EQUIFAX INC
10-Ks and 10-Qs
|
|
|
|
|
|
|
|
|
|
|
|
|
|
|
|
|
|
|
|
|
|
|
|
|
|
|
|
|
|
|
|
|
|
|
|
|
|
|
|
|
|
|
|
|
|
|
|
|
|
|
|
|
|
|
|
UNITED STATES
SECURITIES AND EXCHANGE COMMISSION
Washington, D.C. 20549
FORM 10-K
|
x
|
ANNUAL REPORT PURSUANT TO SECTION 13 OR 15(d) OF THE SECURITIES EXCHANGE ACT OF 1934
|
For the fiscal year ended December 31, 2010
OR
|
¨
|
TRANSITION REPORT PURSUANT TO SECTION 13 OR 15(d) OF THE SECURITIES EXCHANGE ACT OF 1934
|
For the transition period from to
Commission File Number 001-06605
EQUIFAX INC.
(Exact name of registrant as specified in its charter)
|
Georgia
|
58-0401110
|
|
(State or other jurisdiction of incorporation or organization)
|
(I.R.S. Employer Identification No.)
|
|
1550 Peachtree Street, N.W.
Atlanta, Georgia
|
30309
|
|
(Address of principal executive offices)
|
(Zip Code)
|
Registrant’s telephone number, including area code: 404-885-8000
Securities registered pursuant to Section 12(b) of the Act:
|
Title of each class
|
Name of each exchange on which registered
|
|
|
Common Stock, $1.25 par value per share
|
New York Stock Exchange
|
|
|
Common Stock Purchase Rights
|
New York Stock Exchange
|
Securities registered pursuant to Section 12(g) of the Act: None.
Indicate by check mark if Registrant is a well-known seasoned issuer, as defined in Rule 405 of the Securities Exchange Act (“Act”).
x
YES
¨
NO
Indicate by check mark if Registrant is not required to file reports pursuant to Section 13 or Section 15(d) of the Act.
¨
YES
x
NO
Indicate by check mark whether Registrant (1) has filed all reports required to be filed by Section 13 or 15(d) of the Securities Exchange Act of 1934 during the preceding 12 months (or for such shorter period that the Registrant was required to file such reports), and (2) has been subject to such filing requirements for the past 90 days.
x
YES
¨
NO
Indicate by check mark if disclosure of delinquent filers pursuant to Item 405 of Regulation S-K is not contained herein, and will not be contained, to the best of Registrant’s knowledge, in definitive proxy or information statements incorporated by reference in Part III of this Form 10-K or any amendment to this Form 10-K.
x
Indicate by check mark whether the Registrant has submitted electronically and posted on its corporate Web site, if any, every Interactive Data File required to be submitted and posted pursuant to Rule 405 of Regulation S-T during the preceding 12 months (or for such shorter period that the Registrant was required to submit and post such files). YES
x
NO
¨
Indicate by check mark whether the Registrant is a large accelerated filer, an accelerated filer, a non-accelerated filer or a smaller reporting company. See definitions of “large accelerated filer,” “accelerated filer” and “smaller reporting company” in Rule 12b-2 of the Exchange Act. (Check one):
|
x
Large accelerated filer
|
¨
Accelerated filer
|
¨
Non-accelerated filer
|
¨
Smaller reporting company
|
|
(Do not check if a smaller reporting company)
|
|||
Indicate by check mark whether the Registrant is a shell company (as defined in Rule 12b-2 of the Act).
¨
YES
x
NO
As of June 30, 2010, the aggregate market value of Registrant’s common stock held by non-affiliates of Registrant was approximately $3,507,932,713 based on the closing sale price as reported on the New York Stock Exchange. At January 31, 2011, there were 122,739,885 shares of Registrant’s common stock outstanding.
DOCUMENTS INCORPORATED BY REFERENCE
Portions of Registrant’s definitive proxy statement for its 2011 annual meeting of shareholders are incorporated by reference in Part III of this 10-K.
OVERVIEW
Equifax Inc. is a leading global provider of information solutions for businesses and consumers. We have a large and diversified group of clients and customers, including financial institutions, corporations, governments and individuals. Our products and services are based on comprehensive databases of consumer and business information derived from numerous types of credit, financial, employment and income, public record, demographic and marketing data. We use proprietary analytical tools to analyze this data to create customized insights, decision-making solutions and processing services for businesses. We help consumers understand, manage and protect their personal information and make more informed financial
decisions. Additionally, we are a leading provider of payroll-related and human resources business process outsourcing services in the United States of America, or U.S.
We currently operate in three global regions: North America (U.S. and Canada), Europe (the United Kingdom, or U.K., Spain and Portugal) and Latin America (Argentina, Brazil, Chile, Ecuador, El Salvador, Honduras, Paraguay, Peru and Uruguay). We also maintain support operations in Costa Rica and the Republic of Ireland. We own an equity interest in a consumer credit information company in Russia. During 2009, we formed a joint venture to provide a broad range of credit data and information solutions in India. Of the countries in which we operate, 73% of our revenue was generated in the U.S. during 2010.
Equifax was originally incorporated under the laws of the State of Georgia in 1913, and its predecessor company dates back to 1899. As used herein, the terms Equifax, the Company, we, our and us refer to Equifax Inc., a Georgia corporation, and its consolidated subsidiaries as a combined entity, except where it is clear that the terms mean only Equifax Inc.
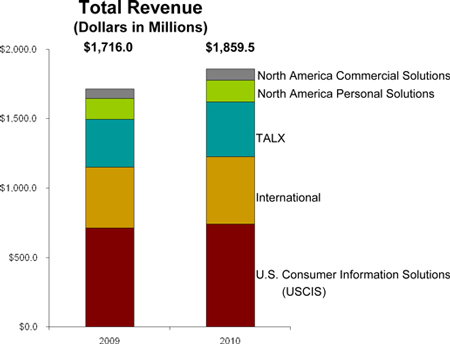
We are organized and report our business results in five operating segments, as follows:
|
|
•
|
U.S. Consumer Information Solutions (USCIS)
—
provides consumer information solutions to businesses in the U.S. including online credit data and credit decision technology solutions (OCIS), mortgage reporting and settlement solutions, and consumer financial marketing services (CFMS).
|
|
|
•
|
International
—
includes our Canada Consumer, Europe and Latin America business units. Products and services offered are similar to those available in the USCIS, North America Commercial Solutions and North America Personal Solutions operating segments but vary by geographic region.
|
|
|
•
|
TALX
—
provides services enabling clients to outsource and automate the performance of certain payroll-related and human resources business processes, including employment, income and social security number verification, employment-related tax management and talent management services.
|
|
|
•
|
North America Personal Solutions
—
provides products to consumers enabling them to monitor, manage and protect their credit, credit score and identity information and make more informed financial decisions.
|
|
|
•
|
North America Commercial Solutions
—
provides credit, financial, marketing and other information regarding businesses in the U.S. and Canada.
|
2
Our revenue base and business mix are diversified among our five segments as depicted in the chart below.
3
PRODUCTS AND SERVICES
The following chart summarizes the key products and services offered by each of the business units within our segments:
|
USCIS
|
North
|
North
|
International
|
TALX
|
|||||||||||||||||
|
OCIS
|
CFMS
|
Mortgage
Services
|
America
Personal
Solutions
|
America
Commercial
Solutions
|
Canada
Consumer
|
Europe
|
Latin
America
|
The Work
Number ®
|
Tax & Talent
Management
Services
|
||||||||||||
|
Online consumer credit reports
|
X
|
X
|
X
|
X
|
X
|
X
|
|||||||||||||||
|
Consumer alerts, scores and analytical services
|
X
|
X
|
X
|
X
|
X
|
X
|
X
|
X
|
|||||||||||||
|
Enabling technology services (i.e., credit decisioning platforms)
|
X
|
X
|
X
|
X
|
X
|
X
|
|||||||||||||||
|
Identity authentication/fraud
|
X
|
X
|
X
|
X
|
X
|
X
|
|||||||||||||||
|
Consumer financial marketing services
|
X
|
X
|
X
|
X
|
X
|
||||||||||||||||
|
Business credit reports, scores and analytical services
|
X
|
X
|
X
|
||||||||||||||||||
|
Business marketing services and database management
|
X
|
X
|
X
|
||||||||||||||||||
|
Business demographic information
|
X
|
X
|
|||||||||||||||||||
|
Direct to consumer credit monitoring
|
X
|
X
|
|||||||||||||||||||
|
Identity protection
|
X
|
||||||||||||||||||||
|
Debt Reduction Solutions
|
X
|
||||||||||||||||||||
|
Employment, income and identity verification services
|
X
|
||||||||||||||||||||
|
Business Process Outsourcing (BPO)
|
|
|
|
X
|
|
|
|
|
|
|
X
|
|
X
|
||||||||
Each of our operating segments is described more fully below.
USCIS
USCIS provides consumer information solutions to businesses in the U.S. through three product lines, as follows:
Online Consumer Information Solutions (OCIS).
OCIS products are derived from large databases of credit information that we maintain about individual consumers, including credit history, current credit status and consumer address information. Our customers utilize the credit report information we provide to make decisions for a wide range of credit and business purposes, such as whether, and on what terms, to approve auto loans or credit card applications, whether to allow a consumer to open a new utility or telephone account and similar business uses. We offer other data, analytical and predictive services based on the information in the
consumer credit information databases to help further mitigate the risk of granting credit by verifying the identity of a consumer seeking credit, predicting the risk of consumer bankruptcy, or indicating the credit applicant’s risk potential for account delinquency, for example. These risk management services, as well as fraud detection and prevention services, enable our customers to monitor default rates and proactively manage their existing credit card or other consumer loan accounts, and ensure a consumer’s identity.
4
OCIS customers access products through a full range of electronic distribution mechanisms, including direct real-time access, which facilitates instant decisions, such as the immediate granting of credit at the point of sale. We also develop and host customized applications that enhance the decision-making process for our customers. These decisioning technology applications assist with pre-approved offers of credit, cross-selling of various banking products, determining deposit amounts for telephone and utility companies, and verifying the identity of consumer customers.
Mortgage Solutions.
Our Mortgage Solutions products, offered in the U.S., consist of specialized credit reports that combine the reports of the three major consumer credit reporting agencies (Equifax, Experian Group and TransUnion LLC) into a single credit report provided in an online format, commonly referred to as a tri-merge report. Mortgage lenders use these tri-merge reports in making their mortgage underwriting decisions. We also offer certain mortgage settlement services, such as appraisal, title and closing services, with our traditional mortgage service offerings, with certain of these services provided through agreements with third
parties.
Consumer Financial Marketing Services (CFMS).
Our CFMS products apply consumer financial information to enable our customers to manage their marketing efforts, including targeting and segmentation, for efficiency and effectiveness; identify and acquire new customers for their financial products and services; and realize additional revenue from existing customers. These products utilize information derived from actual consumer data, including credit, income, asset, liquidity, net worth and spending activity, which also support many of our OCIS products. These data assets broaden the understanding of customer financial potential and
opportunity which can further drive breakthrough decisioning and targeting solutions for our customers. We also provide account review services which assist our customers in managing their existing customers and prescreen services that help our clients identify potential new customers. Customers for these products primarily include institutions in the banking, brokerage, insurance, and mortgage industries as well as companies primarily focused on digital and interactive marketing.
International
The International operating segment includes our Canada Consumer, Europe and Latin America business units. These business units offer products that are similar to those available in the USCIS operating segment, although data sources tend to rely more heavily on government agencies than in the U.S. These products generate revenue in Argentina, Brazil, Canada, Chile, Ecuador, El Salvador, Honduras, Paraguay, Peru, Portugal, Spain, the U.K. and Uruguay. We also maintain support operations in the Republic of Ireland and Costa Rica. We offer consumer credit services in Russia and India through joint ventures.
Canada Consumer.
Similar to our OCIS, Mortgage Solutions and CFMS business units, Canada Consumer offers products derived from the credit information that we maintain about individual consumers. We offer many products in Canada, including credit reporting and scoring, consumer marketing, risk management, fraud detection and modeling services, together with certain of our decisioning products that facilitate pre-approved offers of credit and automate a variety of credit decisions.
Europe.
Our European operation provides information solutions, marketing and personal solutions products. Information solutions and personal solutions products are generated from credit records that we maintain and include credit reporting and scoring, risk management, fraud detection and modeling services. Both of these products are sold in the U.K. and our information solutions products are sold in Portugal and Spain. Our commercial products, such as business credit reporting and commercial risk management services, are only available in the U.K. Marketing products, which are similar to those offered in our CFMS business unit, are
primarily available in the U.K. and, to a lesser extent, in Spain.
Latin America.
Our Latin American operation provides consumer and commercial information solutions products and marketing products. We offer a full range of consumer products, generated from credit records that we maintain, including credit reporting and scoring, risk management, identity verification and fraud detection services. Our consumer products are the primary source of revenue in each of the countries in which we operate, with the exception of Brazil where the majority of our revenue comes from commercial products. We offer our commercial products, which include credit reporting, decisioning tools and risk management services, in
varying degrees to the countries we serve. We also provide a variety of consumer and commercial marketing products generated from our credit information databases, including business profile analysis, business prospect lists and database management, in varying degrees in the countries we serve. The other countries in which we operate include Argentina, Chile, Ecuador, El Salvador, Honduras, Paraguay, Peru and Uruguay.
5
TALX
TALX operates in the U.S. through two business units, as follows:
The Work Number
®
(TWN Services).
TWN Services include employment, income and social security number verification services and complementary services which include W-2 management services (which include initial distribution, reissue and correction of W-2 forms); paperless pay services that enable employees to electronically receive pay statement information as well as review and change direct deposit account or W-4 information; integrated
electronic time capture and reporting services; paperless new-hire services to bring new workers on board using electronic forms; and I-9 management services designed to help clients electronically comply with the immigration laws that require employers to complete an I-9 form for each new hire.
TWN Services enable employers to direct third-party verifiers to our website or to a toll-free telephone number to verify the employee’s employment status and income data. We also offer an offline research verification service which expands employment verification to locate data outside our existing TWN database. In 2009, we increased our services to provide IRS income verifications using the
IncomeChek
®
product as well as identity verification through a secure, web-based portal using the
DirectChek
®
product.
We rely on payroll data received from over 2,400 organizations, including over half of Fortune 500 companies, to regularly update the TWN database. This data is updated as employers transmit data electronically directly to us each payroll period. Employers contract to provide this data to us for specified periods under the terms of contracts which range from one to five years. We use this data to provide employment and income verifications to third-party verifiers; the fees we charge for these services are generally per transaction. After the expiration of the applicable contract, absent renewal by mutual agreement of the parties, we generally do not have any further right to use the employment data we obtained
pursuant to the contract. We have not experienced significant turnover in the employer contributors to the TWN database because we generally do not charge them to add their employment data to the database and the verification service we offer relieves them of the administrative burden and expense of responding to third party employment verification requests. The database contained approximately 220 million current and historic employment records at December 31, 2010.
Tax and Talent Management Services.
These services are aimed at reducing the cost to the human resources function of businesses by assisting with employment tax matters and planning and improving the cost-effectiveness of talent recruitment and management. We offer a broad suite of services designed to reduce the cost of unemployment claims through effective claims representation and management and efficient processing and to better manage the tax rate that employers are assessed for unemployment taxes. We also offer our customers comprehensive services designed to research the availability of employment-related tax credits (e.g., the
federal work opportunity and welfare to work tax credits and state tax credits), process the necessary filings and assist the customer in obtaining the tax credit. In talent management, we also offer secure, electronic-based psychometric testing and assessments, as well as onboarding services using online forms to complete the new hire process for employees of corporate and government agencies.
North America Personal Solutions
Our Personal Solutions products give consumers information to make financial decisions and monitor and protect credit, credit score and identity information through our Equifax Complete, ID Patrol, Credit Watch and Score Watch monitoring products. Consumers can obtain a copy of credit file information about them and their credit score. We offer monitoring products for consumers who are concerned about identity theft and data breaches, including the Credit Report Control service that allows consumers subscribing to our credit monitoring products to restrict access to their credit report to mitigate unauthorized use of Equifax credit file information by third parties. Our Debt Wise product utilizes credit report
information to assist consumers in creating a debt repayment plan. Our products are available to consumers directly and through relationships with business partners who distribute our products or provide these services to their employees or customers.
6
North America Commercial Solutions
Our Commercial Solutions products are derived from databases of credit, financial and marketing information regarding businesses in the U.S. and Canada. The business records included in the U.S. credit database have been developed in part from the Small Business Financial Exchange, Inc., or SBFE. SBFE members, including a number of commercial lending financial institutions, contribute their data to the member-owned SBFE database which we exclusively manage. Our contract with the SBFE to manage this database is scheduled to expire in 2012, unless renewed by mutual agreement of the parties. The information comprising the database is generally not owned by us, and the participating organizations could discontinue
contributing information to the database or our management contract may not be renewed; however, we believe that such an event is unlikely because contributors to the database use the aggregated information in the database to conduct their business and we have a good working relationship with the SBFE members as one of the original founders of this database.
Other databases we have compiled include loan; credit card; public records and leasing history data; trade accounts receivable performance; and Secretary of State and Securities and Exchange Commission registration information. We also offer scoring and analytical services that provide additional information to help mitigate the credit risk assumed by our customers. We also have a marketing database which hosts approximately 47 million commercial demographic data records from around the world helping companies to identify corporate family structures for enterprise visibility of customers and suppliers.
OUR BUSINESS STRATEGY
Our strategic objective is to be the trusted provider of information driven solutions that empower our customers with the ability to make critical decisions with greater confidence. Data is at the core of our value proposition. Leveraging our extensive resources, we deliver differentiated decisions through advanced data, analytics and technology. Our comprehensive set of data assets can provide a complete, 360 degree view of the consumer’s financial potential and opportunity including their propensity, ability and capacity to pay. Our long-term corporate growth strategy is driven by the following initiatives:
|
|
•
|
Increase penetration of our customers’ information solutions needs.
We seek to increase our share of customers’ spending on information-related services through the development and introduction of new products such as ID management, pricing our services in accordance with the value they create, increasing the range of current services utilized by our customers, and improving the quality of sales and customer support interactions with consumers. We are also helping customers address increasing compliance requirements through the development of new products.
|
|
|
•
|
Deploy decisioning technologies and analytics globally.
We continue to invest in and develop new technology to enhance the functionality, cost-effectiveness and security of the services we offer and further differentiate our products from those offered by our competitors. In addition to custom products for large customers, we develop off-the-shelf, decisioning technology platforms that are more cost-effective for medium- and smaller-sized customers. We also develop predictive scores and analytics to help customers acquire new customers and manage their existing customer relationships. We develop a broad array of industry, risk management, cross-sell and account acquisition models to enhance the precision of our customers’
decisioning activities.
|
|
|
•
|
Invest in unique data sources.
We continue to invest in and acquire unique sources of credit and non-credit information to enhance the variety and quality of our services while increasing customers’ confidence in information-based business decisions. Areas of focus for investment in new sources of data include, among others, positive payment data, real estate data and new commercial business data. As an example, we acquired IXI Corporation in 2009, which added valuable and unique U.S. consumer data related to employment and financial assets which broadens and enriches the types of services we can offer our customers.
|
|
|
•
|
Pursue new vertical markets and expand into emerging markets.
We see numerous opportunities to expand into emerging markets both in the U.S. and internationally. In the U.S., our Capital Markets area offers unique products which enable investors and underwriters to have a more current and relevant understanding of the inherent risk in a portfolio of loans. Our Mortgage Services business continues to expand its presence in the mortgage value chain with a broader offering of mortgage underwriting services. During 2010, we acquired Anakam, Inc. which is a provider of large-scale, software-based, multi-factor authentication solutions. Internationally, we are investing in and building Russian and Indian ventures, as well as our existing served
markets.
|
7
COMPETITION
The market for our products and services is highly competitive and is subject to constant change. Our competitors vary widely in size and the nature of the products and services they offer. Sources of competition are numerous and include the following:
|
|
•
|
Competition for our consumer information solutions and personal solutions products varies by both application and industry, but generally includes two global consumer credit reporting companies, Experian, and TransUnion, both of which offer a product suite similar to ours, and LifeLock, a national provider of personal identity theft protection products. There are also a large number of smaller competitors who offer competing products in specialized areas (such as fraud prevention, risk management and application processing and decisioning solutions) and software companies offering credit modeling services or analytical tools. We believe that our products offer our customers an advantage over those of our competitors because of the quality of our data files, which we believe to be superior in
terms of depth, accuracy and availability. Other differentiators include our decisioning technology and the capabilities of our analytical services. Our competitive strategy is to emphasize customer solutions and quality while remaining competitive on price. Our marketing services products also compete with the foregoing companies and others who offer demographic information products, including Acxiom Corporation, Harte-Hanks, Inc. and infoGROUP, Inc. We also compete with Fair Isaac Corporation with respect to our analytical tools.
|
|
|
•
|
Competition for our commercial solutions products primarily includes Experian and The Dun & Bradstreet Corporation and providers of these services in the international markets we serve. We believe our U.S. small business loan information from financial institutions creates a unique database and product for the small business segment of that market.
|
|
|
•
|
Competition for our employment and income verification services includes large employers who serve their own needs through in-house systems to manage verification as well as regional online verification companies, such as Verify Jobs and First Advantage, who offer verification services along with other human resources and tax services. Competition for complementary TWN Services includes payroll processors such as Automatic Data Processing, Inc., or ADP, Paychex, Inc. and Ceridian Corporation. Competitors of our Tax Management Services include in-house management of this function primarily by large employers; ADP; and a number of smaller regional firms that offer tax management services (including Barnett Associates, Thomas & Thorngren, UC Advantage). Talent Management Services competitors
include assessment service providers that offer proprietary content (Previsor, Inc., Development Dimensions International, Brainbench, Inc.), human resources consulting firms (AON Corporation, Towers Watson, Right Management Consulting) and assessment or test publishers that have proprietary delivery platforms (Devine Group, Inc., Hogan Assessments Systems, Inc., SHL Group plc).
|
While we believe that none of our competitors offers the same mix of products and services as we do, certain competitors may have larger shares of particular geographic or product markets or operate in geographic areas where we do not currently have a presence.
We assess the principal competitive factors affecting our markets to include: product attributes such as quality, adaptability, scalability, interoperability, functionality and ease-of-use; product price; technical performance; access to unique proprietary databases; availability in application service provider, or ASP, format; quickness of response, flexibility and customer services and support; effectiveness of sales and marketing efforts; existing market penetration; new product innovation; and our reputation as a trusted steward of information.
MARKETS AND CUSTOMERS
Our products and services serve clients across a wide range of industries, including financial services, mortgage, human resources, consumer, commercial, telecommunications, retail, automotive, utilities, brokerage, healthcare and insurance industries, as well as state and federal governments. We also serve consumers directly. Our revenue stream is highly diversified with our largest customer providing only 3% of total revenue. The following table summarizes the various end-user markets we serve:
8
|
Percentage of
Consolidated Revenue
|
||||||||
|
2010
|
2009
|
|||||||
|
Financial
|
26 | % | 26 | % | ||||
|
Mortgage
|
15 | % | 14 | % | ||||
|
Employers
|
11 | % | 10 | % | ||||
|
Consumer
|
10 | % | 10 | % | ||||
|
Commercial
|
8 | % | 7 | % | ||||
|
Telecommunications
|
7 | % | 6 | % | ||||
|
Retail
|
5 | % | 5 | % | ||||
|
Automotive
|
4 | % | 4 | % | ||||
|
Other
(1)
|
14 | % | 18 | % | ||||
| 100 | % | 100 | % | |||||
|
(1)
|
Other includes revenue from marketing services, government, insurance and health care end-users.
|
We market our products and services primarily through our own direct sales organization that is organized around sales teams that focus on customer segments typically aligned by vertical markets and geography. Sales groups are based in our headquarters in Atlanta, Georgia, and field offices located in the U.S. and in the countries where we have operations. We also market our products and services through indirect channels, including alliance partners, joint ventures and other resellers. In addition, we sell through direct mail and various websites, such as
www.equifax.com
.
Our largest geographic market segments are North America (the U.S. and Canada); Europe (the U.K., Spain and Portugal); and Latin America (Argentina, Brazil, Chile, Ecuador, El Salvador, Honduras, Paraguay, Peru and Uruguay). We also maintain support operations in Costa Rica and the Republic of Ireland. We own an equity interest in a consumer credit information company in Russia. During 2009, we formed a joint venture to provide a broad range of credit data and information solutions in India.
9
Revenue from international customers, including end-users and resellers, amounted to 27% of our total revenue in 2010 and 2009 and 29% of our total revenue in 2008.
TECHNOLOGY AND INTELLECTUAL PROPERTY
We generally seek protection under federal, state and foreign laws for strategic or financially important intellectual property developed in connection with our business. Certain intellectual property, where appropriate, is protected by registration under applicable trademark laws or by prosecution of patent applications. We own several patents registered in the U.S. and certain foreign countries. We also have certain registered trademarks in the U.S. and in many foreign countries. The most important of these are “Equifax,” “TALX”, “The Work Number” and many variations thereof. These trademarks are used in connection with most of our product lines and services. Although these
patents and trademarks are important and valuable assets in the aggregate, no single patent, group of patents or trademark, other than our Equifax trademark, is critical to the success of our business.
We license other companies to use certain data, technology and other intellectual property rights we own or control, primarily as core components of our products and services, on terms that are consistent with customary industry standards and that are designed to protect our interest in our intellectual property.
We are licensed by others to use certain data, technology and other intellectual property rights they own or control, none of which is material to our business except for a license from Fair Isaac Corporation, relating to certain credit-scoring algorithms and the right to sell credit scores derived from them. This license has a five-year term expiring in June 2013 and provides for usage-based fees. Additionally, the licenses do not contain early termination provisions except for standard provisions providing the right to terminate in the event of breach by the other party. We do not hold any franchises or concessions that are material to our business or results of operations.
INFORMATION SECURITY AND GOVERNMENT REGULATION
Safeguarding the privacy and security of consumer credit information, whether delivered online or in an offline format, is a top priority. We recognize the importance of secure online transactions and we maintain physical, administrative, and technical safeguards to protect personal and business identifiable information. We have security protocols and measures in place to protect information from unauthorized access or alteration. These measures include internal and external firewalls, physical security and technological security measures, and encryption of certain data.
Our databases are regularly updated by information provided by financial institutions, telecommunications companies, other trade credit providers, employers, public records vendors and government agencies. Various laws and regulations govern the collection and use of this information. These laws and regulations impact how we are able to provide information to our customers and have significantly increased our compliance costs. We are subject to differing laws and regulations depending on where we operate.
U.S. Data and Privacy Protection
Our U.S. operations are subject to various federal and state laws and regulations governing the collection, protection and use of consumer credit and other information, and imposing sanctions for the misuse of such information or unauthorized access to data. Many of these provisions also affect our customers’ use of consumer credit or other data we furnish. The information underlying our North America Commercial Services business is less regulated than the other portions of our business.
These laws and regulations that may apply to portions of our business include, but are not limited to, the following:
|
|
•
|
The Fair Credit Reporting Act, or FCRA, which governs among other things the reporting of information to consumer reporting agencies that engage in the practice of assembling or evaluating certain information relating to consumers, including our credit reporting business and employment verification; making prescreened offers of credit; the sharing of consumer report information among affiliated and unaffiliated third parties; access to credit scores; and requirements for data furnishers and users of consumer report information. Violation of the FCRA, or of similar state laws, can result in an award of actual damages, as well as statutory and/or punitive damages in the event of a willful violation.
|
10
|
|
•
|
The Fair and Accurate Credit Transactions Act of 2003, or FACT Act, which amended the FCRA and requires, among other things, nationwide consumer credit reporting agencies, such as us, upon the request of a consumer, to place a fraud alert in the consumer’s credit file stating that the consumer may be the victim of identity theft or other fraud, and furnish a free annual credit file disclosure to consumers through a centralized request facility we have established with the other nationwide credit reporting agencies. FACT Act regulations also require financial institutions to develop policies and procedures to identify potential identity theft, and consumer credit report notice requirements for lenders that use consumer report information in connection with risk-based credit pricing
actions. Entities that furnish information to consumer reporting agencies are required to implement procedures and policies regarding the accuracy and integrity of the furnished information and regarding the correction of previously furnished information that is later determined to be inaccurate. Mortgage lenders are required to disclose credit scores to consumers. Additionally, the FACT Act prohibits a business that receives consumer information from an affiliate from using that information for marketing purposes unless the consumer is first provided a notice and an opportunity to direct the business not to use the information for such marketing purposes (“opt-out”), subject to certain exceptions.
|
|
|
•
|
The Financial Services Modernization Act of 1999, or Gramm-Leach-Bliley Act, or GLB, which, among other things, regulates the use of non-public personal financial information of consumers that is held by financial institutions. Equifax is subject to various GLB provisions, including rules relating to the physical, administrative and technological protection of non-public personal financial information. Breach of the GLB can result in civil and/or criminal liability and sanctions by regulatory authorities, such as fines of up to $100,000 per violation and up to five years imprisonment for individuals.
|
|
|
•
|
The Health Insurance Portability and Accountability Act of 1996, or HIPAA, which requires reasonable safeguards to prevent intentional or unintentional use or disclosure of protected health information.
|
|
|
•
|
Federal and state laws governing the use of the Internet and regulating telemarketing, including the federal Controlling the Assault of Non-Solicited Pornography and Marketing Act of 2003, or CAN-SPAM, which regulates commercial email, prohibits false or misleading header information, requires that a commercial email be identified as an advertisement, and requires that commercial emails give recipients an opt-out method. Senate Bill 3386, signed into federal law on December 29, 2010, seeks to protect online consumers from unfair and deceptive sales tactics on the Internet. Other Internet privacy laws and regulations have been proposed from time to time to address digital marketing, i.e., how personal information is collected and distributed online, including behavioral advertising.
|
|
|
•
|
Fannie Mae and Freddie Mac regulations applicable to our credit reporting and mortgage solutions products, the Real Estate Settlement Procedures Act and HUD’s Regulation X, which requires the disclosure of certain basic information to borrowers concerning settlement costs and prohibits the charging of unearned fees and certain “kickbacks” or other fees for referrals in connection with a residential mortgage settlement service.
|
On July 21, 2010, the Dodd-Frank Wall Street Reform and Consumer Protection Act (Dodd-Frank Act) became law. The Dodd-Frank Act represents a comprehensive overhaul of the financial services industry within the U.S., establishes the new Bureau of Consumer Financial Protection (the "BCFP") within the Federal Reserve Board, and will require the BCFP and other federal agencies to implement many new and significant rules and regulations. The BCFP will have sweeping powers to administer and enforce a new federal regulatory framework of consumer financial regulation. The Dodd-Frank Act will allow consumers free access to their credit score if their score negatively affects
them in a financial transaction or a hiring decision, and also gives consumers access to credit score disclosures as part of an adverse action and risk-based pricing notice. At this time, it is difficult to predict the extent to which the Dodd-Frank Act or the resulting rules and regulations will impact the U.S. economy or our business. Compliance with these new laws and regulations may require changes in the way we conduct our business and may result in additional compliance costs, which could be significant and could adversely impact our results of operations, financial condition or liquidity.
11
A number of states in the U.S. have passed versions of security breach notification and credit file freeze legislation. A file freeze enables consumers to place and lift a freeze on access to their credit files. File freeze laws impose differing requirements on credit reporting agencies with respect to how and when to respond to such credit file freeze requests and in the fees, if any, the agencies may charge for freeze-related actions.
International Data and Privacy Protection
We are subject to data protection, privacy and consumer credit laws and regulations in the foreign countries where we do business.
|
|
•
|
In Canada, the Personal Information Protection and Electronic Documents Act (2000) applies to organizations with respect to personal information that they collect, use or disclose in the course of commercial activities. It requires compliance with the National Standard of Canada Model Code for the Protection of Personal Information, covering accountability and identifying purposes, consent, collection, use, disclosure, retention, accuracy, safeguards, individual access and compliance. The Federal Privacy Commissioner is invested with powers of investigation and intervention, and provisions of Canadian law regarding civil liability apply in the event of unlawful processing which is prejudicial to the persons concerned.
|
|
|
•
|
In Europe, Equifax is subject to the European Union, or EU, data protection laws, including the comprehensive EU Directive on Data Protection (1995), which imposes a number of obligations on Equifax with respect to use of personal data, and includes a prohibition on the transfer of personal information from the EU to other countries that do not provide consumers with an “adequate” level of privacy or security. The EU standard for adequacy is generally stricter and more comprehensive than that of the U.S. and most other countries. In the U.K., in addition to the EU Directive on Data Protection, the Data Protection Act of 1998 regulates the manner in which we can use third-party data. In addition, regulatory limitations affect our use of the Electoral Roll, one of our key data
sources in the U.K. Generally, the data underlying the products offered by our U.K. Information Services and Personal Solutions product lines, excluding our Commercial Services products, are subject to these regulations. In Spain and Portugal, the privacy laws which are subject to the EU Directive on Data Protection regulate all credit bureau and personal solutions activities. Except for negative data, the laws in Spain and Portugal generally require consumer consent for all Equifax activities.
|
|
|
•
|
In Latin America, consumer data protection and privacy laws and regulations exist in Argentina, Chile, Peru and Uruguay. Uruguay generally follows the EU data protection model. There are also constitutional provisions in Argentina, Brazil, Chile, Peru and certain other countries which declare the right to seek judicial protection regarding the use of personal data, and in many of those countries grant individuals the right to access and correction of information in the possession of data controllers.
|
Tax Management Services
The Tax Management business within our TALX segment is potentially impacted by changes in U.S. tax laws or interpretations, for example, those pertaining to work opportunity tax credits and unemployment compensation claims. A subsidiary of TALX, Talent Management, provides employee testing, assessment and talent management services to the federal government through a number of primary contracts and subcontracts with federal agencies, including the Transportation Security Administration. These contracts may be adversely affected by changes in U.S. federal government programs or contractor requirements, including the adoption of new laws or regulations.
Environmental Regulation
We are subject to federal, state and local laws and regulations in the areas of safety, health and environmental protection. Compliance with these laws and regulations has not in the past had any material effect on our earnings, capital expenditures or competitive position. However, the effect of such compliance in the future cannot be predicted. We believe that we are in material compliance with applicable federal, state and local safety, health and environmental regulations.
12
PERSONNEL
Equifax employed approximately 6,500 employees in 16 countries as of December 31, 2010. None of our U.S. employees are subject to a collective bargaining agreement and no work stoppages have been experienced. Pursuant to local laws, certain of our employees in Argentina, Brazil and Spain are covered under government-mandated collective bargaining regulations that govern general salary and compensation matters, basic benefits and hours of work.
EXECUTIVE OFFICERS OF EQUIFAX
The executive officers of Equifax and their ages and titles are set forth below. Business experience and other information is provided in accordance with SEC rules.
Richard F. Smith (51)
has been Chairman and Chief Executive Officer since December 15, 2005. He was named Chairman-Elect and Chief Executive Officer effective September 19, 2005 and was elected as a Director on September 22, 2005. Prior to that, Mr. Smith served as Chief Operating Officer, GE Insurance Solutions, from 2004 to September 2005 and President and Chief Executive Officer of GE Property and Casualty Reinsurance from 2003 to 2004.
Lee Adrean (59)
has been Corporate Vice President and Chief Financial Officer since October 2006. Prior to joining Equifax, he served as Executive Vice President and Chief Financial Officer of NDCHealth Corporation from 2004 to 2006. Prior thereto, he served as Executive Vice President and Chief Financial Officer of EarthLink, Inc. from 2000 until 2004.
Kent E. Mast (67)
has served as Corporate Vice President and Chief Legal Officer since 2000. His responsibilities include legal services, global sourcing, security and compliance, government and legislative relations, corporate governance and privacy functions.
Coretha M. Rushing (54)
has been Corporate Vice President and Chief Human Resources Officer since 2006. Prior to joining Equifax, she served as an executive coach and HR Consultant with Atlanta-based Cameron Wesley LLC. Prior thereto, she was Senior Vice President of Human Resources at The Coca-Cola Company, where she was employed from 1996 until 2004.
Paul J. Springman (65)
has served as Corporate Vice President and Chief Marketing Officer since February 2004. Prior thereto, he was head of the Predictive Sciences unit from August 2002 until February 2004.
David C. Webb (55)
became Chief Information Officer on January 19, 2010. Prior thereto, he served as Chief Operations Officer for SVB Financial Corp. from 2008, and from 2004 to 2008 was Chief Information Officer. Mr. Webb was Vice President, Investment Banking Division at Goldman Sachs, a leading global investment banking, securities and investment management firm, from 1999 to 2004. He was Chief Information Officer at Bank One from 1997 to 1999.
Rodolfo M. Ploder (50)
has been President, U.S. Consumer Information Solutions since July 2010. Prior thereto, he served as President, International from January 2007 until June 2010. Prior thereto, he was Group Executive, Latin America from February 2004 to January 2007.
J. Dann Adams (53)
has been President of Equifax’s TALX subsidiary since July 2010. Prior thereto, he served as President, U.S. Consumer Information Solutions from 2007 to June 2010. Prior thereto, he served as Group Executive, North America Information Services from November 2003 until December 2006.
Paulino R. Barros (54)
has been President, International since July 2010. Prior thereto, he served as President of PB&C Global Investments, LLC, an international consulting and investment firm. Prior thereto, he was President of Global Operations for AT&T.
Joseph M. Loughran, III (43)
has been President, North America Personal Solutions since January 4, 2010. Prior thereto, he was Senior Vice President — Corporate Development from April 2006 to December 2009. Prior to joining Equifax he held various executive roles at BellSouth Corporation from May 2001 to April 2006, including most recently Managing Director-Corporate Strategy and Planning from May 2005 to April 2006. Prior to joining BellSouth, Mr. Loughran held various roles with McKinsey & Company, King & Spalding, and Lazard Frères & Co.
13
Alejandro (“Alex”) Gonzalez (41)
has been President, North America Commercial Solutions since January 4, 2010. Prior thereto, he was Senior Vice President of Strategic Marketing from January 2006 to December 2009, and Customer Experience Leader for GE Insurance Solutions from January 2005 to December 2005.
Nuala M. King (57)
has been Senior Vice President and Controller since May 2006. Prior thereto, she was Vice President and Corporate Controller from March 2004 to April 2006. Prior to joining Equifax, Ms. King served as Corporate Controller for UPS Capital from March 2001 until March 2004.
FORWARD-LOOKING STATEMENTS
This report contains information that may constitute “forward-looking statements.” Generally, the words “believe,” “expect,” “intend,” “estimate,” “anticipate,” “project,” “will” and similar expressions identify forward-looking statements, which generally are not historical in nature. All statements that address operating performance, events or developments that we expect or anticipate will occur in the future are forward-looking statements. Management believes that these forward-looking statements are reasonable as and when made. However, forward-looking statements are subject to certain risks and uncertainties that
could cause actual results to differ materially from our Company’s historical experience and our present expectations or projections. These risks and uncertainties include, but are not limited to, those described below in Item 1A. Risk Factors, and elsewhere in this report and those described from time to time in our future reports filed with the United States Securities and Exchange Commission, or SEC. As a result of such risks and uncertainties, we urge you not to place undue reliance on any such forward-looking statements. Forward-looking statements speak only as of the date when made. We undertake no obligation to publicly update or revise any forward-looking statements, whether as a result of new information, future events or otherwise, except as required by law.
AVAILABLE INFORMATION
Detailed information about us is contained in our annual reports on Form 10-K, quarterly reports on Form 10-Q, current reports on Form 8-K, proxy statements and other reports, and amendments to those reports, that we file with, or furnish to, the SEC. These reports are available free of charge at our website, www.equifax.com, as soon as reasonably practicable after we electronically file such reports with or furnish such reports to the SEC. However, our website and any contents thereof should not be considered to be incorporated by reference into this document. We will furnish copies of such reports free of charge upon written request to Corporate Secretary, Equifax Inc., P.O. Box 4081, Atlanta, Georgia,
30302.
Our business faces a variety of risks and uncertainties, including those described below, and may include additional risks and uncertainties not presently known to us or that we currently deem immaterial. If any of the events or circumstances described below occurs, our business, financial results or results of operations may be adversely impacted. These risk factors should be read in conjunction with the other information in this Form 10-K.
Weakness in consumer lending activity could materially adversely affect us.
Business customers use our credit information and related analytical services and data to process applications for new credit cards, automobile loans, home and equity loans and other consumer loans, and to manage their existing credit relationships. Bank and other lenders’ willingness to extend credit is adversely affected by elevated consumer delinquency and loan losses in a weak economy. Consumer demand for credit (i.e., rates of spending and levels of indebtedness) also tends to grow more slowly or decline during periods of economic contraction or slow economic growth. High or rising rates of unemployment and interest, declines in income, home prices, or investment values, lower consumer confidence and
reduced access to credit adversely affect demand for our products and services, and consequently our revenue, as consumers may continue to postpone or reduce their spending and use of credit, and lenders may reduce the amount of credit offered or available.
14
The loss of access to credit and other data from external sources could harm our ability to provide our products and services.
We rely extensively upon data from external sources to maintain our proprietary and non-proprietary databases, including data received from customers, strategic partners and various government and public record sources. This includes the widespread and voluntary contribution of credit data from most lenders in the U.S and many other markets as well as the contribution of data under proprietary contractual agreements, such as employers
’
contribution of employment and income data to The Work Number, financial institutions’ contribution of individual financial data to IXI, and financial institutions’ contribution of small business
borrowing information to the Small Business Financial Exchange. Our data sources could withdraw their data from us for a variety of reasons, including legislatively or judicially imposed restrictions on use. We also compete with several of our third-party data suppliers. If a substantial number of data sources or certain key data sources were to withdraw or be unable to provide their data, if we were to lose access to data due to government regulation, or if the collection of data becomes uneconomical, our ability to provide products and services to our clients could be materially adversely impacted, which could result in decreased revenue, net income and earnings per share.
Our markets are highly competitive and new product introductions and pricing strategies being offered by our competitors could decrease our sales and market share or require us to reduce our prices in a manner that reduces our operating margins.
We operate in a number of geographic, product and service markets that are highly competitive. Competitors may develop products and services that are superior to or that achieve greater market acceptance than our products and services. The size of our competitors varies across market segments, as do the resources we have allocated to the segments we target. Therefore, some of our competitors may have significantly greater financial, technical, marketing or other resources than we do in one or more of our market segments, or overall, as is the case in Brazil and the U.K., markets where we face a larger competitor. As a result, our competitors may be in a position to respond more quickly than we can to new or emerging
technologies and changes in customer requirements, or may devote greater resources than we can to the development, promotion, sale and support of products and services. Moreover, new competitors or alliances among our competitors may emerge and potentially reduce our market share, revenue or margins.
Some of our competitors may choose to sell products competitive to ours at lower prices by accepting lower margins and profitability, or may be able to sell products competitive to ours at lower prices given proprietary ownership of data, technological superiority or economies of scale. Price reductions by our competitors could negatively impact our margins and results of operations and could also harm our ability to obtain new customers on favorable terms. Historically, certain of our key products have experienced declines in per unit pricing due to competitive factors and customer demand. Since a significant portion of our operating expenses is relatively fixed in nature due to sales, information technology and
development and other costs, if we were unable to respond quickly enough to changes in competition or customer demand, we could experience further reductions in our operating margins.
If we do not introduce successful new products and services in a timely manner, our products and services will become obsolete and our operating results will suffer.
We generally sell our products in industries that are characterized by rapid technological changes, frequent new product and service introductions and changing industry standards. In addition, certain of the markets in which we operate are seasonal and cyclical. Without the timely introduction of new products, services and enhancements, our products and services will become technologically or commercially obsolete over time, in which case our revenue and operating results would suffer. The success of our new products and services will depend on several factors, including our ability to properly identify customer needs; innovate and develop new technologies, services and applications; successfully commercialize new
technologies in a timely manner; produce and deliver our products in sufficient volumes on time; differentiate our offerings from competitor offerings; price our products competitively; anticipate our competitors’ development of new products, services or technological innovations; and control product quality in our product development process.
15
The impact of consolidation in the financial services, mortgage, retail, telecommunications and other markets is difficult to predict and may harm our business.
The financial services, mortgage, retail and telecommunications industries are intensely competitive and have been subject to increasing consolidation. Continuation of the consolidation trends in these and other industries could result in lower average prices for the larger combined entities, lower combined purchases of our services than were purchased cumulatively by separate entities prior to consolidation, or existing competitors increasing their market share in newly consolidated entities, which could have a material adverse effect on our business, financial condition and results of operations if we are not retained or chosen as a service provider. We may not be able to compete successfully in an increasingly
consolidated industry and cannot predict with certainty how industry consolidation will affect our competitors or us.
If we are unable to protect our information systems against data corruption, cyber-based attacks or network security breaches, our operations could be disrupted.
We are highly dependent on information technology networks and systems, including the Internet, to process, transmit and store electronic information. In particular, we depend on our information technology infrastructure for business-to-business and business-to-consumer electronic commerce. Security breaches of this infrastructure can create system disruptions, shutdowns or unauthorized disclosure of confidential information. If we are unable to prevent such breaches, our operations could be disrupted, or we may suffer financial damage or loss because of lost or misappropriated information.
Many of our products are accessed through the Internet, including our consumer and commercial information services. Security breaches in connection with the delivery of our products and services via the Internet may affect us or our industry and could be detrimental to our reputation, business, operating results and financial condition. We cannot be certain that advances in criminal capabilities, new discoveries in the field of cryptography or other developments will not compromise or breach the technology protecting the networks that access our products and services.
Dependence on outsourcing certain portions of our supply and distribution chain may adversely affect our ability to bring products to market and damage our reputation. Dependence on outsourced information technology and other administrative functions may impair our ability to operate effectively.
As part of our efforts to streamline operations and to reduce operating costs, we have outsourced various components of our application development, information technology, operational support and administrative functions and will continue to evaluate additional outsourcing. Although we have implemented service level agreements and have established monitoring controls, if our outsourcing vendors fail to perform their obligations in a timely manner or at satisfactory quality levels, our ability to bring products to market and support our customers, and our reputation could suffer. Any failure to perform on the part of these third party providers could impair our ability to operate effectively and could result in
lower future revenue, unexecuted efficiencies and adversely impact our results of operations and our stock price. Much of our outsourcing takes place in developing countries and, as a result, may be subject to geopolitical uncertainty.
If we experience system failures, the delivery of our products and services to our customers could be delayed or interrupted, which could harm our business and reputation and result in the loss of customers.
Our ability to provide reliable service largely depends on the efficient and uninterrupted operation of our computer network systems and data centers. Some of these systems have been outsourced to third-party providers. Any significant interruptions could severely harm our business and reputation and result in a loss of customers and large expenses to repair or replace the facility. Our systems and operations could be exposed to damage or interruption from power disruption, fire, flood, telecommunications failure, unauthorized entry and computer viruses, terrorism or other natural or man-made disasters. The steps we have taken and are taking to prevent a system failure, including backup disaster recovery systems,
may not be effective. Our property and business interruption insurance may not be adequate to compensate us for all losses or failures that may occur. Also, our third party insurance coverage will vary from time to time in both type and amount depending on availability, cost and our decisions with respect to risk retention.
16
Interest rates and credit ratings could adversely affect our cost of capital and net income
.
Rising interest rates, credit market dislocations and decisions and actions by credit rating agencies can affect the availability and cost of our funding. Credit rating downgrades or negative changes to ratings outlooks can increase our cost of capital and hurt our competitive position. Guidance from rating agencies as to acceptable leverage can affect our returns as well.
We may suffer adverse financial consequences if Computer Sciences Corporation requires us to purchase its credit reporting business at a time when the public equity or debt markets or other financing conditions are unfavorable to us.
In 1988, we entered into an agreement with Computer Sciences Corporation, or CSC, and certain of its affiliates under which CSC’s credit reporting agencies utilize our computerized credit database services. Under this agreement, CSC has an option, exercisable at any time, to sell its credit reporting business to us. The option expires in August 2013. The option exercise price will be determined by an appraisal process and would be due in cash within 180 days after the exercise of the option. We estimate that if CSC were to exercise the option at December 31, 2010, the option price would have been approximately $625 million to $700 million. This estimate is based solely on our internal analysis of the value of
the business, current market conditions and other factors, all of which are subject to constant change. Therefore, the actual option exercise price could be materially higher or lower than the estimated amount. If CSC were to exercise its option, we would have to obtain additional sources of funding. We believe that this funding would be available from sources such as additional bank lines of credit and the issuance of public debt and/or equity. However, the availability and terms of any such capital financing would be subject to a number of factors, including credit or equity market conditions, general economic conditions and our financial performance and condition. Because we do not control the timing of the exercise, if any, by CSC of its option, we could be required to seek such financing and increase our debt levels at a time when market or other conditions are
unfavorable.
The acquisition, integration or divestiture of businesses by us may not produce the desired financial or operating results.
During 2010, we completed the acquisition of various businesses in separate transactions, including Anakam, Inc. and several international acquisitions, and divested our APPRO loan origination software and Direct Marketing Services businesses to align with our strategic focus. Expected benefits, synergies and growth from these initiatives may not materialize as planned. We may have difficulty assimilating new businesses and their products, services, technologies, and personnel into our operations. These difficulties could disrupt our ongoing business, distract our management and workforce, increase our expenses and materially adversely affect our operating results and financial condition. Also, we may not be able to
retain key management and other critical employees after an acquisition.
Our customers and we are subject to various current governmental regulations, and could be affected by new laws or regulations, compliance with which may cause us to incur significant expenses, and if we fail to maintain satisfactory compliance with certain regulations, we could be subject to civil or criminal penalties.
Our businesses are subject to various significant international, federal, state and local regulations, including but not limited to privacy and consumer data protection, health and safety, tax, labor and environmental regulations. These regulations are complex, change frequently and have tended to become more stringent over time. We may be required to incur significant expenses to comply with these regulations or to remedy violations of these regulations. Any failure by us to comply with applicable government regulations could also result in cessation of our operations or portions of our operations or impositions of fines and restrictions on our ability to carry on or expand our operations. In addition, because many
of our products are regulated or sold into regulated industries, we must comply with additional regulations in marketing our products.
Enactment of the Dodd-Frank Wall Street Reform and Consumer Protection Act and the rules and regulations that may be issued by U.S. regulators implementing such legislation (as well as actions that may be taken by legislatures and regulatory bodies in other countries) could limit our ability to pursue business opportunities we might otherwise consider engaging in, impose additional costs on us, result in significant loss of revenue, impact the value of assets we hold, or otherwise significantly adversely affect our businesses.
17
We also have agreements relating to the sale of our products to government entities, including through the Performance Assessment Network subsidiary of our TALX business and, as a result, we are subject to various statutes and regulations that apply to companies doing business with the government. The laws governing government contracts differ from the laws governing private contracts. For example, many government contracts contain pricing terms and conditions that are not applicable to private contracts. We are also subject to investigation for compliance with the regulations governing government contracts. A failure to comply with these regulations might result in suspension of these contracts, or administrative
penalties.
Third parties may claim that we are infringing their intellectual property and we could suffer significant litigation or licensing expenses or be prevented from selling products or services.
From time to time, third parties may claim that one or more of our products or services infringe their intellectual property rights. We analyze and take action in response to such claims on a case by case basis. Any dispute or litigation regarding patents or other intellectual property could be costly and time-consuming due to the complexity of our technology and the uncertainty of intellectual property litigation and could divert our management and key personnel from our business operations. A claim of intellectual property infringement could force us to enter into a costly or restrictive license agreement, which might not be available under acceptable terms or at all, or could subject us to significant damages or
to an injunction against development and sale of certain of our products or services. Our intellectual property portfolio may not be useful in asserting a counterclaim, or negotiating a license, in response to a claim of intellectual property infringement. In certain of our businesses we rely on third party intellectual property licenses and we cannot ensure that these licenses will be available to us in the future on favorable terms or at all.
Third parties may infringe our intellectual property and we may suffer competitive injury or expend significant resources enforcing our rights.
Our success increasingly depends on our proprietary technology. We rely on various intellectual property rights, including patents, copyrights, database rights, trademarks and trade secrets, as well as confidentiality provisions and licensing arrangements, to establish our proprietary rights. The extent to which such rights can be protected varies in different jurisdictions. If we do not enforce our intellectual property rights successfully our competitive position may suffer which could harm our operating results. Our pending patent applications, and our pending copyright and trademark registration applications, may not be allowed or competitors may challenge the validity or scope of our patents, copyrights or
trademarks. In addition, our patents, copyrights, trademarks and other intellectual property rights may not provide us a significant competitive advantage.
We may need to spend significant resources monitoring our intellectual property rights and we may or may not be able to detect infringement by third parties. Our competitive position may be harmed if we cannot detect infringement and enforce our intellectual property rights quickly or at all. In some circumstances, enforcement may not be available to us because an infringer has a dominant intellectual property position or for other business reasons. In addition, competitors might avoid infringement by designing around our intellectual property rights or by developing non-infringing competing technologies. Intellectual property rights and our ability to enforce them may be unavailable or limited in some countries
which could make it easier for competitors to capture market share and could result in lost revenue.
Economic, political and other risks associated with international sales and operations could adversely affect our results of operations.
Sales outside the U.S. make up approximately 27% of our net operating revenue and, as a result, our business is subject to various risks associated with doing business internationally. We anticipate that revenue from international operations will continue to represent an increasing portion of our total revenue. In addition, many of our employees, suppliers, job functions and facilities are increasingly located outside the U.S. Accordingly, our future results could be harmed by a variety of factors including changes in specific country or region political, economic or other conditions; trade protection measures; data privacy and consumer protection regulations; difficulty in staffing and managing widespread
operations; differing labor, intellectual property protection and technology standards and regulations; business licensing requirements or other requirements relating to making foreign direct investments, which could increase our cost of doing business in certain jurisdictions, prevent us from entering certain markets, increase our operating costs or lead to penalties or restrictions; difficulties associated with repatriating cash generated or held abroad in a tax-efficient manner; and geopolitical instability, including terrorism and war.
18
We earn revenue, pay expenses, own assets and incur liabilities in countries using currencies other than the U.S. dollar, including among others the British pound, the Canadian dollar, the Brazilian real, the Chilean peso and the Euro. Because our consolidated financial statements are presented in U.S. dollars, we must translate revenue, income and expenses, as well as assets and liabilities, into U.S. dollars at exchange rates in effect during or at the end of each reporting period. Therefore, increases or decreases in the value of the U.S. dollar against other major currencies will affect our net operating revenues, operating income and the value of balance sheet items denominated in foreign currencies. Because of
the geographic diversity of our operations, weaknesses in some currencies might be offset by strengths in others over time. We generally do not mitigate the risks associated with fluctuating exchange rates, although we may from time to time through forward contracts or other derivative instruments hedge a portion of our translational foreign currency exposure or exchange rate risks associated with material transactions which are denominated in a foreign currency. The use of such hedging activities may not offset any or more than a portion of the adverse financial effects of unfavorable movements in foreign exchange rates over the limited time the hedges are in place. Accordingly, fluctuations in foreign currency exchange rates, particularly the strengthening of the U.S. dollar against major currencies, may materially affect our consolidated financial results.
In many foreign countries, particularly those with developing economies, it is common to engage in business practices that are prohibited by laws and regulations applicable to us, such as the Foreign Corrupt Practices Act and the newly passed but not yet implemented U.K. Bribery Act. Although we implement policies and procedures designed to facilitate compliance with these laws, our employees, contractors and agents, as well as those companies to which we outsource certain of our business operations, may take actions in violation of our policies. Any such violation, even if prohibited by our policies, could have a material adverse effect on our business and reputation.
Our business will suffer if we are not able to retain and hire key personnel.
Our future success depends partly on the continued service of our key development, sales, marketing, executive and administrative personnel. Additionally, increased retention risk exists in certain key areas of our operations that require specialized skills, such as maintenance of legacy computer systems and analytical modelers. If we fail to retain and hire a sufficient number of these personnel, we will not be able to maintain or expand our business. We believe our pay levels are competitive within the regions that we operate. However, there is intense competition for certain highly technical specialties in geographic areas where we continue to recruit, and it may become more difficult to retain our key
employees.
Unfavorable results of legal proceedings could materially affect us.
We are subject to legal proceedings and claims, including putative class action claims, that have arisen out of the ordinary conduct of our business and are not yet resolved and additional claims may arise in the future. Results of legal proceedings cannot be predicted with certainty. We may be faced with significant monetary damages or injunctive relief against us that would materially adversely affect a portion of our business and might materially affect our financial condition and operating results.
Changes in income tax laws can significantly impact our net income.
Federal and state governments in the U.S. as well as a number of other governments around the world are currently facing significant fiscal pressures and have considered or may consider changes to their tax laws for revenue raising or economic competiveness reasons. Changes to tax laws can have immediate impacts, either favorable or unfavorable, on our results of operations and cash flows, and may impact our competitive position versus certain competitors who are domiciled in other jurisdictions and subject to different tax laws.
We are subject to a variety of other general risks and uncertainties inherent in doing business.
In addition to the specific factors discussed above, we are subject to risks that are inherent to doing business. These include growth rates, general economic and political conditions, customer satisfaction with the quality of our services, costs of obtaining insurance, changes in unemployment, and other events that can impact revenue and the cost of doing business.
19
Not applicable.
Our executive offices are located at 1550 Peachtree Street, N.W., Atlanta, Georgia. On February 27, 2009, we notified the lessor that we intended to exercise our purchase option in accordance with the lease terms. We purchased the building for $29.0 million on February 26, 2010.
Our other properties are geographically distributed to meet sales and operating requirements worldwide. We consider these properties to be both suitable and adequate to meet our current operating requirements, and most of the space is being utilized. We ordinarily lease office space for conducting our business and are obligated under approximately 110 leases and other rental arrangements for our field locations. We owned five office buildings at December 31, 2010, including our executive offices mentioned above, two buildings which house our Atlanta, Georgia data center, as well as buildings utilized by our Latin America operations located in Sao Paulo, Brazil and Santiago, Chile. We also own 23.5 acres adjacent to
the Atlanta, Georgia data center.
For additional information regarding our obligations under leases, see Note 6 of the Notes to Consolidated Financial Statements in this report. We believe that suitable additional space will be available to accommodate our future needs.
Equifax, certain of its subsidiaries, and other persons have been named as parties in various legal actions and administrative proceedings arising in connection with the operation of Equifax’s businesses. In most cases, plaintiffs seek unspecified damages and other relief. These actions include the following:
California Bankruptcy Litigation.
In consolidated actions filed in the U.S. District Court for the Central District of California, captioned
Terri N. White, et al. v. Equifax Information Services LLC, Jose Hernandez v. Equifax Information Services LLC, Kathryn L. Pike v. Equifax Information Services LLC,
and
Jose L. Acosta, Jr., et al. v. Trans Union LLC, et al.,
plaintiffs asserted that Equifax violated federal and state law (the FCRA, the California Credit Reporting Act and the California Unfair Competition Law) by failing to
follow reasonable procedures to determine whether credit accounts are discharged in bankruptcy, including the method for updating the status of an account following a bankruptcy discharge. On August 20, 2008, the District Court approved a Settlement Agreement and Release providing for certain changes in the procedures used by defendants to record discharges in bankruptcy on consumer credit files. That settlement resolved claims for injunctive relief, but not plaintiffs’ claims for damages. On May 7, 2009, the District Court issued an order preliminarily approving an agreement to settle remaining class claims. Certain plaintiffs filed a motion to reconsider the preliminary approval order, which motion was denied by the District Court on June 9, 2009. Following a hearing on May 20, 2010, the District Court deferred final approval of the settlement and issued an order requiring the
settling parties to send a supplemental notice to all class members. On December 14, 2010, the District Court granted the settling plaintiffs’ motion for reconsideration and ruled that the defendants will only have to re-notice those class members who filed a claim and objected to the settlement or opted out, with the cost for the re-notice to be deducted from the plaintiffs’ counsel fee award.
Other.
Equifax has been named as a defendant in various other legal actions, including administrative claims, class actions and other litigation arising in connection with our business. Some of the legal actions include claims for substantial compensatory or punitive damages or claims for indeterminate amounts of damages. We believe we have strong defenses to and, where appropriate, will vigorously contest, many of these matters. Given the number of these matters, some are likely to result in adverse judgments, penalties, injunctions, fines or other relief. However, we do not believe that these litigation matters will be individually
material to our financial condition or results of operations. We may explore potential settlements before a case is taken through trial because of the uncertainty and risks inherent in the litigation process.
20
For information regarding contingent tax claims raised by the Canada Revenue Agency, and our accounting for legal contingencies, see Note 6 of the Notes to Consolidated Financial Statements in this report.
No matters were submitted to a vote of our security holders during the fourth quarter of 2010.
21
Equifax’s common stock is traded on the New York Stock Exchange under the symbol “EFX.” As of January 31, 2011, Equifax had approximately 5,745 holders of record; however, Equifax believes the number of beneficial owners of common stock exceeds this number.
The table below sets forth the high and low sales prices per share of Equifax common stock, as reported on the
New York Stock Exchange, for each quarter in the last two fiscal years and dividends declared per share:
|
High Sales Price
|
Low Sales Price
|
Dividends
(1)
|
||||||||||
|
(In dollars)
|
||||||||||||
|
2010
|
||||||||||||
|
First Quarter
|
$ | 36.63 | $ | 30.93 | $ | 0.04 | ||||||
|
Second Quarter
|
$ | 36.22 | $ | 27.98 | $ | 0.04 | ||||||
|
Third Quarter
|
$ | 32.29 | $ | 27.64 | $ | 0.04 | ||||||
|
Fourth Quarter
|
$ | 36.13 | $ | 30.53 | $ | 0.16 | ||||||
|
2009
|
||||||||||||
|
First Quarter
|
$ | 28.43 | $ | 19.63 | $ | 0.04 | ||||||
|
Second Quarter
|
$ | 29.62 | $ | 24.00 | $ | 0.04 | ||||||
|
Third Quarter
|
$ | 29.33 | $ | 24.39 | $ | 0.04 | ||||||
|
Fourth Quarter
|
$ | 31.64 | $ | 27.21 | $ | 0.04 | ||||||
|
(1)
|
Equifax’s Senior Credit Facility restricts our ability to pay cash dividends on our capital stock or repurchase capital stock if a default exists or would result according to the terms of the credit agreement.
|
Shareholder Return Performance Graph
The following graph compares Equifax’s five-year cumulative total shareholder return with that of the Standard & Poor’s Composite Stock Index (S&P 500) and two peer group indices, the Dow Jones U.S. General Financial Index, and the S&P 500 Commercial & Professional Services Index which is a subset of the S&P Stock Index that includes companies that provide business-to-business services. The graph assumes that value of the investment in our Common Stock and each index was $100 on the last trading day of 2005 and that all quarterly dividends were reinvested without commissions. Our past performance may not be indicative of future performance.
22
COMPARATIVE FIVE-YEAR CUMULATIVE TOTAL RETURN AMONG EQUIFAX INC., S&P 500, DOW JONES U.S. GENERAL FINANCIAL, AND S&P 500 COMMERCIAL & PROFESSIONAL SERVICES INDICES
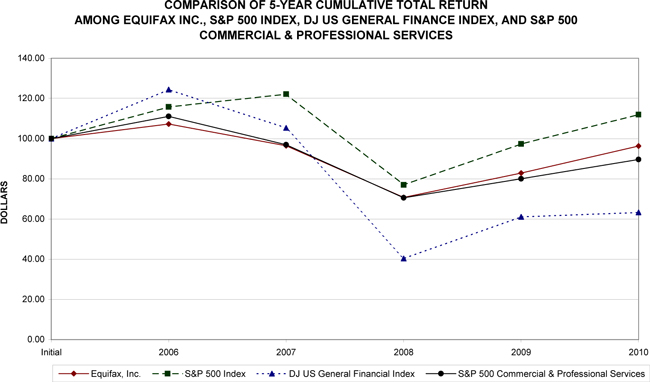
|
Fiscal Year Ended December 31,
|
||||||||||||||||||||||||
|
Initial
|
2006
|
2007
|
2008
|
2009
|
2010
|
|||||||||||||||||||
|
Equifax, Inc.
|
100.00 | 107.26 | 96.45 | 70.73 | 82.88 | 96.34 | ||||||||||||||||||
|
S&P 500 Index
|
100.00 | 115.79 | 122.16 | 76.96 | 97.33 | 111.99 | ||||||||||||||||||
|
DJ US General Financial Index
|
100.00 | 124.40 | 105.32 | 40.33 | 61.09 | 63.28 | ||||||||||||||||||
|
S&P 500 Commercial & Professional Services
|
100.00 | 111.06 | 96.95 | 70.57 | 80.02 | 89.60 | ||||||||||||||||||
The table below contains information with respect to purchases made by or on behalf of Equifax of its common stock during the fourth quarter ended December 31, 2010:
23
Issuer Purchases of Equity Securities
|
Maximum Number
|
||||||||||||||||
|
(or Approximate
|
||||||||||||||||
|
Total Number
|
Dollar Value)
|
|||||||||||||||
|
Total
|
Average
|
of Shares Purchased
|
of Shares that May
|
|||||||||||||
|
Number
|
Price
|
as Part of
|
Yet Be Purchased
|
|||||||||||||
|
of Shares
|
Paid
|
Publicly-Announced
|
Under the Plans or
|
|||||||||||||
|
Period
|
Purchased (1)
|
Per Share (2)
|
Plans or Programs
|
Programs (3)
|
||||||||||||
|
September 30, 2010
|
$ | 155,486,450 | ||||||||||||||
|
October 1 - October 31, 2010
|
2,426 | $ | - | - | $ | 155,486,450 | ||||||||||
|
November 1 - November 30, 2010
|
1,232,223 | $ | 34.49 | 1,230,873 | $ | 113,033,640 | ||||||||||
|
December 1 - December 31, 2010
|
255,193 | $ | 35.45 | 241,943 | $ | 104,456,761 | ||||||||||
|
Total
|
1,489,842 | $ | 34.65 | 1,472,816 | $ | 104,456,761 | ||||||||||
|
(1)
|
The total number of shares purchased includes: (a) shares purchased pursuant to our publicly-announced share repurchase program, or Program; and (b) shares surrendered, or deemed surrendered, in satisfaction of the exercise price and/or to satisfy tax withholding obligations in connection with the exercise of employee stock options and vesting of restricted stock, totaling 2,426 shares for the month of October 2010, 1,350 shares for the month of November 2010, and 13,250 shares for the month of December 2010.
|
|
(2)
|
Average price paid per share for shares purchased as part of our publicly-announced plan (includes brokerage commissions).
|
|
(3)
|
Under the share repurchase program authorized by our Board of Directors, we purchased 5.2 million common shares on the open market during the twelve months ended December 31, 2010 for $167.5 million. At December 31, 2010, the amount authorized for future share repurchases under the Program was $104.5 million.
|
Information relating to compensation plans under which the Company’s equity securities are authorized for issuance is included in the section captioned “Equity Compensation Plan Information” in our 2011 Proxy Statement and is incorporated herein by reference.
24
The table below summarizes our selected historical financial information for each of the last five years. The summary of operations data for the years ended December 31, 2010, 2009 and 2008, and the balance sheet data as of December 31, 2010 and 2009, have been derived from our audited Consolidated Financial Statements included in this report. The summary of operations data for the years ended December 31, 2007 and 2006, and the balance sheet data as of December 31, 2008, 2007 and 2006, have been derived from our audited Consolidated Financial Statements not included in this report. The historical selected financial information may not be indicative of our future performance and should be read in conjunction with
the information contained in Management’s Discussion and Analysis of Financial Condition and Results of Operations, and the Consolidated Financial Statements and the accompanying Notes to the Consolidated Financial Statements in this report.
|
Twelve Months Ended
|
||||||||||||||||||||
|
December 31,
|
||||||||||||||||||||
|
2010
|
2009
(1)(2)(4)
|
2008
(2)(4)
|
2007
(5)
|
2006
(4)
|
||||||||||||||||
|
(In millions, except per share data)
|
||||||||||||||||||||
|
Summary of Operations:
|
||||||||||||||||||||
|
Operating revenue
|
$ | 1,859.5 | $ | 1,716.0 | $ | 1,813.6 | $ | 1,706.7 | $ | 1,409.3 | ||||||||||
|
Operating expenses
|
$ | 1,429.5 | $ | 1,334.2 | $ | 1,374.6 | $ | 1,261.7 | $ | 1,004.1 | ||||||||||
|
Operating income
|
$ | 430.0 | $ | 381.8 | $ | 439.0 | $ | 445.0 | $ | 405.2 | ||||||||||
|
Consolidated income from continuing operations
|
$ | 243.3 | $ | 224.4 | $ | 254.9 | $ | 252.7 | $ | 259.5 | ||||||||||
|
Discontinued operations, net of tax
(6)
|
$ | 31.5 | $ | 16.1 | $ | 24.1 | $ | 26.1 | $ | 19.5 | ||||||||||
|
Net income attributable to Equifax
|
$ | 266.7 | $ | 233.9 | $ | 272.8 | $ | 272.7 | $ | 274.5 | ||||||||||
|
Dividends paid to Equifax shareholders
|
$ | 35.2 | $ | 20.2 | $ | 20.5 | $ | 20.7 | $ | 20.3 | ||||||||||
|
Diluted earnings per common share
|
||||||||||||||||||||
|
Net income from continuing operations attributable to Equifax
|
$ | 1.86 | $ | 1.70 | $ | 1.91 | $ | 1.83 | $ | 1.97 | ||||||||||
|
Discontinued operations attributable to Equifax
|
$ | 0.25 | $ | 0.13 | $ | 0.18 | $ | 0.19 | $ | 0.15 | ||||||||||
|
Net income attributable to Equifax
|
$ | 2.11 | $ | 1.83 | $ | 2.09 | $ | 2.02 | $ | 2.12 | ||||||||||
|
Cash dividends declared per common share
|
$ | 0.28 | $ | 0.16 | $ | 0.16 | $ | 0.16 | $ | 0.16 | ||||||||||
|
Weighted-average common shares outstanding (diluted)
(5)
|
126.5 | 127.9 | 130.4 | 135.1 | 129.4 | |||||||||||||||
|
As of December 31,
|
||||||||||||||||||||
|
2010
|
2009
(1)
|
2008
|
2007
(3)(5)
|
2006
|
||||||||||||||||
|
(In millions)
|
||||||||||||||||||||
|
Balance Sheet Data:
|
||||||||||||||||||||
|
Total assets
|
$ | 3,433.6 | $ | 3,550.5 | $ | 3,260.3 | $ | 3,523.9 | $ | 1,790.6 | ||||||||||
|
Short-term debt and current maturities
|
$ | 20.7 | $ | 183.2 | $ | 31.9 | $ | 222.1 | $ | 330.0 | ||||||||||
|
Long-term debt, net of current portion
|
$ | 978.9 | $ | 990.9 | $ | 1,187.4 | $ | 1,165.2 | $ | 173.9 | ||||||||||
|
Total debt, net
|
$ | 999.6 | $ | 1,174.1 | $ | 1,219.3 | $ | 1,387.3 | $ | 503.9 | ||||||||||
|
Shareholders' equity
|
$ | 1,708.4 | $ | 1,615.0 | $ | 1,323.5 | $ | 1,408.0 | $ | 844.2 | ||||||||||
|
(1)
|
On October 27, 2009, we acquired IXI Corporation for $124.0 million. On November 2, 2009, we acquired Rapid Reporting Verification Company for $72.5 million. The results of these acquisitions are included in our Consolidated Financial Statements subsequent to the acquisition dates. For additional information about these acquisitions, see Note 3 of the Notes to Consolidated Financial Statements in this report.
|
|
(2)
|
During 2009 and 2008, we recorded restructuring and asset write-down charges of $24.8 million and $16.8 million, respectively ($15.8 million and $10.5 million, respectively, net of tax). For additional information about these charges, see Note 11 of the Notes to the Consolidated Financial Statements in this report.
|
|
(3)
|
During 2007, total debt increased as a result of our issuance of $550.0 million of ten- and thirty-year fixed rate senior notes during the second quarter, our assumption of $75.0 million in senior guaranteed notes of TALX due 2012, and the commencement of a commercial paper program for general corporate purposes.
|
|
(4)
|
During 2009, we recorded a $7.3 million income tax benefit related to our ability to utilize foreign tax credits beyond 2009. In 2008 and 2006, we recorded income tax benefits of $14.6 million and $9.5 million, respectively, related to uncertain tax positions for which the statute of limitations expired.
|
25
|
(5)
|
On May 15, 2007, we acquired all the outstanding shares of TALX. Under the terms of the transaction, we issued 20.6 million shares of Equifax common stock and 1.9 million fully-vested options to purchase Equifax common stock, and paid approximately $288.1 million in cash, net of cash acquired. We also assumed TALX’s outstanding debt, which had a fair value totaling $177.6 million at May 15, 2007. The results of TALX’s operations are included in our Consolidated Financial Statements beginning on the date of acquisition.
|
|
(6)
|
On April 23, 2010, we sold our APPRO loan origination software business (“APPRO”) for approximately $72 million. On July 1, 2010, we sold the assets of our Direct Marketing Services division (“DMS”) for approximately $117 million. Both of these were previously reported in our U.S. Consumer Information Solutions segment. We have presented the APPRO and DMS operations as discontinued operations for all periods presented. For additional information about these divestitures, see Note 2 of the Notes to Consolidated Financial Statements in this report.
|
26
As used herein, the terms Equifax, the Company, we, our and us refer to Equifax Inc., a Georgia corporation, and its consolidated subsidiaries as a combined entity, except where it is clear that the terms mean only Equifax Inc.
All references to earnings per share data in Management’s Discussion and Analysis, or MD&A, are to diluted earnings per share, or EPS, unless otherwise noted. Diluted EPS is calculated to reflect the potential dilution that would occur if stock options or other contracts to issue common stock were exercised and resulted in additional common shares outstanding.
BUSINESS OVERVIEW
We are a leading global provider of information solutions, employment, income and identity verifications and human resources business process outsourcing services. We leverage some of the largest sources of consumer and commercial data, along with advanced analytics and proprietary technology, to create customized insights which enable our business customers to grow faster, more efficiently, and more profitably, and to inform and empower consumers.
Businesses rely on us for consumer and business credit intelligence, credit portfolio management, fraud detection, decisioning technology, marketing tools, and human resources and payroll services. We also offer a portfolio of products that enable individual consumers to manage their financial affairs and protect their identity. Our revenue stream is diversified among individual consumers and among businesses across a wide range of industries and international geographies.
Segment and Geographic Information
Segments.
The U.S. Consumer Information Solutions, or USCIS, segment, the largest of our five segments, consists of three product and service lines: Online Consumer Information Solutions, or OCIS; Mortgage Solutions; and Consumer Financial Marketing Services. OCIS and Mortgage Solutions revenue is principally transaction-based and is derived from our sales of products such as consumer credit reporting and scoring, mortgage settlement services, identity verification, fraud detection and modeling services. USCIS also markets certain of our decisioning products which facilitate and automate a variety of consumer credit-oriented
decisions. Consumer Financial Marketing Services revenue is principally project- and subscription-based and is derived from our sales of batch credit, consumer wealth or demographic information such as those that assist clients in acquiring new customers, cross-selling to existing customers and managing portfolio risk.
The International segment consists of Latin America, Europe and Canada Consumer. Canada Consumer’s products and services are similar to our USCIS offerings, while Europe and Latin America are made up of varying mixes of product lines that are in our USCIS, North America Commercial Solutions and North America Personal Solutions reportable segments.
The TALX segment consists of The Work Number
®
and Tax and Talent Management business units. The Work Number revenue is transaction-based and is derived primarily from employment, income and social security number verifications. Tax and Talent Management revenues are derived from our provision of certain human resources business process outsourcing services that include both transaction- and subscription-based product offerings. These services assist our customers with the administration of unemployment claims and employer-based tax credits and the assessment of new hires.
North America Personal Solutions revenue is both transaction- and subscription-based and is derived from the sale of credit monitoring, debt management and identity theft protection products, which we deliver to consumers through the mail and electronically via the internet.
North America Commercial Solutions revenue is principally transaction-based, with the remainder project-based, and is derived from the sale of business information, credit scores and portfolio analytics that enable customers to utilize our reports to make financial, marketing and purchasing decisions related to businesses.
27
Geographic Information.
We currently operate in the following countries: Argentina, Brazil, Canada, Chile, Costa Rica, Ecuador, El Salvador, Honduras, Paraguay, Peru, Portugal, the Republic of Ireland, Spain, the U.K., Uruguay, and the U.S. Our operations in Costa Rica and the Republic of Ireland focus on data handling and customer support activities. We own an equity interest in a consumer credit information company in Russia. During 2009, we formed a joint venture to provide a broad range of credit data and information solutions in India. Of the countries we operate in, 73% of our revenue was generated in the U.S. during the
twelve months ended December 31, 2010.
Key Performance Indicators.
Management focuses on a variety of key indicators to monitor operating and financial performance. These performance indicators include measurements of operating revenue, change in operating revenue, operating income, operating margin, net income, diluted earnings per share, cash provided by operating activities and capital expenditures. The key performance indicators for the twelve months ended December 31, 2010, 2009 and 2008, include the following:
|
Key Performance Indicators
|
||||||||||||
|
Twelve Months Ended
|
||||||||||||
|
December 31,
|
||||||||||||
|
2010
|
2009
|
2008
|
||||||||||
|
(Dollars in millions, except per share data)
|
||||||||||||
|
Operating revenue
|
$ | 1,859.5 | $ | 1,716.0 | $ | 1,813.6 | ||||||
|
Operating revenue change
|
8 | % | -5 | % | 6 | % | ||||||
|
Operating income
|
$ | 430.0 | $ | 381.8 | $ | 439.0 | ||||||
|
Operating margin
|
23.1 | % | 22.2 | % | 24.2 | % | ||||||
|
Net income attributable to Equifax
|
$ | 266.7 | $ | 233.9 | $ | 272.8 | ||||||
|
Diluted earnings per share from continuing operations
|
$ | 1.86 | $ | 1.70 | $ | 1.91 | ||||||
|
Cash provided by operating activities
|
$ | 352.6 | $ | 418.4 | $ | 448.1 | ||||||
|
Capital expenditures
|
$ | 99.8 | $ | 70.7 | $ | 110.5 | ||||||
Operational and Financial Highlights.
|
|
•
|
On April 23, 2010, we sold our APPRO loan origination software business (“APPRO”) for approximately $72 million. On July 1, 2010, we sold the assets of our Direct Marketing Services division (“DMS”) for approximately $117 million.
|
|
|
•
|
On October 1, 2010, we acquired Anakam, Inc., a provider of large-scale, software-based, multi-factor authentication solutions for $64.3 million. Anakam is part of our U.S. Consumer Information Solutions segment.
|
|
|
•
|
We repurchased 5.2 million shares of our common stock on the open market for $167.5 million during 2010.
|
|
|
•
|
Total debt was $1.0 billion at December 31, 2010, a decrease of $174.5 million from December 31, 2009.
|
Business Environment, Company Outlook and Strategy
Consumer and small business lending activity, which is one of the drivers of demand for our services, has stabilized in most markets around the world, but in most cases is not yet showing significant growth. We expect growth in consumer lending to continue to lag the general economic recovery, particularly in the more mature markets. In addition, new financial regulations are increasing the compliance requirements for many of our customers, introducing new challenges and opportunities in the marketing of our product and service offerings to financial institutions. In an effort to respond to these challenges, we have focused on the following initiatives and activities:
|
|
•
|
We are further diversifying our revenues by pursuing and investing in key strategic initiatives including new product innovation, differentiated decisioning solutions and analytics leveraging our diverse data assets and technology.
|
28
|
|
•
|
We have reorganized our sales force and have key customer teams dedicated to our largest accounts.
|
|
|
•
|
We have divested two product lines that were considered non-strategic, APPRO loan origination software and Direct Marketing Services.
|
|
|
•
|
We continue to acquire new data assets and technologies and pursue international expansion.
|
|
|
•
|
We continue to focus on managing our expenses through the use of LEAN, Work Out and other process improvement initiatives.
|
For 2011, the operating environment will continue to create challenges for the marketing and growth of our traditional products and services, but will also create new opportunities for our more recently developed products which leverage our diverse data assets, analytical capabilities and technology to improve customers' decisioning capabilities and risk management activities. In 2011, we expect improvements in the credit economy to be modest and therefore not contribute measurably to organic growth. However, we do expect to derive organic growth through our new product offerings and from the momentum we achieved as a result of our performance in 2010.
RESULTS OF OPERATIONS —
TWELVE MONTHS ENDED DECEMBER 31, 2010, 2009 AND 2008
Consolidated Financial Results
Operating Revenue
|
Twelve Months Ended December 31,
|
Change
|
|||||||||||||||||||||||||||
|
2010 vs. 2009
|
2009 vs. 2008
|
|||||||||||||||||||||||||||
|
Operating Revenue
|
2010
|
2009
|
2008
|
$
|
%
|
$
|
%
|
|||||||||||||||||||||
|
(Dollars in millions)
|
||||||||||||||||||||||||||||
|
U.S. Consumer Information Solutions
|
$ | 743.0 | $ | 712.2 | $ | 768.7 | $ | 30.8 | 4 | % | $ | (56.5 | ) | -7 | % | |||||||||||||
|
International
|
482.8 | 438.6 | 505.7 | 44.2 | 10 | % | (67.1 | ) | -13 | % | ||||||||||||||||||
|
TALX
|
395.6 | 346.4 | 305.1 | 49.2 | 14 | % | 41.3 | 14 | % | |||||||||||||||||||
|
North America Personal Solutions
|
157.6 | 149.0 | 162.6 | 8.6 | 6 | % | (13.6 | ) | -8 | % | ||||||||||||||||||
|
North America Commercial Solutions
|
80.5 | 69.8 | 71.5 | 10.7 | 15 | % | (1.7 | ) | -2 | % | ||||||||||||||||||
|
Consolidated operating revenue
|
$ | 1,859.5 | $ | 1,716.0 | $ | 1,813.6 | $ | 143.5 | 8 | % | $ | (97.6 | ) | -5 | % | |||||||||||||
Revenue from continuing operations increased by 8% compared to 2009. The favorable effect of foreign exchange rates increased revenue by $24.1 million, or 1.4%, in 2010 compared to the prior year period. Revenue grew over the prior year in each of our operating segments, primarily driven by strong execution of key strategic initiatives as well as growth contributed by 2009 acquisitions in USCIS and TALX. For additional information about revenue fluctuations and operating income by segment, see “Segment Financial Results” below.
The decrease in revenue from continuing operations for 2009, as compared to 2008, was primarily due to continued global economic weakness, which significantly impacted demand for our U.S. Consumer Information Solutions, International and North America Personal Solutions business units when compared to 2008, as well as the unfavorable effects of foreign exchange rates. Foreign currency negatively impacted 2009 revenue by $48.9 million, or 3%. This decrease was partially offset by strength in our TALX segment and Mortgage Solutions business within U.S. Consumer Information Solutions.
29
Operating Expenses
|
Twelve Months Ended December 31,
|
Change
|
|||||||||||||||||||||||||||
|
2010 vs. 2009
|
2009 vs. 2008
|
|||||||||||||||||||||||||||
|
Operating Expenses
|
2010
|
2009
|
2008
|
$
|
%
|
$
|
%
|
|||||||||||||||||||||
|
(Dollars in millions)
|
||||||||||||||||||||||||||||
|
Consolidated cost of services
|
$ | 759.9 | $ | 718.8 | $ | 741.8 | $ | 41.1 | 6 | % | $ | (23.0 | ) | -3 | % | |||||||||||||
|
Consolidated selling, general and administrative expenses
|
507.4 | 470.2 | 490.6 | 37.2 | 8 | % | (20.4 | ) | -4 | % | ||||||||||||||||||
|
Consolidated depreciation and amortization expense
|
162.2 | 145.2 | 142.2 | 17.0 | 12 | % | 3.0 | 2 | % | |||||||||||||||||||
|
Consolidated operating expenses
|
$ | 1,429.5 | $ | 1,334.2 | $ | 1,374.6 | $ | 95.3 | 7 | % | $ | (40.4 | ) | -3 | % | |||||||||||||
Cost of Services.
The increase in cost of services from continuing operations, when compared to 2009, was due primarily to the impact of increased salary and incentives expense of $6.3 million; the impact of changes in foreign currency exchange rates which increased our cost of services by $11.4 million; and the impact of our fourth quarter 2009 acquisitions of IXI Corporation and Rapid Reporting Verification Company.
The decrease in cost of services from continuing operations for 2009, as compared to the prior year, was primarily due to the impact of foreign currency translation. The impact of foreign currency translation decreased our cost of services by $19.2 million during 2009. The remaining decrease was due to lower technology outsourcing costs resulting from a renegotiated contract with a large service provider and lower personnel costs resulting from our third quarter 2008 and 2009 headcount reductions. This decrease was partially offset by increased production costs related to growth in demand for our settlement services products within our Mortgage Solutions business and increased postretirement employee benefit
costs. We reclassified $13.2 million of selling, general and administrative expense during the twelve months ended December 31, 2008 to cost of services to conform to the current period presentation.
Selling, General and Administrative Expenses.
The increase in selling, general and administrative expenses from continuing operations of $37.2 million in 2010 when compared to 2009, was due to changes in foreign exchange rates, which increased 2010 expense by $5.2 million, and increased salary, incentive and benefits expenses of $32.3 million, offset by $24.8 million in restructuring charges that were incurred during 2009 that did not recur in 2010. The remaining increase was primarily due to the impact of the inclusion of businesses acquired in the fourth quarter of 2009.
Selling, general and administrative expenses from continuing operations for 2009 decreased $20.4 million when compared to 2008. Of this decline, $12.7 million resulted from foreign currency translation. The remaining decrease was primarily due to reduced legal expenses, lower technology and occupancy costs and reduced personnel and incentive costs due to the 2008 and 2009 headcount reductions, partially offset by a $10.4 million increase in restructuring charges in 2009, increased advertising and insurance costs and higher postretirement employee benefits cost.
Depreciation and Amortization.
Depreciation and amortization expense from continuing operations in 2010 increased $17.0 million as compared to 2009 primarily due to our fourth quarter 2009 acquisitions which contributed $9.0 million of incremental depreciation and amortization expense, as well as the effect of recent investments in new products and technology infrastructure.
Depreciation and amortization expense from continuing operations increased $3.0 million in 2009 over 2008. Excluding the positive foreign currency translation impact of $2.6 million, depreciation and amortization expense increased $5.6 million over the prior year. The increase is primarily due to our fourth quarter 2009 acquisitions of IXI Corporation and Rapid Reporting Verification Company which contributed $1.8 million of incremental depreciation and amortization expense and the inclusion of a full year of depreciation and amortization expense for our 2008 acquisitions, partially offset by the absence of a $2.4 million software write-down charge recognized in 2008.
For additional information about our restructuring charges, see Note 11 of the Notes to the Consolidated Financial Statements in this report.
30
Operating Income and Operating Margin
|
Twelve Months Ended December 31,
|
Change
|
|||||||||||||||||||||||||||
|
2010 vs. 2009
|
2009 vs. 2008
|
|||||||||||||||||||||||||||
|
Operating Income and Operating Margin
|
2010
|
2009
|
2008
|
$
|
%
|
$
|
%
|
|||||||||||||||||||||
|
(Dollars in millions)
|
||||||||||||||||||||||||||||
|
Consolidated operating revenue
|
$ | 1,859.5 | $ | 1,716.0 | $ | 1,813.6 | $ | 143.5 | 8 | % | $ | (97.6 | ) | -5 | % | |||||||||||||
|
Consolidated operating expenses
|
(1,429.5 | ) | (1,334.2 | ) | (1,374.6 | ) | (95.3 | ) | 7 | % | 40.4 | -3 | % | |||||||||||||||
|
Consolidated operating income
|
$ | 430.0 | $ | 381.8 | $ | 439.0 | $ | 48.2 | 13 | % | $ | (57.2 | ) | -13 | % | |||||||||||||
|
Consolidated operating margin
|
23.1 | % | 22.2 | % | 24.2 | % | 0.9 |
pts
|
|
-2.0 | pts | |||||||||||||||||
The increase in operating income from continuing operations and operating margin for 2010, as compared to 2009, is primarily attributed to the 8% increase in revenue and $24.8 million of restructuring charges in 2009 that did not recur in 2010.
The decline in operating margin for 2009, as compared to 2008, was primarily due to lower operating income in our USCIS, International and North America Personal Solutions segments and $8.0 million of additional restructuring charges in 2009, partially offset by growth in our TALX operating income. The operating income declines for the aforementioned segments are attributed to reductions in revenue resulting from global economic weakness, partially offset by lower operating expenses due to headcount reductions, reduced incentive costs and lower technology outsourcing costs.
Other Expense, Net
|
Twelve Months Ended December 31,
|
Change
|
|||||||||||||||||||||||||||
|
2010 vs. 2009
|
2009 vs. 2008
|
|||||||||||||||||||||||||||
|
Other Expense, Net
|
2010
|
2009
|
2008
|
$
|
%
|
$
|
%
|
|||||||||||||||||||||
|
(Dollars in millions)
|
||||||||||||||||||||||||||||
|
Consolidated interest expense
|
$ | 56.1 | $ | 57.0 | $ | 71.3 | $ | (0.9 | ) | -2 | % | $ | (14.3 | ) | -20 | % | ||||||||||||
|
Consolidated other income, net
|
(1.3 | ) | (6.2 | ) | (6.2 | ) | 4.9 | -79 | % | - | 0 | % | ||||||||||||||||
|
Consolidated other expense, net
|
$ | 54.8 | $ | 50.8 | $ | 65.1 | $ | 4.0 | 8 | % | $ | (14.3 | ) | -22 | % | |||||||||||||
|
Average cost of debt
|
5.2 | % | 4.8 | % | 5.3 | % | ||||||||||||||||||||||
|
Total consolidated debt, net, at year end
|
$ | 999.6 | $ | 1,174.1 | $ | 1,219.3 | $ | (174.5 | ) | -15 | % | $ | (45.2 | ) | -4 | % | ||||||||||||
The increase in other expense, net, from continuing operations for 2010, as compared to 2009, was primarily due to a decline in other income, net. Other income, net, for 2009 included a $2.2 million mark-to-market adjustment on certain insurance policies, a $1.1 million gain on our repurchase of $7.5 million principal amount of our ten-year senior notes due 2017 and a $1.3 million gain related to a litigation settlement. Interest expense decreased slightly for 2010, when compared to 2009, as a decrease in our average debt balance from $1.18 billion to $1.07 billion more than offset an increase in the average interest rate on our total debt from 4.8% in 2009 to 5.2% in 2010. The
increase in our average interest rate paid was caused by a reduction in short term, floating rate commercial paper, while longer term fixed rate debt outstanding remained essentially unchanged.
The decrease in other expense, net, for 2009, as compared to 2008, was primarily due to lower interest rates on our floating rate debt, which drove the average cost of our total debt from 5.3% in 2008 to 4.8% in 2009, as well as a reduced level of debt outstanding during 2009. Our average debt balance fell to $1.18 billion in 2009 from $1.34 billion in 2008. For additional information about our debt agreements, see Note 5 of the Notes to the Consolidated Financial Statements in this report. Other income, net, for 2009 primarily includes a $2.2 million mark-to-market adjustment on certain insurance policies, a $1.1 million gain on our repurchase of $7.5 million principal amount of our
ten-year senior notes due 2017 and a $1.3 million gain related to a litigation settlement. Other income, net in 2008 includes a $5.5 million gain on our repurchase of $20 million principal amount of ten-year senior notes due 2017.
31
Income Taxes
|
Twelve Months Ended December 31,
|
Change
|
|||||||||||||||||||||||||||
|
2010 vs. 2009
|
2009 vs. 2008
|
|||||||||||||||||||||||||||
|
Provision for Income Taxes
|
2010
|
2009
|
2008
|
$
|
%
|
$
|
%
|
|||||||||||||||||||||
|
(Dollars in millions)
|
||||||||||||||||||||||||||||
|
Consolidated provision for income taxes
|
$ | 131.9 | $ | 106.6 | $ | 119.0 | $ | 25.3 | 24 | % | $ | (12.4 | ) | -10 | % | |||||||||||||
|
Effective income tax rate
|
35.1 | % | 32.2 | % | 31.8 | % | ||||||||||||||||||||||
Our effective tax rate was 35.1% for 2010, up from 32.2% for the same period in 2009. The 2010 rate was higher due primarily to the prior year recognition of a $7.3 million income tax benefit related to our ability to utilize foreign tax credits beyond 2009, more favorable discrete items in 2009 related to foreign and state taxes and a 2009 investment loss in subsidiary, partially offset by a permanent federal deduction realized in 2010. We expect our effective tax rate in 2011 to increase to a range of 36% to 38%.
Our effective income tax rate for 2009 was up slightly compared to 2008. The 2009 rate reflects the recognition of a $7.3 million income tax benefit in the fourth quarter of 2009 related to our ability to utilize foreign tax credits beyond 2009. Additionally, we recorded favorable discrete items in 2009 related to foreign and state taxes and an investment loss in a subsidiary. With the fourth quarter 2009 adjustments, we have recognized the benefit of foreign tax credit carryforwards that would have reduced future tax expense. The 2008 rate reflects $14.6 million in income tax benefits that we recorded related to uncertain tax positions for which the statute of limitations had expired which resulted
in a lower effective income tax rate in 2008 as compared to 2009.
Net Income
|
Twelve Months Ended December 31,
|
Change
|
|||||||||||||||||||||||||||
|
2010 vs. 2009
|
2009 vs. 2008
|
|||||||||||||||||||||||||||
|
Net Income
|
2010
|
2009
|
2008
|
$
|
%
|
$
|
%
|
|||||||||||||||||||||
|
(In millions, except per share amounts)
|
||||||||||||||||||||||||||||
|
Consolidated operating income
|
$ | 430.0 | $ | 381.8 | $ | 439.0 | $ | 48.2 | 13 | % | $ | (57.2 | ) | -13 | % | |||||||||||||
|
Consolidated other expense, net
|
(54.8 | ) | (50.8 | ) | (65.1 | ) | (4.0 | ) | 8 | % | 14.3 | -22 | % | |||||||||||||||
|
Consolidated provision for income taxes
|
(131.9 | ) | (106.6 | ) | (119.0 | ) | (25.3 | ) | 24 | % | 12.4 | -10 | % | |||||||||||||||
|
Consolidated net income from continuing operations
|
$ | 243.3 | $ | 224.4 | $ | 254.9 | $ | 18.9 | 8 | % | $ | (30.5 | ) | -12 | % | |||||||||||||
|
Discontinued operations, net of tax
|
$ | 31.5 | $ | 16.1 | $ | 24.1 | $ | 15.4 | 94 | % | $ | (8.0 | ) | -33 | % | |||||||||||||
|
Net income attributable to noncontrolling interests
|
(8.1 | ) | (6.6 | ) | (6.2 | ) | (1.5 | ) | 22 | % | (0.4 | ) | 6 | % | ||||||||||||||
|
Net income attributable to Equifax
|
$ | 266.7 | $ | 233.9 | $ | 272.8 | $ | 32.8 | 14 | % | $ | (38.9 | ) | -14 | % | |||||||||||||
|
Diluted earnings per common share
|
||||||||||||||||||||||||||||
|
Net income from continuing operations attributable to Equifax
|
$ | 1.86 | $ | 1.70 | $ | 1.91 | $ | 0.16 | 9 | % | $ | (0.21 | ) | -11 | % | |||||||||||||
|
Discontinued operations attributable to Equifax
|
0.25 | 0.13 | 0.18 | $ | 0.12 | 92 | % | $ | (0.05 | ) | -28 | % | ||||||||||||||||
|
Net income attributable to Equifax
|
$ | 2.11 | $ | 1.83 | $ | 2.09 | $ | 0.28 | 15 | % | $ | (0.26 | ) | -12 | % | |||||||||||||
|
Weighted-average shares used in computing diluted earnings per share
|
126.5 | 127.9 | 130.4 | |||||||||||||||||||||||||
The increase in net income attributable to Equifax for 2010, as compared to 2009, was primarily due to increased income from discontinued operations, driven by a $14.9 million gain, net of tax, on the sale of DMS recorded in the third quarter of 2010 and a $12.3 million gain, net of tax, on the sale of the APPRO product line recorded in the second quarter of 2010. Net income attributed to Equifax for 2010 also benefited from higher operating income, which grew generally in line with higher revenue.
The decrease in net income for 2009, as compared to 2008, was a function of lower operating income in three of our five businesses and $8.0 million of additional restructuring charges in 2009, partially offset by increased income from our TALX and North America Commercial Solutions segments and lower interest expense.
32
Segment Financial Results
U.S. Consumer Information Solutions
|
Twelve Months Ended December 31,
|
Change
|
|||||||||||||||||||||||||||
|
2010 vs. 2009
|
2009 vs. 2008
|
|||||||||||||||||||||||||||
|
U.S. Consumer Information Solutions
|
2010
|
2009
|
2008
|
$
|
%
|
$
|
%
|
|||||||||||||||||||||
|
(Dollars in millions)
|
||||||||||||||||||||||||||||
|
Operating revenue:
|
||||||||||||||||||||||||||||
|
Online Consumer Information Solutions
|
$ | 485.2 | $ | 501.4 | $ | 566.5 | $ | (16.2 | ) | -3 | % | $ | (65.1 | ) | -11 | % | ||||||||||||
|
Mortgage Solutions
|
113.5 | 99.5 | 70.2 | 14.0 | 14 | % | 29.3 | 42 | % | |||||||||||||||||||
|
Consumer Financial Marketing Services
|
144.3 | 111.3 | 132.0 | 33.0 | 30 | % | (20.7 | ) | -16 | % | ||||||||||||||||||
|
Total operating revenue
|
$ | 743.0 | $ | 712.2 | $ | 768.7 | $ | 30.8 | 4 | % | $ | (56.5 | ) | -7 | % | |||||||||||||
|
% of consolidated revenue
|
40 | % | 41 | % | 42 | % | ||||||||||||||||||||||
|
Total operating income
|
$ | 269.8 | $ | 259.4 | $ | 298.9 | $ | 10.4 | 4 | % | $ | (39.5 | ) | -13 | % | |||||||||||||
|
Operating margin
|
36.3 | % | 36.4 | % | 38.9 | % | -0.1 |
pts
|
|
-2.5 |
pts
|
|||||||||||||||||
U.S. Consumer Information Solutions revenue increased 4% in 2010 as compared to 2009 as growth in Mortgage Solutions along with growth due to our acquisition of IXI Corporation in the fourth quarter of 2009 was partially offset by a small decline in online credit reporting revenue. The decrease in revenue for 2009, as compared to 2008, was mainly due to continued weakness in the U.S. credit and retail economy, offset by growth in the Mortgage Solutions business due to increased activity associated with our settlement services products and increased mortgage refinancing activity in 2009 and 2010.
OCIS.
Revenue for 2010, as compared to 2009, declined primarily due to a reduction of online credit decision transaction volume of 5% caused by weakness in the U.S. consumer credit markets while pricing remained relatively flat year over year. Revenue for 2009, as compared to the prior year, declined primarily due to a reduction of online credit decision transaction volume as consumer lending activity was lower than in 2008. The 18% decline in volume for 2009, from the prior year, was partially offset by a 4% increase in average revenue per transaction. This increase was attributable to a disproportionate decline in
volume from large national accounts which are generally billed at a lower average price per transaction.
Mortgage Solutions.
Revenue for 2010 has increased, as compared to the prior year, due to favorable long-term interest rates that have resulted in higher consumer refinancing activity and increased home sales activity attributable to U.S. government incentives for housing purchases which expired on May 31, 2010. The 2009 increase in revenue, as compared to 2008, is due to increased activity associated with growth in demand for our settlement services products which resulted in increased revenue of $16.5 million over 2008, higher volumes of mortgage credit reporting related to increased refinance activity and incremental
revenue from our acquisition of certain assets of a small mortgage credit reporting reseller.
Consumer Financial Marketing Services.
The increase in revenue in 2010, as compared to 2009, was primarily due to our acquisition of IXI Corporation during the fourth quarter of 2009. Revenue decreased in 2009 as compared to 2008 as banks and other market participants reduced prescreen marketing volumes and negotiated lower prices for portfolio management services at a time of significant uncertainty in the consumer credit market. This decline was partially offset by approximately $6 million of incremental revenue from our acquisition of IXI Corporation in October 2009.
U.S. Consumer Information Solutions Operating Margin.
Operating margin remained relatively consistent in 2010, as compared to 2009. The margin impact of amortization expense associated with the IXI acquisition was offset by expense leveraging resulting from revenue growth and expense reductions due to certain process streamlining activities.
Operating margin decreased for 2009, as compared to 2008, mainly due to revenue declines described above in our OCIS and Consumer Financial Marketing Services businesses. Our operating expenses generally do not decline at the same rate as our revenue due to a high portion of costs that are fixed rather than variable in the short term. The overall decline in revenue was partially offset by lower personnel costs due to headcount reductions, process efficiencies and lower technology outsourcing costs. The increases in revenue from our core mortgage and settlement services products also contributed to the USCIS margin decline as these products have higher variable costs and lower margins than traditional online database
products.
33
International
|
Twelve Months Ended December 31,
|
Change
|
|||||||||||||||||||||||||||
|
2010 vs. 2009
|
2009 vs. 2008
|
|||||||||||||||||||||||||||
|
International
|
2010
|
2009
|
2008
|
$
|
%
|
$
|
%
|
|||||||||||||||||||||
|
(Dollars in millions)
|
||||||||||||||||||||||||||||
|
Operating revenue:
|
||||||||||||||||||||||||||||
|
Latin America
|
$ | 231.3 | $ | 200.4 | $ | 219.9 | $ | 30.9 | 15 | % | $ | (19.5 | ) | -9 | % | |||||||||||||
|
Europe
|
137.6 | 138.4 | 175.0 | (0.8 | ) | -1 | % | (36.6 | ) | -21 | % | |||||||||||||||||
|
Canada Consumer
|
113.9 | 99.8 | 110.8 | 14.1 | 14 | % | (11.0 | ) | -10 | % | ||||||||||||||||||
|
Total operating revenue
|
$ | 482.8 | $ | 438.6 | $ | 505.7 | $ | 44.2 | 10 | % | $ | (67.1 | ) | -13 | % | |||||||||||||
|
% of consolidated revenue
|
26 | % | 26 | % | 28 | % | ||||||||||||||||||||||
|
Total operating income
|
$ | 119.4 | $ | 118.9 | $ | 149.9 | $ | 0.5 | 0 | % | $ | (31.0 | ) | -21 | % | |||||||||||||
|
Operating margin
|
24.7 | % | 27.1 | % | 29.6 | % | -2.4 |
pts
|
|
-2.5 |
pts
|
|||||||||||||||||
International revenue increased in 2010, as compared to 2009, primarily due to strong growth in Latin America and the favorable impact of changes in foreign exchange rates. Local currency fluctuations against the U.S. dollar favorably impacted our International revenue by $21.8 million, or 5%. In local currency, International revenue was up 5% in 2010. For 2009, as compared to 2008, revenue decreased primarily due to the negative impact of foreign currency translation and secondarily due to global economic weakness affecting several of our larger international country operations. Local currency fluctuation against the U.S. dollar negatively impacted our 2009 International revenue by
$47.2 million, or 9%. In local currency, 2009 revenue was down 4%, as compared to the same period a year ago.
Latin America.
Revenue increased for 2010, as compared to the prior year by $30.9 million, or 15%, partially due to the favorable foreign currency impact of $14.3 million, or 7%. In local currency, revenue increased 8% from 2009. Local currency revenue increased in most of our Latin American geographies, resulting from broad-based growth across all product segments, partially offset by a modest decline in Brazil.
Revenue declined for 2009, as compared to the prior year, due to an unfavorable foreign currency impact of $18.9 million, or 9%. In local currency, 2009 revenue was approximately flat when compared to 2008. Local currency revenue declines in Brazil and Chile were offset by increased revenue in our other Latin American geographies resulting from increased volumes for our collection services and decisioning technology products. The revenue declines in Brazil and Chile were mainly due to lower volumes related to our online solutions, marketing products and decisioning technologies, resulting primarily from competitive factors in these geographies.
Europe.
The slight decrease in revenue for 2010, as compared to 2009, was due to an unfavorable foreign currency impact of $3.2 million, or 3%. In local currency, revenue increased 2%, as compared to the same period in 2009. The increase was due to growth in online transactions and a higher volume of subscriptions in the U.K. as well as higher registries usage in Spain and Portugal offset by declines in some of our other product segments. The decline in revenue for 2009, as compared to the prior year, was partially due to the unfavorable foreign currency impact of $21.3 million, or 12%. In
local currency, revenue declined 9% for 2009, as compared to the same period in 2008. The local currency declines were due to decreased volume in the U.K. caused by weakness in the U.K. economy affecting customer demand, which was partially offset by higher volumes and new customers for our online services and new collections products in Spain and Portugal.
Canada Consumer.
The $14.1 million increase in revenue for 2010, as compared to the prior year, was primarily due to favorable foreign currency impact of $10.6 million, or 11%. In local currency, revenue increased 3% when compared to 2009. The increase in local currency was due to increased volumes for our technology and analytical services products primarily due to growth in the customer base for a new fraud mitigation product. The decline in revenue for 2009, as compared to the prior year, was partially due to an unfavorable foreign currency impact of $7.0 million, or 6%. In local currency, revenue
declined 4% for 2009, as compared to 2008. The decline in local currency was due to lower volumes related to our online solutions and marketing products resulting from weakness in the economy, partially offset by increased volumes for our analytical and decisioning technology products.
34
International Operating Margin.
Operating margin decreased for 2010, as compared to 2009, primarily due to a shift in product mix and increased operating expenses. Operating expenses increased 8% for 2010, in local currency, when compared to 2009, due to increased revenue and expense investments in new product development and increased sales force, particularly in Brazil. Operating margin decreased for 2009, as compared to 2008, due to the revenue declines discussed above. Operating expenses decreased 1% for 2009, in local currency, when compared to 2008, compared to a 4% decline in revenue in local
currency.
TALX
|
Twelve Months Ended December 31,
|
Change
|
|||||||||||||||||||||||||||
|
2010 vs. 2009
|
2009 vs. 2008
|
|||||||||||||||||||||||||||
|
TALX
|
2010
|
2009
|
2008
|
$
|
%
|
$
|
%
|
|||||||||||||||||||||
|
(Dollars in millions)
|
||||||||||||||||||||||||||||
|
Operating Revenue:
|
||||||||||||||||||||||||||||
|
The Work Number
|
$ | 209.1 | $ | 158.2 | $ | 131.9 | $ | 50.9 | 32 | % | $ | 26.3 | 20 | % | ||||||||||||||
|
Tax and Talent Management
|
186.5 | 188.2 | 173.2 | (1.7 | ) | -1 | % | 15.0 | 9 | % | ||||||||||||||||||
|
Total operating revenue
|
$ | 395.6 | $ | 346.4 | $ | 305.1 | $ | 49.2 | 14 | % | $ | 41.3 | 14 | % | ||||||||||||||
|
% of consolidated revenue
|
21 | % | 20 | % | 16 | % | ||||||||||||||||||||||
|
Total operating income
|
$ | 92.1 | $ | 75.4 | $ | 53.1 | $ | 16.7 | 22 | % | $ | 22.3 | 42 | % | ||||||||||||||
|
Operating margin
|
23.3 | % | 21.8 | % | 17.4 | % | 1.5 |
pts
|
|
4.4 | pts | |||||||||||||||||
The Work Number.
Revenue from The Work Number increased $50.9 million, or 32%, in 2010 compared to 2009 due to mid-double digit growth from traditional employment based verification and complementary services, with strong demand across each of the mortgage, pre-employment screening, social services and collections sectors; and due to the impact of our acquisition of Rapid Reporting Verification Company in the fourth quarter of 2009. Revenue increased in 2009, as compared to 2008, due to the increased volumes of verifications of consumer employment from government service agencies, who use our services to approve
benefits to consumers under certain government programs, and verifications of employment and income by financial institutions, who confirm consumer data for use in underwriting decisions. Our acquisition of Rapid Reporting Verification Company in November 2009 provided approximately $5 million of incremental revenue.
Tax and Talent Management Services.
The decrease in revenue during 2010, as compared to the prior year, resulted primarily from expected declines in our Tax Management Services business driven primarily by decreases in unemployment compensation claims activity, partially offset by revenue growth in our Talent Management Services business due to increased government hiring activity at the U.S. Transportation and Security Administration and other large government customers. The increase in revenue during 2009, as compared to 2008, resulted from growth in our Tax Management Services business driven primarily by increased
unemployment compensation claims activity due to the high levels of unemployment in the U.S., partially offset by declines in volume from our Talent Management Services business during the first half of the year, as demand was negatively impacted by reduced hiring activity by employers, particularly governmental agencies who are key clients, caused by the weakened economy and budgetary pressures.
TALX Operating Margin.
Operating margin increased 150 basis points for 2010, as compared to 2009, and 440 basis points in 2009, as compared to 2008, due to continued revenue growth, while operating expenses grew at a slower rate due to the leveraging of certain fixed operational and overhead costs and certain operating process efficiencies for both periods.
North America Personal Solutions
|
Twelve Months Ended December 31,
|
Change
|
|||||||||||||||||||||||||||
|
2010 vs. 2009
|
2009 vs. 2008
|
|||||||||||||||||||||||||||
|
North America Personal Solutions
|
2010
|
2009
|
2008
|
$
|
%
|
$
|
%
|
|||||||||||||||||||||
|
(Dollars in millions)
|
||||||||||||||||||||||||||||
|
Total operating revenue
|
$ | 157.6 | $ | 149.0 | $ | 162.6 | $ | 8.6 | 6 | % | $ | (13.6 | ) | -8 | % | |||||||||||||
|
% of consolidated revenue
|
9 | % | 9 | % | 9 | % | ||||||||||||||||||||||
|
Total operating income
|
$ | 44.6 | $ | 34.3 | $ | 46.3 | $ | 10.3 | 30 | % | $ | (12.0 | ) | -26 | % | |||||||||||||
|
Operating margin
|
28.3 | % | 23.0 | % | 28.4 | % | 5.3 |
pts
|
|
-5.4 |
pts
|
|||||||||||||||||
35
The increase in revenue for 2010, as compared to 2009, was primarily due to increased direct to customer, Equifax-branded subscription service revenue, which was up 11% from 2009, driven by higher average revenue per subscriber due to new product offerings and better market segmentation. The increase in subscription revenue was partially offset by lower transaction sales and lower corporate breach revenues. The operating margin increase was primarily due to the revenue growth and operating efficiencies.
Revenue declined for 2009, as compared to 2008, primarily due to lower transaction sales, as a result of lower levels of new consumer credit activity, and lower corporate data breach revenues. These declines were partially offset by direct to consumer, Equifax-branded subscription service revenue, which was up 4% for 2009, as compared to the prior year, driven by higher new sales and higher average revenue per subscription, reflecting additional features in the Equifax offering. Total subscription customers, including direct to consumer Equifax-branded services and subscriptions related to data breach offers, were 1.0 million at December 31, 2009. The operating margin decline in 2009, as compared to the
prior year, was primarily due to the revenue decline discussed above, as well as increased advertising expenses, as the Company introduced a 2009 television advertising program in order to increase direct subscription sales.
North America Commercial Solutions
|
Twelve Months Ended December 31,
|
Change
|
|||||||||||||||||||||||||||
|
2010 vs. 2009
|
2009 vs. 2008
|
|||||||||||||||||||||||||||
|
North America Commercial Solutions
|
2010
|
2009
|
2008
|
$
|
%
|
$
|
%
|
|||||||||||||||||||||
|
(Dollars in millions)
|
||||||||||||||||||||||||||||
|
Total operating revenue
|
$ | 80.5 | $ | 69.8 | $ | 71.5 | $ | 10.7 | 15 | % | $ | (1.7 | ) | -2 | % | |||||||||||||
|
% of consolidated revenue
|
4 | % | 4 | % | 4 | % | ||||||||||||||||||||||
|
Total operating income
|
$ | 19.5 | $ | 15.1 | $ | 13.6 | $ | 4.4 | 29 | % | $ | 1.5 | 11 | % | ||||||||||||||
|
Operating margin
|
24.2 | % | 21.7 | % | 19.0 | % | 2.5 |
pts
|
|
2.7 |
pts
|
|||||||||||||||||
Revenue increased for 2010, as compared to 2009, $10.7 million, or 15%. The favorable impact of changes in the U.S. – Canadian foreign exchange rate increased revenue by $2.3 million, or 3%. In local currency, revenue increased 12% in 2010 compared to the prior year. The local currency increase was primarily due to increases in U.S. risk and marketing service revenue and revenue from our data management products. Online transaction volume for U.S. commercial credit information products for 2010 increased when compared to the prior year. Operating margin increased for 2010, as compared to 2009, as the rapid rate in revenue growth exceeded growth in
operating expenses.
Revenue declined for 2009, as compared to the prior year, due to the unfavorable impact of changes in the U.S. — Canadian foreign exchange rate of $1.7 million, or 2%. In local currency, 2009 revenue was flat when compared to 2008. Revenue declines in the U.S. and Canadian risk and marketing service revenues attributed to weakness in the U.S. and Canadian economies were offset by increased revenue from our data management products. Online transaction volume for U.S. commercial credit information products decreased 21% for 2009, as compared to the prior year, due to a slowdown in loan origination to small businesses. Operating margin increased for 2009, as compared to 2008, mainly due to reduced
operating expenses resulting from lower personnel costs and discretionary expenses.
General Corporate Expense
|
Twelve Months Ended December 31,
|
Change
|
|||||||||||||||||||||||||||
|
2010 vs. 2009
|
2009 vs. 2008
|
|||||||||||||||||||||||||||
|
General Corporate Expense
|
2010
|
2009
|
2008
|
$
|
%
|
$
|
%
|
|||||||||||||||||||||
|
(Dollars in millions)
|
||||||||||||||||||||||||||||
|
General corporate expense
|
$ | 115.4 | $ | 121.3 | $ | 122.8 | $ | (5.9 | ) | -5 | % | $ | (1.5 | ) | -1 | % | ||||||||||||
Our general corporate expenses are costs that are incurred at the corporate level and include those expenses impacted by corporate direction, such as shared services, administrative, legal, equity compensation costs and restructuring expenses. General corporate expenses decreased for 2010, as compared to 2009, primarily as a result of $24.8 million of restructuring charges recorded in 2009 that did not recur in 2010. This was partially offset by increased salary, benefit and incentive costs, upgrades in shared corporate technology, and acquisition-related expenses.
General corporate expenses decreased slightly for 2009, as compared to 2008, primarily as a result of reduced incentive costs, lower legal and professional fees and reduced occupancy costs. This was partially offset by $8.0 million of additional restructuring charges recorded during 2009, as well as increased insurance costs. Total 2009 restructuring charges of $24.8 million related primarily to headcount reductions.
36
LIQUIDITY AND FINANCIAL CONDITION
Management assesses liquidity in terms of our ability to generate cash to fund operating, investing and financing activities. We continue to generate substantial cash from operating activities and remain in a strong financial position, with resources available for reinvestment in existing businesses, strategic acquisitions and managing our capital structure to meet short- and long-term objectives.
Sources and Uses of Cash
Funds generated by operating activities and our credit facilities continue to be our most significant sources of liquidity. We believe that funds generated from expected results of operations will be sufficient to finance our anticipated working capital and other cash requirements (such as capital expenditures, interest payments, potential pension funding contributions, dividend payments and stock repurchases, if any) for the foreseeable future. Since the beginning of 2009, credit market conditions have improved and we have primarily shifted our short-term borrowings to our commercial paper program. In the event that credit market conditions were to deteriorate, we would rely more heavily on borrowings as needed
under our Senior Credit Facility described below. At December 31, 2010, $848.3 million was available to borrow under our Senior Credit Facility. Our Senior Credit Facility does not include a provision under which lenders could refuse to allow us to borrow under this facility in the event of a material adverse change in our financial condition, as long as we are in compliance with the covenants contained in the lending agreement.
On February 18, 2011, we extended the maturity date and reduced the borrowing limits of our existing unsecured revolving credit facility dated as of July 24, 2006, as amended (the Senior Credit Facility) with a group of lenders by entering into a Second Amended and Restated Credit Agreement dated as of February 18, 2011 (the “Amended Agreement”). The Senior Credit Facility had been scheduled to expire on July 24, 2011, and provided $850 million of borrowing capacity. The Amended Agreement provides for a maturity date of February 18, 2015. We elected to reduce the size of the facility to $500 million in line with our liquidity needs and
reflecting credit market conditions, including higher upfront fees and fees for unused borrowing availability. The Amended Agreement also provides an accordion feature that allows us to request an increase in the total commitment amount to $750 million should we so choose. We added certain of our subsidiaries in Canada and Luxembourg as co-borrowers in addition to the Company and our U.K. subsidiary to provide additional flexibility as to the place of borrowing.
The Amended Agreement revises certain other terms of the existing credit agreement, including pricing, to reflect current market conditions. The pricing grid for the Senior Credit Facility, which is based on our applicable credit ratings at the time of any borrowing, was increased. Based on our current credit ratings, the unused facility fee as of the closing date increased from 8 to 20 basis points, and the margin for base rate or LIBOR rate loans and letters of credit as of the closing date increased from 32 to 150 basis points. The Amended Agreement did not change the existing financial covenant which requires us to maintain, on a
rolling four quarter basis, a maximum leverage ratio (the ratio of consolidated total funded debt to consolidated EBITDA as defined in the Amended Agreement) not to exceed 3.5 to 1.0. On February 18, 2011, we correspondingly reduced the size of our commercial paper program (the CP Program), which is supported by the Senior Credit Facility, from $850 million to $500 million.
Fund Transfer Limitations.
The ability of certain of our subsidiaries and associated companies to transfer funds to us is limited, in some cases, by certain restrictions imposed by foreign governments; these restrictions do not, individually or in the aggregate, materially limit our ability to service our indebtedness, meet our current obligations or pay dividends.
Information about our cash flows, by category, is presented in the consolidated statement of cash flows. The following table summarizes our cash flows for the twelve months ended December 31, 2010, 2009 and 2008:
37
|
Twelve Months Ended December 31,
|
Change
|
|||||||||||||||||||||||||||
|
2010 vs. 2009
|
2009 vs. 2008
|
|||||||||||||||||||||||||||
|
Net cash provided by (used in):
|
2010
|
2009
|
2008
|
$
|
%
|
$
|
%
|
|||||||||||||||||||||
|
(Dollars in millions)
|
||||||||||||||||||||||||||||
|
Operating activities
|
$ | 352.6 | $ | 418.4 | $ | 448.1 | $ | (65.8 | ) | -16 | % | $ | (29.7 | ) | -7 | % | ||||||||||||
|
Investing activities
|
$ | 1.0 | $ | (270.1 | ) | $ | (141.6 | ) | $ | 271.1 |
nm
|
$ | (128.5 | ) |
nm
|
|||||||||||||
|
Financing activities
|
$ | (335.3 | ) | $ | (108.3 | ) | $ | (319.1 | ) | $ | (227.0 | ) |
nm
|
$ | 210.8 |
nm
|
||||||||||||
nm — not meaningful
Operating Activities
The decrease in operating cash flow for 2010 was primarily driven by $35.0 million of additional pension contributions; a $16.4 million net impact on use of funds as accounts receivable, which had been reduced in 2009, grew in 2010 as revenue grew; and $42.0 million in taxes paid on the sale of DMS and the APPRO product line. These, and other lesser changes in assets and liabilities, more than offset increased net income and the contribution from higher depreciation and amortization.
The decrease in operating cash flow for 2009 was primarily driven by $38.5 million of lower consolidated net income described above and $29.3 million of pension contributions in 2009 with no similar payments made in 2008. These items were partially offset by year to year reduction in days sales outstanding in trade receivables and increases in operating liabilities as reduced levels of accruals in 2008 did not recur.
Fund Transfer Limitations.
The ability of certain of our subsidiaries and associated companies to transfer funds to us is limited, in some cases, by certain restrictions imposed by foreign governments; these restrictions do not, individually or in the aggregate, materially limit our ability to service our indebtedness, meet our current obligations or pay dividends.
Investing Activities
|
Twelve Months Ended December 31,
|
Change
|
|||||||||||||||||||
|
Net cash used in:
|
2010
|
2009
|
2008
|
2010 vs. 2009
|
2009 vs. 2008
|
|||||||||||||||
|
(Dollars in millions)
|
||||||||||||||||||||
|
Capital expenditures
|
$ | 99.8 | $ | 70.7 | $ | 110.5 | $ | 29.1 | $ | (39.8 | ) | |||||||||
Our capital expenditures are used for developing, enhancing and deploying new and existing software in support of our expanding product set, replacing or adding equipment, updating systems for regulatory compliance, the licensing of software applications and investing in system reliability, security and disaster recovery enhancements.
Capital expenditures in 2010 were higher than 2009 due to the purchase of our headquarters building in Atlanta, GA. On February 27, 2009, we notified the lessor of our headquarters building that we intended to exercise our purchase option in accordance with the lease terms. We purchased the building for $29.0 million on February 26, 2010. The notice of our intent to exercise our purchase option caused us to account for this lease obligation as a capital lease. We recorded the building and the related obligation on our Consolidated Balance Sheets at December 31, 2009. For additional information regarding our headquarters building lease, see Note 6 of the Notes to the Consolidated
Financial Statements in this report.
Capital expenditures in 2009 were less than 2008, due to significant data center infrastructure improvements that were substantially completed in 2008. We expect capital expenditures in 2011 to be in the range of $75 million to $95 million, as we continue to invest for growth.
38
Acquisitions, Divestitures and Investments
|
Twelve Months Ended December 31,
|
Change
|
|||||||||||||||||||
|
Net cash used in:
|
2010
|
2009
|
2008
|
2010 vs. 2009
|
2009 vs. 2008
|
|||||||||||||||
|
(Dollars in millions)
|
||||||||||||||||||||
|
Acquisitions, net of cash acquired
|
$ | (82.6 | ) | $ | (196.0 | ) | $ | (27.4 | ) | $ | 113.4 | $ | (168.6 | ) | ||||||
|
Proceeds received from divestitures
|
$ | 181.7 | $ | - | $ | - | $ | 181.7 | $ | - | ||||||||||
|
Investment in unconsolidated affiliates, net
|
$ | 1.7 | $ | (3.4 | ) | $ | (3.7 | ) | $ | 5.1 | $ | 0.3 | ||||||||
2010 Acquisitions, Divestitures and Investments.
On October 1, 2010, we acquired Anakam, Inc., a provider of large-scale, software-based, multi-factor authentication solutions for $64.3 million. The results of this acquisition are included in our U.S. Consumer Information Solutions segment.
To further enhance our market share, during the twelve months ended December 31, 2010, we completed four acquisitions totaling $12.3 million, net of cash acquired. These transactions were in our International segment and the results of these acquisitions are not material.
During 2010, we resolved a contingent earn-out associated with a 2008 acquisition included in our TALX segment. The earn-out of $6 million was measured on the completion of 2009 revenue targets and was accrued at December 31, 2009.
On April 23, 2010, we sold our Equifax Enabling Technologies LLC legal entity, consisting of our APPRO loan origination software business (“APPRO”) for approximately $72 million. On July 1, 2010, we sold the assets of our Direct Marketing Services division (“DMS”) for approximately $117 million. Both of these were previously reported in our U.S. Consumer Information Solutions segment. We have presented the APPRO and DMS operations as discontinued operations for all periods presented. The discontinued operations are further described in Note 2 of the Notes to the Consolidated Financial Statements in this report.
2009 Acquisitions, Divestitures and Investments.
On December 23, 2009, as a part of our long-term growth strategy of expanding into emerging markets, we formed a joint venture, Equifax Credit Information Services Private Limited, or ECIS, to provide a broad range of credit data and information solutions in India. We paid cash consideration of $5.2 million for our 49 percent equity interest in ECIS.
On November 2, 2009, to further enhance our income and identity verification service offerings, we acquired Rapid Reporting Verification Company, a provider of IRS tax transcript information and social security number authentication services, for $72.5 million. The results of this acquisition have been included in our TALX operating segment subsequent to the acquisition.
On October 27, 2009, we acquired IXI Corporation, a provider of consumer wealth and asset data, for $124.0 million. This acquisition enables us to offer more differentiated and in-depth consumer income, wealth and other data to help our clients improve their marketing, collections, portfolio management and customer management efforts across different product segments. The results of this acquisition have been included in our U.S. Consumer Information Solutions operating segment subsequent to the acquisition date.
We financed these purchases through borrowings under our Senior Credit Facility, which were subsequently refinanced through the issuance in November 2009 of our 4.45%, five-year unsecured Senior Notes. The 4.45% Senior Notes are further described in Note 5 of the Notes to the Consolidated Financial Statements in this report.
On August 12, 2009, in order to enhance our Mortgage Solutions business market share, we acquired certain assets and specified liabilities of a small mortgage credit reporting reseller for cash consideration of $3.8 million. The results of this acquisition have been included in our U.S. Consumer Information Solutions segment subsequent to the acquisition date.
39
2008 Acquisitions, Divestitures and Investments.
To further enhance our market share and grow our credit data business, during the twelve months ended December 31, 2008, we completed nine acquisitions and investments in a number of small businesses totaling $27.4 million, net of cash acquired. Six of the transactions were in our International segment, two within our U.S. Consumer Information Solutions segment and one within our TALX segment. We recorded a $6.0 million liability at December 31, 2009, with a corresponding adjustment to goodwill, for the contingent earn-out payment associated with the acquired
company within the TALX segment. The earn-out payment was measured on the completion of 2009 revenue targets and will be paid in 2010.
On June 30, 2008, as a part of our long-term growth strategy of entering new geographies, we acquired a 28 percent equity interest in Global Payments Credit Services LLC, or GPCS, a credit information company in Russia, for cash consideration of $4.4 million, which is now doing business as Equifax Credit Services, LLC in Russia. Under our shareholders’ agreement, we have the option to acquire up to an additional 22 percent interest in GPCS between 2011 and 2013 for cash consideration based on a formula for determining equity value of the business and the assumption of certain debt, subject to satisfaction of certain conditions.
For additional information about our acquisitions, see Note 3 of the Notes to Consolidated Financial Statements in this report.
Financing Activities
|
Twelve Months Ended December 31,
|
Change
|
|||||||||||||||||||
|
Net cash provided by (used in):
|
2010
|
2009
|
2008
|
2010 vs. 2009
|
2009 vs. 2008
|
|||||||||||||||
|
(Dollars in millions)
|
||||||||||||||||||||
|
Net short-term (repayments) borrowings
|
$ | (134.0 | ) | $ | 101.8 | $ | (184.8 | ) | $ | (235.8 | ) | $ | 286.6 | |||||||
|
Net borrowings (repayments) under long-term revolving credit facilities
|
$ | (5.0 | ) | $ | (415.2 | ) | $ | 45.0 | $ | 410.2 | $ | (460.2 | ) | |||||||
|
Payments on long-term debt
|
$ | (20.8 | ) | $ | (31.8 | ) | $ | (17.8 | ) | $ | 11.0 | $ | (14.0 | ) | ||||||
|
Proceeds from issuance of long-term debt
|
$ | - | $ | 274.4 | $ | 2.3 | $ | (274.4 | ) | $ | 272.1 | |||||||||
Credit Facility Availability.
Our principal unsecured revolving credit facility with a group of banks, which we refer to as the Senior Credit Facility, permitted us to borrow up to $850.0 million through July 2011. The Senior Credit Facility may be used for general corporate purposes. Availability of the Senior Credit Facility for borrowings is reduced by the outstanding face amount of any letters of credit issued under the facility and, pursuant to our existing Board of Directors authorization, by the outstanding principal amount of our commercial paper notes, or
CP. The Senior Credit Facility was scheduled to expire in July 2011. As noted above, on February 18, 2011, we extended the maturity date to February 18, 2015 and reduced the borrowing limits of the Senior Credit Facility from $850.0 million to $500.0 million pursuant to the Amended Agreement.
Our $850.0 million CP program has been established to allow for borrowing through the private placement of CP with maturities ranging from overnight to 397 days. We may use the proceeds of CP for general corporate purposes. On February 18, 2011, under the terms of the Amended Agreement, we correspondingly reduced the size of the CP Program, which is supported by the Senior Credit Facility, from $850 million to $500 million.
In June 2010, we amended our 364-day revolving credit agreement with a Canadian bank (our Canadian Credit Facility), to reduce the borrowing limit from C$20.0 million to C$10.0 million (denominated in Canadian dollars) and extending its maturity through June 2011. Borrowings may be used for general corporate purposes.
At December 31, 2010, no amounts were outstanding under our Senior Credit Facility, CP program or Canadian Credit Facility. At December 31, 2010, a total of $858.3 million was available under our committed credit facilities.
At December 31, 2010, approximately 72% of our debt was fixed-rate debt and 28% was effectively variable-rate debt. Our variable-rate debt, consisting of our five-year senior notes due 2014 (against which we have executed interest rate swaps to convert interest expense from fixed rates to floating rates), generally bears interest based on a specified margin plus a base rate (LIBOR) or on CP rates for investment grade issuers. The interest rates reset periodically, depending on the terms of the respective financing arrangements. At December 31, 2010, interest rates on our variable-rate debt were 2.1%.
Borrowing and Repayment Activity.
Net short-term borrowings (repayments) primarily represent activity under our CP program, as well as activity under our Canadian short-term revolving credit agreement. Net (repayments) borrowings under long-term revolving credit facilities relates to activity on our Senior Credit Facility. We primarily borrow under our CP program, when available.
40
The change in net short-term (repayments) borrowings in 2010 primarily reflects the net repayment of $134.0 million of CP notes since December 31, 2009. Net short-term borrowings in 2009 primarily reflects the net issuance of $132.0 million of CP notes, offset by the repayment of $25.8 million under our Canadian Credit Facility in 2009. Net short-term (repayments) in 2008 reflects the net repayment of $216.5 million of the balance outstanding on our CP notes, offset by the increase of $25.8 million in borrowings under our Canadian Credit Facility.
The change in net (repayments) borrowings for 2010 under long-term revolving credit facilities represents the 2009 repayment of borrowings outstanding at December 31, 2008, under our Senior Credit Facility as we decreased our use of CP to fund our capital needs in 2009 and 2010. The 2009 repayment of these borrowing drove the increase in net (repayments) borrowings for 2009. In 2008, the net borrowing activity under long-term revolving credit facilities primarily represents our pay down of $216.5 million of CP outstanding at December 31, 2007 from cash from operations and borrowings under our Senior Credit Facility to lower the average cost of our debt and due to the adverse conditions in the CP
market. In 2009, we purchased $7.5 million principal amount of our outstanding ten-year senior notes due 2017 for $6.3 million and $25.0 million principal amount of our outstanding debentures due 2028 for $25.1 million. During 2008, we purchased $20.0 million principal amount of the ten-year senior notes due 2017 for $14.3 million.
On November 4, 2009, we issued $275.0 million principal amount of 4.45%, five-year senior notes in an underwritten public offering. We used the net proceeds from the sale of the senior notes to repay amounts outstanding under our CP program, a portion of which was used to finance our fourth quarter 2009 acquisitions. In conjunction with our 2009 sale of five-year senior notes, we entered into five-year interest rate swaps, designated as fair value hedges, which convert the debt’s fixed interest rate to a variable rate.
Debt Covenants.
Our outstanding indentures and comparable instruments contain customary covenants including for example limits on secured debt and sale/leaseback transactions. In addition, our Senior Credit Facility and Canadian Credit Facility each require us to maintain a maximum leverage ratio of not more than 3.5 to 1.0, and limit the amount of subsidiary debt. Our leverage ratio was 1.71 at December 31, 2010. None of these covenants are considered restrictive to our operations and, as of December 31, 2010, we were in compliance with all of our debt covenants.
We do not have any credit rating triggers that would accelerate the maturity of a material amount of our outstanding debt; however, our senior notes, discussed above, contain change in control provisions. If we experience a change of control or publicly announce our intention to effect a change of control and the rating on the senior notes is lowered by Standard & Poor’s, or S&P, and Moody’s Investors Service, or Moody’s, below an investment grade rating within 60 days of such change of control or notice thereof, then we will be required to offer to repurchase the senior notes at a price equal to 101% of the aggregate principal amount of the senior notes plus accrued and unpaid
interest.
Credit Ratings.
Credit ratings reflect an independent agency’s judgment on the likelihood that a borrower will repay a debt obligation at maturity. The ratings reflect many considerations, such as the nature of the borrower’s industry and its competitive position, the size of the company, its liquidity and access to capital and the sensitivity of a company’s cash flows to changes in the economy. The two largest rating agencies, S&P and Moody’s, use alphanumeric codes to designate their ratings. The highest quality rating for long-term credit obligations is AAA and Aaa for S&P and Moody’s,
respectively. A security rating is not a recommendation to buy, sell or hold securities and may be subject to revision or withdrawal at any time by the assigning rating agency.
Long-term ratings of BBB- and Baa3 or better by S&P and Moody’s, respectively, reflect ratings on debt obligations that fall within a band of credit quality considered to be “investment grade”. At December 31, 2010, the long-term ratings for our obligations were BBB+ and Baa1, which are consistent with the ratings and outlooks which existed at December 31, 2009. A downgrade in our credit rating would increase the cost of borrowings under our CP program and credit facilities, and could limit, or in the case of a significant downgrade, preclude our ability to issue CP. If our credit ratings were to decline to lower levels, we could experience increases in the interest cost for any new
debt. In addition, the market’s demand for, and thus our ability to readily issue, new debt could become further influenced by the economic and credit market environment.
41
For additional information about our debt, including the terms of our financing arrangements, basis for variable interest rates and debt covenants, see Note 5 of the Notes to Consolidated Financial Statements in this report.
Equity Transactions
|
Twelve Months Ended December 31,
|
Change
|
|||||||||||||||||||
|
Net cash provided by (used in):
|
2010
|
2009
|
2008
|
2010 vs. 2009
|
2009 vs. 2008
|
|||||||||||||||
|
(Dollars in millions)
|
||||||||||||||||||||
|
Treasury stock purchases
|
$ | (167.5 | ) | $ | (23.8 | ) | $ | (155.7 | ) | $ | (143.7 | ) | $ | 131.9 | ||||||
|
Dividends paid to Equifax shareholders
|
$ | (35.2 | ) | $ | (20.2 | ) | $ | (20.5 | ) | $ | (15.0 | ) | $ | 0.3 | ||||||
|
Dividends paid to noncontrolling interests
|
$ | (5.1 | ) | $ | (4.0 | ) | $ | (3.4 | ) | $ | (1.1 | ) | $ | (0.6 | ) | |||||
|
Proceeds from exercise of stock options
|
$ | 29.3 | $ | 10.2 | $ | 14.7 | $ | 19.1 | $ | (4.5 | ) | |||||||||
|
Excess tax benefits from stock-based compensation plans
|
$ | 3.5 | $ | 1.3 | $ | 2.1 | $ | 2.2 | $ | (0.8 | ) | |||||||||
Sources and uses of cash related to equity during the twelve months ended December 31, 2010, 2009 and 2008 were as follows:
|
|
•
|
Under share repurchase programs authorized by our Board of Directors, we purchased 5.2 million, 0.9 million, and 4.5 million common shares on the open market during the twelve months ended December 31, 2010, 2009 and 2008, respectively, for $167.5 million, $23.8 million and $155.7 million, respectively, at an average price per common share of $32.28, $26.41 and $34.41, respectively. At December 31, 2010, the Company had $104.5 million remaining for stock repurchases under the existing Board authorization.
|
|
|
•
|
During the twelve months ended December 31, 2010, 2009 and 2008, we paid cash dividends to Equifax shareholders of $35.2 million, $20.2 million and $20.5 million, respectively, at $0.28 per share for 2010 and $0.16 per share for 2009 and 2008.
|
Contractual Obligations and Commercial Commitments
The following table summarizes our significant contractual obligations and commitments as of December 31, 2010. The table excludes commitments that are contingent based on events or factors uncertain at this time. Some of the excluded commitments are discussed below the footnotes to the table.
|
Payments due by
|
||||||||||||||||||||
|
Total
|
Less than 1 year
|
1 to 3 years
|
3 to 5 years
|
Thereafter
|
||||||||||||||||
|
(In millions)
|
||||||||||||||||||||
|
Debt (including capitalized lease obligation)
(1)
|
$ | 990.2 | $ | 19.9 | $ | 32.8 | $ | 290.0 | $ | 647.5 | ||||||||||
|
Operating leases
(2)
|
95.3 | 17.9 | 26.3 | 13.1 | 38.0 | |||||||||||||||
|
Data processing, outsourcing agreements and other purchase obligations
(3)
|
236.8 | 88.5 | 129.8 | 9.9 | 8.6 | |||||||||||||||
|
Other long-term liabilities
(4) (6)
|
98.1 | 7.3 | 13.2 | 8.8 | 68.8 | |||||||||||||||
|
Interest payments
(5)
|
761.3 | 54.0 | 104.2 | 93.2 | 509.9 | |||||||||||||||
| $ | 2,181.7 | $ | 187.6 | $ | 306.3 | $ | 415.0 | $ | 1,272.8 | |||||||||||
|
(1)
|
The amounts are gross of unamortized discounts totaling $2.1 million and fair value adjustments of $11.5 million at December 31, 2010. Total debt on our Consolidated Balance Sheets is net of the unamortized discounts and fair value adjustments.
|
|
(2)
|
Our operating lease obligations principally involve office space and equipment, which include the ground lease associated with our headquarters building that expires in 2048.
|
|
(3)
|
These agreements primarily represent our minimum contractual obligations for services that we outsource associated with our computer data processing operations and related functions, and certain administrative functions. These agreements expire between 2011 and 2014.
|
42
|
(4)
|
These long-term liabilities primarily relate to obligations associated with certain pension, postretirement and other compensation-related plans, some of which are discounted in accordance with U.S. generally accepted accounting principles, or GAAP. We made certain assumptions about the timing of such future payments. In the table above, we have not included amounts related to future pension plan obligations, as such required funding amounts beyond 2010 have not been deemed necessary due to our current expectations regarding future plan asset performance. During January 2011, we made a $10.0 million discretionary contribution to fund our U.S. Retirement Income Plan.
|
|
(5)
|
For future interest payments on variable-rate debt, which are generally based on a specified margin plus a base rate (LIBOR) or on CP rates for investment grade issuers, we used the variable rate in effect at December 31, 2010 to calculate these payments. Our variable rate debt at December 31, 2010, consisted of CP, borrowings under our credit facilities and our five-year senior notes due 2014 (against which we have executed interest rate swaps to convert interest expense from fixed rates to floating rates). Future interest payments related to our Senior Credit Facility and our CP program are based on the borrowings outstanding at December 31, 2010 through their respective maturity dates, assuming such borrowings are outstanding until that time. The variable portion of the rate
at December 31, 2010 was 2.1% for all of our variable-rate debt. Future interest payments may be different depending on future borrowing activity and interest rates.
|
|
(6)
|
This table excludes $27.9 million of unrecognized tax benefits, including interest and penalties, as we cannot make a reasonably reliable estimate of the period of cash settlement with the respective taxing authorities.
|
A potential significant future use of cash would be the payment to Computer Sciences Corporation, or CSC, if it were to exercise its option to sell its credit reporting business to us at any time prior to 2013. The option exercise price would be determined by agreement or by an appraisal process and would be due in cash within 180 days after the exercise of the option. We estimate that if the option had been exercised at December 31, 2010, the price range would have been approximately $625 million to $700 million. This estimate is based solely on our internal analysis of the value of the business, current market conditions and other factors, all of which are subject to constant change. Therefore,
the actual option exercise price could be materially higher or lower than our estimate. Our agreement with CSC, which expires on July 31, 2018, also provides us with an option to purchase its credit reporting business if it does not elect to renew the agreement or if there is a change in control of CSC while the agreement is in effect. If CSC were to exercise its option, or if we were able to and decided to exercise our option, then we would have to obtain additional sources of funding. We believe that this funding would be available from sources such as additional bank lines of credit and the capital markets for debt and/or equity financing. However, the availability and terms of any such capital financing would be subject to a number of factors, including credit market conditions, the state of the equity markets, general economic conditions, our credit ratings and our financial
performance and condition.
43
Off-Balance Sheet Transactions
We do not engage in off-balance sheet financing activities.
Pursuant to the terms of certain industrial revenue bonds, we transferred title to certain of our fixed assets with costs of $47.9 million and $35.7 million, as of December 31, 2010 and 2009, respectively, to a local governmental authority in the U.S. to receive a property tax abatement related to economic development. The title to these assets will revert back to us upon retirement or cancellation of the applicable bonds. These fixed assets are still recognized in the Company’s Consolidated Balance Sheets as all risks and rewards remain with the Company.
Letters of Credit and Guarantees
We will from time to time issue standby letters of credit, performance bonds or other guarantees in the normal course of business. The aggregate notional amount of all performance bonds and standby letters of credit was not material at December 31, 2010, and all have a remaining maturity of one year or less. Guarantees are issued from time to time to support the needs of our operating units. The maximum potential future payments we could be required to make under the guarantees is not material at December 31, 2010.
Benefit Plans
Prior to December 31, 2009, we had one non-contributory qualified retirement plan covering most U.S. salaried employees (the Equifax Inc. Pension Plan, or EIPP), a qualified retirement plan that covered U.S. salaried employees (the U.S. Retirement Income Plan, or USRIP) who terminated or retired before January 1, 2005 and a defined benefit plan for most salaried and hourly employees in Canada (the Canadian Retirement Income Plan, or CRIP). On December 31, 2009, the plan assets and obligations of the EIPP were merged with the USRIP. The USRIP remained as the sole U.S. qualified retirement plan.
At December 31, 2010, the USRIP met or exceeded ERISA’s minimum funding requirements. In January 2011, we made a contribution of $10.0 million to the USRIP. During the twelve months ended December 31, 2010, we made contributions of $50.0 million to the USRIP. During the twelve months ended December 31, 2009, we made contributions of $15.0 million to the EIPP. We also contributed $1.6 and $1.8 million to the CRIP during the twelve months ended December 31, 2010 and 2009, respectively. The Equifax Employee Benefits Trust contributed $12.5 million to the EIPP upon dissolution of the Trust in 2009. In the future, we will make minimum funding contributions as
required and may make discretionary contributions, depending on certain circumstances, including market conditions and liquidity needs. We believe additional funding contributions, if any, would not prevent us from continuing to meet our liquidity needs, which are primarily funded from cash flows generated by operating activities, available cash and cash equivalents, and our credit facilities.
For our non-U.S., tax-qualified retirement plans, we fund an amount sufficient to meet minimum funding requirements but no more than allowed as a tax deduction pursuant to applicable tax regulations. For the non-qualified supplementary retirement plans, we fund the benefits as they are paid to retired participants, but accrue the associated expense and liabilities in accordance with GAAP.
For additional information about our benefit plans, see Note 10 of the Notes to Consolidated Financial Statements in this report.
Seasonality
We experience seasonality in certain of our revenue streams. Revenue generated from The Work Number business unit within the TALX operating segment is generally higher in the first quarter due primarily to the provision of Form W-2 preparation services which occur in the first quarter each year. Revenue from our OCIS and Mortgage Solutions business units tends to increase in periods of the year in which our customers have higher volumes of credit granting decisions, most commonly the second and third calendar quarters.
44
Effects of Inflation and Changes in Foreign Currency Exchange Rates
Equifax’s operating results are not materially affected by inflation, although inflation may result in increases in the Company’s expenses, which may not be readily recoverable in the price of services offered. To the extent inflation results in rising interest rates and has other adverse effects upon the securities markets and upon the value of financial instruments, it may adversely affect the Company’s financial position and profitability.
A significant portion of the Company’s business is conducted in currencies other than the U.S. dollar, and changes in foreign exchange rates relative to the U.S. dollar can therefore affect the value of non-U.S. dollar net assets, revenues and expenses. Potential exposures as a result of these fluctuations in currencies are closely monitored. We generally do not mitigate the risks associated with fluctuating exchange rates, although we may from time to time through forward contracts or other derivative instruments hedge a portion of our translational foreign currency exposure or exchange rate risks associated with material transactions which are denominated in a foreign currency.
RECENT ACCOUNTING PRONOUNCEMENTS
For information about new accounting pronouncements and the potential impact on our Consolidated Financial Statements, see Note 1 of the Notes to Consolidated Financial Statements in this report.
APPLICATION OF CRITICAL ACCOUNTING POLICIES AND ESTIMATES
The Company’s Consolidated Financial Statements are prepared in conformity with U.S. GAAP. This requires our management to make estimates and assumptions that affect the reported amounts of assets and liabilities, revenues and expenses and related disclosures of contingent assets and liabilities in our Consolidated Financial Statements and the Notes to Consolidated Financial Statements. The following accounting policies involve critical accounting estimates because they are particularly dependent on estimates and assumptions made by management about matters that are uncertain at the time the accounting estimates are made. In addition, while we have used our best estimates based on facts and circumstances
available to us at the time, different estimates reasonably could have been used in the current period, or changes in the accounting estimates that we used are reasonably likely to occur from period to period, either of which may have a material impact on the presentation of our Consolidated Balance Sheets and Statements of Income. We also have other significant accounting policies which involve the use of estimates, judgments and assumptions that are relevant to understanding our results. For additional information about these policies, see Note 1 of the Notes to Consolidated Financial Statements in this report. Although we believe that our estimates, assumptions and judgments are reasonable, they are based upon information available at the time. Actual results may differ significantly from these estimates under different assumptions, judgments or conditions.
Revenue Recognition
Revenue is recognized when persuasive evidence of an arrangement exists, collectibility of arrangement consideration is reasonably assured, the arrangement fees are fixed or determinable and delivery of the product or service has been completed. A significant portion of our revenue is derived from our processing of transactions related to the provision of information services to our customers, in which case revenue is recognized, assuming all other revenue recognition criteria are met, when the services are provided. A smaller portion of our revenues relate to subscription-based contracts under which a customer pays a preset fee for a predetermined or unlimited number of transactions or services provided during the
subscription period, generally one year. Revenue related to subscription-based contracts having a preset number of transactions is recognized as the services are provided, using an effective transaction rate as the actual transactions are completed. Any remaining revenue related to unfulfilled units is not recognized until the end of the related contract’s subscription period. Revenue related to subscription-based contracts having an unlimited volume is recognized ratably during the contract term. Revenue is recorded net of sales taxes.
If at the outset of an arrangement, we determine that collectibility is not reasonably assured, revenue is deferred until the earlier of when collectibility becomes probable or the receipt of payment. If there is uncertainty as to the customer’s acceptance of our deliverables, revenue is not recognized until the earlier of receipt of customer acceptance or expiration of the acceptance period. If at the outset of an arrangement, we determine that the arrangement fee is not fixed or determinable, revenue is deferred until the arrangement fee becomes estimable, assuming all other revenue recognition criteria have been met.
45
The determination of certain of our tax management services revenue requires the use of estimates, principally related to transaction volumes in instances where these volumes are reported to us by our clients on a monthly basis in arrears. In these instances, we estimate transaction volumes based on average actual reported volumes reported in the past. Differences between our estimates and actual final volumes reported are recorded in the period in which actual volumes are reported. We have not experienced significant variances between our estimates and actual reported volumes in the past. We monitor actual volumes to ensure that we will continue to make reasonable estimates in the future. If we determine that we
are unable to make reasonable future estimates, revenue may be deferred until actual customer data is obtained. Also within our TALX operating segment, the fees for certain of our tax credits and incentives revenue are based on a percentage of the credit delivered to our clients. Revenue for these arrangements is recognized based on the achievement of milestones, upon calculation of the credit, or when the credit is utilized by our client, depending on the provisions of the client contract.
We have certain information solution offerings that are sold as multiple element arrangements. The multiple elements may include consumer or commercial information, file updates for certain solutions, services provided by our decisioning technologies personnel, training services, statistical models and other services. To account for each of these elements separately, the delivered elements must have stand-alone value to our customer, and there must exist objective and reliable evidence of the fair value for any undelivered elements. If we are unable to unbundle the arrangement into separate units of accounting, we apply one of the accounting policies described above. This may lead to the arrangement
consideration being recognized as the final contract element is delivered to our customer.
Many of our multiple element arrangements involve the delivery of services generated by a combination of services provided by one or more of our operating segments. No individual information service impacts the value or usage of other information services included in an arrangement and each service can be sold alone or, in most cases, purchased from another vendor without affecting the quality of use or value to the customer of the other information services included in the arrangement. Some of our products require the development of interfaces or platforms by our decisioning technologies personnel that allow our customers to interact with our proprietary information databases. These development services do not meet
the requirement for having stand-alone value, thus any related development fees are deferred when billed and are recognized over the expected period that the customer will benefit from the related decisioning technologies service. Revenue from the provision of statistical models is recognized as the service is provided and accepted, assuming all other revenue recognition criteria are met.
We have some multiple element arrangements that include software. We recognize the elements for which we have established vendor specific objective evidence at fair value upon delivery, in accordance with the applicable guidance.
We record revenue on a net basis for those sales in which we have in substance acted as an agent or broker in the transaction. The direct costs of set up of a customer are capitalized and amortized as a cost of service during the term of the related customer contract.
Deferred revenue consists of amounts billed in excess of revenue recognized on sales of our information services relating generally to the deferral of subscription fees and arrangement consideration from elements not meeting the criteria for having stand-alone value discussed above. Deferred revenues are subsequently recognized as revenue in accordance with our revenue recognition policies.
Judgments and uncertainties —
Each element of a multiple element arrangement must be considered separately to ensure that appropriate accounting is performed for these deliverables. These considerations include assessing the price at which the element is sold compared to its relative fair value; concluding when the element will be delivered; and determining whether any contingencies exist in the related customer contract that impact the prices paid to us for the services.
46
In addition, the determination of certain of our marketing information services and tax management services revenue requires the use of estimates, principally related to transaction volumes in instances where these volumes are reported to us by our clients on a monthly basis in arrears. In these instances, we estimate transaction volumes based on average actual volumes reported in the past. Differences between our estimates and actual final volumes reported are recorded in the period in which actual volumes are reported.
Effects if actual results differ from assumptions —
We have not experienced significant variances between our estimates of marketing information services and tax management services revenues reported to us by our customers and actual reported volumes in the past. We monitor actual volumes to ensure that we will continue to make reasonable estimates in the future. If we determine that we are unable to make reasonable future estimates, revenue may be deferred until actual customer data is obtained. However, if actual results are not consistent with our estimates and assumptions, or if our customer arrangements become more complex or include more
bundled offerings in the future, we may be required to recognize revenue differently in the future to account for these changes. We do not believe there is a reasonable likelihood that there will be a material change in the future estimates or assumptions we use to recognize revenue.
Goodwill and Indefinite-Lived Intangible Assets
We review goodwill and indefinite-lived intangible assets for impairment annually (as of September 30) and whenever events or changes in circumstances indicate the carrying value of an asset may not be recoverable. These events or circumstances could include a significant change in the business climate, legal factors, operating performance or trends, competition, or sale or disposition of a significant portion of a reporting unit. We have nine reporting units comprised of Consumer Information Solutions (which includes Mortgage Solutions and Consumer Financial Marketing Services), Europe, Latin America, Canada Consumer, North America Personal Solutions, North America Commercial Solutions, The Work Number, Tax
Management Services and Talent Management Services.
The goodwill balance at December 31, 2010, for our nine reporting units was as follows:
|
December
31,
|
||||
|
2010
|
||||
|
(In millions)
|
||||
|
Consumer Information Solutions (including Mortgage Solutions and Consumer Financial Marketing Services)
|
$ | 628.5 | ||
|
Europe
|
96.2 | |||
|
Latin America
|
219.8 | |||
|
Canada Consumer
|
30.9 | |||
|
North America Personal Solutions
|
1.8 | |||
|
North America Commercial Solutions
|
37.6 | |||
|
The Work Number
|
752.2 | |||
|
Tax Management Services
|
121.6 | |||
|
Talent Management Services
|
26.1 | |||
|
Total goodwill
|
$ | 1,914.7 | ||
Judgments and Uncertainties
— In determining the fair value of our reporting units, we used a combination of the income and market approaches to estimate the reporting unit’s business enterprise value.
Under the income approach, we calculate the fair value of a reporting unit based on estimated future discounted cash flows which require assumptions about short and long-term revenue growth rates, operating margins for each reporting unit, discount rates, foreign currency exchange rates and estimates of capital charges. The assumptions we use are based on what we believe a hypothetical marketplace participant would use in estimating fair value. Under the market approach, we estimate the fair value based on market multiples of revenue or earnings before income taxes, depreciation and amortization, for benchmark companies. We believe the benchmark companies used for each
of the reporting units serve as an appropriate input for calculating a fair value for the reporting unit as those benchmark companies have similar risks, participate in similar markets, provide similar services for their customers and compete with us directly. The companies we use as benchmarks are outlined in our “Competition” discussion in Item I of this report. Data for the benchmark companies was obtained from publicly available information. Latin America has benchmark companies that conduct operations of businesses of a similar type and scope, such as Experian Group Limited and The Dun & Bradstreet Corporation. The Work Number, Tax Management Services and Talent Management Services share a different set of benchmark companies, notably ADP and Paychex Inc., as the markets they serve are different than those served by our other reporting units. Valuation
multiples were selected based on a financial benchmarking analysis that compared the reporting unit’s operating result with the comparable companies’ information. In addition to these financial considerations, qualitative factors such as variations in growth opportunities and overall risk among the benchmark companies were considered in the ultimate selection of the multiple.
47
The values separately derived from each of the income and market approach valuation techniques were used to develop an overall estimate of a reporting unit’s fair value. We use a consistent approach across all reporting units when considering the weight of the income and market approaches for calculating the fair value of each of our reporting units. This approach relies more heavily on the calculated fair value derived from the income approach, with 70% of the value coming from the income approach. We believe this approach is consistent with that of a market participant in valuing prospective purchase business combinations. The selection and weighting of the various fair value techniques may result in a
higher or lower fair value. Judgment is applied in determining the weightings that are most representative of fair value.
We have not made any material changes to the valuation methodology we use to assess goodwill impairment since the date of the last annual impairment test.
Growth Assumptions
The assumptions for our future cash flows begin with our historical operating performance, the details of which are described in our Management’s Discussion & Analysis of operating performance. Additionally, we consider the impact that known economic, industry and market trends will have on our future forecasts, as well as the impact that we expect from planned business initiatives including new product initiatives, client service and retention standards, and cost management programs. At the end of the forecast period, the long-term growth rate we used to determine the terminal value of each reporting unit was generally 3% to 5% based on management’s assessment of the minimum expected terminal
growth rate of each reporting unit, as well as broader economic considerations such as Gross Domestic Product, or GDP, inflation and the maturity of the markets we serve.
As a result of the economic downturn experienced in 2008 and 2009, and the resultant decline in revenue experienced in certain of our business units, in completing our 2010 impairment testing at September 30, 2010, we projected only modest revenue growth in 2011 for our reporting units based on planned business initiatives and prevailing trends exhibited by these units. The anticipated revenue growth is partially offset by assumed increases in expenses for a majority of our reporting units which reflect the additional level of investment needed in order to achieve the planned revenue growth. Our 2010 long-term forecast anticipated slow but steady recovery of the global economy in 2011 which combined with our
own strategic initiatives is expected to result in moderate revenue and cash flow growth. We also plan on continuing to take cost containment actions to help maintain operating margins for our reporting units.
48
Discount Rate Assumptions
We utilize a weighted average cost of capital, or WACC, in our impairment analysis that makes assumptions about the capital structure that we believe a market participant would make and include a risk premium based on an assessment of risks related to the projected cash flows of each reporting unit. We believe this approach yields a discount rate that is consistent with an implied rate of return that an independent investor or market participant would require for an investment in a company having similar risks and business characteristics to the reporting unit being assessed. To calculate the WACC, the cost of equity and cost of debt are multiplied by the assumed
capital structure of the reporting unit as compared to industry trends and relevant benchmark company structures. The cost of equity was computed using the Capital Asset Pricing Model which considers the risk-free interest rate, beta, equity risk premium and specific company risk premium related to a particular reporting unit. The cost of debt was computed using a benchmark rate and the Company’s tax rate. For the 2010 annual goodwill impairment evaluation, the discount rates used to develop the estimated fair value of the reporting units ranged from 10% to 16%. Because of assigned market premiums, discount rates are lowest for reporting units, whose cash flows are expected to be less volatile due to such factors as the maturity of the market they serve, their position in that market or other macroeconomic factors. Where there is the greatest volatility of cash flows due to the
degree of maturity or predictability of a business, competition, or participation in less stable geographic markets, such as our Latin America reporting unit, the discount rate selected is in the higher portion of the range as there is more inherent risk in the expected cash flows of that reporting unit.
Estimated Fair Value and Sensitivities
The estimated fair value of the reporting units whose fair value was calculated for purposes of the 2010 impairment testing is derived from the valuation techniques described above, incorporating the related projections and assumptions. An indication of possible impairment occurs when the estimated fair value of the reporting unit is below the carrying value of its equity. The estimated fair value for all reporting units exceeded the carrying value of these units as of September 30, 2010. As a result, no goodwill impairment was recorded.
The estimated fair value of the reporting unit is highly sensitive to changes in these projections and assumptions; therefore, in some instances changes in these assumptions could impact whether the fair value of a reporting unit is greater than its carrying value. For example, an increase in the discount rate and decline in the cumulative cash flow projections of a reporting unit could cause the fair value of certain reporting units to be below their carrying value. We perform sensitivity analyses around these assumptions in order to assess the reasonableness of the assumptions and the resulting estimated fair values. Ultimately, future potential changes in these assumptions may impact the estimated fair value of a
reporting unit and cause the fair value of the reporting unit to be below its carrying value. The excess of fair value over carrying value for the Company’s reporting units that were valued as of September 30, 2010, ranged from approximately 15% to 76%.
The Work Number revenues have been strong historically, having grown at a double digit compound annual growth rate since our acquisition of the reporting unit on May 17, 2007, therefore revenue growth is expected to continue for each of the years used in the preparation of the discounted cash flows. The actual growth rate for The Work Number would have to decline to a compounded rate of 5% growth, with all other factors held constant, for the reporting unit’s fair value to drop below its carrying value. However, in the event that the revenue growth rate was to decline, management would take action to preserve operating margins. If the fair value dropped below carrying value, we would compare the carrying value
of the goodwill to the implied fair value of goodwill to determine if a goodwill impairment charge would become necessary.
The calculated percentage excess in the Latin America reporting unit, at approximately 15%, reflects in part the effect of the uncertain economic and competitive conditions in Latin America on our actual and projected financial performance. The projections used in the calculation of fair value reflect our assumption of moderate economic growth in most of these countries, increases in revenue from the addition of sales staff and from new product and new customer segment initiatives, and our planned spending on operating improvement initiatives in 2011 to drive improving growth and profitability, particularly in Brazil, followed by growth for all of Latin America in 2012. If our operating
improvement initiatives are not successful, there could be a change in the valuation of our goodwill in future periods and may possibly result in the recognition of an impairment loss.
49
The reporting unit having the lowest absolute dollar excess of fair value over carrying value is our Talent Management Services business which has a goodwill balance of $26.1 million as of September 30, 2010. This reporting unit has been impacted by uncertainty in government hiring activity and, as a result, we have lowered our revenue growth projections. While no impairment was noted in our impairment test as of September 30, 2010, if customer hiring activity does not increase in the near to medium term as forecast or if other events adversely impact the business drivers and corresponding assumptions used to value this reporting unit, there could be a change in the valuation of our goodwill in future periods and
may possibly result in the recognition of an impairment loss.
No new indications of impairment existed during the fourth quarter of 2010, thus no impairment testing was updated as of December 31, 2010.
Effect if actual results differ from assumptions
— We believe that our estimates are consistent with assumptions that marketplace participants would use in their estimates of fair value. However, if actual results are not consistent with our estimates and assumptions, we may be exposed to an impairment charge that could be material.
Loss Contingencies
We are subject to various proceedings, lawsuits and claims arising in the normal course of our business. We determine whether to disclose and/or accrue for loss contingencies based on our assessment of whether the potential loss is probable, reasonably possible or remote.
Judgments and uncertainties
— We periodically review claims and legal proceedings and assess whether we have potential financial exposure based on consultation with internal and outside legal counsel and other advisors. If the likelihood of an adverse outcome from any claim or legal proceeding is probable and the amount can be reasonably estimated, we record a liability in our Consolidated Balance Sheet for the estimated settlement costs. If the likelihood of an adverse outcome is reasonably possible, but not probable, we provide disclosures related to the potential loss contingency. Our assumptions related to loss contingencies are inherently
subjective.
Effect if actual results differ from assumptions
— We do not believe there is a reasonable likelihood that there will be a material change in the future estimates or assumptions we use to determine loss contingencies. However, if facts and circumstances change in the future that change our belief regarding assumptions used to determine our estimates, we may be exposed to a loss that could be material.
Income Taxes
We record deferred income taxes using enacted tax laws and rates for the years in which the taxes are expected to be paid. We assess the likelihood that our net deferred tax assets will be recovered from future taxable income or other tax planning strategies. To the extent that we believe that recovery is not likely, we must establish a valuation allowance to reduce the deferred tax asset to the amount we estimate will be recoverable.
Our income tax provisions are based on assumptions and calculations which will be subject to examination by various tax authorities. We record tax benefits for positions in which we believe are more likely than not of being sustained under such examinations. We assess the potential outcome of such examinations to determine the adequacy of our income tax accruals.
Judgments and uncertainties
— We consider accounting for income taxes critical because management is required to make significant judgments in determining our provision for income taxes, our deferred tax assets and liabilities, and our future taxable income for purposes of assessing our ability to realize any future benefit from our deferred tax assets. These judgments and estimates are affected by our expectations of future taxable income, mix of earnings among different taxing jurisdictions, and timing of the reversal of deferred tax assets and liabilities.
We also use our judgment to determine whether it is more likely than not that we will sustain positions that we have taken on tax returns and, if so, the amount of benefit to initially recognize within our financial statements. We review our uncertain tax positions and adjust our unrecognized tax benefits in light of changes in facts and circumstances, such as changes in tax law, interactions with taxing authorities and developments in case law. These adjustments to our unrecognized tax benefits may affect our income tax expense. Settlement of uncertain tax positions may require use of our cash. At December 31, 2010, $27.9 million was recorded for uncertain tax benefits, including interest and penalties,
of which it is reasonably possible that up to $7.1 million of our unrecognized tax benefit may change within the next twelve months.
50
Effect if actual results differ from assumptions
— Although management believes that the judgments and estimates discussed herein are reasonable, actual results could differ, and we may be exposed to increases or decreases in income tax expense that could be material.
Pension and Other Postretirement Plans
We consider accounting for our U.S. and Canadian pension and other postretirement plans critical because management is required to make significant subjective judgments about a number of actuarial assumptions, which include discount rates, salary growth, expected return on plan assets, interest cost and mortality and retirement rates. Actuarial valuations are used in determining our benefit obligation and net periodic benefit cost.
Judgments and uncertainties
— We believe that the most significant assumptions related to our net periodic benefit cost are (1) the discount rate and (2) the expected return on plan assets.
We determine our discount rates primarily based on high-quality, fixed-income investments and yield-to-maturity analysis specific to our estimated future benefit payments available as of the measurement date. Discount rates are updated annually on the measurement date to reflect current market conditions. We use a publicly published yield curve to develop our discount rates. The yield curve provides discount rates related to a dedicated high-quality bond portfolio whose cash flows extend beyond the current period, from which we choose a rate matched to the expected benefit payments required for each plan.
The expected rate of return on plan assets is based on both our historical returns and forecasted future investment returns by asset class, as provided by our external investment advisor. In setting the long-term expected rate of return, management considers capital markets future expectations and the asset mix of the plan investments. Prior to 2008, the U.S. Pension Plans investment returns were 10.9%, 13.0% and 7.5% over three, five and ten years, respectively. The returns exceeded the S&P 500 returns for similar periods of time primarily due to an asset allocation strategy where large allocations to alternative asset classes (hedge fund of funds, private equity, real estate and real assets) provided
consistently higher returns with a low correlation to equity market returns. These returns historically demonstrate a long-term record of producing returns at or above the expected rate of return. However, the dramatic adverse market conditions in 2008 skewed the traditional measures of long-term performance, such as the ten-year average return. The severity of the 2008 losses, approximately negative 20%, makes the historical ten-year average return a less accurate predictor of future return expectations. Our weighted-average expected rate of return for 2011 is 7.75% which is the same as the 2010 expected rate. In 2009, the investment returns were approximately 16%, reflecting a partial recovery of the 2008 losses. Our weighted-average expected rate of return declined from 8.02% in 2009 to approximately 7.75% for 2010 primarily related to the U.S. Retirement Income Plan which
experienced lower growth due to our migration to a lower risk investment strategy, with increased allocation to lower risk/lower return asset classes, as well as the current forecast of expected future returns for our asset classes, which is lower than the prior year.
Annual differences, if any, between the expected and actual returns on plan assets are included in unrecognized net actuarial gain. In calculating the annual amortization of the unrecognized net actuarial gain or loss, we use a market-related value of assets that smoothes actual investment gains and losses on plan assets over a period up to five years. The resulting unrecognized net actuarial gain or loss amount is recognized in net periodic pension expense over the average remaining life expectancy of the participant group since almost all participants are inactive. The market-related value of our assets was $632.3 million at December 31, 2010. We do not expect our 2011 net periodic benefit
cost, which includes the effect of the market-related value of assets, to be materially different than our 2010 cost. See Note 10 of the Notes to the Consolidated Financial Statements for details on changes in the pension benefit obligation and the fair value of plan assets.
Effect if actual results differ from assumptions
— We do not believe there is a reasonable likelihood that there will be a material change in the future estimates or assumptions that are used in our actuarial valuations. However, if actual results are not consistent with our estimates or assumptions, we may be exposed to changes in pension expense that could be material. Adjusting our expected long-term rate of return (7.73% at December 31, 2010) by 50 basis points would change our estimated pension expense in 2011 by approximately $3.1 million. Adjusting our weighted-average discount rate (5.77% at December 31, 2010) by 50 basis
points would change our estimated pension expense in 2011 by approximately $1.1 million.
51
In the normal course of our business, we are exposed to market risk, primarily from changes in foreign currency exchange rates and interest rates, that could impact our results of operations and financial position. We manage our exposure to these market risks through our regular operating and financing activities, and, when deemed appropriate, through the use of derivative financial instruments, such as interest rate swaps, to hedge certain of these exposures. We use derivative financial instruments as risk management tools and not for speculative or trading purposes.
Foreign Currency Exchange Rate Risk
A substantial majority of our revenue, expense and capital expenditure activities are transacted in U.S. dollars. However, we do transact business in other currencies, primarily the British pound, the Canadian dollar, the Brazilian real, the Chilean peso and the Euro. For most of these foreign currencies, we are a net recipient, and, therefore, benefit from a weaker U.S. dollar and are adversely affected by a stronger U.S. dollar relative to the foreign currencies in which we transact significant amounts of business.
We are required to translate, or express in U.S. dollars, the assets and liabilities of our foreign subsidiaries that are denominated or measured in foreign currencies at the applicable year-end rate of exchange on our Consolidated Balance Sheets and income statement items of our foreign subsidiaries at the average rates prevailing during the year. We record the resulting translation adjustment, and gains and losses resulting from the translation of intercompany balances of a long-term investment nature within other comprehensive income, as a component of our shareholders’ equity. Foreign currency transaction gains and losses, which have historically been immaterial, are recorded in our Consolidated Statements
of Income. We generally do not mitigate the risks associated with fluctuating exchange rates, although we may from time to time through forward contracts or other derivative instruments hedge a portion of our translational foreign currency exposure or exchange rate risks associated with material transactions which are denominated in a foreign currency.
For the year ended December 31, 2010, a 10% weaker U.S. dollar against the currencies of all foreign countries in which we had operations during 2010 would have increased our revenue by $49.6 million and our pre-tax operating profit by $13.7 million. For the year ended December 31, 2009, a 10% weaker U.S. dollar against the currencies of all foreign countries in which we had operations during 2009 would have increased our revenue by $45.2 million and our pre-tax operating profit by $13.3 million. A 10% stronger U.S. dollar would have resulted in similar decreases to our revenue and pre-tax operating profit for 2010 and 2009.
Interest Rate Risk
Our exposure to market risk for changes in interest rates relates to our variable-rate, long-term Senior Credit Facility and commercial paper borrowings, as well as our interest rate swaps which economically convert our 2014 fixed rate bonds from a fixed rate of interest to a floating rate. We attempt to achieve the lowest all-in weighted-average cost of debt while simultaneously taking into account the mix of our fixed- and floating-rate debt, and the average life and scheduled maturities of our debt. At December 31, 2010, our weighted average cost of debt was 5.4% and weighted-average life of debt was 11.9 years. At December 31, 2010, 72% of our debt was fixed rate, and the remaining 28% was
variable rate. Occasionally we use derivatives to manage our exposure to changes in interest rates by entering into interest rate swaps. A 100 basis point increase in the weighted-average interest rate on our variable-rate debt would have increased our 2010 interest expense by approximately $2.8 million.
Based on the amount of outstanding variable-rate debt, we have material exposure to interest rate risk. In the future, if our mix of fixed-rate and variable-rate debt were to change due to additional borrowings under existing or new variable-rate debt, we could have additional exposure to interest rate risk. The nature and amount of our long-term and short-term debt, as well as the proportionate amount of fixed-rate and variable-rate debt, can be expected to vary as a result of future business requirements, market conditions and other factors.
52
|
Index to Financial Statements
|
|||
|
Management’s Report on Internal Control over Financial Reporting
|
53 | ||
|
Report of Independent Registered Public Accounting Firm on Internal Control over Financial Reporting
|
54 | ||
|
Report of Independent Registered Public Accounting Firm
|
55 | ||
|
Consolidated Statements of Income for each of the three years in the period ended December 31, 2010
|
56 | ||
|
Consolidated Balance Sheets at December 31, 2010 and 2009
|
57 | ||
|
Consolidated Statements of Cash Flows for each of the three years in the period ended December 31, 2010
|
58 | ||
|
Consolidated Statements of Shareholders’ Equity and Comprehensive Income for each of the three years in the period ended December 31, 2010
|
59 | ||
|
Notes to Consolidated Financial Statements
|
61 |
MANAGEMENT’S REPORT ON INTERNAL CONTROL OVER FINANCIAL REPORTING
Management of Equifax is responsible for establishing and maintaining adequate internal control over financial reporting as defined in Rule 13a-15(f) under the Securities Exchange Act of 1934. Equifax’s internal control over financial reporting is a process designed to provide reasonable assurance regarding the reliability of financial reporting and the preparation of financial statements for external purposes in accordance with U.S. generally accepted accounting principles. Internal control over financial reporting includes those written policies and procedures that:
|
•
|
Pertain to the maintenance of records that, in reasonable detail, accurately and fairly reflect the transactions and dispositions of the assets of Equifax;
|
|
•
|
Provide reasonable assurance that transactions are recorded as necessary to permit preparation of financial statements in accordance with U.S. generally accepted accounting principles;
|
|
•
|
Provide reasonable assurance that receipts and expenditures of Equifax are being made only in accordance with authorization of management and the Board of Directors of Equifax; and
|
|
•
|
Provide reasonable assurance regarding prevention or timely detection of unauthorized acquisition, use or disposition of assets that could have a material effect on the consolidated financial statements.
|
Internal control over financial reporting includes the controls themselves, monitoring and internal auditing practices, and actions taken to correct deficiencies as identified.
Because of its inherent limitations, internal control over financial reporting may not prevent or detect all misstatements. Also, projections of any evaluation of effectiveness to future periods are subject to the risk that controls may become inadequate because of changes in conditions, or that the degree of compliance with the policies or procedures may deteriorate.
Management assessed the effectiveness of Equifax’s internal control over financial reporting as of December 31, 2010. Management based this assessment on criteria for effective internal control over financial reporting described in “Internal Control — Integrated Framework” issued by the Committee of Sponsoring Organizations of the Treadway Commission. Management’s assessment included an evaluation of the design of Equifax’s internal control over financial reporting and testing of the operational effectiveness of its internal control over financial reporting. Management reviewed the results of its assessment with the Audit Committee of its Board of Directors.
Based on this assessment, management determined that, as of December 31, 2010, Equifax maintained effective internal control over financial reporting. Ernst & Young LLP, the Company’s independent registered public accounting firm, has issued an audit report on the Company’s internal control over financial reporting as of December 31, 2010.
53
REPORT OF INDEPENDENT REGISTERED PUBLIC ACCOUNTING FIRM
ON INTERNAL CONTROL OVER FINANCIAL REPORTING
The Board of Directors and Shareholders of Equifax Inc.:
We have audited Equifax Inc.’s (
“Equifax
” or “the Company
”)
internal control over financial reporting as of December 31, 2010, based on criteria established in Internal Control — Integrated Framework issued by the Committee of Sponsoring Organizations of the Treadway Commission (the COSO criteria). Equifax’s management is responsible for maintaining effective internal control over financial reporting, and for its assessment of the effectiveness of internal
control over financial reporting included in the accompanying Management’s Report on Internal Control over Financial Reporting. Our responsibility is to express an opinion on the Company’s internal control over financial reporting based on our audit.
We conducted our audit in accordance with the standards of the Public Company Accounting Oversight Board (United States). Those standards require that we plan and perform the audit to obtain reasonable assurance about whether effective internal control over financial reporting was maintained in all material respects. Our audit included obtaining an understanding of internal control over financial reporting, assessing the risk that a material weakness exists, testing and evaluating the design and operating effectiveness of internal control based on the assessed risk, and performing such other procedures as we considered necessary in the circumstances. We believe that our audit provides a reasonable basis for our
opinion.
A company’s internal control over financial reporting is a process designed to provide reasonable assurance regarding the reliability of financial reporting and the preparation of financial statements for external purposes in accordance with generally accepted accounting principles. A company’s internal control over financial reporting includes those policies and procedures that (1) pertain to the maintenance of records that, in reasonable detail, accurately and fairly reflect the transactions and dispositions of the assets of the company; (2) provide reasonable assurance that transactions are recorded as necessary to permit preparation of financial statements in accordance with generally
accepted accounting principles, and that receipts and expenditures of the company are being made only in accordance with authorizations of management and directors of the company; and (3) provide reasonable assurance regarding prevention or timely detection of unauthorized acquisition, use or disposition of the company’s assets that could have a material effect on the financial statements.
Because of its inherent limitations, internal control over financial reporting may not prevent or detect misstatements. Also, projections of any evaluation of effectiveness to future periods are subject to the risk that controls may become inadequate because of changes in conditions, or that the degree of compliance with the policies or procedures may deteriorate.
In our opinion, Equifax Inc. maintained, in all material respects, effective internal control over financial reporting as of December 31, 2010, based on the COSO criteria.
We also have audited, in accordance with the standards of the Public Company Accounting Oversight Board (United States), the consolidated balance sheets as of December 31, 2010 and 2009, and the related consolidated statements of income, shareholders’ equity and comprehensive income, and cash flows for each of the three years in the period ended December 31, 2010 of Equifax Inc. and our report dated February 23, 2011 expressed an unqualified opinion thereon.
/s/ Ernst & Young LLP
Atlanta, Georgia
February 23, 2011
54
REPORT OF INDEPENDENT REGISTERED PUBLIC ACCOUNTING FIRM
The Board of Directors and Shareholders of Equifax Inc.:
We have audited the accompanying consolidated balance sheets of Equifax Inc. as of December 31, 2010 and 2009, and the related consolidated statements of income, shareholders’ equity and comprehensive income, and cash flows for each of the three years in the period ended December 31, 2010. Our audits also included the financial statement schedule listed in the Index at Item 15(a)(2). These financial statements and schedule are the responsibility of the Company’s management. Our responsibility is to express an opinion on these financial statements and schedule based on our audits.
We conducted our audits in accordance with the standards of the Public Company Accounting Oversight Board (United States). Those standards require that we plan and perform the audit to obtain reasonable assurance about whether the financial statements are free of material misstatement. An audit includes examining, on a test basis, evidence supporting the amounts and disclosures in the financial statements. An audit also includes assessing the accounting principles used and significant estimates made by management, as well as evaluating the overall financial statement presentation. We believe that our audits provide a reasonable basis for our opinion.
In our opinion, the financial statements referred to above present fairly, in all material respects, the consolidated financial position of Equifax Inc. at December 31, 2010 and 2009, and the consolidated results of its operations and its cash flows for each of the three years in the period ended December 31, 2010, in conformity with U.S. generally accepted accounting principles. Also, in our opinion the related financial statement schedule, when considered in relation to the basic financial statements taken as a whole, presents fairly in all material respects the information set forth therein.
We also have audited, in accordance with the standards of the Public Company Accounting Oversight Board (United States), Equifax Inc.’s internal control over financial reporting as of December 31, 2010, based on criteria established in Internal Control — Integrated Framework issued by the Committee of Sponsoring Organizations of the Treadway Commission and our report dated February 23, 2011 expressed an unqualified opinion thereon.
/s/ Ernst & Young LLP
Atlanta, Georgia
February 23, 2011
55
CONSOLIDATED STATEMENTS OF INCOME
|
Twelve Months Ended
|
||||||||||||
|
December 31,
|
||||||||||||
|
2010
|
2009
|
2008
|
||||||||||
|
(In millions, except per share amounts)
|
||||||||||||
|
Operating revenue
|
$ | 1,859.5 | $ | 1,716.0 | $ | 1,813.6 | ||||||
|
Operating expenses:
|
||||||||||||
|
Cost of services (exclusive of depreciation and amortization below)
|
759.9 | 718.8 | 741.8 | |||||||||
|
Selling, general and administrative expenses
|
507.4 | 470.2 | 490.6 | |||||||||
|
Depreciation and amortization
|
162.2 | 145.2 | 142.2 | |||||||||
|
Total operating expenses
|
1,429.5 | 1,334.2 | 1,374.6 | |||||||||
|
Operating income
|
430.0 | 381.8 | 439.0 | |||||||||
|
Interest expense
|
(56.1 | ) | (57.0 | ) | (71.3 | ) | ||||||
|
Other income, net
|
1.3 | 6.2 | 6.2 | |||||||||
|
Consolidated income from continuing operations before income taxes
|
375.2 | 331.0 | 373.9 | |||||||||
|
Provision for income taxes
|
(131.9 | ) | (106.6 | ) | (119.0 | ) | ||||||
|
Consolidated income from continuing operations
|
243.3 | 224.4 | 254.9 | |||||||||
|
Income from discontinued operations, net of tax
|
31.5 | 16.1 | 24.1 | |||||||||
|
Consolidated net income
|
274.8 | 240.5 | 279.0 | |||||||||
|
Less: Net income attributable to noncontrolling interests
|
(8.1 | ) | (6.6 | ) | (6.2 | ) | ||||||
|
Net income attributable to Equifax
|
$ | 266.7 | $ | 233.9 | $ | 272.8 | ||||||
|
Amounts attributable to Equifax:
|
||||||||||||
|
Net income from continuing operations attributable to Equifax
|
$ | 235.2 | $ | 217.8 | $ | 248.7 | ||||||
|
Discontinued operations, net of tax
|
31.5 | 16.1 | 24.1 | |||||||||
|
Net income attributable to Equifax
|
$ | 266.7 | $ | 233.9 | $ | 272.8 | ||||||
|
Basic earnings per common share:
|
||||||||||||
|
Income from continuing operations attributable to Equifax
|
$ | 1.89 | $ | 1.72 | $ | 1.94 | ||||||
|
Discontinued operations
|
0.25 | 0.13 | 0.19 | |||||||||
|
Net income attributable to Equifax
|
$ | 2.14 | $ | 1.85 | $ | 2.13 | ||||||
|
Weighted-average shares used in computing basic earnings per share
|
124.8 | 126.3 | 128.1 | |||||||||
|
Diluted earnings per common share:
|
||||||||||||
|
Income from continuing operations attributable to Equifax
|
$ | 1.86 | $ | 1.70 | $ | 1.91 | ||||||
|
Discontinued operations
|
0.25 | 0.13 | 0.18 | |||||||||
|
Net income attributable to Equifax
|
$ | 2.11 | $ | 1.83 | $ | 2.09 | ||||||
|
Weighted-average shares used in computing diluted earnings per share
|
126.5 | 127.9 | 130.4 | |||||||||
|
Dividends per common share
|
$ | 0.28 | $ | 0.16 | $ | 0.16 | ||||||
See Notes to Consolidated Financial Statements.
56
CONSOLIDATED BALANCE SHEETS
|
December 31,
|
||||||||
|
2010
|
2009
|
|||||||
|
(In millions, except par values)
|
||||||||
|
ASSETS
|
||||||||
|
Current assets:
|
||||||||
|
Cash and cash equivalents
|
$ | 119.4 | $ | 103.1 | ||||
|
Trade accounts receivable, net of allowance for doubtful accounts of $7.5 and $15.1 at December 31, 2010 and 2009, respectively
|
262.6 | 258.7 | ||||||
|
Prepaid expenses
|
26.1 | 27.6 | ||||||
|
Other current assets
|
21.1 | 27.4 | ||||||
|
Total current assets
|
429.2 | 416.8 | ||||||
|
Property and equipment:
|
||||||||
|
Capitalized internal-use software and system costs
|
315.9 | 316.6 | ||||||
|
Data processing equipment and furniture
|
181.0 | 184.2 | ||||||
|
Land, buildings and improvements
|
169.5 | 164.5 | ||||||
|
Total property and equipment
|
666.4 | 665.3 | ||||||
|
Less accumulated depreciation and amortization
|
(368.0 | ) | (346.0 | ) | ||||
|
Total property and equipment, net
|
298.4 | 319.3 | ||||||
|
Goodwill
|
1,914.7 | 1,943.2 | ||||||
|
Indefinite-lived intangible assets
|
95.6 | 95.5 | ||||||
|
Purchased intangible assets, net
|
593.9 | 687.0 | ||||||
|
Other assets, net
|
101.8 | 88.7 | ||||||
|
Total assets
|
$ | 3,433.6 | $ | 3,550.5 | ||||
|
LIABILITIES AND EQUITY
|
||||||||
|
Current liabilities:
|
||||||||
|
Short-term debt and current maturities
|
$ | 20.7 | $ | 183.2 | ||||
|
Accounts payable
|
24.6 | 35.9 | ||||||
|
Accrued expenses
|
61.9 | 67.7 | ||||||
|
Accrued salaries and bonuses
|
71.9 | 58.1 | ||||||
|
Deferred revenue
|
58.7 | 69.8 | ||||||
|
Other current liabilities
|
81.7 | 77.5 | ||||||
|
Total current liabilities
|
319.5 | 492.2 | ||||||
|
Long-term debt
|
978.9 | 990.9 | ||||||
|
Deferred income tax liabilities, net
|
244.2 | 249.3 | ||||||
|
Long-term pension and other postretirement benefit liabilities
|
129.0 | 142.5 | ||||||
|
Other long-term liabilities
|
53.6 | 60.6 | ||||||
|
Total liabilities
|
1,725.2 | 1,935.5 | ||||||
|
Commitments and Contingencies (see Note 6)
|
||||||||
|
Equifax shareholders' equity:
|
||||||||
|
Preferred stock, $0.01 par value: Authorized shares - 10.0; Issued shares - none
|
- | - | ||||||
|
Common stock, $1.25 par value: Authorized shares - 300.0; Issued shares - 189.3 at December 31, 2010 and 2009; Outstanding shares - 122.6 and 126.2 at December 31, 2010 and 2009, respectively
|
236.6 | 236.6 | ||||||
|
Paid-in capital
|
1,105.8 | 1,102.0 | ||||||
|
Retained earnings
|
2,725.7 | 2,494.2 | ||||||
|
Accumulated other comprehensive loss
|
(344.5 | ) | (318.7 | ) | ||||
|
Treasury stock, at cost, 64.6 shares and 61.0 shares at December 31, 2010 and 2009, respectively
|
(1,991.0 | ) | (1,871.7 | ) | ||||
|
Stock held by employee benefits trusts, at cost, 2.1 shares at December 31, 2010 and 2009
|
(41.2 | ) | (41.2 | ) | ||||
|
Total Equifax shareholders' equity
|
1,691.4 | 1,601.2 | ||||||
|
Noncontrolling interests
|
17.0 | 13.8 | ||||||
|
Total equity
|
1,708.4 | 1,615.0 | ||||||
|
Total liabilities and equity
|
$ | 3,433.6 | $ | 3,550.5 | ||||
See Notes to Consolidated Financial Statements.
57
CONSOLIDATED STATEMENTS OF CASH FLOWS
|
Twelve Months Ended
|
||||||||||||
|
December 31,
|
||||||||||||
|
2010
|
2009
|
2008
|
||||||||||
|
(In millions)
|
||||||||||||
|
Operating activities:
|
||||||||||||
|
Consolidated net income
|
$ | 274.8 | $ | 240.5 | $ | 279.0 | ||||||
|
Adjustments to reconcile consolidated net income to net cash provided by operating activities:
|
||||||||||||
|
Gain on divestitures
|
(27.1 | ) | - | - | ||||||||
|
Depreciation and amortization
|
167.8 | 158.8 | 155.4 | |||||||||
|
Stock-based compensation expense
|
21.8 | 19.6 | 19.9 | |||||||||
|
Excess tax benefits from stock-based compensation plans
|
(3.5 | ) | (1.3 | ) | (2.1 | ) | ||||||
|
Deferred income taxes
|
0.1 | 14.7 | 7.7 | |||||||||
|
Changes in assets and liabilities, excluding effects of acquisitions:
|
||||||||||||
|
Accounts receivable, net
|
(3.6 | ) | 12.8 | 24.2 | ||||||||
|
Prepaid expenses and other current assets
|
6.1 | (1.4 | ) | 3.5 | ||||||||
|
Other assets
|
(1.4 | ) | (6.9 | ) | (2.2 | ) | ||||||
|
Current liabilities, excluding debt
|
(32.4 | ) | 4.2 | (20.5 | ) | |||||||
|
Other long-term liabilities, excluding debt
|
(50.0 | ) | (22.6 | ) | (16.8 | ) | ||||||
|
Cash provided by operating activities
|
352.6 | 418.4 | 448.1 | |||||||||
|
Investing activities:
|
||||||||||||
|
Capital expenditures
|
(99.8 | ) | (70.7 | ) | (110.5 | ) | ||||||
|
Acquisitions, net of cash acquired
|
(82.6 | ) | (196.0 | ) | (27.4 | ) | ||||||
|
Proceeds received from divestitures
|
181.7 | - | - | |||||||||
|
Investment in unconsolidated affiliates, net
|
1.7 | (3.4 | ) | (3.7 | ) | |||||||
|
Cash provided by (used in) investing activities
|
1.0 | (270.1 | ) | (141.6 | ) | |||||||
|
Financing activities:
|
||||||||||||
|
Net short-term (repayments) borrowings
|
(134.0 | ) | 101.8 | (184.8 | ) | |||||||
|
Net (repayments) borrowings under long-term revolving credit facilities
|
(5.0 | ) | (415.2 | ) | 45.0 | |||||||
|
Payments on long-term debt
|
(20.8 | ) | (31.8 | ) | (17.8 | ) | ||||||
|
Proceeds from issuance of long-term debt
|
- | 274.4 | 2.3 | |||||||||
|
Treasury stock purchases
|
(167.5 | ) | (23.8 | ) | (155.7 | ) | ||||||
|
Dividends paid to Equifax shareholders
|
(35.2 | ) | (20.2 | ) | (20.5 | ) | ||||||
|
Dividends paid to noncontrolling interests
|
(5.1 | ) | (4.0 | ) | (3.4 | ) | ||||||
|
Proceeds from exercise of stock options
|
29.3 | 10.2 | 14.7 | |||||||||
|
Excess tax benefits from stock-based compensation plans
|
3.5 | 1.3 | 2.1 | |||||||||
|
Other
|
(0.5 | ) | (1.0 | ) | (1.0 | ) | ||||||
|
Cash used in financing activities
|
(335.3 | ) | (108.3 | ) | (319.1 | ) | ||||||
|
Effect of foreign currency exchange rates on cash and cash equivalents
|
(2.0 | ) | 4.9 | (10.8 | ) | |||||||
|
Increase (decrease) in cash and cash equivalents
|
16.3 | 44.9 | (23.4 | ) | ||||||||
|
Cash and cash equivalents, beginning of period
|
103.1 | 58.2 | 81.6 | |||||||||
|
Cash and cash equivalents, end of period
|
$ | 119.4 | $ | 103.1 | $ | 58.2 | ||||||
See Notes to Consolidated Financial Statements.
58
CONSOLIDATED STATEMENTS OF SHAREHOLDERS’ EQUITY AND COMPREHENSIVE INCOME
|
Equifax Shareholders
|
||||||||||||||||||||||||||||||||||||
|
Stock
|
||||||||||||||||||||||||||||||||||||
|
Accumulated
|
Held By
|
|||||||||||||||||||||||||||||||||||
|
Common Stock
|
Other
|
Employee
|
Total
|
|||||||||||||||||||||||||||||||||
|
Shares
|
Paid-In
|
Retained
|
Comprehensive
|
Treasury
|
Benefits
|
Noncontrolling
|
Shareholders’
|
|||||||||||||||||||||||||||||
|
Outstanding
|
Amount
|
Capital
|
Earnings
|
Loss
|
Stock
|
Trusts
|
Interests
|
Equity
|
||||||||||||||||||||||||||||
|
(In millions, except per share values)
|
||||||||||||||||||||||||||||||||||||
|
Balance, December 31, 2007
|
129.7 | $ | 235.6 | $ | 1,040.8 | $ | 2,030.0 | $ | (170.5 | ) | $ | (1,679.0 | ) | $ | (57.7 | ) | $ | 8.8 | $ | 1,408.0 | ||||||||||||||||
|
Net income
|
- | - | - | 272.8 | - | - | - | 6.2 | 279.0 | |||||||||||||||||||||||||||
|
Other comprehensive income (loss)
|
- | - | - | - | (220.1 | ) | - | - | (0.5 | ) | (220.6 | ) | ||||||||||||||||||||||||
|
Shares issued under stock and benefit plans, net of minimum tax withholdings
|
1.1 | 0.9 | 11.1 | - | - | (3.2 | ) | 5.9 | - | 14.7 | ||||||||||||||||||||||||||
|
Treasury stock purchased under share repurchase program ($34.41 per share)*
|
(4.5 | ) | - | - | - | - | (155.7 | ) | - | - | (155.7 | ) | ||||||||||||||||||||||||
|
Cash dividends ($0.16 per share)
|
- | - | - | (21.0 | ) | - | - | - | - | (21.0 | ) | |||||||||||||||||||||||||
|
Dividends paid to employee benefits trusts
|
- | - | 0.5 | - | - | - | - | - | 0.5 | |||||||||||||||||||||||||||
|
Stock-based compensation expense
|
- | - | 19.9 | - | - | - | - | - | 19.9 | |||||||||||||||||||||||||||
|
Tax effects of stock-based compensation plans
|
- | - | 2.9 | - | - | - | - | - | 2.9 | |||||||||||||||||||||||||||
|
Dividends paid to noncontrolling interests
|
- | - | - | - | - | - | - | (3.4 | ) | (3.4 | ) | |||||||||||||||||||||||||
|
Adjustment to initially apply EITF 06-04 and EITF 06-10
|
- | - | - | (0.8 | ) | - | - | - | - | (0.8 | ) | |||||||||||||||||||||||||
|
Balance, December 31, 2008
|
126.3 | $ | 236.5 | $ | 1,075.2 | $ | 2,281.0 | $ | (390.6 | ) | $ | (1,837.9 | ) | $ | (51.8 | ) | $ | 11.1 | $ | 1,323.5 | ||||||||||||||||
|
Net income
|
- | - | - | 233.9 | - | - | - | 6.6 | 240.5 | |||||||||||||||||||||||||||
|
Other comprehensive income (loss)
|
- | - | - | - | 71.9 | - | - | 0.1 | 72.0 | |||||||||||||||||||||||||||
|
Shares issued under stock and benefit plans, net of minimum tax withholdings
|
0.8 | 0.1 | (0.6 | ) | - | - | 2.5 | 6.4 | - | 8.4 | ||||||||||||||||||||||||||
|
Treasury stock purchased under share repurchase program ($26.41 per share)*
|
(0.9 | ) | - | - | - | - | (23.8 | ) | - | - | (23.8 | ) | ||||||||||||||||||||||||
|
Treasury stock purchased from the Equifax Employee Stock Benefits Trust ($29.29 per share)**
|
- | - | 8.3 | - | - | (12.5 | ) | 4.2 | - | - | ||||||||||||||||||||||||||
|
Cash dividends ($0.16 per share)
|
- | - | - | (20.7 | ) | - | - | - | - | (20.7 | ) | |||||||||||||||||||||||||
|
Dividends paid to employee benefits trusts
|
- | - | 0.5 | - | - | - | - | - | 0.5 | |||||||||||||||||||||||||||
|
Stock-based compensation expense
|
- | - | 19.6 | - | - | - | - | - | 19.6 | |||||||||||||||||||||||||||
|
Tax effects of stock-based compensation plans
|
- | - | 0.9 | - | - | - | - | - | 0.9 | |||||||||||||||||||||||||||
|
Dividends paid to noncontrolling interests
|
- | - | - | - | - | - | - | (4.0 | ) | (4.0 | ) | |||||||||||||||||||||||||
|
Other
|
- | - | (1.9 | ) | - | - | - | - | (1.9 | ) | ||||||||||||||||||||||||||
|
Balance, December 31, 2009
|
126.2 | $ | 236.6 | $ | 1,102.0 | $ | 2,494.2 | $ | (318.7 | ) | $ | (1,871.7 | ) | $ | (41.2 | ) | $ | 13.8 | $ | 1,615.0 | ||||||||||||||||
|
Net income
|
- | - | - | 266.7 | - | - | - | 8.1 | 274.8 | |||||||||||||||||||||||||||
|
Other comprehensive income (loss)
|
- | - | - | - | (25.8 | ) | - | - | (0.2 | ) | (26.0 | ) | ||||||||||||||||||||||||
|
Shares issued under stock and benefit plans, net of minimum tax withholdings
|
1.6 | - | (21.7 | ) | - | - | 48.2 | - | - | 26.5 | ||||||||||||||||||||||||||
|
Treasury stock purchased under share repurchase program ($32.28 per share)*
|
(5.2 | ) | - | - | - | - | (167.5 | ) | - | - | (167.5 | ) | ||||||||||||||||||||||||
|
Cash dividends ($0.28 per share)
|
- | - | - | (35.2 | ) | - | - | - | - | (35.2 | ) | |||||||||||||||||||||||||
|
Dividends paid to employee benefits trusts
|
- | - | 0.3 | - | - | - | - | - | 0.3 | |||||||||||||||||||||||||||
|
Stock-based compensation expense
|
- | - | 21.8 | - | - | - | - | - | 21.8 | |||||||||||||||||||||||||||
|
Tax effects of stock-based compensation plans
|
- | - | 3.4 | - | - | - | - | - | 3.4 | |||||||||||||||||||||||||||
|
Dividends paid to noncontrolling interests
|
- | - | - | - | - | - | - | (5.1 | ) | (5.1 | ) | |||||||||||||||||||||||||
|
Other
|
- | - | - | - | - | - | 0.4 | 0.4 | ||||||||||||||||||||||||||||
|
Balance, December 31, 2010
|
122.6 | $ | 236.6 | $ | 1,105.8 | $ | 2,725.7 | $ | (344.5 | ) | $ | (1,991.0 | ) | $ | (41.2 | ) | $ | 17.0 | $ | 1,708.4 | ||||||||||||||||
|
*
|
At December 31, 2010, $104.5 million was authorized for future repurchases of our common stock.
|
|
**
|
426,533 shares were reclassified from Stock Held by Employee Benefits Trusts to Treasury Stock on our Consolidated Balance Sheets as a result of this transaction.
|
See Notes to Consolidated Financial Statements.
59
CONSOLIDATED STATEMENTS OF SHAREHOLDERS’ EQUITY AND COMPREHENSIVE INCOME
Accumulated Other Comprehensive Loss consists of the following components:
|
December 31,
|
||||||||||||
|
2010
|
2009
|
2008
|
||||||||||
|
(In millions)
|
||||||||||||
|
Foreign currency translation
|
$ | (100.8 | ) | $ | (99.9 | ) | $ | (178.4 | ) | |||
|
Unrecognized actuarial losses and prior service cost related to our pension and other postretirement benefit plans, net of accumulated tax of $138.6, $124.9 and $119.2 in 2010, 2009 and 2008, respectively
|
(241.3 | ) | (216.2 | ) | (208.5 | ) | ||||||
|
Cash flow hedging transactions, net of tax of $1.6, $1.7 and $2.1 in 2010, 2009 and 2008, respectively
|
(2.4 | ) | (2.6 | ) | (3.7 | ) | ||||||
|
Accumulated other comprehensive loss
|
$ | (344.5 | ) | $ | (318.7 | ) | $ | (390.6 | ) | |||
Comprehensive Income is as follows:
|
Twelve Months Ended December 31,
|
||||||||||||||||||||||||||||||||||||
|
2010
|
2009
|
2008
|
||||||||||||||||||||||||||||||||||
|
Equifax
|
Noncontrolling
|
Equifax
|
Noncontrolling
|
Equifax
|
Noncontrolling
|
|||||||||||||||||||||||||||||||
|
Shareholders
|
Interests
|
Total
|
Shareholders
|
Interests
|
Total
|
Shareholders
|
Interests
|
Total
|
||||||||||||||||||||||||||||
|
(In millions)
|
||||||||||||||||||||||||||||||||||||
|
Net income
|
$ | 266.7 | $ | 8.1 | $ | 274.8 | $ | 233.9 | $ | 6.6 | $ | 240.5 | $ | 272.8 | $ | 6.2 | $ | 279.0 | ||||||||||||||||||
| Other comprehensive income: | ||||||||||||||||||||||||||||||||||||
|
Foreign currency translation adjustment
|
(0.9 | ) | (0.2 | ) | (1.1 | ) | 78.5 | 0.1 | 78.6 | (118.3 | ) | (0.5 | ) | (118.8 | ) | |||||||||||||||||||||
|
Recognition of prior service cost and actuarial gains (losses) related to our pension and other postretirement benefit plans
|
(25.1 | ) | - | (25.1 | ) | (7.7 | ) | - | (7.7 | ) | (102.0 | ) | - | (102.0 | ) | |||||||||||||||||||||
|
Change in cumulative loss from cash flow hedging transactions
|
0.2 | - | 0.2 | 1.1 | - | 1.1 | 0.2 | - | 0.2 | |||||||||||||||||||||||||||
|
Comprehensive income
|
$ | 240.9 | $ | 7.9 | $ | 248.8 | $ | 305.8 | $ | 6.7 | $ | 312.5 | $ | 52.7 | $ | 5.7 | $ | 58.4 | ||||||||||||||||||
See Notes to Consolidated Financial Statements.
60
NOTES TO CONSOLIDATED FINANCIAL STATEMENTS
1. SUMMARY OF SIGNIFICANT ACCOUNTING POLICIES
As used herein, the terms Equifax, the Company, we, our and us refer to Equifax Inc., a Georgia corporation, and its consolidated subsidiaries as a combined entity, except where it is clear that the terms mean only Equifax Inc.
Nature of Operations.
We collect, organize and manage various types of financial, demographic, employment and marketing information. Our products and services enable businesses to make credit and service decisions, manage their portfolio risk, automate or outsource certain payroll-related, tax and human resources business processes, and develop marketing strategies concerning consumers and commercial enterprises. We serve customers across a wide range of industries, including the financial services, mortgage, retail, telecommunications, utilities, automotive, brokerage, healthcare and insurance industries, as well as government agencies. We also
enable consumers to manage and protect their financial health through a portfolio of products offered directly to consumers. As of December 31, 2010, we operated in the following countries: Argentina, Brazil, Canada, Chile, Ecuador, El Salvador, Honduras, Paraguay, Peru, Portugal, Spain, the United Kingdom, or U.K., Uruguay, and the United States of America, or U.S. We also maintain support operations in Costa Rica and the Republic of Ireland. We own an equity interest in a consumer credit information company in Russia. During 2009, we formed a joint venture to provide a broad range of credit data and information solutions in India.
We develop, maintain and enhance secured proprietary information databases through the compilation of actual consumer data, including credit, employment, asset, liquidity, net worth and spending activity, and business data, including credit and business demographics, that we obtain from a variety of sources, such as credit granting institutions, public record information (including bankruptcies, liens and judgments), income and tax information primarily from large to mid-sized companies in the U.S., and survey-based marketing information. We process this information utilizing our proprietary information management systems.
We acquired Anakam, Inc., a provider of large-scale, software-based, multi-factor authentication solutions, on October 1, 2010. We acquired Rapid Reporting Verification Company, a provider of IRS tax transcript information and social security number authentication services, on November 2, 2009. On October 27, 2009, we acquired IXI Corporation, a provider of consumer wealth and asset data. The results of these and a number of smaller acquisitions are included in our consolidated results subsequent to the acquisition dates.
Basis of Consolidation.
Our Consolidated Financial Statements and the accompanying notes, which are prepared in accordance with U.S. generally accepted accounting principles, or GAAP, include Equifax and all its subsidiaries. We consolidate all majority-owned and controlled subsidiaries as well as variable interest entities in which we are the primary beneficiary. Other parties’ interests in consolidated entities are reported as noncontrolling interests. We use the equity method of accounting for investments in which we are able to exercise significant influence and use the cost method for all other investments. All significant intercompany
transactions and balances are eliminated.
Our Consolidated Financial Statements reflect all adjustments which are, in the opinion of management, necessary for a fair presentation of the periods presented therein. Certain prior year amounts have been reclassified to conform to current year presentation, including selling, general and administrative expense of $13.2 million for the twelve months ended December 31, 2008, which was reclassified to cost of services. The effect of these reclassifications is not material.
Segments.
We manage our business and report our financial results through the following five reportable segments, which are the same as operating segments:
|
•
|
U.S. Consumer Information Solutions, or USCIS
|
|
•
|
International
|
|
•
|
TALX
|
|
•
|
North America Personal Solutions
|
61
NOTES TO CONSOLIDATED FINANCIAL STATEMENTS
|
•
|
North America Commercial Solutions
|
USCIS is our largest reportable segment, with 40% of total operating revenue for 2010. Our most significant foreign operations are located in Canada, the U.K. and Brazil.
Use of Estimates.
The preparation of our Consolidated Financial Statements requires us to make estimates and assumptions in accordance with GAAP. Accordingly, we make these estimates and assumptions after exercising judgment. We believe that the estimates and assumptions inherent in our Consolidated Financial Statements are reasonable, based upon information available to us at the time they are made including the consideration of events that have occurred up until the point these Statements have been filed. These estimates and assumptions affect the reported amounts of assets, liabilities, revenues and expenses, and disclosure of contingent assets
and liabilities at the date of the financial statements, as well as reported amounts of revenues and expenses during the reporting period. Actual results could differ materially from these estimates.
Revenue Recognition and Deferred Revenue.
Revenue is recognized when persuasive evidence of an arrangement exists, collectibility of arrangement consideration is reasonably assured, the arrangement fees are fixed or determinable and delivery of the product or service has been completed. A significant portion of our revenue is derived from our processing of transactions related to the provision of information services to our customers, in which case revenue is recognized, assuming all other revenue recognition criteria are met, when the services are provided. A smaller portion of our revenues relate to subscription-based contracts under which a
customer pays a preset fee for a predetermined or unlimited number of transactions or services provided during the subscription period, generally one year. Revenue related to subscription-based contracts having a preset number of transactions is recognized as the services are provided, using an effective transaction rate as the actual transactions are completed. Any remaining revenue related to unfulfilled units is not recognized until the end of the related contract’s subscription period. Revenue related to subscription-based contracts having an unlimited volume is recognized ratably during the contract term. Revenue is recorded net of sales taxes.
If at the outset of an arrangement, we determine that collectibility is not reasonably assured, revenue is deferred until the earlier of when collectibility becomes probable or the receipt of payment. If there is uncertainty as to the customer’s acceptance of our deliverables, revenue is not recognized until the earlier of receipt of customer acceptance or expiration of the acceptance period. If at the outset of an arrangement, we determine that the arrangement fee is not fixed or determinable, revenue is deferred until the arrangement fee becomes estimable, assuming all other revenue recognition criteria have been met.
The determination of certain of our tax management services revenue requires the use of estimates, principally related to transaction volumes in instances where these volumes are reported to us by our clients on a monthly basis in arrears. In these instances, we estimate transaction volumes based on average actual reported volumes reported in the past. Differences between our estimates and actual final volumes reported are recorded in the period in which actual volumes are reported. We have not experienced significant variances between our estimates and actual reported volumes in the past. We monitor actual volumes to ensure that we will continue to make reasonable estimates in the future. If we determine that we
are unable to make reasonable future estimates, revenue may be deferred until actual customer data is obtained. Also within our TALX operating segment, the fees for certain of our tax credits and incentives revenue are based on a portion of the credit delivered to our clients. Revenue for these arrangements is recognized based on the achievement of milestones, upon calculation of the credit, or when the credit is utilized by our client, depending on the provisions of the client contract.
We have certain information solution offerings that are sold as multiple element arrangements. The multiple elements may include consumer or commercial information, file updates for certain solutions, services provided by our decisioning technologies personnel, training services, statistical models and other services. To account for each of these elements separately, the delivered elements must have stand-alone value to our customer, and there must exist objective and reliable evidence of the fair value for any undelivered elements. For certain customer contracts, the total arrangement fee is allocated to the undelivered elements based on their fair values and to the initial delivered elements using the residual
method. If we are unable to unbundle the arrangement into separate units of accounting, we apply one of the accounting policies described above. This may lead to the arrangement consideration being recognized as the final contract element is delivered to our customer.
62
NOTES TO CONSOLIDATED FINANCIAL STATEMENTS
Many of our multiple element arrangements involve the delivery of services generated by a combination of services provided by one or more of our operating segments. No individual information service impacts the value or usage of other information services included in an arrangement and each service can be sold alone or, in most cases, purchased from another vendor without affecting the quality of use or value to the customer of the other information services included in the arrangement. Some of our products require the development of interfaces or platforms by our decisioning technologies personnel that allow our customers to interact with our proprietary information databases. These development services do not meet
the requirement for having stand-alone value, thus any related development fees are deferred when billed and are recognized over the expected period that the customer will benefit from the related decisioning technologies service. Revenue from the provision of statistical models is recognized as the service is provided and accepted, assuming all other revenue recognition criteria are met.
We have some multiple element arrangements that include software. We recognize the elements for which we have established vendor specific objective evidence at fair value upon delivery, in accordance with the applicable guidance.
We record revenue on a net basis for those sales in which we have in substance acted as an agent or broker in the transaction. The direct costs of set up of a customer are capitalized and amortized as a cost of service during the term of the related customer contract.
Deferred revenue consists of amounts billed in excess of revenue recognized on sales of our information services relating generally to the deferral of subscription fees and arrangement consideration from elements not meeting the criteria for having stand-alone value discussed above. Deferred revenues are subsequently recognized as revenue in accordance with our revenue recognition policies.
Cost of Services.
Cost of services consist primarily of (1) data acquisition and royalty fees; (2) customer service costs, which include: personnel costs to collect, maintain and update our proprietary databases, to develop and maintain software application platforms and to provide consumer and customer call center support; (3) hardware and software expense associated with transaction processing systems; (4) telecommunication and computer network expense; and (5) occupancy costs associated with facilities where these functions are performed by Equifax employees.
Selling, General and Administrative Expenses.
Selling, general and administrative expenses consist primarily of personnel-related costs, restructuring costs, corporate costs, fees for professional and consulting services, advertising costs, and other costs of administration.
Advertising.
Advertising costs from continuing operations, which are expensed as incurred, totaled $32.6 million, $31.9 million and $28.4 million during 2010, 2009 and 2008, respectively.
Stock-Based Compensation.
We recognize the cost of stock-based payment transactions in the financial statements over the period services are rendered according to the fair value of the stock-based awards issued. All of our stock- based awards, which are stock options and nonvested stock, are classified as equity instruments.
Income Taxes.
We account for income taxes under the liability method. Deferred income tax assets and liabilities are determined based on the estimated future tax effects of temporary differences between the financial statement and tax bases of assets and liabilities, as measured by current enacted tax rates. We assess whether it is more likely than not that we will generate sufficient taxable income to realize our deferred tax assets. We record a valuation allowance, as necessary, to reduce our deferred tax assets to the amount of future tax benefit that we estimate is more likely than not to be realized.
We record tax benefits for positions that we believe are more likely than not of being sustained under audit examinations. We assess the potential outcome of such examinations to determine the adequacy of our income tax accruals. We adjust our income tax provision during the period in which we determine that the actual results of the examinations may differ from our estimates or when statutory terms expire. Changes in tax laws and rates are reflected in our income tax provision in the period in which they occur.
63
NOTES TO CONSOLIDATED FINANCIAL STATEMENTS
Earnings Per Share.
Our basic earnings per share, or EPS, is calculated as net income divided by the weighted-average number of common shares outstanding during the reporting period. Diluted EPS is calculated to reflect the potential dilution that would occur if stock options or other contracts to issue common stock were exercised and resulted in additional common shares outstanding. The net income amounts used in both our basic and diluted EPS calculations are the same. A reconciliation of the weighted-average outstanding shares used in the two calculations is as follows:
|
Twelve Months Ended December 31,
|
||||||||||||
|
2010
|
2009
|
2008
|
||||||||||
|
(In millions)
|
||||||||||||
|
Weighted-average shares outstanding (basic)
|
124.8 | 126.3 | 128.1 | |||||||||
|
Effect of dilutive securities:
|
||||||||||||
|
Stock options and restricted stock units
|
1.5 | 1.4 | 2.2 | |||||||||
|
Long-term incentive plans
|
0.2 | 0.2 | 0.1 | |||||||||
|
Weighted-average shares outstanding (diluted)
|
126.5 | 127.9 | 130.4 | |||||||||
For the twelve months ended December 31, 2010, 2009 and 2008, 3.3 million, 3.3 million and 2.1 million stock options, respectively, were anti-dilutive and therefore excluded from this calculation.
Cash Equivalents.
We consider all highly liquid investments with an original maturity of three months or less to be cash equivalents.
Trade Accounts Receivable and Allowance for Doubtful Accounts.
We do not recognize interest income on our trade accounts receivable. Additionally, we generally do not require collateral from our customers related to our trade accounts receivable.
The allowance for doubtful accounts for estimated losses on trade accounts receivable is based on historical write-off experience, an analysis of the aging of outstanding receivables, customer payment patterns and the establishment of specific reserves for customers in an adverse financial condition. We reassess the adequacy of the allowance for doubtful accounts each reporting period. Increases to the allowance for doubtful accounts are recorded as bad debt expense, which are included in selling, general and administrative expenses on the accompanying Consolidated Statements of Income. Bad debt expense from continuing operations was $0.8 million, $6.6 million and $10.0 million during the twelve
months ended December 31, 2010, 2009, and 2008, respectively.
Long-Lived Assets.
Property and equipment are stated at cost less accumulated depreciation and amortization. The cost of additions is capitalized. Property and equipment are depreciated primarily on a straight-line basis over assets’ estimated useful lives, which are generally three to five years for data processing equipment and capitalized internal-use software and systems costs. Leasehold improvements are depreciated over the shorter of their estimated useful lives or lease terms that are reasonably assured. Buildings are depreciated over a forty-year period. Other fixed assets are depreciated over three to seven years. Upon sale or
retirement of an asset, the related costs and accumulated depreciation are removed from the accounts and any gain or loss is recognized and included in income from operations on the Consolidated Statements of Income, with the classification of any gain or loss dependent on the characteristics of the asset sold or retired.
Certain internal-use software and system development costs are deferred and capitalized. Accordingly, the specifically identified costs incurred to develop or obtain software which is intended for internal use are not capitalized until the determination is made as to the availability of a technically feasible solution to solve the predefined user and operating performance requirements as established during the preliminary stage of an internal-use software development project. Costs incurred during a software development project’s preliminary stage and post-implementation stage are expensed. Application development activities which are eligible for capitalization include software design and configuration,
development of interfaces, coding, testing, and installation. Capitalized internal-use software and systems costs are subsequently amortized on a straight-line basis over a three- to ten-year period after project completion and when the related software or system is ready for its intended use.
64
NOTES TO CONSOLIDATED FINANCIAL STATEMENTS
Depreciation and amortization expense from continuing operations related to property and equipment was $72.2 million, $65.0 million and $59.5 million during the twelve months ended December 31, 2010, 2009, and 2008, respectively.
Industrial Revenue Bonds.
Pursuant to the terms of certain industrial revenue bonds, we transferred title to certain of our fixed assets with costs of $47.9 million and $35.7 million as of December 31, 2010 and 2009, respectively, to a local governmental authority in the U.S. to receive a property tax abatement related to economic development. The title to these assets will revert back to us upon retirement or cancellation of the applicable bonds. These fixed assets are still recognized in the Company’s Consolidated Balance Sheets as all risks and rewards remain with the Company.
Impairment of Long-Lived Assets.
We monitor the status of our long-lived assets in order to determine if conditions exist or events and circumstances indicate that an asset group may be impaired in that its carrying amount may not be recoverable. Significant factors that are considered that could be indicative of an impairment include: changes in business strategy, market conditions or the manner in which an asset group is used; underperformance relative to historical or expected future operating results; and negative industry or economic trends. If potential indicators of impairment exist, we estimate recoverability based on the asset group’s
ability to generate cash flows greater than the carrying value of the asset group. We estimate the undiscounted future cash flows arising from the use and eventual disposition of the related long-lived asset group. If the carrying value of the long-lived asset group exceeds the estimated future undiscounted cash flows, an impairment loss is recorded based on the amount by which the asset group’s carrying amount exceeds its fair value. We utilize estimates of discounted future cash flows to determine the asset group’s fair value. During 2008, we recorded a $2.4 million impairment loss, included in depreciation and amortization expense, related to the write-down of certain internal-use software from which we will no longer derive future benefit. We did not record any impairment losses in 2010 or 2009.
Goodwill and Indefinite-Lived Intangible Assets.
Goodwill represents the cost in excess of the fair value of the net assets of acquired businesses. Goodwill is not amortized. We are required to test goodwill for impairment at the reporting unit level on an annual basis or on an interim basis if an event occurs or circumstances change that would reduce the fair value of a reporting unit below its carrying value. We perform our annual goodwill impairment test as of September 30 each year. In analyzing goodwill for potential impairment, we use a combination of the income and market approaches to estimate the reporting unit’s fair value. Under
the income approach, we calculate the fair value of a reporting unit based on estimated future discounted cash flows. The assumptions we use are based on what we believe a hypothetical marketplace participant would use in estimating fair value. Under the market approach, we estimate the fair value based on market multiples of revenue or earnings before interest, income taxes, depreciation and amortization for benchmark companies. If the fair value of a reporting unit exceeds its carrying value, then no further testing is required. However, if a reporting unit’s fair value were to be less than its carrying value, we would then determine the amount of the impairment charge, if any, which would be the amount that the carrying value of the reporting unit’s goodwill exceeded its implied value.
65
NOTES TO CONSOLIDATED FINANCIAL STATEMENTS
Contractual/territorial rights represent the estimated fair value of rights to operate in certain territories acquired through the purchase of independent credit reporting agencies in the U.S. and Canada. Our contractual/territorial rights are perpetual in nature and, therefore, the useful lives are considered indefinite. Indefinite-lived intangible assets are not amortized. We are required to test indefinite-lived intangible assets for impairment annually or whenever events and circumstances indicate that there may be an impairment of the asset value. Our annual impairment test date is September 30. We perform the impairment test for our indefinite-lived intangible assets by comparing the asset’s fair
value to its carrying value. We estimate the fair value based on projected discounted future cash flows. An impairment charge is recognized if the asset’s estimated fair value is less than its carrying value.
We completed our annual impairment testing for goodwill and indefinite-lived intangible assets during the twelve months ended December 31, 2010, 2009, and 2008, and we determined that there was no impairment in any of these years.
Purchased Intangible Assets.
Purchased intangible assets represent the estimated fair value of acquired intangible assets used in our business. Purchased data files represent the estimated fair value of consumer credit files acquired primarily through the purchase of independent credit reporting agencies in the U.S. and Canada. We expense the cost of modifying and updating credit files in the period such costs are incurred. We amortize purchased data files, which primarily consist of acquired credit files, on a straight-line basis. Primarily all of our other purchased intangible assets are also amortized on a straight-line basis.
|
Asset
|
Useful Life
|
|
|
(in years)
|
||
|
Purchased data files
|
2 to 15
|
|
|
Acquired software and technology
|
1 to 10
|
|
|
Non-compete agreements
|
1 to 10
|
|
|
Proprietary database
|
6 to 10
|
|
|
Customer relationships
|
2 to 25
|
|
|
Trade names
|
5 to 15
|
Other Assets.
Other assets on our Consolidated Balance Sheets primarily represents our interest rate swaps, investment in unconsolidated affiliates, assets related to life insurance policies covering certain officers of the Company, employee benefit trust assets, a statutorily-required tax deposit and data purchases, net of related amortization.
Benefit Plans.
We sponsor various pension and defined contribution plans. We also maintain certain healthcare and life insurance benefit plans for eligible retired U.S. employees. Benefits under the pension and other postretirement benefit plans are generally based on age at retirement and years of service and for some pension plans, benefits are also based on the employee’s annual earnings. The net periodic cost of our pension and other postretirement plans is determined using several actuarial assumptions, the most significant of which are the discount rate and the expected return on plan assets. Our Consolidated Balance Sheets reflect the
funded status of the pension and postretirement plans.
Foreign Currency Translation.
The functional currency of each of our foreign subsidiaries is that subsidiary’s local currency. We translate the assets and liabilities of foreign subsidiaries at the year-end rate of exchange and revenue and expenses at the monthly average rates during the year. We record the resulting translation adjustment in other comprehensive income, a component of shareholders’ equity. We also record gains and losses resulting from the translation of intercompany balances of a long-term investment nature in accumulated other comprehensive loss.
Financial Instruments.
Our financial instruments consist primarily of cash and cash equivalents, accounts and notes receivable, accounts payable and short-term and long-term debt. The carrying amounts of these items, other than long-term debt, approximate their fair market values due to the short-term nature of these instruments. The fair value of our fixed-rate debt is determined using quoted market prices for publicly traded instruments, and for non-publicly traded instruments through valuation techniques depending on the specific characteristics of the debt instrument, taking into account credit risk. As of December 31, 2010 and 2009, the
fair value of our fixed-rate debt was $1.05 billion and $1.02 billion, respectively, compared to its carrying value of $0.98 billion and $1.00 billion, respectively.
66
NOTES TO CONSOLIDATED FINANCIAL STATEMENTS
Derivatives and Hedging Activities.
Although derivative financial instruments are not utilized for speculative purposes or as the Company’s primary risk management tool, derivatives have been used as a risk management tool to hedge the Company’s exposure to changes in interest rates and foreign exchange rates. We have used interest rate swaps and interest rate lock agreements to manage interest rate risk associated with our fixed and floating-rate borrowings. Forward contracts on various foreign currencies have been used to manage the foreign currency exchange rate risk of certain firm commitments denominated in foreign currencies. We
recognize all derivatives on the balance sheet at fair value. Derivative valuations reflect the value of the instrument including the value associated with any material counterparty risk.
Fair Value Hedges.
In conjunction with our fourth quarter 2009 sale of five-year Senior Notes, we entered into five-year interest rate swaps, designated as fair value hedges, which convert the debt’s fixed interest rate to a variable rate. These swaps involve the receipt of fixed rate amounts for floating interest rate payments over the life of the swaps without exchange of the underlying principal amount. Changes in the fair value of the interest rate swaps offset changes in the fair value of the fixed-rate Senior Notes they hedge due to changes in the designated benchmark interest rate and are recorded in interest expense. The full fair
value of the interest rate swap is classified as a non-current asset or liability as the remaining maturity of the fixed-rate Senior Notes they hedge is more than twelve months. There was no ineffectiveness on our fair value hedge that impacted current year earnings. The fair value of these interest rate swaps at December 31, 2010 and 2009, was a $9.7 million asset recorded in other assets, net and a $3.3 million liability recorded in other long-term liabilities, respectively, on our Consolidated Balance Sheets.
Cash Flow Hedges.
Changes in the fair value of highly effective derivatives designated as cash flow hedges are initially recorded in accumulated other comprehensive income and are reclassified into the line item in the Consolidated Statements of Income in which the hedged item is recorded in the same period the hedged item impacts earnings. Any ineffective portion is recorded in current period earnings. The fair value of our unsettled cash flow hedges was not material at December 31, 2010 and 2009.
Fair Value Measurements.
Fair value is determined based on the assumptions marketplace participants use in pricing the asset or liability. We use a three level fair value hierarchy to prioritize the inputs used in valuation techniques between observable inputs that reflect quoted prices in active markets, inputs other than quoted prices with observable market data and unobservable data (e.g., a company’s own data). The adoption of fair value guidance for nonfinancial assets and nonfinancial liabilities on January 1, 2009 did not have a material impact on our Consolidated Financial Statements.
The following table presents assets and liabilities measured at fair value on a recurring basis:
|
Fair Value Measurements at Reporting Date Using:
|
|||||||||||||||||
|
Description
|
Fair Value at
December 31, 2010
|
Quoted Prices in
Active Markets for
Identical Assets
(Level 1)
|
Significant
Other
Observable
Inputs
(Level 2)
|
Significant
Unobservable
Inputs
(Level 3)
|
|||||||||||||
|
(In millions)
|
|||||||||||||||||
|
Assets and Liabilities:
|
|||||||||||||||||
|
Fair Value Interest Rate Swaps
|
(2) | $ | 9.7 | $ | - | $ | 9.7 | $ | - | ||||||||
|
Notes, due 2014
|
(284.7 | ) | - | (284.7 | ) | - | |||||||||||
|
Deferred Compensation Plan
|
(1) | (12.9 | ) | (12.9 | ) | - | - | ||||||||||
|
Total assets and liabilities
|
$ | (287.9 | ) | $ | (12.9 | ) | $ | (275.0 | ) | $ | - | ||||||
|
(1)
|
We maintain deferred compensation plans that allow for certain management employees to defer the receipt of compensation (such as salary, incentive compensation and commissions) until a later date based on the terms of the plans. The liability representing benefits accrued for plan participants is valued at the quoted market prices of the participants’ elections for investments in variable life insurance policies. Identical instruments are traded in active markets that we have access to as of December 31, 2010. As such, we have classified this liability as Level 1 within the fair value hierarchy.
|
67
NOTES TO CONSOLIDATED FINANCIAL STATEMENTS
|
(2)
|
The fair value of our interest rate swaps, designated as fair value hedges, and notes are based on the present value of expected future cash flows using zero coupon rates and are classified within Level 2 of the fair value hierarchy.
|
Variable Interest Entities.
We hold interests in certain entities, including credit data and information solutions ventures, that are considered variable interest entities, or VIEs. These variable interests relate to ownership interests that require financial support for these entities. Our investments related to these VIEs totaled $8.0 million at December 31, 2010, representing our maximum exposure to loss. These investments are classified in other assets, net on our Consolidated Balance Sheets. We are not the primary beneficiary and are not required to consolidate any of these VIEs.
Recent Accounting Pronouncements.
Fair Value Disclosures.
In January 2010, the FASB issued guidance requiring additional fair value disclosures for significant transfers between levels of the fair value hierarchy and gross presentation of items within the Level 3 reconciliation. This guidance also clarifies that entities need to disclose fair value information for each class of asset and liability measured at fair value and that valuation techniques need to be provided for all non-market observable measurements. Our adoption of this guidance on January 1, 2010, did not
impact our Consolidated Financial Statements as we have no items classified as Level 3.
Variable Interest Entities.
In June 2009, the FASB amended the consolidation guidance for variable-interest entities and expanded disclosure requirements. The new guidance requires an enterprise to perform an analysis to determine whether the enterprise’s variable interests give it a controlling financial interest in the variable interest entity. The adoption of this guidance on January 1, 2010, did not have a material impact on our Consolidated Financial Statements.
Revenue Arrangements with Multiple Deliverables.
In October 2009, the FASB issued revenue guidance for multiple-deliverable arrangements which addresses how to separate deliverables and how to measure and allocate arrangement consideration. This guidance requires vendors to develop the best estimate of selling price for each deliverable and to allocate arrangement consideration using this selling price. The guidance is effective prospectively for revenue arrangements entered into or materially modified in annual periods beginning after June 15, 2010. The adoption of this guidance on January 1, 2011, is not expected to have a material impact on
our Consolidated Financial Statements.
2. DISCONTINUED OPERATIONS
On April 23, 2010, we sold our APPRO loan origination software business (“APPRO”), for approximately $72 million. On July 1, 2010, we sold substantially all the assets of our Direct Marketing Services division (“DMS”) for approximately $117 million. Both of these businesses had previously been reported in our U.S. Consumer Information Solutions segment. The historical results of these operations for the years ended December 31, 2010, 2009 and 2008 are classified as discontinued operations in the Consolidated Statements of Income. Revenue for these businesses for the years ended December 31, 2010, 2009 and 2008 was $42.1 million, $108.5 million and
$122.1 million, respectively. Pretax income was $65.4 million, $25.6 million and $38.2 million for the years ended December 31, 2010, 2009 and 2008. We recorded a gain from the sale of APPRO in the second quarter of 2010 of $12.3 million, after tax, and a gain from the sale of DMS in the third quarter of 2010 of $14.9 million, after tax, both of which were classified as discontinued operations in the Consolidated Statements of Income.
3. ACQUISITIONS AND INVESTMENTS
2010 Acquisitions and Investments.
On October 1, 2010, to broaden our portfolio of solutions, we acquired Anakam, Inc., a provider of large-scale, software-based, multi-factor authentication solutions, for $64.3 million. The results of this acquisition have been included in our U.S. Consumer Information Solutions segment.
68
NOTES TO CONSOLIDATED FINANCIAL STATEMENTS
To further enhance our market share, during the twelve months ended December 31, 2010, we completed four acquisitions totaling $12.3 million. These transactions were in our International segment and the results of these acquisitions are not material.
2009 Acquisitions and Investments.
On December 23, 2009, as a part of our long-term growth strategy of expanding into emerging markets, we formed a joint venture, Equifax Credit Information Services Private Limited, or ECIS, to provide a broad range of credit data and information solutions in India. We paid cash consideration of $5.2 million for our 49 percent equity interest in ECIS.
On November 2, 2009, to further enhance our income and identity verification service offerings, we acquired Rapid Reporting Verification Company, or Rapid, a provider of IRS tax transcript information and social security number authentication services, for $72.5 million. The results of this acquisition have been included in our TALX operating segment subsequent to the acquisition.
On October 27, 2009, we acquired IXI Corporation, or IXI, a provider of consumer wealth and asset data, for $124.0 million. This acquisition enables us to offer more differentiated and in-depth consumer income, wealth and other data to help our clients improve their marketing, collections, portfolio management and customer management efforts across different product segments. The results of this acquisition have been included in our U.S. Consumer Information Solutions operating segment subsequent to the acquisition date.
We financed these purchases through borrowings under our Senior Credit Facility, which were subsequently refinanced through the issuance in November 2009 of our 4.45%, five-year unsecured Senior Notes. The 4.45% Senior Notes are further described in Note 5 of the Notes to the Consolidated Financial Statements in this report.
On August 12, 2009, in order to enhance our Mortgage Solutions business market share, we acquired certain assets and specified liabilities of a small mortgage credit reporting reseller for cash consideration of $3.8 million. The results of this acquisition have been included in our U.S. Consumer Information Solutions segment subsequent to the acquisition date.
2008 Acquisitions and Investments.
To further enhance our market share and grow our credit data business, during the twelve months ended December 31, 2008, we completed nine acquisitions and investments in a number of small businesses totaling $27.4 million, net of cash acquired. Six of the transactions were in our International segment, two within our U.S. Consumer Information Solutions segment and one within our TALX segment. We recorded a $6.0 million liability at December 31, 2009, with a corresponding adjustment to goodwill, for the contingent earn-out payment associated with the acquired company within the TALX segment. The
earn-out payment was measured on the completion of 2009 revenue targets and was paid in 2010.
On June 30, 2008, as a part of our long-term growth strategy of entering new geographies, we acquired a 28 percent equity interest in Global Payments Credit Services LLC, or GPCS, a credit information company in Russia, for cash consideration of $4.4 million, which is now doing business as Equifax Credit Services, LLC in Russia. Under our shareholders’ agreement, we have the option to acquire up to an additional 22 percent interest in GPCS between 2011 and 2013 for cash consideration based on a formula for determining equity value of the business and the assumption of certain debt, subject to satisfaction of certain conditions.
69
NOTES TO CONSOLIDATED FINANCIAL STATEMENTS
Purchase Price Allocation.
The following table summarizes the estimated fair value of the net assets acquired and the liabilities assumed at the acquisition dates. The 2010 allocations are considered final, except for the resolution of certain contingencies all of which existed at the acquisition date, primarily related to sales tax exposures and income tax accounts, which will be resolved when final returns are filed related to the acquired entities. Estimates for these items have been included in the purchase price allocations and will be finalized prior to the one year anniversary date of the acquisitions.
|
December 31,
|
||||||||
|
2010
|
2009
|
|||||||
|
(In millions)
|
||||||||
|
Current assets
|
$ | 6.0 | $ | 13.1 | ||||
|
Property and equipment
|
0.3 | 1.9 | ||||||
|
Other assets
|
0.6 | 3.0 | ||||||
|
Identifiable intangible assets
(1)
|
30.6 | 83.9 | ||||||
|
Goodwill
(2)
|
47.5 | 116.7 | ||||||
|
Total assets acquired
|
85.0 | 218.6 | ||||||
|
Total liabilities assumed
|
(8.0 | ) | (18.3 | ) | ||||
|
Non-controlling interest
|
(0.4 | ) | - | |||||
|
Net assets acquired
|
$ | 76.6 | $ | 200.3 | ||||
|
(1)
|
Identifiable intangible assets are further disaggregated in the table below.
|
|
(2)
|
Of the goodwill resulting from 2010 and 2009 acquisitions, $4.4 million and $39.6 million, respectively, is tax deductible.
|
The primary reasons the purchase price of certain of these acquisitions exceeded the fair value of the net assets acquired, which resulted in the recognition of goodwill, were expanded growth opportunities from new or enhanced product offerings, cost savings from the elimination of duplicative activities, and the acquisition of intellectual property and workforce that are not recognized as assets apart from goodwill.
|
December 31,
|
||||||||||||||||
|
2010
|
2009
|
|||||||||||||||
|
Intangible asset category
|
Fair value
|
Weighted-average
useful life
|
Fair value
|
Weighted-
average
useful life
|
||||||||||||
|
(in millions)
|
(in years)
|
(in millions)
|
(in years)
|
|||||||||||||
|
Customer relationships
|
$ | 11.5 | 8.9 | $ | 61.7 | 13.2 | ||||||||||
|
Proprietary database
|
- | - | 7.4 | 5.9 | ||||||||||||
|
Acquired software and technology
|
13.9 | 5.9 | 7.1 | 5.6 | ||||||||||||
|
Non-compete agreements
|
3.8 | 3.7 | 2.2 | 5.0 | ||||||||||||
|
Trade names and other intangible assets
|
1.4 | 5.8 | 5.5 | 8.1 | ||||||||||||
|
Total acquired intangibles
|
$ | 30.6 | 6.8 | $ | 83.9 | 11.4 | ||||||||||
The 2010 and 2009 acquisitions did not have a material impact in the Company’s Consolidated Statement of Income. The impact of the 2010 and 2009 acquisitions would not have significantly changed our Consolidated Statements of Income if they had occurred at the beginning of the earliest year presented.
70
NOTES TO CONSOLIDATED FINANCIAL STATEMENTS
4. GOODWILL AND OTHER INTANGIBLE ASSETS
Goodwill.
Goodwill represents the cost in excess of the fair value of the net assets acquired in a business combination. As discussed in Note 1, goodwill is tested for impairment at the reporting unit level on an annual basis and on an interim basis if an event occurs or circumstances change that would reduce the fair value of a reporting unit below its carrying value. We perform our annual goodwill impairment tests as of September 30 each year. The fair value estimates for our reporting units were determined using a combination of the income and market approaches in accordance with the Company’s methodology. Our
annual impairment tests as of September 30, 2010, 2009 and 2008 resulted in no impairment of goodwill.
Changes in the amount of goodwill for the twelve months ended December 31, 2010 and 2009, are as follows:
|
U.S.
Consumer
|
North
America
|
North
America
|
||||||||||||||||||||||
|
Information
|
Personal
|
Commercial
|
||||||||||||||||||||||
|
(In millions)
|
Solutions
|
International
|
TALX
|
Solutions
|
Solutions
|
Total
|
||||||||||||||||||
|
Balance, December 31, 2008
|
$ | 589.9 | $ | 275.3 | $ | 856.5 | $ | 1.8 | $ | 36.5 | $ | 1,760.0 | ||||||||||||
|
Acquisitions
|
78.4 | - | 38.3 | - | - | 116.7 | ||||||||||||||||||
|
Adjustments to initial purchase price allocation
|
(0.5 | ) | 0.1 | 6.0 | - | - | 5.6 | |||||||||||||||||
|
Foreign currency translation
|
- | 60.3 | - | - | 0.8 | 61.1 | ||||||||||||||||||
|
Tax benefits of options exercised
|
- | - | (0.2 | ) | - | - | (0.2 | ) | ||||||||||||||||
|
Balance, December 31, 2009
|
$ | 667.8 | $ | 335.7 | $ | 900.6 | $ | 1.8 | $ | 37.3 | $ | 1,943.2 | ||||||||||||
|
Acquisitions
|
41.0 | 6.5 | - | - | - | 47.5 | ||||||||||||||||||
|
Adjustments to initial purchase price allocation
|
(0.8 | ) | - | (0.7 | ) | - | - | (1.5 | ) | |||||||||||||||
|
Foreign currency translation
|
- | 4.7 | - | - | 0.3 | 5.0 | ||||||||||||||||||
|
Businesses sold
|
(79.5 | ) | - | - | - | - | (79.5 | ) | ||||||||||||||||
|
Balance, December 31, 2010
|
$ | 628.5 | $ | 346.9 | $ | 899.9 | $ | 1.8 | $ | 37.6 | $ | 1,914.7 | ||||||||||||
Indefinite-Lived Intangible Assets.
Indefinite-lived intangible assets consist of contractual/territorial rights representing the estimated fair value of rights to operate in certain territories acquired through the purchase of independent credit reporting agencies in the U.S. and Canada. Our contractual/territorial rights are perpetual in nature and, therefore, the useful lives are considered indefinite. Indefinite-lived intangible assets are not amortized. As discussed in Note 1, we are required to test indefinite-lived intangible assets for impairment annually and whenever events or circumstances indicate that there may be
an impairment of the asset value. We perform our annual indefinite-lived intangible asset impairment test as of September 30 each year. Our annual impairment tests as of September 30, 2010, 2009 and 2008 resulted in no impairment of our indefinite-lived intangible assets. Our contractual/territorial rights carrying amounts did not change materially during the twelve months ended December 31, 2010 and 2009.
Purchased Intangible Assets.
Purchased intangible assets net, recorded on our Consolidated Balance Sheets at December 31, 2010 and 2009, are as follows:
|
December 31, 2010
|
December 31, 2009
|
|||||||||||||||||||||||
|
Accumulated
|
Accumulated
|
|||||||||||||||||||||||
|
Gross
|
Amortization
|
Net
|
Gross
|
Amortization
|
Net
|
|||||||||||||||||||
|
Definite-lived intangible assets:
|
(In millions)
|
|||||||||||||||||||||||
|
Purchased data files
|
$ | 339.2 | $ | (240.7 | ) | $ | 98.5 | $ | 373.8 | $ | (240.6 | ) | $ | 133.2 | ||||||||||
|
Acquired software and technology
|
55.0 | (33.3 | ) | 21.7 | 70.3 | (37.1 | ) | 33.2 | ||||||||||||||||
|
Customer relationships
|
489.2 | (97.1 | ) | 392.1 | 488.0 | (70.8 | ) | 417.2 | ||||||||||||||||
|
Proprietary database
|
125.0 | (74.4 | ) | 50.6 | 125.0 | (52.2 | ) | 72.8 | ||||||||||||||||
|
Non-compete agreements
|
7.2 | (1.4 | ) | 5.8 | 3.3 | (0.5 | ) | 2.8 | ||||||||||||||||
|
Trade names and other intangible assets
|
37.4 | (12.2 | ) | 25.2 | 36.0 | (8.2 | ) | 27.8 | ||||||||||||||||
|
Total definite-lived intangible assets
|
$ | 1,053.0 | $ | (459.1 | ) | $ | 593.9 | $ | 1,096.4 | $ | (409.4 | ) | $ | 687.0 | ||||||||||
Amortization expense related to purchased intangible assets was $90.0 million, $80.3 million, and $80.2 million during the twelve months ended December 31, 2010, 2009, and 2008, respectively.
Estimated future amortization expense related to definite-lived purchased intangible assets at December 31, 2010 is as follows:
71
NOTES TO CONSOLIDATED FINANCIAL STATEMENTS
|
Years ending December 31,
|
Amount
|
|||
|
(In millions)
|
||||
|
2011
|
$ | 94.8 | ||
|
2012
|
84.7 | |||
|
2013
|
60.0 | |||
|
2014
|
46.8 | |||
|
2015
|
43.1 | |||
|
Thereafter
|
264.5 | |||
| $ | 593.9 | |||
5. DEBT
Debt outstanding at December 31, 2010 and 2009 was as follows:
|
December 31,
|
||||||||
|
2010
|
2009
|
|||||||
|
(In millions)
|
||||||||
|
Commercial paper
|
$ | - | $ | 135.0 | ||||
|
Note, 4.25%, due in installments through May 2012
|
4.7 | 7.6 | ||||||
|
Notes, 7.34%, due in installments through May 2014
|
60.0 | 75.0 | ||||||
|
Notes, 4.45%, due December 2014
|
275.0 | 275.0 | ||||||
|
Notes, 6.30%, due July 2017
|
272.5 | 272.5 | ||||||
|
Debentures, 6.90%, due July 2028
|
125.0 | 125.0 | ||||||
|
Notes, 7.00%, due July 2037
|
250.0 | 250.0 | ||||||
|
Borrowings under long-term revolving credit facilities, weighted-average rate of 0.9% in 2009
|
- | 4.8 | ||||||
|
Capitalized lease obligation
|
2.0 | 29.0 | ||||||
|
Other
|
1.0 | 3.1 | ||||||
|
Total debt
|
990.2 | 1,177.0 | ||||||
|
Less short-term debt and current maturities
|
(20.7 | ) | (183.2 | ) | ||||
|
Less unamortized discounts
|
(2.1 | ) | (2.4 | ) | ||||
|
Plus fair value adjustments
|
11.5 | (0.5 | ) | |||||
|
Total long-term debt, net of discount
|
$ | 978.9 | $ | 990.9 | ||||
Scheduled future maturities of debt at December 31, 2010, are as follows:
|
Years ending December 31,
|
Amount
|
|||
|
(In millions)
|
||||
|
2011
|
$ | 19.9 | ||
|
2012
|
17.8 | |||
|
2013
|
15.0 | |||
|
2014
|
290.0 | |||
|
2015
|
- | |||
|
Thereafter
|
647.5 | |||
|
Total debt
|
$ | 990.2 | ||
Senior Credit Facility.
We are party to an $850.0 million senior unsecured revolving credit facility, which we refer to as the Senior Credit Facility, with a group of financial institutions. Borrowings may be used for general corporate purposes, including working capital, capital expenditures, acquisitions and share repurchase programs. Availability of the Senior Credit Facility for borrowings is reduced by the outstanding face amount of any letters of credit issued under the facility and, pursuant to our existing Board of Directors authorization, by the outstanding principal amount of our commercial paper, or CP,
notes. The Senior Credit Facility was scheduled to expire in July 2011. On February 18, 2011, we extended the maturity date and reduced the borrowing limits of the Senior Credit Facility from $850.0 million to $500.0 million under the Second Amended and Restated Credit Agreement (the “Amended Agreement”). For additional information about the Amended Agreement, see Note 15 of the Notes to Consolidated Financial Statements.
72
NOTES TO CONSOLIDATED FINANCIAL STATEMENTS
Under our Senior Credit Facility, we must comply with various financial and non-financial covenants. The financial covenants require us to maintain a maximum leverage ratio, defined as consolidated funded debt divided by consolidated EBITDA (as set forth in the Senior Credit Facility) for the preceding four quarters, of not more than 3.5 to 1.0. Compliance with this financial covenant is tested quarterly. The non-financial covenants include limitations on liens, cross defaults, subsidiary debt, mergers, liquidations, asset dispositions and acquisitions. As of December 31, 2010, we were in compliance with our covenants under the Senior Credit Facility. Our borrowings under this facility, which have not been
guaranteed by any of our subsidiaries, are unsecured and will rank on parity in right of payment with all of our other unsecured and unsubordinated indebtedness from time to time outstanding.
At December 31, 2010, interest was payable on borrowings under the existing credit facility at the base rate or London Interbank Offered Rate, or LIBOR, plus a specified margin. The annual facility fee, which we pay regardless of borrowings, and interest rate are subject to adjustment based on our debt ratings. As of December 31, 2010, $848.3 million was available for borrowings and there were no outstanding borrowings under the Senior Credit Facility, which is included in long-term debt on our Consolidated Balance Sheet.
While the underlying final maturity date of this facility is July 2011, it is structured to provide borrowings under short-term loans. Since these borrowings primarily have a maturity of thirty days, the borrowings and repayments are presented on a net basis within the financing activities portion of our Consolidated Statements of Cash Flows as net (repayments) borrowings under long-term revolving credit facilities.
CP Program.
Our $850.0 million CP program has been established through the private placement of CP notes from time-to-time, in which borrowings bear interest at either a variable rate (based on LIBOR or other benchmarks) or a fixed rate, with the applicable rate and margin. Maturities of CP can range from overnight to 397 days. Since the CP program is backstopped by our Senior Credit Facility, the amount of CP which may be issued under the program is reduced by the outstanding face amount of any letters of credit issued under the facility and, pursuant to our existing Board of Directors authorization, by the outstanding
borrowings under our Senior Credit Facility. At December 31, 2010, there were no outstanding borrowings under this program. On February 18, 2011, under the terms of the Amended Agreement, we reduced the size of the CP Program, which is supported by the Senior Credit Facility, from $850.0 million to $500 million. For additional information about the Amended Agreement, see Note 15 of the Notes to Consolidated Financial Statements.
4.25% Note.
Upon our July 26, 2007 acquisition of our Atlanta, Georgia, data center, we assumed a $12.5 million mortgage obligation from the prior owner of the building. The mortgage obligation has a fixed rate of interest of 4.25% per annum and is payable in annual installments until March 1, 2012.
TALX Debt.
At the closing of the TALX acquisition in May 2007, we assumed $75.0 million in 7.34% Senior Guaranteed Notes, or TALX Notes, privately placed by TALX with several institutional investors in May 2006 and $96.6 million outstanding under TALX’s revolving credit facility. Subsequent to the TALX acquisition, we repaid and terminated the TALX revolving credit facility with borrowings under our Senior Credit Facility. We are required to repay the principal amount of the TALX Notes in five equal annual installments commencing on May 25, 2010 with a final maturity date of May 25, 2014. We may prepay
the TALX Notes subject to certain restrictions and the payment of a make-whole amount. Under certain circumstances, we may be required to use proceeds of certain asset dispositions to prepay a portion of the TALX Notes. Interest on the TALX Notes is payable semi-annually until the principal becomes due and payable. We identified a fair value adjustment related to the TALX Notes in applying purchase accounting; this amount is being amortized against interest expense over the remainder of the term of the TALX Notes. At December 31, 2010, the remaining balance of this adjustment is $1.8 million and is included in long-term debt on the Consolidated Balance Sheet.
4.45% Senior Notes.
On November 4, 2009, we issued $275.0 million principal amount of 4.45%, five-year senior notes in an underwritten public offering. Interest is payable semi-annually in arrears on December 1 and June 1 of each year. We used the net proceeds from the sale of the senior notes to repay outstanding borrowings under our CP program, a portion of which was used to finance our fourth quarter 2009 acquisitions. The senior notes are unsecured and rank equally with all of our other unsecured and unsubordinated indebtedness. In conjunction with the senior notes, we entered into five-year interest rate
swaps, designated as fair value hedges, which convert the fixed interest rate to a variable rate. The long-term debt fair value adjustment related to these interest rate swaps was an increase of $9.7 million at December 31, 2010.
73
NOTES TO CONSOLIDATED FINANCIAL STATEMENTS
6.3% and 7.0% Senior Notes.
On June 28, 2007, we issued $300.0 million principal amount of 6.3%, ten-year senior notes and $250.0 million principal amount of 7.0%, thirty-year senior notes in underwritten public offerings. Interest is payable semi-annually in arrears on January 1 and July 1 of each year. The net proceeds of the financing were used to repay short-term indebtedness, a substantial portion of which was incurred in connection with our acquisition of TALX. We must comply with various non-financial covenants, including certain limitations on liens, additional debt and mortgages, mergers, asset
dispositions and sale-leaseback arrangements. The senior notes are unsecured and rank equally with all of our other unsecured and unsubordinated indebtedness. During 2009, we purchased $7.5 million principal amount of the ten-year senior notes for $6.3 million.
6.9% Debentures.
We have $125 million of debentures outstanding with a maturity date of 2028. The debentures are unsecured and rank equally with all of our other unsecured and unsubordinated indebtedness. During 2009, we purchased $25.0 million principal amount of the debentures for $25.1 million.
Canadian Credit Facility.
We are a party to a credit agreement with a Canadian financial institution that provides for a C$10.0 million (denominated in Canadian dollars), 364-day revolving credit agreement. We reduced the borrowing limit from C$20.0 million to C$10.0 million during the second quarter of 2010 and extended the maturity date until June 2011. As of December 31, 2010, there were no outstanding borrowings under this facility.
Cash paid for interest, net of capitalized interest, was $55.6 million, $56.7 million and $71.7 million during the twelve months ended December 31, 2010, 2009 and 2008, respectively.
6. COMMITMENTS AND CONTINGENCIES
Leases.
On February 27, 2009, we notified the lessor of our headquarters building in Atlanta, Georgia, that we intended to exercise our purchase option in accordance with the lease terms. Under the terms of the $29.0 million synthetic lease for this facility, which commenced in 1998 and expired in March 2010, we guaranteed the residual value of the building at the end of the lease. We were responsible for any shortfall of sales proceeds, up to a maximum amount of $23.2 million, which equaled 80% of the value of the property at the beginning of the lease term. A residual guarantee value of $1.9 million was recorded related to this
contingency.
By making notification of our intent to purchase, we committed to purchase the building for $29.0 million on February 26, 2010. The exercise of our purchase option caused us to account for this lease obligation as a capital lease. We recorded the building and the related obligation on our Consolidated Balance Sheets at December 31, 2009, based on the difference between the purchase price and our residual guarantee of fair value, or $27.1 million.
Our operating leases principally involve office space and office equipment. Rental expense for operating leases, which is recognized on a straight-line basis over the lease term, was $20.5 million, $20.9 million and $20.6 million for the twelve months ended December 31, 2010, 2009 and 2008, respectively. Our headquarters building ground lease has purchase options exercisable beginning in 2019, renewal options exercisable in 2048 and escalation clauses that began in 2009. Expected future minimum payment obligations for non-cancelable operating leases exceeding one year are as follows as of December 31, 2010:
74
NOTES TO CONSOLIDATED FINANCIAL STATEMENTS
|
Years ending December 31,
|
Amount
|
|||
|
(In millions)
|
||||
|
2011
|
$ | 17.9 | ||
|
2012
|
14.8 | |||
|
2013
|
11.5 | |||
|
2014
|
7.4 | |||
|
2015
|
5.7 | |||
|
Thereafter
|
38.0 | |||
| $ | 95.3 | |||
We have no material sublease agreements and as a result, expected sublease income is not reflected as a reduction in the total minimum rental obligations under operating leases in the table above.
Data Processing, Outsourcing Services and Other Agreements.
We have separate agreements with IBM, Acxiom, TCS and others to outsource portions of our computer data processing operations, applications development, maintenance and related functions and to provide certain other administrative and operational services. The agreements expire between 2011 and 2016. The estimated aggregate minimum contractual obligation remaining under these agreements is approximately $100 million as of December 31, 2010, with no future year’s minimum contractual obligation expected to exceed approximately $40 million. Annual payment obligations in
regard to these agreements vary due to factors such as the volume of data processed; changes in our servicing needs as a result of new product offerings, acquisitions or divestitures; the introduction of significant new technologies; foreign currency; or the general rate of inflation. In certain circumstances (e.g., a change in control or for our convenience), we may terminate these data processing and outsourcing agreements, and, in doing so, certain of these agreements require us to pay a significant penalty.
During 2010, we amended our data processing outsourcing agreement with IBM in the U.K. The amended agreement extends the term three years through December 2016 and allows for a reduction in the scope of services provided by IBM, as well as financial savings to the Company. Under our agreement with IBM (which also covers our operations in North America, Europe, Brazil and Chile), we have outsourced our mainframe and midrange operations, help desk service and desktop support functions, and the operation of our voice and data networks. The scope of such services varies by location. The estimated future minimum contractual obligation under the revised agreement is approximately $76 million for the
remaining term, with no individual year’s minimum expected to exceed approximately $36 million. We may terminate certain portions of this agreement without penalty in the event that IBM is in material breach of the terms of the agreement. During 2010, 2009 and 2008, we paid $61.1 million, $87.3 million and $124.0 million, respectively, for these services.
Agreement with Computer Sciences Corporation.
We have an agreement with Computer Sciences Corporation, or CSC, and certain of its affiliates, collectively CSC, under which CSC-owned credit reporting agencies utilize our computerized credit database services. CSC retains ownership of its credit files and the revenues generated by its credit reporting activities. We receive a processing fee for maintaining the database and for each report supplied. The agreement will expire on July 31, 2018 and is renewable at the option of CSC for successive ten-year periods. The agreement provides us with an option to purchase CSC’s credit reporting
business if it does not elect to renew the agreement or if there is a change in control of CSC while the agreement is in effect. Under the agreement CSC also has an option, exercisable at any time, to sell its credit reporting business to us. The option expires in 2013. The option exercise price will be determined by a third-party appraisal process and would be due in cash within 180 days after the exercise of the option. We estimate that if the option were exercised at December 31, 2010, the price range would approximate $625 million to $700 million. This estimate is based solely on our internal analysis of the value of the business, current market conditions and other factors, all of which are subject to constant change. Therefore, the actual option exercise price could be materially higher or lower than the estimated amount.
Change in Control Agreements.
We have entered into change in control severance agreements with certain key executives. The agreements provide for, among other things, certain payments and benefits in the event of a qualifying termination of employment (i.e., termination of employment by the executive for “good reason” or termination of employment by the Company without “cause,” each as defined in the agreements) following a change in control of the Company. In the event of a qualifying termination, the executive will become entitled to continuation of group health, dental, vision, life, disability, 401(k) and similar
benefits for three years, as well as a lump sum severance payment, all of which differs by executive.
75
NOTES TO CONSOLIDATED FINANCIAL STATEMENTS
The change in control agreements have a five-year term and automatically renew for another five years unless we elect not to renew the agreements. Change in control events potentially triggering benefits under the agreements would occur, subject to certain exceptions, if (1) any person acquires 20% or more of our voting stock; (2) upon a merger or other business combination, our shareholders receive less than two-thirds of the common stock and combined voting power of the new company; (3) we sell or otherwise dispose of all or substantially all of our assets; or (4) we liquidate or dissolve.
If these change in control agreements had been triggered as of December 31, 2010, payments of approximately $39.6 million would have been made (excluding tax gross-up amounts of $16.6 million). Under the Company’s existing director and employee stock benefit plans, a change in control generally would result in the immediate vesting of all outstanding stock options and satisfaction of the restrictions on any outstanding nonvested stock awards.
Guarantees.
We will from time to time issue standby letters of credit, performance bonds or other guarantees in the normal course of business. The aggregate notional amount of all performance bonds and standby letters of credit is not material at December 31, 2010, and all have a remaining maturity of one year or less. The maximum potential future payments we could be required to make under the guarantees is not material at December 31, 2010.
General Indemnifications.
We are the lessee under many real estate leases. It is common in these commercial lease transactions for us, as the lessee, to agree to indemnify the lessor and other related third parties for tort, environmental and other liabilities that arise out of or relate to our use or occupancy of the leased premises. This type of indemnity would typically make us responsible to indemnified parties for liabilities arising out of the conduct of, among others, contractors, licensees and invitees at or in connection with the use or occupancy of the leased premises. This indemnity often extends to related liabilities arising from the
negligence of the indemnified parties, but usually excludes any liabilities caused by either their sole or gross negligence and their willful misconduct.
Certain of our credit agreements include provisions which require us to make payments to preserve an expected economic return to the lenders if that economic return is diminished due to certain changes in law or regulations. In certain of these credit agreements, we also bear the risk of certain changes in tax laws that would subject payments to non-U.S. lenders to withholding taxes.
In conjunction with certain transactions, such as sales or purchases of operating assets or services in the ordinary course of business, or the disposition of certain assets or businesses, we sometimes provide routine indemnifications, the terms of which range in duration and sometimes are not limited.
The Company has entered into indemnification agreements with its directors and executive officers. Under these agreements, the Company has agreed to indemnify such individuals to the fullest extent permitted by law against liabilities that arise by reason of their status as directors or officers and to advance expenses incurred by such individuals in connection with the related legal proceedings. The Company maintains directors and officers liability insurance coverage to reduce its exposure to such obligations.
We cannot reasonably estimate our potential future payments under the indemnities and related provisions described above because we cannot predict when and under what circumstances these provisions may be triggered. We have no accrual related to indemnifications on our Consolidated Balance Sheets at December 31, 2010 and 2009.
Subsidiary Dividend and Fund Transfer Limitations.
The ability of some of our subsidiaries and associated companies to transfer funds to us is limited, in some cases, by certain restrictions imposed by foreign governments, which do not, individually or in the aggregate, materially limit our ability to service our indebtedness, meet our current obligations or pay dividends.
Contingencies.
We are involved in legal proceedings, claims and litigation arising in the ordinary course of business. We periodically assess our exposure related to these matters based on the information which is available. We have recorded accruals in our Consolidated Financial Statements for those matters in which it is probable that we have incurred a loss and the amount of the loss, or range of loss, can be reasonably estimated.
76
NOTES TO CONSOLIDATED FINANCIAL STATEMENTS
For other legal proceedings, claims and litigation, we have recorded loss contingencies that are immaterial, or we cannot reasonably estimate the potential loss because of uncertainties about the outcome of the matter and the amount of the loss or range of loss. We also accrue for unpaid legal fees for services performed to date. Although the final outcome of these other matters cannot be predicted with certainty, any possible adverse outcome arising from these matters is not expected to have a material impact on our Consolidated Financial Statements, either individually or in the aggregate. However, our evaluation of the likely impact of these matters may change in the future.
Tax Matters.
In 2003, the Canada Revenue Agency, or CRA, issued Notices of Reassessment asserting that Acrofax, Inc., our wholly-owned Canadian subsidiary, is liable for additional tax for the 1995 through 2000 tax years, related to certain intercompany capital contributions and loans. The additional tax sought by the CRA for these periods ranges, based on alternative theories, from $8.5 million (8.5 million in Canadian dollars) to $19.0 million (19.0 million in Canadian dollars) plus interest and penalties. Subsequently in 2003, we made a statutorily-required deposit for a portion of the claim. We intend to vigorously
contest these reassessments and do not believe we have violated any statutory provision or rule. While we believe our potential exposure is less than the asserted claims and not material to our Consolidated Financial Statements, if the final outcome of this matter was unfavorable to us, an additional claim may be filed by the local province. The likelihood and potential amount of such claim is unknown at this time. We cannot predict when this tax matter will be resolved.
7. INCOME TAXES
The provision for income taxes from continuing operations consisted of the following:
|
Twelve Months Ended December 31,
|
||||||||||||
|
2010
|
2009
|
2008
|
||||||||||
|
(In millions)
|
||||||||||||
|
Current:
|
||||||||||||
|
Federal
|
$ | 74.2 | $ | 65.8 | $ | 59.7 | ||||||
|
State
|
8.2 | 6.9 | 8.8 | |||||||||
|
Foreign
|
41.3 | 38.8 | 49.2 | |||||||||
| 123.7 | 111.5 | 117.7 | ||||||||||
|
Deferred:
|
||||||||||||
|
Federal
|
15.3 | (5.0 | ) | (1.4 | ) | |||||||
|
State
|
(4.1 | ) | 0.1 | 1.3 | ||||||||
|
Foreign
|
(3.0 | ) | - | 1.4 | ||||||||
| 8.2 | (4.9 | ) | 1.3 | |||||||||
|
Provision for income taxes
|
$ | 131.9 | $ | 106.6 | $ | 119.0 | ||||||
Domestic and foreign income
from continuing operations
before income taxes was as follows:
|
Twelve Months Ended December 31,
|
||||||||||||
|
2010
|
2009
|
2008
|
||||||||||
|
(In millions)
|
||||||||||||
|
U.S.
|
$ | 203.3 | $ | 166.5 | $ | 173.7 | ||||||
|
Foreign
|
171.9 | 164.5 | 200.2 | |||||||||
| $ | 375.2 | $ | 331.0 | $ | 373.9 | |||||||
77
NOTES TO CONSOLIDATED FINANCIAL STATEMENTS
The provision for income taxes reconciles with the U.S. federal statutory rate, as follows:
|
Twelve Months Ended December 31,
|
||||||||||||
|
2010
|
2009
|
2008
|
||||||||||
|
(In millions)
|
||||||||||||
|
Federal statutory rate
|
35.0 | % | 35.0 | % | 35.0 | % | ||||||
|
Provision computed at federal statutory rate
|
$ | 131.3 | $ | 115.9 | $ | 130.9 | ||||||
|
State and local taxes, net of federal tax benefit
|
2.9 | 4.8 | 6.0 | |||||||||
|
Foreign
(2)
|
2.4 | (3.2 | ) | 1.3 | ||||||||
|
Valuation allowance
(2)
|
(3.2 | ) | (8.3 | ) | (8.7 | ) | ||||||
|
Tax reserves
(1)(2)
|
0.8 | 1.0 | (12.2 | ) | ||||||||
|
Other
(3)
|
(2.3 | ) | (3.6 | ) | 1.7 | |||||||
|
Provision for income taxes
|
$ | 131.9 | $ | 106.6 | $ | 119.0 | ||||||
|
Effective income tax rate
|
35.1 | % | 32.2 | % | 31.8 | % | ||||||
|
(1)
|
During the third quarter of 2008, the applicable statute of limitations related to uncertain tax positions expired, resulting in the reversal of the related income tax reserve. The reversal of this reserve resulted in an income tax benefit of $14.6 million. These are reflected in tax reserves on the effective tax reconciliation and reduced our 2008 effective tax rates by 3.5%.
|
|
(2)
|
During the fourth quarter of 2009, we recognized a $7.3 million income tax benefit related to our ability to utilize foreign tax credits beyond 2009. This reduced our 2009 effective tax rate by 2.1%.
|
|
(3)
|
Includes the benefit related to an investment loss in a subsidiary recognized during the third quarter of 2009.
|
We record deferred income taxes using enacted tax laws and rates for the years in which the taxes are expected to be paid. Deferred income tax assets and liabilities are recorded based on the differences between the financial reporting and income tax bases of assets and liabilities. For additional information about our income tax policy, see Note 1 of the Notes to Consolidated Financial Statements.
78
NOTES TO CONSOLIDATED FINANCIAL STATEMENTS
Components of the deferred income tax assets and liabilities at December 31, 2010 and 2009, were as follows:
|
December 31,
|
||||||||
|
2010
|
2009
|
|||||||
|
(In millions)
|
||||||||
|
Deferred income tax assets:
|
||||||||
|
Employee pension benefits
|
$ | 137.4 | $ | 124.1 | ||||
|
Net operating and capital loss carryforwards
(1)
|
104.0 | 44.8 | ||||||
|
Foreign tax credits
|
55.2 | 20.8 | ||||||
|
Employee compensation programs
|
43.8 | 33.6 | ||||||
|
Reserves and accrued expenses
|
12.8 | 12.5 | ||||||
|
Deferred revenue
|
5.8 | 9.2 | ||||||
|
Other
|
10.0 | 9.2 | ||||||
|
Gross deferred income tax assets
|
369.0 | 254.2 | ||||||
|
Valuation allowance
(1)
|
(87.2 | ) | (31.7 | ) | ||||
|
Total deferred income tax assets, net
|
$ | 281.8 | $ | 222.5 | ||||
|
Deferred income tax liabilities:
|
||||||||
|
Goodwill and intangible assets
|
(366.6 | ) | (330.5 | ) | ||||
|
Pension expense
|
(109.4 | ) | (94.2 | ) | ||||
|
Undistributed earnings of foreign subsidiaries
|
(27.4 | ) | (18.9 | ) | ||||
|
Depreciation
|
(6.4 | ) | (8.6 | ) | ||||
|
Other
|
(5.5 | ) | (5.1 | ) | ||||
|
Total deferred income tax liability
|
(515.3 | ) | (457.3 | ) | ||||
|
Net deferred income tax liability
|
$ | (233.5 | ) | $ | (234.8 | ) | ||
(1) During 2010, the Company was able to recognize certain losses on a foreign tax return which resulted in a net operating loss carryforward. However, the net operating loss carryforward is not expected to be utilized and a corresponding valuation allowance has been recorded against the related deferred tax asset. Additionally, it was determined that a previously disclosed deferred tax asset for unrealized foreign currency exchanges losses, which was fully reserved, should not have been recorded. The impact of not recording the asset and related valuation allowance has no impact on the Consolidated Financial
Statements.
Our deferred income tax assets, included in other current assets, and liabilities at December 31, 2010 and 2009, are included in the accompanying Consolidated Balance Sheets as follows:
|
December 31,
|
||||||||
|
2010
|
2009
|
|||||||
|
(In millions)
|
||||||||
|
Current deferred income tax assets, included in other current assets
|
$ | 10.7 | $ | 14.5 | ||||
|
Long-term deferred income tax liabilities
|
(244.2 | ) | (249.3 | ) | ||||
|
Net deferred income tax liability
|
$ | (233.5 | ) | $ | (234.8 | ) | ||
We record deferred income taxes on the temporary differences of our foreign subsidiaries and branches, except for the temporary differences related to undistributed earnings of subsidiaries which we consider indefinitely invested. We have indefinitely invested $85.7 million attributable to pre-2004 undistributed earnings of our Canadian and Chilean subsidiaries. If the pre-2004 earnings were not considered indefinitely invested, $6.4 million of deferred U.S. income taxes would have been provided. Such taxes, if ultimately paid, may be recoverable as U.S. foreign tax credits.
79
NOTES TO CONSOLIDATED FINANCIAL STATEMENTS
At December 31, 2010, we had U.S. federal and state net operating loss carryforwards of $102.4 million which will expire at various times between 2012 and 2029. We also had foreign net operating loss carryforwards totaling $305.8 million of which $33.2 million will expire between 2013 and 2017 and the remaining $272.6 million will carryforward indefinitely. U.S. federal and state capital loss carryforwards total $1.6 million at December 31, 2010, all of which will expire by 2012. Foreign capital loss carryforwards of $20.6 million may be carried forward indefinitely. Additionally, we had foreign tax credit carryforwards of $55.2 million, of which $4.3 million will begin
to expire in 2015, $22.6 million will be available to be utilized upon repatriation of foreign earnings and $28.3 million will be realized as foreign deferred tax liabilities reverse. We also had state credit carryforwards of $1.4 million which will begin expiring in 2017. Tax-effected state and foreign net operating losses and capital losses of $87.2 million have been fully reserved in the deferred tax asset valuation allowance.
Cash paid for income taxes, net of amounts refunded, was $163.7 million, $103.2 million and $128.7 million during the twelve months ended December 31, 2010, 2009 and 2008, respectively.
We recognize interest and penalties accrued related to unrecognized tax benefits in the provision for income taxes on our Consolidated Statements of Income.
A reconciliation of the beginning and ending amount of unrecognized tax benefits is as follows:
|
2010
|
2009
|
|||||||
|
(In millions)
|
||||||||
|
Beginning balance (January 1)
|
$ | 19.4 | $ | 15.8 | ||||
|
Increases related to prior year tax positions
|
3.6 | 0.6 | ||||||
|
Decreases related to prior year tax positions
|
(0.5 | ) | (1.2 | ) | ||||
|
Increases related to current year tax positions
|
2.7 | 3.7 | ||||||
|
Decreases related to settlements
|
(3.4 | ) | (0.3 | ) | ||||
|
Expiration of the statute of limitations for the assessment of taxes
|
(1.6 | ) | (1.1 | ) | ||||
|
Currency translation adjustment
|
0.3 | 1.9 | ||||||
|
Ending balance (December 31)
|
$ | 20.5 | $ | 19.4 | ||||
We recorded liabilities of $27.9 million and $26.8 million for unrecognized tax benefits as of December 31, 2010 and 2009, respectively, which included interest and penalties of $7.4 million for both years. As of December 31, 2010 and 2009, the total amount of unrecognized benefits that, if recognized, would have affected the effective tax rate was $19.7 million and $20.5 million, respectively, which included interest and penalties of $5.5 million and $5.7 million, respectively. The accruals for potential interest and penalties during 2010 and 2009 were not material.
Equifax and its subsidiaries are subject to U.S. federal, state and international income taxes. We are generally no longer subject to federal, state or international income tax examinations by tax authorities for years before 2005, with few exceptions including those discussed for Canada. In Canada, we are under audit by the Canada Revenue Agency for the 1995 through 2002 tax years (see Note 6 of the Notes to Consolidated Financial Statements). Due to the potential for resolution of state and foreign examinations, and the expiration of various statutes of limitations, it is reasonably possible that Equifax’s gross unrecognized tax benefit balance may change within the next twelve months by a range of zero
to $7.1 million.
8. STOCK-BASED COMPENSATION
We have one active share-based award plan, the 2008 Omnibus Incentive Plan which was approved by our shareholders in 2008, that provides our directors, officers and certain employees with stock options and nonvested stock. The plan is described below. We expect to issue common shares held by treasury stock upon the exercise of stock options or once nonvested shares vest. Total stock-based compensation expense in our Consolidated Statements of Income during the twelve months ended December 31, 2010, 2009 and 2008, was as follows:
80
NOTES TO CONSOLIDATED FINANCIAL STATEMENTS
|
Twelve Months Ended December 31,
|
||||||||||||
|
(in millions)
|
2010
|
2009
|
2008
|
|||||||||
|
Cost of services
|
$ | 3.6 | $ | 2.6 | $ | 2.4 | ||||||
|
Selling, general and administrative expenses
|
18.2 | 17.0 | 17.5 | |||||||||
|
Stock-based compensation expense, before income taxes
|
$ | 21.8 | $ | 19.6 | $ | 19.9 | ||||||
The total income tax benefit recognized for stock-based compensation expense was $7.8 million, $6.9 million and $7.1 million for the twelve months ended December 31, 2010, 2009 and 2008, respectively.
Benefits of tax deductions in excess of recognized compensation cost are reported as a financing cash flow, rather than as an operating cash flow. This requirement reduced operating cash flows and increased financing cash flows by $3.5 million, $1.3 million and $2.1 million during the twelve months ended December 31, 2010, 2009 and 2008, respectively.
Stock Options.
The 2008 Omnibus Incentive Plan provides that qualified and nonqualified stock options may be granted to officers and other employees. In conjunction with our acquisition of TALX, we assumed options outstanding under the legacy TALX stock option plan, which was approved by TALX shareholders. In addition, stock options remain outstanding under three shareholder-approved plans and three non-shareholder-approved plans from which no new grants may be made. The 2008 Omnibus Incentive Plan requires that stock options be granted at exercise prices not less than market value on the date of grant. Generally, stock options
are subject to graded vesting for periods of up to three years based on service, with 33% vesting for each year of completed service, and expire ten years from the grant date.
We use the binomial model to calculate the fair value of stock options granted on or after January 1, 2006. The binomial model incorporates assumptions regarding anticipated employee exercise behavior, expected stock price volatility, dividend yield and risk-free interest rate. Anticipated employee exercise behavior and expected post-vesting cancellations over the contractual term used in the binomial model were primarily based on historical exercise patterns. These historical exercise patterns indicated there was not significantly different exercise behavior between employee groups. For our expected stock price volatility assumption, we weighted historical volatility and implied volatility. We used daily
observations for historical volatility, while our implied volatility assumption was based on actively traded options related to our common stock. The expected term is derived from the binomial model, based on assumptions incorporated into the binomial model as described above.
The fair value for stock options granted during the twelve months ended December 31, 2010, 2009 and 2008, was estimated at the date of grant, using the binomial model with the following weighted-average assumptions:
|
Twelve Months Ended December 31,
|
||||||||||||
|
2010
|
2009
|
2008
|
||||||||||
|
Dividend yield
|
0.5 | % | 0.6 | % | 0.4 | % | ||||||
|
Expected volatility
|
29.9 | % | 32.3 | % | 27.1 | % | ||||||
|
Risk-free interest rate
|
1.6 | % | 2.0 | % | 2.6 | % | ||||||
|
Expected term (in years)
|
4.6 | 4.6 | 4.6 | |||||||||
|
Weighted-average fair value of stock options granted
|
$ | 8.28 | $ | 7.90 | $ | 9.09 | ||||||
The following table summarizes changes in outstanding stock options during the twelve months ended December 31, 2010, as well as stock options that are vested and expected to vest and stock options exercisable at December 31, 2010:
81
NOTES TO CONSOLIDATED FINANCIAL STATEMENTS
|
Weighted-Average
|
||||||||||||||||
|
Weighted-Average
|
Remaining
|
Aggregate
|
||||||||||||||
|
Shares
|
Exercise Price
|
Contractual Term
|
Intrinsic
Value
|
|||||||||||||
|
(in thousands)
|
(in years)
|
(in millions)
|
||||||||||||||
|
Outstanding at December 31, 2009
|
6,845 | $ | 28.68 | |||||||||||||
|
Granted (all at market price)
|
1,216 | $ | 32.02 | |||||||||||||
|
Exercised
|
(1,358 | ) | $ | 21.58 | ||||||||||||
|
Forfeited and cancelled
|
(177 | ) | $ | 34.04 | ||||||||||||
|
Outstanding at December 31, 2010
|
6,526 | $ | 30.63 | 6.1 | $ | 37.2 | ||||||||||
|
Vested and expected to vest at December 31, 2010
|
6,184 | $ | 30.44 | 6.0 | $ | 36.3 | ||||||||||
|
Exercisable at December 31, 2010
|
4,248 | $ | 30.28 | 4.6 | $ | 27.2 | ||||||||||
The aggregate intrinsic value amounts in the table above represent the difference between the closing price of Equifax’s common stock on December 31, 2010 and the exercise price, multiplied by the number of in-the-money stock options as of the same date. This represents the amount that would have been received by the stock option holders if they had all exercised their stock options on December 31, 2010. In future periods, this amount will change depending on fluctuations in Equifax’s stock price. The total intrinsic value of stock options exercised during the twelve months ended December 31, 2010, 2009 and 2008, was $14.7 million, $5.1 million and $14.4 million,
respectively. At December 31, 2010, our total unrecognized compensation cost related to stock options was $7.0 million with a weighted-average recognition period of 1.5 years.
The following table summarizes changes in outstanding options and the related weighted-average exercise price per share for the twelve months ended December 31, 2009 and 2008:
|
December 31,
|
||||||||||||||||
|
2009
|
2008
|
|||||||||||||||
|
Shares
|
Weighted-
Average
Price
|
Shares
|
Weighted-
Average
Price
|
|||||||||||||
|
(Shares in thousands)
|
(Shares in thousands)
|
|||||||||||||||
|
Outstanding at the beginning of the year
|
6,422 | $ | 27.84 | 6,484 | $ | 24.94 | ||||||||||
|
Granted (all at market price)
|
1,198 | $ | 28.49 | 1,042 | $ | 35.35 | ||||||||||
|
Exercised
|
(589 | ) | $ | 17.35 | (1,036 | ) | $ | 16.72 | ||||||||
|
Cancelled
|
(186 | ) | $ | 33.70 | (68 | ) | $ | 36.55 | ||||||||
|
Outstanding at the end of the year
|
6,845 | $ | 28.68 | 6,422 | $ | 27.84 | ||||||||||
|
Exercisable at end of year
|
4,780 | $ | 27.21 | 4,699 | $ | 24.47 | ||||||||||
Nonvested Stock.
Our 2008 Omnibus Incentive Plan also provides for awards of nonvested shares of our common stock that can be granted to executive officers, employees and directors. Nonvested stock awards are generally subject to cliff vesting over a period between one to three years based on service.
The fair value of nonvested stock is based on the fair market value of our common stock on the date of grant. However, since our nonvested stock does not pay dividends during the vesting period, the fair value on the date of grant is reduced by the present value of the expected dividends over the requisite service period (discounted using the appropriate risk-free interest rate).
The following table summarizes changes in our nonvested stock during the twelve months ended December 31, 2010, 2009 and 2008 and the related weighted-average grant date fair value:
82
NOTES TO CONSOLIDATED FINANCIAL STATEMENTS
|
Weighted-Average
|
||||||||
|
Grant Date
|
||||||||
|
Shares
|
Fair Value
|
|||||||
|
(in thousands)
|
||||||||
|
Nonvested at December 31, 2007
|
823 | $ | 38.33 | |||||
|
Granted
|
407 | $ | 35.05 | |||||
|
Vested
|
(360 | ) | $ | 33.83 | ||||
|
Forfeited
|
(20 | ) | $ | 38.90 | ||||
|
Nonvested at December 31, 2008
|
850 | $ | 36.33 | |||||
|
Granted
|
536 | $ | 28.41 | |||||
|
Vested
|
(230 | ) | $ | 34.40 | ||||
|
Forfeited
|
(46 | ) | $ | 31.75 | ||||
|
Nonvested at December 31, 2009
|
1,110 | $ | 33.10 | |||||
|
Granted
|
553 | $ | 33.27 | |||||
|
Vested
|
(317 | ) | $ | 38.08 | ||||
|
Forfeited
|
(36 | ) | $ | 33.20 | ||||
|
Nonvested at December 31, 2010
|
1,310 | $ | 31.54 | |||||
83
NOTES TO CONSOLIDATED FINANCIAL STATEMENTS
The total fair value of nonvested stock that vested during the twelve months ended December 31, 2010, 2009 and 2008, was $10.3 million, $6.5 million and $11.5 million, respectively, based on the weighted-average fair value on the vesting date, and $12.1 million, $7.9 million and $12.2 million, respectively, based on the weighted-average fair value on the date of grant. At December 31, 2010, our total unrecognized compensation cost related to nonvested stock was $16.2 million with a weighted-average recognition period of 2.1 years.
9. SHAREHOLDER RIGHTS PLAN
Our Board of Directors has adopted a shareholder rights plan designed to protect our shareholders against abusive takeover attempts and tactics. The rights plan operates to dilute the interests of any person or group attempting to take control of the Company if the attempt is not deemed by our Board of Directors to be in the best interests of our shareholders. Under the rights agreement, as originally adopted in October 1995 and amended and restated in October 2005, holders of our common stock were granted one right to purchase common stock, or Right, for each outstanding share of common stock held of record on November 24, 1995. All newly issued shares of common stock since that date have been accompanied by a
Right. The Rights will become exercisable and trade independently from our common stock if a person or group acquires or obtains the right to acquire 20% or more of Equifax’s outstanding shares of common stock, or commences a tender or exchange offer that would result in that person or group acquiring 20% or more of the outstanding common stock, in each case without the consent of our Board. In the event the Rights become exercisable, each holder (other than the acquiring person or group) will be entitled to purchase that number of shares of securities or other property of Equifax having a market value equal to two times the exercise price of the Right. If Equifax were acquired in a merger or other business combination, each Right would entitle its holder to purchase the number of the acquiring company’s common stock having a market value of two times the exercise price of
the Right. In either case, our Board may choose to redeem the Rights for $0.01 per Right before they become exercisable. The Rights will expire on November 6, 2015, unless earlier redeemed, exchanged or amended by the Board.
10. BENEFIT PLANS
We have defined benefit pension plans and defined contribution plans. We also maintain certain healthcare and life insurance benefit plans for eligible retired employees. The measurement date for our defined benefit pension plans and other postretirement benefit plans is December 31 of each year.
Pension Benefits.
Pension benefits are provided through U.S. and Canadian defined benefit pension plans and two supplemental executive defined benefit pension plans.
U.S. and Canadian Retirement Plans.
Prior to December 31, 2009, we had one non-contributory qualified retirement plan covering most U.S. salaried employees (the Equifax Inc. Pension Plan, or EIPP), a qualified retirement plan that covered U.S. salaried employees (the U.S. Retirement Income Plan, or USRIP) who terminated or retired before January 1, 2005 and a defined benefit plan for most salaried and hourly employees in Canada (the Canadian Retirement Income Plan, or CRIP). On December 31, 2009, the plan assets and obligations of the EIPP were merged with the USRIP. The USRIP remained as the sole U.S. qualified retirement plan.
There were no other plan amendments as a result of this merger. Benefits from these plans are primarily a function of salary and years of service.
On September 15, 2008, we announced a redesign of our retirement plans for our U.S. active employees effective January 1, 2009. The changes to our retirement plans froze the EIPP. Under the plan amendments, the EIPP was closed to new participants and the service credit for non-grandfathered participants was frozen, but participants will continue to receive credit for salary increases and vesting of service. Additionally, certain non-grandfathered employees and certain other employees not eligible to participate in the EIPP are able to participate in an enhanced 401(k) savings plan. As a result of these changes to the EIPP, we completed a remeasurement of the plan during the third quarter of 2008. The
remeasurement did not materially impact our Consolidated Financial Statements as of and for the twelve months ended December 31, 2008.
In January 2011, we made a contribution of $10.0 million to the USRIP. During the twelve months ended December 31, 2010, we made contributions of $50.0 million to the USRIP and $1.6 million to the CRIP. During the twelve months ended December 31, 2009, we made contributions of $15.0 million to the EIPP and $1.8 million to the CRIP. Additionally, the Equifax Employee Benefits Trust contributed $12.5 million to the EIPP upon dissolution of the Trust in December 2009. At December 31, 2010, the USRIP met or exceeded ERISA’s minimum funding requirements.
84
NOTES TO CONSOLIDATED FINANCIAL STATEMENTS
The annual report produced by our consulting actuaries specifies the funding requirements for our plans, based on projected benefits for plan participants, historical investment results on plan assets, current discount rates for liabilities, assumptions for future demographic developments and recent changes in statutory requirements. We may elect to make additional discretionary contributions to our plans in excess of minimum funding requirements, subject to statutory limitations.
Supplemental Retirement Plans.
We maintain two supplemental executive retirement programs for certain key employees. The plans, which are unfunded, provide supplemental retirement payments, based on salary and years of service.
Other Benefits.
We maintain certain healthcare and life insurance benefit plans for eligible retired employees. Substantially all of our U.S. employees may become eligible for the healthcare benefits if they reach retirement age while working for us and satisfy certain years of service requirements. The retiree life insurance program covers employees who retired on or before December 31, 2003. We accrue the cost of providing healthcare benefits over the active service period of the employee.
Obligations and Funded Status.
A reconciliation of the benefit obligations, plan assets and funded status of the plans is as follows:
|
Pension Benefits
|
Other Benefits
|
|||||||||||||||
|
2010
|
2009
|
2010
|
2009
|
|||||||||||||
|
(In millions)
|
||||||||||||||||
|
Change in benefit obligation
|
||||||||||||||||
|
Benefit obligation at January 1,
|
$ | 624.2 | $ | 577.8 | $ | 33.5 | $ | 31.0 | ||||||||
|
Service cost
|
6.4 | 5.3 | 0.5 | 0.5 | ||||||||||||
|
Interest cost
|
34.9 | 35.1 | 1.7 | 1.8 | ||||||||||||
|
Plan participants' contributions
|
- | - | 1.1 | 1.0 | ||||||||||||
|
Amendments
|
0.6 | - | - | - | ||||||||||||
|
Actuarial loss (gain)
|
50.5 | 41.5 | 1.2 | 3.4 | ||||||||||||
|
Foreign currency exchange rate changes
|
1.8 | 5.4 | - | - | ||||||||||||
|
Special termination benefits
|
- | 0.1 | - | - | ||||||||||||
|
Benefits paid
|
(40.4 | ) | (41.0 | ) | (4.5 | ) | (4.2 | ) | ||||||||
|
Benefit obligation at December 31,
|
678.0 | 624.2 | 33.5 | 33.5 | ||||||||||||
|
Change in plan assets
|
||||||||||||||||
|
Fair value of plan assets at January 1,
|
505.4 | 440.8 | 17.3 | 15.0 | ||||||||||||
|
Actual return on plan assets
|
47.5 | 66.3 | 1.6 | 2.3 | ||||||||||||
|
Employer contributions
|
55.4 | 32.9 | 3.4 | 3.2 | ||||||||||||
|
Plan participants' contributions
|
- | - | 1.1 | 1.0 | ||||||||||||
|
Foreign currency exchange rate changes
|
2.0 | 6.4 | - | - | ||||||||||||
|
Benefits paid
|
(40.4 | ) | (41.0 | ) | (4.5 | ) | (4.2 | ) | ||||||||
|
Fair value of plan assets at December 31,
|
569.9 | 505.4 | 18.9 | 17.3 | ||||||||||||
|
Funded status of plan
|
$ | (108.1 | ) | $ | (118.8 | ) | $ | (14.6 | ) | $ | (16.2 | ) | ||||
The accumulated benefit obligation for the USRIP, CRIP and Supplemental Retirement Plans was $646.3 million at December 31, 2010. The accumulated benefit obligation for the USRIP, CRIP and Supplemental Retirement Plans was $592.2 million at December 31, 2009.
At December 31, 2010, the USRIP and Supplemental Retirement Plans had projected benefit obligations and accumulated benefit obligations in excess of those plans’ respective assets. The projected benefit obligation, accumulated benefit obligation and fair value of plan assets for these plans in the aggregate were $631.3 million, $605.6 million and $519.2 million, respectively, at December 31, 2010.
85
NOTES TO CONSOLIDATED FINANCIAL STATEMENTS
At December 31, 2009, the USRIP and Supplemental Retirement Plans had projected benefit obligations and accumulated benefit obligations in excess of those plans’ respective assets. The projected benefit obligation, accumulated benefit obligation and fair value of plan assets for these plans in the aggregate were $583.6 million, $557.9 million and $459.4 million, respectively, at December 31, 2009.
The following table represents the net amounts recognized, or the funded status of our pension and other postretirement benefit plans, in our Consolidated Balance Sheets at December 31, 2010 and 2009:
|
Pension Benefits
|
Other Benefits
|
|||||||||||||||
|
(In millions)
|
2010
|
2009
|
2010
|
2009
|
||||||||||||
|
Amounts recognized in the statements of financial position
consist of:
|
||||||||||||||||
|
Prepaid pension asset
|
$ | 4.0 | $ | 5.3 | $ | - | $ | - | ||||||||
|
Current liabilities
|
(3.8 | ) | (3.8 | ) | - | - | ||||||||||
|
Long-term liabilities
|
(108.3 | ) | (120.3 | ) | (14.6 | ) | (16.2 | ) | ||||||||
|
Net amount recognized
|
$ | (108.1 | ) | $ | (118.8 | ) | $ | (14.6 | ) | $ | (16.2 | ) | ||||
Included in accumulated other comprehensive loss at December 31, 2010 and 2009, were the following amounts that have not yet been recognized in net periodic pension cost:
|
Pension Benefits
|
Other Benefits
|
|||||||||||||||
|
(In millions)
|
2010
|
2009
|
2010
|
2009
|
||||||||||||
|
Prior service cost, net of accumulated taxes of $1.3 and $1.4 in 2010 and 2009, respectively, for pension benefits and $(0.4) and $(0.5) in 2010 and 2009, respectively, for other benefits
|
$ | 2.2 | $ | 2.3 | $ | (0.8 | ) | $ | (0.9 | ) | ||||||
|
Net actuarial loss, net of accumulated taxes of $130.6 and $116.9 in 2010 and 2009, respectively, for pension benefits and $7.1 in both 2010 and 2009 for other benefits
|
227.5 | 202.5 | 12.4 | 12.3 | ||||||||||||
|
Accumulated other comprehensive loss
|
$ | 229.7 | $ | 204.8 | $ | 11.6 | $ | 11.4 | ||||||||
The following indicates amounts recognized in other comprehensive income during the twelve months ended December 31, 2010 and 2009:
86
NOTES TO CONSOLIDATED FINANCIAL STATEMENTS
|
Pension Benefits
|
Other Benefits
|
|||||||||||||||
|
(In millions)
|
2010
|
2009
|
2010
|
2009
|
||||||||||||
|
Amounts arising during the period:
|
||||||||||||||||
|
Net actuarial loss (gain), net of taxes of $17.2 and $8.1 in 2010 and 2009, respectively, for pension benefits and $0.4 and $0.9 in 2010 and 2009, respectively, for other benefits
|
$ | 31.0 | $ | 11.7 | $ | 0.8 | $ | 1.6 | ||||||||
|
Foreign currency exchange rate (gain) loss, net of taxes of $(0.1) and $0.5 in 2010 and 2009, respectively, for pension benefits
|
(0.1 | ) | 1.0 | - | - | |||||||||||
|
Prior service (credit) cost, net of taxes of $0.2 for pension benefits in 2010
|
0.4 | - | - | - | ||||||||||||
|
Amounts recognized in net periodic benefit cost during the period:
|
||||||||||||||||
|
Recognized actuarial loss, net of taxes of $(3.4) and $(3.2) in 2010 and 2009, respectively, for pension benefits and $(0.4) in 2010 and 2009 for other benefits
|
(5.8 | ) | (5.5 | ) | (0.8 | ) | (0.7 | ) | ||||||||
|
Amortization of prior service cost, net of taxes of $(0.3) in 2010 and 2009 for pension benefits and $0.1 in 2010 and 2009 for other benefits
|
(0.5 | ) | (0.5 | ) | 0.1 | 0.1 | ||||||||||
|
Total recognized in other comprehensive income
|
$ | 25.0 | $ | 6.7 | $ | 0.1 | $ | 1.0 | ||||||||
Components of Net Periodic Benefit Cost.
|
Pension Benefits
|
Other Benefits
|
|||||||||||||||||||||||
|
2010
|
2009
|
2008
|
2010
|
2009
|
2008
|
|||||||||||||||||||
|
(In millions)
|
||||||||||||||||||||||||
|
Service cost
|
$ | 6.4 | $ | 5.3 | $ | 11.0 | $ | 0.5 | $ | 0.5 | $ | 0.5 | ||||||||||||
|
Interest cost
|
34.9 | 35.1 | 34.8 | 1.7 | 1.8 | 1.9 | ||||||||||||||||||
|
Expected return on plan assets
|
(44.8 | ) | (44.8 | ) | (45.2 | ) | (1.5 | ) | (1.5 | ) | (1.5 | ) | ||||||||||||
|
Amortization of prior service cost
|
0.8 | 0.8 | 0.9 | (0.2 | ) | (0.2 | ) | 0.4 | ||||||||||||||||
|
Recognized actuarial loss
|
9.2 | 8.7 | 5.6 | 1.2 | 1.1 | 0.6 | ||||||||||||||||||
|
Special termination benefit
|
- | 0.1 | - | - | - | - | ||||||||||||||||||
|
Total net periodic benefit cost
|
$ | 6.5 | $ | 5.2 | $ | 7.1 | $ | 1.7 | $ | 1.7 | $ | 1.9 | ||||||||||||
The following represents the amount of prior service cost and actuarial loss included in accumulated other comprehensive loss that is expected to be recognized in net periodic benefit cost during the twelve months ending December 31, 2011:
|
Pension
|
Other
|
|||||||
|
(In millions)
|
Benefits
|
Benefits
|
||||||
|
Prior service cost, net of taxes of $0.3 for pension benefits and and $(0.1) for other benefits
|
$ | 0.5 | $ | (0.1 | ) | |||
|
Actuarial loss, net of taxes of $4.3 for pension benefits and and $0.5 for other benefits
|
$ | 7.6 | $ | 0.8 | ||||
Weighted-Average Assumptions.
|
Weighted-average assumptions used to determine
|
Pension Benefits
|
Other Benefits
|
||||||||||||||
|
benefit obligations at December 31,
|
2010
|
2009
|
2010
|
2009
|
||||||||||||
|
Discount rate
|
5.24 | % | 5.77 | % | 4.90 | % | 5.45 | % | ||||||||
|
Rate of compensation increase
|
4.37 | % | 4.37 | % | N/A | N/A | ||||||||||
|
Weighted-average assumptions used to determine
|
Pension Benefits
|
Other Benefits
|
||||||||||||||||||||||
|
net periodic benefit cost at December 31,
|
2010
|
2009
|
2008
|
2010
|
2009
|
2008
|
||||||||||||||||||
|
Discount rate
|
5.77 | % | 6.27 | % | 6.23 | % | 5.45 | % | 6.22 | % | 6.04 | % | ||||||||||||
|
Expected return on plan assets
|
7.73 | % | 8.02 | % | 8.00 | % | 7.75 | % | 8.00 | % | 8.00 | % | ||||||||||||
|
Rate of compensation increase
|
4.37 | % | 4.38 | % | 4.30 | % | N/A | N/A | N/A | |||||||||||||||
Discount Rates.
We determine our discount rates primarily based on high-quality, fixed-income investments and yield-to-maturity analysis specific to our estimated future benefit payments available as of the measurement date. Discount rates are reset annually on the measurement date to reflect current market conditions. We use a publicly published yield curve updated monthly to develop our discount rates. The yield curve provides discount rates related to a dedicated high-quality bond portfolio whose cash flows extend beyond the current period, from which we choose a rate matched to the expected benefit payments required for each plan.
87
NOTES TO CONSOLIDATED FINANCIAL STATEMENTS
Expected Return on Plan Assets.
The expected rate of return on plan assets is based on both our historical returns and forecasted future investment returns by asset class, as provided by our external investment advisor. Prior to 2008, the U.S. Pension Plans investment returns were 10.9%, 13.0% and 7.5% over three, five and ten years, respectively. The returns exceeded the S&P 500 returns for similar periods of time primarily due to an asset allocation strategy where large allocations to alternative asset classes (hedge fund of funds, private equity, real estate and real assets) provided consistently higher returns with a low correlation to
equity market returns. These returns historically demonstrate a long-term record of producing returns at or above the expected rate of return. However, the dramatic adverse market conditions in 2008 skewed the traditional measures of long-term performance, such as the ten-year average return. The severity of the 2008 losses, approximately negative 20%, makes the historical ten-year average return a less accurate predictor of future return expectations. In 2009, the investment returns were approximately 16%, reflecting a partial recovery of the 2008 losses. Our weighted-average expected rate of return for 2011 is 7.75% which is the same as the expected rate of return in 2010. Our weighted-average expected rate of return declined from 8.02% in 2009 to approximately 7.75% for 2010 primarily related to the USRIP which declined due to our migration to a lower risk investment
strategy, with increased allocation to lower risk/lower return asset classes, as well as the current forecast of expected future returns for our asset classes, which is lower than the prior year.
The calculation of the net periodic benefit cost for the USRIP and CRIP utilizes a market-related value of assets. The market-related value of assets recognizes the difference between actual returns and expected returns over five years at a rate of 20% per year.
Healthcare Costs.
An initial 7.75% annual rate of increase in the per capita cost of covered healthcare benefits was assumed for 2011 for pre-Medicare coverage. The rate was assumed to decrease gradually to an ultimate rate of 5.0% by 2015. An initial 11.0% annual rate of increase in the per capita cost of covered healthcare benefits was assumed for 2011 for post-Medicare coverage. The rate was assumed to decrease gradually to an ultimate rate of 5.0% by 2017. Assumed healthcare cost trend rates have a significant effect on the amounts reported for the healthcare plan. A one-percentage point change in assumed healthcare cost trend rates
at December 31, 2010 would have had the following effects:
|
1-Percentage
|
1-Percentage
|
|||||||
|
(In millions)
|
Point Increase
|
Point Decrease
|
||||||
|
Effect on total service and interest cost components
|
$ | 0.3 | $ | (0.2 | ) | |||
|
Effect on accumulated postretirement benefit obligation
|
$ | 3.2 | $ | (2.8 | ) | |||
We estimate that the future benefits payable for our retirement and postretirement plans are as follows at December 31, 2010:
|
U.S. Defined
|
Non-U.S.
Defined
|
Other
|
||||||||||
|
Years ending December 31,
|
Benefit Plans
|
Benefit
Plans
|
Benefit
Plans
|
|||||||||
|
(In millions)
|
||||||||||||
|
2011
|
$ | 40.0 | $ | 2.5 | $ | 3.0 | ||||||
|
2012
|
$ | 40.7 | $ | 2.5 | $ | 2.9 | ||||||
|
2013
|
$ | 40.9 | $ | 2.5 | $ | 2.8 | ||||||
|
2014
|
$ | 40.8 | $ | 2.5 | $ | 2.8 | ||||||
|
2015
|
$ | 40.9 | $ | 2.6 | $ | 2.7 | ||||||
|
Next five fiscal years to December 31, 2020
|
$ | 209.5 | $ | 14.4 | $ | 12.4 | ||||||
Fair Value of Plan Assets.
The fair value of the pension assets at December 31, 2010, is as follows:
88
NOTES TO CONSOLIDATED FINANCIAL STATEMENTS
|
Fair Value Measurements at Reporting Date Using:
|
|||||||||||||||||
|
Description
|
Fair Value at
December 31, 2010
|
Quoted Prices
in
Active Markets
for
Identical Assets
(Level 1)
|
Significant
Other
Observable
Inputs
(Level 2)
|
Significant
Unobservable
Inputs
(Level 3)
|
|||||||||||||
|
(In millions)
|
|||||||||||||||||
|
Large-Cap Equity
|
(1)
|
$ | 88.8 | $ | 88.8 | $ | - | $ | - | ||||||||
|
Small and Mid-Cap Equity
|
(1)
|
26.8 | 26.8 | - | - | ||||||||||||
|
International Equity
|
(1)
|
93.4 | 93.4 | - | - | ||||||||||||
|
Fixed Income
|
(1)
|
197.2 | 197.2 | - | - | ||||||||||||
|
Private Equity
|
(2)
|
31.8 | - | - | 31.8 | ||||||||||||
|
Hedge Funds
|
(3)
|
93.2 | - | - | 93.2 | ||||||||||||
|
Real Assets
|
(1) (4)
|
32.9 | 24.9 | - | 8.0 | ||||||||||||
|
Cash
|
(1)
|
5.8 | 5.8 | - | - | ||||||||||||
|
Total
|
$ | 569.9 | $ | 436.9 | $ | - | $ | 133.0 | |||||||||
|
(1)
|
Fair value is based on observable market prices for the assets.
|
|
(2)
|
Private equity investments are initially valued at cost. Fund managers periodically review the valuations utilizing subsequent company- specific transactions or deterioration in the company’s financial performance to determine if fair value adjustments are necessary. Private equity investments are typically viewed as long term, less liquid investments with return of capital coming via cash distributions from the sale of underlying fund assets. The Plan intends to hold these investments through each fund’s normal life cycle and wind down period. As of December 31, 2010, we had $16.4 million of remaining commitments related to these private equity investments.
|
|
(3)
|
Fair value is reported by the fund manager based on observable market prices for actively traded assets within the funds, as well as financial models, comparable financial transactions or other factors relevant to the specific asset for assets with no observable market. These investments are redeemable quarterly with a range of 30 – 90 days notice.
|
|
(4)
|
For the portion of this asset class categorized as Level 3, fair value is reported by the fund manager based on a combination of the following valuation approaches: current replacement cost less deterioration and obsolescence, a discounted cash flow model of income streams and comparable market sales.
|
The following table shows a reconciliation of the beginning and ending balances for assets valued using significant unobservable inputs:
|
Private Equity
|
Hedge Funds
|
Real Assets
|
||||||||||
|
(In millions)
|
||||||||||||
|
Balance at December 31, 2009
|
$ | 27.1 | $ | 63.5 | $ | 3.7 | ||||||
|
Return on plan assets:
|
||||||||||||
|
Unrealized
|
1.6 | 4.7 | - | |||||||||
|
Realized
|
0.1 | 2.4 | 0.4 | |||||||||
|
Purchases
|
6.8 | 50.7 | 3.9 | |||||||||
|
Sales
|
(3.8 | ) | (28.1 | ) | - | |||||||
|
Level 3 transfers, net
|
- | - | - | |||||||||
|
Balance at December 31, 2010
|
$ | 31.8 | $ | 93.2 | $ | 8.0 | ||||||
The fair value of the postretirement assets at December 31, 2010, is as follows:
89
NOTES TO CONSOLIDATED FINANCIAL STATEMENTS
|
Fair Value Measurements at Reporting Date Using:
|
|||||||||||||||||
|
Description
|
Fair Value at
December 31, 2010
|
Quoted Prices
in
Active Markets
for
Identical Assets
(Level 1)
|
Significant
Other
Observable
Inputs
(Level 2)
|
Significant
Unobservable
Inputs
(Level 3)
|
|||||||||||||
|
(In millions)
|
|||||||||||||||||
|
Large-Cap Equity
|
(1)
|
$ | 3.1 | $ | 3.1 | $ | - | $ | - | ||||||||
|
Small and Mid-Cap Equity
|
(1)
|
1.0 | 1.0 | - | - | ||||||||||||
|
International Equity
|
(1)
|
2.6 | 2.6 | - | - | ||||||||||||
|
Fixed Income
|
(1)
|
6.2 | 6.2 | - | - | ||||||||||||
|
Private Equity
|
(2)
|
1.2 | - | - | 1.2 | ||||||||||||
|
Hedge Funds
|
(3)
|
3.4 | - | - | 3.4 | ||||||||||||
|
Real Assets
|
(1) (4)
|
1.2 | 0.9 | - | 0.3 | ||||||||||||
|
Cash
|
(1)
|
0.2 | 0.2 | - | - | ||||||||||||
|
Total
|
$ | 18.9 | $ | 14.0 | $ | - | $ | 4.9 | |||||||||
|
(1)
|
Fair value is based on observable market prices for the assets.
|
|
(2)
|
Private equity investments are initially valued at cost. Fund managers periodically review the valuations utilizing subsequent company- specific transactions or deterioration in the company’s financial performance to determine if fair value adjustments are necessary. Private equity investments are typically viewed as long term, less liquid investments with return of capital coming via cash distributions from the sale of underlying fund assets. The Plan intends to hold these investments through each fund’s normal life cycle and wind down period.
|
|
(3)
|
Fair value is reported by the fund manager based on observable market prices for actively traded assets within the funds, as well as financial models, comparable financial transactions or other factors relevant to the specific asset for assets with no observable market.
|
|
(4)
|
For the portion of this asset class categorized as Level 3, fair value is reported by the fund manager based on a combination of the following valuation approaches: current replacement cost less deterioration and obsolescence, a discounted cash flow model of income streams and comparable market sales.
|
Gross realized and unrealized gains and losses, purchases and sales for Level 3 postretirement assets were not material for the twelve months ended December 31, 2010.
USRIP, or the Plan, Investment and Asset Allocation Strategies.
The primary goal of the asset allocation strategy of the Plan is to produce a total investment return which will satisfy future annual cash benefit payments to participants and minimize future contributions from the Company. Additionally, this strategy will diversify the plan assets to minimize nonsystemic risk and provide reasonable assurance that no single security or class of security will have a disproportionate impact on the Plan. Investment managers are required to abide by the provisions of ERISA. Standards of performance for each manager include an expected return versus an
assigned benchmark, a measure of volatility, and a time period of evaluation.
The asset allocation strategy is determined by our external advisor forecasting investment returns by asset class and providing allocation guidelines to maximize returns while minimizing the volatility and correlation of those returns. Investment recommendations are made by our external advisor, working in conjunction with our in-house Investment Officer. The asset allocation and ranges are approved by in-house Plan Administrators, who are Named Fiduciaries under ERISA.
90
NOTES TO CONSOLIDATED FINANCIAL STATEMENTS
The Plan, in an effort to meet asset allocation objectives, utilizes a variety of asset classes which has historically produced returns which are relatively uncorrelated to those of the S&P 500 in most environments. Asset classes included in this category are alternative assets (hedge fund-of-funds), private equity (including secondary private equity) and real assets (real estate and funds of hard asset securities). The primary benefits of using these types of asset classes are: (1) their non-correlated returns reduce the overall volatility of the Plan’s portfolio of assets, and (2) their ability to produce superior risk-adjusted returns. This has allowed the Plan’s average annual
investment return to exceed the S&P 500 index return over the last ten years. Additionally, the Plan allows certain of their managers, subject to specific risk constraints, to utilize derivative instruments, in order to enhance asset return, reduce volatility or both. Derivatives are primarily employed by the Plans in their fixed income portfolios and in the hedge fund-of-funds area. Derivatives can be used for hedging purposes to reduce risk. During 2007, the Equifax Master Trust entered into certain allowed derivative arrangements in order to minimize potential losses in the Plan’s assets. These agreements were settled in 2008 resulting in payments received of $13.2 million in the USRIP and $6.6 million in the EIPP.
The Plan is prohibited from investing additional amounts in Equifax stock once the market value of stock held by each plan exceeds 10% of the total market value of each plan. At December 31, 2010, the USRIP’s assets included 0.4 million shares of Equifax common stock, with a market value of $13.7 million. At December 31, 2009, the USRIP’s assets included 0.5 million shares of Equifax common stock, with a market value of $15.3 million. Not more than 5% of the portfolio (at cost) shall be invested in the securities of any one issuer, with the exceptions of Equifax common stock or other securities, and U.S. Treasury and government agency securities.
The following asset allocation ranges and actual allocations were in effect as of December 31, 2010 and 2009:
|
Actual
|
||||||||||||
|
USRIP
|
Range
|
2010
|
2009
|
|||||||||
|
Large-Cap Equity
|
10%-35 | % | 16.6 | % | 14.7 | % | ||||||
|
Small- and Mid-Cap Equity
|
0%-15 | % | 5.2 | % | 4.9 | % | ||||||
|
International Equity
|
10%-30 | % | 13.7 | % | 15.5 | % | ||||||
|
Private Equity
|
2%-10 | % | 6.1 | % | 5.6 | % | ||||||
|
Hedge Funds
|
10%-30 | % | 18.0 | % | 14.2 | % | ||||||
|
Real Assets
|
2%-10 | % | 6.3 | % | 6.0 | % | ||||||
|
Fixed Income
|
15%-40 | % | 33.1 | % | 27.9 | % | ||||||
|
Cash
|
0%-15 | % | 1.0 | % | 11.2 | % | ||||||
CRIP Investment and Asset Allocation Strategies.
The Pension Committee of the CRIP has retained an investment manager who has the discretion to invest in various asset classes with the care, skill, and diligence expected of professional prudence. The CRIP has a separate custodian of those assets, which are held in various segregated pooled funds. The Pension Committee maintains an investment policy for the CRIP, which imposes certain limitations and restrictions regarding allowable types of investments. The current investment policy imposes those restrictions on investments or transactions such as (1) Equifax common stock or securities, except
as might be incidental to any pooled funds which the plan may have, (2) commodities or loans, (3) short sales and the use of margin accounts, (4) put and call options, (5) private placements, and (6) transactions which are “related-party” in nature as specified by the Canadian Pension Benefits Standards Act and its regulations.
Each pooled fund is associated with an asset classification, which has a primary investment objective. The objective for each asset class is related to a standard investment index and to a period of four-years. The following includes the objectives for each of the current five asset classes:
91
NOTES TO CONSOLIDATED FINANCIAL STATEMENTS
|
Asset class
|
Four-Year Objective
|
|
|
Canadian Equities
|
S&P/TSX Composite Total Return Index plus 1.5%
|
|
|
U.S. Equities
|
S&P 500 Total Return Index plus 1.5% (Canadian $)
|
|
|
International Equities
|
MSCI EAFE Total Return Index plus 1.5% (Canadian $)
|
|
|
Fixed Income
|
Scotia Capital Universe Bond Index plus 0.5%
|
|
|
Money Market
|
Scotia Capital 91-Day Treasury Bill Index plus 0.3%
|
The following specifies the asset allocation ranges and actual allocation as of December 31, 2010 and 2009:
|
Actual
|
||||||||||||
|
CRIP
|
Range
|
2010
|
2009
|
|||||||||
|
Canadian Equities
|
25%-50 | % | 35.3 | % | 38.0 | % | ||||||
|
U.S. Equities
|
0%-19 | % | 4.9 | % | 21.8 | % | ||||||
|
International Equities
|
0%-19 | % | 8.9 | % | 7.9 | % | ||||||
|
Fixed Income
|
30%-70 | % | 50.3 | % | 31.6 | % | ||||||
|
Money Market
|
0%-10 | % | 0.6 | % | 0.7 | % | ||||||
The investment goal is to achieve the composite return calculated based on the above benchmark allocation plus 1% over successive four-year periods. An additional objective is to provide a real rate of return of 3.0% when compared with the Canadian Consumer Price Index, also over successive four-year periods.
Equifax Retirement Savings Plans.
Equifax sponsors a tax qualified defined contribution plan, the Equifax Inc. 401(k) Plan, or the Plan. We provide a discretionary match of participants’ contributions, up to six percent of employee contributions. We also provide a discretionary direct contribution to certain eligible employees, the percentage of which is based upon an employee
’
s years of service. Company contributions for the Plan during the twelve months ended December 31, 2010, 2009 and 2008 were $14.6 million, $13.8 million and $6.7 million,
respectively.
Foreign Retirement Plans.
We also maintain defined contribution plans for certain employees in the U.K., Ireland and Canada. For the years ended December 31, 2010, 2009 and 2008, our expenses related to these plans were not material.
Deferred Compensation Plans.
We maintain deferred compensation plans that allow for certain management employees and the Board of Directors to defer the receipt of compensation (such as salary, incentive compensation, commissions or vested restricted stock units) until a later date based on the terms of the plans. The benefits under our deferred compensation plans are guaranteed by the assets of a grantor trust which, through our funding, purchased variable life insurance policies on certain consenting individuals, with this trust as beneficiary. The purpose of this trust is to ensure the distribution of benefits accrued by participants of the
deferred compensation plans in case of a change in control, as defined in the trust agreement.
Long-Term Incentive Plan.
We have a shareholder-approved Key Management Incentive Plan (Annual Incentive Plan) for certain key officers that provides for annual or long-term cash awards at the end of various measurement periods, based on the earnings per share and/or various other criteria over the measurement period. Our total accrued incentive compensation for all incentive plans included in accrued salaries and bonuses on our Consolidated Balance Sheets was $61.9 million and $49.4 million at December 31, 2010 and 2009, respectively.
Employee Benefit Trusts.
We maintain employee benefit trusts for the purpose of satisfying obligations under certain benefit plans. These trusts held 2.1 million shares of Equifax stock with a value, at cost, of $41.2 million at December 31, 2010 and 2009, as well as cash, which was not material for both periods presented. The employee benefits trusts are as follows:
|
•
|
The Employee Stock Benefits Trust, which constitutes a funding vehicle for a variety of employee benefit programs. Prior to 2009, the trust released a certain number of shares annually which were distributed to employees in the course of share option exercises or nonvested share distributions upon vesting. During 2009, we took certain steps to dissolve the trust, including selling the remaining shares to Equifax. The $12.5 million of cash the trust received from the sale was contributed to the EIPP in December 2009.
|
92
NOTES TO CONSOLIDATED FINANCIAL STATEMENTS
|
•
|
The Executive Life and Supplemental Retirement Benefit Plan Grantor Trust is used to ensure that the insurance premiums due under the Executive Life and Supplemental Retirement Benefit Plan are paid in case we fail to make scheduled payments following a change in control, as defined in this trust agreement.
|
|
•
|
The Supplemental Executive Retirement Plans Grantor Trust’s assets are dedicated to ensure the payment of benefits accrued under our Supplemental Executive Retirement Plans in case of a change in control, as defined in this trust agreement.
|
The assets in these plans which are recorded on our Consolidated Balance Sheets are subject to creditors claims in case of insolvency of Equifax Inc.
11. RESTRUCTURING CHARGES
2009 Restructuring Charges.
In the fourth quarter of 2009, we recorded a $16.4 million restructuring charge ($10.4 million, net of tax) in selling, general and administrative expenses on our Consolidated Statements of Income primarily related to headcount reductions of approximately 400 positions. This charge resulted from our continuing efforts to align our business to better support our strategic objectives. Generally, severance benefits for our U.S. employees are paid through monthly payroll according to the number of weeks of severance benefit provided to the employee, while our international employees receive a lump sum severance
payment for their benefit. Payments related to this charge totaled $10.4 million for the twelve months ended December 31, 2010. Total payments to date, through December 31, 2010, related to the fourth quarter 2009 restructuring charge were $12.1 million.
During the first quarter of 2009, we recorded in selling, general and administrative expenses in our Consolidated Statements of Income an $8.4 million restructuring charge ($5.4 million, net of tax) associated with headcount reductions of approximately 300 positions. This charge resulted from our efforts to reduce and manage our expenses and to maintain our financial results in the face of a weak global economy and reduced revenues. Payments related to this charge were not material during the twelve months ended December 31, 2010. Total payments related to the first quarter 2009 restructuring charge were $8.0 million.
2008 Restructuring and Asset Write-down Charges.
In the third quarter 2008, we realigned our business to better support our strategic objectives and recorded a $16.8 million restructuring and asset write-down charge ($10.5 million, net of tax) of which $14.4 million was recorded in selling, general and administrative expenses and $2.4 million was recorded in depreciation and amortization on our Consolidated Statements of Income. The $2.4 million recorded in depreciation and amortization is related to the write-down of certain internal-use software from which we will no longer derive future benefit.
Of the $14.4 million recorded in selling, general and administrative expenses, $10.3 million was associated with headcount reductions of approximately 300 positions which was accrued for under existing severance plans or statutory requirements, and $4.1 million was related to certain contractual costs. Payments related to headcount reductions were substantially completed by March 31, 2009. Substantially all of the certain contractual costs, which primarily represents services we do not intend to utilize for which we are contractually committed to future payments, are expected to be paid by 2011. Payments related to headcount reductions and certain contractual costs were not material for the
twelve months ended December 31, 2010, and totaled $5.4 million for the twelve months ended December 31, 2009. Total payments, through December 31, 2010, related to the third quarter 2008 restructuring charge were $12.7 million.
Restructuring charges are recorded in general corporate expense. Restructuring charges related to discontinued operations were $4.1 million and $0.8 million during 2009 and 2008, respectively.
12. RELATED PARTY TRANSACTIONS
SunTrust Banks, Inc., or SunTrust
We considered SunTrust a related party until September 18, 2008, because Larry L. Prince, a member of our Board of Directors until that date, was also a director of SunTrust. L. Phillip Humann, a member of our Board of Directors, was Executive Chairman of the Board of Directors of SunTrust from 2007 to April 2008 and prior thereto, Chairman and Chief Executive Officer from 2004 through 2006. Our relationships with SunTrust are described more fully as follows:
93
NOTES TO CONSOLIDATED FINANCIAL STATEMENTS
|
•
|
We paid SunTrust $4.1 million during the twelve months ended December 31, 2008 for services such as lending, foreign exchange, debt underwriting, cash management, trust, investment management, acquisition valuation, and shareholder services relationships.
|
|
•
|
We also provide credit management services to SunTrust, as a customer, from whom we recognized revenue of $6.6 million during the twelve months ended December 31, 2008.
|
|
•
|
SunTrust is a dealer under our commercial paper program. Fees paid to the dealers related to our issuance of commercial paper were immaterial during the twelve months ended December 31, 2008.
|
Bank of America, N.A., or B of A
We considered B of A a related party until September 18, 2008, because Jacquelyn M. Ward, a member of our Board of Directors until that date, was also a director of B of A. Our relationships with B of A are described more fully as follows:
|
•
|
We provide credit management services to B of A, as a customer, from whom we recognized revenue of $40.3 million during the twelve months ended December 31, 2008.
|
|
•
|
B of A is a dealer under our commercial paper program. Fees paid to the dealers related to our issuance of commercial paper were immaterial during the twelve months ended December 31, 2008.
|
Fidelity National Information Services, Inc., or FNIS
We considered FNIS a related party until September 17, 2008, because Lee A. Kennedy, one of our directors until that date was President and Chief Executive Officer and a Director of FNIS. We sell certain consumer credit information services to FNIS. Revenue from FNIS, as a customer, for credit disclosure reports and portfolio reviews was not material during the twelve months ended December 31, 2008. In addition, FNIS provides customer invoice and disclosure notification printing and mailing services to us. Amounts paid to FNIS for fulfillment services were $12.1 million for the twelve months ended December 31, 2008.
On February 29, 2008, in order to enhance our mortgage solutions market share, we acquired certain assets and specified liabilities of FIS Credit Services, Inc., a related party mortgage credit reporting reseller, for cash consideration of $6.0 million. This is considered a related party transaction since FNIS is the parent company of FIS Credit Services, Inc.
13. SEGMENT INFORMATION
Reportable Segments.
We manage our business and report our financial results through the following five reportable segments, which are the same as our operating segments:
|
•
|
U.S. Consumer Information Solutions
|
|
•
|
TALX
|
|
•
|
International
|
|
•
|
North America Personal Solutions
|
|
•
|
North America Commercial Solutions
|
The accounting policies of the reportable segments are the same as those described in our summary of significant accounting policies (see Note 1). We evaluate the performance of these reportable segments based on their operating revenues, operating income and operating margins, excluding any unusual or infrequent items, if any. Inter-segment sales and transfers are not material for all periods presented. The measurement criteria for segment profit or loss and segment assets are substantially the same for each reportable segment. All transactions between segments are accounted for at cost, and no timing differences occur between segments.
94
NOTES TO CONSOLIDATED FINANCIAL STATEMENTS
A summary of segment products and services is as follows:
U.S. Consumer Information Solutions.
This segment includes consumer information services (such as credit information and credit scoring, credit modeling services, locate services, fraud detection and prevention services, identity verification services and other consulting services); mortgage loan origination information, appraisal, title and closing services; consumer financial marketing services; and multi-factor authentication solutions.
TALX.
This segment includes employment, income and social security number verification services (known as The Work Number) and employment tax and talent management services.
International.
This segment includes information services products, which includes consumer and commercial services (such as credit and financial information, credit scoring and credit modeling services), credit and other marketing products and services, and products and services sold directly to consumers.
North America Personal Solutions.
This segment includes credit information, credit monitoring and identity theft protection products sold directly to consumers via the Internet and in various hard-copy formats.
North America Commercial Solutions.
This segment includes commercial products and services such as business credit and demographic information, credit scores and portfolio analytics (decisioning tools), which are derived from our databases of business credit, financial and demographic information.
Segment information for the twelve months ended December 31, 2010, 2009 and 2008 and as of December 31, 2010 and 2009 is as follows:
|
Twelve Months Ended
|
||||||||||||
|
(in millions)
|
December 31,
|
|||||||||||
|
Operating revenue:
|
2010
|
2009
|
2008
|
|||||||||
|
U.S. Consumer Information Solutions
|
$ | 743.0 | $ | 712.2 | $ | 768.7 | ||||||
|
International
|
482.8 | 438.6 | 505.7 | |||||||||
|
TALX
|
395.6 | 346.4 | 305.1 | |||||||||
|
North America Personal Solutions
|
157.6 | 149.0 | 162.6 | |||||||||
|
North America Commercial Solutions
|
80.5 | 69.8 | 71.5 | |||||||||
|
Total operating revenue
|
$ | 1,859.5 | $ | 1,716.0 | $ | 1,813.6 | ||||||
|
Twelve Months Ended
|
||||||||||||
|
(in millions)
|
December 31,
|
|||||||||||
|
Operating income:
|
2010
|
2009
|
2008
|
|||||||||
|
U.S. Consumer Information Solutions
|
$ | 269.8 | $ | 259.4 | $ | 298.9 | ||||||
|
International
|
119.4 | 118.9 | 149.9 | |||||||||
|
TALX
|
92.1 | 75.4 | 53.1 | |||||||||
|
North America Personal Solutions
|
44.6 | 34.3 | 46.3 | |||||||||
|
North America Commercial Solutions
|
19.5 | 15.1 | 13.6 | |||||||||
|
General Corporate Expense
|
(115.4 | ) | (121.3 | ) | (122.8 | ) | ||||||
|
Total operating income
|
$ | 430.0 | $ | 381.8 | $ | 439.0 | ||||||
95
NOTES TO CONSOLIDATED FINANCIAL STATEMENTS
|
December 31,
|
||||||||
|
(in millions)
|
2010
|
2009
|
||||||
|
Total assets:
|
||||||||
|
U.S. Consumer Information Solutions
|
$ | 1,022.5 | $ | 1,145.8 | ||||
|
International
|
632.2 | 604.3 | ||||||
|
TALX
|
1,403.4 | 1,450.7 | ||||||
|
North America Personal Solutions
|
21.2 | 19.6 | ||||||
|
North America Commercial Solutions
|
66.7 | 70.7 | ||||||
|
General Corporate
|
287.6 | 259.4 | ||||||
|
Total assets
|
$ | 3,433.6 | $ | 3,550.5 | ||||
|
Twelve Months Ended
|
||||||||||||
|
(in millions)
|
December 31,
|
|||||||||||
|
Depreciation and amortization expense:
|
2010
|
2009
|
2008
|
|||||||||
|
U.S. Consumer Information Solutions
|
$ | 41.4 | $ | 35.4 | $ | 33.0 | ||||||
|
International
|
25.6 | 23.2 | 23.8 | |||||||||
|
TALX
|
67.9 | 62.6 | 62.6 | |||||||||
|
North America Personal Solutions
|
5.4 | 4.8 | 3.1 | |||||||||
|
North America Commercial Solutions
|
6.2 | 5.8 | 5.4 | |||||||||
|
General Corporate
|
15.7 | 13.4 | 14.3 | |||||||||
|
Total depreciation and amortization expense
|
$ | 162.2 | $ | 145.2 | $ | 142.2 | ||||||
|
Twelve Months Ended
|
||||||||||||
|
(in millions)
|
December 31,
|
|||||||||||
|
Capital expenditures:
|
2010
|
2009
|
2008
|
|||||||||
|
U.S. Consumer Information Solutions
|
$ | 13.8 | $ | 16.8 | $ | 22.1 | ||||||
|
International
|
12.4 | 11.9 | 22.8 | |||||||||
|
TALX
|
16.5 | 13.5 | 9.9 | |||||||||
|
North America Personal Solutions
|
4.9 | 5.1 | 9.5 | |||||||||
|
North America Commercial Solutions
|
2.4 | 2.6 | 4.3 | |||||||||
|
General Corporate
|
49.8 | 20.8 | 41.9 | |||||||||
|
Total capital expenditures
|
$ | 99.8 | $ | 70.7 | $ | 110.5 | ||||||
Financial information by geographic area is as follows:
|
Twelve Months Ended
|
||||||||||||||||||||||||
|
(in millions)
|
December 31,
|
|||||||||||||||||||||||
|
2010
|
2009
|
2008
|
||||||||||||||||||||||
|
Operating revenue (based on location of customer):
|
Amount
|
%
|
Amount
|
%
|
Amount
|
%
|
||||||||||||||||||
|
U.S.
|
$ | 1,352.2 | 73 | % | $ | 1,254.6 | 73 | % | $ | 1,282.6 | 71 | % | ||||||||||||
|
Canada
|
138.4 | 7 | % | 122.6 | 7 | % | 136.2 | 7 | % | |||||||||||||||
|
U.K.
|
104.7 | 6 | % | 104.9 | 6 | % | 141.0 | 8 | % | |||||||||||||||
|
Brazil
|
84.1 | 4 | % | 82.3 | 5 | % | 97.6 | 5 | % | |||||||||||||||
|
Other
|
180.1 | 10 | % | 151.6 | 9 | % | 156.2 | 9 | % | |||||||||||||||
|
Total operating revenue
|
$ | 1,859.5 | 100 | % | $ | 1,716.0 | 100 | % | $ | 1,813.6 | 100 | % | ||||||||||||
96
NOTES TO CONSOLIDATED FINANCIAL STATEMENTS
|
(in millions)
|
December 31,
|
|||||||||||||||
|
2010
|
2009
|
|||||||||||||||
|
Long-lived assets:
|
Amount
|
%
|
Amount
|
%
|
||||||||||||
|
U.S.
|
$ | 2,535.2 | 84 | % | $ | 2,667.4 | 86 | % | ||||||||
|
Brazil
|
170.9 | 6 | % | 168.3 | 5 | % | ||||||||||
|
Canada
|
93.1 | 3 | % | 100.0 | 3 | % | ||||||||||
|
U.K.
|
93.2 | 3 | % | 99.3 | 3 | % | ||||||||||
|
Other
|
112.0 | 4 | % | 98.7 | 3 | % | ||||||||||
|
Total long-lived assets
|
$ | 3,004.4 | 100 | % | $ | 3,133.7 | 100 | % | ||||||||
14. QUARTERLY FINANCIAL DATA (UNAUDITED)
Quarterly financial data for 2010 and 2009 was as follows:
|
Three Months Ended
|
||||||||||||||||
|
2010
|
March 31,
|
June 30,
|
September
30,
|
December
31,
|
||||||||||||
|
(In millions, except per share data)
|
||||||||||||||||
|
Operating revenue
|
$ | 443.0 | $ | 460.7 | $ | 473.8 | $ | 482.0 | ||||||||
|
Operating income
|
$ | 104.3 | $ | 105.8 | $ | 110.2 | $ | 109.7 | ||||||||
|
Consolidated income from continuing operations
|
$ | 55.9 | $ | 59.8 | $ | 63.6 | $ | 64.0 | ||||||||
|
Discontinued operations, net of tax
|
$ | 2.7 | $ | 13.6 | $ | 15.2 | $ | - | ||||||||
|
Consolidated net income
|
$ | 58.6 | $ | 73.4 | $ | 78.8 | $ | 64.0 | ||||||||
|
Net income attributable to Equifax
|
$ | 56.7 | $ | 71.3 | $ | 76.5 | $ | 62.2 | ||||||||
|
Basic earnings per common share*
|
||||||||||||||||
|
Net income from continuing operations attributable to Equifax
|
$ | 0.43 | $ | 0.46 | $ | 0.50 | $ | 0.51 | ||||||||
|
Discontinued operations attributable to Equifax
|
$ | 0.02 | $ | 0.11 | $ | 0.12 | $ | - | ||||||||
|
Net income attributable to Equifax
|
$ | 0.45 | $ | 0.57 | $ | 0.62 | $ | 0.51 | ||||||||
|
Diluted earnings per common share*
|
||||||||||||||||
|
Net income from continuing operations attributable to Equifax
|
$ | 0.42 | $ | 0.45 | $ | 0.49 | $ | 0.50 | ||||||||
|
Discontinued operations attributable to Equifax
|
$ | 0.02 | $ | 0.11 | $ | 0.12 | $ | - | ||||||||
|
Net income attributable to Equifax
|
$ | 0.44 | $ | 0.56 | $ | 0.61 | $ | 0.50 | ||||||||
|
Three Months Ended
|
||||||||||||||||
|
2009
|
March 31,
|
June 30,
|
September
30,
|
December
31,
|
||||||||||||
|
(In millions, except per share data)
|
||||||||||||||||
|
Operating revenue
|
$ | 426.5 | $ | 429.1 | $ | 425.0 | $ | 435.4 | ||||||||
|
Operating income
|
$ | 96.9 | $ | 102.0 | $ | 100.0 | $ | 82.9 | ||||||||
|
Consolidated income from continuing operations
|
$ | 52.5 | $ | 57.9 | $ | 57.4 | $ | 56.6 | ||||||||
|
Discontinued operations, net of tax
|
$ | 3.6 | $ | 3.2 | $ | 4.0 | $ | 5.3 | ||||||||
|
Consolidated net income
|
$ | 56.1 | $ | 61.1 | $ | 61.4 | $ | 61.9 | ||||||||
|
Net income attributable to Equifax
|
$ | 54.4 | $ | 59.6 | $ | 59.7 | $ | 60.2 | ||||||||
|
Basic earnings per common share*
|
||||||||||||||||
|
Net income from continuing operations attributable to Equifax
|
$ | 0.40 | $ | 0.44 | $ | 0.44 | $ | 0.44 | ||||||||
|
Discontinued operations attributable to Equifax
|
$ | 0.03 | $ | 0.03 | $ | 0.03 | $ | 0.04 | ||||||||
|
Net income attributable to Equifax
|
$ | 0.43 | $ | 0.47 | $ | 0.47 | $ | 0.48 | ||||||||
|
Diluted earnings per common share*
|
||||||||||||||||
|
Net income from continuing operations attributable to Equifax
|
$ | 0.40 | $ | 0.44 | $ | 0.44 | $ | 0.43 | ||||||||
|
Discontinued operations attributable to Equifax
|
$ | 0.03 | $ | 0.03 | $ | 0.03 | $ | 0.04 | ||||||||
|
Net income attributable to Equifax
|
$ | 0.43 | $ | 0.47 | $ | 0.47 | $ | 0.47 | ||||||||
|
*
|
The sum of the quarterly EPS does not equal the annual EPS due to changes in the weighted-average shares between periods.
|
The comparability of our quarterly financial results during 2010 and 2009 was impacted by certain events, as follows:
97
NOTES TO CONSOLIDATED FINANCIAL STATEMENTS
|
•
|
During 2010 and 2009, we made several acquisitions, including Anakam, Inc. during the fourth quarter of 2010, and IXI Corporation and Rapid Reporting Verification Company during the fourth quarter of 2009. For additional information about our acquisitions, see Note 3 of the Notes to Consolidated Financial Statements.
|
|
•
|
During the second quarter of 2010, we sold our APPRO loan origination software business (“APPRO”) for approximately $72 million. During the third quarter of 2010, we sold the assets of our Direct Marketing Services division (“DMS”) for approximately $117 million. Both of these were previously reported in our U.S. Consumer Information Solutions segment. We have presented the APPRO and DMS operations as discontinued operations for all periods presented. For additional information about these divestitures, see Note 2 of the Notes to Consolidated Financial Statements in this report.
|
|
•
|
During the first and fourth quarters of 2009, we recorded restructuring charges. For additional information about these charges, see Note 11 of the Notes to Consolidated Financial Statements.
|
|
•
|
During the fourth quarter of 2009, we recorded a $7.3 million income tax benefit related to our ability to utilize foreign tax credits beyond 2009. For additional information about these benefits, see Note 7 of the Notes to the Consolidated Financial Statements.
|
15. SUBSEQUENT EVENT
On February 18, 2011, we extended the maturity date and reduced the borrowing limits of our existing unsecured revolving credit facility dated as of July 24, 2006, as amended (the “Senior Credit Facility”) with a group of lenders by entering into a Second Amended and Restated Credit Agreement dated as of February 18, 2011 (the “Amended Agreement”). The Senior Credit Facility had been scheduled to expire on July 24, 2011, and provided $850.0 million of borrowing capacity. The Amended Agreement provides for a maturity date of February 18, 2015. We elected to reduce the size of the facility to $500.0 million in line with our liquidity needs and reflecting credit market
conditions, including higher upfront fees and fees for unused borrowing availability. No amounts are currently outstanding under the Senior Credit Facility. The Amended Agreement also provides an accordion feature that allows us to request an increase in the total commitment amount to $750 million should we so choose. We added certain of our subsidiaries in Canada and Luxembourg as co-borrowers in addition to the Company and our U.K. subsidiary to provide additional flexibility as to the place of borrowing.
The Amended Agreement revises certain other terms of the existing credit agreement, including pricing, to reflect current market conditions. The pricing grid for the Senior Credit Facility, which is based on our applicable credit ratings at the time of any borrowing, was increased. Based on our current credit ratings, the unused facility fee as of the closing date increased from 8 to 20 basis points, and the margin for base rate or LIBOR rate loans and letters of credit as of the closing date increased from 32 to 150 basis points. The Amended Agreement did not change the existing financial covenant which requires us to maintain, on a rolling four quarter basis, a maximum leverage
ratio (the ratio of consolidated total funded debt to consolidated EBITDA as defined in the Amended Agreement) not to exceed 3.5 to 1.0. On February 18, 2011, we correspondingly reduced the size of our commercial paper program (the CP Program), which is supported by the Senior Credit Facility, from $850.0 million to $500.0 million. As of February 18, 2011, no amounts were outstanding under the CP Program.
98
None.
Effectiveness of Disclosure Controls and Procedures.
Our management, with the participation of our Chairman and Chief Executive Officer and Chief Financial Officer, evaluated the effectiveness of Equifax’s disclosure controls and procedures as of the end of the period covered by this report. Based on that evaluation, our Chairman and Chief Executive Officer and Chief Financial Officer concluded that our disclosure controls and procedures as of the end of the period covered by this report (i) were appropriately designed to provide reasonable assurance of achieving their objectives and (ii) were effective and provided reasonable assurance that the information required to be disclosed by Equifax in reports filed under the Exchange Act is
(a) recorded, processed, summarized and reported within the time periods specified in the SEC’s rules and forms and (b) accumulated and communicated to Equifax’s management, including our Chairman and Chief Executive Officer and Chief Financial Officer, as appropriate to allow timely decisions regarding required disclosure.
Management’s Annual Report on Internal Control Over Financial Reporting.
Our management is responsible for establishing and maintaining adequate internal control over financial reporting. Internal control over financial reporting is defined in Rules 13a-15(f) and 15d-15(f) of the Exchange Act as a process designed by, or under the supervision of, our Chairman and Chief Executive Officer and Chief Financial Officer and effected by our Board of Directors, management and other personnel, to provide reasonable assurance regarding the reliability of financial reporting and the preparation of financial statements for external purposes in accordance with generally accepted accounting principles and includes those policies and procedures that:
|
|
•
|
pertain to the maintenance of records that in reasonable detail accurately and fairly reflect transactions and dispositions of our assets;
|
|
|
•
|
provide reasonable assurance that transactions are recorded as necessary to permit preparation of financial statements in accordance with generally accepted accounting principles, and that our receipts and expenditures are being made only in accordance with authorizations of our management and directors; and
|
|
|
•
|
provide reasonable assurance regarding prevention or timely detection of unauthorized acquisition, use or disposition of our assets that could have a material effect on the financial statements.
|
Because of its inherent limitations, internal control over financial reporting may not prevent or detect misstatements. Projections of any evaluation of effectiveness to future periods are subject to the risk that controls may become inadequate because of changes in conditions, or that the degree of compliance with the policies or procedures may deteriorate.
Our management assessed the effectiveness of Equifax’s internal control over financial reporting as of December 31, 2010 using the criteria set forth by the Committee of Sponsoring Organizations of the Treadway Commission (COSO) in Internal Control-Integrated Framework. Based on this assessment using those criteria, our management concluded that, as of December 31, 2010, Equifax’s internal control over financial reporting was effective. The effectiveness of Equifax’s internal control over financial reporting as of December 31, 2010 has been audited by Ernst & Young LLP, Equifax’s independent registered public accounting firm, as stated in their report, which appears under
Item 8 on page 54.
Changes in Internal Control Over Financial Reporting.
No change in our internal control over financial reporting occurred during Equifax’s fourth quarter ended December 31, 2010 that has materially affected, or is reasonably likely to materially affect, Equifax’s internal control over financial reporting.
99
Information required by Item 10 of Part III regarding our directors, nominees, and audit committee financial experts is included in the sections captioned “Directors, Executive Officers and Corporate Governance” and “Section 16(a) Beneficial Ownership Reporting Compliance” in our definitive Proxy Statement, or 2011 Proxy Statement, relating to the Annual Meeting of Shareholders to be held on May 5, 2011, to be filed with the SEC within 120 days after December 31, 2010, and is incorporated herein by reference.
Information regarding our Executive Officers required by Item 10 of Part III is set forth in Item 1 of Part I “Business — Executive Officers of the Registrant.”
Information regarding compliance with Section 16(a) of the Securities Exchange Act of 1934 is included in the section of our 2011 Proxy Statement captioned “Section 16(a) Beneficial Ownership Reporting Compliance,” and is incorporated herein by reference.
Equifax has adopted codes of ethics and business conduct applicable to all directors, officers and employees, available at
www.equifax.com/about_equifax/corporate_governance/en_us,
or in print upon request to the Corporate Secretary, Equifax Inc., P.O. Box 4081, Atlanta, Georgia, 30302. We will post any amendments to the code of ethics and business conduct, and any waivers that are required to be disclosed by the rules of either the SEC or the New York Stock Exchange on our Internet site.
Information
required by Item 11 of Part III is included in the sections of our 2011 Proxy Statement captioned
“Compensation Discussion and Analysis,” “Executive Compensation Tables,” “Director Compensation,” “Compensation Committee Interlocks and Insider Participation,” and “Compensation Committee Report” and is incorporated herein by reference.
Information
required by Item 12 of Part III is included in the section of our 2011 Proxy Statement captioned
“Security Ownership of Certain Beneficial Owners and Management” and is incorporated herein by reference.
Securities Authorized for Issuance Under Equity Compensation Plans
Information required by Item 12 regarding the securities authorized for issuance under our equity compensation plans is included in the section captioned “Equity Compensation Plan Information” in our 2011 Proxy Statement and is incorporated herein by reference.
Information
required by Item 13 of Part III is included in the sections of our 2011 Proxy Statement captioned
“Directors, Executive Officers and Corporate Governance,” and “Review, Approval or Ratification of Transactions with Related Persons” and is incorporated herein by reference.
Information required by Item 14 of Part III is included in the section of
our
2011 Proxy Statement captioned
“Fees Paid to Auditor” and “Policy on Audit Committee Pre-Approval of Audit and Non-Audit Services Performed by the Independent Registered Public Accounting Firm”and is incorporated herein by reference.
100
FINANCIAL STATEMENT SCHEDULES
|
(a)
|
List of Documents Filed as a Part of This Report:
|
|
|
(1)
|
Financial Statements.
The following financial statements are included in Item 8 of Part II:
|
|
|
•
|
Consolidated Balance Sheets — December 31, 2010 and 2009;
|
|
|
•
|
Consolidated Statements of Income for the Years Ended December 31, 2010, 2009 and 2008;
|
|
|
•
|
Consolidated Statements of Cash Flows for the Years Ended December 31, 2010, 2009 and 2008;
|
|
|
•
|
Consolidated Statements of Shareholders’ Equity and Comprehensive Income for the Years Ended December 31, 2010, 2009 and 2008; and
|
|
|
•
|
Notes to Consolidated Financial Statements.
|
|
|
(2)
|
Financial Statement Schedules.
|
|
|
•
|
Schedule II — Valuation and Qualifying Accounts
|
All other schedules for which provision is made in the applicable accounting regulation of the SEC are not required under the related instructions or are inapplicable and, therefore, have been omitted.
|
|
(3)
|
Exhibits.
A list of the exhibits required to be filed as part of this Report by Item 601 of Regulation S-K is set forth in the Exhibit Index on page 104 of this report, which immediately precedes such exhibits, and is incorporated herein by reference.
|
|
(b)
|
Exhibits.
See Item 15(a)(3).
|
|
(c)
|
Financial Statement Schedules.
See Item 15(a)(2).
|
101
SIGNATURES
Pursuant to the requirements of Section 13 or 15(d) of the Securities Exchange Act of 1934, the registrant has duly caused this report to be signed on its behalf by the undersigned, thereunto duly authorized, on February 23, 2011.
|
EQUIFAX INC.
(Registrant)
|
||
|
By:
|
/s/ RICHARD F. SMITH
|
|
|
Richard F. Smith
Chairman and Chief Executive Officer
|
We, the undersigned directors and executive officers of Equifax Inc., hereby severally constitute and appoint Lee Adrean, Nuala M. King and Chad R. Meyer, and each of them singly, our true and lawful attorneys with full power to them and each of them to sign for us, and in our names in the capacities indicated below, any and all amendments to this Annual Report on Form 10-K filed with the SEC, hereby ratifying and confirming our signatures as they may be signed by our said attorneys to any and all amendments to said Annual Report on Form 10-K.
Pursuant to the requirements of the Securities Exchange Act of 1934, this report has been signed below by the following persons on behalf of the registrant and in the capacities indicated on February 23, 2011.
|
/s/ RICHARD F. SMITH
|
|
Richard F. Smith
Director, Chairman and Chief Executive Officer
(Principal Executive Officer)
|
|
/s/ LEE ADREAN
|
|
Lee Adrean
Corporate Vice President and Chief Financial Officer
(Principal Financial Officer)
|
|
/s/ NUALA M. KING
|
|
Nuala M. King
Senior Vice President and Corporate Controller
(Principal Accounting Officer)
|
|
/s/ JAMES E. COPELAND, JR.
|
|
James E. Copeland, Jr.
Director
|
102
|
/s/ ROBERT D. DALEO
|
|
Robert D. Daleo
|
|
Director
|
|
/s/ WALTER W. DRIVER, JR.
|
|
Walter W. Driver, Jr.
Director
|
|
/s/ MARK L. FEIDLER
|
|
Mark L. Feidler
Director
|
|
/s/ L. PHILLIP HUMANN
|
|
L. Phillip Humann
Director
|
|
/s/ SIRI S. MARSHALL
|
|
Siri S. Marshall
Director
|
|
/s/ JOHN A. MCKINLEY
|
|
John A. McKinley
Director
|
|
/s/ MARK B. TEMPLETON
|
|
Mark B. Templeton
Director
|
103
2010 Form 10-K
EXHIBIT INDEX
|
Exhibit Number
|
Description
|
||
|
|
|
Articles of Incorporation and Bylaws
|
|
|
3.1
|
Amended and Restated Articles of Incorporation of Equifax Inc. (incorporated by reference to Exhibit 3.1 to Equifax's Form 8-K filed May 14, 2009).
|
||
|
3.2
|
Amended and Restated Bylaws of Equifax Inc. (incorporated by reference to Exhibit 3.1 to Equifax's Form 8-K filed December 1, 2010).
|
||
|
|
|
Instruments Defining the Rights of Security Holders, Including Indentures
|
|
|
4.1
|
Amended and Restated Rights Agreement dated as of October 14, 2005, between Equifax Inc. and SunTrust Bank, as Rights Agent, which includes as Exhibit A the form of Rights Certificate and as Exhibit B the Summary of Rights (incorporated by reference to Exhibit 4.1 to Equifax's Form 8-K filed on October 18, 2005).
|
||
|
4.2
|
Indenture dated as of June 29, 1998, between Equifax Inc. and The First National Bank of Chicago, Trustee (the “1998 Indenture”)(under which Equifax's 6.9% Debentures due 2028 were issued) (incorporated by reference to Exhibit 4.4 to Equifax's Form 10-K filed March 31, 1999).
|
||
|
4.3
|
First Supplemental Indenture dated as of June 28, 2007, between Equifax Inc. and The Bank of New York Trust Company, N.A. (under which Equifax's 6.30% Senior Notes due 2017 were issued), to the 1998 Indenture (incorporated by reference to Exhibit 4.1 to Equifax's Form 8-K filed June 29, 2007).
|
||
|
4.4
|
Second Supplemental Indenture dated as of June 28, 2007, between Equifax Inc. and The Bank of New York Trust Company, N.A. (under which Equifax's 7.00% Senior Notes due 2037 were issued), to the 1998 Indenture (incorporated by reference to Exhibit 4.1 to Equifax's Form 8-K filed June 29, 2007).
|
||
|
4.5
|
Third Supplemental Indenture dated as of November 9, 2009, between Equifax Inc. and The Bank of New York Mellon Trust Company, N.A. (under which Equifax’s 4.450% Senior Notes due 2014 were issued), to the 1998 Indenture (incorporated by reference to Exhibit 4.2 to Equifax's Form 8-K filed November 5, 2009).
|
||
|
4.6
|
** |
Second Amended and Restated Credit Agreement dated as of February 18, 2011, among Equifax Inc., Equifax Limited, Equifax Canada Inc., Equifax Luxembourg S.A.R.L., the Lenders named therein and Bank of America, N.A. as Administrative Agent.
|
|
|
4.7
|
Note Purchase Agreement dated as of May 25, 2006, among TALX Corporation and the Purchasers named therein (the “TALX Note Purchase Agreement”)(TALX Corporation Senior Guaranteed Notes due 2014) (including as Exhibit 1 the form of Senior Guaranteed Note due 2014) (incorporated by reference to Exhibit 4.1 to Equifax's Form 10-Q filed August 1, 2007).
|
||
|
4.8
|
Amendment Agreement dated as of May 15, 2007, among Equifax Inc., TALX Corporation and the Purchasers named therein (including form of Equifax Inc. parent guaranty), to the TALX Note Purchase Agreement (TALX Corporation Senior Guaranteed Notes due 2014) (incorporated by reference to Exhibit 4.2 to Equifax's Form 10-Q filed August 1, 2007).
|
||
|
|
Except as set forth in the preceding Exhibits 4.1 through 4.8, instruments defining the rights of holders of long-term debt securities of Equifax have been omitted where the total amount of securities authorized does not exceed 10% of the total assets of Equifax and its subsidiaries on a consolidated basis. Equifax agrees to furnish to the SEC, upon request, a copy of such instruments with respect to issuances of long-term debt of Equifax and its subsidiaries.
|
104
|
|
|
Management Contracts and Compensatory Plans or Arrangements
|
|
|
10.1
|
Form of Director/Executive Officer Indemnification Agreement (incorporated by reference to Exhibit 10.1 to Equifax’s Form 8-K dated May 14, 2009).
|
||
|
10.2
|
Form of New Change in Control Agreement (Tier I or Tier II) (incorporated by reference to Exhibit 10.3 to Equifax’s Form 8-K filed September 26, 2008).
|
||
|
10.3
|
Equifax Inc. 2008 Omnibus Incentive Plan (incorporated by reference to Exhibit 10.1 to Equifax’s Form 10-Q filed July 29, 2008).
|
||
|
10.4
|
Equifax Inc. Non-Employee Director Stock Option Plan and Form of Non-Employee Director Stock Option Agreement (incorporated by reference to Exhibit 10.16 to Equifax’s Form 10-K filed March 31, 1999).
|
||
|
10.5
|
Equifax Inc. Supplemental Executive Retirement Plan (incorporated by reference to Exhibit 10.7 to Equifax’s Form 10-K filed March 29, 2001).
|
||
|
10.6
|
Supplemental Retirement Plan for Executives of Equifax Inc. (incorporated by reference to Exhibit 10.1 to Equifax’s Form 8-K filed November 15, 2004).
|
||
|
10.7
|
Equifax Inc. Executive Life and Supplemental Retirement Benefit Plan (incorporated by reference to Exhibit 10.8 to Equifax’s Form 10-K filed March 29, 2001).
|
||
|
10.8
|
Equifax Inc. Key Management Long-Term Incentive Plan, as amended and restated effective as of January 1, 2006 (incorporated by reference to Appendix A to Equifax’s definitive proxy statement on Schedule 14A filed April 12, 2006).
|
||
|
10.9
|
**
|
Form of Non-Qualified Stock Option Agreement under the Equifax Inc. 2008 Omnibus Incentive Plan (incorporated by reference to Exhibit 10.8 to Equifax’s Form 10-K filed February 26, 2009).
|
|
|
10.10
|
**
|
Form of Deferred Share Award Agreement (restricted stock units) under the Equifax Inc. 2008 Omnibus Incentive Plan (incorporated by reference to Exhibit 10.9 to Equifax’s Form 10-K filed February 26, 2009).
|
|
|
10.11
|
Equifax Inc. 2008 Omnibus Incentive Plan (U.K. Sub-Plan for U.K. Participants) (incorporated by reference to Exhibit 10.10 to Equifax’s Form 10-K filed February 26, 2009).
|
||
|
10.12
|
Form of Non-Qualified Stock Option Agreement under the Equifax Inc. 2008 Omnibus Incentive Plan (U.K. approved option version) (incorporated by reference to Exhibit 10.11 to Equifax’s Form 10-K filed February 26, 2009).
|
||
|
10.13
|
Form of Non-Qualified Stock Option Agreement under the Equifax Inc. 2008 Omnibus Incentive Plan (U.K. unapproved option version) (incorporated by reference to Exhibit 10.12 to Equifax’s Form 10-K filed February 26, 2009).
|
||
|
10.14
|
Equifax Inc. Executive Deferred Compensation Plan, as amended through December 31, 2008 (incorporated by reference to Exhibit 10.13 to Equifax’s Form 10-K filed February 26, 2009).
|
||
|
10.15
|
Equifax Inc. Director Deferred Compensation Plan, as amended through December 31, 2008 (incorporated by reference to Exhibit 10.14 to Equifax’s Form 10-K filed February 26, 2009).
|
||
|
10.16
|
Equifax Grantor Trust dated as of January 1, 2003, between Equifax Inc. and Wachovia Bank, N.A., Trustee, relating to supplemental deferred compensation and phantom stock benefits (incorporated by reference to Exhibit 10.30 to Equifax’s Form 10-K filed March 28, 2003).
|
||
|
10.17
|
Equifax Inc. Director and Executive Stock Deferral Plan, as amended through December 31, 2008 (incorporated by reference to Exhibit 10.16 to Equifax’s Form 10-K filed February 26, 2009).
|
||
|
10.18
|
Form of Director Deferred Share Award Agreement, as amended through December 31, 2008 (incorporated by reference to Exhibit 10.17 to Equifax’s Form 10-K filed February 26, 2009).
|
||
|
10.19
|
Summary of Annual Incentive Plan (incorporated by reference to Exhibit 10.32 to Equifax’s Form 10-K filed on March 16, 2005).
|
||
|
10.20
|
Summary of Non-Employee Director Compensation (incorporated by reference to Exhibit 10.20 to Equifax’s Form 10-K filed February 23, 2010).
|
||
|
10.21
|
Amended and Restated Employment Agreement dated as of September 23, 2008, between Equifax Inc. and Richard F. Smith (incorporated by reference to Exhibit 10.1 to Equifax’s Form 8-K filed September 26, 2008).
|
105
|
|
10.22
|
|
Deferred Share Award Agreement dated as of September 19, 2005, between Equifax Inc. and Richard F. Smith (incorporated by reference to Exhibit 10.2 to Equifax’s Form 10-Q filed November 7, 2005).
|
|
10.23
|
Employment Agreement dated September 1, 1996, and Modification of Employment Agreement dated February 1, 2007, between TALX Corporation and William W. Canfield (incorporated by reference to Exhibit 10.9 to Equifax’s Form 10-Q filed August 1, 2007).
|
||
|
10.24
|
Amendment to Employment Agreement dated September 23, 2008, between TALX Corporation and William W. Canfield (incorporated by reference to Exhibit 10.2 to Equifax’s Form 8-K filed September 26, 2008).
|
||
|
10.25
|
First Amendment to and Complete Restatement of TALX Split-Dollar Agreements and Related Insurance Agreements, dated March 31, 1999, among TALX Corporation, William W. Canfield, and Thomas M. Canfield and James W. Canfield, Trustees of the Canfield Family Irrevocable Insurance Trust U/A March 31, 1993 (incorporated by reference to Exhibit 10.10 to Equifax’s Form 10-Q filed August 1, 2007).
|
||
|
Material Contracts
|
|||
|
10.26
|
Agreement for Computerized Credit Reporting Services and Options to Purchase and Sell Assets dated as of August 1, 1988, among The Credit Bureau, Incorporated of Georgia, Equifax Inc., Computer Sciences Corporation, CSC Credit Services, Inc., Credit Bureau of Greater Cincinnati, Inc., Credit Bureau of Greater Kansas City, Inc., Johns Holding Company, CSC Credit Services of Minnesota, Inc. and CSC Accounts Management, Inc. (incorporated by reference to Exhibit 10.18 to Equifax’s Form 10-K filed March 30, 2000).
|
||
|
10.27
|
First through Third Amendments dated as of December 28, 1990, 1991 and September 27, 1991, respectively, to Agreement for Computerized Credit Reporting Services and Options to Purchase and Sell Assets (incorporated by reference to Exhibit 10.26 to Equifax’s Form 10-K filed March 31, 1997).
|
||
|
10.28
|
Fourth Amendment dated as of December 31, 1992 to Agreement for Computerized Services and Options to Purchase and Sell Assets (incorporated by reference to pages 8 through 16 and Exhibit 4.1 to Amendment No. 1 to Form S-3, Registration Statement No. 33-62820 filed June 17, 1993).
|
||
|
10.29
|
Fifth Amendment dated as of September 7, 1993 to Agreement for Computerized Credit Reporting Services and Options to Purchase and Sell Assets (incorporated by reference to Exhibit 10.21 to Equifax’s Form 10-K filed March 30, 2000).
|
||
|
10.30
|
Sixth Amendment dated as of 1994 to Agreement for Computerized Credit Reporting Services and Options to Purchase and Sell Assets (incorporated by reference to Exhibit 10.25 to Equifax’s Form 10-K filed March 30, 1995).
|
||
|
10.31
|
Purchase and Sale Agreement dated as of June 28, 2007, between Equifax Inc. and First Chicago Leasing Corporation related to Equifax’s purchase of the JV White Technology Center (incorporated by reference to Exhibit 10.1 to Equifax’s Form 8-K filed July 3, 2007).
|
||
|
10.32
|
Ground Lease Agreement dated as of March 5, 1998, between Rhodes Center Property, L.L.C. and Equifax Inc. related to lease of Equifax’s corporate headquarters (incorporated by reference to Exhibit 10.29 to Equifax’s Form 10-K filed March 31, 1999).
|
||
|
10.33
|
*
|
Agreement for Operations Support dated as of July 1, 2003, between International Business Machines Corporation and Equifax Inc. (incorporated by reference to Exhibit 10.1 to Equifax’s Form 10-Q/A filed April 29, 2004).
|
|
|
10.34
|
Commercial Paper Dealer Agreement dated May 22, 2007, between Equifax Inc. and Banc of America Securities LLC (incorporated by reference to Exhibit 10.1 to Equifax’s Form 8-K filed May 23, 2007).
|
||
|
10.35
|
Commercial Paper Dealer Agreement dated May 22, 2007, between Equifax Inc. and SunTrust Capital Markets Securities, Inc. (incorporated by reference to Exhibit 10.2 to Equifax’s Form 8-K filed May 23, 2007).
|
||
|
Other Exhibits and Certifications
|
|||
|
11.1
|
Calculation of earnings per share. (The calculation of earnings per share is in Part II, Item 8, Note 1 to the Consolidated Financial Statements and is omitted in accordance with Section (b)(11) of Item 601 of the Notes to Regulation S-K).
|
106
|
|
14.1
|
**
|
Code of Ethics (The Equifax Business Ethics and Compliance Program).
|
|
21.1
|
**
|
Subsidiaries of Equifax Inc.
|
|
|
23.1
|
**
|
Consent of Independent Registered Public Accounting Firm.
|
|
|
24.1
|
**
|
Powers of Attorney (included on signature page).
|
|
|
31.1
|
**
|
Rule 13a-14(a) Certification of Chief Executive Officer.
|
|
|
31.2
|
**
|
Rule 13a-14(a) Certification of Chief Financial Officer.
|
|
|
32.1
|
**
|
Section 1350 Certification of Chief Executive Officer.
|
|
|
32.2
|
**
|
Section 1350 Certification of Chief Financial Officer.
|
* Document omits information pursuant to a Request for Confidential Treatment under Rule 406 of the Securities Act of 1933 which has been granted by the SEC. Omitted portions have been filed separately with the SEC.
** Filed herewith.
107
SCHEDULE II — VALUATION AND QUALIFYING ACCOUNTS
2010
|
Column
A
|
Column
B
|
Column
C
|
Column
D
|
Column
E
|
||||||||||||||||
|
Additions
|
||||||||||||||||||||
|
Balance at
|
Charged to
|
Charged to
|
Balance at
|
|||||||||||||||||
|
Beginning
|
Costs and
|
Other
|
End of
|
|||||||||||||||||
|
Description
|
of Period
|
Expenses
|
Accounts
|
Deductions
|
Period
|
|||||||||||||||
|
(In millions)
|
||||||||||||||||||||
|
Reserves deducted in the balance sheet from the
assets to which they apply:
|
||||||||||||||||||||
|
Trade accounts receivable
|
$ | 15.1 | $ | (0.4 | ) | $ | - | $ | (7.2 | ) | $ | 7.5 | ||||||||
|
Deferred income tax asset valuation allowance
|
31.7 | 1.2 | 59.8 | (5.5 | ) | 87.2 | ||||||||||||||
| $ | 46.8 | $ | 0.8 | $ | 59.8 | $ | (12.7 | ) | $ | 94.7 | ||||||||||
2009
|
Column
A
|
Column
B
|
Column
C
|
Column
D
|
Column
E
|
||||||||||||||||
|
Additions
|
||||||||||||||||||||
|
Balance at
|
Charged to
|
Charged to
|
Balance at
|
|||||||||||||||||
|
Beginning
|
Costs and
|
Other
|
End of
|
|||||||||||||||||
|
Description
|
of Period
|
Expenses
|
Accounts
|
Deductions
|
Period
|
|||||||||||||||
|
(In millions)
|
||||||||||||||||||||
|
Reserves deducted in the balance sheet from the
assets to which they apply:
|
||||||||||||||||||||
|
Trade accounts receivable
|
$ | 14.5 | $ | 7.6 | $ | - | $ | (7.0 | ) | $ | 15.1 | |||||||||
|
Deferred income tax asset valuation allowance
|
37.8 | 2.0 | 6.8 | (14.9 | ) | 31.7 | ||||||||||||||
| $ | 52.3 | $ | 9.6 | $ | 6.8 | $ | (21.9 | ) | $ | 46.8 | ||||||||||
2008
|
Column
A
|
Column
B
|
Column
C
|
Column
D
|
Column
E
|
||||||||||||||||
|
Additions
|
||||||||||||||||||||
|
Balance at
|
Charged to
|
Charged to
|
Balance at
|
|||||||||||||||||
|
Beginning
|
Costs and
|
Other
|
End of
|
|||||||||||||||||
|
Description
|
of Period
|
Expenses
|
Accounts
|
Deductions
|
Period
|
|||||||||||||||
|
(In millions)
|
||||||||||||||||||||
|
Reserves deducted in the balance sheet from the
assets to which they apply:
|
||||||||||||||||||||
|
Trade accounts receivable
|
$ | 8.9 | $ | 11.0 | $ | - | $ | (5.4 | ) | $ | 14.5 | |||||||||
|
Deferred income tax asset valuation allowance
|
52.6 | 0.2 | 2.2 | (17.2 | ) | 37.8 | ||||||||||||||
| $ | 61.5 | $ | 11.2 | $ | 2.2 | $ | (22.6 | ) | $ | 52.3 | ||||||||||
108
TABLE OF CONTENTS
Part IItem 1. BusinessItem 1A. Risk FactorsItem 1B. Unresolved Staff CommentsItem 2. PropertiesItem 3. Legal ProceedingsItem 4. Submission Of Matters To A Vote Of Security HoldersPart IIItem 5. Market For The Registrant S Common Equity, Related Stockholder Matters and Issuer Purchases Of Equity SecuritiesItem 5. Market For The Registrant SItem 6. Selected Financial DataItem 7. Management S Discussion and Analysis Of Financial Condition and Results Of OperationsItem 7A. Quantitative and Qualitative Disclosures About Market RiskItem 8. Financial Statements and Supplementary DataItem 9. Changes in and Disagreements with Accountants on Accounting and Financial DisclosureItem 9A. Controls and ProceduresPart IIIItem 10. Directors, Executive Officers and Corporate GovernanceItem 11. Executive CompensationItem 12. Security Ownership Of Certain Beneficial Owners and Management and Related Stockholder MattersItem 13. Certain Relationships and Related Transactions, and Director IndependenceItem 14. Principal Accountant Fees and ServicesPart IVItem 15. Exhibits and