8X8 INC /DE/
10-Ks and 10-Qs
|
|
|
|
|
|
|
|
|
|
|
|
|
|
|
|
|
|
|
|
|
|
|
|
|
|
|
|
|
|
|
|
|
|
|
|
|
|
|
|
|
|
|
|
|
|
|
|
|
|
UNITED STATES
SECURITIES AND EXCHANGE COMMISSION
Washington, D.C. 20549
FORM 10-K
[X] ANNUAL REPORT PURSUANT TO SECTION 13 OR 15(d) OF THE SECURITIES EXCHANGE ACT OF 1934
For the fiscal year ended
March 31, 2019
Commission file number 000-21783

8x8, Inc.
(Exact name of Registrant as Specified in its Charter)
|
Delaware
|
77-0142404
|
|
(State or Other Jurisdiction of Incorporation or Organization)
|
(I.R.S. Employer Identification Number)
|
2125 O'Nel Drive
San Jose, CA 95131
(Address of Principal Executive Offices including Zip Code)
(408) 727-1885
(Registrant's Telephone Number, Including Area Code)
Securities registered pursuant to Section 12(b) of the Act:
|
Title of each class
Common Stock, Par Value $.001 Per Share
|
Trading Symbol
EGHT
|
Name of each exchange on which registered
New York Stock Exchange
|
Securities registered pursuant to Section 12(g) of the Act: None
Indicate by check mark if the registrant is a well-known seasoned issuer, as defined in Rule 405 of the Securities Act. YES
ý
NO
¨
Indicate by check mark if the registrant is not required to file reports pursuant to Section 13 or Section 15(d) of the Act. YES
¨
NO
ý
Indicate by check mark whether the registrant (1) has filed all reports required to be filed by Section 13 or 15 (d) of the Securities Exchange Act of 1934 during the preceding 12 months (or for such shorter period that the registrant was required to file reports), and (2) has been subject to such filing requirements for the past 90 days. YES
ý
NO
¨
Indicate by check mark whether the registrant has submitted electronically every Interactive Data File required to be submitted pursuant to Rule 405 of Regulation S-T (§232.405 of this chapter) during the preceding 12 months (or for such shorter period that the registrant was required to submit such files). YES
ý
NO
¨
Indicate by check mark if disclosure of delinquent filers pursuant to Item 405 of Regulation S-K is not contained herein, and will not be contained, to the best of registrant's knowledge, in definitive proxy or information statements incorporated by reference in Part III of this Form 10-K, or any amendment to this Form 10-K.
¨
Indicate by check mark whether the registrant is a large accelerated filer, an accelerated filer, a non-accelerated filer, a smaller reporting company or an emerging growth company. See definitions of "large accelerated filer," "accelerated filer," "smaller reporting company" and "emerging growth company" in Rule 12b-2 of the Exchange Act.
|
Large accelerated filer
x
|
Accelerated filer
¨
|
Non-accelerated filer
¨
|
Smaller reporting company
¨
|
Emerging growth company
¨
|
If an emerging growth company, indicate by check mark if the registrant has elected not to use the extended transition period for complying with any new or revised financial accounting standards provided pursuant to Section 13(a) of the Exchange Act.
¨
Indicate by check mark whether the registrant is a shell company (as defined in Rule 12b-2 of the Act).
YES
¨
NO
ý
Based on the closing sale price of the Registrant's common stock on the New York Stock Exchange on September 30, 2018, the aggregate market value of the voting stock held by non-affiliates of the Registrant was approximately $2.0 billion. For purposes of this disclosure, shares of common stock held by officers and directors of the Registrant, and any beneficial owners of more than 5% of the outstanding shares of common stock that the Registrant believes may be affiliates, have been excluded as shares that might be deemed to be held by affiliates. The determination of affiliate status for this purpose is not necessarily a conclusive determination for any other purpose.
The number of shares of the Registrant's common stock outstanding as of
May 16, 2019
was 96,287,366.
DOCUMENTS INCORPORATED BY REFERENCE
Items 10, 11, 12, 13 and 14 of Part III incorporate information by reference from the Proxy Statement to be filed within 120 days of March 31,
2019
for the
2019
Annual Meeting of Stockholders.
8X8, INC.
INDEX TO
ANNUAL REPORT ON FORM 10-K
FOR THE YEAR ENDED MARCH 31,
2019
|
Page
|
||
PART I
Forward-Looking Statements and Risk Factors
Statements contained in this annual report on Form 10-K, or Annual Report, regarding our expectations, beliefs, estimates, intentions or strategies are forward-looking statements within the meaning of Section 27A of the Securities Act of 1933 and Section 21E of the Securities Exchange Act of 1934. Any statements contained herein that are not statements of historical fact may be deemed to be forward-looking statements. For example, words such as "may," "will," "should," "estimates," "predicts," "potential," "continue," "strategy," "believes," "anticipates," "plans," "expects," "intends," and similar expressions are intended to identify forward-looking statements. You should not place undue reliance on these forward-looking statements. Actual results and trends may differ materially from historical results and those projected in any such forward-looking statements depending on a variety of factors. These factors include, but are not limited to:
|
•
|
market acceptance of new or existing services and features,
|
|
•
|
customer acceptance and demand for our cloud communication and collaboration services,
|
|
•
|
changes in the competitive dynamics of the markets in which we compete,
|
|
•
|
the quality and reliability of our services,
|
|
•
|
customer cancellations and rate of churn,
|
|
•
|
our ability to scale our business,
|
|
•
|
customer acquisition costs,
|
|
•
|
our reliance on infrastructure of third-party network services providers,
|
|
•
|
risk of failure in our physical infrastructure,
|
|
•
|
risk of failure of our software,
|
|
•
|
our ability to maintain the compatibility of our software with third-party applications and mobile platforms,
|
|
•
|
continued compliance with industry standards and regulatory requirements in the United States and foreign countries in which we make our software solutions available, and the costs of such compliance,
|
|
•
|
risks relating to our strategies and objectives for future operations, including the execution of integration plans and realization of the expected benefits of our acquisitions,
|
|
•
|
the amount and timing of costs associated with recruiting, training and integrating new employees,
|
|
•
|
timing and extent of improvements in operating results from increased spending in marketing, sales, and research and development,
|
|
•
|
introduction and adoption of our cloud software solutions in markets outside of the United States,
|
|
•
|
risk of cybersecurity breaches,
|
|
•
|
risks related to our senior convertible notes and the related capped call transactions,
|
|
•
|
general economic conditions that could adversely affect our business and operating results,
|
|
•
|
implementation and effects of new accounting standards and policies in our reported financial results, and
|
|
•
|
potential future intellectual property infringement claims and other litigation that could adversely effect our business and operating results.
|
The forward-looking statements may also be impacted by the additional risks faced by us as described in this Annual Report, including those set forth under the section entitled "Risk Factors." All forward-looking statements included in this Annual Report are based on information available to us on the date hereof, and we assume no obligation to update any such forward-looking statements. Readers are urged to carefully review and consider the various disclosures made in this Annual Report, which attempts to advise interested parties of the risks and factors that may affect our business, financial condition, results of operations and prospects.
Our fiscal year ends on March 31 of each calendar year. Each reference to a fiscal year in this Annual Report, refers to the fiscal year ended March 31 of the calendar year indicated (for example, fiscal
2019
refers to the fiscal year ended
March 31, 2019
). Unless the context requires otherwise, references to "we," "us," "our," "8x8" and the "Company" refer to 8x8, Inc. and its consolidated subsidiaries.
ITEM 1. BUSINESS
Overview
8x8 is a leading cloud provider of enterprise Software-as-a-Service (SaaS) communications solutions, that enable businesses of all sizes to communicate faster and smarter across voice, video meetings, chat and contact centers, transforming both employee and customer experiences with communications that work simply, integrate seamlessly, and perform reliably. From one proprietary cloud technology platform, customers have access to unified communications, team collaboration, video conferencing, contact center, data and analytics and other services.
2
We believe that 8x8 is emerging from being the industry’s best kept secret. Unlike our cloud communication competitors, 8x8 owns its complete technology stack, built over twenty years of company investment and supported by over 170 technology patents. Our cloud communications and collaboration solutions are designed for easy deployment, management, and use, operating across multiple devices and locations for any business workflow or global environment. Built from core cloud technologies that we own and manage internally, our solution enables 8x8 customers to rely on one provider for their global communications, video meetings, contact center and customer support requirements.
The 8x8 technology platform provides customers with key technology integrations within their existing infrastructure. Companies are looking to increase their competitive edge by integrating their communications with Enterprise Resource Planning (ERP), Customer Relationship Management (CRM), Human Capital Management (HCM) applications, and other back-office IT (information technology) systems within their infrastructure. Further complicating matters, business users are circumventing their IT departments by using a variety of self-selected third-party tools for team communication and collaboration, driving a shift in the buying center for communications and collaboration from IT to individuals, a phenomenon known in the industry as "shadow IT." 8x8 integrates across CRM/ERP (such as Netsuite or Bullhorn), service and support (such as Zendesk or Salesforce sales cloud), and other productivity/collaboration tools (slack or G-suite, for example), providing seamless access, unified analytics, and business flexibility to 8x8 customers. This is supported by 8x8 through its data security and compliance certifications, including HIPAA, FISMA and ISO 27001,which meet or exceed the requirements of government and industry agencies around the world.
Many other legacy business processes have already experienced the move to the cloud phenomenon. Examples include companies using legacy front office applications switching to cloud providers like Salesforce.com, Inc., or the use of IT management applications migrating to industry disruptors such as Servicenow, Inc. Business communications applications are following suit as the next major business segment to migrate to the cloud. Businesses today face increasing cost and complexity with deployments of communications and collaboration solutions. Companies of all sizes are managing a global, distributed workforce that seeks to leverage multiple forms of communication in their day-to-day interactions. The rapid rise of mobile devices in the enterprise has created demand for bring-your-own-device (BYOD) integration as part of a typical business' communications needs. We believe that 8x8 is an industry disruptor (in the same vein as Salesforce was for front office applications or Servicenow was for IT applications), across three large markets: unified communications, video meeting solutions, and contact center applications. Our platform, which offers capabilities and functionality across all three areas in one integrated technology stack provides a complete cloud offering that enhances productivity and business insight. Combining these services allows our customers to eliminate information silos and expose vital, real-time communications data spanning multiple services, applications and devices which, in turn, can improve productivity, business performance and customer experience.
Traditionally, small businesses were the first to transition their communications to the cloud starting several years ago, due to cost effectiveness, ease of deployment and inherent flexibility. Mid-market and Enterprise sized companies that have adopted cloud-based solutions for other applications and processes are increasingly looking to modernize their communications in a similar fashion. We believe this adoption is being driven by the convergence of several market trends, including the increasing costs of maintaining installed legacy communications systems; the fragmentation resulting from varied use of multiple on-premises systems or point cloud solutions, which has worsened as workforces have become more distributed and international; and the proliferation of personal mobile devices in the workplace.
We have more than 1 million business users. Our customers are spread across more than 150 countries and range from small businesses to large enterprises with more than 10,000 employees. In recent years, we have increased our focus on the mid-market and enterprise customer sectors. In fiscal 2019, we experienced consistent top line revenue growth and the majority of our accelerated service revenue growth from customers of these business sizes.
3
The 8x8 Solution
We offer a highly scalable and configurable cloud communications platform comprising voice, video meetings, chat and team collaboration, contact center, and analytics for businesses of all sizes across the globe. With voice, video conferencing, team messaging and contact center integrated as one platform, customers can start out with just phone service and then roll out the additional capabilities when ready. The key attributes of the 8x8 solution include:
|
•
|
Communication, Meetings and Contact Center on One Cloud Technology Platform.
We believe that integration of solutions for communication and collaboration drives more efficient employee and customer engagement and greater business productivity. Unlike our principal competitors, we own the core technology and manage the platform behind all of our services: voice, video meetings, contact center and team collaboration. We believe having control over our entire platform enables us to deliver a more consistent and seamless experience for our customers across all aspects of the service — from the user interface, to the technical support experience. For example, our 8x8 team messaging technology helps our customers tear down information silos by providing instant access to all employees within a global directory and real-time interoperability among multiple third-party collaboration tools.
|
|
•
|
Big Data, Analytics, and Artificial Intelligence.
We have developed a suite of web-based analytics tools to help customers make informed decisions based on underlying communications data associated with 8x8 services and supported devices. We continue to make strategic investments in Artificial Intelligence (AI) and Machine Learning (ML) to develop new capabilities and features for our customers such as context-rich customer engagements, intelligent call routing and faster first-call resolution.
|
|
•
|
Global Reach®.
8x8's Global Reach® technology refers to our global strategy to provide enterprise-grade quality of service, reliability, security and support for our multinational customers. Our platform utilizes intelligent geo-routing technology and leverages 15 data centers across seven dispersed regions - United States, Canada, United Kingdom, Continental Europe, Asia, South America, and Australia - to provide consistently high call quality to customers worldwide. Our global footprint allows us to provide support 24 hours a day.
|
|
•
|
Integration with Third-Party Business Applications.
Our software uses a combination of open application program interfaces (APIs) and pre-built integrations to retrieve contextually relevant data from, and to enhance the functionality of, customers' third-party applications, including Salesforce, Microsoft Dynamics, Google, NetSuite, Zendesk, Oracle Sales Cloud, Bullhorn, and Hubspot.
|
|
•
|
Intuitive User Experience.
Our web, desktop and mobile interfaces act as the communications portal for all 8x8 services and provide customers with a familiar and consistent user experience across all endpoints.
|
|
•
|
Configurability.
Each service plan in our flagship offering, X Series, is designed for the different roles in a company so customers only pay for the features each role needs. No matter what the business communication needs are now, X Series has a service plan designed to meet them, while giving customers an easy way to expand their communications options in the future. The simplicity and ease of configuration and deployment is due to all solutions being owned by 8x8 and sharing the same platform.
|
|
•
|
Rapid Deployment.
Business agility in the global, modern economy is a competitive necessity, and we embrace the notion that communication services should be deployable as quickly as possible. Our services can generally be provisioned in minutes from web-based administrative tools. We continue to increase the automation across our customer bases for our provisioning, billing and other back systems to provide greater speed and flexibility in deployment for our customers. To ensure consistency and quality across our services and customer base, we have developed a standard, yet flexible, deployment methodology. We apply this systematic approach to all of our deployments, regardless of size or complexity.
|
|
•
|
Committed Service Quality over the Public Internet.
We currently offer our qualifying enterprise customers an "end-to-end" service level agreement (SLA), with meaningful uptime and voice quality commitments, backed by service credits and a no-penalty early termination right for the customer under specified conditions.
|
|
•
|
Emphasis on Security and Compliance.
We have invested heavily in achieving compliance with various industry standards for data security, and to obtain related third-party certifications. We believe we have created a top-down culture of security and compliance, including a commitment to secure architecture and development.
|
Our Strategy
We are committed to developing and delivering the most innovative, reliable, scalable and secure cloud communications software for global business communications. Our strategy is informed by evolving market dynamics and a broad market focus across all customer sectors, along with the unique attributes of our technology.
4
Key elements of our strategy include:
|
•
|
Selling and Supporting our 8x8 X Series Service Line.
We launched 8x8's latest service innovation, X Series, in July 2018 in the United States (US), and we have since rolled it out to the United Kingdom (UK) and Australia/New Zealand (ANZ) regions.
Exemplifying our vision of one cloud communications solution, X-Series is offered with flexible service plans that have increasingly powerful communication capabilities, from plans that simply provide a new phone system to more complete plans that combine traditionally segregated unified communications and contact center services into one comprehensive offering. We intend to continue investing in positioning, selling and supporting X-Series.
|
|
•
|
Providing Enterprise Grade Reliability.
We have invested in our software and software delivery infrastructure to provide a high-level of availability, reliability, security and compliance, and will continue to invest in this area. We intend to continue to expand our customer deployment and support capabilities, including our program management, professional services, and partner delivery capabilities, to meet the needs of customers.
|
|
•
|
Promoting the Benefits of Our Single Platform Solution.
We believe business communications solutions increasingly require a breadth of software capabilities, from a simple phone system with voice to hosting audio and video meetings to complex multi-channel contact center capabilities. We believe our ability to deliver a full spectrum of capabilities on one cloud platform from a single vendor is a competitive advantage, especially for larger customers. The one platform enables instant communication between employees, customers, sales and services with voice, video meetings, team messaging, and contact center, delivering a consistent user experience across desktop and mobile applications, reducing the ramp up time and accelerating the speed of business as well as easing the move to the cloud. By having a common set of interaction capabilities and information about how the business communicates with customers, partners, and employees, customers receive rapid insights into the real-time and historical intelligence of their business, allowing them to improve their customer, partner, and employee experience. We plan to continue expanding these services within our platform, including extending our contact center capabilities, advancing our video meetings solutions, adding deeper collaboration services, and bringing to market an increasing number of analytics-driven features beyond the quality management and speech analytics tools brought to market in fiscal year 2020.
|
|
•
|
Expanding our Global Footprint.
As more and more businesses establish international operations, we believe companies will view traditional communication solutions bridging multiple geographies and carrier networks as cumbersome and expensive. We will continue to focus on expanding our ability to effectively and efficiently deliver our services into the countries and regions we currently serve. In addition, we plan to continue expanding the distribution of our services into new countries through a combination of organic growth, regional acquisitions, and channel partners.
|
|
•
|
Acquiring Strategic Assets.
We intend to identify, acquire and integrate strategic technologies, assets and businesses to expand the breadth and adoption of our cloud software offerings and drive growth, both domestically and internationally.
|
Our Services
Powered by one fully owned technology stack, 8x8's solutions serve businesses of all sizes, and can be readily configured to serve large, globally distributed enterprise customers. All of our core software components work together and can be combined into different bundles depending on the business needs of our customers.
Over the course of fiscal 2019, we offered a variety of stand alone services and offerings:
|
•
|
8x8 Virtual Office
is a self-contained, feature rich, end-to-end solution that delivers high quality voice and unified communications-as-a-service globally.
|
|
•
|
8x8 Contact Center
is a multi-channel cloud-based contact center solution that enables both large and small contact centers to enjoy the same customer experience and agent productivity benefits previously available only to large contact centers at a much higher cost.
|
|
•
|
8x8 Meetings
is a cloud-based video conferencing and collaboration solution that enables secure, continuous collaboration with borderless high definition (HD) video and audio communications from mobile and desktop devices anywhere in the world.
|
|
•
|
8x8 Team Messaging
is an integrated open team messaging platform to facilitate modern modes of communication with support for direct messages, public and private team messaging rooms, short messaging service (SMS), presence, emojis, and “@ mentions,” i.e. embedded links directed at named users. With the team messaging technology, our customers can collaborate across more than twenty disparate team messaging solutions.
|
|
•
|
Script8
®
(Scripting Engine)
is a dynamic communications flow and routing engine that offers a scripting environment for intelligently routing communications data for specific workflows. Script8 allows end-users to create
|
5
simple, personalized and customizable communications experiences, including communications control, external data source integration and intelligent routing.
8x8 SX Series
The capabilities of these stand-alone services are integrated into a comprehensive offering called 8x8 X Series. We began releasing integrated service suites during our fiscal 2018 with offerings such as Virtual Office X8 Editions. During fiscal 2019, we accelerated the transition by delivering the X Series platform and driving adoption to more than 10,000 new customers. X Series service plans are designed so customers pay for only those capabilities the business needs
.
Designated X1 through X8, we offer the following service plans and capabilities in the 8x8 X Series:
|
•
|
X1 through X4
provide enterprise-grade voice, unified communications, video meetings and team collaboration functionality. Delivered from a single platform, these service plans provide more than just PBX replacement by offering one application for business voice, team messaging and meetings so that employees can quickly, easily and with just one click move from a chat message to a phone call to a video conference. Users can access the essential communication and collaboration features through the desktop app, mobile app or a desk phone. As a business grows, the details and features of plans can be mapped to business needs such as a lobby or store floor, a global caller organization, or to supervisor/analyst requirements. Features expected by demanding communications and collaboration customers today, such as auto attendants; worldwide extension dialing; corporate directory with click-to-call functionality; presence, messaging and chat; call recording; call monitoring; internet fax; and the ability to interact contextually with inbound communication (email, call or chat) can be mixed and matched for customizable packages fit for business to most effectively meet the needs of individual users.
|
|
•
|
X5 through X8
generally provide the features of X1 through X4, plus contact center functionality. These service plans deliver employee experience and deep customer engagement through integrated cloud communication, contact center software and video meetings solutions. Whether the customer is managing a startup or a large enterprise, 8x8 X Series provides the communication capabilities that contact center agents need to respond faster using instant access to relevant information and subject matter experts. Designed to ensure that customers pay for only the requirements needed, there are four X Series Cloud Contact Center service plans: the Voice-Focused Contact Center with Predictive Dialer Plan; the Voice-Focused Contact Center with Advanced Reporting Plan; the Multichannel Contact Center with Advanced Reporting Plan; and the Multichannel Contact Center with Advanced Analytics and Predictive Dialer Plan, inclusive of quality management, speech analytics, and outbound predictive AI dialer.
|
The result is a communication, meeting, and contact center engagement platform that enables businesses to move at the speed of employee and customer expectations, leading to less churn and more revenue.
Our Technology
We introduced our first communications SaaS offering in 2002, and have since heavily invested in expanding our platform, solutions, features and capabilities. Our services are powered by internally-owned and operated technologies and are delivered to our customers from our micro services based cloud communications platform. We hold more than 170 United States patents covering a variety of voice and video communications, signaling, processing, analytics, and storage technologies. Many of our current patents apply to the communications software used in our various SaaS solutions.
We developed our Global Reach patented technology with the goal of ensuring that 8x8 voice communications, placed or received anywhere on the globe on any compatible device, can have the same consistent quality as a local call within a single area code. Many hosted Voice over Internet Protocol (VoIP) solutions route call data through the same, predetermined data center, regardless of the physical or geographic location of callers. By contrast, when an end-user makes a call using our solution, our patented technology seeks out the closest data center to the caller's location, subject to service quality, security and data sovereignty considerations. We call this "geo-routing." Our proprietary technologies take into account current Internet and carrier network conditions and determine the best route virtually instantaneously, ensuring that latency is minimized within the available routing options.
Our software solutions provide mission critical services to our business customers. Therefore, we have developed technologies and cloud native architectures that ensure high reliability and uptime of our services.
We believe one of the key areas that differentiates 8x8 from our competitors is the quality of our real-time service delivery over the public Internet. Real-time voice is perhaps the most difficult application to be delivered over the public Internet as there is no time for retransmission and there is little buffering that can be done without impacting the quality of a real-time
6
conversation. As such, quality of the connection well beyond just the available bandwidth is the most important element of service delivery for VoIP. By having diverse routes and connectivity as well as full and granular Border Gateway Protocol (BGP) control over these connections, 8x8 is constantly inspecting the state of the Internet to optimize our service delivery to customers.
In addition, we have instrumented hundreds of thousands of 8x8 endpoints to provide details of quality of connection information at the end of each call to 8x8's internal network operations big data environment. The results of data analytics over this data set is used by our operations and support teams to optimize the delivery of the service as well as reduce impact of carrier outages on our customers. This is possible due to our full control over the core networking stack and the transit connections in our data centers.
Furthermore, we have been leveraging public cloud infrastructure services such as Amazon Web Service (AWS) and Google Cloud Platform (GCP) as an important part of our infrastructure expansion strategy to increase the velocity of innovation and value delivery to our customers. This is done by taking advantage of the elasticity and power of Infrastructure as a Service (IaaS) as well as artificial intelligence/machine learning capabilities of AWS and GCP for many of our microservices and services such as storage (for data sovereignty), analytics, integration framework and quality management.
In fiscal 2019, we invested heavily in scaling, testing and expanding our platform globally. This is made possible by heavy investment in automation, continuous deployment and continuous integration tools and associated processes. Embracing the latest trends in the software development and operations (DevOps) culture, these investments included focusing on containerization of our applications and utilizing kubernetes for orchestration to automate the deployment and rapid scaling of our containerized applications globally consistently across public cloud and our own data centers. Our one platform and microservices infrastructure, allows our operations to roll-out new services quickly and efficiently to all of our customers and further allows us to scale, manage, and maintain our platform cost-effectively.
Our technologies include a number of deployment methodologies that promote consistency and efficiency in the implementation of our services, while driving customer adoption of our more advanced software features. We also manage and port existing business numbers globally, and we provide local number porting services in more than 40 countries. Our software provides connectivity to emergency services and other services required by telecommunications regulations in different regions of the world. We have developed our own proprietary billing software which is closely integrated with our offerings.
We have developed a set of data processing and analytics technologies to respond to the needs of global enterprise customers. Our analytics solutions are developed on a purpose-made, in-house-built real time analytics platform. The same one platform is used for unified communication and contact center customers. The data and insights from the system are available in home grown reports as well as dashboards and wallboards. Our large customers are also able to request (API) access to data in order to allow them to embed 8x8 datasets in their own analytics driven processes and tools.
Finally, a key aspect of our technology, especially critical for larger enterprise customers and certain industry verticals, such as healthcare, is our emphasis on security and compliance, which we have addressed through specific measures such as our end-to-end encryption technologies and certifications with various regulations and industry standards.
Sales, Marketing and Promotional Activities
We market our services directly to end users through a variety of means, including search engine marketing and optimization, third-party lead generation sources, industry conferences, trade shows, webinars, and digital advertising channels. We employ a direct sales organization, consisting of inside and field-based sales agents, and we partner with an indirect channel partner network consisting of master agents and the sub agent community, value-added resellers (VARs), independent software vendors (ISVs), system integrators and service providers. We typically contract directly with the end customer and use these channel partners to identify, qualify and manage prospects throughout the sales cycle, although we also have arrangements with a number of partners who resell our services to their own customers, with whom we do not contract directly. For mid-market and enterprise customers, our sales professionals work closely with inside technical support, sales engineers and deployment specialists to develop customized solution proposals based on individual customer requirements.
7
In fiscal
2019
, we continued to invest in new and unique demand generation tools and programs. For our direct and channel teams, we hosted customers and partners at "8x8 Experience Roadshow", a series of conferences held across several cities to share recent product developments and hear customer feedback first-hand. For our channel partners, we began the Elev8 program to visit and enable sub-agents with tools and training to effectively sell 8x8 solutions. We also launched 8x8 Partner Xchange, a new online portal that enables channel partners to effectively and efficiently manage their 8x8-related business and drive sales of 8x8 solutions. PartnerXchange is a single platform that makes it easier for partners to do business with 8x8 globally. We also continued to invest in developing partner deployment and support certification programs. We believe the 8x8 partner channel strategy has been a critical component of our strategy for winning large and mid-market enterprise business. In this most recent fiscal year, we significantly focused on strengthening those relationships and enhancing our global partner program to drive channel onboarding, enablement, and customer sales.
Competition
Given the size and stage of the current market opportunity and the breadth of our communications platform, we face competition from many companies, including other cloud services providers, communications and collaboration software vendors and incumbent telephone companies and other resellers of legacy communications equipment. For more information regarding the risks associated with such competition, please refer to our "Risk Factors" below.
Cloud Communications and Contact Center Services Providers
For customers looking to implement cloud-based communications, we compete with other cloud communication and contact center service providers such as RingCentral, Inc., Vonage Holdings Corp., Zoom Video Communications, Inc., Fuze, Inc., Five9, Inc., and NICE inContact. We believe that the integration of our services over a common platform, including contact center, differentiates our services from those offered by these competitors.
Large and Disruptive Internet and Cloud Services Vendors
We also face competition from communications and collaboration software vendors such as Cisco Systems, Inc., Google, Inc., Amazon Web Services, Inc., Microsoft Corporation, and Slack, Inc., some of which are well established in the communications industry while others have only recently begun to market cloud communications solutions. Some of these competitors have developed strong software solutions for its respective communications and/or collaboration silo. Many of these competitors are substantially larger, better capitalized, and more well-known than we are. However, we believe that a collective deployment of these software solutions is likely to be more expensive and cumbersome for customers, when compared to similar deployments of our services.
Incumbent Telephony Companies and Legacy Equipment Providers
Our cloud-based software replaces wire line business voice services sold by incumbent telephone and cable companies such as AT&T, Inc., CenturyLink, Inc., Comcast Corporation, and Verizon Communications, Inc. often in conjunction with on-premises hardware solutions from companies like Avaya, Inc., Cisco and Mitel Networks Corp. We believe that the solutions offered by these competitors are typically more expensive to adopt, require cumbersome on-premises implementations, and need regular hardware and IT infrastructure upgrades. Furthermore, the offerings often do not provide all the functionality needed for larger customers to integrate their communication systems with their IT infrastructure, therefore requiring additional system integration investments.
Operations
Our operations infrastructure consists of data management, monitoring, control, and billing systems that support all of our products and services. We have invested substantial resources to develop and implement our real-time call management information system. Key elements of our operations infrastructure include a prospective customer quotation portal, customer provisioning, customer access, fraud control, network security, call routing, call monitoring, media processing and normalization, call reliability, detailed call record storage and billing and integration with third-party applications. We maintain a call-switching platform in software that manages call admission, call control and call rating and routes calls to an appropriate destination or customer premises equipment.
Network Operations Center
We maintain global network operations centers at our headquarters in San Jose, California and in Cluj-Napoca, Romania, and employ experienced staff in voice and data operations in US, UK, and Romania to provide 24-hour operations support, seven days per week. We use various tools including an extensive set of synthetic tests and Application Performance Monitoring (APMs) to monitor and manage elements of our network and our partners' networks in real time. We also monitor the network elements of some of our larger business customers. Additionally, our network operations centers provide technical support to
8
troubleshoot equipment and network problems. We also rely upon the network operations centers and resources of our telecommunications carrier partners and data center providers to augment our monitoring and response efforts.
In the event of a major disruption at a data center, such as a natural disaster, failover between data centers for 8x8 Virtual Office and 8x8 X Series is designed to occur almost instantly and with minimal disruption. In addition, most of the maintenance services performed by 8x8 do not interrupt the service we provide to customers. For example, we can move the core call flow processing from one data center to another without dropping a call. We offer local redundancy (i.e., failover to a data center within the same region) as a standard feature of 8x8 Virtual Contact Center and X Series, and geographical redundancy (i.e., failover to a data center in a different region) can be enabled as an option to provision geo-redundant tenants on multiple sites.
Customer and Technical Support
8x8 maintains a global customer support organization with operations in the United States, United Kingdom, Philippines, Singapore, and Romania. Customers can access 8x8 customer support services directly from the company website, or receive multi-channel technical support via phone, chat, web and email. Emergency support is available on a 24x7 basis.
We take a lifecycle approach to customer support, supporting customers from onboarding to deployment and training, and through the renewal process, to drive greater user adoption of 8x8 services. For our larger enterprise customers, our Elite Touch implementation methodology utilizes a Deployment Management team and provides active support through the "go-live" date at each customer site. We also have an Elite Customer Success Program, and, for a certain profile of customer, a dedicated Customer Success Manager, as a single point of contact for every aspect of the post-sale relationship. Finally, we offer a variety of training classes through our 8x8 Academy, either through instructor-led classes or self-paced on-line learning.
Interconnection Agreements
We are a party to telecommunications interconnect and service agreements with VoIP providers and public switched telephone network (PSTN) telecommunications carriers in the United States and other global regions. Pursuant to these agreements, VoIP calls originating on our network can be terminated on other VoIP networks or the PSTN, and likewise, calls originating on other VoIP networks and the PSTN can be terminated on our network.
Research and Development
The cloud communications market is characterized by rapid technological changes and advancements, typical of most SaaS markets. Accordingly, we make substantial investments in the design and development of new products and services, as well as the development of enhancements and features to our existing products and services, and make these enhancements available to our customers frequently. Research and development expenses in each of the fiscal years ended March 31,
2019
,
2018
, and
2017
were
$62.1 million
,
$36.4 million
, and
$29.0 million
, respectively.
We plan to continue to invest in expanding the set of services within our platform, including extending our contact center capabilities, adding deeper collaboration services, and bringing an increasing number of analytics-driven applications to market. Our development programs continue to focus on the integration and functionality of our products and services with other SaaS services, such as Microsoft Teams, ServiceNow, Google's GSuite, Salesforce.com, NetSuite, Zendesk and others. We also plan to continue investing in our AI and ML research, to develop more intelligent features for our services.
We currently employ individuals in research, development and engineering activities in our facilities in San Jose, California, London, England and Cluj-Napoca, Romania as well as outsourced software development consultants.
Regulatory Matters
In the United States, VoIP and other software communications and collaboration services, like ours, have been subject to less regulation at the state and federal levels than traditional telecommunications services. The Federal Communications Commission (FCC) has subjected VoIP service providers to a subset of the regulations that apply to traditional telecommunications service providers and has not yet classified VoIP services as either telecommunications or information. The FCC is currently examining the status of VoIP service providers and the services they provide in multiple open proceedings.
Many state regulatory agencies impose taxes and other surcharges on VoIP services, and certain states take the position that offerings by VoIP providers are intrastate telecommunications services and therefore subject to state regulation. These states argue that if the beginning and end points of communications are known, and if some of these communications occur entirely within the boundaries of a state, the state can regulate that offering. We believe that federal regulations largely pre-empt state regulations that treat VoIP offerings in the same manner as providers of traditional telecommunications services. However, there are many areas of regulation where pre-emption has not been resolved as a matter of law. It is possible that the FCC could determine that VoIP services are not information services, or that there could be a judicial or legislative determination that the
9
states are not pre-empted from regulating VoIP services as traditional telecommunications services. We cannot predict how or when these issues will be resolved or the potential future impact on our business at this time.
In addition to regulations addressing Internet telephony and broadband services, other regulatory issues relating to the Internet generally could affect our ability to provide our services. Congress has adopted legislation that regulates certain aspects of the Internet including online content, user privacy, taxation, liability for third-party activities and jurisdiction. In addition, a number of initiatives pending in Congress and state legislatures would prohibit or restrict advertising or sale of certain products and services on the Internet, which may have the effect of raising the cost of doing business on the Internet generally. Certain states are also enacting privacy legislation. In particular, California has enacted the California Consumer Privacy Act (CCPA) which is scheduled to go into effect January 1, 2020. The CCPA imposes new obligations on for profit companies, including us, doing business in California with annual gross revenue in excess of $25 million, and substantially increases potential liability for such companies for failure to comply with data protection rules applicable to California residents.
Internationally, we are subject to a complex patchwork of regulations that vary from country to country. Some countries have adopted laws that make the provision of VoIP services illegal within the country. Other countries have adopted laws that impose stringent licensing obligations on providers of VoIP services like ours. In many countries, it is not clear how laws that have historically been applied to traditional telecommunications providers will be applied to providers of VoIP services like us. On May 4, 2016, the European Union (EU) formally adopted the General Data Protection Regulation, or GDPR, which became effective on May 25, 2018, replacing the Data Protection Directive 95/46/EC. The GDPR imposes new obligations on all companies, including us, and substantially increases potential liability for all companies, including us, for failure to comply with data protection rules.
The effect of any future laws, regulations and orders, or any changes in existing laws or their enforcement, on our operations cannot be determined. But as a general matter, increased regulation and the imposition of additional funding obligations increases service costs that may or may not be recoverable from our customers. An increase in these costs could make our services less competitive with traditional telecommunications services, if we increase our prices, or decrease our profit margins, if we attempt to absorb such costs.
Federal, state, local and foreign governmental organizations are considering other legislative and regulatory proposals that would regulate and/or tax applications running over the Internet. We cannot predict whether new taxes will be imposed on our services, and depending on the type of taxes imposed, whether and how our services would be affected thereafter.
Please refer to Part I, Item 1A "Risk Factors," for a discussion of additional regulatory risks, proceedings and issues that could adversely affect our business and operating results in the future.
Intellectual Property and Proprietary Rights
Our ability to compete depends, in part, on our ability to obtain and enforce intellectual property protection for our technology in the United States and internationally. We currently rely primarily on a combination of trade secrets, patents, copyrights, trademarks and licenses to protect our intellectual property. We currently hold more than 170 United States patents, which we expect to expire between
2019
and 2036. We have additional patent applications pending. We cannot predict whether our pending patent applications will result in issued patents.
To protect our trade secrets and other proprietary information, we require our employees to sign agreements providing for the maintenance of confidentiality and also the assignment of rights to inventions made by them while employed by us. There can be no assurance that our means of protecting our proprietary rights in the United States or abroad will be adequate or that competition will not independently develop technologies that are similar or superior to our technology, duplicate our technology or design around any of our patents. In addition, the laws of foreign countries in which our products and services are or may be sold may not protect our intellectual property rights to the same extent as do the laws of the United States. Our failure to protect our proprietary information could cause our business and operating results to suffer.
We are also subject to the risks of adverse claims and litigation alleging infringement of the intellectual property rights of others. Such claims and litigation could require us to expend substantial resources and distract key employees from their normal duties, which could have a material adverse effect on our operating results, cash flows and financial condition. The communications and software industries are subject to frequent litigation regarding patent and other intellectual property rights. Moreover, the VoIP service provider community has historically been a target of patent holders. There is a risk that we will be a target of assertions of patent rights and that we may be required to expend significant resources to investigate and defend against such assertions of patent rights. For information about specific claims, please refer to Part I, Item 1A, Risk Factors - "Our infringement of a third party's proprietary technology could disrupt our business" and Part I, Item 3. "LEGAL PROCEEDINGS."
10
We utilize certain technology, including hardware and software, that we license from third parties. Most of these licenses are on standard commercial terms made generally available by the companies providing the licenses. To date, the cost and terms of these licenses individually has not been material to our business. There can be no assurance that the technology licensed by us will continue to provide competitive features and functionality or that licenses for technology currently utilized by us or other technology which we may seek to license in the future will be available to us on commercially reasonable terms or at all. The loss of, or inability to maintain, existing licenses could result in shipment delays or reductions until equivalent technology or suitable alternative products and services could be developed, identified, licensed and integrated, and could harm our business.
Geographic Areas
We have one reportable segment. Financial information relating to revenues generated in different geographic areas are set forth in Note 11 to our consolidated financial statements contained in Part II, Item 8 of this Annual Report.
Employees
As of
March 31, 2019
, our workforce consisted of 1,497 full time employees most of whom are located in the US, UK, and Romania. None of our employees are represented by a labor union nor subject to a collective bargaining arrangement.
Available Information
We were incorporated in California in February 1987 and reincorporated in Delaware in December 1996. We maintain a corporate Internet website at the address http://www.8x8.com. The contents of this website are not incorporated in or otherwise to be regarded as part of this Annual Report. We file reports with the Securities and Exchange Commission, or SEC, which are available on our website free of charge. These reports include annual reports on Form 10-K, quarterly reports on Form 10-Q, current reports on Form 8-K and amendments to such reports, each of which is provided on our website as soon as reasonably practical after we electronically file such materials with or furnish them to the SEC. In addition, the SEC maintains a website (www.sec.gov) that contains reports, proxy and information statements, and other information regarding issuers that file electronically with the SEC, including 8x8.
Information About Our Executive Officers
Our executive officers as of the date of this report are listed below.
Vikram Verma, Chief Executive Officer.
Vikram Verma, age 54, has served as Chief Executive Officer since September 2013 and as a director since January 2012. From October 2008 through August 2013, Mr. Verma was President of Strategic Venture Development for Lockheed Martin. From 2006 through 2008, Mr. Verma was President of the IS&GS Savi Group, a division of Lockheed Martin. Prior to 2006, Mr. Verma was Chairman and Chief Executive Officer of Savi Technology, Inc. Mr. Verma received a B.S.E.E. degree from Florida Institute of Technology, a M.S.E. degree from the University of Michigan in electrical engineering, and the graduate degree of Engineer in Electrical Engineering from Stanford University.
Bryan Martin, Chairman and Chief Technology Officer.
Bryan Martin, age 51, has served as Chairman of the Board of Directors since December 2003, has served as Chief Technology Officer since September 2013 and as a director since February 2002. From February 2002 to September 2013, he served as Chief Executive Officer. From March 2007 to November 2008, and again from April 2011 to December 2011, he served as President. From February 2001 to February 2002, he served as our President and Chief Operating Officer. He served as our Senior Vice President, Engineering Operations from July 2000 to February 2001 and as Chief Technical Officer from August 1995 to August 2000. He also served as a director of the Company from January 1998 through July 1999. In addition, Mr. Martin served in various technical roles for the Company from April 1990 to August 1995. He received a B.S. and an M.S. in Electrical Engineering from Stanford University.
Steven Gatoff, Chief Financial Officer
. Steven Gatoff, age 51, joined 8x8 in October 2018 and has served as our Executive Vice President and Chief Financial Officer since November 2018. Prior to joining the Company, Mr. Gatoff served as Chief Financial Officer of Elementum during 2018, and from 2017 through 2018 was the Chief Financial Officer of PagerDuty. Prior to that, Mr. Gatoff was Chief Financial Officer of Rapid7 from 2013 to 2017 and Chief Financial Officer of iPass from 2009 to 2013. From 2002 through 2009, Mr. Gatoff held a succession of financial and accounting executive roles at software and technology companies, including Senior Vice President of Finance and Corporate Controller. Prior to these roles, Mr. Gatoff spent eight years in investment banking with Morgan Stanley, Credit Suisse and Bear Stearns. Mr. Gatoff holds a M.B.A. from Columbia University and received his CPA license from the State of New York.
11
Dejan Deklich, Chief Product Officer.
Dejan Deklich, age 44, has served as our Chief Product Officer since September 2017. Mr. Deklich had been serving as our Senior Vice President of Research and Development since February 2017. Prior to joining the Company, Mr. Deklich served as Vice President of Platform and Cloud at Splunk from January 2013 to September 2016. Mr. Deklich also held various senior roles at Nice System post Merced Systems acquisition, as well as Atribbutor, Yahoo and IBM Research. Mr. Deklich holds a Masters of Science degree in Computer Engineering from Santa Clara University and Masters in Physics from University of Bremen, Germany.
Matthew Zinn, Senior Vice President, General Counsel, Chief Privacy Officer and Secretary.
Matthew Zinn, age 55, has served as our Senior Vice President, General Counsel, Secretary, and Chief Privacy Officer since September 2018. Mr. Zinn previously served as General Counsel and Secretary at Jaunt, Inc. from June 2017 to September 2018. From April 2006 until January 2017, Mr. Zinn served as Senior Vice President, General Counsel, Secretary, and Chief Privacy Officer for TiVo Inc. Prior to that, Mr. Zinn had served as Vice President, General Counsel, and Chief Privacy Officer since July 2000 and as Corporate Secretary since November 2003 of TiVo Inc. Prior to TiVo, Mr. Zinn held senior legal positions at MediaOne Group Inc., Continental Cablevision, and the law firms of Cole, Raywid & Braverman and Fisher, Wayland, Cooper & Leader. Mr. Zinn holds a B.A. degree in Political Science from the University of Vermont and holds a J.D. degree from the George Washington University National Law Center.
ITEM 1A. RISK FACTORS
If any of the following risks actually occur, our business, results of operations and financial condition could suffer significantly.
Our success depends on acquiring new customers, and retaining and selling additional services to existing customers.
Our future success depends on our ability to significantly increase revenue generated from sales of our cloud software solutions to business customers, including small and mid-size businesses (SMBs) as well as mid-market and larger enterprises. To increase our revenue, we must add new customers and encourage existing customers to continue their subscriptions (on terms favorable to us), increase their usage of our services, and/or purchase additional services from us. For customer demand and adoption of our cloud communications solutions to grow, the quality, cost and feature benefits of these services must compare favorably to those of competing services. For example, our cloud unified communications and contact center services must continue to evolve so that high-quality service and features can be consistently offered at competitive prices. As our target markets mature, or as competitors introduce lower cost and/or more differentiated products or services that compete or are perceived to compete with ours, we may be unable to renew or extend our agreements with existing customers or attract new customers, or new business from existing customers, on favorable terms, or at all, which could have an adverse effect on our revenue and growth.
The rate at which our existing customers purchase any new or enhanced services we may offer depends on a number of factors, including general economic conditions, the importance of these additional features and services to our customers, the quality and performance of our cloud communications solutions, and the price at which we offer them. If our customers react negatively to our new or enhanced service offerings, such as our recently launched X Series suite of services, or our efforts to upsell are otherwise not as successful as we anticipate, our business may suffer. Our sales strategies must also continue to evolve and adapt as our market matures, for example through the offering of additional customer self-service tools and automation for the SMB sector and the development of new and more sophisticated sales channels that leverage the strengths of our partners. In addition, marketing and selling new and enhanced features and services may require increasingly sophisticated and costly sales and marketing efforts that may require us to incur additional expenses and negatively impact the results of our operations.
To support the successful marketing and sale of our services to new and existing customers, we must continue to offer high-quality training, implementation, and customer support. Providing these services effectively requires that our customer support personnel have industry-specific technical knowledge and expertise, which may make it difficult and costly for us to locate and hire qualified personnel, particularly in the competitive labor market in Silicon Valley where we are headquartered. Our support personnel also require extensive training on our products and services, which may make it difficult to scale up our support operations rapidly or effectively. The importance of high-quality customer support will increase as we expand our business globally and pursue new mid-market and enterprise customers. If we do not help our customers quickly resolve post-implementation issues and provide effective ongoing support, our ability to sell additional features and services to existing customers will suffer and our reputation may be harmed.
If the emerging market for cloud communications services does not continue to grow and if we do not increase our market share, our future business could be harmed.
12
The market for cloud communications services is evolving rapidly and is characterized by an increasing number of market entrants. As is typical of a rapidly evolving industry, the demand for and market acceptance of, cloud communications services is uncertain. Our success will depend to a substantial extent on the widespread adoption of cloud communications services as a replacement for legacy on-premise systems. Many larger organizations have invested substantial technical and financial resources and personnel to integrate legacy on-premise communications systems into their businesses and, therefore, may be reluctant or unwilling to migrate to cloud communications services such as ours. It is difficult to predict client adoption rates and demand for our solution, the future growth rate and size of the cloud communications service market, or the entry of competitive products and services. The expansion of the cloud communications services market depends on a number of factors, including the refresh rate for legacy on-premise systems, cost, performance and perceived value associated with cloud communications services, as well as the ability of providers of cloud communications solutions to address security, stability and privacy concerns. If we or other cloud communications service providers experience security incidents, loss of client data, disruptions in service or other problems, the market for cloud communications services as a whole, including our services, may be harmed. If the demand for cloud communications services fails to develop or develops more slowly than we anticipate, it could significantly harm our business.
Our success in the cloud communications market depends in part on developing and maintaining effective distribution channels. If we fail to develop and maintain these channels, it could harm our ability to increase our revenues.
A portion of our revenue is generated through our direct sales. This channel is driven largely by sales agents—including inside and field-based sales agents—who market and sell our services products and services to customers. Our future success requires continuing to develop and maintain a successful direct sales organization that identifies and closes a significant portion of sales opportunities in the market for cloud communications services. If we fail to do so, or if our sales agents are not successful in their sales efforts, we may be unable to meet our revenue growth targets.
A portion of our business revenue is generated through indirect channel sales. These channels consist of master agents, independent software vendors (ISVs), system integrators, value-added resellers (VARs), and service providers. We typically contract directly with the end customer and use these channel partners to identify, qualify and manage prospects throughout the sales cycle—although we also have arrangements with a number of partners who resell our services to their own customers, with whom we do not contract or contract only to a limited extent. These channels may generate an increasing portion of our revenue in the future. Our continued success requires continuing to develop and maintain successful relationships with these channel partners and increasing the portion of sales opportunities that they refer to us. If we fail to do so, or if our channel partners are not successful in their sales efforts, we may be unable to meet our revenue growth targets.
As we increase sales to enterprise customers, our average sales cycle has become longer and more challenging.
We currently derive a majority of our revenues from sales of our cloud software solutions to mid-market and larger enterprises, and we believe that increasing our sales to these customers is key to our future growth. Our sales cycle, which is the time between initial contact with a potential customer and the ultimate sale to that customer, is often lengthy and unpredictable for larger enterprise customers. Many of our prospective enterprise customers do not have prior experience with cloud-based communications and, therefore, typically spend significant time and resources evaluating our solutions before they purchase from us. Similarly, we typically spend more time and effort determining their requirements and educating these customers about the benefits and uses of our solutions. Enterprise customers also tend to demand more customizations, integrations and additional features than SMB customers. As a result, we may be required to divert more sales and engineering resources to a smaller number of large transactions than we have in the past, which means that we will have less personnel available to support other sectors, or that we will need to hire additional personnel, which would increase our operating expenses.
It is often difficult for us to forecast when a potential enterprise sale will close, the size of the customer's initial service order and the period over which the implementation will occur, any of which may impact the amount of revenue we recognize or the timing of revenue recognition. Enterprise customers may delay their purchases from one quarter to another as they assess their budget constraints, negotiate early contract terminations with their existing providers or wait for us to develop new features. Any delay in closing, or failure to close, a large enterprise sales opportunity in a particular quarter or year could significantly harm our projected growth rates and cause the amount of new sales we book to vary significantly from quarter to quarter. We also may have to delay revenue recognition on some of these transactions until the customer's technical or implementation requirements have been met.
In some cases, we may enter into a contract with a large enterprise customer, such as a preferred vendor agreement, that has little or no minimum purchase commitment but establishes the terms on which the customer's affiliates, clients or franchisees (as the case may be) may order services from us in the future. We may expend significant time and resources becoming a preferred vendor without booking significant sales from the opportunity until months or years after we sign the initial agreement. If we are unsuccessful in selling our services to the prospective purchasers under these agreements, we may not
13
recognize revenue in excess of the expenses we incur in pursuing these opportunities, which could adversely impact our results of operations and cash flow.
We face significant risks in implementing and supporting the services we sell to mid-market and larger enterprises and, if we do not manage these efforts effectively, our recurring service revenue may not grow at the rate we expected, and our business and results of operations could be harmed.
We have a limited history of selling our services to larger businesses and have experienced, and may continue to experience, new challenges in configuring and providing ongoing support for the solutions we sell to large customers.
Larger customers' networks are often more complex than those of smaller customers, and the configuration of our services for these customers generally require participation from the customer’s information technology (IT) team. There is no guarantee that the customer will make available to us the necessary personnel and other resources for a successful configuration of services. The lack of local resources may prevent us from properly configuring our services for the customer, which can in turn adversely impact the quality of services that we deliver over our customers' networks, and/or may result in delays in the implementation of our services. This may create a public perception that we are unable to deliver high quality of service to our customers, which could harm our reputation and make it more difficult to attract new customers and retain existing customers. Moreover, larger customers tend to require higher levels of customer service and individual attention (including periodic business reviews and in-person visits, for example), which may increase our costs for implementing and delivering services. If a customer is unsatisfied with the quality of services we provide or the quality of work performed by us or a third party, we may decide to incur costs beyond the scope of our contract with the customer in order to address the situation and protect our reputation, which may in turn reduce or eliminate the profitability of our contract with the customer. In addition, negative publicity related to our larger customer relationships, regardless of its accuracy, could harm our reputation and make it more difficult for us to compete for new business with current and prospective customers.
We also face challenges building and training an integrated sales force capable of addressing the services and features of our comprehensive service suite, as well as a staff of expert engineering and customer support personnel capable of addressing the full range of implementation and configuration issues that tend to arise more frequently with larger customers. Also, we have only limited experience in developing and managing sales channels and distribution arrangements for larger businesses. If we fail to effectively execute the sale, configuration and ongoing support of our services to mid-market and larger enterprises, our results of operations and our overall ability to grow our customer base could be materially and adversely affected.
Intense competition in the markets in which we compete could prevent us from increasing or sustaining our revenue growth and increasing or maintaining profitability and cause us to incur losses, which could harm our business.
The cloud communications industry is competitive, and we expect it to become increasingly competitive in the future. We may also face competition from companies in adjacent or overlapping industries.
In connection with our unified communication services, we face competition from other providers of cloud communication services, such as RingCentral, Zoom, Fuze, Vonage, Dialpad, Nextiva and Shoretel (acquired by Mitel in 2017). In connection with our cloud contact center services, we face competition from other providers of cloud and premise-based contact center software services, such as NICE/inContact, Five9 and Interactive Intelligence.
In addition, because many of our target customers have historically purchased communications services from incumbent telephone companies along with legacy on-premises communication equipment, we compete with these customers' existing providers. These competitors include, for example, AT&T, CenturyLink, Comcast and Verizon Communications in the United States, as well as local incumbent communications providers in the international markets where we operate, such as Vodafone, Telefonica, Orange, America Movil and Deutsche Telekom, all in conjunction with on-premises hardware solutions from companies like Avaya, Cisco and Mitel. We may face competition from large Internet and cloud service companies such as Google Inc., Amazon Inc., Oracle Corporation and Microsoft Corporation, any of which might launch a new cloud-based business communications service, expand its existing offerings or acquire other cloud-based business communications companies in the future.
Many of our current and potential competitors have longer operating histories, significantly greater resources and brand awareness, and a larger base of customers than we have. As a result, these competitors may have greater credibility with our existing and potential customers. They also may adopt more aggressive pricing policies and devote greater resources to the development, promotion and sale of their products and services. Our competitors may also offer bundled service arrangements that present a more differentiated or better integrated product and services to customers. Increased competition could require us to lower our prices, reduce our sales revenue, lower our gross profits or cause us to incur losses and/or cause us to lose market share. In addition, many of our customers are not subject to long-term contractual commitments and have the ability to switch from our services to our competitors' offerings on relatively short notice. Given the significant price competition in the markets for our services, we may be at a disadvantage compared with those competitors who have substantially greater resources than
14
us or may otherwise be better positioned to withstand an extended period of downward pricing pressure. The adverse impact of a shortfall in our revenues may be magnified by our inability to adjust our expenses to compensate for such shortfall. Announcements, or expectations, as to the introduction of new products and technologies by our competitors or us could cause customers to defer purchases of our existing products and services, which also could have a material adverse effect on our business, financial condition or operating results.
The market for cloud software solutions is subject to rapid technological change, and we depend on new product and service introductions in order to maintain and grow our business, including in particular our recently launched X Series service line.
We operate in an emerging market that is characterized by rapid changes in customer requirements, frequent introductions of new and enhanced products and services, and continuing and rapid technological advancement. To compete successfully in this emerging market, we must continue to design, develop, manufacture, and sell highly scalable new and enhanced cloud software solutions products and services that provide higher levels of performance and reliability at lower cost. If we are unable to develop new products and services that address our customers' needs, to deliver our cloud software solution applications in one seamless integrated service offering that addresses our customers' needs, or to enhance and improve our products and services in a timely manner, we may not be able to achieve or maintain adequate market acceptance of our services. Our ability to grow is also subject to the risk of future disruptive technologies. Access and use of our products and services is provided via the cloud, which, itself, has been disruptive to the previous premises-based model.
If new technologies emerge that are able to deliver communications and collaboration solutions services at lower prices, more efficiently, more conveniently or more securely, such technologies could adversely impact our ability to compete.
If we are unable to develop new features and services internally due to factors such as competitive labor markets, high employee turnover, lack of management ability or a lack of other research and development resources, we may miss market opportunities. Further, many of our competitors have historically spent a greater amount of funds on their research and development programs, and those that do not may be acquired by larger companies that would allocate greater resources to our competitors' research and development programs. In addition, there is no guarantee that our research and development efforts will succeed, or that our new products and services will enable us to maintain or grow our revenue or recover our development costs. Our failure to maintain adequate research and development resources, to compete effectively with the research and development programs of our competitors and to successfully monetize our research and development efforts could materially and adversely affect our business and results of operations.
We launched our new service line, branded "X Series," in July 2018. We market X Series as an array of packaged offerings (designated X2, X4, etc.), which start at the most basic version of our unified communications solution, and add engagement capabilities at each new level, with the top-tier X Series packages combining unified communications and contact center services into a single offering. Customer demand for our X Series offerings will depend on a number of factors, including, for example, factors inherent to the product itself, such as quality of service, reliability, feature availability, and ease of use; and factors relating to our ability to implement, support and market and sell the service effectively. More fundamentally, the success of X Series may depend on whether the market for unified communications, collaborations and contact center services is trending towards convergence of these three solutions into a single system, as we are predicting. We cannot be certain that this market trend will occur according to the timeline we are expecting, or at all. For example, if the various components of our service were to become commoditized and standardized in a way that diminishes the benefits of a single platform for customers, there may be less demand for a unified suite of services like X Series. Low customer demand could make it more difficult for us to win the business of new customers or gain additional business from existing customers, either of which in turn could cause our service revenue to grow more slowly than we expect, or to remain flat or even decrease in future periods.
We have a history of losses and are uncertain of our future profitability.
We recorded a net operating loss of approximately
$88.7 million
for the
twelve
months ended
March 31, 2019
and ended the period with an accumulated deficit of approximately
$250.3 million
. We expect to continue to incur operating losses in the near future as we continue to invest in growth. During our fiscal year ending March 31, 2020, we intend to increase significantly our investments in sales and marketing (and digital demand generation in particular), and in research and development, among other areas of our business, in order to compete more successfully for the business of companies that are transitioning to cloud communications and otherwise position ourselves to take advantage of long-term revenue-generating opportunities.
15
As we increase our investments in these areas, we will likewise need to increase our rate of revenue growth in order to generate and sustain operating profitability in future periods. The investments we expect to make in fiscal 2020 and beyond may not generate the returns that we anticipate, which could adversely impact our financial condition and make it more difficult for us to grow revenue and/or achieve profitability in the time period that we expect, or at all. Given our history of fluctuating revenues and operating losses, we cannot be certain that we will be able to achieve or maintain operating profitability in the future.
Our churn rate may increase in future periods due to customer cancellations or other factors, which may adversely impact our revenue or require us to spend more money to grow our customer base.
Our customers may discontinue their subscriptions for our services after the expiration of their initial subscription period, which typically range from one to four years. In addition, our customers may renew for lower subscription amounts or for shorter contract lengths. We may not accurately predict cancellation rates for our customers. Our cancellation rates may increase or fluctuate as a result of a number of factors, including customer usage, pricing changes, number of applications used by our customers, customer satisfaction with our service, the acquisition of our customers by other companies, the availability of alternative technologies, and deteriorating general economic conditions. If our customers do not renew their subscriptions for our service or decrease the amount they spend with us, our revenue will decline and our business will suffer.
Because of churn, we must acquire new customers on an ongoing basis to maintain our existing level of customers and revenues. As a result, marketing expenditures are an ongoing requirement of our business. If our churn rate increases, we will have to acquire even more new customers in order to maintain our existing revenues. We incur significant costs to acquire new customers, and those costs are an important factor in determining our net profitability. Therefore, if we are unsuccessful in retaining customers or are required to spend significant amounts to acquire new customers beyond those budgeted, our revenue could decrease and our net loss could increase.
Our rate of customer cancellations may increase in future periods due to a number of factors, some of which are beyond our control, such as the financial condition of our customers or the state of credit markets. In addition, a single, protracted service outage or a series of service disruptions, whether due to our services or those of our carrier partners, may result in a sharp increase in customer cancellations.
Due to the length of our sales cycle, especially in adding new mid-market and larger enterprises as customers, we may also experience delays in acquiring new customers to replace those that have terminated our services. Such delays would be exacerbated if general economic conditions worsen. An increase in churn, particularly in challenging economic times, could have a negative impact on the results of our operations.
We may not be able to scale our business efficiently or quickly enough to meet our customers' growing needs, in which case our operating results could be harmed.
As usage of our cloud software solutions by mid-market and larger enterprises expands and as customers continue to integrate our services across their enterprises, we are required to devote additional resources to improving our application architecture, integrating our products and applications across our technology platform, integrating with third-party systems, and maintaining infrastructure performance. To the extent we increase our customer base and as our customers gain more experience with our services, the number of users and transactions managed by our services, the amount of data transferred, processed and stored by us, the number of locations where our service is being accessed, and the volume of communications managed by our services have in some cases, and may in the future, expand rapidly. In addition, we will need to appropriately scale our internal business systems and our services organization, including customer support and services and regulatory compliance, to serve our growing customer base. Any failure or delay in these efforts could cause impaired system performance and reduced customer satisfaction. These issues could reduce the attractiveness of our cloud software solutions to customers, resulting in decreased sales to new customers, lower renewal rates by existing customers, the issuance of service credits, or requested refunds, which could hurt our revenue growth and our reputation. These system upgrades and the expansion of our support and services have been and will continue to be expensive and complex, requiring management time and attention and increasing our operating expenses. We could also face inefficiencies or operational failures as a result of our efforts to scale our infrastructure and information technology systems. There are inherent risks associated with upgrading, improving and expanding our information technology systems and we cannot be sure that the expansion and improvements to our infrastructure and systems will be fully or effectively implemented on a timely basis, if at all. These efforts may reduce revenue and our margins and adversely impact our financial results.
To provide our services, we rely on third parties for all of our network connectivity and co-location facilities.
16
We currently use the infrastructure of third-party network service providers, including the services of Equinix, Inc. and CenturyLink, Inc. in the United States, to provide all of our cloud services over their networks rather than deploying our own network connectivity.
We also rely on third-party network service providers to originate and terminate substantially all of the PSTN calls using our cloud-based services. We leverage the infrastructure of third-party network service providers to provide telephone numbers, PSTN call termination and origination services, and local number portability for our customers rather than deploying our own network throughout the United States and internationally. This decision has resulted in lower capital and operating costs for our business in the short-term, but has reduced our operating flexibility and ability to make timely service changes. If any of these network service providers cease operations or otherwise terminate the services that we depend on, the delay in switching our technology to another network service provider, if available, and qualifying this new service provider could have a material adverse effect on our business, financial condition or operating results. The rates we pay to our network service providers may also increase, which may reduce our profitability and increase the retail price of our service.
There can be no assurance that these service providers will be able or willing to supply cost-effective services to us in the future or that we will be successful in signing up alternative or additional providers. Although we believe that we could replace our current providers, if necessary, our ability to provide service to our subscribers could be impacted during any such transition, which could have an adverse effect on our business, financial condition or results of operations. The loss of access to, or requirement to change, the telephone numbers we provide to our customers also could have a material adverse effect on our business, financial condition or operating results.
Due to our reliance on these service providers, when problems occur in a network, it may be difficult to identify the source of the problem. The occurrence of hardware and software errors, whether caused by our service or products or those of another vendor, may result in the delay or loss of market acceptance of our products and services and any necessary revisions may force us to incur significant expenses. Under the terms of the "end-to-end" service level commitments that we make for the benefit of qualifying customers, we are potentially at risk for service problems experienced by these service providers. Customers who do not qualify for these enhanced service level commitments may nevertheless hold us responsible for these service issues and seek service credits, early termination rights or other remedies. Accordingly, service issues experienced by our service provider partners may harm our reputation as well as our business, financial condition or operating results.
Internet access providers and Internet backbone providers may be able to block, degrade or charge for access to, or the bandwidth use of, certain of our products and services, which could lead to additional expenses and the loss of users.
Our products and services depend on the ability of our users to access the Internet, and certain of our services require significant bandwidth to work effectively. In addition, users who access our services and applications through mobile devices, such as smartphones and tablets, must have a high-speed connection, such as Wi-Fi, 3G, 4G or LTE, to use our services and applications. Currently, this access is provided by companies that have significant and increasing market power in the broadband and Internet access marketplace, including incumbent telephone companies, cable companies and mobile communications companies. Some of these providers offer products and services that directly compete with our own offerings, which give them a significant competitive advantage. Some of these broadband providers have stated that they may exempt their own customers from data-caps or offer other preferred treatment to their customers. Other providers have stated that they may take measures that could degrade, disrupt or increase the cost of user access to certain of our services by restricting or prohibiting the use of their infrastructure to support or facilitate our offerings, or by charging increased fees to us or our users to provide our offerings, while others, including some of the largest providers of broadband Internet access services, have committed to not engaging in such behavior. These providers have the ability generally to increase their rates, which may effectively increase the cost to our customers of using our cloud software solutions.
On January 4, 2018, the Federal Communications Commission, or FCC, released an order that largely repeals rules that the FCC had in place which prevented broadband internet access providers from degrading or otherwise disrupting a broad range of services provisioned over consumers’ and enterprises’ broadband Internet access lines. The FCC’s order became effective on June 11, 2018. The order has been appealed by numerous parties including: a number of state attorneys’ general, public interest groups, associations, and companies. The appeal is before the U.S. Court of Appeals for the District of Columbia. We cannot predict whether the FCC’s January 4, 2018 order (the "January 4, 2018 Order") will withstand appeal, either in whole or in part, nor when the appeal will be resolved.
Following the adoption of the January 4, 2018 Order, a number of states have passed laws establishing rules similar to those that existed prior to the effective date of the January 4, 2018 Order. States have adopted a variety of approaches in attempting to preserve the rules in place prior to the FCC Order. For example, some states have passed narrow laws where rules addressing degradation or otherwise disrupting the provision of broadband internet access services are limited to parties that offer services to government agencies whereas other states have passed laws that apply generally. For example, California passed legislation
17
of general applicability that would prevent providers of broadband internet access services from degrading and disrupting such services when offered to third parties. The law’s effective date was January 1, 2019.
There is legal uncertainty as to whether states that have passed such laws have the authority to do so if such laws could be interpreted to conflict with the January 4, 2018 Order. Due to this legal uncertainty, the U.S. Department of Justice filed a Motion for Preliminary Injunction on September 30, 2018, seeking to prevent California from enforcing its law set to become effective January 1, 2019. In response, California state officials have agreed to delay enforcement of the new law at least until appeal of the January 4, 2018 Order is resolved by the U.S. Court of Appeals for the District of Columbia Circuit.
Many of the largest providers of broadband services, like cable companies and traditional telephone companies, have publicly stated that they will not degrade or disrupt their customers' use of applications and services, like ours. If such providers were to degrade, impair or block our services, it would negatively impact our ability to provide services to our customers, likely result in lost revenue and profits, and we would incur legal fees in attempting to restore our customers' access to our services. Broadband internet access providers may also attempt to charge us or our customers additional fees to access services like ours that may result in the loss of customers and revenue, decreased profitability, or increased costs to our offerings that may make our services less competitive. We cannot predict the potential impact of the January 4, 2018 Order on us at this time.
Our physical infrastructure is concentrated in a few facilities and any failure in our physical infrastructure or services could lead to significant costs and disruptions and could reduce our revenue, harm our business reputation and have a material adverse effect on our financial results.
Our leased network and data centers are subject to various points of failure. Problems with cooling equipment, generators, uninterruptible power supply, routers, switches, or other equipment, whether or not within our control, could result in service interruptions for our customers as well as equipment damage. Because our services do not require geographic proximity of our data centers to our customers, our infrastructure is consolidated into a few large data center facilities. Any failure or downtime in one of our data center facilities could affect a significant percentage of our customers. The total destruction or severe impairment of any of our data center facilities could result in significant downtime of our services and the loss of customer data. Because our ability to attract and retain customers depends on our ability to provide customers with highly reliable service, even minor interruptions in our service could harm our reputation. Additionally, in connection with the expansion or consolidation of our existing data center facilities from time to time, there is an increased risk that service interruptions may occur as a result of server relocation or other unforeseen construction-related issues.
We have experienced interruptions in service in the past. While we have not experienced a material increase in customer attrition following these events, the harm to our reputation is difficult to assess. We have taken and continue to take steps to improve our infrastructure to prevent service interruptions, including upgrading our electrical and mechanical infrastructure. However, service interruptions continue to be a significant risk for us and could have a material adverse impact on our business.
Any future service interruptions could:
|
•
|
cause our customers to seek service credits, or damages for losses incurred;
|
|
•
|
require us to replace existing equipment or add redundant facilities;
|
|
•
|
affect our reputation as a reliable provider of communications services;
|
|
•
|
cause existing customers to cancel or elect to not renew their contracts; or
|
|
•
|
make it more difficult for us to attract new customers.
|
Any of these events could materially increase our expenses or reduce our revenue, which would have a material adverse effect on our operating results.
We may be required to transfer our servers to new data center facilities in the event that we are unable to renew our leases on acceptable terms, or at all, or the owners of the facilities decide to close their facilities, and we may incur significant costs and possible service interruption in connection with doing so. In addition, any financial difficulties, such as bankruptcy or foreclosure, faced by our third-party data center operators, or any of the service providers with which we or they contract, may have negative effects on our business, the nature and extent of which are difficult to predict. Additionally, if our data centers are unable to keep up with our increasing needs for capacity, our ability to grow our business could be materially and adversely impacted.
We depend on third-party vendors for IP phones and certain software endpoints, and any delay or interruption in supply by these vendors would result in delayed or reduced shipments to our customers and may harm our business.
We rely on third-party vendors for IP phones and software endpoints required to utilize our service. We currently do not have long-term supply contracts with any of these vendors. As a result, most of these third-party vendors are not obligated to provide
18
products or services to us for any specific period, in any specific quantities or at any specific price, except as may be provided in a particular purchase order. The inability of these third-party vendors to deliver IP phones of acceptable quality and in a timely manner, particularly the sole source vendors, could adversely affect our operating results or cause them to fluctuate more than anticipated. Additionally, some of our products and services may require specialized or high-performance component parts that may not be available in quantities or in time frames that meet our requirements.
If we do not or cannot maintain the compatibility of our communications and collaboration software with third-party applications and mobile platforms that our customers use in their businesses, our revenue will decline.
The functionality and popularity of our cloud software solutions depends, in part, on our ability to integrate our services with third-party applications and platforms, including enterprise resource planning, customer relations management, human capital management and other proprietary application suites. Third-party providers of applications and application programmable interfaces, or APIs, may change the features of their applications and platforms, restrict our access to their applications and platforms or alter the terms governing use of their applications and APIs and access to those applications and platforms in an adverse manner. Such changes could functionally limit or terminate our ability to use these third-party applications and platforms in conjunction with our services, which could negatively impact our offerings and harm our business. If we fail to integrate our software with new third-party back-end enterprise applications and platforms used by our customers, we may not be able to offer the functionality that our customers need, which would negatively impact our ability to generate revenue and adversely impact our business.
Our services also allow our customers to use and manage our cloud software solutions on smartphones, tablets and other mobile devices. As new smart devices and operating systems are released, we may encounter difficulties supporting these devices and services, and we may need to devote significant resources to the creation, support, and maintenance of our mobile applications. In addition, if we experience difficulties in the future integrating our mobile applications into smartphones, tablets or other mobile devices or if problems arise with our relationships with providers of mobile operating systems, such as those of Apple Inc. or Google Inc., our future growth and our results of operations could suffer.
If our software fails due to defects, bugs, vulnerabilities or similar problems, and if we fail to correct any defect or other software problems, we could lose customers, become subject to service performance or warranty claims or incur significant costs.
Our customers use our service to manage important aspects of their businesses, and any errors, defects, disruptions to our service or other performance problems with our service could hurt our reputation and may damage our customers' businesses. Our services and the systems infrastructure underlying our cloud communications platform incorporate software that is highly technical and complex. Our software has contained, and may now or in the future contain, undetected errors, bugs, or vulnerabilities, which have caused, and may in the future cause, temporary service outages for some customers. Some errors in our software code may not be discovered until after the code has been released. Any errors, bugs, or vulnerabilities discovered in our code after release could result in damage to our reputation, loss of customers, loss of revenue, or liability for service credits or damages, any of which could adversely affect our business and financial results. We implement bug fixes and upgrades as part of our regularly scheduled system maintenance, which may lead to system downtime. Even if we are able to implement the bug fixes and upgrades in a timely manner, any history of defects, or the loss, damage or inadvertent release of confidential customer data, could cause our reputation to be harmed, and customers may elect not to purchase or renew their agreements with us and subject us to service performance credits, warranty claims or increased insurance costs. The costs associated with any material defects or errors in our software or other performance problems may be substantial and could materially adversely affect our operating results.
Vulnerabilities to security breaches, cyber intrusions and other malicious acts could adversely impact our business.
Our operations depend on our ability to protect our network from interruption by damage from unauthorized entry, computer viruses or other events beyond our control. In the past, we may have been subject to denial or disruption of service, or DDOS, and we may be subject to DDOS attacks in the future. We cannot assure you that our backup systems, regular data backups, security protocols, DDOS mitigation and other procedures that are currently in place, or that may be in place in the future, will be adequate to prevent significant damage, system failure or data loss.
Critical to our provision of service is the storage, processing, and transmission of our customers' data, which may include confidential and sensitive information. Customers may use our services to store, process and transmit a wide variety of confidential and sensitive information such as credit card, bank account and other financial information, proprietary information, trade secrets or other data that may be protected by sector-specific laws and regulations like intellectual property laws, laws addressing the protection of personally identifiable information (or personal data in the European Union), as well as the Federal Communications Commission’s, or the FCC’s, customer proprietary network information (“CPNI”) rules. We may
19
be targets of cyber threats and security breaches, given the nature of the information we store, process and transmit and the fact that we provide communications services to a broad range of businesses.
In addition, we use third-party vendors which in some cases have access to our data and our customers' data. Despite the implementation of security measures by us or our vendors, our computing devices, infrastructure or networks, or our vendors computing devices, infrastructure or networks may be vulnerable to hackers, computer viruses, worms, other malicious software programs or similar disruptive problems due to a security vulnerability in our or our vendors' infrastructure or network, or our vendors, customers, employees, business partners, consultants or other internet users who attempt to invade our or our vendors' public and private computers, tablets, mobile devices, software, data networks, or voice networks. If there is a security vulnerability in our or our vendors' infrastructure or networks that is successfully targeted, we could face increased costs, liability claims, government investigations, fines, penalties or forfeitures, class action litigation, reduced revenue, or harm to our reputation or competitive position.
Depending on the evolving nature of cyber threats, we may have to significantly increase our investment in maintaining the security of our networks and data, and our profitability may be adversely impacted, or we may have to increase the price of our services which may make our offerings less competitive with other communications providers.
If an individual obtains unauthorized access to our network, or if our network is penetrated, our service could be disrupted and sensitive information could be lost, stolen or disclosed which could have a variety of negative impacts, including legal liability, investigations by law enforcement and regulatory agencies, exposure to fines, penalties, or forfeitures, or class action litigation, any of which could harm our business reputation and have a material negative impact on our business. In addition, to the extent we market our services as compliant with particular laws governing data privacy and security, such as the Health Insurance Portability and Accountability Act and foreign data protection laws, or provide representations or warranties as to such compliance in our customer contracts, a security breach that exposes protected information may make us susceptible to a number of contractual claims as well as claims related to our marketing. It could also potentially expose us to liability to individuals impacted by such a security breach.
Many governments have enacted laws requiring companies to notify individuals of data security incidents involving certain types of personal data including CPNI, personally identifiable information (or personal data in the European Union), financial account information, government-issued identification numbers, and other information that may lead to harming individuals if subject to an unauthorized disclosure. In addition, some of our customers contractually require notification of any data security compromise. Security compromises experienced by our competitors, by our customers or by us may lead to public disclosures, which may lead to widespread negative publicity. Any security compromise in our industry, whether actual or perceived, could harm our reputation, erode customer confidence in the effectiveness of our security measures, negatively impact our ability to attract new customers, cause existing customers to elect not to renew their subscriptions or subject us to third-party lawsuits, federal and state government investigations, regulatory fines, penalties and forfeitures or other causes of action or liability, which could materially and adversely affect our business and operating results.
In contracts with larger enterprises, we often agree to assume liability for security breaches in excess of the amount of committed revenue from the contract. In addition, there can be no assurance that any limitations of liability provisions in our contracts for a security breach would be enforceable or adequate or would otherwise protect us from any such liabilities or damages with respect to any particular claim. Also, certain classes of information, like CPNI and information subject to state data breach notification laws in the U.S., or personal data in the European Union, can expose us to liability in the form of fines, expenses associated with federal and state government investigations, penalties and forfeitures, in addition to civil liability, if such data is breached. We cannot be sure that our existing cybersecurity insurance will continue to be available on acceptable terms or will be available in sufficient amounts to cover one or more large claims, or that the insurer will not deny coverage as to any future claim. The successful assertion of one or more large claims against us that exceed available insurance coverage, or the occurrence of changes in our insurance policies, including premium increases or the imposition of large deductible or co-insurance requirements, could have a material adverse effect on our business, financial condition and operating results.
Failure to comply with laws and contractual obligations related to data privacy and protection could have a material adverse effect on our business, financial condition and operating results.
We are subject to the data privacy and protection laws and regulations adopted by federal, state and foreign governmental agencies, including the European Union’s General Data Protection Regulation ("GDPR") and the California Consumer Privacy Act ("CCPA"). Data privacy and protection is highly regulated in many jurisdictions and may become the subject of additional regulation in the future. For example, lawmakers and regulators worldwide are considering proposals that would require companies, like us, that encrypt users' data to ensure access to such data by law enforcement authorities. Privacy laws restrict our storage, use, processing, disclosure, transfer and protection of personal information, including credit card data, provided to us by our customers as well as data we collect from our customers and employees. We strive to comply with all applicable laws, regulations, policies and legal obligations relating to privacy and data protection. However, if we fail to comply, we may
20
be subject to fines, penalties and lawsuits, statutory damages at both the federal and state levels in the U.S., substantial fines and penalties under the European Union’s GDPR, class action lawsuits, and our reputation may suffer. We may also be required to make modifications to our data practices that could have an adverse impact on our business.
Governmental entities, class action lawyers and privacy advocates are increasingly examining companies' data collection, processing, use, storing, sharing, transferring and transmitting personal data and data linkable to individuals. Self-regulatory codes of conduct, enforcement actions by regulatory agencies, and lawsuits by private parties could impose additional compliance costs on us, negatively impacting our profitability, as well as subject us to unknown potential liabilities. These evolving laws, rules and practices may also curtail our current business activities which may also result in slimmer profit margins and reduce new opportunities.
We are also subject to the privacy and data protection-related obligations in our contracts with our customers and other third parties. Any failure, or perceived failure, by us to comply with federal, state, or international laws, including laws and regulations regulating privacy, data or consumer protection, or to comply with our contractual obligations related to privacy, could result in proceedings or actions against us by governmental entities, contractual parties or others, which could result in significant liability to us, as well as harm our reputation. Additionally, third parties on which we rely enter into contracts to protect and safeguard our customers' data. Should such parties violate these agreements or suffer a breach, we could be subject to proceedings or actions against us by governmental entities, contractual parties or others, which could result in significant liability to us as well as harm to our reputation.
On July 12, 2016, the European Commission adopted the “Privacy Shield” which replaced the European Union (“EU”)-U.S. Safe Harbor Framework. We are currently participating in Privacy Shield and we also rely on other methods recognized under relevant EU law to transfer personal data between the EU and the U.S. Additionally, GDPR became effective on May 25, 2018, and replaces the Data Protection Directive 95/46/EC. GDPR imposes new obligations on all companies, including us, and substantially increases potential liability for all companies, including us, for failure to comply with data protection rules.
The regulatory landscape applicable to data transfers between the EU and other countries with similar data protection laws, and the U.S. remains unsettled. There is ongoing litigation in the EU, as well as calls by certain political and governmental bodies in the EU to re-evaluate data transfers between the EU and the U.S., that could negatively impact the existing legally acceptable methods for transferring data between the EU and the U.S. on which we rely as do many other companies. Moreover, while we established alternative methods to transfer data between the EU and U.S. that addressed certain legal uncertainties that previously existed, some independent data regulators have adopted the position that other forms of compliance, including the methods we rely upon now as do many other companies, are also invalid.
Like many other companies, we continue to face uncertainty with respect to the measures we have implemented. Additionally, there is continued uncertainty regarding the legality of transferring certain data between the EU and U.S. caused by: (i) ongoing litigation that could invalidate the existing method that we, along with many other companies, rely upon for compliance with relevant law; and (ii) the possibility that political and other governmental bodies may invalidate the method we, along with many other companies, rely upon to comply with relevant law. We cannot predict how or if this issue will be resolved nor can we evaluate our potential liability at this time.
Although GDPR has already gone into effect, there is still considerable uncertainty as to how to interpret and implement many of its provisions. It is particularly challenging for companies operating in the cloud services space, like us, to interpret and implement GDPR. If we fail to properly implement GDPR for any reason, we may be subject to fines and penalties. GDPR may also change our business operations in ways that we cannot currently predict that could increase our operating costs, decrease our profitability, or result in increased prices for our retail offerings that may make our services less competitive. We cannot evaluate our potential liability at this time.
The CCPA is scheduled to go into effect on January 1, 2020. As the CCPA currently stands, for California residents, it will require us to honor certain data subject rights and make certain disclosures regarding processing of personal information. It also grants California residents, the right to opt out of certain uses of personal information. The California Attorney General would be able to seek substantial monetary penalties and injunctive relief in the event of our noncompliance with the CCPA. In addition, the CCPA allows private lawsuits from California residents in the event of certain data breaches.
Difficulty executing local number porting requests could negatively impact our business.
The FCC and foreign regulators require VoIP providers to support telephone number porting within specified timeframes. In order to port telephone numbers, we rely on third party telecommunications carriers to complete the process. Often number ports take longer than the specified timeframes. For many potential customers, the ability to quickly port their existing telephone numbers into our service in a timely fashion is a very important consideration. To the extent that we cannot quickly port telephone numbers in, our ability to acquire new customers may be negatively impacted. To the extent that we cannot
21
quickly port telephone numbers out when a customer leaves our service to go to another provider, we could be subject to regulatory enforcement action.
We could be liable for breaches of security on our website, fraudulent activities by our users, or the failure of third-party vendors to deliver credit card transaction processing services.
A fundamental requirement for operating an Internet-based, worldwide cloud software solutions and electronically billing our customers is the secure transmission of confidential information and media over public networks. Although we have developed systems and processes that are designed to protect consumer information and prevent fraudulent credit card transactions and other security breaches, failure to mitigate such fraud or breaches may subject us to costly breach notification and other mitigation obligations, class action lawsuits, investigations, fines, forfeitures or penalties from governmental agencies that could adversely affect our operating results.
The law relating to the liability of providers of online payment services is currently unsettled and states may enact their own rules with which we may not comply. We rely on third-party providers to process and guarantee payments made by our subscribers up to certain limits, and we may be unable to prevent our customers from fraudulently receiving goods and services. Our liability risk will increase if a larger fraction of transactions effected using our cloud-based services involve fraudulent or disputed credit card transactions.
We may also experience losses due to subscriber fraud and theft of service. Subscribers have, in the past, obtained access to our service without paying for monthly service and international toll calls by unlawfully using our authorization codes or by submitting fraudulent credit card information. If our existing anti-fraud procedures are not adequate or effective, consumer fraud and theft of service could have a material adverse effect on our business, financial condition and operating results.
Natural disasters, war, terrorist attacks or malicious conduct could adversely impact our operations and could degrade or impede our ability to offer services.
Our cloud communications services rely on uninterrupted connection to the Internet through data centers and networks. Any interruption or disruption to our network, or the third parties on which we rely, could adversely impact our ability to provide service. Our network could be disrupted by circumstances outside of our control including natural disasters, acts of war, terrorist attacks or other malicious acts including, but not limited to, cyber-attacks. Our headquarters, global networks operations center and one of our third-party data center facilities are located in the San Francisco Bay Area, a region known for seismic activity. Should any of these events occur and interfere with our ability to operate our network even for a limited period of time, we could incur significant expenses, lose substantial amounts of revenue, suffer damage to our reputation, and lose customers. Such an event may also impede our customers' connections to our network, since these connections also occur over the Internet, and would be perceived by our customers as an interruption of our services, even though such interruption would be beyond our control. Any of these events could have a material adverse impact on our business.
Our infringement of a third party's proprietary technology could disrupt our business.
There has been substantial litigation in the communications, cloud communication services, semiconductor, electronics, and related industries regarding intellectual property rights and, from time to time, third parties may claim that we, our customers, our licensees or parties indemnified by us are infringing, misappropriating or otherwise violating their intellectual property rights. Third parties may also claim that our employees have misappropriated or divulged their former employers' trade secrets or confidential information. Our broad range of current and former technology, including IP telephony systems, digital and analog circuits, software, and semiconductors, increases the likelihood that third parties may claim infringement by us of their intellectual property rights. Certain technology necessary for us to provide our services may, in fact, be patented by other parties either now or in the future. If such technology were held under patent by another person, we would have to negotiate a license for the use of that technology, which we may not be able to negotiate at a price that is acceptable or at all. The existence of such a patent, or our inability to negotiate a license for any such technology on acceptable terms, could force us to cease using such technology and offering products and services incorporating such technology.
If we are found to be infringing on the intellectual property rights of any third-party in lawsuits or proceedings that may be asserted against us, we could be subject to monetary liabilities for such infringement, which could be material. We could also be required to refrain from using, manufacturing or selling certain products or using certain processes, either of which could have a material adverse effect on our business and operating results. We may continue to receive in the future, notices of claims of infringement, misappropriation or misuse of other parties' proprietary rights. There can be no assurance that we will prevail in these discussions and actions or that other actions alleging infringement by us of third-party patents will not be asserted or prosecuted against us. Furthermore, lawsuits like these may require significant time and expense to defend, may divert management's attention away from other aspects of our operations and, upon resolution, may have a material adverse effect on our business, results of operations, financial condition and cash flows.
22
Inability to protect our proprietary technology would disrupt our business.
We rely, in part, on patent, trademark, copyright, and trade secret law to protect our intellectual property in the United States and abroad. We seek to protect our software, documentation, and other written materials under trade secret and copyright law, which afford only limited protection. We currently have several United States patent applications pending. We cannot predict whether such pending patent applications will result in issued patents, and if they do, whether such patents will effectively protect our intellectual property. The intellectual property rights we obtain may not be sufficient to provide us with a competitive advantage, and could be challenged, invalidated, infringed or misappropriated. We may not be able to protect our proprietary rights in the United States or internationally (where effective intellectual property protection may be unavailable or limited), and competitors may independently develop technologies that are similar or superior to our technology, duplicate our technology or design around any patent of ours.
We attempt to further protect our proprietary technology and content by requiring our employees and consultants to enter into confidentiality and assignment of inventions agreements and third parties to enter into nondisclosure agreements. These agreements may not effectively prevent unauthorized use or disclosure of our confidential information, intellectual property or technology and may not provide an adequate remedy in the event of unauthorized use or disclosure of our confidential information, intellectual property or technology.
Litigation may be necessary in the future to enforce our intellectual property rights, to determine the validity and scope of our proprietary rights or the rights of others, or to defend against claims of infringement or invalidity. Such litigation could result in substantial costs and diversion of management time and resources and could have a material adverse effect on our business, financial condition, and operating results. Any settlement or adverse determination in such litigation would also subject us to significant liability.
We also may be required to protect our proprietary technology and content in an increasing number of jurisdictions, a process that is expensive and may not be successful, or which we may not pursue in every location. In addition, effective intellectual property protection may not be available to us in every country, and the laws of some foreign countries may not be as protective of intellectual property rights as those in the United States. Additional uncertainty may result from changes to intellectual property legislation enacted in the United States and elsewhere, and from interpretations of intellectual property laws by applicable courts and agencies. Accordingly, despite our efforts, we may be unable to obtain and maintain the intellectual property rights necessary to provide us with a competitive advantage.
We may have difficulty attracting or retaining personnel with the technical skills and experience necessary to support our growth.
Companies in the cloud communications industry compete aggressively for top talent in all areas of business, but particularly sales and marketing, professional services and engineering, where employees with industry experience, technical knowledge and specialized skill sets are particularly valued. Demand can be expected to increase if cloud communications continues to gain a greater share of the global communications market. Some of our competitors may respond to these competitive pressures by increasing employee compensation, paying more on average than we pay for the same position. Any such disparity in compensation could make us less attractive to candidates as a potential employer, which in turn may make it more difficult for us to hire and retain qualified employees. Training an individual who lacks prior cloud communications experience to be successful in a sales or technical role can take months or even years.
When an employee of 8x8 leaves to work for a competitor, not only are we impacted by the loss of the individual resource, but we also face the risk that the individual will share our trade secrets with the competitor in violation of their contractual and legal obligations to us. Our competitors have in the past and may in the future target their hiring efforts on a particular department, and if we lose a group of employees to a competitor over a short time period, our day-to-day operations may be impaired. While we may have remedies available to us through litigation, they would likely take significant time and expense and divert management attention from other areas of the business.
If we increase employee compensation (beyond levels that reflect customary performance-based and/or cost-of-living adjustments) in response to competitive pressures, we may sustain greater operating losses than we predicted in the near term, and we may not achieve profitability within the timeframe we had expected, or at all.
Because our long-term growth strategy involves further expansion outside the United States, our business will be susceptible to risks associated with international operations.
An important component of our growth strategy involves the further expansion of our operations and customer base internationally. We have formed several subsidiaries outside the United States, including a Romanian subsidiary that contributes significantly to our research and development efforts. We have also acquired two UK-based companies. The risks and challenges associated with sales and other operations outside the United States are different in some ways from those
23
associated with our operations in the United States, and we have a limited history addressing those risks and meeting those challenges. Our current international operations and future initiatives will involve a variety of risks, including:
|
•
|
localization of our services, including translation into foreign languages and associated expenses;
|
|
•
|
regulation of our services as traditional telecommunications services, requiring us to obtain authorizations or licenses to operate in foreign jurisdictions, or alternatively preventing us from selling our full suite of services, or any services at all, in such jurisdictions;
|
|
•
|
changes in a specific country or region's regulatory requirements, taxes, trade laws, or political or economic conditions;
|
|
•
|
more stringent regulations relating to data security and the unauthorized use of, access to, and transfer of, commercial and personal information, particularly in the EU;
|
|
•
|
differing labor regulations, especially in the EU and Latin America, where labor laws are generally more advantageous to employees as compared to the United States, including deemed hourly wage and overtime regulations in these locations;
|
|
•
|
challenges inherent in efficiently managing an increased number of employees over large geographic distances, including the need to implement appropriate systems, policies, benefits and compliance programs;
|
|
•
|
difficulties in managing a business in new markets with diverse cultures, languages, customs, legal systems, alternative dispute systems and regulatory systems;
|
|
•
|
increased travel, real estate, infrastructure and legal compliance costs associated with international operations;
|
|
•
|
different pricing environments, longer sales cycles, longer accounts receivable payment cycles and other collection difficulties;
|
|
•
|
currency exchange rate fluctuations and the resulting effect on our revenue and expenses, and the cost and risk of entering into hedging transactions if we chose to do so in the future;
|
|
•
|
limitations on our ability to reinvest earnings from operations in one country to fund the capital needs of our operations in other countries;
|
|
•
|
laws and business practices favoring local competitors or general preferences for local vendors;
|
|
•
|
limited or insufficient intellectual property protection;
|
|
•
|
political instability or terrorist activities;
|
|
•
|
exposure to liabilities under anti-corruption and anti-money laundering laws, including the U.S. Foreign Corrupt Practices Act, the UK Bribery Act 2010, trade and export laws such as those enforced by the Office of Foreign Assets Control (OFAC) of the US Department of the Treasury, and similar laws and regulations in other jurisdictions; and
|
|
•
|
adverse tax burdens and foreign exchange controls that could make it difficult to repatriate earnings and cash.
|
We have limited experience in operating our business internationally, which increases the risk that any potential future expansion efforts that we may undertake will not be successful. We expect to invest substantial time and resources to expand our international operations. If we are unable to do this successfully and in a timely manner, our business and operating results could be materially adversely affected.
Acquisitions may divert our management's attention, result in dilution to our stockholders and consume resources that are necessary to sustain our business.
We have acquired several businesses in recent years. If appropriate opportunities present themselves, we may make additional acquisitions or investments or enter into joint ventures or strategic alliances with other companies. Risks commonly encountered in such transactions include:
|
•
|
the difficulty of assimilating the operations and personnel of the combined companies:
|
|
•
|
the risk that we may not be able to integrate the acquired services or technologies with our current services, products, and technologies;
|
|
•
|
the potential disruption of our ongoing business;
|
|
•
|
the diversion of management attention from our existing business;
|
|
•
|
the inability of management to maximize our financial and strategic position through the successful integration of the acquired businesses;
|
|
•
|
difficulty in maintaining controls, procedures, and policies;
|
|
•
|
the impairment of relationships with employees, suppliers, and customers as a result of any integration;
|
|
•
|
the loss of an acquired base of customers and accompanying revenue;
|
|
•
|
the loss of an acquired base of customers and accompanying revenue while trying to transition the customer from the legacy systems to 8x8's technology due to mismatch of the features, usability, packaging, or pricing at the renewal times;
|
|
•
|
the loss of an acquired base of customers and accompanying revenue due to failure and/or lack of maintenance/support for the legacy services and/or equipment/software/services being end of life;
|
24
|
•
|
additional regulatory compliance obligations and costs associated with the acquired operations;
|
|
•
|
litigation arising from or relating to the transaction;
|
|
•
|
the assumption of leased facilities, other long-term commitments or liabilities that could have a material adverse impact on our profitability and cash flow; and
|
|
•
|
the dilution to our existing stockholders from the issuance of additional shares of common stock or reduction of earnings per outstanding share in connection with an acquisition that fails to increase the value of our company.
|
As a result of these potential problems and risks, among others, businesses that we may acquire or invest in may not produce the revenue, earnings, or business synergies that we anticipate. In addition, there can be no assurance that any potential transaction will be successfully completed or that, if completed, the acquired business or investment will generate sufficient revenue to offset the associated costs or other potential harmful effects on our business.
The United Kingdom's withdrawal from the EU may adversely impact our operations in the United Kingdom and elsewhere.
On June 23, 2016, voters in the United Kingdom approved an advisory referendum to withdraw from the EU. The timing of the proposed exit is subject to further change; however, it is currently scheduled for as late as October 31, 2019, with a transition period expected to run through December 31, 2020. The political uncertainty that it has raised extends to regulatory uncertainty associated with the proposed exit from the EU. Since the vote to withdraw from the EU, negotiations and arrangements between the United Kingdom, the EU and other countries outside of the EU have been, and will continue to be, complex and time consuming. The potential withdrawal could adversely impact our UK subsidiary, 8x8 UK Limited (previously referred to as Voicenet Solutions Ltd.), and add operational complexities that did not previously exist. Currently, the most immediate impact may be to the relevant regulatory regimes under which 8x8 UK Limited operates, including the offering of communications services, as well as to data privacy regulations. The impact on regulatory regimes remains uncertain. For example, while the United Kingdom government has announced its intent to introduce domestic legislation that would largely reconcile United Kingdom domestic law with many EU laws, including GDPR, it remains unknown what will actually occur it what the departure from the EU may mean with respect to data privacy regulation including its impact on data transfers from the EU to the United Kingdom, and
vice versa
, as well as data transfers from the United Kingdom to jurisdictions outside of the EU. Also, it remains unclear what impact a United Kingdom withdrawal may have on taxes which may increase the cost of our services sold in the United Kingdom, or reduce our profit margins, or make our services less competitive with traditional communications service providers, or some combination of any of these potential issues. Additionally, the impending withdrawal of the United Kingdom from the EU has resulted in significant volatility in the international financial currency markets. Although most of our services revenues are denominated in U.S. dollars, we also receive payments in international currencies including the pound and the euro. Like all business that derive revenue in differing currencies, we incur risks with respect to currency translation when there are fluctuations in exchange rates and when the U.S. dollar is valued higher as compared to other currencies. While we cannot predict the impact that an actual exit from the EU will have on 8x8 UK Limited, the potential collateral impact it may have on our operations elsewhere including the U.S., nor its potential impact on our financial results, the United Kingdom’s vote to leave the European Union and the uncertainties associated with whether it will be with or without a formal plan has created legal, regulatory, and currency risk that may have a materially adverse impact on our business.
Our future operating results may vary substantially from period to period and may be difficult to predict.
Our historical operating results have fluctuated significantly and will likely continue to fluctuate in the future, and a decline in our operating results could cause our stock price to fall. On an annual and a quarterly basis, there are a number of factors that may affect our operating results, some of which are outside our control. These include, but are not limited to:
|
•
|
changes in market demand;
|
|
•
|
the timing of customer subscriptions for our cloud software solutions;
|
|
•
|
customer cancellations;
|
|
•
|
changes in the competitive dynamics of our market, including consolidation among competitors or customers;
|
|
•
|
lengthy sales cycles and/or regulatory approval cycles;
|
|
•
|
new product introductions by us or our competitors;
|
|
•
|
extent of market acceptance of new or existing services and features;
|
|
•
|
the mix of our customer base and sales channels;
|
|
•
|
the mix of services sold;
|
|
•
|
the number of additional customers, on a net basis;
|
|
•
|
the amount and timing of costs associated with recruiting, training and integrating new employees;
|
|
•
|
unforeseen costs and expenses related to the expansion of our business, operations and infrastructure;
|
|
•
|
continued compliance with industry standards and regulatory requirements;
|
25
|
•
|
material security breaches or service interruptions due to cyberattacks or infrastructure failures or unavailability;
|
|
•
|
introduction and adoption of our cloud software solutions in markets outside of the United States;
|
|
•
|
changes in the recognition pattern of revenues and operating expenses as a result of new regulations, accounting principles and their interpretations, such as Financial Accounting Standards Board's Accounting Standards Update ("ASU") No. 2014-09, Revenue from Contracts with Customers (Topic 606); and
|
|
•
|
general economic conditions.
|
Due to these and other factors, we believe that period-to-period comparisons of our results of operations are not meaningful and should not be relied upon as indicators of our future performance. It is possible that in some future periods our results of operations may be below the expectations of public market analysts and investors. If any of these were to occur, the price of our common stock would likely decline significantly.
In addition, changes in regulatory and accounting principles, and our interpretation of these and judgments used in applying them to our facts and circumstances, could have a material effect on our results of operations and financial condition. We also need to revise our business processes, systems and controls which requires significant management attention and may negatively affect our financial reporting obligations.
Our products and services must comply with industry standards, FCC regulations, state, local, country-specific and international regulations, and changes may require us to modify existing products and/or services.
In addition to reliability and quality standards, the market acceptance of telephony over broadband IP networks is dependent upon the adoption of industry standards so that products from multiple manufacturers are able to communicate with each other. Our cloud-based communications and collaboration services rely heavily on communication standards such as SIP, MGCP and network standards such as TCP/IP and UDP to interoperate with other vendors' equipment. There is currently a lack of agreement among industry leaders about which standard should be used for a particular application, and about the definition of the standards themselves. These standards, as well as audio and video compression standards, continue to evolve. We also must comply with certain rules and regulations of the FCC regarding electromagnetic radiation and safety standards established by Underwriters Laboratories, as well as similar regulations and standards applicable in other countries. Standards are frequently modified or replaced. As standards evolve, we may be required to modify our existing services or develop and support new versions of our services. We must comply with certain federal, state and local requirements regarding how we interact with our customers, including marketing practices, consumer protection, privacy, and billing issues, the provision of 9-1-1 or other international emergency services, including location data and the quality of service we provide to our customers. The failure of our products and services to comply, or delays in compliance, with various existing and evolving standards could delay or interrupt volume production of our communications and collaboration services, subject us to fines or other imposed penalties, or harm the perception and adoption rates of our service, any of which would have a material adverse effect on our business, financial condition or operating results.
For example:
|
•
|
Regulation of our services as telecommunications services may require us to obtain authorizations or licenses to operate in foreign jurisdictions and comply with legal requirements applicable to traditional telephony providers.
Regulators around the world, including those in the European Union generally do not distinguish between our cloud-based communications services and traditional telephony services. By entering additional international markets we may subject ourselves to significant regulation from foreign telecommunications authorities, including obligations to obtain telecommunications licenses and authorizations, complying with consumer protection laws and cooperating with local law enforcement authorities. This regulation impacts our ability to differentiate ourselves from incumbent service providers and imposes substantial compliance costs on us. Regulation restricts our ability to compete and, in some jurisdictions, it may restrict how we are able to expand our service offerings. Moreover, the regulatory environment is constantly evolving and changes to the applicable regulations may have an adverse effect upon our business by imposing additional compliance costs, modifying our technology and operations and in general affecting our profitability.
|
|
•
|
Reform of federal and state Universal Service Fund programs and payment of regulatory and other fees in international markets, could increase the cost of our service to our customers diminishing or eliminating our pricing advantage.
The FCC and a number of states are considering reform or other modifications to Universal Service Fund programs. Furthermore, the FCC has ruled that states can require us to contribute to state Universal Service Fund programs. A number of states already require us to contribute, while others are actively considering extending their programs to include the services we provide. At the same time, foreign regulatory authorities may impose regulatory fees or other contributions on our services. Should the FCC, states or foreign regulators adopt new contribution mechanisms or otherwise modify contribution obligations that increase our contribution burden, we will
|
26
either need to raise the amount we currently collect from our customers to cover these obligations or absorb the costs, which would reduce our profit margins. We currently pass-through Universal Service Fund contributions and certain other fees to our customers, which may result in our services becoming less competitive as compared to those provided by others.
|
•
|
We may become subject to state regulation for certain service offerings.
Certain states take the position that offerings by VoIP providers, like us, are intrastate and therefore subject to state regulation. These states argue that if the beginning and end points of communications are known, and if some of these communications occur entirely within the boundaries of a state, the state can regulate that offering. We believe that the FCC has preempted states from regulating VoIP services like ours in the same manner as providers of traditional telecommunications services. We cannot predict how this issue will be resolved or its impact on our business at this time.
|
|
•
|
The FCC adopted rules concerning call completion rates to rural areas of the United States.
It is possible that we, like other providers in the communications marketplace, may be subject to fines or other enforcement actions should the FCC determine that our call completion rates to rural areas are, or have been, unacceptable.
|
|
•
|
The FCC and foreign regulators may require providers like us to comply with regulations related to how we present bills to customers.
The adoption of such obligations may require us to revise our bills and may increase our costs of providing service which could either result in price increases or reduce our profitability.
|
|
•
|
There may be risk associated with our ability to comply with U.S. and foreign rules concerning disabilities access requirements and the FCC and foreign regulators may expand disabilities access requirements to additional services we offer.
We cannot predict whether we will be subject to additional accessibility requirements or whether any of our service offerings that are not currently subject to disabilities access requirements will be subject to such obligations. It is possible that we, like other providers in the communications marketplace, may be subject to fines or other enforcement actions if we are found not to be in compliance with the FCC's and foreign accessibility requirements.
|
|
•
|
There may be risks associated with our ability to comply with requirements of the Telecommunications Relay Service and similar foreign statutes.
The FCC requires providers of interconnected VoIP services to comply with certain regulations pertaining to people with disabilities and to contribute to the Telecommunications Relay Services fund. We are also required to offer 7-1-1 abbreviated dialing for access to relay services. At the same time, several foreign regulators also mandate accessibility requirements for people with disabilities. It is possible that we, like other providers in the communications marketplace, may be subject to fines or other enforcement actions if we are found not to be in compliance with these requirements, including the FCC's 7-1-1 abbreviated dialing obligations.
|
|
•
|
There may be risks associated with our ability to comply with the requirements of U.S. and foreign law enforcement agencies.
The FCC requires all interconnected VoIP providers to comply with the Communications Assistance for Law Enforcement Act, or CALEA. Similarly, foreign regulatory frameworks require VoIP providers to comply with local law enforcement and cooperate with local authorities in conducting wiretaps, pentraps and other surveillance activities. The FCC and other regulators may allow VoIP providers to comply with CALEA and similar statutes through the use of a service provided by a trusted third-party with the ability to extract call content and call-identifying information from a VoIP provider's network. Regardless of our reliance on a third party for compliance, it is possible that we, like other providers in the communications marketplace, may be subject to fines or other enforcement actions if we are found not to be in compliance with our obligations under CALEA or other similar assistance with law enforcement statutes.
|
|
•
|
U.S. and foreign regulations may require us to deploy an E-911 or access to emergency service that automatically determines the location of our customers.
In 2007, the FCC released a Notice of Proposed Rulemaking, in which it tentatively concluded that all interconnected VoIP providers that allow customers to use their service in more than one location (nomadic VoIP service providers, such as us), must utilize an automatic location technology that meets the same accuracy standards which apply to providers of commercial mobile radio services (mobile phone service providers). Since then, the FCC has been conducting proceedings and inquiries concerning the implementation of such a rule, including possible changes to the manner providers provision E-911 services on mobile applications. At the same time, foreign regulatory authorities, have conducted similar proceedings mandating VoIP providers in the applicable jurisdiction to provide caller location data when completing calls to the local emergency service numbers. The outcome of these proceedings cannot be determined at this time and we may or may not be able to comply with any such obligations that may be adopted. At present, we currently have no means to automatically identify the physical location of one of our customers on the Internet. We cannot guarantee that emergency calling service
|
27
consistent with the FCC's order and other similar foreign orders will be available to all of our customers, especially those accessing our services from outside of the United States. Compliance with these obligations could result in service price increases and could have a material adverse effect on our business, financial condition or operating results.
|
•
|
The FCC adopted orders reforming the system of payments between regulated carriers that we partner with to interface with the public switch telephone network.
The FCC reformed the system under which regulated providers of telecommunications services compensate each other for various types of traffic, including VoIP traffic that terminates on the PSTN and applied new call signaling requirements to VoIP providers and other service providers. The FCC's new rules require, among other things, interconnected VoIP providers, like us, that originate interstate or intrastate traffic destined for the PSTN, to transmit the telephone number associated with the calling party to the next provider in the call path. Intermediate providers must pass calling party number or charge number signaling information they receive from other providers unaltered, to subsequent providers in the call path. While we believe we are in compliance with this rule, to the extent that we pass traffic that does not have appropriate calling party number or charge number information, we could be subject to fines, cease and desist orders, or other penalties. The FCC's Order reforming payments between carriers for various types of traffic may result in increasing the payments we make to underlying carriers to access the PSTN, which may result in us increasing the retail price of our service, potentially making our offering less competitive with traditional providers of telecommunications services, or may reduce our profitability.
|
Our emergency and E-911 calling services are different from those offered by traditional wireline telephone companies and may expose us to significant liability.
There may be risks associated with limitations of E-911 and other emergency dialing with the 8x8 service.
Both our emergency calling service and our E-911 calling service are different, in significant respects, from the emergency calling services offered by traditional wireline telephone companies in the United States and abroad. In each case, the differences may cause significant delays, or even failures, in callers' receipt of the emergency assistance they need.
The FCC may determine that our nomadic emergency calling service does not satisfy the requirements of its VoIP E-911 order because, in some instances, our nomadic emergency calling service requires that we route an emergency call to a national emergency call center instead of connecting our customers directly to a local public-safety answering point through a dedicated connection and through the appropriate selective router. Similarly, foreign telecommunications regulators may determine that our nomadic emergency calling service does not meet applicable local emergency dialing and location requirements.
Delays our customers may encounter when making emergency services calls and any inability of the answering point to automatically recognize the caller's location or telephone number can result in life threatening consequences. Customers may, in the future, attempt to hold us responsible for any loss, damage, personal injury or death suffered as a result of any failure of our E-911 services and other emergency dialing services.
The New and Emerging Technologies 911 Improvement Act of 2008 provides public safety entities, interconnected VoIP providers and others involved in handling 911 calls the same liability protections when handling 911 calls from interconnected VoIP users as from mobile or wired telephone service users. The applicability of the liability protections to our national call center service is unclear at the present time.
Alleged or actual failure of our solutions to comply with regulations governing outbound dialing, including regulations under the Telephone Consumer Protection Act of 1991 and similar foreign statutes, could harm our business, financial condition, results of operations and cash flows.
The legal and contractual environment surrounding calling consumers and wireless phone numbers is complex and evolving. In the United States, two federal agencies, the Federal Trade Commission ("FTC") and the FCC, and various states have enacted laws including, at the federal level, the Telephone Consumer Protection Act of 1991, or TCPA, that restrict the placing of certain telephone calls and texts to residential and wireless telephone subscribers by means of automatic telephone dialing systems, prerecorded or artificial voice messages and fax machines. Internationally, we are also subject to similar laws imposing limitations on marketing calls to wireline and wireless numbers and compliance with do not call rules. These laws require companies to institute processes and safeguards to comply with these restrictions. Some of these laws can be enforced by the FTC, FCC, State Attorneys General, foreign regulators or private party litigants. In these types of actions, the plaintiff may seek damages, statutory penalties, costs and/or attorneys' fees.
It is possible that the FTC, FCC, foreign regulators, state attorneys general, private litigants or others may attempt to hold our customers, or us as a software provider, responsible for alleged violations of these laws. In the event that litigation is brought,
28
or fines are assessed, against us, we may not successfully enforce or collect upon any contractual indemnities we may have from our customers. Additionally, any changes to these laws or their interpretation that further restrict calling consumers, any adverse publicity regarding the alleged or actual failure by companies, including our customers and competitors, to comply with such laws, or any governmental or private enforcement actions related thereto, could result in the reduced use of our solution by our clients and potential clients, which could harm our business, financial condition, results of operations and cash flows.
Failure of our back-end information technology systems to function properly could result in significant business disruption.
We rely on IT systems to manage numerous functions of our internal operations, some of which were internally developed IT systems that were not fully integrated among themselves, or with our third-party ERP system. These IT systems require specialized knowledge for which we have to train new personnel, and if we were to experience an unusual increase in attrition of our IT personnel, we may not be adequately equipped to respond to an IT system failure. These IT systems were developed at a time when we provided services primarily to SMB customers and they may not be able to accommodate the requirements of larger enterprises as effectively as more modern and flexible solutions. Continued reliance on these systems may harm us competitively and impede our efforts to sell to larger enterprises.
Although we are in the process of upgrading a number of our IT systems, including our ERP software, our quote-to-cash software and our customer service and support software, we face risks relating to these transitions. For example, we may incur greater costs than we anticipate to train our personnel on the new systems; we may experience more errors in our records during the transition; and we may be delayed in meeting our various reporting obligations. To the extent any of these risks or events impact our customer service, we may experience an increase in customer attrition, which could have a material adverse impact on our results of operations.
Our inability to use software licensed from third parties, or our use of open source software under license terms that interfere with our proprietary rights, could disrupt our business.
Our technology platform incorporates software licensed from third parties, including some software, known as open source software, which we use without charge. Although we monitor our use of open source software, the terms of many open source licenses to which we are subject have not been interpreted by U.S. or foreign courts, and there is a risk that such licenses could be construed in a manner that imposes unanticipated conditions or restrictions on our ability to provide our platform to our customers. In the future, we could be required to seek licenses from third parties in order to continue offering our platform, which licenses may not be available on terms that are acceptable to us, or at all. Alternatively, we may need to re-engineer our platform or discontinue use of portions of the functionality provided by our platform. In addition, the terms of open source software licenses may require us to provide software that we develop using such software to others on unfavorable license terms. Our inability to use third-party software could result in disruptions to our business, or delays in the development of future offerings or enhancements of existing offerings, which could impair our business.
Taxing authorities may successfully assert that we should have collected or in the future should collect sales and use, value added, or similar taxes, and we could be subject to liability with respect to past or future sales, which could adversely affect our business.
The applicability of state and local taxes, fees, surcharges or similar taxes to our services is complex, ambiguous and subject to interpretation and change. In the United States, for example, we collect state and local taxes, fees and surcharges based on our understanding of the applicable laws in the relevant jurisdiction. The taxing authorities may challenge our interpretation of the laws and may assess additional taxes, penalties and interests which could have adverse effects on the results of operations and, to the extent we pass these through to our customers, demand for our services. We currently file more than 1,000 state and municipal tax returns monthly. Periodically, we have received inquiries from state and municipal taxing agencies with respect to the remittance of state or municipal taxes, fees or surcharges. Currently, several jurisdictions are conducting audits of 8x8. As of March 31, 2019, we have accrued for state or municipal taxes, fees or surcharges that we believe are required to be remitted.
We have accrued a liability of approximately $8.0 million as our best estimate of the probable amount of taxes, fees and surcharges that may be imposed by states, municipalities and other taxing jurisdictions on our services to date. Historically, the amounts that have been remitted for uncollected state, municipal and other similar indirect taxes, fees, or surcharges have been within the accruals we established. We adjust our accrual when facts relating to specific exposures warrant such adjustment. This accrued contingent liability is based on our analysis of several factors, including the location where our services are used, our nexus to that jurisdiction for tax purposes, and the taxability of our services under the rules and regulations in each state or municipality (as these may be interpreted by regulatory and judicial authorities from time to time). While we have accrued for these potential liabilities based on our analyses and best estimates at the time, state, municipal and other taxing and regulatory
29
authorities may challenge our position, which could result in us being liable for sales and use taxes, fees, or surcharges, as well as related penalties and interest, above our accrued contingent liability. To the extent we collect or otherwise recover these taxes, fees or surcharges from our customers, our services may become less competitive, our churn rate may increase, and our revenue from new and existing customers may be materially adversely affected.
Our ability to use our net operating losses or research tax credits to offset future taxable income may be subject to certain limitations.
As of March 31, 2019, we had net operating loss (“NOL”) carryforwards for federal and state income tax purposes of
$245.0 million
and
$80.0 million
, respectively, which expire at various dates between 2029 and 2037. We also had research and development credit carryforwards for federal and California tax purposes of approximately
$10.1 million
and
$11.5 million
, respectively. The federal income tax credit carryforwards related to research and development will expire at various dates between 2021 and 2036, while the California income tax credits will carry forward indefinitely. Utilization of our NOL and tax credit carryforwards can become subject to a substantial annual limitation due to the ownership change limitations provided by Section 382 of the Internal Revenue Code and similar state provisions. A Section 382 ownership change generally occurs if one or more stockholders or groups of stockholders who own at least 5% of the stock increase their ownership by more than 50 percentage points over their lowest ownership percentage within a rolling three-year period. Similar rules may apply under state tax laws. Such an ownership change, or any future ownership change, could have a material effect on our ability to utilize the net operating loss or research credit carryforwards. In addition, under the Tax Cuts and Jobs Act, or the Tax Act, the amount of NOLs that we are permitted to deduct in any taxable year is limited to 80% of the taxable income in such year. There is a risk that due to changes under the Tax Act, regulatory changes, or other unforeseen reasons, the existing NOLs could expire or otherwise be unavailable to offset future income tax liabilities, which could have a material impact on our net income (loss) in future periods.
If we fail to establish and maintain proper and effective internal control over financial reporting, our operating results and our ability to operate our business could be harmed.
The Sarbanes-Oxley Act of 2002 requires, among other things, that we establish and maintain internal control over financial reporting and disclosure controls and procedures. In particular, under the current rules of the Securities and Exchange Commission (“SEC”), we must perform system and process evaluation and testing of our internal control over financial reporting to allow management to report on the effectiveness of our internal control over financial reporting, as required by Section 404 of the Sarbanes-Oxley Act. Our independent registered public accounting firm is also required to report on our internal control over financial reporting. Our and our auditor’s testing may reveal deficiencies in our internal control over financial reporting that are deemed to be material weaknesses and render our internal control over financial reporting ineffective. We have incurred and we expect to continue to incur substantial accounting and auditing expense and expend significant management time in complying with the requirements of Section 404. If we are not able to comply with the requirements of Section 404, or if we or our independent registered public accounting firm identify deficiencies in our internal control over financial reporting that are deemed to be material weaknesses, the market price of our stock could decline and we could be subject to investigations or sanctions by the SEC, The NYSE Stock Market, or other regulatory authorities, or subject to litigation. To the extent any material weaknesses in our internal control over financial reporting are identified in the future, we could be required to expend significant management time and financial resources to correct such material weaknesses or to respond to any resulting regulatory investigations or proceedings.
Changes in financial accounting standards or practices may cause adverse, unexpected financial reporting fluctuations and affect our reported operating results.
The accounting rules and regulations that we must comply with are complex and subject to interpretation by the Financial Accounting Standards Board (the “FASB”), the SEC and various bodies formed to promulgate and interpret appropriate accounting principles. Recent actions and public comments from the FASB and the SEC have focused on the integrity of financial reporting and internal controls. In addition, many companies’ accounting policies are being subjected to heightened scrutiny by regulators and the public. Further, the accounting rules and regulations are continually changing in ways that could materially impact our financial statements.
For example, in May 2014, the FASB issued ASU 2014-09, Revenue from Contracts with Customers (
Accounting Standards Codification 606 or ASC 606
), which replaces numerous requirements in U.S. GAAP and provide companies with a single revenue recognition model for recognizing revenue from contracts with customers. The impact of adopting the new standard on our total revenues and deferred revenue has not been and is not expected to be material. With the adoption of ASC 606 we also adopted ASC 340-40, Other Assets and Deferred Costs—Contracts with Customers, which requires the deferral of incremental costs of obtaining a customer contract which, under the old guidance, were expensed as incurred. Adoption of the new standard resulted in changes to our accounting policies for revenue recognition and deferred commissions.
30
We cannot predict the impact of future changes to accounting principles or our accounting policies on our financial statements going forward, which could have a significant effect on our reported financial results and could affect the reporting of transactions completed before the announcement of the change. In addition, if we were to change our critical accounting estimates, including those related to the recognition of subscription revenue and other revenue sources, our operating results could be significantly affected.
We may not be able to secure financing on favorable terms, or at all, to meet our future capital needs.
We may need to pursue financing in the future to make expenditures or investments to support the growth of our business (whether through acquisitions or otherwise) and may require additional capital to pursue our business objectives, respond to new competitive pressures, service our debt, pay extraordinary expenses such as litigation settlements or judgments or fund growth, including through acquisitions, among other potential uses. Additional funds, however, may not be available when we need them on terms that are acceptable to us, or at all. If we are unable to obtain adequate financing or financing on terms satisfactory to us when we require it, our ability to continue to grow and support our business and to respond to business challenges could be significantly limited.
Servicing our debt will require a significant amount of cash, and we may not have sufficient cash flow from our business to pay our substantial debt.
On February 19, 2019, we issued $287.5 million aggregate principal amount of our 0.50% convertible senior notes due 2024 in a private placement. Pursuant to an indenture dated as of February 19, 2019 between us and Wilmington Trust, National Association, as trustee, the notes bear interest at a rate of 0.50% per annum, payable semi-annually in arrears in cash on February 1 and August 1 of each year, and they will mature on February 1, 2024, unless earlier converted, redeemed or repurchased.
Our ability to make scheduled payments of the principal of, to pay interest on or to refinance our indebtedness, including the amounts payable under the notes, depends on our future performance, which is subject to economic, financial, competitive and other factors beyond our control. Our business may not continue to generate cash flow from operations in the future sufficient to service our debt and make necessary capital expenditures. If we are unable to generate such cash flow, we may be required to adopt one or more alternatives, such as selling assets, restructuring debt or obtaining additional equity capital on terms that may be onerous or highly dilutive. Our ability to refinance our indebtedness will depend on the capital markets and our financial condition at such time. We may not be able to engage in any of these activities or engage in these activities on desirable terms, which could result in a default on our debt obligations.
We may not have the ability to raise the funds necessary to settle conversions of the notes in cash or to repurchase the notes upon a fundamental change, and our future debt may contain limitations on our ability to pay cash upon conversion or repurchase of the notes.
Holders of the notes have the right to require us to repurchase their notes upon the occurrence of a fundamental change at a repurchase price equal to 100% of the principal amount of the notes to be repurchased, plus accrued and unpaid interest, if any. In addition, upon conversion of the notes, unless we elect to deliver solely shares of our common stock to settle such conversion (other than paying cash in lieu of delivering any fractional share), we will be required to make cash payments in respect of the notes being converted. However, we may not have enough available cash or be able to obtain financing at the time we are required to make repurchases of notes surrendered therefor or notes being converted. In addition, our ability to repurchase the notes or to pay cash upon conversions of the notes may be limited by law, by regulatory authority or by agreements governing our future indebtedness. Our failure to repurchase notes at a time when the repurchase is required by the indenture or to pay any cash payable on future conversions of the notes as required by the indenture would constitute a default under the indenture. A default under the indenture or the occurrence of the fundamental change may also lead to a default under agreements governing our future indebtedness. If the repayment of the related indebtedness were to be accelerated after any applicable notice or grace periods, we may not have sufficient funds to repay the indebtedness and repurchase the notes or make cash payments upon conversions thereof.
The conditional conversion feature of the notes, if triggered, may adversely affect our financial condition and operating results.
In the event the conditional conversion feature of the notes is triggered, holders of notes will be entitled to convert the notes at any time during specified periods at their option. If one or more holders elect to convert their notes, unless we elect to satisfy our conversion obligation by delivering solely shares of our common stock (other than paying cash in lieu of delivering any fractional share), we would be required to settle a portion or all of our conversion obligation through the payment of cash, which could adversely affect our liquidity. In addition, even if holders of notes do not elect to convert their notes, we could be required under applicable accounting rules to reclassify all or a portion of the outstanding principal of the notes as a current rather than long-term
31
liability, which would result in a material reduction of our net working capital.
The accounting method for convertible debt securities that may be settled in cash, such as the notes, could have a material effect on our reported financial results.
Under Accounting Standards Codification 470-20, Debt with Conversion and Other Options (“ASC 470-20”), an entity must separately account for the liability and equity components of the convertible debt instruments (such as the notes) that may be settled entirely or partially in cash upon conversion in a manner that reflects the issuer’s economic interest cost. The effect of ASC 470-20 on the accounting for the notes is that the equity component is required to be included in the additional paid-in capital section of stockholders’ equity on our consolidated balance sheet at the issuance date and the value of the equity component would be treated as debt discount for purposes of accounting for the debt component of the notes. As a result, we will be required to record a greater amount of non-cash interest expense as a result of the amortization of the discounted carrying value of the notes to their face amount over the term of the notes. We will report larger net losses (or lower net income) in our financial results because ASC 470-20 will require interest to include both the amortization of the debt discount and the instrument’s non-convertible coupon interest rate, which could adversely affect our reported or future financial results, the trading price of our common stock and the trading price of the notes.
In addition, under certain circumstances, convertible debt instruments (such as the notes) that may be settled entirely or partly in cash may be accounted for utilizing the treasury stock method, the effect of which is that the shares issuable upon conversion of such notes are not included in the calculation of diluted earnings per share except to the extent that the conversion value of such notes exceeds their principal amount. Under the treasury stock method, for diluted earnings per share purposes, the transaction is accounted for as if the number of shares of common stock that would be necessary to settle such excess, if we elected to settle such excess in shares, are issued. We cannot be sure that the accounting standards in the future will continue to permit the use of the treasury stock method. If we are unable or otherwise elect not to use the treasury stock method in accounting for the shares issuable upon conversion of the notes, then our diluted earnings per share could be adversely affected.
The capped call transactions entered into in connection with our sale of notes may affect the value of our common stock.
In connection with the offer and sale of the notes, we entered into capped call transactions with one or more of the initial purchasers or affiliates thereof and/or other financial institutions (the “option counterparties”). The capped call transactions are expected generally to reduce the potential dilution upon conversion of the notes at maturity and/or offset any cash payments we are required to make in excess of the principal amount of converted notes, as the case may be, with such reduction and/or offset subject to a cap.
In capped call transactions similar to the ones we entered into, the option counterparties or their respective affiliates typically enter into various derivative transactions with respect to the issuer's common stock and/or purchase shares of the issuer's common stock concurrently with or shortly after the pricing of the notes. The option counterparties or their respective affiliates in our capped call transactions may modify their hedge positions by entering into or unwinding various derivatives with respect to our common stock and/or purchasing or selling our common stock or other securities of ours in secondary market transactions following the pricing of the notes and prior to the maturity of the notes (and are likely to do so during the valuation period for the capped call transactions, which is expected to occur during the 40 trading day period beginning on the 41st scheduled trading day prior to the maturity of the notes). This activity could also cause or avoid an increase or a decrease in the market price of our common stock.
In addition, if any such capped call transactions fail to become effective, whether or not this offering of notes is completed, the option counterparties or their respective affiliates may unwind their hedge positions with respect to our common stock, which could adversely affect the value of our common stock.
Decreasing telecommunications rates and increasing regulatory charges may diminish or eliminate our competitive pricing advantage versus legacy providers.
Decreasing telecommunications rates may diminish or eliminate the competitive pricing advantage of our services, while increased regulation and the imposition of additional regulatory funding obligations at the federal, state, local and foreign level could require us to either increase the retail price for our services, thus making us less competitive, or absorb such costs, thus decreasing our profit margins. International and domestic telecommunications rates have decreased significantly over the last few years in most of the markets in which we operate, and we anticipate these rates will continue to decline in all of the markets in which we do business or expect to do business. Users who select our services to take advantage of the current pricing differential between traditional telecommunications rates and our rates may switch to traditional telecommunications carriers if such pricing differentials diminish or disappear, and we will be unable to use such pricing differentials to attract new customers in the future. Continued rate decreases would require us to lower our rates to remain competitive in the United States
32
and abroad and would reduce or possibly eliminate any gross profit from our services. In addition, we may lose subscribers for our services.
Adverse economic conditions may harm our business.
Our business depends on the overall demand for cloud communications services and on the economic health of our current and prospective customers, which consist primarily of businesses (both for-profit and non-profit). If economic conditions deteriorate globally or in the jurisdictions that account for a material amount of our revenue (in particular, the United States, Europe and Canada, Australia), the size of our target market may decrease, and existing and prospective customers may delay or reduce their cloud communications spending. If our existing and prospective customers experience economic hardship, this could reduce the demand for our cloud services, delay and lengthen sales cycles, force us to lower the prices for our services, and lead to slower growth or even a decline in our revenues, operating results and cash flows.
We currently rely on small and medium-sized businesses for a significant portion of our revenue. Customers in this market generally have more limited financial resources, and may be affected by economic downturns, to a greater extent than larger or more established businesses. If small and medium-sized businesses experience financial hardship as a result of a weak economy, the demand for our services could be materially and adversely affected, and our revenue may not increase from period to period as rapidly as our competitors who have less dependence on sales to these sectors, or may even decrease from period to period.
Risks Related to Our Common Stock
Future sales of our common stock or equity-linked securities in the public market could lower the market price for our common stock.
In the future, we may sell additional shares of our common stock or equity-linked securities to raise capital. In addition, a substantial number of shares of our common stock is reserved for issuance upon the exercise of stock options, upon the vesting and settlement of restricted stock units and performance units, and upon conversion of our notes. We cannot predict the size of future issuances or the effect, if any, that they may have on the market price for our common stock. The issuance and sale of substantial amounts of common stock or equity-linked securities, or the perception that such issuances and sales may occur, could adversely affect the trading price of the notes and the market price of our common stock and impair our ability to raise capital through the sale of additional equity or equity-linked securities.
As of March 31, 2019, our directors and executive officers held an aggregate of 2,925,824 shares, or 3.04%, of our common stock outstanding as of such date. In addition, as of March 31, 2019, 10,930,777 shares of our common stock were subject to options, restricted stock units, and performance stock units outstanding, and 11,268,015 shares of our common stock were available for future grant under our equity incentive plans. These shares may be sold in the public market upon issuance and once vested, subject to the restrictions provided under the terms of the applicable plan or award agreement. If these additional shares are sold, or if it is perceived that they will be sold, in the public market, the trading price of our common stock could decline.
We are unable to predict the effect that sales, or the perception that our shares may be available for sale, will have on the prevailing market price of our common stock.
If securities or industry analysts do not publish research or reports about our business, or if they change their recommendations regarding our stock adversely, our stock price and trading volume could decline.
The trading market for our common stock will be influenced by the research and reports that securities or industry analysts publish about us or our business. If one or more of the analysts who cover us downgrades our stock or publishes inaccurate or unfavorable research about our business, our stock price would likely decline. If one or more of these analysts ceases coverage of our company or fails to publish reports on us regularly, demand for our stock could decrease, which might cause our stock price and trading volume to decline.
Furthermore, such analysts publish their own projections regarding our actual results. These projections may vary widely from one another and may not accurately predict the results we actually achieve. Our stock price may decline if we fail to meet analysts’ projections.
Certain provisions in our charter documents and Delaware law could discourage takeover attempts.
Our restated certificate of incorporation and by-laws contain provisions that could have the effect of delaying or preventing changes in control or changes in our management without the consent of our board of directors, including, among other things:
33
|
•
|
no cumulative voting in the election of directors, which limits the ability of minority stockholders to elect director candidates;
|
|
•
|
the ability of our board of directors to issue shares of preferred stock and to determine the price and other terms of those shares, including preferences and voting rights, without stockholder approval, which could be used to significantly dilute the ownership of a hostile acquirer;
|
|
•
|
the exclusive right of our board of directors to elect a director to fill a vacancy created by the expansion of our board of directors or the resignation, death or removal of a director, which prevents stockholders from being able to fill vacancies on our board of directors;
|
|
•
|
a prohibition on stockholder action by written consent, which forces stockholder action to be taken at an annual or special meeting of our stockholders;
|
|
•
|
the requirement that a special meeting of stockholders may be called only by a majority vote of our Board of Directors or by stockholders holdings shares of our common stock representing in the aggregate a majority of votes then outstanding, which could delay the ability of our stockholders to force consideration of a proposal or to take action, including the removal of directors;
|
|
•
|
the ability of our board of directors, by majority vote, to amend our by-laws, which may allow our board of directors to take additional actions to prevent a hostile acquisition and inhibit the ability of an acquirer to amend our by-laws to facilitate a hostile acquisition; and
|
|
•
|
advance notice procedures with which stockholders must comply to nominate candidates to our board of directors or to propose matters to be acted upon at a stockholders' meeting, which may discourage or deter a potential acquirer from conducting a solicitation of proxies to elect the acquirer's own slate of directors or otherwise attempting to obtain control of us.
|
We are also subject to certain anti-takeover provisions under the General Corporation Law of the State of Delaware, or the DGCL. Under Section 203 of the DGCL, a corporation may not, in general, engage in a business combination with any holder of 15% or more of its capital stock unless the holder has held the stock for three years or (i) our board of directors approves the transaction prior to the stockholder acquiring the 15% ownership position, (ii) upon consummation of the transaction that resulted in the stockholder acquiring the 15% ownership position, the stockholder owns at least 85% of the outstanding voting stock (excluding shares owned by directors or officers and shares owned by certain employee stock plans) or (iii) the transaction is approved by the board of directors and by the stockholders at an annual or special meeting by a vote of 66 2/3% of the outstanding voting stock (excluding shares held or controlled by the interested stockholder). These provisions in our restated certificate of incorporation and by-laws and under Delaware law could discourage potential takeover attempts.
ITEM 1B. UNRESOLVED STAFF COMMENTS
None.
ITEM 2. PROPERTIES
Our principal operations are located in San Jose, California, in two facilities that consist of approximately 140,000 square feet of combined leased office space. The leases expire in 2019 and 2020, respectively.
Outside the United States our operations are conducted primarily in leased office space located in the United Kingdom (primarily used for sales and support in Europe) and Romania (primarily used for research and development).
In addition, we lease space from third-party datacenter hosting facilities under co-location agreements in the United States and in a number of countries across the globe, including South America, Europe, Asia, and the South Pacific.
We believe that we will be able to obtain additional space at other locations at commercially reasonable terms to support our continuing growth and expansion. For additional information regarding our obligations under leases, see Note 6 to the consolidated financial statements contained in Part II, Item 8 of this Annual Report.
ITEM 3. LEGAL PROCEEDINGS
From time to time, we become involved in various legal claims and litigation that arise in the normal course of our operations. While the results of such claims and litigation cannot be predicted with certainty, we are not currently aware of any such matters that we believe would have a material adverse effect on our financial position, results of operations or cash flows.
On November 30, 2018, we were named as a defendant in Rainey Circuit LLC v. 8x8 Inc., by way of a complaint filed by Plaintiff Rainey Circuit LLC in the District of Delaware (Civil Action No. Case 1:18-cv-01903-MN). The complaint alleges that we infringed U.S. Patent No. 8,131,824 with regards to alleged activities concerning our sales or uses of a multimedia
34
messaging system as allegedly implemented in connection with the our Virtual Office application. We are a member of a defensive patent acquisition and pooling organization. This organization negotiated a license covering us, and on February 26, 2019, Rainey Circuit LLC dismissed the complaint against us with prejudice.
ITEM 4. MINE SAFETY DISCLOSURES
Not applicable.
PART II
ITEM 5. MARKET FOR REGISTRANT'S COMMON EQUITY AND RELATED STOCKHOLDER MATTERS AND ISSUER PURCHASES OF EQUITY SECURITIES
Since December 8, 2017, our common stock is traded under the symbol "EGHT" and is listed on the New York Stock Exchange, Inc. (NYSE). Previous to December 8, 2017, our common stock traded under the symbol "EGHT" and was listed on the Nasdaq Global Select Market of the Nasdaq Stock Market national securities exchange.
We have never paid cash dividends on our common stock and have no plans to do so in the foreseeable future. As of May 14, 2019, there were approximately 200 holders of record of our common stock.
The following table sets forth the range of high and low close prices for each period indicated:
|
Period
|
High
|
Low
|
|||||
|
Fiscal 2019:
|
|
|
|
|
|||
|
First quarter
|
$
|
22.55
|
|
$
|
18.05
|
|
|
|
Second quarter
|
$
|
23.20
|
|
$
|
19.85
|
|
|
|
Third quarter
|
$
|
20.51
|
|
$
|
16.36
|
|
|
|
Fourth quarter
|
$
|
20.86
|
|
$
|
17.49
|
|
|
|
Fiscal 2018:
|
|
|
|
|
|||
|
First quarter
|
$
|
15.35
|
|
$
|
12.70
|
|
|
|
Second quarter
|
$
|
14.80
|
|
$
|
12.70
|
|
|
|
Third quarter
|
$
|
14.80
|
|
$
|
12.20
|
|
|
|
Fourth quarter
|
$
|
20.25
|
|
$
|
14.40
|
|
|
See Item 12 of Part III of this Annual Report regarding information about securities authorized for issuance under our equity compensation plans.
The graph below shows the cumulative total stockholder return over a five year period assuming the investment of $100 on March 31, 2014 in each of 8x8's common stock, the NASDAQ Composite Index and the NASDAQ Telecommunications Index. The graph is furnished, not filed, and the historical return cannot be indicative of future performance.
Issuer Purchases of Equity Securities
There was no activity under the Repurchase Plan for the three months ended
March 31, 2019
. The dollar value of shares that may yet to be purchased under the Repurchase plan is approximately $7.1 million.
35
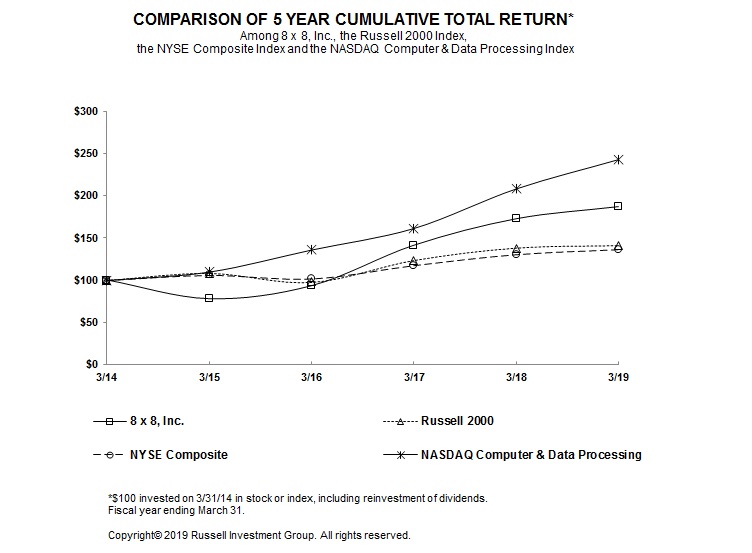
36
ITEM 6. SELECTED FINANCIAL DATA
The following table sets forth selected consolidated financial data of 8x8 Inc. for each year in the five year period ended March 31, 2019. The following selected consolidated financial data is qualified by reference to and should be read in conjunction with "Management's Discussion and Analysis of Financial Condition and Results of Operations" and with the consolidated financial statements, related notes thereto and other financial information included elsewhere in this Annual Report on Form 10-K.
|
Years Ended March 31,
|
|||||||||||||||||||
|
2019
|
2018
|
2017
|
2016
|
2015
|
|||||||||||||||
|
(in thousands, except per share amounts)
|
|||||||||||||||||||
|
Total revenues
|
$
|
352,586
|
|
$
|
296,500
|
|
$
|
253,388
|
|
$
|
209,336
|
|
$
|
162,413
|
|
||||
|
Net income (loss)
|
$
|
(88,739
|
)
|
$
|
(104,497
|
)
|
$
|
(4,751
|
)
|
$
|
(5,120
|
)
|
$
|
1,926
|
|
||||
|
Net income (loss) per share:
|
|
|
|
|
|||||||||||||||
|
Basic and diluted
|
$
|
(0.94
|
)
|
$
|
(1.14
|
)
|
$
|
(0.05
|
)
|
$
|
(0.06
|
)
|
$
|
0.02
|
|
||||
|
Total assets
|
$
|
546,358
|
|
$
|
277,209
|
|
$
|
333,855
|
|
$
|
313,452
|
|
$
|
295,624
|
|
||||
|
Accumulated deficit
|
$
|
(250,302
|
)
|
$
|
(201,464
|
)
|
$
|
(114,610
|
)
|
$
|
(109,859
|
)
|
$
|
(104,739
|
)
|
||||
|
Total stockholders' equity
|
$
|
249,390
|
|
$
|
218,774
|
|
$
|
288,601
|
|
$
|
275,306
|
|
$
|
272,211
|
|
||||
ITEM 7. MANAGEMENT'S DISCUSSION AND ANALYSIS OF FINANCIAL CONDITION AND RESULTS OF OPERATIONS
OVERVIEW
We are a leading cloud provider of enterprise Software-as-a-Service (SaaS) communications solutions, that enable businesses of all sizes to communicate faster and smarter across voice, video meetings, chat and contact centers, transforming both employee and customer experiences with communications that work simply, integrate seamlessly, and perform reliably. From one proprietary cloud technology platform, customers have access to unified communications, team collaboration, video conferencing, contact center, data and analytics and other services.
As of March 31, 2019, our customers are spread across more than 150 countries and range from small businesses to large enterprises with more than 10,000 employees. In recent years, we have increased our focus on the mid-market and enterprise customer sectors, and in fiscal 2019, we generated a majority of our new subscription services revenue from customers in these business sectors.
We generate revenue primarily from the sale of subscriptions to our software services to customers. The remainder of our revenues has historically been comprised of professional services revenue and product revenues from the sale of office phones and other equipment. We define a “customer” as one or more legal entities to which we provide services pursuant to a single contractual arrangement. In some cases, we may have multiple billing relationships with a single customer (for example, where we establish separate billing accounts for a parent company and each of its subsidiaries).
Historically, our flagship services have been Virtual Office, a unified communications solution, and Virtual Contact Center, a contact center solution. In 2018, we began selling our 8x8 X Series suite of services, which consist of service plans designated X1, X2, etc., through X8. With 8x8 X Series, we provide both unified communications and contact center functionality from a single platform, with a single interface, in the high-end set of our service plans (X5 through X8). We also offer more basic, cost-efficient unified communications services in X1 through X4. During the fourth fiscal quarter of fiscal 2019, nearly all of our new customers purchased service plans for 8x8 X Series, although we continue to have a significant number of customers subscribed to our Virtual Office and Virtual Contact Center platforms. We have begun migrating these customers from our legacy platforms to 8x8 X Series, and we intend to accelerate the pace of migrations during fiscal years 2020 and 2021. These migrations will require us to incur professional services costs that we may not be able to recover from our customers, and there is also a risk that we will experience an increase in churn.
Reclassification
Effective for the fourth quarter of fiscal 2019, we reclassified certain expenses on our Consolidated Statement of Operations. We believe these classifications provide additional clarity and insights into the Company’s go-to-market, demand generation and sales execution activities, and how the total Sales and Marketing spend drives revenue generation, in light of the recent strategic and organizational changes impacting our channel, marketing and support activities. These changes in classification also align our external presentation of operating-related expenses with the way that our chief operating decision maker (CODM) expects to assess spend and resource allocation decisions around the Company’s sales and marketing demand
37
generation effectiveness and efficiency. We reclassified these expenses for the prior periods presented in order to provide comparable historical financial information.
The reclassifications did not have any impact to consolidated operating income (loss), net income (loss) or cash flows. A description of the impact on the various line items of our Consolidated Statement of Operations follows:
|
•
|
Cost of Revenues: certain expenses for providing training to customers, deployment of the Company’s technology platform, customer support, and related expenses that were previously classified in Sales & Marketing were reclassified to Cost of Revenues.
|
|
•
|
Sales & Marketing Expenses: certain expenses related to customer service which includes customer deployment, technical support and other costs were reclassified from Sales & Marketing expense to Cost of Revenues, Research & Development expenses and/or General & Administrative expenses.
|
|
•
|
Research & Development Expenses: certain expenses related to customer deployments that were previously classified in Sales & Marketing expenses were reclassified to Research & Development expenses.
|
|
•
|
General & Administrative Expenses: certain personnel expenses that support billing and collection efforts and other miscellaneous costs that were previously classified in Sales & Marketing were reclassified to General & Administrative expenses. Also beginning in the fourth quarter of fiscal 2019, certain expenses related to recruiting activities that had been previously allocated across all departments in the first three quarters of fiscal 2019 were reported in General & Administrative expenses.
|
Tables showing the reclassifications and financial impact on the affected line items are set forth below under Note 14 in Part II, Item 8, Notes to the Consolidated Financial Statements.
SUMMARY AND OUTLOOK
Our 2019 fiscal year was an important milestone year for 8x8. We launched 8x8 X Series, our single-technology platform. We re-aligned our channel and marketing functions to support a more scalable, high-growth, go-to-market strategy. We continued to invest in Research and Development, consistent with our belief that ownership of the core technology behind our platform is an important competitive differentiator.
In fiscal 2019, our total service revenue grew
19%
year-over-year to
$334.4 million
, roughly in-line with our fiscal 2018 growth rate. We continued to show an increase in our average monthly service revenue per customer (ARPU), which grew to $498, compared with $450 in fiscal
2018
, as we are selling more to mid-market and enterprise customers. Service revenue from mid-market and enterprise customers represented 62% of total service revenue and grew 30% over the prior year. We also increased the number of deals where customers purchase our integrated communications and contact center solution, which we have referred to as bundled deals.
Since the beginning of fiscal 2018, we have de-emphasized profitability as a short-term corporate goal and have focused instead on making investments necessary to accelerate growth. This decision was based, in part, on our belief that the communications market was at an inflection point in the shift of businesses from legacy on-premise solutions to cloud services. We believe that this industry trend will continue in fiscal 2020 and beyond. Accordingly, we believe that it is in the company's interest to continue to invest heavily in our business--in particular, to build our technology platform further and expand our sales and marketing activities, particularly in the channel--in order to allow us to scale efficiently and capture market share during this phase of industry disruption.
We plan to continue making significant upfront investments in customer acquisition. We plan to continue investing in our direct marketing efforts, which includes our sales force and digital marketing spend. We also intend to continue investing in our indirect channel to market to sell our solutions. Should these upfront investments not result in additional revenue from new or existing customers, our operating results may be adversely impacted.
RESULTS OF OPERATIONS
The following discussion should be read in conjunction with our Consolidated Financial Statements and related notes included elsewhere in this Annual Report.
38
For a discussion of our results of operations and liquidity and capital resources for the fiscal year ended March 31, 2017, see Management’s Discussion and Analysis of Financial Condition and Results of Operations in Part II, Item 7 of our Annual Report on Form 10-K for the fiscal year ended March 31, 2017, filed with the Securities and Exchange Commission on May 30, 2018.
We have minimal seasonality in our business, but typically sales of new subscriptions in our fourth fiscal quarter are greater than in any of the first three quarters of the fiscal year. We believe this occurs because the customers we target tend to spend a relatively greater portion of their annual capital budgets at the beginning of the calendar year compared with each of the last three quarters of the year.
REVENUE
|
|
Years Ended March 31,
|
Year-over-Year
|
||||||||||||
|
|
2019
|
2018
|
Change
|
|||||||||||
|
|
(dollar amounts in thousands)
|
|
|
|
||||||||||
|
Service revenue
|
$
|
334,438
|
|
$
|
280,430
|
|
$
|
54,008
|
|
19.3
|
%
|
|||
|
Percentage of total revenue
|
94.9
|
%
|
94.6
|
%
|
|
|
|
|
||||||
Service revenue consists of revenues attributable to the provision of our 8x8 cloud communication and collaboration software solutions, along with revenues from professional services.
The increase in fiscal year
2019
, compared with fiscal year
2018
, was primarily attributable to an increase in our business customer subscriber base (net of customer churn), with the largest part of the increase coming from our mid-market and enterprise customers, which are our fastest growing customer sector, contributing to an increase in the average monthly service revenue per customer. Our business service subscriber base grew from approximately 49,000 customers at the end of fiscal
2018
to approximately 52,000 customers on
March 31, 2019
. Average monthly service revenue per customer for the fiscal year increased from $450 for fiscal
2018
to $498 for fiscal
2019
. We expect the number of business customers to continue to grow and average monthly service revenue per customer to continue to grow in fiscal
2020
.
|
|
Years Ended March 31,
|
Year-over-Year
|
||||||||||||
|
|
2019
|
2018
|
Change
|
|||||||||||
|
|
(dollar amounts in thousands)
|
|
|
|||||||||||
|
Product revenue
|
$
|
18,148
|
|
$
|
16,070
|
|
$
|
2,078
|
|
12.9
|
%
|
|||
|
Percentage of total revenue
|
5.1
|
%
|
5.4
|
%
|
|
|
|
|
||||||
Product revenue consists primarily of revenues from sales of IP telephones in conjunction with our cloud telephony service. Product revenue is dependent on the number of customers who choose to purchase an IP telephone in conjunction with our service instead of using the solution on their cell phone, computer or other compatible device. We expect customers to continue to adopt our mobile and desktop solutions in the future.
No single customer represented more than 10% of our total revenues during fiscal
2019
or
2018
.
The following table illustrates our revenues by geographic area. Revenues are attributed to countries based on the destination of shipment and the customer's service address.
|
|
Years Ended March 31,
|
||||
|
|
2019
|
2018
|
|||
|
Americas (principally US)
|
90
|
%
|
90
|
%
|
|
|
Europe (principally UK)
|
10
|
%
|
10
|
%
|
|
|
|
100
|
%
|
100
|
%
|
|
39
COST OF REVENUE
|
|
Years Ended March 31,
|
Year-over-Year Change
|
|||||||||||||||||||||||
|
|
2019
|
2018
|
2017
|
2018 to 2019
|
2017 to 2018
|
||||||||||||||||||||
|
|
(dollar amounts in thousands)
|
|
|
||||||||||||||||||||||
|
Cost of service revenue
|
$
|
107,192
|
|
$
|
86,244
|
|
$
|
70,576
|
|
$
|
20,948
|
|
24.3
|
%
|
$
|
15,668
|
|
22.2
|
%
|
||||||
|
Percentage of service revenue
|
32.1
|
%
|
30.8
|
%
|
29.9
|
%
|
|
|
|
|
|||||||||||||||
Cost of service revenue primarily consists of costs associated with network operations and related personnel, communication origination and termination services provided by third-party carriers, and technology licenses, outsourced customer service call center operations, and amortization of internally developed software. Other costs such as customer service, which includes deployment engineering and technical support, are also included in cost of service revenue.
The increase in cost of service revenue for fiscal
2019
from fiscal
2018
was primarily due to a $5.5 million increase in amortization of capitalized software, a $4.7 million increase in payroll and related expenses, a $2.3 million increase in amortization of intangibles, a $1.5 million increase in stock-based compensation expenses, a $1.4 million increase in consulting and outside service expenses, a $1.1 million increase in third-party network service expenses (due to increased call volumes associated with our subscription revenue growth), and a $1.0 million increase in licenses and fees.
The increase in cost of service revenue for fiscal
2018
from fiscal
2017
was primarily due to a $7.0 million increase in payroll and related expenses, a $1.9 million increase in third-party network service expenses (due to increased call volumes associated with our subscription revenue growth), a $1.7 million increase in amortization of capitalized software, a $1.2 million increase in consulting and outside service expenses, a $1.0 million increase in licenses and fees, and a $0.7 million increase in depreciation expense.
We expect service gross margin to slightly decrease for fiscal
2020
as we continue to make investments to grow service revenue.
|
|
Years Ended March 31,
|
Year-over-Year
|
||||||||||||
|
|
2019
|
2018
|
Change
|
|||||||||||
|
|
(dollar amounts in thousands)
|
|
|
|||||||||||
|
Cost of product revenue
|
$
|
22,780
|
|
$
|
20,482
|
|
$
|
2,298
|
|
11.2
|
%
|
|||
|
Percentage of product revenue
|
125.5
|
%
|
127.5
|
%
|
|
|
|
|
||||||
The cost of product revenue consists primarily of IP telephones, estimated warranty obligations and direct and indirect costs associated with product purchasing, scheduling, shipping and handling.
The increase in the cost of product revenue for fiscal
2019
from fiscal
2018
was primarily due to the increase in the shipment of equipment to our business customers.
RESEARCH AND DEVELOPMENT EXPENSES
|
|
Years Ended March 31,
|
Year-over-Year Change
|
||||||||||||||||||||||
|
|
2019
|
2018
|
2017
|
2019 to 2018
|
2018 to 2017
|
|||||||||||||||||||
|
|
(dollar amounts in thousands)
|
|
|
|||||||||||||||||||||
|
Research and development
|
$
|
62,063
|
|
$
|
36,405
|
|
$
|
28,999
|
|
$
|
25,658
|
|
70.5
|
%
|
7,406
|
|
25.5
|
%
|
||||||
|
Percentage of total revenue
|
17.6
|
%
|
12.3
|
%
|
11.4
|
%
|
|
|
|
|
||||||||||||||
Historically, our research and development expenses have consisted primarily of personnel, various third-party consulting costs and equipment costs necessary for us to conduct our development and engineering efforts.
The increase in research and development expenses for fiscal
2019
from fiscal
2018
was primarily due to a $8.2 million increase in payroll and related expenses (partially related to a department reclassification from sales and marketing), net of capitalized costs, a $5.9 million increase in consulting and outside service expenses, a $5.7 million increase in stock-based compensation expenses, a $1.7 million increase in amortization of capitalized software, and a $1.3 million increase in software expenses.
The increase in research and development expenses for fiscal
2018
from fiscal
2017
was primarily due to a $7.9 million increase in payroll and related expenses, net of capitalized costs, a $3.1 million increase in stock-based compensation expenses, partially offset by decreases to facility and other allocated costs.
40
For fiscal
2020
, we expect research and development expenses to increase in absolute dollars as we continue to invest in our development efforts.
SALES AND MARKETING EXPENSES
|
|
Years Ended March 31,
|
Year-over-Year Changes
|
||||||||||||||||||||||
|
|
2019
|
2018
|
2017
|
2019 to 2018
|
2018 to 2017
|
|||||||||||||||||||
|
|
(dollar amounts in thousands)
|
|
|
|||||||||||||||||||||
|
Sales and marketing
|
$
|
177,976
|
|
$
|
133,945
|
|
$
|
98,893
|
|
$
|
44,031
|
|
32.9
|
%
|
35,052
|
|
35.4
|
%
|
||||||
|
Percentage of total revenue
|
50.5
|
%
|
45.2
|
%
|
39.0
|
%
|
|
|
|
|
||||||||||||||
Sales and marketing expenses consist primarily of personnel and related overhead costs for sales and marketing. Such costs also include sales commissions, trade shows, advertising and other marketing, demand generation, channel, and promotional expenses.
The increase in sales and marketing expenses for fiscal
2019
from fiscal
2018
was primarily due to a $20.8 million increase in payroll and related expenses from an increase in our sales force, a $10.5 million increase in advertising, a $5.3 million increase in stock-based compensation expenses, a $3.5 million increase in consulting and outside service expenses and a $3.0 million increase in travel expenses.
The increase in sales and marketing expenses for fiscal
2018
from fiscal
2017
was primarily due to a $7.7 million increase in allocated costs, a $5.4 million increase in payroll and related expenses from an increase in our sales force, a $5.0 million increase in advertising, a $4.3 million increase in third-party sales commissions, a $2.0 million increase in consulting and outside service expenses, a $1.7 million increase in stock-based compensation expenses, and a $1.5 million increase in travel expenses.
For fiscal
2020
, we expect selling and marketing expenses to increase in absolute dollars as we continue to invest in our sales, demand generation, channel and marketing programs.
GENERAL AND ADMINISTRATIVE EXPENSES
|
|
Years Ended March 31,
|
Year-over-Year Change
|
||||||||||||||||||||||
|
|
2019
|
2018
|
2017
|
2019 to 2018
|
2018 to 2017
|
|||||||||||||||||||
|
|
(dollar amounts in thousands)
|
|||||||||||||||||||||||
|
General and administrative
|
$
|
73,563
|
|
$
|
51,851
|
|
$
|
41,875
|
|
$
|
21,712
|
|
41.9
|
%
|
9,976
|
|
23.8
|
%
|
||||||
|
Percentage of total revenue
|
20.9
|
%
|
17.5
|
%
|
|
|
|
|
||||||||||||||||
General and administrative expenses consist primarily of personnel and related overhead costs and professional service fees for finance, legal, human resources, employee recruiting, and general management. IT, facilities, and other allocable costs are allocated to other departments based on headcount.
The increase in general and administrative expenses for fiscal
2019
from fiscal
2018
was primarily due to a $6.3 million increase in sales and use tax expense, a $4.8 million increase in rent expense related to additional office space, which we started to build out during the first quarter of fiscal 2019 (and which we subleased and assigned in April 2019), a $2.8 million increase in stock-based compensation expenses, a $2.2 million increase in payroll and related expenses, a $1.5 million increase in recruiting expenses, and a $1.4 million increase in consulting and outside service expenses.
The increase in general and administrative expenses for fiscal
2018
from fiscal
2017
was primarily due to a $4.4 million increase in payroll and related expenses, a $2.9 million increase in stock-based compensation expenses and a $1.4 million increase in facility expense.
For fiscal
2020
, we expect general and administrative expenses to increase in absolute dollars in order to support the growth of our business.
41
IMPAIRMENT OF EQUIPMENT, INTANGIBLES AND GOODWILL
|
|
Years Ended March 31,
|
Year-over-Year
|
||||||||||||
|
|
2019
|
2018
|
Change
|
|||||||||||
|
|
(dollar amounts in thousands)
|
|
|
|||||||||||
|
Impairment of equipment, intangible assets and goodwill
|
$
|
—
|
|
$
|
9,469
|
|
$
|
(9,469
|
)
|
100.0
|
%
|
|||
|
Percentage of total revenue
|
—
|
|
3.2
|
%
|
|
|
|
|
||||||
In fiscal 2018, we recorded a $9.5 million impairment charge for goodwill and other assets associated with DXI as a result in the Company's change in product and marketing strategy for the use of DXI's technology.
INTEREST INCOME AND OTHER, NET
|
|
Years Ended March 31,
|
Year-over-Year Change
|
||||||||||||
|
|
2019
|
2018
|
Change
|
|||||||||||
|
|
(dollar amounts in thousands)
|
|
|
|||||||||||
|
Other income, net
|
$
|
2,818
|
|
$
|
3,693
|
|
$
|
(875
|
)
|
(23.7
|
)%
|
|||
|
Percentage of total revenue
|
0.8
|
%
|
1.2
|
%
|
|
|
|
|
||||||
This item primarily consisted of interest income earned on our cash, cash equivalents and investments in fiscal
2019
and
2018
. In fiscal 2018, $1.4 million of the cash held in an escrow fund from our 2015 acquisition of DXI was returned to us and recorded as other income.
PROVISION (BENEFIT) FOR INCOME TAXES
|
|
Years Ended March 31,
|
Year-over-Year
|
|||||||||||
|
|
2019
|
2018
|
Change
|
||||||||||
|
|
(dollar amounts in thousands)
|
|
|
||||||||||
|
Provision (benefit) for income taxes
|
$
|
569
|
|
$
|
66,294
|
|
$
|
(65,725
|
)
|
N/A
|
|||
|
Percentage of total revenue
|
0.2
|
%
|
22.4
|
%
|
|
|
|
||||||
For the twelve months ended
March 31, 2019
, we recorded an income tax expense of
$0.6 million
, mostly related to the current tax liabilities of profitable foreign subsidiaries and state minimum taxes. For the twelve months ended
March 31, 2018
, we recorded an income tax expense of
$66.3 million
, mostly related to the recording of a full valuation allowance established against our deferred tax assets in the quarter ended December 31, 2017.
We record deferred taxes based on differences between the financial statement basis and tax basis of assets and liabilities and available tax loss and credit carryforwards. In evaluating our ability to utilize our deferred tax assets, we consider available evidence, both positive and negative, in determining future taxable income on a jurisdiction-by-jurisdiction basis. We record a valuation allowance against deferred tax assets if, based on the weight of the evidence, it is more likely than not that some portion or all of the deferred tax assets will not be realized. A significant item of objective negative evidence considered was the historical three-year cumulative pretax loss reached in fiscal 2018. As a result, we recorded a full valuation allowance against our U.S. deferred tax assets in the period ended December 31, 2017.
The Tax Cuts and Jobs Act ("the Act") that was enacted on December 22, 2017, significantly reformed the Internal Revenue Code of 1986, as amended. The Act contains significant changes to corporate taxation, including reduction of the corporate tax rate from 35% to 21%, limitation of the tax deduction for interest expense to 30% of earnings, limitation of the deduction for net operating losses to 80% of current year taxable income and elimination of net operating loss carrybacks, one time taxation of offshore earnings at reduced rates regardless of whether they are repatriated, elimination of U.S. tax on foreign earnings (subject to certain important exceptions), immediate deductions for certain new investments instead of deductions for depreciation expense over time, and modifying or repealing many business deductions and credits. In the third quarter of fiscal 2018, we remeasured our deferred tax assets and liabilities based on the rates at which they are expected to reverse in the future, which is generally 21%. We recorded no one-time transition tax liability for our foreign subsidiaries as our preliminary calculations concluded we do not have any untaxed foreign accumulated earnings.
We estimate our annual effective tax rate at the end of each quarter. In estimating the annual effective tax rate, we consider, among other things, annual pre-tax income, permanent tax differences, the geographic mix of pre-tax income and the application and interpretations of existing tax laws. We record the tax effect of certain discrete items, which are unusual or occur infrequently, in the interim period in which they occur, including changes in judgment about deferred tax valuation
42
allowances. The determination of the effective tax rate reflects tax expense and benefit generated in certain domestic and foreign jurisdictions. However, jurisdictions with a year-to-date loss where no tax benefit can be recognized are excluded from the annual effective tax rate.
LIQUIDITY AND CAPITAL RESOURCES
As of
March 31, 2019
, we had
$346.5 million
of cash, cash equivalents and investments. In addition, we had
$8.1 million
in deposits as restricted cash in support of a letter of credit, securing a lease for a new facility in San Jose, California. By comparison, at
March 31, 2018
, we had
$152.3 million
of cash, cash equivalents and investments as well as the
$8.1 million
in deposit as restricted cash. We believe that our existing cash, cash equivalents and investment balances, and our anticipated cash flows from operations will be sufficient to meet our working capital and expenditure requirements for the next twelve months.
Year over Year Changes
Net cash used in operating activities for fiscal
2019
was
$14.9 million
, compared with
$22.0 million
provided by operating activities for fiscal
2018
. Cash used in or provided by operating activities has historically been affected by:
• the amount of net income or loss;
• the amount of non-cash expense items such as deferred income tax, depreciation, amortization and impairments;
• the expense associated with stock options and stock-based awards; and
• changes in working capital accounts, particularly in the timing of collections from receivable and payments of obligations.
Net cash provided by investing activities was
$10.9 million
in fiscal
2019
, compared with
$7.3 million
used in investing activities in fiscal
2018
. The cash provided by investing activities during fiscal
2019
was primarily related to
$51.2 million
of proceeds from sales and maturities of investments, net of purchases of investments. This was partially offset by
$9.1 million
of property and equipment investments and capitalized internal software development costs of
$25.6 million
.
Net cash provided by financing activities was
$249.2 million
in fiscal
2019
, compared with
$16.4 million
used in financing activities in fiscal
2018
. Our financing activities for fiscal
2019
provided cash of
$279.5 million
from the issuance of convertible debt and
$12.2 million
from the issuance of common stock under employee stock purchase plans. These inflows were partially offset by
$33.7 million
in capped call transactions,
$7.8 million
to settle payroll tax obligations and
$0.9 million
to make payments for lease obligations.
Contractual Obligations
Future convertible senior note obligations, operating lease payments, capital lease payments and purchase obligations at March 31, 2019 for the next five years were as follows (in thousands):
|
|
Year Ending March 31,
|
|
|
||||||||||||||||||||||||
|
|
2020
|
2021
|
2022
|
2023
|
2024
|
Thereafter
|
Total
|
||||||||||||||||||||
|
Convertible senior notes
|
—
|
|
—
|
|
—
|
|
—
|
|
216,035
|
|
—
|
|
216,035
|
|
|||||||||||||
|
Capital leases
|
436
|
|
64
|
|
19
|
|
15
|
|
15
|
|
—
|
|
549
|
|
|||||||||||||
|
Office leases
|
7,143
|
|
8,907
|
|
8,797
|
|
1,556
|
|
1,140
|
|
2,279
|
|
29,822
|
|
|||||||||||||
|
Purchase obligations:
|
|
|
|||||||||||||||||||||||||
|
Third party customer support provider
|
1,900
|
|
—
|
|
—
|
|
—
|
|
—
|
|
—
|
|
1,900
|
|
|||||||||||||
|
Third party network service providers
|
1,100
|
|
—
|
|
—
|
|
—
|
|
—
|
|
—
|
|
1,100
|
|
|||||||||||||
|
|
$
|
10,579
|
|
$
|
8,971
|
|
$
|
8,816
|
|
$
|
1,571
|
|
$
|
217,190
|
|
$
|
2,279
|
|
$
|
249,406
|
|
||||||
Our capital lease obligations consist of leases for computer equipment and furniture.
Our office lease obligations consist of our principal facility and various leased facilities under operating lease agreements, which expire on various dates from fiscal 2020 through fiscal 2026. The Company leases its current headquarters facility in San Jose, California under an operating lease agreement that expires in October 2019.
In the fourth quarter of fiscal 2018, we entered into a 132-month lease to rent approximately 162,000 square feet of office space in a new building in San Jose, California. The lease term began on January 1, 2019. On April 30, 2019, due to our rapid growth over the last year and our greater than anticipated future space needs, we entered into an agreement to assign the lease. We
43
expect to be released from all of our obligations under the lease and related standby letter of credit by the end of our fiscal year ending March 31, 2022 or shortly thereafter.
CRITICAL ACCOUNTING POLICIES & ESTIMATES
Our consolidated financial statements are prepared in conformity with accounting principles generally accepted in the United States of America. Note 1 to the consolidated financial statements in Part II, Item 8 of this Report describes the significant accounting policies and methods used in the preparation of our consolidated financial statements.
We have identified the policies below as some of the more critical to our business and the understanding of our results of operations. These policies may involve a higher degree of judgment and complexity in their application and represent the critical accounting policies used in the preparation of our consolidated financial statements. Although we believe our judgments and estimates are appropriate, actual future results may differ from our estimates. If different assumptions or conditions were to prevail, the results could be materially different from our reported results. The impact and any associated risks related to these policies on our business operations is discussed throughout Management's Discussion and Analysis of Financial Condition and Results of Operations where such policies affect our reported and expected financial results.
Use of Estimates
The preparation of the consolidated financial statements in conformity with accounting principles generally accepted in the United States requires management to make estimates and assumptions that affect the reported amounts of assets, liabilities and equity and disclosure of contingent assets and liabilities at the date of the consolidated financial statements and the reported amounts of revenues and expenses during the reporting period. On an on-going basis, we evaluate such estimates, including, but not limited to, those related to, revenue recognition, bad debts, returns reserve for expected cancellations, income and sales tax, and litigation and other contingencies. We base our estimates on historical experience and on various other assumptions that are believed to be reasonable under the circumstances, the results of which form the basis for making judgments about the carrying value of assets and liabilities, and equity that are not readily apparent from other sources. Our actual results could differ from those estimates under different assumptions or conditions.
Additional information regarding risk factors that may impact our estimates is included above under Part I, Item 1A, "Risk Factors."
Revenue Recognition
Our revenue recognition policies are also described in Note 1 to the consolidated financial statements in Part II, Item 8 of this Annual Report. As described below, significant management judgments and estimates must be made and used in connection with the revenue recognized in any accounting period. Material differences may result in the amount and timing of our revenue for any period if our management made different judgments or utilized different estimates.
We recognize service revenue, mainly from subscription services to its cloud-based voice, call center, video and collaboration solutions using the five-step model as prescribed by ASU No. 2014-09,
Revenue from Contracts with Customers (ASC 606), as amended:
Topic 606:
• Identification of the contract, or contracts, with a customer;
• Identification of the performance obligations in the contract;
• Determination of the transaction price;
• Allocation of the transaction price to the performance obligations in the contract; and
• Recognition of revenue when or as, the Company satisfies a performance obligation.
We identify performance obligations in contracts with customers, which may include subscription services and related usage, product revenue and professional services. The transaction price is determined based on the amount we expect to be entitled to receive in exchange for transferring the promised services or products to the customer. The transaction price in the contract is allocated to each distinct performance obligation in an amount that represents the relative amount of consideration expected to be received in exchange for satisfying each performance obligation. Revenue is recognized when performance obligations are satisfied. Revenues are recorded based on the transaction price excluding amounts collected on behalf of third parties such as sales and telecommunication taxes, which are collected on behalf of and remitted to governmental authorities. We usually bill our customers on a monthly basis. Contracts typically range from annual to multi-year agreements with payment terms of net 30 days or less. We occasionally allow a 30-day period to cancel a subscription and return products shipped for a full refund.
Service Revenue
44
Service revenue from subscriptions to our cloud-based technology platform is recognized over time on a ratable basis over the contractual subscription term beginning on the date that the platform is made available to the customer till the end of the contractual period. Payments received in advance of subscription services being rendered are recorded as a deferred revenue. Usage fees, either bundled or not bundled, are recognized when we have a right to invoice. Professional services for configuration, system integration, optimization, customer training or education are primarily billed on a fixed-fee basis and are performed by us directly or, alternatively, customers may also choose to perform these services themselves or engage their own third-party service providers. Professional services revenue is recognized over time as the services are rendered. When a contract with a customer is signed, we assess whether collection of the fees under the arrangement is probable. We estimate the amount to reserve for uncollectible amounts based on the aging of the contract balance, current and historical customer trends, and communications with its customers. These reserves are recorded as operating expenses against the contract asset (Accounts Receivable). In the normal course of business, we record revenue reductions for customer credits.
Product Revenue
We recognize product revenue for telephony equipment at a point in time, when transfer of control has occurred, which is generally upon shipment. Sales returns are recorded as a reduction to revenue estimated based on historical experience.
Collectability of Accounts Receivable
We must make estimates of the collectability of our accounts receivable. Management specifically analyzes accounts receivable, including historical bad debts, customer concentrations, customer creditworthiness, current economic trends and changes in our customer payment terms when evaluating the adequacy of the allowance for doubtful accounts. If the financial condition of our customers deteriorates, our actual losses may exceed our estimates, and additional allowances would be required.
Goodwill and Other Intangible Assets
Goodwill and intangible assets with indefinite useful lives are not amortized. Goodwill represents the excess fair value of consideration transferred over the fair value of net assets acquired in business combinations. The carrying value of goodwill and indefinite lived intangible assets are not amortized but are annually tested for impairment and more often if there is an indicator of impairment.
We perform an annual goodwill impairment test on January 1 of each year and during the year, whenever a triggering event for such an assessment is identified. During the third quarter of fiscal year 2018, we changed our product and marketing strategy for the use of DXI's technology and re-assessed the profitability outlook which triggered us testing the recorded goodwill for impairment. First, we estimated the fair value of our three reporting units at the time using the market approach. Under the market approach, we utilized the market capitalization of our publicly-traded shares and comparable company information to determine revenue multiples which were used to determine the fair value of each reporting unit. Based on this approach, we determined that there was an indication of impairment only for our DXI reporting unit in the UK as the carrying value including goodwill exceeded its estimated fair value. As largely independent cash flows could not be attributed to any assets individually we evaluated DXI's assets and liabilities as one asset group. Then we estimated the fair value of DXI's using discounted cash flow methods to determine the implied fair value of goodwill. The difference between this implied fair value of the goodwill and its carrying value was recorded as impairment. The outcome of the analysis resulted in a non-cash expense for impairment of property and equipment, intangible assets and goodwill of $0.3 million, $1.2 million and $8.0 million, respectively, which was recorded during the third quarter of fiscal year 2018 as a separate line item in our Consolidated Statements of Operations.
For the year ended March 31, 2018, we determined that we had three reporting units and allocated goodwill to the reporting units for the purposes of our annual impairment test. For the year ended March 31, 2019, we determined we had one reporting unit. The change in reporting units resulted from the following events:
|
•
|
As of April 1, 2018, The Company's DXI operations no longer operated on a stand alone basis and was integrated into the Company's existing United Kingdom operations, and
|
|
•
|
During the third fiscal quarter of 2019, the Company assessed it had only one Chief Operating Decision Maker, who reviewed financial results on a consolidated basis.
|
In the fourth quarter of fiscal 2019, we early adopted the provisions of ASU 2017-04,
Simplifying the Test for Goodwill Impairment
. See Note 1 to the consolidated financial statements in Part II, Item 8 of this Report for additional information.
Internal - Use Software Development Costs
45
We account for computer software developed or obtained for internal use in accordance with ASC 350-40,
Internal Use Software
(ASC 350-40), which requires capitalization of certain software development costs incurred during the application development stage. In accordance with authoritative guidance, we begin to capitalize our costs to develop software when preliminary development efforts are successfully completed, management has authorized and committed project funding, and it is probable that the project will be completed and the software will be used as intended. Once the project has been completed, these costs are amortized on a straight-line basis over the estimated useful life of the related asset, generally estimated to be three years. Costs incurred prior to meeting these criteria together with costs incurred for training and maintenance are expensed as incurred and recorded in research and development expense on our consolidated statements of operations.
Income and Other Taxes
As part of the process of preparing our consolidated financial statements we are required to estimate our income taxes in each of the jurisdictions in which we operate. This process requires us to estimate our actual current tax expense and to assess temporary differences resulting from book-tax accounting differences for items such as accrued vacation. These differences result in deferred tax assets and liabilities, which are included within our consolidated balance sheet. We must then assess the likelihood that our deferred tax assets will be recovered from future taxable income and to the extent we believe that recovery is not likely, we must establish a valuation allowance.
Significant management judgment is required to determine the valuation allowance recorded against our net deferred tax assets, which include net operating loss and tax credit carry forwards. The valuation allowance is based on our estimates of taxable income by jurisdiction in which we operate and the period over which our deferred tax assets will be recoverable.
In evaluating our ability to utilize our deferred tax assets, we consider available evidence, both positive and negative, in determining future taxable income on a jurisdiction-by-jurisdiction basis. We record a valuation allowance against deferred tax assets if, based on the weight of the evidence, it is more likely than not that some portion or all of the deferred tax assets will not be realized. A significant item of objective negative evidence considered was the historical three-year cumulative pretax loss as of the end of our third quarter of fiscal 2018. As a result, we recorded a full valuation allowance against our U.S. deferred tax assets during that period. As of March 31, 2019, we maintained a full valuation allowance against our net deferred tax asset on the consolidated balance sheet.
We estimate our annual effective tax rate at the end of each quarter. In estimating the annual effective tax rate, we consider, among other things, annual pre-tax income, permanent tax differences, the geographic mix of pre-tax income and the application and interpretations of existing tax laws. We record the tax effect of certain discrete items, which are unusual or occur infrequently, in the interim period in which they occur, including changes in judgment about deferred tax valuation allowances. The determination of the effective tax rate reflects tax expense and benefit generated in certain domestic and foreign jurisdictions. However, jurisdictions with a year-to-date loss where no tax benefit can be recognized are excluded from the annual effective tax rate.
Our products and services are subject to sales, use and utility taxes and other fees in many jurisdictions. We assess, collect and remit these taxes and report them to municipal, state and federal agencies on a monthly or quarterly basis. We regularly receive inquiries, demands or audit requests from these municipal and state tax agencies. During the year ended March, 31, 2019, we determined that additional sales taxes were probable of being assessed and estimable in multiple states as a result of findings from sales and use tax audits. As of March 31. 2019 we estimated this incremental sales tax liability to be $8.0 million.
Stock-Based Compensation
We account for our employee stock options, stock purchase rights, restricted stock units, and restricted performance stock units granted under the provisions of ASC 718 -
Stock Compensation
. Under the provisions of ASC 718, stock-based compensation cost is measured at the grant date, based on the estimated fair value of the award, and is recognized as an expense over the employee's requisite service period (generally the vesting period of the equity grant), net of estimated forfeitures.
Compensation expense for stock-based payment awards is recognized over the requisite service period using the straight-line method and includes the impact of estimated forfeitures.
To value option grants under the Equity Compensation Plans for stock-based compensation, we used the Black-Scholes option valuation model. Fair value determined using the Black-Scholes option valuation model varies based on assumptions used for the expected stock prices volatility, expected life, risk-free interest rates and future dividend payments. We used the historical volatility of our stock over a period equal to the expected life of the options. The expected life assumptions represent the weighted-average period stock-based awards are expected to remain outstanding. We established expected life assumptions through the review of historical exercise behavior of stock-based award grants with similar vesting periods. The risk-free interest rate was based on the closing market bid yields on actively traded U.S. treasury securities in the over-the-counter
46
market for the expected term equal to the expected term of the option. The dividend yield assumption was based on our history and expectation of future dividend payout.
To value restricted performance stock units under the Equity Compensation Plans, we used a Monte Carlo simulation model. Fair value determined using the Monte Carlo simulation model varies based on the assumptions used for the expected stock price volatility, the correlation coefficient between the Company and the NASDAQ Composite Index, risk-free interest rates, and future dividend payments. We used the historical volatility and correlation of our stock and the Index over a period equal to the remaining performance period as of the grant date. The risk-free interest rate was based on the closing market bid yields of actively traded U.S. treasury securities in the over-the-counter market for the expected term equal to the remaining performance period as of the grant date. The dividend yield assumption was based on our history of not paying dividends.
Recently Issued and Adopted Accounting Pronouncements
Recent accounting pronouncements are detailed in Note 1 to our Consolidated Financial Statements included in Part II, Item 8 of this Annual Report on Form 10-K.
ITEM 7A. QUANTITATIVE AND QUALITATIVE DISCLOSURES ABOUT MARKET RISK
Interest Rate Fluctuation Risk
The primary objective of our investment activities is to preserve principal while maximizing income without significantly increasing risk. Some of the securities in which we invest may be subject to market risk. This means that a change in prevailing interest rates may cause the principal amount of the investment to fluctuate. To minimize this risk, we may maintain our portfolio of cash equivalents and investments of short durations in a variety of securities, including commercial paper, money market funds, debt securities and certificates of deposit.
As of
March 31, 2019
, we had
$216.0 million
outstanding on our 0.50% convertible senior notes (the Notes) due 2024. The values of the Notes are exposed to interest rate risk. Generally, the fair market value of our fixed interest rate Notes will increase as interest rates fall and decrease as interest rates rise. In addition, the fair values of the Notes are affected by our stock price. The fair market value of the Notes will generally increase as our common stock price increases and will generally decrease as our common stock price declines in value. However, we carry the Notes at face value less unamortized discount on our balance sheet, and we present the fair value for required disclosure purposes only.
We do not believe that a hypothetical 10% change in interest rates would have a material impact on our interest income or expenses, convertible senior notes, or financial statements for any periods presented.
Foreign Currency Exchange Risk
We have foreign currency risks related to our revenue and operating expenses denominated in currencies other than the U.S. dollar, primarily the British Pound, causing both our revenue and our operating results to be impacted by fluctuations in the exchange rates.
Gains or losses from the translation of certain cash balances, accounts receivable balances and intercompany balances that are denominated in these currencies impact our net income (loss). A hypothetical decrease in all foreign currencies against the US dollar of 10 percent, would not result in a material foreign currency loss on foreign-denominated balances, at
March 31, 2019
. As our foreign operations expand, our results may be more impacted by fluctuations in the exchange rates of the currencies in which we do business.
At this time, we do not, but we may in the future, enter into financial instruments to hedge our foreign currency exchange risk.
47
ITEM 8. FINANCIAL STATEMENTS AND SUPPLEMENTARY DATA
INDEX TO FINANCIAL STATEMENTS AND FINANCIAL STATEMENT SCHEDULE
|
|
Page
|
|
FINANCIAL STATEMENTS:
|
|
48
REPORT OF INDEPENDENT REGISTERED PUBLIC ACCOUNTING FIRM
To the Shareholders and the Board of Directors
8x8, Inc.
Opinions on the Financial Statements and Internal Control over Financial Reporting
We have audited the accompanying consolidated balance sheets of 8x8, Inc. (the “Company”) as of March 31, 2019 and 2018, the related
consolidated
statements of operations, comprehensive income (loss), stockholders’ equity, and cash flows for each of the three years in the period ended March 31, 2019, and the related notes (collectively referred to as the “consolidated financial statements”). We also have audited the Company’s internal control over financial reporting as of March 31, 2019, based on criteria established in
Internal Control - Integrated Framework (2013)
issued by the Committee of Sponsoring Organizations of the Treadway Commission (COSO).
In our opinion, the consolidated financial statements referred to above present fairly, in all material respects, the consolidated
financial position of the Company as of March 31, 2019 and 2018, and the
consolidated
results of its operations and its cash flows for each of the three years in the period ended March 31, 2019, in conformity with accounting principles generally accepted in the United States of America. Also in our opinion, the Company maintained, in all material respects, effective internal control over financial reporting as of March 31, 2019, based on criteria established in
Internal Control - Integrated Framework (2013)
issued by COSO.
Change in Accounting Principle
As discussed in Note 1 to the consolidated financial statements, in 2019 the Company changed its method of accounting for revenue recognition due to the adoption of Accounting Standards Codification Topic No. 606.
Basis for Opinions
The Company’s management is responsible for these
consolidated financial statements, for maintaining effective internal control over financial reporting, and for its assessment of the effectiveness of internal control over financial reporting, included in the accompanying
Management’s Report on Internal Control Over Financial Reporting
under Item 9A. Our responsibility is to express an opinion on the Company’s consolidated financial statements and an opinion on the Company’s internal control over financial reporting based on our audits. We are a public accounting firm registered with the Public Company Accounting Oversight Board (United States) (“PCAOB”) and are required to be independent with respect to the Company in accordance with the U.S. federal securities laws and the applicable rules and regulations of the Securities and Exchange Commission and the PCAOB.
We conducted our audits in accordance with the standards of the PCAOB. Those standards require that we plan and perform the audits to obtain reasonable assurance about whether the consolidated
financial statements are free of material misstatement, whether due to error or fraud, and whether effective internal control over financial reporting was maintained in all material respects.
Our audits of the consolidated financial statements included performing procedures to assess the risks of material misstatement of the consolidated financial statements, whether due to error or fraud, and performing procedures to respond to those risks. Such procedures included examining, on a test basis, evidence regarding the amounts and disclosures in the consolidated financial statements. Our audits also included evaluating the accounting principles used and significant estimates made by management, as well as evaluating the overall presentation of the consolidated financial statements. Our audit of internal control over financial reporting included obtaining an understanding of internal control over financial reporting, assessing the risk that a material weakness exists, and testing and evaluating the design and operating effectiveness of internal control based on the assessed risk. Our audits also included performing such other procedures as we considered necessary in the circumstances. We believe that our audits provide a reasonable basis for our opinions.
Definition and Limitations of Internal Control Over Financial Reporting
A company’s internal control over financial reporting is a process designed to provide reasonable assurance regarding the reliability of financial reporting and the preparation of financial statements for external purposes in accordance with generally accepted accounting principles. A company’s internal control over financial reporting includes those policies and procedures that (1) pertain to the maintenance of records that, in reasonable detail, accurately and fairly reflect the transactions and dispositions of the assets of the company; (2) provide reasonable assurance that transactions are recorded as necessary to permit preparation of financial statements in accordance with generally accepted accounting principles, and that receipts and expenditures of the company are being made only in accordance with authorizations of management and directors of the company; and (3) provide reasonable assurance regarding prevention or timely detection of unauthorized acquisition, use, or disposition of the company’s assets that could have a material effect on the financial statements.
Because of its inherent limitations, internal control over financial reporting may not prevent or detect misstatements. Also, projections of any evaluation of effectiveness to future periods are subject to the risk that controls may become inadequate because of changes in conditions, or that the degree of compliance with the policies or procedures may deteriorate.
/s/ Moss Adams LLP
San Francisco, California
May 21, 2019
We have served as the Company's auditor since 2008.
49
8X8, INC.
CONSOLIDATED BALANCE SHEETS
(IN THOUSANDS, EXCEPT SHARE AND PER SHARE AMOUNTS)
|
March 31,
|
|||||||
|
2019
|
2018
|
||||||
|
ASSETS
|
|||||||
|
Current assets:
|
|||||||
|
Cash and cash equivalents
|
$
|
276,583
|
|
$
|
31,703
|
|
|
|
Short-term investments
|
69,899
|
|
120,559
|
|
|||
|
Accounts receivable, net
|
20,181
|
|
16,296
|
|
|||
|
Deferred sales commission costs
|
15,601
|
|
—
|
|
|||
|
Other current assets
|
15,127
|
|
10,040
|
|
|||
|
Total current assets
|
397,391
|
|
178,598
|
|
|||
|
Property and equipment, net
|
52,835
|
|
35,732
|
|
|||
|
Intangible assets, net
|
11,680
|
|
11,958
|
|
|||
|
Goodwill
|
39,694
|
|
40,054
|
|
|||
|
Restricted cash
|
8,100
|
|
8,100
|
|
|||
|
Deferred sales commission costs, non-current
|
33,693
|
|
—
|
|
|||
|
Other assets
|
2,965
|
|
2,767
|
|
|||
|
Total assets
|
$
|
546,358
|
|
$
|
277,209
|
|
|
|
LIABILITIES AND STOCKHOLDERS' EQUITY
|
|||||||
|
Current liabilities:
|
|||||||
|
Accounts payable
|
$
|
32,280
|
|
$
|
23,899
|
|
|
|
Accrued compensation
|
18,437
|
|
17,412
|
|
|||
|
Accrued taxes
|
13,862
|
|
6,367
|
|
|||
|
Deferred revenue
|
3,336
|
|
2,559
|
|
|||
|
Other accrued liabilities
|
6,790
|
|
6,026
|
|
|||
|
Total current liabilities
|
74,705
|
|
56,263
|
|
|||
|
Convertible senior notes, net
|
216,035
|
|
—
|
|
|||
|
Non-current liabilities
|
6,222
|
|
2,153
|
|
|||
|
Non-current deferred revenue
|
6
|
|
19
|
|
|||
|
Total liabilities
|
296,968
|
|
58,435
|
|
|||
|
Commitments and contingencies (Note 6)
|
|
|
|
|
|||
|
Stockholders' equity:
|
|||||||
|
Preferred stock, $0.001 par value:
|
|||||||
|
Authorized: 5,000,000 shares;
|
|||||||
|
Issued and outstanding: no shares at March 31, 2019 and 2018
|
—
|
|
—
|
|
|||
|
Common stock, $0.001 par value:
|
|||||||
|
Authorized: 200,000,000 shares;
|
|||||||
|
Issued and outstanding: 96,119,888 shares and 92,847,354 shares
|
|||||||
|
at March 31, 2019 and 2018, respectively
|
96
|
|
93
|
|
|||
|
Additional paid-in capital
|
506,949
|
|
425,790
|
|
|||
|
Accumulated other comprehensive loss
|
(7,353
|
)
|
(5,645
|
)
|
|||
|
Accumulated deficit
|
(250,302
|
)
|
(201,464
|
)
|
|||
|
Total stockholders' equity
|
249,390
|
|
218,774
|
|
|||
|
Total liabilities and stockholders' equity
|
$
|
546,358
|
|
$
|
277,209
|
|
|
The accompanying notes are an integral part of these consolidated financial statements.
50
8X8, INC.
CONSOLIDATED STATEMENTS OF OPERATIONS
(IN THOUSANDS, EXCEPT PER SHARE AMOUNTS)
|
|
Years Ended March 31,
|
||||||||||
|
|
2019
|
2018
|
2017
|
||||||||
|
Service revenue
|
$
|
334,438
|
|
$
|
280,430
|
|
$
|
235,816
|
|
||
|
Product revenue
|
18,148
|
|
16,070
|
|
17,572
|
|
|||||
|
Total revenue
|
352,586
|
|
296,500
|
|
253,388
|
|
|||||
|
Operating expenses:
|
|||||||||||
|
Cost of service revenue
|
107,192
|
|
86,244
|
|
70,576
|
|
|||||
|
Cost of product revenue
|
22,780
|
|
20,482
|
|
19,714
|
|
|||||
|
Research and development
|
62,063
|
|
36,405
|
|
28,999
|
|
|||||
|
Sales and marketing
|
177,976
|
|
133,945
|
|
98,893
|
|
|||||
|
General and administrative
|
73,563
|
|
51,851
|
|
41,875
|
|
|||||
|
Impairment of goodwill, intangible assets and equipment
|
—
|
|
9,469
|
|
—
|
|
|||||
|
Total operating expenses
|
443,574
|
|
338,396
|
|
260,057
|
|
|||||
|
Loss from operations
|
(90,988
|
)
|
(41,896
|
)
|
(6,669
|
)
|
|||||
|
Other income, net
|
2,818
|
|
3,693
|
|
1,792
|
|
|||||
|
Loss before provision (benefit) for income taxes
|
(88,170
|
)
|
(38,203
|
)
|
(4,877
|
)
|
|||||
|
Provision (benefit) for income taxes
|
569
|
|
66,294
|
|
(126
|
)
|
|||||
|
Net loss
|
$
|
(88,739
|
)
|
$
|
(104,497
|
)
|
$
|
(4,751
|
)
|
||
|
Net loss per share:
|
|
|
|
|
|
|
|||||
|
Basic and diluted
|
$
|
(0.94
|
)
|
$
|
(1.14
|
)
|
$
|
(0.05
|
)
|
||
|
Weighted average number of shares:
|
|||||||||||
|
Basic and diluted
|
94,533
|
|
92,017
|
|
90,340
|
|
|||||
The accompanying notes are an integral part of these consolidated financial statements.
51
8X8, INC.
CONSOLIDATED STATEMENTS OF COMPREHENSIVE INCOME (LOSS)
(IN THOUSANDS)
|
|
Years Ended March 31,
|
||||||||||
|
2019
|
2018
|
2017
|
|||||||||
|
Net loss
|
$
|
(88,739
|
)
|
$
|
(104,497
|
)
|
$
|
(4,751
|
)
|
||
|
Other comprehensive income (loss), net of tax
|
|||||||||||
|
Unrealized gains (losses) on investments in securities
|
473
|
|
(259
|
)
|
70
|
|
|||||
|
Foreign currency translation adjustment
|
(2,181
|
)
|
4,256
|
|
(5,528
|
)
|
|||||
|
Comprehensive loss
|
$
|
(90,447
|
)
|
$
|
(100,500
|
)
|
$
|
(10,209
|
)
|
||
The accompanying notes are an integral part of these consolidated financial statements.
52
8X8, INC.
CONSOLIDATED STATEMENTS OF STOCKHOLDERS' EQUITY
(IN THOUSANDS, EXCEPT SHARES)
|
|
Common Stock
|
Additional
Paid-in
Capital
|
Accumulated
Other
Comprehensive
Income (Loss)
|
Accumulated
Deficit
|
Total
|
|||||||||||||||||
|
|
Shares
|
Amount
|
||||||||||||||||||||
|
Balance at March 31, 2016
|
89,213,205
|
|
$
|
89
|
|
$
|
389,260
|
|
$
|
(4,184
|
)
|
$
|
(109,859
|
)
|
$
|
275,306
|
|
|||||
|
Issuance of common stock under
|
||||||||||||||||||||||
|
stock plans
|
2,576,785
|
|
3
|
|
4,557
|
|
—
|
|
—
|
|
4,560
|
|
||||||||||
|
Withholding taxes from stock plans
|
(289,899
|
)
|
(1
|
)
|
(3,003
|
)
|
—
|
|
—
|
|
(3,004
|
)
|
||||||||||
|
Stock-based compensation expense
|
—
|
|
—
|
|
21,462
|
|
—
|
|
—
|
|
21,462
|
|
||||||||||
|
Income tax benefit from stock-
|
||||||||||||||||||||||
|
based compensation
|
—
|
|
—
|
|
486
|
|
—
|
|
—
|
|
486
|
|
||||||||||
|
Unrealized investment gain (loss)
|
—
|
|
—
|
|
—
|
|
70
|
|
—
|
|
70
|
|
||||||||||
|
Foreign currency translation adjustment
|
—
|
|
—
|
|
—
|
|
(5,528
|
)
|
—
|
|
(5,528
|
)
|
||||||||||
|
Net loss
|
—
|
|
—
|
|
—
|
|
—
|
|
(4,751
|
)
|
(4,751
|
)
|
||||||||||
|
Balance at March 31, 2017
|
91,500,091
|
|
91
|
|
412,762
|
|
(9,642
|
)
|
(114,610
|
)
|
288,601
|
|
||||||||||
|
Issuance of common stock under stock
|
||||||||||||||||||||||
|
plans, less withholding taxes
|
2,709,990
|
|
3
|
|
2,179
|
|
—
|
|
—
|
|
2,182
|
|
||||||||||
|
Repurchases of common stock
|
(1,362,727
|
)
|
(1
|
)
|
(17,933
|
)
|
—
|
|
—
|
|
(17,934
|
)
|
||||||||||
|
Stock-based compensation expense
|
28,782
|
|
—
|
|
—
|
|
28,782
|
|
||||||||||||||
|
Unrealized investment gain (loss)
|
—
|
|
—
|
|
—
|
|
(259
|
)
|
—
|
|
(259
|
)
|
||||||||||
|
Foreign currency translation adjustment
|
—
|
|
—
|
|
—
|
|
4,256
|
|
—
|
|
4,256
|
|
||||||||||
|
Adjustment from adoption of ASU 2016-9
|
—
|
|
—
|
|
—
|
|
—
|
|
17,643
|
|
17,643
|
|
||||||||||
|
Net loss
|
—
|
|
—
|
|
—
|
|
—
|
|
(104,497
|
)
|
(104,497
|
)
|
||||||||||
|
Balance at March 31, 2018
|
92,847,354
|
|
93
|
|
425,790
|
|
(5,645
|
)
|
(201,464
|
)
|
218,774
|
|
||||||||||
|
Issuance of common stock under stock
|
||||||||||||||||||||||
|
plans, less withholding taxes
|
3,272,534
|
|
3
|
|
4,483
|
|
—
|
|
—
|
|
4,486
|
|
||||||||||
|
Stock-based compensation expense
|
45,548
|
|
—
|
|
—
|
|
45,548
|
|
||||||||||||||
|
Unrealized investment gain (loss)
|
—
|
|
—
|
|
—
|
|
473
|
|
—
|
|
473
|
|
||||||||||
|
Foreign currency translation adjustment
|
—
|
|
—
|
|
—
|
|
(2,181
|
)
|
—
|
|
(2,181
|
)
|
||||||||||
|
Adjustment from adoption of ASC 606
|
—
|
|
—
|
|
—
|
|
—
|
|
39,901
|
|
39,901
|
|
||||||||||
|
Equity component of convertible senior notes, net of issuance costs
|
—
|
|
—
|
|
31,128
|
|
—
|
|
—
|
|
31,128
|
|
||||||||||
|
Net loss
|
—
|
|
—
|
|
—
|
|
—
|
|
(88,739
|
)
|
(88,739
|
)
|
||||||||||
|
Balance at March 31, 2019
|
96,119,888
|
|
$
|
96
|
|
$
|
506,949
|
|
$
|
(7,353
|
)
|
$
|
(250,302
|
)
|
$
|
249,390
|
|
|||||
The accompanying notes are an integral part of these consolidated financial statements.
53
8X8, INC.
CONSOLIDATED STATEMENTS OF CASH FLOWS
(IN THOUSANDS)
|
|
Years Ended March 31,
|
||||||||||
|
2019
|
2018
|
2017
|
|||||||||
|
Cash flows from operating activities:
|
|
|
|
||||||||
|
Net loss
|
$
|
(88,739
|
)
|
$
|
(104,497
|
)
|
$
|
(4,751
|
)
|
||
|
Adjustments to reconcile net loss to net cash (used in)
|
|||||||||||
|
provided by operating activities:
|
|||||||||||
|
Depreciation
|
8,748
|
|
8,171
|
|
6,084
|
|
|||||
|
Amortization of intangibles
|
6,175
|
|
5,033
|
|
3,762
|
|
|||||
|
Impairment of goodwill and long-lived assets
|
—
|
|
9,469
|
|
15
|
|
|||||
|
Amortization of capitalized software
|
9,748
|
|
2,513
|
|
591
|
|
|||||
|
Amortization of debt discount and issuance costs
|
1,355
|
|
—
|
|
—
|
|
|||||
|
Amortization of deferred sales commission costs
|
14,204
|
|
—
|
|
—
|
|
|||||
|
Non-cash lease expense
|
4,802
|
|
—
|
|
—
|
|
|||||
|
Stock-based compensation expense
|
44,508
|
|
29,176
|
|
21,462
|
|
|||||
|
Tax benefit from stock-based compensation expense
|
—
|
|
—
|
|
(486
|
)
|
|||||
|
Deferred income tax expense (benefit)
|
—
|
|
66,273
|
|
(411
|
)
|
|||||
|
Gain on escrow settlement
|
—
|
|
(1,393
|
)
|
—
|
|
|||||
|
Other
|
1,293
|
|
677
|
|
1,196
|
|
|||||
|
Changes in assets and liabilities:
|
|||||||||||
|
Accounts receivable
|
(5,393
|
)
|
(2,402
|
)
|
(4,799
|
)
|
|||||
|
Deferred sales commission costs
|
(25,286
|
)
|
—
|
|
—
|
|
|||||
|
Other current and noncurrent assets
|
(4,337
|
)
|
(3,149
|
)
|
(2,515
|
)
|
|||||
|
Accounts payable and accruals
|
17,252
|
|
11,860
|
|
8,135
|
|
|||||
|
Deferred revenue
|
802
|
|
310
|
|
195
|
|
|||||
|
Net cash (used in) provided by operating activities
|
(14,868
|
)
|
22,041
|
|
28,478
|
|
|||||
|
Cash flows from investing activities:
|
|||||||||||
|
Purchases of property and equipment
|
(9,096
|
)
|
(9,178
|
)
|
(8,851
|
)
|
|||||
|
Cost of capitalized software
|
(25,622
|
)
|
(12,486
|
)
|
(5,516
|
)
|
|||||
|
Proceeds from escrow settlement
|
—
|
|
1,393
|
|
—
|
|
|||||
|
Purchases of investments
|
(54,127
|
)
|
(115,224
|
)
|
(140,026
|
)
|
|||||
|
Sales of investments
|
54,642
|
|
27,841
|
|
41,288
|
|
|||||
|
Proceeds from maturities of investments
|
50,700
|
|
100,382
|
|
93,795
|
|
|||||
|
Acquisition of businesses, net of cash acquired
|
(5,625
|
)
|
—
|
|
(2,884
|
)
|
|||||
|
Net cash provided by (used in) investing activities
|
10,872
|
|
(7,272
|
)
|
(22,194
|
)
|
|||||
|
Cash flows from financing activities:
|
|||||||||||
|
Capital lease payments
|
(949
|
)
|
(1,079
|
)
|
(674
|
)
|
|||||
|
Payment of contingent consideration
|
—
|
|
(150
|
)
|
(300
|
)
|
|||||
|
Repurchase of common stock, including for withholding taxes
|
(7,823
|
)
|
(22,440
|
)
|
(3,003
|
)
|
|||||
|
Tax benefit from stock-based compensation expense
|
—
|
|
—
|
|
486
|
|
|||||
|
Proceeds from issuance of common stock under employee stock plans
|
12,202
|
|
7,229
|
|
5,087
|
|
|||||
|
Purchases of capped call
|
(33,724
|
)
|
—
|
|
—
|
|
|||||
|
Net proceeds from issuance of convertible senior notes
|
279,532
|
|
—
|
|
—
|
|
|||||
|
Net cash provided by (used in) financing activities
|
249,238
|
|
(16,440
|
)
|
1,596
|
|
|||||
|
Effect of exchange rate changes on cash
|
(362
|
)
|
444
|
|
(426
|
)
|
|||||
|
Net increase (decrease) in cash and cash equivalents
|
244,880
|
|
(1,227
|
)
|
7,454
|
|
|||||
|
Cash, cash equivalents and restricted cash, beginning of year
|
39,803
|
|
41,030
|
|
33,576
|
|
|||||
|
Cash, cash equivalents and restricted cash, end of year
|
$
|
284,683
|
|
$
|
39,803
|
|
$
|
41,030
|
|
||
|
Supplemental and non-cash disclosures:
|
|||||||||||
|
Equipment acquired under capital leases
|
$
|
68
|
|
$
|
765
|
|
$
|
1,152
|
|
||
|
Interest paid
|
—
|
|
36
|
|
16
|
|
|||||
|
Income taxes paid
|
356
|
|
38
|
|
460
|
|
|||||
54
The accompanying notes are an integral part of these consolidated financial statements.
55
8X8, INC.
NOTES TO CONSOLIDATED FINANCIAL STATEMENTS
1. THE COMPANY AND SIGNIFICANT ACCOUNTING POLICIES
THE COMPANY
8x8, Inc. ("8x8" or the "Company") was incorporated in California in February
1987
and was reincorporated in
Delaware
in
December 1996
.
The Company is a leading cloud provider of enterprise Software-as-a-Service (SaaS) communications solutions, that enable businesses of all sizes to communicate faster and smarter across voice, video meetings, chat and contact centers, transforming both employee and customer experiences with communications that work simply, integrate seamlessly, and perform reliably. From one proprietary cloud technology platform, customers have access to unified communications, team collaboration, video conferencing, contact center, data and analytics and other services. Since fiscal 2004, substantially all revenue has been generated from the sale of communications services and related hardware. Prior to fiscal 2003, the Company's main business was Voice over Internet Protocol semiconductors.
The Company's fiscal year ends on
March 31
of each calendar year. Each reference to a fiscal year in these notes to the consolidated financial statements refers to the fiscal year ended
March 31
of the calendar year indicated (for example, fiscal 2019 refers to the fiscal year ended
March 31, 2019
).
Acquisitions
In January 2017, the Company entered into an agreement with the preferred and common shareholders LeChat Inc. pursuant to which the Company purchased technology and other assets to enable cross team messaging and collaboration within the Company's cloud technology platform.
In April 2018, the Company entered into an asset purchase agreement with MarianaIQ, Inc., pursuant to which the Company purchased technology and other assets to strengthen the artificial intelligence and machine learning capabilities of the Company's X Series product suite.
In October 2018, the Company entered into an asset purchase agreement with Atlassian Corporation PLC for the purchase of the Jitsi video collaboration technology (Jitsi). Jitsi extends the Company's cloud technology platform with scalable video routing and interoperability capabilities built on industry standards such as WebRTC.
See Note 12 for further discussion.
PRINCIPLES OF CONSOLIDATION
The consolidated financial statements include the accounts of 8x8 and its subsidiaries. All material intercompany accounts and transactions have been eliminated.
Reclassifications
Certain amounts previously reported as selling and marketing expenses have been reclassified to cost of sales, research and development expenses, and general and administrative expenses within the consolidated statements of operations to conform to the current period presentation. The reclassification had no impact on the Company's previously reported net loss, cash flows, or basic or diluted net loss per share amounts. See Note 14 for further information.
USE OF ESTIMATES
The preparation of the consolidated financial statements in conformity with accounting principles generally accepted in the United States requires management to make estimates and assumptions that affect the reported amounts of assets, liabilities and equity and disclosure of contingent assets and liabilities at the date of the consolidated financial statements and the reported amounts of revenues and expenses during the reporting period. On an ongoing basis, the Company evaluates its estimates, including, but not limited to, those related to bad debts, returns reserve for expected cancellations, income and sales tax, and litigation and other contingencies. The Company bases its estimates on historical experience and on various other assumptions. Actual results could differ from those estimates under different assumptions or conditions.
56
REVENUE RECOGNITION
The Company recognizes service revenue, mainly from subscription services to its cloud-based voice, call center, video and collaboration solutions using the five-step model as prescribed by ASU No. 2014-09,
Revenue from Contracts with Customers (ASC 606), as amended: Topic 606
:
• Identification of the contract, or contracts, with a customer;
• Identification of the performance obligations in the contract;
• Determination of the transaction price;
• Allocation of the transaction price to the performance obligations in the contract; and
• Recognition of revenue when or as, the Company satisfies a performance obligation.
The Company identifies performance obligations in contracts with customers, which may include subscription services and related usage, product revenue and professional services. The transaction price is determined based on the amount the Company expects to be entitled to receive in exchange for transferring the promised services or products to the customer. The transaction price in the contract is allocated to each distinct performance obligation in an amount that represents the relative amount of consideration expected to be received in exchange for satisfying each performance obligation. Revenue is recognized when performance obligations are satisfied. Revenues are recorded based on the transaction price excluding amounts collected on behalf of third parties such as sales and telecommunication taxes, which are collected on behalf of and remitted to governmental authorities. The Company usually bills its customers on a monthly basis. Contracts typically range from annual to multi-year agreements with payment terms of net 30 days or less. The Company occasionally allows a 30-day period to cancel a subscription and return products shipped for a full refund.
Judgments and Estimates
The estimation of variable consideration for each performance obligation requires the Company to make subjective judgments. The Company has service-level agreements with customers warranting defined levels of uptime reliability and performance. Customers may get credits or refunds if the Company fails to meet such levels. If the services do not meet certain criteria, fees are subject to adjustment or refund representing a form of variable consideration. The Company may impose minimum revenue commitments (MRC) on its customers at the inception of the contract. Thus, in estimating variable consideration for each of these performance obligations, the Company assesses both the probability of MRC occurring and the collectability of the MRC, of which both represent a form of variable consideration.
The Company enters into contracts with customers that regularly include promises to transfer multiple services and products, such as subscriptions, products, and professional services. For arrangements with multiple services, the Company evaluates whether the individual services qualify as distinct performance obligations. In its assessment of whether a service is a distinct performance obligation, the Company determines whether the customer can benefit from the service on its own or with other readily available resources, and whether the service is separately identifiable from other services in the contract. This evaluation requires the Company to assess the nature of each individual service offering and how the services are provided in the context of the contract, including whether the services are significantly integrated, highly interrelated, or significantly modify each other, which may require judgment based on the facts and circumstances of the contract.
When agreements involve multiple distinct performance obligations, the Company allocates arrangement consideration to all performance obligations at the inception of an arrangement based on the relative standalone selling prices (SSP) of each performance obligation. Usage fees deemed to be variable consideration meet the allocation exception for variable consideration. Where the Company has standalone sales data for its performance obligations which are indicative of the price at which the Company sells a promised good or service separately to a customer, such data is used to establish SSP. In instances where standalone sales data is not available for a particular performance obligation, the Company estimates SSP by the use of observable market and cost-based inputs. The Company continues to review the factors used to establish list price and will adjust standalone selling price methodologies as necessary on a prospective basis.
Service Revenue
Service revenue from subscriptions to the Company's cloud-based technology platform is recognized over time on a ratable basis over the contractual subscription term beginning on the date that the platform is made available to the customer to the end of the contractual period. This ratable basis depicts the continuous access to the Company's services. Payments received in advance of subscription services being rendered are recorded as a deferred revenue. Usage fees, either bundled or not bundled, are recognized when the Company has a right to invoice. Professional services for configuration, system integration,
57
optimization, customer training or education are primarily billed on a fixed-fee basis and are performed by the Company directly or, alternatively, customers may also choose to perform these services themselves or engage their own third-party service providers. Professional services revenue is recognized over time as the services are rendered. When a contract with a customer is signed, the Company assesses whether collection of the fees under the arrangement is probable. The Company estimates the amount to reserve for uncollectible amounts based on the aging of the contract balance, current and historical customer trends, and communications with its customers. These reserves are recorded as operating expenses against the contract asset (Accounts Receivable). In the normal course of business, the Company records revenue reductions for customer credits.
Product Revenue
The Company recognizes product revenue for telephony equipment at a point in time, when transfer of control has occurred, which is generally upon shipment. Sales returns are recorded as a reduction to revenue estimated based on historical experience.
Contract Assets
Contract assets are recorded for those parts of the contract consideration not yet invoiced but for which the performance obligations are completed. The revenue is recognized when the customer receives services or equipment for a reduced consideration at the onset of an arrangement, for example when the initial month's services or equipment are discounted. Contract assets are included in other current or non-current assets in the consolidated balance sheets, depending on if their reduction will be recognized during the succeeding twelve-month period or beyond.
Deferred Revenue
Deferred revenues represent billings or payments received in advance of revenue recognition and is recognized upon transfer of control. Balances consist primarily of annual plan subscription services and professional and training services not yet provided as of the balance sheet date. Deferred revenues that will be recognized during the succeeding twelve-month period are recorded as current deferred revenues in the consolidated balance sheets, with the remainder recorded as other non-current liabilities in the consolidated balance sheets.
Deferred Sales Commission Costs
Sales commissions are considered incremental and recoverable costs of acquiring customer contracts. These costs are capitalized as other current or non-current assets and amortized on a straight-line basis over the anticipated benefit period, which is
five years
. The benefit period was estimated by taking into consideration the length of customer contracts, technology lifecycle, and other factors. This amortization expense is recorded in sales and marketing expense within the Company's consolidated statement of operations.
Practical Expedients
The new guidance under ASC 340-40,
Other Assets and Deferred Costs - Contracts with Customer
s, sets forth the requirement of deferring incremental costs of obtaining a contract, typically sales commissions, that were expensed as incurred under the previous guidance. The Company applies a practical expedient that permits it to apply Subtopic 340-40 to a portfolio of contracts, instead of on a contract-by-contract basis, as they are similar in their characteristics, and the financial statement effects of applying Subtopic 340-40 to that portfolio would not differ materially from applying it to the individual contracts within that portfolio.
58
CASH, CASH EQUIVALENTS AND INVESTMENTS
The Company considers all highly liquid investments with an original maturity of three months or less to be cash equivalents.
At
March 31, 2019
and
2018
, all investments were classified as available-for-sale and reported at fair value, based either upon quoted prices in active markets, quoted prices in less active markets, or quoted market prices for similar investments, with unrealized gains and losses, net of related tax, if any, included in other comprehensive income (loss) and disclosed as a separate component of stockholders' equity. Realized gains and losses on sales of all such investments are reported within the caption of other income in the consolidated statements of operations and computed using the specific identification method. The Company classifies its investments as current based on the nature of the investments and their availability for use in current operations. The Company's investments in marketable securities are monitored on a periodic basis for impairment. In the event that the carrying value of an investment exceeds its fair value and the decline in value is determined to be other-than-temporary, an impairment charge is recorded and a new cost basis for the investment is established. These available-for-sale investments are primarily held in the custody of one major financial institution.
ACCOUNTS RECEIVABLE ALLOWANCE
The Company estimates the amount of uncollectible accounts receivable at the end of each reporting period based on the aging of the receivable balance, current and historical customer trends, and communications with its customers. Amounts are written off only after considerable collection efforts have been made and the amounts are determined to be uncollectible.
PROPERTY AND EQUIPMENT
Property and equipment are stated at cost less accumulated depreciation and amortization. Depreciation and amortization are computed using the straight-line method. Estimated useful lives of
three years
are used for equipment, software and software development costs and
five years
for furniture and fixtures. Amortization of leasehold improvements is computed using the shorter of the remaining facility lease term or the estimated useful life of the improvements.
Maintenance, repairs and ordinary replacements are charged to expense. Expenditures for improvements that extend the physical or economic life of the property are capitalized. Gains or losses on the disposition of property and equipment are recorded in the Consolidated Statements of Operations.
Construction in progress primarily relates to costs to acquire or internally develop software for internal use not fully completed as of
March 31, 2019
and 2018.
ACCOUNTING FOR LONG-LIVED ASSETS
The Company reviews the recoverability of its long-lived assets, such as property and equipment, definite lived intangibles or capitalized software, when events or changes in circumstances occur that indicate that the carrying value of the asset or asset group may not be recoverable. Examples of such events could include a significant disposal of a portion of such assets, an adverse change in the market involving the business employing the related asset or a significant change in the operation or use of an asset. The assessment of possible impairment is based on the Company's ability to recover the carrying value of the asset or asset group from the expected future cash flows (undiscounted and without interest charges) of the related operations. If these cash flows are less than the carrying value of such asset or asset group, an impairment loss is recognized for the difference between estimated fair value and carrying value. The measurement of impairment requires management to estimate the fair value of long-lived assets and asset groups through future cash flows. See Note 4 for further discussion on impairment charges incurred.
GOODWILL AND OTHER INTANGIBLE ASSETS
Goodwill represents the excess fair value of consideration transferred over the fair value of net assets acquired in business combinations. Goodwill and intangible assets with indefinite useful lives are not amortized but are tested annually for impairment and more often if there is an indicator of impairment. For the year ended March 31, 2018, the Company had determined that it had
three
reporting units and allocated goodwill to the reporting units for the purposes of its annual impairment test. For the year ended March 31, 2019, the Company has determined it had
one
reporting unit. The change in reporting units resulted from the following events:
|
•
|
As of April 1, 2018, The Company's DXI operations no longer operated on a standalone basis and was integrated into the Company's existing United Kingdom operations, and
|
59
|
•
|
During the third fiscal quarter of 2019, the Company assessed it had only one Chief Operating Decision Maker, who reviewed financial results on a consolidated basis. See Note 11 for further discussion.
|
The Company's annual goodwill impairment test is performed on January 1 each year.
No
goodwill impairment charges were recorded in the periods presented. The Company early adopted the provisions of ASU 2017-04,
Simplifying the Test for Goodwill
, for its annual impairment test. See Recently Adopted Accounting Pronouncements for further discussion.
Intangible assets with finite useful lives are amortized on a straight-line basis over the periods benefited. Amortization expense for the customer relationship intangible asset is included in sales and marketing expenses. Amortization expense for acquired technology, software or internally developed software is included in cost of service revenue.
CONVERTIBLE SENIOR NOTES
In accounting for the issuance of the convertible senior notes (the Notes), the Notes were separated into liability and equity components. The carrying amounts of the liability component was calculated by measuring the fair value of similar liabilities that do not have associated convertible features. The carrying amount of the equity component representing the conversion option was determined by deducting the fair value of the liability component from the par value of the respective Notes. This difference represents the debt discount that is amortized to interest expense over the respective terms of the Notes using the effective interest rate method. The equity component was recorded in additional paid-in capital and is not remeasured as long as it continues to meet the accounting requirements for equity classification.
In accounting for the debt issuance costs related to the Notes, the Company allocated the total amount incurred to the liability and equity components of the Notes based on their relative fair values. Issuance costs attributable to the liability component are being amortized to interest expense over the contractual term of the Notes. The issuance costs attributable to the equity component, representing the conversion option, were netted against the equity component in additional paid-in capital.
WARRANTY EXPENSE
The Company accrues for estimated product warranty cost upon revenue recognition. Accruals for product warranties are calculated based on the Company's historical warranty experience adjusted for any specific requirements. The Company's warranty accruals are recorded in current other accrued liabilities in the consolidated balance sheets.
RESEARCH & DEVELOPMENT AND SOFTWARE DEVELOPMENT COSTS
Software developed or obtained for internal use in accordance with ASC 350-40,
Internal-Use Software
(ASC 350-40), is capitalized during the application development stage. In accordance with authoritative guidance, the Company begins to capitalize costs to develop software when preliminary development efforts are successfully completed, management has authorized and committed project funding, and it is probable that the project will be completed, and the software will be used as intended. Once the project has been completed, these costs are amortized to cost of service revenue on a straight - line basis over the estimated useful life of the related asset, generally estimated to be
three years
. Costs incurred prior to meeting these criteria together with costs incurred for training and maintenance are expensed as incurred and recorded in research and development expense on our consolidated statements of operations. The Company classifies software development costs associated with the development of the Company's products and services as property and equipment.
ADVERTISING COSTS
Advertising costs are expensed as incurred and were
$25.0 million
,
$14.5 million
and
$9.5 million
for the years ended
March 31, 2019
,
2018
and
2017
, respectively.
FOREIGN CURRENCY TRANSLATION
The Company has determined that the functional currency of each of its foreign subsidiaries are the subsidiary's local currency. The Company believes this most appropriately reflects the current economic facts and circumstances of the Company's subsidiaries' operations. The assets and liabilities of the subsidiaries are translated at the applicable exchange rate as of the end of the balance sheet period, and revenue and expenses are translated at an average rate over the period presented. Resulting currency translation adjustments are recorded as a component of accumulated other comprehensive income or loss within the stockholder's equity.
60
SEGMENT INFORMATION
The Company has determined the chief executive officer is its chief operating decision maker. The chief executive officer reviews financial information presented on a consolidated basis for purposes of assessing performance and making decisions on how to allocate resources. The Company has determined that it operates in a single reportable segment.
CONCENTRATIONS
Financial instruments that potentially subject the Company to significant concentrations of credit risk consist principally of cash and cash equivalents, investments and trade accounts receivable. The Company has cash equivalents and investment policies that limit the amount of credit exposure to any one financial institution and restrict placement of these funds to financial institutions evaluated as highly credit-worthy. The Company has not experienced any material losses relating to its investments.
The Company sells its products to business customers and distributors. The Company performs ongoing credit evaluations of its customers' financial condition and generally does not require collateral from its customers. At
March 31, 2019
and
2018
, no customer accounted for more than
10%
of accounts receivable.
The Company purchases all of its hardware products from suppliers that manufacturer the hardware directly. The inability of any supplier to fulfill supply requirements of the Company could materially impact future operating results, financial position or cash flows.
The Company also relies primarily on third-party network service providers to provide telephone numbers and PSTN call termination and origination services for its customers. If these service providers failed to perform their obligations to the Company, such failure could materially impact future operating results, financial position and cash flows.
FAIR VALUE OF FINANCIAL INSTRUMENTS
The Company defines fair value as the price that would be received to sell an asset or paid to transfer a liability in an orderly transaction between market participants at the measurement date. When determining the fair value measurements for assets and liabilities required or permitted to be recorded at fair value, the Company considers the principal market or the most advantageous market in which it would transact.
The accounting guidance for fair value measurement requires the Company to maximize the use of observable inputs and minimize the use of unobservable inputs when measuring fair value. Observable inputs are inputs that reflect the assumptions market participants would use in valuing the asset or liability and are developed based on market data obtained from sources independent of the Company. Unobservable inputs are inputs that reflect the Company's assumptions about the factors that market participants would use in valuing the asset or liability developed based on the best information available in the circumstances.
The standard establishes a fair value hierarchy based on the level of independent, objective evidence surrounding the inputs used to measure fair value by requiring that the most observable inputs be used when available. A financial instrument's categorization within the fair value hierarchy is based upon the lowest level of input that is significant to the fair value measurement. The fair value hierarchy is as follows:
|
•
|
Level 1 applies to assets or liabilities for which there are quoted prices in active markets for identical assets or liabilities that the Company has the ability to access at the measurement date.
|
|
•
|
Level 2 applies to assets or liabilities for which there are inputs other than quoted prices included in Level 1 that are observable for the asset or liability, either directly or indirectly, such as quoted prices for similar assets or liabilities in active markets; quoted prices for identical assets or liabilities in markets with insufficient volume or infrequent transactions (less active markets).
|
|
•
|
Level 3 applies to assets or liabilities for which fair value is derived from valuation techniques in which one or more significant inputs are unobservable, including the Company's own assumptions.
|
The estimated fair value of financial instruments is determined by the Company using available market information and valuation methodologies considered to be appropriate. The carrying amounts of the Company's cash and cash equivalents,
61
accounts receivable and accounts payable approximate their fair values due to their short maturities. The Company's investments and convertible senior notes payable are carried at fair value.
ACCOUNTING FOR STOCK-BASED COMPENSATION
The Company accounts for its employee stock options and other stock awards under the provisions of ASC 718 -
Stock Compensation
. Stock-based compensation cost is measured at the grant date, based on the estimated fair value of the award, and is recognized as an expense over the employee's requisite service period (generally the vesting period of the equity grant), net of estimated forfeitures.
To value option grants the Company uses the Black-Scholes option valuation model. Fair value determined using the Black-Scholes option valuation model varies based on assumptions used for the expected stock prices volatility, expected life, risk-free interest rates and future dividend payments. The Company used the historical volatility of its stock over a period equal to the expected life of the options. The expected life assumptions represent the weighted-average period stock-based awards are expecting to remain outstanding. These expected life assumptions were established through the review of historical exercise behavior of stock-based award grants with similar vesting periods. The risk-free interest rates were based on the closing market bid yields of actively traded U.S. treasury securities in the over-the-counter market for the expected term equal to the expected term of the option. The dividend yield assumption is based on the Company's history of not paying dividends.
The Company issued performance stock units (PSUs) to a group of executives with vesting that is contingent on both market performance and continued service during the fiscal year ended
March 31, 2019
:
|
•
|
These PSUs vest (1)
50%
on October 23, 2020 and (2)
50%
on October 23, 2021, in each case subject to the performance of the Company's common stock relative to the Russell 2000 Index (the benchmark) during the period from grant date through such vesting date. A 2x multiplier will be applied to the total shareholder returns (TSR), such that the number of shares earned will increase or decrease by
2%
of the target numbers, for each
1%
of positive or negative relative TSR. In the event the Company's common stock performance is below negative
30%
relative to the benchmark, no shares will be issued. In no event will the number of shares issued in each tranche exceed
200%
of the target for that tranche.
|
The Company issued PSUs to a group of executives with vesting that is contingent on both market performance and continued service during the fiscal year ended
March 31, 2018
:
|
•
|
These PSUs vest (1)
50%
on September 22, 2018 and (2)
50%
on September 27, 2019, in each case subject to the performance of the Company's common stock relative to the Russell 2000 Index (the benchmark) during the period from grant date through such vesting date. A 2x multiplier will be applied to the total shareholder returns (TSR), such that the number of shares earned will increase or decrease by
2%
of the target numbers, for each
1%
of positive or negative relative TSR. In the event the Company's common stock performance is below negative
30%
, relative to the benchmark, no shares will be issued. In no event will the number of shares issued in each tranche exceed
200%
of the target for that tranche.
|
To value these market-based PSUs under the Equity Compensation Plans, the Company used a Monte Carlo simulation model on the date of grant. Fair value determined using the Monte Carlo simulation model varies based on the assumptions used for the expected stock price volatility, the correlation coefficient between the Company and the NASDAQ Composite Index, risk-free interest rates, and future dividend payments.
RESEARCH AND DEVELOPMENT COSTS
Research and development expenses consist primarily of personnel, consulting and equipment costs necessary for the Company to conduct development and engineering efforts. Research and development costs are expensed as incurred.
COMPREHENSIVE INCOME (LOSS)
Comprehensive income (loss), as defined, includes all changes in equity (net assets) during a period. The difference between net income (loss) and comprehensive income (loss) is due to foreign currency translation adjustments and unrealized gains or losses on investments classified as available-for-sale.
NET INCOME (LOSS) PER SHARE
62
Basic net income (loss) per share is computed by dividing net income (loss) available to common stockholders (numerator) by the weighted average number of vested, unrestricted common shares outstanding during the period (denominator). Diluted net income (loss) per share is computed on the basis of the weighted average number of shares of common stock plus the effect of dilutive potential common shares outstanding during the period using the treasury stock method unless their effect is anti-dilutive. Dilutive potential common shares include outstanding stock options, employee shares purchase programs (ESPP), and restricted stock units (RSUs).
The Company would include the dilutive effects of the Convertible Senior Notes (the Notes) (see Note 7) in the calculation of diluted net income per common share if the average market price is above the conversion price. Upon conversion of the Notes, it is the Company’s intention to pay cash equal to the lesser of the aggregate principal amount or the conversion value of the Notes being converted, therefore, only the conversion spread relating to the Notes would be included in the Company’s diluted earnings per share calculation unless their effect is anti-dilutive.
DEFERRED RENT
The Company recognizes rent expense on a straight-line basis for all operating lease arrangements with the difference between required lease payments and rent expense recorded as deferred rent. The difference results from rent holidays, rent escalations and tenant improvement allowances, which are amortized over the lease term.
RECENTLY ADOPTED ACCOUNTING PRONOUNCEMENTS
In May 2014, the Financial Accounting Standards Board (FASB) issued
ASC 606-Revenue from Contracts with Customers
(ASC 606), which replaces numerous requirements in U.S. GAAP and provide companies with a single revenue recognition model for recognizing revenue from contracts with customers. On April 1, 2018, the Company adopted ASC 606 using the modified retrospective method and applied Topic 606 to those contracts which were not completed as of April 1, 2018. Under the modified retrospective method the Company's fiscal 2018 and 2017 consolidated statement of operations were not restated. As such, revenues for those fiscal years were reported under the previous guidance of ASC 605,
Revenue Recognition.
The Company recognized the cumulative effect of initially applying ASC 606 as an adjustment to retained earnings in the consolidated balance sheet as of April 1, 2018 (in thousands).
|
Balance at
March 31, 2018 |
Adjustments
Due to ASC 606 |
Balance at
April 1, 2018 |
||||||||||
|
Current assets:
|
|
|
|
|||||||||
|
Deferred sales commission costs
|
$
|
—
|
|
$
|
11,234
|
|
$
|
11,234
|
|
|||
|
Other current assets
|
$
|
10,040
|
|
$
|
1,725
|
|
$
|
11,765
|
|
|||
|
Non-current assets:
|
||||||||||||
|
Deferred sales commission costs
|
$
|
—
|
|
26,942
|
|
$
|
26,942
|
|
||||
|
Stockholders' Equity
|
||||||||||||
|
Accumulated deficit
|
$
|
(201,464
|
)
|
$
|
39,901
|
|
$
|
(161,563
|
)
|
|||
The following tables summarize the impacts of ASC 606 adoption on the Company's financial statements for the periods ended March 31, 2019:
63
Selected Consolidated Balance Sheet Line Items (in thousands):
|
|
March 31, 2019
|
|||||||||||
|
ASC 605
|
Adjustments
|
(As Reported)
ASC 606 |
||||||||||
|
Current assets:
|
|
|
|
|||||||||
|
Deferred sales commission costs
|
$
|
—
|
|
$
|
15,601
|
|
$
|
15,601
|
|
|||
|
Other current assets
|
$
|
9,410
|
|
$
|
5,717
|
|
$
|
15,127
|
|
|||
|
Non-current assets:
|
||||||||||||
|
Deferred sales commission costs
|
$
|
—
|
|
$
|
33,693
|
|
$
|
33,693
|
|
|||
|
Stockholders' Equity
|
||||||||||||
|
Accumulated deficit
|
$
|
(305,313
|
)
|
$
|
55,011
|
|
$
|
(250,302
|
)
|
|||
Selected Consolidated Statement of Operations Line Items (in thousands, except per share amounts):
|
|
Twelve Months Ended March 31, 2019
|
|||||||||||
|
ASC 605
|
Adjustments
|
(As Reported)
ASC 606 |
||||||||||
|
Service revenue
|
$
|
335,671
|
|
$
|
(1,233
|
)
|
$
|
334,438
|
|
|||
|
Product revenue
|
16,271
|
|
1,877
|
|
18,148
|
|
||||||
|
Total revenue
|
$
|
351,942
|
|
$
|
644
|
|
$
|
352,586
|
|
|||
|
Operating expenses:
|
||||||||||||
|
Sales and marketing
|
$
|
189,058
|
|
$
|
(11,082
|
)
|
$
|
177,976
|
|
|||
|
Loss from operations
|
$
|
(102,714
|
)
|
$
|
11,726
|
|
$
|
(90,988
|
)
|
|||
|
Net loss
|
$
|
(100,465
|
)
|
$
|
11,726
|
|
$
|
(88,739
|
)
|
|||
|
Net loss per share:
|
||||||||||||
|
Basic and Diluted
|
$
|
(1.06
|
)
|
$
|
0.12
|
|
$
|
(0.94
|
)
|
|||
Selected Consolidated Statements of Cash Flows Line Items (in thousands):
|
|
Twelve Months Ended March 31, 2019
|
|||||||||||
|
ASC 605
|
Adjustments
|
(As Reported)
ASC 606 |
||||||||||
|
Net loss
|
$
|
(100,465
|
)
|
$
|
11,726
|
|
$
|
(88,739
|
)
|
|||
|
Amortization of deferred sales commission costs
|
$
|
—
|
|
$
|
14,204
|
|
$
|
14,204
|
|
|||
|
Deferred sales commission costs
|
$
|
—
|
|
$
|
(25,286
|
)
|
$
|
(25,286
|
)
|
|||
|
Other current and non-current assets
|
$
|
(3,693
|
)
|
$
|
(644
|
)
|
$
|
(4,337
|
)
|
|||
|
Net cash provided by operating activities
|
$
|
(14,868
|
)
|
$
|
—
|
|
$
|
(14,868
|
)
|
|||
In January 2016, the FASB issued Accounting Standards Update (ASU) No. 2016-01
Financial Instruments-Overall (Subtopic 825-10): Recognition and Measurement of Financial Assets and Financial Liabilities
, which amends various aspects of the recognition, measurement, presentation, and disclosure of financial instruments This amendment is effective for fiscal years beginning after December 15, 2017, and interim periods within those fiscal years. Therefore, the Company has prospectively adopted this new standard on April 1, 2018. The adoption of this standard did not have a material impact on the Company's consolidated financial statements.
In August 2016, the FASB issued ASU No. 2016-15
, Statement of Cash Flows (Topic 230): Classification of Certain Cash Receipts and Cash Payments
, which provides guidance on how certain cash receipts and cash payments are to be presented and classified in the statement of cash flows. This amendment is effective for fiscal years beginning after December 15, 2017, and interim periods within those fiscal years. Therefore, the Company has prospectively adopted this new standard on April 1, 2018. The adoption of this standard did not have a material impact on the consolidated statement of cash flows.
In October 2016, the FASB has issued ASU No. 2016-16
, Income Taxes (Topic 740): Intra-Entity Transfers of Assets Other Than Inventory
, which provides guidance on how an entity should recognize the income tax consequences of an intra-entity transfer of an asset other than inventory when the transfer occurs. This amendment is effective for fiscal years beginning after December 15, 2017, and interim periods within those fiscal years. Therefore, the Company has prospectively adopted this new
64
standard on April 1, 2018. The adoption of this standard did not have a material impact on the Company's consolidated financial statements.
In January 2017, the FASB issued Accounting Standards Update ASU No. 2017-04,
Simplifying the Test for Goodwill Impairment
, which simplifies the subsequent measurement of goodwill by removing the requirement to perform a hypothetical purchase price allocation to compute the implied fair value of goodwill to measure impairment. Instead, any goodwill impairment will equal the amount by which a reporting unit’s carrying value exceeds its fair value, not to exceed the carrying amount of goodwill. Furthermore, the ASU eliminates the requirements for any reporting unit with a zero or negative carrying amount to perform a qualitative assessment and, if it fails that qualitative test, to perform step 2 of the goodwill impairment test. As permitted by the ASU, the Company have elected to early adopt this guidance for our fiscal 2019 goodwill impairment test, which was performed during the fourth quarter of fiscal 2019. The adoption of this guidance did not have a material impact on our consolidated financial statements.
RECENT ACCOUNTING PRONOUNCEMENTS
In February 2016, the FASB issued ASU 2016-2,
Leases
(Topic 842), along with amendments issued in 2018, which requires companies to generally recognize on the balance sheet operating and financing lease liabilities and corresponding right-of-use assets. The update also requires qualitative and quantitative disclosures designed to assess the amount, timing, and uncertainty of cash flows arising from leases. The update requires the use of a modified retrospective transition approach, which includes a number of optional practical expedients that entities may elect to apply. Among the subsequent amendments, an optional transition method was provided. This amendment is effective for fiscal years beginning after December 15, 2018, including interim periods within those fiscal years. Early adoption is permitted. The Company expects the adoption to have a material impact to the consolidated balance sheets for the recording of the "right-to-use" asset and corresponding contract liability. The Company is currently scoping the definition of a lease under ASC 842 to determine the "right-to-use" asset and corresponding liability in accordance with the standard.
The Company plans to adopt the ASU utilizing the current period adjustment method on April 1, 2019 and expects to record approximately
$13.1
to
$14.1 million
right-of-use assets and
$15.0
to
$16.0 million
lease liability on its consolidated balance sheet. The amount of the Company's deferred rent as of March 31, 2019 of
$1.9 million
will be removed upon adoption.
In June 2018, the FASB issued ASU 2018-7, Compensation-Stock Compensation (Topic 718), which now provides guidance for share-based payments to non-employees, resulting in alignment in accounting for employees and non-employees. The amendment is effective for public companies with fiscal years beginning after December 15, 2018. Early adoption is permitted. The Company estimates the impact of this pronouncement to its consolidated financial statements to be immaterial.
In August 2018, the FASB issued ASU 2018-13, Fair Value Measurement (Topic 820), which makes modifications to disclosure requirements on fair value measurements. The amendment is effective for public companies with fiscal years beginning after December 15, 2019. Early adoption is permitted. The Company is currently assessing the impact of this pronouncement to its consolidated financial statements.
In August 2018, the FASB issued 2018-15, Intangibles-Goodwill and Other-Internal Use Software (Subtopic 350-40), which reduces complexity for the accounting for the accounting for costs of implementing a cloud computing service arrangement. The amendment is effective for public companies with fiscal years beginning after December 15, 2019. Early adoption is permitted. The Company is currently assessing the impact of this pronouncement to its consolidated financial statements.
2. REVENUE RECOGNITION
Disaggregation of Revenue
The Company disaggregates its revenue by geographic region. See Note 11 for more information.
Contract Balances
The following table provides information about receivables, contract assets and deferred revenues from contracts with customers (in thousands):
65
|
|
March 31, 2019
|
||
|
Accounts receivable, net
|
$
|
20,181
|
|
|
Other current assets
|
$
|
5,717
|
|
|
Deferred revenue - current
|
$
|
3,336
|
|
|
Deferred revenue - non-current
|
$
|
6
|
|
Changes in the contract assets and the deferred revenue balances during the
twelve
months ended
March 31, 2019
are as follows (in thousands):
|
|
April 1, 2018
|
March 31, 2019
|
$ Change
|
|||||||||
|
Other current assets
|
$
|
1,725
|
|
$
|
5,717
|
|
$
|
3,992
|
|
|||
|
Deferred revenue
|
$
|
2,578
|
|
$
|
3,342
|
|
$
|
764
|
|
|||
The change in contract assets was primarily driven by the recognition of revenue that has not yet been billed. The increase in deferred revenues was due to billings in advance of performance obligations being satisfied. Revenues of approximately $
2.5
million recognized during the year ended March 31, 2019 were included in the contract liabilities balance at April 1, 2018.
Remaining Performance Obligations
The Company's subscription terms typically range from
one
to
four years
. Contract revenue as of
March 31, 2019
, that has not yet been recognized was approximately
$170.0 million
. This excludes contracts with an original expected length of one year or less. The Company expects to recognize revenue on the vast majority of the remaining performance obligation over the next
24
months.
3. FAIR VALUE MEASUREMENTS
Cash, cash equivalents and available-for-sale investments were (in thousands):
|
As of March 31, 2019
|
Amortized
Costs
|
Gross
Unrealized
Gain
|
Gross
Unrealized
Loss
|
Estimated
Fair Value
|
Cash and
Cash
Equivalents
|
Short-Term
Investments
|
||||||||||||||||||
|
Cash
|
$
|
25,364
|
|
$
|
—
|
|
$
|
—
|
|
$
|
25,364
|
|
$
|
25,364
|
|
$
|
—
|
|
||||||
|
Level 1:
|
||||||||||||||||||||||||
|
Money market funds
|
251,219
|
|
—
|
|
—
|
|
251,219
|
|
251,219
|
|
—
|
|
||||||||||||
|
Subtotal
|
276,583
|
|
—
|
|
—
|
|
276,583
|
|
276,583
|
|
—
|
|
||||||||||||
|
Level 2:
|
||||||||||||||||||||||||
|
Corporate debt
|
46,516
|
|
51
|
|
(29
|
)
|
46,538
|
|
—
|
|
46,538
|
|
||||||||||||
|
Municipal securities
|
5,511
|
|
17
|
|
—
|
|
5,528
|
|
—
|
|
5,528
|
|
||||||||||||
|
Asset backed securities
|
13,596
|
|
9
|
|
(17
|
)
|
13,588
|
|
—
|
|
13,588
|
|
||||||||||||
|
Agency bond
|
4,260
|
|
—
|
|
(15
|
)
|
4,245
|
|
—
|
|
4,245
|
|
||||||||||||
|
Subtotal
|
69,883
|
|
77
|
|
(61
|
)
|
69,899
|
|
—
|
|
69,899
|
|
||||||||||||
|
Total assets
|
$
|
346,466
|
|
$
|
77
|
|
$
|
(61
|
)
|
$
|
346,482
|
|
$
|
276,583
|
|
$
|
69,899
|
|
||||||
66
|
As of March 31, 2018
|
Amortized
Costs
|
Gross
Unrealized
Gain
|
Gross
Unrealized
Loss
|
Estimated
Fair Value
|
Cash and
Cash
Equivalents
|
Short-Term
Investments
|
||||||||||||||||||
|
Cash
|
$
|
16,499
|
|
$
|
—
|
|
$
|
—
|
|
$
|
16,499
|
|
$
|
16,499
|
|
$
|
—
|
|
||||||
|
Level 1:
|
||||||||||||||||||||||||
|
Money market funds
|
15,204
|
|
—
|
|
—
|
|
15,204
|
|
15,204
|
|
—
|
|
||||||||||||
|
Subtotal
|
31,703
|
|
—
|
|
—
|
|
31,703
|
|
31,703
|
|
—
|
|
||||||||||||
|
Level 2:
|
||||||||||||||||||||||||
|
Commercial paper
|
13,254
|
|
—
|
|
(8
|
)
|
13,246
|
|
—
|
|
13,246
|
|
||||||||||||
|
Corporate debt
|
70,631
|
|
6
|
|
(296
|
)
|
70,341
|
|
—
|
|
70,341
|
|
||||||||||||
|
Asset backed securities
|
3,385
|
|
3
|
|
(1
|
)
|
3,387
|
|
—
|
|
3,387
|
|
||||||||||||
|
Mortgage backed securities
|
27,063
|
|
1
|
|
(119
|
)
|
26,945
|
|
—
|
|
26,945
|
|
||||||||||||
|
Agency bond
|
4,183
|
|
—
|
|
(35
|
)
|
4,148
|
|
—
|
|
4,148
|
|
||||||||||||
|
Subtotal
|
121,013
|
|
10
|
|
(464
|
)
|
120,559
|
|
—
|
|
120,559
|
|
||||||||||||
|
Total assets
|
$
|
152,716
|
|
$
|
10
|
|
$
|
(464
|
)
|
$
|
152,262
|
|
$
|
31,703
|
|
$
|
120,559
|
|
||||||
As of March, 31, 2019, the estimated fair value of the Company's outstanding convertible senior notes (the Notes) was
$216.0 million
. The fair value of the Notes was determined based on the closing price for the Notes on the last trading day of the reporting period and is considered as Level 2 in the fair value hierarchy.
Contractual maturities of investments as of
March 31, 2019
are set forth below (in thousands):
|
|
Estimated
Fair Value
|
||
|
Due within one year
|
$
|
32,385
|
|
|
Due after one year
|
37,514
|
|
|
|
Total
|
$
|
69,899
|
|
4. PROPERTY AND EQUIPMENT
Property and equipment consisted of the following (in thousands):
|
|
March 31,
|
||||||
|
|
2019
|
2018
|
|||||
|
Computer equipment
|
$
|
34,706
|
|
$
|
29,761
|
|
|
|
Software development costs
|
39,131
|
|
20,144
|
|
|||
|
Software licenses
|
9,713
|
|
8,663
|
|
|||
|
Leasehold improvements
|
6,286
|
|
6,573
|
|
|||
|
Furniture and fixtures
|
2,324
|
|
1,637
|
|
|||
|
Construction in progress
|
10,071
|
|
2,394
|
|
|||
|
|
102,231
|
|
69,172
|
|
|||
|
Less: accumulated depreciation and amortization
|
(49,396
|
)
|
(33,440
|
)
|
|||
|
|
$
|
52,835
|
|
$
|
35,732
|
|
|
67
5. INTANGIBLE ASSETS, GOODWILL AND OTHER ASSETS
The carrying value of intangible assets consisted of the following (in thousands):
|
|
March 31, 2019
|
March 31, 2018
|
|||||||||||||||||||||
|
Gross
Carrying
Amount
|
Accumulated
Amortization
|
Net Carrying
Amount
|
Gross
Carrying
Amount
|
Accumulated
Amortization
|
Net Carrying
Amount
|
||||||||||||||||||
|
Technology
|
$
|
25,702
|
|
$
|
(15,409
|
)
|
$
|
10,293
|
|
$
|
19,702
|
|
$
|
(10,535
|
)
|
$
|
9,167
|
|
|||||
|
Customer relationships
|
9,467
|
|
(8,080
|
)
|
1,387
|
|
9,776
|
|
(7,366
|
)
|
2,410
|
|
|||||||||||
|
Trade names/domains
|
2,108
|
|
(2,108
|
)
|
—
|
|
2,108
|
|
(1,727
|
)
|
381
|
|
|||||||||||
|
Total acquired identifiable
intangible assets
|
$
|
37,372
|
|
$
|
(25,692
|
)
|
$
|
11,680
|
|
$
|
31,681
|
|
$
|
(19,723
|
)
|
$
|
11,958
|
|
|||||
At
March 31, 2019
, annual amortization of definite lived intangible assets, based upon existing intangible assets and current useful lives, is estimated to be the following (in thousands):
|
|
Amount
|
||
|
2020
|
$
|
6,116
|
|
|
2021
|
3,569
|
|
|
|
2022
|
1,766
|
|
|
|
2023
|
229
|
|
|
|
Total
|
$
|
11,680
|
|
Impairment of Long-Lived Assets and Goodwill
During the third quarter of fiscal year 2018, the Company changed its product and marketing strategy for the use of DXI's technology and re-assessed DXI's profitability outlook. This triggered the requirement that the Company test the recorded goodwill for impairment in accordance with ASC 350-20-35. First, the Company estimated the fair value of its
three
reporting units at the time using the market approach. Under the market approach, the Company utilized the market capitalization of its publicly-traded shares and comparable company information to determine revenue multiples which were used to determine the fair value of the reporting unit. Based on this approach, the Company determined that there was an indication of impairment only for its DXI reporting unit, which was within the Company's Europe reporting segment, as the carrying value including goodwill exceeded the estimated fair value. As largely independent cash flows could not be attributed to any assets individually the Company evaluated DXI's assets and liabilities as one asset group. Then the Company estimated the fair value of DXI's asset group using discounted cash flow methods to determine the implied fair value of goodwill. The difference between this implied fair value of the goodwill and its carrying value was recorded as impairment. The outcome of the analysis resulted in a non-cash expense for impairment of property and equipment, intangible assets and goodwill of
$0.3 million
,
$1.2 million
,
$8.0 million
, respectively, which was recorded during the third quarter of fiscal year 2018 as a separate line item in the Company's Consolidated Statements of Operations.
The following table provides a summary of the changes in the carrying amounts of goodwill (in thousands):
|
|
Total
|
|
|
Balance at March 31, 2017
|
46,136
|
|
|
Impairment loss
|
(8,036
|
)
|
|
Foreign currency translation
|
1,954
|
|
|
Balance at March 31, 2018
|
40,054
|
|
|
Balance at Additions due to acquisitions
|
500
|
|
|
Foreign currency translation
|
(860
|
)
|
|
Balance at March 31, 2019
|
39,694
|
|
Deferred Sales Commission Costs
Amortization expense for the deferred sales commission costs for the year ended March 31, 2019, was
$14.2 million
. Prior to the adoption of ASC 606, the Company did not defer sales commission costs. There were
no
impairment losses relative to the costs capitalized for the year ended March 31, 2019.
68
6. COMMITMENTS AND CONTINGENCIES
Guarantees
Indemnifications
In the normal course of business, the Company may agree to indemnify other parties, including customers, lessors and parties to other transactions with the Company, with respect to certain matters such as breaches of representations or covenants or intellectual property infringement or other claims made by third parties. These agreements may limit the time within which an indemnification claim can be made and the amount of the claim. In addition, the Company has entered into indemnification agreements with its officers and directors.
It is not possible to determine the maximum potential amount of the Company's exposure under these indemnification agreements due to the limited history of prior indemnification claims and the unique facts and circumstances involved in each particular agreement. Historically, payments made by the Company under these agreements have not had a material impact on the Company's operating results, financial position or cash flows. Under some of these agreements, however, the Company's potential indemnification liability might not have a contractual limit.
Product Warranties
The Company accrues for the estimated costs that may be incurred under its product warranties upon revenue recognition.
Operating Leases
The Company's operating lease obligations consist of the Company's principal facility and various leased facilities under operating lease agreements, which expire on various dates from fiscal 2020 through fiscal 2026. The Company leases its headquarters facility in San Jose, California under an operating lease agreement that expires in October 2019.
On January 23, 2018, the Company entered into a
132
-month lease to rent approximately
162,000
square feet of office space in a new building in San Jose, California. The lease term began on January 1, 2019.
In connection with the lease, the Company procured a standby letter of credit (LOC) in the amount of
$8.1 million
for the benefit of the landlord, which may be drawn down in the event the Company defaults in the payment of its obligations under the lease. The LOC is disclosed as restricted cash on the Company's consolidated balance sheets for the year ending March 31, 2019.
On April 30, 2019, the Company entered into an assignment and assumption of lease agreement (the "Agreement") with the landlord and a third party lessee, to assign to the third party lessee its rights and obligations under the new office space lease. Pursuant to the Agreement, the Company expects to be released from all of its obligations under the lease and related LOC by the end of the Company’s fiscal year ending March 31, 2022 or shortly thereafter.
At
March 31, 2019
, future total minimum annual lease payments under non-cancelable operating leases were as follows (in thousands):
|
Year ending March 31:
|
|
|
|
|
2020
|
$
|
7,143
|
|
|
2021
|
8,907
|
|
|
|
2022
|
8,797
|
|
|
|
2023
|
1,556
|
|
|
|
2024
|
1,140
|
|
|
|
Thereafter
|
2,279
|
|
|
|
Total
|
$
|
29,822
|
|
Rent expense for the years ended
March 31, 2019
,
2018
and
2017
was
$10.6 million
,
$5.6 million
and
$5.1 million
, respectively.
69
Capital Leases
The Company has non-cancelable capital lease agreements for office and computer equipment bearing interest at various rates. At
March 31, 2019
, future minimum annual lease payments under non-cancelable capital leases were as follows (in thousands):
|
Year ending March 31:
|
|
|
|
|
2020
|
$
|
436
|
|
|
2021
|
64
|
|
|
|
2022
|
19
|
|
|
|
2023
|
15
|
|
|
|
2024
|
15
|
|
|
|
Total minimum payments
|
549
|
|
|
|
Less: Amount representing interest
|
(15
|
)
|
|
|
|
534
|
|
|
|
Less: Short-term portion of capital lease obligations
|
(424
|
)
|
|
|
Long-term portion of capital lease obligations
|
$
|
110
|
|
Capital leases included in computer and office equipment were approximately
$3.4 million
and
$3.5 million
at
March 31, 2019
and
2018
, respectively. Total accumulated amortization was approximately
$2.8 million
and
$1.8 million
at
March 31, 2019
and
2018
, respectively.
Minimum Third-Party Customer Support Commitments
The Company's contract with third-party customer support vendors include minimum monthly commitments and the requirements to maintain the service level for several months. The total contractual minimum commitments were approximately
$1.1 million
at
March 31, 2019
.
Minimum Third-Party Network Service Provider Commitments
The Company entered into contracts with multiple vendors for third-party network service which expire on various dates through fiscal 2021. At
March 31, 2019
, future minimum annual payments under these third-party network service contracts were approximately
$1.9 million
.
Legal Proceedings
The Company may be involved in various lawsuits, claims and proceedings, including intellectual property, commercial, securities and employment matters that arise in the normal course of business. The Company accrues a liability when management believes information available prior to the issuance of the financial statements indicates it is probable a loss has been incurred as of the date of the financial statements and the amount of loss can be reasonably estimated. The Company adjusts its accruals to reflect the impact of negotiations, settlements, rulings, advice of legal counsel and other information and events pertaining to a particular case. Legal costs are expensed as incurred.
On November 30, 2018, the Company was named as a defendant in Rainey Circuit LLC v. 8x8 Inc., by way of a Complaint filed by Plaintiff Rainey Circuit LLC in the District of Delaware (Civil Action No. Case 1:18-cv-01903-MN, the Complaint). The Complaint alleges that the Company infringes U.S. Patent No. 8,131,824 with regards to alleged activities concerning the Company's sales or uses of a multimedia messaging system as allegedly implemented in connection with the Company’s Virtual Office application. The Company has a membership with a defensive patent acquisition network (third-party). The third-party negotiated a license covering the Company, and on February 26, 2019, Rainey Circuit LLC dismissed the Complaint against the Company with prejudice.
The Company believes it has recorded adequate provisions for any such lawsuits, claims and proceedings and, as of March 31, 2019, it was not reasonably possible that a material loss had been incurred in excess of the amounts recognized in the Consolidated Financial Statements. Based on its experience, the Company believes that damage amounts claimed in these matters are not meaningful indicators of potential liability. Some of the matters pending against the Company involve potential compensatory, punitive or treble damage claims or sanctions, that, if granted, could require the Company to pay damages or make other expenditures in amounts that could have a material adverse effect on its Consolidated Financial Statements. Given the inherent uncertainties of litigation, the ultimate outcome of the ongoing matters described herein cannot be predicted with certainty. While litigation is inherently unpredictable, the Company believes it has valid defenses with respect to the legal matters pending against it. Nevertheless, the Consolidated Financial Statements could be materially adversely affected in a particular period by the resolution of one or more of these contingencies.
70
State and Local Taxes and Surcharges
From time to time, the Company has received inquiries from a number of state and local taxing agencies with respect to the remittance of sales, use, telecommunications, excise, and income taxes. Several jurisdictions currently are conducting tax audits of the Company's records. The Company collects or has accrued for taxes that it believes are required to be remitted. The amounts that have been remitted have historically been within the accruals established by the Company. The Company adjusts its accrual when facts relating to specific exposures warrant such adjustment. During the second quarter of fiscal 2019, the Company conducted a periodic review of the taxability of its services and determined that certain services may be subject to sales, use, telecommunications or other similar indirect taxes in certain jurisdictions. Accordingly, the Company recorded contingent indirect tax liabilities. As of March 31, 2019 and 2018, the Company had accrued contingent indirect tax liabilities of
$8.0 million
and
$0.8 million
, respectively.
Other Commitments, Indemnifications and Contingencies
During the year ended March, 31, 2019, the Company determined that additional sales taxes were probable of being assessed and estimable in multiple states as a result of preliminary findings from current sales and use tax audits. As a result, the Company estimated an incremental sales tax liability of
$7.2 million
, which was recorded as general and administrative expense in the consolidated statements of operations during fiscal 2019.
7. CONVERTIBLE SENIOR NOTES AND CAPPED CALL
Convertible Senior Notes
In February 2019, the Company issued
$287.5 million
aggregate principal amount of
0.50%
convertible senior notes (the Notes) due 2024 in a private placement, including the exercise in full of the initial purchasers' option to purchase additional notes. The Notes are senior unsecured obligations of the Company and interest is payable semiannually in arrears on February 1 and August 1 of each year, beginning on August 1, 2019. The Notes will mature on February 1, 2024, unless earlier repurchased, redeemed, or converted. The total net proceeds from the debt offering, after deducting initial purchase discounts, debt issuance costs, and costs of the capped call transactions described below, were approximately
$245.8 million
.
Each $1,000 principal amount of the Notes is initially convertible into 38.9484 shares of the Company’s common stock, par value
$0.001
, which is equivalent to an initial conversion price of approximately
$25.68
per share. The conversion rate is subject to adjustment upon the occurrence of certain specified events but will not be adjusted for any accrued and unpaid interest. In addition, upon the occurrence of certain corporate events that occur prior to the maturity date or following the Company's issuance of a notice of redemption , in each case as described in the Indenture, the Company will, in certain circumstances, increase the conversion rate for a holder that elects to convert its Notes in connection with such a corporate event or during the relevant redemption period.
Prior to the close of business on the business day immediately preceding October 1, 2023, the Notes will be convertible only under the following circumstances:
|
1.
|
At any time during any calendar quarter commencing after the fiscal quarter ending on June 30, 2019 (and only during such calendar quarter), if the last reported sale price of the Common Stock for at least
20
trading days (whether or not consecutive) during the period of
30
consecutive trading days ending on the last trading day of the immediately preceding calendar quarter is greater than or equal to
130%
of the conversion price on each applicable trading day;
|
|
2.
|
During the
five
business day period immediately after any
ten
consecutive trading day period (the measurement period), if the trading price per $1,000 principal amount of the Notes for each trading day of the measurement period was less than
98%
of the product of the last reported sale price of the common stock on each such trading day and the conversion rate on each such trading day;
|
|
3.
|
If the Company calls any or all of the Notes for redemption, at any time prior to the close of business on the scheduled trading day immediately preceding the redemption date; or
|
|
4.
|
Upon the occurrence of specified corporate events (as set forth in the indenture governing the Notes).
|
On or after October 1, 2023, until the close of business on the second scheduled trading day immediately preceding the maturity date, holders may convert all or any portion of their Notes, regardless of the foregoing circumstances. Upon conversion, the Company will satisfy its conversion obligation by paying or delivering, as the case may be,
cash, shares of
71
common stock, or a combination of cash and shares of common stock, at the Company's election. The Company’s current intent is to settle the principal amount of the Notes in cash upon conversion. During the year ended March 31, 2019, the conditions allowing holders of the Notes to convert were not met.
The Company may not redeem the Notes prior to February 4, 2022. On or after February 4, 2022, the
Company may redeem for cash all or part of the Notes, at the redemption price equal to
100%
of the principal amount thereof, plus accrued and unpaid interest, if the last reported sale price of the common stock has been at least
130%
of the conversion price then in effect for at least
20
trading days (whether or not consecutive) during any
30
consecutive trading day period (including the last trading day of such period) ending on, and including, the trading day immediately preceding the date on which the Company provides a redemption notice. If a fundamental change (as defined in the indenture governing the notes) occurs at any time, holders of Notes may require the Company to repurchase for cash all or any portion of their Notes at a repurchase price equal to
100%
of the principal amount of the Notes to be repurchased, plus accrued and unpaid interest to, but excluding, the fundamental change repurchase date.
The Notes are senior unsecured obligations and will rank senior in right of payment to any of the Company’s indebtedness that is expressly subordinated in right of payment to the Notes; equal in right of payment with the Company’s existing and future liabilities that are not so subordinated; effectively junior in right of payment to any of the Company’s secured indebtedness to the extent of the value of the assets securing such indebtedness; and structurally junior to all indebtedness and other liabilities (including trade payables) of current or future subsidiaries of the Company.
In accounting for the issuance of the Notes, the Company separated the Notes into liability and equity components. The carrying amount of the liability component was calculated by measuring the fair value of a similar debt instrument that does not have an associated convertible feature. The carrying amount of the equity component representing the conversion option was
$66.7 million
and was determined by deducting the fair value of the liability component from the par value of the Notes. The equity component is not remeasured as long as it continues to meet the accounting requirements for equity classification. The excess of the principal amount of the liability component over its carrying amount (“debt discount”) is amortized to interest expense at the effective interest rate of
6.5%
over the contractual terms of the Notes.
In accounting for the transaction costs related to the Notes, the Company allocated the total amount incurred to the liability and equity components of the Notes based on the proportion of the proceeds allocated to the debt and equity components. Issuance costs attributable to the liability component were
$0.6 million
were recorded as additional debt discount to be amortized to interest expense using the effective interest method over the contractual terms of the Notes. Issuance costs attributable to the equity component were netted with the equity component in stockholders’ equity.
The net carrying amount of the liability component of the Notes was as follows (in thousands):
|
|
March 31, 2019
|
|||
|
Principal
|
$
|
287,500
|
|
|
|
Unamortized debt discount
|
(70,876
|
)
|
||
|
Unamortized issuance costs
|
(589
|
)
|
||
|
Net carrying amount
|
$
|
216,035
|
|
|
The net carrying amount of the equity component of the Notes was as follows (in thousands):
|
|
March 31, 2019
|
|||
|
Debt discount for conversion option
|
$
|
66,700
|
|
|
|
Issuance costs
|
(1,848
|
)
|
||
|
Net carrying amount
|
$
|
64,852
|
|
|
Interest expense related to the Notes was as follows (in thousands):
|
|
March 31, 2019
|
|||
|
Contractual interest expense
|
$
|
156
|
|
|
|
Amortization of debt discount
|
1,343
|
|
||
|
Amortization of issuance costs
|
11
|
|
||
|
Total interest expense
|
$
|
1,510
|
|
|
Capped Call
72
In connection with the pricing of the Notes, the Company entered into privately negotiated capped call transactions (Capped Calls) with certain counterparties. The Capped Calls each have an initial strike price of approximately
$25.68
per share, subject to certain adjustments, which corresponds to the initial conversion price of the Notes. The Capped Calls have initial cap prices of
$39.50
per share, subject to certain adjustments. The Capped Calls are expected to partially offset the potential dilution to the Company’s Common Stock upon any conversion of the Notes, with such offset subject to a cap based on the cap price. The Capped Calls cover, subject to anti-dilution adjustments, approximately
11.2 million
shares of the Company’s Common Stock. The Capped Calls are subject to adjustment upon the occurrence of specified extraordinary events affecting the Company, including merger events, tender offers and announcement events. In addition, the Capped Calls are subject to certain specified additional disruption events that may give rise to a termination of the Capped Calls, including nationalization, insolvency or delisting, changes in law, failures to deliver, insolvency filings and hedging disruptions. For accounting purposes, the Capped Calls are separate transactions, and not part of the terms of the Notes. As these transactions meet certain accounting criteria, the Capped Calls are recorded in stockholders' equity and are not accounted for as derivatives. The cost of
$33.7 million
incurred to purchase the Capped Calls was recorded as a reduction to additional paid-in capital and will not be remeasured.
The net impact to the Company’s stockholders’ equity, included in additional paid-in capital, relating to the issuance of the Notes was as follows (in thousands):
|
|
March 31, 2019
|
|||
|
Conversion option
|
$
|
66,700
|
|
|
|
Payments for capped call transactions
|
(33,724
|
)
|
||
|
Issuance costs
|
(1,848
|
)
|
||
|
Total
|
31,128
|
|
||
8. STOCKHOLDERS' EQUITY
In May 2006, the Company's board of directors approved the 2006 Stock Plan ("2006 Plan"). The Company's stockholders subsequently adopted the 2006 Plan in September 2006, and became effective in October 2006. The Company reserved
7,000,000
shares of the Company's common stock for issuance under this plan. The 2006 Plan provides for granting incentive stock options to employees and non-statutory stock options to employees, directors or consultants. The stock option price of incentive stock options granted may not be less than the fair market value on the effective date of the grant. Other types of options and awards under the 2006 Plan may be granted at any price approved by the administrator, which generally will be the compensation committee of the board of directors. Options generally vest over
four years
and expire
ten years
after grant. In 2009, the 2006 Plan was amended to provide for the granting of stock purchase rights. The 2006 Plan expired in May 2016. As of March 31, 2019, there are
no
shares available for future grants under the 2006 Plan.
2012 Equity Incentive Plan
In June 2012, the Company's board of directors approved the 2012 Equity Incentive Plan ("2012 Plan"). The Company's stockholders subsequently adopted the 2012 Plan in July 2012, and became effective in August 2012. The Company reserved
4,100,000
shares of the Company's common stock for issuance under this plan. In August 2014, 2016 and 2018, the 2012 Plan was amended to allow for an additional
6,800,000
,
4,500,000
and
16,300,000
shares reserved for issuance, respectively. The 2012 Plan provides for granting incentive stock options to employees and non-statutory stock options to employees, directors or consultants, and granting of stock appreciation rights, restricted stock, restricted stock units and performance units, qualified performance-based awards and stock grants. The stock option price of incentive stock options granted may not be less than the fair market value on the effective date of the grant. Other types of options and awards under the 2012 Plan may be granted at any price approved by the administrator, which generally will be the compensation committee of the board of directors. Options, restricted stock and restricted stock units generally vest over
four years
and expire
ten years
after grant. The 2012 Plan expires in June 2022. As of
March 31, 2019
,
10.7 million
shares remained available under the 2012 Plan.
2013 New Employee Inducement Incentive Plan
In September 2013, the Company's board of directors approved the 2013 New Employee Inducement Incentive Plan ("2013 Plan"). The Company reserved
1,000,000
shares of the Company's common stock for issuance under this plan. In November 2014, the 2013 Plan was amended to allow for an additional
1,200,000
shares reserved for issuance. In July 2015, the Plan was amended to allow for an additional
1,200,000
shares reserved for issuance. In connection with its approval of the August 2016 amendments to the 2012 Plan, the Board of Directors has approved the suspension of future grants under the 2013 Plan, which
73
became effective immediately upon stockholder approval of the proposed 2012 Plan amendments in August 2016. In addition, the 2013 Plan was amended to reduce the number of shares reserved for issuance under the 2013 Plan to the number of shares that are then subject to outstanding awards under the 2013 Plan, leaving
no
shares available for future grant. The 2013 Plan provided for granting non-statutory stock options, stock appreciation rights, restricted stock, restricted stock and performance units and stock grants solely to newly hired employees as a material inducement to accepting employment with the Company. Options were granted at market value on the grant date under the 2013 Plan, unless determined otherwise at the time of grant by the administrator, which generally will be the compensation committee of the board of directors. Grants generally vest over
four years
and expire
ten years
after grant.
2017 New Employee Inducement Incentive Plan
In October 2017, the Company's board of directors approved the 2017 New Employee Inducement Incentive Plan ("2017 Plan"). The Company reserved
1,000,000
shares of the Company's common stock for issuance under this plan. In January and June 2018 , the 2017 Plan was amended to allow for an additional
1,500,000
and
1,500,000
shares reserved for issuance, respectively. The 2017 Plan provides for granting non-statutory stock options, stock appreciation rights, restricted stock, and performance units and stock grants solely to newly hired employees as a material inducement to accepting employment with the Company. Options are granted at market value on the grant date under the 2017 Plan, unless determined otherwise at the time of grant by the administrator, which generally will be the compensation committee of the board of directors. Grants generally vest over
three years
and expire
ten years
after grant. As of
March 31, 2019
,
0.6 million
shares remained available under the 2017 plan.
Stock-Based Compensation
The following table summarizes stock-based compensation expense (as reclassified, see Note 14, in thousands):
|
|
Years Ended March 31,
|
||||||||||
|
|
2019
|
2018
|
2017
|
||||||||
|
Cost of service revenue
|
$
|
5,527
|
|
$
|
3,977
|
|
$
|
3,308
|
|
||
|
Cost of product revenue
|
—
|
|
—
|
|
—
|
|
|||||
|
Research and development
|
12,313
|
|
6,625
|
|
3,762
|
|
|||||
|
Sales and marketing
|
11,951
|
|
6,630
|
|
5,334
|
|
|||||
|
General and administrative
|
14,717
|
|
11,944
|
|
9,058
|
|
|||||
|
Total
|
$
|
44,508
|
|
$
|
29,176
|
|
$
|
21,462
|
|
||
Stock Options, Stock Purchase Right and Restricted Stock Unit Activity
Stock option activity under all the Company's stock option plans since
March 31, 2016
, is summarized as follows:
74
|
Number of
Shares
|
Weighted
Average
Exercise
Price
Per Share
|
|||||
|
Outstanding at March 31, 2016
|
4,793,266
|
|
$
|
6.29
|
|
|
|
Granted
|
407,392
|
|
14.63
|
|
||
|
Exercised
|
(603,998
|
)
|
2.34
|
|
||
|
Canceled/Forfeited
|
(134,248
|
)
|
8.41
|
|
||
|
Outstanding at March 31, 2017
|
4,462,412
|
|
7.52
|
|
||
|
Granted
|
609,135
|
|
14.95
|
|
||
|
Exercised
|
(773,897
|
)
|
3.95
|
|
||
|
Canceled/Forfeited
|
(299,365
|
)
|
13.05
|
|
||
|
Outstanding at March 31, 2018
|
3,998,285
|
|
8.93
|
|
||
|
Granted
|
236,799
|
|
21.65
|
|
||
|
Exercised
|
(759,884
|
)
|
7.70
|
|
||
|
Canceled/Forfeited
|
(361,129
|
)
|
15.41
|
|
||
|
Outstanding at March 31, 2019
|
3,114,071
|
|
$
|
9.45
|
|
|
|
Vested and expected to vest March 31, 2019
|
3,114,071
|
|
$
|
9.45
|
|
|
|
Exercisable at March 31, 2019
|
2,737,032
|
|
$
|
8.33
|
|
|
Stock Purchase Right activity since
March 31, 2016
is summarized as follows:
|
Number of
Shares
|
Weighted
Average Grant
Date Fair Value
|
Weighted Average
Remaining Contractual
Term (in Years)
|
||||||
|
Balance at March 31, 2016
|
82,171
|
|
$
|
6.30
|
|
0.76
|
||
|
Granted
|
—
|
|
—
|
|
||||
|
Vested and released
|
(69,426
|
)
|
6.00
|
|
||||
|
Forfeited
|
(1,375
|
)
|
6.72
|
|
||||
|
Balance at March 31, 2017
|
11,370
|
|
8.10
|
|
1.09
|
|||
|
Granted
|
—
|
|
—
|
|
||||
|
Vested and released
|
(6,395
|
)
|
8.26
|
|
||||
|
Forfeited
|
—
|
|
—
|
|
||||
|
Balance at March 31, 2018
|
4,975
|
|
8.10
|
|
1.09
|
|||
|
Granted
|
—
|
|
—
|
|
||||
|
Vested and released
|
(4,625
|
)
|
7.88
|
|
||||
|
Forfeited
|
(350
|
)
|
7.88
|
|
||||
|
Balance at March 31, 2019
|
—
|
|
$
|
—
|
|
|
||
75
Restricted stock unit activity since
March 31, 2016
is summarized as follows:
|
Number of
Shares
|
Weighted
Average Grant
Date Fair Value
|
Weighted Average
Remaining Contractual
Term (in Years)
|
||||||
|
Balance at March 31, 2016
|
4,544,799
|
|
$
|
8.08
|
|
1.67
|
||
|
Granted
|
2,491,877
|
|
15.15
|
|
||||
|
Vested and released
|
(1,600,831
|
)
|
7.89
|
|
||||
|
Forfeited
|
(496,795
|
)
|
9.56
|
|
||||
|
Balance at March 31, 2017
|
4,939,050
|
|
11.57
|
|
1.55
|
|||
|
Granted
|
3,481,870
|
|
14.41
|
|
||||
|
Vested and released
|
(1,833,038
|
)
|
10.27
|
|
||||
|
Forfeited
|
(652,339
|
)
|
12.73
|
|
||||
|
Balance at March 31, 2018
|
5,935,543
|
|
13.51
|
|
1.60
|
|||
|
Granted
|
5,726,787
|
|
19.77
|
|
||||
|
Vested and released
|
(2,399,371
|
)
|
12.87
|
|
||||
|
Forfeited
|
(1,442,471
|
)
|
16.85
|
|
||||
|
Balance at March 31, 2019
|
7,820,488
|
|
$
|
17.68
|
|
1.35
|
||
The total intrinsic value of options exercised in the years ended March 31, 2019, 2018 and 2017 was
$10.0 million
,
$9.0 million
and
$7.2 million
, respectively. As of March 31, 2019, there was
$107 million
of unamortized stock-based compensation expense related to unvested stock options and awards which is expected to be recognized over a weighted average period of approximately
2.3 years
.
1996 Employee Stock Purchase Plan
The Company's 1996 Stock Purchase Plan ("Employee Stock Purchase Plan") was adopted in June 1996 and became effective upon the closing of the Company's initial public offering in July 1997. Under the Employee Stock Purchase Plan,
500,000
shares of common stock were initially reserved for issuance. At the start of each fiscal year, the number of shares of common stock subject to the Employee Stock Purchase Plan increases so that
500,000
shares remain available for issuance. In May 2006, the Company's board of directors approved a
ten
-year extension of the Employee Stock Purchase Plan. Stockholders approved a
ten
-year extension of the Employee Stock Purchase Plan at the 2006 Annual Meeting of Stockholders held September 18, 2006. The Board of Directors approved a second
ten
-year extension in May 2017. Stockholders approved the second
ten
-year extension in August 2017. As a result of these extensions, the Employee Stock Purchase Plan is effective until August 2027. During fiscal
2019
,
2018
and
2017
, approximately
$0.5 million
,
$0.4 million
and
$0.3 million
shares, respectively, were issued under the Employee Stock Purchase Plan.
The Employee Stock Purchase Plan permits eligible employees to purchase common stock through payroll deductions at a price equal to
85%
of the fair market value of the common stock at the beginning of each
two
-year offering period or the end of a
six
month purchase period, whichever is lower. When the Employee Stock Purchase Plan was reinstated in fiscal 2005, the offering period was reduced from
two years
to
one year
. The contribution amount may not exceed
ten percent
of an employee's base compensation, including commissions, but not including bonuses and overtime. In the event of a merger of the Company with or into another corporation or the sale of all or substantially all of the assets of the Company, the Employee Stock Purchase Plan provides that a new exercise date will be set for each purchase right under the plan which exercise date will occur before the date of the merger or asset sale.
As of
March 31, 2019
, there was approximately
$1.8 million
of total unrecognized compensation cost related to employee stock purchases. This cost is expected to be recognized over a weighted average period of
0.6
years.
76
Assumptions Used to Calculate Stock-Based Compensation Expense
The fair value of each of the Company's option grants has been estimated on the date of grant using the Black-Scholes pricing model with the following assumptions:
|
|
Years Ended March 31,
|
||||||||||
|
|
2019
|
2018
|
2017
|
||||||||
|
Expected volatility
|
41
|
%
|
41
|
%
|
44
|
%
|
|||||
|
Expected dividend yield
|
—
|
|
—
|
|
—
|
|
|||||
|
Risk-free interest rate
|
2.5% to 3.0%
|
|
1.8% to 2.4%
|
|
1.1% to 2.2%
|
|
|||||
|
Weighted average expected term (in years)
|
4.5 years
|
|
4.8 years
|
|
4.9 years
|
|
|||||
|
Weighted average fair value of options granted
|
$
|
8.19
|
|
$
|
5.70
|
|
$
|
5.74
|
|
||
The estimated fair value of stock purchase rights granted under the Employee Stock Purchase Plan was estimated using the Black-Scholes pricing model with the following weighted-average assumptions:
|
|
Years Ended March 31,
|
||||||||||
|
|
2019
|
2018
|
2017
|
||||||||
|
Expected volatility
|
41
|
%
|
40
|
%
|
37
|
%
|
|||||
|
Expected dividend yield
|
—
|
|
—
|
|
—
|
|
|||||
|
Risk-free interest rate
|
2.43
|
%
|
1.33
|
%
|
0.65
|
%
|
|||||
|
Weighted average expected term (in years)
|
0.8 years
|
|
0.8 years
|
|
0.8 years
|
|
|||||
|
Weighted average fair value of rights granted
|
$
|
5.74
|
|
$
|
4.10
|
|
$
|
4.19
|
|
||
Stock Repurchases
In October 2015, the Company's board of directors authorized the Company to purchase an additional
$15.0 million
of its common stock from time to time until October 20, 2016 under the 2015 Repurchase Plan. The plan expired in October 2016 with an unused authorized repurchase amount of
$15.0 million
.
In May 2017, the Company's board of directors authorized the Company to purchase
$25.0 million
of its common stock from time to time under the 2017 Repurchase Plan (the "2017 Plan"). The 2017 Plan expires when the maximum purchase amount is reached, or upon the earlier revocation or termination by the board of directors. The remaining amount available under the 2017 Plan at
March 31, 2019
was approximately
$7.1 million
.
9. INCOME TAXES
The Tax Cuts and Jobs Act ("Tax Act") was enacted on December 22, 2017. Among numerous provisions, the Tax Act reduces the U.S. federal corporate tax rate from
35% t
o
21%
, requires companies to pay a one-time transition tax on earnings of certain foreign subsidiaries that were previously tax deferred, and creates new taxes on certain foreign sourced earnings.
The Company remeasured certain deferred tax assets and liabilities based on the rates at which they are expected to reverse in the future, which is generally
21%
. Accordingly, deferred tax assets were adjusted down by about
$23 million
in the period ended December 31, 2017. However, because the Company recorded a full valuation allowance during the year ended December 31, 2018, the decrease in deferred tax assets from the tax rate change was fully offset by a corresponding decrease in valuation allowance, and therefore, resulted in no impact to the tax expense.
The one-time transition tax is based on the Company's total post-1986 earnings and profits for which U.S. income taxes have been previously deferred. The Company recorded no one-time transition tax liability for its foreign subsidiaries as the Company's calculations concluded it does not have any untaxed foreign accumulated earnings as of the measurement date. The Company has made an accounting policy election to treat Global Intangible Low-Taxed Income (“GILTI”) as a current period cost.
In response to the Tax Act, the SEC staff issued guidance on accounting for the tax effects of the Tax Act. The guidance provides a one-year measurement period for companies to complete the accounting. As of March 31, 2019, the Company has completed its analysis and recorded no adjustments.
77
For the years ended
March 31, 2019
,
2018
and
2017
, the Company recorded a provision (benefit) for income taxes of approximately
$0.6 million
,
$66.3 million
, and
$(0.1) million
, respectively. The components of the consolidated provision (benefit) for income taxes for fiscal
2019
,
2018
and
2017
consisted of the following (in thousands):
|
|
March 31,
|
||||||||||
|
Current:
|
2019
|
2018
|
2017
|
||||||||
|
Federal
|
$
|
—
|
|
$
|
(395
|
)
|
$
|
(7
|
)
|
||
|
State
|
291
|
|
256
|
|
588
|
|
|||||
|
Foreign
|
278
|
|
185
|
|
112
|
|
|||||
|
Total current tax provision
|
569
|
|
46
|
|
693
|
|
|||||
|
Deferred
|
|||||||||||
|
Federal
|
—
|
|
59,837
|
|
1,506
|
|
|||||
|
State
|
—
|
|
6,664
|
|
(1,095
|
)
|
|||||
|
Foreign
|
—
|
|
(253
|
)
|
(1,230
|
)
|
|||||
|
Total deferred tax provision (benefit)
|
—
|
|
66,248
|
|
(819
|
)
|
|||||
|
Income tax provision (benefit)
|
$
|
569
|
|
$
|
66,294
|
|
$
|
(126
|
)
|
||
The Company's income (loss) from continuing operations before income taxes included
$0.2 million
,
$(19.7) million
, and
$(8.4) million
of foreign subsidiary income (loss) for the fiscal years ended
March 31, 2019
,
2018
and
2017
, respectively. The Company is permanently reinvesting the earnings of its profitable foreign subsidiaries. The Company intends to reinvest these profits in expansion of overseas operations. If the Company were to remit these earnings, the tax impact would be immaterial.
Deferred tax assets and (liabilities) were comprised of the following (in thousands):
|
|
March 31,
|
||||||
|
|
2019
|
2018
|
|||||
|
Deferred tax assets
|
|||||||
|
Net operating loss carryforwards
|
$
|
61,740
|
|
$
|
40,465
|
|
|
|
Research and development and other credit carryforwards
|
15,573
|
|
11,761
|
|
|||
|
Stock-based compensation
|
9,006
|
|
6,389
|
|
|||
|
Reserves and allowances
|
5,697
|
|
3,181
|
|
|||
|
Fixed assets and intangibles
|
2,709
|
|
378
|
|
|||
|
Gross deferred tax assets
|
94,725
|
|
62,174
|
|
|||
|
Valuation allowance
|
(65,948
|
)
|
(62,174
|
)
|
|||
|
Total deferred tax assets
|
28,777
|
|
$
|
—
|
|
||
|
Deferred tax liabilities
|
|||||||
|
Deferred sales commissions
|
(12,221
|
)
|
—
|
|
|||
|
Convertible debt
|
(16,556
|
)
|
—
|
|
|||
|
Net deferred taxes
|
$
|
—
|
|
$
|
—
|
|
|
The Company assesses the realizability of deferred tax assets based on the available evidence, including a history of taxable income and estimates of future taxable income. In assessing the realizability of deferred tax assets, The Company considers whether it is more likely than not that all or some portion of deferred tax assets will not be realized. For the year ended
March 31, 2019
, the Company continues to maintain a full valuation allowance against its deferred tax assets as it considered the cumulative losses in recent periods to be a substantial negative evidence. At
March 31, 2019
, management determined that a valuation allowance of approximately
$65.9 million
was needed compared with approximately
$62.2 million
as of
March 31, 2018
.
At
March 31, 2019
, the Company had federal net operating loss carryforwards related to fiscal year 2019 of approximately
$88.6 million
, which carryforward indefinitely, and had carry-forwards related to prior years of
$156.4 million
, which begin to expire in 2021. At March 31, 2019, the Company has state net operating loss carry-forwards of
$80.0 million
, which expire at various dates between 2029 and 2037. In addition, at
March 31, 2019
, the Company had research and development credit carryforwards for federal and California tax reporting purposes of approximately
$10.1 million
and
$11.5 million
, respectively.
78
The federal income tax credit carryforwards will expire at various dates between 2021 and 2038, while the California income tax credits will carry forward indefinitely. A reconciliation of the Company's provision (benefit) for income taxes to the amounts computed using the statutory U.S. federal income tax rate is as follows (in thousands):
|
|
Years Ended March 31,
|
||||||||||
|
|
2019
|
2018
|
2017
|
||||||||
|
Tax benefit at statutory rate
|
$
|
(18,441
|
)
|
$
|
(11,790
|
)
|
$
|
(1,652
|
)
|
||
|
State income taxes before valuation allowance, net of federal effect
|
(3,612
|
)
|
(1,042
|
)
|
108
|
|
|||||
|
Foreign tax rate differential
|
71
|
|
(1,188
|
)
|
885
|
|
|||||
|
Research and development credits
|
(3,744
|
)
|
(2,189
|
)
|
(1,484
|
)
|
|||||
|
Change in valuation allowance
|
30,558
|
|
56,663
|
|
(287
|
)
|
|||||
|
Compensation/option differences
|
(7,277
|
)
|
(4,965
|
)
|
(246
|
)
|
|||||
|
Non-deductible compensation
|
1,200
|
|
1,132
|
|
1,079
|
|
|||||
|
Tax Act rate change impact
|
—
|
|
22,630
|
|
—
|
|
|||||
|
Acquisition costs
|
—
|
|
—
|
|
54
|
|
|||||
|
Foreign loss not benefited
|
159
|
|
6,847
|
|
780
|
|
|||||
|
Other
|
1,655
|
|
196
|
|
637
|
|
|||||
|
Total income tax provision (benefit)
|
$
|
569
|
|
$
|
66,294
|
|
$
|
(126
|
)
|
||
For
March 31, 2019
, the statutory federal rate of
21%
was used. For fiscal year ended
March 31, 2018
, a blended statutory U.S. federal income tax rate of
34%
for
9 months
and
21%
for
3 months
was used. For the year ended March, 31, 2017 a U.S. federal income tax rate of
34%
was used.
The Company recognizes the tax benefit from uncertain tax positions if it is more likely than not that the tax positions will be sustained on examination by the tax authorities, based on the technical merits of the position. The tax benefit is measured based on the largest benefit that has a greater than
50%
likelihood of being realized upon ultimate settlement. A reconciliation of the beginning and ending amount of unrecognized tax benefits is as follows (in thousands):
|
|
Unrecognized Tax Benefits
|
||||||||||
|
|
2019
|
2018
|
2017
|
||||||||
|
Balance at beginning of year
|
$
|
3,980
|
|
$
|
3,331
|
|
$
|
2,881
|
|
||
|
Gross increases - tax position in prior period
|
17
|
|
—
|
|
—
|
|
|||||
|
Gross increases - tax position related to the current year
|
1,036
|
|
649
|
|
450
|
|
|||||
|
Balance at end of year
|
$
|
5,033
|
|
$
|
3,980
|
|
$
|
3,331
|
|
||
At
March 31, 2019
, the Company had a liability for unrecognized tax benefits of
$5.0 million
, all of which, if recognized, would favorably affect the company's effective tax rate. The Company does not expect its unrecognized tax benefits to change significantly over the next
12 months
.
The Company's policy for recording interest and penalties associated with tax examinations is to record such items as a component of operating expense income before taxes. During the fiscal years ended
March 31, 2019
,
2018
and
2017
, the Company did
no
t recognize any interest or penalties related to unrecognized tax benefits.
Utilization of the Company's net operating loss and tax credit carryforwards can become subject to a substantial annual limitation due to the ownership change limitations provided by Section 382 of the Internal Revenue Code and similar state provisions. Such an annual limitation could result in the expiration or elimination of the net operating loss and tax credit carryforwards before utilization. The Company has performed an analysis of its changes in ownership under Section 382 of the Internal Revenue Code. The Company currently believes that the Section 382 limitation will not limit utilization of the carryforwards prior to their expiration, with the exception of certain acquired loss and tax credit carryforwards.
The Company files U.S. federal and state income tax returns in jurisdictions with varying statutes of limitations. The Company is currently under examination by the Illinois Department of Revenue for the fiscal years ended March 31, 2016 and 2017. The outcome of the ongoing examination is currently unknown. The tax years fiscal 2000 through fiscal 2019 generally remain subject to examination by federal and most state tax authorities.
79
10. NET INCOME (LOSS) PER SHARE
The following is a reconciliation of the weighted average number of common shares outstanding used in calculating basic and diluted net income (loss) per share (in thousands, except share and per share data):
|
|
Years Ended March 31,
|
||||||||||
|
|
2019
|
2018
|
2017
|
||||||||
|
Numerator:
|
|
|
|
|
|
|
|||||
|
Net loss available to common stockholders
|
$
|
(88,739
|
)
|
$
|
(104,497
|
)
|
$
|
(4,751
|
)
|
||
|
Denominator:
|
|||||||||||
|
Denominator for basic and diluted calculation
|
94,533
|
|
92,017
|
|
90,340
|
|
|||||
|
Net loss per share - basic and diluted
|
$
|
(0.94
|
)
|
$
|
(1.14
|
)
|
$
|
(0.05
|
)
|
||
The following table summarizes the potentially dilutive common shares that were excluded from the calculation of diluted earnings per share because their inclusion would have been antidilutive (in thousands):
|
|
Years Ended March 31,
|
|||||||
|
|
2019
|
2018
|
2017
|
|||||
|
Stock options
|
3,114
|
|
3,998
|
|
4,462
|
|
||
|
Restricted stock units
|
7,820
|
|
5,940
|
|
4,950
|
|
||
|
|
10,934
|
|
9,938
|
|
9,412
|
|
||
11. GEOGRAPHICAL INFORMATION
The following tables set forth the geographic information for each period (in thousands):
|
Revenue for the years ended March 31,
|
||||||||||||||
|
|
2019
|
2018
|
2017
|
|||||||||||
|
Americas (principally US)
|
$
|
316,427
|
|
$
|
266,034
|
|
$
|
227,914
|
|
|||||
|
Europe (principally UK)
|
36,159
|
|
30,466
|
|
25,474
|
|
||||||||
|
|
|
$
|
352,586
|
|
$
|
296,500
|
|
$
|
253,388
|
|
||||
|
Property and Equipment
|
||||||||||||
|
|
March 31, 2019
|
|
March 31, 2018
|
|
||||||||
|
Americas (principally US)
|
$
|
45,639
|
|
$
|
27,270
|
|
||||||
|
Europe (principally UK)
|
7,196
|
|
8,462
|
|
||||||||
|
|
$
|
52,835
|
|
$
|
35,732
|
|
||||||
80
12. ACQUISITIONS
LeChat, Inc.
On January 5, 2017, the Company entered into an Agreement and Plan of Merger (the "Agreement") with the preferred and common shareholders LeChat Inc. (LeChat) for the purchase of all the outstanding preferred and common shares of LeChat.
The Company recorded the acquired developed technology as an identifiable intangible asset with an estimated useful life of
two years
. The fair value of the technology was based on estimates and assumptions made by management using a cost approach method. The intangible asset is amortized on a straight-line basis over
two years
.
The excess of the consideration transferred over the aggregate fair value of the asset acquired was recorded as goodwill. The amount of goodwill recognized was primarily attributable to the expected contributions of the acquired assets to the overall corporate strategy in addition to the acquired workforce.
LeChat did not contribute materially to revenue or net loss for the period of acquisition to March 31, 2019. Goodwill recognized upon acquisition is deductible for income tax purposes.
MarianaIQ
On April 12, 2018, the Company entered into an Asset Purchase Agreement with MarianaIQ Inc. (MarianaIQ) for the purchase of certain assets of MarianaIQ to strengthen the artificial intelligence and machine learning capabilities of the Company's X Series product suite.
The Company recorded the acquired developed technology as an identifiable intangible asset with an estimated useful life of
two years
. The fair value of the technology was based on estimates and assumptions made by management using a cost approach method. The intangible asset is amortized on a straight-line basis over
two years
.
The excess of the consideration transferred over the aggregate fair value of the asset acquired was recorded as goodwill. The amount of goodwill recognized was primarily attributable to the expected contributions of the acquired assets to the overall corporate strategy in addition to the acquired workforce.
MarianaIQ did not contribute materially to revenue or net loss for the period of acquisition to March 31, 2019. Goodwill recognized upon acquisition is deductible for income tax purposes.
Jitsi
On October 29, 2018, the Company entered into an Asset Purchase Agreement with Atlassian Corporation PLC (Atlassian) through which the Company purchased certain assets from Atlassian relating to the Jitsi open source video communications technology (Jitsi). The Company intends to integrate Jitsi's video collaboration capabilities into the Company's technology platform to further enhance the Company's video and X Series platform offerings.
The Company recorded the acquired developed technology as an identifiable intangible asset with an estimated useful life of
two years
. The fair value of the technology was based on estimates and assumptions made by management using a cost approach method. The intangible asset is amortized on a straight-line basis over
two years
.
The excess of the consideration transferred over the aggregate fair value of the asset acquired was recorded as goodwill. The amount of goodwill recognized was primarily attributable to the expected contributions of the entity to the overall corporate strategy in addition to the acquired workforce.
Jitsi did not contribute materially to revenue or net loss for the period of acquisition to March 31, 2019. Goodwill recognized upon acquisition is deductible for income tax purposes.
81
13. SUBSEQUENT EVENTS
On April 30, 2019, Company entered into an assignment and assumption of lease agreement (the "Agreement") with CAP Phase I, a Delaware limited liability company (the "Landlord"), and Roku Inc., a Delaware corporation ("Roku"), to assign to Roku the lease executed between the Company and the Landlord on January 23, 2018 (the "Lease"). Pursuant to the Agreement, the Company expects to be released from all of its obligations under the Lease and related standby letter of credit by the end of the Company’s fiscal year ending March 31, 2022 or shortly thereafter.
14. RECLASSIFICATIONS
The Company reclassified certain expenses on its Consolidated Statement of Operations effective for the fourth quarter of fiscal 2019. These expenses are related to servicing our customers, and include customer deployment, technical support, professional services and other costs, which have been reclassified from Sales & Marketing expense to Cost of Revenues, Research & Development expenses or General & Administrative expenses.
The Company believes these classifications provide additional clarity and insights into the Company’s go-to-market, demand generation and sales execution activities, and how the total Sales & Marketing spend drives revenue generation, in light of the recent strategic and organizational changes impacting the Company’s channel, marketing and support activities.
The reclassifications did not have any impact to the consolidated operating income (loss), net income (loss) or cash flows.
The revised Consolidated Statements of Operations three month periods ended June 30, 2016, 2017 and 2018, September 30, 2016, 2017 and 2018, December 31, 2016, 2017, and 2018, and March 31, 2017, 2018, and 2019 and for the twelve month periods ended March 31, 2017, 2018, and 2019 are as follows (in thousands):
82
|
Twelve Months
|
|||||||||||||||||||
|
Three Months Ended (unaudited)
|
Ended
|
||||||||||||||||||
|
June 30,
|
September 30,
|
December 31,
|
March 31,
|
March 31,
|
|||||||||||||||
|
2016
|
2016
|
2016
|
2017
|
2017
|
|||||||||||||||
|
Pre-Reclassification
|
|||||||||||||||||||
|
Total revenues
|
$
|
60,041
|
|
$
|
63,183
|
|
$
|
63,676
|
|
$
|
66,489
|
|
$
|
253,388
|
|
||||
|
Cost of service revenue
|
10,235
|
|
10,837
|
|
10,526
|
|
10,803
|
|
42,400
|
|
|||||||||
|
Cost of product revenue
|
5,505
|
|
5,782
|
|
4,240
|
|
4,187
|
|
19,714
|
|
|||||||||
|
Research and development
|
6,710
|
|
6,505
|
|
7,094
|
|
7,142
|
|
27,452
|
|
|||||||||
|
Sales and marketing
|
31,691
|
|
33,691
|
|
35,667
|
|
38,228
|
|
139,277
|
|
|||||||||
|
General and administrative
|
6,801
|
|
6,747
|
|
7,852
|
|
9,814
|
|
31,214
|
|
|||||||||
|
Loss from operations
|
$
|
(901
|
)
|
$
|
(379
|
)
|
$
|
(1,703
|
)
|
$
|
(3,685
|
)
|
$
|
(6,669
|
)
|
||||
|
Reclassifications
|
|||||||||||||||||||
|
Total revenues
|
$
|
—
|
|
$
|
—
|
|
$
|
—
|
|
$
|
—
|
|
$
|
—
|
|
||||
|
Cost of service revenue
|
7,466
|
|
6,675
|
|
6,759
|
|
7,276
|
|
28,176
|
|
|||||||||
|
Cost of product revenue
|
—
|
|
—
|
|
—
|
|
—
|
|
—
|
|
|||||||||
|
Research and development
|
471
|
|
330
|
|
368
|
|
378
|
|
1,547
|
|
|||||||||
|
Sales and marketing
|
(10,247
|
)
|
(9,363
|
)
|
(9,897
|
)
|
(10,877
|
)
|
(40,384
|
)
|
|||||||||
|
General and administrative
|
2,310
|
|
2,358
|
|
2,770
|
|
3,223
|
|
10,661
|
|
|||||||||
|
Loss from operations
|
$
|
—
|
|
$
|
—
|
|
$
|
—
|
|
$
|
—
|
|
$
|
—
|
|
||||
|
Post-Reclassification
|
|||||||||||||||||||
|
Total revenues
|
$
|
60,041
|
|
$
|
63,183
|
|
$
|
63,676
|
|
$
|
66,489
|
|
$
|
253,388
|
|
||||
|
Cost of service revenue
|
17,701
|
|
17,512
|
|
17,285
|
|
18,079
|
|
70,576
|
|
|||||||||
|
Cost of product revenue
|
5,505
|
|
5,782
|
|
4,240
|
|
4,187
|
|
19,714
|
|
|||||||||
|
Research and development
|
7,181
|
|
6,835
|
|
7,462
|
|
7,520
|
|
28,999
|
|
|||||||||
|
Sales and marketing
|
21,444
|
|
24,328
|
|
25,770
|
|
27,351
|
|
98,893
|
|
|||||||||
|
General and administrative
|
9,111
|
|
9,105
|
|
10,622
|
|
13,037
|
|
41,875
|
|
|||||||||
|
Loss from operations
|
$
|
(901
|
)
|
$
|
(379
|
)
|
$
|
(1,703
|
)
|
$
|
(3,685
|
)
|
$
|
(6,669
|
)
|
||||
83
|
Twelve Months
|
|||||||||||||||||||
|
Three Months Ended (unaudited)
|
Ended
|
||||||||||||||||||
|
June 30,
|
September 30,
|
December 31,
|
March 31,
|
March 31,
|
|||||||||||||||
|
2017
|
2017
|
2017
|
2018
|
2018
|
|||||||||||||||
|
Pre-Reclassification
|
|||||||||||||||||||
|
Total revenues
|
$
|
69,098
|
|
$
|
72,483
|
|
$
|
75,575
|
|
$
|
79,344
|
|
$
|
296,500
|
|
||||
|
Cost of service revenue
|
11,662
|
|
12,757
|
|
12,318
|
|
13,952
|
|
50,689
|
|
|||||||||
|
Cost of product revenue
|
4,884
|
|
5,098
|
|
4,675
|
|
5,826
|
|
20,482
|
|
|||||||||
|
Research and development
|
7,943
|
|
8,311
|
|
8,527
|
|
10,016
|
|
34,797
|
|
|||||||||
|
Sales and marketing
|
41,110
|
|
41,163
|
|
48,830
|
|
52,940
|
|
184,044
|
|
|||||||||
|
General and administrative
|
8,956
|
|
9,616
|
|
10,003
|
|
10,340
|
|
38,915
|
|
|||||||||
|
Impairment of goodwill, intangible assets, and equipment
|
—
|
|
—
|
|
9,469
|
|
—
|
|
9,469
|
|
|||||||||
|
Loss from operations
|
$
|
(5,457
|
)
|
$
|
(4,462
|
)
|
$
|
(18,247
|
)
|
$
|
(13,730
|
)
|
$
|
(41,896
|
)
|
||||
|
Reclassifications
|
|||||||||||||||||||
|
Total revenues
|
$
|
—
|
|
$
|
—
|
|
$
|
—
|
|
$
|
—
|
|
$
|
—
|
|
||||
|
Cost of service revenue
|
8,497
|
|
8,591
|
|
8,586
|
|
9,881
|
|
35,555
|
|
|||||||||
|
Cost of product revenue
|
—
|
|
—
|
|
—
|
|
—
|
|
—
|
|
|||||||||
|
Research and development
|
418
|
|
403
|
|
376
|
|
411
|
|
1,608
|
|
|||||||||
|
Sales and marketing
|
(12,650
|
)
|
(12,483
|
)
|
(12,448
|
)
|
(12,518
|
)
|
(50,099
|
)
|
|||||||||
|
General and administrative
|
3,735
|
|
3,489
|
|
3,486
|
|
2,226
|
|
12,936
|
|
|||||||||
|
Loss from operations
|
$
|
—
|
|
$
|
—
|
|
$
|
—
|
|
$
|
—
|
|
$
|
—
|
|
||||
|
Post-Reclassification
|
|||||||||||||||||||
|
Total revenues
|
$
|
69,098
|
|
$
|
72,483
|
|
$
|
75,575
|
|
$
|
79,344
|
|
$
|
296,500
|
|
||||
|
Cost of service revenue
|
20,159
|
|
21,348
|
|
20,904
|
|
23,833
|
|
86,244
|
|
|||||||||
|
Cost of product revenue
|
4,884
|
|
5,098
|
|
4,675
|
|
5,826
|
|
20,482
|
|
|||||||||
|
Research and development
|
8,361
|
|
8,714
|
|
8,903
|
|
10,427
|
|
36,405
|
|
|||||||||
|
Sales and marketing
|
28,460
|
|
28,680
|
|
36,382
|
|
40,422
|
|
133,945
|
|
|||||||||
|
General and administrative
|
12,691
|
|
13,105
|
|
13,489
|
|
12,566
|
|
51,851
|
|
|||||||||
|
Impairment of goodwill, intangible assets, and equipment
|
—
|
|
—
|
|
9,469
|
|
—
|
|
9,469
|
|
|||||||||
|
Loss from operations
|
$
|
(5,457
|
)
|
$
|
(4,462
|
)
|
$
|
(18,247
|
)
|
$
|
(13,730
|
)
|
$
|
(41,896
|
)
|
||||
84
|
Three Months Ended (unaudited)
|
Twelve Months
|
||||||||||||||||||
|
As Previously Reported
|
Ended
|
||||||||||||||||||
|
June 30,
|
September 30,
|
December 31,
|
March 31,
|
March 31,
|
|||||||||||||||
|
2018
|
2018
|
2018
|
2019
|
2019
|
|||||||||||||||
|
Pre-Reclassification
|
|||||||||||||||||||
|
Total revenues
|
$
|
83,225
|
|
$
|
85,682
|
|
$
|
89,912
|
|
$
|
93,767
|
|
$
|
352,586
|
|
||||
|
Cost of service revenue
|
15,079
|
|
15,866
|
|
17,043
|
|
17,672
|
|
65,660
|
|
|||||||||
|
Cost of product revenue
|
6,281
|
|
5,397
|
|
5,318
|
|
5,784
|
|
22,780
|
|
|||||||||
|
Research and development
|
13,110
|
|
13,933
|
|
16,876
|
|
17,815
|
|
61,734
|
|
|||||||||
|
Sales and marketing
|
53,305
|
|
55,930
|
|
60,717
|
|
64,610
|
|
234,562
|
|
|||||||||
|
General and administrative
|
11,433
|
|
16,543
|
|
14,196
|
|
16,666
|
|
58,838
|
|
|||||||||
|
Loss from operations
|
$
|
(15,983
|
)
|
$
|
(21,987
|
)
|
$
|
(24,238
|
)
|
$
|
(28,780
|
)
|
$
|
(90,988
|
)
|
||||
|
Reclassifications
|
|||||||||||||||||||
|
Total revenues
|
$
|
—
|
|
$
|
—
|
|
$
|
—
|
|
$
|
—
|
|
$
|
—
|
|
||||
|
Cost of service revenue
|
9,470
|
|
10,336
|
|
10,589
|
|
11,137
|
|
41,532
|
|
|||||||||
|
Cost of product revenue
|
—
|
|
—
|
|
—
|
|
—
|
|
—
|
|
|||||||||
|
Research and development
|
(60
|
)
|
131
|
|
10
|
|
249
|
|
330
|
|
|||||||||
|
Sales and marketing
|
(12,810
|
)
|
(14,250
|
)
|
(14,441
|
)
|
(15,085
|
)
|
(56,586
|
)
|
|||||||||
|
General and administrative
|
3,400
|
|
3,783
|
|
3,842
|
|
3,699
|
|
14,724
|
|
|||||||||
|
Loss from operations
|
$
|
—
|
|
$
|
—
|
|
$
|
—
|
|
$
|
—
|
|
$
|
—
|
|
||||
|
Post-Reclassification
|
|||||||||||||||||||
|
Total revenues
|
$
|
83,225
|
|
$
|
85,682
|
|
$
|
89,912
|
|
$
|
93,767
|
|
$
|
352,586
|
|
||||
|
Cost of service revenue
|
24,549
|
|
26,202
|
|
27,632
|
|
28,809
|
|
107,192
|
|
|||||||||
|
Cost of product revenue
|
6,281
|
|
5,397
|
|
5,318
|
|
5,784
|
|
22,780
|
|
|||||||||
|
Research and development
|
13,050
|
|
14,064
|
|
16,886
|
|
18,064
|
|
62,063
|
|
|||||||||
|
Sales and marketing
|
40,495
|
|
41,680
|
|
46,276
|
|
49,525
|
|
177,976
|
|
|||||||||
|
General and administrative
|
14,833
|
|
20,326
|
|
18,038
|
|
20,365
|
|
73,563
|
|
|||||||||
|
Loss from operations
|
$
|
(15,983
|
)
|
$
|
(21,987
|
)
|
$
|
(24,238
|
)
|
$
|
(28,780
|
)
|
$
|
(90,988
|
)
|
||||
85
15. SELECTED QUARTERLY FINANCIAL DATA (UNAUDITED)
In thousands, except per share data amounts:
|
|
QUARTER ENDED
|
||||||||||||||||||||||||||||||
|
March 31,
2019 |
December 31,
2018
|
September 30,
2018
|
June 30,
2018
|
March 31,
2018 |
December 31,
2017
|
September 30,
2017
|
June 30,
2017
|
||||||||||||||||||||||||
|
Total revenues
|
$
|
93,767
|
|
$
|
89,912
|
|
85,682
|
|
$
|
83,225
|
|
$
|
79,344
|
|
$
|
75,575
|
|
$
|
72,483
|
|
$
|
69,098
|
|
||||||||
|
Gross profit
|
59,174
|
|
56,962
|
|
54,083
|
|
52,395
|
|
49,685
|
|
49,996
|
|
46,037
|
|
44,055
|
|
|||||||||||||||
|
Loss from operations
|
(28,780
|
)
|
(24,238
|
)
|
(21,987
|
)
|
(15,983
|
)
|
(13,730
|
)
|
(18,247
|
)
|
(4,462
|
)
|
(5,457
|
)
|
|||||||||||||||
|
Net income (loss)
|
(28,131
|
)
|
(23,771
|
)
|
(21,482
|
)
|
(15,355
|
)
|
(13,262
|
)
|
(88,520
|
)
|
(546
|
)
|
(2,169
|
)
|
|||||||||||||||
|
Net income (loss) per share:
|
|||||||||||||||||||||||||||||||
|
Basic and diluted
|
$
|
(0.29
|
)
|
$
|
(0.25
|
)
|
$
|
(0.23
|
)
|
$
|
(0.16
|
)
|
$
|
(0.14
|
)
|
$
|
(0.96
|
)
|
$
|
(0.01
|
)
|
$
|
(0.02
|
)
|
|||||||
86
ITEM 9. CHANGES IN AND DISAGREEMENTS WITH ACCOUNTANTS ON ACCOUNTING AND FINANCIAL DISCLOSURE
None.
ITEM 9A. CONTROLS AND PROCEDURES
Changes in Internal Control Over Financial Reporting
There have not been any changes in the Company's internal control over financial reporting, as such term is defined in Rules 13a-15(f) and 15d-15(f) under the Securities Exchange Act of 1934, as amended (the "Exchange Act") during the most recent fiscal quarter that have materially affected, or are reasonably likely to materially affect, the Company's internal control over financial reporting.
Conclusion Regarding the Effectiveness of Disclosure Controls and Procedures
Evaluation of Disclosure Controls and Procedures
Our management, with the participation of our Chief Executive Officer and Chief Financial Officer, has evaluated the effectiveness of our disclosure controls and procedures, as such term is defined in Rules 13a-15(e) and 15d-15(e) under the Exchange Act, as of
March 31, 2019
. Based on such evaluation, our Chief Executive Officer and Chief Financial Officer have concluded that, as of
March 31, 2019
, our disclosure controls and procedures were effective.
Management's Report on Internal Control Over Financial Reporting
Our management is responsible for establishing and maintaining adequate internal control over financial reporting, as such term is defined in Rules 13a-15(f) or 15d-15(f) under the Exchange Act. Under the supervision and with the participation of our management, including our chief executive officer and chief financial officer, we conducted an assessment of the effectiveness of our internal control over financial reporting based on criteria established in the framework in
Internal Control - Integrated Framework (2013)
issued by the Committee of Sponsoring Organizations of the Treadway Commission.
Based on this assessment, our management concluded that its internal control over financial reporting was effective as of
March 31, 2019
.
Because of its inherent limitations, internal control over financial reporting may not prevent or detect misstatements. Also, projections of any evaluation of effectiveness to future periods are subject to the risks that controls may become inadequate because of changes in conditions, or that the degree of compliance with the policies or procedures may deteriorate.
Moss Adams LLP, an independent registered public accounting firm, has audited and reported on the consolidated financial statements of 8x8, Inc. and on the effectiveness of our internal control over financial reporting. The report of Moss Adams LLP is contained in Item 8 of this Annual Report on Form 10-K.
ITEM 9B. OTHER INFORMATION
On May 20, 2019, our board of directors adopted the 8x8, Inc. (the “Company”) Employee Bonus Plan (the “Plan”) that is administered by the compensation committee of our board of directors for all executive officers, except for our chief executive officer, with respect to whom our board of directors makes all administrative decisions. Under the Plan, each of our executive officers is eligible to receive bonus awards during each fiscal year tied to the Company’s performance in relation to financial targets and, in certain cases, the executive’s achievement of individual goals. Performance is measured and bonuses are payable on a quarterly basis for the first three quarters of each fiscal year, and there is also an annual measurement of performance and potential bonus payment at the end of the fiscal year. During the first three quarters of the fiscal year, executive officers are eligible to earn bonus payments in amounts ranging from 0% to 100% of the executive officer’s quarterly target bonus amount (which is 25% of such executive officer’s full year target bonus amount). During the fourth fiscal quarter of the fiscal year, executive officers are eligible to earn bonus payments in amounts ranging from 0% to 200% of each executive officer’s annual target bonus amount (which is such executive officer’s full year target bonus amount), less any bonus amounts paid to such executive officers during the first three quarters of the fiscal year. If the Company performs below a minimum threshold during any quarter or the full fiscal year, bonuses are not payable to executive officers for such period. For our chief executive officer and chief financial officer, the bonus target for each quarter and full year is based 100% on the Company’s performance in relation to one or more financial target(s). For all other executive officers, the bonus target for each quarter and full year will be based on a combination of Company performance in relation to financial target(s) and achievement of individual goals. For all executive officers in fiscal year ending March 31, 2020, the Company financial performance target is a revenue-based target.
87
Bonus payments, if any, will be made as soon as practicable following the measurement of the Company’s performance and individual performance during each quarter and full fiscal year, as described above, by our compensation committee or, in the case of our chief executive officer, by our board of directors. If permitted by the compensation committee in its sole discretion, an executive may elect to receive fully vested shares of common stock in lieu of cash payments. The board of directors reserves the right to terminate the Plan at any time at its discretion.
PART III
Certain information required by Part III is omitted from this Annual Report on Form 10-K. The Registrant will file its definitive Proxy Statement for its Annual Meeting of Stockholders pursuant to Regulation 14A of the Securities Exchange Act of 1934, as amended, not later than 120 days after the end of the fiscal year covered by this Annual Report, and certain information included in the 2019 Proxy Statement is incorporated herein by reference.
ITEM 10. DIRECTORS, EXECUTIVE OFFICERS AND CORPORATE GOVERNANCE
Information regarding our directors and corporate governance will be presented in our definitive proxy statement for our 2019 Annual Meeting of Stockholders to be held on or about August 1, 2019, which information is incorporated into this Annual Report by reference. However, certain information regarding current executive officers found under the heading "Information About Our Executive Officers" in Item 1 of Part I hereof is also incorporated by reference in response to this Item 10.
We have adopted a Code of Conduct and Ethics that applies to our principal executive officer, principal financial officer and all other employees at 8x8, Inc. This Code of Conduct and Ethics is posted in the corporate governance section of our website at http://investors.8x8.com. We intend to satisfy the disclosure requirement under Item 5.05 of Form 8-K regarding an amendment to, or waiver from, a provision of this Code of Conduct and Ethics by posting such information in the corporate governance section on our website at http://investors.8x8.com.
ITEM 11. EXECUTIVE COMPENSATION
Information relating to executive compensation will be presented in our definitive proxy statement for our 2019 Annual Meeting of Stockholders to be held on or about August 1, 2019, which information is incorporated into this Annual Report by reference.
ITEM 12. SECURITY OWNERSHIP OF CERTAIN BENEFICIAL OWNERS AND MANAGEMENT AND RELATED STOCKHOLDER MATTERS
Information relating to securities authorized for issuance under equity compensation plans and other information required to be provided in response to this item will be presented in our definitive proxy statement for our 2019 Annual Meeting of Stockholders to be held on or about August 1, 2019, which information is incorporated into this Annual Report by reference. In addition, descriptions of our equity compensation plans are set forth in Part II, Item 8 "FINANCIAL STATEMENTS AND SUPPLEMENTARY DATA − NOTES TO CONSOLIDATED FINANCIAL STATEMENTS -- Note 8 STOCKHOLDERS' EQUITY."
ITEM 13. CERTAIN RELATIONSHIPS AND RELATED TRANSACTIONS, AND DIRECTOR INDEPENDENCE
Information required to be provided in response to this item will be presented in our definitive proxy statement for our 2019 Annual Meeting of Stockholders to be held on or about August 1, 2019, which information is incorporated into this Annual Report by reference.
ITEM 14. PRINCIPAL ACCOUNTANT FEES AND SERVICES
Information required to be provided in response to this item will be presented in our definitive proxy statement for our 2019 Annual Meeting of Stockholders to be held on or about August 1, 2019, which information is incorporated into this Annual Report by reference.
88
PART IV
ITEM 15. EXHIBITS AND FINANCIAL STATEMENT SCHEDULES
(a)(1) Financial Statements.
The information required by this item is included in Item 8.
SCHEDULE II
VALUATION AND QUALIFYING ACCOUNTS
(in thousands)
|
Description
|
Balance at
Beginning
of Year
|
Additions
Charged to
Expenses
|
Deductions (a)
|
Balance
at End
of Year
|
|||||||||||
|
Total Allowance for Doubtful Accounts:
|
|
|
|
|
|||||||||||
|
Year ended March 31, 2017:
|
$
|
586
|
|
$
|
941
|
|
$
|
(573
|
)
|
$
|
954
|
|
|||
|
Year ended March 31, 2018:
|
$
|
954
|
|
$
|
250
|
|
$
|
(300
|
)
|
$
|
904
|
|
|||
|
Year ended March 31, 2019:
|
$
|
904
|
|
$
|
1,115
|
|
$
|
(1,155
|
)
|
$
|
864
|
|
|||
(a) The deductions related to allowance for doubtful accounts represent accounts receivable which are written off.
89
(a)(3) Exhibits.
Copies of the exhibits listed will be furnished, upon request, to holders or beneficial owners of the Company's common stock.
|
Exhibit
Number
|
Exhibit Title
|
|
|
|
|
3.1 (a)
|
|
|
3.2 (b)
|
|
|
4.1**
|
|
|
4.2 (d)
|
|
|
10.1 (e)*
|
|
|
10.2 (f)
|
|
|
10.3 (g)*
|
|
|
10.4 (h)*
|
|
|
10.5 (i)*
|
|
|
10.6 (j)*
|
|
|
10.7 (k)*
|
|
|
10.8 (l)*
|
|
|
10.9 (m)*
|
|
|
10.10 (n)*
|
|
|
10.11 (o)*
|
|
|
10.12 (p)*
|
|
|
10.13 (q)*
|
|
|
10.14 (r)*
|
|
|
10.15 (s)*
|
|
|
10.16 (t)*
|
|
|
10.17 (u)
|
|
|
10.18 (v)
|
|
|
10.19**
|
|
|
10.20 (w)*
|
|
|
10.21 (x)*
|
|
|
10.22 (y)*
|
|
|
10.23 (z)*
|
|
|
10.24 (aa)*
|
|
|
10.25 (bb)*
|
|
|
10.26 (cc)
|
|
|
21.1 (dd)
|
|
|
23.1
|
|
|
24.1
|
Power of Attorney (included on page 92)
|
|
31.1
|
|
|
31.2
|
|
90
|
32.1
|
|
|
32.2
|
|
|
101.INS**
|
XBRL Instance Document
|
|
101.SCH**
|
XBRL Taxonomy Extension Schema
|
|
101.CAL**
|
XBRL Taxonomy Extension Calculation Linkbase
|
|
101.DEF**
|
XBRL Taxonomy Extension Definition Linkbase
|
|
101.LAB**
|
XBRL Taxonomy Extension Label Linkbase
|
|
101.PRE**
|
XBRL Taxonomy Extension Presentation Linkbase
|
__________
* Indicates management contract or compensatory plan or arrangement.
**Filed herewith.
|
(a)
|
Incorporated by reference to exhibit 3.1 to the Registrant's Form 10-K filed May 28, 2013 (File No. 000-21783).
|
|
(b)
|
Incorporated by reference to exhibit 3.2 to the Registrant's Form 8-K filed July 29, 2015 (File No. 000-21783).
|
|
(c)
|
Not used.
|
|
(d)
|
Incorporated by reference to exhibit 4.1 to the Registrant's Form 8-K filed February 19, 2019 (File No. 000-21783).
|
|
(e)
|
Incorporated by reference to exhibit 10.3 to the Registrant's Form 10-Q filed July 31, 2015 (File No. 000-21783).
|
|
(f)
|
Incorporated by reference to exhibit 10.1 to the Registrant's Form 8-K filed February 19, 2019 (File No. 000-21783).
|
|
(g)
|
Incorporated by reference to exhibit 10.2 to the Registrant's Form 10-Q filed November 7, 2018 (File No. 000-21783).
|
|
(h)
|
Incorporated by reference to exhibit 10.4 to the Registrant's Form 10-K filed May 30, 2018 (File No. 000-21783).
|
|
(i)
|
Incorporated by reference to exhibit 10.4 to the Registrant's Form 10-K filed May 30, 2017 (File No. 000-21783).
|
|
(j)
|
Incorporated by reference to exhibit 10.19 to the Registrant's Form S-8 filed August 16, 2018 (File No. 000-21783).
|
|
(k)
|
Incorporated by reference to exhibit 10.20 to the Registrant's Form S-8 filed August 28, 2012 (File No. 333-191080).
|
|
(l)
|
Incorporated by reference to exhibit 10.21 to the Registrant's Form S-8 filed August 28, 2012 (File No. 333-191080).
|
|
(m)
|
Incorporated by reference to exhibit 10.7 to the Registrant's Form 10-K filed May 26, 2009 (File No. 000-21783).
|
|
(n)
|
Incorporated by reference to exhibit 10.1 to the Registrant's Form 10-Q filed February 7, 2007 (File no. 000-21783).
|
|
(o)
|
Incorporated by reference to exhibit 10.5 to the Registrant's Form S-8 filed June 1, 2018 (File No. 000-21783).
|
|
(p)
|
Incorporated by reference to exhibit 10.24 to the Registrant's Form S-8 filed November 2, 2017 (File no. 000-21783).
|
|
(q)
|
Incorporated by reference to exhibit 10.25 to the Registrant's Form S-8 filed November 2, 2017 (File no. 000-21783).
|
|
(r)
|
Incorporated by reference to exhibit 10.34 to the Registrant's Form 10-Q filed November 2, 2016 (File No. 000-21783).
|
|
(s)
|
Incorporated by reference to exhibit 10.24 to the Registrant's Form S-8 filed September 10, 2013 (File No. 000-21783).
|
|
(t)
|
Incorporated by reference to exhibit 10.25 to the Registrant's Form S-8 filed September 10, 2013 (File No. 000-21783).
|
|
(u)
|
Incorporated by reference to exhibit 10.12 to the Registrant's Form 10-K filed May 23, 2012 (File No. 000-21783).
|
|
(v)
|
Incorporated by reference to exhibit 10.29 to the Registrant's Form 10-K filed May 30, 2018 (File No. 000-21783).
|
|
(w)
|
Incorporated by reference to exhibit 10.2 to the Registrant's Form 10-Q filed November 8, 2013 (File No. 000-21783).
|
|
(x)
|
Incorporated by reference to exhibit 10.2 to the Registrant's Form 10-Q filed July 31, 2015 (File No. 000-21783).
|
|
(y)
|
Incorporated by reference to exhibit 10.6 to the Registrant's Form 10-Q filed November 8, 2013 (File No. 000-21783).
|
|
(z)
|
Incorporated by reference to exhibit 10.36 to the Registrant's Form 10-Q filed November 2, 2017 (File No. 000-21783).
|
|
(aa)
|
Incorporated by reference to exhibit 10.37 to the Registrant's Form 10-Q filed November 7, 2018 (File No. 000-21783).
|
|
(ab)
|
Incorporated by reference to exhibit 10.38 to the Registrant's Form 10-Q filed November 7, 2018 (File No. 000-21783).
|
91
|
(ac)
|
Incorporated by reference to exhibit 10.39 to the Registrant's Form 10-Q filed November 7, 2018 (File No. 000-21783).
|
|
(ad)
|
Incorporated by reference to exhibit 21.1 to the Registrant's Form 10-K filed May 30, 2017 (File No. 000-21783).
|
ITEM 16. FORM 10-K SUMMARY
None.
92
SIGNATURES
Pursuant to the requirements of Section 13 or 15(d) of the Securities Exchange Act of 1934, the Registrant, 8x8, Inc., a Delaware corporation, has duly caused this Annual Report on Form 10-K to be signed on its behalf by the undersigned, thereunto duly authorized, in the City of San Jose, State of California, on
May 21, 2019
.
|
|
8X8, INC.
|
|
|
By: /s/ VIKRAM VERMA
Vikram Verma,
Chief Executive Officer
|
POWER OF ATTORNEY
KNOW ALL PERSONS BY THESE PRESENT, that each person whose signature appears below constitutes and appoints Vikram Verma and Steven Gatoff, jointly and severally, his or her attorneys-in-fact, each with the power of substitution, for him or her in any and all capacities, to sign any amendments to this Annual Report on Form 10-K, and to file the same, with exhibits thereto and other documents in connection therewith, with the Securities and Exchange Commission, hereby ratifying and confirming all that each of said attorneys-in-fact, or his substitute or substitutes, may do or cause to be done by virtue hereof.
Pursuant to the requirements of the Securities and Exchange Act of 1934, this Annual Report on Form 10-K has been signed by the following persons in the capacities and on the date indicated:
|
Signature
|
Title
|
Date
|
|
/s/ VIKRAM VERMA
Vikram Verma
|
Chief Executive Officer and Director (Principal Executive Officer)
|
May 21, 2019
|
|
/s/ STEVEN GATOFF
Steven Gatoff
|
Chief Financial Officer
(Principal Financial and Accounting Officer)
|
May 21, 2019
|
|
/s/ BRYAN MARTIN
Bryan Martin
|
Chairman, Director and Chief Technology Officer
|
May 21, 2019
|
|
/s/ ERIC SALZMAN
Eric Salzman
|
Director
|
May 21, 2019
|
|
/s/ IAN POTTER
Ian Potter
|
Director
|
May 21, 2019
|
|
/s/ JASWINDER PAL SINGH
Jaswinder Pal Singh
|
Director
|
May 21, 2019
|
|
/s/ VLADIMIR JACIMOVIC
Vladimir Jacimovic
|
Director
|
May 21, 2019
|
|
/s/ MONIQUE BONNER
Monique Bonner
|
Director
|
May 21, 2019
|
93
TABLE OF CONTENTS
Part IItem 1. BusinessItem 1A. Risk FactorsItem 1B. Unresolved Staff CommentsItem 2. PropertiesItem 3. Legal ProceedingsItem 4. Mine Safety DisclosuresPart IIItem 5. Market For Registrant's Common Equity and Related Stockholder Matters and Issuer Purchases Of Equity SecuritiesItem 6. Selected Financial DataItem 7. Management's Discussion and Analysis Of Financial Condition and Results Of OperationsItem 7A. Quantitative and Qualitative Disclosures About Market RiskItem 8. Financial Statements and Supplementary DataItem 9. Changes in and Disagreements with Accountants on Accounting and Financial DisclosureItem 9A. Controls and ProceduresItem 9B. Other InformationPart IIIItem 10. Directors, Executive Officers and Corporate GovernanceItem 11. Executive CompensationItem 12. Security Ownership Of Certain Beneficial Owners and Management and Related Stockholder MattersItem 13. Certain Relationships and Related Transactions, and Director IndependenceItem 14. Principal Accountant Fees and ServicesPart IVItem 15. Exhibits and Financial Statement SchedulesItem 16. Form 10-k Summary