EASTGROUP PROPERTIES INC
10-Ks and 10-Qs
|
|
|
|
|
|
|
|
|
|
|
|
|
|
|
|
|
|
|
|
|
|
|
|
|
|
|
|
|
|
|
|
|
|
|
|
|
|
|
|
|
|
|
|
|
|
|
|
|
|
|
|
|
|
|
|
|
|
|
UNITED STATES
SECURITIES AND EXCHANGE COMMISSION
WASHINGTON, D.C. 20549
FORM 10-K
ANNUAL REPORT PURSUANT TO SECTION 13 OR 15(d) OF
THE SECURITIES EXCHANGE ACT OF 1934
FOR THE FISCAL YEAR ENDED
DECEMBER 31, 2016
COMMISSION FILE NUMBER 1-07094
EASTGROUP PROPERTIES, INC.
(EXACT NAME OF REGISTRANT AS SPECIFIED IN ITS CHARTER)
|
MARYLAND
|
13-2711135
|
|
(State or other jurisdiction
|
(I.R.S. Employer
|
|
of incorporation or organization)
|
Identification No.)
|
|
|
|
|
190 EAST CAPITOL STREET
|
|
|
SUITE 400
|
|
|
JACKSON, MISSISSIPPI
|
39201
|
|
(Address of principal executive offices)
|
(Zip code)
|
|
|
|
|
Registrant’s telephone number: (601) 354-3555
|
|
SECURITIES REGISTERED PURSUANT TO SECTION 12(b) OF THE ACT:
SHARES OF COMMON STOCK, $.0001 PAR VALUE,
NEW YORK STOCK EXCHANGE
SECURITIES REGISTERED PURSUANT TO SECTION 12(g) OF THE ACT: NONE
Indicate by check mark if the Registrant is a well-known seasoned issuer, as defined in Rule 405 of the Securities Act. YES (x) NO ( )
Indicate by check mark if the Registrant is not required to file reports pursuant to Section 13 or Section 15(d) of the Exchange Act. YES ( ) NO (x)
Indicate by check mark whether the Registrant (1) has filed all reports required to be filed by Section 13 or 15(d) of the Securities Exchange Act of 1934 during the preceding 12 months (or for such shorter period that the Registrant was required to file such reports), and (2) has been subject to such filing requirements for the past 90 days. YES (x) NO ( )
Indicate by check mark whether the registrant has submitted electronically and posted on its corporate Web site, if any, every Interactive Data File required to be submitted and posted pursuant to Rule 405 of Regulation S-T during the preceding 12 months (or for such shorter period that the registrant was required to submit and post such files). YES (x) NO ( )
Indicate by check mark if disclosure of delinquent filers pursuant to Item 405 of Regulation S-K is not contained herein, and will not be contained, to the best of Registrant's knowledge, in definitive proxy or information statements incorporated by reference in Part III of this Form 10-K or any amendment to this Form 10-K. (x)
Indicate by check mark whether the Registrant is a large accelerated filer, an accelerated filer, a non-accelerated filer or a smaller reporting company. See the definitions of “large accelerated filer,” “accelerated filer” and “smaller reporting company” in Rule 12b-2 of the Exchange Act. (Check one):
Large Accelerated Filer (x) Accelerated Filer ( ) Non-accelerated Filer ( ) Smaller Reporting Company ( )
Indicate by check mark whether the Registrant is a shell company (as defined in Rule 12b-2 of the Exchange Act). YES ( ) NO (x)
State the aggregate market value of the voting and non-voting common equity held by non-affiliates computed by reference to the price at which the common equity was last sold, or the average bid and asked price of such common equity, as of June 30, 2016, the last business day of the Registrant's most recently completed second fiscal quarter: $2,188,222,000.
1
The number of shares of common stock, $.0001 par value, outstanding as of
February 14, 2017
was
33,314,596
.
DOCUMENTS INCORPORATED BY REFERENCE
Portions of the Registrant’s Proxy Statement for the
2017
Annual Meeting of Stockholders are incorporated by reference into Part
III.
2
|
Page
|
||
|
PART I
|
|
|
|
PART II
|
||
|
PART III
|
||
|
PART IV
|
||
3
Organization
EastGroup Properties, Inc. (the Company or EastGroup) is an equity real estate investment trust (REIT) organized in 1969. The Company has elected to be taxed and intends to continue to qualify as a REIT under Sections 856-860 of the Internal Revenue Code (the Code), as amended.
Available Information
The Company maintains a website at eastgroup.net. The Company posts its annual reports on Form 10-K, quarterly reports on Form 10-Q, current reports on Form 8-K and amendments to those reports filed or furnished pursuant to Section 13(a) of the Securities Exchange Act of 1934, as amended, as soon as reasonably practicable after it electronically files or furnishes such materials to the Securities and Exchange Commission (SEC). In addition, the Company's website includes items related to corporate governance matters, including, among other things, the Company's corporate governance guidelines, charters of various committees of the Board of Directors, and the Company's code of business conduct and ethics applicable to all employees, officers and directors. The Company intends to disclose on its website any amendment to, or waiver of, any provision of this code of business conduct and ethics applicable to the Company's directors and executive officers that would otherwise be required to be disclosed under the rules of the SEC or the New York Stock Exchange. Copies of these reports and corporate governance documents may be obtained, free of charge, from the Company's website. Any shareholder also may obtain copies of these documents, free of charge, by sending a request in writing to: Investor Relations, EastGroup Properties, Inc., 190 East Capitol Street, Suite 400, Jackson, MS 39201-2152.
Administration
EastGroup maintains its principal executive office and headquarters in Jackson, Mississippi. The Company also has regional offices in Orlando, Houston and Phoenix and asset management offices in Charlotte and Dallas. EastGroup has property management offices in Jacksonville, Tampa, Ft. Lauderdale and San Antonio. Offices at these locations allow the Company to provide property management services to all of its Florida, Texas (except Austin and El Paso), Arizona, Mississippi and North Carolina properties, which together account for 80% of the Company’s total portfolio on a square foot basis. In addition, the Company currently provides property administration (accounting of operations) for its entire portfolio. The regional offices in Florida, Texas and Arizona provide oversight of the Company's development program. As of
February 14, 2017
, EastGroup had 68 full-time employees and 3 part-time employees.
Operations
EastGroup is focused on the development, acquisition and operation of industrial properties in major Sunbelt markets throughout the United States with an emphasis in the states of Florida, Texas, Arizona, California and North Carolina. The Company’s goal is to maximize shareholder value by being a leading provider of functional, flexible and quality business distribution space for location sensitive tenants primarily in the 5,000 to 50,000 square foot range. EastGroup’s strategy for growth is based on the ownership of premier distribution facilities generally clustered near major transportation features in supply constrained submarkets. Over 99% of the Company’s revenue consists of rental income from real estate properties.
During
2016
, EastGroup increased its holdings in real estate properties through its acquisition and development programs. The Company purchased four warehouse distribution complexes (1,354,000 square feet) and
197
acres of development land for a total of $157 million. Also during
2016
, the Company began construction of nine development projects containing 1.2 million square feet and transferred
nine
projects (
1.0 million
square feet) from its development program to real estate properties with costs of
$68.1 million
at the date of transfer.
Typically, the Company initially funds its development and acquisition programs through its $335 million unsecured bank credit facilities. As market conditions permit, EastGroup issues equity and/or employs fixed-rate debt, including variable-rate debt that has been swapped to an effectively fixed rate through the use of interest rate swaps, to replace short-term bank borrowings. In March 2016, Moody's Investors Service affirmed the Company's issuer rating of Baa2 with a stable outlook. In April 2016, Fitch Ratings affirmed EastGroup's issuer rating of BBB with a stable outlook. A security rating is not a recommendation to buy, sell, or hold securities and may be subject to revision or withdrawal at any time by the assigning rating agency. Each rating should be evaluated independently of any other rating. The Company intends to issue primarily unsecured fixed-rate debt, including variable-rate debt that has been swapped to an effectively fixed rate through the use of interest rate swaps, in the future. The Company may also access the public debt market in the future as a means to raise capital.
EastGroup holds its properties as long-term investments but may determine to sell certain properties that no longer meet its investment criteria. The Company may provide financing in connection with such sales of property if market conditions require. In
4
addition, the Company may provide financing to a partner or co-owner in connection with an acquisition of real estate in certain situations.
Subject to the requirements necessary to maintain EastGroup’s qualifications as a REIT, the Company may acquire securities of entities engaged in real estate activities or securities of other issuers, including for the purpose of exercising control over those entities.
The Company intends to continue to qualify as a REIT under the Code. To maintain its status as a REIT, the Company is required to distribute at least 90% of its ordinary taxable income to its stockholders. If the Company has a capital gain, it has the option of (i) deferring recognition of the capital gain through a tax-deferred exchange, (ii) declaring and paying a capital gain dividend on any recognized net capital gain resulting in no corporate level tax, or (iii) retaining and paying corporate income tax on its net long-term capital gain, with shareholders reporting their proportional share of the undistributed long-term capital gain and receiving a credit or refund of their share of the tax paid by the Company.
EastGroup has no present intention of acting as an underwriter of offerings of securities of other issuers. The strategies and policies set forth above were determined and are subject to review by EastGroup's Board of Directors, which may change such strategies or policies based upon its evaluation of the state of the real estate market, the performance of EastGroup's assets, capital and credit market conditions, and other relevant factors. EastGroup provides annual reports to its stockholders, which contain financial statements audited by the Company’s independent registered public accounting firm.
Environmental Matters
Under various federal, state and local laws, ordinances and regulations, an owner of real estate may be liable for the costs of removal or remediation of certain hazardous or toxic substances on or in such property. Many such laws impose liability without regard to whether the owner knows of, or was responsible for, the presence of such hazardous or toxic substances. The presence of such substances, or the failure to properly remediate such substances, may adversely affect the owner’s ability to sell or rent such property or to use such property as collateral in its borrowings. EastGroup’s properties have been subjected to Phase I Environmental Site Assessments (ESAs) by independent environmental consultants and as necessary, have been subjected to Phase II ESAs. These reports have not revealed any potential significant environmental liability. Management of EastGroup is not aware of any environmental liability that would have a material adverse effect on EastGroup’s business, assets, financial position or results of operations.
In addition to the other information contained or incorporated by reference in this document, readers should carefully consider the following risk factors. Any of these risks or the occurrence of any one or more of the uncertainties described below could have a material adverse effect on the Company's financial condition and the performance of its business. The Company refers to itself as "we", "us" or "our" in the following risk factors.
Real Estate Industry Risks
We face risks associated with local real estate conditions in areas where we own properties.
We may be adversely affected by general economic conditions and local real estate conditions. For example, an oversupply of industrial properties in a local area or a decline in the attractiveness of our properties to tenants would have a negative effect on us. Other factors that may affect general economic conditions or local real estate conditions include:
|
•
|
population and demographic trends;
|
|
•
|
employment and personal income trends;
|
|
•
|
income and other tax laws;
|
|
•
|
changes in interest rates and availability and costs of financing;
|
|
•
|
increased operating costs, including insurance premiums, utilities and real estate taxes, due to inflation and other factors which may not necessarily be offset by increased rents;
|
|
•
|
changes in the price of oil; and
|
|
•
|
construction costs.
|
We may be unable to compete for properties and tenants
. The real estate business is highly competitive. We compete for interests in properties with other real estate investors and purchasers, some of whom have greater financial resources, revenues and geographical diversity than we have. Furthermore, we compete for tenants with other property owners. All of our industrial properties are subject to significant local competition. We also compete with a wide variety of institutions and other investors for capital funds necessary to support our investment activities and asset growth.
5
We are subject to significant regulation that constrains our activities.
Local zoning and land use laws, environmental statutes and other governmental requirements restrict our expansion, rehabilitation and reconstruction activities. These regulations may prevent us from taking advantage of economic opportunities. Legislation such as the Americans with Disabilities Act may require us to modify our properties, and noncompliance could result in the imposition of fines or an award of damages to private litigants. Future legislation may impose additional requirements. We cannot predict what requirements may be enacted or what changes may be implemented to existing legislation.
Risks Associated with Our Properties
We may be unable to lease space.
When a lease expires, a tenant may elect not to renew it. We may not be able to re-lease the property on similar terms, if we are able to re-lease the property at all. The terms of renewal or re-lease (including the cost of required renovations and/or concessions to tenants) may be less favorable to us than the prior lease. We also routinely develop properties with no pre-leasing. If we are unable to lease all or a substantial portion of our properties, or if the rental rates upon such leasing are significantly lower than expected rates, our cash generated before debt repayments and capital expenditures and our ability to make expected distributions to stockholders may be adversely affected.
We have been and may continue to be affected negatively by tenant bankruptcies and leasing delays.
At any time, a tenant may experience a downturn in its business that may weaken its financial condition. Similarly, a general decline in the economy may result in a decline in the demand for space at our industrial properties. As a result, our tenants may delay lease commencement, fail to make rental payments when due, or declare bankruptcy. Any such event could result in the termination of that tenant’s lease and losses to us, and distributions to investors may decrease. We receive a substantial portion of our income as rents under mid-term and long-term leases. If tenants are unable to comply with the terms of their leases because of rising costs or falling sales, we may deem it advisable to modify lease terms to allow tenants to pay a lower rent or a smaller share of taxes, insurance and other operating costs. If a tenant becomes insolvent or bankrupt, we cannot be sure that we could recover the premises from the tenant promptly or from a trustee or debtor-in-possession in any bankruptcy proceeding relating to the tenant. We also cannot be sure that we would receive rent in the proceeding sufficient to cover our expenses with respect to the premises. If a tenant becomes bankrupt, the federal bankruptcy code will apply and, in some instances, may restrict the amount and recoverability of our claims against the tenant. A tenant’s default on its obligations to us could adversely affect our financial condition and the cash we have available for distribution.
We face risks associated with our property development.
We intend to continue to develop properties where market conditions warrant such investment. Once made, our investments may not produce results in accordance with our expectations. Risks associated with our current and future development and construction activities include:
|
•
|
the availability of favorable financing alternatives;
|
|
•
|
the risk that we may not be able to obtain land on which to develop or that due to the increased cost of land, our activities may not be as profitable;
|
|
•
|
construction costs exceeding original estimates due to rising interest rates and increases in the costs of materials and labor;
|
|
•
|
construction and lease-up delays resulting in increased debt service, fixed expenses and construction costs;
|
|
•
|
expenditure of funds and devotion of management's time to projects that we do not complete;
|
|
•
|
fluctuations of occupancy and rental rates at newly completed properties, which depend on a number of factors, including market and economic conditions, resulting in lower than projected rental rates and a corresponding lower return on our investment; and
|
|
•
|
complications (including building moratoriums and anti-growth legislation) in obtaining necessary zoning, occupancy and other governmental permits.
|
We face risks associated with property acquisitions
. We acquire individual properties and portfolios of properties and intend to continue to do so. Our acquisition activities and their success are subject to the following risks:
|
•
|
when we are able to locate a desired property, competition from other real estate investors may significantly increase the purchase price;
|
|
•
|
acquired properties may fail to perform as expected;
|
|
•
|
the actual costs of repositioning or redeveloping acquired properties may be higher than our estimates;
|
|
•
|
acquired properties may be located in new markets where we face risks associated with an incomplete knowledge or understanding of the local market, a limited number of established business relationships in the area and a relative unfamiliarity with local governmental and permitting procedures;
|
|
•
|
we may be unable to quickly and efficiently integrate new acquisitions, particularly acquisitions of portfolios of properties, into our existing operations, and as a result, our results of operations and financial condition could be adversely affected; and
|
6
|
•
|
we may acquire properties subject to liabilities and without any recourse, or with only limited recourse, to the transferor with respect to unknown liabilities. As a result, if a claim were asserted against us based upon ownership of those properties, we might have to pay substantial sums to settle it, which could adversely affect our cash flow.
|
Coverage under our existing insurance policies may be inadequate to cover losses
. We generally maintain insurance policies related to our business, including casualty, general liability and other policies, covering our business operations, employees and assets as appropriate for the markets where our properties and business operations are located. However, we would be required to bear all losses that are not adequately covered by insurance. In addition, there may be certain losses that are not generally insured against or that are not generally fully insured against because it is not deemed economically feasible or prudent to do so, including losses due to floods, wind, earthquakes, acts of war, acts of terrorism or riots. If an uninsured loss or a loss in excess of insured limits occurs with respect to one or more of our properties, then we could lose the capital we invested in the properties, as well as the anticipated future revenue from the properties. In addition, if the damaged properties are subject to recourse indebtedness, we would continue to be liable for the indebtedness, even if these properties were irreparably damaged.
We face risks due to lack of geographic and real estate sector diversity.
Substantially all of our properties are located in the Sunbelt region of the United States with an emphasis in the states of Florida, Texas, Arizona, California and North Carolina. As of
December 31, 2016
, we owned operating properties totaling 5.9 million square feet in Houston, which represents 17.0% of the Company's total
Real estate properties
on a square foot basis. A downturn in general economic conditions and local real estate conditions in these geographic regions, as a result of oversupply of or reduced demand for industrial properties, local business climate, business layoffs and changing demographics, would have a particularly strong adverse effect on us. Our investments in real estate assets are concentrated in the industrial distribution sector. This concentration may expose us to the risk of economic downturns in this sector to a greater extent than if our business activities included other sectors of the real estate industry.
We face risks due to the illiquidity of real estate which may limit our ability to vary our portfolio.
Real estate investments are relatively illiquid. Our ability to vary our portfolio in response to changes in economic and other conditions will therefore be limited. In addition, because of our status as a REIT, the Internal Revenue Code limits our ability to sell our properties. If we must sell an investment, we cannot ensure that we will be able to dispose of the investment on terms favorable to the Company.
We are subject to environmental laws and regulations.
Current and previous real estate owners and operators may be required under various federal, state and local laws, ordinances and regulations to investigate and clean up hazardous substances released at the properties they own or operate. They may also be liable to the government or to third parties for substantial property or natural resource damage, investigation costs and cleanup costs. Such laws often impose liability without regard to whether the owner or operator knew of, or was responsible for, the release or presence of such hazardous substances. In addition, some environmental laws create a lien on the contaminated site in favor of the government for damages and costs the government incurs in connection with the contamination. Contamination may adversely affect the owner’s ability to use, sell or lease real estate or to borrow using the real estate as collateral. We have no way of determining at this time the magnitude of any potential liability to which we may be subject arising out of environmental conditions or violations with respect to the properties we currently or formerly owned. Environmental laws today can impose liability on a previous owner or operator of a property that owned or operated the property at a time when hazardous or toxic substances were disposed of, released from, or present at the property. A conveyance of the property, therefore, may not relieve the owner or operator from liability. Although ESAs have been conducted at our properties to identify potential sources of contamination at the properties, such ESAs do not reveal all environmental liabilities or compliance concerns that could arise from the properties. Moreover, material environmental liabilities or compliance concerns may exist, of which we are currently unaware, that in the future may have a material adverse effect on our business, assets or results of operations.
Compliance with new laws or regulations related to climate change, including compliance with “green” building codes, may require us to make improvements to our existing properties.
Proposed legislation could also increase the costs of energy and utilities. The cost of the proposed legislation may adversely affect our financial position, results of operations and cash flows. We may be adversely affected by floods, hurricanes and other climate related events.
Financing Risks
We face risks associated with the use of debt to fund acquisitions and developments, including refinancing risk.
We are subject to the risks normally associated with debt financing, including the risk that our cash flow will be insufficient to meet required payments of principal and interest. In addition, certain of our debt will have significant outstanding principal balances on their maturity dates, commonly known as “balloon payments.” Therefore, we will likely need to refinance at least a portion of our outstanding debt as it matures. There is a risk that we may not be able to refinance existing debt or that the terms of any refinancing will not be as favorable as the terms of the existing debt.
7
We face risks associated with our dependence on external sources of capital.
In order to qualify as a REIT, we are required each year to distribute to our stockholders at least 90% of our ordinary taxable income, and we are subject to tax on our income to the extent it is not distributed. Because of this distribution requirement, we may not be able to fund all future capital needs from cash retained from operations. As a result, to fund capital needs, we rely on third-party sources of capital, which we may not be able to obtain on favorable terms, if at all. Our access to third-party sources of capital depends upon a number of factors, including (i) general market conditions; (ii) the market’s perception of our growth potential; (iii) our current and potential future earnings and cash distributions; and (iv) the market price of our capital stock. Additional debt financing may substantially increase our debt-to-total market capitalization ratio. Additional equity financing may dilute the holdings of our current stockholders.
Covenants in our credit agreements could limit our flexibility and adversely affect our financial condition
. The terms of our various credit agreements and other indebtedness require us to comply with a number of customary financial and other covenants, such as maintaining debt service coverage and leverage ratios and maintaining insurance coverage. These covenants may limit our flexibility in our operations, and breaches of these covenants could result in defaults under the instruments governing the applicable indebtedness even if we had satisfied our payment obligations. If we are unable to refinance our indebtedness at maturity or meet our payment obligations, the amount of our distributable cash flow and our financial condition would be adversely affected.
Adverse changes in our credit ratings could impair our ability to obtain additional debt and equity financing on favorable terms, if at all.
Our credit ratings are based on our operating performance, liquidity and leverage ratios, overall financial position and other factors employed by the credit rating agencies in their rating analysis of us. Our credit ratings can affect the amount and type of capital we can access, as well as the terms of any financings we may obtain. There can be no assurance that we will be able to maintain our current credit ratings. In the event our current credit ratings deteriorate, it may be more difficult or expensive to obtain additional financing or refinance existing obligations and commitments. Also, a downgrade in our credit ratings would trigger additional costs or other potentially negative consequences under our current and future credit facilities and debt instruments.
Increases in interest rates would increase our interest expense.
At
December 31, 2016
, we had $112.0 million of variable-rate debt outstanding not protected by interest rate hedge contracts. We may incur additional variable-rate debt in the future. If interest rates increase, then so would the interest expense on our unhedged variable-rate debt, which would adversely affect our financial condition and results of operations. From time to time, we manage our exposure to interest rate risk with interest rate hedge contracts that effectively fix or cap a portion of our variable-rate debt. In addition, we refinance fixed-rate debt at times when we believe rates and terms are appropriate. Our efforts to manage these exposures may not be successful. Our use of interest rate hedge contracts to manage risk associated with interest rate volatility may expose us to additional risks, including a risk that a counterparty to a hedge contract may fail to honor its obligations. Developing an effective interest rate risk strategy is complex and no strategy can completely insulate us from risks associated with interest rate fluctuations. There can be no assurance that our hedging activities will have the desired beneficial impact on our results of operations or financial condition. Termination of interest rate hedge contracts typically involves costs, such as transaction fees or breakage costs.
A lack of any limitation on our debt could result in our becoming more highly leveraged
. Our governing documents do not limit the amount of indebtedness we may incur. Accordingly, we may incur additional debt and would do so, for example, if it were necessary to maintain our status as a REIT. We might become more highly leveraged as a result, and our financial condition and cash available for distribution to stockholders might be negatively affected and the risk of default on our indebtedness could increase.
Other Risks
The market value of our common stock could decrease based on our performance and market perception and conditions.
The market value of our common stock may be affected by the market’s perception of our operating results, growth potential, and current and future cash dividends and may also be affected by the real estate market value of our underlying assets. The market price of our common stock may be influenced by the dividend on our common stock relative to market interest rates. Rising interest rates may lead potential buyers of our common stock to expect a higher dividend rate, which would adversely affect the market price of our common stock. In addition, rising interest rates would result in increased expense, thereby adversely affecting cash flow and our ability to service our indebtedness and pay dividends.
The state of the economy or other adverse changes in general or local economic conditions may adversely affect our operating results and financial condition.
Turmoil in the global financial markets may have an adverse impact on the availability of credit to businesses generally and could lead to a further weakening of the U.S. and global economies. Currently these conditions have not impaired our ability to access credit markets and finance our operations. However, our ability to access the capital markets may be restricted at a time when we would like, or need, to raise financing, which could have an impact on our flexibility to react to changing economic and business conditions. Furthermore, deteriorating economic conditions including business layoffs, downsizing, industry slowdowns and other similar factors that affect our customers could continue to negatively impact commercial real estate fundamentals and result in lower occupancy, lower rental rates and declining values in our real estate portfolio and in
8
the collateral securing any loan investments we may make. Additionally, an adverse economic situation could have an impact on our lenders or customers, causing them to fail to meet their obligations to us. No assurances can be given that the effects of an adverse economic situation will not have a material adverse effect on our business, financial condition and results of operations.
We may fail to qualify as a REIT.
If we fail to qualify as a REIT, we will not be allowed to deduct distributions to stockholders in computing our taxable income and will be subject to federal income tax, including any applicable alternative minimum tax, at regular corporate rates. In addition, we may be barred from qualification as a REIT for the four years following disqualification. The additional tax incurred at regular corporate rates would significantly reduce the cash flow available for distribution to stockholders and for debt service. Furthermore, we would no longer be required by the Internal Revenue Code to make any distributions to our stockholders as a condition of REIT qualification. Any distributions to stockholders would be taxable as ordinary income to the extent of our current and accumulated earnings and profits. Corporate distributees, however, may be eligible for the dividends received deduction on the distributions, subject to limitations under the Internal Revenue Code. To qualify as a REIT, we must comply with certain highly technical and complex requirements. We cannot be certain we have complied with these requirements because there are few judicial and administrative interpretations of these provisions. In addition, facts and circumstances that may be beyond our control may affect our ability to qualify as a REIT. We cannot assure you that new legislation, regulations, administrative interpretations or court decisions will not change the tax laws significantly with respect to our qualification as a REIT or with respect to the federal income tax consequences of qualification. We cannot assure you that we will remain qualified as a REIT.
There is a risk of changes in the tax law applicable to real estate investment trusts
. Since the Internal Revenue Service, the United States Treasury Department and Congress frequently review federal income tax legislation, we cannot predict whether, when or to what extent new federal tax laws, regulations, interpretations or rulings will be adopted. Any such legislative action may prospectively or retroactively modify our tax treatment and, therefore, may adversely affect taxation of us and/or our investors.
We face possible adverse changes in tax laws.
From time to time, changes in state and local tax laws or regulations are enacted which may result in an increase in our tax liability. A shortfall in tax revenues for states and municipalities in which we operate may lead to an increase in the frequency and size of such changes. If such changes occur, we may be required to pay additional taxes on our assets or income. These increased tax costs could adversely affect our financial condition, results of operations and the amount of cash available for the payment of dividends.
To maintain our status as a REIT, we limit the amount of shares any one stockholder can own
. The Internal Revenue Code imposes certain limitations on the ownership of the stock of a REIT. For example, not more than 50% in value of our outstanding shares of capital stock may be owned, directly or indirectly, by five or fewer individuals (as defined in the Code) during the last half of any taxable year. To protect our REIT status, our charter prohibits any holder from acquiring more than 9.8% (in value or in number, whichever is more restrictive) of our outstanding equity stock (defined as all of our classes of capital stock, except our excess stock (of which there is none outstanding)) unless our Board of Directors grants a waiver. The ownership limit may limit the opportunity for stockholders to receive a premium for their shares of common stock that might otherwise exist if an investor were attempting to assemble a block of shares in excess of 9.8% of the outstanding shares of equity stock or otherwise effect a change in control.
Certain tax and anti-takeover provisions of our charter and bylaws may inhibit a change of our control
. Certain provisions contained in our charter and bylaws and the Maryland General Corporation Law may discourage a third party from making a tender offer or acquisition proposal to us. If this were to happen, it could delay, deter or prevent a change in control or the removal of existing management. These provisions also may delay or prevent the shareholders from receiving a premium for their common shares over then-prevailing market prices. These provisions include:
|
•
|
the REIT ownership limit described above;
|
|
•
|
special meetings of our stockholders may be called only by the chairman of the board, the chief executive officer, the president, a majority of the board or by stockholders possessing a majority of all the votes entitled to be cast at the meeting;
|
|
•
|
our Board of Directors may authorize and issue securities without stockholder approval; and
|
|
•
|
advance-notice requirements for proposals to be presented at stockholder meetings.
|
In addition, Maryland law provides protection for Maryland corporations against unsolicited takeovers by limiting, among other things, the duties of the directors in unsolicited takeover situations. The duties of directors of Maryland corporations do not require them to (a) accept, recommend or respond to any proposal by a person seeking to acquire control of the corporation, (b) authorize the corporation to redeem any rights under, or modify or render inapplicable, any stockholders rights plan, (c) make a determination under the Maryland Business Combination Act or the Maryland Control Share Acquisition Act, or (d) act or fail to act solely because of the effect of the act or failure to act may have on an acquisition or potential acquisition of control of the corporation
9
or the amount or type of consideration that may be offered or paid to the stockholders in an acquisition. Moreover, under Maryland law the act of a director of a Maryland corporation relating to or affecting an acquisition or potential acquisition of control is not subject to any higher duty or greater scrutiny than is applied to any other act of a director. Maryland law also contains a statutory presumption that an act of a director of a Maryland corporation satisfies the applicable standards of conduct for directors under Maryland law.
The Maryland Business Combination Act provides that unless exempted, a Maryland corporation may not engage in business combinations, including mergers, dispositions of 10 percent or more of its assets, certain issuances of shares of stock and other specified transactions, with an "interested stockholder" or an affiliate of an interested stockholder for five years after the most recent date on which the interested stockholder became an interested stockholder, and thereafter unless specified criteria are met. An interested stockholder is generally a person owning or controlling, directly or indirectly, 10 percent or more of the voting power of the outstanding stock of the Maryland corporation.
The Maryland Control Share Acquisition Act provides that "control shares" of a corporation acquired in a "control share acquisition" shall have no voting rights except to the extent approved by a vote of two-thirds of the votes eligible to cast on the matter. "Control Shares" means shares of stock that, if aggregated with all other shares of stock previously acquired by the acquirer, would entitle the acquirer to exercise voting power in electing directors within one of the following ranges of the voting power: one-tenth or more but less than one-third, one-third or more but less than a majority, or a majority or more of all voting power. A "control share acquisition" means the acquisition of control shares, subject to certain exceptions.
If voting rights of control shares acquired in a control share acquisition are not approved at a stockholders' meeting, then subject to certain conditions and limitations, the issuer may redeem any or all of the control shares for fair value. If voting rights of such control shares are approved at a stockholders' meeting and the acquirer becomes entitled to vote a majority of the shares of stock entitled to vote, all other stockholders may exercise appraisal rights.
The Company faces risks in attracting and retaining key personnel.
Many of our senior executives have strong industry reputations, which aid us in identifying acquisition and development opportunities and negotiating with tenants and sellers of properties. The loss of the services of these key personnel could affect our operations because of diminished relationships with existing and prospective tenants, property sellers and industry personnel. In addition, attracting new or replacement personnel may be difficult in a competitive market.
We have severance and change in control agreements with certain of our officers that may deter changes in control of the Company.
If, within a certain time period (as set in the officer’s agreement) following a change in control, we terminate the officer's employment other than for cause, or if the officer elects to terminate his or her employment with us for reasons specified in the agreement, we will make a severance payment equal to the officer's average annual compensation times an amount specified in the officer's agreement, together with the officer's base salary and vacation pay that have accrued but are unpaid through the date of termination. These agreements may deter a change in control because of the increased cost for a third party to acquire control of us.
We rely on information technology in our operations, and any material failure, inadequacy, interruption or security failure of that technology could harm our business.
We rely on information technology networks and systems, including the internet, to process, transmit and store electronic information, and to manage or support a variety of business processes, including financial transactions and records, and maintaining personal identifying information and customer and lease data. We purchase some of our information technology from vendors, on whom our systems depend. We rely on commercially available systems, software, tools and monitoring to provide security for the processing, transmission and storage of confidential customer data, including individually identifiable information relating to financial accounts. Although we have taken steps to protect the security of our information systems and the data maintained in those systems, it is possible that our safety and security measures will not prevent the systems' improper functioning or damage, or the improper access or disclosure of personally identifiable information such as in the event of cyber-attacks. Security breaches, including physical or electronic break-ins, computer viruses, attacks by hackers and similar breaches, can create system disruptions, shutdowns or unauthorized disclosure of confidential information. In some cases, it may be difficult to anticipate or immediately detect such incidents and the damage they cause. Any failure to maintain proper function, security and availability of our information systems could interrupt our operations, damage our reputation, subject us to liability claims or regulatory penalties and could have a materially adverse effect on our business, financial condition and results of operations.
We may be impacted by changes in U.S. social, political, regulatory and economic conditions or laws and policies.
Any changes to U.S. tax laws, foreign trade, manufacturing, and development and investment in the territories and countries where our customers operate could adversely affect our operating results and our business.
10
None.
EastGroup owned 327 industrial properties and one office building at
December 31, 2016
. These properties are located primarily in the Sunbelt states of Florida, Texas, Arizona, California and North Carolina, and the majority are clustered around major transportation features in supply constrained submarkets. As of
February 14, 2017
, EastGroup’s portfolio was 95.8% leased and 95.2% occupied. The Company has developed approximately 44% of its total portfolio (on a square foot basis), including real estate properties and development properties in lease-up and under construction. The Company’s focus is the ownership of business distribution space (87% of the total portfolio) with the remainder in bulk distribution space (9%) and business service space (4%). Business distribution space properties are typically multi-tenant buildings with a building depth of 200 feet or less, clear height of 24-30 feet, office finish of 10-25% and truck courts with a depth of 100-120 feet. See Consolidated Financial Statement Schedule III – Real Estate Properties and Accumulated Depreciation for a detailed listing of the Company’s properties.
At
December 31, 2016
, EastGroup did not own any single property with a book value that was 10% or more of total book value or with gross revenues that were 10% or more of total gross revenues.
The Company's lease expirations, excluding month-to-month leases of 243,000 square feet, for the next ten years are detailed below:
|
Years Ending December 31,
|
Number of Leases Expiring
|
Total Area of Leases Expiring
(in Square Feet)
|
Annualized Current Base Rent of Leases Expiring
(1)
|
% of Total Base Rent of Leases Expiring
|
|||||||
|
2017
|
249
|
4,739,000
|
|
$
|
28,604,000
|
|
14.9%
|
||||
|
2018
|
310
|
5,042,000
|
|
$
|
29,518,000
|
|
15.3%
|
||||
|
2019
|
267
|
5,524,000
|
|
$
|
31,307,000
|
|
16.3%
|
||||
|
2020
|
216
|
4,963,000
|
|
$
|
28,763,000
|
|
14.9%
|
||||
|
2021
|
180
|
5,633,000
|
|
$
|
30,630,000
|
|
15.9%
|
||||
|
2022
|
76
|
2,872,000
|
|
$
|
16,078,000
|
|
8.4%
|
||||
|
2023
|
44
|
1,790,000
|
|
$
|
9,645,000
|
|
5.0%
|
||||
|
2024
|
28
|
1,542,000
|
|
$
|
6,485,000
|
|
3.4%
|
||||
|
2025
|
10
|
772,000
|
|
$
|
4,597,000
|
|
2.4%
|
||||
|
2026 and beyond
|
25
|
895,000
|
|
$
|
5,357,000
|
|
2.8%
|
||||
|
(1)
|
Represents the monthly cash rental rates, excluding tenant expense reimbursements, as of
December 31, 2016
, multiplied by 12 months.
|
The Company is not presently involved in any material litigation nor, to its knowledge, is any material litigation threatened against the Company or its properties, other than routine litigation arising in the ordinary course of business or which is expected to be covered by the Company’s liability insurance.
Not applicable.
11
The Company’s shares of common stock are listed for trading on the New York Stock Exchange under the symbol “EGP.” The following table shows the high and low share prices for each quarter reported by the New York Stock Exchange during the past two years and the per share distributions paid for each quarter.
Shares of Common Stock Market Prices and Dividends
|
Quarter
|
Calendar Year 2016
|
Calendar Year 2015
|
||||||||||||||||||||
|
High
|
Low
|
Distributions
|
High
|
Low
|
Distributions
|
|||||||||||||||||
|
First
|
$
|
60.46
|
|
49.31
|
|
$
|
0.60
|
|
$
|
67.42
|
|
57.98
|
|
$
|
0.57
|
|
||||||
|
Second
|
69.35
|
|
58.28
|
|
0.60
|
|
62.11
|
|
55.00
|
|
0.57
|
|
||||||||||
|
Third
|
76.00
|
|
68.40
|
|
0.62
|
|
60.85
|
|
51.76
|
|
0.60
|
|
||||||||||
|
Fourth
|
74.71
|
|
63.99
|
|
0.62
|
|
59.51
|
|
53.15
|
|
0.60
|
|
||||||||||
|
|
|
|
|
|
$
|
2.44
|
|
|
|
|
|
$
|
2.34
|
|
||||||||
As of
February 14, 2017
, there were
495
holders of record of the Company’s
33,314,596
outstanding shares of common stock. The Company distributed all of its
2016
and
2015
taxable income to its stockholders. Accordingly, no significant provisions for income taxes were necessary. The following table summarizes the federal income tax treatment for all distributions by the Company for the years
2016
and
2015
.
Federal Income Tax Treatment of Share Distributions
|
|
Years Ended December 31,
|
|||||
|
2016
|
2015
|
|||||
|
Common Share Distributions:
|
|
|
||||
|
Ordinary dividends
|
$
|
2.10494
|
|
2.24258
|
|
|
|
Nondividend distributions
|
0.05202
|
|
0.02774
|
|
||
|
Unrecaptured Section 1250 capital gain
|
0.12872
|
|
0.06968
|
|
||
|
Other capital gain
|
0.15432
|
|
—
|
|
||
|
Total Common Distributions
|
$
|
2.44000
|
|
2.34000
|
|
|
Securities Authorized For Issuance Under Equity Compensation Plans
See Item 12 of this Annual Report on Form 10-K, “Security Ownership of Certain Beneficial Owners and Management and Related Stockholder Matters,” for certain information regarding the Company’s equity compensation plans.
Purchases of Equity Securities by the Issuer and Affiliated Purchasers
No shares of common stock were purchased by the Company or withheld by the Company to satisfy any tax withholding obligations during the three-month period ended December 31, 2016.
12
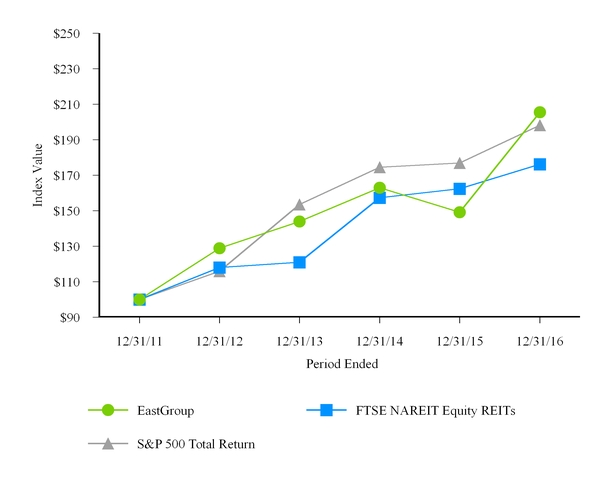
Performance Graph
The following graph compares, over the five years ended
December 31, 2016
, the cumulative total shareholder return on EastGroup’s common stock with the cumulative total return of the Standard & Poor’s 500 Total Return Index (S&P 500 Total Return) and the FTSE Equity REIT index prepared by the National Association of Real Estate Investment Trusts (FTSE NAREIT Equity REITs).
The performance graph and related information shall not be deemed “soliciting material” or be deemed to be “filed” with the SEC, nor shall such information be incorporated by reference into any future filing, except to the extent that the Company specifically incorporates it by reference into such filing.
|
|
Fiscal years ended December 31,
|
|||||||||||||||||
|
2011
|
2012
|
2013
|
2014
|
2015
|
2016
|
|||||||||||||
|
EastGroup
|
$
|
100.00
|
|
128.89
|
|
144.01
|
|
163.04
|
|
149.21
|
|
205.58
|
|
|||||
|
FTSE NAREIT Equity REITs
|
100.00
|
|
118.06
|
|
120.97
|
|
157.43
|
|
162.46
|
|
176.30
|
|
||||||
|
S&P 500 Total Return
|
100.00
|
|
116.00
|
|
153.57
|
|
174.60
|
|
177.01
|
|
198.18
|
|
||||||
The information above assumes that the value of the investment in shares of EastGroup’s common stock and each index was $100 on December 31, 2011, and that all dividends were reinvested.
The following table sets forth selected consolidated financial data for the Company derived from the audited consolidated financial statements and should be read in conjunction with the consolidated financial statements and notes thereto included elsewhere in this report.
|
|
Years Ended December 31,
|
||||||||||||||
|
2016
|
2015
|
2014
|
2013
|
2012
|
|||||||||||
|
OPERATING DATA
|
(In thousands, except per share data)
|
||||||||||||||
|
REVENUES
|
|
|
|
|
|
||||||||||
|
Income from real estate operations
|
$
|
252,961
|
|
234,918
|
|
219,706
|
|
201,849
|
|
185,783
|
|
||||
|
Other income
|
86
|
|
90
|
|
123
|
|
322
|
|
61
|
|
|||||
|
|
253,047
|
|
235,008
|
|
219,829
|
|
202,171
|
|
185,844
|
|
|||||
|
Expenses
|
|
|
|
|
|
|
|
|
|
|
|||||
|
Expenses from real estate operations
|
74,347
|
|
67,402
|
|
62,797
|
|
57,885
|
|
52,891
|
|
|||||
|
Depreciation and amortization
|
77,935
|
|
73,290
|
|
70,314
|
|
65,789
|
|
61,345
|
|
|||||
|
General and administrative
|
13,232
|
|
15,091
|
|
12,726
|
|
11,725
|
|
10,488
|
|
|||||
|
Acquisition costs
|
161
|
|
164
|
|
210
|
|
191
|
|
188
|
|
|||||
|
|
165,675
|
|
155,947
|
|
146,047
|
|
135,590
|
|
124,912
|
|
|||||
|
Operating income
|
87,372
|
|
79,061
|
|
73,782
|
|
66,581
|
|
60,932
|
|
|||||
|
Other income (expense)
|
|
|
|
|
|
|
|
|
|
|
|||||
|
Interest expense
|
(35,213
|
)
|
(34,666
|
)
|
(35,486
|
)
|
(35,192
|
)
|
(35,371
|
)
|
|||||
|
Gain, net of loss, on sales of real estate investments
|
42,170
|
|
2,903
|
|
9,188
|
|
—
|
|
—
|
|
|||||
|
Other
|
1,765
|
|
1,101
|
|
989
|
|
949
|
|
456
|
|
|||||
|
Income from continuing operations
|
96,094
|
|
48,399
|
|
48,473
|
|
32,338
|
|
26,017
|
|
|||||
|
Discontinued operations
|
|
|
|
|
|
|
|
|
|
|
|||||
|
Income from real estate operations
|
—
|
|
—
|
|
—
|
|
89
|
|
360
|
|
|||||
|
Gain on sales of nondepreciable real estate investments
|
—
|
|
—
|
|
—
|
|
—
|
|
167
|
|
|||||
|
Gain on sales of real estate investments
|
—
|
|
—
|
|
—
|
|
798
|
|
6,343
|
|
|||||
|
Income from discontinued operations
|
—
|
|
—
|
|
—
|
|
887
|
|
6,870
|
|
|||||
|
Net income
|
96,094
|
|
48,399
|
|
48,473
|
|
33,225
|
|
32,887
|
|
|||||
|
Net income attributable to noncontrolling interest in joint ventures
|
(585
|
)
|
(533
|
)
|
(532
|
)
|
(610
|
)
|
(503
|
)
|
|||||
|
Net income attributable to EastGroup Properties, Inc. common stockholders
|
95,509
|
|
47,866
|
|
47,941
|
|
32,615
|
|
32,384
|
|
|||||
|
Other comprehensive income (loss) - Cash flow hedges
|
5,451
|
|
(1,099
|
)
|
(3,986
|
)
|
2,021
|
|
(392
|
)
|
|||||
|
TOTAL COMPREHENSIVE INCOME
|
$
|
100,960
|
|
46,767
|
|
43,955
|
|
34,636
|
|
31,992
|
|
||||
|
BASIC PER COMMON SHARE DATA FOR NET INCOME ATTRIBUTABLE TO EASTGROUP PROPERTIES, INC. COMMON STOCKHOLDERS
|
|
|
|
|
|
|
|
|
|
|
|||||
|
Income from continuing operations
|
$
|
2.93
|
|
1.49
|
|
1.53
|
|
1.05
|
|
0.89
|
|
||||
|
Income from discontinued operations
|
—
|
|
—
|
|
—
|
|
0.03
|
|
0.24
|
|
|||||
|
Net income attributable to common stockholders
|
$
|
2.93
|
|
1.49
|
|
1.53
|
|
1.08
|
|
1.13
|
|
||||
|
Weighted average shares outstanding
|
32,563
|
|
32,091
|
|
31,341
|
|
30,162
|
|
28,577
|
|
|||||
|
DILUTED PER COMMON SHARE DATA FOR NET INCOMEATTRIBUTABLE TO EASTGROUP PROPERTIES, INC. COMMON STOCKHOLDERS
|
|
|
|
|
|
|
|
|
|
|
|||||
|
Income from continuing operations
|
$
|
2.93
|
|
1.49
|
|
1.52
|
|
1.05
|
|
0.89
|
|
||||
|
Income from discontinued operations
|
—
|
|
—
|
|
—
|
|
0.03
|
|
0.24
|
|
|||||
|
Net income attributable to common stockholders
|
$
|
2.93
|
|
1.49
|
|
1.52
|
|
1.08
|
|
1.13
|
|
||||
|
Weighted average shares outstanding
|
32,628
|
|
32,196
|
|
31,452
|
|
30,269
|
|
28,677
|
|
|||||
|
AMOUNTS ATTRIBUTABLE TO EASTGROUP
PROPERTIES, INC. COMMON STOCKHOLDERS
|
|
|
|
|
|
|
|
|
|
|
|||||
|
Income from continuing operations
|
$
|
95,509
|
|
47,866
|
|
47,941
|
|
31,728
|
|
25,514
|
|
||||
|
Income from discontinued operations
|
—
|
|
—
|
|
—
|
|
887
|
|
6,870
|
|
|||||
|
Net income attributable to common stockholders
|
$
|
95,509
|
|
47,866
|
|
47,941
|
|
32,615
|
|
32,384
|
|
||||
|
OTHER PER SHARE DATA
|
|
|
|
|
|
|
|
|
|
|
|||||
|
Book value, at end of year
|
$
|
19.13
|
|
17.11
|
|
17.72
|
|
16.61
|
|
16.25
|
|
||||
|
Common distributions declared
|
2.44
|
|
2.34
|
|
2.22
|
|
2.14
|
|
2.10
|
|
|||||
|
Common distributions paid
|
2.44
|
|
2.34
|
|
2.22
|
|
2.14
|
|
2.10
|
|
|||||
|
BALANCE SHEET DATA (AT END OF YEAR)
|
|
|
|
|
|
|
|
|
|
|
|||||
|
Real estate investments, at cost
(1)
|
$
|
2,419,414
|
|
2,232,327
|
|
2,087,821
|
|
1,938,960
|
|
1,780,098
|
|
||||
|
Real estate investments, net of accumulated depreciation
(1)
|
1,725,164
|
|
1,574,873
|
|
1,487,295
|
|
1,388,847
|
|
1,283,851
|
|
|||||
|
Total assets
|
1,825,764
|
|
1,661,904
|
|
1,572,112
|
|
1,468,963
|
|
1,350,586
|
|
|||||
|
Unsecured bank credit facilities, unsecured debt and secured debt
|
1,101,333
|
|
1,027,909
|
|
929,465
|
|
889,296
|
|
810,411
|
|
|||||
|
Total liabilities
|
1,183,898
|
|
1,102,703
|
|
996,497
|
|
950,258
|
|
859,410
|
|
|||||
|
Noncontrolling interest in joint ventures
|
4,205
|
|
4,339
|
|
4,486
|
|
4,707
|
|
4,864
|
|
|||||
|
Total stockholders’ equity
|
637,661
|
|
554,862
|
|
571,129
|
|
513,998
|
|
486,312
|
|
|||||
|
(1)
|
Includes mortgage loans receivable and unconsolidated investment. See Notes 3 and 4 in the Notes to Consolidated Financial Statements.
|
13
OVERVIEW
EastGroup’s goal is to maximize shareholder value by being a leading provider in its markets of functional, flexible and quality business distribution space for location sensitive customers (primarily in the 5,000 to 50,000 square foot range). The Company develops, acquires and operates distribution facilities, the majority of which are clustered around major transportation features in supply constrained submarkets in major Sunbelt regions. The Company’s core markets are in the states of Florida, Texas, Arizona, California and North Carolina.
The Company believes its current operating cash flow and unsecured bank credit facilities provide the capacity to fund the operations of the Company, and the Company also believes it can issue common and/or preferred equity and obtain debt financing. During
2016
, EastGroup obtained unsecured debt totaling $205 million and issued 875,052 shares of common stock through its continuous common equity program, providing net proceeds to the Company of $59.3 million. EastGroup's financing and equity issuances are further described in
Liquidity and Capital Resources
.
The Company’s primary revenue is rental income; as such, EastGroup’s greatest challenge is leasing space. During
2016
, leases expired on 6,676,000 square feet (19.1% of EastGroup’s total square footage of 34,951,000), and the Company was successful in renewing or re-leasing 89% of the expiring square feet. In addition, EastGroup leased 1,778,000 square feet of other vacant space during the year. During
2016
, average rental rates on new and renewal leases increased by 11.9%. Property net operating income (PNOI) from same properties, defined as operating properties owned during the entire current period and prior year reporting period, increased 3.1% for
2016
compared to 2015.
EastGroup’s total leased percentage was 97.3% at December 31,
2016
compared to 97.2% at December 31, 2015. Leases scheduled to expire in 2017 were 13.6% of the portfolio on a square foot basis at December 31,
2016
. As of
February 14, 2017
, leases scheduled to expire during the remainder of 2017 were 10.7% of the portfolio on a square foot basis.
The Company generates new sources of leasing revenue through its acquisition and development programs. EastGroup continues to see targeted development as a contributor to the Company’s long-term growth. The Company mitigates risks associated with development through a Board-approved maximum level of land held for development and by adjusting development start dates according to leasing activity.
During
2016
, EastGroup acquired Flagler Center, a three-building, 358,000 square foot business distribution complex in Jacksonville, Florida, for $24 million. Also during
2016
, the Company acquired three development-stage operating properties (996,000 square feet) in Dallas, Las Vegas and Weston (South Florida) and 197 acres of development land for $133 million. In addition, EastGroup began construction of nine development projects containing 1,234,000 square feet in Orlando, Tampa, Ft. Myers, San Antonio, Dallas and Tucson. Also in 2016, the Company transferred nine projects (1,004,000 square feet) in San Antonio, Houston, Dallas, Orlando, Tampa and Phoenix from its development program to real estate properties with costs of
$68.1 million
at the date of transfer. As of December 31, 2016, EastGroup's development program consisted of 17 buildings (2,891,000 square feet) located in San Antonio, Dallas, Orlando, Tampa, Ft. Myers, Ft. Lauderdale, Charlotte, Las Vegas, Phoenix and Tucson. The projected total cost for the development projects, which were collectively 57% leased as of
February 14, 2017
, is $235 million, of which $58 million remained to be invested as of December 31,
2016
.
During
2016
, EastGroup sold 1,256,000 square feet of operating properties and 25 acres of land, generating gross sales proceeds of $81.1 million. The Company recognized $42,170,000 in
Gain, net of loss, on sales of real estate investments
and $733,000 in
Gain on sales of non-operating real estate
(included in
Other
on the Consolidated Statements of Income and Comprehensive Income) during
2016
.
Typically, the Company initially funds its development and acquisition programs through its $335 million unsecured bank credit facilities (as discussed in
Liquidity and Capital Resources
). As market conditions permit, EastGroup issues equity and/or employs fixed-rate debt, including variable-rate debt that has been swapped to an effectively fixed rate through the use of interest rate swaps, to replace short-term bank borrowings. In March 2016, Moody's Investors Service affirmed the Company's issuer rating of Baa2 with a stable outlook. In April 2016, Fitch Ratings affirmed EastGroup's issuer rating of BBB with a stable outlook. A security rating is not a recommendation to buy, sell or hold securities and may be subject to revision or withdrawal at any time by the assigning rating agency. Each rating should be evaluated independently of any other rating. For future debt issuances, the Company intends to issue primarily unsecured fixed-rate debt, including variable-rate debt that has been swapped to an effectively fixed rate through the use of interest rate swaps. The Company may also access the public debt market in the future as a means to raise capital.
14
EastGroup has one reportable segment – industrial properties. These properties are primarily located in major Sunbelt regions of the United States, have similar economic characteristics and also meet the other criteria permitting the properties to be aggregated into one reportable segment. The Company’s chief decision makers use two primary measures of operating results in making decisions: (1) property net operating income (PNOI), defined as
Income from real estate operations
less
Expenses from real estate operations
(including market-based internal management fee expense) plus the Company's share of income and property operating expenses from its less-than-wholly-owned real estate investments, and (2) funds from operations attributable to common stockholders (FFO), defined as net income (loss) attributable to common stockholders computed in accordance with U.S. generally accepted accounting principles (GAAP), excluding gains or losses from sales of depreciable real estate property and impairment losses, plus real estate related depreciation and amortization, and after adjustments for unconsolidated partnerships and joint ventures. The Company calculates FFO based on the National Association of Real Estate Investment Trusts’ (NAREIT) definition.
PNOI is a supplemental industry reporting measurement used to evaluate the performance of the Company’s real estate investments. The Company believes the exclusion of depreciation and amortization in the industry’s calculation of PNOI provides a supplemental indicator of the properties’ performance since real estate values have historically risen or fallen with market conditions. PNOI as calculated by the Company may not be comparable to similarly titled but differently calculated measures for other real estate investment trusts (REITs). The major factors influencing PNOI are occupancy levels, acquisitions and sales, development properties that achieve stabilized operations, rental rate increases or decreases, and the recoverability of operating expenses. The Company’s success depends largely upon its ability to lease space and to recover from tenants the operating costs associated with those leases.
PNOI is comprised of
Income from real estate operations
, less
Expenses from real estate operations
plus the Company's share of income and property operating expenses from its less-than-wholly-owned real estate investments. PNOI was calculated as follows for the three fiscal years ended December 31,
2016
,
2015
and
2014
.
|
|
Years Ended December 31,
|
||||||||
|
2016
|
2015
|
2014
|
|||||||
|
(In thousands)
|
|||||||||
|
Income from real estate operations
|
$
|
252,961
|
|
234,918
|
|
219,706
|
|
||
|
Expenses from real estate operations
|
(74,347
|
)
|
(67,402
|
)
|
(62,797
|
)
|
|||
|
Noncontrolling interest in PNOI of consolidated 80% joint ventures
|
(823
|
)
|
(851
|
)
|
(848
|
)
|
|||
|
PNOI from 50% owned unconsolidated investment
|
906
|
|
842
|
|
789
|
|
|||
|
PROPERTY NET OPERATING INCOME
|
$
|
178,697
|
|
167,507
|
|
156,850
|
|
||
Income from real estate operations
is comprised of rental income, expense reimbursement pass-through income and other real estate income including lease termination fees.
Expenses from real estate operations
is comprised of property taxes, insurance, utilities, repair and maintenance expenses, management fees, other operating costs and bad debt expense. Generally, the Company’s most significant operating expenses are property taxes and insurance. Tenant leases may be net leases in which the total operating expenses are recoverable, modified gross leases in which some of the operating expenses are recoverable, or gross leases in which no expenses are recoverable (gross leases represent only a small portion of the Company’s total leases). Increases in property operating expenses are fully recoverable under net leases and recoverable to a high degree under modified gross leases. Modified gross leases often include base year amounts and expense increases over these amounts are recoverable. The Company’s exposure to property operating expenses is primarily due to vacancies and leases for occupied space that limit the amount of expenses that can be recovered.
15
The following table presents reconciliations of Net Income to PNOI for the three fiscal years ended December 31,
2016
,
2015
and
2014
.
|
|
Years Ended December 31,
|
||||||||
|
2016
|
2015
|
2014
|
|||||||
|
(In thousands)
|
|||||||||
|
NET INCOME
|
$
|
96,094
|
|
48,399
|
|
48,473
|
|
||
|
Gain, net of loss, on sales of real estate investments
|
(42,170
|
)
|
(2,903
|
)
|
(9,188
|
)
|
|||
|
Gain on sales of non-operating real estate
|
(733
|
)
|
(123
|
)
|
(98
|
)
|
|||
|
Interest income
|
(255
|
)
|
(258
|
)
|
(479
|
)
|
|||
|
Other income
|
(86
|
)
|
(90
|
)
|
(123
|
)
|
|||
|
Interest rate swap ineffectiveness
|
5
|
|
—
|
|
1
|
|
|||
|
Depreciation and amortization
|
77,935
|
|
73,290
|
|
70,314
|
|
|||
|
Company's share of depreciation from unconsolidated investment
|
124
|
|
122
|
|
134
|
|
|||
|
Company's share of interest expense from unconsolidated investment
|
—
|
|
—
|
|
242
|
|
|||
|
Interest expense
|
35,213
|
|
34,666
|
|
35,486
|
|
|||
|
General and administrative expense
|
13,232
|
|
15,091
|
|
12,726
|
|
|||
|
Acquisition costs
|
161
|
|
164
|
|
210
|
|
|||
|
Noncontrolling interest in PNOI of consolidated 80% joint ventures
|
(823
|
)
|
(851
|
)
|
(848
|
)
|
|||
|
PROPERTY NET OPERATING INCOME (PNOI)
|
$
|
178,697
|
|
167,507
|
|
156,850
|
|
||
The Company believes FFO is a meaningful supplemental measure of operating performance for equity REITs. The Company believes excluding depreciation and amortization in the calculation of FFO is appropriate since real estate values have historically increased or decreased based on market conditions. FFO is not considered as an alternative to net income (determined in accordance with GAAP) as an indication of the Company’s financial performance, nor is it a measure of the Company’s liquidity or indicative of funds available to provide for the Company’s cash needs, including its ability to make distributions. In addition, FFO, as reported by the Company, may not be comparable to FFO reported by other REITs that do not define the term in accordance with the current NAREIT definition. The Company’s key drivers affecting FFO are changes in PNOI (as discussed above), interest rates, the amount of leverage the Company employs and general and administrative expenses. The following table presents reconciliations of Net Income Attributable to EastGroup Properties, Inc. Common Stockholders to FFO Attributable to Common Stockholders for the three fiscal years ended December 31,
2016
,
2015
and
2014
.
|
|
Years Ended December 31,
|
||||||||
|
2016
|
2015
|
2014
|
|||||||
|
(In thousands, except per share data)
|
|||||||||
|
NET INCOME ATTRIBUTABLE TO EASTGROUP PROPERTIES, INC. COMMON STOCKHOLDERS
|
$
|
95,509
|
|
47,866
|
|
47,941
|
|
||
|
Depreciation and amortization
|
77,935
|
|
73,290
|
|
70,314
|
|
|||
|
Company's share of depreciation from unconsolidated investment
|
124
|
|
122
|
|
134
|
|
|||
|
Depreciation and amortization from noncontrolling interest
|
(214
|
)
|
(206
|
)
|
(204
|
)
|
|||
|
Gain, net of loss, on sales of real estate investments
|
(42,170
|
)
|
(2,903
|
)
|
(9,188
|
)
|
|||
|
FUNDS FROM OPERATIONS (FFO) ATTRIBUTABLE TO COMMON STOCKHOLDERS
|
$
|
131,184
|
|
118,169
|
|
108,997
|
|
||
|
Net income attributable to common stockholders per diluted share
|
$
|
2.93
|
|
1.49
|
|
1.52
|
|
||
|
Funds from operations attributable to common stockholders per diluted share
|
4.02
|
|
3.67
|
|
3.47
|
|
|||
|
Diluted shares for earnings per share and funds from operations
|
32,628
|
|
32,196
|
|
31,452
|
|
|||
16
The Company analyzes the following performance trends in evaluating the progress of the Company:
|
•
|
The FFO change per share represents the increase or decrease in FFO per share from the current year compared to the prior year. For
2016
, FFO was
$4.02
per share compared with
$3.67
per share for
2015
, an increase of 9.5% per share.
|
|
•
|
For the year ended December 31,
2016
, PNOI increased by $11,190,000, or 6.7%, compared to
2015
. PNOI increased $7,345,000 from newly developed and redeveloped properties, $4,943,000 from same property operations and $2,488,000 from
2015
and
2016
acquisitions; PNOI decreased $3,447,000 from properties sold in 2015 and 2016.
|
|
•
|
The same property net operating income change represents the PNOI increase or decrease for the same operating properties owned during the entire current period and prior year reporting period. PNOI from same properties increased 3.1% for the year ended
December 31, 2016
, compared to
2015
.
|
|
•
|
Same property average occupancy represents the average month-end percentage of leased square footage for which the lease term has commenced as compared to the total leasable square footage for the same operating properties owned during the entire current period and prior year reporting period. Same property average occupancy for the year ended
December 31, 2016
, was 96.4% compared to 96.1% for
2015
.
|
|
•
|
Occupancy is the percentage of leased square footage for which the lease term has commenced as compared to the total leasable square footage as of the close of the reporting period. Occupancy at
December 31, 2016
was 96.8%. Quarter-end occupancy ranged from 95.7% to 96.3% over the previous four quarters ended
December 31, 2015
to September 30,
2016
.
|
|
•
|
Rental rate change represents the rental rate increase or decrease on new and renewal leases compared to the prior leases on the same space. For the year
2016
, rental rate increases on new and renewal leases (22.0% of total square footage) averaged 11.9%.
|
|
•
|
For the year
2016
, lease termination fee income was $812,000 compared to $225,000 for
2015
. The Company recorded bad debt expense, net of recoveries, of $992,000 in
2016
and $747,000 in
2015
.
|
17
CRITICAL ACCOUNTING POLICIES AND ESTIMATES
The Company’s management considers the following accounting policies and estimates to be critical to the reported operations of the Company.
Real Estate Properties
The Company applied the principles of Accounting Standards Codification (ASC) 805,
Business Combinations,
when accounting for purchase of real estate until its adoption of ASU 2017-01,
Business Combinations (Topic 805): Clarifying the Definition of a Business,
which was effective October 1, 2016. ASU 2017-01 provides a new framework for determining whether transactions should be accounted for as acquisitions (or disposals) of assets or businesses. Under the new guidance, companies are required to utilize an initial screening test to determine whether substantially all of the fair value of the gross assets acquired (or disposed of) is concentrated in a single identifiable asset or a group of similar identifiable assets; if so, the set is not a business. EastGroup has determined that some of its real estate property acquisitions may be considered to be acquisitions of groups of similar identifiable assets; therefore, the acquisitions are not considered to be acquisitions of a business.
The Financial Accounting Standards Board (FASB) Codification provides guidance on how to properly determine the allocation of the purchase price among the individual components of both the tangible and intangible assets based on their respective fair values. Goodwill for business combinations is recorded when the purchase price exceeds the fair value of the assets and liabilities acquired. Factors considered by management in allocating the cost of the properties acquired include an estimate of carrying costs during the expected lease-up periods considering current market conditions and costs to execute similar leases. The allocation to tangible assets (land, building and improvements) is based upon management’s determination of the value of the property as if it were vacant using discounted cash flow models. The Company determines whether any financing assumed is above or below market based upon comparison to similar financing terms for similar properties. The cost of the properties acquired may be adjusted based on indebtedness assumed from the seller that is determined to be above or below market rates.
The purchase price is also allocated among the following categories of intangible assets: the above or below market component of in-place leases, the value of in-place leases, and the value of customer relationships. The value allocable to the above or below market component of an acquired in-place lease is determined based upon the present value (using a discount rate reflecting the risks associated with the acquired leases) of the difference between (i) the contractual amounts to be paid pursuant to the lease over its remaining term, and (ii) management’s estimate of the amounts that would be paid using fair market rates over the remaining term of the lease. The amounts allocated to above and below market leases are included in
Other assets
and
Other liabilities
, respectively, on the Consolidated Balance Sheets and are amortized to rental income over the remaining terms of the respective leases. The total amount of intangible assets is further allocated to in-place lease values and customer relationship values based upon management’s assessment of their respective values. These intangible assets are included in
Other assets
on the Consolidated Balance Sheets and are amortized over the remaining term of the existing lease, or the anticipated life of the customer relationship, as applicable.
During the period in which a property is under development, costs associated with development (i.e., land, construction costs, interest expense, property taxes and other costs associated with development) are aggregated into the total capitalized costs of the property. Included in these costs are management’s estimates for the portions of internal costs (primarily personnel costs) deemed related to such development activities. The internal costs are allocated to specific development properties based on development activity.
The Company reviews its real estate investments for impairment of value whenever events or changes in circumstances indicate that the carrying amount of an asset may not be recoverable. If any real estate investment is considered permanently impaired, a loss is recorded to reduce the carrying value of the property to its estimated fair value. Real estate assets classified as held for sale are reported at the lower of the carrying amount or fair value less estimated costs of sale. The evaluation of real estate investments involves many subjective assumptions dependent upon future economic events that affect the ultimate value of the property. Currently, the Company’s management has not identified any significant impairment charges which should be recorded nor has it recorded any impairment charges in recent years. In the event of impairment, the property’s basis would be reduced, and the impairment would be recognized as a current period charge on the Consolidated Statements of Income and Comprehensive Income.
Valuation of Receivables
The Company is subject to tenant defaults and bankruptcies that could affect the collection of outstanding receivables. In order to mitigate these risks, the Company performs credit reviews and analyses on prospective tenants before significant leases are executed and on existing tenants before properties are acquired. On a quarterly basis, the Company evaluates outstanding receivables and estimates the allowance for doubtful accounts. Management specifically analyzes aged receivables, customer credit-worthiness, historical bad debts and current economic trends when evaluating the adequacy of the allowance for doubtful accounts. The Company believes its allowance for doubtful accounts is adequate for its outstanding receivables for the periods
18
presented. In the event the allowance for doubtful accounts is insufficient for an account that is subsequently written off, additional bad debt expense would be recognized as a current period charge on the Consolidated Statements of Income and Comprehensive Income.
Tax Status
EastGroup, a Maryland corporation, has qualified as a real estate investment trust under Sections 856-860 of the Internal Revenue Code and intends to continue to qualify as such. To maintain its status as a REIT, the Company is required to distribute at least 90% of its ordinary taxable income to its stockholders. If the Company has a capital gain, it has the option of (i) deferring recognition of the capital gain through a tax-deferred exchange, (ii) declaring and paying a capital gain dividend on any recognized net capital gain resulting in no corporate level tax, or (iii) retaining and paying corporate income tax on its net long-term capital gain, with shareholders reporting their proportional share of the undistributed long-term capital gain and receiving a credit or refund of their share of the tax paid by the Company. The Company distributed all of its
2016
,
2015
and
2014
taxable income to its stockholders. Accordingly, no significant provisions for income taxes were necessary.
FINANCIAL CONDITION
EastGroup’s
Total Assets
were
$1,825,764,000
at
December 31, 2016
,
an increase
of
$163,860,000
from
December 31, 2015
.
Total Liabilities
increased
$81,195,000
to
$1,183,898,000
, and
Total Equity
increased
$82,665,000
to
$641,866,000
during the same period. The following paragraphs explain these changes in detail.
Assets
Real Estate Properties
Real estate properties
increased
$
64,066,000
during the year ended
December 31, 2016
, primarily due to the transfer of
nine
properties from
Development
, as detailed under
Development
below; the purchase of Flagler Center; and capital improvements at the Company's properties. These increases were partially offset by the operating property sales discussed below.
During 2016, EastGroup acquired Flagler Center, a
three
-building,
358,000
square foot complex in Jacksonville, Florida, for
$24,011,000
, of which
$22,228,000
was allocated to
Real estate properties
. EastGroup allocated $7,317,000 of the total purchase price to land using third party land valuations for the Jacksonville market. The market values are considered to be Level 3 inputs as defined by ASC 820,
Fair Value Measurements and Disclosures
(see Note 18 for additional information on ASC 820). Intangibles associated with the purchase of Flagler were allocated as follows: $2,020,000 to in-place lease intangibles and $342,000 to above market leases (both included in
Other assets
on the Consolidated Balance Sheets), and $579,000 to below market leases (included in
Other liabilities
on the Consolidated Balance Sheets).
During the year ended
December 31, 2016
, the Company made capital improvements of
$23,157,000
on existing and acquired properties (included in the Capital Expenditures table under
Results of Operations
). Also, the Company incurred costs of
$7,871,000
on development projects subsequent to transfer to
Real estate properties
; the Company records these expenditures as development costs on the Consolidated Statements of Cash Flows.
EastGroup sold the following operating properties during 2016: Northwest Point Distribution and Service Centers, Lockwood Distribution Center, West Loop Distribution Center 1 & 2 and America Plaza in Houston; North Stemmons II and III in Dallas; two of its four Interstate Commons Distribution Center buildings in Phoenix; Castilian Research Center in Santa Barbara, California; and Memphis I, the last of its properties in Memphis. The properties (
1,256,000
square feet combined) were sold for $75.7 million and the Company recognized net gains on the sales of $42.2 million.
Development
EastGroup’s investment in development at
December 31, 2016
consisted of properties in lease-up and under construction of
$176,813,000
and prospective development (primarily land) of
$117,095,000
. The Company’s total investment in development at
December 31, 2016
was
$293,908,000
compared to
$170,441,000
at
December 31, 2015
. Total capital invested for development during
2016
was
$203,765,000
, which primarily consisted of costs of
$186,305,000
and
$5,272,000
as detailed in the development activity table below and costs of
$7,871,000
on development projects subsequent to transfer to
Real estate properties
. The capitalized costs incurred on development projects subsequent to transfer to
Real estate properties
include capital improvements at the properties and do not include other capitalized costs associated with development (i.e., interest expense, property taxes and internal personnel costs).
EastGroup capitalized internal development costs of
$3,789,000
during the year ended
December 31, 2016
, compared to
$4,467,000
during
2015
.
19
During 2016, the Company acquired the following development-stage operating properties:
|
DEVELOPMENT-STAGE REAL ESTATE PROPERTIES ACQUIRED IN 2016
|
Location
|
Size
|
Date
Acquired
|
Cost
(1)
|
|||||||
|
|
|
(Square feet)
|
|
(In thousands)
|
|||||||
|
Parc North 1-4
|
Dallas, TX
|
446,000
|
|
07/08/2016
|
$
|
30,984
|
|
||||
|
Weston Commerce Park
|
Ft. Lauderdale, FL
|
134,000
|
|
11/01/2016
|
14,112
|
|
|||||
|
Jones Corporate Center
|
Las Vegas, NV
|
416,000
|
|
11/15/2016
|
39,394
|
|
|||||
|
Total Acquisitions
|
|
996,000
|
|
|
$
|
84,490
|
|
||||
|
(1)
|
Total cost of the properties acquired was $88,147,000, of which
$84,490,000
was allocated to Development as indicated above. Intangibles associated with the purchases of real estate were allocated as follows: $3,921,000 to in-place lease intangibles and $51,000 to above market leases (included in Other assets on the Consolidated Balance Sheets) and $315,000 to below market leases (included in Other liabilities on the Consolidated Balance Sheets). All of these costs are amortized over the remaining lives of the associated leases in place at the time of acquisition.
|
Costs associated with the development-stage operating property acquisitions, except for the amounts allocated to in-place lease intangibles, above market leases and below market leases, are included in the development activity table below.
During
2016
, EastGroup purchased
197
acres of development land in Charlotte, San Antonio, Dallas, Miami and Tucson for
$44,594,000
. Costs associated with these acquisitions are included in the development activity table. These increases were offset by the sale of 25 acres of land for $5,400,000 and the transfer of
nine
development projects to
Real estate properties
during
2016
with a total investment of
$68,110,000
as of the date of transfer.
20
|
DEVELOPMENT
|
|
Costs Incurred
|
|
|||||||||||||||
|
Costs
Transferred
in 2016
(1)
|
For the
Year Ended
12/31/16
|
Cumulative
as of
12/31/16
|
Estimated
Total Costs
(2)
|
Anticipated Building Conversion Date
|
||||||||||||||
|
|
(In thousands)
|
|||||||||||||||||
|
LEASE-UP
|
Building Size (Square feet)
|
|
|
|
|
|||||||||||||
|
Eisenhauer Point 1 & 2, San Antonio, TX
|
201,000
|
|
$
|
—
|
|
9,016
|
|
15,776
|
|
17,000
|
|
01/17
|
||||||
|
South 35th Avenue, Phoenix, AZ
(3)
|
124,000
|
|
—
|
|
493
|
|
1,664
|
|
1,900
|
|
01/17
|
|||||||
|
Parc North 1-4, Dallas, TX
(4)
|
446,000
|
|
—
|
|
32,120
|
|
32,120
|
|
35,500
|
|
02/17
|
|||||||
|
Jones Corporate Park, Las Vegas, NV
(5)
|
416,000
|
|
—
|
|
39,540
|
|
39,540
|
|
43,700
|
|
04/17
|
|||||||
|
Ten Sky Harbor, Phoenix, AZ
|
64,000
|
|
—
|
|
1,613
|
|
5,265
|
|
6,200
|
|
04/17
|
|||||||
|
Steele Creek VI, Charlotte, NC
|
137,000
|
|
—
|
|
4,102
|
|
7,006
|
|
8,200
|
|
07/17
|
|||||||
|
Madison IV & V, Tampa, FL
|
145,000
|
|
1,069
|
|
6,456
|
|
7,525
|
|
9,600
|
|
10/17
|
|||||||
|
Total Lease-Up
|
1,533,000
|
|
1,069
|
|
93,340
|
|
108,896
|
|
122,100
|
|
||||||||
|
UNDER CONSTRUCTION
|
|
|
|
|
|
|||||||||||||
|
Alamo Ridge III, San Antonio, TX
|
135,000
|
|
—
|
|
8,179
|
|
10,559
|
|
12,200
|
|
02/17
|
|||||||
|
Horizon V, Orlando, FL
|
141,000
|
|
2,891
|
|
1,544
|
|
4,435
|
|
9,900
|
|
07/17
|
|||||||
|
Horizon VII, Orlando, FL
|
109,000
|
|
2,344
|
|
4,547
|
|
6,891
|
|
8,300
|
|
01/18
|
|||||||
|
Alamo Ridge IV, San Antonio, TX
|
97,000
|
|
843
|
|
4,102
|
|
4,945
|
|
6,000
|
|
02/18
|
|||||||
|
Country Club V, Tucson, AZ
|
300,000
|
|
—
|
|
3,295
|
|
3,295
|
|
24,200
|
|
02/18
|
|||||||
|
CreekView 121 1 & 2, Dallas, TX
|
193,000
|
|
3,481
|
|
8,374
|
|
11,855
|
|
16,700
|
|
02/18
|
|||||||
|
Eisenhauer Point 3, San Antonio, TX
|
71,000
|
|
808
|
|
1,940
|
|
2,748
|
|
5,400
|
|
04/18
|
|||||||
|
Eisenhauer Point 4, San Antonio, TX
|
85,000
|
|
777
|
|
1,876
|
|
2,653
|
|
5,200
|
|
04/18
|
|||||||
|
SunCoast 4, Ft. Myers, FL
|
93,000
|
|
4,287
|
|
1,968
|
|
6,255
|
|
8,700
|
|
04/18
|
|||||||
|
Weston, Ft. Lauderdale, FL
(6)
|
134,000
|
|
—
|
|
14,281
|
|
14,281
|
|
15,900
|
|
05/18
|
|||||||
|
Total Under Construction
|
1,358,000
|
|
15,431
|
|
50,106
|
|
67,917
|
|
112,500
|
|
||||||||
|
PROSPECTIVE DEVELOPMENT (PRIMARILY LAND)
|
Estimated Building Size (Square feet)
|
|
|
|
|
|||||||||||||
|
Phoenix, AZ
|
261,000
|
|
—
|
|
406
|
|
3,893
|
|
||||||||||
|
Tucson, AZ
|
70,000
|
|
—
|
|
—
|
|
417
|
|
||||||||||
|
Ft. Myers, FL
|
570,000
|
|
(4,287
|
)
|
72
|
|
13,643
|
|
||||||||||
|
Miami, FL
|
850,000
|
|
—
|
|
27,244
|
|
27,244
|
|
||||||||||
|
Orlando, FL
|
662,000
|
|
(5,235
|
)
|
993
|
|
16,129
|
|
||||||||||
|
Tampa, FL
|
148,000
|
|
(1,069
|
)
|
111
|
|
3,681
|
|
||||||||||
|
Jackson, MS
|
28,000
|
|
—
|
|
—
|
|
706
|
|
||||||||||
|
Charlotte, NC
|
756,000
|
|
—
|
|
4,882
|
|
9,303
|
|
||||||||||
|
Dallas, TX
|
718,000
|
|
(3,481
|
)
|
7,677
|
|
12,322
|
|
||||||||||
|
El Paso, TX
|
251,000
|
|
—
|
|
—
|
|
2,444
|
|
||||||||||
|
Houston, TX
|
1,476,000
|
|
—
|
|
(3,213
|
)
|
21,374
|
|
||||||||||
|
San Antonio, TX
|
544,000
|
|
(2,428
|
)
|
4,687
|
|
5,939
|
|
||||||||||
|
Total Prospective Development
|
6,334,000
|
|
(16,500
|
)
|
42,859
|
|
117,095
|
|
||||||||||
|
|
9,225,000
|
|
$
|
—
|
|
186,305
|
|
293,908
|
|
|||||||||
|
DEVELOPMENTS COMPLETED AND TRANSFERRED TO REAL ESTATE PROPERTIES DURING 2016
|
Building Size (Square feet)
|
|
|
|
|
Building Conversion Date
|
||||||||||||
|
Alamo Ridge I, San Antonio, TX
|
96,000
|
|
$
|
—
|
|
26
|
|
7,378
|
|
02/16
|
||||||||
|
Alamo Ridge II, San Antonio, TX
|
62,000
|
|
—
|
|
28
|
|
4,167
|
|
02/16
|
|||||||||
|
Madison II & III, Tampa, FL
|
127,000
|
|
—
|
|
(14
|
)
|
7,403
|
|
02/16
|
|||||||||
|
West Road III, Houston, TX
|
78,000
|
|
—
|
|
57
|
|
4,839
|
|
03/16
|
|||||||||
|
Ten West Crossing 7, Houston, TX
|
68,000
|
|
—
|
|
91
|
|
4,163
|
|
04/16
|
|||||||||
|
West Road IV, Houston, TX
|
65,000
|
|
—
|
|
642
|
|
5,327
|
|
06/16
|
|||||||||
|
Horizon III, Orlando, FL
|
109,000
|
|
—
|
|
1,217
|
|
7,332
|
|
07/16
|
|||||||||
|
Kyrene 202 VI, Phoenix, AZ
|
123,000
|
|
—
|
|
631
|
|
7,651
|
|
09/16
|
|||||||||
|
ParkView 1-3, Dallas, TX
|
276,000
|
|
—
|
|
2,594
|
|
19,850
|
|
10/16
|
|||||||||
|
Total Transferred to Real Estate Properties
|
1,004,000
|
|
$
|
—
|
|
5,272
|
|
68,110
|
|
(7)
|
||||||||
|
(1)
|
Represents costs transferred from Prospective Development (primarily land) to Under Construction during the period. Negative amounts represent land inventory costs transferred to Under Construction.
|
|
(2)
|
Included in these costs are development obligations of
$25.5 million
and tenant improvement obligations of
$6.1 million
on properties under development.
|
|
(3)
|
This property was redeveloped from a manufacturing building to a multi-tenant distribution building.
|
|
(4)
|
This project, which was recently developed by the seller, was acquired by EastGroup on 7/8/16 and is considered to be in the lease-up phase.
|
|
(5)
|
This project, which was recently developed by the seller, was acquired by EastGroup on 11/15/16 and is considered to be in the lease-up phase.
|
|
(6)
|
This project was acquired by EastGroup on 11/1/16 and is being redeveloped.
|
|
(7)
|
Represents cumulative costs at the date of transfer.
|
21
Accumulated Depreciation
Accumulated depreciation on real estate and development properties
increased
$36,796,000
during
2016
due primarily to depreciation expense of $63,793,000, offset by accumulated depreciation of $26,501,000 on the properties sold during the year.
Other Assets
Other assets
increased
$12,972,000
during
2016
. A summary of
Other assets
follows:
|
|
December 31,
|
|||||
|
2016
|
2015
|
|||||
|
(In thousands)
|
||||||
|
Leasing costs (principally commissions)
|
$
|
65,521
|
|
59,043
|
|
|
|
Accumulated amortization of leasing costs
|
(26,340
|
)
|
(23,455
|
)
|
||
|
Leasing costs (principally commissions), net of accumulated amortization
|
39,181
|
|
35,588
|
|
||
|
Straight-line rents receivable
|
28,369
|
|
26,482
|
|
||
|
Allowance for doubtful accounts on straight-line rents receivable
|
(76
|
)
|
(167
|
)
|
||
|
Straight-line rents receivable, net of allowance for doubtful accounts
|
28,293
|
|
26,315
|
|
||
|
Accounts receivable
|
6,824
|
|
5,615
|
|
||
|
Allowance for doubtful accounts on accounts receivable
|
(809
|
)
|
(394
|
)
|
||
|
Accounts receivable, net of allowance for doubtful accounts
|
6,015
|
|
5,221
|
|
||
|
Acquired in-place lease intangibles
|
21,231
|
|
19,061
|
|
||
|
Accumulated amortization of acquired in-place lease intangibles
|
(8,642
|
)
|
(8,205
|
)
|
||
|
Acquired in-place lease intangibles, net of accumulated amortization
|
12,589
|
|
10,856
|
|
||
|
Acquired above market lease intangibles
|
1,594
|
|
1,337
|
|
||
|
Accumulated amortization of acquired above market lease intangibles
|
(736
|
)
|
(684
|
)
|
||
|
Acquired above market lease intangibles, net of accumulated amortization
|
858
|
|
653
|
|
||
|
Mortgage loans receivable
|
4,752
|
|
4,875
|
|
||
|
Interest rate swap assets
|
4,546
|
|
400
|
|
||
|
Goodwill
|
990
|
|
990
|
|
||
|
Prepaid expenses and other assets
|
7,606
|
|
6,960
|
|
||
|
Total
Other assets
|
$
|
104,830
|
|
91,858
|
|
|
Liabilities
Unsecured bank credit facilities
increased
$41,576,000
during
2016
, mainly due to proceeds of
$608,349,000
exceeding repayments of
$567,165,000
. The Company’s credit facilities are described in greater detail under
Liquidity and Capital Resources
.
Unsecured debt
increased
$124,628,000
during
2016
, primarily due to the closing of a $65 million unsecured term loan, a $40 million unsecured term loan and two senior unsecured private placement notes totaling $100 million. These increases were offset by the repayment of an $80 million unsecured term loan in August 2016.
Secured debt
decreased
$92,780,000
during the year ended
December 31, 2016
. The decrease primarily resulted from the repayment of two mortgage loans with a combined balance of $75,737,000, regularly scheduled principal payments of $17,037,000 and mortgage loan premium amortization of $34,000.
22
Accounts payable and accrued expenses
increased
$8,520,000
during
2016
. A summary of the Company’s
Accounts payable and accrued expenses
follows:
|
|
December 31,
|
|||||
|
2016
|
2015
|
|||||
|
(In thousands)
|
||||||
|
Property taxes payable
|
$
|
14,186
|
|
16,055
|
|
|
|
Development costs payable
|
9,844
|
|
6,215
|
|
||
|
Property capital expenditures payable
|
2,304
|
|
2,818
|
|
||
|
Interest payable
|
3,822
|
|
3,704
|
|
||
|
Dividends payable on unvested restricted stock
|
1,530
|
|
2,157
|
|
||
|
Book overdraft
(1)
|
14,452
|
|
7,215
|
|
||
|
Other payables and accrued expenses
|
6,563
|
|
6,017
|
|
||
|
Total
Accounts payable and accrued expenses
|
$
|
52,701
|
|
44,181
|
|
|
(1)
Represents unfunded outstanding checks for which the bank has not advanced cash to the Company. See Note 1(p)
in the Notes to Consolidated Financial Statements.
Other liabilities
decreased
$749,000
during
2016
. A summary of the Company’s
Other liabilities
follows:
|
|
December 31,
|
|||||
|
2016
|
2015
|
|||||
|
(In thousands)
|
||||||
|
Security deposits
|
$
|
14,782
|
|
13,943
|
|
|
|
Prepaid rent and other deferred income
|
9,795
|
|
10,003
|
|
||
|
Acquired below market lease intangibles
|
4,012
|
|
3,485
|
|
||
|
Accumulated amortization of acquired below market lease intangibles
|
(1,662
|
)
|
(1,353
|
)
|
||
|
Acquired below market lease intangibles, net of accumulated amortization
|
2,350
|
|
2,132
|
|
||
|
Interest rate swap liabilities
|
2,578
|
|
3,960
|
|
||
|
Prepaid tenant improvement reimbursements
|
343
|
|
493
|
|
||
|
Other liabilities
|
16
|
|
82
|
|
||
|
Total
Other liabilities
|
$
|
29,864
|
|
30,613
|
|
|
Equity
Additional paid-in capital
increased
$62,111,000
during
2016
primarily due to the issuance of common stock under the Company's continuous common equity program (as discussed in
Liquidity and Capital Resources)
and stock-based compensation (as discussed in Note 11 in the Notes to Consolidated Financial Statements). EastGroup issued
875,052
shares of common stock under its continuous common equity program with net proceeds to the Company of
$59,283,000
.
During
2016
,
Distributions in excess of earnings
decreased
$15,237,000
as a result of
Net Income Attributable to EastGroup Properties, Inc. Common Stockholders
of
$95,509,000
exceeding dividends on common stock of
$80,272,000
.
Accumulated other comprehensive income (loss)
increased
$5,451,000
during
2016
. The increase resulted from the change in fair value of the Company's interest rate swaps which are further discussed in Notes 12 and 13 in the Notes to Consolidated Financial Statements.
23
RESULTS OF OPERATIONS
2016
Compared to
2015
Net Income Attributable to EastGroup Properties, Inc. Common Stockholders
for
2016
was
$95,509,000
(
$2.93
per basic and diluted share) compared to
$47,866,000
(
$1.49
per basic and diluted share) for
2015
. EastGroup recognized
Gain, net of loss, on sales of real estate investments
of
$42,170,000
during
2016
and
$2,903,000
during
2015
.
PNOI increased by $11,190,000, or 6.7%, for
2016
compared to
2015
. PNOI increased $7,345,000 from newly developed and redeveloped properties, $4,943,000 from same property operations and $2,488,000 from
2015
and
2016
acquisitions; PNOI decreased $3,447,000 from properties sold in 2015 and 2016. For the year
2016
, lease termination fee income was $812,000 compared to $225,000 for
2015
. The Company recorded net bad debt expense of $992,000 in
2016
and $747,000 in
2015
. Straight-lining of rent increased
Income from real estate operations
by $2,839,000 and $1,889,000 in
2016
and
2015
, respectively.
The Company signed 143 leases with certain free rent concessions on 4,176,000 square feet during
2016
with total free rent concessions of $5,286,000 over the lives of the leases, compared to 164 leases with free rent concessions on 3,678,000 square feet with total free rent concessions of $4,024,000 over the lives of the leases in
2015
.
Property expense to revenue ratios, defined as
Expenses from real estate operations
as a percentage of
Income from real estate operations
, were 29.4% in
2016
compared to 28.7% in
2015
. The Company’s percentage of leased square footage was 97.3% at December 31,
2016
, compared to 97.2% at December 31,
2015
. Occupancy at the end of
2016
was 96.8% compared to 96.1% at the end of
2015
.
Same property average occupancy represents the average month-end percentage of leased square footage for which the lease term has commenced as compared to the total leasable square footage for the same operating properties owned during the entire current period and prior year reporting period. Same property average occupancy for the year ended
December 31, 2016
, was 96.4% compared to 96.1% for
2015
.
The same property average rental rate calculated in accordance with GAAP represents the average annual rental rates of leases in place for the same operating properties owned during the entire current period and prior year reporting period. The same property average rental rate was $5.61 per square foot for the year ended
December 31, 2016
, compared to $5.26 per square foot for
2015
.
24
Interest Expense
increased
$547,000
for
2016
compared to
2015
. The following table presents the components of
Interest Expense
for
2016
and
2015
:
|
|
Years Ended December 31,
|
||||||||
|
2016
|
2015
|
Increase (Decrease)
|
|||||||
|
(In thousands)
|
|||||||||
|
VARIABLE RATE INTEREST EXPENSE
|
|
|
|
|
|
|
|||
|
Unsecured bank credit facilities interest - variable rate
(excluding amortization of facility fees and debt issuance costs)
|
$
|
1,583
|
|
1,420
|
|
163
|
|
||
|
Amortization of facility fees - unsecured bank credit facilities
|
670
|
|
608
|
|
62
|
|
|||
|
Amortization of debt issuance costs - unsecured bank credit facilities
|
450
|
|
493
|
|
(43
|
)
|
|||
|
Total variable rate interest expense
|
2,703
|
|
2,521
|
|
182
|
|
|||
|
FIXED RATE INTEREST EXPENSE
|
|
|
|
|
|
|
|||
|
Unsecured bank credit facilities interest - fixed rate
(1)
(excluding amortization of facility fees and debt issuance costs)
|
614
|
|
—
|
|
614
|
|
|||
|
Unsecured debt interest
(1)
(excluding amortization of debt issuance costs)
|
19,245
|
|
15,498
|
|
3,747
|
|
|||
|
Secured debt interest
(excluding amortization of debt issuance costs)
|
16,907
|
|
21,061
|
|
(4,154
|
)
|
|||
|
Amortization of debt issuance costs - unsecured debt
|
700
|
|
422
|
|
278
|
|
|||
|
Amortization of debt issuance costs - secured debt
|
384
|
|
421
|
|
(37
|
)
|
|||
|
Total fixed rate interest expense
|
37,850
|
|
37,402
|
|
448
|
|
|||
|
Total interest
|
40,553
|
|
39,923
|
|
630
|
|
|||
|
Less capitalized interest
|
(5,340
|
)
|
(5,257
|
)
|
(83
|
)
|
|||
|
TOTAL INTEREST EXPENSE
|
$
|
35,213
|
|
34,666
|
|
547
|
|
||
|
(1)
|
Includes interest on the Company's unsecured bank credit facilities and unsecured debt with fixed interest rates per the debt agreements or effectively fixed interest rates due to interest rate swaps, as discussed in Note 13 in the Notes to Consolidated Financial Statements.
|
EastGroup's variable rate interest expense increased by
$182,000
for
2016
as compared to
2015
primarily due to an increase in the Company's weighted average interest rate on unsecured bank credit facilities borrowings, offset by a decrease in average unsecured bank credit facilities borrowings as shown in the following table:
|
|
Years Ended December 31,
|
|||||||||
|
|
2016
|
2015
|
Increase
(Decrease)
|
|||||||
|
|
(In thousands, except rates of interest)
|
|||||||||
|
Average borrowings on unsecured bank credit facilities - variable rate
|
$
|
106,352
|
|
109,777
|
|
(3,425
|
)
|
|||
|
Weighted average variable interest rates
(excluding amortization of facility fees and debt issuance costs)
|
1.49
|
%
|
1.29
|
%
|
|
|
||||
The Company's fixed rate interest expense increased by
$448,000
for
2016
as compared to
2015
as a result of the fixed rate unsecured bank credit facilities, unsecured debt and secured debt activity described below.
In August 2016, EastGroup repaid (with no penalty) an $80 million unsecured term loan with an effectively fixed interest rate of 2.770% and an original maturity date of August 15, 2018. On the same day, the Company borrowed $80 million through its $300 million unsecured bank credit facility; the maturity date for the credit facility is July 30, 2019. The Company re-designated the interest rate swap that was previously applied to the $80 million unsecured term loan to the $80 million unsecured bank credit facility borrowing. The $80 million unsecured bank credit facility draw has an effectively fixed interest rate of 2.020% through the interest rate swap's maturity date of August 15, 2018.
EastGroup's unsecured debt interest increased in 2016 as compared to 2015 as a result of the unsecured debt activity described below. The details of the unsecured debt obtained in 2015 and 2016 are shown in the following table:
25
|
NEW UNSECURED DEBT IN 2015 and 2016
|
Effective Interest Rate
|
Date Obtained
|
Maturity Date
|
Amount
|
||||||
|
(In thousands)
|
||||||||||
|
$75 Million Unsecured Term Loan
(1)
|
3.031%
|
03/02/2015
|
02/28/2022
|
$
|
75,000
|
|
||||
|
$25 Million Senior Unsecured Notes
|
3.970%
|
10/01/2015
|
10/01/2025
|
25,000
|
|
|||||
|
$50 Million Senior Unsecured Notes
|
3.990%
|
10/07/2015
|
10/07/2025
|
50,000
|
|
|||||
|
Weighted Average/Total Amount for 2015
|
3.507%
|
$
|
150,000
|
|
||||||
|
$65 Million Unsecured Term Loan
(2)
|
2.863%
|
04/01/2016
|
04/01/2023
|
$
|
65,000
|
|
||||
|
$40 Million Unsecured Term Loan
(3)
|
2.335%
|
07/29/2016
|
07/30/2021
|
40,000
|
|
|||||
|
$60 Million Senior Unsecured Notes
|
3.480%
|
12/15/2016
|
12/15/2024
|
60,000
|
|
|||||
|
$40 Million Senior Unsecured Notes
|
3.750%
|
12/15/2016
|
12/15/2026
|
40,000
|
|
|||||
|
Weighted Average/Total Amount for 2016
|
3.114%
|
$
|
205,000
|
|
||||||
|
Weighted Average/Total Amount for 2015 and 2016
|
3.280%
|
$
|
355,000
|
|
||||||
|
(1)
|
The interest rate on this unsecured term loan is comprised of LIBOR plus 140 basis points subject to a pricing grid for changes in the Company's coverage ratings. The Company entered into an interest rate swap to convert the loan's LIBOR rate to a fixed interest rate, providing the Company a weighted average effective interest rate on the term loan of 3.031% as of
December 31, 2016
. See Note 13 in the Notes to Consolidated Financial Statements for additional information on the interest rate swaps.
|
|
(2)
|
The interest rate on this unsecured term loan is comprised of LIBOR plus 165 basis points subject to a pricing grid for changes in the Company's coverage ratings. The Company entered into an interest rate swap to convert the loan's LIBOR rate to a fixed interest rate, providing the Company a weighted average effective interest rate on the term loan of 2.863% as of
December 31, 2016
. See Note 13 in the Notes to Consolidated Financial Statements for additional information on the interest rate swaps.
|
|
(3)
|
The interest rate on this unsecured term loan is comprised of LIBOR plus 110 basis points subject to a pricing grid for changes in the Company's coverage ratings. The Company entered into an interest rate swap to convert the loan's LIBOR rate to a fixed interest rate, providing the Company a weighted average effective interest rate on the term loan of 2.335% as of
December 31, 2016
. See Note 13 in the Notes to Consolidated Financial Statements for additional information on the interest rate swaps.
|
Secured debt interest decreased in 2016 as compared to 2015 as a result of regularly scheduled principal payments and debt repayments. Regularly scheduled principal payments on secured debt were $17,037,000 during
2016
and $20,484,000 in
2015
. The details of the secured debt repaid in
2015
and
2016
are shown in the following table:
|
SECURED DEBT REPAID IN 2015 AND 2016
|
Interest Rate
|
Date Repaid
|
Payoff Amount
|
|||||
|
(In thousands)
|
||||||||
|
Beltway II-IV, Commerce Park I, Eastlake, Fairgrounds, Nations Ford,
Techway Southwest III, Wetmore 1-4 and World Houston 15 & 22 |
5.50%
|
03/06/2015
|
$
|
57,450
|
|
|||
|
Country Club I, Lake Pointe, Techway Southwest II and
World Houston 19 & 20 |
4.98%
|
11/06/2015
|
24,403
|
|
||||
|
Weighted Average/Total Amount for 2015
|
5.34%
|
$
|
81,853
|
|
||||
|
Huntwood and Wiegman I
|
5.68%
|
08/05/2016
|
$
|
24,543
|
|
|||
|
Alamo Downs, Arion 1-15 & 17, Rampart I-IV, Santan 10 I and
World Houston 16 |
5.97%
|
09/06/2016
|
51,194
|
|
||||
|
Weighted Average/Total Amount for 2016
|
5.88%
|
$
|
75,737
|
|
||||
|
Weighted Average/Total Amount for 2015 and 2016
|
5.60%
|
$
|
157,590
|
|
||||
During 2016 and 2015, EastGroup did not obtain any new secured debt.
Interest costs during the period of construction of real estate properties are capitalized and offset against interest expense. Capitalized interest increased $83,000 for
2016
as compared to
2015
.
Depreciation and amortization
expense increased $4,645,000 for
2016
compared to
2015
primarily due to the operating properties acquired by the Company during 2015 and 2016 and the properties transferred from
Development
in 2015 and 2016, partially offset by operating properties sold in 2015 and 2016.
General and administrative
expense decreased $1,859,000 for the year ended December 31, 2016, as compared to 2015. The decrease was primarily due to additional expenses recorded in 2015 for the accelerated restricted stock vestings for the Company's Chief Financial Officer (CFO) and former Chief Executive Officer (CEO) and various costs associated with the CEO transition.
26
Gain, net of loss, on sales of real estate investments,
which includes gains on the sales of operating properties, increased $39,267,000 for 2016 as compared to 2015. Gain on sales of non-operating real estate (included in
Other
on the Consolidated Statements of Income and Comprehensive Income) increased $610,000 for 2016 as compared to 2015. The Company's 2015 and 2016 sales transactions are described below in
Real Estate Sold and Held for Sale/Discontinued Operations.
Capital Expenditures
Capital expenditures for EastGroup’s operating properties for the years ended December 31,
2016
and
2015
were as follows:
|
|
Estimated
Useful Life
|
Years Ended December 31,
|
||||||
|
2016
|
2015
|
|||||||
|
|
(In thousands)
|
|||||||
|
Upgrade on Acquisitions
|
40 yrs
|
$
|
394
|
|
5
|
|
||
|
Tenant Improvements:
|
|
|
|
|||||
|
New Tenants
|
Lease Life
|
9,976
|
|
10,100
|
|
|||
|
Renewal Tenants
|
Lease Life
|
2,748
|
|
1,936
|
|
|||
|
Other:
|
|
|
|
|
|
|||
|
Building Improvements
|
5-40 yrs
|
5,113
|
|
4,599
|
|
|||
|
Roofs
|
5-15 yrs
|
2,785
|
|
7,562
|
|
|||
|
Parking Lots
|
3-5 yrs
|
1,377
|
|
808
|
|
|||
|
Other
|
5 yrs
|
764
|
|
768
|
|
|||
|
Total Capital Expenditures
(1)
|
|
$
|
23,157
|
|
25,778
|
|
||
|
(1)
|
Reconciliation of Total Capital Expenditures to Real Estate Improvements on the Consolidated Statements of Cash Flows:
|
|
|
Years Ended December 31,
|
||||||
|
2016
|
2015
|
||||||
|
(In thousands)
|
|||||||
|
Total Capital Expenditures
|
$
|
23,157
|
|
25,778
|
|
||
|
Change in Real Estate Property Payables
|
514
|
|
(1,264
|
)
|
|||
|
Real Estate Improvements
|
$
|
23,671
|
|
24,514
|
|
||
Capitalized Leasing Costs
The Company’s leasing costs (principally commissions) are capitalized and included in
Other assets
. The costs are amortized over the terms of the associated leases and are included in
Depreciation and amortization
expense. Capitalized leasing costs for the years ended December 31,
2016
and
2015
were as follows:
|
|
Estimated
Useful Life
|
Years Ended December 31,
|
||||||
|
2016
|
2015
|
|||||||
|
|
(In thousands)
|
|||||||
|
Development
|
Lease Life
|
$
|
4,217
|
|
3,824
|
|
||
|
New Tenants
|
Lease Life
|
5,273
|
|
3,893
|
|
|||
|
Renewal Tenants
|
Lease Life
|
4,978
|
|
3,773
|
|
|||
|
Total Capitalized Leasing Costs
|
|
$
|
14,468
|
|
11,490
|
|
||
|
Amortization of Leasing Costs
|
|
$
|
9,932
|
|
9,038
|
|
||
Real Estate Sold and Held for Sale/Discontinued Operations
The Company considers a real estate property to be held for sale when it meets the criteria established under ASC 360,
Property, Plant and Equipment,
including when it is probable that the property will be sold within a year. Real estate properties held for sale are reported at the lower of the carrying amount or fair value less estimated costs to sell and are not depreciated while they are held for sale.
In accordance with FASB Accounting Standards Update (ASU) 2014-08,
Presentation of Financial Statements (Topic 205) and Property, Plant, and Equipment (Topic 360), Reporting Discontinued Operations and Disclosures of Disposals of Components of an Entity,
the Company would report a disposal of a component of an entity or a group of components of an entity in discontinued
27
operations if the disposal represents a strategic shift that has (or will have) a major effect on an entity's operations and financial results when the component or group of components meets the criteria to be classified as held for sale or when the component or group of components is disposed of by sale or other than by sale. In addition, the Company would provide additional disclosures about both discontinued operations and the disposal of an individually significant component of an entity that does not qualify for discontinued operations presentation in the financial statements. EastGroup performs an analysis of properties sold to determine whether the sales qualify for discontinued operations presentation.
The Company did not classify any properties as held for sale as of December 31,
2016
and
2015
.
The Company does not consider its sales in 2015 and 2016 to be disposals of a component of an entity or a group of components of an entity representing a strategic shift that has (or will have) a major effect on the entity's operations and financial results.
During
2016
, EastGroup sold the following operating properties: Northwest Point Distribution and Service Centers, North Stemmons II and III, America Plaza, Lockwood Distribution Center, West Loop Distribution Center 1 & 2, two of its four Interstate Commons Distribution Center buildings, Castilian Research Center and Memphis I. The properties, which contain
1,256,000
square feet and are located in Houston, Dallas, Phoenix, Santa Barbara and Memphis, were sold for $75.7 million and the Company recognized net gains on the sales of $42.2 million. The Company also sold 25 acres of land in Dallas, Orlando and Houston for $5.4 million and recognized gains on sales of $733,000.
During 2015, EastGroup sold one operating property, the last of its three Ambassador Row Warehouses in Dallas containing 185,000 square feet, for $5.3 million and recognized a gain on the sale of $2.9 million. The Company also sold a small parcel of land in New Orleans for $170,000 and recognized a gain of $123,000.
The gains on the sales of land are included in
Other
on the Consolidated Statements of Income and Comprehensive Income, and the gains (losses) on the sales of operating properties are included in
Gain, net of loss, on sales of real estate investments
. See Notes 1(f) and 2 in the Notes to Consolidated Financial Statements for more information related to discontinued operations and gains on sales of real estate investments.
2015
Compared to
2014
Net Income Attributable to EastGroup Properties, Inc. Common Stockholders
for
2015
was
$47,866,000
(
$1.49
per basic and diluted share) compared to
$47,941,000
(
$1.53
per basic and
$1.52
per diluted share) for
2014
. EastGroup recognized
Gain on sales of real estate investments
of
$2,903,000
during
2015
and
$9,188,000
during
2014
.
PNOI increased by $10,657,000, or 6.8%, for
2015
compared to
2014
. PNOI increased $6,321,000 from newly developed properties, $3,030,000 from same property operations and $2,607,000 from
2014
and
2015
acquisitions; PNOI decreased $1,266,000 from properties sold in 2014 and 2015 and $68,000 from a property undergoing redevelopment. Lease termination fee income was $225,000 and $1,205,000 in
2015
and
2014
, respectively. The Company recorded net bad debt expense of $747,000 in
2015
and net bad debt recoveries of $4,000 in
2014
. Straight-lining of rent increased
Income from real estate operations
by $1,889,000 and $1,679,000 in
2015
and
2014
, respectively.
The Company signed 164 leases with certain free rent concessions on 3,678,000 square feet during
2015
with total free rent concessions of $4,024,000 over the lives of the leases, compared to 157 leases with free rent concessions on 3,274,000 square feet with total free rent concessions of $3,816,000 over the lives of the leases in
2014
.
Property expense to revenue ratios were 28.7% in
2015
compared to 28.6% in
2014
. The Company’s percentage of leased square footage was 97.2% at December 31,
2015
, compared to 96.7% at December 31,
2014
. Occupancy at the end of
2015
was 96.1% compared to 96.3% at the end of
2014
.
28
Interest expense
decreased
$820,000
in
2015
compared to
2014
. The following table presents the components of
Interest expense
for
2015
and
2014
:
|
|
Years Ended December 31,
|
||||||||
|
2015
|
2014
|
Increase (Decrease)
|
|||||||
|
(In thousands)
|
|||||||||
|
VARIABLE RATE INTEREST EXPENSE
|
|
|
|
|
|
|
|||
|
Unsecured bank credit facilities interest - variable rate
(excluding amortization of facility fees and debt issuance costs)
|
$
|
1,420
|
|
1,280
|
|
140
|
|
||
|
Amortization of facility fees - unsecured bank credit facilities
|
608
|
|
563
|
|
45
|
|
|||
|
Amortization of debt issuance costs - unsecured bank credit facilities
|
493
|
|
413
|
|
80
|
|
|||
|
Total variable rate interest expense
|
2,521
|
|
2,256
|
|
265
|
|
|||
|
FIXED RATE INTEREST EXPENSE
|
|
|
|
|
|
|
|||
|
Unsecured debt interest
(1)
(excluding amortization of debt issuance costs)
|
15,498
|
|
11,649
|
|
3,849
|
|
|||
|
Secured debt interest
(excluding amortization of debt issuance costs)
|
21,061
|
|
25,700
|
|
(4,639
|
)
|
|||
|
Amortization of debt issuance costs - unsecured debt
|
422
|
|
302
|
|
120
|
|
|||
|
Amortization of debt issuance costs - secured debt
|
421
|
|
521
|
|
(100
|
)
|
|||
|
Total fixed rate interest expense
|
37,402
|
|
38,172
|
|
(770
|
)
|
|||
|
Total interest
|
39,923
|
|
40,428
|
|
(505
|
)
|
|||
|
Less capitalized interest
|
(5,257
|
)
|
(4,942
|
)
|
(315
|
)
|
|||
|
TOTAL INTEREST EXPENSE
|
$
|
34,666
|
|
35,486
|
|
(820
|
)
|
||
|
(1)
|
Includes interest on the Company's unsecured debt with fixed interest rates per the debt agreements or effectively fixed interest rates due to interest rate swaps, as discussed in Note 13 in the Notes to Consolidated Financial Statements.
|
EastGroup's variable rate interest expense increased by $265,000 for
2015
as compared to
2014
primarily due to an increase in the Company's average unsecured bank credit facilities borrowings as shown in the following table:
|
|
Years Ended December 31,
|
|||||||||
|
|
2015
|
2014
|
Increase
(Decrease)
|
|||||||
|
|
(In thousands, except rates of interest)
|
|||||||||
|
Average borrowings on unsecured bank credit facilities - variable rate
|
$
|
109,777
|
|
96,162
|
|
13,615
|
|
|||
|
Weighted average variable interest rates
(excluding amortization of facility fees and debt issuance costs)
|
1.29
|
%
|
1.33
|
%
|
|
|
||||
The Company's fixed rate interest expense decreased by $770,000 for
2015
as compared to
2014
. The decrease was primarily due to a decrease in secured debt interest, partially offset by an increase in unsecured debt interest. The changes resulted from the Company's debt activity described below.
The decrease in secured debt interest resulted from regularly scheduled principal payments and debt repayments. Regularly scheduled principal payments on secured debt were $20,484,000 during
2015
and $22,269,000 in
2014
. The details of the secured debt repaid in
2014
and
2015
are shown in the following table:
29
|
SECURED DEBT REPAID IN 2014 AND 2015
|
Interest Rate
|
Date Repaid
|
Payoff Amount
|
|||||
|
(In thousands)
|
||||||||
|
Kyrene Distribution Center
|
9.00%
|
06/30/2014
|
$
|
11
|
|
|||
|
Americas Ten I, Kirby, Palm River North I, II & III, Shady Trail,
Westlake I & II and World Houston 17
|
5.68%
|
07/10/2014
|
26,565
|
|
||||
|
Weighted Average/Total Amount for 2014
|
5.68%
|
$
|
26,576
|
|
||||
|
Beltway II-IV, Commerce Park I, Eastlake, Fairgrounds, Nations Ford,
Techway Southwest III, Wetmore 1-4 and World Houston 15 & 22
|
5.50%
|
03/06/2015
|
$
|
57,450
|
|
|||
|
Country Club I, Lake Pointe, Techway Southwest II and
World Houston 19 & 20
|
4.98%
|
11/06/2015
|
24,403
|
|
||||
|
Weighted Average/Total Amount for 2015
|
5.34%
|
$
|
81,853
|
|
||||
|
Weighted Average/Total Amount for 2014 and 2015
|
5.43%
|
$
|
108,429
|
|
||||
During 2015, EastGroup did not obtain any new secured debt; in 2014, the Company assumed the secured debt detailed in the following table:
|
NEW SECURED DEBT IN 2014
|
Effective Interest Rate
|
Date Obtained
|
Maturity Date
|
Amount
|
||||||
|
(In thousands)
|
||||||||||
|
Ramona Distribution Center
(1)
|
3.85%
|
12/19/2014
|
11/30/2026
|
$
|
2,847
|
|
||||
|
(1)
|
In connection with the acquisition of Ramona Distribution Center, the Company assumed a mortgage of $2,617,000 and recorded a premium of $230,000 to adjust the mortgage loan assumed to fair value. This premium is being amortized over the remaining life of the mortgage.
|
The decrease in secured debt interest was partially offset by an increase in unsecured debt interest resulting from the Company's unsecured debt activity described below. The details of the unsecured debt obtained in
2014
and
2015
are shown in the following table:
|
NEW UNSECURED DEBT IN 2014 and 2015
|
Effective Interest Rate
|
Date Obtained
|
Maturity Date
|
Amount
|
||||||
|
(In thousands)
|
||||||||||
|
$75 Million Unsecured Term Loan
(1)
|
2.846%
|
07/31/2014
|
07/31/2019
|
$
|
75,000
|
|
||||
|
$75 Million Unsecured Term Loan
(2)
|
3.031%
|
03/02/2015
|
02/28/2022
|
$
|
75,000
|
|
||||
|
$25 Million Senior Unsecured Notes
|
3.970%
|
10/01/2015
|
10/01/2025
|
25,000
|
|
|||||
|
$50 Million Senior Unsecured Notes
|
3.990%
|
10/07/2015
|
10/07/2025
|
50,000
|
|
|||||
|
Weighted Average/Total Amount for 2015
|
3.507%
|
$
|
150,000
|
|
||||||
|
Weighted Average/Total Amount for 2014 and 2015
|
3.287%
|
$
|
225,000
|
|
||||||
|
(1)
|
The interest rate on this unsecured term loan is comprised of LIBOR plus 115 basis points subject to a pricing grid for changes in the Company's coverage ratings. The Company entered into an interest rate swap to convert the loan's LIBOR rate to a fixed interest rate, providing the Company a weighted average effective interest rate on the term loan of 2.846% for all applicable periods presented. See Note 13 in the Notes to Consolidated Financial Statements for additional information on the interest rate swaps.
|
|
(2)
|
The interest rate on this unsecured term loan is comprised of LIBOR plus 140 basis points subject to a pricing grid for changes in the Company's coverage ratings. The Company entered into an interest rate swap to convert the loan's LIBOR rate to a fixed interest rate, providing the Company a weighted average effective interest rate on the term loan of 3.031% for all applicable periods presented. See Note 13 in the Notes to Consolidated Financial Statements for additional information on the interest rate swaps.
|
Interest costs during the period of construction of real estate properties are capitalized and offset against interest expense. Capitalized interest increased $315,000 for
2015
as compared to
2014
.
Depreciation and amortization
expense increased $2,976,000 for
2015
compared to
2014
primarily due to the operating properties acquired by the Company in 2014 and 2015 and the properties transferred from
Development
in 2014 and 2015.
General and administrative
expense increased $2,365,000 for the year ended December 31,
2015
, as compared to
2014
. The increase was primarily due to accelerated restricted stock vesting for the Company's CFO and former CEO and various costs associated with the CEO succession.
30
Capital Expenditures
Capital expenditures for EastGroup’s operating properties for the years ended December 31,
2015
and
2014
were as follows:
|
|
Estimated
Useful Life
|
Years Ended December 31,
|
||||||
|
2015
|
2014
|
|||||||
|
|
(In thousands)
|
|||||||
|
Upgrade on Acquisitions
|
40 yrs
|
$
|
5
|
|
246
|
|
||
|
Tenant Improvements:
|
|
|||||||
|
New Tenants
|
Lease Life
|
10,100
|
|
8,274
|
|
|||
|
Renewal Tenants
|
Lease Life
|
1,936
|
|
2,828
|
|
|||
|
Other:
|
|
|
|
|
|
|||
|
Building Improvements
|
5-40 yrs
|
4,599
|
|
3,339
|
|
|||
|
Roofs
|
5-15 yrs
|
7,562
|
|
4,367
|
|
|||
|
Parking Lots
|
3-5 yrs
|
808
|
|
503
|
|
|||
|
Other
|
5 yrs
|
768
|
|
305
|
|
|||
|
Total Capital Expenditures
(1)
|
|
$
|
25,778
|
|
19,862
|
|
||
|
(1)
|
Reconciliation of Total Capital Expenditures to Real Estate Improvements on the Consolidated Statements of Cash Flows:
|
|
|
Years Ended December 31,
|
||||||
|
2015
|
2014
|
||||||
|
(In thousands)
|
|||||||
|
Total Capital Expenditures
|
$
|
25,778
|
|
19,862
|
|
||
|
Change in Real Estate Property Payables
|
(1,264
|
)
|
662
|
|
|||
|
Real Estate Improvements
|
$
|
24,514
|
|
20,524
|
|
||
Capitalized Leasing Costs
The Company’s leasing costs (principally commissions) are capitalized and included in
Other assets
. The costs are amortized over the terms of the associated leases and are included in
Depreciation and amortization
expense. Capitalized leasing costs for the years ended December 31,
2015
and
2014
were as follows:
|
|
Estimated
Useful Life
|
Years Ended December 31,
|
||||||
|
2015
|
2014
|
|||||||
|
|
(In thousands)
|
|||||||
|
Development
|
Lease Life
|
$
|
3,824
|
|
2,866
|
|
||
|
New Tenants
|
Lease Life
|
3,893
|
|
3,823
|
|
|||
|
Renewal Tenants
|
Lease Life
|
3,773
|
|
5,469
|
|
|||
|
Total Capitalized Leasing Costs
|
|
$
|
11,490
|
|
12,158
|
|
||
|
Amortization of Leasing Costs
|
|
$
|
9,038
|
|
8,284
|
|
||
Real Estate Held for Sale/Discontinued Operations
During 2015, EastGroup sold one operating property, the last of its three Ambassador Row Warehouses in Dallas containing 185,000 square feet, for $5.3 million and recognized a gain on the sale of $2.9 million. The Company also sold a small parcel of land in New Orleans for $170,000 and recognized a gain of $123,000.
During 2014, the Company sold the following properties: Northpoint Commerce Center in Oklahoma City, Tampa West Distribution Center VI in Tampa, Clay Campbell Distribution Center and Kirby Business Center in Houston, and two of its three Ambassador Row Warehouses in Dallas. EastGroup sold the properties for $21.4 million and recognized gains on the sales of $9.2 million. The Company also sold a small parcel of land in Orlando for $141,000 and recognized a gain of $98,000.
The gains on the sales of land are included in
Other
on the Consolidated Statements of Income and Comprehensive Income, and the gains (losses) on the sales of operating properties are included in
Gain, net of loss, on sales of real estate investments
. See Notes 1(f) and 2 in the Notes to Consolidated Financial Statements for more information related to discontinued operations and gains on sales of real estate investments.
31
RECENT ACCOUNTING PRONOUNCEMENTS
EastGroup has evaluated all ASUs recently released by the FASB through the date the financial statements were issued and determined that the following ASUs apply to the Company.
In May 2014, the FASB issued ASU 2014-09,
Revenue from Contracts with Customers,
which requires an entity to recognize the amount of revenue to which it expects to be entitled for the transfer of promised goods or services to customers. The FASB issued further guidance in ASU 2016-12,
Revenue from Contracts with Customers (Topic 606): Narrow-Scope Improvements and Practical Expedients,
that provides clarifying guidance in certain narrow areas and adds some practical expedients. ASU 2014-09 will replace most existing revenue recognition guidance in U.S. GAAP when it becomes effective. The effective date of ASU 2014-09 was extended by one year by ASU 2015-14,
Revenue from Contracts with Customers (Topic 606): Deferral of the Effective Date.
The new standard is effective for the Company on January 1, 2018. The standard permits the use of either the retrospective or cumulative effect transition method, and the Company is evaluating which transition method it will elect. The Company is also in the process of evaluating the effect that ASU 2014-09 will have on its consolidated financial statements and related disclosures beginning with the Form 10-Q for the period ending March 31, 2018. EastGroup has performed an initial impact assessment; because most of the Company's revenues are from leases (which are governed by other FASB accounting standards) and sales of real estate assets (for which the accounting is largely unchanged by the new revenue recognition standard), the impact of adopting ASU 2014-09 is not expected to be material to the Company.
In February 2015, the FASB issued ASU 2015-02,
Consolidation (Topic 810): Amendments to Consolidation Analysis,
under which all legal entities are subject to reevaluation under the revised consolidation model. The ASU modifies whether limited partnerships and similar legal entities are variable interest entities (VIEs) or voting interest entities, eliminates the presumption that a general partner should consolidate a limited partnership, affects the consolidation analysis of reporting entities that are involved with VIEs, and provides a scope exception from consolidation guidance for reporting entities with interests in legal entities that are required to comply with or operate in accordance with requirements that are similar to those in Rule 2a-7 of the Investment Company Act of 1940 for registered money market funds. EastGroup adopted ASU 2015-02 effective January 1, 2016, and the adoption of ASU 2015-02 had an immaterial impact on the Company's financial condition and results of operations.
In April 2015, the FASB issued ASU 2015-03,
Simplifying the Presentation of Debt Issuance Costs
, which requires that debt issuance costs related to a recognized debt liability be presented in the balance sheet as a direct deduction from the carrying amount of that debt liability. For public business entities, the ASU was effective for financial statements issued for fiscal years beginning after December 15, 2015, and interim periods within those fiscal years. Entities are to apply the new guidance on a retrospective basis, wherein the balance sheet of each individual period presented should be adjusted to reflect the period-specific effects of applying the new guidance. EastGroup adopted ASU 2015-03 effective January 1, 2016. Prior to adoption, the Company included debt issuance costs in
Other assets
on the Consolidated Balance Sheets. Beginning with the Form 10-Q for the period ended March 31, 2016, EastGroup changed its presentation of debt issuance costs for all periods presented; the Company now presents debt issuance costs as direct deductions from the carrying amounts of its debt liabilities both on the Balance Sheet and in the Notes to Consolidated Financial Statements. As a result of the adoption of ASU 2015-03, the Company adjusted its December 31, 2015 Balance Sheet as follows:
|
Balance Sheet Items as of December 31, 2015:
|
As Presented in the Company’s 2015 Form 10-K
|
As Presented in the Company’s Form 10-Q Beginning With the Period Ended March 31, 2016
|
|||||
|
(In thousands)
|
|||||||
|
Other assets
|
$
|
96,186
|
|
91,858
|
|
||
|
Total assets
|
1,666,232
|
|
1,661,904
|
|
|||
|
Secured debt
|
351,401
|
|
350,285
|
|
|||
|
Unsecured debt
|
530,000
|
|
528,210
|
|
|||
|
Unsecured bank credit facilities
|
150,836
|
|
149,414
|
|
|||
|
Total liabilities
|
1,107,031
|
|
1,102,703
|
|
|||
|
Total liabilities and equity
|
1,666,232
|
|
1,661,904
|
|
|||
In January 2016, the FASB issued ASU 2016-01,
Financial Instruments - Overall (Subtopic 825-10): Recognition and Measurement of Financial Assets and Financial Liabilities,
which requires public business entities to use the exit price notion when measuring the fair value of financial instruments for disclosure purposes, requires separate presentation of financial assets and financial liabilities by measurement category and form of financial asset, and eliminates the requirement for public business entities to disclose the methods and significant assumptions used to estimate the fair value that is required to be disclosed for financial
32
instruments measured at amortized costs on the balance sheet. EastGroup plans to adopt ASU 2016-01 effective January 1, 2018. The Company does not anticipate the adoption of ASU 2016-01 will have a material impact on the Company's financial condition or results of operations.
In February 2016, the FASB issued ASU 2016-02,
Leases (Topic 842),
which requires lessees to recognize the following for all leases (with the exception of short-term leases) at the commencement date: (1) a lease liability, which is a lessee's obligation to make lease payments arising from a lease, measured on a discounted basis; and (2) a right-of-use asset, which is an asset that represents the lessee's right to use, or control the use of, a specified asset for the lease term. The Company is a lessee on a limited number of leases, including office and ground leases, and the Company anticipates the related impact of ASU 2016-02 will not be material to its overall financial condition and results of operations. Lessor accounting is largely unchanged under ASU 2016-02. The Company's primary revenue is rental income; as such, the Company is a lessor on a significant number of leases. The Company is continuing to evaluate the potential impacts of the ASU and believes it will continue to account for its leases in substantially the same manner. The most significant change for the Company related to lessor accounting relates to the new standard's narrow definition of initial direct costs for leases; the new definition will result in certain costs (primarily legal costs related to lease negotiations) being expensed rather than capitalized upon adoption of the new standard. Public business entities are required to apply the amendments in ASU 2016-02 for fiscal years beginning after December 15, 2018, including interim periods within those fiscal years. EastGroup plans to adopt ASU 2016-02 effective January 1, 2019. The Company is continuing the process of evaluating and quantifying the effect that ASU 2016-02 will have on its consolidated financial statements and related disclosures beginning with the Form 10-Q for the period ending March 31, 2019.
In March 2016, the FASB issued ASU 2016-09,
Compensation - Stock Compensation (Topic 718): Improvements to Employee Share-Based Payment Accounting
. The ASU is intended to improve the accounting for share-based payments and affects all organizations that issue share-based payment awards to their employees. Several aspects of the accounting for share-based payment awards are simplified with the ASU, including income tax consequences, classification of awards as equity or liabilities and classification on the Consolidated Statements of Cash Flows. ASU 2016-09 is effective for public business entities for annual periods beginning after December 15, 2016, and interim periods within those fiscal years; early adoption is permitted. EastGroup adopted ASU 2016-09 effective January 1, 2017. As a result, the Company will elect to reverse compensation cost of any forfeited awards when they occur and will continue to classify the cash flows resulting from remitting cash to the tax authorities for the payment of taxes on the vesting of share-based payment awards as a financing activity on the Consolidated Statements of Cash Flows. In addition, upon vesting of share-based payments, the Company will withhold up to the maximum individual statutory tax rate and classify the entire award as equity. The adoption of ASU 2016-09 did not have a material impact on the Company's financial condition or results of operations.
In August 2016, the FASB issued ASU 2016-15,
Statement of Cash Flows (Topic 230): Classification of Certain Cash Receipts and Cash Payments,
which addresses certain cash flow issues, including how debt prepayments or debt extinguishment costs and distributions received from equity method investees are presented. ASU 2016-15 is effective for public business entities for annual periods beginning after December 15, 2017, and interim periods within those fiscal years. Early adoption is permitted, and the Company has adopted ASU 2016-15 effective January 1, 2017 and will provide the necessary disclosures beginning with its Form 10-Q for the period ending March 31, 2017. The Company does not believe the adoption of ASU 2016-15 has a material impact on the Company's financial condition or results of operations.
In January 2017, the FASB issued ASU 2017-01,
Business Combinations (Topic 805): Clarifying the Definition of a Business
. The ASU is intended to provide a new framework for determining whether transactions should be accounted for as acquisitions (or disposals) of assets or businesses. Under the new guidance, companies are required to utilize an initial screening test to determine whether substantially all of the fair value of the gross assets acquired (or disposed of) is concentrated in a single identifiable asset or a group of similar identifiable assets; if so, the set is not a business. The Company has determined that some of its real estate property acquisitions may be considered to be acquisitions of groups of similar identifiable assets; therefore, the acquisitions are not considered to be acquisitions of a business. ASU 2017-01 is effective for public business entities for annual periods beginning after December 15, 2017, and interim periods within those fiscal years; early adoption is permitted and may be applied to transactions that have not been reported in financial statements that have been issued or made available for issuance. EastGroup adopted ASU 2017-01 for transactions beginning on October 1, 2016. As a result, the Company has capitalized acquisition costs related to its fourth quarter 2016 acquisitions as they were determined not to be acquisitions of a business.
In January 2017, the FASB issued ASU 2017-04,
Intangibles - Goodwill and Others (Topic 350): Simplifying the Test for Goodwill Impairment,
which simplifies the measurement of goodwill impairment by eliminating the requirement of performing a hypothetical purchase price allocation to measure goodwill impairment. ASU 2017-04 is effective for public business entities for annual periods beginning after December 15, 2019, and interim periods within those fiscal years. Early adoption is permitted, and the Company has adopted ASU 2017-04 effective January 1, 2017, and will apply the new guidance for goodwill impairment tests with
33
measurement dates after January 1, 2017. EastGroup does not believe the adoption of ASU 2017-04 has a material impact on the Company's financial condition or results of operations.
LIQUIDITY AND CAPITAL RESOURCES
Net cash provided by operating activities was
$138,864,000
for the year ended
December 31, 2016
. The primary other sources of cash were from borrowings on unsecured bank credit facilities; proceeds from unsecured debt; net proceeds from sales of real estate investments and non-operating real estate; and proceeds from common stock offerings. The Company distributed
$80,899,000
in common stock dividends during
2016
. Other primary uses of cash were for repayments on unsecured bank credit facilities, unsecured debt and secured debt; development of properties; purchases of real estate; and capital improvements at various properties.
Total debt at
December 31, 2016
and
2015
is detailed below. The Company’s unsecured bank credit facilities and unsecured debt instruments have certain restrictive covenants, such as maintaining debt service coverage and leverage ratios and maintaining insurance coverage, and the Company was in compliance with all of its debt covenants at
December 31, 2016
and
2015
.
|
|
December 31,
|
|||||
|
2016
|
2015
|
|||||
|
(In thousands)
|
||||||
|
Unsecured bank credit facilities - variable rate, carrying amount
|
$
|
112,020
|
|
150,836
|
|
|
|
Unsecured bank credit facilities - fixed rate, carrying amount
(1)
|
80,000
|
|
—
|
|
||
|
Unamortized debt issuance costs
|
(1,030
|
)
|
(1,422
|
)
|
||
|
Unsecured bank credit facilities
|
190,990
|
|
149,414
|
|
||
|
Unsecured debt - fixed rate, carrying amount
(1)
|
655,000
|
|
530,000
|
|
||
|
Unamortized debt issuance costs
|
(2,162
|
)
|
(1,790
|
)
|
||
|
Unsecured debt
|
652,838
|
|
528,210
|
|
||
|
Secured debt - fixed rate, carrying amount
(1)
|
258,594
|
|
351,401
|
|
||
|
Unamortized debt issuance costs
|
(1,089
|
)
|
(1,116
|
)
|
||
|
Secured debt
|
257,505
|
|
350,285
|
|
||
|
Total debt
|
$
|
1,101,333
|
|
1,027,909
|
|
|
|
(1)
|
These loans have a fixed interest rate or an effectively fixed interest rate due to interest rate swaps.
|
EastGroup has a $300 million unsecured revolving credit facility with a group of nine banks that matures in July 2019. The credit facility contains options for a one-year extension (at the Company's election) and a $150 million expansion (with agreement by all parties). The interest rate on each tranche is usually reset on a monthly basis and as of
December 31, 2016
, was LIBOR plus 100 basis points with an annual facility fee of 20 basis points. The margin and facility fee are subject to changes in the Company's credit ratings. The Company has designated an interest rate swap to an $80 million unsecured bank credit facility draw that effectively fixes the interest rate on the $80 million draw to 2.020% through the interest rate swap's maturity date of August 15, 2018. As of
December 31, 2016
, EastGroup had an additional $95,000,000 of variable rate borrowings on this unsecured bank credit facility with a weighted average interest rate of 1.731%.
The Company also has a $35 million unsecured revolving credit facility that matures in July 2019. This credit facility automatically extends for one year if the extension option in the $300 million revolving credit facility is exercised. The interest rate is reset on a daily basis and as of
December 31, 2016
, was LIBOR plus 100 basis points with an annual facility fee of 20 basis points. The margin and facility fee are subject to changes in the Company's credit ratings. At
December 31, 2016
, the interest rate was 1.772% on a balance of $17,020,000.
As market conditions permit, EastGroup issues equity and/or employs fixed-rate debt, including variable-rate debt that has been swapped to an effectively fixed rate through the use of interest rate swaps, to replace the short-term bank borrowings. The Company believes its current operating cash flow and unsecured bank credit facilities provide the capacity to fund the operations of the Company. The Company also believes it can obtain debt financing and issue common and/or preferred equity. For future debt issuances, the Company intends to issue primarily unsecured fixed-rate debt, including variable-rate debt that has been swapped
34
to an effectively fixed rate through the use of interest rate swaps. The Company may also access the public debt market in the future as a means to raise capital.
On February 19, 2014, EastGroup entered into Sales Agency Financing Agreements with BNY Mellon Capital Markets, LLC, Raymond James & Associates, Inc., and Merrill Lynch, Pierce, Fenner & Smith Incorporated pursuant to which it may issue and sell up to 10,000,000 shares of its common stock from time to time. During
2016
, the Company issued and sold
875,052
shares of common stock under its continuous equity program at an average price of $68.57 per share with gross proceeds to the Company of $60,000,000. The Company incurred offering-related costs of $717,000 during the year, resulting in net proceeds to the Company of
$59,283,000
. As of
February 15, 2017
, the Company has
7,771,797
shares of common stock remaining to sell under the program.
In April 2016, EastGroup closed a $65 million senior unsecured term loan with a seven-year term and interest only payments. It bears interest at the annual rate of LIBOR plus an applicable margin (currently 1.65%) based on the Company's senior unsecured long-term debt rating. The Company also entered into an interest rate swap agreement to convert the loan's LIBOR rate component to a fixed interest rate for the entire term of the loan providing a total effective fixed interest rate of 2.863%.
In July 2016, EastGroup closed a $40 million senior unsecured term loan with a five-year term and interest only payments. It bears interest at the annual rate of LIBOR plus an applicable margin (currently 1.10%) based on the Company's senior unsecured long-term debt rating. The Company also entered into an interest rate swap agreement to convert the loan's LIBOR rate component to a fixed interest rate for the entire term of the loan providing a total effective fixed interest rate of 2.335%.
In December 2016, the Company closed two senior unsecured private placement notes totaling $100 million. The $60 million notes has an eight-year term and an interest rate of 3.48% with semi-annual interest payments. The $40 million note has a ten-year term and an interest rate of 3.75% with semi-annual interest paym
ents. The notes will not be and have not been registered under the Securities Act of 1933, as amended, and may not be offered or sold in the United States absent registration or an applicable exemption from the registration requirements.
In August 2016, EastGroup repaid (with no penalty) a mortgage loan with a balance of $24.5 million, an interest rate of 5.68%, and an original maturity date of September 5, 2016. In September 2016, the Company repaid (with no penalty) a mortgage loan with a balance of $51.2 million, an interest rate of 5.97% and an original maturity date of October 5, 2016.
In August 2016, EastGroup repaid (with no penalty) an $80 million unsecured term loan with an effectively fixed interest rate of 2.770% and an original maturity date of August 15, 2018. On the same day, the Company borrowed $80 million through its $300 million unsecured bank credit facility (as discussed above); the maturity date for the credit facility is July 30, 2019. The Company re-designated the interest rate swap that was previously applied to the $80 million unsecured term loan to the $80 million unsecured bank credit facility borrowing. The $80 million unsecured bank credit facility draw has an effectively fixed interest rate of 2.020% through the interest rate swap's maturity date of August 15, 2018.
35
Contractual Obligations
EastGroup’s fixed, non-cancelable obligations as of
December 31, 2016
were as follows:
|
|
Payments Due by Period
|
||||||||||||||
|
Total
|
Less Than
1 Year
|
1-3 Years
|
3-5 Years
|
More Than
5 Years
|
|||||||||||
|
(In thousands)
|
|||||||||||||||
|
Unsecured Bank Credit Facilities
(1)
(2)
|
$
|
192,020
|
|
—
|
|
192,020
|
|
—
|
|
—
|
|
||||
|
Interest on Unsecured Bank Credit Facilities
(3)
|
11,025
|
|
4,232
|
|
6,793
|
|
—
|
|
—
|
|
|||||
|
Unsecured Debt
(1)
|
655,000
|
|
—
|
|
125,000
|
|
145,000
|
|
385,000
|
|
|||||
|
Interest on Unsecured Debt
|
129,322
|
|
22,347
|
|
41,780
|
|
31,727
|
|
33,468
|
|
|||||
|
Secured Debt
(1)
|
258,594
|
|
58,237
|
|
66,885
|
|
98,659
|
|
34,813
|
|
|||||
|
Interest on Secured Debt
|
39,087
|
|
12,623
|
|
17,667
|
|
8,327
|
|
470
|
|
|||||
|
Operating Lease Obligations:
|
|
|
|
|
|
|
|
|
|
|
|||||
|
Office Leases
|
698
|
|
341
|
|
188
|
|
149
|
|
20
|
|
|||||
|
Ground Leases
|
14,210
|
|
756
|
|
1,512
|
|
1,512
|
|
10,430
|
|
|||||
|
Real Estate Property Obligations
(4)
|
1,155
|
|
1,155
|
|
—
|
|
—
|
|
—
|
|
|||||
|
Development Obligations
(5)
|
25,453
|
|
25,453
|
|
—
|
|
—
|
|
—
|
|
|||||
|
Tenant Improvements
(6)
|
12,768
|
|
12,768
|
|
—
|
|
—
|
|
—
|
|
|||||
|
Purchase Obligations
|
340
|
|
100
|
|
240
|
|
—
|
|
—
|
|
|||||
|
Total
|
$
|
1,339,672
|
|
138,012
|
|
452,085
|
|
285,374
|
|
464,201
|
|
||||
|
(1)
|
These amounts are included on the Consolidated Balance Sheets net of unamortized debt issuance costs.
|
|
(2)
|
The Company’s balances under its unsecured bank credit facilities change depending on the Company’s cash needs and, as such, both the principal amounts and the interest rates are subject to variability. At
December 31, 2016
, the weighted average interest rate was 1.737% on the $112,020,000 of variable-rate debt that matures in July 2019. Unsecured bank credit facilities also included $80,000,000 of debt with an effectively fixed interest rate of 2.020% due to an interest rate swap that matures on August 15, 2018. The $300 million unsecured credit facility has options for a one-year extension (at the Company's election) and a $150 million expansion (with agreement by all parties). The $35 million unsecured credit facility automatically extends for one year if the extension option in the $300 million revolving facility is exercised. As of
December 31, 2016
, the interest rate on the $300 million facility was LIBOR plus 100 basis points (weighted average interest rate of 1.731%) with an annual facility fee of 20 basis points, and the interest rate on the $35 million facility, which resets on a daily basis, was LIBOR plus 100 basis points (1.772%) with an annual facility fee of 20 basis points. The margin and facility fee are subject to changes in the Company's credit ratings.
|
|
(3)
|
Represents an estimate of interest due on the Company's unsecured bank credit facilities based on the outstanding unsecured credit facilities as of
December 31, 2016
and interest rates and maturity dates on the facilities as of
December 31, 2016
as discussed in note 2 above.
|
|
(4)
|
Represents commitments on real estate properties, except for tenant improvement obligations.
|
|
(5)
|
Represents commitments on properties under development, except for tenant improvement obligations.
|
|
(6)
|
Represents tenant improvement allowance obligations.
|
The Company anticipates that its current cash balance, operating cash flows, borrowings under its unsecured bank credit facilities, proceeds from new debt and/or proceeds from the issuance of equity instruments will be adequate for (i) operating and administrative expenses, (ii) normal repair and maintenance expenses at its properties, (iii) debt service obligations, (iv) maintaining compliance with its debt covenants, (v) distributions to stockholders, (vi) capital improvements, (vii) purchases of properties, (viii) development, and (ix) any other normal business activities of the Company, both in the short-term and long-term.
INFLATION AND OTHER ECONOMIC CONSIDERATIONS
Most of the Company's leases include scheduled rent increases. Additionally, most of the Company's leases require the tenants to pay their pro rata share of operating expenses, including real estate taxes, insurance and common area maintenance, thereby reducing the Company's exposure to increases in operating expenses resulting from inflation. In the event inflation causes increases in the Company’s general and administrative expenses or the level of interest rates, such increased costs would not be passed through to tenants and could adversely affect the Company’s results of operations.
EastGroup's financial results are affected by general economic conditions in the markets in which the Company's properties are located. The state of the economy, or other adverse changes in general or local economic conditions, could result in the inability
36
of some of the Company's existing tenants to make lease payments and may therefore increase bad debt expense. It may also impact the Company’s ability to (i) renew leases or re-lease space as leases expire, or (ii) lease development space. In addition, an economic downturn or recession could also lead to an increase in overall vacancy rates or a decline in rents the Company can charge to re-lease properties upon expiration of current leases. In all of these cases, EastGroup’s cash flows would be adversely affected.
The Company is exposed to interest rate changes primarily as a result of its unsecured bank credit facilities and long-term debt maturities. This debt is used to maintain liquidity and fund capital expenditures and expansion of the Company’s real estate investment portfolio and operations. The Company’s objective for interest rate risk management is to limit the impact of interest rate changes on earnings and cash flows and to lower its overall borrowing costs. The Company has two variable rate unsecured bank credit facilities as discussed under
Liquidity and Capital Resources
. As market conditions permit, EastGroup issues equity and/or employs fixed-rate debt, including variable-rate debt that has been swapped to an effectively fixed rate through the use of interest rate swaps, to replace the short-term bank borrowings. The Company's interest rate swaps are discussed in Note 13 in the Notes to Consolidated Financial Statements. The table below presents the principal payments due and weighted average interest rates, which include the impact of interest rate swaps, for both the fixed-rate and variable-rate debt as of
December 31, 2016
.
|
|
2017
|
2018
|
2019
|
2020
|
2021
|
Thereafter
|
Total
|
Fair Value
|
|||||||||||||||
|
Unsecured bank credit facilities - variable
rate
(in thousands)
|
$
|
—
|
|
—
|
|
112,020
|
|
(1)
|
—
|
|
—
|
|
—
|
|
112,020
|
|
111,923
(2)
|
||||||
|
Weighted average
interest rate
|
—
|
|
—
|
|
1.74
|
%
|
(3)
|
—
|
|
—
|
|
—
|
|
1.74
|
%
|
|
|||||||
|
Unsecured bank credit facilities - fixed rate
(in thousands)
|
$
|
—
|
|
—
|
|
80,000
|
|
—
|
|
—
|
|
—
|
|
80,000
|
|
79,998
(4)
|
|||||||
|
Weighted average
interest rate
|
—
|
|
—
|
|
2.02
|
%
|
—
|
|
—
|
|
—
|
|
2.02
|
%
|
|||||||||
|
Unsecured debt - fixed
rate
(in thousands)
|
$
|
—
|
|
50,000
|
|
75,000
|
|
105,000
|
|
40,000
|
|
385,000
|
|
655,000
|
|
623,147
(4)
|
|||||||
|
Weighted average
interest rate
|
—
|
|
3.91
|
%
|
2.85
|
%
|
3.77
|
%
|
2.34
|
%
|
3.47
|
%
|
3.41
|
%
|
|
||||||||
|
Secured debt - fixed
rate
(in thousands)
|
$
|
58,237
|
|
11,316
|
|
55,569
|
|
9,096
|
|
89,563
|
|
34,813
|
|
258,594
|
|
266,585
(4)
|
|||||||
|
Weighted average
interest rate
|
5.50
|
%
|
5.21
|
%
|
7.01
|
%
|
4.43
|
%
|
4.55
|
%
|
4.08
|
%
|
5.25
|
%
|
|
||||||||
|
(1)
|
The variable-rate unsecured bank credit facilities mature in July 2019 and as of December 31, 2016, have balances of $95,000,000 on the $300 million unsecured bank credit facility and $17,020,000 on the $35 million unsecured bank credit facility.
|
|
(2)
|
The fair value of the Company’s variable-rate debt is estimated by discounting expected cash flows at current market rates, excluding the effects of debt issuance costs.
|
|
(3)
|
Represents the weighted average interest rate for the Company's variable rate unsecured bank credit facilities as of
December 31, 2016
.
|
|
(4)
|
The fair value of the Company’s fixed-rate debt, including variable-rate debt that has been swapped to an effectively fixed rate through the use of interest rate swaps, is estimated by discounting expected cash flows at the rates currently offered to the Company for debt of the same remaining maturities, as advised by the Company’s bankers, excluding the effects of debt issuance costs.
|
As the table above incorporates only those exposures that existed as of
December 31, 2016
, it does not consider those exposures or positions that could arise after that date. If the weighted average interest rate on the variable-rate unsecured bank credit facilities, as shown above, changes by 10% or approximately 17 basis points, interest expense and cash flows would increase or decrease by approximately $195,000 annually. This does not include variable-rate debt that has been effectively fixed through the use of interest rate swaps.
37
FORWARD-LOOKING STATEMENTS
Certain statements contained in this report may be deemed “forward-looking statements” within the meaning of the Private Securities Litigation Reform Act of 1995. Words such as “will,” “anticipates,” “expects,” “believes,” “intends,” “plans,” “seeks,” “estimates,” variations of such words and similar expressions are intended to identify such forward-looking statements, which generally are not historical in nature. All statements that address operating performance, events or developments that the Company expects or anticipates will occur in the future, including statements relating to rent and occupancy growth, development activity, the acquisition or sale of properties, general conditions in the geographic areas where the Company operates and the availability of capital, are forward-looking statements. Forward-looking statements are inherently subject to known and unknown risks and uncertainties, many of which the Company cannot predict, including, without limitation: changes in general economic conditions; the extent of tenant defaults or of any early lease terminations; the Company's ability to lease or re-lease space at current or anticipated rents; the availability of financing; the failure to maintain credit ratings with rating agencies; changes in the supply of and demand for industrial/warehouse properties; increases in interest rate levels; increases in operating costs; natural disasters, terrorism, riots and acts of war, and the Company's ability to obtain adequate insurance; changes in governmental regulation, tax rates and similar matters; and other risks associated with the development and acquisition of properties, including risks that development projects may not be completed on schedule, development or operating costs may be greater than anticipated or acquisitions may not close as scheduled, and those additional factors discussed under “Item 1A. Risk Factors” in Part I of this report. Although the Company believes the expectations reflected in the forward-looking statements are based upon reasonable assumptions at the time made, the Company can give no assurance that such expectations will be achieved. The Company assumes no obligation whatsoever to publicly update or revise any forward-looking statements. See also the information contained in the Company’s reports filed or to be filed from time to time with the Securities and Exchange Commission pursuant to the Securities Exchange Act of 1934, as amended (the “Exchange Act”).
The Registrant's Consolidated Balance Sheets as of
December 31, 2016
and
2015
, and its Consolidated Statements of Income and Comprehensive Income, Changes in Equity and Cash Flows and Notes to Consolidated Financial Statements for the years ended
December 31, 2016
,
2015
and
2014
and the Report of Independent Registered Public Accounting Firm thereon are included under Item 15 of this report and are incorporated herein by reference. Unaudited quarterly results of operations included in the Notes to Consolidated Financial Statements are also incorporated herein by reference.
None.
|
(i)
|
Disclosure Controls and Procedures.
|
The Company carried out an evaluation, under the supervision and with the participation of the Company’s management, including the Company’s Chief Executive Officer and Chief Financial Officer, of the effectiveness of the design and operation of the Company’s disclosure controls and procedures pursuant to Exchange Act Rule 13a-15. Based upon that evaluation, the Chief Executive Officer and Chief Financial Officer concluded that, as of
December 31, 2016
, the Company’s disclosure controls and procedures were effective in timely alerting them to material information relating to the Company (including its consolidated subsidiaries) required to be included in the Company’s periodic SEC filings.
|
(ii)
|
Internal Control Over Financial Reporting.
|
|
(a)
|
Management's annual report on internal control over financial reporting.
|
Management is responsible for establishing and maintaining adequate internal control over financial reporting, as such term is defined in Exchange Act Rule 13a-15(f). EastGroup’s Management Report on Internal Control Over Financial Reporting is set forth in Part IV, Item 15 of this Form 10-K on page 45 and is incorporated herein by reference.
|
(b)
|
Report of the independent registered public accounting firm.
|
The report of KPMG LLP, the Company's independent registered public accounting firm, on the Company's internal control over financial reporting is set forth in Part IV, Item 15 of this Form 10-K on page 45 and is incorporated herein by reference.
38
|
(c)
|
Changes in internal control over financial reporting.
|
There was no change in the Company's internal control over financial reporting during the Company's fourth fiscal quarter ended
December 31, 2016
that has materially affected, or is reasonably likely to materially affect, the Company's internal control over financial reporting.
Not applicable.
The following table sets forth information regarding the Company’s executive officers and directors.
|
Name
|
Position
|
|
D. Pike Aloian
|
Director since 1999; Partner in Almanac Realty Investors, LLC (real estate advisory and investment management services)
|
|
H.C. Bailey, Jr.
|
Director since 1980; Chairman and President of H.C. Bailey Company (real estate development and investment)
|
|
H. Eric Bolton, Jr.
|
Director since 2013; Chairman and Chief Executive Officer of Mid-America Apartment Communities, Inc.
|
|
Hayden C. Eaves III
|
Director since 2002; President of Hayden Holdings, Inc. (real estate investment)
|
|
Fredric H. Gould
|
Director since 1998; Chairman of the General Partner of Gould Investors L.P., Member of the Board of Directors of BRT Realty Trust and Vice-Chairman of One Liberty Properties, Inc.
|
|
Mary E. McCormick
|
Director since 2005; Director of Xenia Hotels and Resorts (lodging real estate investment trust (REIT)); Senior Lecturer at The Ohio State University, Fisher College of Business
|
|
Leland R. Speed
|
Director since 1978; Chairman Emeritus of the Board of the Company since 2016; Chairman of the Board of the Company from 1983 to 2015
|
|
David H. Hoster II
|
Director since 1993; Chairman of the Board of the Company since 2016; President of the Company from 1993 to 2015; Chief Executive Officer of the Company from 1997 to 2015
|
|
Marshall A. Loeb
|
Director, President and Chief Executive Officer of the Company
|
|
N. Keith McKey
|
Executive Vice President, Chief Financial Officer, Secretary and Treasurer of the Company
|
|
John F. Coleman
|
Senior Vice President of the Company
|
|
Bruce Corkern
|
Senior Vice President, Chief Accounting Officer, Controller and Assistant Secretary of the Company
|
|
William D. Petsas
|
Senior Vice President of the Company
|
|
Brent W. Wood
|
Senior Vice President of the Company
|
All other information required by Item 10 of Part III regarding the Company’s executive officers and directors is incorporated herein by reference from the sections entitled "Corporate Governance and Board Matters" and “Executive Officers” in the Company's definitive Proxy Statement ("
2017
Proxy Statement") to be filed pursuant to Regulation 14A of the Securities Exchange Act of 1934, as amended, for EastGroup's Annual Meeting of Stockholders to be held on May 11,
2017
. The
2017
Proxy Statement will be filed within 120 days after the end of the Company's fiscal year ended
December 31, 2016
.
The information regarding compliance with Section 16(a) of the Exchange Act is incorporated herein by reference from the subsection entitled "Section 16(a) Beneficial Ownership Reporting Compliance" in the Company's
2017
Proxy Statement.
Information regarding EastGroup's code of business conduct and ethics found in the subsection captioned "Available Information" in Item 1 of Part I hereof is also incorporated herein by reference into this Item 10.
The information regarding the Company's audit committee, its members and the audit committee financial experts is incorporated herein by reference from the subsection entitled "Committees and Meeting Data” in the Company's
2017
Proxy Statement.
39
The information included under the following captions in the Company's
2017
Proxy Statement is incorporated herein by reference: "Compensation Discussion and Analysis," "Summary Compensation Table," "Grants of Plan-Based Awards in
2016
," "Outstanding Equity Awards at
2016
Fiscal Year-End," "Option Exercises and Stock Vested in
2016
," "Potential Payments upon Termination or Change in Control," "Compensation of Directors" and "Compensation Committee Interlocks." The information included under the heading "Report of the Compensation Committee" in the Company's
2017
Proxy Statement is incorporated herein by reference; however, this information shall not be deemed to be "soliciting material" or to be "filed" with the SEC or subject to Regulation 14A or 14C, or to the liabilities of Section 18 of the Exchange Act.
Information regarding security ownership of certain beneficial owners and management is incorporated herein by reference from the subsections entitled “Security Ownership of Certain Beneficial Owners” and “Security Ownership of Management and Directors” in the Company’s
2017
Proxy Statement.
The following table summarizes the Company’s equity compensation plan information as of
December 31, 2016
.
|
Equity Compensation Plan Information
|
|||||||||
|
Plan category
|
(a)
Number of securities to be issued upon exercise of outstanding options, warrants and rights
|
(b)
Weighted-average exercise price of outstanding options,
warrants and rights
|
(c)
Number of securities remaining available for future issuance under equity compensation plans (excluding securities reflected in column (a))
|
||||||
|
Equity compensation plans approved by security holders
|
—
|
|
—
|
|
1,752,345
|
|
|||
|
Equity compensation plans not approved by security holders
|
—
|
|
—
|
|
—
|
|
|||
|
Total
|
—
|
|
—
|
|
1,752,345
|
|
|||
The information regarding transactions with related parties and director independence is incorporated herein by reference from the subsection entitled "Independent Directors" and the section entitled “Certain Transactions and Relationships” in the Company's
2017
Proxy Statement.
The information regarding principal auditor fees and services is incorporated herein by reference from the section entitled "Auditor Fees and Services" in the Company's
2017
Proxy Statement.
40
|
(a)
|
The following documents are filed as part of this Annual Report on Form 10-K:
|
|
|
|
Page
|
|
(1)
|
Consolidated Financial Statements:
|
|
|
|
||
|
|
||
|
|
||
|
|
||
|
|
||
|
|
||
|
|
||
|
|
||
|
|
|
|
|
(2)
|
Consolidated Financial Statement Schedules:
|
|
|
|
||
|
|
||
|
|
||
|
|
|
|
|
|
All other schedules for which provision is made in the applicable accounting regulations of the Securities and Exchange Commission are not required under the related instructions or are inapplicable, and therefore have been omitted, or the required information is included in the Notes to Consolidated Financial Statements.
|
|
|
|
|
|
|
(3)
|
Exhibits:
|
|
|
|
The following exhibits are filed with this Form 10-K or incorporated by reference to the listed document previously filed with the SEC:
|
|
|
Number
|
Description
|
|
(3)
|
Articles of Incorporation and Bylaws
|
|
(a)
|
Articles of Incorporation (incorporated by reference to Appendix B to the Company's Proxy Statement for its Annual Meeting of Stockholders held on June 5, 1997).
|
|
(b)
|
EastGroup Properties, Inc. Bylaws, Amended through December 5, 2014 (incorporated by reference to Exhibit 3.1 to the Company's Form 8-K filed December 10, 2014).
|
|
(10)
|
Material Contracts (*Indicates management or compensatory agreement):
|
|
(a)
|
Form of Severance and Change in Control Agreement that the Company has entered into with Marshall A. Loeb and N. Keith McKey (incorporated by reference to Exhibit 10(a) to the Company's Form 8-K filed May 18, 2016).*
|
|
(b)
|
Form of Severance and Change in Control Agreement that the Company has entered into with John F. Coleman, William D. Petsas, Brent W. Wood and C. Bruce Corkern (incorporated by reference to Exhibit 10(b) to the Company's Form 8-K filed May 18, 2016).*
|
|
(c)
|
Third Amended and Restated Credit Agreement Dated January 2, 2013 among EastGroup Properties, L.P.; EastGroup Properties, Inc.; PNC Bank, National Association, as Administrative Agent; Regions Bank and SunTrust Bank as Co-Syndication Agents; U.S. Bank National Association and Wells Fargo Bank, National Association as Co-Documentation Agents; PNC Capital Markets LLC, as Sole Lead Arranger and Sole Bookrunner; and the Lenders thereunder (incorporated by reference to Exhibit 10.1 to the Company's Form 8-K filed January 8, 2013).
|
41
|
(d)
|
First Amendment to Third Amended and Restated Credit Agreement, dated as of August 9, 2013, among EastGroup Properties, L.P., EastGroup Properties, Inc. and PNC Bank, National Association, as administrative agent, and each of the financial institutions party thereto as lenders (incorporated by reference to Exhibit 10.2 to the Company's Form 8-K filed August 30, 2013).
|
|
(e)
|
Second Amendment to Third Amended and Restated Credit Agreement dated as of July 30, 2015 by and among EastGroup Properties, L.P.; EastGroup Properties, Inc.; PNC Bank, National Association, as Administrative Agent; and each of the financial institutions party thereto as lenders (incorporated by reference to Exhibit 10.1 to the Company's Form 8-K filed August 4, 2015).
|
|
(f)
|
EastGroup Properties, Inc. 2013 Equity Incentive Plan (incorporated by reference to Appendix A to the proxy material for the 2013 Annual Meeting of Stockholders).*
|
|
(g)
|
EastGroup Properties, Inc. Director Compensation Program (incorporated by reference to Exhibit 10.1 to the Company's Form 8-K filed June 2, 2015).*
|
|
(h)
|
Note Purchase Agreement, dated as of August 28, 2013, among EastGroup Properties, L.P., EastGroup Properties, Inc. and the purchasers of the notes party thereto (including the form of the 3.80% Senior Notes due August 28, 2025) (incorporated by reference to Exhibit 10.1 to the Company's Form 8-K filed August 30, 2013).
|
|
(i)
|
Sales Agency Financing Agreement dated February 19, 2014 between EastGroup Properties, Inc. and BNY Mellon Capital Markets, LLC (incorporated by reference to Exhibit 1.1 to the Company's Form 8-K filed February 25, 2014).
|
|
(j)
|
Sales Agency Financing Agreement dated February 19, 2014 between EastGroup Properties, Inc. and Merrill Lynch, Pierce, Fenner & Smith Incorporated (incorporated by reference to Exhibit 1.2 to the Company's Form 8-K filed February 25, 2014).
|
|
(k)
|
Sales Agency Financing Agreement dated February 19, 2014 between EastGroup Properties, Inc. and Raymond James & Associates, Inc. (incorporated by reference to Exhibit 1.3 to the Company's Form 8-K filed February 25, 2014).
|
|
(12)
|
Statement of computation of ratio of earnings to combined fixed charges and preferred stock distributions (filed herewith)
|
|
(21)
|
Subsidiaries of EastGroup Properties, Inc. (filed herewith).
|
|
|
|
|
(23)
|
Consent of KPMG LLP (filed herewith).
|
|
|
|
|
(24)
|
Powers of attorney (filed herewith).
|
|
|
|
|
(31)
|
Rule 13a-14(a)/15d-14(a) Certifications (pursuant to Section 302 of the Sarbanes-Oxley Act of 2002)
|
|
(a)
|
Marshall A. Loeb, Chief Executive Officer
|
|
(b)
|
N. Keith McKey, Chief Financial Officer
|
|
|
|
|
(32)
|
Section 1350 Certifications (pursuant to Section 906 of the Sarbanes-Oxley Act of 2002)
|
|
(a)
|
Marshall A. Loeb, Chief Executive Officer
|
|
(b)
|
N. Keith McKey, Chief Financial Officer
|
|
|
|
|
(101)
|
The following materials from EastGroup Properties, Inc.’s Annual Report on Form 10-K for the year ended December 31, 2016, formatted in XBRL (eXtensible Business Reporting Language): (i) consolidated balance sheets, (ii) consolidated statements of income and comprehensive income, (iii) consolidated statements of changes in equity, (iv) consolidated statements of cash flows, and (v) the notes to the consolidated financial statements.
|
|
(b)
|
Exhibits
|
The exhibits required to be filed with this Report pursuant to Item 601 of Regulation S-K are listed under “Exhibits” in Part IV, Item 15(a)(3) of this Report and are incorporated herein by reference.
|
(c)
|
Financial Statement Schedules
|
The Financial Statement Schedules required to be filed with this Report are listed under “Consolidated Financial Statement Schedules” in Part IV, Item 15(a)(2) of this Report, and are incorporated herein by reference.
42
REPORT OF INDEPENDENT REGISTERED PUBLIC ACCOUNTING FIRM
THE BOARD OF DIRECTORS AND STOCKHOLDERS
EASTGROUP PROPERTIES, INC.:
We have audited the accompanying consolidated balance sheets of EastGroup Properties, Inc. and subsidiaries (the Company) as of
December 31, 2016
and
2015
, and the related consolidated statements of income and comprehensive income, changes in equity and cash flows for each of the years in the three-year period ended
December 31, 2016
. These consolidated financial statements are the responsibility of the Company’s management. Our responsibility is to express an opinion on these consolidated financial statements based on our audits.
We conducted our audits in accordance with the standards of the Public Company Accounting Oversight Board (United States). Those standards require that we plan and perform the audit to obtain reasonable assurance about whether the financial statements are free of material misstatement. An audit includes examining, on a test basis, evidence supporting the amounts and disclosures in the financial statements. An audit also includes assessing the accounting principles used and significant estimates made by management, as well as evaluating the overall financial statement presentation. We believe that our audits provide a reasonable basis for our opinion.
In our opinion, the consolidated financial statements referred to above present fairly, in all material respects, the financial position of EastGroup Properties, Inc. and subsidiaries as of
December 31, 2016
and
2015
, and the results of their operations and their cash flows for each of the years in the three-year period ended
December 31, 2016
, in conformity with U.S. generally accepted accounting principles.
We also have audited, in accordance with the standards of the Public Company Accounting Oversight Board (United States), the Company’s internal control over financial reporting as of
December 31, 2016
, based on the criteria established in
Internal Control – Integrated Framework (2013)
issued by the Committee of Sponsoring Organizations of the Treadway Commission (COSO), and our report dated
February 15, 2017
, expressed an unqualified opinion on the effectiveness of the Company’s internal control over financial reporting.
|
|
(Signed) KPMG LLP
|
|
Jackson, Mississippi
|
|
|
February 15, 2017
|
|
43
MANAGEMENT REPORT ON INTERNAL CONTROL OVER FINANCIAL REPORTING
EastGroup’s management is responsible for establishing and maintaining adequate internal control over financial reporting, as such term is defined in Exchange Act Rule 13a-15(f). Under the supervision and with the participation of management, including the Chief Executive Officer and Chief Financial Officer, EastGroup conducted an evaluation of the effectiveness of internal control over financial reporting based on the framework in
Internal Control – Integrated Framework (2013)
issued by the Committee of Sponsoring Organizations of the Treadway Commission. The design of any system of internal control over financial reporting is based in part upon certain assumptions about the likelihood of future events, and there can be no assurance that any design will succeed in achieving its stated goals under all potential future conditions. Based on EastGroup’s evaluation under the framework in
Internal Control – Integrated Framework (2013)
, management concluded that our internal control over financial reporting was effective as of
December 31, 2016
.
|
|
/s/ EASTGROUP PROPERTIES, INC.
|
|
Jackson, Mississippi
|
|
|
February 15, 2017
|
|
REPORT OF INDEPENDENT REGISTERED PUBLIC ACCOUNTING FIRM
THE BOARD OF DIRECTORS AND STOCKHOLDERS
EASTGROUP PROPERTIES, INC.:
We have audited EastGroup Properties, Inc. and subsidiaries’ (the Company) internal control over financial reporting as of
December 31, 2016
, based on the criteria established in
Internal Control – Integrated Framework (2013)
issued by the Committee of Sponsoring Organizations of the Treadway Commission (COSO). The Company’s management is responsible for maintaining effective internal control over financial reporting and for its assessment of the effectiveness of internal control over financial reporting, included in the accompanying
Management Report on Internal Control over Financial Reporting.
Our responsibility is to express an opinion on the Company’s internal control over financial reporting based on our audit.
We conducted our audit in accordance with the standards of the Public Company Accounting Oversight Board (United States). Those standards require that we plan and perform the audit to obtain reasonable assurance about whether effective internal control over financial reporting was maintained in all material respects. Our audit included obtaining an understanding of internal control over financial reporting, assessing the risk that a material weakness exists, and testing and evaluating the design and operating effectiveness of internal control based on the assessed risk. Our audit also included performing such other procedures as we considered necessary in the circumstances. We believe that our audit provides a reasonable basis for our opinion.
A company’s internal control over financial reporting is a process designed to provide reasonable assurance regarding the reliability of financial reporting and the preparation of financial statements for external purposes in accordance with generally accepted accounting principles. A company’s internal control over financial reporting includes those policies and procedures that (1) pertain to the maintenance of records that, in reasonable detail, accurately and fairly reflect the transactions and dispositions of the assets of the company; (2) provide reasonable assurance that transactions are recorded as necessary to permit preparation of financial statements in accordance with generally accepted accounting principles, and that receipts and expenditures of the company are being made only in accordance with authorizations of management and directors of the company; and (3) provide reasonable assurance regarding prevention or timely detection of unauthorized acquisition, use, or disposition of the company’s assets that could have a material effect on the financial statements.
Because of its inherent limitations, internal control over financial reporting may not prevent or detect misstatements. Also, projections of any evaluation of effectiveness to future periods are subject to the risk that controls may become inadequate because of changes in conditions, or that the degree of compliance with the policies or procedures may deteriorate.
In our opinion, EastGroup Properties, Inc. and subsidiaries maintained, in all material respects, effective internal control over financial reporting as of
December 31, 2016
, based on the criteria established in
Internal Control – Integrated Framework (2013)
issued by the Committee of Sponsoring Organizations of the Treadway Commission.
We also have audited, in accordance with the standards of the Public Company Accounting Oversight Board (United States), the consolidated balance sheets of EastGroup Properties, Inc. and subsidiaries as of
December 31, 2016
and
2015
, and the related consolidated statements of income and comprehensive income, changes in equity and cash flows for each of the years in the three-year period ended
December 31, 2016
, and our report dated
February 15, 2017
, expressed an unqualified opinion on those consolidated financial statements.
|
|
(Signed) KPMG LLP
|
|
Jackson, Mississippi
|
|
|
February 15, 2017
|
|
44
EASTGROUP PROPERTIES, INC. AND SUBSIDIARIES
CONSOLIDATED BALANCE SHEETS
|
|
December 31,
|
|||||
|
2016
|
2015
|
|||||
|
(In thousands, except for share and per share data)
|
||||||
|
ASSETS
|
|
|
||||
|
Real estate properties
|
$
|
2,113,073
|
|
2,049,007
|
|
|
|
Development
|
293,908
|
|
170,441
|
|
||
|
|
2,406,981
|
|
2,219,448
|
|
||
|
Less accumulated depreciation
|
(694,250
|
)
|
(657,454
|
)
|
||
|
|
1,712,731
|
|
1,561,994
|
|
||
|
Unconsolidated investment
|
7,681
|
|
8,004
|
|
||
|
Cash
|
522
|
|
48
|
|
||
|
Other assets
|
104,830
|
|
91,858
|
|
||
|
TOTAL ASSETS
|
$
|
1,825,764
|
|
1,661,904
|
|
|
|
LIABILITIES AND EQUITY
|
|
|
|
|
||
|
LIABILITIES
|
|
|
|
|
||
|
Unsecured bank credit facilities
|
$
|
190,990
|
|
149,414
|
|
|
|
Unsecured debt
|
652,838
|
|
528,210
|
|
||
|
Secured debt
|
257,505
|
|
350,285
|
|
||
|
Accounts payable and accrued expenses
|
52,701
|
|
44,181
|
|
||
|
Other liabilities
|
29,864
|
|
30,613
|
|
||
|
Total Liabilities
|
1,183,898
|
|
1,102,703
|
|
||
|
EQUITY
|
|
|
|
|
||
|
Stockholders’ Equity:
|
|
|
|
|
||
|
Common shares; $.0001 par value; 70,000,000 shares authorized;
33,332,213 shares issued and outstanding at December 31, 2016 and
32,421,460 at December 31, 2015
|
3
|
|
3
|
|
||
|
Excess shares; $.0001 par value; 30,000,000 shares authorized;
no shares issued
|
—
|
|
—
|
|
||
|
Additional paid-in capital on common shares
|
949,318
|
|
887,207
|
|
||
|
Distributions in excess of earnings
|
(313,655
|
)
|
(328,892
|
)
|
||
|
Accumulated other comprehensive income (loss)
|
1,995
|
|
(3,456
|
)
|
||
|
Total Stockholders’ Equity
|
637,661
|
|
554,862
|
|
||
|
Noncontrolling interest in joint ventures
|
4,205
|
|
4,339
|
|
||
|
Total Equity
|
641,866
|
|
559,201
|
|
||
|
TOTAL LIABILITIES AND EQUITY
|
$
|
1,825,764
|
|
1,661,904
|
|
|
See accompanying Notes to Consolidated Financial Statements.
45
EASTGROUP PROPERTIES, INC. AND SUBSIDIARIES
|
|
Years Ended December 31,
|
||||||||
|
2016
|
2015
|
2014
|
|||||||
|
(In thousands, except per share data)
|
|||||||||
|
REVENUES
|
|
|
|
||||||
|
Income from real estate operations
|
$
|
252,961
|
|
234,918
|
|
219,706
|
|
||
|
Other income
|
86
|
|
90
|
|
123
|
|
|||
|
|
253,047
|
|
235,008
|
|
219,829
|
|
|||
|
EXPENSES
|
|
|
|
|
|||||
|
Expenses from real estate operations
|
74,347
|
|
67,402
|
|
62,797
|
|
|||
|
Depreciation and amortization
|
77,935
|
|
73,290
|
|
70,314
|
|
|||
|
General and administrative
|
13,232
|
|
15,091
|
|
12,726
|
|
|||
|
Acquisition costs
|
161
|
|
164
|
|
210
|
|
|||
|
|
165,675
|
|
155,947
|
|
146,047
|
|
|||
|
OPERATING INCOME
|
87,372
|
|
79,061
|
|
73,782
|
|
|||
|
OTHER INCOME (EXPENSE)
|
|
|
|
|
|
|
|||
|
Interest expense
|
(35,213
|
)
|
(34,666
|
)
|
(35,486
|
)
|
|||
|
Gain, net of loss, on sales of real estate investments
|
42,170
|
|
2,903
|
|
9,188
|
|
|||
|
Other
|
1,765
|
|
1,101
|
|
989
|
|
|||
|
NET INCOME
|
96,094
|
|
48,399
|
|
48,473
|
|
|||
|
Net income attributable to noncontrolling interest in joint ventures
|
(585
|
)
|
(533
|
)
|
(532
|
)
|
|||
|
NET INCOME ATTRIBUTABLE TO EASTGROUP PROPERTIES, INC. COMMON STOCKHOLDERS
|
95,509
|
|
47,866
|
|
47,941
|
|
|||
|
Other comprehensive income (loss) - cash flow hedges
|
5,451
|
|
(1,099
|
)
|
(3,986
|
)
|
|||
|
TOTAL COMPREHENSIVE INCOME
|
$
|
100,960
|
|
46,767
|
|
43,955
|
|
||
|
BASIC PER COMMON SHARE DATA FOR NET INCOME ATTRIBUTABLE TO EASTGROUP PROPERTIES, INC. COMMON STOCKHOLDERS
|
|
|
|
|
|
|
|||
|
Net income attributable to common stockholders
|
$
|
2.93
|
|
1.49
|
|
1.53
|
|
||
|
Weighted average shares outstanding
|
32,563
|
|
32,091
|
|
31,341
|
|
|||
|
DILUTED PER COMMON SHARE DATA FOR NET INCOME ATTRIBUTABLE TO EASTGROUP PROPERTIES, INC. COMMON STOCKHOLDERS
|
|
|
|
|
|
|
|||
|
Net income attributable to common stockholders
|
$
|
2.93
|
|
1.49
|
|
1.52
|
|
||
|
Weighted average shares outstanding
|
32,628
|
|
32,196
|
|
31,452
|
|
|||
See accompanying Notes to Consolidated Financial Statements.
46
EASTGROUP PROPERTIES, INC. AND SUBSIDIARIES
CONSOLIDATED STATEMENTS OF CHANGES IN EQUITY
|
Common
Stock
|
Additional
Paid-In
Capital
|
Distributions
In Excess
Of Earnings
|
Accumulated
Other
Comprehensive
Income (Loss)
|
Noncontrolling
Interest in
Joint Ventures
|
Total
|
|||||||||||||
|
(In thousands, except for share and per share data)
|
||||||||||||||||||
|
Balance, December 31, 2013
|
$
|
3
|
|
790,535
|
|
(278,169
|
)
|
1,629
|
|
4,707
|
|
518,705
|
|
|||||
|
Net income
|
—
|
|
—
|
|
47,941
|
|
—
|
|
532
|
|
48,473
|
|
||||||
|
Net unrealized change in fair value of
interest rate swaps
|
—
|
|
—
|
|
—
|
|
(3,986
|
)
|
—
|
|
(3,986
|
)
|
||||||
|
Common dividends declared – $2.22 per share
|
—
|
|
—
|
|
(70,624
|
)
|
—
|
|
—
|
|
(70,624
|
)
|
||||||
|
Stock-based compensation, net of forfeitures
|
—
|
|
6,567
|
|
—
|
|
—
|
|
—
|
|
6,567
|
|
||||||
|
Issuance of 1,246,400 shares of common stock,
common stock offering, net of expenses |
—
|
|
78,868
|
|
—
|
|
—
|
|
—
|
|
78,868
|
|
||||||
|
Issuance of 3,626 shares of common stock,
dividend reinvestment plan |
—
|
|
227
|
|
—
|
|
—
|
|
—
|
|
227
|
|
||||||
|
Withheld 31,673 shares of common stock to satisfy tax withholding obligations in connection with the vesting of restricted stock
|
—
|
|
(1,862
|
)
|
—
|
|
—
|
|
—
|
|
(1,862
|
)
|
||||||
|
Distributions to noncontrolling interest
|
—
|
|
—
|
|
—
|
|
—
|
|
(753
|
)
|
(753
|
)
|
||||||
|
Balance, December 31, 2014
|
3
|
|
874,335
|
|
(300,852
|
)
|
(2,357
|
)
|
4,486
|
|
575,615
|
|
||||||
|
Net income
|
—
|
|
—
|
|
47,866
|
|
—
|
|
533
|
|
48,399
|
|
||||||
|
Net unrealized change in fair value of
interest rate swaps
|
—
|
|
—
|
|
—
|
|
(1,099
|
)
|
—
|
|
(1,099
|
)
|
||||||
|
Common dividends declared – $2.34 per share
|
—
|
|
—
|
|
(75,906
|
)
|
—
|
|
—
|
|
(75,906
|
)
|
||||||
|
Stock-based compensation, net of forfeitures
|
—
|
|
8,423
|
|
—
|
|
—
|
|
—
|
|
8,423
|
|
||||||
|
Issuance of 106,751 shares of common stock,
common stock offering, net of expenses
|
—
|
|
6,233
|
|
—
|
|
—
|
|
—
|
|
6,233
|
|
||||||
|
Issuance of 4,536 shares of common stock,
dividend reinvestment plan |
—
|
|
257
|
|
—
|
|
—
|
|
—
|
|
257
|
|
||||||
|
Withheld 32,409 shares of common stock to satisfy tax withholding obligations in connection with the vesting of restricted stock
|
—
|
|
(2,041
|
)
|
—
|
|
—
|
|
—
|
|
(2,041
|
)
|
||||||
|
Distributions to noncontrolling interest
|
—
|
|
—
|
|
—
|
|
—
|
|
(680
|
)
|
(680
|
)
|
||||||
|
Balance, December 31, 2015
|
3
|
|
887,207
|
|
(328,892
|
)
|
(3,456
|
)
|
4,339
|
|
559,201
|
|
||||||
|
Net income
|
—
|
|
—
|
|
95,509
|
|
—
|
|
585
|
|
96,094
|
|
||||||
|
Net unrealized change in fair value of
interest rate swaps
|
—
|
|
—
|
|
—
|
|
5,451
|
|
—
|
|
5,451
|
|
||||||
|
Common dividends declared – $2.44 per share
|
—
|
|
—
|
|
(80,272
|
)
|
—
|
|
—
|
|
(80,272
|
)
|
||||||
|
Stock-based compensation, net of forfeitures
|
—
|
|
5,831
|
|
—
|
|
—
|
|
—
|
|
5,831
|
|
||||||
|
Issuance of 875,052 shares of common stock, common stock offering, net of expenses
|
—
|
|
59,283
|
|
—
|
|
—
|
|
—
|
|
59,283
|
|
||||||
|
Issuance of 3,326 shares of common stock,
dividend reinvestment plan
|
—
|
|
228
|
|
—
|
|
—
|
|
—
|
|
228
|
|
||||||
|
Withheld 57,316 shares of common stock to satisfy tax withholding obligations in connection with the vesting of restricted stock
|
—
|
|
(3,231
|
)
|
—
|
|
—
|
|
—
|
|
(3,231
|
)
|
||||||
|
Distributions to noncontrolling interest
|
—
|
|
—
|
|
—
|
|
—
|
|
(719
|
)
|
(719
|
)
|
||||||
|
Balance, December 31, 2016
|
$
|
3
|
|
949,318
|
|
(313,655
|
)
|
1,995
|
|
4,205
|
|
641,866
|
|
|||||
See accompanying Notes to Consolidated Financial Statements.
47
EASTGROUP PROPERTIES, INC. AND SUBSIDIARIES
CONSOLIDATED STATEMENTS OF CASH FLOWS
|
|
Years Ended December 31,
|
||||||||
|
2016
|
2015
|
2014
|
|||||||
|
(In thousands)
|
|||||||||
|
OPERATING ACTIVITIES
|
|
|
|
||||||
|
Net income
|
$
|
96,094
|
|
48,399
|
|
48,473
|
|
||
|
Adjustments to reconcile net income to net cash provided by operating activities:
|
|
|
|
|
|
|
|||
|
Depreciation and amortization
|
77,935
|
|
73,290
|
|
70,314
|
|
|||
|
Stock-based compensation expense
|
4,590
|
|
6,733
|
|
5,146
|
|
|||
|
Gain, net of loss, on sales of real estate investments and non-operating real estate
|
(42,903
|
)
|
(3,026
|
)
|
(9,286
|
)
|
|||
|
Changes in operating assets and liabilities:
|
|
|
|||||||
|
Accrued income and other assets
|
(2,883
|
)
|
(2,118
|
)
|
(713
|
)
|
|||
|
Accounts payable, accrued expenses and prepaid rent
|
5,736
|
|
6,928
|
|
2,315
|
|
|||
|
Other
|
295
|
|
(157
|
)
|
(28
|
)
|
|||
|
NET CASH PROVIDED BY OPERATING ACTIVITIES
|
138,864
|
|
130,049
|
|
116,221
|
|
|||
|
INVESTING ACTIVITIES
|
|
|
|
|
|
|
|||
|
Real estate development
|
(203,765
|
)
|
(95,032
|
)
|
(97,696
|
)
|
|||
|
Purchases of real estate
|
(27,668
|
)
|
(31,574
|
)
|
(48,805
|
)
|
|||
|
Real estate improvements
|
(23,671
|
)
|
(24,514
|
)
|
(20,524
|
)
|
|||
|
Net proceeds from sales of real estate investments and non-operating real estate
|
78,780
|
|
5,156
|
|
20,625
|
|
|||
|
Capital contributions to unconsolidated investment
|
—
|
|
—
|
|
(5,132
|
)
|
|||
|
Repayments on mortgage loans receivable
|
123
|
|
116
|
|
3,902
|
|
|||
|
Changes in accrued development costs
|
3,629
|
|
(1,705
|
)
|
241
|
|
|||
|
Changes in other assets and other liabilities
|
(13,900
|
)
|
(8,865
|
)
|
(12,181
|
)
|
|||
|
NET CASH USED IN INVESTING ACTIVITIES
|
(186,472
|
)
|
(156,418
|
)
|
(159,570
|
)
|
|||
|
FINANCING ACTIVITIES
|
|
|
|
|
|
|
|||
|
Proceeds from unsecured bank credit facilities
|
608,349
|
|
420,104
|
|
350,214
|
|
|||
|
Repayments on unsecured bank credit facilities
|
(567,165
|
)
|
(368,669
|
)
|
(339,765
|
)
|
|||
|
Proceeds from unsecured debt
|
205,000
|
|
150,000
|
|
75,000
|
|
|||
|
Repayments on unsecured debt
|
(80,000
|
)
|
—
|
|
—
|
|
|||
|
Repayments on secured debt
|
(92,773
|
)
|
(102,337
|
)
|
(48,846
|
)
|
|||
|
Debt issuance costs
|
(1,487
|
)
|
(1,952
|
)
|
(499
|
)
|
|||
|
Distributions paid to stockholders (not including dividends accrued on unvested restricted stock)
|
(80,899
|
)
|
(75,845
|
)
|
(70,456
|
)
|
|||
|
Proceeds from common stock offerings
|
59,283
|
|
6,233
|
|
78,868
|
|
|||
|
Proceeds from dividend reinvestment plan
|
236
|
|
256
|
|
216
|
|
|||
|
Other
|
(2,462
|
)
|
(1,384
|
)
|
(1,380
|
)
|
|||
|
NET CASH PROVIDED BY FINANCING ACTIVITIES
|
48,082
|
|
26,406
|
|
43,352
|
|
|||
|
INCREASE IN CASH AND CASH EQUIVALENTS
|
474
|
|
37
|
|
3
|
|
|||
|
CASH AND CASH EQUIVALENTS AT BEGINNING OF YEAR
|
48
|
|
11
|
|
8
|
|
|||
|
CASH AND CASH EQUIVALENTS AT END OF YEAR
|
$
|
522
|
|
48
|
|
11
|
|
||
|
SUPPLEMENTAL CASH FLOW INFORMATION
|
|
|
|
|
|
|
|||
|
Cash paid for interest, net of amount capitalized of $5,340, $5,257, and
$4,942 for 2016, 2015 and 2014, respectively
|
$
|
33,595
|
|
33,164
|
|
34,426
|
|
||
|
Fair value of debt assumed by the Company in the purchase of
real estate
|
—
|
|
—
|
|
2,847
|
|
|||
See accompanying Notes to Consolidated Financial Statements.
48
EASTGROUP PROPERTIES, INC. AND SUBSIDIARIES
NOTES TO CONSOLIDATED FINANCIAL STATEMENTS
DECEMBER 31,
2016
,
2015
and
2014
|
(1)
|
SIGNIFICANT ACCOUNTING POLICIES
|
|
(a)
|
Principles of Consolidation
|
The consolidated financial statements include the accounts of EastGroup Properties, Inc. ("EastGroup" or "the Company"), its wholly owned subsidiaries and its investment in any joint ventures in which the Company has a controlling interest. At December 31, 2016, EastGroup had a controlling interest in
one
joint venture, the
80%
owned University Business Center. At December 31,
2015
and
2014
, the Company had a controlling interest in
two
joint ventures: the
80%
owned University Business Center and the
80%
owned Castilian Research Center. During the second quarter of 2016, Castilian Research Center was sold, and the joint venture was subsequently terminated. The Company records
100%
of the joint ventures’ assets, liabilities, revenues and expenses with noncontrolling interests provided for in accordance with the joint venture agreements. The equity method of accounting is used for the Company’s
50%
undivided tenant-in-common interest in Industry Distribution Center II. All significant intercompany transactions and accounts have been eliminated in consolidation.
|
(b)
|
Income Taxes
|
EastGroup, a Maryland corporation, has qualified as a real estate investment trust (REIT) under Sections 856-860 of the Internal Revenue Code and intends to continue to qualify as such. To maintain its status as a REIT, the Company is required to distribute at least
90%
of its ordinary taxable income to its stockholders. If the Company has a capital gain, it has the option of (i) deferring recognition of the capital gain through a tax-deferred exchange, (ii) declaring and paying a capital gain dividend on any recognized net capital gain resulting in no corporate level tax, or (iii) retaining and paying corporate income tax on its net long-term capital gain, with the shareholders reporting their proportional share of the undistributed long-term capital gain and receiving a credit or refund of their share of the tax paid by the Company. The Company distributed all of its
2016
,
2015
and
2014
taxable income to its stockholders. Accordingly, no significant provisions for income taxes were necessary. The following table summarizes the federal income tax treatment for all distributions by the Company for the years ended
2016
,
2015
and
2014
.
Federal Income Tax Treatment of Share Distributions
|
|
Years Ended December 31,
|
||||||||
|
|
2016
|
2015
|
2014
|
||||||
|
Common Share Distributions:
|
|
|
|
||||||
|
Ordinary dividends
|
$
|
2.10494
|
|
2.24258
|
|
2.02398
|
|
||
|
Nondividend distributions
|
0.05202
|
|
0.02774
|
|
0.08974
|
|
|||
|
Unrecaptured Section 1250 capital gain
|
0.12872
|
|
0.06968
|
|
0.09470
|
|
|||
|
Other capital gain
|
0.15432
|
|
—
|
|
0.01158
|
|
|||
|
Total Common Share Distributions
|
$
|
2.44000
|
|
2.34000
|
|
2.22000
|
|
||
EastGroup applies the principles of Financial Accounting Standards Board (FASB) Accounting Standards Codification (ASC) 740,
Income Taxes,
when evaluating and accounting for uncertainty in income taxes. With few exceptions, the Company’s 2012 and earlier tax years are closed for examination by U.S. federal, state and local tax authorities. In accordance with the provisions of ASC 740, the Company had no significant uncertain tax positions as of
December 31, 2016
and
2015
.
The Company’s income may differ for tax and financial reporting purposes principally because of (1) the timing of the deduction for the provision for possible losses and losses on investments, (2) the timing of the recognition of gains or losses from the sale of investments, (3) different depreciation methods and lives, (4) real estate properties having a different basis for tax and financial reporting purposes, (5) mortgage loans having a different basis for tax and financial reporting purposes, thereby producing different gains upon collection of these loans, and (6) differences in book and tax allowances and timing for stock-based compensation expense.
|
(c)
|
Income Recognition
|
Minimum rental income from real estate operations is recognized on a straight-line basis. The straight-line rent calculation on leases includes the effects of rent concessions and scheduled rent increases, and the calculated straight-line rent income is recognized over the lives of the individual leases. The Company maintains allowances for doubtful accounts receivable, including straight-line rents receivable, based upon estimates determined by management. Management specifically analyzes aged receivables, customer credit-worthiness and current economic trends when evaluating the adequacy of the allowance for doubtful accounts.
49
EASTGROUP PROPERTIES, INC. AND SUBSIDIARIES
NOTES TO CONSOLIDATED FINANCIAL STATEMENTS
Revenue is recognized on payments received from tenants for early terminations after all criteria have been met in accordance with ASC 840,
Leases.
The Company recognizes gains on sales of real estate in accordance with the principles set forth in ASC 360,
Property, Plant and Equipment
. Upon closing of real estate transactions, the provisions of ASC 360 require consideration for the transfer of rights of ownership to the purchaser, receipt of an adequate cash down payment from the purchaser, adequate continuing investment by the purchaser and no substantial continuing involvement by the Company. If the requirements for recognizing gains have not been met, the sale and related costs are recorded, but the gain is deferred and recognized by a method other than the full accrual method.
The Company recognizes interest income on mortgage loans on the accrual method unless a significant uncertainty of collection exists. If a significant uncertainty exists, interest income is recognized as collected. If applicable, discounts on mortgage loans receivable are amortized over the lives of the loans using a method that does not differ materially from the interest method. The Company evaluates the collectibility of both interest and principal on each of its loans to determine whether the loans are impaired. A loan is considered to be impaired when, based on current information and events, it is probable that the Company will be unable to collect all amounts due according to the existing contractual terms. When a loan is considered to be impaired, the amount of loss is calculated by comparing the recorded investment to the value determined by discounting the expected future cash flows at the loan’s effective interest rate or to the fair value of the underlying collateral (if the loan is collateralized) less costs to sell. As of
December 31, 2016
and
2015
, there was no significant uncertainty of collection; therefore, interest income was recognized. As of
December 31, 2016
and
2015
, the Company determined that no allowance for collectibility of the mortgage loans receivable was necessary.
|
(d)
|
Real Estate Properties
|
EastGroup has one reportable segment–industrial properties. These properties are concentrated in major Sunbelt markets of the United States, primarily in the states of Florida, Texas, Arizona, California and North Carolina, have similar economic characteristics and also meet the other criteria that permit the properties to be aggregated into one reportable segment.
The Company reviews long-lived assets for impairment whenever events or changes in circumstances indicate the carrying amount of an asset may not be recoverable. Recoverability of assets to be held and used is measured by a comparison of the carrying amount of an asset to future undiscounted net cash flows (including estimated future expenditures necessary to substantially complete the asset) expected to be generated by the asset. If the carrying amount of an asset exceeds its estimated future cash flows, an impairment charge is recognized for the amount by which the carrying amount of the asset exceeds the fair value of the asset. As of
December 31, 2016
and
2015
, the Company did not identify any significant impairment charges which should be recorded.
Depreciation of buildings and other improvements is computed using the straight-line method over estimated useful lives of generally
40
years for buildings and
3
to
15
years for improvements. Building improvements are capitalized, while maintenance and repair expenses are charged to expense as incurred. Significant renovations and improvements that improve or extend the useful life of the assets are capitalized. Depreciation expense was
$63,793,000
,
$59,882,000
and $
57,303,000
for
2016
,
2015
and
2014
, respectively.
|
(e)
|
Development
|
During the period in which a property is under development, costs associated with development (i.e., land, construction costs, interest expense, property taxes and other direct and indirect costs associated with development) are aggregated into the total capitalized costs of the property. Included in these costs are management’s estimates for the portions of internal costs (primarily personnel costs) deemed related to such development activities. The internal costs are allocated to specific development properties based on development activity. As the property becomes occupied, depreciation commences on the occupied portion of the building, and costs are capitalized only for the portion of the building that remains vacant. When the property becomes
80%
occupied or
one
year after completion of the shell construction (whichever comes first), capitalization of development costs, including interest expense, property taxes and internal personnel costs, ceases. The properties are then transferred to
Real estate properties
, and depreciation commences on the entire property (excluding the land).
|
(f)
|
Real Estate Held for Sale
|
The Company considers a real estate property to be held for sale when it meets the criteria established under ASC 360,
Property, Plant and Equipment,
including when it is probable that the property will be sold within a year. Real estate properties held for sale are reported at the lower of the carrying amount or fair value less estimated costs to sell and are not depreciated while they are held for sale.
50
EASTGROUP PROPERTIES, INC. AND SUBSIDIARIES
NOTES TO CONSOLIDATED FINANCIAL STATEMENTS
In accordance with FASB Accounting Standards Update (ASU) 2014-08,
Presentation of Financial Statements (Topic 205) and Property, Plant, and Equipment (Topic 360), Reporting Discontinued Operations and Disclosures of Disposals of Components of an Entity,
the Company would report a disposal of a component of an entity or a group of components of an entity in discontinued operations if the disposal represents a strategic shift that has (or will have) a major effect on an entity's operations and financial results when the component or group of components meets the criteria to be classified as held for sale or when the component or group of components is disposed of by sale or other than by sale. In addition, the Company would provide additional disclosures about both discontinued operations and the disposal of an individually significant component of an entity that does not qualify for discontinued operations presentation in the financial statements. EastGroup performs an analysis of properties sold to determine whether the sales qualify for discontinued operations presentation.
|
(g)
|
Derivative Instruments and Hedging Activities
|
EastGroup applies ASC 815,
Derivatives and Hedging
, which requires all entities with derivative instruments to disclose information regarding how and why the entity uses derivative instruments and how derivative instruments and related hedged items affect the entity’s financial position, financial performance and cash flows. See Note 13 for a discussion of the Company's derivative instruments and hedging activities.
|
(h)
|
Cash Equivalents
|
The Company considers all highly liquid investments with a maturity of three months or less when purchased to be cash equivalents.
|
(i)
|
Amortization
|
Debt origination costs are deferred and amortized over the term of each loan using the effective interest method. Amortization of debt issuance costs was
$1,534,000
,
$1,336,000
and
$1,236,000
for
2016
,
2015
and
2014
, respectively. Amortization of facility fees was
$670,000
,
$608,000
and
$563,000
for
2016
,
2015
and
2014
, respectively.
Leasing costs are deferred and amortized using the straight-line method over the term of the lease. Leasing costs paid during the period are included in
Changes in other assets and other liabilities
in the Investing Activities section on the Consolidated Statements of Cash Flows. Leasing costs amortization expense was
$9,932,000
,
$9,038,000
and
$8,284,000
for
2016
,
2015
and
2014
, respectively.
Amortization expense for in-place lease intangibles is disclosed below in
Real Estate Property Acquisitions and Acquired Intangibles
.
|
(j)
|
Real Estate Property Acquisitions and Acquired Intangibles
|
Upon acquisition of real estate properties, EastGroup applies the principles of ASC 805,
Business Combinations.
Prior to the Company's adoption of ASU 2017-01,
Business Combinations (Topic 805): Clarifying the Definition of a Business,
effective October 1, 2016, acquisition-related costs were recognized as expenses in the periods in which the costs were incurred and the services were received.
As discussed in Note 1(o), beginning with acquisitions after October 1, 2016, the Company follows the guidance in ASU 2017-01, which provides a new framework for determining whether transactions should be accounted for as acquisitions (or disposals) of assets or businesses. Under the new guidance, companies are required to utilize an initial screening test to determine whether substantially all of the fair value of the gross assets acquired (or disposed of) is concentrated in a single identifiable asset or a group of similar identifiable assets; if so, the set is not a business. EastGroup has determined that its real estate property acquisitions in the fourth quarter of 2016 are considered to be acquisitions of groups of similar identifiable assets; therefore, the acquisitions are not considered to be acquisitions of a business. As a result, the Company has capitalized acquisition costs related to its fourth quarter 2016 acquisitions.
The FASB Codification provides guidance on how to properly determine the allocation of the purchase price among the individual components of both the tangible and intangible assets based on their respective fair values. Goodwill for business combinations is recorded when the purchase price exceeds the fair value of the assets and liabilities acquired. Factors considered by management in allocating the cost of the properties acquired include an estimate of carrying costs during the expected lease-up periods considering current market conditions and costs to execute similar leases. The allocation to tangible assets (land, building and improvements) is based upon management’s determination of the value of the property as if it were vacant using discounted cash flow models. The Company determines whether any financing assumed is above or below market based upon comparison to similar financing terms for similar properties. The cost of the properties acquired may be adjusted based on indebtedness assumed from the seller that is determined to be above or below market rates.
The purchase price is also allocated among the following categories of intangible assets: the above or below market component of in-place leases, the value of in-place leases, and the value of customer relationships. The value allocable to the above or below
51
EASTGROUP PROPERTIES, INC. AND SUBSIDIARIES
NOTES TO CONSOLIDATED FINANCIAL STATEMENTS
market component of an acquired in-place lease is determined based upon the present value (using a discount rate reflecting the risks associated with the acquired leases) of the difference between (i) the contractual amounts to be paid pursuant to the lease over its remaining term, and (ii) management’s estimate of the amounts that would be paid using fair market rates over the remaining term of the lease. The amounts allocated to above and below market leases are included in
Other assets
and
Other liabilities
, respectively, on the Consolidated Balance Sheets and are amortized to rental income over the remaining terms of the respective leases. The total amount of intangible assets is further allocated to in-place lease values and customer relationship values based upon management’s assessment of their respective values. These intangible assets are included in
Other assets
on the Consolidated Balance Sheets and are amortized over the remaining term of the existing lease, or the anticipated life of the customer relationship, as applicable.
Amortization of above and below market leases increased rental income by
$488,000
,
$448,000
and
$421,000
in
2016
,
2015
and
2014
, respectively. Amortization expense for in-place lease intangibles was
$4,210,000
,
$4,370,000
and
$4,727,000
for
2016
,
2015
and
2014
, respectively.
Projected amortization of in-place lease intangibles for the next five years as of
December 31, 2016
is as follows:
|
Years Ending December 31,
|
(In thousands)
|
|||
|
2017
|
$
|
3,572
|
|
|
|
2018
|
2,545
|
|
||
|
2019
|
2,042
|
|
||
|
2020
|
1,551
|
|
||
|
2021
|
1,150
|
|
||
During 2016, the Company acquired the following development-stage properties: Parc North in Ft. Worth (Dallas), Weston Commerce Park in Weston (South Florida), and Jones Corporate Park in Las Vegas. At the time of acquisition, the properties were classified as under construction or in the lease-up phase of development.
Also in 2016, the Company acquired Flagler Center, a
three
-building business distribution complex in Jacksonville, Florida.
The properties purchased in 2016 were acquired for a total cost of
$112,158,000
, of which
$22,228,000
was allocated to
Real estate properties
and
$84,490,000
was allocated to
Development.
EastGroup allocated
$29,164,000
of the total purchase price to land using third party land valuations for the Dallas, South Florida, Las Vegas and Jacksonville markets. The market values are considered to be Level 3 inputs as defined by ASC 820,
Fair Value Measurements and Disclosures
(see Note 18 for additional information on ASC 820). Intangibles associated with the purchase of real estate were allocated as follows:
$5,941,000
to in-place lease intangibles,
$393,000
to above market leases (included in
Other assets
on the Consolidated Balance Sheets), and
$894,000
to below market leases (included in
Other liabilities
on the Consolidated Balance Sheets). These costs are amortized over the remaining lives of the associated leases in place at the time of acquisition.
During 2015, the Company acquired Southpark Corporate Center and Springdale Business Center, both in Austin, Texas, for a total cost of
$31,574,000
, of which
$28,648,000
was allocated to
Real estate properties
. The Company allocated
$5,494,000
of the total purchase price to land using third party land valuations for the Austin market. The market values are considered to be Level 3 inputs as defined by ASC 820. Intangibles associated with the purchase of real estate were allocated as follows:
$3,453,000
to in-place lease intangibles and
$527,000
to below market leases.
During 2014, EastGroup acquired the following operating properties: Ridge Creek Distribution Center III in Charlotte, North Carolina; Colorado Crossing Distribution Center in Austin, Texas; and Ramona Distribution Center in Chino, California. The Company purchased these properties for a total cost of
$51,652,000
, of which
$47,477,000
was allocated to
Real estate properties
. The Company allocated
$10,822,000
of the total purchase price to land using third party land valuations for the Charlotte, Austin and Chino markets. The market values are considered to be Level 3 inputs as defined by ASC 820. Intangibles associated with the purchase of real estate were allocated as follows:
$5,074,000
to in-place lease intangibles,
$4,000
to above market leases and
$903,000
to below market leases. The Company paid cash of
$48,805,000
for the properties and intangibles acquired, assumed a mortgage of
$2,617,000
and recorded a premium of
$230,000
to adjust the mortgage loan assumed to fair value.
The Company periodically reviews the recoverability of goodwill (at least annually) and the recoverability of other intangibles (on a quarterly basis) for possible impairment. In management’s opinion, no impairment of goodwill and other intangibles existed at December 31,
2016
and
2015
.
52
EASTGROUP PROPERTIES, INC. AND SUBSIDIARIES
NOTES TO CONSOLIDATED FINANCIAL STATEMENTS
|
(k)
|
Stock-Based Compensation
|
In May 2004, the stockholders of the Company approved the EastGroup Properties, Inc. 2004 Equity Incentive Plan ("the 2004 Plan"), which was further amended by the Board of Directors in September 2005 and December 2006. This plan authorized the issuance of common stock to employees in the form of options, stock appreciation rights, restricted stock, deferred stock units, performance shares, bonus stock or stock in lieu of cash compensation.
In April 2013, the Board of Directors adopted the EastGroup Properties, Inc. 2013 Equity Incentive Plan (the “2013 Equity Plan”) upon the recommendation of the Compensation Committee; the 2013 Equity Plan was approved by the Company's stockholders and became effective May 29, 2013. The 2013 Equity Plan replaced the 2004 Plan and the 2005 Directors Equity Incentive Plan. Typically, the Company issues new shares to fulfill stock grants or upon the exercise of stock options.
EastGroup applies the provisions of ASC 718,
Compensation – Stock Compensation
, to account for its stock-based compensation plans. ASC 718 requires that the compensation cost relating to share-based payment transactions be recognized in the financial statements and that the cost be measured on the fair value of the equity or liability instruments issued. The cost for market-based awards and awards that only require service are expensed on a straight-line basis over the requisite service periods. The cost for performance-based awards is determined using the graded vesting attribution method which recognizes each separate vesting portion of the award as a separate award on a straight-line basis over the requisite service period. This method accelerates the expensing of the award compared to the straight-line method.
The total compensation expense for service and performance based awards is based upon the fair market value of the shares on the grant date, adjusted for estimated forfeitures. The grant date fair value for awards that have been granted and are subject to a future market condition (total shareholder return) are determined using a simulation pricing model developed to specifically accommodate the unique features of the awards (the Company did not have any such awards in 2016, 2015 or 2014).
During the restricted period for awards no longer subject to contingencies, the Company accrues dividends and holds the certificates for the shares; however, the employee can vote the shares. Share certificates and dividends are delivered to the employee as they vest.
|
(l)
|
Earnings Per Share
|
The Company applies ASC 260,
Earnings Per Share
, which requires companies to present basic and diluted earnings per share (EPS). Basic EPS represents the amount of earnings for the period attributable to each share of common stock outstanding during the reporting period. The Company’s basic EPS is calculated by dividing
Net Income Attributable to EastGroup Properties, Inc. Common Stockholders
by the weighted average number of common shares outstanding. The weighted average number of common shares outstanding does not include any potentially dilutive securities or any unvested restricted shares of common stock. These unvested restricted shares, although classified as issued and outstanding, are considered forfeitable until the restrictions lapse and will not be included in the basic EPS calculation until the shares are vested.
Diluted EPS represents the amount of earnings for the period attributable to each share of common stock outstanding during the reporting period and to each share that would have been outstanding assuming the issuance of common shares for all dilutive potential common shares outstanding during the reporting period. The Company calculates diluted EPS by dividing
Net Income Attributable to EastGroup Properties, Inc. Common Stockholders
by the weighted average number of common shares outstanding plus the dilutive effect of unvested restricted stock. The dilutive effect of unvested restricted stock is determined using the treasury stock method.
|
(m)
|
Use of Estimates
|
The preparation of financial statements in conformity with U.S. generally accepted accounting principles (GAAP) requires management to make estimates and assumptions that affect the reported amounts of assets and liabilities and revenues and expenses during the reporting period and to disclose material contingent assets and liabilities at the date of the financial statements. Actual results could differ from those estimates.
|
(n)
|
Risks and Uncertainties
|
The state of the overall economy can significantly impact the Company’s operational performance and thus impact its financial position. Should EastGroup experience a significant decline in operational performance, it may affect the Company’s ability to make distributions to its shareholders, service debt, or meet other financial obligations.
53
EASTGROUP PROPERTIES, INC. AND SUBSIDIARIES
NOTES TO CONSOLIDATED FINANCIAL STATEMENTS
|
(o)
|
Recent Accounting Pronouncements
|
EastGroup has evaluated all ASUs recently released by the FASB through the date the financial statements were issued and determined that the following ASUs apply to the Company.
In May 2014, the FASB issued ASU 2014-09,
Revenue from Contracts with Customers,
which requires an entity to recognize the amount of revenue to which it expects to be entitled for the transfer of promised goods or services to customers. The FASB issued further guidance in ASU 2016-12,
Revenue from Contracts with Customers (Topic 606): Narrow-Scope Improvements and Practical Expedients,
that provides clarifying guidance in certain narrow areas and adds some practical expedients. ASU 2014-09 will replace most existing revenue recognition guidance in U.S. GAAP when it becomes effective. The effective date of ASU 2014-09 was extended by one year by ASU 2015-14,
Revenue from Contracts with Customers (Topic 606): Deferral of the Effective Date.
The new standard is effective for the Company on January 1, 2018. The standard permits the use of either the retrospective or cumulative effect transition method, and the Company is evaluating which transition method it will elect. The Company is also in the process of evaluating the effect that ASU 2014-09 will have on its consolidated financial statements and related disclosures beginning with the Form 10-Q for the period ending March 31, 2018. EastGroup has performed an initial impact assessment; because most of the Company's revenues are from leases (which are governed by other FASB accounting standards) and sales of real estate assets (for which the accounting is largely unchanged by the new revenue recognition standard), the impact of adopting ASU 2014-09 is not expected to be material to the Company.
In February 2015, the FASB issued ASU 2015-02,
Consolidation (Topic 810): Amendments to Consolidation Analysis,
under which all legal entities are subject to reevaluation under the revised consolidation model. The ASU modifies whether limited partnerships and similar legal entities are variable interest entities (VIEs) or voting interest entities, eliminates the presumption that a general partner should consolidate a limited partnership, affects the consolidation analysis of reporting entities that are involved with VIEs, and provides a scope exception from consolidation guidance for reporting entities with interests in legal entities that are required to comply with or operate in accordance with requirements that are similar to those in Rule 2a-7 of the Investment Company Act of 1940 for registered money market funds. EastGroup adopted ASU 2015-02 effective January 1, 2016, and the adoption of ASU 2015-02 had an immaterial impact on the Company's financial condition and results of operations.
In April 2015, the FASB issued ASU 2015-03,
Simplifying the Presentation of Debt Issuance Costs
, which requires that debt issuance costs related to a recognized debt liability be presented in the balance sheet as a direct deduction from the carrying amount of that debt liability. For public business entities, the ASU was effective for financial statements issued for fiscal years beginning after December 15, 2015, and interim periods within those fiscal years. Entities are to apply the new guidance on a retrospective basis, wherein the balance sheet of each individual period presented should be adjusted to reflect the period-specific effects of applying the new guidance. EastGroup adopted ASU 2015-03 effective January 1, 2016. Prior to adoption, the Company included debt issuance costs in
Other assets
on the Consolidated Balance Sheets. Beginning with the Form 10-Q for the period ended March 31, 2016, EastGroup changed its presentation of debt issuance costs for all periods presented; the Company now presents debt issuance costs as direct deductions from the carrying amounts of its debt liabilities both on the Balance Sheet and in the Notes to Consolidated Financial Statements. As a result of the adoption of ASU 2015-03, the Company adjusted its December 31, 2015 Balance Sheet as follows:
|
Balance Sheet Items as of December 31, 2015:
|
As Presented in the Company’s 2015 Form 10-K
|
As Presented in the Company’s Form 10-Q Beginning With the Period Ended March 31, 2016
|
|||||
|
(In thousands)
|
|||||||
|
Other assets
|
$
|
96,186
|
|
91,858
|
|
||
|
Total assets
|
1,666,232
|
|
1,661,904
|
|
|||
|
Secured debt
|
351,401
|
|
350,285
|
|
|||
|
Unsecured debt
|
530,000
|
|
528,210
|
|
|||
|
Unsecured bank credit facilities
|
150,836
|
|
149,414
|
|
|||
|
Total liabilities
|
1,107,031
|
|
1,102,703
|
|
|||
|
Total liabilities and equity
|
1,666,232
|
|
1,661,904
|
|
|||
In January 2016, the FASB issued ASU 2016-01,
Financial Instruments - Overall (Subtopic 825-10): Recognition and Measurement of Financial Assets and Financial Liabilities,
which requires public business entities to use the exit price notion when measuring the fair value of financial instruments for disclosure purposes, requires separate presentation of financial assets and financial liabilities by measurement category and form of financial asset, and eliminates the requirement for public business entities to
54
EASTGROUP PROPERTIES, INC. AND SUBSIDIARIES
NOTES TO CONSOLIDATED FINANCIAL STATEMENTS
disclose the methods and significant assumptions used to estimate the fair value that is required to be disclosed for financial instruments measured at amortized costs on the balance sheet. EastGroup plans to adopt ASU 2016-01 effective January 1, 2018. The Company does not anticipate the adoption of ASU 2016-01 will have a material impact on the Company's financial condition or results of operations.
In February 2016, the FASB issued ASU 2016-02,
Leases (Topic 842),
which requires lessees to recognize the following for all leases (with the exception of short-term leases) at the commencement date: (1) a lease liability, which is a lessee's obligation to make lease payments arising from a lease, measured on a discounted basis; and (2) a right-of-use asset, which is an asset that represents the lessee's right to use, or control the use of, a specified asset for the lease term. The Company is a lessee on a limited number of leases, including office and ground leases, and the Company anticipates the related impact of ASU 2016-02 will not be material to its overall financial condition and results of operations. Lessor accounting is largely unchanged under ASU 2016-02. The Company's primary revenue is rental income; as such, the Company is a lessor on a significant number of leases. The Company is continuing to evaluate the potential impacts of the ASU and believes it will continue to account for its leases in substantially the same manner. The most significant change for the Company related to lessor accounting relates to the new standard's narrow definition of initial direct costs for leases; the new definition will result in certain costs (primarily legal costs related to lease negotiations) being expensed rather than capitalized upon adoption of the new standard. Public business entities are required to apply the amendments in ASU 2016-02 for fiscal years beginning after December 15, 2018, including interim periods within those fiscal years. EastGroup plans to adopt ASU 2016-02 effective January 1, 2019. The Company is continuing the process of evaluating and quantifying the effect that ASU 2016-02 will have on its consolidated financial statements and related disclosures beginning with the Form 10-Q for the period ending March 31, 2019.
In March 2016, the FASB issued ASU 2016-09,
Compensation - Stock Compensation (Topic 718): Improvements to Employee Share-Based Payment Accounting
. The ASU is intended to improve the accounting for share-based payments and affects all organizations that issue share-based payment awards to their employees. Several aspects of the accounting for share-based payment awards are simplified with the ASU, including income tax consequences, classification of awards as equity or liabilities and classification on the Consolidated Statements of Cash Flows. ASU 2016-09 is effective for public business entities for annual periods beginning after December 15, 2016, and interim periods within those fiscal years; early adoption is permitted. EastGroup adopted ASU 2016-09 effective January 1, 2017. As a result, the Company will elect to reverse compensation cost of any forfeited awards when they occur and will continue to classify the cash flows resulting from remitting cash to the tax authorities for the payment of taxes on the vesting of share-based payment awards as a financing activity on the Consolidated Statements of Cash Flows. In addition, upon vesting of share-based payments, the Company will withhold up to the maximum individual statutory tax rate and classify the entire award as equity. The adoption of ASU 2016-09 did not have a material impact on the Company's financial condition or results of operations.
In August 2016, the FASB issued ASU 2016-15,
Statement of Cash Flows (Topic 230): Classification of Certain Cash Receipts and Cash Payments,
which addresses certain cash flow issues, including how debt prepayments or debt extinguishment costs and distributions received from equity method investees are presented. ASU 2016-15 is effective for public business entities for annual periods beginning after December 15, 2017, and interim periods within those fiscal years. Early adoption is permitted, and the Company has adopted ASU 2016-15 effective January 1, 2017 and will provide the necessary disclosures beginning with its Form 10-Q for the period ending March 31, 2017. The Company does not believe the adoption of ASU 2016-15 has a material impact on the Company's financial condition or results of operations.
In January 2017, the FASB issued ASU 2017-01,
Business Combinations (Topic 805): Clarifying the Definition of a Business
. The ASU is intended to provide a new framework for determining whether transactions should be accounted for as acquisitions (or disposals) of assets or businesses. Under the new guidance, companies are required to utilize an initial screening test to determine whether substantially all of the fair value of the gross assets acquired (or disposed of) is concentrated in a single identifiable asset or a group of similar identifiable assets; if so, the set is not a business. The Company has determined that some of its real estate property acquisitions may be considered to be acquisitions of groups of similar identifiable assets; therefore, the acquisitions are not considered to be acquisitions of a business. ASU 2017-01 is effective for public business entities for annual periods beginning after December 15, 2017, and interim periods within those fiscal years; early adoption is permitted and may be applied to transactions that have not been reported in financial statements that have been issued or made available for issuance. EastGroup adopted ASU 2017-01 for transactions beginning on October 1, 2016. As a result, the Company has capitalized acquisition costs related to its fourth quarter 2016 acquisitions as they were determined not to be acquisitions of a business.
In January 2017, the FASB issued ASU 2017-04,
Intangibles - Goodwill and Others (Topic 350): Simplifying the Test for Goodwill Impairment,
which simplifies the measurement of goodwill impairment by eliminating the requirement of performing a hypothetical purchase price allocation to measure goodwill impairment. ASU 2017-04 is effective for public business entities for annual periods beginning after December 15, 2019, and interim periods within those fiscal years. Early adoption is permitted, and the Company has adopted ASU 2017-04 effective January 1, 2017, and will apply the new guidance for goodwill impairment tests with
55
EASTGROUP PROPERTIES, INC. AND SUBSIDIARIES
NOTES TO CONSOLIDATED FINANCIAL STATEMENTS
measurement dates after January 1, 2017. EastGroup does not believe the adoption of ASU 2017-04 has a material impact on the Company's financial condition or results of operations.
|
(p)
|
|
The Company classifies changes in book overdraft in which the bank has not advanced cash to the Company to cover outstanding checks as an operating activity. Such amounts are included in
Accounts payable, accrued expenses and prepaid rent
in the Operating Activities section on the Consolidated Statements of Cash Flows.
|
(q)
|
Reclassifications
|
Certain reclassifications have been made in the
2015
and
2014
consolidated financial statements to conform to the
2016
presentation.
|
(2)
|
REAL ESTATE PROPERTIES
|
The Company’s
Real estate properties
and
Development
at
December 31, 2016
and
2015
were as follows:
|
|
December 31,
|
|||||
|
2016
|
2015
|
|||||
|
(In thousands)
|
||||||
|
Real estate properties:
|
|
|
||||
|
Land
|
$
|
308,931
|
|
301,435
|
|
|
|
Buildings and building improvements
|
1,435,309
|
|
1,393,688
|
|
||
|
Tenant and other improvements
|
368,833
|
|
353,884
|
|
||
|
Development
|
293,908
|
|
170,441
|
|
||
|
|
2,406,981
|
|
2,219,448
|
|
||
|
Less accumulated depreciation
|
(694,250
|
)
|
(657,454
|
)
|
||
|
|
$
|
1,712,731
|
|
1,561,994
|
|
|
EastGroup acquired operating properties during
2016
,
2015
and
2014
as discussed in Note 1(j).
In 2016, the Company sold the following operating properties: Northwest Point Distribution and Service Centers, North Stemmons II and III, America Plaza, Lockwood Distribution Center, West Loop Distribution Center 1 & 2, two of its four Interstate Commons Distribution Center buildings, Castilian Research Center and Memphis I.
In 2015, EastGroup sold one operating property, the last of its three Ambassador Row Warehouses.
In 2014, the Company sold the following operating properties: Northpoint Commerce Center, Tampa West Distribution Center VI, Clay Campbell Distribution Center, Kirby Business Center and two of its three Ambassador Row Warehouses.
The results of operations and gains and losses on sales for the properties sold during the periods presented are reported in continuing operations on the Consolidated Statements of Income and Comprehensive Income. The gains and losses on sales are included in
Gain, net of loss, on sales of real estate investments.
The Company did not classify any properties as held for sale as of
December 31, 2016
and
2015
.
56
EASTGROUP PROPERTIES, INC. AND SUBSIDIARIES
NOTES TO CONSOLIDATED FINANCIAL STATEMENTS
Sales of Real Estate
A summary of
Gain, net of loss, on sales of real estate investments
for the years ended
December 31, 2016
,
2015
and
2014
follows:
|
Real Estate Properties
|
Location
|
Size
(in Square Feet)
|
Date Sold
|
Net Sales Price
|
Basis
|
Recognized Gain
|
|||||||||||
|
|
|
|
|
(In thousands)
|
|||||||||||||
|
2016
|
|
|
|
|
|
|
|||||||||||
|
Northwest Point Distribution
and Service Centers |
Houston, TX
|
232,000
|
|
02/12/2016
|
$
|
15,189
|
|
5,080
|
|
10,109
|
|
||||||
|
North Stemmons III
|
Dallas, TX
|
60,000
|
|
03/04/2016
|
3,131
|
|
1,908
|
|
1,223
|
|
|||||||
|
North Stemmons II
|
Dallas, TX
|
26,000
|
|
04/12/2016
|
1,203
|
|
765
|
|
438
|
|
|||||||
|
Lockwood Distribution Center
|
Houston, TX
|
392,000
|
|
04/18/2016
|
14,024
|
|
4,154
|
|
9,870
|
|
|||||||
|
West Loop Distribution Center 1 & 2
|
Houston, TX
|
161,000
|
|
04/19/2016
|
13,154
|
|
3,564
|
|
9,590
|
|
|||||||
|
America Plaza
|
Houston, TX
|
121,000
|
|
04/28/2016
|
7,938
|
|
3,378
|
|
4,560
|
|
|||||||
|
Interstate Commons Distribution
Center 1 & 2 |
Phoenix, AZ
|
142,000
|
|
05/31/2016
|
9,906
|
|
3,568
|
|
6,338
|
|
|||||||
|
Castilian Research Center
(1)
|
Santa Barbara, CA
|
30,000
|
|
06/28/2016
|
7,698
|
|
7,513
|
|
185
|
|
|||||||
|
Memphis I
|
Memphis, TN
|
92,000
|
|
12/16/2016
|
1,482
|
|
1,625
|
|
(143
|
)
|
|||||||
|
Total for 2016
|
$
|
73,725
|
|
31,555
|
|
42,170
|
|
||||||||||
|
2015
|
|||||||||||||||||
|
Ambassador Row Warehouse
|
Dallas, TX
|
185,000
|
|
04/13/2015
|
$
|
4,998
|
|
2,095
|
|
2,903
|
|
||||||
|
2014
|
|
|
|
|
|
|
|
|
|
||||||||
|
Northpoint Commerce Center
|
Oklahoma City, OK
|
58,000
|
|
03/28/2014
|
$
|
3,471
|
|
3,376
|
|
95
|
|
||||||
|
Tampa West Distribution Center VI
|
Tampa, FL
|
9,000
|
|
07/08/2014
|
682
|
|
446
|
|
236
|
|
|||||||
|
Clay Campbell Distribution Center
|
Houston, TX
|
118,000
|
|
09/30/2014
|
7,690
|
|
2,826
|
|
4,864
|
|
|||||||
|
Kirby Business Center
|
Houston, TX
|
125,000
|
|
09/30/2014
|
5,306
|
|
2,989
|
|
2,317
|
|
|||||||
|
Ambassador Row Warehouses
|
Dallas, TX
|
132,000
|
|
12/30/2014
|
3,358
|
|
1,682
|
|
1,676
|
|
|||||||
|
Total for 2014
|
|
|
|
$
|
20,507
|
|
11,319
|
|
9,188
|
|
|||||||
|
(1)
|
EastGroup owned
80%
of Castilian Research Center through a joint venture. The information shown for this transaction also includes the
20%
attributable to the Company's noncontrolling interest partner.
|
The table above includes sales of operating properties; the Company also sold parcels of land during the years presented. During the year ended December 31, 2016, EastGroup sold parcels of land in Houston, Dallas and Orlando for
$5,400,000
and recognized a gain of
$733,000
. During the year ended December 31, 2015, EastGroup sold a small parcel of land in New Orleans for
$170,000
and recognized a gain of
$123,000
. During 2014, the Company sold a small parcel of land in Orlando for
$118,000
and recognized a gain of
$98,000
. The gains on sales of land are included in
Other
on the Consolidated Statements of Income and Comprehensive Income.
The Company’s development program as of
December 31, 2016
, was comprised of the properties detailed in the table below. Costs incurred include capitalization of interest costs during the period of construction. The interest costs capitalized on development properties for
2016
were
$5,340,000
compared to
$5,257,000
for
2015
and
$4,942,000
for
2014
. In addition, EastGroup capitalized internal development costs of
$3,789,000
during the year ended
December 31, 2016
, compared to
$4,467,000
during
2015
and
$4,040,000
in
2014
.
Total capital invested for development during
2016
was
$203,765,000
, which primarily consisted of costs of
$186,305,000
and
$5,272,000
as detailed in the development activity table below and costs of
$7,871,000
on development projects subsequent to transfer to
Real estate properties
. The capitalized costs incurred on development projects subsequent to transfer to
Real estate properties
include capital improvements at the properties and do not include other capitalized costs associated with development (i.e., interest expense, property taxes and internal personnel costs).
57
EASTGROUP PROPERTIES, INC. AND SUBSIDIARIES
NOTES TO CONSOLIDATED FINANCIAL STATEMENTS
|
DEVELOPMENT
|
|
Costs Incurred
|
|
Anticipated Building Conversion Date
|
||||||||||||||
|
Costs
Transferred
in 2016
(1)
|
For the
Year Ended
12/31/16
|
Cumulative
as of
12/31/16
|
Estimated
Total Costs
(2)
|
|||||||||||||||
|
|
(In thousands)
|
|||||||||||||||||
|
(Unaudited)
|
(Unaudited)
|
(Unaudited)
|
||||||||||||||||
|
LEASE-UP
|
Building Size (Square feet)
|
|
|
|
|
|||||||||||||
|
Eisenhauer Point 1 & 2, San Antonio, TX
|
201,000
|
|
$
|
—
|
|
9,016
|
|
15,776
|
|
17,000
|
|
01/17
|
||||||
|
South 35th Avenue, Phoenix, AZ
(3)
|
124,000
|
|
—
|
|
493
|
|
1,664
|
|
1,900
|
|
01/17
|
|||||||
|
Parc North 1-4, Dallas, TX
(4)
|
446,000
|
|
—
|
|
32,120
|
|
32,120
|
|
35,500
|
|
02/17
|
|||||||
|
Jones Corporate Park, Las Vegas, NV
(5)
|
416,000
|
|
—
|
|
39,540
|
|
39,540
|
|
43,700
|
|
04/17
|
|||||||
|
Ten Sky Harbor, Phoenix, AZ
|
64,000
|
|
—
|
|
1,613
|
|
5,265
|
|
6,200
|
|
04/17
|
|||||||
|
Steele Creek VI, Charlotte, NC
|
137,000
|
|
—
|
|
4,102
|
|
7,006
|
|
8,200
|
|
07/17
|
|||||||
|
Madison IV & V, Tampa, FL
|
145,000
|
|
1,069
|
|
6,456
|
|
7,525
|
|
9,600
|
|
10/17
|
|||||||
|
Total Lease-Up
|
1,533,000
|
|
1,069
|
|
93,340
|
|
108,896
|
|
122,100
|
|
||||||||
|
UNDER CONSTRUCTION
|
|
|
|
|
|
|
|
|
|
|
||||||||
|
Alamo Ridge III, San Antonio, TX
|
135,000
|
|
—
|
|
8,179
|
|
10,559
|
|
12,200
|
|
02/17
|
|||||||
|
Horizon V, Orlando, FL
|
141,000
|
|
2,891
|
|
1,544
|
|
4,435
|
|
9,900
|
|
07/17
|
|||||||
|
Horizon VII, Orlando, FL
|
109,000
|
|
2,344
|
|
4,547
|
|
6,891
|
|
8,300
|
|
01/18
|
|||||||
|
Alamo Ridge IV, San Antonio, TX
|
97,000
|
|
843
|
|
4,102
|
|
4,945
|
|
6,000
|
|
02/18
|
|||||||
|
Country Club V, Tucson, AZ
|
300,000
|
|
—
|
|
3,295
|
|
3,295
|
|
24,200
|
|
02/18
|
|||||||
|
CreekView 121 1 & 2, Dallas, TX
|
193,000
|
|
3,481
|
|
8,374
|
|
11,855
|
|
16,700
|
|
02/18
|
|||||||
|
Eisenhauer Point 3, San Antonio, TX
|
71,000
|
|
808
|
|
1,940
|
|
2,748
|
|
5,400
|
|
04/18
|
|||||||
|
Eisenhauer Point 4, San Antonio, TX
|
85,000
|
|
777
|
|
1,876
|
|
2,653
|
|
5,200
|
|
04/18
|
|||||||
|
SunCoast 4, Ft. Myers, FL
|
93,000
|
|
4,287
|
|
1,968
|
|
6,255
|
|
8,700
|
|
04/18
|
|||||||
|
Weston, Ft. Lauderdale, FL
(6)
|
134,000
|
|
—
|
|
14,281
|
|
14,281
|
|
15,900
|
|
05/18
|
|||||||
|
Total Under Construction
|
1,358,000
|
|
15,431
|
|
50,106
|
|
67,917
|
|
112,500
|
|
||||||||
|
PROSPECTIVE DEVELOPMENT (PRIMARILY LAND)
|
Estimated Building Size (Square feet)
|
|
|
|
|
|
|
|
|
|||||||||
|
Phoenix, AZ
|
261,000
|
|
—
|
|
406
|
|
3,893
|
|
||||||||||
|
Tucson, AZ
|
70,000
|
|
—
|
|
—
|
|
417
|
|
||||||||||
|
Ft. Myers, FL
|
570,000
|
|
(4,287
|
)
|
72
|
|
13,643
|
|
||||||||||
|
Miami, FL
|
850,000
|
|
—
|
|
27,244
|
|
27,244
|
|
||||||||||
|
Orlando, FL
|
662,000
|
|
(5,235
|
)
|
993
|
|
16,129
|
|
||||||||||
|
Tampa, FL
|
148,000
|
|
(1,069
|
)
|
111
|
|
3,681
|
|
||||||||||
|
Jackson, MS
|
28,000
|
|
—
|
|
—
|
|
706
|
|
||||||||||
|
Charlotte, NC
|
756,000
|
|
—
|
|
4,882
|
|
9,303
|
|
||||||||||
|
Dallas, TX
|
718,000
|
|
(3,481
|
)
|
7,677
|
|
12,322
|
|
||||||||||
|
El Paso, TX
|
251,000
|
|
—
|
|
—
|
|
2,444
|
|
||||||||||
|
Houston, TX
|
1,476,000
|
|
—
|
|
(3,213
|
)
|
21,374
|
|
||||||||||
|
San Antonio, TX
|
544,000
|
|
(2,428
|
)
|
4,687
|
|
5,939
|
|
||||||||||
|
Total Prospective Development
|
6,334,000
|
|
(16,500
|
)
|
42,859
|
|
117,095
|
|
||||||||||
|
|
9,225,000
|
|
$
|
—
|
|
186,305
|
|
293,908
|
|
|||||||||
|
DEVELOPMENTS COMPLETED AND TRANSFERRED TO REAL ESTATE PROPERTIES DURING 2016
|
Building Size (Square feet)
|
|
|
|
|
|
|
|
|
Building Conversion Date
|
||||||||
|
Alamo Ridge I, San Antonio, TX
|
96,000
|
|
$
|
—
|
|
26
|
|
7,378
|
|
02/16
|
||||||||
|
Alamo Ridge II, San Antonio, TX
|
62,000
|
|
—
|
|
28
|
|
4,167
|
|
02/16
|
|||||||||
|
Madison II & III, Tampa, FL
|
127,000
|
|
—
|
|
(14
|
)
|
7,403
|
|
02/16
|
|||||||||
|
West Road III, Houston, TX
|
78,000
|
|
—
|
|
57
|
|
4,839
|
|
03/16
|
|||||||||
|
Ten West Crossing 7, Houston, TX
|
68,000
|
|
—
|
|
91
|
|
4,163
|
|
04/16
|
|||||||||
|
West Road IV, Houston, TX
|
65,000
|
|
—
|
|
642
|
|
5,327
|
|
06/16
|
|||||||||
|
Horizon III, Orlando, FL
|
109,000
|
|
—
|
|
1,217
|
|
7,332
|
|
07/16
|
|||||||||
|
Kyrene 202 VI, Phoenix, AZ
|
123,000
|
|
—
|
|
631
|
|
7,651
|
|
09/16
|
|||||||||
|
ParkView 1-3, Dallas, TX
|
276,000
|
|
—
|
|
2,594
|
|
19,850
|
|
10/16
|
|||||||||
|
Total Transferred to Real Estate Properties
|
1,004,000
|
|
$
|
—
|
|
5,272
|
|
68,110
|
|
(7)
|
||||||||
|
(1)
|
Represents costs transferred from Prospective Development (primarily land) to Under Construction during the period. Negative amounts represent land inventory costs transferred to Under Construction.
|
|
(2)
|
Included in these costs are development obligations of
$25.5 million
and tenant improvement obligations of
$6.1 million
on properties under development.
|
|
(3)
|
This property was redeveloped from a manufacturing building to a multi-tenant distribution building.
|
|
(4)
|
This project, which was recently developed by the seller, was acquired by EastGroup on 7/8/16 and is considered to be in the lease-up phase.
|
|
(5)
|
This project, which was recently developed by the seller, was acquired by EastGroup on 11/15/16 and is considered to be in the lease-up phase.
|
|
(6)
|
This project was acquired by EastGroup on 11/1/16 and is being redeveloped.
|
|
(7)
|
Represents cumulative costs at the date of transfer.
|
58
EASTGROUP PROPERTIES, INC. AND SUBSIDIARIES
NOTES TO CONSOLIDATED FINANCIAL STATEMENTS
The following schedule indicates approximate future minimum rental receipts under non-cancelable leases for real estate properties by year as of
December 31, 2016
:
Future Minimum Rental Receipts Under Non-Cancelable Leases
|
Years Ending December 31,
|
(In thousands)
|
|||
|
2017
|
$
|
186,783
|
|
|
|
2018
|
159,858
|
|
||
|
2019
|
128,487
|
|
||
|
2020
|
96,423
|
|
||
|
2021
|
62,837
|
|
||
|
Thereafter
|
132,642
|
|
||
|
Total minimum receipts
|
$
|
767,030
|
|
|
Ground Leases
As of
December 31, 2016
, the Company owned
two
properties in Florida,
two
properties in Texas and
one
property in Arizona that are subject to ground leases. These leases have terms of
40
to
50
years, expiration dates of August 2031 to November 2037, and renewal options of
15
to
35
years, except for the one lease in Arizona which is automatically and perpetually renewed annually. Total ground lease expenditures for the years ended
December 31, 2016
,
2015
and
2014
were
$756,000
,
$756,000
and
$745,000
, respectively. Payments are subject to increases at
3
to
10
year intervals based upon the agreed or appraised fair market value of the leased premises on the adjustment date or the Consumer Price Index percentage increase since the base rent date. The following schedule indicates approximate future minimum ground lease payments for these properties by year as of
December 31, 2016
:
Future Minimum Ground Lease Payments
|
Years Ending December 31,
|
(In thousands)
|
|||
|
2017
|
$
|
756
|
|
|
|
2018
|
756
|
|
||
|
2019
|
756
|
|
||
|
2020
|
756
|
|
||
|
2021
|
756
|
|
||
|
Thereafter
|
10,430
|
|
||
|
Total minimum payments
|
$
|
14,210
|
|
|
|
(3)
|
UNCONSOLIDATED INVESTMENT
|
The Company owns a
50%
undivided tenant-in-common interest in Industry Distribution Center II, a
309,000
square foot warehouse distribution building in the City of Industry (Los Angeles), California. The building was constructed in
1998
and is
100%
leased through December 2018 to a single tenant who owns the other
50%
interest in the property. This investment is accounted for under the equity method of accounting and had a carrying value of
$7,681,000
at December 31,
2016
, and
$8,004,000
at December 31,
2015
.
|
(4)
|
MORTGAGE LOANS RECEIVABLE
|
As of December 31,
2016
and 2015, the Company had
two
mortgage loans receivable, both of which are classified as first mortgage loans, have effective interest rates of
5.25%
and mature in
October 2017
. Mortgage loans receivable are included in
Other assets
on the Consolidated Balance Sheets. See Note 5 for a summary of
Other assets
.
59
EASTGROUP PROPERTIES, INC. AND SUBSIDIARIES
NOTES TO CONSOLIDATED FINANCIAL STATEMENTS
|
(5)
|
OTHER ASSETS
|
A summary of the Company’s
Other assets
follows:
|
|
December 31,
|
|||||
|
2016
|
2015
|
|||||
|
(In thousands)
|
||||||
|
Leasing costs (principally commissions)
|
$
|
65,521
|
|
59,043
|
|
|
|
Accumulated amortization of leasing costs
|
(26,340
|
)
|
(23,455
|
)
|
||
|
Leasing costs (principally commissions), net of accumulated amortization
|
39,181
|
|
35,588
|
|
||
|
Straight-line rents receivable
|
28,369
|
|
26,482
|
|
||
|
Allowance for doubtful accounts on straight-line rents receivable
|
(76
|
)
|
(167
|
)
|
||
|
Straight-line rents receivable, net of allowance for doubtful accounts
|
28,293
|
|
26,315
|
|
||
|
Accounts receivable
|
6,824
|
|
5,615
|
|
||
|
Allowance for doubtful accounts on accounts receivable
|
(809
|
)
|
(394
|
)
|
||
|
Accounts receivable, net of allowance for doubtful accounts
|
6,015
|
|
5,221
|
|
||
|
Acquired in-place lease intangibles
|
21,231
|
|
19,061
|
|
||
|
Accumulated amortization of acquired in-place lease intangibles
|
(8,642
|
)
|
(8,205
|
)
|
||
|
Acquired in-place lease intangibles, net of accumulated amortization
|
12,589
|
|
10,856
|
|
||
|
Acquired above market lease intangibles
|
1,594
|
|
1,337
|
|
||
|
Accumulated amortization of acquired above market lease intangibles
|
(736
|
)
|
(684
|
)
|
||
|
Acquired above market lease intangibles, net of accumulated amortization
|
858
|
|
653
|
|
||
|
Mortgage loans receivable
|
4,752
|
|
4,875
|
|
||
|
Interest rate swap assets
|
4,546
|
|
400
|
|
||
|
Goodwill
|
990
|
|
990
|
|
||
|
Prepaid expenses and other assets
|
7,606
|
|
6,960
|
|
||
|
Total
Other assets
|
$
|
104,830
|
|
91,858
|
|
|
60
EASTGROUP PROPERTIES, INC. AND SUBSIDIARIES
NOTES TO CONSOLIDATED FINANCIAL STATEMENTS
|
(6)
|
UNSECURED BANK CREDIT FACILITIES
|
EastGroup has a
$300 million
unsecured revolving credit facility with a group of
nine
banks that matures in July 2019. The credit facility contains options for a
one
-year extension (at the Company's election) and a
$150 million
expansion (with agreement by all parties). The interest rate on each tranche is usually reset on a monthly basis and as of
December 31, 2016
, was LIBOR plus
100
basis points with an annual facility fee of
20
basis points. The margin and facility fee are subject to changes in the Company's credit ratings. The Company has designated an interest rate swap to an
$80 million
unsecured bank credit facility draw that effectively fixes the interest rate on the $80 million draw to
2.020%
through the interest rate swap's maturity date of August 15, 2018. As of
December 31, 2016
, EastGroup had an additional
$95,000,000
of variable rate borrowings on this unsecured bank credit facility with a weighted average interest rate of
1.731%
.
The Company also has a
$35 million
unsecured revolving credit facility that matures in July 2019. This credit facility automatically extends for
one
year if the extension option in the $300 million revolving credit facility is exercised. The interest rate is reset on a daily basis and as of
December 31, 2016
, was LIBOR plus
100
basis points with an annual facility fee of
20
basis points. The margin and facility fee are subject to changes in the Company's credit ratings. At
December 31, 2016
, the interest rate was
1.772%
on a balance of
$17,020,000
.
Average unsecured bank credit facilities borrowings were
$106,352,000
in
2016
,
$109,777,000
in
2015
and
$96,162,000
in
2014
, with weighted average interest rates (excluding amortization of facility fees and debt issuance costs) of
1.49%
in
2016
,
1.29%
in
2015
and
1.33%
in
2014
. Amortization of facility fees was
$670,000
,
$608,000
and
$563,000
for
2016
,
2015
and
2014
, respectively. Amortization of debt issuance costs for the Company's unsecured bank credit facilities was
$450,000
,
$493,000
and
$413,000
for
2016
,
2015
and
2014
, respectively.
The Company’s unsecured bank credit facilities have certain restrictive covenants, such as maintaining debt service coverage and leverage ratios and maintaining insurance coverage, and the Company was in compliance with all of its financial debt covenants at
December 31, 2016
.
See Note 7 for a detail of the outstanding balances of the Company's
Unsecured bank credit facilities
as of
December 31, 2016
and 2015.
|
(7)
|
|
In connection with the adoption of ASU 2015-03, which is described in further detail in Note 1(o), the Company presents debt issuance costs as reductions of
Unsecured bank credit facilities, Unsecured debt and Secured debt
on the Consolidated Balance Sheets as detailed below.
|
|
December 31,
2016 |
December 31,
2015 |
||||
|
|
(In thousands)
|
|||||
|
Unsecured bank credit facilities - variable rate, carrying amount
|
$
|
112,020
|
|
150,836
|
|
|
|
Unsecured bank credit facilities - fixed rate, carrying amount
(1)
|
80,000
|
|
—
|
|
||
|
Unamortized debt issuance costs
|
(1,030
|
)
|
(1,422
|
)
|
||
|
Unsecured bank credit facilities
|
190,990
|
|
149,414
|
|
||
|
Unsecured debt - fixed rate, carrying amount
(1)
|
655,000
|
|
530,000
|
|
||
|
Unamortized debt issuance costs
|
(2,162
|
)
|
(1,790
|
)
|
||
|
Unsecured debt
|
652,838
|
|
528,210
|
|
||
|
Secured debt - fixed rate, carrying amount
(1)
|
258,594
|
|
351,401
|
|
||
|
Unamortized debt issuance costs
|
(1,089
|
)
|
(1,116
|
)
|
||
|
Secured debt
|
257,505
|
|
350,285
|
|
||
|
Total debt
|
$
|
1,101,333
|
|
1,027,909
|
|
|
|
(1)
|
These loans have a fixed interest rate or an effectively fixed interest rate due to interest rate swaps.
|
61
EASTGROUP PROPERTIES, INC. AND SUBSIDIARIES
NOTES TO CONSOLIDATED FINANCIAL STATEMENTS
A summary of the carrying amount of
Unsecured debt
follows:
|
Balance at December 31,
|
|||||||||||
|
Margin Above LIBOR
|
Interest Rate
|
Maturity Date
|
2016
|
2015
|
|||||||
|
(In thousands)
|
|||||||||||
|
$80 Million Unsecured Term Loan
(1)
|
1.750%
|
2.770%
|
08/15/2018
|
$
|
—
|
|
80,000
|
|
|||
|
$50 Million Unsecured Term Loan
|
Not applicable
|
3.910%
|
12/21/2018
|
50,000
|
|
50,000
|
|
||||
|
$75 Million Unsecured Term Loan
(1)
|
1.150%
|
2.846%
|
07/31/2019
|
75,000
|
|
75,000
|
|
||||
|
$75 Million Unsecured Term Loan
(1)
|
1.400%
|
3.752%
|
12/20/2020
|
75,000
|
|
75,000
|
|
||||
|
$40 Million Unsecured Term Loan
(1)
|
1.100%
|
2.335%
|
07/30/2021
|
40,000
|
|
—
|
|
||||
|
$75 Million Unsecured Term Loan
(1)
|
1.400%
|
3.031%
|
02/28/2022
|
75,000
|
|
75,000
|
|
||||
|
$65 Million Unsecured Term Loan
(1)
|
1.650%
|
2.863%
|
04/01/2023
|
65,000
|
|
—
|
|
||||
|
$100 Million Senior Unsecured Notes:
|
|||||||||||
|
$30 Million Notes
|
Not applicable
|
3.800%
|
08/28/2020
|
30,000
|
|
30,000
|
|
||||
|
$50 Million Notes
|
Not applicable
|
3.800%
|
08/28/2023
|
50,000
|
|
50,000
|
|
||||
|
$20 Million Notes
|
Not applicable
|
3.800%
|
08/28/2025
|
20,000
|
|
20,000
|
|
||||
|
$100 Million Senior Unsecured Notes:
|
|||||||||||
|
$60 Million Notes
|
Not applicable
|
3.480%
|
12/15/2024
|
60,000
|
|
—
|
|
||||
|
$40 Million Notes
|
Not applicable
|
3.750%
|
12/15/2026
|
40,000
|
|
—
|
|
||||
|
$25 Million Senior Unsecured Notes
|
Not applicable
|
3.970%
|
10/01/2025
|
25,000
|
|
25,000
|
|
||||
|
$50 Million Senior Unsecured Notes
|
Not applicable
|
3.990%
|
10/07/2025
|
50,000
|
|
50,000
|
|
||||
|
$
|
655,000
|
|
530,000
|
|
|||||||
|
(1)
|
The interest rates on these unsecured term loans are comprised of LIBOR plus a margin which is subject to a pricing grid for changes in the Company's coverage ratings. The Company entered into interest rate swap agreements (further described in Note 13) to convert the loans' LIBOR rates to effectively fixed interest rates. The interest rates in the table above are the effectively fixed interest rates for the loans, including the effects of the interest rate swaps, as of
December 31, 2016
.
|
The Company’s unsecured debt instruments have certain restrictive covenants, such as maintaining debt service coverage and leverage ratios and maintaining insurance coverage, and the Company was in compliance with all of its financial debt covenants at
December 31, 2016
.
62
EASTGROUP PROPERTIES, INC. AND SUBSIDIARIES
NOTES TO CONSOLIDATED FINANCIAL STATEMENTS
A summary of the carrying amount of
Secured debt
follows:
|
Interest Rate
|
Monthly
P&I
Payment
|
Maturity
Date
|
Carrying Amount
of Securing
Real Estate at
December 31, 2016
|
Balance at December 31,
|
|||||||||||||
|
Property
|
2016
|
2015
|
|||||||||||||||
|
|
|
|
|
(In thousands)
|
|||||||||||||
|
Huntwood and Wiegman I
|
5.68%
|
265,275
|
|
Repaid
|
$
|
—
|
|
—
|
|
25,567
|
|
||||||
|
Alamo Downs, Arion 1-15 & 17, Rampart I-IV,
Santan 10 I and World Houston 16
|
5.97%
|
557,467
|
|
Repaid
|
—
|
|
—
|
|
53,563
|
|
|||||||
|
Arion 16, Broadway VI, Chino, East
University I & II, Northpark, Santan 10 II, 55
th
Avenue and World Houston 1 & 2, 21 & 23
|
5.57%
|
518,885
|
|
09/05/2017
|
47,514
|
|
47,496
|
|
50,971
|
|
|||||||
|
Dominguez, Industry I & III, Kingsview, Shaw,
Walnut and Washington
(1)
|
7.50%
|
539,747
|
|
05/05/2019
|
46,755
|
|
52,231
|
|
54,689
|
|
|||||||
|
Blue Heron II
|
5.39%
|
16,176
|
|
02/29/2020
|
4,208
|
|
576
|
|
735
|
|
|||||||
|
40
th
Avenue, Beltway Crossing V, Centennial Park,
Executive Airport, Interchange Park I, Ocean View, Wetmore 5-8 and World Houston 26, 28, 29 & 30
|
4.39%
|
463,778
|
|
01/05/2021
|
69,029
|
|
58,380
|
|
61,312
|
|
|||||||
|
Colorado Crossing, Interstate I-III, Rojas, Steele
Creek 1 & 2, Stemmons Circle, Venture and World Houston 3-9
|
4.75%
|
420,045
|
|
06/05/2021
|
59,882
|
|
52,752
|
|
55,223
|
|
|||||||
|
Arion 18, Beltway Crossing VI & VII, Commerce
Park II & III, Concord, Interstate V-VII, Lakeview, Ridge Creek II, Southridge IV & V and World Houston 32
|
4.09%
|
329,796
|
|
01/05/2022
|
58,425
|
|
44,493
|
|
46,584
|
|
|||||||
|
Ramona
|
3.85%
|
16,287
|
|
11/30/2026
|
9,185
|
|
2,666
|
|
2,757
|
|
|||||||
|
|
|
|
|
|
$
|
294,998
|
|
258,594
|
|
351,401
|
|
||||||
|
(1)
|
This mortgage loan has a recourse liability of
$5.0 million
which will be released based on the secured properties generating certain base rent amounts.
|
The Company currently intends to repay its debt obligations, both in the short-term and long-term, through its operating cash flows, borrowings under its unsecured bank credit facilities, proceeds from new debt (primarily unsecured), and/or proceeds from the issuance of equity instruments.
Principal payments on long-term debt, including
Unsecured debt
and
Secured debt
(not including
Unsecured bank credit facilities
), due during the next five years as of
December 31, 2016
are as follows:
|
Years Ending December 31,
|
(In thousands)
|
|||
|
2017
|
$
|
58,237
|
|
|
|
2018
|
61,316
|
|
||
|
2019
|
130,569
|
|
||
|
2020
|
114,096
|
|
||
|
2021
|
129,563
|
|
||
63
EASTGROUP PROPERTIES, INC. AND SUBSIDIARIES
NOTES TO CONSOLIDATED FINANCIAL STATEMENTS
|
(8)
|
ACCOUNTS PAYABLE AND ACCRUED EXPENSES
|
A summary of the Company’s
Accounts payable and accrued expenses
follows:
|
|
December 31,
|
|||||
|
2016
|
2015
|
|||||
|
(In thousands)
|
||||||
|
Property taxes payable
|
$
|
14,186
|
|
16,055
|
|
|
|
Development costs payable
|
9,844
|
|
6,215
|
|
||
|
Property capital expenditures payable
|
2,304
|
|
2,818
|
|
||
|
Interest payable
|
3,822
|
|
3,704
|
|
||
|
Dividends payable on unvested restricted stock
|
1,530
|
|
2,157
|
|
||
|
Book overdraft
(1)
|
14,452
|
|
7,215
|
|
||
|
Other payables and accrued expenses
|
6,563
|
|
6,017
|
|
||
|
Total
Accounts payable and accrued expenses
|
$
|
52,701
|
|
44,181
|
|
|
(1)
Represents unfunded outstanding checks for which the bank has not advanced cash to the Company. See Note 1(p).
|
(9)
|
OTHER LIABILITIES
|
A summary of the Company’s
Other liabilities
follows:
|
|
December 31,
|
|||||
|
2016
|
2015
|
|||||
|
(In thousands)
|
||||||
|
Security deposits
|
$
|
14,782
|
|
13,943
|
|
|
|
Prepaid rent and other deferred income
|
9,795
|
|
10,003
|
|
||
|
Acquired below-market lease intangibles
|
4,012
|
|
3,485
|
|
||
|
Accumulated amortization of below-market lease intangibles
|
(1,662
|
)
|
(1,353
|
)
|
||
|
Acquired below-market lease intangibles, net of accumulated amortization
|
2,350
|
|
2,132
|
|
||
|
Interest rate swap liabilities
|
2,578
|
|
3,960
|
|
||
|
Prepaid tenant improvement reimbursements
|
343
|
|
493
|
|
||
|
Other liabilities
|
16
|
|
82
|
|
||
|
Total
Other liabilities
|
$
|
29,864
|
|
30,613
|
|
|
64
EASTGROUP PROPERTIES, INC. AND SUBSIDIARIES
NOTES TO CONSOLIDATED FINANCIAL STATEMENTS
|
(10)
|
COMMON STOCK ACTIVITY
|
The following table presents the common stock activity for the three years ended
December 31, 2016
:
|
|
Years Ended December 31,
|
|||||||
|
2016
|
2015
|
2014
|
||||||
|
Common Shares
|
||||||||
|
Shares outstanding at beginning of year
|
32,421,460
|
|
32,232,587
|
|
30,937,225
|
|
||
|
Common stock offerings
|
875,052
|
|
106,751
|
|
1,246,400
|
|
||
|
Dividend reinvestment plan
|
3,326
|
|
4,536
|
|
3,626
|
|
||
|
Incentive restricted stock granted
|
80,529
|
|
100,622
|
|
71,642
|
|
||
|
Incentive restricted stock forfeited
|
(910
|
)
|
—
|
|
(2,375
|
)
|
||
|
Director common stock awarded
|
10,072
|
|
9,373
|
|
7,742
|
|
||
|
Restricted stock withheld for tax obligations
|
(57,316
|
)
|
(32,409
|
)
|
(31,673
|
)
|
||
|
Shares outstanding at end of year
|
33,332,213
|
|
32,421,460
|
|
32,232,587
|
|
||
Common Stock Issuances
The following table presents the common stock issuance activity for the three years ended
December 31, 2016
:
|
Years Ended December 31,
|
Number of
Common Shares Issued
|
Net Proceeds
|
|||||
|
(In thousands)
|
|||||||
|
2016
|
875,052
|
|
$
|
59,283
|
|
||
|
2015
|
106,751
|
|
6,233
|
|
|||
|
2014
|
1,246,400
|
|
78,868
|
|
|||
Dividend Reinvestment Plan
The Company has a dividend reinvestment plan that allows stockholders to reinvest cash distributions in new shares of the Company.
|
(11)
|
STOCK-BASED COMPENSATION
|
The Company follows the provisions of ASC 718,
Compensation – Stock Compensation
, to account for its stock-based compensation plans. ASC 718 requires that the compensation cost relating to share-based payment transactions be recognized in the financial statements and that the cost be measured on the fair value of the equity or liability instruments issued.
Equity Incentive Plan
In May 2004, the stockholders of the Company approved the EastGroup Properties, Inc. 2004 Equity Incentive Plan (the “2004 Plan”) that authorized the issuance of up to
1,900,000
shares of common stock to employees in the form of options, stock appreciation rights, restricted stock, deferred stock units, performance shares, bonus stock or stock in lieu of cash compensation. The 2004 Plan was further amended by the Board of Directors in September 2005 and December 2006.
In April 2013, the Board of Directors adopted the EastGroup Properties, Inc. 2013 Equity Incentive Plan (the “2013 Equity Plan”) upon the recommendation of the Compensation Committee; the 2013 Equity Plan was approved by the Company's stockholders and became effective May 29, 2013. The 2013 Equity Plan replaced the 2004 Plan and the 2005 Directors Equity Incentive Plan. The 2013 Equity Plan permits the grant of awards to employees and directors with respect to
2,000,000
shares of common stock.
There were
1,752,345
,
1,802,000
and
1,900,800
total shares available for grant under the 2013 Equity Plan as of December 31, 2016, 2015 and 2014, respectively. Typically, the Company issues new shares to fulfill stock grants.
Stock-based compensation cost for employees was
$5,184,000
,
$7,891,000
and
$6,071,000
for
2016
,
2015
and
2014
, respectively, of which
$1,183,000
,
$1,672,000
and
$1,415,000
were capitalized as part of the Company’s development costs for the respective years.
65
EASTGROUP PROPERTIES, INC. AND SUBSIDIARIES
NOTES TO CONSOLIDATED FINANCIAL STATEMENTS
Employee Equity Awards
The Company's restricted stock program is designed to provide incentives for management to achieve goals established by the Compensation Committee. The awards act as a retention device, as they vest over time, allowing participants to benefit from dividends on shares as well as potential stock appreciation. Equity awards align management's interests with the long-term interests of shareholders. The vesting periods of the Company’s restricted stock plans vary, as determined by the Compensation Committee. Restricted stock is granted to executive officers subject to both continued service and the satisfaction of certain annual performance goals and multi-year market conditions as determined by the Compensation Committee. Restricted stock is granted to non-executive officers subject only to continued service. The cost for market-based awards and awards that only require service is amortized on a straight-line basis over the requisite service periods. The total compensation expense for service and performance based awards is based upon the fair market value of the shares on the grant date, adjusted for estimated forfeitures.
In March 2016, the Compensation Committee of the Company's Board of Directors (the Committee) evaluated the Company's performance compared to certain annual performance goals (primarily funds from operations (FFO) per share and total shareholder return) for the year ended December 31, 2015. Based on the evaluation,
37,848
shares were awarded to the Company’s executive officers at a grant date fair value of
$56.05
per share. These shares vested
20%
on both the dates shares were determined and awarded and on January 1, 2017, and will vest
20%
per year on January 1 in years 2018, 2019 and 2020. The shares are being expensed on a straight-line basis over the remaining service period.
Also in March 2016, the Committee evaluated the Company’s total return, both on an absolute basis for 2015 as well as on a relative basis compared to the NAREIT Equity Index, NAREIT Industrial Index and Russell 2000 Index for the five-year period ended December 31, 2015. Based on the evaluation,
27,431
shares were awarded to the Company’s executive officers at a grant date fair value of
$56.05
per share. These shares vested
25%
on both the dates shares were determined and awarded and on January 1, 2017, and will vest
25%
per year on January 1 in years 2018 and 2019. The shares are being expensed on a straight-line basis over the remaining service period.
In the second quarter of 2016, the Committee approved an equity compensation plan for its executive officers based upon certain annual performance measures (primarily FFO per share and total shareholder return). Any shares issued pursuant to this compensation plan will be determined by the Committee in its discretion and issued in the first quarter of 2017. The number of shares to be issued on the grant date could range from
zero
to
44,848
. These shares would generally vest
20%
on the date shares are determined and awarded and
20%
per year on each January 1 for the subsequent four years.
Also in the second quarter of 2016, the Committee approved a long-term equity compensation plan for the Company’s executive officers. The awards will be based on the results of the Company's total shareholder return, both on an absolute basis for 2016 as well as on a relative basis compared to the NAREIT Equity Index, NAREIT Industrial Index and Russell 2000 Index over the five-year period ended December 31, 2016. Any shares issued pursuant to this equity compensation plan will be determined by the Committee in its discretion and issued in the first quarter of 2017. The number of shares to be issued on the grant date could range from
zero
to
47,275
. These shares would generally vest
25%
on the date shares are determined and awarded and
25%
per year on each January 1 for the subsequent three years.
Notwithstanding the foregoing, any shares issued to the Company’s Chief Financial Officer, N. Keith McKey, will become fully vested on the grant date of the awards which is expected to occur in the first quarter of 2017.
During the third quarter of 2016,
15,250
shares were granted to certain non-executive officers subject only to continued service as of the vesting date. These shares, which have a grant date fair value of
$70.62
per share, vested
20%
on January 1, 2017 and will vest
20%
per year on January 1 in years 2018, 2019, 2020 and 2021.
During the restricted period for awards no longer subject to contingencies, the Company accrues dividends and holds the certificates for the shares; however, the employee can vote the shares. For shares subject to contingencies, dividends are accrued based upon the number of shares expected to be awarded. Share certificates and dividends are delivered to the employee as they vest. As of
December 31, 2016
, there was
$4,577,000
of unrecognized compensation cost related to unvested restricted stock compensation for employees and directors that is expected to be recognized over a weighted average period of
2.7
years.
Following is a summary of the total restricted shares granted, forfeited and delivered (vested) to employees with the related weighted average grant date fair value share prices for
2016
,
2015
and
2014
. Of the shares that vested in
2016
,
2015
and
2014
,
57,316
shares,
32,409
shares and
31,673
shares, respectively, were withheld by the Company to satisfy the tax obligations for those employees who elected this option as permitted under the applicable equity plan. As of the grant date, the fair value of shares that were granted during
2016
,
2015
and
2014
was
$4,736,000
,
$6,145,000
and
$4,439,000
, respectively. As of the vesting date, the fair value of shares that vested during
2016
,
2015
and
2014
was
$10,013,000
,
$6,664,000
and
$5,712,000
, respectively.
66
EASTGROUP PROPERTIES, INC. AND SUBSIDIARIES
NOTES TO CONSOLIDATED FINANCIAL STATEMENTS
|
Restricted Stock Activity:
|
Years Ended December 31,
|
|||||||||||||||||||
|
2016
|
2015
|
2014
|
||||||||||||||||||
|
Shares
|
Weighted Average
Grant Date
Fair Value
|
Shares
|
Weighted Average
Grant Date
Fair Value
|
Shares
|
Weighted Average
Grant Date
Fair Value
|
|||||||||||||||
|
Unvested at beginning of year
|
260,698
|
|
$
|
52.68
|
|
265,911
|
|
$
|
49.79
|
|
293,989
|
|
$
|
47.17
|
|
|||||
|
Granted
|
80,529
|
|
58.81
|
|
100,622
|
|
61.07
|
|
71,642
|
|
61.96
|
|
||||||||
|
Forfeited
|
(910
|
)
|
52.89
|
|
—
|
|
—
|
|
(2,375
|
)
|
52.72
|
|
||||||||
|
Vested
|
(178,230
|
)
|
56.09
|
|
(105,835
|
)
|
53.40
|
|
(97,345
|
)
|
50.76
|
|
||||||||
|
Unvested at end of year
|
162,087
|
|
51.97
|
|
260,698
|
|
52.68
|
|
265,911
|
|
49.79
|
|
||||||||
Following is a vesting schedule of the total unvested shares as of December 31,
2016
:
|
Unvested Shares Vesting Schedule
|
Number of Shares
|
||
|
2017
|
51,064
|
|
|
|
2018
|
41,491
|
|
|
|
2019
|
35,062
|
|
|
|
2020
|
31,420
|
|
|
|
2021
|
3,050
|
|
|
|
Total Unvested Shares
|
162,087
|
|
|
Directors Equity Awards
The Company has a directors equity plan that was approved by stockholders and adopted in 2013 (the "2013 Equity Plan"). The Board of Directors has adopted a policy under the 2013 Equity Plan pursuant to which awards will be made to non-employee Directors. The current policy provides that the Company shall automatically award an annual retainer share award to each non-employee Director who has been elected or reelected as a member of the Board of Directors at the Annual Meeting. The number of shares shall be equal to
$80,000
divided by the fair market value of a share on the date of such election. If a non-employee Director is elected or appointed to the Board of Directors other than at an Annual Meeting of the Company, the annual retainer share award shall be pro rated. The policy also provides that each new non-employee Director appointed or elected will receive an automatic award of restricted shares of Common Stock on the effective date of election or appointment equal to
$25,000
divided by the fair market value of the Company's Common Stock on such date. These restricted shares will vest over a
four
-year period upon the performance of future service as a Director, subject to certain exceptions.
Directors were issued
10,072
shares,
9,373
shares and
7,742
shares of common stock as annual retainer awards for
2016
,
2015
and
2014
, respectively. In addition, during 2013,
417
shares were granted to a newly elected non-employee Director subject only to continued service as of the vesting date. The shares, which have a grant date fair value of
$59.97
per share, vested
25%
on each of December 6, 2014, 2015 and 2016, and will vest
25%
on December 6, 2017. As of the vesting date, the fair value of shares that vested during
2016
,
2015
and
2014
was
$8,000
,
$6,000
and
$7,000
, respectively. Stock-based compensation expense for directors was
$589,000
,
$514,000
and
$490,000
for
2016
,
2015
and
2014
, respectively.
67
EASTGROUP PROPERTIES, INC. AND SUBSIDIARIES
NOTES TO CONSOLIDATED FINANCIAL STATEMENTS
|
(12)
|
COMPREHENSIVE INCOME
|
Total Comprehensive Income
is comprised of net income plus all other changes in equity from non-owner sources and is presented on the Consolidated Statements of Income and Comprehensive Income. The components of
Accumulated other comprehensive income (loss)
for
2016
,
2015
and
2014
are presented in the Company’s Consolidated Statements of Changes in Equity and are summarized below. See Note 13 for information regarding the Company’s interest rate swaps.
|
Years Ended December 31,
|
|||||||||
|
|
2016
|
2015
|
2014
|
||||||
|
ACCUMULATED OTHER COMPREHENSIVE INCOME (LOSS):
|
(In thousands)
|
||||||||
|
Balance at beginning of year
|
$
|
(3,456
|
)
|
(2,357
|
)
|
1,629
|
|
||
|
Change in fair value of interest rate swaps
|
5,451
|
|
(1,099
|
)
|
(3,986
|
)
|
|||
|
Balance at end of year
|
$
|
1,995
|
|
(3,456
|
)
|
(2,357
|
)
|
||
|
(13)
|
DERIVATIVE INSTRUMENTS AND HEDGING ACTIVITIES
|
The Company is exposed to certain risks arising from both its business operations and economic conditions. The Company principally manages its exposures to a wide variety of business and operational risks through management of its core business activities. The Company manages economic risk, including interest rate, liquidity and credit risk primarily by managing the amount, sources, and duration of its debt funding and, to a limited extent, the use of derivative instruments.
Specifically, the Company has entered into derivative instruments to manage exposures that arise from business activities that result in the payment of future known and uncertain cash amounts, the value of which are determined by interest rates. The Company's derivative instruments, described below, are used to manage differences in the amount, timing and duration of the Company's known or expected cash payments principally related to certain of the Company's borrowings.
The Company's objective in using interest rate derivatives is to change variable interest rates to fixed interest rates by using interest rate swaps. Interest rate swaps designated as cash flow hedges involve the receipt of variable-rate amounts from a counterparty in exchange for the Company making fixed-rate payments over the life of the agreements without exchange of the underlying notional amount.
As of
December 31, 2016
, EastGroup had
seven
interest rate swaps outstanding, all of which are used to hedge the variable cash flows associated with unsecured loans. All of the Company's interest rate swaps convert the related loans' LIBOR rate components to effectively fixed interest rates, and the Company has concluded that each of the hedging relationships is highly effective.
The effective portion of changes in the fair value of derivatives designated and qualifying as cash flow hedges is recorded in
Other comprehensive income (loss)
and is subsequently reclassified into earnings through interest expense as interest payments are made in the period that the hedged forecasted transaction affects earnings. The ineffective portion of the change in fair value of the derivatives, which is immaterial for the periods reported, is recognized directly in earnings (included in
Other
on the Consolidated Statements of Income and Comprehensive Income).
Amounts reported in
Other comprehensive income (loss)
related to derivatives will be reclassified to
Interest expense
as interest payments are made on the Company's variable-rate debt. The Company estimates the swap interest payments will be
$2,353,000
over the next twelve months. These payments approximate the expected cash interest payments for the swaps. Since the interest payments on the swaps in combination with the associated debt have been effectively fixed, this estimate is not in addition to the Company's total expected combined interest payments or expense for the next twelve months.
The Company's valuation methodology for over-the-counter (“OTC”) derivatives is to discount cash flows based on Overnight Index Swap (“OIS”) rates. Uncollateralized or partially-collateralized trades are discounted at OIS, but include appropriate economic adjustments for funding costs (i.e., a LIBOR-OIS basis adjustment to approximate uncollateralized cost of funds) and credit risk. As of January 1, 2015, the Company began calculating its derivative prices using mid-market prices; prior to that date, the Company used bid-market prices. The change in valuation methodology is considered a change in accounting estimate and resulted from recent developments in the marketplace. Management has assessed the impact of the change for all periods presented and has deemed the impact to be immaterial to the Company's financial statements.
68
EASTGROUP PROPERTIES, INC. AND SUBSIDIARIES
NOTES TO CONSOLIDATED FINANCIAL STATEMENTS
As of
December 31, 2016
and
2015
, the Company had the following outstanding interest rate derivatives that are designated as cash flow hedges of interest rate risk:
|
Interest Rate Derivative
|
Notional Amount as of December 31, 2016
|
Notional Amount as of December 31, 2015
|
||
|
(In thousands)
|
||||
|
Interest Rate Swap
|
$80,000
|
$80,000
|
||
|
Interest Rate Swap
|
$75,000
|
$75,000
|
||
|
Interest Rate Swap
|
$75,000
|
$75,000
|
||
|
Interest Rate Swap
|
$65,000
|
—
|
||
|
Interest Rate Swap
|
$60,000
|
$60,000
|
||
|
Interest Rate Swap
|
$40,000
|
—
|
||
|
Interest Rate Swap
|
$15,000
|
$15,000
|
||
The table below presents the fair value of the Company's derivative financial instruments as well as their classification on the Consolidated Balance Sheets as of
December 31, 2016
and
2015
. See Note 18 for additional information on the fair value of the Company's interest rate swaps.
|
Derivatives
As of December 31, 2016
|
Derivatives
As of December 31, 2015
|
||||||||||
|
Balance Sheet Location
|
Fair Value
|
Balance Sheet Location
|
Fair Value
|
||||||||
|
(In thousands)
|
|||||||||||
|
Derivatives designated as cash flow hedges:
|
|||||||||||
|
Interest rate swap assets
|
Other assets
|
$
|
4,546
|
|
Other assets
|
$
|
400
|
|
|||
|
Interest rate swap liabilities
|
Other liabilities
|
2,578
|
|
Other liabilities
|
3,960
|
|
|||||
The table below presents the effect of the Company's derivative financial instruments on the Consolidated Statements of Income and Comprehensive Income for the years ended
December 31, 2016
,
2015
and
2014
:
|
Years Ended December 31,
|
|||||||||
|
|
2016
|
2015
|
2014
|
||||||
|
|
(In thousands)
|
||||||||
|
DERIVATIVES IN CASH FLOW HEDGING RELATIONSHIPS
|
|
|
|||||||
|
Interest Rate Swaps:
|
|||||||||
|
Amount of income (loss) recognized in
Other comprehensive income (loss)
on derivatives
|
$
|
1,410
|
|
(5,374
|
)
|
(6,777
|
)
|
||
|
Amount of loss reclassified from
Accumulated other comprehensive income (loss)
into
Interest expense
|
(4,041
|
)
|
(4,275
|
)
|
(2,791
|
)
|
|||
See Note 12 for additional information on the Company's
Accumulated other comprehensive income (loss)
resulting from its interest rate swaps.
Derivative financial agreements expose the Company to credit risk in the event of non-performance by the counterparties under the terms of the interest rate hedge agreements. The Company believes it minimizes the credit risk by transacting with financial institutions the Company regards as credit-worthy.
The Company has an agreement with its derivative counterparties containing a provision stating that the Company could be declared in default on its derivative obligations if the Company defaults on any of its indebtedness, including default where repayment of the indebtedness has not been accelerated by the lender.
As of
December 31, 2016
, the fair value of derivatives in an asset position related to these agreements was
$4,546,000
, and the fair value of derivatives in a liability position related to these agreements was
$2,578,000
. As of
December 31, 2016
, the Company has not posted any collateral related to these arrangements. If the Company had breached any of the contractual provisions of the derivative contract, it could have been required to settle its obligations under the agreements at their termination value. The swap termination value of derivatives in an asset position was an asset in the amount of
$4,567,000
, and the swap termination value of derivatives in a liability position was a liability in the amount of
$2,642,000
.
69
EASTGROUP PROPERTIES, INC. AND SUBSIDIARIES
NOTES TO CONSOLIDATED FINANCIAL STATEMENTS
|
(14)
|
EARNINGS PER SHARE
|
The Company applies ASC 260,
Earnings Per Share
, which requires companies to present basic and diluted EPS. Reconciliation of the numerators and denominators in the basic and diluted EPS computations is as follows:
|
|
2016
|
2015
|
2014
|
||||||
|
(In thousands)
|
|||||||||
|
BASIC EPS COMPUTATION FOR NET INCOME ATTRIBUTABLE TO
EASTGROUP PROPERTIES, INC. COMMON STOCKHOLDERS
|
|
|
|
||||||
|
Numerator – net income attributable to common stockholders
|
$
|
95,509
|
|
47,866
|
|
47,941
|
|
||
|
Denominator – weighted average shares outstanding
|
32,563
|
|
32,091
|
|
31,341
|
|
|||
|
DILUTED EPS COMPUTATION FOR NET INCOME ATTRIBUTABLE
TO EASTGROUP PROPERTIES, INC. COMMON STOCKHOLDERS
|
|||||||||
|
Numerator – net income attributable to common stockholders
|
$
|
95,509
|
|
47,866
|
|
47,941
|
|
||
|
Denominator:
|
|||||||||
|
Weighted average shares outstanding
|
32,563
|
|
32,091
|
|
31,341
|
|
|||
|
Unvested restricted stock
|
65
|
|
105
|
|
111
|
|
|||
|
Total Shares
|
32,628
|
|
32,196
|
|
31,452
|
|
|||
|
(15)
|
QUARTERLY RESULTS OF OPERATIONS – UNAUDITED
|
|
|
2016 Quarter Ended
|
2015 Quarter Ended
|
||||||||||||||||||||||
|
Mar 31
|
Jun 30
|
Sep 30
|
Dec 31
|
Mar 31
|
Jun 30
|
Sep 30
|
Dec 31
|
|||||||||||||||||
|
(In thousands, except per share data)
|
||||||||||||||||||||||||
|
Revenues
|
$
|
73,189
|
|
93,279
|
|
64,043
|
|
66,614
|
|
57,959
|
|
60,989
|
|
58,795
|
|
61,269
|
|
|||||||
|
Expenses
|
(51,359
|
)
|
(49,186
|
)
|
(49,243
|
)
|
(51,243
|
)
|
(47,898
|
)
|
(46,326
|
)
|
(46,698
|
)
|
(49,691
|
)
|
||||||||
|
Net Income
|
21,830
|
|
44,093
|
|
14,800
|
|
15,371
|
|
10,061
|
|
14,663
|
|
12,097
|
|
11,578
|
|
||||||||
|
Net income attributable to
noncontrolling interest in joint ventures
|
(119
|
)
|
(180
|
)
|
(139
|
)
|
(147
|
)
|
(131
|
)
|
(130
|
)
|
(129
|
)
|
(143
|
)
|
||||||||
|
Net income attributable to EastGroup
Properties, Inc. common stockholders
|
$
|
21,711
|
|
43,913
|
|
14,661
|
|
15,224
|
|
9,930
|
|
14,533
|
|
11,968
|
|
11,435
|
|
|||||||
|
BASIC PER SHARE DATA FOR NET INCOME ATTRIBUTABLE TO EASTGROUP PROPERTIES, INC. COMMON STOCKHOLDERS
(1)
|
|
|
|
|
|
|
|
|
|
|
|
|
|
|
|
|
||||||||
|
Net income attributable to common
stockholders
|
$
|
0.67
|
|
1.36
|
|
0.45
|
|
0.46
|
|
0.31
|
|
0.45
|
|
0.37
|
|
0.36
|
|
|||||||
|
Weighted average shares outstanding
|
32,254
|
|
32,376
|
|
32,741
|
|
32,874
|
|
32,032
|
|
32,045
|
|
32,126
|
|
32,159
|
|
||||||||
|
DILUTED PER SHARE DATA FOR NET INCOME ATTRIBUTABLE TO EASTGROUP PROPERTIES, INC. COMMON STOCKHOLDERS
(1)
|
|
|
|
|
|
|
|
|
|
|
|
|
|
|
|
|
||||||||
|
Net income attributable to common
stockholders
|
$
|
0.67
|
|
1.35
|
|
0.45
|
|
0.46
|
|
0.31
|
|
0.45
|
|
0.37
|
|
0.35
|
|
|||||||
|
Weighted average shares outstanding
|
32,307
|
|
32,440
|
|
32,823
|
|
32,964
|
|
32,109
|
|
32,139
|
|
32,248
|
|
32,314
|
|
||||||||
|
(1)
|
The above quarterly earnings per share calculations are based on the weighted average number of common shares outstanding during each quarter for basic earnings per share and the weighted average number of outstanding common shares and common share equivalents during each quarter for diluted earnings per share. The annual earnings per share calculations in the Consolidated Statements of Income and Comprehensive Income are based on the weighted average number of common shares outstanding during each year for basic earnings per share and the weighted average number of outstanding common shares and common share equivalents during each year for diluted earnings per share. The sum of quarterly financial data may vary from the annual data due to rounding.
|
70
EASTGROUP PROPERTIES, INC. AND SUBSIDIARIES
NOTES TO CONSOLIDATED FINANCIAL STATEMENTS
|
(16)
|
DEFINED CONTRIBUTION PLAN
|
EastGroup maintains a 401(k) plan for its employees. The Company makes matching contributions of
50%
of the employee’s contribution (limited to
10%
of compensation as defined by the plan) and may also make annual discretionary contributions. The Company’s total expense for this plan was
$675,000
,
$585,000
and
$457,000
for
2016
,
2015
and
2014
, respectively.
|
(17)
|
LEGAL MATTERS
|
The Company is not presently involved in any material litigation nor, to its knowledge, is any material litigation threatened against the Company or its properties, other than routine litigation arising in the ordinary course of business and for which the Company is adequately insured.
|
(18)
|
FAIR VALUE OF FINANCIAL INSTRUMENTS
|
ASC 820,
Fair Value Measurements and Disclosures,
defines fair value as the price that would be received to sell an asset or paid to transfer a liability in an orderly transaction between market participants at the measurement date. ASC 820 also provides guidance for using fair value to measure financial assets and liabilities. The Codification requires disclosure of the level within the fair value hierarchy in which the fair value measurements fall, including measurements using quoted prices in active markets for identical assets or liabilities (Level 1), quoted prices for similar instruments in active markets or quoted prices for identical or similar instruments in markets that are not active (Level 2), and significant valuation assumptions that are not readily observable in the market (Level 3).
The following table presents the carrying amounts and estimated fair values of the Company’s financial instruments in accordance with ASC 820
at December 31,
2016
and
2015
.
|
|
December 31,
|
|||||||||||
|
2016
|
2015
|
|||||||||||
|
Carrying
Amount
(1)
|
Fair
Value
|
Carrying
Amount
(1)
|
Fair
Value
|
|||||||||
|
(In thousands)
|
||||||||||||
|
Financial Assets:
|
|
|
|
|
||||||||
|
Cash and cash equivalents
|
$
|
522
|
|
522
|
|
48
|
|
48
|
|
|||
|
Mortgage loans receivable
|
4,752
|
|
4,747
|
|
4,875
|
|
4,896
|
|
||||
|
Interest rate swap assets
|
4,546
|
|
4,546
|
|
400
|
|
400
|
|
||||
|
Financial Liabilities:
|
|
|
|
|
|
|
|
|
||||
|
Unsecured bank credit facilities - variable rate
(2)
|
112,020
|
|
111,923
|
|
150,836
|
|
150,670
|
|
||||
|
Unsecured bank credit facilities - fixed rate
(2)
|
80,000
|
|
79,998
|
|
—
|
|
—
|
|
||||
|
Unsecured debt
(2)
|
655,000
|
|
623,147
|
|
530,000
|
|
509,326
|
|
||||
|
Secured debt
(2)
|
258,594
|
|
266,585
|
|
351,401
|
|
366,491
|
|
||||
|
Interest rate swap liabilities
|
2,578
|
|
2,578
|
|
3,960
|
|
3,960
|
|
||||
|
(1)
|
Carrying amounts shown in the table are included in the Consolidated Balance Sheets under the indicated captions, except as indicated in the notes below.
|
|
(2)
|
Carrying amounts and fair values shown in the table exclude debt issuance costs (see Notes 1(o), 6 and 7 for additional information).
|
The following methods and assumptions were used to estimate the fair value of each class of financial instruments:
Cash and cash equivalents:
The carrying amounts approximate fair value due to the short maturity of those instruments.
Mortgage loans receivable (included in Other assets on the Consolidated Balance Sheets):
The fair value is estimated by discounting the future cash flows using the current rates at which similar loans would be made to borrowers with similar credit ratings and for the same remaining maturities (Level 2 input).
Interest rate swap assets (included in Other assets on the Consolidated Balances Sheets):
The instruments are recorded at fair value based on models using inputs, such as interest rate yield curves, LIBOR swap curves and OIS curves, observable for
71
EASTGROUP PROPERTIES, INC. AND SUBSIDIARIES
NOTES TO CONSOLIDATED FINANCIAL STATEMENTS
substantially the full term of the contract (Level 2 input). See Note 13 for additional information on the Company's interest rate swaps.
Unsecured bank credit facilities:
The fair value of the Company’s unsecured bank credit facilities is estimated by discounting expected cash flows at current market rates (Level 2 input), excluding the effects of debt issuance costs.
Unsecured debt:
The fair value of the Company’s unsecured debt is estimated by discounting expected cash flows at the rates currently offered to the Company for debt of the same remaining maturities, as advised by the Company’s bankers (Level 2 input), excluding the effects of debt issuance costs.
Secured debt:
The fair value of the Company’s secured debt is estimated by discounting expected cash flows at the rates currently offered to the Company for debt of the same remaining maturities, as advised by the Company’s bankers (Level 2 input), excluding the effects of debt issuance costs.
Interest rate swap liabilities (included in Other liabilities on the Consolidated Balance Sheets):
The instruments are recorded at fair value based on models using inputs, such as interest rate yield curves, LIBOR swap curves and OIS curves, observable for substantially the full term of the contract (Level 2 input). See Note 13 for additional information on the Company's interest rate swaps.
|
(19)
|
SUBSEQUENT EVENTS
|
On February 7, 2017, EastGroup closed the acquisition of a
three
-building business distribution complex along the Georgia 400 in Atlanta, a new market for the Company. The buildings, which contain a total of
238,000
square feet and are currently
100%
leased, were acquired for
$20 million
.
72
REPORT OF INDEPENDENT REGISTERED PUBLIC ACCOUNTING FIRM ON FINANCIAL STATEMENT SCHEDULES
THE BOARD OF DIRECTORS AND STOCKHOLDERS
EASTGROUP PROPERTIES, INC.:
Under date of
February 15, 2017
, we reported on the consolidated balance sheets of EastGroup Properties, Inc. and subsidiaries as of
December 31, 2016
and
2015
, and the related consolidated statements of income and comprehensive income, changes in equity and cash flows for each of the years in the three-year period ended
December 31, 2016
, which are included in the
2016
Annual Report on Form 10-K. In connection with our audits of the aforementioned consolidated financial statements, we also audited the related consolidated financial statement schedules as listed in Item 15(a)(2) of Form 10-K. These financial statement schedules are the responsibility of the Company's management. Our responsibility is to express an opinion on these financial statement schedules based on our audits.
In our opinion, such financial statement schedules, when considered in relation to the basic consolidated financial statements taken as a whole, present fairly, in all material respects, the information set forth therein.
|
|
(Signed) KPMG LLP
|
|
Jackson, Mississippi
|
|
|
February 15, 2017
|
|
73
|
SCHEDULE III
|
|||||||||||||||||||||||||||||
|
REAL ESTATE PROPERTIES AND ACCUMULATED DEPRECIATION
|
|||||||||||||||||||||||||||||
|
DECEMBER 31, 2016
(In thousands, except footnotes)
|
|||||||||||||||||||||||||||||
|
Description
|
Encumbrances
|
Initial Cost to the Company
|
Costs
Capitalized Subsequent to Acquisition
|
Gross Amount Carried at Close of Period
|
Accumulated Depreciation
|
Year Acquired
|
Year Constructed
|
||||||||||||||||||||||
|
Land
|
Buildings and Improvements
|
Land
|
Buildings and Improvements
|
Total
|
|||||||||||||||||||||||||
|
Real Estate Properties (c):
|
|
|
|
|
|
|
|
|
|
|
|||||||||||||||||||
|
Industrial:
|
|
|
|
|
|
|
|
|
|
|
|||||||||||||||||||
|
FLORIDA
|
|
|
|
|
|
|
|
|
|
|
|||||||||||||||||||
|
Tampa
|
|
|
|
|
|
|
|
|
|
|
|||||||||||||||||||
|
56th Street Commerce Park
|
$
|
—
|
|
843
|
|
3,567
|
|
4,475
|
|
843
|
|
8,042
|
|
8,885
|
|
5,866
|
|
1993
|
1981/86/97
|
||||||||||
|
Jetport Commerce Park
|
—
|
|
1,575
|
|
6,591
|
|
5,885
|
|
1,575
|
|
12,476
|
|
14,051
|
|
8,131
|
|
1993-99
|
1974-85
|
|||||||||||
|
Westport Commerce Center
|
—
|
|
980
|
|
3,800
|
|
2,742
|
|
980
|
|
6,542
|
|
7,522
|
|
4,459
|
|
1994
|
1983/87
|
|||||||||||
|
Benjamin Distribution Center I & II
|
—
|
|
843
|
|
3,963
|
|
1,502
|
|
883
|
|
5,425
|
|
6,308
|
|
3,639
|
|
1997
|
1996
|
|||||||||||
|
Benjamin Distribution Center III
|
—
|
|
407
|
|
1,503
|
|
655
|
|
407
|
|
2,158
|
|
2,565
|
|
1,520
|
|
1999
|
1988
|
|||||||||||
|
Palm River Center
|
—
|
|
1,190
|
|
4,625
|
|
2,507
|
|
1,190
|
|
7,132
|
|
8,322
|
|
4,554
|
|
1997/98
|
1990/97/98
|
|||||||||||
|
Palm River North I & III
|
—
|
|
1,005
|
|
4,688
|
|
2,302
|
|
1,005
|
|
6,990
|
|
7,995
|
|
4,073
|
|
1998
|
2000
|
|||||||||||
|
Palm River North II
|
—
|
|
634
|
|
4,418
|
|
383
|
|
634
|
|
4,801
|
|
5,435
|
|
3,341
|
|
1997/98
|
1999
|
|||||||||||
|
Palm River South I
|
—
|
|
655
|
|
3,187
|
|
649
|
|
655
|
|
3,836
|
|
4,491
|
|
1,716
|
|
2000
|
2005
|
|||||||||||
|
Palm River South II
|
—
|
|
655
|
|
—
|
|
4,411
|
|
655
|
|
4,411
|
|
5,066
|
|
2,049
|
|
2000
|
2006
|
|||||||||||
|
Walden Distribution Center I
|
—
|
|
337
|
|
3,318
|
|
520
|
|
337
|
|
3,838
|
|
4,175
|
|
2,013
|
|
1997/98
|
2001
|
|||||||||||
|
Walden Distribution Center II
|
—
|
|
465
|
|
3,738
|
|
993
|
|
465
|
|
4,731
|
|
5,196
|
|
2,653
|
|
1998
|
1998
|
|||||||||||
|
Oak Creek Distribution Center I
|
—
|
|
1,109
|
|
6,126
|
|
1,366
|
|
1,109
|
|
7,492
|
|
8,601
|
|
3,771
|
|
1998
|
1998
|
|||||||||||
|
Oak Creek Distribution Center II
|
—
|
|
647
|
|
3,603
|
|
1,131
|
|
647
|
|
4,734
|
|
5,381
|
|
2,381
|
|
2003
|
2001
|
|||||||||||
|
Oak Creek Distribution Center III
|
—
|
|
439
|
|
—
|
|
3,202
|
|
556
|
|
3,085
|
|
3,641
|
|
1,097
|
|
2005
|
2007
|
|||||||||||
|
Oak Creek Distribution Center IV
|
—
|
|
682
|
|
6,472
|
|
779
|
|
682
|
|
7,251
|
|
7,933
|
|
2,501
|
|
2005
|
2001
|
|||||||||||
|
Oak Creek Distribution Center V
|
—
|
|
724
|
|
—
|
|
5,856
|
|
916
|
|
5,664
|
|
6,580
|
|
2,096
|
|
2005
|
2007
|
|||||||||||
|
Oak Creek Distribution Center VI
|
—
|
|
642
|
|
—
|
|
5,201
|
|
812
|
|
5,031
|
|
5,843
|
|
1,478
|
|
2005
|
2008
|
|||||||||||
|
Oak Creek Distribution Center VIII
|
—
|
|
843
|
|
—
|
|
6,227
|
|
1,051
|
|
6,019
|
|
7,070
|
|
219
|
|
2005
|
2015
|
|||||||||||
|
Oak Creek Distribution Center IX
|
—
|
|
618
|
|
—
|
|
4,963
|
|
781
|
|
4,800
|
|
5,581
|
|
1,210
|
|
2005
|
2009
|
|||||||||||
|
Oak Creek Distribution Center A
|
—
|
|
185
|
|
—
|
|
1,492
|
|
185
|
|
1,492
|
|
1,677
|
|
436
|
|
2005
|
2008
|
|||||||||||
|
Oak Creek Distribution Center B
|
—
|
|
227
|
|
—
|
|
1,497
|
|
227
|
|
1,497
|
|
1,724
|
|
451
|
|
2005
|
2008
|
|||||||||||
|
Airport Commerce Center
|
—
|
|
1,257
|
|
4,012
|
|
939
|
|
1,257
|
|
4,951
|
|
6,208
|
|
2,596
|
|
1998
|
1998
|
|||||||||||
|
Westlake Distribution Center
|
—
|
|
1,333
|
|
6,998
|
|
2,308
|
|
1,333
|
|
9,306
|
|
10,639
|
|
5,136
|
|
1998
|
1998/99
|
|||||||||||
|
Expressway Commerce Center I
|
—
|
|
915
|
|
5,346
|
|
1,221
|
|
915
|
|
6,567
|
|
7,482
|
|
3,175
|
|
2002
|
2004
|
|||||||||||
|
Expressway Commerce Center II
|
—
|
|
1,013
|
|
3,247
|
|
465
|
|
1,013
|
|
3,712
|
|
4,725
|
|
1,843
|
|
2003
|
2001
|
|||||||||||
|
Silo Bend Distribution Center
|
—
|
|
4,131
|
|
27,497
|
|
1,265
|
|
4,132
|
|
28,761
|
|
32,893
|
|
5,186
|
|
2011
|
1987/90
|
|||||||||||
74
|
SCHEDULE III
|
|||||||||||||||||||||||||||||
|
REAL ESTATE PROPERTIES AND ACCUMULATED DEPRECIATION
|
|||||||||||||||||||||||||||||
|
DECEMBER 31, 2016
(In thousands, except footnotes)
|
|||||||||||||||||||||||||||||
|
Description
|
Encumbrances
|
Initial Cost to the Company
|
Costs
Capitalized Subsequent to Acquisition
|
Gross Amount Carried at Close of Period
|
Accumulated Depreciation
|
Year Acquired
|
Year Constructed
|
||||||||||||||||||||||
|
Land
|
Buildings and Improvements
|
Land
|
Buildings and Improvements
|
Total
|
|||||||||||||||||||||||||
|
Tampa East Distribution Center
|
—
|
|
791
|
|
4,758
|
|
493
|
|
791
|
|
5,251
|
|
6,042
|
|
1,077
|
|
2011
|
1984
|
|||||||||||
|
Tampa West Distribution Center
|
—
|
|
2,139
|
|
8,502
|
|
1,147
|
|
2,140
|
|
9,648
|
|
11,788
|
|
1,934
|
|
2011
|
1975/93/94
|
|||||||||||
|
Madison Distribution Center
|
—
|
|
495
|
|
2,779
|
|
428
|
|
495
|
|
3,207
|
|
3,702
|
|
660
|
|
2012
|
2007
|
|||||||||||
|
Madison Distribution Center II & III
|
—
|
|
624
|
|
—
|
|
7,004
|
|
624
|
|
7,004
|
|
7,628
|
|
326
|
|
2012
|
2015
|
|||||||||||
|
Orlando
|
|
|
|
|
|
|
|
|
|
|
|
|
|
|
|
|
|
|
|||||||||||
|
Chancellor Center
|
—
|
|
291
|
|
1,711
|
|
478
|
|
291
|
|
2,189
|
|
2,480
|
|
1,198
|
|
1996/97
|
1996/97
|
|||||||||||
|
Exchange Distribution Center I
|
—
|
|
603
|
|
2,414
|
|
2,285
|
|
603
|
|
4,699
|
|
5,302
|
|
3,193
|
|
1994
|
1975
|
|||||||||||
|
Exchange Distribution Center II
|
—
|
|
300
|
|
945
|
|
445
|
|
300
|
|
1,390
|
|
1,690
|
|
743
|
|
2002
|
1976
|
|||||||||||
|
Exchange Distribution Center III
|
—
|
|
320
|
|
997
|
|
403
|
|
320
|
|
1,400
|
|
1,720
|
|
860
|
|
2002
|
1980
|
|||||||||||
|
Sunbelt Distribution Center
|
—
|
|
1,472
|
|
5,745
|
|
5,799
|
|
1,472
|
|
11,544
|
|
13,016
|
|
8,231
|
|
1989/97/98
|
1974/87/97/98
|
|||||||||||
|
John Young Commerce Center I
|
—
|
|
497
|
|
2,444
|
|
1,200
|
|
497
|
|
3,644
|
|
4,141
|
|
1,927
|
|
1997/98
|
1997/98
|
|||||||||||
|
John Young Commerce Center II
|
—
|
|
512
|
|
3,613
|
|
504
|
|
512
|
|
4,117
|
|
4,629
|
|
2,529
|
|
1998
|
1999
|
|||||||||||
|
Altamonte Commerce Center I
|
—
|
|
1,498
|
|
2,661
|
|
2,649
|
|
1,498
|
|
5,310
|
|
6,808
|
|
3,711
|
|
1999
|
1980/82
|
|||||||||||
|
Altamonte Commerce Center II
|
—
|
|
745
|
|
2,618
|
|
1,216
|
|
745
|
|
3,834
|
|
4,579
|
|
2,096
|
|
2003
|
1975
|
|||||||||||
|
Sunport Center I
|
—
|
|
555
|
|
1,977
|
|
738
|
|
555
|
|
2,715
|
|
3,270
|
|
1,434
|
|
1999
|
1999
|
|||||||||||
|
Sunport Center II
|
—
|
|
597
|
|
3,271
|
|
1,515
|
|
597
|
|
4,786
|
|
5,383
|
|
3,260
|
|
1999
|
2001
|
|||||||||||
|
Sunport Center III
|
—
|
|
642
|
|
3,121
|
|
1,029
|
|
642
|
|
4,150
|
|
4,792
|
|
2,075
|
|
1999
|
2002
|
|||||||||||
|
Sunport Center IV
|
—
|
|
642
|
|
2,917
|
|
1,482
|
|
642
|
|
4,399
|
|
5,041
|
|
2,137
|
|
1999
|
2004
|
|||||||||||
|
Sunport Center V
|
—
|
|
750
|
|
2,509
|
|
2,390
|
|
750
|
|
4,899
|
|
5,649
|
|
2,591
|
|
1999
|
2005
|
|||||||||||
|
Sunport Center VI
|
—
|
|
672
|
|
—
|
|
3,478
|
|
672
|
|
3,478
|
|
4,150
|
|
1,279
|
|
1999
|
2006
|
|||||||||||
|
Southridge Commerce Park I
|
—
|
|
373
|
|
—
|
|
4,833
|
|
373
|
|
4,833
|
|
5,206
|
|
2,683
|
|
2003
|
2006
|
|||||||||||
|
Southridge Commerce Park II
|
—
|
|
342
|
|
—
|
|
4,425
|
|
342
|
|
4,425
|
|
4,767
|
|
2,101
|
|
2003
|
2007
|
|||||||||||
|
Southridge Commerce Park III
|
—
|
|
547
|
|
—
|
|
5,538
|
|
547
|
|
5,538
|
|
6,085
|
|
1,967
|
|
2003
|
2007
|
|||||||||||
|
Southridge Commerce Park IV (h)
|
2,956
|
|
506
|
|
—
|
|
4,638
|
|
506
|
|
4,638
|
|
5,144
|
|
1,724
|
|
2003
|
2006
|
|||||||||||
|
Southridge Commerce Park V (h)
|
2,810
|
|
382
|
|
—
|
|
4,508
|
|
382
|
|
4,508
|
|
4,890
|
|
1,946
|
|
2003
|
2006
|
|||||||||||
|
Southridge Commerce Park VI
|
—
|
|
571
|
|
—
|
|
5,272
|
|
571
|
|
5,272
|
|
5,843
|
|
1,708
|
|
2003
|
2007
|
|||||||||||
|
Southridge Commerce Park VII
|
—
|
|
520
|
|
—
|
|
6,729
|
|
520
|
|
6,729
|
|
7,249
|
|
2,150
|
|
2003
|
2008
|
|||||||||||
|
Southridge Commerce Park VIII
|
—
|
|
531
|
|
—
|
|
6,343
|
|
531
|
|
6,343
|
|
6,874
|
|
1,751
|
|
2003
|
2008
|
|||||||||||
|
Southridge Commerce Park IX
|
—
|
|
468
|
|
—
|
|
6,455
|
|
468
|
|
6,455
|
|
6,923
|
|
1,140
|
|
2003
|
2012
|
|||||||||||
|
Southridge Commerce Park X
|
—
|
|
414
|
|
—
|
|
4,867
|
|
414
|
|
4,867
|
|
5,281
|
|
603
|
|
2003
|
2012
|
|||||||||||
|
Southridge Commerce Park XI
|
—
|
|
513
|
|
—
|
|
5,927
|
|
513
|
|
5,927
|
|
6,440
|
|
886
|
|
2003
|
2012
|
|||||||||||
75
|
SCHEDULE III
|
|||||||||||||||||||||||||||||
|
REAL ESTATE PROPERTIES AND ACCUMULATED DEPRECIATION
|
|||||||||||||||||||||||||||||
|
DECEMBER 31, 2016
(In thousands, except footnotes)
|
|||||||||||||||||||||||||||||
|
Description
|
Encumbrances
|
Initial Cost to the Company
|
Costs
Capitalized Subsequent to Acquisition
|
Gross Amount Carried at Close of Period
|
Accumulated Depreciation
|
Year Acquired
|
Year Constructed
|
||||||||||||||||||||||
|
Land
|
Buildings and Improvements
|
Land
|
Buildings and Improvements
|
Total
|
|||||||||||||||||||||||||
|
Southridge Commerce Park XII
|
—
|
|
2,025
|
|
—
|
|
16,930
|
|
2,025
|
|
16,930
|
|
18,955
|
|
4,258
|
|
2005
|
2008
|
|||||||||||
|
Horizon Commerce Park I
|
—
|
|
991
|
|
—
|
|
6,501
|
|
991
|
|
6,501
|
|
7,492
|
|
597
|
|
2008
|
2014
|
|||||||||||
|
Horizon Commerce Park II
|
—
|
|
1,111
|
|
—
|
|
7,097
|
|
1,111
|
|
7,097
|
|
8,208
|
|
519
|
|
2008
|
2014
|
|||||||||||
|
Horizon Commerce Park III
|
—
|
|
991
|
|
—
|
|
6,417
|
|
991
|
|
6,417
|
|
7,408
|
|
177
|
|
2008
|
2016
|
|||||||||||
|
Horizon Commerce Park IV
|
—
|
|
1,097
|
|
—
|
|
8,523
|
|
1,097
|
|
8,523
|
|
9,620
|
|
328
|
|
2008
|
2015
|
|||||||||||
|
Jacksonville
|
|
|
|
|
|
|
|
|
|
|
|
|
|
|
|
|
|
|
|||||||||||
|
Deerwood Distribution Center
|
—
|
|
1,147
|
|
1,799
|
|
3,400
|
|
1,147
|
|
5,199
|
|
6,346
|
|
2,877
|
|
1989
|
1978
|
|||||||||||
|
Phillips Distribution Center
|
—
|
|
1,375
|
|
2,961
|
|
4,392
|
|
1,375
|
|
7,353
|
|
8,728
|
|
5,155
|
|
1994
|
1984/95
|
|||||||||||
|
Lake Pointe Business Park
|
—
|
|
3,442
|
|
6,450
|
|
8,110
|
|
3,442
|
|
14,560
|
|
18,002
|
|
10,528
|
|
1993
|
1986/87
|
|||||||||||
|
Ellis Distribution Center
|
—
|
|
540
|
|
7,513
|
|
1,191
|
|
540
|
|
8,704
|
|
9,244
|
|
4,509
|
|
1997
|
1977
|
|||||||||||
|
Westside Distribution Center
|
—
|
|
2,011
|
|
15,374
|
|
7,446
|
|
2,011
|
|
22,820
|
|
24,831
|
|
11,389
|
|
1997/2008
|
1984/85
|
|||||||||||
|
Beach Commerce Center
|
—
|
|
476
|
|
1,899
|
|
644
|
|
476
|
|
2,543
|
|
3,019
|
|
1,327
|
|
2000
|
2000
|
|||||||||||
|
Interstate Distribution Center
|
—
|
|
1,879
|
|
5,700
|
|
1,776
|
|
1,879
|
|
7,476
|
|
9,355
|
|
3,724
|
|
2005
|
1990
|
|||||||||||
|
Flagler Center
|
—
|
|
7,317
|
|
14,912
|
|
—
|
|
7,317
|
|
14,912
|
|
22,229
|
|
201
|
|
2016
|
1997 & 2005
|
|||||||||||
|
Ft. Lauderdale/Palm Beach area
|
|||||||||||||||||||||||||||||
|
Linpro Commerce Center
|
—
|
|
613
|
|
2,243
|
|
1,941
|
|
616
|
|
4,181
|
|
4,797
|
|
3,182
|
|
1996
|
1986
|
|||||||||||
|
Cypress Creek Business Park
|
—
|
|
—
|
|
2,465
|
|
1,878
|
|
—
|
|
4,343
|
|
4,343
|
|
2,867
|
|
1997
|
1986
|
|||||||||||
|
Lockhart Distribution Center
|
—
|
|
—
|
|
3,489
|
|
2,905
|
|
—
|
|
6,394
|
|
6,394
|
|
4,036
|
|
1997
|
1986
|
|||||||||||
|
Interstate Commerce Center
|
—
|
|
485
|
|
2,652
|
|
817
|
|
485
|
|
3,469
|
|
3,954
|
|
2,228
|
|
1998
|
1988
|
|||||||||||
|
Executive Airport Distribution Center (i)
|
7,309
|
|
1,991
|
|
4,857
|
|
5,138
|
|
1,991
|
|
9,995
|
|
11,986
|
|
4,697
|
|
2001
|
2004/06
|
|||||||||||
|
Sample 95 Business Park
|
—
|
|
2,202
|
|
8,785
|
|
3,452
|
|
2,202
|
|
12,237
|
|
14,439
|
|
7,572
|
|
1996/98
|
1990/99
|
|||||||||||
|
Blue Heron Distribution Center
|
—
|
|
975
|
|
3,626
|
|
1,939
|
|
975
|
|
5,565
|
|
6,540
|
|
3,412
|
|
1999
|
1986
|
|||||||||||
|
Blue Heron Distribution Center II
|
576
|
|
1,385
|
|
4,222
|
|
960
|
|
1,385
|
|
5,182
|
|
6,567
|
|
2,359
|
|
2004
|
1988
|
|||||||||||
|
Blue Heron Distribution Center III
|
—
|
|
450
|
|
—
|
|
2,671
|
|
450
|
|
2,671
|
|
3,121
|
|
849
|
|
2004
|
2009
|
|||||||||||
|
Ft. Myers
|
|||||||||||||||||||||||||||||
|
SunCoast Commerce Center I
|
—
|
|
911
|
|
—
|
|
4,768
|
|
928
|
|
4,751
|
|
5,679
|
|
1,594
|
|
2005
|
2008
|
|||||||||||
|
SunCoast Commerce Center II
|
—
|
|
911
|
|
—
|
|
4,952
|
|
928
|
|
4,935
|
|
5,863
|
|
1,863
|
|
2005
|
2007
|
|||||||||||
|
SunCoast Commerce Center III
|
—
|
|
1,720
|
|
—
|
|
6,584
|
|
1,763
|
|
6,541
|
|
8,304
|
|
1,978
|
|
2006
|
2008
|
|||||||||||
|
CALIFORNIA
|
|||||||||||||||||||||||||||||
|
San Francisco area
|
|||||||||||||||||||||||||||||
|
Wiegman Distribution Center I
|
—
|
|
2,197
|
|
8,788
|
|
2,094
|
|
2,308
|
|
10,771
|
|
13,079
|
|
5,868
|
|
1996
|
1986/87
|
|||||||||||
76
|
SCHEDULE III
|
|||||||||||||||||||||||||||||
|
REAL ESTATE PROPERTIES AND ACCUMULATED DEPRECIATION
|
|||||||||||||||||||||||||||||
|
DECEMBER 31, 2016
(In thousands, except footnotes)
|
|||||||||||||||||||||||||||||
|
Description
|
Encumbrances
|
Initial Cost to the Company
|
Costs
Capitalized Subsequent to Acquisition
|
Gross Amount Carried at Close of Period
|
Accumulated Depreciation
|
Year Acquired
|
Year Constructed
|
||||||||||||||||||||||
|
Land
|
Buildings and Improvements
|
Land
|
Buildings and Improvements
|
Total
|
|||||||||||||||||||||||||
|
Wiegman Distribution Center II
|
—
|
|
2,579
|
|
4,316
|
|
152
|
|
2,579
|
|
4,468
|
|
7,047
|
|
564
|
|
2012
|
1998
|
|||||||||||
|
Huntwood Distribution Center
|
—
|
|
3,842
|
|
15,368
|
|
3,054
|
|
3,842
|
|
18,422
|
|
22,264
|
|
10,214
|
|
1996
|
1988
|
|||||||||||
|
San Clemente Distribution Center
|
—
|
|
893
|
|
2,004
|
|
932
|
|
893
|
|
2,936
|
|
3,829
|
|
1,748
|
|
1997
|
1978
|
|||||||||||
|
Yosemite Distribution Center
|
—
|
|
259
|
|
7,058
|
|
1,344
|
|
259
|
|
8,402
|
|
8,661
|
|
4,441
|
|
1999
|
1974/87
|
|||||||||||
|
Los Angeles area
|
|||||||||||||||||||||||||||||
|
Kingsview Industrial Center (e)
|
2,454
|
|
643
|
|
2,573
|
|
628
|
|
643
|
|
3,201
|
|
3,844
|
|
1,833
|
|
1996
|
1980
|
|||||||||||
|
Dominguez Distribution Center (e)
|
7,152
|
|
2,006
|
|
8,025
|
|
1,170
|
|
2,006
|
|
9,195
|
|
11,201
|
|
5,327
|
|
1996
|
1977
|
|||||||||||
|
Main Street Distribution Center
|
—
|
|
1,606
|
|
4,103
|
|
836
|
|
1,606
|
|
4,939
|
|
6,545
|
|
2,636
|
|
1999
|
1999
|
|||||||||||
|
Walnut Business Center (e)
|
6,667
|
|
2,885
|
|
5,274
|
|
2,282
|
|
2,885
|
|
7,556
|
|
10,441
|
|
3,771
|
|
1996
|
1966/90
|
|||||||||||
|
Washington Distribution Center (e)
|
4,593
|
|
1,636
|
|
4,900
|
|
658
|
|
1,636
|
|
5,558
|
|
7,194
|
|
2,987
|
|
1997
|
1996/97
|
|||||||||||
|
Chino Distribution Center (f)
|
8,113
|
|
2,544
|
|
10,175
|
|
1,623
|
|
2,544
|
|
11,798
|
|
14,342
|
|
7,458
|
|
1998
|
1980
|
|||||||||||
|
Ramona Distribution Center
|
2,666
|
|
3,761
|
|
5,751
|
|
3
|
|
3,761
|
|
5,754
|
|
9,515
|
|
330
|
|
2014
|
1984
|
|||||||||||
|
Industry Distribution Center I (e)
|
17,260
|
|
10,230
|
|
12,373
|
|
4,427
|
|
10,230
|
|
16,800
|
|
27,030
|
|
8,178
|
|
1998
|
1959
|
|||||||||||
|
Industry Distribution Center III (e)
|
1,823
|
|
—
|
|
3,012
|
|
(157
|
)
|
—
|
|
2,855
|
|
2,855
|
|
2,855
|
|
2007
|
1992
|
|||||||||||
|
Chestnut Business Center
|
—
|
|
1,674
|
|
3,465
|
|
250
|
|
1,674
|
|
3,715
|
|
5,389
|
|
1,814
|
|
1998
|
1999
|
|||||||||||
|
Los Angeles Corporate Center
|
—
|
|
1,363
|
|
5,453
|
|
3,056
|
|
1,363
|
|
8,509
|
|
9,872
|
|
5,521
|
|
1996
|
1986
|
|||||||||||
|
Santa Barbara
|
|
|
|
|
|
|
|
|
|
|
|
|
|
|
|
|
|
|
|||||||||||
|
University Business Center
|
—
|
|
5,517
|
|
22,067
|
|
6,679
|
|
5,519
|
|
28,744
|
|
34,263
|
|
16,120
|
|
1996
|
1987/88
|
|||||||||||
|
Fresno
|
|||||||||||||||||||||||||||||
|
Shaw Commerce Center (e)
|
12,282
|
|
2,465
|
|
11,627
|
|
5,144
|
|
2,465
|
|
16,771
|
|
19,236
|
|
10,095
|
|
1998
|
1978/81/87
|
|||||||||||
|
San Diego
|
|||||||||||||||||||||||||||||
|
Eastlake Distribution Center
|
—
|
|
3,046
|
|
6,888
|
|
1,767
|
|
3,046
|
|
8,655
|
|
11,701
|
|
5,099
|
|
1997
|
1989
|
|||||||||||
|
Ocean View Corporate Center (i)
|
8,819
|
|
6,577
|
|
7,105
|
|
779
|
|
6,577
|
|
7,884
|
|
14,461
|
|
2,393
|
|
2010
|
2005
|
|||||||||||
|
TEXAS
|
|||||||||||||||||||||||||||||
|
Dallas
|
|||||||||||||||||||||||||||||
|
Interstate Distribution Center I & II (g)
|
5,544
|
|
1,746
|
|
4,941
|
|
3,518
|
|
1,746
|
|
8,459
|
|
10,205
|
|
5,869
|
|
1988
|
1978
|
|||||||||||
|
Interstate Distribution Center III (g)
|
2,226
|
|
519
|
|
2,008
|
|
1,570
|
|
519
|
|
3,578
|
|
4,097
|
|
1,862
|
|
2000
|
1979
|
|||||||||||
|
Interstate Distribution Center IV
|
—
|
|
416
|
|
2,481
|
|
518
|
|
416
|
|
2,999
|
|
3,415
|
|
1,451
|
|
2004
|
2002
|
|||||||||||
|
Interstate Distribution Center V, VI &
VII (h)
|
4,627
|
|
1,824
|
|
4,106
|
|
2,121
|
|
1,824
|
|
6,227
|
|
8,051
|
|
2,581
|
|
2009
|
1979/80/81
|
|||||||||||
|
Venture Warehouses (g)
|
4,235
|
|
1,452
|
|
3,762
|
|
2,583
|
|
1,452
|
|
6,345
|
|
7,797
|
|
4,909
|
|
1988
|
1979
|
|||||||||||
77
|
SCHEDULE III
|
|||||||||||||||||||||||||||||
|
REAL ESTATE PROPERTIES AND ACCUMULATED DEPRECIATION
|
|||||||||||||||||||||||||||||
|
DECEMBER 31, 2016
(In thousands, except footnotes)
|
|||||||||||||||||||||||||||||
|
Description
|
Encumbrances
|
Initial Cost to the Company
|
Costs
Capitalized Subsequent to Acquisition
|
Gross Amount Carried at Close of Period
|
Accumulated Depreciation
|
Year Acquired
|
Year Constructed
|
||||||||||||||||||||||
|
Land
|
Buildings and Improvements
|
Land
|
Buildings and Improvements
|
Total
|
|||||||||||||||||||||||||
|
Stemmons Circle (g)
|
1,667
|
|
363
|
|
2,014
|
|
692
|
|
363
|
|
2,706
|
|
3,069
|
|
1,774
|
|
1998
|
1977
|
|||||||||||
|
ParkView Commerce Center 1-3
|
—
|
|
2,663
|
|
—
|
|
18,044
|
|
2,663
|
|
18,044
|
|
20,707
|
|
306
|
|
2014
|
2015
|
|||||||||||
|
Shady Trail Distribution Center
|
—
|
|
635
|
|
3,621
|
|
1,200
|
|
635
|
|
4,821
|
|
5,456
|
|
2,228
|
|
2003
|
1998
|
|||||||||||
|
Valwood Distribution Center
|
—
|
|
4,361
|
|
34,405
|
|
2,817
|
|
4,361
|
|
37,222
|
|
41,583
|
|
6,396
|
|
2012
|
1986/87/97/98
|
|||||||||||
|
Northfield Distribution Center
|
—
|
|
12,470
|
|
50,713
|
|
2,101
|
|
12,470
|
|
52,814
|
|
65,284
|
|
9,032
|
|
2013
|
1999-2001/03/04/08
|
|||||||||||
|
Houston
|
|||||||||||||||||||||||||||||
|
World Houston Int'l Business Ctr 1 & 2 (f)
|
4,831
|
|
660
|
|
5,893
|
|
1,986
|
|
660
|
|
7,879
|
|
8,539
|
|
4,460
|
|
1998
|
1996
|
|||||||||||
|
World Houston Int'l Business Ctr 3, 4 &
5 (g)
|
4,742
|
|
1,025
|
|
6,413
|
|
1,293
|
|
1,025
|
|
7,706
|
|
8,731
|
|
4,389
|
|
1998
|
1998
|
|||||||||||
|
World Houston Int'l Business Ctr 6 (g)
|
1,886
|
|
425
|
|
2,423
|
|
624
|
|
425
|
|
3,047
|
|
3,472
|
|
1,732
|
|
1998
|
1998
|
|||||||||||
|
World Houston Int'l Business Ctr 7 & 8 (g)
|
5,400
|
|
680
|
|
4,584
|
|
4,677
|
|
680
|
|
9,261
|
|
9,941
|
|
5,206
|
|
1998
|
1998
|
|||||||||||
|
World Houston Int'l Business Ctr 9 (g)
|
3,780
|
|
800
|
|
4,355
|
|
1,805
|
|
800
|
|
6,160
|
|
6,960
|
|
2,748
|
|
1998
|
1998
|
|||||||||||
|
World Houston Int'l Business Ctr 10
|
—
|
|
933
|
|
4,779
|
|
350
|
|
933
|
|
5,129
|
|
6,062
|
|
2,349
|
|
2001
|
1999
|
|||||||||||
|
World Houston Int'l Business Ctr 11
|
—
|
|
638
|
|
3,764
|
|
1,282
|
|
638
|
|
5,046
|
|
5,684
|
|
2,654
|
|
1999
|
1999
|
|||||||||||
|
World Houston Int'l Business Ctr 12
|
—
|
|
340
|
|
2,419
|
|
383
|
|
340
|
|
2,802
|
|
3,142
|
|
1,543
|
|
2000
|
2002
|
|||||||||||
|
World Houston Int'l Business Ctr 13
|
—
|
|
282
|
|
2,569
|
|
414
|
|
282
|
|
2,983
|
|
3,265
|
|
1,851
|
|
2000
|
2002
|
|||||||||||
|
World Houston Int'l Business Ctr 14
|
—
|
|
722
|
|
2,629
|
|
556
|
|
722
|
|
3,185
|
|
3,907
|
|
1,672
|
|
2000
|
2003
|
|||||||||||
|
World Houston Int'l Business Ctr 15
|
—
|
|
731
|
|
—
|
|
6,180
|
|
731
|
|
6,180
|
|
6,911
|
|
3,067
|
|
2000
|
2007
|
|||||||||||
|
World Houston Int'l Business Ctr 16
|
—
|
|
519
|
|
4,248
|
|
1,481
|
|
519
|
|
5,729
|
|
6,248
|
|
3,003
|
|
2000
|
2005
|
|||||||||||
|
World Houston Int'l Business Ctr 17
|
—
|
|
373
|
|
1,945
|
|
799
|
|
373
|
|
2,744
|
|
3,117
|
|
1,279
|
|
2000
|
2004
|
|||||||||||
|
World Houston Int'l Business Ctr 18
|
—
|
|
323
|
|
1,512
|
|
251
|
|
323
|
|
1,763
|
|
2,086
|
|
834
|
|
2005
|
1995
|
|||||||||||
|
World Houston Int'l Business Ctr 19
|
—
|
|
373
|
|
2,256
|
|
1,126
|
|
373
|
|
3,382
|
|
3,755
|
|
1,866
|
|
2000
|
2004
|
|||||||||||
|
World Houston Int'l Business Ctr 20
|
—
|
|
1,008
|
|
1,948
|
|
1,307
|
|
1,008
|
|
3,255
|
|
4,263
|
|
1,859
|
|
2000
|
2004
|
|||||||||||
|
World Houston Int'l Business Ctr 21 (f)
|
2,230
|
|
436
|
|
—
|
|
3,506
|
|
436
|
|
3,506
|
|
3,942
|
|
1,375
|
|
2000/03
|
2006
|
|||||||||||
|
World Houston Int'l Business Ctr 22
|
—
|
|
436
|
|
—
|
|
4,542
|
|
436
|
|
4,542
|
|
4,978
|
|
1,964
|
|
2000
|
2007
|
|||||||||||
|
World Houston Int'l Business Ctr 23 (f)
|
4,567
|
|
910
|
|
—
|
|
7,163
|
|
910
|
|
7,163
|
|
8,073
|
|
2,782
|
|
2000
|
2007
|
|||||||||||
|
World Houston Int'l Business Ctr 24
|
—
|
|
837
|
|
—
|
|
5,516
|
|
837
|
|
5,516
|
|
6,353
|
|
2,203
|
|
2005
|
2008
|
|||||||||||
|
World Houston Int'l Business Ctr 25
|
—
|
|
508
|
|
—
|
|
3,801
|
|
508
|
|
3,801
|
|
4,309
|
|
1,324
|
|
2005
|
2008
|
|||||||||||
|
World Houston Int'l Business Ctr 26 (i)
|
2,219
|
|
445
|
|
—
|
|
3,194
|
|
445
|
|
3,194
|
|
3,639
|
|
1,052
|
|
2005
|
2008
|
|||||||||||
|
World Houston Int'l Business Ctr 27
|
—
|
|
837
|
|
—
|
|
5,004
|
|
837
|
|
5,004
|
|
5,841
|
|
1,580
|
|
2005
|
2008
|
|||||||||||
78
|
SCHEDULE III
|
|||||||||||||||||||||||||||||
|
REAL ESTATE PROPERTIES AND ACCUMULATED DEPRECIATION
|
|||||||||||||||||||||||||||||
|
DECEMBER 31, 2016
(In thousands, except footnotes)
|
|||||||||||||||||||||||||||||
|
Description
|
Encumbrances
|
Initial Cost to the Company
|
Costs
Capitalized Subsequent to Acquisition
|
Gross Amount Carried at Close of Period
|
Accumulated Depreciation
|
Year Acquired
|
Year Constructed
|
||||||||||||||||||||||
|
Land
|
Buildings and Improvements
|
Land
|
Buildings and Improvements
|
Total
|
|||||||||||||||||||||||||
|
World Houston Int'l Business Ctr 28 (i)
|
3,041
|
|
550
|
|
—
|
|
4,437
|
|
550
|
|
4,437
|
|
4,987
|
|
1,328
|
|
2005
|
2009
|
|||||||||||
|
World Houston Int'l Business Ctr 29 (i)
|
3,002
|
|
782
|
|
—
|
|
4,141
|
|
974
|
|
3,949
|
|
4,923
|
|
1,144
|
|
2007
|
2009
|
|||||||||||
|
World Houston Int'l Business Ctr 30 (i)
|
4,121
|
|
981
|
|
—
|
|
5,776
|
|
1,222
|
|
5,535
|
|
6,757
|
|
1,926
|
|
2007
|
2009
|
|||||||||||
|
World Houston Int'l Business Ctr 31A
|
—
|
|
684
|
|
—
|
|
3,921
|
|
684
|
|
3,921
|
|
4,605
|
|
1,383
|
|
2008
|
2011
|
|||||||||||
|
World Houston Int'l Business Ctr 31B
|
—
|
|
546
|
|
—
|
|
3,537
|
|
546
|
|
3,537
|
|
4,083
|
|
816
|
|
2008
|
2012
|
|||||||||||
|
World Houston Int'l Business Ctr 32 (h)
|
3,959
|
|
1,225
|
|
—
|
|
5,663
|
|
1,526
|
|
5,362
|
|
6,888
|
|
1,078
|
|
2007
|
2012
|
|||||||||||
|
World Houston Int'l Business Ctr 33
|
—
|
|
1,166
|
|
—
|
|
7,867
|
|
1,166
|
|
7,867
|
|
9,033
|
|
1,115
|
|
2011
|
2013
|
|||||||||||
|
World Houston Int'l Business Ctr 34
|
—
|
|
439
|
|
—
|
|
3,373
|
|
439
|
|
3,373
|
|
3,812
|
|
527
|
|
2005
|
2012
|
|||||||||||
|
World Houston Int'l Business Ctr 35
|
—
|
|
340
|
|
—
|
|
2,475
|
|
340
|
|
2,475
|
|
2,815
|
|
323
|
|
2005
|
2012
|
|||||||||||
|
World Houston Int'l Business Ctr 36
|
—
|
|
684
|
|
—
|
|
4,879
|
|
684
|
|
4,879
|
|
5,563
|
|
700
|
|
2011
|
2013
|
|||||||||||
|
World Houston Int'l Business Ctr 37
|
—
|
|
759
|
|
—
|
|
6,384
|
|
759
|
|
6,384
|
|
7,143
|
|
820
|
|
2011
|
2013
|
|||||||||||
|
World Houston Int'l Business Ctr 38
|
—
|
|
1,053
|
|
—
|
|
7,320
|
|
1,053
|
|
7,320
|
|
8,373
|
|
1,025
|
|
2011
|
2013
|
|||||||||||
|
World Houston Int'l Business Ctr 39
|
—
|
|
620
|
|
—
|
|
5,202
|
|
620
|
|
5,202
|
|
5,822
|
|
382
|
|
2011
|
2014
|
|||||||||||
|
World Houston Int'l Business Ctr 40
|
—
|
|
1,072
|
|
—
|
|
9,346
|
|
1,072
|
|
9,346
|
|
10,418
|
|
712
|
|
2011
|
2014
|
|||||||||||
|
World Houston Int'l Business Ctr 41
|
—
|
|
649
|
|
—
|
|
5,950
|
|
649
|
|
5,950
|
|
6,599
|
|
326
|
|
2011
|
2014
|
|||||||||||
|
World Houston Int'l Business Ctr 42
|
—
|
|
571
|
|
—
|
|
4,813
|
|
571
|
|
4,813
|
|
5,384
|
|
243
|
|
2011
|
2015
|
|||||||||||
|
Central Green Distribution Center
|
—
|
|
566
|
|
4,031
|
|
417
|
|
566
|
|
4,448
|
|
5,014
|
|
2,266
|
|
1999
|
1998
|
|||||||||||
|
Glenmont Business Park
|
—
|
|
936
|
|
6,161
|
|
2,916
|
|
936
|
|
9,077
|
|
10,013
|
|
5,133
|
|
1998
|
1999/2000
|
|||||||||||
|
Techway Southwest I
|
—
|
|
729
|
|
3,765
|
|
2,281
|
|
729
|
|
6,046
|
|
6,775
|
|
3,477
|
|
2000
|
2001
|
|||||||||||
|
Techway Southwest II
|
—
|
|
550
|
|
3,689
|
|
1,283
|
|
550
|
|
4,972
|
|
5,522
|
|
2,596
|
|
2000
|
2004
|
|||||||||||
|
Techway Southwest III
|
—
|
|
597
|
|
—
|
|
5,578
|
|
751
|
|
5,424
|
|
6,175
|
|
2,556
|
|
1999
|
2006
|
|||||||||||
|
Techway Southwest IV
|
—
|
|
535
|
|
—
|
|
5,791
|
|
674
|
|
5,652
|
|
6,326
|
|
1,932
|
|
1999
|
2008
|
|||||||||||
|
Beltway Crossing Business Park I
|
—
|
|
458
|
|
5,712
|
|
2,725
|
|
458
|
|
8,437
|
|
8,895
|
|
4,044
|
|
2002
|
2001
|
|||||||||||
|
Beltway Crossing Business Park II
|
—
|
|
415
|
|
—
|
|
2,907
|
|
415
|
|
2,907
|
|
3,322
|
|
1,170
|
|
2005
|
2007
|
|||||||||||
|
Beltway Crossing Business Park III
|
—
|
|
460
|
|
—
|
|
3,111
|
|
460
|
|
3,111
|
|
3,571
|
|
1,289
|
|
2005
|
2008
|
|||||||||||
|
Beltway Crossing Business Park IV
|
—
|
|
460
|
|
—
|
|
3,035
|
|
460
|
|
3,035
|
|
3,495
|
|
1,260
|
|
2005
|
2008
|
|||||||||||
|
Beltway Crossing Business Park V (i)
|
3,508
|
|
701
|
|
—
|
|
5,051
|
|
701
|
|
5,051
|
|
5,752
|
|
1,873
|
|
2005
|
2008
|
|||||||||||
|
Beltway Crossing Business Park VI (h)
|
3,851
|
|
618
|
|
—
|
|
6,082
|
|
618
|
|
6,082
|
|
6,700
|
|
1,723
|
|
2005
|
2008
|
|||||||||||
|
Beltway Crossing Business Park VII (h)
|
3,864
|
|
765
|
|
—
|
|
5,959
|
|
765
|
|
5,959
|
|
6,724
|
|
2,210
|
|
2005
|
2009
|
|||||||||||
|
Beltway Crossing Business Park VIII
|
—
|
|
721
|
|
—
|
|
4,617
|
|
721
|
|
4,617
|
|
5,338
|
|
1,177
|
|
2005
|
2011
|
|||||||||||
|
Beltway Crossing Business Park IX
|
—
|
|
418
|
|
—
|
|
2,113
|
|
418
|
|
2,113
|
|
2,531
|
|
371
|
|
2007
|
2012
|
|||||||||||
79
|
SCHEDULE III
|
|||||||||||||||||||||||||||||
|
REAL ESTATE PROPERTIES AND ACCUMULATED DEPRECIATION
|
|||||||||||||||||||||||||||||
|
DECEMBER 31, 2016
(In thousands, except footnotes)
|
|||||||||||||||||||||||||||||
|
Description
|
Encumbrances
|
Initial Cost to the Company
|
Costs
Capitalized Subsequent to Acquisition
|
Gross Amount Carried at Close of Period
|
Accumulated Depreciation
|
Year Acquired
|
Year Constructed
|
||||||||||||||||||||||
|
Land
|
Buildings and Improvements
|
Land
|
Buildings and Improvements
|
Total
|
|||||||||||||||||||||||||
|
Beltway Crossing Business Park X
|
—
|
|
733
|
|
—
|
|
3,871
|
|
733
|
|
3,871
|
|
4,604
|
|
625
|
|
2007
|
2012
|
|||||||||||
|
Beltway Crossing Business Park XI
|
—
|
|
690
|
|
—
|
|
4,101
|
|
690
|
|
4,101
|
|
4,791
|
|
523
|
|
2007
|
2013
|
|||||||||||
|
West Road Business Park I
|
—
|
|
621
|
|
—
|
|
4,332
|
|
621
|
|
4,332
|
|
4,953
|
|
378
|
|
2012
|
2014
|
|||||||||||
|
West Road Business Park II
|
—
|
|
981
|
|
—
|
|
5,295
|
|
981
|
|
5,295
|
|
6,276
|
|
426
|
|
2012
|
2014
|
|||||||||||
|
West Road Business Park III
|
—
|
|
597
|
|
—
|
|
4,245
|
|
597
|
|
4,245
|
|
4,842
|
|
84
|
|
2012
|
2015
|
|||||||||||
|
West Road Business Park IV
|
—
|
|
621
|
|
—
|
|
4,949
|
|
621
|
|
4,949
|
|
5,570
|
|
166
|
|
2012
|
2015
|
|||||||||||
|
Ten West Crossing 1
|
—
|
|
566
|
|
—
|
|
2,997
|
|
566
|
|
2,997
|
|
3,563
|
|
431
|
|
2012
|
2013
|
|||||||||||
|
Ten West Crossing 2
|
—
|
|
829
|
|
—
|
|
4,385
|
|
833
|
|
4,381
|
|
5,214
|
|
716
|
|
2012
|
2013
|
|||||||||||
|
Ten West Crossing 3
|
—
|
|
609
|
|
—
|
|
4,357
|
|
613
|
|
4,353
|
|
4,966
|
|
680
|
|
2012
|
2013
|
|||||||||||
|
Ten West Crossing 4
|
—
|
|
694
|
|
—
|
|
4,506
|
|
699
|
|
4,501
|
|
5,200
|
|
620
|
|
2012
|
2014
|
|||||||||||
|
Ten West Crossing 5
|
—
|
|
933
|
|
—
|
|
5,872
|
|
940
|
|
5,865
|
|
6,805
|
|
573
|
|
2012
|
2014
|
|||||||||||
|
Ten West Crossing 6
|
—
|
|
640
|
|
—
|
|
4,299
|
|
644
|
|
4,295
|
|
4,939
|
|
307
|
|
2012
|
2014
|
|||||||||||
|
Ten West Crossing 7
|
—
|
|
584
|
|
—
|
|
5,125
|
|
588
|
|
5,121
|
|
5,709
|
|
83
|
|
2012
|
2015
|
|||||||||||
|
El Paso
|
|
|
|
|
|
|
|
|
|
|
|
|
|
|
|
|
|
|
|||||||||||
|
Butterfield Trail
|
—
|
|
—
|
|
20,725
|
|
8,538
|
|
—
|
|
29,263
|
|
29,263
|
|
17,672
|
|
1997/2000
|
1987/95
|
|||||||||||
|
Rojas Commerce Park (g)
|
4,193
|
|
900
|
|
3,659
|
|
3,161
|
|
900
|
|
6,820
|
|
7,720
|
|
4,903
|
|
1999
|
1986
|
|||||||||||
|
Americas Ten Business Center I
|
—
|
|
526
|
|
2,778
|
|
1,241
|
|
526
|
|
4,019
|
|
4,545
|
|
2,211
|
|
2001
|
2003
|
|||||||||||
|
San Antonio
|
|||||||||||||||||||||||||||||
|
Alamo Downs Distribution Center
|
—
|
|
1,342
|
|
6,338
|
|
1,280
|
|
1,342
|
|
7,618
|
|
8,960
|
|
4,133
|
|
2004
|
1986/2002
|
|||||||||||
|
Arion Business Park 1-13, 15
|
—
|
|
4,143
|
|
31,432
|
|
6,023
|
|
4,143
|
|
37,455
|
|
41,598
|
|
16,760
|
|
2005
|
1988-2000/06
|
|||||||||||
|
Arion Business Park 14
|
—
|
|
423
|
|
—
|
|
3,435
|
|
423
|
|
3,435
|
|
3,858
|
|
1,306
|
|
2005
|
2006
|
|||||||||||
|
Arion Business Park 16 (f)
|
2,309
|
|
427
|
|
—
|
|
3,654
|
|
427
|
|
3,654
|
|
4,081
|
|
1,212
|
|
2005
|
2007
|
|||||||||||
|
Arion Business Park 17
|
—
|
|
616
|
|
—
|
|
4,096
|
|
616
|
|
4,096
|
|
4,712
|
|
2,097
|
|
2005
|
2007
|
|||||||||||
|
Arion Business Park 18 (h)
|
1,604
|
|
418
|
|
—
|
|
2,373
|
|
418
|
|
2,373
|
|
2,791
|
|
1,002
|
|
2005
|
2008
|
|||||||||||
|
Wetmore Business Center 1-4
|
—
|
|
1,494
|
|
10,804
|
|
3,194
|
|
1,494
|
|
13,998
|
|
15,492
|
|
6,781
|
|
2005
|
1998/99
|
|||||||||||
|
Wetmore Business Center 5 (i)
|
2,347
|
|
412
|
|
—
|
|
3,436
|
|
412
|
|
3,436
|
|
3,848
|
|
1,531
|
|
2006
|
2008
|
|||||||||||
|
Wetmore Business Center 6 (i)
|
2,568
|
|
505
|
|
—
|
|
3,706
|
|
505
|
|
3,706
|
|
4,211
|
|
1,335
|
|
2006
|
2008
|
|||||||||||
|
Wetmore Business Center 7 (i)
|
2,674
|
|
546
|
|
—
|
|
3,838
|
|
546
|
|
3,838
|
|
4,384
|
|
1,014
|
|
2006
|
2008
|
|||||||||||
|
Wetmore Business Center 8 (i)
|
5,303
|
|
1,056
|
|
—
|
|
7,639
|
|
1,056
|
|
7,639
|
|
8,695
|
|
2,337
|
|
2006
|
2008
|
|||||||||||
|
Fairgrounds Business Park
|
—
|
|
1,644
|
|
8,209
|
|
2,176
|
|
1,644
|
|
10,385
|
|
12,029
|
|
4,800
|
|
2007
|
1985/86
|
|||||||||||
|
Rittiman Distribution Center
|
—
|
|
1,083
|
|
6,649
|
|
337
|
|
1,083
|
|
6,986
|
|
8,069
|
|
1,187
|
|
2011
|
2000
|
|||||||||||
80
|
SCHEDULE III
|
|||||||||||||||||||||||||||||
|
REAL ESTATE PROPERTIES AND ACCUMULATED DEPRECIATION
|
|||||||||||||||||||||||||||||
|
DECEMBER 31, 2016
(In thousands, except footnotes)
|
|||||||||||||||||||||||||||||
|
Description
|
Encumbrances
|
Initial Cost to the Company
|
Costs
Capitalized Subsequent to Acquisition
|
Gross Amount Carried at Close of Period
|
Accumulated Depreciation
|
Year Acquired
|
Year Constructed
|
||||||||||||||||||||||
|
Land
|
Buildings and Improvements
|
Land
|
Buildings and Improvements
|
Total
|
|||||||||||||||||||||||||
|
Thousand Oaks Distribution Center 1
|
—
|
|
607
|
|
—
|
|
4,292
|
|
607
|
|
4,292
|
|
4,899
|
|
951
|
|
2008
|
2012
|
|||||||||||
|
Thousand Oaks Distribution Center 2
|
—
|
|
794
|
|
—
|
|
4,719
|
|
794
|
|
4,719
|
|
5,513
|
|
887
|
|
2008
|
2012
|
|||||||||||
|
Thousand Oaks Distribution Center 3
|
—
|
|
772
|
|
—
|
|
4,457
|
|
772
|
|
4,457
|
|
5,229
|
|
680
|
|
2008
|
2013
|
|||||||||||
|
Thousand Oaks Distribution Center 4
|
—
|
|
753
|
|
—
|
|
4,688
|
|
753
|
|
4,688
|
|
5,441
|
|
183
|
|
2013
|
2015
|
|||||||||||
|
Alamo Ridge Business Park I
|
—
|
|
623
|
|
—
|
|
7,970
|
|
623
|
|
7,970
|
|
8,593
|
|
445
|
|
2007
|
2015
|
|||||||||||
|
Alamo Ridge Business Park II
|
—
|
|
402
|
|
—
|
|
5,567
|
|
402
|
|
5,567
|
|
5,969
|
|
151
|
|
2007
|
2015
|
|||||||||||
|
Austin
|
|||||||||||||||||||||||||||||
|
Colorado Crossing Distribution Center (g)
|
13,265
|
|
4,602
|
|
19,757
|
|
62
|
|
4,602
|
|
19,819
|
|
24,421
|
|
2,764
|
|
2014
|
2009
|
|||||||||||
|
Southpark Corporate Center
|
—
|
|
2,670
|
|
14,756
|
|
497
|
|
2,670
|
|
15,253
|
|
17,923
|
|
1,323
|
|
2015
|
1995
|
|||||||||||
|
Springdale Business Center
|
—
|
|
2,824
|
|
8,398
|
|
254
|
|
2,824
|
|
8,652
|
|
11,476
|
|
558
|
|
2015
|
2000
|
|||||||||||
|
ARIZONA
|
|||||||||||||||||||||||||||||
|
Phoenix area
|
|||||||||||||||||||||||||||||
|
Broadway Industrial Park I
|
—
|
|
837
|
|
3,349
|
|
1,031
|
|
837
|
|
4,380
|
|
5,217
|
|
2,663
|
|
1996
|
1971
|
|||||||||||
|
Broadway Industrial Park II
|
—
|
|
455
|
|
482
|
|
202
|
|
455
|
|
684
|
|
1,139
|
|
422
|
|
1999
|
1971
|
|||||||||||
|
Broadway Industrial Park III
|
—
|
|
775
|
|
1,742
|
|
531
|
|
775
|
|
2,273
|
|
3,048
|
|
1,346
|
|
2000
|
1983
|
|||||||||||
|
Broadway Industrial Park IV
|
—
|
|
380
|
|
1,652
|
|
783
|
|
380
|
|
2,435
|
|
2,815
|
|
1,502
|
|
2000
|
1986
|
|||||||||||
|
Broadway Industrial Park V
|
—
|
|
353
|
|
1,090
|
|
141
|
|
353
|
|
1,231
|
|
1,584
|
|
662
|
|
2002
|
1980
|
|||||||||||
|
Broadway Industrial Park VI (f)
|
1,801
|
|
599
|
|
1,855
|
|
730
|
|
599
|
|
2,585
|
|
3,184
|
|
1,485
|
|
2002
|
1979
|
|||||||||||
|
Broadway Industrial Park VII
|
—
|
|
450
|
|
650
|
|
232
|
|
450
|
|
882
|
|
1,332
|
|
182
|
|
2011
|
1999
|
|||||||||||
|
Kyrene Distribution Center
|
—
|
|
1,490
|
|
4,453
|
|
1,813
|
|
1,490
|
|
6,266
|
|
7,756
|
|
3,677
|
|
1999
|
1981/2001
|
|||||||||||
|
Southpark Distribution Center
|
—
|
|
918
|
|
2,738
|
|
1,699
|
|
918
|
|
4,437
|
|
5,355
|
|
1,565
|
|
2001
|
2000
|
|||||||||||
|
Santan 10 Distribution Center I
|
—
|
|
846
|
|
2,647
|
|
643
|
|
846
|
|
3,290
|
|
4,136
|
|
1,383
|
|
2001
|
2005
|
|||||||||||
|
Santan 10 Distribution Center II (f)
|
3,536
|
|
1,088
|
|
—
|
|
5,163
|
|
1,088
|
|
5,163
|
|
6,251
|
|
2,123
|
|
2004
|
2007
|
|||||||||||
|
Chandler Freeways
|
—
|
|
1,525
|
|
—
|
|
7,381
|
|
1,525
|
|
7,381
|
|
8,906
|
|
820
|
|
2012
|
2013
|
|||||||||||
|
Kyrene 202 Business Park I
|
—
|
|
653
|
|
—
|
|
5,777
|
|
653
|
|
5,777
|
|
6,430
|
|
368
|
|
2011
|
2014
|
|||||||||||
|
Kyrene 202 Business Park II
|
—
|
|
387
|
|
—
|
|
3,414
|
|
387
|
|
3,414
|
|
3,801
|
|
231
|
|
2011
|
2014
|
|||||||||||
|
Kyrene 202 Business Park VI
|
—
|
|
936
|
|
—
|
|
6,970
|
|
936
|
|
6,970
|
|
7,906
|
|
90
|
|
2011
|
2015
|
|||||||||||
|
Metro Business Park
|
—
|
|
1,927
|
|
7,708
|
|
7,055
|
|
1,927
|
|
14,763
|
|
16,690
|
|
9,663
|
|
1996
|
1977/79
|
|||||||||||
|
35th Avenue Distribution Center (original building was redeveloped; currently in lease-up phase of development program)
|
—
|
|
418
|
|
2,381
|
|
207
|
|
418
|
|
2,588
|
|
3,006
|
|
1,341
|
|
1997
|
1967
|
|||||||||||
|
51st Avenue Distribution Center
|
—
|
|
300
|
|
2,029
|
|
1,013
|
|
300
|
|
3,042
|
|
3,342
|
|
1,863
|
|
1998
|
1987
|
|||||||||||
81
|
SCHEDULE III
|
|||||||||||||||||||||||||||||
|
REAL ESTATE PROPERTIES AND ACCUMULATED DEPRECIATION
|
|||||||||||||||||||||||||||||
|
DECEMBER 31, 2016
(In thousands, except footnotes)
|
|||||||||||||||||||||||||||||
|
Description
|
Encumbrances
|
Initial Cost to the Company
|
Costs
Capitalized Subsequent to Acquisition
|
Gross Amount Carried at Close of Period
|
Accumulated Depreciation
|
Year Acquired
|
Year Constructed
|
||||||||||||||||||||||
|
Land
|
Buildings and Improvements
|
Land
|
Buildings and Improvements
|
Total
|
|||||||||||||||||||||||||
|
East University Distribution Center I & II (f)
|
4,093
|
|
1,120
|
|
4,482
|
|
1,633
|
|
1,120
|
|
6,115
|
|
7,235
|
|
3,825
|
|
1998
|
1987/89
|
|||||||||||
|
East University Distribution Center III
|
—
|
|
444
|
|
698
|
|
423
|
|
444
|
|
1,121
|
|
1,565
|
|
256
|
|
2010
|
1981
|
|||||||||||
|
55th Avenue Distribution Center (f)
|
3,158
|
|
912
|
|
3,717
|
|
953
|
|
917
|
|
4,665
|
|
5,582
|
|
3,044
|
|
1998
|
1987
|
|||||||||||
|
Interstate Commons Distribution Center I
|
—
|
|
311
|
|
1,416
|
|
720
|
|
311
|
|
2,136
|
|
2,447
|
|
1,159
|
|
1999
|
1988
|
|||||||||||
|
Interstate Commons Distribution Center III
|
—
|
|
242
|
|
—
|
|
2,996
|
|
242
|
|
2,996
|
|
3,238
|
|
947
|
|
2000
|
2008
|
|||||||||||
|
Airport Commons Distribution Center
|
—
|
|
1,000
|
|
1,510
|
|
1,356
|
|
1,000
|
|
2,866
|
|
3,866
|
|
1,670
|
|
2003
|
1971
|
|||||||||||
|
40th Avenue Distribution Center (i)
|
4,124
|
|
703
|
|
—
|
|
6,059
|
|
703
|
|
6,059
|
|
6,762
|
|
1,874
|
|
2004
|
2008
|
|||||||||||
|
Sky Harbor Business Park
|
—
|
|
5,839
|
|
—
|
|
21,411
|
|
5,839
|
|
21,411
|
|
27,250
|
|
6,526
|
|
2006
|
2008
|
|||||||||||
|
Sky Harbor Business Park 6
|
—
|
|
807
|
|
—
|
|
2,177
|
|
807
|
|
2,177
|
|
2,984
|
|
102
|
|
2014
|
2015
|
|||||||||||
|
Tucson
|
|||||||||||||||||||||||||||||
|
Country Club Commerce Center I
|
—
|
|
506
|
|
3,564
|
|
2,173
|
|
693
|
|
5,550
|
|
6,243
|
|
2,499
|
|
1997/2003
|
1994/2003
|
|||||||||||
|
Country Club Commerce Center II
|
—
|
|
442
|
|
3,381
|
|
37
|
|
442
|
|
3,418
|
|
3,860
|
|
1,134
|
|
2007
|
2000
|
|||||||||||
|
Country Club Commerce Center III & IV
|
—
|
|
1,407
|
|
—
|
|
11,825
|
|
1,575
|
|
11,657
|
|
13,232
|
|
3,936
|
|
2007
|
2009
|
|||||||||||
|
Airport Distribution Center
|
—
|
|
1,103
|
|
4,672
|
|
1,549
|
|
1,103
|
|
6,221
|
|
7,324
|
|
3,739
|
|
1998
|
1995
|
|||||||||||
|
Southpointe Distribution Center
|
—
|
|
—
|
|
3,982
|
|
2,950
|
|
—
|
|
6,932
|
|
6,932
|
|
4,229
|
|
1999
|
1989
|
|||||||||||
|
Benan Distribution Center
|
—
|
|
707
|
|
1,842
|
|
649
|
|
707
|
|
2,491
|
|
3,198
|
|
1,360
|
|
2005
|
2001
|
|||||||||||
|
NORTH CAROLINA
|
|
|
|
|
|
|
|
|
|
|
|
|
|
|
|
|
|
|
|||||||||||
|
Charlotte area
|
|
|
|
|
|
|
|
|
|
|
|
|
|
|
|
|
|
|
|||||||||||
|
NorthPark Business Park (f)
|
12,858
|
|
2,758
|
|
15,932
|
|
4,039
|
|
2,758
|
|
19,971
|
|
22,729
|
|
8,680
|
|
2006
|
1987-89
|
|||||||||||
|
Lindbergh Business Park
|
—
|
|
470
|
|
3,401
|
|
453
|
|
470
|
|
3,854
|
|
4,324
|
|
1,485
|
|
2007
|
2001/03
|
|||||||||||
|
Commerce Park Center I
|
—
|
|
765
|
|
4,303
|
|
791
|
|
765
|
|
5,094
|
|
5,859
|
|
1,842
|
|
2007
|
1983
|
|||||||||||
|
Commerce Park Center II (h)
|
1,284
|
|
335
|
|
1,603
|
|
297
|
|
335
|
|
1,900
|
|
2,235
|
|
555
|
|
2010
|
1987
|
|||||||||||
|
Commerce Park Center III (h)
|
2,135
|
|
558
|
|
2,225
|
|
932
|
|
558
|
|
3,157
|
|
3,715
|
|
844
|
|
2010
|
1981
|
|||||||||||
|
Nations Ford Business Park
|
—
|
|
3,924
|
|
16,171
|
|
3,251
|
|
3,924
|
|
19,422
|
|
23,346
|
|
8,304
|
|
2007
|
1989/94
|
|||||||||||
|
Airport Commerce Center
|
—
|
|
1,454
|
|
10,136
|
|
1,976
|
|
1,454
|
|
12,112
|
|
13,566
|
|
3,793
|
|
2008
|
2001/02
|
|||||||||||
|
Interchange Park I (i)
|
5,804
|
|
986
|
|
7,949
|
|
583
|
|
986
|
|
8,532
|
|
9,518
|
|
2,500
|
|
2008
|
1989
|
|||||||||||
|
Interchange Park II
|
—
|
|
746
|
|
1,456
|
|
55
|
|
746
|
|
1,511
|
|
2,257
|
|
173
|
|
2013
|
2000
|
|||||||||||
|
Ridge Creek Distribution Center I
|
—
|
|
1,284
|
|
13,163
|
|
951
|
|
1,284
|
|
14,114
|
|
15,398
|
|
3,752
|
|
2008
|
2006
|
|||||||||||
|
Ridge Creek Distribution Center II (h)
|
9,567
|
|
3,033
|
|
11,497
|
|
2,116
|
|
3,033
|
|
13,613
|
|
16,646
|
|
2,194
|
|
2011
|
2003
|
|||||||||||
|
Ridge Creek Distribution Center III
|
—
|
|
2,459
|
|
11,147
|
|
381
|
|
2,459
|
|
11,528
|
|
13,987
|
|
1,115
|
|
2014
|
2013
|
|||||||||||
82
|
SCHEDULE III
|
|||||||||||||||||||||||||||||
|
REAL ESTATE PROPERTIES AND ACCUMULATED DEPRECIATION
|
|||||||||||||||||||||||||||||
|
DECEMBER 31, 2016
(In thousands, except footnotes)
|
|||||||||||||||||||||||||||||
|
Description
|
Encumbrances
|
Initial Cost to the Company
|
Costs
Capitalized Subsequent to Acquisition
|
Gross Amount Carried at Close of Period
|
Accumulated Depreciation
|
Year Acquired
|
Year Constructed
|
||||||||||||||||||||||
|
Land
|
Buildings and Improvements
|
Land
|
Buildings and Improvements
|
Total
|
|||||||||||||||||||||||||
|
Lakeview Business Center (h)
|
4,237
|
|
1,392
|
|
5,068
|
|
912
|
|
1,392
|
|
5,980
|
|
7,372
|
|
1,258
|
|
2011
|
1996
|
|||||||||||
|
Steele Creek Commerce Park I (g)
|
2,882
|
|
993
|
|
—
|
|
4,314
|
|
1,010
|
|
4,297
|
|
5,307
|
|
571
|
|
2013
|
2014
|
|||||||||||
|
Steele Creek Commerce Park II (g)
|
2,932
|
|
941
|
|
—
|
|
4,458
|
|
957
|
|
4,442
|
|
5,399
|
|
510
|
|
2013
|
2014
|
|||||||||||
|
Steele Creek Commerce Park III
|
—
|
|
1,464
|
|
—
|
|
6,411
|
|
1,469
|
|
6,406
|
|
7,875
|
|
588
|
|
2013
|
2014
|
|||||||||||
|
Steele Creek Commerce Park IV
|
—
|
|
684
|
|
—
|
|
3,944
|
|
687
|
|
3,941
|
|
4,628
|
|
249
|
|
2013
|
2015
|
|||||||||||
|
Waterford Distribution Center
|
—
|
|
654
|
|
3,392
|
|
501
|
|
654
|
|
3,893
|
|
4,547
|
|
1,102
|
|
2008
|
2000
|
|||||||||||
|
LOUISIANA
|
|||||||||||||||||||||||||||||
|
New Orleans
|
|||||||||||||||||||||||||||||
|
Elmwood Business Park
|
—
|
|
2,861
|
|
6,337
|
|
4,536
|
|
2,861
|
|
10,873
|
|
13,734
|
|
7,492
|
|
1997
|
1979
|
|||||||||||
|
Riverbend Business Park
|
—
|
|
2,557
|
|
17,623
|
|
6,762
|
|
2,557
|
|
24,385
|
|
26,942
|
|
13,630
|
|
1997
|
1984
|
|||||||||||
|
COLORADO
|
|||||||||||||||||||||||||||||
|
Denver
|
|||||||||||||||||||||||||||||
|
Rampart Distribution Center I
|
—
|
|
1,023
|
|
3,861
|
|
1,973
|
|
1,023
|
|
5,834
|
|
6,857
|
|
4,040
|
|
1988
|
1987
|
|||||||||||
|
Rampart Distribution Center II
|
—
|
|
230
|
|
2,977
|
|
1,164
|
|
230
|
|
4,141
|
|
4,371
|
|
2,697
|
|
1996/97
|
1996/97
|
|||||||||||
|
Rampart Distribution Center III
|
—
|
|
1,098
|
|
3,884
|
|
1,866
|
|
1,098
|
|
5,750
|
|
6,848
|
|
2,876
|
|
1997/98
|
1999
|
|||||||||||
|
Rampart Distribution Center IV
|
—
|
|
590
|
|
—
|
|
8,128
|
|
590
|
|
8,128
|
|
8,718
|
|
319
|
|
2012
|
2014
|
|||||||||||
|
Concord Distribution Center (h)
|
3,599
|
|
1,051
|
|
4,773
|
|
439
|
|
1,051
|
|
5,212
|
|
6,263
|
|
1,879
|
|
2007
|
2000
|
|||||||||||
|
Centennial Park (i)
|
3,541
|
|
750
|
|
3,319
|
|
1,738
|
|
750
|
|
5,057
|
|
5,807
|
|
1,697
|
|
2007
|
1990
|
|||||||||||
|
NEVADA
|
|||||||||||||||||||||||||||||
|
Las Vegas
|
|||||||||||||||||||||||||||||
|
Arville Distribution Center
|
—
|
|
4,933
|
|
5,094
|
|
430
|
|
4,933
|
|
5,524
|
|
10,457
|
|
1,691
|
|
2009
|
1997
|
|||||||||||
|
MISSISSIPPI
|
|||||||||||||||||||||||||||||
|
Jackson area
|
|||||||||||||||||||||||||||||
|
Interchange Business Park
|
—
|
|
343
|
|
5,007
|
|
3,246
|
|
343
|
|
8,253
|
|
8,596
|
|
5,279
|
|
1997
|
1981
|
|||||||||||
|
Tower Automotive
|
—
|
|
—
|
|
9,958
|
|
1,256
|
|
17
|
|
11,197
|
|
11,214
|
|
4,633
|
|
2001
|
2002
|
|||||||||||
|
Metro Airport Commerce Center I
|
—
|
|
303
|
|
1,479
|
|
1,074
|
|
303
|
|
2,553
|
|
2,856
|
|
1,505
|
|
2001
|
2003
|
|||||||||||
|
|
258,594
|
|
306,373
|
|
949,399
|
|
857,301
|
|
308,931
|
|
1,804,142
|
|
2,113,073
|
|
693,887
|
|
|
|
|||||||||||
83
|
SCHEDULE III
|
|||||||||||||||||||||||||||||
|
REAL ESTATE PROPERTIES AND ACCUMULATED DEPRECIATION
|
|||||||||||||||||||||||||||||
|
DECEMBER 31, 2016
(In thousands, except footnotes)
|
|||||||||||||||||||||||||||||
|
Description
|
Encumbrances
|
Initial Cost to the Company
|
Costs
Capitalized Subsequent to Acquisition
|
Gross Amount Carried at Close of Period
|
Accumulated Depreciation
|
Year Acquired
|
Year Constructed
|
||||||||||||||||||||||
|
Land
|
Buildings and Improvements
|
Land
|
Buildings and Improvements
|
Total
|
|||||||||||||||||||||||||
|
Industrial Development (d):
|
|
|
|
|
|
|
|
|
|
|
|
|
|
|
|
|
|
|
|||||||||||
|
FLORIDA
|
|
|
|
|
|
|
|
|
|
|
|
|
|
|
|
|
|
|
|||||||||||
|
Oak Creek Distribution Center land
|
—
|
|
1,226
|
|
—
|
|
2,455
|
|
1,446
|
|
2,235
|
|
3,681
|
|
—
|
|
2005
|
n/a
|
|||||||||||
|
Madison Distribution Center IV & V
|
—
|
|
565
|
|
—
|
|
6,960
|
|
565
|
|
6,960
|
|
7,525
|
|
—
|
|
2012
|
2016
|
|||||||||||
|
Horizon Commerce Park V
|
—
|
|
1,108
|
|
—
|
|
3,327
|
|
1,108
|
|
3,327
|
|
4,435
|
|
—
|
|
2008
|
n/a
|
|||||||||||
|
Horizon Commerce Park VII
|
—
|
|
962
|
|
—
|
|
5,929
|
|
962
|
|
5,929
|
|
6,891
|
|
—
|
|
2008
|
n/a
|
|||||||||||
|
Horizon Commerce Park land
|
—
|
|
6,701
|
|
—
|
|
9,428
|
|
6,701
|
|
9,428
|
|
16,129
|
|
—
|
|
2008/09
|
n/a
|
|||||||||||
|
SunCoast Commerce Center IV
|
—
|
|
1,733
|
|
—
|
|
4,522
|
|
1,762
|
|
4,493
|
|
6,255
|
|
—
|
|
2006
|
n/a
|
|||||||||||
|
SunCoast Commerce Center land
|
—
|
|
9,159
|
|
—
|
|
4,484
|
|
9,343
|
|
4,300
|
|
13,643
|
|
—
|
|
2006
|
n/a
|
|||||||||||
|
Weston Commerce Park
|
—
|
|
4,163
|
|
9,951
|
|
167
|
|
4,163
|
|
10,118
|
|
14,281
|
|
22
|
|
2016
|
n/a
|
|||||||||||
|
Gateway Commerce Park land
|
—
|
|
26,728
|
|
—
|
|
516
|
|
26,728
|
|
516
|
|
27,244
|
|
—
|
|
2016
|
n/a
|
|||||||||||
|
TEXAS
|
|||||||||||||||||||||||||||||
|
North Stemmons land
|
—
|
|
537
|
|
—
|
|
276
|
|
537
|
|
276
|
|
813
|
|
—
|
|
2001
|
n/a
|
|||||||||||
|
CreekView 121 1 & 2
|
—
|
|
3,275
|
|
—
|
|
8,580
|
|
3,275
|
|
8,580
|
|
11,855
|
|
—
|
|
2015
|
n/a
|
|||||||||||
|
CreekView 121 land
|
—
|
|
7,922
|
|
—
|
|
874
|
|
7,922
|
|
874
|
|
8,796
|
|
—
|
|
2015/16
|
n/a
|
|||||||||||
|
Parc North 1-4
|
—
|
|
4,615
|
|
26,358
|
|
1,147
|
|
4,615
|
|
27,505
|
|
32,120
|
|
147
|
|
2016
|
2016
|
|||||||||||
|
Parc North land
|
—
|
|
2,519
|
|
—
|
|
194
|
|
2,519
|
|
194
|
|
2,713
|
|
—
|
|
2016
|
n/a
|
|||||||||||
|
World Houston Int'l Business Ctr land
|
—
|
|
2,989
|
|
—
|
|
2,119
|
|
3,724
|
|
1,384
|
|
5,108
|
|
—
|
|
2007
|
n/a
|
|||||||||||
|
World Houston Int'l Business Ctr land - 2011 expansion
|
—
|
|
1,636
|
|
—
|
|
4,309
|
|
2,921
|
|
3,024
|
|
5,945
|
|
—
|
|
2011
|
n/a
|
|||||||||||
|
World Houston Int'l Business Ctr land - 2015 expansion
|
—
|
|
6,040
|
|
—
|
|
1,132
|
|
6,041
|
|
1,131
|
|
7,172
|
|
—
|
|
2015
|
n/a
|
|||||||||||
|
Ten West Crossing land
|
—
|
|
1,126
|
|
—
|
|
798
|
|
1,135
|
|
789
|
|
1,924
|
|
—
|
|
2012
|
n/a
|
|||||||||||
|
West Road Business Park land
|
—
|
|
484
|
|
—
|
|
741
|
|
484
|
|
741
|
|
1,225
|
|
—
|
|
2012
|
n/a
|
|||||||||||
|
Americas Ten Business Center II & III land
|
—
|
|
1,365
|
|
—
|
|
1,079
|
|
1,365
|
|
1,079
|
|
2,444
|
|
—
|
|
2001
|
n/a
|
|||||||||||
|
Alamo Ridge Business Park III
|
—
|
|
907
|
|
—
|
|
9,652
|
|
907
|
|
9,652
|
|
10,559
|
|
—
|
|
2007
|
n/a
|
|||||||||||
|
Alamo Ridge Business Park IV
|
—
|
|
354
|
|
—
|
|
4,591
|
|
354
|
|
4,591
|
|
4,945
|
|
—
|
|
2007
|
n/a
|
|||||||||||
|
Eisenhauer Point Business Park 1 & 2
|
—
|
|
1,881
|
|
—
|
|
13,895
|
|
1,881
|
|
13,895
|
|
15,776
|
|
139
|
|
2015
|
2016
|
|||||||||||
|
Eisenhauer Point Business Park 3
|
—
|
|
577
|
|
—
|
|
2,171
|
|
577
|
|
2,171
|
|
2,748
|
|
—
|
|
2015
|
n/a
|
|||||||||||
|
Eisenhauer Point Business Park 4
|
—
|
|
555
|
|
—
|
|
2,098
|
|
555
|
|
2,098
|
|
2,653
|
|
—
|
|
2015
|
n/a
|
|||||||||||
|
Eisenhauer Point Business Park land
|
—
|
|
1,387
|
|
—
|
|
648
|
|
1,387
|
|
648
|
|
2,035
|
|
—
|
|
2015
|
n/a
|
|||||||||||
|
Eisenhauer Point Business Park land phase 2
|
—
|
|
3,225
|
|
—
|
|
679
|
|
3,225
|
|
679
|
|
3,904
|
|
—
|
|
2016
|
n/a
|
|||||||||||
|
ARIZONA
|
|||||||||||||||||||||||||||||
84
|
SCHEDULE III
|
|||||||||||||||||||||||||||||
|
REAL ESTATE PROPERTIES AND ACCUMULATED DEPRECIATION
|
|||||||||||||||||||||||||||||
|
DECEMBER 31, 2016
(In thousands, except footnotes)
|
|||||||||||||||||||||||||||||
|
Description
|
Encumbrances
|
Initial Cost to the Company
|
Costs
Capitalized Subsequent to Acquisition
|
Gross Amount Carried at Close of Period
|
Accumulated Depreciation
|
Year Acquired
|
Year Constructed
|
||||||||||||||||||||||
|
Land
|
Buildings and Improvements
|
Land
|
Buildings and Improvements
|
Total
|
|||||||||||||||||||||||||
|
Kyrene 202 Business Park land
|
—
|
|
1,244
|
|
—
|
|
1,005
|
|
1,244
|
|
1,005
|
|
2,249
|
|
—
|
|
2011
|
n/a
|
|||||||||||
|
35th Avenue Distribution Center - redevelopment
|
—
|
|
—
|
|
—
|
|
1,664
|
|
—
|
|
1,664
|
|
1,664
|
|
—
|
|
1997
|
2016
|
|||||||||||
|
Ten Sky Harbor Business Center
|
—
|
|
1,568
|
|
—
|
|
3,697
|
|
1,569
|
|
3,696
|
|
5,265
|
|
—
|
|
2015
|
2016
|
|||||||||||
|
Falcon Field Business Center land
|
—
|
|
1,311
|
|
—
|
|
333
|
|
1,311
|
|
333
|
|
1,644
|
|
—
|
|
2015
|
n/a
|
|||||||||||
|
Airport Distribution Center II land
|
—
|
|
300
|
|
—
|
|
117
|
|
300
|
|
117
|
|
417
|
|
—
|
|
2000
|
n/a
|
|||||||||||
|
Country Club V
|
—
|
|
2,885
|
|
—
|
|
410
|
|
2,885
|
|
410
|
|
3,295
|
|
—
|
|
2016
|
n/a
|
|||||||||||
|
NEVADA
|
|||||||||||||||||||||||||||||
|
Jones Corporate Park
|
—
|
|
13,068
|
|
26,325
|
|
147
|
|
13,069
|
|
26,471
|
|
39,540
|
|
55
|
|
2016
|
2016
|
|||||||||||
|
NORTH CAROLINA
|
|||||||||||||||||||||||||||||
|
Steele Creek Commerce Center VI
|
—
|
|
867
|
|
—
|
|
6,139
|
|
870
|
|
6,136
|
|
7,006
|
|
—
|
|
2013/14
|
2016
|
|||||||||||
|
Steele Creek Commerce Center land
|
—
|
|
5,731
|
|
—
|
|
1,947
|
|
5,735
|
|
1,943
|
|
7,678
|
|
—
|
|
2013-2016
|
n/a
|
|||||||||||
|
Airport Commerce Center III land
|
—
|
|
855
|
|
—
|
|
770
|
|
855
|
|
770
|
|
1,625
|
|
—
|
|
2008
|
n/a
|
|||||||||||
|
MISSISSIPPI
|
|||||||||||||||||||||||||||||
|
Metro Airport Commerce Center II land
|
—
|
|
307
|
|
—
|
|
399
|
|
307
|
|
399
|
|
706
|
|
—
|
|
2001
|
n/a
|
|||||||||||
|
|
—
|
|
121,875
|
|
62,634
|
|
109,399
|
|
124,347
|
|
169,561
|
|
293,908
|
|
363
|
|
|
|
|||||||||||
|
Total real estate owned (a)(b)
|
$
|
258,594
|
|
428,248
|
|
1,012,033
|
|
966,700
|
|
433,278
|
|
1,973,703
|
|
2,406,981
|
|
694,250
|
|
|
|
||||||||||
|
See accompanying Report of Independent Registered Public Accounting Firm on Financial Statement Schedules
.
|
|
|
|
|
|||||||||||||||||||||||||
85
(a) Changes in
Real Estate Properties
follow:
|
Years Ended December 31,
|
|||||||||
|
2016
|
2015
|
2014
|
|||||||
|
(In thousands)
|
|||||||||
|
Balance at beginning of year
|
$
|
2,219,448
|
|
2,074,946
|
|
1,927,326
|
|
||
|
Purchases of real estate properties
|
22,228
|
|
28,648
|
|
47,477
|
|
|||
|
Development of real estate properties
|
203,765
|
|
95,032
|
|
97,696
|
|
|||
|
Improvements to real estate properties
|
23,157
|
|
25,778
|
|
19,862
|
|
|||
|
Carrying amount of investments sold
|
(61,121
|
)
|
(4,750
|
)
|
(17,049
|
)
|
|||
|
Write-off of improvements
|
(496
|
)
|
(206
|
)
|
(366
|
)
|
|||
|
Balance at end of year
(1)
|
$
|
2,406,981
|
|
2,219,448
|
|
2,074,946
|
|
||
|
(1)
|
Includes
20%
noncontrolling interests in Castilian Research Center of
$0
and
$1,795,000
at December 31, 2016 and 2015, respectively, and in University Business Center of
$6,853,000
and
$6,670,000
at December 31, 2016 and 2015, respectively.
|
Changes in the accumulated depreciation on real estate properties follow:
|
Years Ended December 31,
|
|||||||||
|
2016
|
2015
|
2014
|
|||||||
|
(In thousands)
|
|||||||||
|
Balance at beginning of year
|
$
|
657,454
|
|
600,526
|
|
550,113
|
|
||
|
Depreciation expense
|
63,793
|
|
59,882
|
|
57,303
|
|
|||
|
Accumulated depreciation on assets sold
|
(26,501
|
)
|
(2,748
|
)
|
(6,525
|
)
|
|||
|
Other
|
(496
|
)
|
(206
|
)
|
(365
|
)
|
|||
|
Balance at end of year
|
$
|
694,250
|
|
657,454
|
|
600,526
|
|
||
|
(b)
|
The estimated aggregate cost of real estate properties at
December 31, 2016
for federal income tax purposes was approximately
$2,370,650,000
before estimated accumulated tax depreciation of
$467,599,000
. The federal income tax return for the year ended
December 31, 2016
, has not been filed and accordingly, this estimate is based on preliminary data.
|
|
(c)
|
The Company computes depreciation using the straight-line method over the estimated useful lives of the buildings (generally
40
years) and improvements (generally
3
to
15
years).
|
|
(d)
|
The Company transfers development projects to
Real estate properties
the earlier of
80%
occupancy or
one
year after completion of the shell construction.
|
|
(e)
|
EastGroup has a
$52,231,000
limited recourse first mortgage loan with an insurance company secured by Dominguez, Industry I & III, Kingsview, Shaw, Walnut and Washington. The loan has a recourse liability of
$5 million
which will be released based on the secured properties generating certain base rent amounts.
|
|
(f)
|
EastGroup has a
$47,496,000
non-recourse first mortgage loan with an insurance company secured by Arion 16, Broadway VI, Chino, East University I & II, Northpark, Santan 10 II, 55
th
Avenue and World Houston 1 & 2 and 21 & 23.
|
|
(g)
|
EastGroup has a
$52,752,000
non-recourse first mortgage loan with an insurance company secured by Colorado Crossing, Interstate I-III, Rojas, Steele Creek 1 & 2, Stemmons Circle, Venture and World Houston 3-9.
|
|
(h)
|
EastGroup has a
$44,493,000
non-recourse first mortgage loan with an insurance company secured by Arion 18, Beltway Crossing VI & VII, Commerce Park II & III, Concord, Interstate V-VII, Lakeview, Ridge Creek II, Southridge IV & V and World Houston 32.
|
|
(i)
|
EastGroup has a
$58,380,000
non-recourse first mortgage loan with an insurance company secured by 40
th
Avenue, Beltway Crossing V, Centennial Park, Executive Airport, Interchange Park I, Ocean View, Wetmore 5-8 and World Houston 26, 28, 29 & 30.
|
86
SCHEDULE IV
MORTGAGE LOANS ON REAL ESTATE
December 31, 2016
|
|
Number of Loans
|
Interest
Rate
|
Maturity Date
|
Periodic
Payment Terms
|
|||||
|
First mortgage loans:
|
|||||||||
|
JCB Limited - California
|
1
|
5.25
|
%
|
October 2017
|
Principal and interest due monthly
|
||||
|
JCB Limited - California
|
1
|
5.25
|
%
|
October 2017
|
Principal and interest due monthly
|
||||
|
Total mortgage loans (a)
|
2
|
|
|
|
|
||||
|
|
Face Amount
of Mortgages
Dec. 31, 2016
|
Carrying
Amount of
Mortgages
|
Principal
Amount of Loans
Subject to Delinquent
Principal or Interest (b)
|
||||||
|
(In thousands)
|
|||||||||
|
First mortgage loans:
|
|||||||||
|
JCB Limited - California
|
$
|
1,927
|
|
1,927
|
|
—
|
|
||
|
JCB Limited - California
|
2,825
|
|
2,825
|
|
—
|
|
|||
|
Total mortgage loans
|
$
|
4,752
|
|
4,752
|
(c)(d)
|
—
|
|
||
|
(a)
|
Reference is made to allowance for possible losses on mortgage loans receivable in the Notes to Consolidated Financial Statements.
|
|
(b)
|
Interest in arrears for three months or less is disregarded in computing principal amount of loans subject to delinquent interest.
|
|
(c)
|
Changes in mortgage loans follow:
|
|
|
Years Ended December 31,
|
||||||||
|
2016
|
2015
|
2014
|
|||||||
|
(In thousands)
|
|||||||||
|
Balance at beginning of year
|
$
|
4,875
|
|
4,991
|
|
8,870
|
|
||
|
Advances on mortgage loans receivable
|
—
|
|
—
|
|
—
|
|
|||
|
Payments on mortgage loans receivable
|
(123
|
)
|
(116
|
)
|
(3,902
|
)
|
|||
|
Amortization of discount on mortgage loan receivable
|
—
|
|
—
|
|
23
|
|
|||
|
Balance at end of year
|
$
|
4,752
|
|
4,875
|
|
4,991
|
|
||
(d) The aggregate cost for federal income tax purposes is approximately
$4.75 million
. The federal income tax return for the year ended
December 31, 2016
, has not been filed and, accordingly, the income tax basis of mortgage loans as of
December 31, 2016
, is based on preliminary data.
See accompanying Report of Independent Registered Public Accounting Firm on Financial Statement Schedules.
87
SIGNATURES
Pursuant to the requirements of Section 13 or 15(d) of the Securities Exchange Act of 1934, the Registrant has duly caused this report to be signed on its behalf by the undersigned, thereunto duly authorized.
|
|
EASTGROUP PROPERTIES, INC.
|
|
|
|
|
|
|
|
By: /s/ MARSHALL A. LOEB
|
|
|
|
Marshall A. Loeb, Chief Executive Officer, President & Director
|
|
|
|
February 15, 2017
|
|
Pursuant to the requirements of the Securities Exchange Act of 1934, this report has been signed below by the following persons on behalf of the Registrant and in the capacities and on the dates indicated.
|
*
|
*
|
|
|
D. Pike Aloian, Director
|
H. C. Bailey, Jr., Director
|
|
|
February 15, 2017
|
February 15, 2017
|
|
|
|
|
|
|
*
|
*
|
|
|
H. Eric Bolton, Jr., Director
|
Hayden C. Eaves III, Director
|
|
|
February 15, 2017
|
February 15, 2017
|
|
|
|
|
|
|
*
|
*
|
|
|
Fredric H. Gould, Director
|
Mary Elizabeth McCormick, Director
|
|
|
February 15, 2017
|
February 15, 2017
|
|
|
|
|
|
|
*
|
*
|
|
|
Leland R. Speed, Chairman Emeritus of the Board
|
David H. Hoster II, Chairman of the Board
|
|
|
February 15, 2017
|
February 15, 2017
|
|
|
/s/ N. KEITH MCKEY
|
||
|
* By N. Keith McKey, Attorney-in-fact
|
||
|
February 15, 2017
|
||
|
/s/ MARSHALL A. LOEB
|
|
|
Marshall A. Loeb, Chief Executive Officer,
|
|
|
President & Director
|
|
|
(Principal Executive Officer)
|
|
|
February 15, 2017
|
|
|
/s/ BRUCE CORKERN
|
|
|
Bruce Corkern, Sr. Vice-President, Controller and
|
|
|
Chief Accounting Officer
|
|
|
(Principal Accounting Officer)
|
|
|
February 15, 2017
|
|
|
|
|
|
/s/ N. KEITH MCKEY
|
|
|
N. Keith McKey, Executive Vice-President,
|
|
|
Chief Financial Officer, Treasurer and Secretary
|
|
|
(Principal Financial Officer)
|
|
|
February 15, 2017
|
|
88
EXHIBIT INDEX
|
(3)
|
Exhibits:
|
The following exhibits are filed with this Form 10-K or incorporated by reference to the listed document previously filed with the SEC:
|
Number
|
Description
|
|
(3)
|
Articles of Incorporation and Bylaws
|
|
(a)
|
Articles of Incorporation (incorporated by reference to Appendix B to the Company's Proxy Statement for its Annual Meeting of Stockholders held on June 5, 1997).
|
|
(b)
|
EastGroup Properties, Inc. Bylaws, Amended through December 5, 2014 (incorporated by reference to Exhibit 3.1 to the Company's Form 8-K filed December 10, 2014).
|
|
|
|
|
(10)
|
Material Contracts (*Indicates management or compensatory agreement):
|
|
(a)
|
Form of Severance and Change in Control Agreement that the Company has entered into with Marshall A. Loeb and N. Keith McKey (incorporated by reference to Exhibit 10(a) to the Company's Form 8-K filed May 18, 2016).*
|
|
(b)
|
Form of Severance and Change in Control Agreement that the Company has entered into with John F. Coleman, William D. Petsas, Brent W. Wood and C. Bruce Corkern (incorporated by reference to Exhibit 10(b) to the Company's Form 8-K filed May 18, 2016).*
|
|
(c)
|
Third Amended and Restated Credit Agreement Dated January 2, 2013 among EastGroup Properties, L.P.; EastGroup Properties, Inc.; PNC Bank, National Association, as Administrative Agent; Regions Bank and SunTrust Bank as Co-Syndication Agents; U.S. Bank National Association and Wells Fargo Bank, National Association as Co-Documentation Agents; PNC Capital Markets LLC, as Sole Lead Arranger and Sole Bookrunner; and the Lenders thereunder (incorporated by reference to Exhibit 10.1 to the Company's Form 8-K filed January 8, 2013).
|
|
(d)
|
First Amendment to Third Amended and Restated Credit Agreement, dated as of August 9, 2013, among EastGroup Properties, L.P., EastGroup Properties, Inc. and PNC Bank, National Association, as administrative agent, and each of the financial institutions party thereto as lenders (incorporated by reference to Exhibit 10.2 to the Company's Form 8-K filed August 30, 2013).
|
|
(e)
|
Second Amendment to Third Amended and Restated Credit Agreement dated as of July 30, 2015 by and among EastGroup Properties, L.P.; EastGroup Properties, Inc.; PNC Bank, National Association, as Administrative Agent; and each of the financial institutions party thereto as lenders (incorporated by reference to Exhibit 10.1 to the Company's Form 8-K filed August 4, 2015).
|
|
(f)
|
EastGroup Properties, Inc. 2013 Equity Incentive Plan (incorporated by reference to Appendix A to the proxy material for the 2013 Annual Meeting of Stockholders).*
|
|
(g)
|
EastGroup Properties, Inc. Director Compensation Program (incorporated by reference to Exhibit 10.1 to the Company's Form 8-K filed June 2, 2015).*
|
|
(h)
|
Note Purchase Agreement, dated as of August 28, 2013, among EastGroup Properties, L.P., EastGroup Properties, Inc. and the purchasers of the notes party thereto (including the form of the 3.80% Senior Notes due August 28, 2025) (incorporated by reference to Exhibit 10.1 to the Company's Form 8-K filed August 30, 2013).
|
|
(i)
|
Sales Agency Financing Agreement dated February 19, 2014 between EastGroup Properties, Inc. and BNY Mellon Capital Markets, LLC (incorporated by reference to Exhibit 1.1 to the Company's Form 8-K filed February 25, 2014).
|
|
(j)
|
Sales Agency Financing Agreement dated February 19, 2014 between EastGroup Properties, Inc. and Merrill Lynch, Pierce, Fenner & Smith Incorporated (incorporated by reference to Exhibit 1.2 to the Company's Form 8-K filed February 25, 2014).
|
|
(k)
|
Sales Agency Financing Agreement dated February 19, 2014 between EastGroup Properties, Inc. and Raymond James & Associates, Inc. (incorporated by reference to Exhibit 1.3 to the Company's Form 8-K filed February 25, 2014).
|
|
(12)
|
Statement of computation of ratio of earnings to combined fixed charges and preferred stock distributions (filed herewith)
|
|
|
|
|
(21)
|
Subsidiaries of EastGroup Properties, Inc. (filed herewith).
|
89
|
|
|
|
(23)
|
Consent of KPMG LLP (filed herewith).
|
|
|
|
|
(24)
|
Powers of attorney (filed herewith).
|
|
|
|
|
(31)
|
Rule 13a-14(a)/15d-14(a) Certifications (pursuant to Section 302 of the Sarbanes-Oxley Act of 2002)
|
|
(a)
|
Marshall A. Loeb, Chief Executive Officer
|
|
(b)
|
N. Keith McKey, Chief Financial Officer
|
|
|
|
|
(32)
|
Section 1350 Certifications (pursuant to Section 906 of the Sarbanes-Oxley Act of 2002)
|
|
(a)
|
Marshall A. Loeb, Chief Executive Officer
|
|
(b)
|
N. Keith McKey, Chief Financial Officer
|
|
|
|
|
(101)
|
The following materials from EastGroup Properties, Inc.’s Annual Report on Form 10-K for the year ended December 31, 2016, formatted in XBRL (eXtensible Business Reporting Language): (i) consolidated balance sheets, (ii) consolidated statements of income and comprehensive income, (iii) consolidated statements of changes in equity, (iv) consolidated statements of cash flows, and (v) the notes to the consolidated financial statements.
|
90
TABLE OF CONTENTS
Part IItem 1. BusinessItem 1A. Risk FactorsItem 1B. Unresolved Staff CommentsItem 2. PropertiesItem 3. Legal ProceedingsItem 4. Mine Safety DisclosuresPart II. Other InformationItem 5. Market For Registrant's Common Equity, Related Stockholder Matters and Issuer Purchases Of Equity SecuritiesItem 6. Selected Financial DataItem 7. Management's Discussion and Analysis Of Financial Condition and Results Of OperationsItem 7A. Quantitative and Qualitative Disclosures About Market RiskItem 8. Financial Statements and Supplementary DataItem 9. Changes in and Disagreements with Accountants on Accounting and Financial DisclosureItem 9A. Controls and ProceduresItem 9B. Other InformationPart IIIItem 10. Directors, Executive Officers and Corporate GovernanceItem 11. Executive CompensationItem 12. Security Ownership Of Certain Beneficial Owners and Management and Related Stockholder MattersItem 13. Certain Relationships and Related Transactions, and Director IndependenceItem 14. Principal Accounting Fees and ServicesPart IVItem 15. Exhibits and Financial Statement Schedules