ENCOMPASS HEALTH CORP
10-Ks and 10-Qs
|
|
|
|
|
|
|
|
|
|
|
|
|
|
|
|
|
|
|
|
|
|
|
|
|
|
|
|
|
|
|
|
|
|
|
|
|
|
|
|
|
|
|
|
|
|
|
|
|
|
|
|
|
|
|
|
|
|
|
UNITED STATES
SECURITIES AND EXCHANGE COMMISSION
WASHINGTON, DC 20549
_________________________________________
FORM 10-K
ANNUAL REPORT PURSUANT TO SECTION 13 OR 15(d)
OF THE SECURITIES EXCHANGE ACT OF 1934
For the fiscal year ended
December 31, 2013
Commission File Number 001-10315
________________________________________________________
HealthSouth Corporation
(Exact Name of Registrant as Specified in its Charter)
|
Delaware
|
63-0860407
|
|
(State or Other Jurisdiction of
Incorporation or Organization)
|
(I.R.S. Employer
Identification No.)
|
|
|
|
|
3660 Grandview Parkway, Suite 200
Birmingham, Alabama
|
35243
|
|
(Address of Principal Executive Offices)
|
(Zip Code)
|
(205) 967-7116
(Registrant’s telephone number)
_____________________________________________________
Securities Registered Pursuant to Section 12(b) of the Act:
|
Title of each class
|
Name of each exchange
on which registered
|
|
Common Stock, $0.01 par value
|
New York Stock Exchange
|
Securities Registered Pursuant to Section 12(g) of the Act:
None
_________________________________________________________
Indicate by check mark if the registrant is a well-known seasoned issuer as defined in Rule 405 of the Securities Act.
Yes
x
No
o
Indicate by check mark if the registrant is not required to file reports pursuant to Section 13 or Section 15(d) of the Act.
Yes
o
No
x
Indicate by check mark whether the registrant (1) has filed all reports required to be filed by Section 13 or 15(d) of the Securities Exchange Act of 1934 during the preceding 12 months (or for such shorter period that the registrant was required to file such reports), and (2) has been subject to such filing requirements for the past 90 days. Yes
x
No
o
Indicate by check mark whether the registrant has submitted electronically and posted on its corporate Web site, if any, every Interactive Data File required to be submitted and posted pursuant to Rule 405 of Regulation S-T during the preceding 12 months (or for such shorter period that the registrant was required to submit and post such files). Yes
x
No
o
Indicate by check mark if disclosure of delinquent filers pursuant to Item 405 of Regulation S-K is not contained herein, and will not be contained, to the best of registrant’s knowledge, in definitive proxy or information statements incorporated by reference in Part III of this Form 10-K or any amendment to this Form 10-K.
x
Indicate by check mark whether the registrant is a large accelerated filer, an accelerated filer, a non-accelerated filer, or a smaller reporting company. See the definitions of “large accelerated filer,” “accelerated filer,” and “smaller reporting company” in Rule 12b-2 of the Exchange Act.
Large accelerated filer
x
Accelerated filer
o
Non-Accelerated filer
o
Smaller reporting company
o
Indicate by check mark whether the registrant is a shell company (as defined in Exchange Act Rule 12b-2).
Yes
o
No
x
The aggregate market value of common stock held by non-affiliates of the registrant as of the last business day of the registrant’s most recently completed second fiscal quarter was approximately
$2.5 billion
. For purposes of the foregoing calculation only, executive officers and directors of the registrant have been deemed to be affiliates. There wer
e
88,000,335
shares of common stock of the registrant outstanding, net of treasury shares, as of
February 13, 2014
.
DOCUMENTS INCORPORATED BY REFERENCE
The definitive proxy statement relating to the registrant’s
2014
annual meeting of stockholders is incorporated by reference in Part III to the extent described therein.
TABLE OF CONTENTS
|
|
|
Page
|
|
|
|
|
|
|
||
|
|
|
|
|
|
|
|
|
|
|
|
|
|
|
|
|
|
|
|
|
|
|
|
|
|
|
|
|
|
|
|
|
|
|
|
NOTE TO READERS
As used in this report, the terms “HealthSouth,” “we,” “us,” “our,” and the “Company” refer to HealthSouth Corporation and its consolidated subsidiaries, unless otherwise stated or indicated by context. This drafting style is suggested by the Securities and Exchange Commission and is not meant to imply that HealthSouth Corporation, the publicly traded parent company, owns or operates any specific asset, business, or property. The hospitals, operations, and businesses described in this filing are primarily owned and operated by subsidiaries of the parent company. In addition, we use the term “HealthSouth Corporation” to refer to HealthSouth Corporation alone wherever a distinction between HealthSouth Corporation and its subsidiaries is required or aids in the understanding of this filing.
i
CAUTIONARY STATEMENT REGARDING FORWARD-LOOKING STATEMENTS
This annual report contains historical information, as well as forward-looking statements that involve known and unknown risks and relate to, among other things, future events, changes to Medicare reimbursement and other healthcare laws and regulations from time to time, our business strategy, our dividend and stock repurchase strategies, our financial plans, our growth plans, our future financial performance, our projected business results, or our projected capital expenditures. In some cases, you can identify forward-looking statements by terminology such as “may,” “will,” “should,” “expects,” “plans,” “anticipates,” “believes,” “estimates,” “predicts,” “targets,” “potential,” or “continue” or the negative of these terms or other comparable terminology. Such forward-looking statements are necessarily estimates based upon current information and involve a number of risks and uncertainties, many of which are beyond our control. Any forward-looking statement is based on information current as of the date of this report and speaks only as of the date on which such statement is made. Actual events or results may differ materially from the results anticipated in these forward-looking statements as a result of a variety of factors. While it is impossible to identify all such factors, factors that could cause actual results to differ materially from those estimated by us include, but are not limited to, the following:
|
•
|
each of the factors discussed in Item 1A,
Risk Factors
; as well as uncertainties and factors discussed elsewhere in this Form 10-K, in our other filings from time to time with the SEC, or in materials incorporated therein by reference;
|
|
•
|
changes in the rules and regulations of the healthcare industry at either or both of the federal and state levels, including those contemplated now and in the future as part of national healthcare reform and deficit reduction such as the reinstatement of the “75% Rule” or the introduction of site neutral payments with skilled nursing facilities for certain conditions, and related increases in the costs of complying with such changes;
|
|
•
|
reductions or delays in, or suspension of, reimbursement for our services by governmental or private payors, including our ability to obtain and retain favorable arrangements with third-party payors;
|
|
•
|
increased costs of regulatory compliance and compliance monitoring in the healthcare industry, including the costs of investigating and defending asserted claims, whether meritorious or not;
|
|
•
|
our ability to attract and retain nurses, therapists, and other healthcare professionals in a highly competitive environment with often severe staffing shortages and the impact on our labor expenses from potential union activity and staffing recruitment and retention;
|
|
•
|
competitive pressures in the healthcare industry and our response to those pressures;
|
|
•
|
our ability to successfully complete and integrate de novo developments, acquisitions, investments, and joint ventures consistent with our growth strategy, including realization of anticipated revenues, cost savings, and productivity improvements arising from the related operations;
|
|
•
|
any adverse outcome of various lawsuits, claims, and legal or regulatory proceedings, including the ongoing investigations initiated by the U.S. Department of Health and Human Services, Office of the Inspector General;
|
|
•
|
increased costs of defending and insuring against alleged professional liability and other claims and the ability to predict the costs related to such claims;
|
|
•
|
potential incidents affecting the proper operation, availability, or security of our information systems;
|
|
•
|
the price of our common or preferred stock as it affects our willingness and ability to repurchase shares and the financial and accounting effects of any repurchases;
|
|
•
|
our ability and willingness to continue to declare and pay dividends on our common stock;
|
|
•
|
our ability to attract and retain key management personnel; and
|
|
•
|
general conditions in the economy and capital markets, including any instability or uncertainty related to governmental impasse over approval of the United States federal budget or an increase to the debt ceiling.
|
The cautionary statements referred to in this section also should be considered in connection with any subsequent written or oral forward-looking statements that may be issued by us or persons acting on our behalf. We undertake no duty to update these forward-looking statements, even though our situation may change in the future. Furthermore, we cannot guarantee future results, events, levels of activity, performance, or achievements.
ii
|
Item 1.
|
Business
|
Overview of the Company
General
HealthSouth is the nation’s largest owner and operator of inpatient rehabilitation hospitals in terms of patients treated and discharged, revenues, and number of hospitals. While our national network of inpatient hospitals stretches across
28
states and Puerto Rico, our inpatient hospitals are concentrated in the eastern half of the United States and Texas. The table below provides detail on our hospitals and selected operating data. Additional detail can be found in the table in Item 2,
Properties,
and Item 7,
Management’s Discussion and Analysis of Financial Condition and Results of Operations
, “Results of Operations.”
|
For the Year Ended December 31,
|
||||||||||||
|
2013
|
2012
|
2011
|
||||||||||
|
(Actual Amounts)
|
||||||||||||
|
Consolidated data:
|
||||||||||||
|
Number of inpatient rehabilitation hospitals
(1)
|
103
|
|
100
|
|
99
|
|
||||||
|
Number of outpatient rehabilitation satellite clinics
|
20
|
|
24
|
|
26
|
|
||||||
|
Number of hospital-based home health agencies
|
25
|
|
25
|
|
25
|
|
||||||
|
Number of inpatient rehabilitation units managed by us through management contracts
|
3
|
|
3
|
|
3
|
|
||||||
|
Discharges
|
129,988
|
|
123,854
|
|
118,354
|
|
||||||
|
Outpatient visits
|
806,631
|
|
880,182
|
|
943,439
|
|
||||||
|
Number of licensed beds
(2)
|
6,825
|
|
6,656
|
|
6,461
|
|
||||||
|
(In Millions)
|
||||||||||||
|
Net operating revenues:
|
||||||||||||
|
Net patient revenue - inpatient
|
$
|
2,130.8
|
|
$
|
2,012.6
|
|
$
|
1,866.4
|
|
|||
|
Net patient revenue - outpatient and other
|
142.4
|
|
149.3
|
|
160.5
|
|
||||||
|
Net operating revenues
|
$
|
2,273.2
|
|
$
|
2,161.9
|
|
$
|
2,026.9
|
|
|||
|
(1)
|
Including
2
,
2
, and
3
hospitals as of December 31,
2013
,
2012
, and
2011
, respectively, that operate as joint ventures which we account for using the equity method of accounting.
|
|
(2)
|
Excluding
151
,
151
, and
234
licensed beds as of December 31,
2013
,
2012
, and
2011
, respectively, of hospitals that operate as joint ventures which we account for using the equity method of accounting.
|
Our inpatient rehabilitation hospitals offer specialized rehabilitative care across a wide array of diagnoses and deliver comprehensive, high-quality, cost-effective patient care services. Substantially all (93%) of the patients we serve are admitted from acute care hospitals following physician referrals for specific acute inpatient rehabilitative care. The majority of those patients have experienced significant physical and cognitive disabilities or injuries due to medical conditions, such as strokes, hip fractures, and a variety of debilitating neurological conditions, that are generally nondiscretionary in nature and require rehabilitative healthcare services in an inpatient setting. Our teams of highly skilled nurses and physical, occupational, and speech therapists utilize proven technology and clinical protocols with the objective of returning patients to home and work. Patient care is provided by nursing and therapy staff as directed by physician orders while case managers monitor each patient’s progress and provide documentation and oversight of patient status, achievement of goals, discharge planning, and functional outcomes. Our hospitals provide a comprehensive interdisciplinary clinical approach to treatment that leads to a higher level of care and superior outcomes.
HealthSouth Corporation was organized as a Delaware corporation in February
1984
. Our principal executive offices are located at 3660 Grandview Parkway, Birmingham, Alabama 35243, and the telephone number of our principal executive offices is (205) 967-7116.
1
In addition to the discussion here, we encourage you to read Item 1A,
Risk Factors
, Item 2,
Properties,
and Item 7,
Management’s Discussion and Analysis of Financial Condition and Results of Operations
, which highlight additional considerations about HealthSouth.
Competitive Strengths
As the nation’s largest owner and operator of inpatient rehabilitation hospitals and with our business focused primarily on those services, we believe we differentiate ourselves from our competitors based on our broad platform of clinical expertise, the quality of our clinical outcomes, the sustainability of best practices, our financial strength, and the application of rehabilitative technology. Our strengths can also be described in the following ways:
|
•
|
People
. We believe our
23,600
employees, in particular our highly skilled clinical staff, share a steadfast commitment to providing outstanding rehabilitative care to our patients. We also undertake significant efforts to ensure our clinical and support staff receives the education and training necessary to provide the highest quality rehabilitative care in the most cost-effective manner.
|
|
•
|
Quality
. Our hospitals provide a broad base of clinical experience from which we have developed best practices and protocols. We believe these clinical best practices and protocols help ensure the delivery of consistently high-quality rehabilitative healthcare services across all of our hospitals. We have developed a program called “TeamWorks,” which is a series of operations-focused initiatives using identified best practices to reduce inefficiencies and improve performance across a wide spectrum of operational areas. We believe these initiatives have enhanced, and will continue to enhance, patient-employee interactions and coordination of care and communication among the patient, the patient’s family, the hospital’s treatment team, and payors, which, in turn, improves outcomes and patient satisfaction.
|
Additionally, our hospitals participate in The Joint Commission's Disease-Specific Care Certification Program. Under this program, Joint Commission accredited organizations, like our hospitals, may seek certification for chronic diseases or conditions such as brain injury or stroke rehabilitation by complying with Joint Commission standards, effectively using evidence-based, clinical practice guidelines to manage and optimize patient care, and using an organized approach to performance measurement and evaluation of clinical outcomes. Obtaining such certifications demonstrates our commitment to excellence in providing disease-specific care. Currently, 96 of our hospitals hold one or more disease-specific certifications. We also account for approximately 80% of all Joint Commission disease-specific certifications in stroke nationwide.
|
•
|
Efficiency and Cost Effectiveness
. Our size helps us provide inpatient rehabilitative healthcare services on a cost-effective basis. Specifically, because of our large number of inpatient hospitals, we can utilize proven staffing models and take advantage of certain supply chain efficiencies. In addition, our proprietary management reporting system aggregates data from each of our key business systems into a comprehensive reporting package used by the management teams in our hospitals as well as executive management. This system allows users to analyze data and trends and create custom reports on a timely basis.
|
|
•
|
Strong Cash Flow Generation and Balance Sheet
. We have a proven track record, even in the challenging regulatory and economic environment of the last several years, of generating strong cash flows from operations that have allowed us to successfully reduce our financial leverage, implement our growth strategy, and make significant shareholder value-enhancing distributions. As of December 31, 2013, we have a flexible balance sheet with relatively low financial leverage, no significant debt maturities prior to 2018, and ample availability under our revolving credit facility, which along with the cash flows generated from operations should, we believe, provide excellent support for our business strategy.
|
|
•
|
Technology
. As a market leader in inpatient rehabilitation, we have devoted substantial effort and expertise to leveraging technology to improve patient care and operating efficiencies. Specific rehabilitative technology, such as our internally-developed therapeutic device called the “AutoAmbulator,” utilized in our facilities allows us to effectively treat patients with a wide variety of significant physical disabilities or injuries. Our commitment to technology also includes information technology, such as our rehabilitation-specific electronic clinical information system (“CIS”) and our internally-developed management reporting system described above. To date, we have installed the CIS in
36
hospitals with another
20
installations scheduled for
2014
. We expect to complete installation in our existing hospitals by the end of
2017
. We believe the CIS will improve patient care and safety and enhance operational efficiency. Given the increased emphasis on coordination across the patient care spectrum, we also believe the CIS sets the stage for connectivity with referral sources and health information exchanges. Ultimately, we believe the CIS can be a key competitive differentiator and impact patient choice.
|
2
Patients and Demographic Trends
Demographic trends, such as population aging, will increase long-term demand for inpatient rehabilitative services. While we treat patients of all ages, most of our patients are persons 65 and older (the average age of a HealthSouth patient is 72 years). We believe the demand for inpatient rehabilitative healthcare services will continue to increase as the U.S. population ages and life expectancies increase. The number of Medicare-eligible patients is expected to grow approximately
3%
per year for the foreseeable future, creating an attractive market. We believe these factors align with our strengths in, and focus on, inpatient rehabilitative care. Unlike many of our competitors that may offer inpatient rehabilitation as one of many secondary services, inpatient rehabilitation is our core business. In addition, we believe we can address the demand for inpatient rehabilitative services in markets where we currently do not have a presence by constructing or acquiring new hospitals.
Strategy
Our 2013 strategy focused on the following priorities:
|
•
|
continuing to provide high-quality, cost-effective care to patients in our existing markets;
|
|
•
|
achieving organic growth at our existing hospitals;
|
|
•
|
continuing to expand our services to more patients who require inpatient rehabilitative services by constructing and opportunistically acquiring new hospitals in new markets; and
|
|
•
|
considering additional shareholder value-enhancing strategies such as repurchases of our common and preferred stock and common stock dividends, recognizing that some of these actions may increase our leverage ratio.
|
Total discharges grew
5.0%
from
2012
to
2013
. Our same-store discharges grew
2.5%
during
2013
compared to
2012
. This growth includes the increase of
68
licensed beds in our existing hospitals in
2013
. Our quality and outcome measures, as reported through the Uniform Data System for Medical Rehabilitation (the “UDS”), remained well above the average for hospitals included in the UDS database, and they did so while we continued to increase our market share throughout
2013
. As discussed in Item 7,
Management’s Discussion and Analysis of Financial Condition and Results of Operations
, “Results of Operations,” not only did our hospitals treat more patients and enhance outcomes, they did so in a highly cost-effective manner. We also achieved incremental efficiencies evidenced by the decrease in
Total
operating expenses
as a percentage of
Net operating revenues
.
Likewise, our growth efforts continued to yield positive results in 2013. Specifically, we:
|
•
|
acquired Walton Rehabilitation Hospital, a 58-bed inpatient rehabilitation hospital in Augusta, Georgia, in April 2013;
|
|
•
|
began accepting patients at our newly built, 40-bed inpatient rehabilitation hospital in Littleton, Colorado, in May 2013;
|
|
•
|
began accepting patients at our newly built, 34-bed inpatient rehabilitation hospital in Stuart, Florida in June 2013. This hospital is a joint venture with Martin Health System;
|
|
•
|
completed the relocation of patients to our new 53-bed HealthSouth Rehabilitation Hospital of Western Massachusetts in Ludlow, Massachusetts in December 2013, which replaced a leased facility; and
|
3
|
•
|
continued development of the following de novo hospitals:
|
|
Location
|
# of Beds
|
Actual / Expected Construction Start Date
|
Expected Operational Date
|
|
Altamonte Springs, Florida
|
50
|
Q4 2013
|
Q4 2014
|
|
Newnan, Georgia
|
50
|
Q4 2013
|
Q4 2014
|
|
Middletown, Delaware
|
34
|
Q4 2013
|
Q4 2014
|
|
Modesto, California
|
50
|
Second Half - 2014
|
Q4 2015
|
|
Franklin, Tennessee
*
|
40
|
TBD
|
TBD
|
*
A certificate of need has been awarded, but it is currently under appeal.
In 2013, we followed through on our announced intention to implement additional shareholder value-enhancing strategies. Namely, we:
|
•
|
completed a tender offer for our common stock in March 2013 in which we repurchased approximately 9.1 million shares at a price of $25.50 per share;
|
|
•
|
initiated a quarterly cash dividend on our common stock of $0.18 per share. The first quarterly dividend was paid in October 2013; and
|
|
•
|
received authorization from our board of directors in October 2013 for the repurchase of up to an additional $200 million of our common stock.
|
For additional discussion of these actions, see Item 7,
Management’s Discussion and Analysis of Financial Condition and Results of Operations
, “Liquidity and Capital Resources.”
While implementing those shareholder value-enhancing strategies, we took additional steps to increase the strength and flexibility of our balance sheet. We:
|
•
|
entered into closing agreements with the IRS in April 2013 which settled various matters for tax years through December 31, 2008 and resulted in an increase to our deferred tax assets, including an approximate $283 million increase to our federal net operating loss carryforward on a gross basis, and a net income tax benefit of approximately $115 million;
|
|
•
|
amended our credit agreement in June 2013 to, among other things, permit unlimited restricted payments so long as the senior secured leverage ratio remains less than or equal to 1.5x and extend the revolver maturity from August 2017 to June 2018;
|
|
•
|
purchased the real estate previously subject to leases associated with four of our hospitals in the third quarter of 2013;
|
|
•
|
redeemed $30.2 million and $27.9 million of the outstanding principal amount of our existing 7.25% Senior Notes due 2018 and our existing 7.75% Senior Notes due 2022, respectively, in November 2013; and
|
|
•
|
exchanged $320 million in aggregate principal amount of newly issued 2.00% Convertible Senior Subordinated Notes due 2043 for 257,110 shares of our outstanding 6.50% Series A Convertible Perpetual Preferred Stock in November 2013.
|
For further discussion of these transactions, see Item 7,
Management’s Discussion and Analysis of Financial Condition and Results of Operations
, and
Note 8,
Long-term Debt
, and
Note 16,
Income Taxes
, to the accompanying consolidated financial statements.
We have been disciplined in creating a capital structure that is flexible with no significant debt maturities prior to 2018. Over the past few years, we have redeemed our most expensive debt and reduced our interest expense. We have invested in our core business and created an infrastructure that enables us to provide high-quality care on a cost-effective basis. Our balance sheet remains strong. Our leverage ratio is within our target range, we have ample availability under our revolving credit facility, and we continue to generate strong cash flows from operations. Importantly, we have flexibility with how we
4
choose to invest our cash and return value to shareholders, including bed additions, construction of de novo hospitals, acquisitions of other inpatient rehabilitation hospitals, purchases of leased properties, repurchases of our common and preferred stock, common stock dividends, and repayments of long-term debt. Specifically, on February 14, 2014, our board of directors approved an increase in our existing common stock repurchase authorization from $200 million to $250 million.
In conclusion, we believe our proven track record of producing superior clinical results for a lower average Medicare reimbursement payment than other inpatient rehabilitation providers will allow us to adjust to future Medicare reimbursement initiatives. We also believe the regulatory and reimbursement risks discussed below which we have historically faced and will likely continue to face may present us with opportunities to grow by acquiring or consolidating the operations of other inpatient rehabilitation providers in our highly fragmented industry. We have invested considerable resources into clinical and management systems and protocols that have allowed us to consistently gain market share and realize better outcomes than our competitors while allowing us to consistently contain cost growth. Additionally, we believe continued growth in our Adjusted EBITDA and our strong cash flows from operations as well as our flexible balance sheet will permit us to continue to invest in our core business and in growth opportunities. Our growth strategy in
2014
will again focus on organic growth and development activities.
For additional discussion of our strategy, business outlook, Adjusted EBITDA, and shareholder value-enhancing strategies, see Item 7,
Management’s Discussion and Analysis of Financial Condition and Results of Operations
, “Executive Overview” and “Liquidity and Capital Resources.”
Employees
As of
December 31, 2013
, we employed approximately
23,600
individuals, of whom approximately
13,900
were full-time employees. We are subject to various state and federal laws that regulate wages, hours, benefits, and other terms and conditions relating to employment. Except for approximately 56 employees at one hospital (about 14% of that hospital’s workforce), none of our employees are represented by a labor union as of
December 31, 2013
. Like most healthcare providers, our labor costs are rising faster than the general inflation rate. In some markets, the lack of availability of medical personnel is a significant operating issue facing healthcare providers. To address this challenge, we will continue to focus on maintaining the competitiveness of our compensation and benefit programs and improving our recruiting, retention, and productivity. The shortage of nurses and other medical personnel, including therapists, may, from time to time, require us to increase utilization of more expensive temporary personnel, which we refer to as “contract labor.”
Competition
The inpatient rehabilitation industry is highly fragmented, and we have no single, similar direct competitor. Our inpatient rehabilitation hospitals compete primarily with rehabilitation units, many of which are within acute care hospitals, in the markets we serve. For a list of our markets by state, see the table in Item 2,
Properties.
Smaller privately held companies compete with us primarily in select geographic markets in Texas and the West. In addition, there are public companies that own primarily long-term acute care hospitals but own or operate a small number of inpatient rehabilitation facilities as well, one of which also manages the operations of inpatient rehabilitation facilities as part of its business model. Other providers of post acute-care services may attempt to become competitors in the future. For example, over the past few years, the number of nursing homes marketing themselves as offering certain rehabilitation services has increased even though nursing homes are not required to offer the same level of care, or be licensed, as hospitals. Also, acute care hospitals, including those owned or operated by large public companies, may choose to expand their post-acute rehabilitation services in our markets. The primary competitive factors in any given market include the quality of care and service provided, the treatment outcomes achieved, and the relationship with the acute care hospitals in the market, including physician-owned providers. However, the previously enacted ban on new, or expansion of existing, physician-owned hospitals should limit to some degree that competitive factor going forward. See the “Regulation—Relationships with Physicians and Other Providers” section below for further discussion. Additionally, for a discussion regarding the effects of certificate of need requirements on competition in some states, see the “Regulation—Certificates of Need” section below.
We rely significantly on our ability to attract, develop, and retain nurses, therapists, and other clinical personnel for our hospitals. We compete for these professionals with other healthcare companies, hospitals, and potential clients and partners. In addition, physicians and others have opened inpatient rehabilitation hospitals in direct competition with us, particularly in states in which a certificate of need is not required to build a hospital, which has occasionally made it more difficult and expensive to hire the necessary personnel for our hospitals in those markets.
5
Regulatory and Reimbursement Challenges
Healthcare, including the inpatient rehabilitation sector, has always been a highly regulated industry. Currently, the industry is facing many well-publicized regulatory and reimbursement challenges. The industry is also facing uncertainty associated with the efforts, primarily arising from initiatives included in the Patient Protection and Affordable Care Act (as subsequently amended, the “2010 Healthcare Reform Laws”), to identify and implement workable coordinated care delivery models. Successful healthcare providers are those who provide high-quality, cost-effective care and have the ability to adjust to changes in the regulatory and operating environments. We believe we have the necessary capabilities - scale, infrastructure, balance sheet, and management - to adapt to and succeed in a highly regulated industry, and we have a proven track record of doing so. For more in-depth discussion of the primary challenges and risks related to our business, particularly the changes in Medicare reimbursement (including sequestration), increased federal compliance and enforcement burdens, and changes to our operating environment resulting from healthcare reform, see “Regulation” below in this section as well as Item 1A,
Risk Factors,
and Item 7,
Management’s Discussion and Analysis of Financial Condition and Results of Operations
, “Executive Overview—Key Challenges.”
Sources of Revenues
We receive payment for patient care services from the federal government (primarily under the Medicare program), managed care plans and private insurers, and, to a considerably lesser degree, state governments (under their respective Medicaid or similar programs) and directly from patients. Revenues and receivables from Medicare are significant to our operations. In addition, we receive relatively small payments for non-patient care activities from various sources. The following table identifies the sources and relative mix of our revenues for the periods stated:
|
|
For the Year Ended December 31,
|
|||||||
|
|
2013
|
2012
|
2011
|
|||||
|
Medicare
|
74.5
|
%
|
73.4
|
%
|
72.0
|
%
|
||
|
Medicaid
|
1.2
|
%
|
1.2
|
%
|
1.6
|
%
|
||
|
Workers' compensation
|
1.2
|
%
|
1.5
|
%
|
1.6
|
%
|
||
|
Managed care and other discount plans, including Medicare Advantage
|
18.5
|
%
|
19.3
|
%
|
19.8
|
%
|
||
|
Other third-party payors
|
1.8
|
%
|
1.8
|
%
|
2.0
|
%
|
||
|
Patients
|
1.1
|
%
|
1.3
|
%
|
1.2
|
%
|
||
|
Other income
|
1.7
|
%
|
1.5
|
%
|
1.8
|
%
|
||
|
Total
|
100.0
|
%
|
100.0
|
%
|
100.0
|
%
|
||
Our hospitals offer discounts from established charges to certain group purchasers of healthcare services that are included in “Managed care and other discount plans” in the table above, including private insurance companies, employers, health maintenance organizations (“HMOs”), preferred provider organizations (“PPOs”) and other managed care plans. Medicare, through its Medicare Advantage program, offers Medicare-eligible individuals an opportunity to participate in a managed care plan. Revenues from Medicare and Medicare Advantage represent approximately 80% of total revenues.
Patients are generally not responsible for the difference between established gross charges and amounts reimbursed for such services under Medicare, Medicaid, and other private insurance plans, HMOs, or PPOs but are responsible to the extent of any exclusions, deductibles, copayments, or coinsurance features of their coverage. Collection of amounts due from individuals is typically more difficult than from governmental or third-party payors. The amount of these exclusions, deductibles, copayments, and coinsurance has been increasing each year but is not material to our business or results of operations.
Medicare Reimbursement
Medicare is a federal program that provides certain hospital and medical insurance benefits to persons aged 65 and over, some disabled persons, and persons with end-stage renal disease. Medicare, through statutes and regulations, establishes reimbursement methodologies and rates for various types of healthcare facilities and services. Each year, the Medicare Payment Advisory Commission (“MedPAC”), an independent agency that advises Congress on issues affecting Medicare, makes payment policy recommendations to Congress for a variety of Medicare payment systems including the inpatient rehabilitation facility (“IRF”) prospective payment system (the “IRF-PPS”). Congress is not obligated to adopt MedPAC recommendations, and, based on outcomes in previous years, there can be no assurance Congress will adopt MedPAC’s recommendations in a given year. For example, in recent years, Congress has not adopted any of the recommendations on the annual market basket update to Medicare payment rates under the IRF-PPS, which updates are discussed in greater detail below.
6
These statutes and regulations are subject to change from time to time. For example, in March 2010, President Obama signed the 2010 Healthcare Reform Laws. With respect to Medicare reimbursement, the 2010 Healthcare Reform Laws provided for certain reductions to healthcare providers’ annual market basket updates. In August 2011, President Obama signed into law the Budget Control Act of 2011, as amended by the American Taxpayer Relief Act of 2012 and the Bipartisan Budget Act of 2013, that provided for an automatic 2% reduction, or “sequestration,” of Medicare program payments for all healthcare providers. Sequestration took effect April 1, 2013 and will continue through 2023 unless Congress and the President take further action. Additionally, concerns held by federal policymakers about the federal deficit and national debt levels could result in enactment of further federal spending reductions, further entitlement reform legislation affecting the Medicare program, or both, in 2014 and beyond.
From time to time, these reimbursement methodologies and rates can be further modified by the United States Centers for Medicare and Medicaid Services (“CMS”). In some instances, these modifications can have a substantial impact on existing healthcare providers. In accordance with Medicare laws and statutes, CMS makes annual adjustments to Medicare payment rates in many prospective payment systems, including the IRF-PPS, by what is commonly known as a “market basket update.” CMS may take other regulatory action affecting rates as well. For example, under the 2010 Healthcare Reform Laws, CMS currently requires IRFs to submit data on urinary catheter-related infections and pressure ulcers for the IRF Quality Reporting Program. Beginning October 1, 2014, we will be required to collect and report influenza vaccination data for our clinical staff. In future years, we will also be required to collect and report influenza vaccination data for our patients. A facility’s failure to submit the required quality data will result in a two percentage point reduction to that facility’s annual market basket increase factor for payments made for discharges in the subsequent Medicare fiscal year. Hospitals began submitting quality data to CMS in October 2012. All of our hospitals met the reporting deadlines occurring on or before December 31, 2012 resulting in no corresponding reimbursement reductions.
CMS has also adopted final rules that require healthcare providers to update and supplement diagnosis and procedure codes to the International Classification of Diseases 10
th
Edition (“ICD-10”), effective October 1, 2014. We are currently modifying our systems to accommodate the adoption of ICD-10. We expect to be in compliance on a timely basis. Although this adoption process will result in system conversion expenses and may result in some disruptions to the billing process and delays in the receipt of some payments, we do not believe there will be a material impact on our business. We will continue to monitor this implementation carefully.
We cannot predict the adjustments to Medicare payment rates Congress or CMS may make in the future. Congress, MedPAC, and CMS will continue to address reimbursement rates for a variety of healthcare settings. Any additional downward adjustment to rates for the types of facilities we operate could have a material adverse effect on our business, financial position, results of operations, and cash flows. For additional discussion of the risks associated with our concentration of revenues from the federal government or with potential changes to the statutes or regulations governing Medicare reimbursement, see Item 1A,
Risk Factors.
A basic summary of current Medicare reimbursement in our primary service areas follows:
Inpatient Rehabilitation Hospitals
. As discussed above, our hospitals receive fixed payment reimbursement amounts per discharge under IRF-PPS based on certain rehabilitation impairment categories established by the United States Department of Health and Human Services (“HHS”). In order to qualify for reimbursement under IRF-PPS, our hospitals must comply with various Medicare rules and regulations including documentation and coverage requirements, or specifications as to what conditions must be met to qualify for reimbursement. These requirements relate to, among other things, preadmission screening, post-admission evaluations, and individual treatment planning that all delineate the role of physicians in ordering and overseeing patient care. With IRF-PPS, our hospitals retain the difference, if any, between the fixed payment from Medicare and their operating costs. Thus, our hospitals benefit from being cost-effective providers.
Under IRF-PPS, CMS is required to adjust the payment rates based on a market basket index, known as the rehabilitation, psychiatric, and long-term care hospital market basket. The market basket update is designed to reflect changes over time in the prices of a mix of goods and services provided by rehabilitation hospitals and hospital-based inpatient rehabilitation units. The market basket uses data furnished by the Bureau of Labor Statistics for price proxy purposes, primarily in three categories: Producer Price Indexes, Consumer Price Indexes, and Employment Cost Indexes.
Over the last several years, changes in regulations governing inpatient rehabilitation reimbursement have created challenges for inpatient rehabilitation providers. Many of these changes have resulted in limitations on, and in some cases, reductions in, the levels of payments to healthcare providers. For example, on May 7, 2004, CMS issued a final rule, known as the “75% Rule,” stipulating that to qualify as an inpatient rehabilitation hospital under the Medicare program a facility must show that a certain percentage of its patients are treated for at least one of a specified and limited list of medical conditions. Under the 75% Rule, any inpatient rehabilitation hospital that failed to meet its requirements would be subject to prospective
7
reclassification as an acute care hospital, with lower acute care payment rates for rehabilitative services. On December 29, 2007, the Medicare, Medicaid and State Children’s Health Insurance Program (SCHIP) Extension Act of 2007 (the “2007 Medicare Act”) was signed, setting the compliance threshold at 60% instead of 75% and allowing hospitals to continue using a patient’s secondary medical conditions, or “comorbidities,” to determine whether a patient qualifies for inpatient rehabilitative care under the rule. The long-term impact of the freeze at the 60% compliance threshold is positive because it allowed patient volumes to stabilize. In another example, the 2007 Medicare Act included an elimination of the IRF-PPS market basket adjustment for the period from April 1, 2008 through September 30, 2009 causing a reduction in the pricing of services eligible for Medicare reimbursement to a pricing level that existed in the third quarter of 2007, or a Medicare pricing “roll-back,” which resulted in a decrease in actual reimbursement dollars per discharge despite increases in costs.
On July 25, 2012, CMS released its notice of final rulemaking for the fiscal year 2013 IRF-PPS. This rule was effective for Medicare discharges between October 1, 2012 and September 30, 2013. The pricing changes in this rule included a 2.7% market basket update that was reduced by 0.1% to 2.6% under the requirements of the 2010 Healthcare Reform Laws, as well as other pricing changes that impact our hospital-by-hospital base rate for Medicare reimbursement. The 2010 Healthcare Reform Laws also require the market basket update to be reduced by a productivity adjustment on an annual basis. The productivity adjustments equal the trailing 10-year average of changes in annual economy-wide private nonfarm business multi-factor productivity. The productivity adjustment effective October 1, 2012 decreased the market basket update by 70 basis points.
On July 31, 2013, CMS released its notice of final rulemaking for fiscal year 2014 IRF-PPS (the “2014 Rule”). The final rule would implement a net 1.8% market basket increase effective for discharges between October 1, 2013 and September 30, 2014, calculated as follows:
|
Market basket update
|
2.6%
|
|
Healthcare reform reduction
|
30 basis points
|
|
Productivity adjustment reduction
|
50 basis points
|
The final rule also includes other pricing changes that impact our hospital-by-hospital base rate for Medicare reimbursement. Such changes include, but are not limited to, updates to the IRF-PPS facility-level rural adjustment factor, low-income patient factor, teaching status adjustment factor, and updates to the outlier fixed loss threshold. Based on our analysis which utilizes, among other things, the acuity of our patients over the 12-month period prior to the rule’s release and incorporates other adjustments included in the final rule, we believe the 2014 Rule will result in a net increase to our Medicare payment rates of approximately 1.95% effective October 1, 2013 before sequestration. The sequestration reduction will anniversary for purposes of year-over-year
Net operating revenues
beginning with payments received after April 1, 2014, so the net year-over-year decrease in our
Net operating revenues
is expected to be approximately $8 million in 2014.
Although reductions or changes in reimbursement from governmental or third-party payors and regulatory changes affecting our business represent one of the most significant challenges to our business, our operations are also affected by coverage rules and determinations. Medicare providers like us can be negatively affected by the adoption of coverage policies, either at the national or local level, that determine whether an item or service is covered and under what clinical circumstances it is considered to be reasonable and necessary. Current CMS coverage rules require inpatient rehabilitation services to be ordered by a qualified rehabilitation physician and be coordinated by an interdisciplinary team. The interdisciplinary team must meet weekly to review patient status and make any needed adjustments to the individualized plan of care. Qualified personnel must provide required rehabilitation nursing, physical therapy, occupational therapy, speech-language pathology, social services, psychological services, and prosthetic and orthotic services. For individual claims, Medicare contractors make coverage determinations regarding medical necessity which can represent more restrictive interpretations of the CMS coverage rules. We cannot predict how future CMS coverage rule interpretations or any new local coverage determinations will affect us.
Pursuant to legislative directives and authorizations from Congress, CMS has developed and instituted various Medicare audit programs under which CMS contracts with private companies to conduct claims and medical record audits. These audits are in addition to those conducted by existing Medicare Administrative Contractors (“MACs”). Some contractors are paid a percentage of the overpayments recovered. One type of audit contractor, the Recovery Audit Contractors (”RACs”), began post-payment audit processes in late 2009 for providers in general. The RACs receive claims data directly from MACs on a monthly or quarterly basis and are authorized to review claims up to three years from the date a claim was paid, beginning with claims filed on or after October 1, 2007. The 2010 Healthcare Reform Laws extended the RAC program to Medicare, Parts C and D, and Medicaid. RAC audits initially focused on coding errors. CMS subsequently expanded the program to medical necessity reviews for IRFs.
8
In connection with CMS approved and announced RAC audits related to IRFs, we received requests in 2013 to review certain patient files for discharges occurring from 2010 to 2013. To date, the Medicare payments that are subject to these audit requests represent less than 1% of our Medicare patient discharges during those years, and not all of these patient files requests have resulted in payment denial determinations by the RACs.
These post-payment RAC audits are focused on medical necessity requirements for admission to IRFs rather than targeting a specific diagnosis code as in previous pre-payment audits. Medical necessity is a subjective assessment by an independent physician of a patient’s ability to tolerate and benefit from intensive multi-disciplinary therapy provided in an IRF setting. Because we have confidence in the medical judgment of both the referring and the admitting physicians who assess the treatment needs of our patients, we currently intend to appeal substantially all RAC denials arising from these audits.
While we make provisions for these claims based on our historical experience and success rates in the claim adjudication process, we cannot provide assurance as to our future success in the resolution of these and future disputes, nor can we predict or estimate the scope or number of denials that ultimately may be reviewed. During 2013, we reduced our
Net operating revenues
by approximately $8 million for post-payment claims that are part of this review process.
Unlike the pre-payment denials of certain diagnosis codes by MACs that have been part of our operations for several years, we have not had any experience with RACs in the context of post-payment reviews of this nature. Along with our significant efforts through training and education to ensure compliance with coding and medical necessity coverage rules, we also have a formal process for complying with RAC audits, and we are cooperating fully with the RACs during this process. However, due to additional delays announced by CMS in the related adjudication process, which is the same process we follow for appealing denials of certain diagnosis codes by MACs, we believe the resolution of any claims that are subsequently denied as a result of these RAC audits could take in excess of two years.
On August 27, 2012, CMS launched its three-year demonstration project that expanded the RAC program to include prepayment review of Medicare fee-for-service claims. Currently, acute care hospitals are the primary subject to this review project, but CMS could expand it to inpatient post-acute providers. This demonstration project will identify specific diagnosis codes for review, and the RAC contractors will review the selected claims to determine if they are proper before payment has been made to the provider. The project covers 11 states, including 8 states in which we operate – Florida, California, Texas, Louisiana, Illinois, Pennsylvania, Ohio, and Missouri. Providers with claims identified for RAC prepayment reviews will have 30 days to respond to requests for additional documentation. If they do not respond timely, the claim will be denied. Providers receive determinations within 45 days of submitting the relevant documentation.
CMS has also established contractors known as the Zone Program Integrity Contractors (“ZPICs”). These contractors are successors to the Program Safeguard Contractors and conduct audits with a focus on potential fraud and abuse issues. Like the RACs, the ZPICs conduct audits and have the ability to refer matters to the United States Department of Health and Human Services Office of Inspector General (the “HHS-OIG”) or the United States Department of Justice. Unlike RACs, however, ZPICs do not receive a specific financial incentive based on the amount of the error.
As a matter of course, we undertake significant efforts through training and education to ensure compliance with coding and medical necessity coverage rules. However, despite our belief that our coding and assessment of patients is accurate, audits may lead to assertions that we have been underpaid or overpaid by Medicare or submitted improper claims in some instances, require us to incur additional costs to respond to requests for records and defend the validity of payments and claims, and ultimately require us to refund any amounts determined to have been overpaid. We cannot predict when or how these audit programs will affect us. For additional discussion of these audits and the risks associated with them, see Item 1A,
Risk Factors
and Item 7,
Management’s Discussion and Analysis of Financial Condition and Results of Operations
, “Executive Overview—Key Challenges.”
Outpatient Services
. Our outpatient services are primarily reimbursed under Medicare’s physician fee schedule. By statute, the physician fee schedule is subject to annual automatic adjustment by a sustainable growth rate formula that has resulted in reductions in reimbursement rates every year since 2002. However, in each instance, Congress has acted to suspend or postpone the effectiveness of these automatic reimbursement reductions. For example, under the CMS final notice of rulemaking for the physician fee schedule for calendar year 2014, released on November 27, 2013, a statutory reduction of 20.1% would have been implemented. However, the Bipartisan Budget Act of 2013 increased the current Medicare physician fee schedule payment rates by 0.5% from January 1, 2014 through March 31, 2014, further postponing the statutory reduction. If Congress does not again extend relief as it has done since 2002 or permanently modify the sustainable growth rate formula by April 1, 2014, payment levels for outpatient services under the physician fee schedule will be reduced at that point by more than 20.1%. We currently estimate that a reduction of that size, before taking into account our efforts to mitigate these changes, which would likely include closure of additional outpatient satellite clinics, would result in a net decrease in our
Net operating revenues
of approximately $5 million annually. However, we cannot predict what action, if any, Congress will take on the
9
physician fee schedule and other reimbursement matters affecting our outpatient services or what future rule changes CMS will implement.
Medicaid Reimbursement
Medicaid is a jointly administered and funded federal and state program that provides hospital and medical benefits to qualifying individuals who are deemed unable to afford healthcare. As the Medicaid program is administered by the individual states under the oversight of CMS in accordance with certain regulatory and statutory guidelines, there are substantial differences in reimbursement methodologies and coverage policies from state to state. Many states have experienced shortfalls in their Medicaid budgets and are implementing significant cuts in Medicaid reimbursement rates. Additionally, certain states control Medicaid expenditures through restricting or eliminating coverage of certain services. Continuing downward pressure on Medicaid payment rates could cause a decline in that portion of our
Net operating revenues
. However, for the year ended
December 31, 2013
, Medicaid payments represented only
1.2%
of our consolidated
Net operating revenues
. Although the 2010 Healthcare Reform Laws contain provisions intended to expand Medicaid coverage, part of which were invalidated by the U.S. Supreme Court, we do not believe the expanded coverage will have a material impact on our consolidated
Net operating revenues
given our current patient mix.
Managed Care and Other Discount Plans
All of our hospitals offer discounts from established charges to certain large group purchasers of healthcare services, including Medicare Advantage, managed care plans, private insurance companies, and third-party administrators. Managed care contracts typically have terms of between one and three years, although we have a number of managed care contracts that automatically renew each year (with pre-defined rate increases) unless a party elects to terminate the contract. While some of our contracts provide for annual rate increases of two to four percent and our average rate increase in
2013
was 4.1%, we cannot provide any assurance we will continue to receive increases. Our managed care staff focuses on establishing and re-negotiating contracts that provide equitable reimbursement for the services provided.
Cost Reports
Because of our participation in Medicare, Medicaid, and certain Blue Cross and Blue Shield plans, we are required to meet certain financial reporting requirements. Federal and, where applicable, state regulations require the submission of annual cost reports covering the revenue, costs, and expenses associated with the services provided by our inpatient hospitals to Medicare beneficiaries and Medicaid recipients. These annual cost reports are subject to routine audits which may result in adjustments to the amounts ultimately determined to be due to us under these reimbursement programs. These audits are used for determining if any under- or over-payments were made to these programs and to set payment levels for future years. Medicare also makes retroactive adjustments to payments for certain low-income patients after comparing subsequently published statistical data from CMS to the cost report data. We cannot predict what retroactive adjustments, if any, will be made, but we do not anticipate such adjustments would have a material impact on our financial position, results of operations, and cash flows.
Regulation
The healthcare industry in general is subject to significant federal, state, and local regulation that affects our business activities by controlling the reimbursement we receive for services provided, requiring licensure or certification of our hospitals, regulating our relationships with physicians and other referral sources, regulating the use of our properties, and controlling our growth.
Our facilities provide the medical, nursing, therapy, and ancillary services required to comply with local, state, and federal regulations, as well as, for most facilities, accreditation standards of The Joint Commission (formerly known as the Joint Commission on Accreditation of Healthcare Organizations) and, for some facilities, the Commission on Accreditation of Rehabilitation Facilities.
We maintain a comprehensive compliance program that is designed to meet or exceed applicable federal guidelines and industry standards. The program is intended to monitor and raise awareness of various regulatory issues among employees and to emphasize the importance of complying with governmental laws and regulations. As part of the compliance program, we provide annual compliance training to our employees and encourage all employees to report any violations to their supervisor or through a toll-free telephone hotline.
10
Licensure and Certification
Healthcare facility construction and operation are subject to numerous federal, state, and local regulations relating to, among other things, the adequacy of medical care, equipment, personnel, operating policies and procedures, acquisition and dispensing of pharmaceuticals and controlled substances, infection control, maintenance of adequate records and patient privacy, fire prevention, and compliance with building codes and environmental protection laws. Our hospitals are subject to periodic inspection and other reviews by governmental and non-governmental certification authorities to ensure continued compliance with the various standards necessary for facility licensure. All of our inpatient hospitals are currently required to be licensed.
In addition, hospitals must be certified by CMS to participate in the Medicare program and generally must be certified by Medicaid state agencies to participate in Medicaid programs. Once certified by Medicare, hospitals undergo periodic on-site surveys and revalidations in order to maintain their certification. All of our inpatient hospitals participate in the Medicare program.
Failure to comply with applicable certification requirements may make our hospitals ineligible for Medicare or Medicaid reimbursement. In addition, Medicare or Medicaid may seek retroactive reimbursement from noncompliant facilities or otherwise impose sanctions on noncompliant facilities. Non-governmental payors often have the right to terminate provider contracts if a facility loses its Medicare or Medicaid certification.
The 2010 Healthcare Reform Laws added new screening requirements and associated fees for all Medicare providers. The screening must include a licensure check and may include other procedures such as fingerprinting, criminal background checks, unscheduled and unannounced site visits, database checks, and other screening procedures prescribed by CMS.
We have developed operational systems to oversee compliance with the various standards and requirements of the Medicare program and have established ongoing quality assurance activities; however, given the complex nature of governmental healthcare regulations, there can be no assurance Medicare, Medicaid, or other regulatory authorities will not allege instances of noncompliance. A determination by a regulatory authority that a facility is not in compliance with applicable requirements could also lead to the assessment of fines or other penalties, loss of licensure, and the imposition of requirements that an offending facility takes corrective action.
Certificates of Need
In some states and U.S. territories where we operate, the construction or expansion of facilities, the acquisition of existing facilities, or the introduction of new beds or services may be subject to review by and prior approval of state regulatory bodies under a “certificate of need,” or “CON,” law. As of
December 31, 2013
, approximately 49% of our licensed beds are located in states or U.S. territories that have CON laws. CON laws often require a reviewing agency to determine the public need for additional or expanded healthcare facilities and services. These laws generally require approvals for capital expenditures involving inpatient rehabilitation hospitals, if such capital expenditures exceed certain thresholds. In addition, CON laws in some states require us to abide by certain charity care commitments as a condition for approving a CON. Any time a CON is required, we must obtain it before acquiring, opening, reclassifying, or expanding a healthcare facility or starting a new healthcare program.
We potentially face opposition any time we initiate a CON project or seek to acquire an existing facility or CON. This opposition may arise either from competing national or regional companies or from local hospitals or other providers which file competing applications or oppose the proposed CON project. Opposition to our applications may delay or prevent our future addition of beds or hospitals in given markets or increase our costs in seeking those additions. The necessity for these approvals serves as a barrier to entry and has the potential to limit competition, including in markets where we hold a CON and a competitor is seeking an approval. We have generally been successful in obtaining CONs or similar approvals when required, although there can be no assurance we will achieve similar success in the future and the likelihood of success varies by state.
False Claims
The federal False Claims Act prohibits the knowing presentation of a false claim to the United States government and provides for penalties equal to three times the actual amount of any overpayments plus up to $11,000 per claim. In addition, the False Claims Act allows private persons, known as “relators,” to file complaints under seal and provides a period of time for the government to investigate such complaints and determine whether to intervene in them and take over the handling of all or part of such complaints. Because we perform thousands of similar procedures a year for which we are reimbursed by Medicare and other federal payors and there is a relatively long statute of limitations, a billing error or cost reporting error could result in significant civil or criminal penalties under the False Claims Act. Many states have also adopted similar laws relating to state
11
government payments for healthcare services. The 2010 Healthcare Reform Laws amended the federal False Claims Act to expand the definition of false claim, to make it easier for the government to initiate and conduct investigations, to enhance the monetary reward to relators where prosecutions are ultimately successful, and to extend the statute of limitations on claims by the government. The federal government has become increasingly aggressive in asserting that incidents of erroneous billing or record keeping represent a violation of the False Claims Act. For additional discussion, see Item 1A,
Risk Factors
, and
Note 18,
Contingencies and Other Commitments
, to the accompanying consolidated financial statements.
Relationships with Physicians and Other Providers
Anti-Kickback Law
. Various state and federal laws regulate relationships between providers of healthcare services, including management or service contracts and investment relationships. Among the most important of these restrictions is a federal law prohibiting the offer, payment, solicitation, or receipt of remuneration by individuals or entities to induce referrals of patients for services reimbursed under the Medicare or Medicaid programs (the “Anti-Kickback Law”). The 2010 Healthcare Reform Laws amended the federal Anti-Kickback Law to provide that proving violations of this law does not require proving actual knowledge or specific intent to commit a violation. Another amendment made it clear that Anti-Kickback Law violations can be the basis for claims under the False Claims Act. These changes and those described above related to the False Claims Act, when combined with other recent federal initiatives, are likely to increase investigation and enforcement efforts in the healthcare industry generally. In addition to standard federal criminal and civil sanctions, including imprisonment and penalties of up to $50,000 for each violation plus tripled damages for improper claims, violators of the Anti-Kickback Law may be subject to exclusion from the Medicare and/or Medicaid programs. In 1991, the HHS-OIG issued regulations describing compensation arrangements that are not viewed as illegal remuneration under the Anti-Kickback Law. Those regulations provide for certain safe harbors for identified types of compensation arrangements that, if fully complied with, assure participants in the particular arrangement that the HHS-OIG will not treat that participation as a criminal offense under the Anti-Kickback Law or as the basis for an exclusion from the Medicare and Medicaid programs or the imposition of civil sanctions. Failure to fall within a safe harbor does not constitute a violation of the Anti-Kickback Law, but the HHS-OIG has indicated failure to fall within a safe harbor may subject an arrangement to increased scrutiny. A violation of the Anti-Kickback Law by us or one or more of our partnerships could have a material adverse effect upon our business, financial position, results of operations, or cash flows. Even the assertion of a violation could have an adverse effect upon our stock price or reputation.
Some of our rehabilitation hospitals are owned through joint ventures with institutional healthcare providers that may be in a position to make or influence referrals to our hospitals. In addition, we have a number of relationships with physicians and other healthcare providers, including management or service contracts. Some of these investment relationships and contractual relationships may not meet all of the regulatory requirements to fall within the protection offered by a relevant safe harbor. Despite our compliance and monitoring efforts, there can be no assurance violations of the Anti-Kickback Law will not be asserted in the future, nor can there be any assurance that our defense against any such assertion would be successful.
For example, we have entered into agreements to manage our hospitals that are owned by partnerships. Most of these agreements incorporate a percentage-based management fee. Although there is a safe harbor for personal services and management contracts, this safe harbor requires, among other things, the aggregate compensation paid to the manager over the term of the agreement be set in advance. Because our management fee may be based on a percentage of revenues, the fee arrangement may not meet this requirement. However, we believe our management arrangements satisfy the other requirements of the safe harbor for personal services and management contracts and comply with the Anti-Kickback Law.
Physician Self-Referral Law
. The federal law commonly known as the “Stark law” and CMS regulations promulgated under the Stark law prohibit physicians from making referrals for “designated health services” including inpatient and outpatient hospital services, physical therapy, occupational therapy, or radiology services, to an entity in which the physician (or an immediate family member) has an investment interest or other financial relationship, subject to certain exceptions. The Stark law also prohibits those entities from filing claims or billing for those referred services. Violators of the Stark law and regulations may be subject to recoupments, civil monetary sanctions (up to $15,000 for each violation and assessments up to three times the amount claimed for each prohibited service) and exclusion from any federal, state, or other governmental healthcare programs. The statute also provides a penalty of up to $100,000 for a circumvention scheme. There are statutory exceptions to the Stark law for many of the customary financial arrangements between physicians and providers, including personal services contracts and leases. However, in order to be afforded protection by a Stark law exception, the financial arrangement must comply with every requirement of the applicable exception.
Under the 2010 Healthcare Reform Laws, the exception to the Stark law that currently permits physicians to refer patients to hospitals in which they have an investment or ownership interest has been dramatically limited by providing that only physician-owned hospitals with a provider agreement in place on December 31, 2010 are exempt from the general ban on self-referral. Existing physician-owned hospitals are prohibited from increasing the physician ownership percentage in the hospital after March 23, 2010. Additionally, physician-owned hospitals are prohibited from increasing the number of licensed
12
beds after March 23, 2010, except when certain market and regulatory approval conditions are met. Currently, we have no hospitals that would be considered physician-owned under this law.
CMS has issued several phases of final regulations implementing the Stark law. While these regulations help clarify the requirements of the exceptions to the Stark law, it is unclear how the government will interpret many of these exceptions for enforcement purposes. Because many of these laws and their implementing regulations are relatively new, we do not always have the benefit of significant regulatory or judicial interpretation of these laws and regulations. We attempt to structure our relationships to meet an exception to the Stark law, but the regulations implementing the exceptions are detailed and complex. Accordingly, we cannot assure that every relationship complies fully with the Stark law.
Additionally, no assurances can be given that any agency charged with enforcement of the Stark law and regulations might not assert a violation under the Stark law, nor can there be any assurance that our defense against any such assertion would be successful or that new federal or state laws governing physician relationships, or new interpretations of existing laws governing such relationships, might not adversely affect relationships we have established with physicians or result in the imposition of penalties on us or on particular HealthSouth hospitals. Even the assertion of a violation could have an adverse effect upon our stock price or reputation.
HIPAA
The Health Insurance Portability and Accountability Act of 1996, commonly known as “HIPAA,” broadened the scope of certain fraud and abuse laws by adding several criminal provisions for healthcare fraud offenses that apply to all health benefit programs. HIPAA also added a prohibition against incentives intended to influence decisions by Medicare or Medicaid beneficiaries as to the provider from which they will receive services. In addition, HIPAA created new enforcement mechanisms to combat fraud and abuse, including the Medicare Integrity Program, and an incentive program under which individuals can receive up to $1,000 for providing information on Medicare fraud and abuse that leads to the recovery of at least $100 of Medicare funds. Penalties for violations of HIPAA include civil and criminal monetary penalties.
HIPAA and related HHS regulations contain certain administrative simplification provisions that require the use of uniform electronic data transmission standards for certain healthcare claims and payment transactions submitted or received electronically. HIPAA regulations also regulate the use and disclosure of individually identifiable health-related information, whether communicated electronically, on paper, or orally. The regulations provide patients with significant rights related to understanding and controlling how their health information is used or disclosed and require healthcare providers to implement administrative, physical, and technical practices to protect the security of individually identifiable health information that is maintained or transmitted electronically.
With the enactment of the Health Information Technology for Economic and Clinical Health (“HITECH”) Act as part of the American Recovery and Reinvestment Act of 2009, the privacy and security requirements of HIPAA have been modified and expanded. The HITECH Act applies certain of the HIPAA privacy and security requirements directly to business associates of covered entities. The modifications to existing HIPAA requirements include: expanded accounting requirements for electronic health records, tighter restrictions on marketing and fundraising, and heightened penalties and enforcement associated with noncompliance. Significantly, the HITECH Act also establishes new mandatory federal requirements for notification of breaches of security involving protected health information. HHS is responsible for enforcing the requirement that covered entities notify any individual whose protected health information has been improperly acquired, accessed, used, or disclosed. In certain cases, notice of a breach is required to be made to HHS and media outlets. The heightened penalties for noncompliance range from $100 to $50,000 per violation for most violations. In the event of violations due to willful neglect that are not corrected within 30 days, penalties start at $50,000 per violation and are not subject to a per violation statutory maximum. All penalties are subject to a $1,500,000 cap for multiple identical violations in a single calendar year. Willful neglect could include the failure to conduct a security risk assessment or adequately implement HIPAA compliance policies.
On January 17, 2013, HHS Office for Civil Rights issued a final rule, with a compliance date of September 23, 2013, to implement the HITECH Act and make other modifications to the HIPAA and HITECH regulations. This rule expanded the potential liability for a breach involving protected health information to cover some instances where a subcontractor is responsible for the breaches and that individual or entity was acting within the scope of delegated authority under the related contract or engagement. The final rule generally defines “breach” to mean the acquisition, access, use or disclosure of protected health information in a manner not permitted by the HIPAA privacy standards, which compromises the security or privacy of protected health information. Under the final rule, improper acquisition, access, use, or disclosure is presumed to be a reportable breach, unless the potentially breaching party can demonstrate a low probability that protected health information has been compromised. On the whole, it appears the changes to the breach reporting rules could increase breach reporting in the healthcare industry.
13
In addition, there are numerous legislative and regulatory initiatives at the federal and state levels addressing patient privacy concerns. Facilities will continue to remain subject to any federal or state privacy-related laws that are more restrictive than the privacy regulations issued under HIPAA. These laws vary and could impose additional penalties. Any actual or perceived violation of privacy-related laws and regulations, including HIPAA and the HITECH Act, could have a material adverse effect on our business, financial position, results of operations, and cash flows.
Available Information
Our website address is
www.healthsouth.com
. We make available through our website the following documents, free of charge: our annual reports (Form 10-K), our quarterly reports (Form 10-Q), our current reports (Form 8-K), and any amendments to those reports promptly after we electronically file such material with, or furnish it to, the United States Securities and Exchange Commission. In addition to the information that is available on our website, you may read and copy any materials we file with or furnish to the SEC at the SEC’s Public Reference Room at 100 F Street, N.E., Washington, D.C. 20549. You may obtain information on the operation of the Public Reference Room by calling the SEC at 1-800-SEC-0330. The SEC also maintains a website,
www.sec.gov
, which includes reports, proxy and information statements, and other information regarding us and other issuers that file electronically with the SEC.
|
Item 1A.
|
Risk Factors
|
Our business, operations, and financial position are subject to various risks. Some of these risks are described below, and you should take such risks into account in evaluating HealthSouth or any investment decision involving HealthSouth. This section does not describe all risks that may be applicable to us, our industry, or our business, and it is intended only as a summary of certain material risk factors. More detailed information concerning other risk factors as well as those described below is contained in other sections of this annual report.
Reductions or changes in reimbursement from government or third-party payors and other legislative and regulatory changes affecting our industry could adversely affect our operating results.
We derive a substantial portion of our
Net operating revenues
from the Medicare program. See Item 1,
Business
, “Sources of Revenues,” for a table identifying the sources and relative payor mix of our revenues. Historically, Congress and some state legislatures have periodically proposed significant changes in regulations governing the healthcare system. Many of these changes have resulted in limitations on the increases in and, in some cases, significant roll-backs or reductions in the levels of payments to healthcare providers for services under many government reimbursement programs. There can be no assurance that future governmental initiatives will not result in pricing roll-backs or freezes or reimbursement reductions.
In March 2010, President Obama signed into law the Patient Protection and Affordable Care Act (as subsequently amended, the “2010 Healthcare Reform Laws”). Many provisions within the 2010 Healthcare Reform Laws have impacted or could in the future impact our business, including: (1) reducing annual market basket updates to providers, which include annual productivity adjustment reductions; (2) the possible combining, or “bundling,” of reimbursement for a Medicare beneficiary’s episode of care at some point in the future; (3) implementing a voluntary program for accountable care organizations (“ACOs”); and (4) creating an Independent Payment Advisory Board.
Most notably for us, these laws include a reduction in annual market basket updates to hospitals. In accordance with Medicare laws and statutes, the United States Centers for Medicare and Medicaid Services (“CMS”) makes annual adjustments to Medicare reimbursement rates by what is commonly known as a “market basket update.” The reductions in our annual market basket updates continue through 2019 for each CMS fiscal year, which for us begins October 1, as follows:
|
2014
|
2015-16
|
2017-19
|
|
0.3%
|
0.2%
|
0.75%
|
In addition, the 2010 Healthcare Reform Laws require the market basket update to be reduced by a productivity adjustment on an annual basis. The productivity adjustments equal the trailing 10-year average of changes in annual economy-wide private nonfarm business multi-factor productivity. The productivity adjustment effective from October 1, 2013 to September 30, 2014 is a decrease to the market basket update of 50 basis points. We estimate the adjustment effective October 1, 2014 will be a decrease to the market basket update of approximately 100 basis points, but we cannot predict it with certainty.
The 2010 Healthcare Reform Laws also directed the United States Department of Health and Human Services (“HHS”) to examine the feasibility of bundling, including conducting a voluntary, multi-year bundling pilot program to test and
14
evaluate alternative payment methodologies. On January 31, 2013, CMS announced the selection of participants in the initial phase of limited-scope, voluntary bundling pilot projects. There are four project types: acute care only, acute/post-acute, post‑acute only, and acute and physician services. In the initial phase, pilot participants along with their provider partners exchange data with CMS on care patterns and engage in shared learning in how to improve care. The second phase requires participants in that phase, pending contract finalization and completion of the standard CMS program integrity reviews, to take on financial risk for episodes of care. If participants have not transitioned from the first phase to the second by fall 2014, their participation will terminate. CMS selected as participants a small number of acute care hospitals with which we have relationships. To date, we have agreed to participate in a few bundling projects as a post-acute rehabilitation provider, some of which have not yet experienced much activity and none of which have transitioned to the risk sharing second phase. We will continue to evaluate on a case by case basis the appropriateness of bundling opportunities for our hospitals and patients.
Similarly, in October 2011, CMS established, per the 2010 Healthcare Reform Laws, a voluntary ACO program in which hospitals, physicians, and other care providers develop entities to pursue the delivery of coordinated healthcare on a more efficient, patient-centered basis. Conceptually, ACOs will receive a portion of any savings generated above a certain threshold from care coordination as long as benchmarks for the quality of care are maintained. The ACO rules adopted by CMS are extremely complex and remain subject to further refinement by CMS. As with bundling, we are currently evaluating on a case by case basis appropriate participation opportunities in the ACO pilots for our hospitals and patients. We have expressed interest in participating in several ACOs and have executed one participation agreement as of December 31, 2013.
The bundling and ACO initiatives have served as motivating factors for regulators and healthcare industry participants to identify and implement workable coordinated care delivery models. Broad-based implementation of a new delivery model would represent a significant transformation for us and the healthcare industry generally. The nature and timing of the transformation of the current healthcare system to coordinated care delivery and payment models is uncertain and will likely remain so for some time. The development of new delivery and payment systems will almost certainly take significant time and expense. Many of the alternative approaches being explored may not work. For further discussion of the associated challenges and our efforts to respond to them, see “Executive Overview—Key Challenges—Changes to Our Operating Environment Resulting from Healthcare Reform” section of Item 7,
Management Discussion and Analysis of Financial Condition and Results of Operations
.
Another provision of the 2010 Healthcare Reform Laws establishes an Independent Payment Advisory Board appointed by the President that is charged with presenting proposals, beginning in 2014, to Congress to reduce Medicare expenditures upon the occurrence of Medicare expenditures exceeding a certain level. This board will have broad authority to develop new Medicare policies (including changes to provider reimbursement). In general, unless Congress acts to block the proposals of this board, CMS will implement the policy recommendations. However, due to the market basket reductions that are also part of these laws, certain healthcare providers, including us, will not be subject to payment reduction proposals developed by this board and presented to Congress until 2020. While we may not be subject to its payment reduction proposals for a period of time, based on the scope of this board’s directive to reduce Medicare expenditures and the significance of Medicare as a payor to us, other decisions made by this board may adversely impact our results of operations.
Many aspects of implementation and interpretation of the 2010 Healthcare Reform Laws remain uncertain. Given the complexity and the number of changes in these laws as well as subsequent regulatory developments and delays, we cannot predict the ultimate impact of these laws. However, we believe the provisions discussed above are the issues with the greatest potential impact on us.
The 2010 Healthcare Reform Laws include other provisions that could adversely affect us as well. They include the expansion of the federal Anti-Kickback Law and the False Claims Act that, when combined with other recent federal initiatives, are likely to increase investigation and enforcement efforts in the healthcare industry generally. Changes include increased resources for enforcement, lowered burden of proof for the government in healthcare fraud matters, expanded definition of claims under the False Claims Act, enhanced penalties, and increased rewards for relators in successful prosecutions. CMS may also suspend payment for claims prospectively if, in its opinion, credible allegations of fraud exist. The initial suspension period may be up to
180
days. However, the payment suspension period can be extended almost indefinitely if the matter is under investigation by the HHS Office of Inspector General (the “HHS-OIG”) or the United States Department of Justice (the “DOJ”). Any such suspension would adversely impact our financial position, results of operations, and cash flows.
Further, under the 2010 Healthcare Reform Laws, CMS established new quality data reporting, effective October 1, 2012, for all inpatient rehabilitation facilities (“IRFs”). A facility’s failure to submit the required quality data will result in a two percentage point reduction to that facility’s annual market basket increase factor for payments made for discharges in the subsequent fiscal year. IRFs began submitting quality data to CMS in October 2012. All of our hospitals met the reporting requirements for the period ending December 31, 2012 resulting in no corresponding reductions for the fiscal year beginning October 1, 2014. There can be no assurance that all of our hospitals will do so for future periods which may result in one or
15
more of our hospitals seeing a reduction in its reimbursements. For additional discussion of general healthcare regulation, see Item 1,
Business
, “Regulatory and Reimbursement Challenges” and “Regulation.”
Some states in which we operate have also undertaken, or are considering, healthcare reform initiatives that address similar issues. For example, there is a referendum on the November 2014 ballot in Massachusetts that would, if approved, impose several new requirements on hospitals in that state, including setting minimum staffing ratios and maximum operating margins (8%). While many of the stated goals of other federal and state reform initiatives are consistent with our own goal to provide care that is high-quality and cost-effective, legislation and regulatory proposals may lower reimbursements, increase the cost of compliance, and otherwise adversely affect our business. We cannot predict what healthcare initiatives, if any, will be enacted, implemented or amended, or the effect any future legislation or regulation will have on us.
On August 2, 2011, President Obama signed into law the Budget Control Act of 2011, which provided for an automatic 2% reduction of Medicare program payments. We currently estimate this automatic reduction, known as “sequestration,” which began affecting payments received after April 1, 2013, will reduce the payments we receive under the IRF prospective payment system (the “IRF-PPS”) resulting in a net year-over-year decrease in our
Net operating revenues
of approximately $8 million in 2014. The effect of sequestration on year-over-year comparisons of
Net operating revenues
will cease on April 1, 2014.
Additionally, concerns held by federal policymakers about the federal deficit, national debt levels, and reforming the sustainable growth rate formula used to pay physicians who treat Medicare beneficiaries (the so called “Doc Fix”) could result in enactment of further federal spending reductions, further entitlement reform legislation affecting the Medicare program, and/or further reductions to provider payments. For example, the Health Subcommittee of the Ways and Means Committee of the United States House of Representatives held a hearing in June 2013 to examine legislative proposals contained in President Obama’s fiscal year 2014 budget submission to Congress that would affect post-acute care providers including, among other issues, elevating the 60% Rule to a 75% Rule and paying rehabilitation hospitals nursing home-based rates for certain conditions (also referred to as “site-neutral payment”). As a point of follow-up to this hearing, we provided constructive input to the Ways and Means Health Subcommittee on legislative and regulatory initiatives as well as information on the quality of care and value that inpatient rehabilitation hospitals bring to the Medicare program and its beneficiaries, and we will continue providing such input to policymakers. We cannot predict what alternative or additional deficit reduction initiatives, Medicare payment reductions, or post acute care reforms, if any, will ultimately be enacted into law, or the timing or effect any such initiatives or reductions will have on us. If enacted, such initiatives or reductions would likely be challenging for all providers, would likely have the effect of limiting Medicare beneficiaries’ access to healthcare services, and could have an adverse impact on our financial position, results of operations, and cash flows.
If we are not able to maintain increased case volumes or reduce operating costs to offset any future pricing roll-back, reduction, freeze, or increased costs associated with new regulatory compliance obligations, our operating results could be adversely affected. Our results could be further adversely affected by other changes in laws or regulations governing the Medicare program, as well as possible changes to or expansion of the audit processes conducted by Medicare contractors or Medicare recovery audit contractors. For additional discussion of healthcare reform and other factors affecting reimbursement for our services, see Item 1,
Business
, “Regulatory and Reimbursement Challenges” and “Sources of Revenues—Medicare Reimbursement.”
In addition, there are increasing pressures, including as a result of the 2010 Healthcare Reform Laws, from many third-party payors to control healthcare costs and to reduce or limit increases in reimbursement rates for medical services. Our relationships with managed care and nongovernmental third-party payors, such as health maintenance organizations and preferred provider organizations, are generally governed by negotiated agreements. These agreements set forth the amounts we are entitled to receive for our services. We could be adversely affected in some of the markets where we operate if we are unable to negotiate and maintain favorable agreements with third-party payors.
Our third-party payors may also, from time to time, request audits of the amounts paid, or to be paid, to us. We could be adversely affected in some of the markets where we operate if the auditing payor alleges that substantial overpayments were made to us due to coding errors or lack of documentation to support medical necessity determinations.
16
Compliance with the extensive laws and government regulations applicable to healthcare providers requires substantial time, effort and expense, and if we fail to comply with them, we could suffer penalties or be required to make significant changes to our operations.
As a healthcare provider, we are required to comply with extensive and complex laws and regulations at the federal, state, and local government levels. These laws and regulations relate to, among other things:
|
•
|
licensure, certification, and accreditation;
|
|
•
|
policies, either at the national or local level, delineating what conditions must be met to qualify for reimbursement under Medicare (also referred to as coverage requirements);
|
|
•
|
coding and billing for services;
|
|
•
|
requirements of the 60% compliance threshold under the 2007 Medicare Act;
|
|
•
|
relationships with physicians and other referral sources, including physician self-referral and anti-kickback laws;
|
|
•
|
quality of medical care;
|
|
•
|
use and maintenance of medical supplies and equipment;
|
|
•
|
maintenance and security of patient information and medical records;
|
|
•
|
acquisition and dispensing of pharmaceuticals and controlled substances; and
|
|
•
|
disposal of medical and hazardous waste.
|
In the future, changes in these laws or regulations or the manner in which they are enforced could subject our current or past practices to allegations of impropriety or illegality or could require us to make changes in our hospitals, equipment, personnel, services, capital expenditure programs, operating procedures, and contractual arrangements. Those changes could also affect reimbursements as well as future training and staffing costs. Of note, the HHS-OIG each year releases a work plan that identifies areas of compliance focus for the coming year. The 2012 and 2013 work plans for IRFs continue to focus on timely submissions of patient assessment instruments, the examination of the level of therapy being provided, and the appropriate utilization of concurrent and group therapy. The 2014 work plan provides that the HHS-OIG will review matters related to adverse and temporary harm events occurring in IRFs. For further discussion of certain important healthcare laws and regulations, including updates regarding increases in Medicare payment audit activity, see Item 1,
Business
, “Sources of Revenue—Medicare Reimbursement” and “Regulation.”
On March 4, 2013, we received document subpoenas addressed to four of our wholly owned hospitals. Each subpoena is in connection with an HHS-OIG investigation, led by the DOJ, of alleged improper or fraudulent claims submitted to Medicare and Medicaid and requests documents and materials relating to practices, procedures, protocols and policies, of certain pre- and post-admissions activities at these hospitals. We are cooperating fully with this investigation in connection with these subpoenas and are currently unable to predict the timing or outcome of the related investigations. Through follow-up conversations, the DOJ has indicated it intends to request files from additional hospitals but has provided no specifics on timing or the hospitals involved. For additional discussion, see
Note 18,
Contingencies and Other Commitments
, to the accompanying consolidated financial statements.
Examples of regulatory changes that can affect our business, beyond direct changes to Medicare reimbursement rates, can be found from time to time in CMS rules. The final rule for the fiscal year 2010 IRF-PPS implemented new coverage requirements which provided in part that a patient medical record must document a reasonable expectation that, at the time of admission to an IRF, the patient generally required and was able to participate in the intensive rehabilitation therapy services uniquely provided at IRFs. CMS has also taken the position that a patient’s medical file must appropriately document the rationale for the use of group therapies, as opposed to one-on-one therapy. As previously noted, the appropriate utilization of group therapy was a focus of recent HHS-OIG work plans. Additionally, the final rule for the fiscal year 2014 IRF-PPS includes changes, effective October 1, 2014, to the list of medical conditions, including a reduction in the number of conditions, that will presumptively count toward the 60% compliance threshold to qualify for reimbursement as an inpatient rehabilitation hospital.
The clarity and completeness of each patient medical file, some of which is the work product of a physician not employed by us, are essential to demonstrating our compliance with various regulatory and reimbursement requirements. For
17
example, to support the determination that a patient’s IRF treatment was reasonable and necessary, the file must contain, among other things, an admitting physician’s assessment of the patient as well as a post-admission assessment by the treating physician and other information from clinicians relating to the plan of care and the therapies being provided. These physicians exercise their independent medical judgment. We and our hospital medical directors, who are independent contractors, provide training to the physicians we work with on a regular basis regarding appropriate documentation. In connection with subsequent payment audits and investigations, there can be no assurance as to what opinion a third party may take regarding the status of patient files or the physicians’ medical judgment evidenced in those files.
Although we have invested, and will continue to invest, substantial time, effort, and expense in implementing and maintaining training programs as well as internal controls and procedures designed to ensure regulatory compliance, if we fail to comply with applicable laws and regulations, we could be required to return portions of reimbursements for discharges deemed after the fact to have not been appropriate under the IRF-PPS. We could also be subjected to other liabilities, including (1) criminal penalties, (2) civil penalties, including monetary penalties and the loss of our licenses to operate one or more of our hospitals, and (3) exclusion or suspension of one or more of our hospitals from participation in the Medicare, Medicaid, and other federal and state healthcare programs, which, if lengthy in duration and material to us, could potentially trigger a default under our credit agreement. Because Medicare comprises a significant portion of our
Net operating revenues
, it is important for us to remain compliant with the laws and regulations governing the Medicare program and related matters including anti-kickback and anti-fraud requirements. As discussed above in connection with the 2010 Healthcare Reform Laws, the federal government has in the last couple of years made compliance enforcement and fighting healthcare fraud top priorities. In the past few years, the DOJ and HHS as well as federal lawmakers have significantly increased efforts to ensure strict compliance with various reimbursement related regulations as well as combat healthcare fraud. The DOJ has pursued and recovered a record amount of taxpayer dollars lost to healthcare fraud. Additionally, the federal government has become increasingly aggressive in asserting that incidents of erroneous billing or record keeping represent a violation of the False Claims Act.
Reductions in reimbursements, substantial damages and other remedies assessed against us could have a material adverse effect on our business, financial position, results of operations, and cash flows. Even the assertion of a violation, depending on its nature, could have a material adverse effect upon our stock price or reputation.
Our hospitals face national, regional, and local competition for patients from other healthcare providers.
We operate in a highly competitive industry. Although we are the nation’s largest owner and operator of inpatient rehabilitation hospitals in terms of patients treated and discharged, revenues, and number of hospitals, in any particular market we may encounter competition from local or national entities with longer operating histories or other competitive advantages. For example, acute care hospitals, including those owned and operated by large public companies, may choose to expand or begin offering post-acute rehabilitation services. Given that approximately 93% of our referrals come from acute care hospitals, that increase in competition might materially and adversely affect our admission referrals in the related markets. There can be no assurance this competition, or other competition which we may encounter in the future, will not adversely affect our business, financial position, results of operations, or cash flows. In addition, from time to time, there are efforts in states with certificate of need (“CON”) laws to weaken those laws, which could potentially increase competition in those states. Conversely, competition and statutory procedural requirements in some CON states may inhibit our ability to expand our operations.
We may have difficulty completing acquisitions, investments, joint ventures or de novo developments or increasing capacity with bed additions at existing hospitals consistent with our growth strategy.
We selectively pursue strategic acquisitions of and joint ventures with rehabilitative healthcare providers and, in the future, may do so with other complementary post-acute healthcare operations. We may face limitations on our ability to identify sufficient acquisition or other development targets to meet goals. In many states, the need to obtain governmental approvals, such as a CON or an approval of a change in ownership, may operate as a significant obstacle to completing transactions. Additionally, in states with CON laws, it is not unusual for third-party providers to challenge initial awards of CONs or the increase in the number of approved beds in an existing CON, and the adjudication of those challenges and related appeals may take multiple years.
18
We may make investments or acquisitions or enter into joint ventures that may be unsuccessful and could expose us to unforeseen liabilities.
Investments, acquisitions, joint ventures or other development opportunities identified and completed may involve material cash expenditures, debt incurrence, operating losses, amortization of certain intangible assets of acquired companies, issuances of equity securities, and expenses, some of which are unforeseen, that could affect our business, financial position, results of operations and liquidity. Acquisitions, investments, and joint ventures involve numerous risks, including:
|
•
|
limitations, including state CONs as well as CMS and other regulatory approval requirements, on our ability to complete such acquisitions, particularly those involving not-for-profit providers, on terms, timetables, and valuations reasonable to us;
|
|
•
|
limitations in obtaining financing for acquisitions at a cost reasonable to us;
|
|
•
|
difficulties integrating acquired operations, personnel, and information systems, and in realizing projected revenues, efficiencies and cost savings, or returns on invested capital;
|
|
•
|
entry into markets, businesses or services in which we may have little or no experience;
|
|
•
|
diversion of business resources or management’s attention from ongoing business operations; and
|
|
•
|
exposure to undisclosed or unforeseen liabilities of acquired operations, including liabilities for failure to comply with healthcare laws and anti-trust considerations in specific markets.
|
In addition to those development activities, we intend to build new, or de novo, inpatient rehabilitation hospitals. The construction of new hospitals involves numerous risks, including the receipt of all zoning and other regulatory approvals, such as a CON where necessary, construction delays and cost over-runs. Once built, new hospitals must undergo the state and Medicare certification process, the duration of which may be beyond our control. We may be unable to operate newly constructed hospitals as profitably as expected, and those hospitals may involve significant additional cash expenditures and operating expenses that could, in the aggregate, have an adverse effect on our business, financial position, results of operations, and cash flows.
Competition for staffing, shortages of qualified personnel, union activity or other factors may increase our labor costs and reduce profitability.
Our operations are dependent on the efforts, abilities, and experience of our medical personnel, such as physical therapists, occupational therapists, speech pathologists, nurses, and other healthcare professionals. We compete with other healthcare providers in recruiting and retaining qualified personnel responsible for the daily operations of each of our hospitals. In some markets, the lack of availability of medical personnel is a significant operating issue facing all healthcare providers. This shortage may require us to continue to enhance wages and benefits to recruit and retain qualified personnel or to contract for more expensive temporary personnel. We also depend on the available labor pool of semi-skilled and unskilled employees in each of the markets in which we operate.
If our labor costs increase, we may not experience reimbursement rate increases to offset these additional costs. Because a significant percentage of our revenues consists of fixed, prospective payments, our ability to pass along increased labor costs is limited. In particular, if labor costs rise at an annual rate greater than our net annual market basket update from Medicare, our results of operations and cash flows will be adversely affected. Conversely, decreases in reimbursement revenues, such as with sequestration, may limit our ability to increase compensation or benefits to the extent necessary to retain key employees, in turn increasing our turnover and associated costs. Union activity is another factor that may contribute to increased labor costs. Our failure to recruit and retain qualified medical personnel, or to control our labor costs, could have a material adverse effect on our business, financial position, results of operations, and cash flows.
We are a defendant in various lawsuits, and may be subject to liability under
qui tam
cases, the outcome of which could have a material adverse effect on us.
We operate in a highly regulated and litigious industry. As a result, various lawsuits, claims, and legal and regulatory proceedings have been and can be expected to be instituted or asserted against us. We are a defendant in a number of lawsuits. The material lawsuits and investigations, including the subpoenas received from HHS-OIG, are discussed in
Note 18,
Contingencies and Other Commitments
, to the accompanying consolidated financial statements. Substantial damages, fines, or other remedies assessed against us or agreed to in settlements could have a material adverse effect on our business, financial
19
position, results of operations, and cash flows. Additionally, the costs of defending litigation and investigations, even if frivolous or nonmeritorious, could be significant.
We insure a substantial portion of our professional liability, general liability, and workers’ compensation liability risks through our captive insurance subsidiary, as discussed further in
Note 9,
Self-Insured Risks
, to the accompanying consolidated financial statements. Changes in the number of these liability claims and the cost to resolve them impact the reserves for these risks. A variance between our estimated and actual number of claims or average cost per claim could have a material impact, either favorable or unfavorable, on the adequacy of the reserves for these liability risks, which could have an effect on our financial position and results of operations.
The proper function, availability, and security of our information systems are critical to our business.
We are dependent on the proper function, availability and security of our information systems, including our new electronic clinical information system which plays a substantial role in the operations of the hospitals in which it is installed. We undertake substantial measures to protect the safety and security of our information systems and the data maintained within those systems, and we regularly test the adequacy of our security and disaster recovery measures. We have installed privacy protection systems and devices on our network and electronic devices in an attempt to prevent unauthorized access to that data, which includes patient information subject to the protections of the Health Insurance Portability and Accountability Act of 1996 and the Health Information Technology for Economic and Clinical Health Act. For additional discussion of these laws, see Item 1,
Business
, “Regulation.” As part of our efforts, we may be required to expend significant capital to protect against the threat of security breaches or to alleviate problems caused by breaches, including unauthorized access to patient data and personally identifiable information stored in our information systems and the introduction of computer malware to our systems. However, there can be no assurance our safety and security measures or our disaster recovery plan will detect and prevent security breaches in a timely manner or otherwise prevent damage or interruption of our systems and operations. We may be vulnerable to losses associated with the improper functioning, security breach or unavailability of our information systems. We may be held liable to our patients and regulators, which could result in fines, litigation, or negative publicity. Failure to maintain proper function, security, or availability of our information systems could have a material adverse effect on our business, financial position, results of operations, and cash flows.
Our electronic clinical information system (the “CIS”) is subject to a licensing, implementation, technology hosting, and support agreement with Cerner Corporation. In June 2011, we entered into an agreement with Cerner to begin a company-wide implementation of this system in 2012. As of December 31, 2013, we had installed the CIS in
36
hospitals with another
20
installations scheduled for
2014
. We expect to complete installation in our existing hospitals by the end of
2017
. Our inability, or the inability of Cerner, to continue to maintain and upgrade our information systems, software, and hardware could disrupt or reduce the efficiency of our operations. In addition, costs, unexpected problems, and interruptions associated with the implementation or transition to new systems or technology or with adequate support of those systems or technology across multiple hospitals could have a material adverse effect on our business, financial position, results of operations, and cash flows.
Successful execution of our current business plan depends on our key personnel.
The success of our current business plan depends in large part upon the leadership and performance of our executive management team and key employees and our ability to retain and motivate these individuals. We rely upon their ability, expertise, judgment, discretion, integrity and good faith. There can be no assurance that we will retain our key executives and employees or that we can attract or retain other highly qualified individuals in the future. If we lose key personnel, we may be unable to replace them with personnel of comparable experience in, or knowledge of, the healthcare provider industry or our specific post-acute segment. The loss of the services of any of these individuals could prevent us from successfully executing our business plan and could have a material adverse affect on our business and results of operations.
Our leverage or level of indebtedness may have negative consequences for our business, and we may incur additional indebtedness in the future.
Although we have reduced our outstanding long-term debt substantially in recent years, we still had approximately
$1.4 billion
of long-term debt outstanding (including that portion of long-term debt classified as current and excluding
$88.9 million
in capital leases) as of
December 31, 2013
. See
Note 8,
Long-term Debt
, to the accompanying consolidated financial statements. Subject to specified limitations, our credit agreement and the indentures governing our debt securities permit us and our subsidiaries to incur material additional debt. If new debt is added to our current debt levels, the risks described here could intensify.
20
Our indebtedness could have important consequences, including:
|
•
|
limiting our ability to borrow additional amounts to fund working capital, capital expenditures, acquisitions, debt service requirements, execution of our business strategy and other general corporate purposes;
|
|
•
|
making us more vulnerable to adverse changes in general economic, industry and competitive conditions, in government regulation and in our business by limiting our flexibility in planning for, and making it more difficult for us to react quickly to, changing conditions;
|
|
•
|
placing us at a competitive disadvantage compared with competing providers that have less debt; and
|
|
•
|
exposing us to risks inherent in interest rate fluctuations for outstanding amounts under our credit facility, which could result in higher interest expense in the event of increases in interest rates.
|
We are subject to contingent liabilities, prevailing economic conditions, and financial, business, and other factors beyond our control. Although we expect to make scheduled interest payments and principal reductions, we cannot provide assurance that changes in our business or other factors will not occur that may have the effect of preventing us from satisfying obligations under our debt instruments. If we are unable to generate sufficient cash flow from operations in the future to service our debt and meet our other needs, we may have to refinance all or a portion of our debt, obtain additional financing or reduce expenditures or sell assets we deem necessary to our business. We cannot provide assurance these measures would be possible or any additional financing could be obtained.
The restrictive covenants in our credit agreement and the indentures governing our senior notes could affect our ability to execute aspects of our business plan successfully.
The terms of our credit agreement and the indentures governing our senior notes do, and our future debt instruments may, contain various provisions that limit our ability and the ability of certain of our subsidiaries to, among other things:
|
•
|
incur or guarantee indebtedness;
|
|
•
|
pay dividends on, or redeem or repurchase, our capital stock; or repay, redeem or repurchase our subordinated obligations;
|
|
•
|
issue or sell certain types of preferred stock;
|
|
•
|
make investments;
|
|
•
|
incur obligations that restrict the ability of our subsidiaries to make dividends or other payments to us;
|
|
•
|
sell assets;
|
|
•
|
engage in transactions with affiliates;
|
|
•
|
create certain liens;
|
|
•
|
enter into sale/leaseback transactions; and
|
|
•
|
merge, consolidate, or transfer all or substantially all of our assets.
|
These covenants could adversely affect our ability to finance our future operations or capital needs and pursue available business opportunities. For additional discussion of our material debt covenants, see the “Liquidity and Capital Resources” section of Item 7,
Management Discussion and Analysis of Financial Condition and Results of Operations
, and
Note 8,
Long-term Debt
, to the accompanying consolidated financial statements.
In addition, our credit agreement requires us to maintain specified financial ratios and satisfy certain financial condition tests. See the “Liquidity and Capital Resources” section of Item 7,
Management Discussion and Analysis of Financial Condition and Results of Operations
, and
Note 8,
Long-term Debt
, to the accompanying consolidated financial statements. Although we remained in compliance with the financial ratios and financial condition tests as of December 31, 2013, we cannot provide assurance we will continue to do so. Events beyond our control, including changes in general economic and business conditions, may affect our ability to meet those financial ratios and financial condition tests. A severe downturn in earnings or, if we have outstanding borrowings under our credit facility at the time, a rapid increase in interest rates could impair our ability to comply with those financial ratios and financial condition tests and we may need to obtain waivers from the required
21
proportion of the lenders to avoid being in default. If we try to obtain a waiver or other relief from the required lenders, we may not be able to obtain it or such relief might have a material cost to us or be on terms less favorable than those in our existing debt. If a default occurs, the lenders could exercise their rights, including declaring all the funds borrowed (together with accrued and unpaid interest) to be immediately due and payable, terminating their commitments or instituting foreclosure proceedings against our assets, which, in turn, could cause the default and acceleration of the maturity of our other indebtedness. A breach of any other restrictive covenants contained in our credit agreement or the indentures governing our senior notes would also (after giving effect to applicable grace periods, if any) result in an event of default with the same outcome.
As of
December 31, 2013
, approximately
79%
of our consolidated
Property and equipment, net
held by HealthSouth Corporation and its guarantor subsidiaries was pledged to the lenders under our credit agreement. See
Note 8,
Long-term Debt
, and
Note 20,
Condensed Consolidating Financial Information
, to the accompanying consolidated financial statements, and Item 2,
Properties
.
Uncertainty in the capital markets could adversely affect our ability to carry out our development objectives.
The global and sovereign credit markets have experienced significant disruptions in recent years, and in 2013, the debt ceiling and federal budget disputes in the United States affected capital markets. Future market shocks could negatively affect the availability or terms of certain types of debt and equity financing, including access to revolving lines of credit. Future business needs combined with market conditions at the time may cause us to seek alternative sources of potentially less attractive financing and may require us to adjust our business plan accordingly. For example, tight credit markets, such as might result from further turmoil in the sovereign debt markets, would likely make additional financing more expensive and difficult to obtain. The inability to obtain additional financing at attractive rates or prices could have a material adverse effect on our financial performance or our growth opportunities.
As a result of credit market uncertainty, we also face potential exposure to counterparties who may be unable to adequately service our needs, including the ability of the lenders under our credit agreement to provide liquidity when needed. We monitor the financial strength of our depositories, creditors, and insurance carriers using publicly available information, as well as qualitative inputs.
We may not be able to fully utilize our net operating loss carryforwards.
As of
December 31, 2013
, we had an unused federal net operating loss carryforward (“NOL”) of approximately
$325 million
(approximately
$929 million
on a gross basis) and state NOLs of approximately
$91 million
. Such losses expire in various amounts at varying times through
2031
. Unless they expire, these NOLs may be used to offset future taxable income and thereby reduce our income taxes otherwise payable. While we believe we will be able to use a substantial portion of these tax benefits before they expire, no such assurances can be provided. For further discussion of our NOLs, see Item 7,
Management’s Discussion and Analysis of Financial Condition and Results of Operations
, and
Note 16,
Income Taxes
, to the accompanying consolidated financial statements.
As of
December 31, 2013
, we maintained a valuation allowance of approximately
$31 million
against our deferred tax assets. At the state jurisdiction level, based on the weight of the available evidence including our operating performance in recent years, the scheduled reversal of temporary differences, our forecast of taxable income in future periods in each applicable tax jurisdiction, our ability to sustain a core level of earnings, and the availability of prudent tax planning strategies, we determined it was necessary to maintain a valuation allowance due to uncertainties related to our ability to utilize a portion of our state NOLs before they expire. The amount of the valuation allowance has been determined for each tax jurisdiction based on the weight of all available evidence, as described above, including management’s estimates of taxable income for each jurisdiction in which we operate over the periods in which the related deferred tax assets will be recoverable.
If management’s expectations for future operating results on a consolidated basis or at the state jurisdiction level vary from actual results due to changes in healthcare regulations, general economic conditions, or other factors, we may need to increase our valuation allowance, or reverse amounts recorded currently in the valuation allowance, for all or a portion of our deferred tax assets. Similarly, future adjustments to our valuation allowance may be necessary if the timing of future tax deductions is different than currently expected. Our income tax expense in future periods will be reduced or increased to the extent of offsetting decreases or increases, respectively, in our valuation allowance in the period when the change in circumstances occurs. These changes could have a significant impact on our future earnings.
Section 382 of the Internal Revenue Code (“Section 382”) imposes an annual limit on the ability of a corporation that undergoes an “ownership change” to use its NOLs to reduce its tax liability. An “ownership change” is generally defined as any change in ownership of more than 50% of a corporation’s “stock” by its “5-percent shareholders” (as defined in Section 382)
22
over a rolling three-year period based upon each of those shareholder’s lowest percentage of stock owned during such period. It is possible that future transactions, not all of which would be within our control, could cause us to undergo an ownership change as defined in Section 382. In that event, we would not be able to use our pre-ownership-change NOLs in excess of the limitation imposed by Section 382. At this time, we do not believe these limitations will affect our ability to use any NOLs before they expire. However, no such assurances can be provided. If we are unable to fully utilize our NOLs to offset taxable income generated in the future, our results of operations and cash flows could be materially and negatively impacted. Additionally, the imposition of an annual limit could result in it taking longer to utilize our NOLs, which would adversely affect the present value of those tax assets.
|
Item 1B.
|
Unresolved Staff Comments
|
None.
|
Item 2.
|
Properties
|
We maintain our principal executive office at 3660 Grandview Parkway, Birmingham, Alabama. We occupy those office premises under a long-term lease which expires in 2018 and includes options for us, at our discretion, to renew the lease for up to ten years in total beyond that date.
In addition to our principal executive office, as of
December 31, 2013
, we leased or owned through various consolidated entities 125 business locations to support our operations. Our hospital leases, which represent the largest portion of our rent expense, customarily have initial terms of 10 to 30 years. Most of our leases contain one or more options to extend the lease period for five additional years for each option. Our consolidated entities are generally responsible for property taxes, property and casualty insurance, and routine maintenance expenses, particularly in our leased hospitals. Other than our principal executive offices, no other individual property is materially important.
23
The following table sets forth information regarding our hospital properties (excluding the
two
hospitals that have
151
licensed beds and operate as joint ventures which we account for using the equity method of accounting) as of
December 31, 2013
:
|
|
|
Number of Hospitals
|
|||||||||||||
|
State
|
Licensed Beds
|
Building and Land Owned
|
Building Owned and Land Leased
|
Building and Land Leased
|
Total
|
||||||||||
|
Alabama *
|
383
|
|
1
|
|
3
|
|
2
|
|
6
|
|
|||||
|
Arizona
|
335
|
|
1
|
|
1
|
|
3
|
|
5
|
|
|||||
|
Arkansas
|
267
|
|
2
|
|
1
|
|
1
|
|
4
|
|
|||||
|
California
|
114
|
|
1
|
|
—
|
|
1
|
|
2
|
|
|||||
|
Colorado
|
104
|
|
1
|
|
—
|
|
1
|
|
2
|
|
|||||
|
Florida *
|
827
|
|
8
|
|
1
|
|
2
|
|
11
|
|
|||||
|
Georgia*
|
58
|
|
1
|
|
(1)
|
—
|
|
—
|
|
1
|
|
||||
|
Illinois *
|
55
|
|
—
|
|
1
|
|
—
|
|
1
|
|
|||||
|
Indiana
|
85
|
|
—
|
|
—
|
|
1
|
|
1
|
|
|||||
|
Kansas
|
242
|
|
1
|
|
—
|
|
2
|
|
3
|
|
|||||
|
Kentucky *
|
80
|
|
1
|
|
1
|
|
—
|
|
2
|
|
|||||
|
Louisiana
|
47
|
|
1
|
|
—
|
|
—
|
|
1
|
|
|||||
|
Maine *
|
100
|
|
—
|
|
—
|
|
1
|
|
1
|
|
|||||
|
Maryland *
|
54
|
|
1
|
|
—
|
|
—
|
|
1
|
|
|||||
|
Massachusetts *
|
53
|
|
1
|
|
—
|
|
—
|
|
1
|
|
|||||
|
Missouri*
|
156
|
|
—
|
|
2
|
|
—
|
|
2
|
|
|||||
|
Nevada
|
219
|
|
2
|
|
—
|
|
1
|
|
3
|
|
|||||
|
New Hampshire *
|
50
|
|
—
|
|
1
|
|
—
|
|
1
|
|
|||||
|
New Jersey *
|
199
|
|
1
|
|
1
|
|
1
|
|
3
|
|
|||||
|
New Mexico
|
87
|
|
1
|
|
—
|
|
—
|
|
1
|
|
|||||
|
Ohio
|
60
|
|
—
|
|
—
|
|
1
|
|
1
|
|
|||||
|
Pennsylvania
|
774
|
|
5
|
|
—
|
|
4
|
|
9
|
|
|||||
|
Puerto Rico*
|
72
|
|
—
|
|
—
|
|
2
|
|
2
|
|
|||||
|
South Carolina *
|
338
|
|
1
|
|
4
|
|
—
|
|
5
|
|
|||||
|
Tennessee *
|
380
|
|
3
|
|
3
|
|
—
|
|
6
|
|
|||||
|
Texas
|
1,063
|
|
11
|
|
2
|
|
2
|
|
15
|
|
|||||
|
Utah
|
84
|
|
1
|
|
—
|
|
—
|
|
1
|
|
|||||
|
Virginia *
|
271
|
|
2
|
|
1
|
|
3
|
|
6
|
|
|||||
|
West Virginia *
|
268
|
|
1
|
|
3
|
|
—
|
|
4
|
|
|||||
|
|
6,825
|
|
48
|
|
25
|
|
28
|
|
101
|
|
|||||
* Certificate of need state or U.S. territory
|
(1)
|
Walton Rehabilitation Hospital, a 58-bed inpatient rehabilitation hospital in Augusta, Georgia, is a party to an industrial development bond financing that reduces
ad valorem
taxes payable by the hospital. In connection with this financing, title to the real property is held by the Development Authority of Richmond County. We lease the hospital property and hold the bonds issued by the Authority, the payment on which equals the amount payable under the lease. We may terminate the bond financing and the associated lease at any time at our option without penalty, and fee title to the hospital property will return to us.
|
Our obligations under our existing credit agreement are secured by substantially all of (1) the real property owned by us and our subsidiary guarantors as of August 10, 2012, the date of that agreement, and (2) the current and future personal
24
property owned by us and our subsidiary guarantors. We and the subsidiary guarantors entered into mortgages with respect to most of our material real property that we owned as of August 10, 2012 (excluding real property subject to preexisting liens and/or mortgages) to secure our obligations under the credit agreement. For additional information about our credit agreement, see
Note 8,
Long-term Debt
, to the accompanying consolidated financial statements.
Our principal executive office, hospitals, and other properties are suitable for their respective uses and are, in all material respects, adequate for our present needs. Information regarding the utilization of our licensed beds and other operating statistics can be found in Item 7,
Management’s Discussion and Analysis of Financial Condition and Results of Operations.
|
Item 3.
|
Legal Proceedings
|
Information relating to certain legal proceedings in which we are involved is included in
Note 18,
Contingencies and Other Commitments
, to the accompanying consolidated financial statements, which is incorporated herein by reference.
|
Item 4.
|
Mine Safety Disclosures
|
Not applicable.
25
|
Item 5.
|
Market for Registrant’s Common Equity, Related Stockholder Matters and Issuer Purchases of Equity Securities
|
Market Information
Shares of our common stock trade on the New York Stock Exchange under the ticker symbol “HLS.” The following table sets forth the high and low sales prices per share for our common stock as reported on the NYSE from January 1,
2012
through
December 31, 2013
.
|
|
High
|
Low
|
|||||
|
2012
|
|
|
|||||
|
First Quarter
|
$
|
21.53
|
|
$
|
16.55
|
|
|
|
Second Quarter
|
23.35
|
|
18.44
|
|
|||
|
Third Quarter
|
24.99
|
|
20.99
|
|
|||
|
Fourth Quarter
|
24.39
|
|
19.85
|
|
|||
|
2013
|
|
|
|
|
|||
|
First Quarter
|
$
|
26.40
|
|
$
|
21.53
|
|
|
|
Second Quarter
|
30.95
|
|
25.07
|
|
|||
|
Third Quarter
|
36.52
|
|
28.70
|
|
|||
|
Fourth Quarter
|
37.01
|
|
32.97
|
|
|||
Holders
As of
February 13, 2014
, there were
88,000,335
shares of HealthSouth common stock issued and outstanding, net of treasury shares, held by approximately
9,387
holders of record.
Dividends
On July 25, 2013, our board of directors approved the initiation of a quarterly cash dividend on our common stock of $0.18 per share. The first quarterly dividend has been declared and was paid on October 15, 2013 to stockholders of record as of the close of business on October 1, 2013. On January 15, 2014, we paid a cash dividend on our common stock of $0.18 per share to stockholders of record as of the close of business on January 2, 2014. We expect quarterly dividends to be paid in January, April, July, and October. However, the actual declaration of any future cash dividends, and the setting of record and payment dates, will be at the discretion of our board each quarter after consideration of various factors, including our capital position and the best interests of our stockholders.
The terms of our credit agreement (see
Note 8,
Long-term Debt
,
to the accompanying consolidated financial statements) allow us to declare and pay cash dividends on our common stock so long as: (1) we are not in default under our credit agreement and (2) our senior secured leverage ratio remains less than or equal to 1.5x.
Our preferred stock generally provides for the payment of cash dividends subject to certain limitations. See
Note 10,
Convertible Perpetual Preferred Stock
, to the accompanying consolidated financial statements. Our credit agreement does not limit the payment of dividends on the preferred stock.
Recent Sales of Unregistered Securities
We originally issued 10,000,000 warrants on January 16, 2004, in a private transaction exempt from registration pursuant to Section 4(2) of the Securities Act of 1933, as amended. These warrants were originally exercisable on a one-for-one basis into shares of our common stock. Following our one-for-five reverse stock split in October 2006, these warrants were exercisable for 2.0 million shares of our common stock at an exercise price of $32.50.
From November 1, 2013 through December 23, 2013, holders exercised 7.1 million warrants by means of cash and cashless exercises resulting in our issuance of 0.5 million shares of our common stock and the receipt of $15.3 million in cash proceeds.
26
The payment in January 2014 of an $0.18 per share dividend on our common stock triggered the antidilutive adjustment for these warrants. As of January 3, 2014, the resulting exercise price of each warrant was $32.16, and the resulting exercise rate was 0.2021 for each warrant. In January 2014, holders exercised 2.8 million warrants by means of cash and cashless exercises resulting in the issuance of 0.2 million shares of our common stock and the receipt of $6.3 million in cash proceeds. The remaining warrants expired on January 16, 2014.
Securities Authorized for Issuance Under Equity Compensation Plans
The information required by Item 201(d) of Regulation S-K is provided under Item 12,
Security Ownership of Certain Beneficial Owners and Management and Related Stockholder Matters
, “Equity Compensation Plans,” and incorporated here by reference.
Purchases of Equity Securities
The following table summarizes our repurchases of equity securities during the three months ended
December 31, 2013
:
|
Period
|
Total Number of Shares (or Units) Purchased
|
Average Price Paid per Share (or Unit) ($)
|
Total Number of Shares Purchased as Part of Publicly Announced Plans or Programs
|
Maximum Number (or Approximate Dollar Value) of Shares That May Yet Be Purchased Under the Plans or Programs
(1)
|
||||||||||
|
October 1 through October 31, 2013
|
1,842
|
|
(2)
|
$
|
35.51
|
|
—
|
|
$
|
200,000,000
|
|
|||
|
November 1 through November 30, 2013
|
—
|
|
—
|
|
—
|
|
200,000,000
|
|
||||||
|
December 1 through December 31, 2013
|
—
|
|
—
|
|
—
|
|
200,000,000
|
|
||||||
|
Total
|
1,842
|
|
35.51
|
|
—
|
|
||||||||
|
(1)
|
On October 28, 2013, we announced our board of directors authorized the repurchase of up to $200 million of our common stock. On February 14, 2014, our board of directors approved an increase in this common stock repurchase authorization from $200 million to $250 million. The repurchase authorization does not require the repurchase of a specific number of shares, has an indefinite term, and is subject to termination at any time by our board of directors. Subject to certain terms and conditions, including a maximum price per share and compliance with federal and state securities and other laws, the repurchases may be made from time to time in open market transactions, privately negotiated transactions, or other transactions, including trades under a plan established in accordance with Rule 10b5-1 under the Securities Exchange Act of 1934, as amended.
|
|
(2)
|
These shares were purchased pursuant to previous elections by one or more members of our board of directors to participate in our Directors’ Deferred Stock Investment Plan. This plan is a nonqualified deferral plan allowing nonemployee directors to make advance elections to defer a fixed percentage of their director fees. The plan administrator acquires the shares in the open market which are then held in a rabbi trust. The plan provides that dividends paid on the shares held for the accounts of the directors will be reinvested in shares of our common stock which will also be held in the trust. The directors’ rights to all shares in the trust are nonforfeitable, but the shares are only released to the directors after departure from our board.
|
On November 18, 2013, we exchanged $320 million in aggregate principal amount of newly issued 2.00% Convertible Senior Subordinated Notes due 2043 for 257,110 shares of our outstanding 6.50% Series A Convertible Perpetual Preferred Stock, par value $0.10 per share and liquidation preference $1,000 per share, leaving 96,245 shares of the preferred stock outstanding. See
Note 8,
Long-term Debt
and
Note 10,
Convertible Perpetual Preferred Stock
, to the accompanying consolidated financial statements.
Company Stock Performance
Set forth below is a line graph comparing the total returns of our common stock, the Standard & Poor’s 500 Index (“S&P 500”), and the S&P Health Care Services Select Industry Index (“SPSIHP”), an equal-weighted index of at least 22 companies in healthcare services that are also part of the S&P Total Market Index and subject to float-adjusted market
27
capitalization and liquidity requirements. Our compensation committee has in prior years used the SPSIHP as a benchmark for a portion of the awards under our long-term incentive program. The graph assumes $100 invested on December 31,
2008
in our common stock and each of the indices. The returns below assume reinvestment of dividends paid on the related common stock, including for us the $0.18 per share quarterly cash dividend. Our first quarterly cash dividend on our common stock was declared in July 2013 and paid in October 2013.
The information contained in the performance graph shall not be deemed “soliciting material” or to be “filed” with the SEC nor shall such information be deemed incorporated by reference into any future filing under the Securities Act of 1933 or the Securities Exchange Act of 1934, except to the extent we specifically incorporate it by reference into such filing.
The comparisons in the graph below are based upon historical data and are not indicative of, nor intended to forecast, future performance of HealthSouth’s common stock. Research Data Group, Inc. provided us with the data for the indices presented below. We assume no responsibility for the accuracy of the indices’ data, but we are not aware of any reason to doubt its accuracy.
COMPARISON OF 5 YEAR CUMULATIVE TOTAL RETURN
Among HealthSouth Corporation, the S&P 500 Index, and the S&P Health Care Services Index
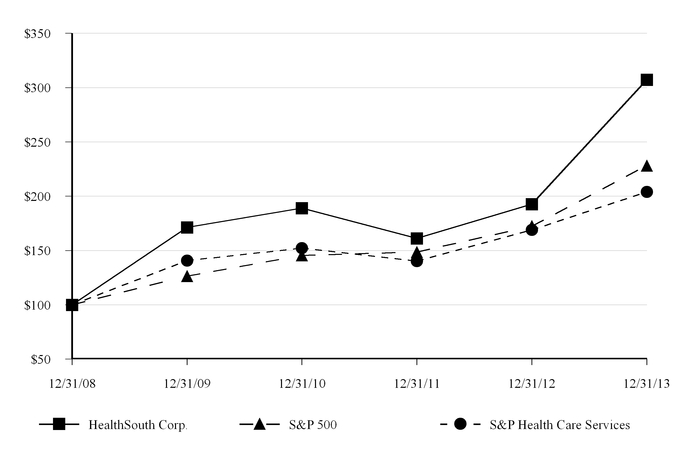
|
|
For the Year Ended December 31,
|
|||||||||||||||||
|
|
Base Period
|
Cumulative Total Return
|
||||||||||||||||
|
Company/Index Name
|
2008
|
2009
|
2010
|
2011
|
2012
|
2013
|
||||||||||||
|
HealthSouth
|
100.00
|
|
171.26
|
|
188.96
|
|
161.22
|
|
192.61
|
|
307.27
|
|
||||||
|
Standard & Poor’s 500 Index
|
100.00
|
|
126.46
|
|
145.51
|
|
148.59
|
|
172.37
|
|
228.19
|
|
||||||
|
S&P Health Care Services Select Industry Index
|
100.00
|
|
140.72
|
|
152.17
|
|
140.36
|
|
168.96
|
|
203.95
|
|
||||||
28
|
Item 6.
|
Selected Financial Data
|
We derived the selected historical consolidated financial data presented below for the years ended December 31,
2013
,
2012
, and
2011
from our audited consolidated financial statements and related notes included elsewhere in this filing. We derived the selected historical consolidated financial data presented below for the years ended December 31,
2010
and
2009
, as adjusted for discontinued operations and the reclassifications discussed in
Note 1,
Summary of Significant Accounting Policies
, to the accompanying consolidated financial statements, from our consolidated financial statements and related notes included in our Form 10-K for the year ended December 31,
2010
. You should refer to Item 7,
Management’s Discussion and Analysis of Financial Condition and Results of Operations,
and the notes to the accompanying consolidated financial statements for additional information regarding the financial data presented below, including matters that might cause this data not to be indicative of our future financial position or results of operations.
|
|
For the Year Ended December 31,
|
||||||||||||||||||
|
|
2013
|
2012
|
2011
|
2010
|
2009
|
||||||||||||||
|
|
(In Millions, Except per Share Data)
|
||||||||||||||||||
|
Statement of Operations Data:
|
|
|
|
|
|
||||||||||||||
|
Net operating revenues
|
$
|
2,273.2
|
|
$
|
2,161.9
|
|
$
|
2,026.9
|
|
$
|
1,877.6
|
|
$
|
1,784.9
|
|
||||
|
Operating earnings
(1)
|
435.7
|
|
378.7
|
|
351.4
|
|
295.9
|
|
228.7
|
|
|||||||||
|
Provision for income tax expense (benefit)
(2)
|
12.7
|
|
108.6
|
|
37.1
|
|
(740.8
|
)
|
(2.9
|
)
|
|||||||||
|
Income from continuing operations
|
382.5
|
|
231.4
|
|
205.8
|
|
930.7
|
|
110.4
|
|
|||||||||
|
(Loss) income from discontinued operations, net of tax
(3)
|
(1.1
|
)
|
4.5
|
|
48.8
|
|
9.1
|
|
18.4
|
|
|||||||||
|
Net income
|
381.4
|
|
235.9
|
|
254.6
|
|
939.8
|
|
128.8
|
|
|||||||||
|
Less: Net income attributable to noncontrolling interests
|
(57.8
|
)
|
(50.9
|
)
|
(45.9
|
)
|
(40.8
|
)
|
(34.0
|
)
|
|||||||||
|
Net income attributable to HealthSouth
|
323.6
|
|
185.0
|
|
208.7
|
|
899.0
|
|
94.8
|
|
|||||||||
|
Less: Convertible perpetual preferred stock dividends
|
(21.0
|
)
|
(23.9
|
)
|
(26.0
|
)
|
(26.0
|
)
|
(26.0
|
)
|
|||||||||
|
Less: Repurchase of convertible perpetual preferred stock
(4)
|
(71.6
|
)
|
(0.8
|
)
|
—
|
|
—
|
|
—
|
|
|||||||||
|
Net income attributable to HealthSouth common shareholders
|
$
|
231.0
|
|
$
|
160.3
|
|
$
|
182.7
|
|
$
|
873.0
|
|
$
|
68.8
|
|
||||
|
Weighted average common shares outstanding:
(5)
|
|
|
|
|
|
|
|
|
|
|
|||||||||
|
Basic
|
88.1
|
|
94.6
|
|
93.3
|
|
92.8
|
|
88.8
|
|
|||||||||
|
Diluted
|
102.1
|
|
108.1
|
|
109.2
|
|
108.5
|
|
103.3
|
|
|||||||||
|
Earnings per common share:
|
|
|
|
|
|
|
|
|
|
|
|||||||||
|
Basic earnings per share attributable to HealthSouth common shareholders:
(6)
|
|
|
|
|
|
|
|
|
|
|
|||||||||
|
Continuing operations
|
$
|
2.59
|
|
$
|
1.62
|
|
$
|
1.39
|
|
$
|
9.20
|
|
$
|
0.57
|
|
||||
|
Discontinued operations
|
(0.01
|
)
|
0.05
|
|
0.52
|
|
0.10
|
|
0.20
|
|
|||||||||
|
Net income
|
$
|
2.58
|
|
$
|
1.67
|
|
$
|
1.91
|
|
$
|
9.30
|
|
$
|
0.77
|
|
||||
|
Diluted earnings per share attributable to HealthSouth common shareholders:
|
|
|
|
|
|
|
|
|
|
|
|||||||||
|
Continuing operations
|
$
|
2.59
|
|
$
|
1.62
|
|
$
|
1.39
|
|
$
|
8.20
|
|
$
|
0.57
|
|
||||
|
Discontinued operations
|
(0.01
|
)
|
0.05
|
|
0.52
|
|
0.08
|
|
0.20
|
|
|||||||||
|
Net income
|
$
|
2.58
|
|
$
|
1.67
|
|
$
|
1.91
|
|
$
|
8.28
|
|
$
|
0.77
|
|
||||
|
Cash dividends per common share
(7)
|
$
|
0.36
|
|
$
|
—
|
|
$
|
—
|
|
$
|
—
|
|
$
|
—
|
|
||||
|
Amounts attributable to HealthSouth:
|
|
|
|
|
|
|
|
|
|
|
|||||||||
|
Income from continuing operations
|
$
|
324.7
|
|
$
|
180.5
|
|
$
|
158.8
|
|
$
|
889.8
|
|
$
|
77.1
|
|
||||
|
(Loss) income from discontinued operations, net of tax
|
(1.1
|
)
|
4.5
|
|
49.9
|
|
9.2
|
|
17.7
|
|
|||||||||
|
Net income attributable to HealthSouth
|
$
|
323.6
|
|
$
|
185.0
|
|
$
|
208.7
|
|
$
|
899.0
|
|
$
|
94.8
|
|
||||
29
|
|
As of December 31,
|
||||||||||||||||||
|
|
2013
|
2012
|
2011
|
2010
|
2009
|
||||||||||||||
|
|
(In Millions)
|
||||||||||||||||||
|
Balance Sheet Data:
|
|
|
|
|
|
||||||||||||||
|
Working capital
|
$
|
268.8
|
|
$
|
335.9
|
|
$
|
178.4
|
|
$
|
111.0
|
|
$
|
34.8
|
|
||||
|
Total assets
|
2,534.4
|
|
2,424.2
|
|
2,271.6
|
|
2,372.5
|
|
1,681.5
|
|
|||||||||
|
Long-term debt, including current portion
(4)
|
1,517.5
|
|
1,253.5
|
|
1,254.7
|
|
1,511.3
|
|
1,662.5
|
|
|||||||||
|
Convertible perpetual preferred stock
(4)
|
93.2
|
|
342.2
|
|
387.4
|
|
387.4
|
|
387.4
|
|
|||||||||
|
HealthSouth shareholders’ equity (deficit)
|
344.6
|
|
291.0
|
|
116.4
|
|
(85.8
|
)
|
(972.9
|
)
|
|||||||||
|
(1)
|
We define operating earnings as income from continuing operations attributable to HealthSouth before (1) loss on early extinguishment of debt; (2) interest expense and amortization of debt discounts and fees; (3) other income; (4) loss on interest rate swaps; and (5) income tax expense or benefit.
|
|
(2)
|
For information related to our
Provision for income tax expense (benefit),
see Item 7,
Management’s Discussion and Analysis of Financial Condition and Results of Operations
, and
Note 16,
Income Taxes
, to the accompanying consolidated financial statements. During the second quarter of 2013, we entered into closing agreements with the IRS that settled federal income tax matters related to the previous restatement of our 2000 and 2001 financial statements, as well as certain other tax matters, through December 31, 2008 and recorded a net income tax benefit of approximately $115 million. During the fourth quarter of 2010, we determined it is more likely than not a substantial portion of our deferred tax assets will be realized in the future and decreased our valuation allowance by $825.4 million through our
Provision for income tax benefit
in our consolidated statement of operations.
|
|
(3)
|
Income from discontinued operations, net of tax
in 2011 included post-tax gains from the sale of five of our long-term acute care hospitals and a settlement related to a previously disclosed audit of unclaimed property. See
Note 15,
Assets and Liabilities in and Results of Discontinued Operations
, to the accompanying consolidated financial statements.
|
|
(4)
|
During the fourth quarter of 2013, we exchanged $320 million in aggregate principal amount of newly issued 2.00% Convertible Senior Subordinated Notes due 2043 for 257,110 shares of our outstanding 6.50% Series A Convertible Perpetual Preferred Stock. See
Note 8,
Long-term Debt
and
Note 10,
Convertible Perpetual Preferred Stock
, to the accompanying consolidated financial statements.
|
|
(5)
|
In the first quarter of 2013, we completed a tender offer for our common stock whereby we repurchased approximately 9.1 million shares. See
Note 17,
Earnings per Common Share
, to the accompanying consolidated financial statements.
|
|
(6)
|
Previously, we reported basic earnings per share of $9.41 and $0.77 for the years ended 2010 and 2009, respectively. In conjunction with the initiation of quarterly cash dividends in the third quarter of 2013, we revised our calculation to present earnings per share using the two-class method. See
Note 17,
Earnings per Common Share
, to the accompanying consolidated financial statements.
|
|
(7)
|
During the third quarter of 2013, our board of directors approved the initiation of a quarterly cash dividend on our common stock of $0.18 per share. See
Note 17,
Earnings per Common Share
, to the accompanying consolidated financial statements.
|
|
Item 7.
|
Management’s Discussion and Analysis of Financial Condition and Results of Operations
|
The following Management’s Discussion and Analysis of Financial Condition and Results of Operations (“MD&A”) should be read in conjunction with the accompanying consolidated financial statements and related notes. This MD&A is designed to provide the reader with information that will assist in understanding our consolidated financial statements, the changes in certain key items in those financial statements from year to year, and the primary factors that accounted for those changes, as well as how certain accounting principles affect our consolidated financial statements. See “Cautionary Statement Regarding Forward-Looking Statements” on page ii of this report for a description of important factors that could cause actual results to differ from expected results. See also Item 1A,
Risk Factors
.
30
Executive Overview
Our Business
We are the nation’s largest owner and operator of inpatient rehabilitation hospitals in terms of patients treated and discharged, revenues, and number of hospitals. While our national network of inpatient hospitals stretches across
28
states and Puerto Rico, our inpatient hospitals are concentrated in the eastern half of the United States and Texas. As of December 31,
2013
, we operated
103
inpatient rehabilitation hospitals (including
two
hospitals that operate as joint ventures which we account for using the equity method of accounting),
20
outpatient rehabilitation satellite clinics (operated by our hospitals), and
25
licensed, hospital-based home health agencies. In addition to HealthSouth hospitals, we manage
three
inpatient rehabilitation units through management contracts. For additional information about our business, see Item 1,
Business
.
2013 Overview
Our 2013 strategy focused on the following priorities:
|
•
|
continuing to provide high-quality, cost-effective care to patients in our existing markets;
|
|
•
|
achieving organic growth at our existing hospitals;
|
|
•
|
continuing to expand our services to more patients who require inpatient rehabilitative services by constructing and opportunistically acquiring new hospitals in new markets; and
|
|
•
|
considering additional shareholder value-enhancing strategies such as repurchases of our common and preferred stock and common stock dividends, recognizing that some of these actions may increase our leverage ratio.
|
During 2013, discharge growth of
5.0%
coupled with a
0.9%
increase in net patient revenue per discharge generated
5.9%
growth in net patient revenue from our hospitals compared to 2012. Discharge growth was comprised of
2.5%
growth from new stores and a
2.5%
increase in same-store discharges. Our quality and outcome measures, as reported through the Uniform Data System for Medical Rehabilitation (the “UDS”), remained well above the average for hospitals included in the UDS database, and they did so while we continued to increase our market share throughout 2013. Not only did our hospitals treat more patients and enhance outcomes, they did so in a highly cost-effective manner. As evidenced by the decrease in our
Total operating expenses
as a percentage of
Net operating revenues
, we also achieved incremental efficiencies in our cost structure. See the “Results of Operations” section of this Item.
Likewise, our growth efforts continued to yield positive results in 2013. Specifically, we:
|
•
|
acquired Walton Rehabilitation Hospital, a 58-bed inpatient rehabilitation hospital in Augusta, Georgia, in April 2013;
|
|
•
|
began accepting patients at our newly built, 40-bed inpatient rehabilitation hospital in Littleton, Colorado in May 2013;
|
|
•
|
began accepting patients at our newly built, 34-bed inpatient rehabilitation hospital in Stuart, Florida in June 2013. This hospital is a joint venture with Martin Health System;
|
|
•
|
completed the relocation of HealthSouth Rehabilitation Hospital of Western Massachusetts in Ludlow, Massachusetts to a newly built, 53-bed inpatient rehabilitation hospital, which replaced a leased facility;
|
|
•
|
added
68
beds to existing hospitals; and
|
31
•
continued development of the following de novo hospitals:
|
Location
|
# of Beds
|
Actual / Expected Construction Start Date
|
Expected Operational Date
|
|
Altamonte Springs, Florida
|
50
|
Q4 2013
|
Q4 2014
|
|
Newnan, Georgia
|
50
|
Q4 2013
|
Q4 2014
|
|
Middletown, Delaware
|
34
|
Q4 2013
|
Q4 2014
|
|
Modesto, California
|
50
|
Second Half - 2014
|
Q4 2015
|
|
Franklin, Tennessee*
|
40
|
TBD
|
TBD
|
*A certificate of need has been awarded, but it is currently under appeal.
In 2013, we followed through on our announced intention to implement additional shareholder value-enhancing strategies. Namely, we:
|
•
|
completed a tender offer for our common stock in March 2013. As a result of the tender offer, we repurchased approximately 9.1 million shares at a price of $25.50 per share for a total cost of $234.1 million, including fees and expenses relating to the tender offer;
|
|
•
|
initiated a quarterly cash dividend of $0.18 per share on our common stock. The first quarterly dividend was declared in July 2013 and paid in October 2013; and
|
|
•
|
received authorization from our board of directors in October 2013 for the repurchase of up to an additional $200 million of our common stock.
|
While implementing those shareholder value-enhancing strategies, we took additional steps to increase the strength and flexibility of our balance sheet:
|
•
|
entered into closing agreements with the IRS that settled federal income tax matters related to the previous restatement of our 2000 and 2001 financial statements, as well as certain other tax matters, through December 31, 2008. As a result of these closing agreements, we increased our deferred tax assets, primarily our federal net operating loss carryforward (“NOL”), and recorded a net income tax benefit of approximately $115 million in the second quarter of 2013. This income tax benefit primarily resulted from an approximate $283 million increase to our federal NOL on a gross basis;
|
|
•
|
amended our credit agreement during the second quarter of 2013 to, among other things, permit unlimited restricted payments so long as the senior secured leverage ratio remains less than or equal to 1.5x and extend the revolver maturity from August 2017 to June 2018;
|
|
•
|
purchased the real estate previously subject to leases associated with four of our hospitals for approximately $70 million during the third quarter of 2013;
|
|
•
|
redeemed $30.2 million and $27.9 million of the outstanding principal amount of our existing 7.25% Senior Notes due 2018 and 7.75% Senior Notes due 2022, respectively, in November 2013; and
|
|
•
|
exchanged $320 million in aggregate principal amount of newly issued 2.00% Convertible Senior Subordinated Notes due 2043 for 257,110 shares of our outstanding 6.50% Series A Convertible Perpetual Preferred Stock, leaving 96,245 shares of the preferred stock outstanding, in November 2013.
|
See the “Liquidity and Capital Resources” section of this Item and
Note 8,
Long-term Debt
, and
Note 16,
Income Taxes
, to the accompanying consolidated financial statements.
Business Outlook
We believe our business outlook remains reasonably positive for two primary reasons. First, demographic trends, specifically the aging of the population, will increase long-term demand for inpatient rehabilitative services. While we treat patients of all ages, most of our patients are persons 65 and older (the average age of a HealthSouth patient is 72 years) and have conditions such as strokes, hip fractures, and a variety of debilitating neurological conditions that are generally nondiscretionary in nature. We believe the demand for inpatient rehabilitative healthcare services will continue to increase as
32
the U.S. population ages and life expectancies increase. The number of Medicare-eligible patients is expected to grow approximately
3%
per year for the foreseeable future, creating an attractive market.
Second, we are the industry leader in this growing sector. As the nation’s largest owner and operator of inpatient rehabilitation hospitals, we believe we differentiate ourselves from our competitors based on our broad platform of clinical expertise, the quality of our clinical outcomes, the sustainability of best practices, our financial strength, and the application of rehabilitative technology. We have invested considerable resources into clinical and management systems and protocols that have allowed us to consistently contain cost growth. Our commitment to technology also includes the on-going implementation of our rehabilitation-specific electronic clinical information system. We believe this system will improve patient care and safety, enhance staff recruitment and retention, and set the stage for connectivity with referral sources and health information exchanges. Our hospitals also participate in The Joint Commission’s Disease-Specific Care Certification Program. Under this program, Joint Commission accredited organizations, like our hospitals, may seek certification for chronic diseases or conditions such as brain injury or stroke rehabilitation by complying with Joint Commission standards, effectively using evidence-based, clinical practice guidelines to manage and optimize patient care, and using an organized approach to performance measurement and evaluation of clinical outcomes. Obtaining such certifications demonstrates our commitment to excellence in providing disease-specific care. Currently, 96 of our hospitals hold one or more disease-specific certifications. We also account for approximately 80% of all Joint Commission disease-specific certifications in stroke nationwide.
We believe these factors align with our strengths in, and focus on, inpatient rehabilitative care. Unlike many of our competitors that may offer inpatient rehabilitation as one of many secondary services, inpatient rehabilitation is our core business. In addition, we believe we can address the demand for inpatient rehabilitative services in markets where we currently do not have a presence by constructing or acquiring new hospitals.
Longer-term, the nature and timing of the transformation of the current healthcare system to coordinated care delivery and payment models is uncertain and will likely remain so for some time. The development of new delivery and payment systems will almost certainly take significant time and expense. Many of the alternative approaches being explored may not work. As outlined in the “Key Challenges—Changes to Our Operating Environment Resulting from Healthcare Reform” section below, we are positioning the Company in a prudent manner to be responsive to industry shifts, whatever they might be.
Healthcare has always been a highly regulated industry, and we have cautioned our stakeholders that future Medicare payment rates could be at risk. While the Medicare reimbursement environment may be challenging, HealthSouth has a proven track record of adapting to and succeeding in a highly regulated environment, and we believe we are well-positioned to continue to succeed and grow. Further, we believe the regulatory and reimbursement risks discussed throughout this report may present us with opportunities to grow by acquiring or consolidating the operations of other inpatient rehabilitation providers in our highly fragmented industry. We have been disciplined in creating a capital structure that is flexible with no significant debt maturities prior to 2018. Over the past few years, we have redeemed our most expensive debt and reduced our interest expense. We have invested in our core business and created an infrastructure that enables us to provide high-quality care on a cost-effective basis. Our balance sheet remains strong. Our leverage ratio is within our target range, we have ample availability under our revolving credit facility, and we continue to generate strong cash flows from operations. Importantly, we have flexibility with how we choose to invest our cash and return value to shareholders, including bed additions, de novos, acquisitions of other inpatient rehabilitation hospitals, purchases of leased properties, repurchases of our common and preferred stock, common stock dividends, and repayment of long-term debt. Specifically, on February 14, 2014, our board of directors approved an increase in our existing common stock repurchase authorization from $200 million to $250 million. See the “Liquidity and Capital Resources - Authorizations for Returning Capital to Stakeholders” section of this Item.
For these and other reasons, we believe we will be able to adapt to changes in reimbursement and sustain our business model. We also believe we will be in a position to take action should an attractive acquisition or consolidation opportunity arise.
Key Challenges
Healthcare, including the inpatient rehabilitation sector, has always been a highly regulated industry. Currently, the industry is facing many well-publicized regulatory and reimbursement challenges. The industry is also facing uncertainty associated with the efforts, primarily arising from initiatives included in the 2010 Healthcare Reform Laws (as defined in Item 1,
Business
, “Regulatory and Reimbursement Challenges”) to identify and implement workable coordinated care delivery models. Successful healthcare providers are those who provide high-quality, cost-effective care and have the ability to adjust to changes in the regulatory and operating environments. We believe we have the necessary capabilities — scale, infrastructure, balance sheet, and management — to adapt to and succeed in a highly regulated industry, and we have a proven track record of doing so.
33
As we continue to execute our business plan, the following are some of the challenges we face:
|
•
|
Operating in a Highly Regulated Industry
. We are required to comply with extensive and complex laws and regulations at the federal, state, and local government levels. These rules and regulations have affected, or could in the future affect, our business activities by having an impact on the reimbursement we receive for services provided or the costs of compliance, mandating new documentation standards, requiring licensure or certification of our hospitals, regulating our relationships with physicians and other referral sources, regulating the use of our properties, and limiting our ability to enter new markets or add new beds to existing hospitals. Ensuring continuous compliance with these laws and regulations is an operating requirement for all healthcare providers.
|
As discussed in Item 1,
Business
, “Sources of Revenues,” the United States Centers for Medicare and Medicaid Services (“CMS”) has developed and instituted various Medicare audit programs under which CMS contracts with private companies to conduct claims and medical record audits. One type of audit contractor, the Recovery Audit Contractors (“RACs”), began post-payment audit processes in late 2009 for providers in general. In connection with CMS approved and announced RAC audits related to inpatient rehabilitation facilities (“IRFs”), we received requests in 2013 to review certain patient files for discharges occurring from 2010 to 2013. To date, the Medicare payments that are subject to these audit requests represent less than 1% of our Medicare patient discharges during those years, and not all of these patient file requests have resulted in payment denial determinations by the RACs. While we make provisions for these claims based on our historical experience and success rates in the claim adjudication process, we cannot provide assurance as to our future success in the resolution of these and future disputes, nor can we predict or estimate the scope or number of denials that ultimately may be reviewed. During 2013, we reduced our
Net operating revenues
by approximately $8 million for post-payment claims that are part of this review process.
Unlike the pre-payment denials of certain diagnosis codes by Medicare Administrative Contractors (“MACs”) that have been part of our operations for several years, we have not had any experience with RACs in the context of post-payment reviews of this nature. Along with our significant efforts through training and education to ensure compliance with coding and medical necessity coverage rules, we also have a formal process for complying with RAC audits, and we are cooperating fully with the RACs during this process. However, due to additional delays announced by CMS in the related adjudication process, which is the same process we follow for appealing denials of certain diagnosis codes by MACs, we believe the resolution of any claims that are subsequently denied as a result of these RAC audits could take in excess of two years.
We have invested, and will continue to invest, substantial time, effort, and expense in implementing and maintaining internal controls and procedures designed to ensure regulatory compliance, and we are committed to continued adherence to these guidelines. More specifically, because Medicare comprises a significant portion of our
Net operating revenues
, it is important for us to remain compliant with the laws and regulations governing the Medicare program and related matters including anti-kickback and anti-fraud requirements. If we were unable to remain compliant with these regulations, our financial position, results of operations, and cash flows could be materially, adversely impacted.
Another challenge relates to reduced Medicare reimbursement, which is also discussed in Item 1A,
Risk Factors
. We currently estimate sequestration, which began affecting payments received after April 1, 2013, will result in a net decrease in our
Net operating revenues
of approximately
$8 million
in 2014. The effect of sequestration on year-over-year comparisons will cease on April 1, 2014. However, unless the United States Congress acts to change or eliminate sequestration, it will continue to result in a 2% decrease to reimbursements otherwise due from Medicare, after taking into consideration other changes to reimbursement rates such as market basket updates.
Additionally, concerns held by federal policymakers about the federal deficit, national debt levels, and reforming the sustainable growth rate formula used to pay physicians who treat Medicare beneficiaries (the so called “Doc Fix”) could result in enactment of further federal spending reductions, further entitlement reform legislation affecting the Medicare program, and/or further reductions to provider payments. Likewise, issues related to the federal budget or the unwillingess to raise the statutory cap on the federal government’s ability to issue debt, also referred to as the “debt ceiling,” may have a significant impact on the economy and indirectly on our results of operations and financial position. We cannot predict what alternative or additional deficit reduction initiatives, Medicare payment reductions, or post acute care reforms, if any, will ultimately be enacted into law, or the timing or effect any such initiatives or reductions will have on us. If enacted, such initiatives or reductions would likely be challenging for all providers, would likely have the effect of limiting Medicare beneficiaries’ access to healthcare services, and could have an adverse impact on our financial position, results of operations, and cash
34
flows. However, we believe our efficient cost structure and substantial owned real estate coupled with the steps we have taken to reduce our debt and corresponding debt service obligations should allow us to absorb, adjust to, or mitigate any potential initiative or reimbursement reductions more easily than most other inpatient rehabilitation providers.
See also Item 1,
Business
, “Sources of Revenues” and “Regulation,” and Item 1A,
Risk Factors
, to this report and
Note 18,
Contingencies and Other Commitments
, “Governmental Inquiries and Investigations,” to the accompanying consolidated financial statements.
Changes to Our Operating Environment Resulting from Healthcare Reform
. Our challenges related to healthcare reform are discussed in Item 1,
Business
, “Sources of Revenue,” and Item 1A,
Risk Factors
. Many provisions within the 2010 Healthcare Reform Laws have impacted, or could in the future impact, our business. Most notably for us are the reductions to our annual market basket updates, including productivity adjustments, and future payment reforms such as Accountable Care Organizations (“ACOs”) and bundled payments.
In July 2013, CMS released its notice of final rulemaking for fiscal year 2014 (the “2014 Rule”) for IRFs under the prospective payment system (“IRF‑PPS”). The final rule would implement a net 1.8% market basket increase effective for discharges between October 1, 2013 and September 30, 2014, calculated as follows:
|
Market basket update
|
2.6%
|
|
Healthcare reform reduction
|
30 basis points
|
|
Productivity adjustment reduction
|
50 basis points
|
The final rule also includes other pricing changes that impact our hospital-by-hospital base rate for Medicare reimbursement. Such changes include, but are not limited to, updates to the IRF-PPS facility-level rural adjustment factor, low-income patient factor, teaching status adjustment factor, and updates to the outlier fixed loss threshold. Based on our analysis which utilizes, among other things, the acuity of our patients over the 12-month period prior to the rule’s release and incorporates other adjustments included in the final rule, we believe the 2014 Rule will result in a net increase to our Medicare payment rates of approximately 1.95% effective October 1, 2013.
The healthcare industry in general is facing uncertainty associated with the efforts, primarily arising from initiatives included in the 2010 Healthcare Reform Laws, to identify and implement workable coordinated care delivery models. In a coordinated care delivery model, hospitals, physicians, and other care providers work together to provide coordinated healthcare on a more efficient, patient-centered basis. These providers are then paid based on the overall value of the services they provide to a patient rather than the number of services they provide. While this is consistent with our goal and proven track record of being a high-quality, cost-effective provider, broad-based implementation of a new delivery model would represent a significant transformation for the healthcare industry. As the industry and its regulators explore this transformation, we are positioning the Company in preparation for whatever changes are ultimately made to the delivery system:
|
•
|
31 of our hospitals already operate as joint ventures with acute care hospitals, and we continue to pursue joint ventures as one of our growth initiatives. These joint ventures create an immediate link to an acute care system and position us to quickly and efficiently integrate our services in a coordinated care model.
|
|
•
|
Our electronic clinical information system is capable of interfaces with all major acute care electronic medical record systems and health information exchanges making communication easier across the continuum of healthcare providers.
|
|
•
|
We own the real estate associated with approximately 73% of our hospitals, and all but one of our hospitals are free standing. This combined with our strong balance sheet and consistent strong free cash flows enhances our flexibility to collaborate and partner with other providers.
|
|
•
|
We have a proven track record of being a high-quality, cost-effective provider. Our FIM
®
Gains consistently exceed industry results, and we have the scale and operating leverage to contribute to a low cost per discharge.
|
35
|
•
|
We have agreed to participate in a few bundling projects as a post-acute rehabilitation provider, and we have expressed interest in participating in several ACOs. As of December 31, 2013, we have executed one ACO participation agreement.
|
Given the complexity and the number of changes in the 2010 Healthcare Reform Laws, we cannot predict their ultimate impact. In addition, the ultimate nature and timing of the transformation of the healthcare delivery system is uncertain, and will likely remain so for some time. We will continue to evaluate these laws and position the Company for this industry shift. Based on our track record, we believe we can adapt to these regulatory and industry changes. Further, we have engaged, and will continue to engage, actively in discussions with key legislators and regulators to attempt to ensure any healthcare laws or regulations adopted or amended promote our goal of high-quality, cost-effective care.
|
•
|
Maintaining Strong Volume Growth
. Various factors may impact our ability to maintain our recent volume growth rates, including competition and increasing regulatory and administrative burdens. In any particular market, we may encounter competition from local or national entities with longer operating histories or other competitive advantages, such as acute care hospitals with their own rehabilitation units and other post-acute providers with relationships with referring acute care hospitals or physicians. Overly aggressive payment review practices by Medicare contractors, excessively strict enforcement of regulatory policies by government agencies, and increasingly restrictive or burdensome rules, regulations or statutes governing admissions practices may lead us to not accept patients who would be appropriate for and would benefit from the services we provide. In addition, from time to time, we must get regulatory approval to add beds to our existing hospitals in states with certificate of need laws. This approval may be withheld or take longer than expected. In the case of new store volume growth, the addition of hospitals to our portfolio, whether de novo construction or the product of acquisitions or joint ventures, also may be difficult and take longer than expected.
|
|
•
|
Recruiting and Retaining High-Quality Personnel
. See Item 1A,
Risk Factors
, for a discussion of competition for staffing, shortages of qualified personnel, and other factors that may increase our labor costs. Recruiting and retaining qualified personnel for our hospitals remain a high priority for us. We attempt to maintain a comprehensive compensation and benefits package that allows us to remain competitive in this challenging staffing environment while remaining consistent with our goal of being a high-quality, cost-effective provider of inpatient rehabilitative services.
|
See also Item 1,
Business
, and Item 1A,
Risk Factors
.
These key challenges notwithstanding, we have a strong business model, a strong balance sheet, and a proven track record of achieving strong financial and operational results. We are positioning the Company to respond to any changes in the healthcare delivery system and believe we will be in a position to take advantage of any opportunities that arise as the industry moves to this new stage. We are in a position to continue to grow, adapt to external events, and create value for our shareholders in 2014 and beyond.
Results of Operations
Payor Mix
During
2013
,
2012
, and
2011
, we derived consolidated
Net operating revenues
from the following payor sources:
|
|
For the Year Ended December 31,
|
|||||||
|
|
2013
|
2012
|
2011
|
|||||
|
Medicare
|
74.5
|
%
|
73.4
|
%
|
72.0
|
%
|
||
|
Medicaid
|
1.2
|
%
|
1.2
|
%
|
1.6
|
%
|
||
|
Workers' compensation
|
1.2
|
%
|
1.5
|
%
|
1.6
|
%
|
||
|
Managed care and other discount plans, including Medicare Advantage
|
18.5
|
%
|
19.3
|
%
|
19.8
|
%
|
||
|
Other third-party payors
|
1.8
|
%
|
1.8
|
%
|
2.0
|
%
|
||
|
Patients
|
1.1
|
%
|
1.3
|
%
|
1.2
|
%
|
||
|
Other income
|
1.7
|
%
|
1.5
|
%
|
1.8
|
%
|
||
|
Total
|
100.0
|
%
|
100.0
|
%
|
100.0
|
%
|
||
36
Our payor mix is weighted heavily towards Medicare. Our hospitals receive Medicare reimbursements under IRF-PPS. Under IRF-PPS, our hospitals receive fixed payment amounts per discharge based on certain rehabilitation impairment categories established by the United States Department of Health and Human Services. Under IRF-PPS, our hospitals retain the difference, if any, between the fixed payment from Medicare and their operating costs. Thus, our hospitals benefit from being cost-effective providers. For additional information regarding Medicare reimbursement, see the “Sources of Revenues” section of Item 1,
Business
.
Managed Medicare revenues, included in the “managed care and other discount plans” category in the above table, represented approximately 8%, 8%, and 7% of our total revenues during the years ended December 31, 2013, 2012, and 2011, respectively. During 2009, we experienced an increase in managed Medicare and private fee-for-service plans. As part of the Balanced Budget Act of 1997, Congress created a program of private, managed healthcare coverage for Medicare beneficiaries. This program has been referred to as Medicare Part C, or “Medicare Advantage.” The program offers beneficiaries a range of Medicare coverage options by providing a choice between the traditional fee-for-service program (Under Medicare Parts A and B) or enrollment in a health maintenance organization (“HMO”), preferred provider organization (“PPO”), point-of-service plan, provider sponsor organization, or an insurance plan operated in conjunction with a medical savings account. Prior to 2010, private fee-for-service plans were not required to build provider networks, did not have the same quality reporting requirements to CMS as other plans, and were reimbursed by Medicare at a higher rate. In 2010, these requirements and reimbursement rates were revised to be similar to other existing payor plans. As these requirements changed, payors began actively marketing and converting their members from private-fee-for-service plans to one of their existing HMO or PPO plans, where provider networks and reporting requirements were already established, or back to traditional Medicare coverage. This shift of payors from private fee-for-service plans back to traditional Medicare can be seen in the above table.
Our consolidated
Net operating revenues
consist primarily of revenues derived from patient care services.
Net operating revenues
also include other revenues generated from management and administrative fees and other nonpatient care services. These other revenues are included in “other income” in the above table.
Under IRF-PPS, hospitals are reimbursed on a “per discharge” basis. Thus, the number of patient discharges is a key metric utilized by management to monitor and evaluate our performance. The number of outpatient visits is also tracked in order to measure the volume of outpatient activity each period.
37
Our Results
From
2011
through
2013
, our consolidated results of operations were as follows:
|
|
For the Year Ended December 31,
|
Percentage Change
|
|||||||||||||||
|
|
2013
|
2012
|
2011
|
2013 v. 2012
|
2012 v. 2011
|
||||||||||||
|
|
(In Millions)
|
|
|
||||||||||||||
|
Net operating revenues
|
$
|
2,273.2
|
|
$
|
2,161.9
|
|
$
|
2,026.9
|
|
5.1
|
%
|
6.7
|
%
|
||||
|
Less: Provision for doubtful accounts
|
(26.0
|
)
|
(27.0
|
)
|
(21.0
|
)
|
(3.7
|
)%
|
28.6
|
%
|
|||||||
|
Net operating revenues less provision for doubtful accounts
|
2,247.2
|
|
2,134.9
|
|
2,005.9
|
|
5.3
|
%
|
6.4
|
%
|
|||||||
|
Operating expenses:
|
|
|
|
|
|
|
|
|
|
|
|||||||
|
Salaries and benefits
|
1,089.7
|
|
1,050.2
|
|
982.0
|
|
3.8
|
%
|
6.9
|
%
|
|||||||
|
Hospital-related expenses:
|
|||||||||||||||||
|
Other operating expenses
|
323.0
|
|
303.8
|
|
288.3
|
|
6.3
|
%
|
5.4
|
%
|
|||||||
|
Occupancy costs
|
47.0
|
|
48.6
|
|
48.4
|
|
(3.3
|
)%
|
0.4
|
%
|
|||||||
|
Supplies
|
105.4
|
|
102.4
|
|
102.8
|
|
2.9
|
%
|
(0.4
|
)%
|
|||||||
|
General and administrative expenses
|
119.1
|
|
117.9
|
|
110.5
|
|
1.0
|
%
|
6.7
|
%
|
|||||||
|
Depreciation and amortization
|
94.7
|
|
82.5
|
|
78.8
|
|
14.8
|
%
|
4.7
|
%
|
|||||||
|
Government, class action, and related settlements
|
(23.5
|
)
|
(3.5
|
)
|
(12.3
|
)
|
571.4
|
%
|
(71.5
|
)%
|
|||||||
|
Professional fees—accounting, tax, and legal
|
9.5
|
|
16.1
|
|
21.0
|
|
(41.0
|
)%
|
(23.3
|
)%
|
|||||||
|
Total operating expenses
|
1,764.9
|
|
1,718.0
|
|
1,619.5
|
|
2.7
|
%
|
6.1
|
%
|
|||||||
|
Loss on early extinguishment of debt
|
2.4
|
|
4.0
|
|
38.8
|
|
(40.0
|
)%
|
(89.7
|
)%
|
|||||||
|
Interest expense and amortization of debt discounts and fees
|
100.4
|
|
94.1
|
|
119.4
|
|
6.7
|
%
|
(21.2
|
)%
|
|||||||
|
Other income
|
(4.5
|
)
|
(8.5
|
)
|
(2.7
|
)
|
(47.1
|
)%
|
214.8
|
%
|
|||||||
|
Equity in net income of nonconsolidated affiliates
|
(11.2
|
)
|
(12.7
|
)
|
(12.0
|
)
|
(11.8
|
)%
|
5.8
|
%
|
|||||||
|
Income from continuing operations before income tax expense
|
395.2
|
|
340.0
|
|
242.9
|
|
16.2
|
%
|
40.0
|
%
|
|||||||
|
Provision for income tax expense
|
12.7
|
|
108.6
|
|
37.1
|
|
(88.3
|
)%
|
192.7
|
%
|
|||||||
|
Income from continuing operations
|
382.5
|
|
231.4
|
|
205.8
|
|
65.3
|
%
|
12.4
|
%
|
|||||||
|
(Loss) income from discontinued operations, net of tax
|
(1.1
|
)
|
4.5
|
|
48.8
|
|
(124.4
|
)%
|
(90.8
|
)%
|
|||||||
|
Net income
|
381.4
|
|
235.9
|
|
254.6
|
|
61.7
|
%
|
(7.3
|
)%
|
|||||||
|
Less: Net income attributable to noncontrolling interests
|
(57.8
|
)
|
(50.9
|
)
|
(45.9
|
)
|
13.6
|
%
|
10.9
|
%
|
|||||||
|
Net income attributable to HealthSouth
|
$
|
323.6
|
|
$
|
185.0
|
|
$
|
208.7
|
|
74.9
|
%
|
(11.4
|
)%
|
||||
38
Provision for Doubtful Accounts and Operating Expenses as a % of Net Operating Revenues
|
|
For the Year Ended December 31,
|
|||||||
|
|
2013
|
2012
|
2011
|
|||||
|
Provision for doubtful accounts
|
1.1
|
%
|
1.2
|
%
|
1.0
|
%
|
||
|
Operating expenses:
|
||||||||
|
Salaries and benefits
|
47.9
|
%
|
48.6
|
%
|
48.4
|
%
|
||
|
Hospital-related expenses:
|
||||||||
|
Other operating expenses
|
14.2
|
%
|
14.1
|
%
|
14.2
|
%
|
||
|
Occupancy costs
|
2.1
|
%
|
2.2
|
%
|
2.4
|
%
|
||
|
Supplies
|
4.6
|
%
|
4.7
|
%
|
5.1
|
%
|
||
|
General and administrative expenses
|
5.2
|
%
|
5.5
|
%
|
5.5
|
%
|
||
|
Depreciation and amortization
|
4.2
|
%
|
3.8
|
%
|
3.9
|
%
|
||
|
Government, class action, and related settlements
|
(1.0
|
)%
|
(0.2
|
)%
|
(0.6
|
)%
|
||
|
Professional fees—accounting, tax, and legal
|
0.4
|
%
|
0.7
|
%
|
1.0
|
%
|
||
|
Total operating expenses
|
77.6
|
%
|
79.5
|
%
|
79.9
|
%
|
||
Additional information regarding our operating results for the years ended December 31,
2013
,
2012
, and
2011
is as follows:
|
|
For the Year Ended December 31,
|
Percentage Change
|
|||||||||||||||
|
|
2013
|
2012
|
2011
|
2013 v. 2012
|
2012 v. 2011
|
||||||||||||
|
|
(In Millions)
|
||||||||||||||||
|
Net patient revenue - inpatient
|
$
|
2,130.8
|
|
$
|
2,012.6
|
|
$
|
1,866.4
|
|
5.9
|
%
|
7.8
|
%
|
||||
|
Net patient revenue - outpatient & other
|
142.4
|
|
149.3
|
|
160.5
|
|
(4.6
|
)%
|
(7.0
|
)%
|
|||||||
|
Net operating revenues
|
$
|
2,273.2
|
|
$
|
2,161.9
|
|
$
|
2,026.9
|
|
5.1
|
%
|
6.7
|
%
|
||||
|
|
(Actual Amounts)
|
|
|||||||||||||||
|
Discharges
|
129,988
|
|
123,854
|
|
118,354
|
|
5.0
|
%
|
4.6
|
%
|
|||||||
|
Net patient revenue per discharge
|
$
|
16,392
|
|
$
|
16,250
|
|
$
|
15,770
|
|
0.9
|
%
|
3.0
|
%
|
||||
|
Outpatient visits
|
806,631
|
|
880,182
|
|
943,439
|
|
(8.4
|
)%
|
(6.7
|
)%
|
|||||||
|
Average length of stay (days)
|
13.3
|
|
13.4
|
|
13.5
|
|
(0.7
|
)%
|
(0.7
|
)%
|
|||||||
|
Occupancy %
|
69.3
|
%
|
68.2
|
%
|
67.7
|
%
|
1.6
|
%
|
0.7
|
%
|
|||||||
|
# of licensed beds
|
6,825
|
|
6,656
|
|
6,461
|
|
2.5
|
%
|
3.0
|
%
|
|||||||
|
Full-time equivalents*
|
16,093
|
|
15,453
|
|
15,089
|
|
4.1
|
%
|
2.4
|
%
|
|||||||
|
Employees per occupied bed
|
3.42
|
|
3.42
|
|
3.47
|
|
—
|
%
|
(1.4
|
)%
|
|||||||
|
*
|
Excludes approximately 400 full-time equivalents in each year who are considered part of corporate overhead with their salaries and benefits included in
General and administrative expenses
in our consolidated statements of operations. Full-time equivalents included in the above table represent HealthSouth employees who participate in or support the operations of our hospitals and exclude an estimate of full-time equivalents related to contract labor.
|
We actively manage the productive portion of our
Salaries and benefits
utilizing certain metrics, including employees per occupied bed, or “EPOB.” This metric is determined by dividing the number of full-time equivalents, including an estimate of full-time equivalents from the utilization of contract labor, by the number of occupied beds during each period. The number of occupied beds is determined by multiplying the number of licensed beds by our occupancy percentage.
In the discussion that follows, we use “same-store” comparisons to explain the changes in certain performance metrics and line items within our financial statements. We calculate same-store comparisons based on hospitals open throughout both the full current period and prior periods presented. These comparisons include the financial results of market consolidation transactions in existing markets, as it is difficult to determine, with precision, the incremental impact of these transactions on our results of operations.
39
2013 Compared to 2012
Net Operating Revenues
Net patient revenue from our hospitals was
5.9%
higher for the year ended December 31, 2013 than the year ended December 31, 2012. This increase was attributable to a
5.0%
increase in patient discharges and a
0.9%
increase in net patient revenue per discharge. Discharge growth included a
2.5%
increase in same-store discharges. Same-store discharges were negatively impacted by the divestiture of 41 skilled nursing facility beds in the first quarter of 2013. Approximately 60 basis points of discharge growth from new stores resulted from the consolidation of St. Vincent Rehabilitation Hospital beginning in the third quarter of 2012, as discussed in
Note 7,
Investments in and Advances to Nonconsolidated Affiliates
, to the accompanying consolidated financial statements. The increase in net patient revenue per discharge resulted from pricing adjustments, higher patient acuity, and a higher percentage of Medicare patients, as shown in the above payor mix table. Net patient revenue per discharge was negatively impacted in 2013 by sequestration (became effective for all discharges after April 1, 2013), the impact of post-payment claim reviews (as discussed below), and the ramping up of three new hospitals. New hospitals are required to treat a minimum of 30 patients for zero revenue as part of the Medicare certification process.
As discussed in Item 1,
Business
, and the “Critical Accounting Estimates—Revenue Recognition” section of this Item, CMS has developed and instituted various Medicare audit programs under which CMS contracts with private companies to conduct claims and medical record audits. In connection with CMS approved and announced RAC audits related to IRFs, we received requests in 2013 to review certain patient files for discharges occurring from 2010 to 2013. To date, the Medicare payments that are subject to these audit requests represent less than 1% of our Medicare patient discharges during those years, and not all of these patient file requests have resulted in payment denial determinations by the RACs. While we make provisions for these claims based on our historical experience and success rates in the claim adjudication process, we cannot provide assurance as to our future success in the resolution of these and future disputes, nor can we predict or estimate the scope or number of denials that ultimately may be reviewed. During 2013, we reduced our
Net operating revenues
by approximately $8 million for post-payment claims that are part of this review process.
Decreased outpatient volumes in 2013 compared to 2012 resulted from the closure of outpatient clinics and continued competition from physicians offering physical therapy services within their own offices. We had
20
and
24
outpatient rehabilitation satellite clinics as of December 31, 2013 and 2012, respectively. Outpatient and other revenues for the years ended December 31, 2013 and 2012 included $15 million and $9 million, respectively, of state provider tax refunds. These refunds are explained in more detail in the “2012 Compared to 2011 — Net Operating Revenues” section of this Item.
Provision for Doubtful Accounts
For several years, under programs designated as “widespread probes,” certain of our MACs have conducted pre-payment claim reviews of our billings and denied payment for certain diagnosis codes based on medical necessity. We dispute, or “appeal,” most of these denials, and we have historically collected approximately 58% of all amounts denied. For claims we choose to take through all levels of appeal, up to and including administrative law judge hearings, we have historically experienced an approximate 70% success rate. The resolution of these disputes can take in excess of two years, and we cannot provide assurance as to our ongoing and future success of these disputes. As such, we make provisions against these receivables in accordance with our accounting policy that necessarily considers historical collection trends of the receivables in this review process as part of our
Provision for doubtful accounts
. Therefore, as we experience increases or decreases in these denials, or if our actual collections of these denials differs from our estimated collections, we may experience volatility in our
Provision for doubtful accounts
. See also Item 1,
Business
, “Sources of Revenues—Medicare Reimbursement,” to this report.
The change in our
Provision for doubtful accounts
as a percent of
Net operating revenues
in 2013 compared 2012 was primarily the result of a decrease in pre-payment claim denials by MACs.
Salaries and Benefits
Salaries and benefits
are the most significant cost to us and represent an investment in our most important asset: our employees.
Salaries and benefits
include all amounts paid to full- and part-time employees who directly participate in or support the operations of our hospitals, including all related costs of benefits provided to employees. It also includes amounts paid for contract labor.
Salaries and benefits
increased in 2013 compared to 2012 primarily due to increased patient volumes, including an increase in the number of full-time equivalents as a result of our 2012 and 2013 development activities, and increased costs associated with medical plan benefits. Because merit increases were foregone in 2012, as discussed below, management determined the Company would absorb all of the increased costs associated with medical plan benefits to employees in 2013.
40
These cost increases were offset by adjustments to our workers’ compensation accruals in 2013 due to favorable trends in claims and industry-wide loss development trends. As a result of these continued favorable trends, we also lowered the statistical confidence level used to determine our self-insurance reserves in 2013. See the “Critical Accounting Estimates—Self-Insured Risks” section of this Item.
Salaries and benefits
as a percent of
Net operating revenues
decreased in 2013 compared to 2012 due to our increasing revenue base, the favorable adjustments to our workers’ compensation accruals discussed above, and the one-time, merit-based, year-end bonus paid in the fourth quarter of 2012 to all eligible nonmanagement employees in lieu of an annual merit increase. The fourth quarter of 2013 included a 2.2% merit increase whereas the fourth quarter of 2012 included an approximate $10 million bonus in lieu of a merit increase resulting in a year-over-year benefit of approximately $5.5 million in
Salaries and benefits
in 2013. The positive impact of all of the above items were offset by sequestration.
Hospital-related Expenses
Other Operating Expenses
Other operating expenses
include costs associated with managing and maintaining our hospitals. These expenses include such items as contract services, utilities, non-income related taxes, insurance, professional fees, and repairs and maintenance.
Other operating expenses
increased during 2013 compared to 2012 primarily as a result of increased patient volumes, including new hospitals, and the ongoing implementation of our clinical information system.
Other operating expenses
associated with the ongoing implementation of our clinical information system were approximately $3 million higher in 2013 than in 2012.
As a percent of
Net operating revenues
,
Other operating expenses
increased during 2013 compared to 2012 due to the effects of sequestration, the ramping up of operations at three new hospitals, and higher expenses associated with the ongoing implementation of our clinical information system offset by growth in our revenue base and a reduction in general and professional liability reserves due to favorable trends in claims and industry-wide loss development trends. As a result of these continued favorable trends, we also lowered the statistical confidence level used to determine our self-insurance reserves in 2013. See the “Critical Accounting Estimates—Self-Insured Risks” section of this Item.
Occupancy costs
Occupancy costs
include amounts paid for rent associated with leased hospitals and outpatient rehabilitation satellite clinics, including common area maintenance and similar charges. These costs decreased as a percent of
Net operating revenues
in 2013 compared to 2012 due to our purchases of the real estate previously subject to operating leases at certain of our hospitals in 2013 and 2012. See the “Liquidity and Capital Resources” section of this Item.
Occupancy costs
are expected to continue to decrease as a percent of
Net operating revenues
going forward.
Supplies
Supplies
expense includes all costs associated with supplies used while providing patient care. Specifically, these costs include pharmaceuticals, food, needles, bandages, and other similar items.
Supplies
expense decreased as a percent of
Net operating revenues
in 2013 compared to 2012 due to our supply chain efforts and continual focus on monitoring and actively managing pharmaceutical costs offset by sequestration.
General and Administrative Expenses
General and administrative expenses
primarily include administrative expenses such as information technology services, human resources, corporate accounting, legal services, and internal audit and controls that are managed from our corporate headquarters in Birmingham, Alabama. These expenses also include stock-based compensation expenses.
General and administrative expenses
decreased as a percent of
Net operating revenues
in 2013 compared to 2012 due primarily to our increasing revenue base.
In March 2008, we sold our corporate campus to Daniel Corporation (“Daniel”), a Birmingham, Alabama-based real estate company. The sale included a deferred purchase price component related to an incomplete 13-story building located on the property, often referred to as the Digital Hospital. Under the agreement, Daniel was obligated upon sale of its interest in the building to pay to us 40% of the net profit realized from the sale. In June 2013, Daniel sold the building to Trinity Medical Center. In the third quarter of 2013, we received $10.8 million in cash from Daniel in connection with the sale of the building. The gain associated with this transaction is being deferred and amortized over five years, which is the remaining life of our
41
lease agreement with Daniel for the portion of the property we continue to occupy with our corporate office, as a component of
General and administrative expenses
. Approximately $1 million of this gain was included in
General and administrative expenses
in 2013.
Depreciation and Amortization
Depreciation and amortization
increased during 2013 compared to 2012 due to our increased capital expenditures throughout 2012 and 2013. We expect
Depreciation and amortization
to increase going forward as a result of our recent and ongoing capital investments.
Government, Class Action, and Related Settlements
The gain included in
Government, class action, and related settlements
in 2013 resulted from a noncash reduction in the estimated liability associated with the apportionment obligation to the plaintiffs in the January 2007 comprehensive settlement of the consolidated securities action, the collection of final judgments against former officers, and the recovery of assets from former officers, as discussed in
Note 18,
Contingencies and Other Commitments
, to the accompanying consolidated financial statements. The gain included in
Government, class action, and related settlements
in
2012 resulted from the recovery of assets from former officers.
Professional Fees — Accounting, Tax, and Legal
Professional fees—accounting, tax, and legal
for 2013 and 2012 related primarily to legal and consulting fees for continued litigation and support matters discussed in
Note 18,
Contingencies and Other Commitments
, to the accompanying consolidated financial statements. These expenses in 2012 also included legal and consulting fees for the pursuit of our remaining income tax benefits as discussed in
Note 16,
Income Taxes
, to the accompanying consolidated financial statements.
Loss on Early Extinguishment of Debt
The
Loss on early extinguishment of debt
in 2013 resulted from the redemption of 10% of the outstanding principal amount of our existing 7.25% Senior Notes due 2018 and our existing 7.75% Senior Notes due 2022 in November 2013. The
Loss on early extinguishment of debt
in 2012 resulted from the amendment to our credit agreement in August 2012 and the redemption of 10% of the outstanding principal amount of our existing 7.25% Senior Notes due 2018 and our existing 7.75% Senior Notes due 2022 in October 2012. See
Note 8,
Long-term Debt
, to the accompanying consolidated financial statements.
Interest Expense and Amortization of Debt Discounts and Fees
The increase in
Interest expense and amortization of debt discounts and fees
during 2013 compared to 2012 resulted from an increase in our average borrowings outstanding offset by a decrease in our average cash interest rate. Average borrowings outstanding increased during 2013 compared to 2012 primarily as a result of our issuance of $275 million aggregate principal amount of 5.75% Senior Notes due 2024 in September 2012. Our average cash interest rate approximated 7.1% and 7.2% during 2013 and 2012, respectively. The decrease in our average cash interest rate primarily resulted from the August 2012 amendment to our credit agreement that lowered the interest rate spread on our revolving credit facility by 50 basis points.
In November 2013, we exchanged $320 million in aggregate principal amount of newly issued 2.00% Convertible Senior Subordinated Notes due 2043 for 257,110 shares of our outstanding preferred stock. Due to discounts and financing costs, the effective interest rate on the convertible notes is 6.0%. As a result of this exchange, interest expense is expected to increase in 2014.
See
Note 8,
Long-term Debt
, to the accompanying consolidated financial statements.
Other Income
Other income
is primarily comprised of interest income and gains and losses on sales of investments. In 2012,
Other income
included a $4.9 million gain as a result of our consolidation of St. Vincent Rehabilitation Hospital and the remeasurement of our previously held equity interest at fair value. See
Note 7,
Investments in and Advances to Nonconsolidated Affiliates
, to the accompanying consolidated financial statements.
42
Income from Continuing Operations Before Income Tax Expense
The increase in our pre-tax income from continuing operations in 2013 compared to 2012 resulted from increased
Net operating revenues
and continued disciplined expense management. Pre-tax income in 2013 and 2012 included gains of
$23.5 million
and
$3.5 million
, respectively, related to
Government, class action, and related settlements
, as discussed above. Pre-tax income for 2012 also included a $4.9 million gain on the consolidation of St. Vincent Rehabilitation Hospital, as discussed above.
Provision for Income Tax Expense
Due to our federal and state NOLs, our cash income taxes approximated $8 million, net of refunds, in 2013. These payments resulted primarily from state income tax expense of subsidiaries which have separate state filing requirements, alternative minimum taxes, and federal income taxes for subsidiaries not included in our federal consolidated income tax return. In 2014, we estimate we will pay approximately $10 million to $15 million of cash income taxes, net of refunds. In 2013 and 2012, current income tax expense was
$6.3 million
and
$5.9 million
, respectively.
In April 2013, we entered into closing agreements with the IRS that settled federal income tax matters related to the previous restatement of our 2000 and 2001 financial statements, as well as certain other tax matters, through December 31, 2008. As a result of these closing agreements, we increased our deferred tax assets, primarily our federal NOL, and recorded a net income tax benefit of approximately $115 million in the second quarter of 2013. This income tax benefit primarily resulted from an approximate $283 million increase to our federal NOL on a gross basis.
Our effective income tax rate for 2013 was
3.2%
. Our
Provision for income tax expense
in 2013 was less than the federal statutory rate of 35.0% primarily due to: (1) the IRS settlement discussed above, (2) the impact of noncontrolling interests, and (3) a decrease in our valuation allowance offset by (4) state income tax expense. The decrease in our valuation allowance in 2013 related primarily to our capital loss carryforwards, our current forecast of future earnings in each jurisdiction, and changes in certain state tax laws. During the second quarter of 2013, we determined a valuation allowance related to our capital loss carryforwards was no longer required as sufficient positive evidence existed to substantiate their utilization. This evidence included our partial utilization of these assets as a result of realizing capital gains in 2013 and the identification of sufficient taxable capital gain income within the available capital loss carryforward period. See also
Note 1,
Summary of Significant Accounting Policies
, “Income Taxes,” to the accompanying consolidated financial statements for a discussion of the allocation of income or loss related to pass-through entities, which we refer to as the impact of noncontrolling interests in this discussion.
Our effective income tax rate for 2012 was
31.9%
. Our
Provision for income tax expense
in 2012 was less than the federal statutory rate of 35.0% primarily due to: (1) the impact of noncontrolling interests and (2) a decrease in the valuation allowance offset by (3) state income tax expense.
In certain state jurisdictions, we do not expect to generate sufficient income to use all of the available NOLs prior to their expiration. This determination is based on our evaluation of all available evidence in these jurisdictions including results of operations during the preceding three years, our forecast of future earnings, and prudent tax planning strategies. It is possible we may be required to increase or decrease our valuation allowance at some future time if our forecast of future earnings varies from actual results on a consolidated basis or in the applicable state tax jurisdiction, or if the timing of future tax deductions differs from our expectations.
We recognize the financial statement effects of uncertain tax positions when it is more likely than not, based on the technical merits, a position will be sustained upon examination by and resolution with the taxing authorities. Total remaining gross unrecognized tax benefits were
$1.1 million
and
$78.0 million
as of December 31, 2013 and 2012, respectively. The amount of gross unrecognized tax benefits changed during 2013 primarily due to the settlement with the IRS discussed above.
See
Note 16,
Income Taxes
, to the accompanying consolidated financial statements and the “Critical Accounting Estimates” section of this Item.
Net Income Attributable to Noncontrolling Interests
Net income attributable to noncontrolling interests
represents the share of net income or loss allocated to members or partners in our consolidated affiliates. Fluctuations in these amounts are primarily driven by the financial performance of the applicable hospital population each period. Approximately $4 million of the increase in noncontrolling interests in 2013 compared to 2012 was due to changes at two of our existing hospitals. During 2013, we entered into an agreement to convert our 100% owned hospital in Jonesboro, Arkansas into a joint venture with St. Bernards Healthcare, as discussed in
Note 11,
43
Redeemable Noncontrolling Interests
, to the accompanying consolidated financial statements. In addition, our share of profits from our joint venture hospital in Memphis, Tennessee decreased in 2013 from 70% to 50% pursuant to the terms of that partnership agreement entered into in 1993.
2012 Compared to 2011
Net Operating Revenues
Net patient revenue from our hospitals was 7.8% higher for the year ended December 31, 2012 than the year ended December 31, 2011. This increase was attributable to a 4.6% increase in patient discharges and a 3.0% increase in net patient revenue per discharge. Discharge growth was comprised of 1.7% growth from new stores and a 2.9% increase in same-store discharges. Discharge growth was enhanced during 2012 compared to 2011 by the additional day in February due to leap year as well as a 60 basis point increase in discharges resulting from the consolidation of St. Vincent Rehabilitation Hospital beginning in the third quarter of 2012, as discussed in
Note 7,
Investments in and Advances to Nonconsolidated Affiliates
, to the accompanying consolidated financial statements. Net patient revenue per discharge in 2012 benefited from pricing adjustments, higher patient acuity, and a higher percentage of Medicare patients (as shown in the above payor mix table).
Outpatient and other revenues include the receipt of state provider taxes. A number of states in which we operate hospitals assess a provider tax to certain healthcare providers. Those tax revenues at the state level are generally matched by federal funds. In order to induce healthcare providers to serve low income patients, many states redistribute a substantial portion of these funds back to the various providers. These redistributions are based on different metrics than those used to assess the tax, and are thus in different amounts and proportions than the initial tax assessment. As a result, some providers receive a net benefit while others experience a net expense. See the discussion of
Other operating expenses
below for information on state provider tax expenses.
While state provider taxes are a regular component of our operating results, during 2011, a new provider tax was implemented in Pennsylvania where we operate nine inpatient hospitals. As a result of the implementation of this new provider tax in Pennsylvania, we recorded approximately $5 million in revenues related to the period from July 1, 2010 through December 31, 2010 when we were notified by Pennsylvania of the specific provider tax refund to be issued to us after Pennsylvania had received approval from CMS on its amended state plan relative to these taxes.
Excluding the state provider tax refunds discussed above, outpatient and other revenues decreased during 2012 compared to 2011 due to the decrease in outpatient volumes, the closure of outpatient satellite clinics in prior periods, and a reduction in home health pricing related to the 2012 Medicare home health rule. Outpatient volumes in the fourth quarter of 2012 were negatively impacted by the implementation of therapy caps to all hospital-based outpatient programs. The Middle Class Tax Relief and Job Creation Act of 2012 applied therapy caps limiting how much Medicare will pay for medically necessary outpatient therapy services per Medicare patient in any one calendar year starting October 1, 2012. When this was implemented in October 2012, many Medicare beneficiaries had already reached their cap limit for 2012 and chose not to receive additional outpatient therapy services since such services would not be covered by Medicare. The decrease in outpatient volumes was slightly offset by an increase in the number of home health visits included in these volume metrics.
Provision for Doubtful Accounts
The change in the
Provision for doubtful accounts
as a percent of
Net operating revenues
in 2012 compared to 2011 was primarily the result of an increase in Medicare claim denials and a lengthening in the related adjudication process.
Salaries and Benefits
Salaries and benefits
increased in 2012 compared to 2011 primarily due to increased patient volumes, including an increase in the number of full-time equivalents as a result of our 2012 and 2011 development activities and the consolidation of St. Vincent Rehabilitation Hospital discussed above, an approximate 2% merit increase provided to employees on October 1, 2011, a change in the skills mix of employees at our hospitals, and a one-time, merit-based, year-end bonus paid in the fourth quarter of 2012 to all eligible nonmanagement employees. As part of the standardization of our labor practices across all of our hospitals and as part of our efforts to continue to provide high-quality inpatient rehabilitative services, our hospitals are utilizing more registered nurses and certified rehabilitation registered nurses, which increases our average cost per full-time equivalent, and fewer licensed practical nurses. These increases were offset by reductions in self-insured workers’ compensation costs primarily due to revised actuarial estimates resulting from better-than-expected claims experience in prior years and a reduction in group medical costs due to favorable claim trends.
44
We did not grant a merit increase to our employees on October 1, 2012. Rather, we replaced merit increases in 2012 with a one-time, merit-based, year-end bonus paid in the fourth quarter of 2012 to all eligible nonmanagement employees. We did this to reward our nonmanagement employees for their performance in 2012 while not carrying the additional costs associated with a merit increase into 2013 and beyond where we face the impact of sequestration and the risk of potential additional Medicare reimbursement reductions.
Salaries and benefits
increased by approximately $10 million in the fourth quarter of 2012 as a result of this special bonus. This bonus was approximately $4.5 million more than would have been included in our fourth quarter 2012 results had we given a 2.25% merit increase to all nonmanagement employees effective October 1, 2012.
Salaries and benefits
as a percent of
Net operating revenues
increased in 2012 compared to 2011. This increase was primarily attributable to the higher skills mix of our employees in 2012 compared to 2011, the one-time bonus discussed above, and the ramping up of operations at our newly opened hospital in Ocala, Florida (i.e., costs with no to little revenues) offset by continued improvement in labor productivity, as shown in our EPOB metric above.
Hospital-related Expenses
Other Operating Expenses
As a percent of
Net operating revenues
,
Other operating expenses
decreased during 2012 compared to 2011 due primarily to our increasing revenue base as well as a decrease in self-insurance costs in 2012. As disclosed previously, we update our actuarial estimates surrounding our self-insurance reserves in June and December of each year. Self-insurance costs associated with professional and general liability risks were less in 2012 than in 2011 due to revised actuarial estimates resulting from better-than-expected claims experience in prior years. See
Note 9,
Self-Insured Risks
, to the accompanying consolidated financial statements.
Other operating expenses
in 2011 included approximately $3 million of expenses associated with the implementation of the new Pennsylvania state provider tax program, as discussed above, offset by a $2.4 million nonrecurring franchise tax recovery.
Other operating expenses
associated with the implementation of our electronic clinical information system were approximately $3 million higher in 2012 than in 2011.
Occupancy costs
Occupancy costs
decreased as a percent of
Net operating revenues
in 2012 compared to 2011 due to our purchase of the land and building previously subject to an operating lease associated with our joint venture hospital in Fayetteville, Arkansas.
Supplies
Supplies
expense decreased as a percent of
Net operating revenues
in 2012 compared to 2011 due to our increasing revenue base, our supply chain efforts, and our continual focus on monitoring and actively managing pharmaceutical costs.
General and Administrative Expenses
The increase in
General and administrative expenses
during 2012 compared to 2011 primarily resulted from increased expenses associated with stock-based compensation. Our restricted stock awards contain vesting requirements that include a service condition, market condition, performance condition, or a combination thereof. Due to the Company’s operating performance, our noncash expenses associated with these awards increased in 2012.
Depreciation and Amortization
While our capital expenditures increased during the latter half of 2011 and all of 2012, the majority of these expenditures related to land and construction in progress for our de novo hospitals and capitalized software costs associated with the implementation of our electronic clinical information system at our hospitals. Depreciation on these assets, excluding land which is nondepreciable, does not begin until the applicable assets are placed in service. Therefore, while we expect depreciation and amortization to increase going forward, we did not experience a significant increase in these charges during 2012.
45
Government, Class Action, and Related Settlements
The gain included in
Government, class action, and related settlements
in 2012 and 2011 resulted from the recovery of assets from former officers, as discussed in
Note 18,
Contingencies and Other Commitments
, to the accompanying consolidated financial statements.
Professional Fees — Accounting, Tax, and Legal
In 2012 and 2011,
Professional fees—accounting, tax, and legal
related primarily to legal and consulting fees for continued litigation and support matters discussed in
Note 18,
Contingencies and Other Commitments
, to the accompanying consolidated financial statements. These fees in 2012 and 2011 specifically included $1.4 million and $5.2 million, respectively, related to our obligation to pay 35% of any recovery from Richard Scrushy to the attorneys for the derivative shareholder plaintiffs. These expenses in 2012 also included legal and consulting fees for the pursuit of our remaining income tax benefits, as discussed in
Note 16,
Income Taxes
,
to the accompanying consolidated financial statements.
Loss on Early Extinguishment of Debt
The
Loss on early extinguishment of debt
in 2012 resulted from
the amendment to our credit agreement in August 2012 and the redemption of 10% of the outstanding principal amount of our existing 7.25% Senior Notes due 2018 and our existing 7.75% Senior Notes due 2022 in October 2012. The
Loss on early extinguishment of debt
in 2011 was the result of our redemption of all of our 10.75% Senior Notes due 2016 in June and September of 2011.
See
Note 8,
Long-term Debt
, to the accompanying
consolidated financial statements.
Interest Expense and Amortization of Debt Discounts and Fees
The decrease in
Interest expense and amortization of debt discounts and fees
during 2012 compared to 2011 was due to a decrease in our average borrowings outstanding and a decrease in our average cash interest rate.
During 2011, we reduced total debt by approximately $257 million, including the redemption of our 10.75% Senior Notes due 2016. Our average cash interest rate was 7.2% during 2012 compared to 8.0% for 2011. Our average cash interest rate decreased as a result of the redemption of the 10.75% Senior Notes due 2016 during 2011, which was our most expensive debt, as well as the amendment to our credit agreement in May 2011 which reduced by 100 basis points each of the various applicable interest rates for any outstanding balance on our revolving credit facility. In addition, pricing on our term loan and revolving credit facility declined an additional 25 basis points in the third quarter of 2011 in conformity with our credit agreement’s leverage grid. In addition, the August 2012 amendment to our credit agreement lowered the interest rate spread on our revolving credit facility by an additional 50 basis points. See
Note 8,
Long-term Debt
, to the accompanying consolidated financial statements.
Other Income
In 2012,
Other income
included a $4.9 million gain as a result of our consolidation of St. Vincent Rehabilitation Hospital and the remeasurement of our previously held equity interest at fair value. See
Note 7,
Investments in and Advances to Nonconsolidated Affiliates
, to the accompanying consolidated financial statements.
Income from Continuing Operations Before Income Tax Expense
Excluding the
Loss on early extinguishment of debt
during 2011, the increase in our pre-tax income from continuing operations in 2012 compared to 2011 resulted from increased
Net operating revenues
, improved operating leverage and labor productivity, and a decrease in interest expense.
Provision for Income Tax Expense
Our effective income tax rate for 2012 was 31.9%. Our
Provision for income tax expense
in 2012 was less than the federal statutory rate of 35.0% primarily due to: (1) the impact of noncontrolling interests and (2) a decrease in the valuation allowance offset by (3) state income tax expense.
Our effective income tax rate for 2011 was 15.3%. The
Provision for income tax expense
in 2011 was less than the federal statutory rate primarily due to: (1) an approximate $28 million benefit associated with a current period net reduction in the valuation allowance and (2) an approximate $18 million net benefit associated with settlements with various taxing authorities including the settlement of federal income tax claims with the Internal Revenue Service for tax years 2007 and 2008 offset by (3) approximately $7 million of net expense primarily related to corrections to 2010 deferred tax assets associated
46
with our NOLs and corresponding valuation allowance. See
Note 1,
Summary of Significant Accounting Policies
, “Out-of-Period Adjustments,” to the accompanying consolidated financial statements.
In 2012, we paid approximately $10 million of cash income taxes, net of refunds. In 2011, we received $0.5 million of net income tax refunds. In 2012 and 2011, current income tax expense was
$5.9 million
and
$0.6 million
, respectively.
See
Note 16,
Income Taxes
, to the accompanying consolidated financial statements.
Net Income Attributable to Noncontrolling Interests
Net income attributable to noncontrolling interests
increased in 2012 compared to 2011 due to the financial performance of the applicable hospital population each period, bed additions at joint venture hospitals, the consolidation of St. Vincent Rehabilitation Hospital beginning in the third quarter of 2012 (see
Note 7,
Investments in and Advances to Nonconsolidated Affiliates
, to the accompanying consolidated financial statements), and the purchase of the land and building previously subject to an operating lease associated with our joint venture hospital in Fayetteville, Arkansas.
Impact of Inflation
The impact of inflation on the Company will be primarily in the area of labor costs. The healthcare industry is labor intensive. Wages and other expenses increase during periods of inflation and when labor shortages occur in the marketplace. While we believe the current economic climate may help to moderate wage increases in the near term, there can be no guarantee we will not experience increases in the cost of labor, as the need for clinical healthcare professionals is expected to grow. In addition, increases in healthcare costs are typically higher than inflation and impact our costs under our employee benefit plans. Managing these costs remains a significant challenge and priority for us.
Suppliers pass along rising costs to us in the form of higher prices. Our supply chain efforts and our continual focus on monitoring and actively managing pharmaceutical costs has enabled to us to accommodate increased pricing related to supplies and other operating expenses over the past few years. However, we cannot predict our ability to cover future cost increases.
It should be noted that we have little or no ability to pass on these increased costs associated with providing services to Medicare and Medicaid patients due to federal and state laws that establish fixed reimbursement rates.
Relationships and Transactions with Related Parties
Related party transactions are not material to our operations, and therefore, are not presented as a separate discussion within this Item.
Results of Discontinued Operations
The operating results of discontinued operations are as follows (in millions):
|
|
For the Year Ended December 31,
|
||||||||||
|
|
2013
|
2012
|
2011
|
||||||||
|
Net operating revenues
|
$
|
0.2
|
|
$
|
1.0
|
|
$
|
95.7
|
|
||
|
Less: Provision for doubtful accounts
|
0.3
|
|
—
|
|
(1.5
|
)
|
|||||
|
Net operating revenues less provision for doubtful accounts
|
0.5
|
|
1.0
|
|
94.2
|
|
|||||
|
Costs and expenses
|
0.2
|
|
0.2
|
|
66.3
|
|
|||||
|
Impairments
|
1.1
|
|
—
|
|
6.8
|
|
|||||
|
(Loss) income from discontinued operations
|
(0.8
|
)
|
0.8
|
|
21.1
|
|
|||||
|
(Loss) gain on disposal of assets/sale of investments of discontinued operations
|
(0.4
|
)
|
5.0
|
|
65.6
|
|
|||||
|
Income tax benefit (expense)
|
0.1
|
|
(1.3
|
)
|
(37.9
|
)
|
|||||
|
(Loss) income from discontinued operations, net of tax
|
$
|
(1.1
|
)
|
$
|
4.5
|
|
$
|
48.8
|
|
||
Our results of discontinued operations primarily included the operations of six long-term acute care hospitals (“LTCHs”). In August 2011, we completed a transaction to sell
five
LTCHs to certain subsidiaries of LifeCare Holdings, Inc. for an aggregate purchase price of
$117.5 million
. We closed the sixth LTCH in August 2011 and sold the associated real estate in December 2013.
47
In addition, as discussed in
Note 18,
Contingencies and Other Commitments
, to the accompanying consolidated financial statements, in April 2011, we entered into a definitive settlement and release agreement with the state of Delaware (the “Delaware Settlement”) relating to a previously disclosed audit of unclaimed property conducted on behalf of Delaware and two other states by Kelmar Associates, LLC. During 2011, we recorded a $24.8 million gain in connection with this settlement as part of our results of discontinued operations.
The impairment charges presented in the above table for 2013 and 2011 related to the LTCH that was closed in 2011. We determined the fair value of the impaired long-lived assets at this LTCH based on offers from potential buyers of the closed facility’s real estate. The impairment charges for 2011 also relate to the Dallas Medical Center that was closed in 2008. We determined the fair value of the impaired long-lived assets at this hospital based on the assets’ estimated fair value using valuation techniques that included third-party appraisals and offers from potential buyers.
During 2012, we recognized gains associated with the sale of the real estate of Dallas Medical Center and an investment we had in a cancer treatment center that was part of our former diagnostic division. As a result of the transaction to sell five of our LTCHs, we recorded a $65.6 million pre-tax gain as part of our results of discontinued operations in 2011.
Income tax expense recorded as part of our results of discontinued operations in 2011 related primarily to the gain from the sale of five of our LTCHs and the Delaware Settlement.
See also
Note 15,
Assets and Liabilities in and Results of Discontinued Operations
, to the accompanying consolidated financial statements.
In connection with the 2007 sale of our surgery centers division (now known as Surgical Care Affiliates, or “SCA”) to ASC Acquisition LLC, an affiliate of TPG Partners V, L.P. (“TPG”), a private investment partnership, we received an option, subject to terms and conditions set forth below, to purchase up to a 5% equity interest in SCA. The price of the option is equal to the original issuance price of the units subscribed for by TPG and certain other co-investors in connection with the acquisition plus a 15% annual premium, compounded annually. The option has a term of ten years and is exercisable upon certain liquidity events, including a public offering of SCA’s shares of common stock that results in 30% or more of SCA’s common stock being listed or traded on a national securities exchange. On November 4, 2013, SCA announced the closing of its initial public offering, which was not a qualifying liquidity event. If there is a secondary offering that results in a qualifying liquidity event under our option agreement with TPG, we intend to exercise our rights pursuant to the option. If the option becomes exercisable, we believe it will have a strike price below the price of the asset being purchased.
Liquidity and Capital Resources
Our primary sources of liquidity are cash on hand, cash flows from operations, and borrowings under our revolving credit facility.
The objectives of our capital structure strategy are to ensure we maintain adequate liquidity and flexibility. Maintaining adequate liquidity includes supporting the execution of our operating and strategic plans and allowing us to weather temporary disruptions in the capital markets and general business environment. Maintaining flexibility in our capital structure includes limiting concentrations of debt maturities in any given year, allowing for debt prepayments without onerous penalties, and ensuring our debt agreements are limited in restrictive terms and maintenance covenants.
With these objectives in mind, in June 2013, we amended our credit agreement to, among other things, permit unlimited restricted payments so long as the senior secured leverage ratio remains less than or equal to 1.5x and extend the revolver maturity from August 2017 to June 2018 (see
Note 8,
Long-term Debt
, to the accompanying consolidated financial statements). We have been disciplined in creating a capital structure that is flexible with no significant debt maturities prior to 2018. Our balance sheet remains strong. Our leverage ratio is within our target range, and we have ample availability under our revolving credit facility. We continue to generate strong cash flows from operations, and we have flexibility with how we choose to invest our cash and return value to shareholders.
Current Liquidity
As of December 31,
2013
, we had
$64.5 million
in
Cash and cash equivalents
. This amount excludes $
52.4 million
in
Restricted cash
and
$47.6 million
of restricted marketable securities (
$42.9 million
of restricted marketable securities are included in
Other long-term assets
in our consolidated balance sheet). Our restricted assets pertain primarily to obligations associated with our captive insurance company, as well as obligations we have under agreements with joint venture partners. See
Note 3,
Cash and Marketable Securities
, to the accompanying consolidated financial statements.
48
In addition to
Cash and cash equivalents
, as of December 31,
2013
, we had approximately $519 million available to us under our revolving credit facility. Our credit agreement governs the majority of our senior secured borrowing capacity and contains a leverage ratio and an interest coverage ratio as financial covenants. Our leverage ratio is defined in our credit agreement as the ratio of consolidated total debt (less up to $75 million of cash on hand) to Adjusted EBITDA for the trailing four quarters. Our interest coverage ratio is defined in our credit agreement as the ratio of Adjusted EBITDA to consolidated interest expense, excluding the amortization of financing fees, for the trailing four quarters. As of December 31,
2013
, the maximum leverage ratio requirement per our credit agreement was 4.5x and the minimum interest coverage ratio requirement was 2.75x, and we were in compliance with these covenants.
We do not face near-term refinancing risk, as the amounts outstanding under our credit agreement do not mature until 2018, and our bonds all mature in 2018 and beyond. See the “Contractual Obligations” section below for information related to our contractual obligations as of December 31,
2013
.
We anticipate we will continue to generate strong cash flows from operations that, together with availability under our revolving credit facility, will allow us to invest in growth opportunities and continue to improve our existing core business. We also will continue to consider additional shareholder value-enhancing strategies such as repurchases of our common and preferred stock and common stock dividends, recognizing that these actions may increase our leverage ratio. And, we will continue to consider reductions to our long-term debt. See also the “Authorizations for Returning Capital to Stakeholders” section of this Item.
See Item 1A,
Risk Factors
, for a discussion of risks and uncertainties facing us.
Sources and Uses of Cash
The following table shows the cash flows provided by or used in operating, investing, and financing activities for the years ended December 31,
2013
,
2012
, and
2011
(in millions):
|
|
For the Year Ended December 31,
|
||||||||||
|
|
2013
|
2012
|
2011
|
||||||||
|
Net cash provided by operating activities
|
$
|
470.3
|
|
$
|
411.5
|
|
$
|
342.7
|
|
||
|
Net cash used in investing activities
|
(226.2
|
)
|
(178.8
|
)
|
(24.6
|
)
|
|||||
|
Net cash used in financing activities
|
(312.4
|
)
|
(130.0
|
)
|
(336.3
|
)
|
|||||
|
(Decrease) increase in cash and cash equivalents
|
$
|
(68.3
|
)
|
$
|
102.7
|
|
$
|
(18.2
|
)
|
||
2013
Compared to
2012
Operating activities. Net cash provided by operating activities
increased from 2012 to 2013 due primarily to increased
Net operating revenues
and continued disciplined expense management.
Investing activities
. The increase in
Net cash used in investing activities
during 2013 compared to 2012 primarily resulted from increased capital expenditures and the acquisition of Walton Rehabilitation Hospital. The increase in our capital expenditures in 2013 primarily resulted from the purchase of the real estate previously subject to leases associated with four of our hospitals, as discussed below.
Net cash used in investing activities
during 2013 also included the receipt of $10.8 million related to the sale of the Digital Hospital. See
Note 2,
Business Combinations
, and
Note 5,
Property and Equipment
, to the accompanying consolidated financial statements.
Financing activities
. The increase in
Net cash used in financing activities
during 2013 compared to 2012 primarily resulted from repurchases of our common stock as part of the tender offer completed in the first quarter of 2013. As discussed in
Note 17,
Earnings per Common Share
, to the accompanying consolidated financial statements, we repurchased approximately 9.1 million shares of our common stock for $234.1 million, including fees and expenses related to the tender offer.
2012
Compared to
2011
Operating activities.
The increase in
Net cash provided by operating activities
from 2011 to 2012 primarily resulted from the increase in our
Net operating revenues
, improved operating leverage, and a decrease in interest expense.
Net cash provided by operating activities
for 2011 included $26.9 million related to the premium paid in conjunction with the redemption of our 10.75% Senior Notes and a $16.2 million decrease in the liability associated with refunds due patients and
49
other third-party payors. The decrease in this liability primarily related to a settlement discussed in
Note 18,
Contingencies and Other Commitments
,
to the accompanying consolidated financial statements.
Investing activities
.
Cash flows used in investing activities
during 2011 included $107.9 million of proceeds from the sale of five of our LTCHs in August 2011. Excluding these proceeds, the increase in
Cash flows used in investing activities
resulted from increased capital expenditures, including capitalized software costs, in 2012 compared to 2011. The increase in our capital expenditures in 2012 primarily resulted from: de novo development activities including land purchases, increased hospital refresh projects, implementation of our electronic clinical information system, and the purchase of the real estate associated with our joint venture hospital in Fayetteville, Arkansas (see also “financing activities” below).
Financing activities
.
Cash flows used in financing activities
during 2012 included the repurchase of
46,645
shares of our convertible perpetual preferred stock, distributions to noncontrolling interests of consolidated affiliates, dividends paid on our preferred stock, and net principal payments on debt offset by capital contributions from consolidated affiliates primarily associated with the purchase of the real estate associated with our joint venture hospital in Fayetteville, Arkansas.
Cash flows used in financing activities
during 2011 included net principal payments on debt, including the redemption of our 10.75% Senior Notes due 2016, distributions to noncontrolling interests of consolidated affiliates, and dividends paid on our preferred stock. Net debt payments, including debt issue costs, were approximately $21 million and $271 million for the years ended December 31, 2012 and 2011, respectively.
Contractual Obligations
Our consolidated contractual obligations as of December 31,
2013
are as follows (in millions):
|
|
Total
|
2014
|
2015-2016
|
2017-2018
|
2019 and thereafter
|
||||||||||||||
|
Long-term debt obligations:
|
|
|
|
|
|
|
|
||||||||||||
|
Long-term debt, excluding revolving credit facility and capital lease obligations
(a)
|
$
|
1,383.6
|
|
$
|
6.3
|
|
$
|
4.9
|
|
$
|
274.6
|
|
$
|
1,097.8
|
|
||||
|
Revolving credit facility
|
45.0
|
|
—
|
|
—
|
|
45.0
|
|
—
|
|
|||||||||
|
Interest on long-term debt
(b)
|
682.3
|
|
89.3
|
|
177.8
|
|
172.1
|
|
243.1
|
|
|||||||||
|
Capital lease obligations
(c)
|
175.5
|
|
12.3
|
|
27.1
|
|
26.9
|
|
109.2
|
|
|||||||||
|
Operating lease obligations
(d)(e)
|
253.9
|
|
37.9
|
|
67.0
|
|
48.3
|
|
100.7
|
|
|||||||||
|
Purchase obligations
(e)(f)
|
121.4
|
|
26.3
|
|
48.4
|
|
20.9
|
|
25.8
|
|
|||||||||
|
Other long-term liabilities
(g)(h)
|
3.8
|
|
0.2
|
|
0.4
|
|
0.4
|
|
2.8
|
|
|||||||||
|
Total
|
$
|
2,665.5
|
|
$
|
172.3
|
|
$
|
325.6
|
|
$
|
588.2
|
|
$
|
1,579.4
|
|
||||
|
(a)
|
Included in long-term debt are amounts owed on our bonds payable and other notes payable. These borrowings are further explained in
Note 8,
Long-term Debt
,
to the accompanying consolidated financial statements.
|
|
(b)
|
Interest on our fixed rate debt is presented using the stated interest rate. Interest expense on our variable rate debt is estimated using the rate in effect as of December 31,
2013
. Interest related to capital lease obligations is excluded from this line. Future minimum payments, which are accounted for as interest, related to sale/leaseback transactions involving real estate accounted for as financings are included in this line (see
Note 5,
Property and Equipment
, and
Note 8,
Long-term Debt
, to the accompanying consolidated financial statements). Amounts exclude amortization of debt discounts, amortization of loan fees, or fees for lines of credit that would be included in interest expense in our consolidated statements of operations.
|
|
(c)
|
Amounts include interest portion of future minimum capital lease payments.
|
|
(d)
|
We lease approximately 27% of our hospitals as well as other property and equipment under operating leases in the normal course of business. Some of our hospital leases contain escalation clauses based on changes in the Consumer Price Index while others have fixed escalation terms. The minimum lease payments do not include contingent rental expense. Some lease agreements provide us with the option to renew the lease or purchase the leased property. Our future operating lease obligations would change if we exercised these renewal options and if we entered into additional operating lease agreements. For more information, see
Note 5,
Property and Equipment
,
to the accompanying consolidated financial statements.
|
50
|
(e)
|
Future operating lease obligations and purchase obligations are not recognized in our consolidated balance sheet.
|
|
(f)
|
Purchase obligations include agreements to purchase goods or services that are enforceable and legally binding on HealthSouth and that specify all significant terms, including: fixed or minimum quantities to be purchased; fixed, minimum, or variable price provisions; and the approximate timing of the transaction. Purchase obligations exclude agreements that are cancelable without penalty. Our purchase obligations primarily relate to software licensing and support.
|
|
(g)
|
Because their future cash outflows are uncertain, the following noncurrent liabilities are excluded from the table above: general liability, professional liability, and workers’ compensation risks, noncurrent amounts related to third-party billing audits, and deferred income taxes. Also, as of December 31,
2013
, we had
$1.1 million
of total gross unrecognized tax benefits. For more information, see
Note 9,
Self-Insured Risks
,
Note 16,
Income Taxes
,
and
Note 18,
Contingencies and Other Commitments
,
to the accompanying consolidated financial statements. See also the discussion below of our purchases of the real estate associated with leased properties.
|
|
(h)
|
The table above does not include
Redeemable noncontrolling interests
of
$13.5 million
because of the uncertainty surrounding the timing and amounts of any related cash outflows.
|
Our capital expenditures include costs associated with our hospital refresh program, de novo projects, capacity expansions, technology initiatives, and building and equipment upgrades and purchases. During the year ended December 31,
2013
, we made capital expenditures of $
216.5 million
for property and equipment and capitalized software. These expenditures included costs associated with our investment in a new hospital to replace our formerly leased hospital in Ludlow, Massachusetts as well as approximately $70 million to purchase four leased properties, as discussed below. This amount is exclusive of
$28.9 million
related to the acquisition of Walton Rehabilitation Hospital in Augusta, Georgia. Approximately $75 million of the total spent was considered nondiscretionary expenditures, which we may refer to in other filings as “maintenance” expenditures.
During
2014
, we expect to spend approximately $185 million to $230 million for capital expenditures. This estimated range for capital expenditures is exclusive of acquisitions. Approximately $90 million to $100 million of this budgeted amount is considered nondiscretionary expenditures. This range of nondiscretionary expenditures includes approximately $12 million of hospital and technology equipment that was received in 2013 but not paid for until 2014. These items were not reflected in our statement of cash flows for 2013. Actual amounts spent will be dependent upon the timing of construction projects.
In the third quarter of 2013, we purchased the real estate previously subject to leases associated with four of our hospitals for approximately $70 million: Tallahassee, Florida; Montgomery, Alabama; Nittany Valley, Pennsylvania; and York, Pennsylvania. In addition, we have given notice of our intent to exercise the purchase option included in one other lease agreement associated with our hospitals. We continue to negotiate with the applicable landlord to finalize the fair value purchase price under the related lease agreement.
In December 2013, we signed an agreement to acquire an additional 30% equity interest from UMass Memorial Health Care, our joint venture partner in Fairlawn Rehabilitation Hospital in Worcester, Massachusetts. This transaction, which is subject to regulatory approval and is expected to close in 2014, will increase our ownership interest from 50% to 80% and will, when completed, result in a change in accounting for this hospital from the equity method of accounting to a consolidated entity. As a result of the consolidation of this hospital and the remeasurement of our previously held equity interest at fair value, we expect to record a $22 million to $32 million gain during 2014.
Authorizations for Returning Capital to Stakeholders
On February 15, 2013, our board of directors approved an increase in our existing common stock repurchase authorization from $125 million to $350 million. Consistent with our strategy of deploying financial resources towards long-term, shareholder value-creating opportunities, during the first quarter of 2013, we completed a tender offer for our common stock. As a result of the tender offer, we purchased approximately 9.1 million shares at a price of $25.50 per share for a total cost of $234.1 million, including fees and expenses relating to the tender offer. We used a combination of cash on hand and availability under our revolving credit facility to fund the repurchases. The remaining repurchase authorization expired at the end of the tender offer.
On July 25, 2013, our board of directors approved the initiation of a quarterly cash dividend on our common stock of $0.18 per share. The first quarterly dividend was paid on October 15, 2013 to stockholders of record as of the close of business on October 1, 2013. On October 25, 2013, our board of directors declared a cash dividend of $0.18 per share payable on January 15, 2014 to stockholders of record on January 2, 2014. We expect quarterly dividends to be paid in January, April, July,
51
and October. However, the actual declaration of any future cash dividends, and the setting of record and payment dates, will be established by our board of directors each quarter after consideration of various factors, including our capital position and the best interests of our stockholders. Cash dividends are expected to be funded using cash flows from operations, cash on hand, and availability under our revolving credit facility.
The payment of cash dividends on our common stock triggers antidilution adjustments, except in instances when such adjustments are deemed
de minimis,
under some of our securities that are convertible or exercisable into common stock. See
Note 17,
Earnings per Common Share
, to the accompanying consolidated financial statements.
On October 25, 2013, our board of directors authorized the repurchase of up to $200 million of our common stock. On February 14, 2014, our board of directors approved an increase in this common stock repurchase authorization from $200 million to $250 million. The repurchase authorization does not require the repurchase of a specific number of shares, has an indefinite term, and is subject to termination at any time by our board of directors. Subject to certain terms and conditions, including a maximum price per share and compliance with federal and state securities and other laws, the repurchases may be made from time to time in open market transactions, privately negotiated transactions, or other transactions, including trades under a plan established in accordance with Rule 10b5-1 under the Securities Exchange Act of 1934, as amended. Any repurchases under this authorization are expected to be funded using a combination of cash on hand and availability under our $600 million revolving credit facility.
Adjusted EBITDA
Management believes Adjusted EBITDA as defined in our credit agreement is a measure of our ability to service our debt and our ability to make capital expenditures. We reconcile Adjusted EBITDA to
Net income
and to
Net cash provided by operating activities
.
We use Adjusted EBITDA on a consolidated basis as a liquidity measure. We believe this financial measure on a consolidated basis is important in analyzing our liquidity because it is the key component of certain material covenants contained within our credit agreement, which is discussed in more detail in
Note 8,
Long-term Debt
, to the accompanying consolidated financial statements. These covenants are material terms of the credit agreement. Noncompliance with these financial covenants under our credit agreement—our interest coverage ratio and our leverage ratio—could result in our lenders requiring us to immediately repay all amounts borrowed. If we anticipated a potential covenant violation, we would seek relief from our lenders, which would have some cost to us, and such relief might not be on terms favorable to those in our existing credit agreement. In addition, if we cannot satisfy these financial covenants, we would be prohibited under our credit agreement from engaging in certain activities, such as incurring additional indebtedness, paying common stock dividends, making certain payments, and acquiring and disposing of assets. Consequently, Adjusted EBITDA is critical to our assessment of our liquidity.
In general terms, the credit agreement definition of Adjusted EBITDA, referred to as “Adjusted Consolidated
EBITDA” there, allows us to add back to consolidated
Net income
interest expense, income taxes, and depreciation and amortization and then add back to consolidated
Net income
(1) all unusual or nonrecurring items reducing consolidated
Net income
(of which only up to $10 million in a year may be cash expenditures), (2) costs and expenses related to refinancing transactions (in years prior to 2012), (3) any losses from discontinued operations and closed locations, (4) costs and expenses, including legal fees and expert witness fees, incurred with respect to litigation associated with stockholder derivative litigation, including the matters related to Ernst & Young LLP and Richard Scrushy discussed in
Note 18,
Contingencies and Other Commitments
, to the accompanying consolidated financial statements, and (5) share-based compensation expense. We also subtract from consolidated
Net income
all unusual or nonrecurring items to the extent increasing consolidated
Net income
.
Under the credit agreement, the Adjusted EBITDA calculation does not include net income attributable to noncontrolling interests and includes (1) gain or loss on disposal of assets, (2) professional fees unrelated to the stockholder derivative litigation, and (3) unusual or nonrecurring cash expenditures in excess of $10 million. These items may not be indicative of our ongoing performance, so the Adjusted EBITDA calculation presented here includes adjustments for them.
Adjusted EBITDA is not a measure of financial performance under generally accepted accounting principles in the United States of America, and the items excluded from Adjusted EBITDA are significant components in understanding and assessing financial performance. Therefore, Adjusted EBITDA should not be considered a substitute for
Net income
or cash flows from operating, investing, or financing activities. Because Adjusted EBITDA is not a measurement determined in accordance with GAAP and is thus susceptible to varying calculations, Adjusted EBITDA, as presented, may not be comparable to other similarly titled measures of other companies. Revenues and expenses are measured in accordance with the policies and procedures described in
Note 1,
Summary of Significant Accounting Policies
, to the accompanying consolidated financial statements.
52
Our Adjusted EBITDA for the years ended December 31,
2013
,
2012
, and
2011
was as follows (in millions):
Reconciliation of Net Income to Adjusted EBITDA
|
|
For the Year Ended December 31,
|
||||||||||
|
|
2013
|
2012
|
2011
|
||||||||
|
Net income
|
$
|
381.4
|
|
$
|
235.9
|
|
$
|
254.6
|
|
||
|
Loss (income) from discontinued operations, net of tax, attributable to HealthSouth
|
1.1
|
|
(4.5
|
)
|
(49.9
|
)
|
|||||
|
Provision for income tax expense
|
12.7
|
|
108.6
|
|
37.1
|
|
|||||
|
Interest expense and amortization of debt discounts and fees
|
100.4
|
|
94.1
|
|
119.4
|
|
|||||
|
Loss on early extinguishment of debt
|
2.4
|
|
4.0
|
|
38.8
|
|
|||||
|
Professional fees—accounting, tax, and legal
|
9.5
|
|
16.1
|
|
21.0
|
|
|||||
|
Government, class action, and related settlements
|
(23.5
|
)
|
(3.5
|
)
|
(12.3
|
)
|
|||||
|
Net noncash loss on disposal or impairment of assets
|
5.9
|
|
4.4
|
|
4.3
|
|
|||||
|
Depreciation and amortization
|
94.7
|
|
82.5
|
|
78.8
|
|
|||||
|
Stock-based compensation expense
|
24.8
|
|
24.1
|
|
20.3
|
|
|||||
|
Net income attributable to noncontrolling interests
|
(57.8
|
)
|
(50.9
|
)
|
(45.9
|
)
|
|||||
|
Gain on consolidation of St. Vincent Rehabilitation Hospital
|
—
|
|
(4.9
|
)
|
—
|
|
|||||
|
Adjusted EBITDA
|
$
|
551.6
|
|
$
|
505.9
|
|
$
|
466.2
|
|
||
Reconciliation of Net Cash Provided by Operating Activities to Adjusted EBITDA
|
|
For the Year Ended December 31,
|
||||||||||
|
|
2013
|
2012
|
2011
|
||||||||
|
Net cash provided by operating activities
|
$
|
470.3
|
|
$
|
411.5
|
|
$
|
342.7
|
|
||
|
Provision for doubtful accounts
|
(26.0
|
)
|
(27.0
|
)
|
(21.0
|
)
|
|||||
|
Professional fees—accounting, tax, and legal
|
9.5
|
|
16.1
|
|
21.0
|
|
|||||
|
Interest expense and amortization of debt discounts and fees
|
100.4
|
|
94.1
|
|
119.4
|
|
|||||
|
Equity in net income of nonconsolidated affiliates
|
11.2
|
|
12.7
|
|
12.0
|
|
|||||
|
Net income attributable to noncontrolling interests in continuing operations
|
(57.8
|
)
|
(50.9
|
)
|
(47.0
|
)
|
|||||
|
Amortization of debt discounts and fees
|
(5.0
|
)
|
(3.7
|
)
|
(4.2
|
)
|
|||||
|
Distributions from nonconsolidated affiliates
|
(11.4
|
)
|
(11.0
|
)
|
(13.0
|
)
|
|||||
|
Current portion of income tax expense
|
6.3
|
|
5.9
|
|
0.6
|
|
|||||
|
Change in assets and liabilities
|
48.9
|
|
58.1
|
|
41.4
|
|
|||||
|
Premium received on bond issuance
|
—
|
|
—
|
|
(4.1
|
)
|
|||||
|
Premium paid on bond redemption
|
1.7
|
|
1.9
|
|
26.9
|
|
|||||
|
Operating cash used in (provided by) discontinued operations
|
1.9
|
|
(2.0
|
)
|
(9.1
|
)
|
|||||
|
Other
|
1.6
|
|
0.2
|
|
0.6
|
|
|||||
|
Adjusted EBITDA
|
$
|
551.6
|
|
$
|
505.9
|
|
$
|
466.2
|
|
||
Growth in Adjusted EBITDA in each year was due primarily to revenue growth and disciplined expense management. Adjusted EBITDA for 2013 benefited from $6.7 million of adjustments to self-insurance reserves resulting from our change in assumptions related to our statistical confidence level, as discussed in the “Critical Accounting Estimates—Self-Insured Risks” section of this Item. Sequestration negatively impacted Adjusted EBITDA by approximately $25 million during 2013.
53
Off-Balance Sheet Arrangements
In accordance with the definition under SEC rules, the following qualify as off-balance sheet arrangements:
|
•
|
any obligation under certain guarantees or contracts;
|
|
•
|
a retained or contingent interest in assets transferred to an unconsolidated entity or similar entity or similar arrangement that serves as credit, liquidity, or market risk support to that entity for such assets;
|
|
•
|
any obligation under certain derivative instruments; and
|
|
•
|
any obligation under a material variable interest held by the registrant in an unconsolidated entity that provides financing, liquidity, market risk, or credit risk support to the registrant, or engages in leasing, hedging, or research and development services with the registrant.
|
As of December 31,
2013
, we do not have any material off-balance sheet arrangements.
As part of our ongoing business, we do not participate in transactions that generate relationships with unconsolidated entities or financial partnerships, such as entities often referred to as structured finance or special purpose entities (“SPEs”), which would have been established for the purpose of facilitating off-balance sheet arrangements or other contractually narrow or limited purposes. As of December 31,
2013
, we are not involved in any unconsolidated SPE transactions.
Critical Accounting Estimates
Our consolidated financial statements are prepared in accordance with GAAP. In connection with the preparation of our financial statements, we are required to make assumptions and estimates about future events and apply judgments that affect the reported amounts of assets, liabilities, revenue, expenses, and the related disclosures. We base our assumptions, estimates, and judgments on historical experience, current trends, and other factors we believe to be relevant at the time we prepared our consolidated financial statements. On a regular basis, we review the accounting policies, assumptions, estimates, and judgments to ensure our consolidated financial statements are presented fairly and in accordance with GAAP. However, because future events and their effects cannot be determined with certainty, actual results could differ from our assumptions and estimates, and such differences could be material.
Our significant accounting policies are discussed in
Note 1,
Summary of Significant Accounting Policies
, to the accompanying consolidated financial statements. We believe the following accounting estimates are the most critical to aid in fully understanding and evaluating our reported financial results, as they require our most difficult, subjective, or complex judgments, resulting from the need to make estimates about the effect of matters that are inherently uncertain. We have reviewed these critical accounting estimates and related disclosures with the audit committee of our board of directors.
Revenue Recognition
We recognize net patient service revenue in the reporting period in which we perform the service based on our current billing rates (i.e., gross charges) less actual adjustments and estimated discounts for contractual allowances (principally for patients covered by Medicare, Medicaid, and managed care and other health plans). See
Note 1,
Summary of Significant Accounting Policies
, “Net Operating Revenues,” to the accompanying consolidated financial statements for a complete discussion of our revenue recognition policies.
Our patient accounting system calculates contractual allowances on a patient-by-patient basis based on the rates in effect for each primary third-party payor. Other factors that are considered and could further influence the level of our reserves include the patient’s total length of stay for in-house patients, each patient’s discharge destination, the proportion of patients with secondary insurance coverage and the level of reimbursement under that secondary coverage, and the amount of charges that will be disallowed by payors. Such additional factors are assumed to remain consistent with the experience for patients discharged in similar time periods for the same payor classes, and additional reserves are provided to account for these factors.
Management continually reviews the contractual estimation process to consider and incorporate updates to laws and regulations and the frequent changes in managed care contractual terms that result from contract renegotiations and renewals. In addition, laws and regulations governing the Medicare and Medicaid programs are complex and subject to interpretation. If actual results are not consistent with our assumptions and judgments, we may be exposed to gains or losses that could be material.
54
In addition, CMS has developed and instituted various Medicare audit programs under which CMS contracts with private companies to conduct claims and medical record audits. In connection with CMS approved and announced RAC audits related to IRFs, we received requests in 2013 to review certain patient files for discharges occurring from 2010 to 2013. To date, the Medicare payments that are subject to these audit requests represent less than 1% of our Medicare patient discharges during those years, and not all of these patient file requests have resulted in payment denial determinations by the RACs. While we make provisions for these claims based on our historical experience and success rates in the claim adjudication process, we cannot provide assurance as to our future success in the resolution of these and future disputes, nor can we predict or estimate the scope or number of denials that ultimately may be reviewed. During 2013, we reduced our
Net operating revenues
by approximately $8 million for post-payment claims that are part of this review process.
Due to complexities involved in determining amounts ultimately due under reimbursement arrangements with third-party payors, which are often subject to interpretation and review, we may receive reimbursement for healthcare services authorized and provided that is different from our estimates, and such differences could be material. However, we continually review the amounts actually collected in subsequent periods in order to determine the amounts by which our estimates differed. Historically, such differences have not been material from either a quantitative or qualitative perspective.
Allowance for Doubtful Accounts
The collection of outstanding receivables from third-party payors and patients is our primary source of cash and is critical to our operating performance. We provide for accounts receivable that could become uncollectible by establishing an allowance to reduce the carrying value of such receivables to their estimated net realizable value. See
Note 1,
Summary of Significant Accounting Policies
, “Accounts Receivable and the Allowance for Doubtful Accounts,” and
Note 4,
Accounts Receivable
, to the accompanying consolidated financial statements for a complete discussion of our policies related to the allowance for doubtful accounts.
Our primary collection risks relate to patient accounts for which the primary insurance carrier has paid the amounts covered by the applicable agreement, but patient responsibility amounts (deductibles and co-payments) remain outstanding. Changes in general economic conditions (such as increased unemployment rates or periods of recession), business office operations, payor mix, or trends in federal or state governmental and private employer healthcare coverage could affect our collection of accounts receivable. We estimate our allowance for doubtful accounts based on the aging of our accounts receivable, our historical collection experience for each type of payor, and other relevant factors so that the remaining receivables, net of allowances, are reflected at their estimated net realizable values.
For several years, under programs designated as “widespread probes,”certain of our MACs have conducted pre-payment claim reviews of our billing and denied payment for certain diagnosis codes based on medical necessity. We dispute, or “appeal,” most of these denials, and we collect approximately
58%
of all amounts denied. For claims we choose to take through all levels of appeal, up to and including administrative law judge hearings, we have historically experienced an approximate 70% success rate. Because we do not write-off receivables until all collection efforts have been exhausted, we do not write-off receivables related to denied claims while they are in this review process. The resolution of these disputes can take in excess of two years.
If actual results are not consistent with our assumptions and judgments, we may be exposed to gains or losses that could be material. As of December 31,
2013
and
2012
,
$22.5 million
and
$20.4 million
, or
7.8%
, of our patient accounts receivable represented denials by MACs that were in the pre-payment medical necessity review process. During the years ended December 31,
2013
,
2012
, and
2011
, we wrote off
$3.5 million
,
$0.2 million
, and
$0.5 million
, respectively, of previously denied claims while we collected
$1.7 million
,
$4.3 million
, and
$1.9 million
, respectively, of previously denied claims.
55
The table below shows a summary of our net accounts receivable balances as of
December 31, 2013
and
2012
. Information on the concentration of total patient accounts receivable by payor class can be found in
Note 1,
Summary of Significant Accounting Policies
, “Accounts Receivable and the Allowance for Doubtful Accounts,” to the accompanying consolidated financial statements.
|
|
As of December 31,
|
||||||
|
|
2013
|
2012
|
|||||
|
|
(In Millions)
|
||||||
|
0 - 30 Days
|
$
|
194.1
|
|
$
|
178.9
|
|
|
|
31 - 60 Days
|
21.7
|
|
19.6
|
|
|||
|
61 - 90 Days
|
10.2
|
|
9.4
|
|
|||
|
91 - 120 Days
|
3.4
|
|
4.6
|
|
|||
|
120 + Days
|
20.0
|
|
18.8
|
|
|||
|
Current patients accounts receivable, net
|
249.4
|
|
231.3
|
|
|||
|
Noncurrent patient accounts receivable, net
|
16.6
|
|
—
|
|
|||
|
Other accounts receivable
|
12.4
|
|
18.0
|
|
|||
|
Accounts receivable, net
|
$
|
278.4
|
|
$
|
249.3
|
|
|
Self-Insured Risks
We are self-insured for certain losses related to professional liability, general liability, and workers’ compensation risks. Although we obtain third-party insurance coverage to limit our exposure to these claims, a substantial portion of our professional liability, general liability, and workers’ compensation risks are insured through a wholly owned insurance subsidiary. See
Note 9,
Self-Insured Risks
, to the accompanying consolidated financial statements for a more complete discussion of our self-insured risks.
Our self-insured liabilities contain uncertainties because management must make assumptions and apply judgment to estimate the ultimate cost to settle reported claims and claims incurred but not reported as of the balance sheet date. Our reserves and provisions for professional liability, general liability, and workers’ compensation risks are based largely upon semi-annual actuarial calculations prepared by third-party actuaries.
Periodically, we review our assumptions and the valuations provided by third-party actuaries to determine the adequacy of our self-insurance reserves. The following are the key assumptions and other factors that significantly influence our estimate of self-insurance reserves:
|
•
|
Historical claims experience
|
|
•
|
Trending of loss development factors
|
|
•
|
Trends in the frequency and severity of claims
|
|
•
|
Coverage limits of third-party insurance
|
|
•
|
Demographic information
|
|
•
|
Statistical confidence levels
|
|
•
|
Medical cost inflation
|
|
•
|
Payroll dollars
|
|
•
|
Hospital patient census
|
The time period to resolve claims can vary depending upon the jurisdiction and whether the claims are settled or litigated. The estimation of the timing of payments beyond a year can vary significantly. In addition, if current and future claims differ from historical trends, our estimated reserves for self-insured claims may be significantly affected. Our self-insurance reserves are not discounted.
56
Given the number of factors used to establish our self-insurance reserves, we believe there is limited benefit to isolating any individual assumption or parameter from the detailed computational process and calculating the impact of changing that single item. Instead, we believe the sensitivity in our reserve estimates is best illustrated by changes in the statistical confidence level used in the computations. Using a higher statistical confidence level increases the estimated self-insurance reserves. The following table shows the sensitivity of our recorded self-insurance reserves to the statistical confidence level (in millions):
|
Net self-insurance reserves as of December 31, 2013:
|
|||
|
As reported, with 50% statistical confidence level
|
$
|
107.7
|
|
|
With 70% statistical confidence level
|
114.4
|
|
|
Over the past few years, we have experienced volatility in our estimates of prior year claim reserves due primarily to favorable trends in claims and industry-wide loss development trends. We believe our efforts to improve patient safety and overall quality of care, as well as our efforts to reduce workplace injuries, have helped contain our ultimate claim costs. With the accumulation of this additional historical data and current favorable trends, when we analyzed our assumptions during our semi-annual review of our self-insurance reserves in the fourth quarter of 2013, we lowered the statistical confidence level used to determine our self-insurance reserves from 70% to 50%. This change, which reflects our current best estimate based on the trends we are experiencing in the resolution of claims, reduced our reserves included in continuing operations by $6.7 million in the fourth quarter of 2013.
We believe our self-insurance reserves are adequate to cover projected costs. Due to the considerable variability that is inherent in such estimates, there can be no assurance the ultimate liability will not exceed management’s estimates. If actual results are not consistent with our assumptions and judgments, we may be exposed to gains or losses that could be material.
Goodwill
Absent any impairment indicators, we evaluate goodwill for impairment as of October 1
st
of each year. We test goodwill for impairment at the reporting unit level and are required to make certain subjective and complex judgments on a number of matters, including assumptions and estimates used to determine the fair value of our single reporting unit. We assess qualitative factors in our single reporting unit to determine whether it is necessary to perform the first step of the two-step quantitative goodwill impairment test. The quantitative impairment test is required only if we conclude it is more likely than not our reporting unit’s fair value is less than its carrying amount.
If, based on our qualitative assessment, we were to believe we must proceed to Step 1, we would determine the fair value of our reporting unit using generally accepted valuation techniques including the income approach and the market approach. We would validate our estimates under the income approach by reconciling the estimated fair value of our reporting unit determined under the income approach to our market capitalization and estimated fair value determined under the market approach. Values from the income approach and market approach would then be evaluated and weighted to arrive at the estimated aggregate fair value of the reporting unit.
The income approach includes the use of our reporting unit’s projected operating results and cash flows that are discounted using a weighted-average cost of capital that reflects market participant assumptions. The projected operating results use management’s best estimates of economic and market conditions over the forecasted period including assumptions for pricing and volume, operating expenses, and capital expenditures. Other significant estimates and assumptions include cost-saving synergies and tax benefits that would accrue to a market participant under a fair value methodology. The market approach estimates fair value through the use of observable inputs, including the Company’s stock price.
See
Note 1,
Summary of Significant Accounting Policies
, “Goodwill and Other Intangibles,” and
Note 6,
Goodwill and Other Intangible Assets
, to the accompanying consolidated financial statements for additional information.
The following events and circumstances are certain of the qualitative factors we consider in evaluating whether it is more likely than not the fair value of our reporting unit is less than its carrying amount:
|
•
|
Macroeconomic conditions, such as deterioration in general economic conditions, limitations on accessing capital, or other developments in equity and credit markets;
|
|
•
|
Industry and market considerations and changes in healthcare regulations, including reimbursement and compliance requirements under the Medicare and Medicaid programs;
|
57
|
•
|
Cost factors, such as an increase in labor, supply, or other costs;
|
|
•
|
Overall financial performance, such as negative or declining cash flows or a decline in actual or forecasted revenue or earnings;
|
|
•
|
Other relevant company-specific events, such as material changes in management or key personnel or outstanding litigation;
|
|
•
|
Material events, such as a change in the composition or carrying amount of our reporting unit’s net assets, including acquisitions and dispositions; and
|
|
•
|
Consideration of the relationship of our market capitalization to our book value, as well as a sustained decrease in our share price.
|
In the fourth quarter of 2013, we assessed the qualitative factors described above for our reporting unit and concluded it is more likely than not the fair value of our reporting unit is greater than its carrying amount. As a result of this assessment of qualitative factors, we determined it was not necessary to perform the two-step goodwill impairment test on our reporting unit. If actual results are not consistent with our assumptions and estimates, we may be exposed to goodwill impairment charges. However, at this time, we continue to believe our reporting unit is not at risk for any impairment charges.
Income Taxes
We provide for income taxes using the asset and liability method. We also evaluate our tax positions and establish assets and liabilities in accordance with the applicable accounting guidance on uncertainty in income taxes. See
Note 1,
Summary of Significant Accounting Policies
, “Income Taxes,” and
Note 16,
Income Taxes
, to the accompanying consolidated financial statements for a more complete discussion of income taxes and our policies related to income taxes.
The application of income tax law is inherently complex. Laws and regulations in this area are voluminous and are often ambiguous. We are required to make many subjective assumptions and judgments regarding our income tax exposures. Interpretations of and guidance surrounding income tax laws and regulations change over time. As such, changes in our subjective assumptions and judgments can materially affect amounts recognized in our consolidated financial statements.
The ultimate recovery of certain of our deferred tax assets is dependent on the amount and timing of taxable income we will ultimately generate in the future, as well as other factors. A high degree of judgment is required to determine the extent a valuation allowance should be provided against deferred tax assets. On a quarterly basis, we assess the likelihood of realization of our deferred tax assets considering all available evidence, both positive and negative. Our operating performance in recent years, the scheduled reversal of temporary differences, our forecast of taxable income in future periods in each applicable tax jurisdiction, our ability to sustain a core level of earnings, and the availability of prudent tax planning strategies are important considerations in our assessment. Our forecast of future earnings includes assumptions about patient volumes, payor reimbursement, labor costs, hospital operating expenses, and interest expense. Based on the weight of available evidence, we determine if it is more likely than not our deferred tax assets will be realized in the future.
Our liability for unrecognized tax benefits contains uncertainties because management is required to make assumptions and to apply judgment to estimate the exposures associated with our various filing positions which are periodically audited by tax authorities. In addition, our effective income tax rate is affected by changes in tax law, the tax jurisdictions in which we operate, and the results of income tax audits.
During the year ended December 31,
2013
, we decreased our valuation allowance by
$9.1 million
. As of December 31,
2013
, we had a remaining valuation allowance of
$30.7 million
which related to state NOLs. At the state jurisdiction level, we determined it was necessary to maintain a valuation allowance due to uncertainties related to our ability to utilize a portion of the deferred tax assets before they expire. The amount of the valuation allowance has been determined for each tax jurisdiction based on the weight of all available evidence, as described above, including management’s estimates of taxable income for each jurisdiction in which we operate over the periods in which the related deferred tax assets will be recoverable.
While management believes the assumptions included in its forecast of future earnings are reasonable and it is more likely than not the net deferred tax asset balance as of December 31,
2013
will be realized, no such assurances can be provided. If management’s expectations for future operating results on a consolidated basis or at the state jurisdiction level vary from actual results due to changes in healthcare regulations, general economic conditions, or other factors, we may need to increase our valuation allowance, or reverse amounts recorded currently in the valuation allowance, for all or a portion of our deferred tax assets. Similarly, future adjustments to our valuation allowance may be necessary if the timing of future tax deductions is
58
different than currently expected. Our income tax expense in future periods will be reduced or increased to the extent of offsetting decreases or increases, respectively, in our valuation allowance in the period when the change in circumstances occurs. These changes could have a significant impact on our future earnings.
Assessment of Loss Contingencies
We have legal and other contingencies that could result in significant losses upon the ultimate resolution of such contingencies. See
Note 1,
Summary of Significant Accounting Policies
, “Litigation Reserves,” and
Note 18,
Contingencies and Other Commitments
, to the accompanying consolidated financial statements for additional information.
We have provided for losses in situations where we have concluded it is probable a loss has been or will be incurred and the amount of loss is reasonably estimable. A significant amount of judgment is involved in determining whether a loss is probable and reasonably estimable due to the uncertainty involved in determining the likelihood of future events and estimating the financial statement impact of such events. If further developments or resolution of a contingent matter are not consistent with our assumptions and judgments, we may need to recognize a significant charge in a future period related to an existing contingent matter.
Recent Accounting Pronouncements
For information regarding recent accounting pronouncements, see
Note 1,
Summary of Significant Accounting Policies
, to the accompanying consolidated financial statements.
|
Item 7A.
|
Quantitative and Qualitative Disclosures about Market Risk
|
Our primary exposure to market risk is to changes in interest rates on our variable rate long-term debt. We use sensitivity analysis models to evaluate the impact of interest rate changes on our variable rate debt. As of December 31, 2013, our primary variable rate debt outstanding related to
$45.0 million
in advances under our revolving credit facility. Assuming outstanding balances were to remain the same, a 1% increase in interest rates would result in an incremental negative cash flow of approximately
$0.4 million
over the next 12 months, while a 1% decrease in interest rates would result in an incremental positive cash flow of approximately
$0.1 million
over the next 12 months, assuming floating rate indices are floored at 0%.
59
The fair value of our fixed rate debt is determined using inputs, including quoted prices in nonactive markets, that are observable either directly or indirectly, or
Level 2
inputs within the fair value hierarchy, and is summarized as follows (in millions):
|
December 31, 2013
|
December 31, 2012
|
|||||||||||||||
|
Financial Instrument:
|
Book Value
|
Market Value
|
Book Value
|
Market Value
|
||||||||||||
|
7.25% Senior Notes due 2018
|
||||||||||||||||
|
Carrying Value
|
$
|
272.4
|
|
$
|
—
|
|
$
|
302.9
|
|
$
|
—
|
|
||||
|
Unamortized debt premium
|
(1.0
|
)
|
—
|
|
(1.4
|
)
|
—
|
|
||||||||
|
Principal amount
|
271.4
|
|
291.4
|
|
301.5
|
|
328.6
|
|
||||||||
|
8.125% Senior Notes due 2020
|
||||||||||||||||
|
Carrying Value
|
286.6
|
|
—
|
|
286.2
|
|
—
|
|
||||||||
|
Unamortized debt discount
|
3.4
|
|
—
|
|
3.8
|
|
—
|
|
||||||||
|
Principal amount
|
290.0
|
|
319.4
|
|
290.0
|
|
321.5
|
|
||||||||
|
7.75% Senior Notes due 2022
|
||||||||||||||||
|
Carrying Value
|
252.5
|
|
—
|
|
280.7
|
|
—
|
|
||||||||
|
Unamortized debt premium
|
(1.4
|
)
|
—
|
|
(1.7
|
)
|
—
|
|
||||||||
|
Principal amount
|
251.1
|
|
275.0
|
|
279.0
|
|
306.5
|
|
||||||||
|
5.75% Senior Notes due 2024
|
||||||||||||||||
|
Carrying Value
|
275.0
|
|
—
|
|
275.0
|
|
—
|
|
||||||||
|
Unamortized debt discount
|
—
|
|
—
|
|
—
|
|
—
|
|
||||||||
|
Principal amount
|
275.0
|
|
273.6
|
|
275.0
|
|
277.1
|
|
||||||||
|
2.00% Convertible Senior Subordinated Notes due 2043
|
||||||||||||||||
|
Carrying Value
|
249.5
|
|
—
|
|
—
|
|
—
|
|
||||||||
|
Unamortized debt discount
|
70.5
|
|
—
|
|
—
|
|
—
|
|
||||||||
|
Principal amount
|
320.0
|
|
339.7
|
|
—
|
|
—
|
|
||||||||
Foreign operations, and the related market risks associated with foreign currencies, are currently, and have been, insignificant to our financial position, results of operations, and cash flows.
|
Item 8.
|
Financial Statements and Supplementary Data
|
Our consolidated financial statements and related notes are filed together with this report. See the index to financial statements on page F-1 for a list of financial statements filed with this report.
|
Item 9.
|
Changes in and Disagreements with Accountants on Accounting and Financial Disclosure
|
None.
|
Item 9A.
|
Controls and Procedures
|
Evaluation of Disclosure Controls and Procedures
As of the end of the period covered by this report, an evaluation was carried out by our management, including our chief executive officer and chief financial officer, of the effectiveness of our disclosure controls and procedures as defined in Rules 13a-15(e) and 15d-15(e) of the Securities Exchange Act of 1934, as amended (the “Exchange Act”). Our disclosure controls and procedures are designed to ensure that information required to be disclosed in reports we file or submit under the Exchange Act is recorded, processed, summarized, and reported within the time periods specified in the rules and forms of the Securities and Exchange Commission and that such information is accumulated and communicated to our management, including our chief executive officer and chief financial officer, to allow timely decisions regarding required disclosures. Based on our evaluation, our chief executive officer and chief financial officer concluded that, as of December 31,
2013
, our disclosure controls and procedures were effective.
60
Management’s Report on Internal Control Over Financial Reporting
Our management is responsible for establishing and maintaining adequate internal control over financial reporting, as such term is defined in Rules 13a-15(f) and 15d-15(f) under the Exchange Act. Internal control over financial reporting is a process designed to provide reasonable assurance regarding the reliability of financial reporting and the preparation of financial statements for external purposes in accordance with generally accepted accounting principles in the United States of America. Internal control over financial reporting includes those policies and procedures that (1) pertain to the maintenance of records that, in reasonable detail, accurately and fairly reflect the transactions and dispositions of the assets of the Company; (2) provide reasonable assurance that transactions are recorded as necessary to permit preparation of financial statements in accordance with GAAP, and that receipts and expenditures of the Company are being made only in accordance with authorizations of management and directors of the Company; and (3) provide reasonable assurance regarding prevention or timely detection of unauthorized acquisition, use, or disposition of the Company’s assets that could have a material effect on its financial statements. Because of its inherent limitations, internal control over financial reporting may not prevent or detect misstatements. Also, projections of any evaluation of effectiveness to future periods are subject to the risk that controls may become inadequate because of changes in conditions or that the degree of compliance with the policies or procedures may deteriorate.
Under the supervision and with the participation of our management, including our chief executive officer and chief financial officer, we conducted an assessment of the effectiveness of our internal control over financial reporting as of December 31,
2013
. In making this assessment, management used the criteria set forth in
Internal Control-Integrated Framework
(1992) issued by the Committee of Sponsoring Organizations of the Treadway Commission, the COSO framework
.
Based on our evaluation, our chief executive officer and chief financial officer concluded that, as of December 31,
2013
, our internal control over financial reporting was effective.
The effectiveness of the Company’s internal control over financial reporting as of December 31,
2013
has been audited by PricewaterhouseCoopers LLP, an independent registered public accounting firm, as stated in their report which appears herein.
Changes in Internal Control Over Financial Reporting
There were no changes in the Company’s internal controls over financial reporting that occurred during the quarter ended December 31,
2013
that have materially affected, or are reasonably likely to materially affect, the Company’s internal control over financial reporting.
|
Item 9B.
|
Other Information
|
None.
61
We expect to file a definitive proxy statement relating to our
2014
Annual Meeting of Stockholders (the “
2014
Proxy Statement”) with the United States Securities and Exchange Commission, pursuant to Regulation 14A, not later than 120 days after the end of our most recent fiscal year. Accordingly, certain information required by Part III has been omitted under General Instruction G(3) to Form 10-K. Only the information from the
2014
Proxy Statement that specifically addresses disclosure requirements of Items 10-14 below is incorporated by reference.
|
Item 10.
|
Directors and Executive Officers of the Registrant
|
As previously announced, Mr. Jon F. Hanson, the current chairman of our board of directors, will be retiring effective as of the adjournment of our 2014 annual meeting of stockholders on May 1, 2014. Accordingly, Mr. Hanson will not be included as a nominee in our 2014 Proxy Statement. In connection with Mr. Hanson’s retirement, our board unanimously approved on February 14, 2014 a decrease in the number of directors to ten effective as of the adjournment of our 2014 annual meeting.
Mr. Hanson, age 77, is the chairman and founder of The Hampshire Companies and has over 50 years of experience in the real estate industry. Mr. Hanson was named non-executive chairman of the board of HealthSouth, effective October 1, 2005 and has served as a director since September 17, 2002. From 1994 through 2005, Mr. Hanson served as chairman of the National Football Foundation and College Hall of Fame, Inc. He now serves as chairman emeritus. Mr. Hanson served for 20 years as a director, including two years as the lead director, of Prudential Financial, Inc. He also served for 21 years as a director, and now serves as an honorary director, of the Hackensack University Medical Center. Mr. Hanson currently serves as chairman of the board of Pascack Community Bank and as a director of Yankee Global Enterprises.
The other information required by Item 10 is hereby incorporated by reference from our
2014
Proxy Statement under the captions “Items of Business Requiring Your Vote—Proposal 1—Election of Directors,” “Corporate Governance and Board Structure—Code of Ethics,” “Corporate Governance and Board Structure—Proposals for Director Nominees by Stockholders,” “Corporate Governance and Board Structure—Audit Committee,” “Section 16(a) Beneficial Ownership Reporting Compliance,” and “Executive Officers.”
|
Item 11.
|
Executive Compensation
|
The information required by Item 11 is hereby incorporated by reference from our
2014
Proxy Statement under the captions “Corporate Governance and Board Structure—Compensation of Directors,” “Compensation Committee Matters,” and “Executive Compensation.”
|
Item 12.
|
Security Ownership of Certain Beneficial Owners and Management and Related Stockholder Matters
|
Equity Compensation Plans
The following table sets forth, as of
December 31, 2013
, information concerning compensation plans under which our securities are authorized for issuance. The table does not reflect grants, awards, exercises, terminations, or expirations since that date. All share amounts and exercise prices have been adjusted to reflect stock splits that occurred after the date on which any particular underlying plan was adopted, to the extent applicable.
|
Securities to be Issued Upon Exercise
|
Weighted Average Price
(1)
|
Securities Available for Future Issuance
|
|||||||
|
Plans approved by stockholders
|
4,642,531
|
|
(2)
|
$
|
20.21
|
|
4,206,112
|
|
(3)
|
|
Plans not approved by stockholders
|
912,435
|
|
(4)
|
21.98
|
|
—
|
|
||
|
Total
|
5,554,966
|
|
20.82
|
|
4,206,112
|
|
|||
|
(1)
|
This calculation does not take into account awards of restricted stock, restricted stock units, or performance share units.
|
|
(2)
|
This amount assumes maximum performance by performance-based awards for which the performance has not yet been determined.
|
62
|
(3)
|
This amount represents the number of shares available for future equity grants under the Amended and Restated 2008 Equity Incentive Plan approved by our stockholders in May 2011.
|
|
(4)
|
This amount includes (a) 805,773
and 7,029
shares issuable upon exercise of stock options outstanding under the
2005 Equity Incentive Plan and the Key Executive Incentive Program, respectively, and (b) 99,633 restr
icted stock units issued under the 2004 Amended and Restated Director Incentive Plan.
|
2004 Amended and Restated Director Incentive Plan
The 2004 Amended and Restated Director Incentive Plan (the “2004 Plan”) provided for the grant of common stock, awards of restricted common stock, and the right to receive awards of common stock, which we refer to as “restricted stock units,” to our nonemployee directors. The 2004 Plan expired in March 2008 and was replaced by the 2008 Equity Incentive Plan. Some awards remain outstanding. Awards granted under the 2004 Plan at the time of its termination will continue in effect in accordance with their terms. Awards of restricted stock units were fully vested when awarded and will be settled in shares of common stock on the earlier of the six-month anniversary of the date on which the director ceases to serve on the board of directors or certain change in control events. The restricted stock units generally cannot be transferred. Awards are generally protected against dilution upon the issuance of stock dividends and in the event of a stock split, recapitalization, or other major corporate restructuring.
2005 Equity Incentive Plan
The 2005 Equity Incentive Plan (the “2005 Plan”) provided for the grant of stock options, restricted stock, stock appreciation rights, deferred stock, and other stock-based awards to our directors, executives, and other key employees as determined by the board of directors or the compensation committee in accordance with the terms of the 2005 Plan and evidenced by an award agreement with each participant. The 2005 Plan expired in November 2008 and was replaced by the 2008 Equity Incentive Plan. Some option awards remain outstanding and are fully vested. Awards granted under the 2005 Plan at the time of its termination will continue in effect in accordance with their terms. The outstanding options have an exercise price not less than the fair market value of such shares of common stock on the date of grant and an expiration date that is ten years after the grant date. Awards are generally protected against dilution upon the issuance of stock dividends and in the event of a stock split, recapitalization, or other major corporate restructuring.
Key Executive Incentive Program
On November 17, 2005, our board of directors adopted the Key Executive Incentive Program, which was a response to unusual employee retention needs we were experiencing at that particular time and served as a means of ensuring management continuity during the Company’s strategic repositioning expected to continue through 2008. The associated equity awards, which were made on November 17, 2005, were one-time special equity grants designed to keep key members of our management team intact and to be an effective deterrent to officers leaving the Company during our transition phase. Some option awards remain outstanding and are fully vested. The options vested 25% in January 2007, 25% in January 2008, and the remaining 50% in January 2009. The outstanding options have an exercise price not less than the fair market value of such shares of common stock on the date of grant and an expiration date that is ten years after the grant date. Awards are generally protected against dilution upon the issuance of stock dividends and in the event of a stock split, recapitalization, or other major corporate restructuring.
Security Ownership of Certain Beneficial Owners and Management
The other information required by Item 12 is hereby incorporated by reference from our
2014
Proxy Statement under the caption “Security Ownership of Certain Beneficial Owners and Management.”
|
Item 13.
|
Certain Relationships and Related Transactions and Director Independence
|
The information required by Item 13 is hereby incorporated by reference from our
2014
Proxy Statement under the captions “Corporate Governance and Board Structure—Director Independence” and “Certain Relationships and Related Transactions.”
|
Item 14.
|
Principal Accountant Fees and Services
|
The information required by Item 14 is hereby incorporated by reference from our
2014
Proxy Statement under the caption “Items of Business Requiring Your Vote—Proposal 2—Ratification of Appointment of Independent Registered Public Accounting Firm.”
63
|
Item 15.
|
Exhibits and Financial Statement Schedules
|
Financial Statements
See the accompanying index on page F-1 for a list of financial statements filed as part of this report.
Financial Statement Schedules
None.
Exhibits
See Exhibit Index immediately following page
F-69 o
f this report.
64
SIGNATURES
Pursuant to the requirements of Section 13 or 15(d) of the Securities Exchange Act of 1934, the Registrant has duly caused this Report to be signed on its behalf by the undersigned, thereunto duly authorized.
|
|
HEALTHSOUTH CORPORATION
|
|
|
|
|
|
|
|
|
|
By:
|
/s/ J
AY
G
RINNEY
|
|
|
|
|
Jay Grinney
|
|
|
|
|
President and Chief Executive Officer
|
|
|
|
Date:
|
February 20, 2014
|
|
POWER OF ATTORNEY
Each person whose signature appears below hereby constitutes and appoints John P. Whittington his true and lawful attorney-in-fact and agent with full power of substitution and re-substitution, for him in his name, place and stead, in any and all capacities, to sign any and all amendments to this Report and to file the same, with all exhibits thereto, and other documents in connection therewith, with the Securities and Exchange Commission, and hereby grants to such attorney-in-fact and agent, full power and authority to do and perform each and every act and thing requisite and necessary to be done, as fully to all intents and purposes as he might or could do in person, hereby ratifying and confirming all that said attorney-in-fact and agent or his substitute or substitutes may lawfully do or cause to be done by virtue hereof.
65
Pursuant to the requirements of the Securities Exchange Act of 1934, this Report has been signed below by the following persons on behalf of the Registrant and in the capacities and on the dates indicated.
|
Signature
|
Capacity
|
Date
|
|
|
|
|
|
/s/ J
AY
G
RINNEY
|
President and Chief Executive Officer and Director
|
February 20, 2014
|
|
Jay Grinney
|
|
|
|
|
|
|
|
/s/ D
OUGLAS
E.
C
OLTHARP
|
Executive Vice President and Chief Financial Officer
|
February 20, 2014
|
|
Douglas E. Coltharp
|
|
|
|
|
|
|
|
/s/ A
NDREW
L
.
P
RICE
|
Chief Accounting Officer
|
February 20, 2014
|
|
Andrew L. Price
|
|
|
|
|
|
|
|
/s/ J
ON
F. H
ANSON
|
Chairman of the Board of Directors
|
February 20, 2014
|
|
Jon F. Hanson
|
|
|
|
|
|
|
|
/s/ J
OHN
W. C
HIDSEY
|
Director
|
February 20, 2014
|
|
John W. Chidsey
|
|
|
|
|
|
|
|
/s/ D
ONALD
L. C
ORRELL
|
Director
|
February 20, 2014
|
|
Donald L. Correll
|
|
|
|
|
|
|
|
/s/ Y
VONNE
M. C
URL
|
Director
|
February 20, 2014
|
|
Yvonne M. Curl
|
|
|
|
/s/ C
HARLES
M. E
LSON
|
Director
|
February 20, 2014
|
|
Charles M. Elson
|
|
|
|
|
|
|
|
/s/ J
OAN
E. H
ERMAN
|
Director
|
February 20, 2014
|
|
Joan E. Herman
|
|
|
|
|
|
|
|
/s/ L
EO
I. H
IGDON
, J
R
.
|
Director
|
February 20, 2014
|
|
Leo I. Higdon, Jr.
|
|
|
|
|
|
|
|
/s/ L
ESLYE
G. K
ATZ
|
Director
|
February 20, 2014
|
|
Leslye G. Katz
|
|
|
|
|
|
|
|
/s/ J
OHN
E. M
AUPIN
, J
R.
|
Director
|
February 20, 2014
|
|
John E. Maupin, Jr.
|
|
|
|
|
|
|
|
/s/ L. E
DWARD
S
HAW
, J
R
.
|
Director
|
February 20, 2014
|
|
L. Edward Shaw, Jr.
|
|
|
66
|
Item 15.
|
Financial Statements
|
F-1
Report of Independent Registered Public Accounting Firm
To the Board of Directors and Shareholders of HealthSouth Corporation:
In our opinion, the accompanying consolidated
balance sheets and the related consolidated statements of operations, comprehensive income, shareholders’ equity and cash flows present fairly, in all material respects, the financial position of HealthSouth Corporation and its subsidiaries at
December 31, 2013
and
2012
, and the results of their operations and their cash flows for each of the three years in the period ended
December 31, 2013
in conformity with accounting principles generally accepted in the United States of America. Also in our opinion, the Company maintained, in all material respects, effective internal control over financial reporting as of
December 31, 2013
, based on criteria established in
Internal Control - Integrated Framework
(1992) issued by the Committee of Sponsoring Organizations of the Treadway Commission (COSO). The Company’s management is responsible for these financial statements, for maintaining effective internal control over financial reporting and for its assessment of the effectiveness of internal control over financial reporting, included in Management’s Report on Internal Control over Financial Reporting appearing under Item 9A. Our responsibility is to express opinions on these financial statements and on the Company’s internal control over financial reporting based on our integrated audits. We conducted our audits in accordance with the standards of the Public Company Accounting Oversight Board (United States). Those standards require that we plan and perform the audits to obtain reasonable assurance about whether the financial statements are free of material misstatement and whether effective internal control over financial reporting was maintained in all material respects. Our audits of the financial statements included examining, on a test basis, evidence supporting the amounts and disclosures in the financial statements, assessing the accounting principles used and significant estimates made by management, and evaluating the overall financial statement presentation. Our audit of internal control over financial reporting included obtaining an understanding of internal control over financial reporting, assessing the risk that a material weakness exists, and testing and evaluating the design and operating effectiveness of internal control based on the assessed risk. Our audits also included performing such other procedures as we considered necessary in the circumstances. We believe that our audits provide a reasonable basis for our opinions.
A company’s internal control over financial reporting is a process designed to provide reasonable assurance regarding the reliability of financial reporting and the preparation of financial statements for external purposes in accordance with generally accepted accounting principles. A company’s internal control over financial reporting includes those policies and procedures that (i) pertain to the maintenance of records that, in reasonable detail, accurately and fairly reflect the transactions and dispositions of the assets of the company; (ii) provide reasonable assurance that transactions are recorded as necessary to permit preparation of financial statements in accordance with generally accepted accounting principles, and that receipts and expenditures of the company are being made only in accordance with authorizations of management and directors of the company; and (iii) provide reasonable assurance regarding prevention or timely detection of unauthorized acquisition, use, or disposition of the company’s assets that could have a material effect on the financial statements.
Because of its inherent limitations, internal control over financial reporting may not prevent or detect misstatements. Also, projections of any evaluation of effectiveness to future periods are subject to the risk that controls may become inadequate because of changes in conditions, or that the degree of compliance with the policies or procedures may deteriorate.
/s/ PricewaterhouseCoopers LLP
PricewaterhouseCoopers LLP
Birmingham, Alabama
February
20
, 2014
F-2
|
HealthSouth Corporation and Subsidiaries
Consolidated Statements of Operations
|
||
|
|
For the Year Ended December 31,
|
||||||||||
|
|
2013
|
2012
|
2011
|
||||||||
|
|
(In Millions, Except Per Share Data)
|
||||||||||
|
Net operating revenues
|
$
|
2,273.2
|
|
$
|
2,161.9
|
|
$
|
2,026.9
|
|
||
|
Less: Provision for doubtful accounts
|
(26.0
|
)
|
(27.0
|
)
|
(21.0
|
)
|
|||||
|
Net operating revenues less provision for doubtful accounts
|
2,247.2
|
|
2,134.9
|
|
2,005.9
|
|
|||||
|
Operating expenses:
|
|
|
|
|
|
|
|||||
|
Salaries and benefits
|
1,089.7
|
|
1,050.2
|
|
982.0
|
|
|||||
|
Other operating expenses
|
323.0
|
|
303.8
|
|
288.3
|
|
|||||
|
Occupancy costs
|
47.0
|
|
48.6
|
|
48.4
|
|
|||||
|
Supplies
|
105.4
|
|
102.4
|
|
102.8
|
|
|||||
|
General and administrative expenses
|
119.1
|
|
117.9
|
|
110.5
|
|
|||||
|
Depreciation and amortization
|
94.7
|
|
82.5
|
|
78.8
|
|
|||||
|
Government, class action, and related settlements
|
(23.5
|
)
|
(3.5
|
)
|
(12.3
|
)
|
|||||
|
Professional fees—accounting, tax, and legal
|
9.5
|
|
16.1
|
|
21.0
|
|
|||||
|
Total operating expenses
|
1,764.9
|
|
1,718.0
|
|
1,619.5
|
|
|||||
|
Loss on early extinguishment of debt
|
2.4
|
|
4.0
|
|
38.8
|
|
|||||
|
Interest expense and amortization of debt discounts and fees
|
100.4
|
|
94.1
|
|
119.4
|
|
|||||
|
Other income
|
(4.5
|
)
|
(8.5
|
)
|
(2.7
|
)
|
|||||
|
Equity in net income of nonconsolidated affiliates
|
(11.2
|
)
|
(12.7
|
)
|
(12.0
|
)
|
|||||
|
Income from continuing operations before income tax expense
|
395.2
|
|
340.0
|
|
242.9
|
|
|||||
|
Provision for income tax expense
|
12.7
|
|
108.6
|
|
37.1
|
|
|||||
|
Income from continuing operations
|
382.5
|
|
231.4
|
|
205.8
|
|
|||||
|
(Loss) income from discontinued operations, net of tax
|
(1.1
|
)
|
4.5
|
|
48.8
|
|
|||||
|
Net income
|
381.4
|
|
235.9
|
|
254.6
|
|
|||||
|
Less: Net income attributable to noncontrolling interests
|
(57.8
|
)
|
(50.9
|
)
|
(45.9
|
)
|
|||||
|
Net income attributable to HealthSouth
|
323.6
|
|
185.0
|
|
208.7
|
|
|||||
|
Less: Convertible perpetual preferred stock dividends
|
(21.0
|
)
|
(23.9
|
)
|
(26.0
|
)
|
|||||
|
Less: Repurchase of convertible perpetual preferred stock
|
(71.6
|
)
|
(0.8
|
)
|
—
|
|
|||||
|
Net income attributable to HealthSouth common shareholders
|
$
|
231.0
|
|
$
|
160.3
|
|
$
|
182.7
|
|
||
|
Weighted average common shares outstanding:
|
|
|
|
|
|
|
|||||
|
Basic
|
88.1
|
|
94.6
|
|
93.3
|
|
|||||
|
Diluted
|
102.1
|
|
108.1
|
|
109.2
|
|
|||||
|
Basic and diluted earnings per share attributable to HealthSouth common shareholders:
|
|
|
|
|
|
|
|||||
|
Continuing operations
|
$
|
2.59
|
|
$
|
1.62
|
|
$
|
1.39
|
|
||
|
Discontinued operations
|
(0.01
|
)
|
0.05
|
|
0.52
|
|
|||||
|
Net income
|
$
|
2.58
|
|
$
|
1.67
|
|
$
|
1.91
|
|
||
|
Cash dividends per common share
|
$
|
0.36
|
|
$
|
—
|
|
$
|
—
|
|
||
|
Amounts attributable to HealthSouth common shareholders:
|
|
|
|
|
|
|
|||||
|
Income from continuing operations
|
$
|
324.7
|
|
$
|
180.5
|
|
$
|
158.8
|
|
||
|
(Loss) income from discontinued operations, net of tax
|
(1.1
|
)
|
4.5
|
|
49.9
|
|
|||||
|
Net income attributable to HealthSouth
|
$
|
323.6
|
|
$
|
185.0
|
|
$
|
208.7
|
|
||
The accompanying notes to consolidated financial statements are an integral part of these statements.
F-3
|
HealthSouth Corporation and Subsidiaries
Consolidated Statements of Comprehensive Income
|
||
|
|
For the Year Ended December 31,
|
||||||||||
|
|
2013
|
2012
|
2011
|
||||||||
|
|
(In Millions)
|
||||||||||
|
COMPREHENSIVE INCOME
|
|
|
|
||||||||
|
Net income
|
$
|
381.4
|
|
$
|
235.9
|
|
$
|
254.6
|
|
||
|
Other comprehensive (loss) income, net of tax:
|
|
|
|
|
|
|
|||||
|
Net change in unrealized (loss) gain on available-for-sale securities:
|
|
|
|
|
|
|
|||||
|
Unrealized net holding (loss) gain arising during the period
|
(0.7
|
)
|
1.6
|
|
(0.7
|
)
|
|||||
|
Reclassifications to net income
|
(0.9
|
)
|
—
|
|
—
|
|
|||||
|
Other comprehensive (loss) income before income taxes
|
(1.6
|
)
|
1.6
|
|
(0.7
|
)
|
|||||
|
Provision for income tax benefit related to other comprehensive (loss) income items
|
0.1
|
|
—
|
|
—
|
|
|||||
|
Other comprehensive (loss) income, net of tax:
|
(1.5
|
)
|
1.6
|
|
(0.7
|
)
|
|||||
|
Comprehensive income
|
379.9
|
|
237.5
|
|
253.9
|
|
|||||
|
Comprehensive income attributable to noncontrolling interests
|
(57.8
|
)
|
(50.9
|
)
|
(45.9
|
)
|
|||||
|
Comprehensive income attributable to HealthSouth
|
$
|
322.1
|
|
$
|
186.6
|
|
$
|
208.0
|
|
||
The accompanying notes to consolidated financial statements are an integral part of these statements.
F-4
|
HealthSouth Corporation and Subsidiaries
Consolidated Balance Sheets
|
||
|
|
As of December 31,
|
||||||
|
|
2013
|
2012
|
|||||
|
|
(In Millions, Except Share Data)
|
||||||
|
Assets
|
|
|
|||||
|
Current assets:
|
|
|
|||||
|
Cash and cash equivalents
|
$
|
64.5
|
|
$
|
132.8
|
|
|
|
Restricted cash
|
52.4
|
|
49.3
|
|
|||
|
Accounts receivable, net of allowance for doubtful accounts of
$23.1
in 2013; $28.7 in 2012
|
261.8
|
|
249.3
|
|
|||
|
Deferred income tax assets
|
139.0
|
|
137.5
|
|
|||
|
Prepaid expenses and other current assets
|
62.7
|
|
67.9
|
|
|||
|
Total current assets
|
580.4
|
|
636.8
|
|
|||
|
Property and equipment, net
|
910.5
|
|
748.0
|
|
|||
|
Goodwill
|
456.9
|
|
437.3
|
|
|||
|
Intangible assets, net
|
88.2
|
|
73.2
|
|
|||
|
Deferred income tax assets
|
354.3
|
|
393.5
|
|
|||
|
Other long-term assets
|
144.1
|
|
135.4
|
|
|||
|
Total assets
|
$
|
2,534.4
|
|
$
|
2,424.2
|
|
|
|
Liabilities and Shareholders’ Equity
|
|
|
|
|
|||
|
Current liabilities:
|
|
|
|
|
|||
|
Current portion of long-term debt
|
$
|
12.3
|
|
$
|
13.6
|
|
|
|
Accounts payable
|
61.9
|
|
45.3
|
|
|||
|
Accrued payroll
|
90.8
|
|
85.7
|
|
|||
|
Accrued interest payable
|
23.8
|
|
25.9
|
|
|||
|
Other current liabilities
|
122.8
|
|
130.4
|
|
|||
|
Total current liabilities
|
311.6
|
|
300.9
|
|
|||
|
Long-term debt, net of current portion
|
1,505.2
|
|
1,239.9
|
|
|||
|
Self-insured risks
|
98.2
|
|
106.5
|
|
|||
|
Other long-term liabilities
|
44.0
|
|
24.0
|
|
|||
|
|
1,959.0
|
|
1,671.3
|
|
|||
|
Commitments and contingencies
|
|
|
|
|
|||
|
Convertible perpetual preferred stock, $.10 par value; 1,500,000 shares authorized; 96,245 shares issued in 2013 and 353,355 shares issued in 2012; liquidation preference of $1,000 per share
|
93.2
|
|
342.2
|
|
|||
|
Redeemable noncontrolling interests
|
13.5
|
|
7.2
|
|
|||
|
Shareholders’ equity:
|
|
|
|
|
|||
|
HealthSouth shareholders’ equity:
|
|
|
|
|
|||
|
Common stock, $.01 par value; 200,000,000 shares authorized; issued: 102,648,302 in 2013; 100,919,297 in 2012
|
1.0
|
|
1.0
|
|
|||
|
Capital in excess of par value
|
2,849.4
|
|
2,876.6
|
|
|||
|
Accumulated deficit
|
(2,101.1
|
)
|
(2,424.7
|
)
|
|||
|
Accumulated other comprehensive (loss) income
|
(0.1
|
)
|
1.4
|
|
|||
|
Treasury stock, at cost (14,654,436 shares in 2013 and 5,233,521 shares in 2012)
|
(404.6
|
)
|
(163.3
|
)
|
|||
|
Total HealthSouth shareholders’ equity
|
344.6
|
|
291.0
|
|
|||
|
Noncontrolling interests
|
124.1
|
|
112.5
|
|
|||
|
Total shareholders’ equity
|
468.7
|
|
403.5
|
|
|||
|
Total liabilities and shareholders’ equity
|
$
|
2,534.4
|
|
$
|
2,424.2
|
|
|
The accompanying notes to consolidated financial statements are an integral part of these statements.
F-5
|
HealthSouth Corporation and Subsidiaries
Consolidated Statements of Shareholders’ Equity
|
||
|
|
HealthSouth Common Shareholders
|
|
|
|||||||||||||||||||||||||||
|
|
Number of Common Shares Outstanding
|
Common Stock
|
Capital in Excess of Par Value
|
Accumulated
Deficit
|
Accumulated Other Comprehensive Income (Loss)
|
Treasury
Stock
|
Noncontrolling Interests
|
Total
|
||||||||||||||||||||||
|
(In Millions)
|
||||||||||||||||||||||||||||||
|
December 31, 2010
|
93.4
|
|
$
|
1.0
|
|
$
|
2,872.9
|
|
$
|
(2,818.4
|
)
|
$
|
0.5
|
|
$
|
(141.8
|
)
|
$
|
83.0
|
|
$
|
(2.8
|
)
|
|||||||
|
Net income
|
—
|
|
—
|
|
—
|
|
208.7
|
|
—
|
|
—
|
|
42.3
|
|
251.0
|
|
||||||||||||||
|
Dividends declared on convertible perpetual preferred stock
|
—
|
|
—
|
|
(26.0
|
)
|
—
|
|
—
|
|
—
|
|
—
|
|
(26.0
|
)
|
||||||||||||||
|
Stock-based compensation
|
—
|
|
—
|
|
20.3
|
|
—
|
|
—
|
|
—
|
|
—
|
|
20.3
|
|
||||||||||||||
|
Distributions declared
|
—
|
|
—
|
|
—
|
|
—
|
|
—
|
|
—
|
|
(40.5
|
)
|
(40.5
|
)
|
||||||||||||||
|
Other
|
1.8
|
|
—
|
|
6.9
|
|
—
|
|
(0.7
|
)
|
(7.0
|
)
|
(0.2
|
)
|
(1.0
|
)
|
||||||||||||||
|
December 31, 2011
|
95.2
|
|
1.0
|
|
2,874.1
|
|
(2,609.7
|
)
|
(0.2
|
)
|
(148.8
|
)
|
84.6
|
|
201.0
|
|
||||||||||||||
|
Net income
|
—
|
|
—
|
|
—
|
|
185.0
|
|
—
|
|
—
|
|
47.1
|
|
232.1
|
|
||||||||||||||
|
Receipt of treasury stock
|
(0.7
|
)
|
—
|
|
—
|
|
—
|
|
—
|
|
(11.9
|
)
|
—
|
|
(11.9
|
)
|
||||||||||||||
|
Dividends declared on convertible perpetual preferred stock
|
—
|
|
—
|
|
(23.9
|
)
|
—
|
|
—
|
|
—
|
|
—
|
|
(23.9
|
)
|
||||||||||||||
|
Stock-based compensation
|
—
|
|
—
|
|
24.1
|
|
—
|
|
—
|
|
—
|
|
—
|
|
24.1
|
|
||||||||||||||
|
Distributions declared
|
—
|
|
—
|
|
—
|
|
—
|
|
—
|
|
—
|
|
(45.4
|
)
|
(45.4
|
)
|
||||||||||||||
|
Capital contributions from consolidated affiliates
|
—
|
|
—
|
|
—
|
|
—
|
|
—
|
|
—
|
|
12.4
|
|
12.4
|
|
||||||||||||||
|
Consolidation of St. Vincent Rehabilitation Hospital
|
—
|
|
—
|
|
—
|
|
—
|
|
—
|
|
—
|
|
13.9
|
|
13.9
|
|
||||||||||||||
|
Other
|
1.2
|
|
—
|
|
2.3
|
|
—
|
|
1.6
|
|
(2.6
|
)
|
(0.1
|
)
|
1.2
|
|
||||||||||||||
|
December 31, 2012
|
95.7
|
|
1.0
|
|
2,876.6
|
|
(2,424.7
|
)
|
1.4
|
|
(163.3
|
)
|
112.5
|
|
403.5
|
|
||||||||||||||
|
Net income
|
—
|
|
—
|
|
—
|
|
323.6
|
|
—
|
|
—
|
|
52.0
|
|
375.6
|
|
||||||||||||||
|
Receipt of treasury stock
|
(0.3
|
)
|
—
|
|
—
|
|
—
|
|
—
|
|
(5.8
|
)
|
—
|
|
(5.8
|
)
|
||||||||||||||
|
Dividends declared on common stock
|
—
|
|
—
|
|
(32.0
|
)
|
—
|
|
—
|
|
—
|
|
—
|
|
(32.0
|
)
|
||||||||||||||
|
Dividends declared on convertible perpetual preferred stock
|
—
|
|
—
|
|
(21.0
|
)
|
—
|
|
—
|
|
—
|
|
—
|
|
(21.0
|
)
|
||||||||||||||
|
Stock-based compensation
|
—
|
|
—
|
|
24.8
|
|
—
|
|
—
|
|
—
|
|
—
|
|
24.8
|
|
||||||||||||||
|
Stock options exercised
|
0.3
|
|
—
|
|
8.2
|
|
—
|
|
—
|
|
—
|
|
—
|
|
8.2
|
|
||||||||||||||
|
Stock warrants exercised
|
0.5
|
|
—
|
|
15.3
|
|
—
|
|
—
|
|
—
|
|
—
|
|
15.3
|
|
||||||||||||||
|
Distributions declared
|
—
|
|
—
|
|
—
|
|
—
|
|
—
|
|
—
|
|
(40.4
|
)
|
(40.4
|
)
|
||||||||||||||
|
Repurchases of common stock through tender offer
|
(9.1
|
)
|
—
|
|
—
|
|
—
|
|
—
|
|
(234.1
|
)
|
—
|
|
(234.1
|
)
|
||||||||||||||
|
Repurchase of preferred stock through convertible exchange
|
—
|
|
—
|
|
(71.6
|
)
|
—
|
|
—
|
|
—
|
|
—
|
|
(71.6
|
)
|
||||||||||||||
|
Equity portion of convertible debt
|
—
|
|
—
|
|
71.0
|
|
—
|
|
—
|
|
—
|
|
—
|
|
71.0
|
|
||||||||||||||
|
Tax impact of equity portion of convertible debt
|
—
|
|
—
|
|
(28.0
|
)
|
—
|
|
—
|
|
—
|
|
—
|
|
(28.0
|
)
|
||||||||||||||
|
Other
|
0.9
|
|
—
|
|
6.1
|
|
—
|
|
(1.5
|
)
|
(1.4
|
)
|
—
|
|
3.2
|
|
||||||||||||||
|
December 31, 2013
|
88.0
|
|
$
|
1.0
|
|
$
|
2,849.4
|
|
$
|
(2,101.1
|
)
|
$
|
(0.1
|
)
|
$
|
(404.6
|
)
|
$
|
124.1
|
|
$
|
468.7
|
|
|||||||
The accompanying notes to consolidated financial statements are an integral part of these statements.
F-6
|
HealthSouth Corporation and Subsidiaries
Consolidated Statements of Cash Flows
|
||
|
|
For the Year Ended December 31,
|
||||||||||
|
|
2013
|
2012
|
2011
|
||||||||
|
|
(In Millions)
|
||||||||||
|
Cash flows from operating activities:
|
|
|
|
||||||||
|
Net income
|
$
|
381.4
|
|
$
|
235.9
|
|
$
|
254.6
|
|
||
|
Loss (income) from discontinued operations, net of tax
|
1.1
|
|
(4.5
|
)
|
(48.8
|
)
|
|||||
|
Adjustments to reconcile net income to net cash provided by operating activities—
|
|
|
|
|
|
|
|||||
|
Provision for doubtful accounts
|
26.0
|
|
27.0
|
|
21.0
|
|
|||||
|
Provision for government, class action, and related settlements
|
(23.5
|
)
|
(3.5
|
)
|
(12.3
|
)
|
|||||
|
Depreciation and amortization
|
94.7
|
|
82.5
|
|
78.8
|
|
|||||
|
Loss on early extinguishment of debt
|
2.4
|
|
4.0
|
|
38.8
|
|
|||||
|
Equity in net income of nonconsolidated affiliates
|
(11.2
|
)
|
(12.7
|
)
|
(12.0
|
)
|
|||||
|
Distributions from nonconsolidated affiliates
|
11.4
|
|
11.0
|
|
13.0
|
|
|||||
|
Stock-based compensation
|
24.8
|
|
24.1
|
|
20.3
|
|
|||||
|
Deferred tax expense
|
6.4
|
|
102.7
|
|
36.5
|
|
|||||
|
Other
|
9.3
|
|
3.0
|
|
7.9
|
|
|||||
|
(Increase) decrease in assets—
|
|
|
|
|
|
|
|||||
|
Accounts receivable
|
(55.1
|
)
|
(51.3
|
)
|
(37.1
|
)
|
|||||
|
Prepaid expenses and other assets
|
(4.8
|
)
|
0.6
|
|
(12.5
|
)
|
|||||
|
Increase (decrease) in liabilities—
|
|
|
|
|
|
|
|||||
|
Accounts payable
|
6.4
|
|
(4.4
|
)
|
0.8
|
|
|||||
|
Refunds due patients and other third-party payors
|
(0.4
|
)
|
2.7
|
|
(16.2
|
)
|
|||||
|
Other liabilities
|
5.0
|
|
(5.7
|
)
|
23.6
|
|
|||||
|
Premium received on bond issuance
|
—
|
|
—
|
|
4.1
|
|
|||||
|
Premium paid on redemption of bonds
|
(1.7
|
)
|
(1.9
|
)
|
(26.9
|
)
|
|||||
|
Net cash (used in) provided by operating activities of discontinued operations
|
(1.9
|
)
|
2.0
|
|
9.1
|
|
|||||
|
Total adjustments
|
87.8
|
|
180.1
|
|
136.9
|
|
|||||
|
Net cash provided by operating activities
|
470.3
|
|
411.5
|
|
342.7
|
|
|||||
|
Cash flows from investing activities:
|
|
|
|
||||||||
|
Purchases of property and equipment
|
(195.2
|
)
|
(140.8
|
)
|
(100.3
|
)
|
|||||
|
Capitalized software costs
|
(21.3
|
)
|
(18.9
|
)
|
(8.8
|
)
|
|||||
|
Acquisition of businesses, net of cash acquired
|
(28.9
|
)
|
(3.1
|
)
|
(4.9
|
)
|
|||||
|
Proceeds from sale of restricted investments
|
16.9
|
|
0.3
|
|
1.2
|
|
|||||
|
Proceeds from sale of Digital Hospital
|
10.8
|
|
—
|
|
—
|
|
|||||
|
Purchases of restricted investments
|
(9.2
|
)
|
(9.1
|
)
|
(8.4
|
)
|
|||||
|
Net change in restricted cash
|
(3.1
|
)
|
(14.0
|
)
|
1.2
|
|
|||||
|
Net settlements on interest rate swaps not designated as hedges
|
—
|
|
—
|
|
(10.9
|
)
|
|||||
|
Other
|
0.5
|
|
(0.9
|
)
|
(0.9
|
)
|
|||||
|
Net cash provided by (used in) investing activities of discontinued operations—
|
|||||||||||
|
Proceeds from sale of LTCHs
|
—
|
|
—
|
|
107.9
|
|
|||||
|
Other investing activities of discontinued operations
|
3.3
|
|
7.7
|
|
(0.7
|
)
|
|||||
|
Net cash used in investing activities
|
(226.2
|
)
|
(178.8
|
)
|
(24.6
|
)
|
|||||
(Continued)
F-7
|
HealthSouth Corporation and Subsidiaries
Consolidated Statements of Cash Flows (Continued)
|
||
|
|
For the Year Ended December 31,
|
||||||||||
|
|
2013
|
2012
|
2011
|
||||||||
|
|
(In Millions)
|
||||||||||
|
Cash flows from financing activities:
|
|
|
|
|
|
|
|||||
|
Principal borrowings on term loan
|
—
|
|
—
|
|
100.0
|
|
|||||
|
Proceeds from bond issuance
|
—
|
|
275.0
|
|
120.0
|
|
|||||
|
Principal payments on debt, including pre-payments
|
(62.5
|
)
|
(166.2
|
)
|
(504.9
|
)
|
|||||
|
Principal borrowings on notes
|
15.2
|
|
—
|
|
—
|
|
|||||
|
Borrowings on revolving credit facility
|
197.0
|
|
135.0
|
|
338.0
|
|
|||||
|
Payments on revolving credit facility
|
(152.0
|
)
|
(245.0
|
)
|
(306.0
|
)
|
|||||
|
Principal payments under capital lease obligations
|
(10.1
|
)
|
(12.1
|
)
|
(13.2
|
)
|
|||||
|
Repurchase of common stock, including fees and expenses
|
(234.1
|
)
|
—
|
|
—
|
|
|||||
|
Repurchases of convertible perpetual preferred stock, including fees
|
(2.8
|
)
|
(46.0
|
)
|
—
|
|
|||||
|
Dividends paid on common stock
|
(15.7
|
)
|
—
|
|
—
|
|
|||||
|
Dividends paid on convertible perpetual preferred stock
|
(23.0
|
)
|
(24.6
|
)
|
(26.0
|
)
|
|||||
|
Distributions paid to noncontrolling interests of consolidated affiliates
|
(46.3
|
)
|
(49.3
|
)
|
(44.2
|
)
|
|||||
|
Contributions from consolidated affiliates
|
1.6
|
|
10.5
|
|
—
|
|
|||||
|
Proceeds from exercising stock warrants
|
15.3
|
|
—
|
|
—
|
|
|||||
|
Other
|
5.0
|
|
(7.3
|
)
|
—
|
|
|||||
|
Net cash used in financing activities
|
(312.4
|
)
|
(130.0
|
)
|
(336.3
|
)
|
|||||
|
(Decrease) increase in cash and cash equivalents
|
(68.3
|
)
|
102.7
|
|
(18.2
|
)
|
|||||
|
Cash and cash equivalents at beginning of year
|
132.8
|
|
30.1
|
|
48.3
|
|
|||||
|
Cash and cash equivalents at end of year
|
$
|
64.5
|
|
$
|
132.8
|
|
$
|
30.1
|
|
||
|
Supplemental cash flow information:
|
|
|
|
||||||||
|
Cash (paid) received during the year for —
|
|
|
|
||||||||
|
Interest
|
$
|
(99.4
|
)
|
$
|
(88.1
|
)
|
$
|
(115.4
|
)
|
||
|
Income tax refunds
|
4.8
|
|
2.2
|
|
9.6
|
|
|||||
|
Income tax payments
|
(12.5
|
)
|
(11.8
|
)
|
(9.1
|
)
|
|||||
|
Supplemental schedule of noncash financing activities:
|
|||||||||||
|
Convertible debt issued
|
$
|
320.0
|
|
$
|
—
|
|
$
|
—
|
|
||
|
Repurchase of preferred stock
|
(320.0
|
)
|
—
|
|
—
|
|
|||||
The accompanying notes to consolidated financial statements are an integral part of these statements.
F-8
|
HealthSouth Corporation and Subsidiaries
Notes to Consolidated Financial Statements
|
||
|
1.
|
Summary of Significant Accounting Policies
:
|
Organization and Description of Business—
HealthSouth Corporation, incorporated in Delaware in
1984
, including its subsidiaries, is the largest owner and operator of inpatient rehabilitation hospitals in the United States in terms of patients treated and discharged, revenues, and number of hospitals. We operate inpatient rehabilitation hospitals and provide specialized rehabilitative treatment on both an inpatient and outpatient basis. While our national network of inpatient hospitals stretches across
28
states and Puerto Rico, we are concentrated in the eastern half of the United States and Texas. As of
December 31, 2013
, we operated
103
inpatient rehabilitation hospitals (including
two
hospitals that operate as joint ventures which we account for using the equity method of accounting). We are the sole owner of
72
of these hospitals. We retain
50.0%
to
97.5%
ownership in the remaining
31
jointly owned hospitals. We also had
20
outpatient rehabilitation satellite clinics (operated by our hospitals) and
25
licensed, hospital-based home health agencies. In addition to HealthSouth hospitals, we manage
three
inpatient rehabilitation units through management contracts.
Reclassifications—
Certain immaterial amounts have been revised to conform to the current year presentation. In our consolidated balance sheet as of December 31, 2012, we reclassified amounts previously reported as
Other long-term liabilities
to a combination of
Capital in excess of par value
, noncurrent
Deferred income tax assets
, and
Redeemable noncontrolling interests
. These amounts relate to a joint venture entity where the partner’s noncontrolling interest includes redemption features that are not solely within our control. This adjustment decreased liabilities by
$6.2 million
, decreased shareholders’ equity by
$0.6 million
, increased assets by
$0.4 million
, and increased amounts in the mezzanine section of our consolidated balance sheet by
$7.2 million
. See
Note 11,
Redeemable Noncontrolling Interests
.
Out-of-Period Adjustments—
During 2011, we recorded additional income tax expense of approximately
$7 million
for out-of-period adjustments primarily related to corrections to our 2010 deferred tax assets associated with our net operating losses (“NOLs”) and the corresponding valuation allowance. We corrected the errors in our financial statements by increasing our
Provision for income tax expense
, which resulted in a reduction of
Income from continuing operations
and
Net income
for the year ended December 31, 2011. We do not believe the errors or their corrections are material to the consolidated financial statements as of December 31, 2011 or to any prior years’ consolidated financial statements. See
Note 16,
Income Taxes
.
See also
Note 17,
Earnings per Common Share
.
Basis of Presentation and Consolidation—
The accompanying consolidated financial statements of HealthSouth and its subsidiaries were prepared in accordance with generally accepted accounting principles in the United States of America and include the assets, liabilities, revenues, and expenses of all wholly owned subsidiaries, majority-owned subsidiaries over which we exercise control, and, when applicable, entities in which we have a controlling financial interest.
We use the equity method to account for our investments in entities we do not control, but where we have the ability to exercise significant influence over operating and financial policies. Consolidated
Net income attributable to HealthSouth
includes our share of the net earnings of these entities. The difference between consolidation and the equity method impacts certain of our financial ratios because of the presentation of the detailed line items reported in the consolidated financial statements for consolidated entities compared to a one line presentation of equity method investments.
We use the cost method to account for our investments in entities we do not control and for which we do not have the ability to exercise significant influence over operating and financial policies. In accordance with the cost method, these investments are recorded at the lower of cost or fair value, as appropriate.
We also consider the guidance for consolidating variable interest entities.
F-9
|
HealthSouth Corporation and Subsidiaries
Notes to Consolidated Financial Statements
|
||
We eliminate all significant intercompany accounts and transactions from our financial results.
Use of Estimates and Assumptions—
The preparation of our consolidated financial statements in conformity with GAAP requires the use of estimates and assumptions that affect the reported amounts of assets and liabilities, the disclosure of contingent assets and liabilities at the date of the consolidated financial statements, and the reported amounts of revenues and expenses during the reporting periods. Significant estimates and assumptions are used for, but not limited to: (1) allowance for contractual revenue adjustments; (2) allowance for doubtful accounts; (3) asset impairments, including goodwill; (4) depreciable lives of assets; (5) useful lives of intangible assets; (6) economic lives and fair value of leased assets; (7) income tax valuation allowances; (8) uncertain tax positions; (9) fair value of stock options and restricted stock containing a market condition; (10) fair value of redeemable noncontrolling interests; (11) reserves for self-insured healthcare plans; (12) reserves for professional, workers’ compensation, and comprehensive general insurance liability risks; and (13) contingency and litigation reserves. Future events and their effects cannot be predicted with certainty; accordingly, our accounting estimates require the exercise of judgment. The accounting estimates used in the preparation of our consolidated financial statements will change as new events occur, as more experience is acquired, as additional information is obtained, and as our operating environment changes. We evaluate and update our assumptions and estimates on an ongoing basis and may employ outside experts to assist in our evaluation, as considered necessary. Actual results could differ from those estimates.
Risks and Uncertainties—
As a healthcare provider, we are required to comply with extensive and complex laws and regulations at the federal, state, and local government levels. These laws and regulations relate to, among other things:
|
•
|
licensure, certification, and accreditation;
|
|
•
|
policies, either at the national or local level, delineating what conditions must be met to qualify for reimbursement under Medicare (also referred to as coverage requirements);
|
|
•
|
coding and billing for services;
|
|
•
|
requirements of the
60%
compliance threshold under The Medicare, Medicaid and State Children’s Health Insurance Program (SCHIP) Extension Act of 2007;
|
|
•
|
relationships with physicians and other referral sources, including physician self-referral and anti-kickback laws;
|
|
•
|
quality of medical care;
|
|
•
|
use and maintenance of medical supplies and equipment;
|
|
•
|
maintenance and security of patient information and medical records;
|
|
•
|
acquisition and dispensing of pharmaceuticals and controlled substances; and
|
|
•
|
disposal of medical and hazardous waste.
|
In the future, changes in these laws or regulations or the manner in which they are enforced could subject our current or past practices to allegations of impropriety or illegality or could require us to make changes in our hospitals, equipment, personnel, services, capital expenditure programs, operating procedures, and contractual arrangements.
If we fail to comply with applicable laws and regulations, we could be subjected to liabilities, including (1) criminal penalties, (2) civil penalties, including monetary penalties and the loss of our licenses to operate one or more of our hospitals, and (3) exclusion or suspension of one or more of our hospitals from participation in the Medicare, Medicaid, and other federal and state healthcare programs which, if lengthy in duration and material to us, could potentially trigger a default under our credit agreement. Because Medicare comprises a significant portion of our
Net operating revenues
, it is important for us to remain compliant with the laws and regulations governing the Medicare program and related matters including anti-kickback
F-10
|
HealthSouth Corporation and Subsidiaries
Notes to Consolidated Financial Statements
|
||
and anti-fraud requirements. Reductions in reimbursements, substantial damages, and other remedies assessed against us could have a material adverse effect on our business, financial position, results of operation, and cash flows. Even the assertion of a violation, depending on its nature, could have a material adverse effect upon our stock price or reputation.
Historically, the United States Congress and some state legislatures have periodically proposed significant changes in regulations governing the healthcare system. Many of these changes have resulted in limitations on the increases in and, in some cases, significant roll-backs or reductions in the levels of payments to healthcare providers for services under many government reimbursement programs. Additionally, concerns held by federal policymakers about the federal deficit, national debt levels, and reforming the sustainable growth rate formula used to pay physicians who treat Medicare beneficiaries (the so called “Doc Fix”) could result in enactment of further federal spending reductions, further entitlement reform legislation affecting the Medicare program, and/or further reductions to provider payments. There can be no assurance that future governmental initiatives will not result in pricing roll-backs or freezes or reimbursement reductions. Because we receive a significant percentage of our revenues from Medicare, such changes in legislation might have a material adverse effect on our financial position, results of operations, and cash flows, if any such changes were to occur.
Pursuant to legislative directives and authorizations from Congress, the United States Centers for Medicare and Medicaid Services (“CMS”) developed and instituted various Medicare audit programs. We undertake significant efforts through training and education to ensure compliance with coding and medical necessity coverage rules. Despite our belief that our coding and assessment of patients is accurate, audits may lead to assertions that we have been underpaid or overpaid by Medicare or submitted improper claims in some instances, require us to incur additional costs to respond to requests for records and defend the validity of payments and claims, and ultimately require us to refund any amounts determined to have been overpaid. We cannot predict when or how these programs will affect us.
In addition, there are increasing pressures from many third-party payors to control healthcare costs and to reduce or limit increases in reimbursement rates for medical services. Our relationships with managed care and nongovernmental third-party payors are generally governed by negotiated agreements. These agreements set forth the amounts we are entitled to receive for our services. We could be adversely affected in some of the markets where we operate if we are unable to negotiate and maintain favorable agreements with third-party payors.
Our third-party payors may also, from time to time, request audits of the amounts paid, or to be paid, to us. We could be adversely affected in some of the markets where we operate if the auditing payor alleges that substantial overpayments were made to us due to coding errors or lack of documentation to support medical necessity determinations.
As discussed in
Note 18,
Contingencies and Other Commitments
, we are a party to a number of lawsuits. We cannot predict the outcome of litigation filed against us. Substantial damages or other monetary remedies assessed against us could have a material adverse effect on our business, financial position, results of operations, and cash flows.
Net Operating Revenues—
We derived consolidated
Net operating revenues
from the following payor sources:
|
|
For the Year Ended December 31,
|
|||||||
|
|
2013
|
2012
|
2011
|
|||||
|
Medicare
|
74.5
|
%
|
73.4
|
%
|
72.0
|
%
|
||
|
Medicaid
|
1.2
|
%
|
1.2
|
%
|
1.6
|
%
|
||
|
Workers' compensation
|
1.2
|
%
|
1.5
|
%
|
1.6
|
%
|
||
|
Managed care and other discount plans, including Medicare Advantage
|
18.5
|
%
|
19.3
|
%
|
19.8
|
%
|
||
|
Other third-party payors
|
1.8
|
%
|
1.8
|
%
|
2.0
|
%
|
||
|
Patients
|
1.1
|
%
|
1.3
|
%
|
1.2
|
%
|
||
|
Other income
|
1.7
|
%
|
1.5
|
%
|
1.8
|
%
|
||
|
Total
|
100.0
|
%
|
100.0
|
%
|
100.0
|
%
|
||
F-11
|
HealthSouth Corporation and Subsidiaries
Notes to Consolidated Financial Statements
|
||
We recognize net patient service revenues in the reporting period in which we perform the service based on our current billing rates (i.e., gross charges), less actual adjustments and estimated discounts for contractual allowances (principally for patients covered by Medicare, Medicaid, and managed care and other health plans). We record gross service charges in our accounting records on an accrual basis using our established rates for the type of service provided to the patient. We recognize an estimated contractual allowance and an estimate of potential subsequent adjustments that may arise from post-payment and other reviews to reduce gross patient charges to the amount we estimate we will actually realize for the service rendered based upon previously agreed to rates with a payor. Our patient accounting system calculates contractual allowances on a patient-by-patient basis based on the rates in effect for each primary third-party payor. Other factors that are considered and could further influence the level of our reserves include the patient’s total length of stay for in-house patients, each patient’s discharge destination, the proportion of patients with secondary insurance coverage and the level of reimbursement under that secondary coverage, and the amount of charges that will be disallowed by payors. Such additional factors are assumed to remain consistent with the experience for patients discharged in similar time periods for the same payor classes, and additional reserves are provided to account for these factors. Payors include federal and state agencies, including Medicare and Medicaid, managed care health plans, commercial insurance companies, employers, and patients.
Management continually reviews the contractual estimation process to consider and incorporate updates to laws and regulations and the frequent changes in managed care contractual terms that result from contract renegotiations and renewals. Due to complexities involved in determining amounts ultimately due under reimbursement arrangements with third-party payors, which are often subject to interpretation, we may receive reimbursement for healthcare services authorized and provided that is different from our estimates, and such differences could be material. In addition, laws and regulations governing the Medicare and Medicaid programs are complex, subject to interpretation, and are routinely modified for provider reimbursement. All healthcare providers participating in the Medicare and Medicaid programs are required to meet certain financial reporting requirements. Federal regulations require submission of annual cost reports covering medical costs and expenses associated with the services provided by each hospital to program beneficiaries. Annual cost reports required under the Medicare and Medicaid programs are subject to routine audits, which may result in adjustments to the amounts ultimately determined to be due to HealthSouth under these reimbursement programs. These audits often require several years to reach the final determination of amounts earned under the programs. If actual results are not consistent with our assumptions and judgments, we may be exposed to gains or losses that could be material.
CMS has been granted authority to suspend payments, in whole or in part, to Medicare providers if CMS possesses reliable information an overpayment, fraud, or willful misrepresentation exists. If CMS suspects payments are being made as the result of fraud or misrepresentation, CMS may suspend payment at any time without providing prior notice to us. The initial suspension period is limited to
180
days. However, the payment suspension period can be extended almost indefinitely if the matter is under investigation by the United States Department of Health and Human Services Office of Inspector General (the “HHS-OIG”) or the United States Department of Justice. Therefore, we are unable to predict if or when we may be subject to a suspension of payments by the Medicare and/or Medicaid programs, the possible length of the suspension period, or the potential cash flow impact of a payment suspension. Any such suspension would adversely impact our financial position, results of operations, and cash flows.
Pursuant to legislative directives and authorizations from Congress, CMS has developed and instituted various Medicare audit programs under which CMS contracts with private companies to conduct claims and medical record audits. One type of audit contractor, the Recovery Audit Contractors (“RACs”), began post-payment audit processes in late 2009 for providers in general. In connection with CMS approved and announced RAC audits related to IRFs, we received requests in 2013 to review certain patient files for discharges occurring from 2010 to 2013. These post-payment RAC audits are focused on medical necessity requirements for admission to IRFs rather than targeting a specific diagnosis code as in previous pre-payment audits. Medical necessity is a subjective assessment by an independent physician of a patient’s ability to tolerate and benefit from intensive multi-disciplinary therapy provided in an IRF setting.
To date, the Medicare payments that are subject to these audit requests represent less than
1%
of our Medicare patient discharges from 2010 to 2013, and not all of these patient file requests have resulted in payment denial determinations by the RACs. Because we have confidence in the medical judgment of both the referring and the admitting physicians who assess the treatment needs of their patients, we currently intend to appeal substantially all RAC denials arising from these audits using the same process we follow for appealing denials of certain diagnosis codes by Medicare Administrative Contractors (“MACs”) (see “Accounts Receivable and Allowance for Doubtful Accounts” below). Due to the delays announced by CMS in the related
F-12
|
HealthSouth Corporation and Subsidiaries
Notes to Consolidated Financial Statements
|
||
adjudication process, we believe the resolution of any claims that are subsequently denied as a result of these RAC audits could take in excess of two years. In addition, because we have limited experience with RACS in the context of post-payment reviews of this nature, we cannot provide assurance as to the future success of these disputes. As such, we make provisions for these claims based on our historical experience and success rates in the claim adjudication process. Because these reviews involve post-payment claims, there are no corresponding patient receivables in our consolidated balance sheet. As the ultimate results of these audits impact our estimates of amounts determined to be due to HealthSouth under these reimbursement programs, our provision for claims that are part of this post-payment review process are recorded to
Net operating revenues
. During 2013, we reduced our
Net operating revenues
by approximately
$8 million
for post-payment claims that are part of this review process.
Cash and Cash Equivalents—
Cash and cash equivalents
include highly liquid investments with maturities of three months or less when purchased. Carrying values of
Cash and cash equivalents
approximate fair value due to the short-term nature of these instruments.
We maintain amounts on deposit with various financial institutions, which may, at times, exceed federally insured limits. However, management periodically evaluates the credit-worthiness of those institutions, and we have not experienced any losses on such deposits.
Marketable Securities—
We record all equity securities with readily determinable fair values and for which we do not exercise significant influence as available-for-sale securities. We carry the available-for-sale securities at fair value and report unrealized holding gains or losses, net of income taxes, in
Accumulated other comprehensive (loss) income
, which is a separate component of shareholders’ equity. We recognize realized gains and losses in our consolidated statements of operations using the specific identification method.
Unrealized losses are charged against earnings when a decline in fair value is determined to be other than temporary. Management reviews several factors to determine whether a loss is other than temporary, such as the length of time a security is in an unrealized loss position, the extent to which fair value is less than cost, the financial condition and near term prospects of the issuer, industry, or geographic area and our ability and intent to hold the security for a period of time sufficient to allow for any anticipated recovery in fair value.
Accounts Receivable and Allowance for Doubtful Accounts—
We report accounts receivable at estimated net realizable amounts from services rendered from federal and state agencies (under the Medicare and Medicaid programs), managed care health plans, commercial insurance companies, workers’ compensation programs, employers, and patients. Our accounts receivable are geographically dispersed, but a significant portion of our revenues are concentrated by type of payors. The concentration of net patient service accounts receivable by payor class, as a percentage of total net patient service accounts receivable, is as follows:
|
|
As of December 31,
|
||||
|
|
2013
|
2012
|
|||
|
Medicare
|
67.4
|
%
|
62.8
|
%
|
|
|
Medicaid
|
2.0
|
%
|
2.1
|
%
|
|
|
Workers' compensation
|
2.6
|
%
|
3.0
|
%
|
|
|
Managed care and other discount plans, including Medicare Advantage
|
22.4
|
%
|
25.8
|
%
|
|
|
Other third-party payors
|
4.0
|
%
|
4.3
|
%
|
|
|
Patients
|
1.6
|
%
|
2.0
|
%
|
|
|
Total
|
100.0
|
%
|
100.0
|
%
|
|
F-13
|
HealthSouth Corporation and Subsidiaries
Notes to Consolidated Financial Statements
|
||
While revenues and accounts receivable from the Medicare program are significant to our operations, we do not believe there are significant credit risks associated with this government agency. Because Medicare traditionally pays claims faster than our other third-party payors, the percentage of our Medicare charges in accounts receivable is less than the percentage of our Medicare revenues. We do not believe there are any other significant concentrations of revenues from any particular payor that would subject us to any significant credit risks in the collection of our accounts receivable.
We provide for accounts receivable that could become uncollectible by establishing an allowance to reduce the carrying value of such receivables to their estimated net realizable value. Additions to the allowance for doubtful accounts are made by means of the
Provision for doubtful accounts
. We write off uncollectible accounts (after exhausting collection efforts) against the allowance for doubtful accounts. Subsequent recoveries are recorded via the
Provision for doubtful accounts
.
The collection of outstanding receivables from Medicare, managed care payors, other third-party payors, and patients is our primary source of cash and is critical to our operating performance. While it is our policy to verify insurance prior to a patient being admitted, there are various exceptions that can occur. Such exceptions include instances where we are (1) unable to obtain verification because the patient’s insurance company was unable to be reached or contacted, (2) a determination is made that a patient may be eligible for benefits under various government programs, such as Medicaid, and it takes several days, weeks, or months before qualification for such benefits is confirmed or denied, and (3) the patient is transferred to our hospital from an acute care hospital without having access to a credit card, cash, or check to pay the applicable patient responsibility amounts (i.e., deductibles and co-payments). Based on our historical collection trends, our primary collection risks relate to patient accounts for which the patient was the primary payor or the primary insurance carrier has paid the amounts covered by the applicable agreement, but patient responsibility amounts remain outstanding. Changes in the economy, such as increased unemployment rates or periods of recession, can further exacerbate our ability to collect patient responsibility amounts.
We estimate our allowance for doubtful accounts based on the aging of our accounts receivable, our historical collection experience for each type of payor, and other relevant factors so that the remaining receivables, net of allowances, are reflected at their estimated net realizable values. Accounts requiring collection efforts are reviewed via system-generated work queues that automatically stage (based on age and size of outstanding balance) accounts requiring collection efforts for patient account representatives. Collection efforts include contacting the applicable party (both in writing and by telephone), providing information (both financial and clinical) to allow for payment or to overturn payor decisions to deny payment, and arranging payment plans with self-pay patients, among other techniques. When we determine all in-house efforts have been exhausted or it is a more prudent use of resources, accounts may be turned over to a collection agency. Accounts are written off after all collection efforts (internal and external) have been exhausted.
For several years, under programs designated as “widespread probes,” certain of our MACs have conducted pre-payment claim reviews of our billings and denied payment for certain diagnosis codes based on medical necessity. We dispute, or “appeal,” most of these denials, and we have historically collected approximately
58%
of all amounts denied. For claims we choose to take through all levels of appeal, up to and including administrative law judge hearings, we have historically experienced an approximate
70%
success rate. The resolution of these disputes can take in excess of two years, and we cannot provide assurance as to our ongoing and future success of these disputes. As such, we make provisions against these receivables in accordance with our accounting policy that necessarily considers historical collection trends of the receivables in this review process as part of our
Provision for doubtful accounts
. Because we do not write-off receivables until all collection efforts have been exhausted, we do not write-off receivables related to denied claims while they are in this review process. When the amount collected related to denied claims differs from the net amount previously recorded, these collection differences are recorded in the
Provision for doubtful accounts
. As a result, the timing of these denials by MACs and their subsequent collection can create volatility in our
Provision for doubtful accounts
.
If actual results are not consistent with our assumptions and judgments, we may be exposed to gains or losses that could be material. Changes in general economic conditions, business office operations, payor mix, or trends in federal or state governmental and private employer healthcare coverage could affect our collection of accounts receivable, financial position, results of operations, and cash flows.
F-14
|
HealthSouth Corporation and Subsidiaries
Notes to Consolidated Financial Statements
|
||
Property and Equipment—
We report land, buildings, improvements, and equipment at cost, net of accumulated depreciation and amortization and any asset impairments. We report assets under capital lease obligations at the lower of fair value or the present value of the aggregate future minimum lease payments at the beginning of the lease term. We depreciate our assets using the straight-line method over the shorter of the estimated useful life of the assets or life of the lease term, excluding any lease renewals, unless the lease renewals are reasonably assured. Useful lives are generally as follows:
|
|
Years
|
||
|
Buildings
|
10 to 30
|
||
|
Leasehold improvements
|
2 to 15
|
||
|
Furniture, fixtures, and equipment
|
3 to 10
|
||
|
Assets under capital lease obligations:
|
|||
|
Real estate
|
15 to 20
|
||
|
Equipment
|
3 to 5
|
||
Maintenance and repairs of property and equipment are expensed as incurred. We capitalize replacements and betterments that increase the estimated useful life of an asset. We capitalize pre-acquisition costs when they are directly identifiable with a specific property, the costs would be capitalizable if the property were already acquired, and acquisition of the property is probable. We capitalize interest expense on major construction and development projects while in progress.
We retain fully depreciated assets in property and accumulated depreciation accounts until we remove them from service. In the case of sale, retirement, or disposal, the asset cost and related accumulated depreciation balances are removed from the respective accounts, and the resulting net amount, less any proceeds, is included as a component of income from continuing operations in the consolidated statements of operations. However, if the sale, retirement, or disposal involves a discontinued operation, the resulting net amount, less any proceeds, is included in the results of discontinued operations.
We account for operating leases by recognizing escalated rents, including any rent holidays, on a straight-line basis over the term of the lease.
Goodwill and Other Intangible Assets—
We are required to test our goodwill for impairment at least annually, absent some triggering event that would accelerate an impairment assessment. Absent any impairment indicators, we perform our goodwill impairment testing as of
October 1st
of each year.
We recognize an impairment charge for any amount by which the carrying amount of goodwill exceeds its implied fair value. We present a goodwill impairment charge as a separate line item within income from continuing operations in the consolidated statements of operations, unless the goodwill impairment is associated with a discontinued operation. In that case, we include the goodwill impairment charge, on a net-of-tax basis, within the results of discontinued operations.
We assess qualitative factors in our single reporting unit to determine whether it is necessary to perform the first step of the two-step quantitative goodwill impairment test. If, based on this qualitative assessment, we were to believe we must proceed to Step 1, we would determine the fair value of our reporting unit using generally accepted valuation techniques including the income approach and the market approach. The income approach includes the use of our reporting unit’s discounted projected operating results and cash flows. This approach includes many assumptions related to pricing and volume, operating expenses, capital expenditures, discount factors, tax rates, etc. Changes in economic and operating conditions impacting these assumptions could result in goodwill impairment in future periods. We reconcile the estimated fair value of our reporting unit to our market capitalization. When we dispose of a hospital, goodwill is allocated to the gain or loss on disposition using the relative fair value methodology.
F-15
|
HealthSouth Corporation and Subsidiaries
Notes to Consolidated Financial Statements
|
||
We amortize the cost of intangible assets with finite useful lives over their respective estimated useful lives to their estimated residual value. As of
December 31, 2013
, none of our finite useful lived intangible assets has an estimated residual value. We also review these assets for impairment whenever events or changes in circumstances indicate we may not be able to recover the asset’s carrying amount. As of
December 31, 2013
, we do not have any intangible assets with indefinite useful lives. The range of estimated useful lives and the amortization basis for our other intangible assets are generally as follows:
|
|
Estimated Useful Life
and Amortization Basis
|
||||
|
Certificates of need
|
10 to 30 years using straight-line basis
|
||||
|
Licenses
|
10 to 20 years using straight-line basis
|
||||
|
Noncompete agreements
|
3 to 18 years using straight-line basis
|
||||
|
Tradenames
|
10 to 20 years using straight-line basis
|
||||
|
Internal-use software
|
3 to 7 years using straight-line basis
|
||||
|
Market access assets
|
20 years using accelerated basis
|
||||
We capitalize the costs of obtaining or developing internal-use software, including external direct costs of material and services and directly related payroll costs. Amortization begins when the internal-use software is ready for its intended use. Costs incurred during the preliminary project and post-implementation stages, as well as maintenance and training costs, are expensed as incurred.
Our market access assets are valued using discounted cash flows under the income approach. The value of the market access assets is attributable to our ability to gain access to and penetrate an acquired facility’s historical market patient base. To determine this value, we first develop a debt-free net cash flow forecast under various patient volume scenarios. The debt-free net cash flow is then discounted back to present value using a discount factor, which includes an adjustment for company-specific risk. As noted in the above table, we amortize these assets over
20
years using an accelerated basis that reflects the pattern in which we believe the economic benefits of the market access will be consumed.
Impairment of Long-Lived Assets and Other Intangible Assets—
We assess the recoverability of long-lived assets (excluding goodwill) and identifiable acquired intangible assets with finite useful lives, whenever events or changes in circumstances indicate we may not be able to recover the asset’s carrying amount. We measure the recoverability of assets to be held and used by a comparison of the carrying amount of the asset to the expected net future cash flows to be generated by that asset, or, for identifiable intangibles with finite useful lives, by determining whether the amortization of the intangible asset balance over its remaining life can be recovered through undiscounted future cash flows. The amount of impairment of identifiable intangible assets with finite useful lives, if any, to be recognized is measured based on projected discounted future cash flows. We measure the amount of impairment of other long-lived assets (excluding goodwill) as the amount by which the carrying value of the asset exceeds the fair market value of the asset, which is generally determined based on projected discounted future cash flows or appraised values. We classify long-lived assets to be disposed of other than by sale as held and used until they are disposed. We report long-lived assets to be disposed of by sale as held for sale and recognize those assets in the balance sheet at the lower of carrying amount or fair value less cost to sell, and we cease depreciation.
Investments in and Advances to Nonconsolidated Affiliates—
Investments in entities we do not control but in which we have the ability to exercise significant influence over the operating and financial policies of the investee are accounted for under the equity method. Equity method investments are recorded at original cost and adjusted periodically to recognize our proportionate share of the investees’ net income or losses after the date of investment, additional contributions made, dividends or distributions received, and impairment losses resulting from adjustments to net realizable value. We record equity method losses in excess of the carrying amount of an investment when we guarantee obligations or we are otherwise committed to provide further financial support to the affiliate.
We use the cost method to account for equity investments for which the equity securities do not have readily determinable fair values and for which we do not have the ability to exercise significant influence. Under the cost method of
F-16
|
HealthSouth Corporation and Subsidiaries
Notes to Consolidated Financial Statements
|
||
accounting, private equity investments are carried at cost and are adjusted only for other-than-temporary declines in fair value, additional investments, or distributions deemed to be a return of capital.
Management periodically assesses the recoverability of our equity method and cost method investments and equity method goodwill for impairment. We consider all available information, including the recoverability of the investment, the earnings and near-term prospects of the affiliate, factors related to the industry, conditions of the affiliate, and our ability, if any, to influence the management of the affiliate. We assess fair value based on valuation methodologies, as appropriate, including discounted cash flows, estimates of sales proceeds, and external appraisals, as appropriate. If an investment or equity method goodwill is considered to be impaired and the decline in value is other than temporary, we record an appropriate write-down.
Financing Costs—
We amortize financing costs using the effective interest method over the expected life of the related debt. The related expense is included in
Interest expense and amortization of debt discounts and fees
in our consolidated statements of operations.
We accrete discounts and amortize premiums using the effective interest method over the expected life of the related debt, and we report discounts or premiums as a direct deduction from, or addition to, the face amount of the financing. The related income or expense is included in
Interest expense and amortization of debt discounts and fees
in our consolidated statements of operations.
Fair Value Measurements—
Fair value is an exit price, representing the amount that would be received to sell an asset or paid to transfer a liability in an orderly transaction between market participants. As such, fair value is a market-based measurement that should be determined based on assumptions market participants would use in pricing an asset or liability.
The basis for these assumptions establishes a three-tier fair value hierarchy, which prioritizes the inputs used in measuring fair value as follows:
|
•
|
Level 1
– Observable inputs such as quoted prices in active markets;
|
|
•
|
Level 2
– Inputs, other than quoted prices in active markets, that are observable either directly or indirectly; and
|
|
•
|
Level 3
– Unobservable inputs in which there is little or no market data, which require the reporting entity to develop its own assumptions.
|
Assets and liabilities measured at fair value are based on one or more of three valuation techniques. The three valuation techniques are as follows:
|
•
|
Market approach
– Prices and other relevant information generated by market transactions involving identical or comparable assets or liabilities;
|
|
•
|
Cost approach
– Amount that would be required to replace the service capacity of an asset (i.e., replacement cost); and
|
|
•
|
Income approach
– Techniques to convert future amounts to a single present amount based on market expectations (including present value techniques, option-pricing models, and lattice models).
|
Our financial instruments consist mainly of cash and cash equivalents, restricted cash, restricted marketable securities, accounts receivable, accounts payable, letters of credit, and long-term debt. The carrying amounts of cash and cash equivalents, restricted cash, accounts receivable, and accounts payable approximate fair value because of the short-term maturity of these instruments. The fair value of our letters of credit is deemed to be the amount of payment guaranteed on our behalf by third-party financial institutions. We determine the fair value of our long-term debt using quoted market prices, when available, or discounted cash flows based on various factors, including maturity schedules, call features, and current market rates.
F-17
|
HealthSouth Corporation and Subsidiaries
Notes to Consolidated Financial Statements
|
||
On a recurring basis, we are required to measure our available-for-sale restricted marketable securities. The fair values of our available-for-sale restricted marketable securities are determined based on quoted market prices in active markets or quoted prices, dealer quotations, or alternative pricing sources supported by observable inputs in markets that are not considered to be active.
On a nonrecurring basis, we are required to measure property and equipment, goodwill, other intangible assets, investments in nonconsolidated affiliates, and assets and liabilities of discontinued operations at fair value. Generally, assets are recorded at fair value on a nonrecurring basis as a result of impairment charges or similar adjustments made to the carrying value of the applicable assets. The fair value of our property and equipment is determined using discounted cash flows and significant unobservable inputs, unless there is an offer to purchase such assets, which could be the basis for determining fair value. The fair value of our intangible assets, excluding goodwill, is determined using discounted cash flows and significant unobservable inputs. The fair value of our investments in nonconsolidated affiliates is determined using quoted prices in private markets, discounted cash flows or earnings, or market multiples derived from a set of comparables. The fair value of our assets and liabilities of discontinued operations is determined using discounted cash flows and significant unobservable inputs unless there is an offer to purchase such assets and liabilities, which would be the basis for determining fair value. The fair value of our goodwill is determined using discounted projected operating results and cash flows, which involve significant unobservable inputs.
See also the “Redeemable Noncontrolling Interests” section of this note.
Noncontrolling Interests in Consolidated Affiliates—
The consolidated financial statements include all assets, liabilities, revenues, and expenses of less-than-100%-owned affiliates we control. Accordingly, we have recorded noncontrolling interests in the earnings and equity of such entities. We record adjustments to noncontrolling interests for the allocable portion of income or loss to which the noncontrolling interests holders are entitled based upon their portion of the subsidiaries they own. Distributions to holders of noncontrolling interests are adjusted to the respective noncontrolling interests holders’ balance.
Convertible Perpetual Preferred Stock—
Our
Convertible perpetual preferred stock
contains fundamental change provisions that allow the holder to require us to redeem the preferred stock for cash if certain events occur. As redemption under these provisions is not solely within our control, we have classified our
Convertible perpetual preferred stock
as temporary equity.
Because our
Convertible perpetual preferred stock
is indexed to, and potentially settled in, our common stock, we also examined whether the embedded conversion option in our
Convertible perpetual preferred stock
should be bifurcated. Based on our analysis, we determined bifurcation is not necessary.
Redeemable Noncontrolling Interests—
Certain of our joint venture agreements contain provisions that allow our partners to require us to purchase their interests in the joint venture at fair value at certain points in the future. Because these noncontrolling interests provide for redemption features that are not solely within our control, we classify them as
Redeemable noncontrolling interests
outside of permanent equity in our consolidated balance sheets. At the end of each reporting period, we compare the carrying value of the
Redeemable noncontrolling interests
to their estimated redemption value. If the estimated redemption value is greater than the current carrying value, the carrying value is adjusted to the estimated redemption value, with the adjustments recorded through equity in the line item
Capital in excess of par value
.
The fair value of our
Redeemable noncontrolling interests
is determined primarily using the income approach. The income approach includes the use of the hospital’s projected operating results and cash flows discounted using a rate that reflects market participant assumptions for the applicable hospitals, or
Level 3
inputs. The projected operating results use management’s best estimates of economic and market conditions over the forecasted periods including assumptions for pricing and volume, operating expenses, and capital expenditures.
F-18
|
HealthSouth Corporation and Subsidiaries
Notes to Consolidated Financial Statements
|
||
Share-Based Payments—
HealthSouth has shareholder-approved stock-based compensation plans that provide for the granting of stock-based compensation to certain employees and directors. All share-based payments to employees, including grants of employee stock options, are recognized in the financial statements based on their estimated grant-date fair value and amortized on a straight-line basis over the applicable requisite service period.
Litigation Reserves—
We accrue for loss contingencies associated with outstanding litigation for which management has determined it is probable a loss contingency exists and the amount of loss can be reasonably estimated. If the accrued amount associated with a loss contingency is greater than
$5.0 million
, we also accrue estimated future legal fees associated with the loss contingency. This requires management to estimate the amount of legal fees that will be incurred in the defense of the litigation. These estimates are based on our expectations of the scope, length to complete, and complexity of the claims. In the future, additional adjustments may be recorded as the scope, length, or complexity of outstanding litigation changes.
Advertising Costs—
We expense costs of print, radio, television, and other advertisements as incurred. Advertising expenses, primarily included in
Other operating expenses
within the accompanying consolidated statements of operations, were
$5.2 million
,
$5.0 million
, and
$4.3 million
in each of the years ended December 31,
2013
,
2012
, and
2011
, respectively.
Professional Fees—Accounting, Tax, and Legal—
In
2013
,
2012
, and
2011
, Professional fees—accounting, tax, and legal
related primarily to legal and consulting fees for continued litigation and support matters discussed in
Note 18,
Contingencies and Other Commitments
. These expenses in 2012 also included legal and consulting fees for the pursuit of our remaining income tax benefits, as discussed in
Note 16,
Income Taxes
.
Income Taxes—
We provide for income taxes using the asset and liability method
.
This approach recognizes the amount of income taxes payable or refundable for the current year, as well as deferred tax assets and liabilities for the future tax consequence of events recognized in the consolidated financial statements and income tax returns. Deferred income tax assets and liabilities are adjusted to recognize the effects of changes in tax laws or enacted tax rates.
A valuation allowance is required when it is more likely than not some portion of the deferred tax assets will not be realized. Realization is dependent on generating sufficient future taxable income in the applicable tax jurisdiction. On a quarterly basis, we assess the likelihood of realization of our deferred tax assets considering all available evidence, both positive and negative. Our most recent operating performance, the scheduled reversal of temporary differences, our forecast of taxable income in future periods by jurisdiction, our ability to sustain a core level of earnings, and the availability of prudent tax planning strategies are important considerations in our assessment.
We evaluate our tax positions and establish assets and liabilities in accordance with the applicable accounting guidance on uncertainty in income taxes. We review these tax uncertainties in light of changing facts and circumstances, such as the progress of tax audits, and adjust them accordingly.
We use the with-and-without method to determine when we will recognize excess tax benefits from stock-based compensation. Under this method, we recognize these excess tax benefits only after we fully realize the tax benefits of net operating losses.
HealthSouth and its corporate subsidiaries file a consolidated federal income tax return. Some subsidiaries consolidated for financial reporting purposes are not part of the consolidated group for federal income tax purposes and file separate federal income tax returns. State income tax returns are filed on a separate, combined, or consolidated basis in accordance with relevant state laws and regulations. Partnerships, limited liability companies, and other pass-through entities we consolidate or account for using the equity method of accounting file separate federal and state income tax returns. We
F-19
|
HealthSouth Corporation and Subsidiaries
Notes to Consolidated Financial Statements
|
||
include the allocable portion of each pass-through entity’s income or loss in our federal income tax return. We allocate the remaining income or loss of each pass-through entity to the other partners or members who are responsible for their portion of the taxes.
Assets and Liabilities in and Results of Discontinued Operations—
Components of an entity that have been disposed of or are classified as held for sale and have operations and cash flows that can be clearly distinguished from the rest of the entity are reported as discontinued operations. In the period a component of an entity has been disposed of or classified as held for sale, we reclassify the results of operations for current and prior periods into a single caption titled
(Loss) income from discontinued operations, net of tax
. In addition, we classify the assets and liabilities of those components as current and noncurrent assets and liabilities within
Prepaid expenses and other current assets
,
Other long-term assets
,
Other current liabilities
, and
Other long-term liabilities
in our consolidated balance sheets. We also classify cash flows related to discontinued operations as one line item within each category of cash flows in our consolidated statements of cash flows.
Earnings per Common Share—
The calculation of earnings per common share is based on the weighted-average number of our common shares outstanding during the applicable period. The calculation for diluted earnings per common share recognizes the effect of all potential dilutive common shares, including warrants, that were outstanding during the respective periods, unless their impact would be antidilutive. The calculation of earnings per common share also considers the effect of participating securities. Stock-based compensation awards that contain nonforfeitable rights to dividends and dividend equivalents, such as our nonvested restricted stock awards and restricted stock units, are considered participating securities and are included in the computation of earnings per common share pursuant to the two-class method. In applying the two-class method, earnings are allocated to both common stock shares and participating securities based on their respective weighted-average shares outstanding for the period.
We use the if-converted method to include our
Convertible perpetual preferred stock
and convertible senior subordinated notes in our computation of diluted earnings per share. All other potential dilutive shares, including warrants, are included in our weighted-average diluted share count using the treasury stock method.
Treasury Stock—
Shares of common stock repurchased by us are recorded at cost as treasury stock. When shares are reissued, we use an average cost method to determine cost. The difference between the cost of the shares and the reissuance price is added to or deducted from
Capital in excess of par value
. We account for the retirement of treasury stock as a reduction of retained earnings. However, due to our
Accumulated deficit
, the retirement of treasury stock is currently recorded as a reduction of
Capital in excess of par value
.
Comprehensive Income—
Comprehensive income
is comprised of
Net income
and changes in unrealized gains or losses on available-for-sale securities and is included in the consolidated statements of comprehensive income.
Recent Accounting Pronouncements
—
We do not believe any recently issued, but not yet effective, accounting standards will have a material effect on our consolidated financial position, results of operations, or cash flows.
|
2.
|
Business Combinations
:
|
In April 2013, we closed the transaction to acquire Walton Rehabilitation Hospital, a
58
-bed inpatient rehabilitation hospital in Augusta, Georgia. The acquisition was not material to our financial position, results of operations, or cash flows. As a result of this transaction,
Goodwill
increased by
$13.7 million
. The acquisition was funded using availability under our revolving credit facility.
F-20
|
HealthSouth Corporation and Subsidiaries
Notes to Consolidated Financial Statements
|
||
In April 2012, we acquired
12
inpatient rehabilitation beds in Andalusia, Alabama from a subsidiary of LifePoint Hospitals in order to add beds at our existing hospital in Dothan, Alabama. In July 2012, we acquired the
34
-bed inpatient rehabilitation unit of CHRISTUS Santa Rosa Hospital - Medical Center. The operations of this unit have been relocated to and consolidated with our existing hospital in San Antonio, Texas. These transactions, either individually or in the aggregate, were not material to our financial position, results of operations, or cash flows.
Goodwill
did not increase as a result of these transactions. Both acquisitions were funded with available cash.
In November 2011, we completed a transaction to purchase substantially all of the assets of Drake Center’s two rehabilitation-focused patient care units located in Cincinnati, Ohio and sublease space for the operation of a
40
-bed inpatient rehabilitation hospital that is fully owned and operated by HealthSouth. HealthSouth Rehabilitation Hospital at Drake remained on Drake’s campus and began accepting patients in mid-December 2011. This transaction was not material to our financial position, results of operations, or cash flows. As a result of this transaction,
Goodwill
increased by
$1.4 million
. The acquisition was funded with available cash.
These acquisitions were made to enhance our position and ability to provide inpatient rehabilitative services to patients in the respective areas. All of the goodwill resulting from these transactions is deductible for federal income tax purposes. The goodwill reflects our expectations of our ability to gain access to and penetrate the acquired hospital’s historical patient base and the benefits of being able to leverage operational efficiencies with favorable growth opportunities based on positive demographic trends in these markets.
We accounted for these transactions under the acquisition method of accounting and reported the results of operations of the acquired hospitals from their respective dates of acquisition. Assets acquired and liabilities assumed were recorded at their estimated fair values as of the acquisition date. The fair values of identifiable intangible assets were based on valuations using the cost and income approaches. The cost approach is based on amounts that would be required to replace the asset (i.e., replacement cost). The income approach is based on management’s estimates of future operating results and cash flows discounted using a weighted-average cost of capital that reflects market participant assumptions. The excess of the fair value of the consideration conveyed over the fair value of the net assets acquired was recorded as goodwill.
The fair value of the assets acquired and liabilities assumed at the acquisition date for the transaction completed in 2013 was as follows (in millions):
|
Property and equipment, net
|
$
|
11.3
|
|
|
Identifiable intangible assets:
|
|
|
|
|
Noncompete agreement (useful life of 5 years)
|
0.1
|
|
|
|
Tradename (useful life of 20 years)
|
0.9
|
|
|
|
Certificate of need (useful life of 20 years)
|
3.3
|
|
|
|
Goodwill
|
13.7
|
|
|
|
Total assets acquired
|
29.3
|
|
|
|
Total current liabilities assumed
|
(0.4
|
)
|
|
|
Net assets acquired
|
$
|
28.9
|
|
F-21
|
HealthSouth Corporation and Subsidiaries
Notes to Consolidated Financial Statements
|
||
The Company’s reported
Net operating revenues
and
Net income
for the year ended December 31, 2013 include operating results for Walton Rehabilitation Hospital from April 1, 2013 through December 31, 2013. The following table summarizes the results of operations of the above mentioned transaction from the date of acquisition included in our consolidated results of operations and the unaudited pro forma results of operations of the combined entity had the date of the acquisition been January 1, 2012 (in millions):
|
Net Operating
Revenues
|
Net Income
Attributable to
HealthSouth
|
||||||
|
Acquired entity only: Actual from acquisition date to December 31, 2013
|
$
|
11.8
|
|
$
|
0.1
|
|
|
|
Combined entity: Supplemental pro forma from 1/01/2013-12/31/2013 (unaudited)
|
2,278.1
|
|
323.2
|
|
|||
|
Combined entity: Supplemental pro forma from 1/01/2012-12/31/2012 (unaudited)
|
2,183.6
|
|
184.8
|
|
|||
Information regarding the net cash paid for all acquisitions during each period presented is as follows (in millions):
|
For the Year Ended December 31,
|
|||||||||||
|
2013
|
2012
|
2011
|
|||||||||
|
Fair value of assets acquired
|
$
|
15.6
|
|
$
|
2.1
|
|
$
|
0.7
|
|
||
|
Goodwill
|
13.7
|
|
—
|
|
1.4
|
|
|||||
|
Fair value of liabilities assumed
|
(0.4
|
)
|
—
|
|
—
|
|
|||||
|
Noncompete agreements
|
—
|
|
1.0
|
|
2.8
|
|
|||||
|
Net cash paid for acquisitions
|
$
|
28.9
|
|
$
|
3.1
|
|
$
|
4.9
|
|
||
See also
Note 7,
Investments in and Advances to Nonconsolidated Affiliates
.
|
3.
|
Cash and Marketable Securities
:
|
The components of our investments as of
December 31, 2013
are as follows (in millions):
|
|
Cash & Cash Equivalents
|
Restricted Cash
|
Restricted Marketable Securities
|
Total
|
|||||||||||
|
Cash
|
$
|
64.5
|
|
$
|
52.4
|
|
$
|
—
|
|
$
|
116.9
|
|
|||
|
Equity securities
|
—
|
|
—
|
|
47.6
|
|
47.6
|
|
|||||||
|
Total
|
$
|
64.5
|
|
$
|
52.4
|
|
|
$
|
47.6
|
|
$
|
164.5
|
|
||
The components of our investments as of
December 31, 2012
are as follows (in millions):
|
|
Cash & Cash Equivalents
|
Restricted Cash
|
Restricted Marketable Securities
|
Total
|
|||||||||||
|
Cash
|
$
|
132.8
|
|
$
|
49.3
|
|
$
|
—
|
|
$
|
182.1
|
|
|||
|
Equity securities
|
—
|
|
—
|
|
55.8
|
|
55.8
|
|
|||||||
|
Total
|
$
|
132.8
|
|
$
|
49.3
|
|
$
|
55.8
|
|
$
|
237.9
|
|
|||
F-22
|
HealthSouth Corporation and Subsidiaries
Notes to Consolidated Financial Statements
|
||
Restricted Cash—
As of
December 31, 2013
and
2012
,
Restricted cash
consisted of the following (in millions):
|
|
As of December 31,
|
||||||
|
|
2013
|
2012
|
|||||
|
Affiliate cash
|
$
|
13.6
|
|
$
|
22.5
|
|
|
|
Self-insured captive funds
|
37.8
|
|
26.0
|
|
|||
|
Paid-loss deposit funds
|
1.0
|
|
0.8
|
|
|||
|
Total restricted cash
|
$
|
52.4
|
|
$
|
49.3
|
|
|
Affiliate cash represents cash accounts maintained by joint ventures in which we participate where one or more of our external partners requested, and we agreed, that the joint venture’s cash not be commingled with other corporate cash accounts and be used only to fund the operations of those joint ventures. Self-insured captive funds represent cash held at our wholly owned insurance captive, HCS, Ltd., as discussed in
Note 9,
Self-Insured Risks
. These funds are committed to pay third-party administrators for claims incurred and are restricted by insurance regulations and requirements. These funds cannot be used for purposes outside HCS without the permission of the Cayman Islands Monetary Authority. Paid-loss deposit funds represent cash held by third-party administrators to fund expenses and other payments related to claims.
The classification of restricted cash held by HCS as current or noncurrent depends on the classification of the corresponding claims liability. As of
December 31, 2013
and
2012
, all restricted cash was current.
Marketable Securities—
Restricted marketable securities at both balance sheet dates represent restricted assets held at HCS. HCS insures HealthSouth’s professional liability, workers’ compensation, and other insurance claims. These funds are committed for payment of claims incurred, and the classification of these marketable securities as current or noncurrent depends on the classification of the corresponding claims liability. As of
December 31, 2013
and
2012
,
$42.9 million
and
$39.4 million
, respectively, of restricted marketable securities are included in
Other long-term assets
in our consolidated balance sheets.
A summary of our restricted marketable securities as of
December 31, 2013
is as follows (in millions):
|
|
Cost
|
Gross Unrealized Gains
|
Gross Unrealized Losses
|
Fair Value
|
|||||||||||
|
Equity securities
|
$
|
47.9
|
|
$
|
0.2
|
|
$
|
(0.5
|
)
|
$
|
47.6
|
|
|||
A summary of our restricted marketable securities as of
December 31, 2012
is as follows (in millions):
|
|
Cost
|
Gross Unrealized Gains
|
Gross Unrealized Losses
|
Fair Value
|
|||||||||||
|
Equity securities
|
$
|
54.4
|
|
$
|
1.5
|
|
$
|
(0.1
|
)
|
$
|
55.8
|
|
|||
Cost in the above tables includes adjustments made to the cost basis of our equity securities for other-than-temporary impairments. During the years ended
December 31, 2013
,
2012
, and
2011
, we did not record any impairment charges related to our restricted marketable securities.
F-23
|
HealthSouth Corporation and Subsidiaries
Notes to Consolidated Financial Statements
|
||
Investing information related to our restricted marketable securities is as follows (in millions):
|
|
For the Year Ended December 31,
|
||||||||||
|
|
2013
|
2012
|
2011
|
||||||||
|
Proceeds from sales of restricted available-for-sale securities
|
$
|
16.6
|
|
$
|
—
|
|
$
|
—
|
|
||
|
Gross realized gains
|
$
|
1.0
|
|
$
|
—
|
|
$
|
—
|
|
||
|
Gross realized losses
|
$
|
(0.1
|
)
|
$
|
—
|
|
$
|
—
|
|
||
Our portfolio of marketable securities is comprised of investments in mutual funds that hold investments in a variety of industries and geographies. As discussed in
Note 1,
Summary of Significant Accounting Policies
, “Marketable Securities,” when our portfolio includes marketable securities with unrealized losses that are not deemed to be other-than-temporarily impaired, we examine the severity and duration of the impairments in relation to the cost of the individual investments. We also consider the industry and geography in which each investment is held and the near-term prospects for a recovery in each.
|
4.
|
Accounts Receivable
:
|
Accounts receivable consists of the following (in millions):
|
|
As of December 31,
|
||||||
|
|
2013
|
2012
|
|||||
|
Current:
|
|||||||
|
Patient accounts receivable, net of allowance for doubtful accounts of $23.1 million in 2013; $28.7 million in 2012
|
$
|
249.4
|
|
$
|
231.3
|
|
|
|
Other accounts receivable
|
12.4
|
|
18.0
|
|
|||
|
261.8
|
|
249.3
|
|
||||
|
Noncurrent patient accounts receivable, net of allowance for doubtful accounts of $10.0 million in 2013
|
16.6
|
|
—
|
|
|||
|
Accounts receivable, net
|
$
|
278.4
|
|
$
|
249.3
|
|
|
During 2013, CMS announced additional delays in the adjudication process of claims that are part of Medicare audit programs. Because the resolution of such claims can take in excess of two years, we review the patient receivables that are part of this adjudication process to determine their appropriate classification as either current or noncurrent. Amounts considered noncurrent are included in
Other long-term assets
in our consolidated balance sheet.
At
December 31, 2013
and
2012
, our allowance for doubtful accounts represented approximately
11.1%
and
11.0%
, respectively, of the total patient due accounts receivable balance.
The following is the activity related to our allowance for doubtful accounts (in millions):
|
For the Year Ended December 31,
|
Balance at Beginning of Period
|
Additions and Charges to Expense
|
Deductions and Accounts Written Off
|
Balance at End of Period
|
||||||||||||
|
2013
|
$
|
28.7
|
|
$
|
26.0
|
|
$
|
(21.6
|
)
|
$
|
33.1
|
|
||||
|
2012
|
$
|
21.4
|
|
$
|
27.0
|
|
$
|
(19.7
|
)
|
$
|
28.7
|
|
||||
|
2011
|
$
|
22.7
|
|
$
|
21.0
|
|
$
|
(22.3
|
)
|
$
|
21.4
|
|
||||
F-24
|
HealthSouth Corporation and Subsidiaries
Notes to Consolidated Financial Statements
|
||
|
5.
|
Property and Equipment
:
|
Property and equipment consists of the following (in millions):
|
|
As of December 31,
|
||||||
|
|
2013
|
2012
|
|||||
|
Land
|
$
|
96.0
|
|
$
|
79.6
|
|
|
|
Buildings
|
1,085.2
|
|
963.7
|
|
|||
|
Leasehold improvements
|
65.0
|
|
62.3
|
|
|||
|
Furniture, fixtures, and equipment
|
344.4
|
|
324.5
|
|
|||
|
|
1,590.6
|
|
1,430.1
|
|
|||
|
Less: Accumulated depreciation and amortization
|
(712.6
|
)
|
(728.1
|
)
|
|||
|
|
878.0
|
|
702.0
|
|
|||
|
Construction in progress
|
32.5
|
|
46.0
|
|
|||
|
Property and equipment, net
|
$
|
910.5
|
|
$
|
748.0
|
|
|
As of
December 31, 2013
, approximately
79%
of our consolidated
Property and equipment, net
held by HealthSouth Corporation and its guarantor subsidiaries was pledged to the lenders under our credit agreement. See
Note 8,
Long-term Debt
, and
Note 20,
Condensed Consolidating Financial Information
.
Information related to fully depreciated assets and assets under capital lease obligations is as follows (in millions):
|
|
As of December 31,
|
||||||
|
|
2013
|
2012
|
|||||
|
Fully depreciated assets
|
$
|
225.0
|
|
$
|
219.0
|
|
|
|
Assets under capital lease obligations:
|
|
|
|
|
|||
|
Buildings
|
$
|
124.4
|
|
$
|
169.6
|
|
|
|
Equipment
|
0.2
|
|
0.2
|
|
|||
|
|
124.6
|
|
169.8
|
|
|||
|
Accumulated amortization
|
(47.6
|
)
|
(110.3
|
)
|
|||
|
Assets under capital lease obligations, net
|
$
|
77.0
|
|
$
|
59.5
|
|
|
The amount of depreciation expense, amortization expense relating to assets under capital lease obligations, interest capitalized, and rent expense under operating leases is as follows (in millions):
|
|
For the Year Ended December 31,
|
||||||||||
|
|
2013
|
2012
|
2011
|
||||||||
|
Depreciation expense
|
$
|
67.9
|
|
$
|
59.0
|
|
$
|
52.5
|
|
||
|
Amortization expense
|
$
|
9.5
|
|
$
|
10.1
|
|
$
|
11.1
|
|
||
|
Interest capitalized
|
$
|
1.9
|
|
$
|
1.0
|
|
$
|
0.5
|
|
||
|
Rent expense:
|
|
|
|
|
|
|
|||||
|
Minimum rent payments
|
$
|
40.3
|
|
$
|
41.2
|
|
$
|
38.5
|
|
||
|
Contingent and other rents
|
20.3
|
|
20.6
|
|
24.2
|
|
|||||
|
Other
|
4.2
|
|
4.5
|
|
4.2
|
|
|||||
|
Total rent expense
|
$
|
64.8
|
|
$
|
66.3
|
|
$
|
66.9
|
|
||
F-25
|
HealthSouth Corporation and Subsidiaries
Notes to Consolidated Financial Statements
|
||
Leases—
We lease certain land, buildings, and equipment under noncancelable operating leases generally expiring at various dates through
2025
. We also lease certain buildings and equipment under capital leases generally expiring at various dates through
2034
. Operating leases generally have
3
- to
15
-year terms, with one or more renewal options, with terms to be negotiated at the time of renewal. Various facility leases include provisions for rent escalation to recognize increased operating costs or require us to pay certain maintenance and utility costs. Contingent rents are included in rent expense in the year incurred.
Some facilities are subleased to other parties. Rental income from subleases approximated
$4.9 million
,
$4.7 million
, and
$4.7 million
for the years ended
December 31, 2013
,
2012
, and
2011
, respectively. Total expected future minimum rentals under these noncancelable subleases approximated
$10.4 million
as of
December 31, 2013
.
Certain leases contain annual escalation clauses based on changes in the Consumer Price Index while others have fixed escalation terms. The excess of cumulative rent expense (recognized on a straight-line basis) over cumulative rent payments made on leases with fixed escalation terms is recognized as straight-line rental accrual and is included in
Other long-term liabilities
in the accompanying consolidated balance sheets, as follows (in millions):
|
|
As of December 31,
|
||||||
|
|
2013
|
2012
|
|||||
|
Straight-line rental accrual
|
$
|
17.3
|
|
$
|
7.7
|
|
|
In March 2008, we sold our corporate campus to Daniel Corporation (“Daniel”), a Birmingham, Alabama-based real estate company. The sale included a deferred purchase price component related to an incomplete 13-story building located on the property, often referred to as the Digital Hospital. Under the agreement, Daniel was obligated upon sale of its interest in the building to pay to us
40%
of the net profit realized from the sale. In June 2013, Daniel sold the building to Trinity Medical Center. In the third quarter of 2013, we received
$10.8 million
in cash from Daniel in connection with the sale of the building. The gain associated with this transaction is being deferred and amortized over five years, which is the remaining life of our lease agreement with Daniel for the portion of the property we continue to occupy with our corporate office, as a component of
General and administrative expenses
.
Future minimum lease payments at
December 31, 2013
, for those leases having an initial or remaining noncancelable lease term in excess of one year, are as follows (in millions):
|
Year Ending December 31,
|
Operating Leases
|
Capital Lease Obligations
|
Total
|
|||||||||
|
2014
|
$
|
37.9
|
|
$
|
12.3
|
|
$
|
50.2
|
|
|||
|
2015
|
36.0
|
|
13.6
|
|
49.6
|
|
||||||
|
2016
|
31.0
|
|
13.5
|
|
44.5
|
|
||||||
|
2017
|
26.3
|
|
13.4
|
|
39.7
|
|
||||||
|
2018
|
22.0
|
|
13.5
|
|
35.5
|
|
||||||
|
2019 and thereafter
|
100.7
|
|
109.2
|
|
209.9
|
|
||||||
|
|
$
|
253.9
|
|
175.5
|
|
$
|
429.4
|
|
||||
|
Less: Interest portion
|
|
|
(86.6
|
)
|
|
|
||||||
|
Obligations under capital leases
|
|
|
$
|
88.9
|
|
|
|
|||||
In addition to the above, and as discussed in
Note 8,
Long-term Debt
, “Other Notes Payable,” we have
two
sale/leaseback transactions involving real estate accounted for as financings. Future minimum payments, which are accounted for as interest, under these obligations are
$2.7 million
in each of the next five years and
$14.0 million
thereafter.
F-26
|
HealthSouth Corporation and Subsidiaries
Notes to Consolidated Financial Statements
|
||
|
6.
|
Goodwill and Other Intangible Assets
:
|
The following table shows changes in the carrying amount of
Goodwill
for the years ended
December 31, 2013
,
2012
, and
2011
(in millions):
|
|
Amount
|
||
|
Goodwill as of December 31, 2010
|
$
|
420.3
|
|
|
Acquisition
|
1.4
|
|
|
|
Goodwill as of December 31, 2011
|
421.7
|
|
|
|
Consolidation of joint venture formerly accounted for under the equity method of accounting
|
15.6
|
|
|
|
Goodwill as of December 31, 2012
|
437.3
|
|
|
|
Acquisition
|
13.7
|
|
|
|
Conversion of 100% owned hospital into a joint venture
|
6.2
|
|
|
|
Divestiture of skilled nursing facility beds
|
(0.3
|
)
|
|
|
Goodwill as of December 31, 2013
|
$
|
456.9
|
|
Goodwill
increased in 2011 as a result of our acquisition of Drake Center’s two rehabilitation-focused patient care units.
Goodwill
increased in 2012 as a result of our consolidation of St. Vincent Rehabilitation Hospital and the remeasurement of our previously held equity interest at fair value.
Goodwill
increased in 2013 as a result of our acquisition of Walton Rehabilitation Hospital and conversion of our
100%
owned hospital in Jonesboro, Arkansas into a joint venture with St. Bernards Healthcare offset by the divestiture of
41
skilled nursing facility beds. See
Note 2,
Business Combinations
,
Note 7,
Investments in and Advances to Nonconsolidated Affiliates
, and
Note 11,
Redeemable Noncontrolling Interests
.
We performed impairment reviews as of October 1,
2013
,
2012
, and
2011
and concluded no
Goodwill
impairment existed. As of
December 31, 2013
, we had no accumulated impairment losses related to
Goodwill
.
F-27
|
HealthSouth Corporation and Subsidiaries
Notes to Consolidated Financial Statements
|
||
The following table provides information regarding our other intangible assets (in millions):
|
|
Gross Carrying Amount
|
Accumulated Amortization
|
Net
|
||||||||
|
Certificates of need:
|
|
|
|
||||||||
|
2013
|
$
|
14.7
|
|
$
|
(3.0
|
)
|
$
|
11.7
|
|
||
|
2012
|
9.9
|
|
(2.5
|
)
|
7.4
|
|
|||||
|
Licenses:
|
|
|
|
|
|
|
|||||
|
2013
|
$
|
50.5
|
|
$
|
(44.9
|
)
|
$
|
5.6
|
|
||
|
2012
|
50.6
|
|
(42.9
|
)
|
7.7
|
|
|||||
|
Noncompete agreements:
|
|
|
|
|
|
|
|||||
|
2013
|
$
|
40.2
|
|
$
|
(24.8
|
)
|
$
|
15.4
|
|
||
|
2012
|
34.3
|
|
(20.3
|
)
|
14.0
|
|
|||||
|
Tradenames:
|
|
|
|
|
|
|
|||||
|
2013
|
$
|
17.0
|
|
$
|
(9.3
|
)
|
$
|
7.7
|
|
||
|
2012
|
16.1
|
|
(8.6
|
)
|
7.5
|
|
|||||
|
Internal-use software:
|
|
|
|
|
|
|
|||||
|
2013
|
$
|
105.3
|
|
$
|
(63.5
|
)
|
$
|
41.8
|
|
||
|
2012
|
84.7
|
|
(55.0
|
)
|
29.7
|
|
|||||
|
Market access assets:
|
|||||||||||
|
2013
|
$
|
13.2
|
|
$
|
(7.2
|
)
|
$
|
6.0
|
|
||
|
2012
|
13.2
|
|
(6.3
|
)
|
6.9
|
|
|||||
|
Total intangible assets:
|
|
|
|
|
|
|
|||||
|
2013
|
$
|
240.9
|
|
$
|
(152.7
|
)
|
$
|
88.2
|
|
||
|
2012
|
208.8
|
|
(135.6
|
)
|
73.2
|
|
|||||
Amortization expense for other intangible assets is as follows (in millions):
|
|
For the Year Ended December 31,
|
||||||||||
|
|
2013
|
2012
|
2011
|
||||||||
|
Amortization expense
|
$
|
17.3
|
|
$
|
13.4
|
|
$
|
15.2
|
|
||
Total estimated amortization expense for our other intangible assets for the next five years is as follows (in millions):
|
Year Ending December 31,
|
Estimated Amortization Expense
|
||
|
2014
|
$
|
17.6
|
|
|
2015
|
15.8
|
|
|
|
2016
|
12.0
|
|
|
|
2017
|
8.6
|
|
|
|
2018
|
6.2
|
|
|
F-28
|
HealthSouth Corporation and Subsidiaries
Notes to Consolidated Financial Statements
|
||
|
7.
|
Investments in and Advances to Nonconsolidated Affiliates
:
|
Investments in and advances to nonconsolidated affiliates as of
December 31, 2013
represents our investment in
12
partially owned subsidiaries, of which
9
are general or limited partnerships, limited liability companies, or joint ventures in which HealthSouth or one of its subsidiaries is a general or limited partner, managing member, member, or venturer, as applicable. We do not control these affiliates but have the ability to exercise significant influence over the operating and financial policies of certain of these affiliates. Our ownership percentages in these affiliates range from approximately
1%
to
51%
. We account for these investments using the cost and equity methods of accounting. Our investments, which are included in
Other long-term assets
in our consolidated balance sheets, consist of the following (in millions):
|
|
As of December 31,
|
||||||
|
|
2013
|
2012
|
|||||
|
Equity method investments:
|
|
|
|||||
|
Capital contributions
|
$
|
2.9
|
|
$
|
2.8
|
|
|
|
Cumulative share of income
|
104.8
|
|
93.8
|
|
|||
|
Cumulative share of distributions
|
(88.8
|
)
|
(77.4
|
)
|
|||
|
|
18.9
|
|
19.2
|
|
|||
|
Cost method investments:
|
|
|
|
|
|||
|
Capital contributions, net of distributions and impairments
|
1.4
|
|
1.6
|
|
|||
|
Total investments in and advances to nonconsolidated affiliates
|
$
|
20.3
|
|
$
|
20.8
|
|
|
The following summarizes the combined assets, liabilities, and equity and the combined results of operations of our equity method affiliates (on a 100% basis, in millions):
|
|
As of December 31,
|
||||||
|
|
2013
|
2012
|
|||||
|
Assets—
|
|
|
|||||
|
Current
|
$
|
16.6
|
|
$
|
21.4
|
|
|
|
Noncurrent
|
36.2
|
|
36.6
|
|
|||
|
Total assets
|
$
|
52.8
|
|
$
|
58.0
|
|
|
|
Liabilities and equity—
|
|
|
|
|
|||
|
Current liabilities
|
$
|
2.4
|
|
$
|
6.6
|
|
|
|
Noncurrent liabilities
|
0.7
|
|
1.2
|
|
|||
|
Partners’ capital and shareholders’ equity—
|
|
|
|
|
|||
|
HealthSouth
|
18.9
|
|
19.2
|
|
|||
|
Outside partners
|
30.8
|
|
31.0
|
|
|||
|
Total liabilities and equity
|
$
|
52.8
|
|
$
|
58.0
|
|
|
F-29
|
HealthSouth Corporation and Subsidiaries
Notes to Consolidated Financial Statements
|
||
Condensed statements of operations (in millions):
|
|
For the Year Ended December 31,
|
||||||||||
|
|
2013
|
2012
|
2011
|
||||||||
|
Net operating revenues
|
$
|
74.3
|
|
$
|
83.3
|
|
$
|
87.0
|
|
||
|
Operating expenses
|
(43.6
|
)
|
(48.1
|
)
|
(53.1
|
)
|
|||||
|
Income from continuing operations, net of tax
|
24.6
|
|
28.3
|
|
26.5
|
|
|||||
|
Net income
|
24.6
|
|
28.3
|
|
26.5
|
|
|||||
During the third quarter of 2012, we negotiated with our partner to amend the joint venture agreement related to St. Vincent Rehabilitation Hospital which resulted in a change in accounting for this hospital from the equity method of accounting to a consolidated entity. The amendment revised certain participatory rights held by our joint venture partner resulting in HealthSouth gaining control of this entity from an accounting perspective. We accounted for this change in control as a business combination and consolidated this entity using the acquisition method. The consolidation of St. Vincent Rehabilitation Hospital did not have a material impact on our financial position, results of operations, or cash flows. As a result of our consolidation of this hospital and the remeasurement of our previously held equity interest at fair value, goodwill increased by
$15.6 million
, and we recorded a
$4.9 million
gain as part of
Other income
during the year ended December 31, 2012. See
Note 6,
Goodwill and Other Intangible Assets
, and
Note 12,
Fair Value Measurements
.
In December 2013, we signed an agreement to acquire an additional 30% equity interest from UMass Memorial Health Care, our joint venture partner in Fairlawn Rehabilitation Hospital in Worcester, Massachusetts. This transaction, which is subject to regulatory approval and is expected to close in 2014, will increase our ownership interest from
50%
to
80%
and will, when completed, result in a change in accounting for this hospital from the equity method of accounting to a consolidated entity. We expect to account for this change in control as a business combination and will consolidate this entity using the acquisition method. The consolidation of the operating results of Fairlawn Rehabilitation Hospital is not expected to have a material impact on our financial position, results of operations, or cash flows.
|
8.
|
|
Our long-term debt outstanding consists of the following (in millions):
|
|
As of December 31,
|
||||||
|
|
2013
|
2012
|
|||||
|
Credit Agreement—
|
|||||||
|
Advances under revolving credit facility
|
$
|
45.0
|
|
$
|
—
|
|
|
|
Bonds payable—
|
|||||||
|
7.25% Senior Notes due 2018
|
272.4
|
|
302.9
|
|
|||
|
8.125% Senior Notes due 2020
|
286.6
|
|
286.2
|
|
|||
|
7.75% Senior Notes due 2022
|
252.5
|
|
280.7
|
|
|||
|
5.75% Senior Notes due 2024
|
275.0
|
|
275.0
|
|
|||
|
2.00% Convertible Senior Subordinated Notes due 2043
|
249.5
|
|
—
|
|
|||
|
Other notes payable
|
47.6
|
|
36.8
|
|
|||
|
Capital lease obligations
|
88.9
|
|
71.9
|
|
|||
|
|
1,517.5
|
|
1,253.5
|
|
|||
|
Less: Current portion
|
(12.3
|
)
|
(13.6
|
)
|
|||
|
Long-term debt, net of current portion
|
$
|
1,505.2
|
|
$
|
1,239.9
|
|
|
F-30
|
HealthSouth Corporation and Subsidiaries
Notes to Consolidated Financial Statements
|
||
The following chart shows scheduled principal payments due on long-term debt for the next five years and thereafter (in millions):
|
Year Ending December 31,
|
Face Amount
|
Net Amount
|
||||||
|
2014
|
$
|
12.3
|
|
$
|
12.3
|
|
||
|
2015
|
9.0
|
|
9.0
|
|
||||
|
2016
|
9.0
|
|
9.0
|
|
||||
|
2017
|
8.1
|
|
8.1
|
|
||||
|
2018
|
325.0
|
|
326.0
|
|
||||
|
Thereafter
|
1,225.6
|
|
1,153.1
|
|
||||
|
Total
|
$
|
1,589.0
|
|
$
|
1,517.5
|
|
||
In June 2013, we amended our existing credit agreement to, among other things, permit unlimited restricted payments (as defined in the credit agreement) so long as the senior secured leverage ratio remains less than or equal to
1.5
x and extend the maturity date of the revolving credit facility from August 2017 to June 2018. In November 2013, we redeemed
$30.2 million
and
$27.9 million
of the outstanding principal amount of our existing 7.25% Senior Notes due 2018 and our existing 7.75% Senior Notes due 2022, respectively. Pursuant to the terms of these senior notes, this optional redemption represented
10%
of the outstanding principal amount of the notes at a price of
103%
, which resulted in a total cash outlay of approximately
$60 million
to retire the
$58.1 million
in principal. We used a combination of cash on hand and availability under our revolving credit facility for this redemption. As a result of this redemption, we recorded a
$2.4 million
Loss on early extinguishment of debt
in 2013. Additionally, in November 2013, we exchanged
$320 million
in aggregate principal amount of newly issued 2.00% Convertible Senior Subordinated Notes due 2043 for
257,110
shares of our outstanding 6.50% Series A Convertible Perpetual Preferred Stock. See
Note 10,
Convertible Perpetual Preferred Stock
.
In August 2012, we amended and restated our credit agreement to increase the size of our revolver from
$500 million
to
$600 million
,
eliminate the former
$100 million
term loan (
$95 million
outstanding), extend the revolver maturity from May 2016 to August 2017, and lower the interest rate spread by 50 basis points to an initial rate of
LIBOR plus 1.75%
. In addition, in September 2012, we completed a registered public offering of
$275 million
aggregate principal amount of 5.75% Senior Notes due 2024 at a public offering price of 100% of the principal amount, the proceeds of which were used to repay amounts outstanding under our revolving credit facility and redeem 10% of the outstanding principal amount of our existing 7.25% Senior Notes due 2018 and our existing 7.75% Senior Notes due 2022. As a result of these transactions, we recorded a
$4.0 million
Loss on early extinguishment of debt
in 2012.
During 2011, we completed refinancing transactions in which we issued an additional
$60 million
each of our 7.25% Senior Notes due 2018
and 7
.75% Senior Notes due 2022 and amended and restated our credit agreement to create, under a pre-existing accordion feature, a
$100 million
term loan maturing in 2016. Net proceeds from this senior notes offering were approximately
$122 million
. We used approximately
$45 million
of these net proceeds to repay a portion of the amounts outstanding under our revolving credit facili
ty. In June 2011, the remainder of the proceeds from this senior notes offering along with the
$100 million
of proceeds from the new term loan were used to redeem a portion of our 10.75% Senior Notes due 2016, as discussed below. Our 2011 credit agreement amendment also extended the maturity of our revolving credit facility to May 2016 and reduced by 100 basis points the applicable spread on loans. In September 2011, we redeemed the remainder of our 10.75% Senior Notes due 2016, as discussed below. As a resu
lt of the redemptions of our 10.75% Senior Notes due 2016, we recorded a
$38.8 million
Loss on early extinguishment of debt
in 2011.
Senior Secured Credit Agreement—
2013 Credit Agreement
On June 11, 2013, we amended our existing credit agreement, dated August 10, 2012 (the “Credit Agreement”). The Credit Agreement provides for a
$600 million
revolving credit facility with a
$260 million
letter of credit subfacility and a swingline loan subfacility all of which mature in June 2018.
F-31
|
HealthSouth Corporation and Subsidiaries
Notes to Consolidated Financial Statements
|
||
Amounts drawn on the revolving credit facility bear interest at a rate per annum of, at our option,
(1) LIBOR or (2) the higher of (a) Barclays’ Bank PLC’s (“Barclays”) prime rate and (b) the federal funds rate
plus
0.5%
, in each case, plus an applicable margin that varies depending upon our leverage ratio. We are also subject to a commitment fee of
0.375%
per annum on the daily amount of the unutilized commitments under the revolving credit facility. The initial interest rate on borrowings under the Credit Agreement is
LIBOR plus 1.75%
.
The Credit Agreement provides that, subject to the satisfaction of certain conditions, we will have the right to increase the amount of the revolving credit facility prior to its maturity by incurring incremental term loans or by increasing the revolving credit facility, or both, in an aggregate amount not to exceed
$300 million
.
The Credit Agreement contains affirmative and negative covenants and default and acceleration provisions, including a minimum interest coverage ratio and a maximum leverage ratio that change over time. Under one such negative covenant, we are restricted from paying common stock dividends, prepaying certain senior notes, and repurchasing preferred and common equity unless (1) we are not in default under the terms of the Credit Agreement and (2) our senior secured leverage ratio, as defined in the Credit Agreement, does not exceed 1.5x. In the event the senior secured leverage ratio exceeds 1.5x, these payments are subject to a limit of
$200 million
plus an amount equal to a portion of excess cash flows each fiscal year.
The Company's obligations under the Credit Agreement are secured by substantially all of (1) the real property owned by the Company and its subsidiary guarantors as of the date of this amendment and (2) the current and future personal property of the Company and its subsidiary guarantors. The Company's obligations are guaranteed by the subsidiary guarantors pursuant to the amended and restated collateral and guarantee agreement (the “Collateral and Guarantee Agreement”), dated as of October 26, 2010, among the Agent, the Company, and its subsidiaries identified therein (collectively, the “Subsidiary Guarantors”). In addition to the Collateral and Guarantee Agreement, we and the Subsidiary Guarantors entered into mortgages with respect to certain of our material real property that we owned as of the date of this amendment (excluding real property subject to preexisting liens and/or mortgages) to secure our obligations under the Credit Agreement.
As of December 31, 2013,
$45.0 million
were drawn under the revolving credit facility with an interest rate of
1.9%
. Amounts drawn as of December 31, 2013 exclude
$36.5 million
utilized under the letter of credit subfacility, which were being used in the ordinary course of business to secure workers’ compensation and other insurance coverages and for general corporate purposes.
2012 Credit Agreement
On August 10, 2012, we amended and restated our existing credit agreement, dated May 10, 2011 (the “2012 Credit Agreement”). The 2012 Credit Agreement provided for a
$600 million
revolving credit facility with a
$260 million
letter of credit subfacility and a swingline loan subfacility all of which would have matured in August 2017.
All other material terms were the same as the Credit Agreement discussed above. Our obligations under the 2012 Credit Agreement also were secured and guaranteed by us and our subsidiaries.
As of December 31, 2012, no amounts were drawn under the revolving credit facility. If amounts had been drawn as of that date, they would have bore interest at a rate of
2.05%
. As of December 31, 2012,
$39.5 million
were being utilized under the letter of credit subfacility, which were being used in the ordinary course of business to secure workers’ compensation and other insurance coverages and for general corporate purposes.
2011 Credit Agreement
On May 10, 2011, we amended and restated in its entirety our existing credit agreement, dated October 26, 2010 (the “2011 Credit Agreement”). The 2011 Credit Agreement provided for a
$100 million
term loan and a
$500 million
revolving credit facility with a
$260 million
letter of credit subfacility and a swingline loan subfacility all of which would have matured in May 2016. Quarterly amortization on the term loan began September 30, 2011 at
$1.25 million
through June 30, 2013, then at
$1.875 million
through June 30, 2014, and then at
$2.5 million
through March 31, 2016. In June 2011, the net proceeds from the term loan were used to redeem a portion of the
10.75% Senior Notes due 2016
.
The term loan and amounts drawn on the revolving credit facility under the 2011 Credit Agreement bore interest at a rate per annum of, at our option,
(1) LIBOR or (2) the higher of (a) Barclays’ prime rate and (b) the federal funds rate
plus
F-32
|
HealthSouth Corporation and Subsidiaries
Notes to Consolidated Financial Statements
|
||
0.5%
, in each case, plus an applicable margin that varied depending upon our leverage ratio. We were also subject to a commitment fee of
0.5%
per annum on the daily amount of the unutilized commitments under the revolving credit facility.
The initial interest rate on borrowings under the 2011 Credit Agreement was
LIBOR plus 2.5%
. Under the terms of the 2011 Credit Agreement, the applicable interest rate for a given interest rate period was adjusted based on the leverage ratio (defined in the 2011 Credit Agreement) as of the end of our most recent fiscal quarter. Accordingly, on August 5, 2011, the spread above the applicable base rate (LIBOR) applicable to both our revolving credit facility and term loan decreased from
2.5%
to
2.25%
as a result of the leverage ratio calculated under the terms of the 2011 Credit Agreement.
The 2011 Credit Agreement provided that, subject to the satisfaction of certain conditions, we had the right to increase the amount of the revolving credit facility prior to its maturity by incurring incremental term loans or by increasing the revolving credit facility, or both, in an aggregate amount not to exceed
$200 million
.
All other material terms were the same as the Credit Agreement discussed above. Our obligations under the 2011 Credit Agreement also were secured and guaranteed by us and our subsidiaries.
Bonds Payable—
Nonconvertible Notes
The Company’s 2018 Notes, 2020 Notes, 2022 Notes, and 2024 Notes (collectively, the “Senior Notes”) were issued pursuant to an indenture (the “Base Indenture”) dated as of December 1, 2009 between us and The Bank of Nova Scotia Trust Company of New York, as trustee (the “Original Trustee”), as supplemented by the second, third, and fourth supplemental indenture, respectively, relating to the Senior Notes (together with the Base Indenture, the “Indenture”), among us, the Subsidiary Guarantors (as defined in the Indenture), and the Original Trustee. The Original Trustee notified us of its intention to discontinue its corporate trust operations and, accordingly, to resign upon the appointment of a successor trustee. Effective July 29, 2013, Wells Fargo Bank, National Association, was appointed as successor trustee under the Indenture.
Pursuant to the terms of the Indenture, the Senior Notes are jointly and severally guaranteed on a senior, unsecured basis by all of our existing and future subsidiaries that guarantee borrowings under our Credit Agreement and other capital markets debt (see
Note 20,
Condensed Consolidating Financial Information
). The Senior Notes are senior, unsecured obligations of HealthSouth and rank equally with our other senior indebtedness, senior to any of our subordinated indebtedness, and effectively junior to our secured indebtedness to the extent of the value of the collateral securing such indebtedness.
Upon the occurrence of a change in control (as defined in the Indenture), each holder of the Senior Notes may require us to repurchase all or a portion of the notes in cash at a price equal to
101%
of the principal amount of the Senior Notes to be repurchased, plus accrued and unpaid interest.
The Senior Notes contain covenants and default and acceleration provisions, that, among other things, limit our and certain of our subsidiaries’ ability to (1) incur additional debt, (2) make certain restricted payments, (3) consummate specified asset sales, (4) incur liens, and (5) merge or consolidate with another person.
Senior Notes Due 2018 and 2022
On October 7, 2010, we completed a public offering of
$525.0 million
aggregate principal amount of senior notes, which included
$275.0 million
of 7.25% Senior Notes due 2018 (the “2018 Notes”) at par and
$250.0 million
of 7.75% Senior Notes due 2022 (the “2022 Notes”) at par (collectively, the “2018 and 2022 Senior Notes”). We used the net proceeds from the initial offering of the 2018 and 2022 Senior Notes to repay amounts outstanding under the term loan facility of our former credit agreement dated March 2006.
On March 7, 2011, we completed a public offering of
$120 million
aggregate principal amount of senior notes, which included an additional
$60 million
of the 2018 Notes at
103.25%
of the principal amount and an additional
$60 million
of the 2022 Notes at
103.50%
of the principal amount. Net proceeds from this offering were approximately
$122 million
. We used approximately
$45 million
of the net proceeds to repay a portion of the amounts outstanding under our revolving credit facility. In June 2011, the remainder of the net proceeds were used to redeem a portion of our
10.75% Senior Notes due 2016, as discussed below.
F-33
|
HealthSouth Corporation and Subsidiaries
Notes to Consolidated Financial Statements
|
||
On October 9, 2012,
$64.5 million
of the net proceeds from our public offering of the 2024 Notes were used to redeem
$33.5 million
of the outstanding principal amount of our existing 2018 Notes and
$31.0 million
of the outstanding principal amount of our existing 2022 Notes. The notes were redeemed at a price of
103%
, which resulted in an additional cash outlay of
$1.9 million
from the net proceeds.
On November 29, 2013, we redeemed
$30.2 million
and
$27.9 million
of the outstanding principal amount of our existing 2018 Notes and our existing 2022 Notes, respectively. Pursuant to the terms of these senior notes, this optional redemption represented
10%
of the outstanding principal amount of the notes at a price of
103%
, which resulted in a total cash outlay of approximately
$60 million
to retire the
$58.1 million
in principal. We used a combination of cash on hand and availability under our revolving credit facility for this redemption.
2018 Notes
The 2018 Notes mature on
October 1, 2018
and bear interest at a per annum rate of
7.25%
. Due to financing costs, the effective interest rate on the 2018 Notes is
7.5%
. Interest is payable
semiannually in arrears on April 1 and October 1 of each year.
We may redeem the 2018 Notes, in whole or in part, at any time on or after October 1, 2014, at the redemption prices set forth below:
|
Period
|
Redemption
Price*
|
||
|
2014
|
103.625
|
%
|
|
|
2015
|
101.813
|
%
|
|
|
2016 and thereafter
|
100.000
|
%
|
|
* Expressed in percentage of principal amount
2022 Notes
The 2022 Notes mature on
September 15, 2022
and bear interest at a per annum rate of
7.75%
. Due to financing costs, the effective interest rate on the 2022 Notes is
7.9%
. Interest is payable
semiannually in arrears on March 15 and September 15 of each year.
We may redeem the 2022 Notes, in whole or in part, at any time on or after September 15, 2015, at the redemption prices set forth below:
|
Period
|
Redemption
Price*
|
||
|
2015
|
103.875
|
%
|
|
|
2016
|
102.583
|
%
|
|
|
2017
|
101.292
|
%
|
|
|
2018 and thereafter
|
100.000
|
%
|
|
* Expressed in percentage of principal amount
Prior to September 15, 2015, during any 12-month period, we may redeem up to
10%
of the aggregate principal amount of the 2022 Notes at a redemption price equal to
103%
of the principal amount, plus accrued and unpaid interest, if any, to the redemption date.
F-34
|
HealthSouth Corporation and Subsidiaries
Notes to Consolidated Financial Statements
|
||
Senior Notes Due 2020
In December 2009, we issued
$290.0 million
of
8.125%
Senior Notes due 2020 (the “2020 Notes”) at
98.327%
of par. We used the net proceeds from this transaction along with cash on hand to tender for and redeem all of our former floating rate senior notes due 2014 outstanding at that time. Due to discounts and financing costs, the effective interest rate on the 2020 Notes is
8.7%
. Interest is payable
semiannually in arrears on February 15 and August 15 of each year.
We may redeem the 2020 Notes, in whole or in part, at any time on or after February 15, 2015, at the redemption prices set forth below:
|
Period
|
Redemption Price*
|
||
|
2015
|
104.063
|
%
|
|
|
2016
|
102.708
|
%
|
|
|
2017
|
101.354
|
%
|
|
|
2018 and thereafter
|
100.000
|
%
|
|
* Expressed in percentage of principal amount
Senior Notes Due 2024
On September 11, 2012, we completed a public offering of
$275 million
aggregate principal amount of 5.75% Senior Notes due 2024 (the “2024 Notes”) at a public offering price of 100% of the principal amount. Net proceeds from this offering were approximately
$270 million
. We used
$195 million
of the net proceeds to repay the amounts outstanding under our revolving credit facility. Additionally, in October 2012,
$64.5 million
of the net proceeds were used to redeem a portion of our 2018 and 2022 Senior Notes.
The 2024 Notes mature on
November 1, 2024
and bear interest at a per annum rate of
5.75%
. Due to financing costs, the effective interest rate on the 2024 Notes is
6.0%
. Interest is payable
semiannually in arrears on May 1 and November 1 of each year.
We may redeem the 2024 Notes, in whole or in part, at any time on or after November 1, 2017, at the redemption prices set forth below:
|
Period
|
Redemption
Price*
|
||
|
2017
|
102.875
|
%
|
|
|
2018
|
101.917
|
%
|
|
|
2019
|
100.958
|
%
|
|
|
2020 and thereafter
|
100.000
|
%
|
|
* Expressed in percentage of principal amount
Senior Notes Due 2016
On June 14, 2006, we completed a private offering of
$625.0 million
aggregate principal amount of 10.75% senior notes due 2016 (the “2016 Notes”) at
98.505%
of par. On June 15, 2011, we completed a call of
$335.0 million
in principal of the 2016 Notes and on September 1, 2011, we completed the redemption of the remaining
$165.6 million
in principal of the 2016 Notes. As a result of the above redemptions of our 2016 Notes, we recorded a
$38.8 million
Loss on early extinguishment of debt
during 2011. The 2016 Notes bore interest at a per annum rate of
10.75%
. Due to discounts and financing costs, the effective interest rate on the 2016 Notes was
11.4%
.
F-35
|
HealthSouth Corporation and Subsidiaries
Notes to Consolidated Financial Statements
|
||
Convertible Notes
Convertible Senior Subordinated Notes Due 2043
On November 18, 2013, we exchanged
$320 million
in aggregate principal amount of newly issued 2.00% Convertible Senior Subordinated Notes due 2043 (the “Convertible Notes”) for
257,110
shares of our outstanding
6.50%
Series A Convertible Perpetual Preferred Stock. The Company’s Convertible Notes were issued pursuant to an indenture dated November 18, 2013 (the “Convertible Notes Indenture”) between us and Wells Fargo Bank, National Association, as trustee and conversion agent. The Convertible Notes are senior subordinated unsecured obligations of the Company. As such, the Convertible Notes are subordinated to all our existing and future senior unsecured debt and are effectively subordinated to our existing and future secured debt to the extent of the value of the collateral securing such debt. Additionally, the Convertible Notes are structurally subordinated to all existing and future debt and other obligations of our subsidiaries.
The Convertible Notes are senior subordinated unsecured obligations of the Company. They bear regular interest at a rate of
2.0%
per year payable
semiannually in arrears in cash on June 1 and December 1 of each year
, beginning June 1, 2014.
Beginning with the six-month period starting December 1, 2018, contingent interest is payable if the trading price of the Convertible Notes for each of the five trading days ending two trading days prior to any six-month contingent interest period is equal to or greater than $1,200. The amount of contingent interest payable per $1,000 principal amount of the Convertible Notes in respect of any contingent interest period is equal to 0.25% of the average trading price of the Convertible Notes during the specified measurement period.
Due to discounts and financing costs, the effective interest rate on the Convertible Notes is
6.0%
.
The Convertible Notes mature on
December 1, 2043
, unless earlier redeemed, repurchased, or converted. The Convertible Notes are convertible, at the option of the holder, at any time on or prior to the close of business on the business day immediately preceding December 1, 2043 into shares of our common stock at an initial conversion rate of
25.2194 shares per $1,000 principal amount
of the Convertible Notes, subject to customary antidilution adjustments. This conversion rate equates to an initial conversion price of
$39.652
per share. We may elect to settle any conversion, in whole or in part, by delivering cash in lieu of shares. Upon the occurrence of certain change of control events, we will pay a make-whole premium on any Convertible Notes converted by increasing the conversion rate on such Convertible Notes.
Prior to December 1, 2018, we may redeem all or any part of the Convertible Notes if the volume weighted average price per share of our common stock is at least
120%
of the conversion price of the Convertible Notes for at least
20
trading days during any
30
consecutive trading day period, at a redemption price equal to
100%
of the principal amount of Convertible Notes to be redeemed, plus accrued and unpaid interest. On or after December 1, 2018, we may, at our option, redeem all or any part of the Convertible Notes at a redemption price equal to
100%
of the principal amount of the Convertible Notes to be redeemed, plus accrued and unpaid interest.
Upon the occurrence of certain fundamental change events (as defined in the Convertible Notes Indenture), each holder of the Convertible Notes may require us to repurchase for cash all or any portion of such holders’ Convertible Notes at a price equal to
100%
of the principal amount of the repurchased Convertible Notes, plus accrued and unpaid interest thereon to, but excluding, the repurchase date. Holders may, at their option, also require us to repurchase all or any portion of such holders’ Convertible Notes on December 1 of 2020, 2027, 2034, and 2041 at a price equal to
100%
of the principal amount of the repurchased Convertible Notes, plus accrued and unpaid interest thereon to, but excluding, the repurchase date.
The Convertible Notes Indenture contains customary events of default, which includes, among other things, a default in the obligation of the Company to convert the Convertible Notes that continues for five days.
See also
Note 10,
Convertible Perpetual Preferred Stock
.
F-36
|
HealthSouth Corporation and Subsidiaries
Notes to Consolidated Financial Statements
|
||
Other Notes Payable—
Our notes payable consist of the following (in millions):
|
As of December 31,
|
|||||||||
|
2013
|
2012
|
Interest Rates
|
|||||||
|
Sale/leaseback transactions involving real estate accounted for as financings
|
$
|
28.0
|
|
$
|
28.0
|
|
8.1% to 11.2%
|
||
|
Acquisition of an inpatient rehabilitation unit
|
4.3
|
|
5.7
|
|
7.8%
|
||||
|
Construction of a new hospital
|
13.5
|
|
—
|
|
LIBOR + 2.5%;
2.7% as of December 31, 2013
|
||||
|
Other
|
1.8
|
|
3.1
|
|
5.7% to 6.8%
|
||||
|
Other notes payable
|
$
|
47.6
|
|
$
|
36.8
|
|
|||
Capital Lease Obligations—
We engage in a significant number of leasing transactions including real estate and other equipment utilized in operations. Leases meeting certain accounting criteria have been recorded as an asset and liability at the lower of fair value or the net present value of the aggregate future minimum lease payments at the inception of the lease. Interest rates used in computing the net present value of the lease payments generally ranged from
6.4%
to
10.7%
based on our incremental borrowing rate at the inception of the lease. Our leasing transactions include arrangements for equipment with major equipment finance companies and manufacturers who retain ownership in the equipment during the term of the lease and with a variety of both small and large real estate owners.
|
9.
|
Self-Insured Risks
:
|
We insure a substantial portion of our professional liability, general liability, and workers’ compensation risks through a self-insured retention program (“SIR”) underwritten by our consolidated wholly owned offshore captive insurance subsidiary, HCS, Ltd., which we fund via regularly scheduled premium payments. HCS is an independent insurance company licensed by the Cayman Island Monetary Authority. We use HCS to fund our first layer of insurance coverage up to
$24 million
for general and professional liability risks. Workers’ compensation exposures are capped on a per claim basis. Risks in excess of specified limits per claim and in excess of our aggregate SIR amount are covered by unrelated commercial carriers.
F-37
|
HealthSouth Corporation and Subsidiaries
Notes to Consolidated Financial Statements
|
||
The following table presents the changes in our self-insurance reserves for the years ended December 31, 2013, 2012, and 2011 (in millions):
|
2013
|
2012
|
2011
|
|||||||||
|
Balance at beginning of period, gross
|
$
|
148.3
|
|
$
|
153.3
|
|
$
|
152.9
|
|
||
|
Less: Reinsurance receivables
|
(29.4
|
)
|
(34.4
|
)
|
(33.6
|
)
|
|||||
|
Balance at beginning of period, net
|
118.9
|
|
118.9
|
|
119.3
|
|
|||||
|
Increase for the provision of current year claims
|
33.7
|
|
32.7
|
|
32.7
|
|
|||||
|
(Decrease) increase for the provision of prior year claims
|
(5.2
|
)
|
(5.3
|
)
|
0.9
|
|
|||||
|
Decrease related to change in statistical confidence level
|
(6.7
|
)
|
—
|
|
(2.8
|
)
|
|||||
|
Expenses related to discontinued operations
|
(1.8
|
)
|
(1.9
|
)
|
(3.5
|
)
|
|||||
|
Payments related to current year claims
|
(3.9
|
)
|
(4.2
|
)
|
(4.2
|
)
|
|||||
|
Payments related to prior year claims
|
(27.3
|
)
|
(21.3
|
)
|
(23.5
|
)
|
|||||
|
Balance at end of period, net
|
107.7
|
|
118.9
|
|
118.9
|
|
|||||
|
Add: Reinsurance receivables
|
32.6
|
|
29.4
|
|
34.4
|
|
|||||
|
Balance at end of period, gross
|
$
|
140.3
|
|
$
|
148.3
|
|
$
|
153.3
|
|
||
As of
December 31, 2013
and
2012
,
$42.1 million
and
$41.8 million
, respectively, of these reserves are included in
Other current liabilities
in our consolidated balance sheets.
Provisions for these risks are based primarily upon actuarially determined estimates. These reserves represent the unpaid portion of the estimated ultimate net cost of all reported and unreported losses incurred through the respective consolidated balance sheet dates. The reserves are estimated using individual case-basis valuations and actuarial analyses. Those estimates are subject to the effects of trends in loss severity and frequency. The estimates are continually reviewed and adjustments are recorded as experience develops or new information becomes known. The changes to the estimated ultimate loss amounts are included in current operating results.
Over the past few years, we have experienced volatility in our estimates of prior year claim reserves due primarily to favorable trends in claims and industry-wide loss development trends. Our efforts to improve patient safety and overall quality of care, as well as our efforts to reduce workplace injuries, have helped contain our ultimate claim costs. With the accumulation of this additional historical data and current favorable trends, when we analyzed our assumptions during our semi-annual review of our self-insurance reserves in the fourth quarter of 2013, we lowered the statistical confidence level used to determine our self-insurance reserves from
70%
to
50%
. This change, which reflects our current best estimate based on the trends we are experiencing in the resolution of claims, reduced our reserves included in continuing operations by
$6.7 million
in the fourth quarter of 2013.
The reserves for these self-insured risks cover approximately
1,150
and
800
individual claims at
December 31, 2013
and
2012
, respectively, and estimates for potential unreported claims. The time period required to resolve these claims can vary depending upon the jurisdiction and whether the claim is settled or litigated. The estimation of the timing of payments beyond a year can vary significantly. Although considerable variability is inherent in reserve estimates, management believes the reserves for losses and loss expenses are adequate; however, there can be no assurance the ultimate liability will not exceed management’s estimates.
|
10.
|
Convertible Perpetual Preferred Stock
:
|
On
March 7, 2006
, we completed the sale of
400,000
shares of our 6.50% Series A Convertible Perpetual Preferred Stock. The preferred stock has a liquidation preference of
$1,000
per share of preferred stock, which is contingently subject to accretion. Holders of the preferred stock are entitled to receive, when and if declared by our board of directors, cash dividends at the rate of
6.50%
per annum on the accreted liquidation preference per share, payable quarterly in arrears. Dividends on the preferred stock are cumulative. Each holder of preferred stock has one vote for each share held by the holder on all matters voted upon by the holders of our common stock.
F-38
|
HealthSouth Corporation and Subsidiaries
Notes to Consolidated Financial Statements
|
||
The preferred stock is convertible, at the option of the holder, at any time into shares of our common stock.
We may at any time cause the shares of preferred stock to be automatically converted into shares of our common stock at the conversion rate then in effect if the closing sale price of our common stock for 20 trading days within a period of 30 consecutive trading days ending on the trading day before the date we give the notice of forced conversion exceeds 150% of the conversion price of the preferred stock. If we are subject to a fundamental change, as defined in the certificate of designation of the preferred stock, each holder of shares of preferred stock has the right, subject to certain limitations, to require us to purchase with cash any or all of its shares of preferred stock at a purchase price equal to 100% of the accreted liquidation preference, plus any accrued and unpaid dividends to the date of purchase. In addition, if holders of the preferred stock elect to convert shares of preferred stock in connection with certain fundamental changes, we will in certain circumstances increase the conversion rate for such shares of preferred stock.
As redemption of the preferred stock is contingent upon the occurrence of a fundamental change, and since we do not deem a fundamental change probable of occurring, accretion of our
Convertible perpetual preferred stock
is not necessary.
The agreement underlying the preferred stock includes antidilutive protection that requires adjustments to the number of shares of common stock issuable upon conversion and the exercise price for common stock upon the occurrence of certain events, including payment of cash dividends on our common stock after a
de minimis
threshold. At issuance, the preferred stock had a conversion price of
$30.50
per share, which was equal to an initial conversion rate of
32.7869
shares of common stock per share of preferred stock. The payment in January 2014 of an
$0.18
per share dividend on our common stock triggered the antidilutive adjustment for the preferred stock. As of January 3, 2014, the resulting exercise price of each share of preferred stock was
$30.17
, and the resulting conversion rate was
33.1455
for each preferred share.
During the year ended December 31, 2012, we repurchased
46,645
shares of our preferred stock for total cash consideration of
$46.5 million
, including fees. In the fourth quarter of 2013, we exchanged
$320.0 million
in aggregate principal amount of newly issued 2.00% Convertible Senior Subordinated Notes due 2043 for
257,110
shares of our outstanding preferred stock. No common stock was issued as part of these exchange transactions. As of December 31, 2013,
96,245
shares of our preferred stock remained outstanding. See
Note 8,
Long-term Debt
.
The following is a summary of the activity related to our
Convertible perpetual preferred stock
from December 31, 2011 to December 31, 2013 (in millions, except share data):
|
Number of Shares Outstanding
|
Amount
|
|||||
|
Balance as of December 31, 2011
|
400,000
|
|
$
|
387.4
|
|
|
|
Repurchase of preferred stock
|
(46,645
|
)
|
(45.2
|
)
|
||
|
Balance as of December 31, 2012
|
353,355
|
|
342.2
|
|
||
|
Repurchase of preferred stock
|
(257,110
|
)
|
(249.0
|
)
|
||
|
Balance as of December 31, 2013
|
96,245
|
|
$
|
93.2
|
|
|
The allocation of the consideration exchanged for repurchases of preferred stock is as follows (in millions):
|
For the Year Ended December 31,
|
|||||||
|
2013
|
2012
|
||||||
|
Carrying value of shares repurchased
|
$
|
249.0
|
|
$
|
45.2
|
|
|
|
Cumulative dividends included as part of repurchase price
|
2.2
|
0.5
|
|
||||
|
Excess exchanged in transaction
|
71.6
|
0.8
|
|
||||
|
$
|
322.8
|
|
$
|
46.5
|
|
||
For 2013, the difference between the fair value of the consideration exchanged with the holders of the preferred stock, or
$322.8 million
(including fees), and the carrying value of the preferred stock in our balance sheet, or
$249.0 million
, resulted in a charge of
$73.8 million
to
Capital in excess of par value
that was treated like a dividend and subtracted from
Net income
to
F-39
|
HealthSouth Corporation and Subsidiaries
Notes to Consolidated Financial Statements
|
||
arrive at
Net income attributable to HealthSouth common shareholders
in our consolidated statement of operations. Of this amount,
$2.2 million
represents cumulative dividends through the date of the exchange transactions.
For 2012, the difference between the fair value of the consideration paid to the holders of the preferred stock, or
$46.5 million
(including fees), and the carrying value of the preferred stock in our balance sheet, or
$45.2 million
, resulted in a charge of
$1.3 million
to
Capital in excess of par value
that was treated like a dividend and subtracted from
Net income
to arrive at
Net income attributable to HealthSouth common shareholders
in our consolidated statement of operations. Of this amount,
$0.5 million
represents cumulative dividends through the date of the repurchase transactions.
We declared
$21.0 million
,
$23.9 million
, and
$26.0 million
in dividends on our preferred stock in the years ended December 31, 2013, 2012, and 2011, respectively. As of
December 31, 2013
and
2012
, accrued dividends of
$1.6 million
and
$5.7 million
, respectively, were included in
Other current liabilities
on our consolidated balance sheets. These accrued dividends were paid in January
2014
and
2013
, respectively.
|
11.
|
Redeemable Noncontrolling Interests
|
Redeemable noncontrolling interests
relate to two joint venture entities:
|
•
|
In the first quarter of 2013, we entered into an agreement to convert our
100%
owned hospital in Jonesboro, Arkansas into a joint venture with St. Bernards Healthcare. Following the formation of the joint venture, our ownership percentage was reduced to approximately
56%
. As part of this agreement, St. Bernards Healthcare received an option to increase its ownership percentage in the joint venture to
50%
. In the fourth quarter of 2013, St. Bernards Healthcare exercised its option which reduced our ownership percentage to
50%
. We remain the managing partner of this joint venture and continue to consolidate this entity. See also
Note 6,
Goodwill and Other Intangible Assets
.
|
|
•
|
In 2009, we entered into an agreement to convert our
100%
owned hospital in Altoona, Pennsylvania into a joint venture with Altoona Regional Health System. Following the formation of the joint venture, our ownership percentage was reduced to
55%
. Historically, the noncontrolling interest related to this joint venture was included in
Other long-term liabilities
in our consolidated balance sheets. See Note 1,
Summary of Significant Accounting Policies
, “Reclassifications.”
|
The following is a summary of the activity related to our
Redeemable noncontrolling interests
(in millions):
|
For the Year Ended December 31,
|
|||||||||||
|
2013
|
2012
|
2011
|
|||||||||
|
Balance at beginning of period
|
$
|
7.2
|
|
$
|
7.3
|
|
$
|
7.2
|
|
||
|
Net income attributable to noncontrolling interests
|
5.8
|
|
3.8
|
|
3.6
|
|
|||||
|
Distributions declared
|
(4.9
|
)
|
(3.9
|
)
|
(3.5
|
)
|
|||||
|
Contribution to joint venture
|
7.1
|
|
—
|
|
—
|
|
|||||
|
Change in fair value
|
(1.7
|
)
|
—
|
|
—
|
|
|||||
|
Balance at end of period
|
$
|
13.5
|
|
$
|
7.2
|
|
$
|
7.3
|
|
||
F-40
|
HealthSouth Corporation and Subsidiaries
Notes to Consolidated Financial Statements
|
||
The following table reconciles the net income attributable to nonredeemable
Noncontrolling interests
, as recorded in the shareholders’ equity section of the consolidated balance sheets, and the net income attributable to
Redeemable noncontrolling interests
, as recorded in the mezzanine section of the consolidated balance sheets, to the
Net income attributable to noncontrolling interests
presented on the consolidated statements of operations (in millions):
|
For the Year Ended December 31,
|
|||||||||||
|
2013
|
2012
|
2011
|
|||||||||
|
Net income attributable to nonredeemable noncontrolling interests
|
$
|
52.0
|
|
$
|
47.1
|
|
$
|
42.3
|
|
||
|
Net income attributable to redeemable noncontrolling interests
|
5.8
|
|
3.8
|
|
3.6
|
|
|||||
|
Net income attributable to noncontrolling interests
|
$
|
57.8
|
|
$
|
50.9
|
|
$
|
45.9
|
|
||
|
12.
|
Fair Value Measurements
:
|
Our financial assets and liabilities that are measured at fair value on a recurring basis are as follows (in millions):
|
|
|
Fair Value Measurements at Reporting Date Using
|
||||||||||||||||
|
As of December 31, 2013
|
Fair Value
|
Quoted Prices in Active Markets for Identical Assets
(Level 1)
|
Significant Other Observable Inputs
(Level 2)
|
Significant Unobservable Inputs
(Level 3)
|
Valuation Technique
(1)
|
|||||||||||||
|
Prepaid expenses and other current assets:
|
||||||||||||||||||
|
Current portion of restricted marketable securities
|
$
|
4.7
|
|
$
|
—
|
|
$
|
4.7
|
|
$
|
—
|
|
M
|
|||||
|
Other long-term assets:
|
|
|
|
|
|
|
|
|
|
|||||||||
|
Restricted marketable securities
|
42.9
|
|
—
|
|
42.9
|
|
—
|
|
M
|
|||||||||
|
As of December 31, 2012
|
|
|
|
|
|
|
|
|
|
|||||||||
|
Prepaid expenses and other current assets:
|
||||||||||||||||||
|
Current portion of restricted marketable securities
|
$
|
16.4
|
|
$
|
—
|
|
$
|
16.4
|
|
$
|
—
|
|
M
|
|||||
|
Other long-term assets:
|
|
|
|
|
|
|
|
|
|
|||||||||
|
Restricted marketable securities
|
39.4
|
|
—
|
|
39.4
|
|
—
|
|
M
|
|||||||||
|
(1)
|
The three valuation techniques are: market approach (M), cost approach (C), and income approach (I).
|
In addition to assets and liabilities recorded at fair value on a recurring basis, we are also required to record assets and liabilities at fair value on a nonrecurring basis. Generally, assets are recorded at fair value on a nonrecurring basis as a result of impairment charges or similar adjustments made to the carrying value of the applicable assets.
During the years ended December 31,
2013
and 2011, we did not record any gains or losses related to our nonfinancial assets and liabilities that are recognized or disclosed at fair value in the financial statements on a nonrecurring basis as part of our continuing operations. As a result of our consolidation of St. Vincent Rehabilitation Hospital and the remeasurement of our previously held equity interest at fair value, we recorded a
$4.9 million
gain as part of
Other income
during the year ended December 31, 2012. We determined the fair value of our previously held equity interest using the income approach. The income approach included the use of the hospital’s projected operating results and cash flows discounted using a rate that reflects market participant assumptions for the hospital. The projected operating results used management’s best estimates of economic and market conditions over the forecasted period including assumptions for pricing and volume, operating expenses, and capital expenditures. See
Note 7,
Investments in and Advances to Nonconsolidated Affiliates
.
F-41
|
HealthSouth Corporation and Subsidiaries
Notes to Consolidated Financial Statements
|
||
During the years ended December 31,
2013
and
2011
, we recorded impairment charges of
$1.1 million
and
$6.8 million
, respectively, as part of our results of discontinued operations. See
Note 15,
Assets and Liabilities in and Results of Discontinued Operations
.
As discussed in
Note 1,
Summary of Significant Accounting Policies
, “Fair Value Measurements,” the carrying value equals fair value for our financial instruments that are not included in the table below and are classified as current in our consolidated balance sheets. The carrying amounts and estimated fair values for our other financial instruments are presented in the following table (in millions):
|
|
As of December 31, 2013
|
As of December 31, 2012
|
|||||||||||||
|
|
Carrying Amount
|
Estimated Fair Value
|
Carrying Amount
|
Estimated Fair Value
|
|||||||||||
|
Long-term debt:
|
|
|
|
|
|
|
|
|
|||||||
|
Advances under revolving credit facility
|
$
|
45.0
|
|
$
|
45.0
|
|
$
|
—
|
|
$
|
—
|
|
|||
|
7.25% Senior Notes due 2018
|
272.4
|
|
291.4
|
|
302.9
|
|
328.6
|
|
|||||||
|
8.125% Senior Notes due 2020
|
286.6
|
|
319.4
|
|
286.2
|
|
321.5
|
|
|||||||
|
7.75% Senior Notes due 2022
|
252.5
|
|
275.0
|
|
280.7
|
|
306.5
|
|
|||||||
|
5.75% Senior Notes due 2024
|
275.0
|
|
273.6
|
|
275.0
|
|
277.1
|
|
|||||||
|
2.00% Convertible Senior Subordinated Notes due 2043
|
249.5
|
|
339.7
|
|
—
|
|
—
|
|
|||||||
|
Other notes payable
|
47.6
|
|
47.6
|
|
36.8
|
|
36.8
|
|
|||||||
|
Financial commitments:
|
|
|
|
|
|
|
|
|
|||||||
|
Letters of credit
|
—
|
|
36.5
|
|
—
|
|
39.5
|
|
|||||||
Fair values for our long-term debt and financial commitments are determined using inputs, including quoted prices in nonactive markets, that are observable either directly or indirectly, or
Level 2
inputs within the fair value hierarchy. See
Note 1,
Summary of Significant Accounting Policies
, “Fair Value Measurements.”
See also
Note 11,
Redeemable Noncontrolling Interests
.
|
13.
|
Share-Based Payments
:
|
The Company has awarded employee stock-based compensation in the form of stock options and restricted stock awards under the terms of share-based incentive plans designed to align employee and executive interests to those of its stockholders. All employee stock-based compensation awarded in
2011
was issued under the 2008 Equity Incentive Plan. The terms of the 2008 Equity Incentive Plan made available up to
six million
shares of common stock to be granted. In May 2011, our shareholders approved the Amended and Restated 2008 Equity Incentive Plan, which reserves and provides for the grant of up to
nine million
shares of common stock. All employee stock-based compensation awarded in
2012
and
2013
was issued under this plan. Both incentive plans were approved by our stockholders and provide for the grants of nonqualified stock options, incentive stock options, restricted stock, stock appreciation rights, performance shares, performance share units, dividend equivalents, restricted stock units (“RSUs”), and/or other stock-based awards.
Stock Options—
Under our share-based incentive plans, officers and employees are given the right to purchase shares of HealthSouth common stock at a fixed grant price determined on the day the options are granted. The terms and conditions of the options, including exercise prices and the periods in which options are exercisable, are generally at the discretion of the compensation committee of our board of directors. However, no options are exercisable beyond ten years from the date of grant. Granted options vest over the awards’ requisite service periods, which is generally three years.
F-42
|
HealthSouth Corporation and Subsidiaries
Notes to Consolidated Financial Statements
|
||
The fair values of the options granted during the years ended
December 31, 2013
,
2012
, and
2011
have been estimated at the grant date using the Black-Scholes option-pricing model with the following weighted-average assumptions:
|
|
For the Year Ended December 31,
|
|||||||
|
|
2013
|
2012
|
2011
|
|||||
|
Expected volatility
|
41.8
|
%
|
42.8
|
%
|
41.5
|
%
|
||
|
Risk-free interest rate
|
1.4
|
%
|
1.4
|
%
|
2.8
|
%
|
||
|
Expected life (years)
|
7.2
|
|
7.0
|
|
6.7
|
|
||
|
Dividend yield
|
0.0
|
%
|
0.0
|
%
|
0.0
|
%
|
||
The Black-Scholes option-pricing model was developed for use in estimating the fair value of traded options which have no vesting restrictions and are fully transferable. In addition, option-pricing models require the input of highly subjective assumptions, including the expected stock price volatility. We estimate our expected term through an analysis of actual, historical post-vesting exercise, cancellation, and expiration behavior by our employees and projected post-vesting activity of outstanding options. We calculate volatility based on the historical volatility of our common stock over the period commensurate with the expected life of the options. The risk-free interest rate is the implied daily yield currently available on U.S. Treasury issues with a remaining term closely approximating the expected term used as the input to the Black-Scholes option-pricing model. While our board of directors initiated quarterly dividends of
$0.18
per common share in 2013 (see
Note 17,
Earnings per Common Share
), we did not include a dividend payment as part of our pricing model because we had not historically paid dividends at the time of our option grants. We estimate forfeitures through an analysis of actual, historical pre-vesting option forfeiture activity. Under the Black-Scholes option-pricing model, the weighted-average fair value per share of employee stock options granted during the years ended
December 31, 2013
,
2012
, and
2011
was
$10.96
,
$9.57
, and
$11.27
, respectively.
A summary of our stock option activity and related information is as follows:
|
|
Shares
(In Thousands)
|
Weighted- Average Exercise Price per Share
|
Weighted- Average Remaining Life (Years)
|
Aggregate Intrinsic Value
(In Millions)
|
|||||||||
|
Outstanding, December 31, 2012
|
2,575
|
|
$
|
21.12
|
|
|
|
||||||
|
Granted
|
141
|
|
24.17
|
|
|
|
|||||||
|
Exercised
|
(338
|
)
|
24.39
|
|
|
|
|||||||
|
Forfeitures
|
—
|
|
—
|
|
|
|
|||||||
|
Expirations
|
(17
|
)
|
24.47
|
|
|
|
|||||||
|
Outstanding, December 31, 2013
|
2,361
|
|
20.82
|
|
4.5
|
|
$
|
29.5
|
|
||||
|
Exercisable, December 31, 2013
|
1,991
|
|
20.45
|
|
3.8
|
|
25.6
|
|
|||||
We recognized approximately
$2.1 million
,
$2.0 million
, and
$1.7 million
of compensation expense related to our stock options for the years ended
December 31, 2013
,
2012
, and
2011
, respectively. As of
December 31, 2013
, there was
$2.1 million
of unrecognized compensation cost related to unvested stock options. This cost is expected to be recognized over a weighted-average period of
19
months. The total intrinsic value of options exercised during the years ended December 31,
2013
,
2012
, and
2011
was
$1.9 million
,
$0.1 million
, and
$0.8 million
, respectively.
Restricted Stock—
The restricted stock awards granted in
2013
,
2012
, and
2011
included service-based awards, performance-based awards (that also included a service requirement), and market condition awards (that also included a service requirement). These awards generally vest over a three-year requisite service period. For awards with a service and/or performance requirement, the fair value of the award is determined by the closing price of our common stock on the grant date. For awards
F-43
|
HealthSouth Corporation and Subsidiaries
Notes to Consolidated Financial Statements
|
||
with a market condition, the fair value of the awards is determined using a lattice model. Inputs into the model include the historical price volatility of our common stock, the historical volatility of the common stock of the companies in the defined peer group, and the risk free interest rate. Utilizing these inputs and potential future changes in stock prices, multiple trials are run to determine the fair value.
A summary of our issued restricted stock awards is as follows (share information in thousands):
|
|
Shares
|
Weighted-Average Grant Date Fair Value
|
||||
|
Nonvested shares at December 31, 2012
|
1,048
|
|
$
|
19.28
|
|
|
|
Granted
|
847
|
|
23.55
|
|
||
|
Vested
|
(690
|
)
|
18.25
|
|
||
|
Forfeited
|
(43
|
)
|
22.67
|
|
||
|
Nonvested shares at December 31, 2013
|
1,162
|
|
22.89
|
|
||
The weighted-average grant date fair value of restricted stock granted during the years ended
December 31, 2012
and
2011
was
$19.30
and
$8.23
per share, respectively. We recognized approximately
$21.6 million
,
$21.2 million
, and
$17.7 million
of compensation expense related to our restricted stock awards for the years ended
December 31, 2013
,
2012
, and
2011
, respectively. As of
December 31, 2013
, there was
$22.0 million
of unrecognized compensation expense related to unvested restricted stock. This cost is expected to be recognized over a weighted-average period of
20
months. The remaining unrecognized compensation expense for the performance-based awards may vary each reporting period based on changes in the expected achievement of performance measures. The total fair value of shares vested during the years ended December 31,
2013
,
2012
, and
2011
was
$15.7 million
,
$34.0 million
, and
$12.5 million
, respectively.
Nonemployee Stock-Based Compensation Plans—
During the years ended
December 31, 2013
,
2012
, and
2011
, we provided incentives to our nonemployee members of our board of directors through the issuance of RSUs out of our share-based incentive plans. RSUs are fully vested when awarded and receive dividend equivalents in the form of additional RSUs upon the payment of a cash dividend on our common stock. During the years ended
December 31, 2013
,
2012
, and
2011
, we issued
53,011
,
42,903
, and
37,332
RSUs, respectively, with a fair value of
$22.47
,
$20.98
, and
$24.11
, respectively, per unit. We recognized approximately
$1.2 million
,
$0.9 million
, and
$0.9 million
, respectively, of compensation expense upon their issuance in
2013
,
2012
, and
2011
. There was no unrecognized compensation related to unvested shares as of
December 31, 2013
. As of
December 31, 2013
,
357,308
RSUs were outstanding.
|
14.
|
Employee Benefit Plans
:
|
Substantially all HealthSouth employees are eligible to enroll in HealthSouth-sponsored healthcare plans, including coverage for medical and dental benefits. Our primary healthcare plans are national plans administered by third-party administrators. We are self-insured for these plans. During
2013
,
2012
, and
2011
, costs associated with these plans, net of amounts paid by employees, approximated
$73.4 million
,
$67.8 million
, and
$66.8 million
, respectively.
The HealthSouth Retirement Investment Plan is a qualified 401(k) savings plan. The plan allows eligible employees to contribute up to
100%
of their pay on a pre-tax basis into their individual retirement account in the plan subject to the normal maximum limits set annually by the Internal Revenue Service. HealthSouth’s employer matching contribution is
50% of the first 6% of each participant’s elective deferrals
. All contributions to the plan are in the form of cash. Employees who are at least
21
years of age are eligible to participate in the plan. Employer contributions vest
100%
after
three
years of service. Participants are always fully vested in their own contributions.
Employer contributions to the HealthSouth Retirement Investment Plan approximated
$13.2 million
,
$13.2 million
, and
$12.6 million
in
2013
,
2012
, and
2011
, respectively. In
2013
,
2012
, and
2011
, approximately
$0.5 million
,
$0.8 million
,
F-44
|
HealthSouth Corporation and Subsidiaries
Notes to Consolidated Financial Statements
|
||
and
$1.7 million
, respectively, from the plan’s forfeiture account were used to fund the matching contributions in accordance with the terms of the plan.
Senior Management Bonus Program—
We maintain a Senior Management Bonus Program to reward senior management for performance based on a combination of corporate or regional goals and individual goals. The corporate and regional goals are approved on an annual basis by our board of directors as part of our routine budgeting and financial planning process. The individual goals, which are weighted according to importance, are determined between each participant and his or her immediate supervisor. The program applies to persons who join the Company in, or are promoted to, senior management positions. In
2014
, we expect to pay approximately
$12.4 million
under the program for the year ended
December 31, 2013
. In February
2013
and
2012
, we paid
$11.4 million
and
$12.8 million
, respectively, under the program for the years ended
December 31, 2012
and
2011
.
|
15.
|
Assets and Liabilities in and Results of Discontinued Operations
:
|
The operating results of discontinued operations are as follows (in millions):
|
|
For the Year Ended December 31,
|
||||||||||
|
|
2013
|
2012
|
2011
|
||||||||
|
Net operating revenues
|
$
|
0.2
|
|
$
|
1.0
|
|
$
|
95.7
|
|
||
|
Less: Provision for doubtful accounts
|
0.3
|
|
—
|
|
(1.5
|
)
|
|||||
|
Net operating revenues less provision for doubtful accounts
|
0.5
|
|
1.0
|
|
94.2
|
|
|||||
|
Costs and expenses
|
0.2
|
|
0.2
|
|
66.3
|
|
|||||
|
Impairments
|
1.1
|
|
—
|
|
6.8
|
|
|||||
|
(Loss) income from discontinued operations
|
(0.8
|
)
|
0.8
|
|
21.1
|
|
|||||
|
(Loss) gain on disposal of assets/sale of investments of discontinued operations
|
(0.4
|
)
|
5.0
|
|
65.6
|
|
|||||
|
Income tax benefit (expense)
|
0.1
|
|
(1.3
|
)
|
(37.9
|
)
|
|||||
|
(Loss) income from discontinued operations, net of tax
|
$
|
(1.1
|
)
|
$
|
4.5
|
|
$
|
48.8
|
|
||
Our results of discontinued operations primarily included the operations of six long-term acute care hospitals (“LTCHs”). In August 2011, we completed a transaction to sell
five
LTCHs to certain subsidiaries of LifeCare Holdings, Inc. for an aggregate purchase price of
$117.5 million
. We closed the sixth LTCH in August 2011 and sold the associated real estate in December 2013.
As discussed in
Note 18,
Contingencies and Other Commitments
, in April 2011, we entered into a definitive settlement and release agreement with the state of Delaware (the “Delaware Settlement”) relating to a previously disclosed audit of unclaimed property conducted on behalf of Delaware and two other states by Kelmar Associates, LLC. During the year ended December 31, 2011, we recorded a
$24.8 million
gain in connection with this settlement as part of our results of discontinued operations.
The impairment charges presented in the above table for 2013 and 2011 related to the LTCH that was closed in 2011. We determined the fair value of the impaired long-lived assets at this LTCH based on offers from potential buyers of the closed facility’s real estate. The impairment charges recorded in 2011 also related to the Dallas Medical Center that was closed in 2008. We determined the fair value of the impaired long-lived assets at this hospital based on the assets’ estimated fair value using valuation techniques that included third-party appraisals and offers from potential buyers.
During 2012, we recognized gains associated with the sale of the real estate associated with Dallas Medical Center and an investment we had in a cancer treatment center that was part of our former diagnostic division. As a result of the transaction discussed above to sell
five
of our LTCHs, we recorded a
$65.6 million
pre-tax gain as part of our results of discontinued operations in 2011.
F-45
|
HealthSouth Corporation and Subsidiaries
Notes to Consolidated Financial Statements
|
||
Income tax expense recorded as part of our results of discontinued operations in 2011 related primarily to the gain from the sale of
five
of our LTCHs and the Delaware Settlement.
As discussed in
Note 9,
Self-Insured Risks
, we insure a substantial portion of our professional liability, general liability, and workers’ compensation risks through a self-insured retention program underwritten by HCS. Expenses for retained professional and general liability risks and workers’ compensation risks associated with our divested surgery centers, outpatient, and diagnostic divisions and our former LTCHs have been included in our results of discontinued operations.
Assets and liabilities in discontinued operations consist of the following (in millions):
|
|
As of December 31,
|
||||||
|
|
2013
|
2012
|
|||||
|
Total current assets
|
$
|
0.1
|
|
$
|
0.4
|
|
|
|
Total long-term assets
|
$
|
0.3
|
|
$
|
5.0
|
|
|
|
Total current liabilities
|
$
|
4.6
|
|
$
|
5.2
|
|
|
|
Total long-term liabilities
|
$
|
0.6
|
|
$
|
0.6
|
|
|
As of December 31, 2013 and 2012, assets and liabilities in discontinued operations primarily relate to our former LTCHs. Current assets and long-term assets in the above table are included in
Prepaid expenses and other current assets
and
Other long-term assets
, respectively, in our consolidated balance sheets. Current liabilities and long-term liabilities in the above table are included in
Other current liabilities
and
Other long-term liabilities
, respectively, in our consolidated balance sheets.
In connection with the 2007 sale of our surgery centers division (now known as Surgical Care Affiliates, or “SCA”) to ASC Acquisition LLC, an affiliate of TPG Partners V, L.P. (“TPG”), a private investment partnership, we received an option, subject to terms and conditions set forth below, to purchase up to a
5%
equity interest in SCA. The price of the option is equal to the original issuance price of the units subscribed for by TPG and certain other co-investors in connection with the acquisition plus a
15%
annual premium, compounded annually. The option has a term of ten years and is exercisable upon certain liquidity events, including a public offering of SCA’s shares of common stock that results in
30%
or more of SCA’s common stock being listed or traded on a national securities exchange.
|
16.
|
Income Taxes
:
|
The significant components of the
Provision for income tax expense
related to continuing operations are as follows (in millions):
|
|
For the Year Ended December 31,
|
||||||||||
|
|
2013
|
2012
|
2011
|
||||||||
|
Current:
|
|
|
|
||||||||
|
Federal
|
$
|
0.9
|
|
$
|
0.7
|
|
$
|
1.4
|
|
||
|
State and local
|
5.4
|
|
5.2
|
|
(0.8
|
)
|
|||||
|
Total current expense
|
6.3
|
|
5.9
|
|
0.6
|
|
|||||
|
Deferred:
|
|
|
|
|
|
|
|||||
|
Federal
|
11.3
|
|
104.2
|
|
48.2
|
|
|||||
|
State and local
|
(4.9
|
)
|
(1.5
|
)
|
(11.7
|
)
|
|||||
|
Total deferred expense
|
6.4
|
|
102.7
|
|
36.5
|
|
|||||
|
Total income tax expense related to continuing operations
|
$
|
12.7
|
|
$
|
108.6
|
|
$
|
37.1
|
|
||
F-46
|
HealthSouth Corporation and Subsidiaries
Notes to Consolidated Financial Statements
|
||
A reconciliation of differences between the federal income tax at statutory rates and our actual income tax expense on our income from continuing operations, which include federal, state, and other income taxes, is presented below:
|
|
For the Year Ended December 31,
|
|||||||
|
|
2013
|
2012
|
2011
|
|||||
|
Tax expense at statutory rate
|
35.0
|
%
|
35.0
|
%
|
35.0
|
%
|
||
|
Increase (decrease) in tax rate resulting from:
|
|
|
|
|
|
|
||
|
State income taxes, net of federal tax benefit
|
4.0
|
%
|
3.7
|
%
|
3.0
|
%
|
||
|
Decrease in valuation allowance
|
(2.3
|
)%
|
(2.8
|
)%
|
(11.6
|
)%
|
||
|
Settlement of tax claims
|
(28.7
|
)%
|
0.3
|
%
|
(7.2
|
)%
|
||
|
Noncontrolling interests
|
(5.1
|
)%
|
(5.1
|
)%
|
(6.5
|
)%
|
||
|
Adjustments to net operating loss carryforwards
|
—
|
%
|
—
|
%
|
2.9
|
%
|
||
|
Interest, net
|
(0.1
|
)%
|
(0.2
|
)%
|
(1.6
|
)%
|
||
|
Other, net
|
0.4
|
%
|
1.0
|
%
|
1.3
|
%
|
||
|
Income tax expense
|
3.2
|
%
|
31.9
|
%
|
15.3
|
%
|
||
In April 2013, we entered into closing agreements with the IRS that settled federal income tax matters related to the previous restatement of our 2000 and 2001 financial statements, as well as certain other tax matters, through December 31, 2008. As a result of these closing agreements, we increased our deferred tax assets, primarily our federal net operating loss carryforward (“NOL”), and recorded a net federal income tax benefit of approximately
$115 million
in the second quarter of 2013. This federal income tax benefit primarily resulted from an approximate
$283 million
increase to our federal NOL on a gross basis.
The
Provision for income tax expense
in 2013 is less than the federal statutory rate primarily due to: (1) the IRS settlement discussed above, (2) the impact of noncontrolling interests, and (3) a decrease in our valuation allowance, as discussed below, offset by (4) state income tax expense. See
Note 1,
Summary of Significant Accounting Policies
, “Income Taxes,” for a discussion of the allocation of income or loss related to pass-through entities, which is referred to as the impact of noncontrolling interests in the above table.
The
Provision for income tax expense
in 2012 is less than the federal statutory rate primarily due to: (1) the impact of noncontrolling interests and (2) a decrease in the valuation allowance, as discussed below, offset by (3) state income tax expense.
The
Provision for income tax expense
in 2011 is less than the federal statutory rate primarily due to: (1) an approximate
$28 million
benefit associated with a current period net reduction in the valuation allowance and (2) an approximate
$18 million
net benefit associated with settlements with various taxing authorities including the settlement of federal income tax claims with the Internal Revenue Service for tax years 2007 and 2008 offset by (3) approximately
$7 million
of net expense primarily related to corrections to 2010 deferred tax assets associated with our NOLs and corresponding valuation allowance. See
Note 1,
Summary of Significant Accounting Policies
, “Out-of-Period Adjustments.”
F-47
|
HealthSouth Corporation and Subsidiaries
Notes to Consolidated Financial Statements
|
||
Deferred income taxes recognize the net tax effects of temporary differences between the carrying amounts of assets and liabilities for financial reporting purposes and amounts used for income tax purposes and the impact of available NOLs. The significant components of HealthSouth’s deferred tax assets and liabilities are presented in the following table (in millions). See also
Note 1,
Summary of Significant Accounting Policies
, “Reclassifications.”
|
|
As of December 31,
|
||||||
|
|
2013
|
2012
|
|||||
|
Deferred income tax assets:
|
|
|
|||||
|
Net operating loss
|
$
|
416.5
|
|
$
|
432.5
|
|
|
|
Property, net
|
44.3
|
|
40.3
|
|
|||
|
Insurance reserve
|
28.5
|
|
30.7
|
|
|||
|
Stock-based compensation
|
26.8
|
|
26.8
|
|
|||
|
Allowance for doubtful accounts
|
15.3
|
|
14.9
|
|
|||
|
Alternative minimum tax
|
11.1
|
|
11.9
|
|
|||
|
Carrying value of partnerships
|
19.8
|
|
14.7
|
|
|||
|
Other accruals
|
19.0
|
|
18.9
|
|
|||
|
Capital losses
|
1.2
|
|
6.5
|
|
|||
|
Other
|
2.0
|
|
0.4
|
|
|||
|
Total deferred income tax assets
|
584.5
|
|
597.6
|
|
|||
|
Less: Valuation allowance
|
(30.7
|
)
|
(39.8
|
)
|
|||
|
Net deferred income tax assets
|
553.8
|
|
557.8
|
|
|||
|
Deferred income tax liabilities:
|
|
|
|
|
|||
|
Intangibles
|
(29.2
|
)
|
(26.5
|
)
|
|||
|
Convertible debt interest
|
(28.0
|
)
|
—
|
|
|||
|
Other
|
(3.3
|
)
|
(0.3
|
)
|
|||
|
Total deferred income tax liabilities
|
(60.5
|
)
|
(26.8
|
)
|
|||
|
Net deferred income tax assets
|
493.3
|
|
531.0
|
|
|||
|
Less: Current deferred tax assets
|
139.0
|
|
137.5
|
|
|||
|
Noncurrent deferred tax assets
|
$
|
354.3
|
|
$
|
393.5
|
|
|
At December 31,
2013
, we had an unused federal NOL of
$325.1 million
(approximately
$929.0 million
on a gross basis) and state NOLs of
$91.4 million
. Such losses expire in various amounts at varying times through
2031
. Our reported federal NOL as of
December 31, 2013
excludes
$8.6 million
related to operating loss carryforwards resulting from excess tax benefits related to share-based awards, the tax benefits of which, when recognized, will be accounted for as a credit to additional paid-in-capital when they reduce taxes payable.
For the years ended December 31,
2013
,
2012
, and
2011
, the net decreases in our valuation allowance were
$9.1 million
,
$10.5 million
, and
$62.4 million
, respectively. The decrease in our valuation allowance in 2013 related primarily to our capital loss carryforwards, our current forecast of future earnings in each jurisdiction, and changes in certain state tax laws. During the second quarter of 2013, we determined a valuation allowance related to our capital loss carryforwards was no longer required as sufficient positive evidence existed to substantiate their utilization. This evidence included our partial utilization of these assets as a result of realizing capital gains in 2013 and the identification of sufficient taxable capital gain income within the available capital loss carryforward period. Substantially all of the decrease in the valuation allowance in 2012 and approximately
$21 million
of the decrease in the valuation allowance during 2011 related primarily to our determination it is more likely than not a substantial portion of our deferred tax assets will be realized in the future. In addition, approximately
$34 million
of the decrease in the valuation allowance in 2011 was due to the corrections made to the valuation allowance, as discussed above. Approximately
$7 million
of the decrease in the valuation allowance in 2011 resulted from our settlement with
F-48
|
HealthSouth Corporation and Subsidiaries
Notes to Consolidated Financial Statements
|
||
the IRS for tax year
s 2007 and 2008 which enabled us to utilize certain capital losses previously offset by a valuation allowance
.
As of December 31,
2013
, we have a remaining valuation allowance of
$30.7 million
. This valuation allowance remains recorded due to uncertainties regarding our ability to utilize a portion of our state NOLs before they expire. The amount of the valuation allowance has been determined for each tax jurisdiction based on the weight of all available evidence including management’s estimates of taxable income for each jurisdiction in which we operate over the periods in which the related deferred tax assets will be recoverable. It is possible we may be required to increase or decrease our valuation allowance at some future time if our forecast of future earnings varies from actual results on a consolidated basis or in the applicable state tax jurisdictions, or if the timing of future tax deductions differs from our expectations.
Our utilization of NOLs could be subject to limitations under Internal Revenue Code Section 382 (“Section 382”) and may be limited in the event of certain cumulative changes in ownership interests of significant stockholders over a three-year period exceed 50%. Section 382 imposes an annual limitation on the use of certain carryforward losses to an amount that approximates the value of a company at the time of an ownership change multiplied by the long-term tax exempt rate. At this time, we do not believe these limitations will restrict our ability to use any NOLs before they expire. However, no such assurances can be provided.
As of January 1,
2011
, total remaining gross unrecognized tax benefits were
$12.6 million
, all of which would affect our effective tax rate if recognized. Total accrued interest expense related to unrecognized tax benefits was
$1.1 million
as of January 1,
2011
. The amount of unrecognized tax benefits changed during 2011 primarily due to the settlement of federal income tax claims with the IRS for tax years 2007 and 2008 and the lapse of the applicable statute of limitations for certain federal and state claims. Total remaining gross unrecognized tax benefits were
$6.0 million
as of December 31, 2011, all of which would affect our effective tax rate if recognized. Total accrued interest expense related to unrecognized tax benefits as of December 31, 2011 was
$0.1 million
. The amount of unrecognized tax benefits changed during 2012 primarily based on our then ongoing discussions with taxing authorities as part of our continued pursuit of the maximization of our tax benefits, primarily related to our federal NOL. Total remaining gross unrecognized tax benefits were
$78.0 million
as of December 31, 2012,
$76.0 million
of which would affect our effective tax rate if recognized. The amount of unrecognized tax benefits changed during 2013 primarily due to the April 2013 IRS settlement discussed above. Total remaining gross unrecognized tax benefits were
$1.1 million
as of December 31, 2013,
$0.4 million
of which would affect our effective tax rate if recognized.
F-49
|
HealthSouth Corporation and Subsidiaries
Notes to Consolidated Financial Statements
|
||
A reconciliation of the beginning and ending liability for unrecognized tax benefits is as follows (in millions):
|
|
Gross Unrecognized Income Tax Benefits
|
Accrued Interest and Penalties
|
|||||
|
January 1, 2011
|
$
|
12.6
|
|
$
|
1.1
|
|
|
|
Gross amount of increases in unrecognized tax benefits related to prior periods
|
19.8
|
|
—
|
|
|||
|
Gross amount of decreases in unrecognized tax benefits related to prior periods
|
(3.0
|
)
|
—
|
|
|||
|
Decreases in unrecognized tax benefits relating to settlements with taxing authorities
|
(20.2
|
)
|
—
|
|
|||
|
Reductions to unrecognized tax benefits as a result of a lapse of the applicable statute of limitations
|
(3.2
|
)
|
(1.0
|
)
|
|||
|
December 31, 2011
|
6.0
|
|
0.1
|
|
|||
|
Gross amount of increases in unrecognized tax benefits related to prior periods
|
75.8
|
|
—
|
|
|||
|
Gross amount of decreases in unrecognized tax benefits related to prior periods
|
(2.5
|
)
|
—
|
|
|||
|
Decreases in unrecognized tax benefits relating to settlements with taxing authorities
|
(0.9
|
)
|
—
|
|
|||
|
Reductions to unrecognized tax benefits as a result of a lapse of the applicable statute of limitations
|
(0.4
|
)
|
(0.1
|
)
|
|||
|
December 31, 2012
|
78.0
|
|
—
|
|
|||
|
Gross amount of increases in unrecognized tax benefits related to prior periods
|
46.7
|
|
0.3
|
|
|||
|
Gross amount of decreases in unrecognized tax benefits related to prior periods
|
(1.9
|
)
|
—
|
|
|||
|
Decreases in unrecognized tax benefits relating to settlements with taxing authorities
|
(121.7
|
)
|
—
|
|
|||
|
December 31, 2013
|
$
|
1.1
|
|
$
|
0.3
|
|
|
Our continuing practice is to recognize interest and penalties related to income tax matters in income tax expense. For the years ended December 31,
2013
,
2012
, and
2011
, we recorded
$0.2 million
,
$0.7 million
, and
$4.7 million
of net interest income, respectively, primarily related to amended state income tax returns, as part of our income tax provision. Total net accrued interest (expense) income was
$(0.1) million
and
$0.2 million
as of December 31,
2013
and
2012
, respectively.
HealthSouth and its subsidiaries’ federal and state income tax returns are periodically examined by various regulatory taxing authorities. In connection with such examinations, we have settled federal income tax examinations with the IRS for all tax years through 2010. We are currently under audit by two states for tax years ranging from 2007 through 2011.
For the tax years that remain open under the applicable statutes of limitations, amounts related to these unrecognized tax benefits have been considered by management in its estimate of our potential net recovery of prior years’ income taxes. We do not expect a material change in our unrecognized tax benefits within the next 12 months due to the closing of the applicable statutes of limitation.
F-50
|
HealthSouth Corporation and Subsidiaries
Notes to Consolidated Financial Statements
|
||
|
17.
|
Earnings per Common Share
:
|
In conjunction with the initiation of quarterly cash dividends in the third quarter of 2013, we revised our calculation to present earnings per share using the two-class method. The two-class method should have been used during all prior periods. We assessed the materiality of these revisions and concluded they were not material to any previously issued financial statements. Revisions for the years ended December 31, 2012 and 2011 are presented below.
|
|
Year Ended December 31,
|
|||||||
|
|
2012
|
2011
|
||||||
|
Basic earnings per share attributable to HealthSouth common shareholders, as reported:
|
||||||||
|
Continuing operations
|
$
|
1.65
|
|
$
|
1.42
|
|
||
|
Discontinued operations
|
0.04
|
|
0.54
|
|
||||
|
Net income
|
$
|
1.69
|
|
$
|
1.96
|
|
||
|
Basic earnings per share attributable to HealthSouth common shareholders as revised using the two-class method:
|
||||||||
|
Continuing operations
|
$
|
1.62
|
|
$
|
1.39
|
|
||
|
Discontinued operations
|
0.05
|
|
0.52
|
|
||||
|
Net income
|
$
|
1.67
|
|
$
|
1.91
|
|
||
The following table sets forth the computation of basic and diluted earnings per common share (in millions, except per share amounts):
|
|
For the Year Ended December 31,
|
||||||||||
|
|
2013
|
2012
|
2011
|
||||||||
|
Numerator:
|
|
|
|
||||||||
|
Income from continuing operations
|
$
|
382.5
|
|
$
|
231.4
|
|
$
|
205.8
|
|
||
|
Less: Net income attributable to noncontrolling interests included in continuing operations
|
(57.8
|
)
|
(50.9
|
)
|
(47.0
|
)
|
|||||
|
Less: Income allocated to participating securities
|
(3.4
|
)
|
(2.2
|
)
|
(3.2
|
)
|
|||||
|
Less: Convertible perpetual preferred stock dividends
|
(21.0
|
)
|
(23.9
|
)
|
(26.0
|
)
|
|||||
|
Less: Repurchase of convertible perpetual preferred stock
|
(71.6
|
)
|
(0.8
|
)
|
—
|
|
|||||
|
Income from continuing operations attributable to HealthSouth common shareholders
|
228.7
|
|
153.6
|
|
129.6
|
|
|||||
|
(Loss) income from discontinued operations, net of tax, attributable to HealthSouth common shareholders
|
(1.1
|
)
|
4.5
|
|
49.9
|
|
|||||
|
Less: Income from discontinued operations allocated to participating securities
|
—
|
|
(0.1
|
)
|
(1.2
|
)
|
|||||
|
Net income attributable to HealthSouth common shareholders
|
$
|
227.6
|
|
$
|
158.0
|
|
$
|
178.3
|
|
||
|
Denominator:
|
|
|
|
|
|
|
|||||
|
Basic weighted average common shares outstanding
|
88.1
|
|
94.6
|
|
93.3
|
|
|||||
|
Diluted weighted average common shares outstanding
|
102.1
|
|
108.1
|
|
109.2
|
|
|||||
|
Basic and diluted earnings per share attributable to HealthSouth common shareholders:
|
|
|
|
|
|
|
|||||
|
Continuing operations
|
$
|
2.59
|
|
$
|
1.62
|
|
$
|
1.39
|
|
||
|
Discontinued operations
|
(0.01
|
)
|
0.05
|
|
0.52
|
|
|||||
|
Net income
|
$
|
2.58
|
|
$
|
1.67
|
|
$
|
1.91
|
|
||
F-51
|
HealthSouth Corporation and Subsidiaries
Notes to Consolidated Financial Statements
|
||
The following table sets forth the reconciliation between basic weighted average common shares outstanding and diluted weighted average common shares outstanding (in millions):
|
For the Year Ended December 31,
|
||||||||
|
2013
|
2012
|
2011
|
||||||
|
Basic weighted average common shares outstanding
|
88.1
|
|
94.6
|
|
93.3
|
|
||
|
Convertible perpetual preferred stock
|
10.5
|
|
12.0
|
|
13.1
|
|
||
|
Convertible senior subordinated notes
|
1.0
|
|
—
|
|
—
|
|
||
|
Restricted stock awards, dilutive stock options, and restricted stock units
|
2.5
|
|
1.5
|
|
2.8
|
|
||
|
Diluted weighted average common shares outstanding
|
102.1
|
|
108.1
|
|
109.2
|
|
||
For the year ended December 31, 2013, adding back amounts related to the repurchase of our preferred stock to our
Income from continuing operations attributable to HealthSouth common shareholders
causes a per share increase when calculating diluted earnings per common share resulting in an antidilutive per share amount. See
Note 10,
Convertible Perpetual Preferred Stock
. For the years ended December 31, 2012 and 2011, adding back the dividends on our preferred stock to our
Income from continuing operations attributable to HealthSouth common shareholders
causes a per share increase when calculating diluted earnings per common share resulting in an antidilutive per share amount. Therefore, basic and diluted earnings per common share are the same for all years presented.
Options to purchase approximately
0.1 million
and
1.8 million
shares of common stock were outstanding as of
December 31, 2013
and
2012
, respectively, but were not included in the computation of diluted weighted-average shares because to do so would have been antidilutive.
In October 2011, our board of directors authorized the repurchase of up to
$125 million
of our common stock. No repurchases were made under this original authorization. On February 15, 2013, our board of directors approved an increase in our existing common stock repurchase authorization from
$125 million
to
$350 million
. During the first quarter of 2013, we completed a tender offer for our common stock. As a result of the tender offer, we purchased approximately
9.1 million
shares at a price of
$25.50
per share for a total cost of approximately
$234.1 million
, including fees and expenses relating to the tender offer. The remaining repurchase authorization expired at the end of the tender offer.
On October 25, 2013, our board of directors authorized the repurchase of up to
$200 million
of our common stock. On February 14, 2014, our board of directors approved an increase in this common stock repurchase authorization from
$200 million
to
$250 million
. The repurchase authorization does not require the repurchase of a specific number of shares, has an indefinite term, and is subject to termination at any time by our board of directors.
On July 25, 2013, our board of directors approved the initiation of a quarterly cash dividend on our common stock of
$0.18
per share. The first quarterly dividend was paid on October 15, 2013 to stockholders of record as of the close of business on October 1, 2013. On October 25, 2013, our board of directors declared a cash dividend of
$0.18
per share that was paid on January 15, 2014 to stockholders of record on January 2, 2014. As of December 31, 2013, accrued common stock dividends of
$15.8 million
were included in
Other current liabilities
in our consolidated balance sheet. Future dividend payments are subject to declaration by our board of directors.
In January 2004, we repaid our then-outstanding
3.25%
Convertible Debentures using the net proceeds of a loan arranged by Credit Suisse First Boston. In connection with this transaction, we issued
ten million
warrants with an expiration date of January 16, 2014 to the lender to purchase shares of our common stock. The agreement underlying these warrants included antidilutive protection that required adjustments to the number of shares of common stock purchasable upon exercise and the exercise price for common stock upon the occurrence of certain events. Following our one-for-five reverse stock split in October 2006, the warrants were exercisable for
two million
shares of our common stock at an exercise price of
$32.50
. This antidilution protection also provided for adjustment upon payment of cash dividends on our common stock after a
de minimis
threshold. The payment in January 2014 of an
$0.18
per share dividend on our common stock triggered the antidilutive adjustment for these warrants. As of January 3, 2014, the resulting exercise price of each warrant was
$32.16
, and the resulting exercise rate was
0.2021
for each warrant. The warrants were not assumed exercised for dilutive shares outstanding for the years ended December 31, 2012 or 2011 because they were antidilutive in those periods.
F-52
|
HealthSouth Corporation and Subsidiaries
Notes to Consolidated Financial Statements
|
||
The following table summarizes information relating to these warrants and their activity during 2013 and through their expiration date (number of warrants in millions):
|
Number of Warrants
|
Weighted Average Exercise Price
|
|||||
|
Common stock warrants outstanding as of December 31, 2012
|
10.0
|
|
$
|
32.50
|
|
|
|
Cashless exercise
|
(4.8
|
)
|
32.50
|
|
||
|
Cash exercise
|
(2.3
|
)
|
32.50
|
|
||
|
Common stock warrants outstanding as of December 31, 2013
|
2.9
|
|
32.50
|
|
||
|
Cashless exercise
|
(1.8
|
)
|
32.16
|
|
||
|
Cash exercise
|
(1.0
|
)
|
32.16
|
|
||
|
Expired
|
(0.1
|
)
|
32.16
|
|
||
|
Common stock warrants outstanding as of January 16, 2014
|
—
|
|
||||
The above exercises resulted in the issuance of
0.5 million
and
0.2 million
shares of common stock in 2013 and 2014, respectively. Cash exercises resulted in gross proceeds of
$15.3 million
and
$6.3 million
during 2013 and 2014, respectively.
On September 30, 2009, we issued
5.0 million
shares of common stock and
8.2 million
common stock warrants in full satisfaction of our obligation to do so under the January 2007 comprehensive settlement of the consolidated securities action brought against us by our stockholders and bondholders. Each warrant has a term of approximately
seven
years from the date of issuance and an exercise price of
$41.40
per share. The warrants were not assumed exercised for dilutive shares outstanding because they were antidilutive in the periods presented.
See also
Note 10,
Convertible Perpetual Preferred Stock
.
|
18.
|
Contingencies and Other Commitments
:
|
We operate in a highly regulated and litigious industry. As a result, various lawsuits, claims, and legal and regulatory proceedings have been and can be expected to be instituted or asserted against us. The resolution of any such lawsuits, claims, or legal and regulatory proceedings could materially and adversely affect our financial position, results of operations, and cash flows in a given period.
Derivative Litigation—
All lawsuits purporting to be derivative complaints on our behalf filed in the Circuit Court of Jefferson County, Alabama since 2002 have been dismissed or consolidated with the first-filed action captioned
Tucker v. Scrushy
and filed August 28, 2002. Derivative lawsuits in other jurisdictions have been stayed as well. The
Tucker
complaint asserted claims on our behalf against, among others, a number of our former officers and directors and Ernst & Young LLP, our former auditor. When originally filed, the primary allegations in the
Tucker
case involved self-dealing by Richard M. Scrushy, our former chairman and chief executive officer, and other insiders through transactions with various entities allegedly controlled by Mr. Scrushy. The complaint was amended four times to add additional defendants and include claims of accounting fraud, improper Medicare billing practices, and additional self-dealing transactions.
The claims against all defendants in the
Tucker
case, except Ernst & Young, have been settled or otherwise resolved. The
Tucker
derivative litigation against Ernst & Young is discussed in more detail below. In 2013, we and the derivative stockholder plaintiffs resolved all claims against the remaining individual defendants. These resolutions included the entry of final judgments against five former officers and resulted in the collection of approximately
$5 million
during 2013. As a reminder, the 2009 final judgment against Mr. Scrushy found him guilty of fraud and breach of fiduciary duties and ordered him to pay
$2.9 billion
in damages to us. Our collection efforts against Mr. Scrushy are ongoing.
For the years ended December 31, 2013, 2012, and 2011, we recorded net gains of
$9.3 million
,
$3.5 million
, and
$12.3 million
, respectively, in
Government, class action, and related settlements
in our consolidated statements of operations in connection with our receipt of cash distributions from Mr. Scrushy and the other former officers, after reimbursement of
F-53
|
HealthSouth Corporation and Subsidiaries
Notes to Consolidated Financial Statements
|
||
reasonable out-of-pocket expenses incurred by HealthSouth and the attorneys for the derivative stockholder plaintiffs and after recording a liability for the federal securities plaintiffs’
25%
apportionment of the net recovery as required in the January 2007 comprehensive settlement of the consolidated securities action brought against us by our stockholders and bondholders. We are obligated to pay
35%
of the recoveries from Mr. Scrushy and the other former officers along with reasonable out-of-pocket expenses to the attorneys for the derivative stockholder plaintiffs. In connection with those obligations, during 2013, 2012, and 2011,
$3.3 million
,
$1.4 million
, and
$5.2 million
, respectively, of the amounts previously collected were distributed to attorneys for the derivative stockholder plaintiffs. We recorded these cash distributions as part of
Professional fees—accounting, tax, and legal
in our consolidated statements of operations for those years.
We had previously recorded an estimated liability for the federal securities plaintiffs’ claim for the
25%
apportionment of any net recovery from the defendants in the derivative litigation. In September 2013, these plaintiffs filed a request with the federal court overseeing the related settlement to approve an agreement reached on how to calculate this apportionment obligation. As a result of this filing with the court, we recorded a noncash reduction to the liability originally recorded in 2006 for this obligation during 2013 as part of
Government, class action, and related settlements
in our consolidated statements of operations.
Litigation By and Against Former Independent Auditor—
In March 2003, claims on behalf of HealthSouth were brought in the
Tucker
derivative litigation against Ernst & Young, alleging that from 1996 through 2002, when Ernst & Young served as our independent auditor, Ernst & Young acted recklessly and with gross negligence in performing its duties, and specifically that Ernst & Young failed to perform reviews and audits of our financial statements with due professional care as required by law and by its contractual agreements with us. The claims further allege Ernst & Young either knew of or, in the exercise of due care, should have discovered and investigated the fraudulent and improper accounting practices being directed by certain officers and employees, and should have reported them to our board of directors and the audit committee. The claims seek compensatory and punitive damages, disgorgement of fees received from us by Ernst & Young, and attorneys’ fees and costs. On March 18, 2005, Ernst & Young filed a lawsuit captioned
Ernst & Young LLP v. HealthSouth Corp.
in the Circuit Court of Jefferson County, Alabama. The complaint alleges we provided Ernst & Young with fraudulent management representation letters, financial statements, invoices, bank reconciliations, and journal entries in an effort to conceal accounting fraud. Ernst & Young claims that as a result of our actions, Ernst & Young’s reputation has been injured and it has and will incur damages, expenses, and legal fees. On April 1, 2005, we answered Ernst & Young’s claims and asserted counterclaims related or identical to those asserted in the
Tucker
action. Upon Ernst & Young’s motion, the Alabama state court referred Ernst & Young’s claims and our counterclaims to arbitration pursuant to a clause in the engagement agreements between HealthSouth and Ernst & Young. In August 2006, we and the derivative plaintiffs agreed to jointly prosecute the claims against Ernst & Young in arbitration.
The trial phase of the arbitration process began on July 12, 2010 before a three-person arbitration panel selected under rules of the American Arbitration Association (the “AAA”). On December 18, 2012, the AAA panel granted Ernst & Young’s motion to dismiss our claims on the grounds that HealthSouth is not permitted to pursue its claims since certain of its former officers and employees committed fraudulent acts. The panel also denied and dismissed Ernst & Young’s claims against us. On December 18, 2012, we, together with the stockholder derivative plaintiffs, filed a notice of appeal of the panel’s decision in the Circuit Court of Jefferson County, Alabama. On December 28, 2012, we filed a motion to vacate the decision. We assert that the panel’s decision is contrary to the Federal Arbitration Act and the duties of a public accounting firm to its corporate clients, and that the arbitrators exceeded their authority by entering an award contrary to Alabama law. On April 25, 2013, the court denied our motion to vacate. On June 4, 2013, we filed a notice of appeal to the Supreme Court of Alabama seeking review of the Circuit Court's denial of our motion to vacate the arbitration panel's decision, and the parties have since submitted their briefs.
At this time, we do not know how long the appellate process will take.
We are vigorously pursuing our claims against Ernst & Young. Based on the ruling of the arbitration panel, we do not believe there is a reasonable possibility of a loss that might result from an adverse judgment or a settlement of this case.
General Medicine Action—
On August 16, 2004, General Medicine, P.C. filed a lawsuit against us captioned
General Medicine, P.C. v. HealthSouth Corp.
seeking the recovery of allegedly fraudulent transfers involving assets of Horizon/CMS Healthcare
F-54
|
HealthSouth Corporation and Subsidiaries
Notes to Consolidated Financial Statements
|
||
Corporation, a former subsidiary of HealthSouth. The lawsuit is pending in the Circuit Court of Jefferson County, Alabama (the “Alabama Action”).
General Medicine’s underlying claim against Horizon/CMS originates from a services contract entered into in 1995 between General Medicine and Horizon/CMS whereby General Medicine agreed to provide medical director services to skilled nursing facilities owned by Horizon/CMS for a term of
three years
. Horizon/CMS terminated the agreement for cause six months after it was executed, and General Medicine then initiated a lawsuit against Horizon/CMS in the United States District Court for the Eastern District of Michigan in 1996 (the “Michigan Action”). General Medicine’s complaint in the Michigan Action alleged that Horizon/CMS breached the services contract by wrongfully terminating General Medicine. We acquired Horizon/CMS in 1997 and sold it to Meadowbrook Healthcare, Inc. in 2001 pursuant to a stock purchase agreement. In 2004, Meadowbrook, without the knowledge of HealthSouth, consented to the entry of a final judgment in the Michigan Action in favor of General Medicine against Horizon/CMS for the alleged wrongful termination of the contract with General Medicine in the amount of
$376 million
, plus interest from the date of the judgment until paid at the rate of
10%
per annum (the “Consent Judgment”). The
$376 million
damages figure was unilaterally selected by General Medicine and was not tested or opposed by Meadowbrook. Additionally, the settlement agreement (the “Settlement”) used as the basis for the Consent Judgment provided that Meadowbrook would pay only
$300,000
to General Medicine to settle the Michigan Action and that General Medicine would seek to recover the remaining balance of the Consent Judgment solely from us. We were not a party to the Michigan Action, the Settlement negotiated by Meadowbrook, or the Consent Judgment.
The complaint filed by General Medicine against us in the Alabama Action alleges that while Horizon/CMS was our wholly owned subsidiary, General Medicine was an existing creditor of Horizon/CMS by virtue of the breach of contract claim underlying the Settlement. The complaint also alleges we caused Horizon/CMS to transfer its assets to us for less than a reasonably equivalent value or, in the alternative, with the actual intent to defraud creditors of Horizon/CMS, including General Medicine, in violation of the Alabama Uniform Fraudulent Transfer Act. General Medicine further alleges in its amended complaint that we are liable for the Consent Judgment despite not being a party to it because as Horizon/CMS’s parent we failed to observe corporate formalities in our operation and ownership of Horizon/CMS, misused our control of Horizon/CMS, stripped assets from Horizon/CMS, and engaged in other conduct which amounted to a fraud on Horizon/CMS’s creditors. General Medicine has requested relief including recovery of the unpaid amount of the Consent Judgment, the avoidance of the subject transfers of assets, attachment of the assets transferred to us, appointment of a receiver over the transferred properties, and a monetary judgment for the value of properties transferred.
We have denied liability to General Medicine and asserted counterclaims against General Medicine for fraud, injurious falsehood, tortious interference with business relations, conspiracy, unjust enrichment, abuse of process, and other causes of action. In our counterclaims, we alleged the Consent Judgment is the product of fraud, collusion and bad faith by General Medicine and Meadowbrook and, further, that these parties were guilty of a conspiracy to manufacture a lawsuit against HealthSouth in favor of General Medicine. Consequently, we assert that the Consent Judgment is not evidence of a legitimate debt owed by Horizon/CMS to General Medicine that is collectible from HealthSouth under any theory of liability.
In 2008, after we obtained discovery concerning the circumstances that led to the entry of the Consent Judgment, we filed a motion in the Michigan Action asking the court to set aside the Consent Judgment on grounds that it was the product of fraud on the court and collusion by the parties. On May 21, 2009, the court granted our motion to set aside the Consent Judgment on grounds that it was the product of fraud on the court. On March 9, 2010, General Medicine filed an appeal of the court's decision to the Sixth Circuit Court of Appeals. The parties agreed to a voluntary stay of the Alabama Action pending the outcome of General Medicine's appeal to the Sixth Circuit Court of Appeals. On April 10, 2012, the Sixth Circuit Court of Appeals reversed the lower court's ruling and reinstated the Consent Judgment. Due to the conclusion of the appeal in the Michigan Action, General Medicine requested reactivation of the Alabama Action in the Circuit Court of Jefferson County, Alabama. On January 10, 2013, we filed a motion for partial summary judgment in the Alabama Action seeking a declaration that the Consent Judgment obtained by General Medicine is not enforceable against us because, among other reasons, it was the result of collusion. On February 27, 2013, the court denied our motion. The court also indicated it concurred with the Sixth Circuit Court of Appeals that the Consent Judgment did nothing more than establish Horizon/CMS's liability to General Medicine and did not establish the amount of General Medicine’s damages claim against Horizon/CMS or the merits of General Medicine's separate fraudulent conveyance claims against HealthSouth.
On January 9, 2014 and on February 18, 2014, the court entered rulings which together provided that the
$376 million
damages figure contained in the Consent Judgment is not admissible at trial and that, accordingly, the issue of collusion with
F-55
|
HealthSouth Corporation and Subsidiaries
Notes to Consolidated Financial Statements
|
||
respect to the amount of the Consent Judgment is now moot. Instead of relying on the Consent Judgment to prove damages against Horizon/CMS, General Medicine will be required to prove the amount of any damages it has against Horizon/CMS. We intend to provide a vigorous defense to those damage claims and to continue to pursue our counterclaims relating to alleged fraud, collusion, and bad faith by General Medicine. The Alabama Action is still in the discovery phase and has been set for trial beginning in September 2014.
Based on the stage of litigation, review of the current facts and circumstances as we understand them, the nature of the underlying claim, the results of the proceedings to date, and the nature and scope of the defense we continue to mount, we do not believe an adverse judgment or settlement is probable in this matter, and it is also not possible to estimate the amount of loss, if any, or range of possible loss that might result from an adverse judgment or settlement of this case. We intend to vigorously defend ourselves against General Medicine’s claims and to vigorously prosecute our counterclaims against General Medicine.
Other Litigation—
We have been named as a defendant in a lawsuit filed March 28, 2003 by several individual stockholders in the Circuit Court of Jefferson County, Alabama, captioned
Nichols v. HealthSouth Corp
. The plaintiffs allege that we, some of our former officers, and our former investment bank engaged in a scheme to overstate and misrepresent our earnings and financial position. The plaintiffs are seeking compensatory and punitive damages. This case was consolidated with the
Tucker
case for discovery and other pretrial purposes and was stayed in the Circuit Court on August 8, 2005. The plaintiffs filed an amended complaint on November 9, 2010 to which we responded with a motion to dismiss filed on December 22, 2010. During a hearing on February 24, 2012, plaintiffs’ counsel indicated his intent to dismiss certain claims against us. Instead, on March 9, 2012, the plaintiffs amended their complaint to include additional securities fraud claims against HealthSouth and add several former officers to the lawsuit. On September 12, 2012, the plaintiffs further amended their complaint to request certification as a class action. One of those named officers has repeatedly attempted to remove the case to federal district court, most recently on December 11, 2012. We filed our latest motion to remand the case back to state court on January 10, 2013. On September 27, 2013, the federal court remanded the case back to state court. We intend to vigorously defend ourselves in this case. Based on the stage of litigation, review of the current facts and circumstances as we understand them, the nature of the underlying claim, the results of the proceedings to date, and the nature and scope of the defense we continue to mount, we do not believe an adverse judgment or settlement is probable in this matter, and it is also not possible to estimate the amount of loss, if any, or range of possible loss that might result from an adverse judgment or settlement of this case.
We were named as a defendant in a lawsuit filed March 3, 2009 by an individual in the Court of Common Pleas, Richland County, South Carolina, captioned
Sulton v. HealthSouth Corp, et al.
The plaintiff alleged that certain treatment he received at a HealthSouth facility complicated a pre-existing infectious injury. The plaintiff sought recovery for pain and suffering, medical expenses, punitive damages, and other damages. On July 30, 2010, the jury in this case returned a verdict in favor of the plaintiff for
$12.3 million
in damages. Given the jury verdict, we had recorded a liability of
$12.3 million
in
Other current liabilities
in our consolidated balance sheet as of December 31, 2011 with a corresponding receivable of
$7.7 million
in
Prepaid expenses and other current assets
for the portion of the claim we expected to be covered through our excess insurance coverages. We appealed that verdict, and on November 21, 2012, the Supreme Court of South Carolina reversed the jury verdict in its entirety and remanded the case to the court of common pleas for retrial. Given the reversal, we decreased the liability and corresponding receivable related to the original jury verdict in our consolidated balance sheet and statement of operations as of and for the year ended December 31, 2012. On March 8, 2013, the Court of Common Pleas, Richland County, South Carolina approved our comprehensive settlement agreement with the plaintiff in the
Sulton
case. While the terms of the settlement are confidential, the amount paid to the plaintiff to settle all claims was not material to us and was less than the liability accrued as of December 31, 2012.
Governmental Inquiries and Investigations—
On June 24, 2011, we received a document subpoena addressed to HealthSouth Hospital of Houston, a LTCH we closed in August 2011, and issued from the Dallas, Texas office of the HHS-OIG. The subpoena stated it was in connection with an investigation of possible false or otherwise improper claims submitted to Medicare and Medicaid and requested documents and materials relating to patient admissions, length of stay, and discharge matters at this closed LTCH. We furnished the documents requested and have heard nothing from HHS-OIG since December 2012.
F-56
|
HealthSouth Corporation and Subsidiaries
Notes to Consolidated Financial Statements
|
||
On March 4, 2013, we received document subpoenas from an office of the HHS-OIG addressed to
four
of our wholly owned hospitals. The investigation is being conducted by the United States Department of Justice (the “DOJ”). Each subpoena is in connection with an investigation of alleged improper or fraudulent claims submitted to Medicare and Medicaid and requests documents and materials relating to practices, procedures, protocols and policies, of certain pre- and post-admissions activities at these hospitals including, among other things, marketing functions, pre-admission screening, post-admission physician evaluations, patient assessment instruments, individualized patient plans of care, and compliance with the Medicare
60%
rule. Under the Medicare rule commonly referred to as the “
60%
rule,” an inpatient rehabilitation hospital must treat
60%
or more of its patients from at least one of a specified list of medical conditions in order to be reimbursed at the inpatient rehabilitation hospital payment rates, rather than at the lower acute care hospital payment rates. The subpoenas also request complete copies of medical records for
100
patients treated at each of these hospitals between September 2008 and June 2012. We have responded to the subpoenas received, and, through follow-up conversations, the DOJ has indicated it intends to request files from additional hospitals but has provided no specifics on timing or the hospitals involved.
We are cooperating fully with the DOJ in connection with these subpoenas and are currently unable to predict the timing or outcome of the related investigations.
Other Matters—
The False Claims Act, 18 U.S.C. § 287, allows private citizens, called “relators,” to institute civil proceedings alleging violations of the False Claims Act. These
qui tam
cases are generally sealed by the court at the time of filing. The only parties privy to the information contained in the complaint are the relator, the federal government, and the presiding court. It is possible that
qui tam
lawsuits have been filed against us and that we are unaware of such filings or have been ordered by the presiding court not to discuss or disclose the filing of such lawsuits. We may be subject to liability under one or more undisclosed
qui tam
cases brought pursuant to the False Claims Act.
It is our obligation as a participant in Medicare and other federal healthcare programs to routinely conduct audits and reviews of the accuracy of our billing systems and other regulatory compliance matters. As a result of these reviews, we have made, and will continue to make, disclosures to the HHS-OIG and CMS relating to amounts we suspect represent over-payments from these programs, whether due to inaccurate billing or otherwise. Some of these disclosures have resulted in, or may result in, HealthSouth refunding amounts to Medicare or other federal healthcare programs.
On April 4, 2011, we entered into a definitive settlement and release agreement with the state of Delaware relating to a previously disclosed audit of unclaimed property conducted on behalf of Delaware and two other states by Kelmar Associates, LLC. While the terms of the settlement are confidential, the amount paid to Delaware was less than the amount previously accrued in our consolidated balance sheet as of December 31, 2010. Accordingly, we recorded a
$25.3 million
pre-tax gain in connection with this settlement in our results of operations for the year ended December 31, 2011. Of this amount,
$24.8 million
is included in
Income from discontinued operations, net of tax
, as this gain primarily related to our previously divested divisions. The remainder is included in
Net operating revenues
in our consolidated statement of operations for the year ended December 31, 2011.
Other Commitments—
We are a party to service and other contracts in connection with conducting our business. Minimum amounts due under these agreements are
$26.3 million
in
2014
,
$26.4 million
in
2015
,
$22.0 million
in
2016
,
$10.8 million
in
2017
,
$10.1 million
in
2018
, and
$25.8 million
thereafter. These contracts primarily relate to software licensing and support.
F-57
|
HealthSouth Corporation and Subsidiaries
Notes to Consolidated Financial Statements
|
||
|
19.
|
Quarterly Data (Unaudited)
:
|
|
|
2013
|
|||||||||||||||||||
|
|
First
|
Second
|
Third
|
Fourth
|
Total
|
|||||||||||||||
|
|
(In Millions, Except Per Share Data)
|
|||||||||||||||||||
|
Net operating revenues
|
$
|
572.6
|
|
$
|
564.5
|
|
$
|
564.0
|
|
$
|
572.1
|
|
$
|
2,273.2
|
|
|||||
|
Operating earnings
(a)
|
108.7
|
|
101.1
|
|
119.0
|
|
106.9
|
|
435.7
|
|
||||||||||
|
Provision for income tax expense (benefit)
|
33.5
|
|
(86.5
|
)
|
35.2
|
|
30.5
|
|
12.7
|
|
||||||||||
|
Income from continuing operations
|
66.3
|
|
178.9
|
|
73.2
|
|
64.1
|
|
382.5
|
|
||||||||||
|
(Loss) income from discontinued operations, net of tax
|
(0.4
|
)
|
0.1
|
|
(0.9
|
)
|
0.1
|
|
(1.1
|
)
|
||||||||||
|
Net income
|
65.9
|
|
179.0
|
|
72.3
|
|
64.2
|
|
381.4
|
|
||||||||||
|
Less: Net income attributable to noncontrolling interests
|
(14.6
|
)
|
(13.8
|
)
|
(14.1
|
)
|
(15.3
|
)
|
(57.8
|
)
|
||||||||||
|
Net income attributable to HealthSouth
|
$
|
51.3
|
|
$
|
165.2
|
|
$
|
58.2
|
|
$
|
48.9
|
|
$
|
323.6
|
|
|||||
|
Earnings (loss) per common share:
|
||||||||||||||||||||
|
Basic earnings (loss) per share attributable to HealthSouth common shareholders:
(b)(c)
|
||||||||||||||||||||
|
Continuing operations
|
$
|
0.48
|
|
$
|
1.82
|
|
$
|
0.61
|
|
$
|
(0.31
|
)
|
$
|
2.59
|
|
|||||
|
Discontinued operations
|
—
|
|
—
|
|
(0.01
|
)
|
—
|
|
(0.01
|
)
|
||||||||||
|
Net income
|
$
|
0.48
|
|
$
|
1.82
|
|
$
|
0.60
|
|
$
|
(0.31
|
)
|
$
|
2.58
|
|
|||||
|
Diluted earnings (loss) per share attributable to HealthSouth common shareholders:
(b)(d)
|
||||||||||||||||||||
|
Continuing operations
|
$
|
0.48
|
|
$
|
1.66
|
|
$
|
0.59
|
|
$
|
(0.31
|
)
|
$
|
2.59
|
|
|||||
|
Discontinued operations
|
—
|
|
—
|
|
(0.01
|
)
|
—
|
|
(0.01
|
)
|
||||||||||
|
Net income
|
$
|
0.48
|
|
$
|
1.66
|
|
$
|
0.58
|
|
$
|
(0.31
|
)
|
$
|
2.58
|
|
|||||
|
(a)
|
We define operating earnings as income from continuing operations attributable to HealthSouth before (1) loss on early extinguishment of debt; (2) interest expense and amortization of debt discounts and fees; (3) other income; and (4) income tax expense or benefit.
|
|
(b)
|
Per share amounts may not sum due to the weighted average common shares outstanding during each quarter compared to the weighted average common shares outstanding during the entire year.
|
F-58
|
HealthSouth Corporation and Subsidiaries
Notes to Consolidated Financial Statements
|
||
|
(c)
|
In conjunction with the initiation of quarterly cash dividends in the third quarter of 2013, we revised our calculation to present earnings per share using the two-class method for the first and second quarters of 2013.
|
|
|
2013
|
|||||||
|
|
First Quarter
|
Second Quarter
|
||||||
|
Basic earnings per share attributable to HealthSouth common shareholders, as reported:
|
||||||||
|
Continuing operations
|
$
|
0.49
|
|
$
|
1.85
|
|
||
|
Discontinued operations
|
—
|
|
—
|
|
||||
|
Net income
|
$
|
0.49
|
|
$
|
1.85
|
|
||
|
Basic earnings per share attributable to HealthSouth common shareholders as revised using the two-class method:
|
||||||||
|
Continuing operations
|
$
|
0.48
|
|
$
|
1.82
|
|
||
|
Discontinued operations
|
—
|
|
—
|
|
||||
|
Net income
|
$
|
0.48
|
|
$
|
1.82
|
|
||
|
(d)
|
During the first quarter of 2013, adding back the dividends for the
Convertible perpetual preferred stock
to our
Income from continuing operations attributable to HealthSouth common shareholders
causes a per share increase when calculating diluted earnings per common share resulting in an antidilutive per share amount. For the fourth quarter of 2013, adding back amounts related to the repurchase of our preferred stock to our
Income from continuing operations attributable to HealthSouth common shareholders
causes a per share increase when calculating diluted earnings per common share resulting in an antidilutive per share amount. Therefore, basic and diluted earnings (loss) per common share are the same for these quarters.
|
F-59
|
HealthSouth Corporation and Subsidiaries
Notes to Consolidated Financial Statements
|
||
|
|
2012
|
|||||||||||||||||||
|
|
First
|
Second
|
Third
|
Fourth
|
Total
|
|||||||||||||||
|
|
(In Millions, Except Per Share Data)
|
|||||||||||||||||||
|
Net operating revenues
|
$
|
538.6
|
|
$
|
533.4
|
|
$
|
537.0
|
|
$
|
552.9
|
|
$
|
2,161.9
|
|
|||||
|
Operating earnings
(a)
|
96.1
|
|
92.7
|
|
94.4
|
|
95.5
|
|
378.7
|
|
||||||||||
|
Provision for income tax expense
|
29.1
|
|
26.9
|
|
28.1
|
|
24.5
|
|
108.6
|
|
||||||||||
|
Income from continuing operations
|
57.2
|
|
56.4
|
|
60.4
|
|
57.4
|
|
231.4
|
|
||||||||||
|
(Loss) income from discontinued operations, net of tax
|
(0.4
|
)
|
3.5
|
|
(0.5
|
)
|
1.9
|
|
4.5
|
|
||||||||||
|
Net income
|
56.8
|
|
59.9
|
|
59.9
|
|
59.3
|
|
235.9
|
|
||||||||||
|
Less: Net income attributable to noncontrolling interests
|
(12.6
|
)
|
(13.2
|
)
|
(12.8
|
)
|
(12.3
|
)
|
(50.9
|
)
|
||||||||||
|
Net income attributable to HealthSouth
|
$
|
44.2
|
|
$
|
46.7
|
|
$
|
47.1
|
|
$
|
47.0
|
|
$
|
185.0
|
|
|||||
|
Earnings per common share:
|
||||||||||||||||||||
|
Basic earnings per share attributable to HealthSouth common shareholders:
(b)
|
||||||||||||||||||||
|
Continuing operations
|
$
|
0.39
|
|
$
|
0.38
|
|
$
|
0.44
|
|
$
|
0.41
|
|
$
|
1.62
|
|
|||||
|
Discontinued operations
|
—
|
|
0.04
|
|
(0.01
|
)
|
0.02
|
|
0.05
|
|
||||||||||
|
Net income
|
$
|
0.39
|
|
$
|
0.42
|
|
$
|
0.43
|
|
$
|
0.43
|
|
$
|
1.67
|
|
|||||
|
Diluted earnings per share attributable to HealthSouth common shareholders:
(c)
|
||||||||||||||||||||
|
Continuing operations
|
$
|
0.39
|
|
$
|
0.38
|
|
$
|
0.44
|
|
$
|
0.41
|
|
$
|
1.62
|
|
|||||
|
Discontinued operations
|
—
|
|
0.04
|
|
(0.01
|
)
|
0.02
|
|
0.05
|
|
||||||||||
|
Net income
|
$
|
0.39
|
|
$
|
0.42
|
|
$
|
0.43
|
|
$
|
0.43
|
|
$
|
1.67
|
|
|||||
|
(a)
|
We define operating earnings as income from continuing operations attributable to HealthSouth before (1) loss on early extinguishment of debt; (2) interest expense and amortization of debt discounts and fees; (3) other income; and (4) income tax expense.
|
|
(b)
|
In conjunction with the initiation of quarterly cash dividends in the third quarter of 2013, we revised our calculation to present earnings per share using the two-class method for 2012.
|
|
|
2012
|
|||||||||||||||||||
|
|
First Quarter
|
Second Quarter
|
Third Quarter
|
Fourth Quarter
|
Full Year
|
|||||||||||||||
|
Basic earnings per share attributable to HealthSouth common shareholders, as reported:
|
||||||||||||||||||||
|
Continuing operations
|
$
|
0.40
|
|
$
|
0.39
|
|
$
|
0.44
|
|
$
|
0.42
|
|
$
|
1.65
|
|
|||||
|
Discontinued operations
|
(0.01
|
)
|
0.04
|
|
—
|
|
0.02
|
|
0.04
|
|
||||||||||
|
Net income
|
$
|
0.39
|
|
$
|
0.43
|
|
$
|
0.44
|
|
$
|
0.44
|
|
$
|
1.69
|
|
|||||
|
Basic earnings per share attributable to HealthSouth common shareholders as revised using the two-class method:
|
||||||||||||||||||||
|
Continuing operations
|
$
|
0.39
|
|
$
|
0.38
|
|
$
|
0.44
|
|
$
|
0.41
|
|
$
|
1.62
|
|
|||||
|
Discontinued operations
|
—
|
|
0.04
|
|
(0.01
|
)
|
0.02
|
|
0.05
|
|
||||||||||
|
Net income
|
$
|
0.39
|
|
$
|
0.42
|
|
$
|
0.43
|
|
$
|
0.43
|
|
$
|
1.67
|
|
|||||
|
(c)
|
During each reporting period of 2012, adding back the dividends for the
Convertible perpetual preferred stock
to our
Income from continuing operations attributable to HealthSouth common shareholders
causes a per share increase when
|
F-60
|
HealthSouth Corporation and Subsidiaries
Notes to Consolidated Financial Statements
|
||
calculating diluted earnings per common share resulting in an antidilutive per share amount. Therefore, basic and diluted earnings per common share are the same.
|
20.
|
Condensed Consolidating Financial Information
:
|
The accompanying condensed consolidating financial information has been prepared and presented pursuant to SEC Regulation S-X, Rule 3-10, “Financial Statements of Guarantors and Issuers of Guaranteed Securities Registered or Being Registered.” Each of the subsidiary guarantors is
100%
owned by HealthSouth, and all guarantees are full and unconditional and joint and several, subject to certain customary conditions for release. HealthSouth’s investments in its consolidated subsidiaries, as well as guarantor subsidiaries’ investments in nonguarantor subsidiaries and nonguarantor subsidiaries’ investments in guarantor subsidiaries, are presented under the equity method of accounting with the related investment presented within the line items
Intercompany receivable
and
Intercompany payable
in the accompanying condensed consolidating balance sheets.
As described in
Note 8,
Long-term Debt
, the terms of our credit agreement restrict us from declaring or paying cash dividends on our common stock unless: (1) we are not in default under our credit agreement and (2) the amount of the dividend, when added to the aggregate amount of certain other defined payments made during the same fiscal year, does not exceed certain maximum thresholds. However, as described in
Note 10,
Convertible Perpetual Preferred Stock
, our preferred stock generally provides for the payment of cash dividends, subject to certain limitations.
During 2013, certain wholly owned subsidiaries of HealthSouth made a dividend or distribution of available cash and/or intercompany receivable balances to their parents. In addition, HealthSouth made contributions to certain wholly owned subsidiaries. These dividends, distributions, and contributions impacted the
Intercompany receivable, Intercompany payable,
and
HealthSouth shareholders’ equity
line items in the accompanying condensed consolidating balance sheet as of December 31, 2013 but had no impact on the consolidated financial statements of HealthSouth Corporation.
F-61
|
HealthSouth Corporation and Subsidiaries
Notes to Consolidated Financial Statements
Condensed Consolidating Statement of Operations
|
||
|
|
For the Year Ended December 31, 2013
|
||||||||||||||||||
|
|
HealthSouth Corporation
|
Guarantor Subsidiaries
|
Nonguarantor Subsidiaries
|
Eliminating Entries
|
HealthSouth Consolidated
|
||||||||||||||
|
|
(In Millions)
|
||||||||||||||||||
|
Net operating revenues
|
$
|
12.2
|
|
$
|
1,622.4
|
|
$
|
709.8
|
|
$
|
(71.2
|
)
|
$
|
2,273.2
|
|
||||
|
Less: Provision for doubtful accounts
|
—
|
|
(18.3
|
)
|
(7.7
|
)
|
—
|
|
(26.0
|
)
|
|||||||||
|
Net operating revenues less provision for doubtful accounts
|
12.2
|
|
1,604.1
|
|
702.1
|
|
(71.2
|
)
|
2,247.2
|
|
|||||||||
|
Operating expenses:
|
|
|
|
|
|
|
|
|
|
|
|||||||||
|
Salaries and benefits
|
12.1
|
|
757.7
|
|
334.4
|
|
(14.5
|
)
|
1,089.7
|
|
|||||||||
|
Other operating expenses
|
10.8
|
|
238.5
|
|
107.4
|
|
(33.7
|
)
|
323.0
|
|
|||||||||
|
Occupancy costs
|
4.1
|
|
48.3
|
|
17.5
|
|
(22.9
|
)
|
47.0
|
|
|||||||||
|
Supplies
|
—
|
|
73.8
|
|
31.6
|
|
—
|
|
105.4
|
|
|||||||||
|
General and administrative expenses
|
119.1
|
|
—
|
|
—
|
|
—
|
|
119.1
|
|
|||||||||
|
Depreciation and amortization
|
8.8
|
|
65.1
|
|
20.8
|
|
—
|
|
94.7
|
|
|||||||||
|
Government, class action, and related settlements
|
(23.5
|
)
|
—
|
|
—
|
|
—
|
|
(23.5
|
)
|
|||||||||
|
Professional fees—accounting, tax, and legal
|
9.5
|
|
—
|
|
—
|
|
—
|
|
9.5
|
|
|||||||||
|
Total operating expenses
|
140.9
|
|
1,183.4
|
|
511.7
|
|
(71.1
|
)
|
1,764.9
|
|
|||||||||
|
Loss on early extinguishment of debt
|
2.4
|
|
—
|
|
—
|
|
—
|
|
2.4
|
|
|||||||||
|
Interest expense and amortization of debt discounts and fees
|
90.4
|
|
8.1
|
|
3.1
|
|
(1.2
|
)
|
100.4
|
|
|||||||||
|
Other income
|
(1.0
|
)
|
(1.2
|
)
|
(3.5
|
)
|
1.2
|
|
(4.5
|
)
|
|||||||||
|
Equity in net income of nonconsolidated affiliates
|
(3.6
|
)
|
(7.5
|
)
|
(0.1
|
)
|
—
|
|
(11.2
|
)
|
|||||||||
|
Equity in net income of consolidated affiliates
|
(268.0
|
)
|
(20.6
|
)
|
—
|
|
288.6
|
|
—
|
|
|||||||||
|
Management fees
|
(102.3
|
)
|
78.6
|
|
23.7
|
|
—
|
|
—
|
|
|||||||||
|
Income from continuing operations before income tax (benefit) expense
|
153.4
|
|
363.3
|
|
167.2
|
|
(288.7
|
)
|
395.2
|
|
|||||||||
|
Provision for income tax (benefit) expense
|
(169.0
|
)
|
134.4
|
|
47.3
|
|
—
|
|
12.7
|
|
|||||||||
|
Income from continuing operations
|
322.4
|
|
228.9
|
|
119.9
|
|
(288.7
|
)
|
382.5
|
|
|||||||||
|
Income (loss) from discontinued operations, net of tax
|
1.2
|
|
(0.8
|
)
|
(1.5
|
)
|
—
|
|
(1.1
|
)
|
|||||||||
|
Net Income
|
323.6
|
|
228.1
|
|
118.4
|
|
(288.7
|
)
|
381.4
|
|
|||||||||
|
Less: Net income attributable to noncontrolling interests
|
—
|
|
—
|
|
(57.8
|
)
|
—
|
|
(57.8
|
)
|
|||||||||
|
Net income attributable to HealthSouth
|
$
|
323.6
|
|
$
|
228.1
|
|
$
|
60.6
|
|
$
|
(288.7
|
)
|
$
|
323.6
|
|
||||
|
Comprehensive income
|
$
|
322.1
|
|
$
|
228.1
|
|
$
|
118.4
|
|
$
|
(288.7
|
)
|
$
|
379.9
|
|
||||
|
Comprehensive income attributable to HealthSouth
|
$
|
322.1
|
|
$
|
228.1
|
|
$
|
60.6
|
|
$
|
(288.7
|
)
|
$
|
322.1
|
|
||||
F-62
|
HealthSouth Corporation and Subsidiaries
Notes to Consolidated Financial Statements
Condensed Consolidating Statement of Operations
|
||
|
|
For the Year Ended December 31, 2012
|
||||||||||||||||||
|
|
HealthSouth Corporation
|
Guarantor Subsidiaries
|
Nonguarantor Subsidiaries
|
Eliminating Entries
|
HealthSouth Consolidated
|
||||||||||||||
|
|
(In Millions)
|
||||||||||||||||||
|
Net operating revenues
|
$
|
9.0
|
|
$
|
1,562.8
|
|
$
|
649.3
|
|
$
|
(59.2
|
)
|
$
|
2,161.9
|
|
||||
|
Less: Provision for doubtful accounts
|
(0.3
|
)
|
(18.0
|
)
|
(8.7
|
)
|
—
|
|
(27.0
|
)
|
|||||||||
|
Net operating revenues less provision for doubtful accounts
|
8.7
|
|
1,544.8
|
|
640.6
|
|
(59.2
|
)
|
2,134.9
|
|
|||||||||
|
Operating expenses:
|
|
|
|
|
|
|
|
|
|
|
|||||||||
|
Salaries and benefits
|
19.8
|
|
735.4
|
|
308.6
|
|
(13.6
|
)
|
1,050.2
|
|
|||||||||
|
Other operating expenses
|
10.6
|
|
224.8
|
|
97.4
|
|
(29.0
|
)
|
303.8
|
|
|||||||||
|
Occupancy costs
|
4.1
|
|
44.5
|
|
16.6
|
|
(16.6
|
)
|
48.6
|
|
|||||||||
|
Supplies
|
0.1
|
|
73.3
|
|
29.0
|
|
—
|
|
102.4
|
|
|||||||||
|
General and administrative expenses
|
117.9
|
|
—
|
|
—
|
|
—
|
|
117.9
|
|
|||||||||
|
Depreciation and amortization
|
8.6
|
|
57.1
|
|
16.8
|
|
—
|
|
82.5
|
|
|||||||||
|
Government, class action, and related settlements
|
(3.5
|
)
|
—
|
|
—
|
|
—
|
|
(3.5
|
)
|
|||||||||
|
Professional fees—accounting, tax, and legal
|
16.1
|
|
—
|
|
—
|
|
—
|
|
16.1
|
|
|||||||||
|
Total operating expenses
|
173.7
|
|
1,135.1
|
|
468.4
|
|
(59.2
|
)
|
1,718.0
|
|
|||||||||
|
Loss on early extinguishment of debt
|
4.0
|
|
—
|
|
—
|
|
—
|
|
4.0
|
|
|||||||||
|
Interest expense and amortization of debt discounts and fees
|
85.1
|
|
7.5
|
|
2.6
|
|
(1.1
|
)
|
94.1
|
|
|||||||||
|
Other income
|
(1.2
|
)
|
(5.0
|
)
|
(3.4
|
)
|
1.1
|
|
(8.5
|
)
|
|||||||||
|
Equity in net income of nonconsolidated affiliates
|
(4.3
|
)
|
(8.4
|
)
|
—
|
|
—
|
|
(12.7
|
)
|
|||||||||
|
Equity in net income of consolidated affiliates
|
(258.6
|
)
|
(21.5
|
)
|
—
|
|
280.1
|
|
—
|
|
|||||||||
|
Management fees
|
(97.8
|
)
|
75.8
|
|
22.0
|
|
—
|
|
—
|
|
|||||||||
|
Income from continuing operations before income tax (benefit) expense
|
107.8
|
|
361.3
|
|
151.0
|
|
(280.1
|
)
|
340.0
|
|
|||||||||
|
Provision for income tax (benefit) expense
|
(75.9
|
)
|
146.2
|
|
38.3
|
|
—
|
|
108.6
|
|
|||||||||
|
Income from continuing operations
|
183.7
|
|
215.1
|
|
112.7
|
|
(280.1
|
)
|
231.4
|
|
|||||||||
|
Income from discontinued operations, net of tax
|
1.3
|
|
1.3
|
|
1.9
|
|
—
|
|
4.5
|
|
|||||||||
|
Net Income
|
185.0
|
|
216.4
|
|
114.6
|
|
(280.1
|
)
|
235.9
|
|
|||||||||
|
Less: Net income attributable to noncontrolling interests
|
—
|
|
—
|
|
(50.9
|
)
|
—
|
|
(50.9
|
)
|
|||||||||
|
Net income attributable to HealthSouth
|
$
|
185.0
|
|
$
|
216.4
|
|
$
|
63.7
|
|
$
|
(280.1
|
)
|
$
|
185.0
|
|
||||
|
Comprehensive income
|
$
|
186.6
|
|
$
|
216.4
|
|
$
|
114.6
|
|
$
|
(280.1
|
)
|
$
|
237.5
|
|
||||
|
Comprehensive income attributable to HealthSouth
|
$
|
186.6
|
|
$
|
216.4
|
|
$
|
63.7
|
|
$
|
(280.1
|
)
|
$
|
186.6
|
|
||||
F-63
|
HealthSouth Corporation and Subsidiaries
Notes to Consolidated Financial Statements
Condensed Consolidating Statement of Operations
|
||
|
|
For the Year Ended December 31, 2011
|
||||||||||||||||||
|
|
HealthSouth Corporation
|
Guarantor Subsidiaries
|
Nonguarantor Subsidiaries
|
Eliminating Entries
|
HealthSouth Consolidated
|
||||||||||||||
|
|
(In Millions)
|
||||||||||||||||||
|
Net operating revenues
|
$
|
5.8
|
|
$
|
1,464.9
|
|
$
|
601.4
|
|
$
|
(45.2
|
)
|
$
|
2,026.9
|
|
||||
|
Less: Provision for doubtful accounts
|
—
|
|
(15.5
|
)
|
(5.5
|
)
|
—
|
|
(21.0
|
)
|
|||||||||
|
Net operating revenues less provision for doubtful accounts
|
5.8
|
|
1,449.4
|
|
|
595.9
|
|
|
(45.2
|
)
|
2,005.9
|
|
|||||||
|
Operating expenses:
|
|
|
|
|
|
|
|
|
|
|
|||||||||
|
Salaries and benefits
|
18.4
|
|
691.6
|
|
285.5
|
|
(13.5
|
)
|
982.0
|
|
|||||||||
|
Other operating expenses
|
10.0
|
|
209.7
|
|
90.3
|
|
(21.7
|
)
|
288.3
|
|
|||||||||
|
Occupancy costs
|
3.8
|
|
36.9
|
|
17.7
|
|
(10.0
|
)
|
48.4
|
|
|||||||||
|
Supplies
|
—
|
|
73.9
|
|
28.9
|
|
—
|
|
102.8
|
|
|||||||||
|
General and administrative expenses
|
110.5
|
|
—
|
|
—
|
|
—
|
|
110.5
|
|
|||||||||
|
Depreciation and amortization
|
9.5
|
|
52.5
|
|
16.8
|
|
—
|
|
78.8
|
|
|||||||||
|
Government, class action, and related settlements
|
(12.3
|
)
|
—
|
|
—
|
|
—
|
|
(12.3
|
)
|
|||||||||
|
Professional fees—accounting, tax, and legal
|
21.0
|
|
—
|
|
—
|
|
—
|
|
21.0
|
|
|||||||||
|
Total operating expenses
|
160.9
|
|
1,064.6
|
|
|
439.2
|
|
|
(45.2
|
)
|
1,619.5
|
|
|||||||
|
Loss on early extinguishment of debt
|
38.8
|
|
—
|
|
—
|
|
—
|
|
38.8
|
|
|||||||||
|
Interest expense and amortization of debt discounts and fees
|
109.5
|
|
8.4
|
|
2.6
|
|
(1.1
|
)
|
119.4
|
|
|||||||||
|
Other income
|
(0.2
|
)
|
(0.1
|
)
|
(3.5
|
)
|
1.1
|
|
(2.7
|
)
|
|||||||||
|
Equity in net income of nonconsolidated affiliates
|
(3.1
|
)
|
(8.9
|
)
|
—
|
|
—
|
|
(12.0
|
)
|
|||||||||
|
Equity in net income of consolidated affiliates
|
(234.2
|
)
|
(13.2
|
)
|
—
|
|
247.4
|
|
—
|
|
|||||||||
|
Management fees
|
(94.5
|
)
|
73.6
|
|
20.9
|
|
—
|
|
—
|
|
|||||||||
|
Income from continuing operations before income tax (benefit) expense
|
28.6
|
|
325.0
|
|
|
136.7
|
|
|
(247.4
|
)
|
242.9
|
|
|||||||
|
Provision for income tax (benefit) expense
|
(161.1
|
)
|
157.6
|
|
40.6
|
|
—
|
|
37.1
|
|
|||||||||
|
Income from continuing operations
|
189.7
|
|
167.4
|
|
|
96.1
|
|
|
(247.4
|
)
|
205.8
|
|
|||||||
|
Income (loss) from discontinued operations, net of tax
|
19.0
|
|
34.3
|
|
(4.5
|
)
|
—
|
|
48.8
|
|
|||||||||
|
Net Income
|
208.7
|
|
201.7
|
|
|
91.6
|
|
|
(247.4
|
)
|
254.6
|
|
|||||||
|
Less: Net income attributable to noncontrolling interests
|
—
|
|
—
|
|
(45.9
|
)
|
—
|
|
(45.9
|
)
|
|||||||||
|
Net income attributable to HealthSouth
|
$
|
208.7
|
|
$
|
201.7
|
|
|
$
|
45.7
|
|
|
$
|
(247.4
|
)
|
$
|
208.7
|
|
||
|
Comprehensive income
|
$
|
208.0
|
|
$
|
201.7
|
|
$
|
91.6
|
|
$
|
(247.4
|
)
|
$
|
253.9
|
|
||||
|
Comprehensive income attributable to HealthSouth
|
$
|
208.0
|
|
$
|
201.7
|
|
$
|
45.7
|
|
$
|
(247.4
|
)
|
$
|
208.0
|
|
||||
F-64
|
HealthSouth Corporation and Subsidiaries
Notes to Consolidated Financial Statements
Condensed Consolidating Balance Sheet
|
||
|
|
As of December 31, 2013
|
||||||||||||||||||
|
|
HealthSouth Corporation
|
Guarantor Subsidiaries
|
Nonguarantor Subsidiaries
|
Eliminating Entries
|
HealthSouth Consolidated
|
||||||||||||||
|
|
(In Millions)
|
||||||||||||||||||
|
Assets
|
|
|
|
|
|
||||||||||||||
|
Current assets:
|
|
|
|
|
|
||||||||||||||
|
Cash and cash equivalents
|
$
|
60.5
|
|
$
|
2.3
|
|
$
|
1.7
|
|
$
|
—
|
|
$
|
64.5
|
|
||||
|
Restricted cash
|
1.0
|
|
—
|
|
51.4
|
|
—
|
|
52.4
|
|
|||||||||
|
Accounts receivable, net
|
—
|
|
184.7
|
|
77.1
|
|
—
|
|
261.8
|
|
|||||||||
|
Deferred income tax assets
|
85.5
|
|
34.5
|
|
19.0
|
|
—
|
|
139.0
|
|
|||||||||
|
Prepaid expenses and other current assets
|
36.0
|
|
15.8
|
|
29.4
|
|
(18.5
|
)
|
62.7
|
|
|||||||||
|
Total current assets
|
183.0
|
|
237.3
|
|
|
178.6
|
|
|
(18.5
|
)
|
580.4
|
|
|||||||
|
Property and equipment, net
|
16.3
|
|
698.5
|
|
195.7
|
|
—
|
|
910.5
|
|
|||||||||
|
Goodwill
|
—
|
|
279.6
|
|
177.3
|
|
—
|
|
456.9
|
|
|||||||||
|
Intangible assets, net
|
18.1
|
|
49.6
|
|
20.5
|
|
—
|
|
88.2
|
|
|||||||||
|
Deferred income tax assets
|
288.8
|
|
24.5
|
|
41.0
|
|
—
|
|
354.3
|
|
|||||||||
|
Other long-term assets
|
64.6
|
|
27.1
|
|
52.4
|
|
—
|
|
144.1
|
|
|||||||||
|
Intercompany receivable
|
1,438.8
|
|
—
|
|
—
|
|
(1,438.8
|
)
|
—
|
|
|||||||||
|
Total assets
|
$
|
2,009.6
|
|
$
|
1,316.6
|
|
|
$
|
665.5
|
|
|
$
|
(1,457.3
|
)
|
$
|
2,534.4
|
|
||
|
Liabilities and Shareholders’ Equity
|
|
|
|
|
|
|
|
|
|
|
|||||||||
|
Current liabilities:
|
|
|
|
|
|
|
|
|
|
|
|||||||||
|
Current portion of long-term debt
|
$
|
19.4
|
|
$
|
3.8
|
|
$
|
6.6
|
|
$
|
(17.5
|
)
|
$
|
12.3
|
|
||||
|
Accounts payable
|
15.1
|
|
32.6
|
|
14.2
|
|
—
|
|
61.9
|
|
|||||||||
|
Accrued payroll
|
23.1
|
|
47.8
|
|
19.9
|
|
—
|
|
90.8
|
|
|||||||||
|
Accrued interest payable
|
22.9
|
|
0.8
|
|
0.1
|
|
—
|
|
23.8
|
|
|||||||||
|
Other current liabilities
|
65.1
|
|
18.6
|
|
40.1
|
|
(1.0
|
)
|
122.8
|
|
|||||||||
|
Total current liabilities
|
145.6
|
|
103.6
|
|
|
80.9
|
|
|
(18.5
|
)
|
311.6
|
|
|||||||
|
Long-term debt, net of current portion
|
1,381.7
|
|
88.1
|
|
35.4
|
|
—
|
|
1,505.2
|
|
|||||||||
|
Self-insured risks
|
23.2
|
|
—
|
|
75.0
|
|
—
|
|
98.2
|
|
|||||||||
|
Other long-term liabilities
|
21.3
|
|
17.4
|
|
5.3
|
|
—
|
|
44.0
|
|
|||||||||
|
Intercompany payable
|
—
|
|
299.2
|
|
228.9
|
|
(528.1
|
)
|
—
|
|
|||||||||
|
|
1,571.8
|
|
508.3
|
|
|
425.5
|
|
|
(546.6
|
)
|
1,959.0
|
|
|||||||
|
Commitments and contingencies
|
|
|
|
|
|
|
|
|
|
|
|||||||||
|
Convertible perpetual preferred stock
|
93.2
|
|
—
|
|
—
|
|
—
|
|
93.2
|
|
|||||||||
|
Redeemable noncontrolling interests
|
—
|
|
—
|
|
13.5
|
|
—
|
|
13.5
|
|
|||||||||
|
Shareholders’ equity:
|
|
|
|
|
|
|
|
|
|
|
|||||||||
|
HealthSouth shareholders’ equity
|
344.6
|
|
808.3
|
|
102.4
|
|
(910.7
|
)
|
344.6
|
|
|||||||||
|
Noncontrolling interests
|
—
|
|
—
|
|
124.1
|
|
—
|
|
124.1
|
|
|||||||||
|
Total shareholders’ equity
|
344.6
|
|
808.3
|
|
|
226.5
|
|
|
(910.7
|
)
|
468.7
|
|
|||||||
|
Total liabilities and shareholders’ equity
|
$
|
2,009.6
|
|
$
|
1,316.6
|
|
|
$
|
665.5
|
|
|
$
|
(1,457.3
|
)
|
$
|
2,534.4
|
|
||
F-65
|
HealthSouth Corporation and Subsidiaries
Notes to Consolidated Financial Statements
Condensed Consolidating Balance Sheet
|
||
|
|
As of December 31, 2012
|
||||||||||||||||||
|
|
HealthSouth Corporation
|
Guarantor Subsidiaries
|
Nonguarantor Subsidiaries
|
Eliminating Entries
|
HealthSouth Consolidated
|
||||||||||||||
|
|
(In Millions)
|
||||||||||||||||||
|
Assets
|
|
|
|
|
|
||||||||||||||
|
Current assets:
|
|
|
|
|
|
||||||||||||||
|
Cash and cash equivalents
|
$
|
131.3
|
|
$
|
0.3
|
|
$
|
1.2
|
|
$
|
—
|
|
$
|
132.8
|
|
||||
|
Restricted cash
|
0.8
|
|
—
|
|
48.5
|
|
—
|
|
49.3
|
|
|||||||||
|
Accounts receivable, net
|
0.2
|
|
178.8
|
|
70.3
|
|
—
|
|
249.3
|
|
|||||||||
|
Deferred income tax assets
|
106.5
|
|
19.7
|
|
11.3
|
|
—
|
|
137.5
|
|
|||||||||
|
Prepaid expenses and other current assets
|
29.7
|
|
15.2
|
|
40.5
|
|
(17.5
|
)
|
67.9
|
|
|||||||||
|
Total current assets
|
268.5
|
|
214.0
|
|
|
171.8
|
|
|
(17.5
|
)
|
636.8
|
|
|||||||
|
Property and equipment, net
|
12.7
|
|
550.3
|
|
185.0
|
|
—
|
|
748.0
|
|
|||||||||
|
Goodwill
|
—
|
|
266.1
|
|
171.2
|
|
—
|
|
437.3
|
|
|||||||||
|
Intangible assets, net
|
18.1
|
|
41.5
|
|
13.6
|
|
—
|
|
73.2
|
|
|||||||||
|
Deferred income tax assets
|
340.7
|
|
0.9
|
|
51.9
|
|
—
|
|
393.5
|
|
|||||||||
|
Other long-term assets
|
69.9
|
|
21.3
|
|
44.2
|
|
—
|
|
135.4
|
|
|||||||||
|
Intercompany receivable
|
1,244.4
|
|
—
|
|
—
|
|
(1,244.4
|
)
|
—
|
|
|||||||||
|
Total assets
|
$
|
1,954.3
|
|
$
|
1,094.1
|
|
|
$
|
637.7
|
|
|
$
|
(1,261.9
|
)
|
$
|
2,424.2
|
|
||
|
Liabilities and Shareholders’ Equity (Deficit)
|
|
|
|
|
|
|
|
|
|
|
|||||||||
|
Current liabilities:
|
|
|
|
|
|
|
|
|
|
|
|||||||||
|
Current portion of long-term debt
|
$
|
19.2
|
|
$
|
8.4
|
|
$
|
3.5
|
|
$
|
(17.5
|
)
|
$
|
13.6
|
|
||||
|
Accounts payable
|
7.4
|
|
28.3
|
|
9.6
|
|
—
|
|
45.3
|
|
|||||||||
|
Accrued payroll
|
20.6
|
|
46.8
|
|
18.3
|
|
—
|
|
85.7
|
|
|||||||||
|
Accrued interest payable
|
25.6
|
|
0.1
|
|
0.2
|
|
—
|
|
25.9
|
|
|||||||||
|
Other current liabilities
|
63.2
|
|
18.5
|
|
48.7
|
|
—
|
|
130.4
|
|
|||||||||
|
Total current liabilities
|
136.0
|
|
102.1
|
|
|
80.3
|
|
|
(17.5
|
)
|
300.9
|
|
|||||||
|
Long-term debt, net of current portion
|
1,147.3
|
|
64.2
|
|
28.4
|
|
—
|
|
1,239.9
|
|
|||||||||
|
Self-insured risks
|
28.1
|
|
—
|
|
78.4
|
|
—
|
|
106.5
|
|
|||||||||
|
Other long-term liabilities
|
9.7
|
|
11.2
|
|
3.1
|
|
—
|
|
24.0
|
|
|||||||||
|
Intercompany payable
|
—
|
|
515.6
|
|
1,021.4
|
|
(1,537.0
|
)
|
—
|
|
|||||||||
|
|
1,321.1
|
|
693.1
|
|
|
1,211.6
|
|
|
(1,554.5
|
)
|
1,671.3
|
|
|||||||
|
Commitments and contingencies
|
|
|
|
|
|
|
|
|
|
|
|||||||||
|
Convertible perpetual preferred stock
|
342.2
|
|
—
|
|
—
|
|
—
|
|
342.2
|
|
|||||||||
|
Redeemable noncontrolling interests
|
—
|
|
—
|
|
7.2
|
|
—
|
|
7.2
|
|
|||||||||
|
Shareholders’ equity (deficit):
|
|
|
|
|
|
|
|
|
|
|
|||||||||
|
HealthSouth shareholders’ equity (deficit)
|
291.0
|
|
401.0
|
|
(693.6
|
)
|
292.6
|
|
291.0
|
|
|||||||||
|
Noncontrolling interests
|
—
|
|
—
|
|
112.5
|
|
—
|
|
112.5
|
|
|||||||||
|
Total shareholders’ equity (deficit)
|
291.0
|
|
401.0
|
|
|
(581.1
|
)
|
|
292.6
|
|
403.5
|
|
|||||||
|
Total liabilities and shareholders’ equity (deficit)
|
$
|
1,954.3
|
|
$
|
1,094.1
|
|
|
$
|
637.7
|
|
|
$
|
(1,261.9
|
)
|
$
|
2,424.2
|
|
||
F-66
|
HealthSouth Corporation and Subsidiaries
Notes to Consolidated Financial Statements
Condensed Consolidating Statement of Cash Flows
|
||
|
|
For the Year Ended December 31, 2013
|
||||||||||||||||||
|
|
HealthSouth Corporation
|
Guarantor Subsidiaries
|
Non-guarantor Subsidiaries
|
Eliminating Entries
|
HealthSouth Consolidated
|
||||||||||||||
|
|
(In Millions)
|
||||||||||||||||||
|
Net cash provided by operating activities
|
$
|
113.2
|
|
$
|
235.7
|
|
$
|
121.4
|
|
$
|
—
|
|
$
|
470.3
|
|
||||
|
Cash flows from investing activities:
|
|
|
|
|
|
|
|
|
|
|
|||||||||
|
Purchases of property and equipment
|
(2.8
|
)
|
(167.9
|
)
|
(24.5
|
)
|
—
|
|
(195.2
|
)
|
|||||||||
|
Capitalized software costs
|
(6.0
|
)
|
(11.1
|
)
|
(4.2
|
)
|
—
|
|
(21.3
|
)
|
|||||||||
|
Acquisition of business, net of cash acquired
|
—
|
|
(28.9
|
)
|
—
|
|
—
|
|
(28.9
|
)
|
|||||||||
|
Proceeds from sale of restricted investments
|
—
|
|
—
|
|
16.9
|
|
—
|
|
16.9
|
|
|||||||||
|
Proceeds from sale of Digital Hospital
|
10.8
|
|
—
|
|
—
|
|
—
|
|
10.8
|
|
|||||||||
|
Purchases of restricted investments
|
—
|
|
—
|
|
(9.2
|
)
|
—
|
|
(9.2
|
)
|
|||||||||
|
Net change in restricted cash
|
(0.2
|
)
|
—
|
|
(2.9
|
)
|
—
|
|
(3.1
|
)
|
|||||||||
|
Other
|
—
|
|
0.9
|
|
(0.4
|
)
|
—
|
|
0.5
|
|
|||||||||
|
Net cash provided by investing activities of discontinued operations
|
—
|
|
3.1
|
|
0.2
|
|
—
|
|
3.3
|
|
|||||||||
|
Net cash provided by (used in) investing activities
|
1.8
|
|
(203.9
|
)
|
|
(24.1
|
)
|
|
—
|
|
|
(226.2
|
)
|
||||||
|
Cash flows from financing activities:
|
|
|
|
|
|
|
|
|
|
|
|||||||||
|
Principal payments on debt, including pre-payments
|
(59.5
|
)
|
(1.3
|
)
|
(1.7
|
)
|
—
|
|
(62.5
|
)
|
|||||||||
|
Principal borrowings on notes
|
—
|
|
—
|
|
15.2
|
|
—
|
|
15.2
|
|
|||||||||
|
Borrowings on revolving credit facility
|
197.0
|
|
—
|
|
—
|
|
—
|
|
197.0
|
|
|||||||||
|
Payments on revolving credit facility
|
(152.0
|
)
|
—
|
|
—
|
|
—
|
|
(152.0
|
)
|
|||||||||
|
Principal payments under capital lease obligations
|
(0.3
|
)
|
(6.3
|
)
|
(3.5
|
)
|
—
|
|
(10.1
|
)
|
|||||||||
|
Repurchase of common stock, including fees and expenses
|
(234.1
|
)
|
—
|
|
—
|
|
—
|
|
(234.1
|
)
|
|||||||||
|
Repurchases of convertible perpetual preferred stock, including fees
|
(2.8
|
)
|
—
|
|
—
|
|
—
|
|
(2.8
|
)
|
|||||||||
|
Dividends paid on common stock
|
(15.7
|
)
|
—
|
|
—
|
|
—
|
|
(15.7
|
)
|
|||||||||
|
Dividends paid on convertible perpetual preferred stock
|
(23.0
|
)
|
—
|
|
—
|
|
—
|
|
(23.0
|
)
|
|||||||||
|
Distributions paid to noncontrolling interests of consolidated affiliates
|
—
|
|
—
|
|
(46.3
|
)
|
—
|
|
(46.3
|
)
|
|||||||||
|
Contributions from consolidated affiliates
|
—
|
|
—
|
|
1.6
|
|
—
|
|
1.6
|
|
|||||||||
|
Proceeds from exercising stock warrants
|
15.3
|
|
—
|
|
—
|
|
—
|
|
15.3
|
|
|||||||||
|
Other
|
5.0
|
|
—
|
|
—
|
|
—
|
|
5.0
|
|
|||||||||
|
Change in intercompany advances
|
84.3
|
|
(22.2
|
)
|
(62.1
|
)
|
—
|
|
—
|
|
|||||||||
|
Net cash used in financing activities
|
(185.8
|
)
|
(29.8
|
)
|
|
(96.8
|
)
|
|
—
|
|
(312.4
|
)
|
|||||||
|
(Decrease) increase in cash and cash equivalents
|
(70.8
|
)
|
2.0
|
|
|
0.5
|
|
|
—
|
|
(68.3
|
)
|
|||||||
|
Cash and cash equivalents at beginning of year
|
131.3
|
|
0.3
|
|
1.2
|
|
—
|
|
132.8
|
|
|||||||||
|
Cash and cash equivalents at end of year
|
$
|
60.5
|
|
$
|
2.3
|
|
|
$
|
1.7
|
|
|
$
|
—
|
|
$
|
64.5
|
|
||
F-67
|
HealthSouth Corporation and Subsidiaries
Notes to Consolidated Financial Statements
Condensed Consolidating Statement of Cash Flows
|
||
|
|
For the Year Ended December 31, 2012
|
||||||||||||||||||
|
|
HealthSouth Corporation
|
Guarantor Subsidiaries
|
Non-guarantor Subsidiaries
|
Eliminating Entries
|
HealthSouth Consolidated
|
||||||||||||||
|
|
(In Millions)
|
||||||||||||||||||
|
Net cash provided by operating activities
|
$
|
31.3
|
|
$
|
252.4
|
|
$
|
127.8
|
|
$
|
—
|
|
$
|
411.5
|
|
||||
|
Cash flows from investing activities:
|
|
|
|
|
|
|
|
|
|
|
|||||||||
|
Purchases of property and equipment
|
(4.8
|
)
|
(98.4
|
)
|
(37.6
|
)
|
—
|
|
(140.8
|
)
|
|||||||||
|
Capitalized software costs
|
(8.5
|
)
|
(7.2
|
)
|
(3.2
|
)
|
—
|
|
(18.9
|
)
|
|||||||||
|
Acquisition of businesses, net of cash acquired
|
—
|
|
(3.1
|
)
|
—
|
|
—
|
|
(3.1
|
)
|
|||||||||
|
Proceeds from sale of restricted investments
|
—
|
|
—
|
|
0.3
|
|
—
|
|
0.3
|
|
|||||||||
|
Purchases of restricted investments
|
—
|
|
—
|
|
(9.1
|
)
|
—
|
|
(9.1
|
)
|
|||||||||
|
Net change in restricted cash
|
(0.1
|
)
|
—
|
|
(13.9
|
)
|
—
|
|
(14.0
|
)
|
|||||||||
|
Other
|
(0.3
|
)
|
(0.8
|
)
|
0.2
|
|
—
|
|
(0.9
|
)
|
|||||||||
|
Net cash provided by investing activities of discontinued operations
|
4.4
|
|
3.3
|
|
—
|
|
—
|
|
7.7
|
|
|||||||||
|
Net cash used in investing activities
|
(9.3
|
)
|
(106.2
|
)
|
|
(63.3
|
)
|
|
—
|
|
(178.8
|
)
|
|||||||
|
Cash flows from financing activities:
|
|
|
|
|
|
|
|
|
|
|
|||||||||
|
Proceeds from bond issuance
|
275.0
|
|
—
|
|
—
|
|
—
|
|
275.0
|
|
|||||||||
|
Principal payments on debt, including pre-payments
|
(164.9
|
)
|
(1.3
|
)
|
—
|
|
—
|
|
(166.2
|
)
|
|||||||||
|
Borrowings on revolving credit facility
|
135.0
|
|
—
|
|
—
|
|
—
|
|
135.0
|
|
|||||||||
|
Payments on revolving credit facility
|
(245.0
|
)
|
—
|
|
—
|
|
—
|
|
(245.0
|
)
|
|||||||||
|
Principal payments under capital lease obligations
|
(0.3
|
)
|
(8.9
|
)
|
(2.9
|
)
|
—
|
|
(12.1
|
)
|
|||||||||
|
Repurchases of convertible perpetual preferred stock, including fees
|
(46.0
|
)
|
—
|
|
—
|
|
—
|
|
(46.0
|
)
|
|||||||||
|
Dividends paid on convertible perpetual preferred stock
|
(24.6
|
)
|
—
|
|
—
|
|
—
|
|
(24.6
|
)
|
|||||||||
|
Distributions paid to noncontrolling interests of consolidated affiliates
|
—
|
|
—
|
|
(49.3
|
)
|
—
|
|
(49.3
|
)
|
|||||||||
|
Contributions from consolidated affiliates
|
—
|
|
—
|
|
10.5
|
|
—
|
|
10.5
|
|
|||||||||
|
Other
|
0.2
|
|
—
|
|
(7.5
|
)
|
—
|
|
(7.3
|
)
|
|||||||||
|
Change in intercompany advances
|
153.9
|
|
(137.0
|
)
|
(16.9
|
)
|
—
|
|
—
|
|
|||||||||
|
Net cash provided by (used in) financing activities
|
83.3
|
|
(147.2
|
)
|
|
(66.1
|
)
|
|
—
|
|
(130.0
|
)
|
|||||||
|
Increase (decrease) in cash and cash equivalents
|
105.3
|
|
(1.0
|
)
|
|
(1.6
|
)
|
|
—
|
|
102.7
|
|
|||||||
|
Cash and cash equivalents at beginning of year
|
26.0
|
|
1.3
|
|
2.8
|
|
—
|
|
30.1
|
|
|||||||||
|
Cash and cash equivalents at end of year
|
$
|
131.3
|
|
$
|
0.3
|
|
|
$
|
1.2
|
|
|
$
|
—
|
|
$
|
132.8
|
|
||
F-68
|
HealthSouth Corporation and Subsidiaries
Notes to Consolidated Financial Statements
Condensed Consolidating Statement of Cash Flows
|
||
|
|
For the Year Ended December 31, 2011
|
||||||||||||||||||
|
|
HealthSouth Corporation
|
Guarantor Subsidiaries
|
Non-guarantor Subsidiaries
|
Eliminating Entries
|
HealthSouth Consolidated
|
||||||||||||||
|
|
(In Millions)
|
||||||||||||||||||
|
Net cash (used in) provided by operating activities
|
$
|
(58.3
|
)
|
$
|
273.7
|
|
$
|
127.3
|
|
$
|
—
|
|
$
|
342.7
|
|
||||
|
Cash flows from investing activities:
|
|
|
|
|
|
|
|
|
|
|
|||||||||
|
Purchases of property and equipment
|
(4.8
|
)
|
(83.3
|
)
|
(12.2
|
)
|
—
|
|
(100.3
|
)
|
|||||||||
|
Capitalized software costs
|
(6.6
|
)
|
(2.0
|
)
|
(0.2
|
)
|
—
|
|
(8.8
|
)
|
|||||||||
|
Acquisition of businesses, net of cash acquired
|
—
|
|
(4.9
|
)
|
—
|
|
—
|
|
(4.9
|
)
|
|||||||||
|
Proceeds from sale of restricted investments
|
—
|
|
—
|
|
1.2
|
|
—
|
|
1.2
|
|
|||||||||
|
Purchases of restricted investments
|
—
|
|
—
|
|
(8.4
|
)
|
—
|
|
(8.4
|
)
|
|||||||||
|
Net change in restricted cash
|
(0.2
|
)
|
—
|
|
1.4
|
|
—
|
|
1.2
|
|
|||||||||
|
Net settlements on interest rate swaps not designated as hedges
|
(10.9
|
)
|
—
|
|
—
|
|
—
|
|
(10.9
|
)
|
|||||||||
|
Other
|
—
|
|
(0.9
|
)
|
—
|
|
—
|
|
(0.9
|
)
|
|||||||||
|
Net cash provided by (used in) investing activities of discontinued operations—
|
|
|
|||||||||||||||||
|
Proceeds from sale of LTCHs
|
107.9
|
|
—
|
|
—
|
|
—
|
|
107.9
|
|
|||||||||
|
Other investing activities of discontinued operations
|
—
|
|
(0.3
|
)
|
(0.4
|
)
|
—
|
|
(0.7
|
)
|
|||||||||
|
Net cash provided by (used in) investing activities
|
85.4
|
|
(91.4
|
)
|
|
(18.6
|
)
|
|
—
|
|
(24.6
|
)
|
|||||||
|
Cash flows from financing activities:
|
|
|
|
|
|
|
|
|
|
|
|||||||||
|
Principal borrowings on term loan
|
100.0
|
|
—
|
|
—
|
|
—
|
|
100.0
|
|
|||||||||
|
Proceeds from bond issuance
|
120.0
|
|
—
|
|
—
|
|
—
|
|
120.0
|
|
|||||||||
|
Principal payments on debt, including pre-payments
|
(507.4
|
)
|
(1.5
|
)
|
4.0
|
|
—
|
|
(504.9
|
)
|
|||||||||
|
Borrowings on revolving credit facility
|
338.0
|
|
—
|
|
—
|
|
—
|
|
338.0
|
|
|||||||||
|
Payments on revolving credit facility
|
(306.0
|
)
|
—
|
|
—
|
|
—
|
|
(306.0
|
)
|
|||||||||
|
Principal payments under capital lease obligations
|
(0.8
|
)
|
(10.2
|
)
|
(2.2
|
)
|
—
|
|
(13.2
|
)
|
|||||||||
|
Dividends paid on convertible perpetual preferred stock
|
(26.0
|
)
|
—
|
|
—
|
|
—
|
|
(26.0
|
)
|
|||||||||
|
Distributions paid to noncontrolling interests of consolidated affiliates
|
—
|
|
—
|
|
(44.2
|
)
|
—
|
|
(44.2
|
)
|
|||||||||
|
Change in intercompany advances
|
235.3
|
|
(169.4
|
)
|
(65.9
|
)
|
—
|
|
—
|
|
|||||||||
|
Net cash used in financing activities
|
(46.9
|
)
|
(181.1
|
)
|
|
(108.3
|
)
|
|
—
|
|
(336.3
|
)
|
|||||||
|
(Decrease) increase in cash and cash equivalents
|
(19.8
|
)
|
1.2
|
|
|
0.4
|
|
|
—
|
|
(18.2
|
)
|
|||||||
|
Cash and cash equivalents at beginning of year
|
45.8
|
|
0.1
|
|
2.4
|
|
—
|
|
48.3
|
|
|||||||||
|
Cash and cash equivalents at end of year
|
$
|
26.0
|
|
$
|
1.3
|
|
|
$
|
2.8
|
|
|
$
|
—
|
|
$
|
30.1
|
|
||
F-69
EXHIBIT LIST
|
No.
|
Description
|
|
|
3.1
|
Restated Certificate of Incorporation of HealthSouth Corporation, as filed in the Office of the Secretary of State of the State of Delaware on May 21, 1998.*
|
|
|
|
|
|
|
3.2
|
Certificate of Amendment to the Restated Certificate of Incorporation of HealthSouth Corporation, as filed in the Office of the Secretary of State of the State of Delaware on October 25, 2006 (incorporated by reference to Exhibit 3.1 to HealthSouth’s Current Report on Form 8-K filed on October 31, 2006).
|
|
|
|
|
|
|
3.3
|
Amended and Restated Bylaws of HealthSouth Corporation, effective as of October 30, 2009 (incorporated by reference to Exhibit 3.3 to HealthSouth’s Quarterly Report on Form 10-Q filed on November 4, 2009).
|
|
|
|
|
|
|
3.4
|
Certificate of Designations of 6.50% Series A Convertible Perpetual Preferred Stock, as filed with the Secretary of State of the State of Delaware on March 7, 2006 (incorporated by reference to Exhibit 3.1 to HealthSouth’s Current Report on Form 8-K filed on March 9, 2006).
|
|
|
|
||
|
4.1
|
Warrant Agreement, dated as of September 30, 2009, among HealthSouth Corporation and Computershare Inc. and Computershare Trust Company, N.A., jointly and severally as warrant agent (incorporated by reference to Exhibit 4.1 to HealthSouth’s Registration Statement on Form 8-A filed on October 1, 2009).
|
|
|
4.2.1
|
Indenture, dated as of December 1, 2009, between HealthSouth Corporation and Wells Fargo Bank, National Association, as trustee and successor in interest to The Bank of Nova Scotia Trust Company of New York, relating to HealthSouth’s 8.125% Senior Notes due 2020, 7.250% Senior Notes due 2018, 7.750% Senior Notes due 2022, and 5.75% Senior Notes due 2024 (incorporated by reference to Exhibit 4.7.1 to HealthSouth’s Annual Report on Form 10-K filed on February 23, 2010).
|
|
|
|
|
|
|
4.2.2
|
First Supplemental Indenture, dated December 1, 2009, among HealthSouth Corporation, the Subsidiary Guarantors (as defined therein) and Wells Fargo Bank, National Association, as trustee and successor in interest to The Bank of Nova Scotia Trust Company of New York, relating to HealthSouth’s 8.125% Senior Notes due 2020 (incorporated by reference to Exhibit 4.7.2 to HealthSouth’s Annual Report on Form 10-K filed on February 23, 2010).
|
|
|
|
|
|
|
4.2.3
|
Second Supplemental Indenture, dated October 7, 2010, among HealthSouth Corporation, the Subsidiary Guarantors (as defined therein) and Wells Fargo Bank, National Association, as trustee and successor in interest to The Bank of Nova Scotia Trust Company of New York, relating to HealthSouth’s 7.250% Senior Notes due 2018 (incorporated by reference to Exhibit 4.2 to HealthSouth’s Current Report on Form 8-K filed on October 12, 2010).
|
|
|
|
|
|
|
4.2.4
|
Third Supplemental Indenture, dated October 7, 2010, among HealthSouth Corporation, the Subsidiary Guarantors (as defined therein) and Wells Fargo Bank, National Association, as trustee and successor in interest to The Bank of Nova Scotia Trust Company of New York, relating to HealthSouth’s 7.750% Senior Notes due 2022 (incorporated by reference to Exhibit 4.3 to HealthSouth’s Current Report on Form 8-K filed on October 12, 2010).
|
|
|
4.2.5
|
Fourth Supplemental Indenture, dated September 11, 2012, among HealthSouth Corporation, the Subsidiary Guarantors (as defined therein) and Wells Fargo Bank, National Association, as trustee and successor in interest to The Bank of Nova Scotia Trust Company of New York, relating to HealthSouth’s 5.75% Senior Notes due 2024 (incorporated by reference to Exhibit 4.2 to HealthSouth’s Current Report on Form 8-K filed on September 11, 2012).
|
|
|
4.3
|
Indenture, dated November 18, 2013, by and between HealthSouth Corporation and Wells Fargo Bank, National Association, as trustee, relating to HealthSouth’s 2.00% Convertible Senior Subordinated Notes due 2043 (incorporated by reference to Exhibit 4.1 to HealthSouth’s Current Report on Form 8-K filed on November 19, 2013).
|
|
|
10.1
|
Stipulation of Partial Settlement, dated as of September 26, 2006, by and among HealthSouth Corporation, the stockholder lead plaintiffs named therein, the bondholder lead plaintiff named therein and the individual settling defendants named therein (incorporated by reference to Exhibit 10.1 to HealthSouth’s Current Report on Form 8-K filed on September 27, 2006).
|
|
|
|
|
|
|
10.2
|
Stipulation of Settlement with Certain Individual Defendants dated as of September 25, 2006, by and among HealthSouth Corporation, plaintiffs named therein and the individual settling defendants named therein (incorporated by reference to Exhibit 10.3 to HealthSouth’s Current Report on Form 8-K filed on September 27, 2006).
|
|
|
|
|
|
|
10.3.1
|
HealthSouth Corporation Amended and Restated 2004 Director Incentive Plan.** +
|
|
|
|
|
|
|
10.3.2
|
Form of Restricted Stock Unit Agreement (Amended and Restated 2004 Director Incentive Plan).** +
|
|
|
|
|
|
|
10.4
|
HealthSouth Corporation Second Amended and Restated Change in Control Benefits Plan. +
|
|
|
|
|
|
|
10.5.1
|
HealthSouth Corporation 1995 Stock Option Plan, as amended.* +
|
|
|
|
|
|
|
10.5.2
|
Form of Non-Qualified Stock Option Agreement (1995 Stock Option Plan).* +
|
|
|
|
|
|
|
10.6.1
|
HealthSouth Corporation 2002 Non-Executive Stock Option Plan.* +
|
|
|
|
|
|
|
10.6.2
|
Form of Non-Qualified Stock Option Agreement (2002 Non-Executive Stock Option Plan).* +
|
|
|
10.7
|
Description of the HealthSouth Corporation Senior Management Compensation Recoupment Policy (incorporated by reference to Item 5, “Other Matters,” in HealthSouth’s Quarterly Report on Form 10-Q filed on November 4, 2009).+
|
|
|
|
|
|
|
10.8
|
Description of the HealthSouth Corporation Senior Management Bonus and Long-Term Incentive Plans (incorporated by reference to the section captioned “Executive Compensation – Compensation Discussion and Analysis – Elements of Executive Compensation” in HealthSouth’s Definitive Proxy Statement on Schedule 14A filed on April 2, 2013).+
|
|
|
|
|
|
|
10.9
|
HealthSouth Corporation Nonqualified 401(k) Plan.+
|
|
|
|
|
|
|
10.10
|
HealthSouth Corporation Fourth Amended and Restated Executive Severance Plan (incorporated by reference to Exhibit 10.1 to HealthSouth’s Quarterly Report on Form 10-Q filed on October 29, 2013).+
|
|
|
|
|
|
|
10.11
|
Letter of Understanding, dated as of December 2, 2010, between HealthSouth Corporation and Jay Grinney (incorporated by reference to Exhibit 10.1 to HealthSouth’s Current Report on Form 8-K filed on December 3, 2010).+
|
|
|
|
|
|
|
10.12.1
|
HealthSouth Corporation 2005 Equity Incentive Plan (incorporated by reference to Exhibit 10 to HealthSouth’s Current Report on Form 8-K, filed on November 21, 2005).+
|
|
|
|
|
|
|
10.12.2
|
Form of Non-Qualified Stock Option Agreement (2005 Equity Incentive Plan).**+
|
|
|
|
|
|
|
10.13
|
Form of Key Executive Incentive Award Agreement.** +
|
|
|
|
|
|
|
10.14.1
|
HealthSouth Corporation Amended and Restated 2008 Equity Incentive Plan (incorporated by reference to Exhibit 4(d) to HealthSouth’s Registration Statement on Form S-8 filed on August 2, 2011).+
|
|
|
|
|
|
|
10.14.2
|
Form of Non-Qualified Stock Option Agreement (2008 Equity Incentive Plan)(incorporated by reference to Exhibit 10.28.2 to HealthSouth’s Annual Report on Form 10-K filed on February 24, 2009). +
|
|
|
|
|
|
|
10.14.3
|
Form of Restricted Stock Agreement (2008 Equity Incentive Plan)(incorporated by reference to Exhibit 10.28.3 to HealthSouth’s Annual Report on Form 10-K filed on February 24, 2009).+
|
|
|
|
|
|
|
10.14.4
|
Form of Performance Share Unit Award (2008 Equity Incentive Plan)(incorporated by reference to Exhibit 10.28.4 to HealthSouth’s Annual Report on Form 10-K filed on February 24, 2009).+
|
|
|
10.14.5
|
Form of Non-Qualified Stock Option Agreement (Amended and Restated 2008 Equity Incentive Plan (incorporated by reference to Exhibit 10.1.2 to HealthSouth’s Quarterly Report on Form 10-Q filed on August 4, 2011).+
|
|
|
10.14.6
|
Form of Restricted Stock Agreement (Amended and Restated 2008 Equity Incentive Plan (incorporated by reference to Exhibit 10.1.3 to HealthSouth’s Quarterly Report on Form 10-Q filed on August 4, 2011).+
|
|
|
10.14.7
|
Form of Performance Share Unit Award (Amended and Restated 2008 Equity Incentive Plan (incorporated by reference to Exhibit 10.1.4 to HealthSouth’s Quarterly Report on Form 10-Q filed on August 4, 2011 and the description in Item 5, “Other Items,” in HealthSouth’s Quarterly Report on Form 10-Q filed on July 30, 2013).+
|
|
|
10.14.8
|
Form of Restricted Stock Unit Award (Amended and Restated 2008 Equity Incentive Plan (incorporated by reference to Exhibit 10.1.5 to HealthSouth’s Quarterly Report on Form 10-Q filed on August 4, 2011).+
|
|
|
10.15
|
HealthSouth Corporation Directors’ Deferred Stock Investment Plan (incorporated by reference to HealthSouth’s Annual Report on Form 10-K filed on February 19, 2013).+
|
|
|
|
|
|
|
10.16
|
Written description of the annual compensation arrangement for non-employee directors of HealthSouth Corporation (incorporated by reference to the section captioned “Corporate Governance and Board Structure – Compensation of Directors” in HealthSouth’s Definitive Proxy Statement on Schedule 14A, filed on April 2, 2013).+
|
|
|
|
|
|
|
10.17
|
Form of Indemnity Agreement entered into between HealthSouth Corporation and the directors of HealthSouth.* +
|
|
|
|
|
|
|
10.18
|
Lease between LAKD HQ, LLC and HealthSouth Corporation, dated March 31, 2008, for corporate office space (incorporated by reference to Exhibit 10.5 to HealthSouth’s Quarterly Report on Form 10-Q filed on May 7, 2008).
|
|
|
|
|
|
|
10.19
|
Settlement Agreement and Stipulation regarding Fees, dated as of January 13, 2009 (incorporated by reference to Exhibit 99.3 to HealthSouth’s Current Report on Form 8-K filed on January 20, 2009).
|
|
|
|
|
|
|
10.20.1
|
Third Amended and Restated Credit Agreement, dated August 10, 2012, among HealthSouth Corporation, Barclays Bank PLC, as administrative agent and collateral agent, Citigroup Global Markets Inc., as syndication agent, Bank of America, N.A., Goldman Sachs Lending Partners LLC, and Morgan Stanley Senior Funding, Inc., as co-documentation agents, and various other lenders from time to time (incorporated by reference to Exhibit 10.1 to HealthSouth’s Quarterly Report on Form 10-Q filed on October 26, 2012).
|
|
|
10.20.2
|
First Amendment to the Third Amended and Restated Credit Agreement, dated June 11, 2013, among HealthSouth Corporation, Barclays Bank PLC, as administrative agent and collateral agent, Citigroup Global Markets Inc., as syndication agent, Bank of America, N.A., Goldman Sachs Lending Partners LLC, and Morgan Stanley Senior Funding, Inc., as co-documentation agents, and various other lenders from time to time (incorporated by reference to Exhibit 10.1 to HealthSouth’s Quarterly Report on Form 10-Q filed on July 30, 2013).
|
|
|
10.20.3
|
Amended and Restated Collateral and Guarantee Agreement, dated as of October 26, 2010, among HealthSouth Corporation, its subsidiaries identified herein, and Barclays Bank PLC, as collateral agent (incorporated by reference to Exhibit 10.3 to HealthSouth’s Current Report on Form 8-K/A filed on November 23, 2010).
|
|
|
10.21
|
Form of Exchange Agreement entered into between HealthSouth Corporation and certain holders of 6.50% Series A Convertible Perpetual Preferred Stock relating to the exchange of such preferred stock for 2.00% Convertible Senior Subordinated Notes due 2043 (incorporated by reference to Exhibit 10.1 to HealthSouth’s Current Report on Form 8-K filed on November 13, 2013).
|
|
|
12
|
Computation of Ratios.
|
|
|
21
|
Subsidiaries of HealthSouth Corporation.
|
|
|
23
|
Consent of PricewaterhouseCoopers LLP, Independent Registered Public Accounting Firm.
|
|
|
24
|
Power of Attorney (included as part of signature page).
|
|
|
31.1
|
Certification of Chief Executive Officer required by Rule 13a-14(a) or Rule 15d-14(a) of the Securities Exchange Act of 1934, as adopted pursuant to Section 302 of the Sarbanes-Oxley Act of 2002.
|
|
|
31.2
|
Certification of Chief Financial Officer required by Rule 13a-14(a) or Rule 15d-14(a) of the Securities Exchange Act of 1934, as adopted pursuant to Section 302 of the Sarbanes-Oxley Act of 2002.
|
|
|
32.1
|
Certification of Chief Executive Officer pursuant to 18 U.S.C. 1350, as adopted pursuant to Section 906 of the Sarbanes-Oxley Act of 2002.
|
|
|
|
|
|
|
32.2
|
Certification of Chief Financial Officer pursuant to 18 U.S.C. 1350, as adopted pursuant to Section 906 of the Sarbanes-Oxley Act of 2002.
|
|
|
101
|
Sections of the HealthSouth Corporation Annual Report on Form 10-K for the year ended December 31, 2013, formatted in XBRL (eXtensible Business Reporting Language), submitted in the following files:
|
|
|
101.INS
|
XBRL Instance Document
|
|
|
|
|
|
|
101.SCH
|
XBRL Taxonomy Extension Schema Document
|
|
|
|
|
|
|
101.CAL
|
XBRL Taxonomy Extension Calculation Linkbase Document
|
|
|
|
|
|
|
101.DEF
|
XBRL Taxonomy Extension Definition Linkbase Document
|
|
|
|
|
|
|
101.LAB
|
XBRL Taxonomy Extension Label Linkbase Document
|
|
|
|
|
|
|
101.PRE
|
XBRL Taxonomy Extension Presentation Linkbase Document
|
|
# Schedules have been omitted pursuant to Item 601(b)(2) of Regulation S-K. A copy of any omitted schedule will be furnished supplementally to the Securities and Exchange Commission upon request
* Incorporated by reference to HealthSouth’s Annual Report on Form 10-K filed with the SEC on June 27, 2005.
** Incorporated by reference to HealthSouth’s Annual Report on Form 10-K filed with the SEC on March 29, 2006.
+ Management contract or compensatory plan or arrangement.
TABLE OF CONTENTS
Part IItem 1. BusinessItem 1A. Risk FactorsItem 1B. Unresolved Staff CommentsItem 2. PropertiesItem 3. Legal ProceedingsItem 4. Mine Safety DisclosuresPart IIItem 5. Market For Registrant S Common Equity, Related Stockholder Matters and Issuer Purchases Of Equity SecuritiesItem 6. Selected Financial DataItem 7. Management S Discussion and Analysis Of Financial Condition and Results Of OperationsItem 7A. Quantitative and Qualitative Disclosures About Market RiskItem 8. Financial Statements and Supplementary DataItem 9. Changes in and Disagreements with Accountants on Accounting and Financial DisclosureItem 9A. Controls and ProceduresItem 9B. Other InformationPart IIIItem 10. Directors and Executive Officers Of The RegistrantItem 11. Executive CompensationItem 12. Security Ownership Of Certain Beneficial Owners and Management and Related Stockholder MattersItem 13. Certain Relationships and Related Transactions and Director IndependenceItem 14. Principal Accountant Fees and ServicesPart IVItem 15. Exhibits and Financial Statement SchedulesItem 15. Financial Statements