ENCOMPASS HEALTH CORP
10-Ks and 10-Qs
|
|
|
|
|
|
|
|
|
|
|
|
|
|
|
|
|
|
|
|
|
|
|
|
|
|
|
|
|
|
|
|
|
|
|
|
|
|
|
|
|
|
|
|
|
|
|
|
|
|
|
|
|
|
|
|
|
|
|
UNITED STATES
SECURITIES AND EXCHANGE COMMISSION
WASHINGTON, DC 20549
_________________________________________
FORM 10-K
ANNUAL REPORT PURSUANT TO SECTION 13 OR 15(d)
OF THE SECURITIES EXCHANGE ACT OF 1934
For the fiscal year ended
December 31, 2018
Commission File Number 001-10315
________________________________________________________
Encompass Health Corporation
(Exact Name of Registrant as Specified in its Charter)
|
Delaware
|
63-0860407
|
|
(State or Other Jurisdiction of
Incorporation or Organization)
|
(I.R.S. Employer
Identification No.)
|
|
|
|
|
9001 Liberty Parkway
Birmingham, Alabama
|
35242
|
|
(Address of Principal Executive Offices)
|
(Zip Code)
|
(205) 967-7116
(Registrant’s telephone number)
_____________________________________________________
Securities Registered Pursuant to Section 12(b) of the Act:
|
Title of each class
|
Name of each exchange
on which registered
|
|
Common Stock, $0.01 par value
|
New York Stock Exchange
|
Securities Registered Pursuant to Section 12(g) of the Act:
None
_________________________________________________________
Indicate by check mark if the registrant is a well-known seasoned issuer as defined in Rule 405 of the Securities Act. Yes
x
No
o
Indicate by check mark if the registrant is not required to file reports pursuant to Section 13 or Section 15(d) of the Act. Yes
o
No
x
Indicate by check mark whether the registrant (1) has filed all reports required to be filed by Section 13 or 15(d) of the Securities Exchange Act of 1934 during the preceding 12 months (or for such shorter period that the registrant was required to file such reports), and (2) has been subject to such filing requirements for the past 90 days. Yes
x
No
o
Indicate by check mark whether the registrant has submitted electronically every Interactive Data File required to be submitted pursuant to Rule 405 of Regulation S-T during the preceding 12 months (or for such shorter period that the registrant was required to submit such files). Yes
x
No
o
Indicate by check mark if disclosure of delinquent filers pursuant to Item 405 of Regulation S-K is not contained herein, and will not be contained, to the best of registrant’s knowledge, in definitive proxy or information statements incorporated by reference in Part III of this Form 10-K or any amendment to this Form 10-K.
x
Indicate by check mark whether the registrant is a large accelerated filer, an accelerated filer, a non-accelerated filer, a smaller reporting company, or an emerging growth company. See the definitions of “large accelerated filer,” “accelerated filer,” “smaller reporting company,” and “emerging growth company” in Rule 12b-2 of the Exchange Act.
Large accelerated filer
x
Accelerated filer
o
Emerging growth company
o
Non-Accelerated filer
o
Smaller reporting company
o
If an emerging growth company, indicate by check mark if the registrant has elected not to use the extended transition period for complying with any new or revised financial accounting standards provided pursuant to Section 13(a) of the Exchange Act.
o
Indicate by check mark whether the registrant is a shell company (as defined in Exchange Act Rule 12b-2). Yes
o
No
x
The aggregate market value of common stock held by non-affiliates of the registrant as of the last business day of the registrant’s most recently completed second fiscal quarter was approximately
$6.6 billion
. For purposes of the foregoing calculation only, executive officers and directors of the registrant have been deemed to be affiliates. There were
98,743,918
shares of common stock of the registrant outstanding, net of treasury shares, as of
February 13, 2019
.
DOCUMENTS INCORPORATED BY REFERENCE
The definitive proxy statement relating to the registrant’s
2019
annual meeting of stockholders is incorporated by reference in Part III to the extent described therein.
TABLE OF CONTENTS
|
|
|
Page
|
|
|
|
|
|
|
||
|
|
|
|
|
|
|
|
|
|
|
|
|
|
|
|
|
|
|
|
|
|
|
|
|
|
|
|
|
|
|
|
|
|
|
|
|
Item 16.
|
||
NOTE TO READERS
As used in this report, the terms “Encompass Health,” “we,” “us,” “our,” and the “Company” refer to Encompass Health Corporation and its consolidated subsidiaries, unless otherwise stated or indicated by context. This drafting style is suggested by the Securities and Exchange Commission and is not meant to imply that Encompass Health Corporation, the publicly traded parent company, owns or operates any specific asset, business, or property. The hospitals, operations, and businesses described in this filing are primarily owned and operated by subsidiaries of the parent company. In addition, we use the term “Encompass Health Corporation” to refer to Encompass Health Corporation alone wherever a distinction between Encompass Health Corporation and its subsidiaries is required or aids in the understanding of this filing. We may refer to our consolidated subsidiary, EHHI Holdings, Inc. and its subsidiaries, which collectively operate our home health and hospice business, as “EHHI.”
i
CAUTIONARY STATEMENT REGARDING FORWARD-LOOKING STATEMENTS
This annual report contains historical information, as well as forward-looking statements that involve known and unknown risks and relate to, among other things, future events, changes to Medicare reimbursement and other healthcare laws and regulations from time to time, our business strategy, our dividend and stock repurchase strategies, our financial plans, our growth plans, our future financial performance, our projected business results, or our projected capital expenditures. In some cases, the reader can identify forward-looking statements by terminology such as “may,” “will,” “should,” “could,” “expects,” “plans,” “anticipates,” “believes,” “estimates,” “predicts,” “targets,” “potential,” or “continue” or the negative of these terms or other comparable terminology. Such forward-looking statements are necessarily estimates based upon current information and involve a number of risks and uncertainties, many of which are beyond our control. Any forward-looking statement is based on information current as of the date of this report and speaks only as of the date on which such statement is made. Actual events or results may differ materially from the results anticipated in these forward-looking statements as a result of a variety of factors. While it is impossible to identify all such factors, factors that could cause actual results to differ, such as decreases in revenues or increases in costs or charges, materially from those estimated by us include, but are not limited to, the following:
|
•
|
each of the factors discussed in Item 1A,
Risk Factors
; as well as uncertainties and factors discussed elsewhere in this Form 10-K, in our other filings from time to time with the SEC, or in materials incorporated therein by reference;
|
|
•
|
changes in the rules and regulations of the healthcare industry at either or both of the federal and state levels, including those contemplated now and in the future as part of national healthcare reform and deficit reduction (such as the re-basing of payment systems, the introduction of site neutral payments or case-mix weightings across post-acute settings, the Patient-Driven Groupings Model for home health, the CARE Tool for inpatient rehabilitation, and other payment system reforms), which may decrease revenues and increase the costs of complying with such changes;
|
|
•
|
reductions or delays in, or suspension of, reimbursement for our services by governmental or private payors, including our ability to obtain and retain favorable arrangements with third-party payors;
|
|
•
|
restrictive interpretations of the regulations governing the claims that are reimbursable by Medicare;
|
|
•
|
our ability to comply with extensive and changing healthcare regulations as well as the increased costs of regulatory compliance and compliance monitoring in the healthcare industry, including the costs of investigating and defending asserted claims, whether meritorious or not;
|
|
•
|
any adverse outcome of various lawsuits, claims, and legal or regulatory proceedings, including disclosed and undisclosed
qui tam
suits;
|
|
•
|
our ability to finalize a settlement of the United States Department of Justice’s investigation which has been pending six years and is discussed further in
Note 17,
Contingencies and Other Commitments
;
|
|
•
|
the use by governmental agencies and contractors of statistical sampling and extrapolation to expand claims of overpayment or noncompliance;
|
|
•
|
delays in the administrative appeals process associated with denied Medicare reimbursement claims, including from various Medicare audit programs, and our exposure to the related delay or reduction in the receipt of the reimbursement amounts for services previously provided, including through recoupment of ongoing claims reimbursement by CMS;
|
|
•
|
the ongoing evolution of the healthcare delivery system, including alternative payment models and value-based purchasing initiatives, which may decrease our reimbursement rate or increase costs associated with our operations;
|
|
•
|
our ability to attract and retain nurses, therapists, and other healthcare professionals in a highly competitive environment with often severe staffing shortages and the impact on our labor expenses from potential union activity and staffing recruitment and retention;
|
|
•
|
competitive pressures in the healthcare industry, including from other providers that may be participating in integrated delivery payment arrangements in which we do not participate, and our response to those pressures;
|
|
•
|
changes in our payor mix or the acuity of our patients affecting reimbursement rates;
|
ii
|
•
|
our ability to successfully complete and integrate de novo developments, acquisitions, investments, and joint ventures consistent with our growth strategy, including realization of anticipated revenues, cost savings, productivity improvements arising from the related operations and avoidance of unanticipated difficulties, costs or liabilities that could arise from acquisitions or integrations;
|
|
•
|
increased costs of defending and insuring against alleged professional liability and other claims and the ability to predict the costs related to claims;
|
|
•
|
potential incidents affecting the proper operation, availability, or security of our information systems, including the patient information stored there;
|
|
•
|
new or changing quality reporting requirements impacting operational costs or our Medicare reimbursement;
|
|
•
|
the price of our common stock as it affects our willingness and ability to repurchase shares and the financial and accounting effects of any repurchases;
|
|
•
|
our ability and willingness to continue to declare and pay dividends on our common stock;
|
|
•
|
our ability to maintain proper local, state and federal licensing, including compliance with the Medicare conditions of participation, which is required to participate in the Medicare program;
|
|
•
|
our ability to attract and retain key management personnel; and
|
|
•
|
general conditions in the economy and capital markets, including any instability or uncertainty related to armed conflict or an act of terrorism, governmental impasse over approval of the United States federal budget, an increase to the debt ceiling, or an international sovereign debt crisis.
|
The cautionary statements referred to in this section also should be considered in connection with any subsequent written or oral forward-looking statements that may be issued by us or persons acting on our behalf. We undertake no duty to update these forward-looking statements, even though our situation may change in the future. Furthermore, we cannot guarantee future results, events, levels of activity, performance, or achievements.
iii
PART I
|
Item 1.
|
Business.
|
Overview of the Company
General
We are a leading provider of integrated healthcare services, offering both facility-based and home-based patient care through our network of inpatient rehabilitation hospitals, home health agencies, and hospice agencies. As of December 31, 2018, our national footprint spans
36
states and Puerto Rico and includes 130 hospitals and 220 home health and 58 hospice locations. We are committed to delivering high-quality, cost-effective, integrated patient care across the healthcare continuum with a primary focus on the post-acute sector. Our home health and hospice agencies also serve patients without a preceding inpatient stay.
In 2018, we undertook a rebranding to reinforce our strategy and position as an integrated provider of facility-based and home-based patient care. As part of the rebranding, we changed our corporate name from HealthSouth Corporation to Encompass Health Corporation and the NYSE ticker symbol for our common stock from “HLS” to “EHC.” Our principal executive offices are located at 9001 Liberty Parkway, Birmingham, Alabama 35242, and the telephone number of the principal executive offices is (205) 967-7116. Our website address is
www.encompasshealth.com
.
In addition to the discussion here, we encourage the reader to review Item 1A,
Risk Factors
, Item 2,
Properties,
and Item 7,
Management’s Discussion and Analysis of Financial Condition and Results of Operations
, which highlight additional considerations about our company.
We manage our operations in two operating segments which are also our reportable segments: (1) inpatient rehabilitation and (2) home health and hospice. The table below provides selected operating and financial data for our inpatient rehabilitation hospitals, home health agencies, and hospice agencies. See
Note 18,
Segment Reporting
,
to the accompanying consolidated financial statements for detailed financial information for each of our segments.
|
As of or for the Year Ended December 31,
|
||||||||||||
|
2018
|
2017
|
2016
|
||||||||||
|
Consolidated data:
|
(Actual Amounts)
|
|||||||||||
|
Inpatient rehabilitation:
|
||||||||||||
|
Number of hospitals
(1)
|
130
|
|
127
|
|
123
|
|
||||||
|
Discharges
|
179,846
|
|
171,922
|
|
165,305
|
|
||||||
|
Number of licensed beds
|
8,966
|
|
8,851
|
|
8,504
|
|
||||||
|
Home health and hospice:
|
||||||||||||
|
Number of home health locations
(2)
|
220
|
|
200
|
|
188
|
|
||||||
|
Home health admissions
|
137,396
|
|
124,870
|
|
106,712
|
|
||||||
|
Number of hospice locations
|
58
|
|
37
|
|
35
|
|
||||||
|
Hospice admissions
|
7,474
|
|
4,870
|
|
3,337
|
|
||||||
|
Net operating revenues:
|
(In Millions)
|
|||||||||||
|
Inpatient
|
$
|
3,247.9
|
|
$
|
3,039.3
|
|
$
|
2,853.9
|
|
|||
|
Outpatient and other
|
98.3
|
|
102.0
|
|
110.2
|
|
||||||
|
Total inpatient rehabilitation
|
3,346.2
|
|
3,141.3
|
|
2,964.1
|
|
||||||
|
Home health
|
814.6
|
|
702.4
|
|
630.8
|
|
||||||
|
Hospice
|
116.5
|
|
70.2
|
|
47.7
|
|
||||||
|
Total home health and hospice
|
931.1
|
|
772.6
|
|
678.5
|
|
||||||
|
Net operating revenues
|
$
|
4,277.3
|
|
$
|
3,913.9
|
|
$
|
3,642.6
|
|
|||
|
(1)
|
These amounts include one hospital as of December 31,
2018
,
2017
, and
2016
operating as a joint venture, which we account for using the equity method of accounting.
|
|
(2)
|
These amounts include two locations as of December 31,
2018
,
2017
, and
2016
which we account for using the equity method of accounting.
|
1
Inpatient Rehabilitation
We are the nation’s largest owner and operator of inpatient rehabilitation hospitals in terms of patients treated and discharged, revenues, and number of hospitals. We provide specialized rehabilitative treatment on predominantly an inpatient basis. We operate hospitals in
32
states and Puerto Rico, with concentrations in the eastern half of the United States and Texas. In addition to our hospitals, we manage
five
inpatient rehabilitation units through management contracts.
Our inpatient rehabilitation hospitals offer specialized rehabilitative care across an array of diagnoses and deliver comprehensive, high-quality, cost-effective patient care services. As participants in the Medicare program, our hospitals must be licensed and certified and otherwise comply with various requirements that are discussed below in the “Sources of Revenues—Medicare Reimbursement—Inpatient Rehabilitation” section. Substantially all (
90%
) of the patients we serve are admitted from acute care hospitals following physician referrals for specific acute inpatient rehabilitative care. Most of those patients have experienced significant physical and cognitive disabilities or injuries due to medical conditions, such as strokes, hip fractures, and a variety of debilitating neurological conditions, that are generally nondiscretionary in nature and require rehabilitative healthcare services in a facility-based setting. Our teams of highly skilled nurses and physical, occupational, and speech therapists utilize proven technology and clinical protocols with the objective of restoring our patients’ physical and cognitive abilities. Patient care is provided by nursing and therapy staff as directed by physician orders while case managers monitor each patient’s progress and provide documentation and oversight of patient status, achievement of goals, discharge planning, and functional outcomes. Our hospitals provide a comprehensive interdisciplinary clinical approach to treatment that leverages innovative technologies and advanced therapies and leads to superior outcomes.
Home Health and Hospice
Our home health and hospice business is the nation’s fourth largest provider of Medicare-certified skilled home health services in terms of revenues. We operate home health and hospice agencies in
30
states, with concentrations in the Southeast and Texas. As participants in the Medicare program, our agencies must comply with various requirements that are discussed below in the “Sources of Revenues—Medicare Reimbursement—Home Health” and “—Hospice” sections. We acquired a significant portion of our home health and hospice business when we purchased EHHI Holdings, Inc. (“EHHI”) on December 31, 2014. In the acquisition, we acquired 83.3% of the issued and outstanding equity interests of EHHI, and certain members of EHHI management, including April Anthony, its chief executive officer, acquired the remaining interests. See Item 7,
Management’s Discussion and Analysis of Financial Condition and Results of Operations
, “Liquidity and Capital Resources” for further discussion of the ownership structure of our home health and hospice business.
Our home health agencies provide a comprehensive range of Medicare-certified home care services. These services include, among others, skilled nursing, physical, occupational and speech therapy, medical social work, and home health aide services. We also offer evidence-based specialty programs related to post-operative care, fall prevention, chronic disease management, and transitional care. Home health patients are frequently referred to us following a stay in an acute care or inpatient rehabilitation hospital or other facility, but many patients are referred from primary care settings and specialty physicians without a preceding inpatient stay. Our patients are typically older adults with three or more chronic conditions and significant functional limitations, and require greater than ten medications. Our team of registered nurses, licensed practical nurses, physical, speech and occupational therapists, medical social workers, and home health aides work closely with patients and their families and physicians to deliver patient-centered care plans focused on their needs and their goals.
We also provide hospice services to terminally ill patients and their families. These in-home services address patients’ physical needs, including pain control and symptom management, and provide emotional and spiritual support. Our hospice care teams consist of physician medical directors, nurses, social workers, chaplains, therapists, home health aides, and volunteers.
Competitive Strengths
We believe we differentiate ourselves from our competitors based on, among other things, the quality of our clinical outcomes, our cost-effectiveness, our financial strength, and our extensive application of technology. We also believe our competitive strengths discussed below give us the ability to adapt and succeed in a healthcare industry facing the movement toward integrated delivery models and value-based care. For example, we are well-positioned to treat all types of post-acute patients by leveraging our operational expertise across our network of facility- and home-based assets in the event multiple or all post-acute settings (long-term acute care, inpatient rehabilitation, skilled nursing, and home health) transition in the future to site neutral patient criteria. Our hospitals have the physical construct (including aspects such as the therapy gym and training areas), clinical staffing, and operating expertise to address the broad spectrum of needs for higher acuity post-acute patients needing inpatient care. Our home health agencies can often treat patients leaving our or other inpatient facilities who need
2
additional post-acute care services in lieu of skilled nursing facility-based care. Additionally, those agencies can serve the lower acuity patients that do not require facility-based care.
|
•
|
People
. We believe our employees share a steadfast commitment to providing outstanding care to our patients. We undertake significant efforts to ensure our clinical and support staff receives the education and training necessary to provide the highest quality care in the most cost-effective manner. We also have hospital staff trained for all patient acuity levels faced in the post-acute setting. We embrace the Encompass Health Way by setting the standard, leading with empathy, doing what's right, focusing on the positive and ensuring we are stronger together.
|
|
•
|
Change Agility
. We have a demonstrated ability to adapt in the face of numerous and significant regulatory and legislative changes. For example, we successfully managed through the significant regulatory, financial, and other challenges associated with the Centers for Medicare & Medicaid Services (“CMS”) rule commonly referred to as the “75% Rule” in 2004, reimbursement rate reductions associated with the shift from the 75% Rule to the “60% Rule” in 2007, sequestration beginning in 2013, multiple reimbursement rate reductions associated with healthcare reform and otherwise, introduction of significantly more quality reporting requirements beginning in 2013, and implementation of both voluntary and mandatory alternative payment models in recent years.
|
|
•
|
Strategic Relationships
. We have a long and successful history of building strategic relationships with major healthcare systems. Our experience will be important in growing the Company as the industry evolves toward integrated delivery models. We entered into our first joint venture in 1991 with a nationally prominent university’s acute care hospital. We have never unwound a joint venture. Approximately one-third of our inpatient rehabilitation hospitals currently operate as joint ventures with acute care hospitals or systems. Joint ventures with market leading acute care hospitals establish a solid foundation for operating our business within integrated delivery and alternative payment models.
|
Our combined platform of facility- and home-based services provides us with an opportunity to succeed in value-based purchasing programs and to participate in more coordinated care and integrated delivery payment models, such as accountable care organizations (“ACOs”) and bundled payment arrangements. We believe clinical collaboration between our hospitals and home health agencies offers an excellent means to deliver the quality of care and the cost effectiveness the healthcare partners in these new models seek. We have focused, and will continue to focus, on increasing this collaboration. For additional discussion of our participation in these models, including the Bundled Payments for Care Improvement Advanced initiative, see Item 1A,
Risk Factors,
and Item 7,
Management’s Discussion and Analysis of Financial Condition and Results of Operations
, “Executive Overview.”
In 2017, we formed the Post-Acute Innovation Center in collaboration with Cerner Corporation, a global leader in health information technology, to develop enhanced tools to manage patients across the continuum of care. The objective of the Innovation Center is to develop clinical decision support tools and other initiatives that enhance the effective and efficient management of patients across multiple care settings by facilitating high-quality patient care, enhanced care coordination, post-acute network performance and cost management across the post-acute continuum.
In 2017, we also entered into a three-year strategic sponsorship with the American Heart Association/American Stroke Association on a nationwide basis to increase patient independence after a stroke and reduce stroke mortality through community outreach and information campaigns. This strategic sponsorship is intended to be a three-year project beginning in 2019 to accelerate adoption of the new AHA/ASA Stroke Rehabilitation Guidelines, increase patient awareness of their post-stroke options, and provide practical support to patients and their families to improve recovery outcomes. These Guidelines recommend, among other things, that stroke patients be treated at an inpatient rehabilitation facility, or “IRF,” rather than a skilled nursing facility. In 2018, we worked with the AHA/ASA to develop events and patient, caregiver, and provider tools as well as educational programs to achieve the goals of this joint effort. We expect to implement these events, tools, and educational programs nationwide beginning in 2019.
|
•
|
Clinical Expertise and High-Quality Outcomes
. We have extensive facility-based and home-based clinical experience from which we have developed best practices and protocols. We believe these clinical best practices and protocols, particularly as leveraged with industry-leading technology, help ensure the delivery of consistently high-quality healthcare services. We have developed a program called “TeamWorks,” which is a series of operations-focused initiatives using identified best practices to reduce inefficiencies and improve performance across a spectrum of operational areas. We believe these initiatives have enhanced, and will continue to enhance,
|
3
patient-employee interactions, clinical collaboration, and communication among the patient, the patient’s family, our treatment teams, other care providers, and payors, which, in turn, improves patient outcomes and satisfaction.
Our best practices and protocols have helped our hospitals consistently achieve patient outcomes, such as the rate of discharge to community, that exceed industry averages. Additionally, our hospitals participate in The Joint Commission's Disease-Specific Care Certification Program. Under this program, Joint Commission accredited organizations, like our hospitals, may seek certification for chronic diseases or conditions such as brain injury, stroke, or hip fracture rehabilitation by complying with Joint Commission standards, effectively using evidence-based, clinical practice guidelines to manage and optimize patient care, and using an organized approach to performance measurement and evaluation of clinical outcomes. Obtaining such certifications demonstrates our commitment to excellence in providing disease-specific care. As of
December 31, 2018
, 114 of our hospitals hold one or more disease-specific certifications, including 112 hospitals with stroke-specific certifications.
In home health, we place a significant emphasis on technology for the purpose of furthering clinical excellence and consistency. We have also developed programs to, among other things, create physician-specific custom treatment protocols and provide care transition from inpatient facilities to home for higher acuity patients. We consistently achieve an acute care readmission rate lower than the industry average along with an average quality of patient care star rating above the industry average.
Clinical collaboration between our inpatient rehabilitation hospitals and home health agencies furthers our pursuit of quality patient outcomes and improved patient experiences. Institutional programs and advanced treatment protocols connect facility- and home-based care and allow seamless transition of patients across the healthcare continuum. An important component of clinical collaboration has been to place care transition coordinators in markets where we operate both inpatient rehabilitation hospitals and home health agencies, which we refer to as “overlap markets.” These highly skilled professionals collaborate with clinicians and case managers in our hospitals to assess patients who may require home health services and prepare these patients for the care they will receive at home. The coordinators also work with patients’ families to ensure those family members are prepared to bring their loved ones home safely. We believe our clinical collaboration efforts contributed to reductions in discharges to skilled nursing facilities, higher discharges to home, and improved patient satisfaction.
|
•
|
Cost Effectiveness
. Our size, data-driven business practices, and culture help us provide facility-based and home-based healthcare services on a cost-effective basis. For example, our inpatient rehabilitation hospitals historically have received, on average, a lower per discharge payment from Medicare than the industry average payment while also treating patients with higher average acuity. Additionally, our hospitals historically have received, on average, significantly less Medicare high cost outlier reimbursement than other inpatient rehabilitation providers have. High cost outlier payments are supplemental payments from Medicare intended to cover high cost cases in excess of a fixed-loss threshold amount.
|
Specifically, we can leverage our comprehensive IT capabilities and centralized administrative functions, identify best practices, utilize proven staffing models, and take advantage of supply chain efficiencies across our extensive platform of operations. At the location level, we also enjoy economies of scale as our hospitals are often larger (more beds) than industry average. Also, we target patient density in the home health markets we serve, which is central to our ability to deliver an efficient cost per visit. In addition, our proprietary information systems, discussed below, aggregate data from our business into a comprehensive reporting package and database used by management in the field and in the home office. Our information systems allow users to analyze data and trends and create custom reports on a timely basis.
With a significant presence in both facility-based and home-based healthcare services, we have the opportunity to take advantage of the broader industry focus on reducing costs. Home-based services, which typically have significantly lower cost structures than facility-based care settings, have increasingly been serving larger populations of higher acuity patients than in the past. Home-based services provide a cost-effective alternative to facility-based care in cases where patient acuities do not require a hospital stay.
In 2018, we furthered several initiatives leveraging our clinical expertise, technology, large post-acute datasets and strategic partnerships in order to further develop our post-acute value proposition for acute care hospitals and payors. We populated and deployed a longitudinal patient record and a community care management platform that we began piloting in one market. These initiatives assist care navigators in the management of patients across the post-acute continuum of care, by following a patient throughout an episode of care and identifying the most appropriate care setting for an individual patient. The longitudinal patient record deployed in our pilot market incorporates daily patient data from our acute care partner’s system as well as our rehabilitation-specific
4
electronic clinical information system (“ACE-IT”) and Homecare Homebase
SM
and provides our care navigators the capability to assess patient condition and to develop appropriate community care plans. We also developed a 90-day post-acute readmission prediction model that is being piloted in one market in conjunction with our community care management platform. Additionally, we deployed in all of our hospitals ReAct, a program that uses predictive modeling and an extensive proprietary database of our IRF patients in an effort to identify patients at risk for acute care transfer and to implement intervention strategies in the plans of care.
|
•
|
Financial Resources
. We have a proven track record of generating strong cash flows from operations that have allowed us to successfully pursue our growth strategy, reduce our financial leverage, and make significant shareholder distributions. As of
December 31, 2018
, we have a strong, well-capitalized balance sheet, including ownership of approximately 70% of our hospital real estate, no significant debt maturities prior to 2022, and ample availability under our revolving credit facility, which along with the cash flows generated from operations should, we believe, provide sufficient support for our business strategy.
|
|
•
|
Advanced Technology
. We are focused on developing technology-enabled real-time strategies for the next generation of integrated healthcare. Our digital health strategy is based on leveraging our clinical expertise, our exceptionally large post-acute datasets, and our proven capabilities in enterprise-level electronic medical record technologies, data analytics, data integration, and predictive analytics to drive value-based performance across the healthcare continuum for our patients, our partners, and our payors. We have devoted substantial effort and expertise to leveraging technology to improve patient care and operating efficiencies. We have developed and implemented information technology, such as ACE-IT and our internally developed management reporting system described above (“BEACON”), which we then leverage to enhance our clinical and business processes. ACE-IT allows us to interface with the clinical information systems of acute care hospitals to facilitate patient transfers, reduce readmissions, and enhance patient outcomes. We believe also ACE-IT will improve patient care and safety, streamline operating efficiencies, and enhance staff recruitment and retention, making it a key competitive differentiator. BEACON gives us the ability to build from disparate data sources clinical and business dashboards that contribute to our ability to make data driven decisions in the day-to-day operation of our business and clinical care of our patients. For example, we have a physician dashboard that helps us implement our quality, patient satisfaction, opioid dispensing and other initiatives at the individual physician and patient level.
|
Members of our home health management team also internally developed Homecare Homebase
SM
, an industry-leading, comprehensive information platform designed to manage the entire patient work flow and allow home health providers to process clinical, compliance, financial, and marketing information as well as analyze data and trends for management purposes using custom reports on a timely basis. Our knowledge of Homecare Homebase, of which we are now a licensee, as well as the thorough integration of it into the operating culture allow us to optimize the system’s capability to drive superior clinical, operational, and financial outcomes. Additionally, we offer a number of evidence-based home health specialty programs, including post-operative care, fall prevention, chronic disease management and transitional care.
We believe our information systems allow us to collect, analyze, and share information on a timely basis making us an ideal partner for other healthcare providers in a coordinated care delivery environment. Systems such as ACE-IT and Homecare Homebase allow for interoperability with referral sources and other providers coordinating care. Homecare Homebase also allows us to share valuable data with payors to promote better patient outcomes on a more cost-effective basis. Additionally, we will continue to design and implement information systems to improve our clinical care, including clinical decision support tools and home health care plan optimization tools.
Patients and Demographic Trends
Demographic trends, such as population aging, should increase long-term demand for the services we provide. While we treat patients of all ages, most of our patients are 65 and older, and the number of Medicare enrollees is expected to grow approximately 3% per year for the foreseeable future. We believe the demand for the services we provide will continue to increase as the U.S. population ages. We believe these factors align with our strengths in, and focus on, post-acute services. In addition, we believe we can address the demand for facility-based and home-based post-acute care services in markets where we currently do not have a presence by constructing or acquiring new hospitals and by acquiring or opening home health and hospice agencies in those extremely fragmented industries.
5
Strategic Priorities
In
2018
, we focused on the following strategic priorities:
|
•
|
providing high-quality, cost-effective care to patients in our existing markets;
|
|
•
|
achieving organic growth at our existing inpatient rehabilitation hospitals, home health agencies, and hospice agencies;
|
|
•
|
expanding our services to more patients who require these services by constructing and acquiring hospitals in new markets and acquiring and opening home health and hospice agencies in new markets;
|
|
•
|
making shareholder distributions via common stock dividends and repurchases of our common stock; and
|
|
•
|
positioning the Company for success in the evolving healthcare delivery system.
|
Total hospital discharges grew
4.6%
from
2017
to
2018
. Our same-store discharges grew
2.8%
during
2018
compared to
2017
. Our home health agencies experienced same-store admissions growth of
5.6%
in
2018
as well. We entered new inpatient rehabilitation markets and enhanced our geographic coverage in existing markets in
2018
by adding 4 new hospitals, including 2 joint ventures, with 169 licensed beds to our portfolio. We also expanded existing hospitals by 26 licensed beds. Likewise, we added 23 home health locations and 22 hospice locations.
In
2018
, we further positioned ourselves for the healthcare industry’s movement to integrated delivery payment models, value-based purchasing, and post-acute site neutrality. We recently completed our company-wide rebranding and name change initiative to reflect and reinforce our expanding national footprint and our strategy to deliver high-quality, cost-effective care across the post-acute continuum. We increased the clinical collaboration rate between our inpatient rehabilitation hospitals and home health locations. We developed and piloted a longitudinal patient record to manage patients across the post-acute continuum and a 90-day post-acute readmission prediction model. We began using patient care navigators to follow a patient throughout an episode of care. We also refined and expanded use of clinical data analytics to further improve patient outcomes and lower cost of care.
Many of our quality and outcome measures remained above both inpatient rehabilitation and home health industry averages. Not only did we treat more patients and enhance outcomes, we did so in a cost-effective manner. For additional discussion of the pursuit of our
2018
strategic priorities, including operating results, growth, and shareholder distributions, as well as our
2019
priorities and business outlook, see Item 7,
Management’s Discussion and Analysis of Financial Condition and Results of Operations
, “Executive Overview,” “Results of Operations,” and “Liquidity and Capital Resources.”
Employees
As of
December 31, 2018
, we employed approximately
30,060
individuals, of whom approximately
18,280
were full-time employees, in our inpatient rehabilitation business and approximately
10,270
individuals, of whom approximately
7,490
were full-time employees, in our home health and hospice business. We are subject to various state and federal laws that regulate wages, hours, benefits, and other terms and conditions relating to employment. Except for approximately 63 employees at one hospital (approximately 16% of that hospital’s workforce), none of our employees are represented by a labor union as of
December 31, 2018
. As with most healthcare providers, our labor costs are rising faster than the general inflation rate. In some markets, the lack of availability of medical personnel is a significant operating issue facing healthcare providers. To address this challenge, we will continue to focus on maintaining the competitiveness of our compensation and benefit programs and improving our recruitment, retention, and productivity. Shortages of nurses and other medical personnel, including therapists, may, from time to time, require us to increase use of more expensive temporary personnel, which we refer to as “contract labor,” and other types of premium pay programs.
Competition
Inpatient Rehabilitation
. The inpatient rehabilitation industry, outside of our leading position, is highly fragmented. Our inpatient rehabilitation hospitals compete primarily with rehabilitation units, most of which are within acute care hospitals, in the markets we serve. For a list of our markets by state, see the table in Item 2,
Properties.
There are several privately held companies that compete with us primarily in select geographic markets. In addition, there is a public company that is primarily focused on other post-acute care services but also operates approximately 26 inpatient rehabilitation hospitals. Other providers of post-acute care services may attempt to compete. For example, nursing homes may market themselves as offering certain rehabilitation services even though those nursing homes are not required to offer the same level of care, and are not licensed, as hospitals. Also, acute care hospitals, including those owned or operated by large public companies or not-for-profits that have
6
dominant positions in specific markets, may choose to expand their post-acute rehabilitation services. The primary competitive factors in any given market include the quality of care and service provided, the relationship and reputation with managed care and other private payors and the acute care hospitals in the market, and the regulatory barriers to entry in certificate of need states. The ability to work as part of an integrated delivery payment model with other providers, including the ability to deliver quality patient outcomes and cost-effective care, is likely to become an increasingly important factor in competition. See the “Regulation—Relationships with Physicians and Other Providers” and “Regulation—Certificates of Need” sections below for further discussion of some of these factors.
Home Health and Hospice
. The home health and hospice services industries are also highly competitive and fragmented. There are more than 11,800 home health agencies and approximately 4,500 hospice agencies nationwide certified to participate in Medicare. We are the fourth largest provider of Medicare-certified skilled home health services in the United States. For a list of our home health markets by state, see the table in Item 2,
Properties.
Our primary competition comes from locally owned private home health companies or acute care hospitals with adjunct home health services and typically varies from market to market. Providers of home health and hospice services include both not-for-profit and for-profit organizations. There are five public companies, including us, with significant presences in the Medicare-certified home health industry. There are also two large insurance companies with affiliated home health businesses, one of which is one of the largest providers of Medicare-certified skilled home health services. The primary competitive factors in any given market include the quality of care and service provided, the treatment outcomes achieved, the relationship and reputation with managed care and other private payors and the acute care hospitals, physicians, or other referral sources in the market, and the regulatory barriers to entry in certificate of need states. The ability to work as part of an integrated care delivery model with other providers is likely to become an increasingly important factor in competition. For example, we are currently the preferred home health provider in two ACOs serving approximately 24,000 patients. Home health providers with scale, which include the other public companies and insurance companies, may have competitive advantages, including professional management, efficient operations, sophisticated information systems, brand recognition, and large referral bases.
Regulatory and Reimbursement Challenges
Healthcare is a highly regulated industry facing many well-publicized regulatory and reimbursement challenges. The industry also is facing uncertainty associated with the efforts to identify and implement workable coordinated care and integrated delivery payment models as well as post-acute site neutrality in Medicare reimbursement. The Medicare reimbursement systems for both inpatient rehabilitation and home health are subject to potentially significant changes in the next two years. The future of many aspects of healthcare regulation remains uncertain. Any regulatory or legislative changes impacting the healthcare industry ultimately may affect, among other things, reimbursement of healthcare providers, consumers’ access to coverage of health services, including among non-Medicare aged population segments within commercial insurance markets and Medicaid enrollees, and competition among providers. Changes may also affect the delivery of healthcare services to patients by providers and the regulatory compliance obligations associated with those services.
Successful healthcare providers are those able to adapt to changes in the regulatory and operating environments, build strategic relationships across the healthcare continuum, and consistently provide high-quality, cost-effective care. We believe we have the necessary capabilities — change agility, strategic relationships, quality of patient outcomes, cost effectiveness, and ability to capitalize on growth opportunities — to adapt to and succeed in a dynamic, highly regulated industry, and we have a proven track record of doing so. For more in-depth discussion of the primary challenges and risks related to our business, particularly the changes in Medicare reimbursement (including the impact of alternative payment models, value-based purchasing initiatives and site neutrality), increased federal compliance and enforcement burdens, and changes to our operating environment resulting from healthcare reform, see “Sources of Revenues—Medicare Reimbursement” and “Regulation” below in this section as well as Item 1A,
Risk Factors,
and Item 7,
Management’s Discussion and Analysis of Financial Condition and Results of Operations
, “Executive Overview—Key Challenges.”
Sources of Revenues
We receive payment for patient care services from the federal government (primarily under the Medicare program), managed care plans and private insurers, and, to a considerably lesser degree, state governments (under their respective Medicaid or similar programs) and directly from patients. Revenues and receivables from Medicare are significant to our operations. The federal and state governments establish payment rates as described in more detail below. We negotiate the payment rates with non-governmental group purchasers of healthcare services that are included in “Managed care” in the tables below, including private insurance companies, employers, health maintenance organizations (“HMOs”), preferred provider organizations (“PPOs”), and other managed care plans. Patients are generally not responsible for the difference between established gross charges and amounts reimbursed for such services under Medicare, Medicaid, and other private insurance plans, HMOs, or PPOs but are responsible to the extent of any exclusions, deductibles, copayments, or coinsurance features of
7
their coverage. Medicare, through its Medicare Advantage program, offers Medicare-eligible individuals an opportunity to participate in managed care plans. Revenues from Medicare and Medicare Advantage represent approximately
85%
of total revenues.
The following tables identify the sources and relative mix of our revenues for the periods stated for each of our business segments:
|
Inpatient Rehabilitation
|
||||||||
|
|
For the Year Ended December 31,
|
|||||||
|
|
2018
|
2017
|
2016
|
|||||
|
Medicare
|
73.2
|
%
|
73.6
|
%
|
73.7
|
%
|
||
|
Medicare Advantage
|
9.2
|
%
|
8.3
|
%
|
7.7
|
%
|
||
|
Managed care
|
10.3
|
%
|
10.7
|
%
|
11.0
|
%
|
||
|
Medicaid
|
3.0
|
%
|
3.0
|
%
|
2.9
|
%
|
||
|
Other third-party payors
|
1.5
|
%
|
1.6
|
%
|
1.7
|
%
|
||
|
Workers' compensation
|
0.8
|
%
|
0.9
|
%
|
1.0
|
%
|
||
|
Patients
|
0.6
|
%
|
0.6
|
%
|
0.6
|
%
|
||
|
Other income
|
1.4
|
%
|
1.3
|
%
|
1.4
|
%
|
||
|
Total
|
100.0
|
%
|
100.0
|
%
|
100.0
|
%
|
||
|
Home Health and Hospice
|
||||||||
|
|
For the Year Ended December 31,
|
|||||||
|
|
2018
|
2017
|
2016
|
|||||
|
Medicare
|
85.3
|
%
|
85.7
|
%
|
83.4
|
%
|
||
|
Medicare Advantage
|
9.5
|
%
|
9.7
|
%
|
8.7
|
%
|
||
|
Managed care
|
3.6
|
%
|
3.8
|
%
|
3.9
|
%
|
||
|
Medicaid
|
1.2
|
%
|
0.6
|
%
|
3.8
|
%
|
||
|
Other third-party payors
|
—
|
%
|
—
|
%
|
—
|
%
|
||
|
Workers' compensation
|
0.2
|
%
|
—
|
%
|
—
|
%
|
||
|
Patients
|
0.1
|
%
|
0.1
|
%
|
0.1
|
%
|
||
|
Other income
|
0.1
|
%
|
0.1
|
%
|
0.1
|
%
|
||
|
Total
|
100.0
|
%
|
100.0
|
%
|
100.0
|
%
|
||
Medicare Reimbursement
Medicare is a federal program that provides certain hospital and medical insurance benefits to persons aged 65 and over, some disabled persons, and persons with end-stage renal disease. Medicare, through statutes and regulations, establishes reimbursement methodologies and rates for various types of healthcare providers, facilities, and services. Each year, the Medicare Payment Advisory Commission (“MedPAC”), an independent agency that advises the United States Congress on issues affecting Medicare, makes payment policy recommendations to Congress for a variety of Medicare payment systems including, among others, the inpatient rehabilitation facility prospective payment system (the “IRF-PPS”), the home health prospective payment system (“HH-PPS”), and the hospice prospective payment system (the “Hospice-PPS”). Congress is not obligated to adopt MedPAC recommendations, and, based on outcomes in previous years, there can be no assurance Congress will adopt MedPAC’s recommendations in a given year. However, MedPAC’s recommendations have, and could in the future, become the basis for subsequent legislative or, as discussed below, regulatory action.
The Medicare statutes are subject to change from time to time. For example, in March 2010, President Obama signed the Patient Protection and Affordable Care Act (as subsequently amended, the “2010 Healthcare Reform Laws”). In December 2018, a federal district court in Texas invalidated the 2010 Healthcare Reform Laws in their entirety but postponed enforcement of that decision pending appeal. With respect to Medicare reimbursement, the 2010 Healthcare Reform Laws provided for specific reductions to healthcare providers’ annual market basket updates. In August 2011, President Obama signed into law the Budget Control Act of 2011 providing for an automatic 2% reduction, or “sequestration,” of Medicare program payments for all
8
healthcare providers. Sequestration took effect April 1, 2013 and will continue through 2027 unless Congress and the President take further action. The future of the 2010 Healthcare Reform Laws as well as the nature and substance of any replacement reform legislation enacted remain uncertain. On February 9, 2018, President Trump signed into law the Bipartisan Budget Act of 2018 (the “2018 Budget Act”), which includes several provisions affecting Medicare reimbursement. Among those changes, the 2018 Budget Act mandates the adoption of a new Medicare payment model for home health providers to be effective in 2020. In the future, concerns about the federal deficit and national debt levels could result in enactment of further federal spending reductions, further entitlement reform legislation affecting the Medicare program, or both.
From time to time, Medicare regulations, including reimbursement methodologies and rates, can be further modified by CMS. CMS, subject to its statutory authority, may make some prospective payment system changes, including in response to MedPAC recommendations. For example, CMS recently instituted a rebasing adjustment in the HH-PPS consistent with a MedPAC recommendation. In some instances, CMS’s modifications can have a substantial impact on healthcare providers. In accordance with Medicare laws and statutes, CMS makes annual adjustments to Medicare payment rates in prospective payment systems, including the IRF-PPS and HH-PPS, by what is commonly known as a “market basket update.” CMS may take other regulatory action affecting rates as well. For example, under the 2010 Healthcare Reform Laws, CMS requires IRFs to submit data on certain quality of care measures for the IRF Quality Reporting Program. A facility’s failure to submit the required quality data results in a two percentage point reduction to that facility’s annual market basket increase factor for payments made for discharges in a subsequent Medicare fiscal year. IRFs began submitting quality data to CMS in October 2012. All of our inpatient rehabilitation hospitals have met the reporting deadlines to date resulting in no corresponding reimbursement reductions. Similarly, home health and hospice agencies are also required to submit quality data to CMS each year, and the failure to do so in accordance with the rules will result in a two percentage point reduction in their market basket update. For 2019, we expect no more than six of our home health and hospice agencies will incur a reduction in their reimbursement rates.
We cannot predict the adjustments to Medicare payment rates Congress or CMS may make in the future. Congress, MedPAC, and CMS will continue to address reimbursement rates for a variety of healthcare settings. Any additional downward adjustment to rates or limitations on reimbursement for the types of facilities we operate and services we provide could have a material adverse effect on our business, financial position, results of operations, and cash flows. For additional discussion of the risks associated with our concentration of revenues from the federal government or with potential changes to the statutes or regulations governing Medicare reimbursement, including the 2018 Budget Act, see Item 1A,
Risk Factors,
and Item 7,
Management’s Discussion and Analysis of Financial Condition and Results of Operations
, “Executive Overview—Key Challenges.”
Although reductions or changes in reimbursement from governmental or third-party payors and regulatory changes affecting our business represent one of the most significant challenges to our business, our operations are also affected by other rules and regulations that indirectly affect reimbursement for our services, such as data coding rules and patient coverage rules and determinations. For example, Medicare providers like us can be negatively affected by the adoption of coverage policies, either at the national or local level, that determine whether an item or service is covered and under what clinical circumstances it is considered to be reasonable and necessary. Current CMS coverage rules require inpatient rehabilitation services to be ordered by a physician and be coordinated by an interdisciplinary team. The interdisciplinary team must meet weekly to review patient status and make any needed adjustments to the individualized plan of care. Qualified personnel must provide the rehabilitation nursing, physical therapy, occupational therapy, speech-language pathology, social services, psychological services, and prosthetic and orthotic services that may be needed. Medicare contractors processing claims for CMS make coverage determinations regarding medical necessity that can represent more restrictive interpretations of the CMS coverage rules. We cannot predict how future CMS coverage rule interpretations or any new local coverage determinations will affect us.
In the ordinary course, Medicare reimbursement claims made by healthcare providers, including inpatient rehabilitation hospitals as well as home health and hospice agencies, are subject to audit from time to time by governmental payors and their agents, such as the Medicare Administrative Contractors (“MACs”) that act as fiscal intermediaries for all Medicare billings, as well as the United States Department of Health and Human Services Office of Inspector General (the “HHS-OIG”), CMS, and state Medicaid programs. In addition to those audits conducted by existing MACs, CMS has developed and instituted various Medicare audit programs under which CMS contracts with private companies to conduct claims and medical record audits. Some contractors are paid a percentage of the overpayments recovered. The Recovery Audit Contractors (“RACs”) conduct payment reviews of claims, which can include coding errors, overall billing accuracy, and medical necessity reviews. When conducting an audit, the RACs receive claims data directly from MACs on a monthly or quarterly basis.
CMS has also established contractors known as the Zone Program Integrity Contractors (“ZPICs”) to conduct audits with a focus on potential fraud and abuse issues. Like the RACs, the ZPICs conduct audits and have the ability to refer matters to the HHS-OIG or the United States Department of Justice. Unlike RACs, however, ZPICs do not receive a specific financial
9
incentive based on the amount of the error. CMS has announced its intention to rename ZPICs as Unified Program Integrity Contractors.
As a matter of course, we undertake significant efforts through training, education, and documentation to ensure compliance with coding and medical necessity coverage rules. Despite our belief that our coding and assessment of patients are accurate, audits may lead to assertions that we have been underpaid or overpaid by Medicare or submitted improper claims in some instances, require us to incur additional costs to respond to requests for records and defend the validity of payments and claims, and ultimately require us to refund any amounts determined to have been overpaid. We cannot predict when or how these audit programs will affect us. Any denial of a claim for payment, either as a result of an audit or ordinary course payment review by the MAC, is subject to an appeals process that is currently taking numerous years to complete. For additional discussion of these audits and the risks associated with them, see Item 1A,
Risk Factors
, and Item 7,
Management’s Discussion and Analysis of Financial Condition and Results of Operations
, “Executive Overview—Key Challenges.”
A basic summary of current Medicare reimbursement in our business segments follows:
Inpatient Rehabilitation
. As discussed above, our inpatient rehabilitation hospitals receive a fixed payment reimbursement amount per discharge under IRF-PPS based on the patient’s rehabilitation impairment category established by the United States Department of Health and Human Services (“HHS”) and other characteristics and conditions identified by the attending clinicians. In order to qualify for reimbursement under IRF-PPS, our hospitals must comply with various Medicare rules and regulations including documentation and coverage requirements, or specifications as to what conditions must be met to qualify for reimbursement. These requirements relate to, among other things, pre-admission screening, post-admission evaluations, and individual treatment planning that all delineate the role of physicians in ordering and overseeing patient care. For example, a physician must admit each patient and in doing so determine that the patient’s IRF treatment is reasonable and necessary. In addition, to qualify as an IRF under Medicare rules, a facility must be primarily focused on treating patients with one of 13 specified medical conditions that typically require intensive therapy and supervision, such as stroke, brain injury, hip fracture, certain neurological conditions, and spinal cord injury. Specifically, at least 60% of a facility’s patients must suffer from at least one of these 13 conditions, which requirement is known as the “60% Rule.” Also, each patient admitted to an IRF must be able to tolerate a minimum of three hours of therapy per day and must have a registered nurse available 24 hours, each day of the week.
Under IRF-PPS, CMS is required to adjust the payment rates based on an IRF-specific market basket index. The annual market basket update is designed to reflect changes over time in the prices of a mix of goods and services used by IRFs. In setting annual market basket updates, CMS uses data furnished by the Bureau of Labor Statistics for price proxy purposes, primarily in three categories: Producer Price Indexes, Consumer Price Indexes, and Employment Cost Indexes. With IRF-PPS, our inpatient rehabilitation hospitals retain the difference, if any, between the fixed payment from Medicare and their operating costs. Thus, our hospitals benefit from being cost-effective providers.
On July 31, 2017, CMS released its notice of final rulemaking for the fiscal year 2018 IRF-PPS (the “2018 IRF Rule”). In accordance with the Medicare Access and CHIP (Children’s Health Insurance Program) Reauthorization Act of 2015 (“MACRA”), the 2018 Final IRF Rule implemented a net 1.0% market basket increase effective for discharges between October 1, 2017 and September 30, 2018. The 2018 IRF Rule also included other changes that impacted our hospital-by-hospital base rate for Medicare reimbursement. Such changes included, but were not limited to, revisions to the wage index values, changes to case mix-group relative weights and average length of stay values, and updates to the outlier fixed loss threshold.
On July 31, 2018, CMS released its notice of final rulemaking for fiscal year 2019 IRF-PPS (the “2019 IRF Rule”). The 2019 Final IRF Rule implements a 2.9% market basket update that was reduced by 75 basis points under the requirements of the 2010 Healthcare Reform Laws. The 2010 Healthcare Reform Laws also require the market basket update to be reduced by a productivity adjustment on an annual basis. The productivity adjustments equal the trailing 10-year average of changes in annual economy-wide private nonfarm business multi-factor productivity. The productivity adjustment effective October 1, 2018 decreased the market basket update by 80 basis points.
The 2019 IRF Rule also includes the other hospital-by-hospital pricing changes noted above. Based on our analysis that utilizes, among other things, the acuity of our patients over the 12-month period prior to the 2019 IRF Rule’s release and incorporates other adjustments included in it, we believe the 2019 IRF Rule will result in a net increase to our Medicare payment rates of approximately 1.2% effective October 1, 2018. Additionally, the 2019 IRF Rule finalized a change to the IRF-PPS, effective October 1, 2019, that replaces the FIM™ assessment instrument with new patient assessment measures, commonly referred to as “CARE Tool” measures. This change in how patients are assessed and reported to CMS will require substantial changes to the case mix-group relative weights and average length of stay values, which will in turn impact reimbursement amounts. We and the IRF industry are still assessing the nature and magnitude of any impact this might have on
10
aggregate Medicare reimbursements, which impact will depend in part on additional data and updates to be included in future rulemaking by CMS. We will continue to educate and train our staff on the use of the CARE Tool, including the new documentation requirements.
Unlike our inpatient services, our outpatient services are primarily reimbursed under the physician fee schedule of Medicare Part B. On November 1, 2018, CMS released its final notice of rulemaking for the payment policies under the physician fee schedule and other revisions to Part B for calendar year 2019. The provisions of this rule, including the updates to the fee schedule, are not expected to be material to us.
Home Health
. Medicare pays home health benefits for patients discharged from a hospital or patients otherwise suffering from chronic conditions that require ongoing but intermittent skilled care. As a condition of participation under Medicare, patients must be homebound (meaning unable to leave their home without a considerable and taxing effort), require intermittent skilled nursing, physical therapy or speech therapy services, or have a continuing need for occupational therapy, and receive treatment under a plan of care established and periodically reviewed by a physician. A physician must document that he or she or a qualifying nurse practitioner has had a face-to-face encounter with the patient and then certify to CMS that a patient meets the eligibility requirements for the home health benefit. Medicare currently pays home health providers under the HH-PPS for each 60-day period of care for each patient. Payments are adjusted based on each patient’s condition and clinical treatment, including the number of therapy visits. This is referred to as the case-mix adjustment. In addition to the case-mix adjustment, payments for periods of care may be adjusted for other reasons, including unusually large (outlier) costs, low-utilization patients (such as those requiring four or fewer visits), and geographic differences in wages. Payments are also made for non-routine medical supplies that are used in treatment. Home health providers typically receive either 50% or 60% of the estimated base payment for the full 60 days for each patient upon submission of the initial claim at the beginning of the episode of care. The estimate is based on the patient’s condition and treatment needs. The provider receives the remaining portion of the payment after the 60-day treatment period, subject to any applicable adjustments. If a patient remains eligible for care after that period, a new 60-day treatment period may begin. There are currently no limits to the number of home health treatment periods an eligible Medicare patient may receive. As discussed below, several changes to the HH-PPS will take place in calendar year 2020.
On November 1, 2017, CMS released its notice of final rulemaking for calendar year 2018 for home health agencies under the HH-PPS (the “2018 HH Rule”). This rule was effective for Medicare episodes ending in calendar year 2018 and provided for a net market basket update of 1.0% as required by MACRA. That update was substantially offset by a nominal case-mix coding intensity reduction of 90 basis points. The 2018 HH Rule also included other pricing changes, such as a reduction to the case-mix weights for certain cases, that impacted our Medicare reimbursement.
On October 31, 2018, CMS released its notice of final rulemaking for calendar year 2019 for home health agencies under the HH-PPS (the “2019 HH Rule”). CMS estimated the rule would increase Medicare payments to home health agencies by 2.2% in 2019. Specifically, the 2019 HH Rule provides for a market basket update of 3.0%, partially offset by a productivity adjustment reduction of 80 basis points and a change in the rural add-on program estimated to result in a reduction of 10 basis points but increased by an estimated 10 basis points associated with a change in outlier patient reimbursement. The 2019 HH Rule also includes other pricing changes, such as a reduction to the case-mix weights for certain cases, that impact our Medicare reimbursement. Based on our analysis, we believe the 2019 HH Rule will result in a net increase to our Medicare home health payment rates of approximately 1.5% effective for episodes ending in calendar year 2019.
Additionally, pursuant to the requirements of the 2018 Budget Act, the 2019 HH Rule sets out significant changes to the HH-PPS that will be adopted effective for calendar year 2020. The new payment system, referred to as the Patient-Driven Groupings Model (“PDGM”), replaces the current 60-day episode of payment methodology with a 30-day unit of service for home health payment purposes and eliminates therapy usage as a factor in adjusting case-mix weighting. CMS previously proposed but has not yet adopted a 6.4% reduction in the base payment rate for 2020 intended to offset the provider behavioral changes that CMS assumes PDGM will drive. For additional discussion of PDGM, the proposed rate cut, and other regulatory and legislative initiatives that could impact our home health business, see Item 1A,
Risk Factors
, and Item 7,
Management’s Discussion and Analysis of Financial Condition and Results of Operations
, “Executive Overview—Key Challenges.”
Hospice
. Medicare pays hospice benefits for patients with life expectancies of six months or less, as documented by the patient’s physician(s). Under Medicare rules, patients seeking hospice benefits must agree to forgo curative treatment for their terminal medical conditions. For each day a patient elects hospice benefits, Medicare pays an adjusted daily rate based on patient location, and payments represent a prospective per diem amount tied to one of four different categories or levels of care: routine home care, continuous home care, inpatient respite care, and general inpatient care. Medicare hospice reimbursements to each provider are also subject to two annual caps, one limiting total hospice payments based on the average annual payment per beneficiary and another limiting payments based on the number of days of inpatient care billed by the hospice provider.
11
There are currently no limits to the number of hospice benefit periods an eligible Medicare patient may receive, and a patient may revoke the benefit at any time.
On August 1, 2018, CMS released its notice of final rulemaking for fiscal year 2019 for hospice agencies under the hospice-PPS (the “2019 Hospice Rule”). The final rule impacts hospice payments between October 1, 2019 and September 30, 2019. The 2019 Hospice Rule provides for a net market basket update of 1.8%, and we believe that update is indicative of the change we will see in our Medicare hospice payment rates through September 30, 2019.
For additional discussion of matters and risks related to reimbursement, see Item 1A,
Risk Factors
.
Managed Care and Other Discount Plans
We negotiate payment rates with certain large group purchasers of healthcare services, including Medicare Advantage, managed care plans, private insurance companies, and third-party administrators. Managed care contracts typically have terms between one and three years, although we have a number of managed care contracts that automatically renew each year (with pre-defined rate increases) unless a party elects to terminate the contract. In
2018
, typical rate increases for our inpatient rehabilitation contracts ranged from 2-4% and for our home health and hospice contracts ranged from 0-2%. We cannot provide any assurance we will continue to receive increases in the future. Our managed care staff focuses on establishing and re-negotiating contracts that provide equitable reimbursement for the services provided.
Medicaid Reimbursement
Medicaid is a jointly administered and funded federal and state program that provides hospital and medical benefits to qualifying individuals who are deemed unable to afford healthcare. As the Medicaid program is administered by the individual states under the oversight of CMS in accordance with certain regulatory and statutory guidelines, there are substantial differences in reimbursement methodologies and coverage policies from state to state. Many states have experienced shortfalls in their Medicaid budgets and are implementing significant cuts in Medicaid reimbursement rates. Additionally, certain states control Medicaid expenditures through restricting or eliminating coverage of some services. Continuing downward pressure on Medicaid payment rates could cause a decline in that portion of our
Net operating revenues
. However, for the year ended
December 31, 2018
, Medicaid payments represented only
2.6%
of our consolidated
Net operating revenues
. In certain states in which we operate, we are experiencing an increase in Medicaid patients, partially the result of expanded coverage consistent with the intent of the 2010 Healthcare Reform Laws. For additional discussion, see Item 1A,
Risk Factors
, “Changes in our payor mix or the acuity of our patients could adversely impact our revenues or our profitability.”
Cost Reports
Because of our participation in Medicare and Medicaid, we are required to meet certain financial reporting requirements. Federal and, where applicable, state regulations require the submission of annual cost reports covering the revenue, costs, and expenses associated with the services provided by inpatient hospital, home health, and hospice providers to Medicare beneficiaries and Medicaid recipients. These annual cost reports are subject to routine audits which may result in adjustments to the amounts ultimately determined to be due to us under these reimbursement programs. These audits are used for determining if any under- or over-payments were made to these programs and to set payment levels for future years. Medicare also makes retroactive adjustments to payments for certain low-income patients after comparing subsequently published statistical data from CMS to the cost report data. We cannot predict what retroactive adjustments, if any, will be made, but we do not anticipate these adjustments will have a material impact on us.
Regulation
The healthcare industry is subject to significant federal, state, and local regulation that affects our business activities by controlling the reimbursement we receive for services provided, requiring licensure or certification of our operations, regulating our relationships with physicians and other referral sources, regulating the use of our properties, and controlling our growth. We are also subject to the broader federal and state regulations that prohibit fraud and abuse in the delivery of healthcare services. Congress and DOJ have historically focused on fraud and abuse in healthcare. Since the 1980s, a steady stream of changes have stiffened penalties or made it easier for DOJ to impose liability on companies and individuals, and the pace of these changes has only been increasing. The 2018 Budget Act continues this emphasis by increasing the criminal and civil penalties that can be imposed for violating federal health care laws. As a healthcare provider, we are subject to periodic audits, examinations and investigations conducted by, or at the direction of, government investigative and oversight agencies. Failure to comply with applicable federal and state healthcare regulations can result in a provider’s exclusion from participation in government reimbursement programs and in substantial civil and criminal penalties.
12
We undertake significant effort and expense to provide the medical, nursing, therapy, and ancillary services required to comply with local, state, and federal regulations, as well as, for most facilities, accreditation standards of The Joint Commission and, for some facilities, the Commission on Accreditation of Rehabilitation Facilities. We also maintain accreditation for our home health and hospice agencies where required and in other instances where it facilitates more efficient Medicare enrollment. The Community Health Accreditation Program is the most common accrediting organization for our agencies. Accredited facilities and agencies are subject to periodic resurvey to ensure the standards are being met.
We maintain a comprehensive ethics and compliance program to promote conduct and business practices that meet or exceed requirements under laws, regulations, and industry standards. The program monitors the Company’s performance on and raises awareness of various regulatory requirements among employees and emphasizes the importance of complying with governmental laws and regulations. As part of the compliance program, we provide annual compliance training to our employees, Board members, Medical Directors, vendors, and other non-employees that operate within our hospitals, and require all employees to report any violations to their supervisor or another person of authority or through a toll-free telephone hotline. Another integral part of our compliance program is a policy of non-retaliation against employees who report compliance concerns.
Licensure and Certification
Healthcare facility construction and operation are subject to numerous federal, state, and local regulations relating to, among other things, the adequacy of medical care, equipment, personnel, operating policies and procedures, acquisition and dispensing of pharmaceuticals and controlled substances, infection control, maintenance of adequate records and patient privacy, fire prevention, and compliance with building codes and environmental protection laws. Our inpatient rehabilitation hospitals are subject to periodic inspection and other reviews by governmental and non-governmental certification authorities to ensure continued compliance with the various standards necessary for facility licensure. All of our hospitals are required to be licensed.
In addition, inpatient rehabilitation hospitals must be certified by CMS to participate in the Medicare program and generally must be certified by Medicaid state agencies to participate in Medicaid programs. Certification and participation in these programs involve numerous regulatory obligations. For example, hospitals must treat at least 30 patients free-of-charge prior to certification and eligibility for Medicare reimbursement. Once certified by Medicare, hospitals undergo periodic on-site surveys and revalidations in order to maintain their certification. All of our inpatient hospitals participate in the Medicare program.
Our home health and hospice agencies are each licensed under applicable law, certified by CMS for participation in the Medicare program, and generally certified by the applicable state Medicaid agencies to participate in those programs.
Failure to comply with applicable certification requirements may make our hospitals and agencies, as the case may be, ineligible for Medicare or Medicaid reimbursement. In addition, Medicare or Medicaid may seek retroactive reimbursement from noncompliant providers or otherwise impose sanctions for noncompliance. Non-governmental payors often have the right to terminate provider contracts if the provider loses its Medicare or Medicaid certification.
The 2010 Healthcare Reform Laws added new screening requirements and associated fees for all Medicare providers. The screening of employees with patient access must include a licensure check and may include other procedures such as fingerprinting, criminal background checks, unscheduled and unannounced site visits, database checks, and other screening procedures prescribed by CMS.
We have developed operational systems to oversee compliance with the various standards and requirements of the Medicare program and have established ongoing quality assurance activities; however, given the complex nature of governmental healthcare regulations, there can be no assurance Medicare, Medicaid, or other regulatory authorities will not allege instances of noncompliance. A determination by a regulatory authority that a facility or agency is not in compliance with applicable requirements could also lead to the assessment of fines or other penalties, loss of licensure, exclusion from participation in Medicare and Medicaid, and the imposition of requirements that the offending facility or agency takes corrective action.
Certificates of Need
In some states and U.S. territories where we operate, the construction or expansion of facilities, the acquisition of existing facilities or agencies, or the introduction of new beds or inpatient, home health, and hospice services may be subject to review by and prior approval of state regulatory bodies under a “certificate of need,” or “CON,” law. As of
December 31, 2018
, approximately 52% of our licensed beds and 27% of our home health and hospice locations are in states or U.S. territories that
13
have CON laws. CON laws require a reviewing authority or agency to determine the public need for additional or expanded healthcare facilities and services. These laws also generally require approvals for capital expenditures involving inpatient rehabilitation hospitals if such capital expenditures exceed certain thresholds. In addition, CON laws in some states require us to abide by certain charity care commitments as a condition for approving a CON. Any instance where we are subject to a CON law, we must obtain it before acquiring, opening, reclassifying, or expanding a healthcare facility, starting a new healthcare program, or opening a new home health or hospice agency.
We potentially face opposition any time we initiate a project requiring a new or amended CON or seek to acquire an existing CON. This opposition may arise either from competing national or regional companies or from local hospitals, agencies, or other providers which file competing applications or oppose the proposed CON project. Opposition to our applications may delay or prevent our future addition of beds, hospitals, or agencies in given markets or increase our costs in seeking those additions. The necessity for these approvals serves as a barrier to entry and has the potential to limit competition for us (in markets where we hold a CON) and for other providers (in markets where we are seeking a CON). We have generally been successful in obtaining CONs or similar approvals, although there can be no assurance we will achieve similar success in the future, and the likelihood of success varies by locality and state.
False Claims
The federal False Claims Act (the “FCA”) prohibits the knowing presentation of a false claim to the United States government and provides for penalties equal to three times the actual amount of any overpayments plus up to $23,000 per claim. Federal civil penalties will be adjusted to account for inflation each year. In addition, the FCA allows private persons, known as “relators,” to file complaints under seal and provides a period of time for the government to investigate such complaints and determine whether to intervene in them and take over the handling of all or part of such complaints. The government and relators may also allege violations of the FCA for the knowing and improper failure to report and refund amounts owed to the government in a timely manner following identification of an overpayment. This is known as a “reverse false claim.” The government deems identification of the overpayment to occur when a person has, or should have through reasonable diligence, determined that an overpayment was received and quantified the overpayment.
Because we perform thousands of similar procedures a year for which we are reimbursed by Medicare and other federal payors and there is a relatively long statute of limitations, a billing error, cost reporting error or disagreement over physician medical judgment could result in significant civil or criminal penalties under the FCA. Many states have also adopted similar laws relating to state government payments for healthcare services. The 2010 Healthcare Reform Laws amended the FCA to expand the definition of false claim, to make it easier for the government to initiate and conduct investigations, to enhance the monetary reward to relators where prosecutions are ultimately successful, and to extend the statute of limitations on claims by the government. The federal government has become increasingly aggressive in asserting that incidents of erroneous billing or record keeping represent FCA violations and in challenging the medical judgment of independent physicians as the basis for FCA allegations. Furthermore, well-publicized enforcement actions indicate that the federal government has increasingly sought to use statistical sampling to extrapolate allegations to larger pools of claims or to infer liability without proving knowledge of falsity of individual claims. For additional discussion, see Item 1A,
Risk Factors
, and
Note 17,
Contingencies and Other Commitments
, to the accompanying consolidated financial statements.
Relationships with Physicians and Other Providers
Anti-Kickback Law
. Various state and federal laws regulate relationships between providers of healthcare services, including management or service contracts and investment relationships. Among the most important of these restrictions is a federal law prohibiting the offer, payment, solicitation, or receipt of remuneration by individuals or entities to induce referrals of patients for services reimbursed under the Medicare or Medicaid programs (the “Anti-Kickback Law”). The 2010 Healthcare Reform Laws amended the federal Anti-Kickback Law to provide that proving violations of this law does not require proving actual knowledge or specific intent to commit a violation. Another amendment made it clear that Anti-Kickback Law violations can be the basis for claims under the FCA. These changes and those described above related to the FCA, when combined with other recent federal initiatives, are likely to increase investigation and enforcement efforts in the healthcare industry generally. In addition to standard federal criminal and civil sanctions, including imprisonment and penalties of up to $100,000 for each violation plus tripled damages for improper claims, violators of the Anti-Kickback Law may be subject to exclusion from the Medicare and/or Medicaid programs. Federal civil penalties will be adjusted to account for inflation each year. In 1991, the HHS-OIG issued regulations describing compensation arrangements that are not viewed as illegal remuneration under the Anti-Kickback Law. Those regulations provide for certain safe harbors for identified types of compensation arrangements that, if fully complied with, assure participants in the particular arrangement that the HHS-OIG will not treat that participation as a criminal offense under the Anti-Kickback Law or as the basis for an exclusion from the Medicare and Medicaid programs or the imposition of civil sanctions. Failure to fall within a safe harbor does not constitute a violation of the Anti-Kickback Law, but the HHS-OIG has indicated failure to fall within a safe harbor may subject an arrangement to increased scrutiny. A violation of
14
the Anti-Kickback Law by us or one or more of our joint ventures could have a material adverse effect upon our business, financial position, results of operations, or cash flows. Even the assertion of a violation could have an adverse effect upon our stock price or reputation.
Some of our rehabilitation hospitals are owned through joint ventures with institutional healthcare providers that may be in a position to make or influence referrals to our hospitals. In addition, we have a number of relationships with physicians and other healthcare providers, including management or service contracts. Some of these investment relationships and contractual relationships may not fall within the protection offered by a safe harbor. Despite our compliance and monitoring efforts, there can be no assurance violations of the Anti-Kickback Law will not be asserted in the future, nor can there be any assurance our defense against any such assertion would be successful.
For example, we have entered into agreements to manage our hospitals that are owned by joint ventures. Most of these agreements incorporate a percentage-based management fee. Although there is a safe harbor for personal services and management contracts, this safe harbor requires, among other things, the aggregate compensation paid to the manager over the term of the agreement be set in advance. Because our management fee may be based on a percentage of revenues, the fee arrangement may not meet this requirement. However, we believe our management arrangements satisfy the other requirements of the safe harbor for personal services and management contracts and comply with the Anti-Kickback Law.
Physician Self-Referral Law
. The federal law commonly known as the “Stark law” and CMS regulations promulgated under the Stark law prohibit physicians from making referrals for “designated health services” including inpatient and outpatient hospital services, physical therapy, occupational therapy, radiology services, and home health services, to an entity in which the physician (or an immediate family member) has an investment interest or other financial relationship, subject to certain exceptions. The Stark law also prohibits those entities from filing claims or billing Medicare for those referred services. Violators of the Stark law and regulations may be subject to recoupments, civil monetary sanctions (up to $25,000 for each violation and assessments up to three times the amount claimed for each prohibited service) and exclusion from any federal, state, or other governmental healthcare programs. The statute also provides a penalty of up to $162,000 for a circumvention scheme. Federal civil penalties will be adjusted to account for inflation each year. There are statutory exceptions to the Stark law for many of the customary financial arrangements between physicians and providers, including personal services contracts and leases. However, in order to be afforded protection by a Stark law exception, the financial arrangement must comply with every requirement of the applicable exception.
Under the 2010 Healthcare Reform Laws, the exception to the Stark law that currently permits physicians to refer patients to hospitals in which they have an investment or ownership interest has been dramatically limited by providing that only physician-owned hospitals with a provider agreement in place on December 31, 2010 are exempt from the general ban on self-referral. Existing physician-owned hospitals are prohibited from increasing the physician ownership percentage in the hospital after March 23, 2010. Additionally, physician-owned hospitals are prohibited from increasing the number of licensed beds after March 23, 2010, except when certain market and regulatory approval conditions are met. Currently, we have no hospitals that would be considered physician-owned under this law.
The complexity of the Stark law and the associated regulations and their associated strict liability provisions are a challenge for healthcare providers, who do not always have the benefit of significant regulatory or judicial interpretation of these laws and regulations. We attempt to structure our relationships to meet one or more exceptions to the Stark law, but the regulations implementing the exceptions are detailed and complex. Accordingly, we cannot assure that every relationship complies fully with the Stark law.
Additionally, no assurances can be given that any agency charged with enforcement of the Stark law and regulations might not assert a violation under the Stark law, nor can there be any assurance our defense against any such assertion would be successful or that new federal or state laws governing physician relationships, or new interpretations of existing laws governing such relationships, might not adversely affect relationships we have established with physicians or result in the imposition of penalties on us. A violation of the Stark law by us could have a material adverse effect upon our business, financial position, results of operations, or cash flows. Even the assertion of a violation could have an adverse effect upon our stock price or reputation.
HIPAA
The Health Insurance Portability and Accountability Act of 1996, commonly known as “HIPAA,” broadened the scope of certain fraud and abuse laws by adding several criminal provisions for healthcare fraud offenses that apply to all health benefit programs. HIPAA also added a prohibition against incentives intended to influence decisions by Medicare or Medicaid beneficiaries as to the provider from which they will receive services. In addition, HIPAA created new enforcement mechanisms to combat fraud and abuse, including the Medicare Integrity Program, and an incentive program under which
15
individuals can receive a monetary reward for providing information on Medicare fraud and abuse that leads to the recovery of at least Medicare funds. Penalties for violations of HIPAA include civil and criminal monetary penalties. The HHS Office of Civil Rights (“HHS-OCR”) implemented a permanent HIPAA audit program for healthcare providers nationwide in 2016. As of
December 31, 2018
, we have not been selected for audit.
HIPAA and related HHS regulations contain certain administrative simplification provisions that require the use of uniform electronic data transmission standards for certain healthcare claims and payment transactions submitted or received electronically. HIPAA regulations also regulate the use and disclosure of individually identifiable health-related information, whether communicated electronically, on paper, or orally. The regulations provide patients with significant rights related to understanding and controlling how their health information is used or disclosed and require healthcare providers to implement administrative, physical, and technical practices to protect the security of individually identifiable health information that is maintained or transmitted electronically.
With the enactment of the Health Information Technology for Economic and Clinical Health (“HITECH”) Act as part of the American Recovery and Reinvestment Act of 2009, the privacy and security requirements of HIPAA have been modified and expanded. The HITECH Act applies certain of the HIPAA privacy and security requirements directly to business associates of covered entities. The modifications to existing HIPAA requirements include: expanded accounting requirements for electronic health records, tighter restrictions on marketing and fundraising, and heightened penalties and enforcement associated with noncompliance. Significantly, the HITECH Act also establishes new mandatory federal requirements for notification of breaches of security involving protected health information. HHS-OCR is responsible for enforcing the requirement that covered entities notify any individual whose protected health information has been improperly acquired, accessed, used, or disclosed. In certain cases, notice of a breach is required to be made to HHS and media outlets. The heightened penalties for noncompliance range from $100 to $50,000 per violation for most violations. In the event of violations due to willful neglect that are not corrected within 30 days, penalties start at $50,000 per violation and are not subject to a per violation statutory maximum. All penalties are subject to a $1,500,000 cap for multiple identical violations in a single calendar year. Willful neglect could include the failure to conduct a security risk assessment or adequately implement HIPAA compliance policies.
On January 17, 2013, the HHS-OCR issued a final rule, with a compliance date of September 23, 2013, to implement the HITECH Act and make other modifications to the HIPAA and HITECH regulations. This rule expanded the potential liability for a breach involving protected health information to cover some instances where a subcontractor is responsible for the breaches and that individual or entity was acting within the scope of delegated authority under the related contract or engagement. The final rule generally defines “breach” to mean the acquisition, access, use or disclosure of protected health information in a manner not permitted by the HIPAA privacy standards, which compromises the security or privacy of protected health information. Under the final rule, improper acquisition, access, use, or disclosure is presumed to be a reportable breach, unless the potentially breaching party can demonstrate a low probability that protected health information has been compromised.
In addition, there are numerous legislative and regulatory initiatives at the federal and state levels addressing patient privacy concerns. Healthcare providers will continue to remain subject to any federal or state privacy-related laws that are more restrictive than the privacy regulations issued under HIPAA. These laws vary and could impose additional penalties. HHS-OIG and other regulators have also increasingly interpreted laws and regulations in a manner as to increase exposure of healthcare providers to allegations of noncompliance. Any actual or perceived violation of privacy-related laws and regulations, including HIPAA and the HITECH Act, could have a material adverse effect on our business, financial position, results of operations, and cash flows.
Civil Monetary Penalties Law
Under the Civil Monetary Penalties Law, HHS may impose civil monetary penalties on healthcare providers that present, or cause to be presented, ineligible reimbursement claims for services. The 2018 Budget Act increased the civil monetary penalties, which vary depending on the offense from $5,000 to $100,000 per violation, plus treble damages for the amount at issue and may include exclusion from federal health care programs such as Medicare and Medicaid. The penalties will be adjusted annually to account for inflation. HHS may seek to impose monetary penalties under this law for, among other things, offering inducements to beneficiaries for program services and filing false or fraudulent claims.
Available Information
We make available through our website,
www.encompasshealth.com
, the following documents, free of charge: our annual reports (Form 10-K), our quarterly reports (Form 10-Q), our current reports (Form 8-K), and any amendments to those
16
reports promptly after we electronically file such material with, or furnish it to, the United States Securities and Exchange Commission.
17
|
Item 1A.
|
Risk Factors
|
Our business, operations, and financial position are subject to various risks. Some of these risks are described below, and the reader should take such risks into account in evaluating Encompass Health or any investment decision involving Encompass Health. This section does not describe all risks that may be applicable to us, our industry, or our business, and it is intended only as a summary of certain material risk factors. More detailed information concerning other risk factors as well as those described below is contained in other sections of this annual report.
Reductions or changes in reimbursement from government or third-party payors could adversely affect our Net operating revenues and other operating results.
We derive a substantial portion of our
Net operating revenues
from the Medicare program. See Item 1,
Business
, “Sources of Revenues,” for a table identifying the sources and relative payor mix of our revenues. In addition to many ordinary course reimbursement rate changes that the United States Department of Health and Human Services, Centers for Medicare and Medicaid Services (“CMS”), adopts each year as part of its annual rulemaking process for various healthcare provider categories, Congress and some state legislatures have periodically proposed significant changes in laws and regulations governing the healthcare system. Many of these changes have resulted in limitations on the increases in and, in some cases, significant roll-backs or reductions in the levels of payments to healthcare providers for services under many government reimbursement programs. There can be no assurance that future governmental initiatives will not result in pricing freezes or reimbursement reductions.
In March 2010, President Obama signed into law the Patient Protection and Affordable Care Act (as subsequently amended, the “2010 Healthcare Reform Laws”). Many provisions within the 2010 Healthcare Reform Laws have impacted or could in the future impact our business, including Medicare reimbursement reductions and promotion of alternative payment models, such as accountable care organizations (“ACOs”) and bundled payment initiatives. The Trump administration and the United States Congress have previously attempted, and may in the future attempt, to change or repeal provisions of the 2010 Healthcare Reform Laws through both legislative and regulatory action. For example, on December 22, 2017, President Trump signed into law the Tax Cuts and Jobs Act, which eliminated the tax penalty for individuals for failing to enroll in health insurance beginning in 2019. On January 20, 2017, President Trump issued his first executive order titled “Minimizing the Economic Burden of the Patient Protection And Affordable Care Act Pending Repeal,” that directs federal regulators to begin dismantling those laws through regulatory and policy-making processes and procedures, “to the maximum extent permitted by law.” In December 2018, a federal district court in Texas invalidated the 2010 Healthcare Reform Laws in their entirety based on the elimination of the tax penalty but postponed enforcement of that decision pending appeal. The future of the 2010 Healthcare Reform Laws as well as the nature and substance of any replacement reform legislation enacted remain uncertain. Any future changes may ultimately impact the provisions of the 2010 Healthcare Reform Laws discussed below or other laws or regulations that either currently affect, or may in the future affect, our business.
For hospital providers like us, these laws include reductions in CMS’s annual adjustments to Medicare reimbursement rates, commonly known as a “market basket update.” In accordance with Medicare laws and statutes, CMS makes market basket updates by provider type in an effort to compensate providers for rising operating costs. The 2010 Healthcare Reform Laws established reductions in the annual market basket updates for hospital providers ranging from 10 to 75 basis points. In addition, the 2010 Healthcare Reform Laws require the market basket updates for hospital providers as well as home health and hospice agencies to be reduced by a productivity adjustment on an annual basis. The productivity adjustment equals the trailing 10-year average of changes in annual economy-wide private nonfarm business multi-factor productivity. To date, the productivity adjustments have resulted in decreases to the market basket updates ranging from 30 to 100 basis points. For home health agencies, the 2010 Healthcare Reform Laws also directed CMS to improve home health payment accuracy through rebasing home health payments over four years starting in 2014. For hospice agencies, these laws required a reduction of the annual market basket update of 30 basis points for fiscal years 2017 and 2019.
Other federal legislation can also have a significant direct impact on our Medicare reimbursement. On August 2, 2011, President Obama signed into law the Budget Control Act of 2011, which provided for an automatic 2% reduction of Medicare program payments. This automatic reduction, known as “sequestration,” began affecting payments received after April 1, 2013. Each year through 2027, the reimbursement we receive from Medicare, after first taking into account all annual payment adjustments including the market basket update, will be reduced by sequestration unless it is repealed before then.
The Medicare Access and CHIP (Children’s Health Insurance Program) Reauthorization Act of 2015 (“MACRA”) eliminated the payment adjustments mandated by the 2010 Health Care Reform Laws in favor of fixing a market basket update of 1.0% in that year for inpatient rehabilitation, home health and hospice providers. The Bipartisan Budget Act of 2018 (the “2018 Budget Act”), signed into law by President Trump on February 9, 2018, includes several provisions affecting Medicare reimbursement. Among those changes, the 2018 Budget Act mandates the adoption of a new Medicare payment model for
18
home health providers to be effective in 2020 and eliminates the payment adjustments mandated by the 2010 Health Care Reform Laws in favor of fixing a market basket update of 1.5% in 2020.
Additionally, concerns held by federal policymakers about the federal deficit and national debt levels could result in enactment of further federal spending reductions, further entitlement reform legislation affecting the Medicare program, and/or further reductions to provider payments. For example, the Tax Cut and Jobs Act signed into law in December 2017 significantly reduced the federal corporate tax rate, and Congress may seek to reduce Medicare spending to offset the associated loss of tax revenue.
In October 2014, President Obama signed into law the Improving Medicare Post-Acute Care Transformation Act of 2014 (the “IMPACT Act”). The IMPACT Act was developed on a bi-partisan basis by the House Ways and Means and Senate Finance Committees and incorporated feedback from healthcare providers and provider organizations that responded to the Committees’ solicitation of post-acute payment reform ideas and proposals. It directs the United States Department of Health and Human Services (“HHS”), in consultation with healthcare stakeholders, to implement standardized data collection processes for post-acute quality and outcome measures. Although the IMPACT Act does not specifically call for the development of a new post-acute payment system, we believe this act lays the foundation for possible future post-acute payment policies that would be based on patients’ medical conditions and other clinical factors rather than the setting where the care is provided, also referred to as “site neutral” reimbursement. CMS has begun changing current post-acute payment systems to improve comparability of patient assessment data and clinical characteristics across settings, which will make it easier to create a unified payment system in the future. For example, CMS recently established a new case-mix classification model for skilled nursing facilities which relies on patient characteristics rather than the amount of therapy received to determine skilled nursing payments. Another example is CMS’s impending use of CARE Tool assessment measures for IRFs discussed below. The IMPACT Act also creates additional data reporting requirements for our hospitals and home health agencies. The precise details of these new reporting requirements, including timing and content, will be developed and implemented by CMS through the regulatory process that we expect will take place over the next several years. We cannot quantify the potential effects of the IMPACT Act on us.
Each year, the Medicare Payment Advisory Commission (“MedPAC”), an independent agency, advises Congress on issues affecting Medicare and makes payment policy recommendations to Congress for a variety of Medicare payment systems including, among others, the inpatient rehabilitation facility prospective payment system (the “IRF-PPS”), the home health prospective payment system (“HH-PPS”) and the hospice prospective payment system (“Hospice-PPS”). MedPAC also provides comments to CMS on proposed rules, including the prospective payment system rules. Congress is not obligated to adopt MedPAC recommendations, and, based on outcomes in previous years, there can be no assurance Congress will adopt MedPAC’s recommendations in a given year. However, MedPAC’s recommendations have, and could in the future, become the basis for subsequent legislative or regulatory action.
In connection with CMS’s final rulemaking for the IRF-PPS and the HH-PPS in each year since 2008, MedPAC has recommended either no updates to payments or reductions to payments. In a March 2018 report to Congress, MedPAC recommended, among other things, legislative changes to withhold market basket updates in 2018 for hospice agencies, to reduce by 5% the base payments under the HH-PPS and IRF-PPS, and to re-base payments under the HH-PPS over two years beginning in 2020. In the March 2018 report, MedPAC also reiterated an increase to the outlier payment pool to be funded by reductions to base Medicare payments rates under the IRF-PPS. This proposal would adversely affect us as we have a relatively low percentage of outlier patients compared to other inpatient rehabilitation providers.
In a June 2018 report mandated by the IMPACT Act, MedPAC reiterated its recommendation that Congress adopt a unified payment system for all post-acute care (“PAC-PPS”) in lieu of separate systems for inpatient rehabilitation facilities (“IRFs”), skilled nursing facilities, long-term acute care hospitals, and home health agencies. A PAC-PPS would rely on “site neutral” reimbursement based on patients’ medical conditions and other clinical factors rather than the care settings. MedPAC found a PAC-PPS to be feasible and desirable but also suggested many existing regulatory requirements, including the 60% rule discussed below and the requirement for a minimum of three hours of therapy per day, should be waived or modified as part of implementing a PAC-PPS. MedPAC previously estimated, although we cannot verify the methodology or the accuracy of that estimate, a PAC-PPS would result in 15% and 1% decreases to IRF and home health reimbursements, respectively. As a precursor to a unified PAC-PPS, MedPAC discussed in November 2017 a potential recommendation to change the case-mix weights in each post-acute setting for 2019 and 2020 to a blend of the current setting specific weight and the proposed unified PAC-PPS weight, which MedPAC suggested would shift money from for-profit and freestanding IRFs to non-profit & hospital-based IRFs. Additionally, MedPAC previously has suggested that Medicare should ultimately move from fee-for-service reimbursement to more integrated delivery payment models.
MedPAC also recommended significant changes to the HH-PPS, some of which CMS incorporated into the new payment system mandated by the 2018 Budget Act, referred to as the Patient-Driven Groupings Model (“PDGM”), and set out
19
in the final rule for the 2019 HH-PPS. Beginning in 2020, PDGM replaces the current 60-day episode of payment methodology with a 30-day unit of service for home health payment purposes and eliminates therapy usage as a factor in setting payments (that is, more therapy visits lead to higher reimbursement). CMS previously proposed but has not yet adopted a 6.4% reduction in the base payment rate for 2020 intended to offset the provider behavioral changes that CMS assumes PDGM will drive. Such changes could have a significant impact on home health providers. We cannot predict the final substance of any mandated regulatory actions or the impact of these significant changes to the HH-PPS on our home health agencies and their Medicare reimbursements.
With respect to significant changes to the IRF-PPS, CMS recently finalized pursuant to a requirement of the IMPACT Act a change, effective October 1, 2019, that replaces the FIM™ assessment instrument with new patient assessment measures, commonly referred to as “CARE Tool” measures. This change in how patients are assessed and reported to CMS will require substantial changes to the case mix-group relative weights and average length of stay values, which will in turn impact reimbursement amounts. We and the IRF industry are still assessing the nature and magnitude of any impact this might have on aggregate Medicare reimbursements, which impact will depend in part on additional data and updates to be included in future rulemaking by CMS. We will continue to educate and train our staff on the use of the CARE Tool, including the new documentation requirements.
Further, we cannot predict what alternative or additional deficit reduction initiatives, Medicare payment reductions, or post-acute care reforms, if any, will ultimately be adopted or enacted into law, or the timing or effect of any initiatives or reductions. Those initiatives or reductions would be in addition to many ordinary course reimbursement rate changes that CMS adopts each year as part of the market basket update rulemaking process for various provider categories. While we do not expect the drive toward integrated delivery payment models, value-based purchasing, and post-acute site neutrality in Medicare reimbursement to subside, there are well publicized efforts to repeal, or alter implementation of, various provisions of the 2010 Healthcare Reform Laws and substitute yet to be determined healthcare reforms. We cannot predict the nature or timing of any changes to the 2010 Healthcare Reform Laws or other laws or regulations that either currently affect, or may in the future affect, our business.
There can be no assurance future governmental action will not result in substantial changes to, or material reductions in, our reimbursements. Similarly, we may experience material increases in our operating costs. For example, in 2019, we expect our wage and benefit costs to increase at a rate in excess of our aggregate Medicare reimbursement rate increase. In any given year, the net effect of statutory and regulatory changes may result in a decrease in our reimbursement rate, and that decrease may occur at a time when our expenses are increasing. As a result, there could be a material adverse effect on our business, financial position, results of operations, and cash flows. For additional discussion of how we are reimbursed by Medicare, see Item 1,
Business
, “Regulatory and Reimbursement Challenges” and “Sources of Revenues—Medicare Reimbursement.”
In addition, there are increasing pressures, including as a result of the 2010 Healthcare Reform Laws, from many third-party payors to control healthcare costs and to reduce or limit increases in reimbursement rates for medical services. Our relationships with managed care and nongovernmental third-party payors, such as health maintenance organizations and preferred provider organizations, are generally governed by negotiated agreements. These agreements set forth the amounts we are entitled to receive for our services. Our
Net operating revenue
s and our ability to grow our business with these payors could be adversely affected if we are unable to negotiate and maintain favorable agreements with third-party payors.
The ongoing evolution of the healthcare delivery system, including alternative payment models and value-based purchasing initiatives, in the United States may significantly affect our business and results of operations.
The healthcare industry in general is facing uncertainty associated with the efforts, primarily arising from initiatives such as payment bundling and ACOs included in the 2010 Healthcare Reform Laws, to identify and implement workable coordinated care and integrated delivery payment models. In an integrated delivery payment model, hospitals, physicians, and other care providers are reimbursed in a fashion meant to encourage coordinated healthcare on a more efficient, patient-centered basis. These providers are then paid based on the overall value and quality (as determined by outcomes) of the services they provide to a patient rather than the number of services they provide. While this is consistent with our goal and proven track record of being a high-quality, cost-effective provider, broad-based implementation of a new delivery payment model would represent a significant evolution or transformation of the healthcare industry, which may have a significant impact on our business and results of operations.
In recent years, HHS has been studying the feasibility of bundling, including conducting a voluntary, multi-year bundling pilot program to test and evaluate alternative payment methodologies. As of December 31, 2017, eight of our inpatient rehabilitation hospitals participated in the “at-risk” phase of Model 3, the post-acute only model, of CMS’ voluntary Bundled Payments for Care Improvement (“BPCI”) initiative and our home health agencies participated in 128 “at-risk” bundled
20
payment arrangements. In the “at-risk” phase, providers take on financial risk associated with an episode of care. Accordingly, reimbursement may be increased or decreased, compared to what would otherwise be due, based on whether the total Medicare expenditures and patient outcomes meet, exceed or fall short of the targets. The BPCI initiative ended in September 2018. The BPCI Advanced voluntary initiative began October 1, 2018, runs through December 31, 2023, and covers 29 types of inpatient and 3 types of outpatient clinical episodes, including stroke and hip fracture. Providers participating in BPCI Advanced are subject to a semi-annual reconciliation process where CMS compares the aggregate Medicare expenditures for all items and services included in a clinical episode against the target price for that type of episode to determine whether the participant is eligible to receive a portion of the savings, or is required to repay a portion of the payment above target. The opportunities for post-acute providers to participate in BPCI Advanced are more limited than in the initial BPCI, so we cannot predict what the extent of our participation will be.
Similarly, CMS has established per the 2010 Healthcare Reform Laws several separate ACO programs, the largest of which is the Medicare Shared Savings Program (“MSSP”), a voluntary ACO program in which hospitals, physicians, and other care providers pursue the delivery of coordinated healthcare on a more efficient, patient-centered basis. Conceptually, ACOs receive a portion of any savings generated above a certain threshold from care coordination as long as benchmarks for the quality of care are maintained. Under the MSSP, there are different ACO tracks from which participants can choose. Each track offers a different degree to which participants share any savings realized or any obligation to repay losses suffered. The ACO rules adopted by CMS are extremely complex and remain subject to further refinement by CMS. According to CMS, 506 MSSP ACOs served patients in 2018. On December 21, 2018, CMS issued a final rule that makes several changes to the MSSP to, among other things, encourage transition to two-sided performance based risk more quickly.
We continue to evaluate, on a case-by-case basis, appropriate ACO participation opportunities for our hospitals and home health agencies. Several of our inpatient rehabilitation hospitals have signed participation or preferred provider agreements with an ACO. Given our recent involvement, those hospitals have treated only a limited number of patients in the ACOs to date. We have also partnered as the preferred home health provider with two ACOs serving approximately 24,000 total Medicare patients in Texas and Oklahoma, one of which met the minimum savings rate required to participate in Medicare shared savings for 2017.
On November 16, 2015, CMS published its final rule establishing the Comprehensive Care for Joint Replacement (“CJR”) payment model, which holds acute care hospitals accountable for the quality of care they deliver to Medicare fee-for-service beneficiaries for lower extremity joint replacements (i.e., knees and hips) from surgery through recovery. The CJR originally was mandatory for the acute care hospitals in the 67 geographic areas covered. On November 30, 2017, CMS issued a final rule making the CJR voluntary in 33 of those areas. During the CJR model’s five-year term, healthcare providers in the 34 geographic areas with mandatory participation will continue to be paid under existing Medicare payment systems. However, the acute-care hospital where the joint replacement takes place will be held accountable for the quality and costs of care for the entire episode of care — from the time of the original admission through 90 days after discharge. Depending on the quality and cost performance during the entire episode, the acute-care hospital may receive an additional payment or be required to repay Medicare a portion of the episode costs. As a result, CMS believes acute care hospitals will be incented to work with physicians and post-acute care providers to ensure beneficiaries receive the coordinated care they need in an efficient manner. Acute care hospitals participating in the CJR model may enter into risk-sharing financial arrangements with post-acute providers, including IRFs and home health agencies. We operate 25 inpatient rehabilitation hospitals in the 34 areas with mandatory participation.
The bundling and ACO initiatives have served as motivating factors for regulators and healthcare industry participants to identify and implement workable coordinated care and integrated delivery payment models. Broad-based implementation of a new delivery payment model would represent a significant transformation for us and the healthcare industry generally. The nature and timing of the evolution or transformation of the current healthcare system to coordinated care delivery and integrated delivery payment models and value-based purchasing are uncertain. The development of new delivery and payment systems will almost certainly take significant time and expense. Many of the alternative approaches, including those discussed above and the new home health value-based purchasing model discussed below, being explored may not work or could change substantially prior to a nationwide implementation. While only a small percentage of our business currently is or is anticipated to be subject to the alternative payment models discussed above, we cannot be certain these models will not be expanded or made standard.
Additionally, as the number and types of bundling and ACO models increase, the number of Medicare beneficiaries who are treated in one of the models increases. Our willingness and ability to participate in integrated delivery payment and other alternative payment models and the referral patterns of other providers participating in those models may limit our access to Medicare patients who would benefit from treatment in inpatient rehabilitation hospitals or by home care services. In an attempt to reduce costs, ACOs may seek to discourage referrals to post-acute care all together. To the extent that acute care hospitals participating in those models do not perceive our quality of care or cost efficiency favorably compared to alternative
21
post-acute providers, we may experience a decrease in volumes and
Net operating revenues
, which could adversely affect our financial position, results of operations, and cash flows. For further discussion of new coordinated care and integrated delivery payment models and value-based purchasing initiatives, the associated challenges, and our efforts to respond to them, see the “Executive Overview—Key Challenges—Changes to Our Operating Environment Resulting from Healthcare Reform” section of Item 7,
Management’s Discussion and Analysis of Financial Condition and Results of Operations
.
Other legislative and regulatory initiatives and changes affecting the industry could adversely affect our business and results of operations.
In addition to the legislative and regulatory actions that directly affect our reimbursement rates or further the evolution of the current healthcare delivery system, other legislative and regulatory changes, including as a result of ongoing healthcare reform, affect healthcare providers like us from time to time. For example, the 2010 Healthcare Reform Laws provide for the expansion of the federal Anti-Kickback Law and the False Claims Act that, when combined with other recent federal initiatives, are likely to increase investigation and enforcement efforts in the healthcare industry generally. Changes include increased resources for enforcement, lowered burden of proof for the government in healthcare fraud matters, expanded definition of claims under the False Claims Act, enhanced penalties, and increased rewards for relators in successful prosecutions. CMS may also suspend payment for claims prospectively if, in its opinion, credible allegations of fraud exist. The initial suspension period may be up to 180 days. However, the payment suspension period can be extended almost indefinitely if the matter is under investigation by the HHS Office of Inspector General (the “HHS-OIG”) or the United States Department of Justice (the “DOJ”). Any such suspension would adversely affect our financial position, results of operations, and cash flows.
Some states in which we operate have also undertaken, or are considering, healthcare reform initiatives that address similar issues. While many of the stated goals of other federal and state reform initiatives are consistent with our own goal to provide care that is high-quality and cost-effective, legislation and regulatory proposals may lower reimbursements, increase the cost of compliance, decrease patient volumes, promote frivolous or baseless litigation, and otherwise adversely affect our business. We cannot predict what healthcare initiatives, if any, will be enacted, implemented or amended, or the effect any future legislation or regulation will have on us.
On October 29, 2015, CMS issued a proposed rule relating to requirements for discharge planning for hospitals and home health agencies as called for by the IMPACT Act. The proposed rule would revise the discharge planning requirements applicable to our inpatient rehabilitation hospitals and home health agencies. CMS proposes to require hospitals (including IRFs) to have a discharge planning process that focuses on patients’ goals and preferences and on preparing them and, as appropriate, their caregivers, to be active partners in their post-discharge care. For our hospitals, the proposed rule would require standardized procedures pertaining to the development and finalization of unique discharge plans for all patients. CMS proposes that discharge instructions must be provided at the time of discharge to patients, or the patient’s caregiver or both, who are discharged home or who are referred to other post-acute care services, and that any post-discharge practitioners or providers must receive the patient’s discharge instructions at the time of discharge, including the patient’s discharge summary within 48 hours of discharge and any test results within 24 hours of availability.
For home health agencies, the proposed rule includes several new requirements. The discharge planning process would require the regular re
-
evaluation of patients to identify changes requiring modification of the discharge plan. The physician responsible for a patient’s plan of care would have to be involved in the ongoing establishment of the discharge plan. Home health agencies must also send certain specified medical and other information to the post-discharge facility or health care practitioner. The proposed rule would likely require the modification of existing discharge forms and reports, and patient visits may need to be extended in order to accommodate patient education. If adopted as proposed, we would expect to incur additional one-time and recurring expenses to comply, but at this time, we cannot predict what the final requirements will be or the timing or effect of those requirements. CMS has until November 3, 2019 to finalize this proposed rule.
In accordance with requirements adopted pursuant to the IMPACT Act, CMS implemented the new Medicare spending per beneficiary measures for each inpatient rehabilitation hospital in October 2016 and each home health agency in January 2017. The intent of tracking and publishing this data is to evaluate a given provider’s payment efficiency relative to the efficiency of the national median provider in that provider’s post-acute segment. CMS believes this measure will encourage improved efficiency and coordination of care in the post-acute setting by holding providers accountable for Medicare resource use during an episode of care. However, the measures do not take into account patient outcomes. CMS has not proposed to compare payment efficiency across provider segments.
In July 2013, CMS established a temporary moratorium on the enrollment of new home health agencies and branch locations in certain counties of Florida and Illinois and subsequently expanded it to the entirety of the states of Florida, Texas, Illinois and Michigan. CMS repeatedly extended the moratorium but allowed it to expire in January 2019.
22
In 2016, CMS launched a new three-year demonstration project requiring home health providers to seek prior authorization before submitting claims for services in Florida, Texas, Illinois, Michigan, and Massachusetts. In the pre-claim review demonstration project, CMS proposed to have Medicare contractors collect additional information from home health providers submitting claims in order to determine proper payment or detect evidence of fraud. The project was intended to test whether pre-claim review improves methods for the identification, investigation, and prosecution of Medicare fraud and whether the pre-claim review helps reduce expenditures while maintaining or improving quality of care. The project began in Illinois on August 3, 2016. CMS paused the project in Illinois and delayed the remainder of the roll out because of difficulties encountered in administering the project. In September 2018, CMS announced the re-initiation of the project, now referred to as Home Health Review Choice Demonstration (“RCD”), with a start date in Illinois of December 10, 2018. Under RCD, providers may choose pre-claim review (not pre-authorization for payment as under the original project) or post-payment review of all Medicare claims submitted or elect not to participate, in which case they will incur a 25% payment reduction on all claims. Unlike the original version of the project, if 90% or more of a home health agency’s claims are found to be valid in the review, that agency may opt out of the RCD review, except for spot reviews of samples consisting of 5% of total claims. We expect a staggered implementation, beginning in Illinois, then expanding to Ohio and North Carolina, and later to Florida and Texas. We operate agencies (representing approximately 46% of our home health Medicare claims) in these states.
In December 2018, CMS delayed the start date for RCD indefinitely. If rolled out, this pre-claim demonstration project will require us to incur additional administrative and staffing costs and may impact the timeliness of claims payment given that fiscal intermediaries in Illinois had difficulty processing pre-claim reviews on a timely basis. Accordingly, if the roll out project is not canceled, we may experience temporary decreases in
Net operating revenues
and in cash flow or we may incur costs associated with patient care, the Medicare claim for which is subsequently denied, each of which could have an adverse effect on our financial position, results of operations, and liquidity.
As discussed above, MedPAC makes healthcare policy recommendations to Congress and provides comments to CMS on Medicare payment related issues. Congress is not obligated to adopt MedPAC’s recommendations, and, based on outcomes in previous years, there can be no assurance Congress will adopt any given MedPAC recommendation. For example, in March and June 2018, MedPAC issued reports to Congress again recommending several possible changes, which MedPAC has advocated previously, to various post-acute payment systems. One possible change reported on was an increase to outlier payments to be funded by reductions to non-outlier payments rates under the IRF-PPS. This change would adversely impact us compared to other IRF providers because our hospitals have also historically averaged significantly less Medicare reimbursement for high cost outlier patients than other providers have averaged.
We cannot predict what legislative or regulatory reforms or changes, if any, will ultimately be enacted, or the timing or effect any of those changes or reforms will have on us. If enacted, they may be challenging for all providers and have the effect of limiting Medicare beneficiaries’ access to healthcare services and could have a material adverse impact on our
Net operating revenues
, financial position, results of operations, and cash flows. For additional discussion of healthcare reform and other factors affecting reimbursement for our services, see Item 1,
Business
, “Regulatory and Reimbursement Challenges” and “Sources of Revenues—Medicare Reimbursement.”
Quality reporting requirements may negatively affect the Medicare reimbursement we receive.
The focus on alternative payment models and value-based purchasing of healthcare services has, in turn, led to more extensive quality of care reporting requirements. In many cases, the new reporting requirements are linked to reimbursement incentives. For example, under the 2010 Healthcare Reform Laws, CMS established new quality data reporting, effective October 1, 2012, for all IRFs. A facility’s failure to submit the required quality data results in a two percentage point reduction to that facility’s annual market basket increase factor for payments made for discharges in the subsequent Medicare fiscal year. Hospitals began submitting quality data to CMS in October 2012. All of our hospitals have met the reporting deadlines to date resulting in no corresponding reimbursement reductions. Similarly, home health and hospice agencies are also required to submit quality data to CMS each year, and the failure to do so in accordance with the rules will result in a two percentage point reduction in their market basket updates. For 2019, we expect no more than six of our home health and hospice agencies will incur a reduction in their reimbursement rates.
As noted above, the IMPACT Act mandated that CMS adopt several new quality reporting measures for the various post-acute provider types. The adoption of additional quality reporting measures to track and report will require additional time and expense and could affect reimbursement in the future. In healthcare generally, the burdens associated with collecting, recording, and reporting quality data are increasing. Currently, CMS requires IRF and home health providers to track and submit patient assessment data to support the calculation of 17 and 23 quality reporting measures, respectively.
23
In 2015, CMS established a five-year home health value-based purchasing model in nine states to test whether incentives for better care can improve outcomes in the delivery of home health services. The model, which began in 2016, applies a reduction or increase to current Medicare-certified home health agency payments, depending on quality performance, made to agencies in Massachusetts, Maryland, North Carolina, Florida, Washington, Arizona, Iowa, Nebraska, and Tennessee. As of December 31, 2018, we have 44 home health locations in those states, which account for 22% of our home health Medicare revenue. Performance will be assessed based on several process, outcome, and care satisfaction measures, and the payment adjustments to be applied on an annual basis are set forth in the table below:
|
Performance Year
|
Calendar Year for Payment Adjustment
|
Maximum Payment Adjustment (+/-)
|
|
2017
|
2019
|
5%
|
|
2018
|
2020
|
6%
|
|
2019
|
2021
|
7%
|
|
2020
|
2022
|
8%
|
In 2018, we experienced a decrease in
Net operating revenues
of $0.3 million. Based on 2017 performance data, we anticipate almost no impact to our 2019 reimbursements. There can be no assurance all of our hospitals and agencies will meet quality reporting requirements or quality performance in the future which may result in one or more of our hospitals or agencies seeing a reduction in its Medicare reimbursements. Regardless, we, like other healthcare providers, are likely to incur additional expenses in an effort to comply with additional and changing quality reporting requirements.
Compliance with the extensive laws and government regulations applicable to healthcare providers requires substantial time, effort and expense, and if we fail to comply with them, we could suffer penalties or be required to make significant changes to our operations.
Healthcare providers are required to comply with extensive and complex laws and regulations at the federal, state, and local government levels. These laws and regulations relate to, among other things:
|
•
|
licensure, certification, and accreditation;
|
|
•
|
policies, either at the national or local level, delineating what conditions must be met to qualify for reimbursement under Medicare (also referred to as coverage requirements);
|
|
•
|
coding and billing for services;
|
|
•
|
requirements of the 60% compliance threshold under the 2007 Medicare Act;
|
|
•
|
relationships with physicians and other referral sources, including physician self-referral and anti-kickback laws;
|
|
•
|
quality of medical care;
|
|
•
|
use and maintenance of medical supplies and equipment;
|
|
•
|
maintenance and security of patient information and medical records;
|
|
•
|
acquisition and dispensing of pharmaceuticals and controlled substances; and
|
|
•
|
disposal of medical and hazardous waste.
|
In the future, changes in these laws or regulations or the manner in which they are enforced could subject our current or past practices to allegations of impropriety or illegality or could require us to make changes in our hospitals, equipment, personnel, services, capital expenditure programs, operating procedures, and contractual arrangements, as well as the way in which we deliver home health and hospice services. Those changes could also affect reimbursements as well as future training and staffing costs.
In addition to specific compliance-related laws and regulations, examples of regulatory changes that can affect our business, beyond direct changes to Medicare reimbursement rates, can be found from time to time in CMS’s annual rulemaking. For example, the final rule for the fiscal year 2010 IRF-PPS implemented new coverage requirements which provided in part that a patient medical record must document a reasonable expectation that, at the time of admission to an IRF, the patient
24
generally required and was able to participate in the intensive rehabilitation therapy services uniquely provided at IRFs. CMS has also taken the position that a patient’s medical file must appropriately document the rationale for the use of group therapies, as opposed to one-on-one therapy. Beginning on October 1, 2015, CMS instituted a new data collection requirement pursuant to which IRFs must capture the minutes and mode (individual, group, concurrent, or co-treatment) of therapy by specialty. CMS plans to use this data to potentially support future rulemaking in this area. Additionally, from time to time CMS has adopted changes in the medical conditions that will presumptively count toward the 60% compliance threshold to qualify for reimbursement as an inpatient rehabilitation hospital.
Of note, the HHS-OIG periodically updates a work plan that identifies areas of compliance focus. In recent years, HHS-OIG work plans for IRFs have focused on, among other items, the appropriate utilization of concurrent and group therapy and adverse and temporary harm events occurring in IRFs. The HHS-OIG website indicates active work plans will focus on appropriate documentation to support claims by home health and hospice agencies. Another active work plan provides HHS-OIG will determine if hospice patients are receiving the required visits by registered nurses. In September 2016, the HHS-OIG released a report purporting to identify a high error rate (approximately 80% of claims) among inpatient rehabilitation hospital admissions in a small sample of 220 claims. Based on its findings, the HHS-OIG extrapolated the error rate to the universe of inpatient rehabilitation claims and, among other things, recommended reevaluation of the IRF-PPS. However, the HHS-OIG report involves an extremely small sample size, is not a random sample of cases, includes some citations to coverage requirements that do not match actual regulations, appears to conflate technical documentation requirements with medical necessity determinations, and is at odds with actual Medicare Administrative Contractors (“MACs”) reviews of claims during that same timeframe which found substantially lower error rates. The HHS-OIG work plan, audit or similar future efforts could result in proposed changes to the payment systems for providers or increased denials of Medicare claims for patients notwithstanding the referring physicians’ judgment that treatment is appropriate.
As the recent HHS-OIG work plans demonstrate, the clarity and completeness of each patient medical file, some of which is the work product of a physician not employed by us, are essential to demonstrating our compliance with various regulatory and reimbursement requirements. For example, to support the determination that a patient’s IRF treatment was reasonable and necessary, the file must contain, among other things, an admitting physician’s assessment of the patient as well as a post-admission assessment by the treating physician and other information from clinicians relating to the plan of care and the therapies being provided. These physicians are not employees. They exercise their independent medical judgment. We and our hospital medical directors, who are independent contractors, provide training on a regular basis to the physicians who treat patients at our hospitals regarding appropriate documentation. However, we ultimately do not and cannot control the physicians’ medical judgment. In connection with subsequent payment audits and investigations, there can be no assurance as to what opinion a third party may take regarding the status of patient files or the physicians’ medical judgment evidenced in those files.
On March 4, 2013, we received document subpoenas from an office of the HHS-OIG addressed to four of our hospitals. Those subpoenas also requested complete copies of medical records for 100 patients treated at each of those hospitals between September 2008 and June 2012. The investigation is being conducted by DOJ. On April 24, 2014, we received document subpoenas relating to an additional seven of our hospitals. The new subpoenas reference substantially similar investigation subject matter as the original subpoenas and request materials from the period January 2008 through December 2013. Two of the four hospitals addressed in the original set of subpoenas have received supplemental subpoenas to cover this new time period. The most recent subpoenas do not include requests for specific patient files. However, in February 2015, DOJ requested the voluntary production of the medical records of an additional 70 patients, some of whom were treated in hospitals not subject to the subpoenas, and we provided these records. We have not received any subsequent requests for medical records from DOJ.
All of the subpoenas were in connection with an investigation of alleged improper or fraudulent claims submitted to Medicare and Medicaid and requested documents and materials relating to practices, procedures, protocols and policies of certain pre- and post-admissions activities at these hospitals including marketing functions, pre-admission screening, post-admission physician evaluations, patient assessment instruments, individualized patient plans of care, and compliance with the Medicare 60% rule. Under the Medicare rule commonly referred to as the “60% Rule,” 60% or more of the patients of an IRF must have at least one of a specified list of medical conditions in order to be reimbursed at the IRF-PPS payment rates, rather than at the lower acute care hospital payment rates.
We are aware of no evidence of fraud, falsity or wrongdoing. However, based on recent discussions with the government as well as the burdens and distractions associated with continuing the investigation and the likely costs of future litigation, we now estimate a settlement value of $48 million. Discussions are ongoing, and until they are concluded, there can be no certainty about the nature, timing or likelihood of a settlement. See
Note 17,
Contingencies and Other Commitments
, to the accompanying consolidated financial statements for additional discussion of this matter.
25
Although we have invested, and will continue to invest, substantial time, effort, and expense in implementing and maintaining training programs as well as internal controls and procedures designed to ensure regulatory compliance, we could be required to return portions of reimbursements for discharges alleged after the fact to have not been appropriate under the applicable reimbursement rules and change our patient admissions practices going forward. We could also be subjected to other liabilities, including (1) criminal penalties, (2) civil penalties, including monetary penalties and the loss of our licenses to operate one or more of our hospitals, and (3) exclusion or suspension of one or more of our hospitals from participation in the Medicare, Medicaid, and other federal and state healthcare programs, which, if lengthy in duration and material to us, could potentially trigger a default under our credit agreement or debt instruments.
Because Medicare comprises a significant portion of our
Net operating revenues
, failure to comply with the laws and regulations governing the Medicare program and related matters, including anti-kickback and anti-fraud requirements, could materially and adversely affect us. As discussed above in connection with the 2010 Healthcare Reform Laws, the federal government has in the last couple of years made compliance enforcement and fighting healthcare fraud top priorities. In the past few years, DOJ and HHS as well as federal lawmakers have significantly increased efforts to ensure strict compliance with various reimbursement related regulations as well as combat healthcare fraud. DOJ has pursued and recovered record amounts based on alleged healthcare fraud. The increased enforcement efforts have frequently included aggressive arguments and interpretations of laws and regulations that pose risks for all providers. For example, the federal government has increasingly asserted that incidents of erroneous billing or record keeping may represent violations of the False Claims Act. Human error and oversight in record keeping and documentation, particularly where those activities are the responsibility of non-employees, are always a risk in business, and healthcare providers and independent physicians are no different. Additionally, the federal government has been willing to challenge the medical judgment of independent physicians in determining issues such as the medical necessity of a given treatment plan.
Settlements of alleged violations or imposed reductions in reimbursements, substantial damages and other remedies assessed against us could have a material adverse effect on our business, financial position, results of operations, and cash flows. Even the assertion of a violation, depending on its nature, could have a material adverse effect upon our stock price or reputation and could cost us significant time and expense to defend.
Reimbursement claims are subject to various audits from time to time and such audits may negatively affect our operations and our cash flows from operations.
We receive a substantial portion of our revenues from the Medicare program. Medicare reimbursement claims made by healthcare providers, including inpatient rehabilitation hospitals as well as home health and hospice agencies, are subject to audit from time to time by governmental payors and their agents, such as MACs that act as fiscal intermediaries for all Medicare billings, auditors contracted by CMS, and insurance carriers, as well as HHS-OIG, CMS and state Medicaid programs. As noted above, the clarity and completeness of each patient medical file, some of which is the work product of a physician not employed by us, is essential to successfully challenging any payment denials. If the physicians working with our patients do not adequately document, among other things, their diagnoses and plans of care, our risks related to audits and payment denials in general are greater. Depending on the nature of the conduct found in such audits and whether the underlying conduct could be considered systemic, the resolution of these audits could have a material adverse effect in the aggregate on our financial position, results of operation and liquidity.
In the context of our inpatient rehabilitation business, one of the prevalent grounds for denying a claim or challenging a previously paid claim in an audit is that the patient’s treatment in a hospital was not medically necessary. The medical record must support that both the documentation and coverage criteria requirements are met for the hospital stay to be considered medically reasonable and necessary. Medical necessity is an assessment by an independent physician of a patient’s ability to tolerate and benefit from intensive multi-disciplinary therapy provided in an IRF setting. A Medicare claim may be denied or challenged based on an opinion of the auditor that the record did not evidence medical necessity for treatment in an IRF or lacked sufficient documentation to support the conclusion. In some cases, we believe the reviewing party is not merely challenging the sufficiency of the medical record but is substituting its judgment of medical necessity for that of the attending physician or imposing documentation or other requirements that are not set out in the regulations. We argue that doing so is inappropriate and has no basis in law. When the government or its contractors reject the medical judgment of physicians or impose documentation and other requirements beyond the language of the statutes and regulations, patient access to inpatient rehabilitation as well as our Medicare reimbursement from the related claims may be adversely affected.
MACs, under programs known as “widespread probes,” have conducted pre-payment claim reviews of our Medicare billings and in some cases denied payment for certain diagnosis codes. A majority of the denials we have encountered in these probes derive from one MAC. In connection with some probes, that MAC made determinations regarding medical necessity which represent its uniquely restrictive interpretations of the CMS coverage rules or impose otherwise arbitrary conditions not set out in the related rules. That MAC lost its contract with CMS, and in February 2018, another MAC assumed the contract
26
and began processing the claims from our hospitals in that jurisdiction. There can be no assurance that our current or future MACs will not take similarly restrictive interpretations. Because one MAC has jurisdiction over a significant number of our hospitals, a single widespread probe by that MAC could result in a large number of denials. We cannot predict what, if any, changes will result from the transition of the CMS MAC contract from one company to another.
In August 2017, CMS announced the Targeted Probe and Educate (“TPE”) initiative. Under the TPE initiative, MACs use data analysis to identify healthcare providers with high claim error rates and items and services that have high national error rates. Once a MAC selects a provider for claims review, the initial volume of claims review is limited to 20 to 40 claims. The TPE initiative includes up to three rounds of claims review with corresponding provider education and a subsequent period to allow for improvement. If results do not improve sufficiently after three rounds, the MAC may refer the provider to CMS for further action, which may include extrapolation of error rates to a broader universe of claims or referral to a ZPIC or RAC (defined below). We cannot predict the impact of the TPE initiative on our ability to collect claims on a timely basis.
CMS has developed and instituted various audit programs under which CMS contracts with private companies to conduct claims and medical record audits. These audits are in addition to those conducted by existing MACs. Some contractors are paid a percentage of the overpayments recovered. One type of audit contractor, the Recovery Audit Contractors (“RACs”), receive claims data directly from MACs on a monthly or quarterly basis and are authorized to review previously paid claims. The recovery auditor look back period is limited to six months from the date of service in cases where the hospital submits the claim within three months of the date of service. CMS has previously operated a demonstration project that expanded the RAC program to include prepayment review of Medicare fee-for-service claims from primarily acute care hospitals. It is unclear whether CMS intends to conduct RAC prepayment reviews in the future and if so, what providers and claims would be the focus of those reviews.
RAC audits of IRFs initially focused on coding errors but subsequently expanded to include medical necessity and billing accuracy reviews. To date, the Medicare payments subject to RAC audit requests represent less than
1%
of our Medicare patient discharges from
2010
to 2018. We have appealed substantially all RAC denials arising from these audits using the same process we follow for appealing pre-payment denials by MACs. In December 2017, CMS announced the authorization of RACs to conduct complex reviews of the medical records associated with home health reimbursement claims. In September 2018, CMS announced the authorization of RACs to conduct complex reviews of the medical records associated with IRF reimbursement claims.
CMS has also established contractors known as the Zone Program Integrity Contractors (“ZPICs”). These contractors are successors to the Program Safeguard Contractors and conduct audits with a focus on potential fraud and abuse issues. Like the RACs, the ZPICs conduct audits and have the ability to refer matters to the HHS-OIG or DOJ. Unlike RACs, however, ZPICs do not receive a specific financial incentive based on the amount of the error. We have, from time to time, received ZPIC record requests which have resulted in claim denials on paid claims. In some cases, the ZPICs have extrapolated error rates to larger pools of our claims. We have appealed substantially all ZPIC denials arising from these audits using the same process we follow for appealing other denials by contractors and contested the use of extrapolation.
Audits may lead to assertions that we have been underpaid or overpaid by Medicare or have submitted improper claims in some instances. Such assertions may require us to incur additional costs to respond to requests for records and defend the validity of payments and claims and may ultimately require us to refund any amounts determined to have been overpaid. In some circumstances auditors have the authority to extrapolate denial rationales to large pools of claims not actually audited, which could greatly increase the impact of the audit. As a result, we may suffer reduced profitability, and we may have to elect not to accept patients and conditions physicians believe can benefit from inpatient rehabilitation. We cannot predict when or how these audit programs will affect us.
Our third-party payors may also, from time to time, request audits of the amounts paid, or to be paid, to us. We could be adversely affected in some of the markets where we operate if the auditing payor alleges substantial overpayments were made to us due to coding errors or lack of documentation to support medical necessity determinations.
The use of sub-regulatory guidance, statistical sampling, and extrapolation by CMS, Medicare contractors, HHS-OIG, and DOJ to deny claims, expand enforcement claims, and advocate for changes in reimbursement policy increases the risk that we could experience reduced revenue, suffer penalties, or be required to make significant changes to our operations.
Because Medicare comprises a significant portion of our
Net operating revenues
, failure to comply with the laws and regulations governing the Medicare program and related matters, including anti-kickback and anti-fraud requirements, could materially and adversely affect us. Our ability to operate in a compliant manner impacts the claims denials, compliance enforcement, and regulatory processes discussed in other risks above. The federal government’s reliance on sub-regulatory guidance, such as handbooks, FAQs, internal memoranda, and press releases, presents a unique challenge to compliance efforts.
27
Such sub-regulatory guidance purports to explain validly promulgated regulations but often expands or supplements existing regulations without constitutionally and statutorily required notice and comment and other procedural protections. Without procedural protections, sub-regulatory guidance poses a risk above and beyond reasonable efforts to follow validly promulgated regulations, particularly when the agency or MAC seeking to enforce such sub-regulatory guidance is not the agency or MAC issuing the guidance and therefore not as familiar with the substance and nature of the underlying regulatory or even clinical issues involved.
Additionally, the federal government is also increasingly turning to statistical sampling and extrapolation to expand claims denials and enforcement efforts and advocate for changes in reimbursement policy. Through sampling and extrapolation, the government takes a review of a small number reimbursement claims and generalizes the results of that review to a much broader universe of claims, which can result in significant increases in the aggregate number and value of claims at issue. Increasing use of extrapolation can be found in payment review audits, such as those conducted by RACs and ZPICs. In addition to payment reviews, government agencies may allege compliance violations, including submission of false claims, based on sampling and extrapolation and seek to change reimbursement policy. For example, the HHS-OIG recently issued a report purporting to identify a high error rate (approximately 80% of claims) among inpatient rehabilitation hospital admissions in a small sample of 220 claims. Based on its findings, the HHS-OIG extrapolated the error rate to the universe of inpatient rehabilitation claims and, among other things, recommended reevaluation of the IRF-PPS. However, the HHS-OIG report involves an extremely small sample size, is not a random sample of cases, includes incorrect references to coverage requirement regulations, appears to conflate technical documentation requirements with medical necessity determinations, and is at odds with actual MAC reviews of claims during that same timeframe which found substantially lower error rates. Additionally, we believe there is no statutory authority for the practice of extrapolating in Medicare claims reviews. Notwithstanding the technical statistical flaws that can arise in sampling small groups of claims and the extremely problematic nature of extrapolation in the context of individualized decisions of medical judgment as some courts are beginning to note, sampling and extrapolation pose a growing risk to healthcare providers in the form of more significant claims of overpayments and increased legal costs to defend against these problematic regulatory practices. Any associated loss of revenue or increased legal costs could materially and adversely affect our financial position, results of operations, and cash flows.
Delays in the administrative appeals process associated with denied Medicare reimbursement claims may delay or reduce receipt of the related reimbursement amounts for services previously provided.
Ordinary course Medicare pre-payment denials by MACs, as well as denials resulting from widespread probes and audits, are subject to appeal by providers. We have historically appealed a majority of our denials. For claims we choose to appeal to an administrative law judge, we have historically experienced a success rate of approximately
70%
. However, the appeals adjudication process established by CMS has encountered significant delays in recent years for, among other reasons, a shortage of judges to hear appeals. For example, most of our appeals heard in 2018 related to denials received in 2011 and 2012. We believe the process for resolving individual Medicare payment claims that are denied will continue to take several years. Currently, we have appeals being heard that have been pending for up to eight years. Additionally, the number of new denials far exceeds the number of appeals resolved in recent years (except 2018) as shown in the following summary of our inpatient rehabilitation segment activity:
|
New Denials
|
Collections of Previously Denied Claims
|
Revenue Reserve for New Denials
|
|||
|
(In Millions)
|
|||||
|
2018
|
$10.2
|
$14.1
|
$3.0
|
||
|
2017
|
43.6
|
27.6
|
13.0
|
||
|
2016
|
74.9
|
26.2
|
20.6
|
||
|
2015
|
79.0
|
15.0
|
20.6
|
||
We currently record our estimates for pre-payment denials, including those resulting from widespread probes, and for post-payment audit denials that will ultimately not be collected as a component of
Net operating revenues
.
Prior to an accounting guidance change, we recorded these amounts in the
Provision for doubtful accounts.
See
Note 1,
Summary of Significant Accounting Policies
, “Net Operating Revenues,” to the accompanying consolidated financial statements. Given the continuing or increasing delays along with the increasing number of denials in the backlog, we may experience decreases in
Net operating revenues
and/or
decreases in cash flow as a result of increasing accounts receivable, which may in turn lead to a change in the patients and conditions we treat. Any of these impacts could have an adverse effect on our financial position, results of operations, and liquidity. Although Congress has considered legislation to reform and improve the Medicare audit and
28
appeals process, we cannot predict what, if any, legislation will be adopted or what, if any, effect that legislation might have on the audit and appeals process.
In May 2014, the American Hospital Association and others filed a lawsuit seeking to compel HHS to meet the statutory deadlines for adjudication of denied Medicare claims. In December 2016, the presiding federal district court judge in the lawsuit ordered HHS to eliminate the backlog of appeals by the end of 2020. HHS appealed the federal district court decision, and an appeals court remanded the order for further consideration of how HHS can eliminate the backlog. On November 1, 2018, the district court again ordered HHS to achieve the following reductions: 19% by the end of fiscal year 2019; 49% by the end of fiscal year 2020; 75% by the end of fiscal year 2021; and 100% by the end of fiscal year 2022. We cannot predict what, if any, further action CMS will take to reduce the backlog.
Changes in our payor mix or the acuity of our patients could adversely affect our Net operating revenues or our profitability.
Many factors affect pricing of our services and, in turn, our revenues. For example, in the inpatient rehabilitation segment, these factors include the treating facility’s urban or rural status, the length of stay, the payor and its applicable rate of reimbursement, and the patient’s medical condition and impairment status (acuity). In recent years, our inpatient rehabilitation segment has experienced a shift in payor mix to a slightly larger percentage of Medicaid patients. We could also experience a shift to a lower average patient acuity. Both of these shifts adversely affect pricing growth. See the “Segment Results of Operations—Inpatient Rehabilitation—Net Operating Revenues” section of Item 7,
Management’s Discussion and Analysis of Financial Condition and Results of Operations.
The expansion and growth of Medicaid resulting from provisions of the 2010 Healthcare Reform Laws has increased the number of those patients coming to us. Medicaid reimbursement rates are almost always the lowest among those of our payors, and frequently Medicaid patients come to us with other complicating conditions that make treatment more difficult and costly. We do not anticipate that Medicaid will continue to grow at the rate it has in recent years. However, we cannot predict what, if any, Medicaid changes will be adopted. We cannot predict whether our payor mix will to shift to lower reimbursement rate payors. In the future, we may experience shifts in our payor mix or the acuity of our patients that could adversely affect our pricing,
Net operating revenues,
or profitability.
We face intense competition for patients from other healthcare providers.
We operate in highly competitive, fragmented inpatient rehabilitation and home health and hospice industries. Although we are the nation’s largest owner and operator of inpatient rehabilitation hospitals in terms of patients treated and discharged, revenues, and number of hospitals, in any particular market we may encounter competition from local or national entities with longer operating histories or other competitive advantages. For example, acute care hospitals, including those owned and operated by large public companies, may choose to expand or begin offering post-acute rehabilitation services. Given that approximately
90%
of our hospitals’ referrals come from acute care hospitals, that increase in competition could materially and adversely affect our admission referrals in the related markets. There are also large acute care systems that may have more resources available to compete than we have. Other providers of post-acute care services may attempt to become competitors in the future. For example, some nursing homes, including at least one public company operator, have been marketing themselves as offering certain rehabilitation services, even though nursing homes are not required to offer the same level of care, or are not licensed, as hospitals.
In the home health and hospice services industries, our primary competition comes from locally owned private home health companies or acute care hospitals with adjunct home health services and typically varies from market to market. We also compete with a variety of other companies in providing home health and hospice services, some of which, including several large public companies, may have greater financial and other resources and may be more established in their respective communities. One public home health company has a joint venture arrangement in numerous markets with a public acute care hospital company. Similarly, there are also two large insurance companies that own home health businesses, one of which is one of the largest providers of Medicare-certified skilled home health services.
Competing companies may offer newer or different services from those we offer or have better relationships with referring physicians and may thereby attract patients who are presently, or would be candidates for, receiving our home health or hospice services. The other public companies and the insurance companies have or may obtain significantly greater marketing and financial resources or other advantages of scale than we have or may obtain. Relatively few barriers to entry exist in most of our local markets. Accordingly, other companies, including hospitals and other healthcare organizations that are not currently providing competing services, may expand their services to include home health services, hospice care, community care services, or similar services. Additionally, nursing homes compete for referrals in some instances when the patients may be suitable for home-based care.
29
There can be no assurance this competition, or other competition which we may encounter in the future, will not adversely affect our business, financial position, results of operations, or cash flows. In addition, from time to time, there are efforts in states with certificate of need (“CON”) laws to weaken those laws, which could potentially increase competition in those states. Conversely, competition and statutory procedural requirements in some CON states may inhibit our ability to expand our operations. For a breakdown of the CON status of the states and territories in which we have operations, see Item 2,
Properties
.
If we are unable to maintain or develop relationships with patient referral sources, our growth and profitability could be adversely affected.
Our success depends in large part on referrals from physicians, hospitals, case managers and other patient referral sources in the communities we serve. By law, referral sources cannot be contractually obligated to refer patients to any specific provider. However, there can be no assurance that individuals will not attempt to steer patients to competing post-acute providers or otherwise limit our access to potential referrals. The establishment of joint ventures or networks between referral sources, such as acute care hospitals, and other post-acute providers may hinder patient referrals to us.
Our growth and profitability depend on our ability to establish and maintain close working relationships with patient referral sources and to increase awareness and acceptance of the benefits of inpatient rehabilitation, home health, and hospice care by our referral sources and their patients. We cannot provide assurance that we will be able to maintain our existing referral source relationships or that we will be able to develop and maintain new relationships in existing or new markets. Our loss of, or failure to maintain, existing relationships or our failure to develop new relationships could adversely affect our ability to grow our business and operate profitably.
Efforts to reduce payments to healthcare providers undertaken by third-party payors, conveners, and referral sources may adversely affect our revenues and profitability.
Health insurers and managed care companies, including Medicare Advantage plans, may utilize certain third parties, known as conveners, to attempt to control costs. Conveners offer patient placement and care transition services to those payors as well as bundled payment participants, ACOs, and other healthcare providers with the intent of managing post-acute utilization and associated costs. Conveners may influence referral source decisions on which post-acute setting to recommend, as well as how long to remain in a particular setting. Given their focus on perceived financial savings, conveners customarily suggest that patients avoid higher acuity post-acute settings altogether or move as soon as practicable to lower acuity settings. Conveners are not healthcare providers and may suggest a post-acute setting or duration of care that may not be appropriate from a clinical perspective potentially resulting in a costly acute care hospital readmission.
We also depend on referrals from physicians, acute care hospitals, and other healthcare providers in the communities we serve. As a result of various alternative payment models, many third-party referral sources are becoming increasingly focused on reducing post-acute costs by eliminating post-acute care referrals or referring patients to post-acute settings other than perceived high-cost rehabilitation hospitals, sometimes without understanding the potential impact on patient outcomes over an entire episode of care. Our ability to attract patients could be adversely affected if any of our hospitals or agencies fail to provide or maintain a reputation for providing high-quality care on a cost-effective basis as compared to other providers.
We may have difficulty completing investments and transactions that increase our capacity consistent with our growth strategy.
We are selectively pursuing strategic acquisitions of, and in some instances joint ventures with, other healthcare providers. We may face limitations on our ability to identify sufficient acquisition or other development targets and to complete those transactions to meet goals. In the home health industry, there is significant competition among acquirors attempting to secure the acquisition of companies that have a large number of locations. In many states, the need to obtain governmental approvals, such as a CON or an approval of a change in ownership, may represent a significant obstacle to completing transactions. Additionally, in states with CON laws, it is not unusual for third-party providers to challenge the initial awards of CONs, the increase in the number of approved beds in an existing CON, or the expansion of the area served, and the adjudication of those challenges and related appeals may take many years. These factors may increase the cost to us associated with any acquisition or prevent us from completing one or more acquisitions.
30
We may make investments or complete transactions that could expose us to unforeseen risks and liabilities.
Investments, acquisitions, joint ventures or other development opportunities identified and completed may involve material cash expenditures, debt incurrence, operating losses, amortization of certain intangible assets of acquired companies, issuances of equity securities, liabilities, and expenses, some of which are unforeseen, that could materially and adversely affect our business, financial position, results of operations and liquidity. Acquisitions, investments, and joint ventures involve numerous risks, including:
|
•
|
limitations, including state CONs as well as CMS and other regulatory approval requirements, on our ability to complete such acquisitions, particularly those involving not-for-profit providers, on terms, timetables, and valuations reasonable to us;
|
|
•
|
limitations in obtaining financing for acquisitions at a cost reasonable to us;
|
|
•
|
difficulties integrating acquired operations, personnel, and information systems, and in realizing projected revenues, efficiencies and cost savings, or returns on invested capital;
|
|
•
|
entry into markets, businesses or services in which we may have little or no experience;
|
|
•
|
diversion of business resources or management’s attention from ongoing business operations; and
|
|
•
|
exposure to undisclosed or unforeseen liabilities of acquired operations, including liabilities for failure to comply with healthcare laws and anti-trust considerations in specific markets as well as risks and liabilities related to previously compromised information systems.
|
As part of our development activities, we intend to build new, or de novo, inpatient rehabilitation hospitals. The construction of new hospitals involves numerous risks, including the receipt of all zoning and other regulatory approvals, such as a CON where necessary, construction delays and cost over-runs and unforeseen environmental liability exposure. Once built, new hospitals must undergo the state and Medicare certification process, the duration of which may be beyond our control. We may be unable to operate newly constructed hospitals as profitably as expected, and those hospitals may involve significant additional cash expenditures and operating expenses that could, in the aggregate, have an adverse effect on our business, financial position, results of operations, and cash flows.
We may not be able to successfully integrate acquisitions or realize the anticipated benefits of any acquisitions.
We may undertake strategic acquisitions from time to time. For example, we completed the acquisitions of the home health business of EHHI Holdings, Inc. in 2014, the inpatient rehabilitation operations of Reliant Hospital Partners, LLC and affiliated entities in 2015, and the home health operations of CareSouth Health System, Inc. in 2015. Prior to consummation of any acquisition, the acquired business will have operated independently of us, with its own procedures, corporate culture, locations, employees and systems. We expect to integrate acquired businesses into our existing business utilizing certain common information systems, operating procedures, administrative functions, financial and internal controls and human resources practices to the extent practicable. There may be substantial difficulties, costs and delays involved in the integration of an acquired business with our business. Additionally, an acquisition could cause disruption to our business and operations and our relationships with customers, employees and other parties. In some cases, the acquired business has itself grown through acquisitions, as was the case with EHHI, and there may be legacy systems, operating policies and procedures, financial and administrative practices yet to be fully integrated. To the extent we are attempting to integrate multiple businesses at the same time, we may not be able to do so as efficiently or effectively as we initially anticipate. The failure to successfully integrate on a timely basis any acquired business with our existing business could have an adverse effect on our business, financial position, results of operations, and cash flows.
We anticipate our acquisitions will result in benefits including, among other things, increased revenues and an enhanced ability to provide a continuum of facility-based and home-based post-acute healthcare services. However, acquired businesses may not contribute to our revenues or earnings to the extent anticipated, and any synergies we expect may not be realized after the acquisitions have been completed. If the acquired businesses underperform and such underperformance is other than temporary, we may be required to take an impairment charge. Failure to achieve the anticipated benefits could result in the diversion of management’s time and energy and could have an adverse effect on our business, financial position, results of operations, and cash flows.
31
Competition for staffing, shortages of qualified personnel, union activity or other factors may increase our labor costs and reduce profitability.
Our operations are dependent on the efforts, abilities, and experience of our medical personnel, such as physical therapists, occupational therapists, speech pathologists, nurses, and other healthcare professionals. We compete with other healthcare providers in recruiting and retaining qualified personnel responsible for the daily operations of each of our locations. In some markets, the lack of availability of medical personnel is a significant operating issue facing all healthcare providers. This issue may be exacerbated if immigration is more limited in the future. A shortage may require us to continue to enhance wages and benefits to recruit and retain qualified personnel or to contract for more expensive temporary personnel. We also depend on the available labor pool of semi-skilled and unskilled employees in each of the markets in which we operate.
If our labor costs increase, we may not experience reimbursement rate or pricing increases to offset these additional costs. Because a significant percentage of our revenues consists of fixed, prospective payments, our ability to pass along increased labor costs is limited. In particular, if labor costs rise at an annual rate greater than our net annual market basket update from Medicare, as is expected to happen in 2019, or we continue to experience a shift in our payor mix to lower rate payors such as Medicaid, our results of operations and cash flows will be adversely affected. Conversely, decreases in reimbursement revenues, such as with sequestration and the proposed PDGM reimbursement rate reductions, may limit our ability to increase compensation or benefits to the extent necessary to retain key employees, in turn increasing our turnover and associated costs. Union activity is another factor that may contribute to increased labor costs. We currently have a minimal number of union employees, so an increase in labor union activity could have a significant impact on our labor costs. Our failure to recruit and retain qualified medical personnel, or to control our labor costs, could have a material adverse effect on our business, financial position, results of operations, and cash flows.
We are a defendant in various lawsuits, and may be subject to liability under qui tam cases, the outcome of which could have a material adverse effect on us.
We operate in a highly regulated industry in which healthcare providers are routinely subject to litigation. As a result, various lawsuits, claims, and legal and regulatory proceedings have been and can be expected to be instituted or asserted against us. We are a defendant in a number of lawsuits. The material lawsuits and investigations, including the investigation related to the subpoenas received from HHS-OIG, are discussed in
Note 17,
Contingencies and Other Commitments
, to the accompanying consolidated financial statements. This investigation, under the direction of DOJ, has been pending six years. We are aware of no evidence of fraud, falsity or wrongdoing. However, based on recent discussions with the government as well as the burdens and distractions associated with continuing the investigation and the likely costs of future litigation, we now estimate a settlement value of $48 million. Discussions are ongoing, and until they are concluded, there can be no certainty about the nature, timing or likelihood of a settlement.
Substantial damages, fines, or other remedies assessed against us or agreed to in settlements could have a material adverse effect on our business, financial position, results of operations, and cash flows, including indirectly as a result of the covenant defaults under our credit agreement or debt instruments or other claims such as those in securities actions. Additionally, the costs of defending litigation and investigations, even if frivolous or nonmeritorious, could be significant.
The False Claims Act allows private citizens, called “relators,” to institute civil proceedings on behalf of the United States alleging violations of the False Claims Act. These lawsuits, also known as “whistleblower” or “
qui tam
” actions, can involve significant monetary damages, fines, attorneys’ fees and the award of bounties to the relators who successfully prosecute or bring these suits to the government.
Qui tam
cases are sealed at the time of filing, which means knowledge of the information contained in the complaint typically is limited to the relator, the federal government, and the presiding court. The defendant in a
qui tam
action may remain unaware of the existence of a sealed complaint for years. While the complaint is under seal, the government reviews the merits of the case and may conduct a broad investigation and seek discovery from the defendant and other parties before deciding whether to intervene in the case and take the lead on litigating the claims. The court lifts the seal when the government makes its decision on whether to intervene. If the government decides not to intervene, the relator may elect to continue to pursue the lawsuit individually on behalf of the government. We are aware of an unsealed
qui tam
case involving one of our hospitals in which the government has declined to intervene and the relator has decided to pursue on the government’s behalf. We believe this case to be without merit. It is possible that
qui tam
lawsuits have been filed against us, which suits remain under seal, or that we are unaware of such filings or precluded by existing law or court order from discussing or disclosing the filing of such suits. We may be subject to liability under one or more undisclosed
qui tam
cases brought pursuant to the False Claims Act.
Home care services, by their very nature, are provided in an environment that is not in the substantial control of the healthcare provider. Accordingly, home care involves an increased level of risk of general and professional liability. On any given day, we have thousands of care providers driving to and from the homes of patients. We cannot predict the impact any
32
claims arising out of the travel, the home visits or the care being provided (regardless of their ultimate outcomes) could have on our business or reputation or on our ability to attract and retain patients and employees. We also cannot predict the adequacy of any reserves for such losses or recoveries from any insurance or re-insurance policies.
We insure a substantial portion of our professional liability, general liability, and workers’ compensation liability risks, which may not include risks related to regulatory fines and penalties, through our captive insurance subsidiary, as discussed further in
Note 10,
Self-Insured Risks
, to the accompanying consolidated financial statements. Changes in the number of these liability claims and the cost to resolve them impact the reserves for these risks. A variance between our estimated and actual number of claims or average cost per claim could have a material impact, either favorable or unfavorable, on the adequacy of the reserves for these liability risks, which could have an effect on our financial position and results of operations.
The proper function, availability, and security of our information systems are critical to our business.
We are and will remain dependent on the proper function, availability and security of our and third-party information systems, including our electronic clinical information system, referred to as ACE-IT, which plays a substantial role in the operations of the hospitals, and the information systems currently in use by our home health and hospice business. We undertake substantial measures to protect the safety and security of our information systems and the data maintained within those systems, and we periodically test the adequacy of our security and disaster recovery measures. We have implemented administrative, technical and physical controls on our systems and devices in an attempt to prevent unauthorized access to that data, which includes patient information subject to the protections of the Health Insurance Portability and Accountability Act of 1996 and the Health Information Technology for Economic and Clinical Health Act and other sensitive information. For additional discussion of these laws, see Item 1,
Business
, “Regulation.”
We expend significant capital to protect against the threat of security breaches, including cyber attacks, email phishing schemes, malware and ransomware. Substantial additional expenditures may be required to alleviate any problems caused by breaches, including unauthorized access to or theft of patient data and protected health information stored in our information systems and the introduction of computer malware or ransomware to our systems. We also provide our employees training and regular reminders on important measures they can take to prevent breaches or phishing schemes. We routinely identify attempts to gain unauthorized access to our systems. However, given the rapidly evolving nature and proliferation of cyber threats, there can be no assurance our training and network security measures or other controls will detect, prevent or remediate security or data breaches in a timely manner or otherwise prevent unauthorized access to, damage to, or interruption of our systems and operations. For example, it has been widely reported that many well-organized international interests, in certain cases with the backing of sovereign governments, are targeting the theft of patient information through the use of advance persistent threats. Similarly, in recent years, several hospitals have reported being the victim of ransomware attacks in which they lost access to their systems, including clinical systems, during the course of the attacks. We are likely to face attempted attacks in the future. Accordingly, we may be vulnerable to losses associated with the improper functioning, security breach or unavailability of our information systems as well as any systems used in acquired operations. In January 2018, news reports widely circulated the discovery of two vulnerabilities, named Meltdown and Spectre, found in the most commonly used microchip processors. These vulnerabilities which affect nearly all computers could allow unauthorized parties to circumvent system protections exposing nearly any data device processes, such as passwords, proprietary information, or encrypted communications. We have taken and will continue to take corrective action to attempt to prevent an exploitation of these vulnerabilities on our systems.
To date, we are not aware of having experienced a material cyber breach or attack. However, given the increasing cyber security threats in the healthcare industry, there can be no assurance we will not experience business interruptions; data loss, ransom, misappropriation or corruption; theft or misuse of proprietary or patient information; or litigation, investigation, or regulatory action related to any of those, any of which could have a material adverse effect on our financial position and results of operations and harm our business reputation. In November 2018, an employee fell victim to a spoofed email purporting to be from a vendor seeking to change electronic payment instructions. We initiated payments for an aggregate amount less than $1 million pursuant to those fraudulent instructions, but the fraud was detected and the funds frozen in the recipient account. The funds were returned to us in January 2019. As a result of this incident, we reviewed and supplemented our procedures and training for processing changes in vendor information.
A compromise of our network security measures or other controls, or of those businesses and vendors with whom we interact, which results in confidential information being accessed, obtained, damaged or used by unauthorized or improper persons or unavailability of systems necessary to the operation of our business, could impact patient care, harm our reputation, and expose us to significant remedial costs as well as regulatory actions (fines and penalties) and claims from patients, financial institutions, regulatory and law enforcement agencies, and other persons, any of which could have a material adverse effect on our business, financial position, results of operations and cash flows. The nature of our business requires the sharing of protected health information and other sensitive information among employees and physician partners, many of whom carry and access portable devices outside of our physical locations, which in turn increases the risk of loss, theft or inadvertent
33
disclosure of that information. Moreover, a security breach, or threat thereof, could require that we expend significant resources to repair or improve our information systems and infrastructure and could distract management and other key personnel from performing their primary operational duties. In the case of a material breach or cyber attack, the associated expenses and losses may exceed our current insurance coverage for such events. Some adverse consequences are not insurable, such as reputational harm and third-party business interruption. Failure to maintain proper function, security, or availability of our information systems or protect our data against unauthorized access could have a material adverse effect on our business, financial position, results of operations, and cash flows.
ACE-IT is subject to a licensing, implementation, technology hosting, and support agreement with Cerner Corporation. Similarly, we have an agreement to license, host, and support a comprehensive home care management and clinical information system, Homecare Homebase
SM
. Our inability, or the inability of software vendors, to continue to maintain and upgrade our information systems, software, and hardware could disrupt or reduce the efficiency of our operations, including affecting patient care. A security breach or other system failure at Cerner, Homecare Homebase or another technology vendor could compromise our patient data or proprietary information or disrupt our ability to operate. In addition, costs, unexpected problems, and interruptions associated with the implementation or transition to new systems or technology or with adequate support of those systems or technology across numerous hospitals and agencies could have a material adverse effect on our business, financial position, results of operations, and cash flows.
Successful execution of our current business plan depends on our key personnel.
The success of our current business plan depends in large part upon the leadership and performance of our executive management team and other key employees and our ability to retain and motivate these individuals. We rely upon their ability, expertise, experience, judgment, discretion, integrity and good faith. However, there is no guarantee we will be able to retain our key personnel. Our only employment agreements with members of management, which were put in place with the home health management team as part of the acquisition at the end of 2014, expire at the end of 2019. If we are unable to retain one or more key members of management, we may be unable to replace them with personnel of comparable experience in, or knowledge of, the healthcare provider industry or our specific post-acute segments. The loss of the services of any of these individuals could prevent us from successfully executing our business plan and could have a material adverse effect on our business and results of operations.
We may incur additional indebtedness in the future, and that debt or the associated increased leverage may have negative consequences for our business.
As of
December 31, 2018
, we have approximately
$2.3 billion
of long-term debt outstanding (including that portion of long-term debt classified as current and excluding
$263.8 million
in capital leases). See
Note 9,
Long-term Debt
, to the accompanying consolidated financial statements. Subject to specified limitations, our credit agreement and the indentures governing our debt securities permit us and our subsidiaries to incur material additional debt. If new debt is added to our current debt levels, the risks described here could intensify.
Our indebtedness could have important consequences, including:
|
•
|
limiting our ability to borrow additional amounts to fund working capital, capital expenditures, acquisitions, debt service requirements, execution of our business strategy and other general corporate purposes;
|
|
•
|
making us more vulnerable to adverse changes in general economic, industry and competitive conditions, in government regulation and in our business by limiting our flexibility in planning for, and making it more difficult for us to react quickly to, changing conditions;
|
|
•
|
placing us at a competitive disadvantage compared with competing providers that have less debt; and
|
|
•
|
exposing us to risks inherent in interest rate fluctuations for outstanding amounts under our credit facility, which could result in higher interest expense in the event of increases in interest rates, as discussed in Item 7A,
Quantitative and Qualitative Disclosures about Market Risk.
|
We are subject to contingent liabilities, prevailing economic conditions, and financial, business, and other factors beyond our control. Although we expect to make scheduled interest payments and principal reductions, we cannot provide assurance that changes in our business or other factors will not occur that may have the effect of preventing us from satisfying obligations under our credit agreement or debt instruments. If we are unable to generate sufficient cash flow from operations in the future to service our debt and meet our other needs or have an unanticipated cash payment obligation, we may have to
34
refinance all or a portion of our debt, obtain additional financing or reduce expenditures or sell assets we deem necessary to our business. We cannot provide assurance these measures would be possible or any additional financing could be obtained.
The restrictive covenants in our credit agreement and the indentures governing our senior notes could affect our ability to execute aspects of our business plan successfully.
The terms of our credit agreement and the indentures governing our senior notes do, and our future debt instruments may, contain various provisions that limit our ability and the ability of certain of our subsidiaries to, among other things:
|
•
|
incur or guarantee indebtedness;
|
|
•
|
pay dividends on, or redeem or repurchase, our capital stock; or repay, redeem or repurchase our subordinated obligations;
|
|
•
|
issue or sell certain types of preferred stock;
|
|
•
|
make investments;
|
|
•
|
incur obligations that restrict the ability of our subsidiaries to make dividends or other payments to us;
|
|
•
|
sell assets;
|
|
•
|
engage in transactions with affiliates;
|
|
•
|
create certain liens;
|
|
•
|
enter into sale/leaseback transactions; and
|
|
•
|
merge, consolidate, or transfer all or substantially all of our assets.
|
These covenants could adversely affect our ability to finance our future operations or capital needs and pursue available business opportunities. For additional discussion of our material debt covenants, see the “Liquidity and Capital Resources” section of Item 7,
Management’s Discussion and Analysis of Financial Condition and Results of Operations
, and
Note 9,
Long-term Debt
, to the accompanying consolidated financial statements.
In addition, our credit agreement requires us to maintain specified financial ratios and satisfy certain financial condition tests. See the “Liquidity and Capital Resources” section of Item 7,
Management’s Discussion and Analysis of Financial Condition and Results of Operations
, and
Note 9,
Long-term Debt
, to the accompanying consolidated financial statements. Although we remained in compliance with the financial ratios and financial condition tests as of December 31, 2018, we cannot provide assurance we will continue to do so. Events beyond our control, including changes in general economic and business conditions, may affect our ability to meet those financial ratios and financial condition tests. A severe downturn in earnings, failure to realize anticipated earnings from acquisitions, or, if we have outstanding borrowings under our credit facility at the time, a rapid increase in interest rates could impair our ability to comply with those financial ratios and financial condition tests and we may need to obtain waivers from the required proportion of the lenders to avoid being in default. If we try to obtain a waiver or other relief from the required lenders, we may not be able to obtain it or such relief might have a material cost to us or be on terms less favorable than those in our existing debt. If a default occurs, the lenders could exercise their rights, including declaring all the funds borrowed (together with accrued and unpaid interest) to be immediately due and payable, terminating their commitments or instituting foreclosure proceedings against our assets, which, in turn, could cause the default and acceleration of the maturity of our other indebtedness. A breach of any other restrictive covenants contained in our credit agreement or the indentures governing our senior notes would also (after giving effect to applicable grace periods, if any) result in an event of default with the same outcome.
As of
December 31, 2018
, approximately
70%
of our consolidated
Property and equipment, net
was held by our company and its guarantor subsidiaries under its credit agreement. See
Note 9,
Long-term Debt
, and
Note 20,
Condensed Consolidating Financial Information
, to the accompanying consolidated financial statements, and Item 2,
Properties
.
Uncertainty in the capital markets could adversely affect our ability to carry out our development objectives.
In recent years, the global and sovereign credit markets have experienced significant disruptions, and the debt ceiling and federal budget disputes in the United States affected capital markets. Future market shocks could negatively affect the availability or terms of certain types of debt and equity financing, including access to revolving lines of credit. Future business
35
needs combined with market conditions at the time may cause us to seek alternative sources of potentially less attractive financing and may require us to adjust our business plan accordingly. For example, tight credit markets, such as might result from further turmoil in the sovereign debt markets, would likely make additional financing more expensive and difficult to obtain. In 2018, the equity markets experienced volatility, which is believed to have been driven in part by concerns associated with rising interest rates. The inability to obtain additional financing at attractive rates or prices could have a material adverse effect on our financial performance or our growth opportunities.
As a result of credit market uncertainty, we could face potential exposure to counterparties who may be unable to adequately service our needs, including the ability of the lenders under our credit agreement to provide liquidity when needed. We monitor the financial strength of our depositories, creditors, and insurance carriers using publicly available information, as well as qualitative inputs.
If any of our hospitals or home health or hospice agencies fail to comply with the Medicare conditions of participation, that hospital or agency could be terminated from the Medicare program.
Each of our hospitals and home health and hospice agencies must comply with extensive conditions of participation for certification in the Medicare program. If any fail to meet any of the Medicare conditions of participation, we may receive a notice of deficiency from the applicable survey agency. If that hospital or agency then fails to institute an acceptable plan of correction and correct the deficiency within the applicable correction period, it could lose the ability to bill Medicare. A hospital or agency could be terminated from the Medicare program if it fails to address the deficiency within the applicable correction period. If CMS terminates one hospital or agency, it may increase its scrutiny of others under common control. Any termination of one or more of our hospitals or agencies from the Medicare program for failure to satisfy the conditions of participation could adversely affect our business, financial position, results of operations, and cash flows.
|
Item 1B.
|
Unresolved Staff Comments
|
None.
|
Item 2.
|
Properties
|
We currently maintain our principal executive office at 9001 Liberty Parkway, Birmingham, Alabama, the lease for which expires in 2033 and has multiple renewal options for additional 5-year terms.
In addition to our principal executive office, as of
December 31, 2018
, we leased or owned through various consolidated entities 427 locations to operate or support our business. All but three of our hospital leases, which represent the largest portion of our rent expense, have at least five years remaining on their terms after taking into consideration one or more renewal options. Our consolidated entities associated with our leased hospitals are generally responsible for property taxes, property and casualty insurance, and routine maintenance expenses. Our home health and hospice business is based in Dallas, Texas where it leases office space for corporate and administrative functions. The remaining home health and hospice locations are in the localities served by that business and are subject to relatively small space leases, primarily 4,000 square feet or less. Those space leases are typically six years or less in term. We do not believe any one of our individual properties is material to our consolidated operations.
36
The following table sets forth information regarding our hospital properties (excluding the
one
hospital that has
51
licensed beds and operates as a joint venture which we account for using the equity method of accounting) and our home health and hospice locations (excluding
two
of the home health locations that operate as joint ventures which we account for using the equity method of accounting) as of
December 31, 2018
:
|
|
|
Number of Hospitals
|
|||||||||||||||||
|
State
|
Licensed Beds
|
Building and Land Owned
|
Building Owned and Land Leased
|
Building and Land Leased
|
Total
|
Home Health and Hospice Locations
|
|||||||||||||
|
Alabama *+
|
427
|
|
2
|
|
3
|
|
2
|
|
7
|
|
13
|
|
|||||||
|
Arizona
|
335
|
|
1
|
|
1
|
|
3
|
|
5
|
|
5
|
|
|||||||
|
Arkansas *+
|
360
|
|
3
|
|
1
|
|
1
|
|
5
|
|
5
|
|
|||||||
|
California
|
184
|
|
2
|
|
—
|
|
1
|
|
3
|
|
—
|
|
|||||||
|
Colorado
|
104
|
|
1
|
|
—
|
|
1
|
|
2
|
|
6
|
|
|||||||
|
Connecticut*
|
—
|
|
—
|
|
—
|
|
—
|
|
—
|
|
1
|
|
|||||||
|
Delaware *
|
37
|
|
—
|
|
1
|
|
—
|
|
1
|
|
—
|
|
|||||||
|
Florida *
|
927
|
|
10
|
|
—
|
|
2
|
|
12
|
|
15
|
|
|||||||
|
Georgia *+
|
160
|
|
2
|
|
(1)
|
1
|
|
3
|
|
26
|
|
||||||||
|
Idaho
|
—
|
|
—
|
|
—
|
|
—
|
|
—
|
|
12
|
|
|||||||
|
Illinois *
|
65
|
|
—
|
|
1
|
|
—
|
|
1
|
|
3
|
|
|||||||
|
Indiana
|
103
|
|
—
|
|
—
|
|
1
|
|
1
|
|
1
|
|
|||||||
|
Kansas
|
242
|
|
1
|
|
—
|
|
2
|
|
3
|
|
6
|
|
|||||||
|
Kentucky *+
|
323
|
|
2
|
|
1
|
|
—
|
|
3
|
|
3
|
|
|||||||
|
Louisiana
|
47
|
|
1
|
|
—
|
|
—
|
|
1
|
|
3
|
|
|||||||
|
Maine *
|
100
|
|
—
|
|
—
|
|
1
|
|
1
|
|
—
|
|
|||||||
|
Maryland *+
|
64
|
|
1
|
|
—
|
|
—
|
|
1
|
|
3
|
|
|||||||
|
Massachusetts *
|
560
|
|
2
|
|
—
|
|
2
|
|
4
|
|
4
|
|
|||||||
|
Mississippi*+
|
33
|
|
—
|
|
—
|
|
1
|
|
1
|
|
20
|
|
|||||||
|
Missouri *
|
191
|
|
—
|
|
2
|
|
—
|
|
2
|
|
2
|
|
|||||||
|
Nevada
|
219
|
|
2
|
|
—
|
|
1
|
|
3
|
|
4
|
|
|||||||
|
New Hampshire
|
50
|
|
—
|
|
1
|
|
—
|
|
1
|
|
—
|
|
|||||||
|
New Jersey *+
|
199
|
|
1
|
|
1
|
|
1
|
|
3
|
|
—
|
|
|||||||
|
New Mexico
|
87
|
|
1
|
|
—
|
|
—
|
|
1
|
|
7
|
|
|||||||
|
North Carolina *+
|
68
|
|
1
|
|
—
|
|
—
|
|
1
|
|
6
|
|
|||||||
|
Ohio
|
210
|
|
1
|
|
—
|
|
2
|
|
3
|
|
1
|
|
|||||||
|
Oklahoma
|
40
|
|
—
|
|
1
|
|
—
|
|
1
|
|
22
|
|
|||||||
|
Oregon*
|
—
|
|
—
|
|
—
|
|
—
|
|
—
|
|
2
|
|
|||||||
|
Pennsylvania
|
734
|
|
5
|
|
—
|
|
4
|
|
9
|
|
3
|
|
|||||||
|
Puerto Rico *+
|
72
|
|
—
|
|
—
|
|
2
|
|
2
|
|
—
|
|
|||||||
|
South Carolina *+
|
410
|
|
2
|
|
4
|
|
1
|
|
7
|
|
3
|
|
|||||||
|
Tennessee *+
|
493
|
|
5
|
|
4
|
|
—
|
|
9
|
|
10
|
|
|||||||
|
Texas
|
1,473
|
|
11
|
|
2
|
|
9
|
|
22
|
|
62
|
|
|||||||
|
Utah
|
84
|
|
1
|
|
—
|
|
—
|
|
1
|
|
15
|
|
|||||||
|
Virginia *
|
297
|
|
2
|
|
1
|
|
3
|
|
6
|
|
11
|
|
|||||||
|
West Virginia *+
|
268
|
|
1
|
|
3
|
|
—
|
|
4
|
|
—
|
|
|||||||
|
Wyoming
|
—
|
|
—
|
|
—
|
|
—
|
|
—
|
|
2
|
|
|||||||
|
|
8,966
|
|
61
|
|
28
|
|
40
|
|
129
|
|
276
|
|
(2)
|
||||||
37
* Hospital certificate of need state or U.S. territory
+ Home health certificate of need state or U.S. territory
|
(1)
|
The inpatient rehabilitation hospitals in Augusta and Newnan, Georgia are parties to industrial development bond financings that reduce the
ad valorem
taxes payable by each hospital. In connection with each of these bond structures, title to the related property is held by the local development authority. We lease the related hospital property and hold the bonds issued by that authority, the payment on which equals the amount payable under the lease. We may terminate each bond financing and the associated lease at any time at our option without penalty, and fee title to the related hospital property will return to us.
|
|
(2)
|
This total includes 218 locations where we provide home health services and 58 locations where we provide hospice services.
|
Our principal executive office, hospitals, and other properties are suitable for their respective uses and are, in all material respects, adequate for our present needs. Information regarding the utilization of our licensed beds and other operating statistics can be found in Item 7,
Management’s Discussion and Analysis of Financial Condition and Results of Operations.
|
Item 3.
|
Legal Proceedings
|
Information relating to certain legal proceedings in which we are involved is included in
Note 17,
Contingencies and Other Commitments
, to the accompanying consolidated financial statements, which is incorporated herein by reference.
|
Item 4.
|
Mine Safety Disclosures
|
Not applicable.
38
PART II
|
Item 5.
|
Market for Registrant’s Common Equity, Related Stockholder Matters and Issuer Purchases of Equity Securities
|
Market Information
Shares of our common stock trade on the New York Stock Exchange under the ticker symbol “EHC.” As discussed in Item 1,
Business
, effective as of January 1, 2018, the NYSE ticker symbol for our common stock changed from “HLS” to “EHC.”
Holders
As of
February 13, 2019
, there were
98,743,918
shares of Encompass Health common stock issued and outstanding, net of treasury shares, held by approximately
7,785
holders of record.
Dividends
On February 21, 2019, our board of directors declared a cash dividend of $0.27 per share, payable on April 15, 2019 to stockholders of record on April 1, 2019. We expect quarterly dividends to continue to be paid in January, April, July, and October. However, the actual declaration of any future cash dividends, and the setting of record and payment dates as well as the per share amounts, will be at the discretion of our board each quarter after consideration of various factors, including our capital position and alternative uses of funds.
Recent Sales of Unregistered Securities
None.
Securities Authorized for Issuance Under Equity Compensation Plans
The following table sets forth, as of
December 31, 2018
, information concerning compensation plans under which our securities are authorized for issuance. The table does not reflect grants, awards, exercises, terminations, or expirations since that date. All share amounts and exercise prices have been adjusted to reflect stock splits that occurred after the date on which any particular underlying plan was adopted, to the extent applicable.
|
Number of securities to be issued upon exercise of outstanding options
|
Weighted-average exercise price of outstanding options
(1)
|
Number of securities available for future issuance
|
|||||||
|
Plans approved by stockholders
|
2,862,849
|
|
(2)
|
$
|
35.23
|
|
10,592,123
|
|
(3)
|
|
Plans not approved by stockholders
|
86,830
|
|
(4)
|
—
|
|
||||
|
Total
|
2,949,679
|
|
$
|
35.23
|
|
10,592,123
|
|
||
|
(1)
|
This calculation does not take into account awards of restricted stock, restricted stock units, or performance share units.
|
|
(2)
|
This amount assumes maximum performance by performance-based awards for which the performance has not yet been determined.
|
|
(3)
|
This amount represents the number of shares available for future equity grants under the 2016 Omnibus Performance Incentive Plan approved by our stockholders in May 2016.
|
|
(4)
|
This amount represents
86,830 restr
icted stock units issued under the 2004 Amended and Restated Director Incentive Plan, the material terms of which are described below.
|
2004 Amended and Restated Director Incentive Plan
The 2004 Amended and Restated Director Incentive Plan (the “2004 Plan”) provided for the grant of common stock, awards of restricted common stock, and the right to receive awards of common stock, which we refer to as “restricted stock units,” to our non-employee directors. The 2004 Plan expired in March 2008 and was replaced by the 2008 Equity Incentive Plan. Some awards remain outstanding. Awards granted under the 2004 Plan at the time of its termination will continue in effect in accordance with their terms. Awards of restricted stock units were fully vested when awarded and will be settled in
39
shares of common stock on the earlier of the six-month anniversary of the date on which the director ceases to serve on the board of directors or certain change in control events. The restricted stock units generally cannot be transferred. Awards are generally protected against dilution upon the issuance of stock dividends and in the event of a stock split, recapitalization, or other major corporate restructuring.
Purchases of Equity Securities
The following table summarizes our repurchases of equity securities during the three months ended
December 31, 2018
:
|
Period
|
Total Number of Shares (or Units) Purchased
(1)
|
Average Price Paid per Share (or Unit) ($)
|
Total Number of Shares Purchased as Part of Publicly Announced Plans or Programs
|
Maximum Number (or Approximate Dollar Value) of Shares That May Yet Be Purchased Under the Plans or Programs
(2)
|
||||||||
|
October 1 through October 31, 2018
|
596
|
|
$
|
75.28
|
|
—
|
|
$250,000,000
|
||||
|
November 1 through November 30, 2018
|
—
|
|
—
|
|
—
|
|
$250,000,000
|
|||||
|
December 1 through December 31, 2018
|
—
|
|
—
|
|
—
|
|
$250,000,000
|
|||||
|
Total
|
596
|
|
$
|
75.28
|
|
—
|
|
|||||
|
(1)
|
In October, 596 shares were purchased pursuant to our Directors’ Deferred Stock Investment Plan. This plan is a nonqualified deferral plan allowing non-employee directors to make advance elections to defer a fixed percentage of their director fees. The plan administrator acquires the shares in the open market which are then held in a rabbi trust. The plan also provides that dividends paid on the shares held for the accounts of the directors will be reinvested in shares of our common stock which will also be held in the trust. The directors’ rights to all shares in the trust are nonforfeitable, but the shares are only released to the directors after departure from our board.
|
|
(2)
|
On October 28, 2013, we announced our board of directors authorized the repurchase of up to $200 million of our common stock. On February 14, 2014, our board approved an increase in this common stock repurchase authorization from $200 million to $250 million. On July 24, 2018, our board approved resetting the aggregate common stock repurchase authorization to $250 million. The repurchase authorization does not require the repurchase of a specific number of shares, has an indefinite term, and is subject to termination at any time by our board of directors. Subject to certain terms and conditions, including a maximum price per share and compliance with federal and state securities and other laws, the repurchases may be made from time to time in open market transactions, privately negotiated transactions, or other transactions, including trades under a plan established in accordance with Rule 10b5-1 under the Securities Exchange Act of 1934, as amended.
|
Company Stock Performance
Set forth below is a line graph comparing the total returns of our common stock, the Standard & Poor’s 500 Index (“S&P 500”), and the S&P Health Care Services Select Industry Index (“SPSIHP”), an equal-weighted index of at least 35 companies in healthcare services that are also part of the S&P Total Market Index and subject to float-adjusted market capitalization and liquidity requirements. Our compensation committee has in prior years used the SPSIHP as a benchmark for a portion of the awards under our long-term incentive program. The graph assumes $100 invested on December 31,
2013
in our common stock and each of the indices. The returns below assume reinvestment of dividends paid on the related common stock. We have paid a quarterly cash dividend on our common stock since October 2013.
The information contained in the performance graph shall not be deemed “soliciting material” or to be “filed” with the SEC nor shall such information be deemed incorporated by reference into any future filing under the Securities Act of 1933 or the Securities Exchange Act of 1934, except to the extent we specifically incorporate it by reference into such filing.
40
The comparisons in the graph below are based upon historical data and are not indicative of, nor intended to forecast, future performance of our common stock. Research Data Group, Inc. provided the data for the indices presented below. We assume no responsibility for the accuracy of the indices’ data, but we are not aware of any reason to doubt its accuracy.
COMPARISON OF 5-YEAR CUMULATIVE TOTAL RETURN
Among Encompass Health Corporation, the S&P 500 Index, and the S&P Health Care Services Select Industry Index
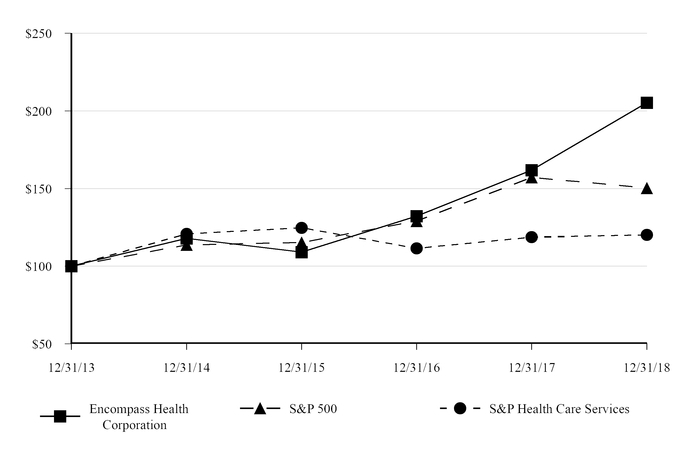
|
|
For the Year Ended December 31,
|
|||||||||||||||||
|
|
Base Period
|
Cumulative Total Return
|
||||||||||||||||
|
Company/Index Name
|
2013
|
2014
|
2015
|
2016
|
2017
|
2018
|
||||||||||||
|
Encompass Health Corporation
|
100.00
|
|
117.90
|
|
109.06
|
|
132.31
|
|
161.88
|
|
205.38
|
|
||||||
|
Standard & Poor’s 500 Index
|
100.00
|
|
113.69
|
|
115.26
|
|
129.05
|
|
157.22
|
|
150.33
|
|
||||||
|
S&P Health Care Services Select Industry Index
|
100.00
|
|
120.81
|
|
124.75
|
|
111.51
|
|
118.70
|
|
120.17
|
|
||||||
41
|
Item 6.
|
Selected Financial Data
|
We derived the selected consolidated financial data presented below as of December 31,
2018
and
2017
and for the years ended December 31,
2018
,
2017
, and
2016
from our audited consolidated financial statements and related notes included elsewhere in this filing. We derived the selected historical consolidated financial data presented below as of December 31,
2016
and as of and for the years ended December 31,
2015
and
2014
from our consolidated financial statements and related notes not included herein. Refer to Item 7,
Management’s Discussion and Analysis of Financial Condition and Results of Operations,
and the notes to the accompanying consolidated financial statements for additional information regarding the financial data presented below, including matters that might cause this data not to be indicative of our future financial position or results of operations.
|
For the Year Ended December 31,
|
|||||||||||||||||||
|
|
2018
|
2017
|
2016
|
2015
|
2014
|
||||||||||||||
|
|
(In Millions, Except per Share Data)
|
||||||||||||||||||
|
Statement of Operations Data:
(1)
|
|
|
|
|
|
||||||||||||||
|
Net operating revenues
|
$
|
4,277.3
|
|
$
|
3,913.9
|
|
$
|
3,642.6
|
|
$
|
3,115.7
|
|
$
|
2,374.3
|
|
||||
|
Operating earnings
(2)
|
555.2
|
|
578.3
|
|
588.1
|
|
485.7
|
|
418.4
|
|
|||||||||
|
Provision for income tax expense
* (3)
|
118.9
|
|
145.8
|
|
163.9
|
|
141.9
|
|
110.7
|
|
|||||||||
|
Income from continuing operations
*
|
374.3
|
|
350.6
|
|
318.1
|
|
253.7
|
|
276.2
|
|
|||||||||
|
Income (loss) from discontinued operations, net of tax
|
1.1
|
|
(0.4
|
)
|
—
|
|
(0.9
|
)
|
5.5
|
|
|||||||||
|
Net income
*
|
375.4
|
|
350.2
|
|
318.1
|
|
252.8
|
|
281.7
|
|
|||||||||
|
Less: Net income attributable to noncontrolling interests
|
(83.1
|
)
|
(79.1
|
)
|
(70.5
|
)
|
(69.7
|
)
|
(59.7
|
)
|
|||||||||
|
Net income attributable to Encompass Health
*
|
292.3
|
|
271.1
|
|
247.6
|
|
183.1
|
|
222.0
|
|
|||||||||
|
Less: Convertible perpetual preferred stock dividends
|
—
|
|
—
|
|
—
|
|
(1.6
|
)
|
(6.3
|
)
|
|||||||||
|
Net income attributable to Encompass Health common shareholders
*
|
$
|
292.3
|
|
$
|
271.1
|
|
$
|
247.6
|
|
$
|
181.5
|
|
$
|
215.7
|
|
||||
|
Weighted average common shares outstanding:
(5)
|
|
|
|
|
|
|
|
|
|
|
|||||||||
|
Basic
|
97.9
|
|
93.7
|
|
89.1
|
|
89.4
|
|
86.8
|
|
|||||||||
|
Diluted
|
99.8
|
|
99.3
|
|
99.5
|
|
101.0
|
|
100.7
|
|
|||||||||
|
Earnings per common share:
|
|
|
|
|
|
|
|
|
|
|
|||||||||
|
Basic earnings per share attributable to Encompass Health common shareholders:
*
|
|
|
|
|
|
|
|
|
|
|
|||||||||
|
Continuing operations
|
$
|
2.97
|
|
$
|
2.88
|
|
$
|
2.77
|
|
$
|
2.03
|
|
$
|
2.40
|
|
||||
|
Discontinued operations
|
0.01
|
|
—
|
|
—
|
|
(0.01
|
)
|
0.06
|
|
|||||||||
|
Net income
|
$
|
2.98
|
|
$
|
2.88
|
|
$
|
2.77
|
|
$
|
2.02
|
|
$
|
2.46
|
|
||||
|
Diluted earnings per share attributable to Encompass Health common shareholders:
*
|
|
|
|
|
|
|
|
|
|
|
|||||||||
|
Continuing operations
|
$
|
2.92
|
|
$
|
2.84
|
|
$
|
2.59
|
|
$
|
1.92
|
|
$
|
2.24
|
|
||||
|
Discontinued operations
|
0.01
|
|
—
|
|
—
|
|
(0.01
|
)
|
0.05
|
|
|||||||||
|
Net income
|
$
|
2.93
|
|
$
|
2.84
|
|
$
|
2.59
|
|
$
|
1.91
|
|
$
|
2.29
|
|
||||
|
Cash dividends per common share
(6)
|
$
|
1.04
|
|
$
|
0.98
|
|
$
|
0.94
|
|
$
|
0.88
|
|
$
|
0.78
|
|
||||
|
Amounts attributable to Encompass Health:
|
|
|
|
|
|
|
|
|
|
|
|||||||||
|
Income from continuing operations
*
|
$
|
291.2
|
|
$
|
271.5
|
|
$
|
247.6
|
|
$
|
184.0
|
|
$
|
216.5
|
|
||||
|
Income (loss) from discontinued operations, net of tax
|
1.1
|
|
(0.4
|
)
|
—
|
|
(0.9
|
)
|
5.5
|
|
|||||||||
|
Net income attributable to Encompass Health
*
|
$
|
292.3
|
|
$
|
271.1
|
|
$
|
247.6
|
|
$
|
183.1
|
|
$
|
222.0
|
|
||||
42
|
|
As of December 31,
|
||||||||||||||||||
|
|
2018
|
2017
|
2016
|
2015
|
2014
|
||||||||||||||
|
|
(In Millions)
|
||||||||||||||||||
|
Balance Sheet Data:
(1)
|
|
|
|
|
|
||||||||||||||
|
Working capital
|
$
|
(10.4
|
)
|
$
|
184.7
|
|
$
|
178.9
|
|
$
|
172.3
|
|
$
|
322.3
|
|
||||
|
Total assets
*
(7)
|
5,175.0
|
|
4,864.5
|
|
4,663.8
|
|
4,592.2
|
|
3,386.1
|
|
|||||||||
|
Long-term debt, including current portion
(4) (7)
|
2,514.4
|
|
2,577.7
|
|
3,016.4
|
|
3,171.5
|
|
2,111.2
|
|
|||||||||
|
Convertible perpetual preferred stock
(4)
|
—
|
|
—
|
|
—
|
|
—
|
|
93.2
|
|
|||||||||
|
Encompass Health shareholders’ equity
*
(4)
|
1,276.7
|
|
1,152.5
|
|
717.8
|
|
597.5
|
|
471.0
|
|
|||||||||
|
(*)
|
During the preparation of our December 31, 2018 financial statements, an error was identified in our recognition of deferred tax assets which resulted in an incorrect overstatement of our
Total assets
and
Encompass Health shareholders’ equity
of $18.1 million, $13.9 million, and $2.2 million in 2016, 2015, and 2014, respectively. The impact of correcting this error to our 2017 consolidated financial statements is discussed in
Note 1,
Summary of Significant Accounting Policies
, “Revision of Previously Issued Financial Statements,” to the accompanying consolidated financial statements. The amounts included in the tables above have been revised to reflect the correction of this error.
|
|
(1)
|
We acquired the home health and hospice business of EHHI Holdings, Inc. (“EHHI”) on December 31, 2014. Because the acquisition took place on December 31, 2014, our consolidated results of operations prior to 2015 do not include any results of operations from EHHI. Assets acquired, liabilities assumed, and redeemable noncontrolling interests were recorded at their estimated fair values as of the acquisition date.
|
|
(2)
|
We define operating earnings as income from continuing operations attributable to Encompass Health before (1) loss on early extinguishment of debt; (2) interest expense and amortization of debt discounts and fees; (3) other income; (4) loss on interest rate swaps; and (5) income tax expense or benefit.
|
|
(3)
|
For information related to our
Provision for income tax expense,
see Item 7,
Management’s Discussion and Analysis of Financial Condition and Results of Operations
, and
Note 15,
Income Taxes
, to the accompanying consolidated financial statements.
|
|
(4)
|
During the fourth quarter of 2013, we exchanged $320 million in aggregate principal amount of newly issued 2.00% Convertible Senior Subordinated Notes due 2043 (“Convertible Notes”) for 257,110 shares of our then outstanding 6.50% Series A Convertible Perpetual Preferred Stock. On April 23, 2015, we exercised our rights to force conversion of all remaining outstanding shares of our
Convertible perpetual preferred stock
into common stock
.
During the second quarter of 2017, we exercised the early redemption option and subsequently retired all $320 million of the Convertible Notes reducing our long-term debt balance by approximately $278 million. Substantially all of the holders elected to convert their Convertible Notes to shares of our common stock, which resulted in the issuance of 8.9 million shares from treasury stock. See
Note 9,
Long-term Debt
and
Note 16,
Earnings per Common Share
, to the accompanying consolidated financial statements.
|
|
(5)
|
During 2017, we repurchased 0.9 million shares of our common stock in the open market for $38.1 million. During 2016, we repurchased 1.7 million shares of our common stock in the open market for $65.6 million. During 2015, we repurchased 1.3 million shares of our common stock in the open market for $45.3 million. During 2014, we repurchased 1.3 million shares of our common stock in the open market for $43.1 million.
|
|
(6)
|
In July 2014, our board of directors approved an increase in our quarterly cash dividend to $0.21 per share. In July 2015, our board of directors approved an increase in our quarterly cash dividend of $0.23 per share. In July 2016, our board of directors approved an increase in our quarterly cash dividend of $0.24 per share. In July 2017, our board of directors approved an increase in our quarterly cash dividend of $0.25 per share. In July 2018, our board of directors approved an increase in our quarterly cash dividend of $0.27 per share. See
Note 16,
Earnings per Common Share
, to the accompanying consolidated financial statements.
|
|
(7)
|
The EHHI acquisition resulted in total cash consideration delivered at closing of $695.5 million. We funded the cash purchase price in the acquisition entirely with draws under the revolving and expanded term loan facilities of our credit agreement. On October 1, 2015, we acquired Reliant Hospital Partners, LLC and affiliated entities. The total cash consideration delivered at closing was approximately $730 million. We funded the cash purchase price in the
|
43
acquisition with proceeds from our August and September 2015 senior notes issuances and borrowings under our senior secured credit facility. On November 2, 2015, we acquired the home health agency operations of CareSouth Health System, Inc. The total cash consideration delivered at closing was approximately $170 million. We funded the cash purchase price with our term loan facility capacity and cash on hand. In May 2018, we acquired Camellia Healthcare and affiliated entities using cash on hand and borrowings under our revolving credit facility. See
Note 2,
Business Combinations
, and
Note 9,
Long-term Debt
, to the accompanying consolidated financial statements.
|
Item 7.
|
Management’s Discussion and Analysis of Financial Condition and Results of Operations
|
The following Management’s Discussion and Analysis of Financial Condition and Results of Operations (“MD&A”) should be read in conjunction with the accompanying consolidated financial statements and related notes. This MD&A is designed to provide the reader with information that will assist in understanding our consolidated financial statements, the changes in certain key items in those financial statements from year to year, and the primary factors that accounted for those changes, as well as how certain accounting principles affect our consolidated financial statements. See “Cautionary Statement Regarding Forward-Looking Statements” on page ii of this report for a description of important factors that could cause actual results to differ from expected results. See also Item 1A,
Risk Factors
.
We have revised our financial statements as of and for the year ended December 31, 2017 to correct an error in the accounting for deferred income taxes. Accordingly, the MD&A set forth below reflect the effects of this revision. See details in
Note 1,
Summary of Significant Accounting Policies
, “Revision of Previously Issued Financial Statements,” to the accompanying consolidated financial statements.
Executive Overview
Our Business
We are a leading provider of integrated healthcare services, offering both facility-based and home-based patient care through our network of inpatient rehabilitation hospitals, home health agencies, and hospice agencies. As of December 31, 2018, our national footprint spans
36
states and Puerto Rico. As discussed in this Item, “Segment Results of Operations,” we manage our operations in two operating segments which are also our reportable segments: (1) inpatient rehabilitation and (2) home health and hospice. For additional information about our business, see Item 1,
Business.
In 2018, we undertook a rebranding to reinforce our strategy and position as an integrated provider of facility-based and home-based patient care. As part of the rebranding, we changed our corporate name from HealthSouth Corporation to Encompass Health Corporation and the NYSE ticker symbol for our common stock from “HLS” to “EHC.”
Inpatient Rehabilitation
We are the nation’s largest owner and operator of inpatient rehabilitation hospitals in terms of patients treated and discharged, revenues, and number of hospitals. We provide specialized rehabilitative treatment on both an inpatient and outpatient basis. We operate hospitals in
32
states and Puerto Rico, with concentrations in the eastern half of the United States and Texas. As of December 31,
2018
, we operate
130
inpatient rehabilitation hospitals, including
one
hospital that operates as a joint venture that we account for using the equity method of accounting. In addition to our hospitals, we manage
five
inpatient rehabilitation units through management contracts. Our inpatient rehabilitation segment represented approximately
78%
of our
Net operating revenues
for the year ended December 31,
2018
.
Home Health and Hospice
Our home health and hospice business is the nation’s fourth largest provider of Medicare-certified skilled home health services in terms of revenues. Our home health services include a comprehensive range of Medicare-certified home nursing services to adult patients in need of care. These services include, among others, skilled nursing, physical, occupational, and speech therapy, medical social work, and home health aide services. We also provide hospice services to terminally ill patients and their families that address patients’ physical needs, including pain control and symptom management, and to provide emotional and spiritual support. As of December 31,
2018
, we provide home health and hospice services across
278
locations and
30
states, with concentrations in the Southeast and Texas. In addition,
two
of these home health agencies operate as joint ventures that we account for using the equity method of accounting. Our home health and hospice segment represented approximately
22%
of our
Net operating revenues
for the year ended December 31,
2018
.
See also Item 1,
Business
, and Item 1A,
Risk Factors
, of this report, Note
18
,
Segment Reporting
, to the accompanying consolidated financial statements, and the “Results of Operations” section of this Item.
44
2018
Overview
In
2018
, we focused on the following strategic priorities:
|
•
|
providing high-quality, cost-effective care to patients in our existing markets;
|
|
•
|
achieving organic growth at our existing inpatient rehabilitation hospitals, home health agencies, and hospice agencies;
|
|
•
|
expanding our services to more patients who require these services by constructing and acquiring hospitals in new markets and acquiring and opening home health and hospice agencies in new markets;
|
|
•
|
making shareholder distributions via common stock dividends and repurchases of our common stock; and
|
|
•
|
positioning the Company for success in the evolving healthcare delivery system through key operational initiatives that include implementing the rebranding and name change, developing and implementing post-acute solutions, enhancing clinical collaboration between our inpatient rehabilitation hospitals and home health locations, refining and expanding use of clinical data analytics to further improve patient outcomes, and participating in alternative payment models.
|
During
2018
,
Net operating revenues
increased
9.3%
over
2017
due primarily to pricing and volume growth in our inpatient rehabilitation segment and volume growth in our home health and hospice segment. Within our inpatient rehabilitation segment, discharge growth of
4.6%
coupled with a
2.2%
increase inpatient revenue per discharge in
2018
generated
6.5%
growth in net patient revenue compared to
2017
. Discharge growth included a
2.8%
increase in same-store discharges. Within our home health and hospice segment, home health admission growth of
10.0%
coupled with the impact of a
0.6%
decrease in revenue per episode in
2018
contributed to
20.5%
growth in home health and hospice revenue compared to
2017
. Home health admission growth included a
5.6%
increase in same-store admissions. Many of our quality and outcome measures remained above both inpatient rehabilitation and home health industry averages. Not only did we treat more patients and enhance outcomes, we did so in a cost-effective manner. See the “Results of Operations” section of this Item.
Our growth efforts continued to yield positive results in
2018
. In our inpatient rehabilitation segment, we:
|
•
|
entered into an agreement with Saint Alphonsus Regional Medical Center in February 2018 to own and operate a new 40-bed inpatient rehabilitation hospital in Boise, Idaho. The joint venture hospital is expected to begin operating in the third quarter of 2019 subject to customary closing conditions, including regulatory approvals;
|
|
•
|
began operating our new 34-bed inpatient rehabilitation hospital in Shelby County, Alabama in April 2018 and our new 38-bed inpatient rehabilitation hospital in Bluffton, South Carolina (formerly referred to as Hilton Head, South Carolina) in June 2018;
|
|
•
|
began operating a 29-bed inpatient rehabilitation hospital in Murrells Inlet, South Carolina with our joint venture partner, Tidelands Health, in September 2018;
|
|
•
|
began operating our new 68-bed inpatient rehabilitation hospital in Winston-Salem, North Carolina with our joint venture partner, Novant Health Inc., in October 2018;
|
|
•
|
continued the construction of our new 40-bed joint venture hospital with University Medical Center Health System in Lubbock, Texas. The hospital is expected to begin operating in the second quarter of 2019;
|
|
•
|
continued our capacity expansions by adding 26 new beds to existing hospitals; and
|
45
|
•
|
continued development of the following de novo hospitals:
|
|
Location
|
# of Beds
|
Actual / Expected Construction Start Date
|
Expected Operational Date
|
|
Murrieta, California
|
50
|
Q2 2018
|
Q4 2019
|
|
Katy, Texas
|
40
|
Q3 2018
|
Q4 2019
|
|
Sioux Falls, South Dakota
|
40
|
Q2 2019
|
Q2 2020
|
|
Coralville, Iowa
|
40
|
Q2 2019
|
Q2 2020
|
We also continued our growth efforts in our home health and hospice segment. On May 1, 2018, we completed the acquisition of privately owned Camellia Healthcare and affiliated entities (“Camellia”). The Camellia portfolio consisted of 18 hospice, 14 home health, and 2 private duty locations in Mississippi, Alabama, Louisiana and Tennessee. The Camellia acquisition leveraged our home health and hospice operating platform across key certificate of need states and strengthened our geographic presence in the Southeastern United States. We funded the cash purchase price of the acquisition with cash on hand and borrowings under our revolving credit facility. We expect to realize a tax benefit with an estimated present value of $20 million to $25 million related to this transaction.
In addition to completing the Camellia transaction, we acquired two home health locations located in Birmingham, Alabama, and Talladega, Alabama and four hospice locations located in Oklahoma City, Oklahoma; Las Vegas, Nevada; Talladega, Alabama; and El Paso, Texas. We also began accepting patients at our seven new home health locations in Owasso, Oklahoma; Atlanta, Georgia; Vernon, Alabama; Boise, Idaho; Henderson, Nevada; Worcester, Massachusetts; and Bluffton, South Carolina.
We also continued our shareholder distributions by paying a quarterly cash dividend of $0.25 per share on our common stock in the first three quarters of 2018. On July 24, 2018, our board of directors approved an increase in our quarterly cash dividend to $0.27 per share. See the “Liquidity and Capital Resources” section of this Item.
We further positioned ourselves for the healthcare industry’s movement to integrated delivery payment models, value-based purchasing, and post-acute site neutrality. We recently completed our company-wide rebranding and name change initiative to reflect and reinforce our expanding national footprint and our strategy to deliver high-quality, cost-effective care across the post-acute continuum. We increased the clinical collaboration rate between our inpatient rehabilitation hospitals and home health locations. We developed and piloted a longitudinal patient record to manage patients across the post-acute continuum and a 90-day post-acute readmission prediction model. We began using patient care navigators to follow a patient throughout an episode of care. We also refined and expanded use of clinical data analytics to further improve patient outcomes and lower cost of care.
Business Outlook
We believe our business outlook remains positive. Favorable demographic trends, such as population aging, should increase long-term demand for the services we provide. While we treat patients of all ages, most of our patients are 65 and older, and the number of Medicare enrollees is expected to grow approximately 3% per year for the foreseeable future. We believe the demand for the services we provide will continue to increase as the U.S. population ages. We believe these factors align with our strengths in, and focus on, post-acute services. In addition, we believe we can address the demand for facility-based and home-based post-acute care services in markets where we currently do not have a presence by constructing or acquiring new hospitals and by acquiring or opening home health and hospice agencies in those extremely fragmented industries.
We are a leading provider of integrated healthcare services, offering both facility-based and home-based patient care through our network of inpatient rehabilitation hospitals, home health agencies, and hospice agencies. We are committed to delivering high-quality, cost-effective, integrated patient care across the healthcare continuum with a primary focus on the post-acute sector. As the nation’s largest owner and operator of inpatient rehabilitation hospitals in terms of patients treated and discharged, revenues, and number of hospitals, we believe we differentiate ourselves from our competitors based on the quality of our clinical outcomes, our cost-effectiveness, our financial strength, and our extensive application of technology. As the fourth largest provider of Medicare-certified skilled home health services in terms of revenues, we believe we differentiate ourselves from our competitors by the application of a highly integrated technology platform, our ability to manage a variety of care pathways, and a proven track record of consummating and integrating acquisitions.
46
We have invested considerable resources into clinical and management systems and protocols that have allowed us to consistently produce high-quality outcomes for our patients while continuing to contain cost growth. Our proprietary hospital management reporting system aggregates data from each of our key business systems into a comprehensive reporting package used by the management teams in our hospitals, as well as executive management, and allows them to analyze data and trends and create custom reports on a timely basis. Our commitment to technology also includes our electronic clinical information system (“ACE-IT”). ACE-IT allows us to interface with the clinical information systems of acute care hospitals to facilitate patient transfers, reduce readmissions, and enhance patient outcomes. We also believe this system will improve patient care and safety, enhance staff recruitment and retention, and set the stage for connectivity with other providers and health information exchanges. Our home health and hospice segment uses information technology to enhance patient care and manage the business by utilizing Homecare Homebase
SM
, an industry leading comprehensive information platform designed to manage the entire patient work flow and allow home health providers to process clinical, compliance, financial, and marketing information as well as analyze data and trends for management purposes using custom reports on a timely basis. Homecare Homebase also allows us to share valuable data with payors to promote better patient outcomes on a more cost-effective basis. All of these systems allow us to enhance our clinical and business processes. Our information systems allow us to collect, analyze, and share information on a timely basis, making us an ideal partner for other healthcare providers in a coordinated care delivery environment.
Our priorities include operational initiatives that build on momentum from 2018. Through clinical collaboration between our inpatient rehabilitation hospitals and home health agencies we further our pursuit of quality patient outcomes and improved patient experiences. We believe our clinical collaboration efforts have and will continue to contribute to reductions in discharges to skilled nursing facilities, higher discharges to home, and improved patient satisfaction. Due to the need of post-acute care for stroke patients, we are attempting to build our stroke market share by leveraging our strategic sponsorship of the American Heart Association/American Stroke Association, clinical collaboration, and hospital participation in The Joint Commission's Disease-Specific Care Certification Program. We will also continue to develop and implement post-acute solutions by leveraging our clinical expertise, large post-acute datasets, electronic medical record technologies, and strategic partnerships to drive improved patient outcomes and lower cost of care across the entire post-acute episode. The Medicare reimbursement systems for both inpatient rehabilitation and home health are subject to potentially significant changes. We will prepare for the transition to the new IRF patient assessment measures, commonly referred to as “CARE Tool” measures, and the implementation of the home health Patient-Driven Groupings Model (“PDGM”). For additional information see “Key Challenges” below as well as Item 1,
Business
, and Item 1A,
Risk Factors
.
The nature and timing of the transformation of the current healthcare system to coordinated care delivery and payment models is uncertain, as the development and implementation of new care delivery and payment systems will require significant time and resources. Furthermore, many of the alternative approaches being explored may not work as intended. However, as outlined in Item 1,
Business
, “Competitive Strengths”, our goal is to position the Company in a prudent manner to be responsive to industry shifts. We have invested in our core business and created an infrastructure that enables us to provide high-quality care on a cost-effective basis. We have been disciplined in creating a capital structure that is flexible with no significant debt maturities prior to 2022. We continue to have a strong, well-capitalized balance sheet, including a substantial portfolio of owned real estate. We have significant availability under our revolving credit facility, and we continue to generate strong cash flows from operations. Strong and consistent free cash flow generated by our Company, together with our relatively low financial leverage and the unfunded commitment of our revolving credit facility, provides substantial capacity to pursue growth opportunities in both of our business segments while continuing to invest in our operational initiatives and capital structure strategy.
For these and other reasons, we believe we will be able to adapt to changes in reimbursement, sustain our business model, and grow through acquisition and consolidation opportunities as they arise.
Key Challenges
Healthcare is a highly-regulated industry facing many well-publicized regulatory and reimbursement challenges. The industry also is facing uncertainty associated with the efforts to identify and implement workable coordinated care and integrated delivery payment models as well as post-acute site neutrality in Medicare reimbursement. The Medicare reimbursement systems for both inpatient rehabilitation and home health are subject to potentially significant changes in the next two years. The future of many aspects of healthcare regulation remains uncertain. Successful healthcare providers are those able to adapt to changes in the regulatory and operating environments, build strategic relationships across the healthcare continuum, and consistently provide high-quality, cost-effective care. We believe we have the necessary capabilities — change agility, strategic relationships, quality of patient outcomes, cost effectiveness, and ability to capitalize on growth opportunities — to adapt to and succeed in a dynamic, highly regulated industry, and we have a proven track record of doing so.
47
As we continue to execute our business plan, the following are some of the challenges we face.
|
•
|
Operating in a Highly Regulated Industry
. We are required to comply with extensive and complex laws and regulations at the federal, state, and local government levels. These rules and regulations have affected, or could in the future affect, our business activities by having an impact on the reimbursement we receive for services provided or the costs of compliance, mandating new documentation standards, requiring additional licensure or certification, regulating our relationships with physicians and other referral sources, regulating the use of our properties, and limiting our ability to enter new markets or add new capacity to existing hospitals and agencies. Ensuring continuous compliance with extensive laws and regulations is an operating requirement for all healthcare providers.
|
We have invested, and will continue to invest, substantial time, effort, and expense in implementing and maintaining training programs as well as internal controls and procedures designed to ensure regulatory compliance, and we are committed to continued adherence to these guidelines. More specifically, because Medicare comprises a significant portion of our
Net operating revenues
, failure to comply with the laws and regulations governing the Medicare program and related matters, including anti-kickback and anti-fraud requirements, could materially and adversely affect us. The federal government’s reliance on sub-regulatory guidance, such as handbooks, FAQs, internal memoranda, and press releases, presents a unique challenge to compliance efforts. Such sub-regulatory guidance purports to explain validly promulgated regulations but often expands or supplements existing regulations without constitutionally and statutorily required notice and comment and other procedural protections. Without procedural protections, sub-regulatory guidance poses a risk above and beyond reasonable efforts to follow validly promulgated regulations, particularly when the agency or Medicare Administrative Contractor (“MAC”) seeking to enforce such sub-regulatory guidance is not the agency or MAC issuing the guidance. If we were unable to remain compliant with these regulations, our financial position, results of operations, and cash flows could be materially, adversely impacted.
Concerns held by federal policymakers about the federal deficit and national debt levels, as well as other healthcare policy priorities, could result in enactment of legislation affecting portions of the Medicare program, including post-acute care services we provide. It is not clear what, if any, Medicare-related changes may ultimately be enacted and signed into law or otherwise implemented or caused by the Trump Administration through regulatory procedures, but it is possible that any reductions in Medicare spending will have a material impact on reimbursements for healthcare providers generally and post-acute providers specifically. We cannot predict what, if any, changes in Medicare spending or modifications to the healthcare laws and regulations will result from future budget or other legislative or regulatory initiatives.
On February 9, 2018, President Trump signed into law the Bipartisan Budget Act of 2018 (the “2018 Budget Act”). The 2018 Budget Act requires CMS to update the home health prospective payment system (the “HH-PPS”) with a market basket update of 1.5% and eliminates the productivity adjustment for 2020. The 2018 Budget Act also mandates several significant changes to the HH-PPS, including replacing in 2020 the 60-day unit of payment with a 30-day unit of payment methodology, while retaining the 60-day episode. We cannot predict the impact of these significant changes to the HH-PPS on our home health agencies and their Medicare reimbursements. See Item 1A,
Risk Factors,
for additional discussion on changes included in the 2018 Budget Act.
The Medicare Payment Advisory Commission (“MedPAC”) is an independent agency that advises Congress on issues affecting Medicare and makes payment policy recommendations to Congress and CMS for a variety of Medicare payment systems including, among others, the inpatient rehabilitation facility prospective payment system (the “IRF-PPS”) and the HH-PPS. Congress and CMS are not obligated to adopt MedPAC recommendations, and, based on outcomes in previous years, there can be no assurance those recommendations will be adopted. However, MedPAC’s recommendations have, and may in the future, become the basis for subsequent legislative or regulatory action. In recent years, MedPAC has made several recommendations that would significantly impact post-acute reimbursement systems if ultimately adopted. See Item 1A,
Risk Factors,
for additional discussion on MedPAC’s payment policy recommendations.
Each year, CMS adopts rules that update pricing and otherwise amend the respective payment systems. On July 31, 2018, CMS released its notice of final rulemaking for Fiscal Year 2019 under the IRF-PPS (the “2019 IRF Rule”). Based on our analysis which utilizes, among other things, the acuity of our patients over the 12-month period prior to the 2019 IRF Rule’s release and incorporates other adjustments included in it, we believe the 2019 Final IRF Rule will result in a net increase to our Medicare payment rates of approximately 1.2% effective October 1, 2018. Additionally, the 2019 IRF Rule finalized a change to the IRF-PPS, effective October 1,
48
2019, that replaces the FIM™ assessment instrument with new patient assessment measures, commonly referred to as “CARE Tool” measures. We and the IRF industry are still assessing the nature and magnitude of any impact this might have on aggregate Medicare reimbursements, which impact will depend in part on additional data and updates to be included in future rulemaking by CMS.
On October 31, 2018, CMS released its notice of final rulemaking for calendar year 2019 for home health agencies under the HH-PPS (the “2019 HH Rule”). Based on our analysis, we believe the 2019 HH Rule will result in a net increase to our Medicare home health payment rates of approximately 1.5% effective for episodes ending in calendar year 2019. Additionally, pursuant to the requirements of the 2018 Budget Act, the 2019 HH Rule sets out significant changes to the HH-PPS that will be adopted effective for calendar year 2020. The new payment system, referred to as the Patient-Driven Groupings Model (“PDGM”), replaces the current 60-day episode of payment methodology with 30-day payment periods and eliminates therapy usage as a factor in adjusting case-mix weighting. CMS previously proposed but has not yet adopted a 6.4% reduction in the base payment rate for 2020 intended to offset the provider behavioral changes that CMS assumes PDGM will drive. Based on 2017 data, and assuming no change in the foregoing and other factors, which are subject to potentially significant change, we estimate an approximate 3.8% incremental reduction (after 1.3% net market basket update mandated by the 2018 Budget Act) in Medicare payments assuming the PDGM is implemented on a budget neutral basis. For additional details of the 2019 IRF Rule, 2019 HH Rule, and other proposed and adopted legislative and regulatory actions that may be material to our business, see Item 1A,
Risk Factors
.
Reimbursement claims made by healthcare providers, including inpatient rehabilitation hospitals as well as home health and hospice agencies, are subject to audit from time to time by governmental payors and their agents, such as the MACs, fiscal intermediaries and carriers, as well as the Office of Inspector General, CMS, and state Medicaid programs. These audits as well as the ordinary course claim reviews of our billings result in payment denials, including recoupment of previously paid claims from current account receivables. Healthcare providers can challenge any denials through an administrative appeals process that can be extremely lengthy, taking up to eight years or longer. For additional details of these claim reviews, See Item 1A,
Risk Factors
and
Note 1,
Summary of Significant Accounting Policies
, “Accounts Receivable,” to the accompanying consolidated financial statements.
See also Item 1,
Business
, “Sources of Revenues” and “Regulation,” and Item 1A,
Risk Factors
, to this report and
Note 17,
Contingencies and Other Commitments
, “Governmental Inquiries and Investigations,” to the accompanying consolidated financial statements.
|
•
|
Changes to Our Operating Environment Resulting from Healthcare Reform
. Many provisions within the 2010 Healthcare Reform Laws have impacted, or could in the future impact, our business. Most notable for us are Medicare reimbursement reductions, such as reductions to annual market basket updates to providers and reimbursement rate rebasing adjustments, and promotion of alternative payment models, such as accountable care organizations (“ACOs”) and bundled payment initiatives such as the Bundled Payment for Care Improvement Initiative (“BPCI”), the Comprehensive Care for Joint Replacement (“CJR”) program, and the BPCI-Advanced program. Our challenges related to healthcare reform are discussed in Item 1,
Business
, “Sources of Revenues,” and Item 1A,
Risk Factors
.
|
While the change in administration has added to regulatory uncertainty, the healthcare industry in general has been facing uncertainty associated with the efforts to identify and implement workable coordinated care and integrated delivery payment models. In these models, hospitals, physicians, and other care providers work together to provide coordinated healthcare on a more efficient, patient-centered basis. These providers are then paid based on the efficiency and overall value and quality of the services they provide to a patient. While this is consistent with our goal and proven track record of being a high-quality, cost-effective provider, broad-based implementation of a new care delivery and payment model would represent a significant transformation for the healthcare industry. As the industry and its regulators explore this transformation, we are attempting to position the Company in preparation for whatever changes are ultimately made to the delivery system.
As discussed in Item 1,
Business
, the future of the 2010 Healthcare Reform Laws as well as the nature and substance of any replacement reform legislation enacted remain uncertain, nor can we predict whether other legislation affecting Medicare and post-acute care providers will be enacted, or what actions the Trump Administration may take or cause through the regulatory process that may result in modifications to the 2010 Healthcare Laws or the Medicare program. Therefore, the ultimate nature and timing of the transformation of the healthcare delivery system is uncertain, and will likely remain so for some time. We will continue to evaluate these laws and regulations and position the Company for this industry shift. Based on our track record, we believe
49
we can adapt to these regulatory and industry changes. Further, we have engaged, and will continue to engage, actively in discussions with key legislators and regulators to attempt to ensure any healthcare laws or regulations adopted or amended promote our goal of high-quality, cost-effective care.
Additionally, in October 2014, President Obama signed into law the IMPACT Act. The IMPACT Act was developed on a bi-partisan basis by the House Ways and Means and Senate Finance Committees and incorporated feedback from healthcare providers and provider organizations that responded to the Committees’ solicitation of post-acute payment reform ideas and proposals. It directs the United States Department of Health and Human Services (“HHS”), in consultation with healthcare stakeholders, to implement standardized data collection processes for post-acute quality and outcome measures. Although the IMPACT Act does not specifically call for the development of a new post-acute payment system, we believe this act will lay the foundation for possible future post-acute payment policies that would be based on patients’ medical conditions and other clinical factors rather than the setting where the care is provided, also referred to as “site neutral” reimbursement. For additional details on the IMPACT Act and efforts to implement a unified post-acute care payment system, see Item 1A,
Risk Factors
.
|
•
|
Maintaining Strong Volume Growth
. Various factors, including competition and increasing regulatory and administrative burdens, may impact our ability to maintain and grow our hospital, home health, and hospice volumes. In any particular market, we may encounter competition from local or national entities with longer operating histories or other competitive advantages, such as acute care hospitals who provide post-acute services similar to ours or other post-acute providers with relationships with referring acute care hospitals or physicians. Aggressive payment review practices by Medicare contractors, aggressive enforcement of regulatory policies by government agencies, and restrictive or burdensome rules, regulations or statutes governing admissions practices may lead us to not accept patients who would be appropriate for and would benefit from the services we provide. In addition, from time to time, we must get regulatory approval to expand our services and locations in states with certificate of need laws. This approval may be withheld or take longer than expected. In the case of new-store volume growth, the addition of hospitals, home health agencies, and hospice agencies to our portfolio also may be difficult and take longer than expected.
|
|
•
|
Recruiting and Retaining High-Quality Personnel
. See Item 1A,
Risk Factors
, for a discussion of competition for staffing, shortages of qualified personnel, and other factors that may increase our labor costs. Recruiting and retaining qualified personnel, including management, for our inpatient hospitals and home health and hospice agencies remain a high priority for us. We attempt to maintain a comprehensive compensation and benefits package that allows us to remain competitive in this challenging staffing environment while remaining consistent with our goal of being a high-quality, cost-effective provider of post-acute services.
|
See also Item 1,
Business
, and Item 1A,
Risk Factors
.
These key challenges notwithstanding, we believe we have a strong business model, a strong balance sheet, and a proven track record of achieving strong financial and operational results. We are attempting to position the Company to respond to changes in the healthcare delivery system and believe we will be in a position to take advantage of any opportunities that arise as the industry moves to this new stage. We believe we are positioned to continue to grow, adapt to external events, and create value for our shareholders in 2019 and beyond.
50
Results of Operations
Payor Mix
During
2018
,
2017
, and
2016
, we derived consolidated
Net operating revenues
from the following payor sources:
|
|
For the Year Ended December 31,
|
|||||||
|
|
2018
|
2017
|
2016
|
|||||
|
Medicare
|
75.9
|
%
|
76.0
|
%
|
75.6
|
%
|
||
|
Medicare Advantage
|
9.2
|
%
|
8.6
|
%
|
7.8
|
%
|
||
|
Managed care
|
8.8
|
%
|
9.3
|
%
|
9.7
|
%
|
||
|
Medicaid
|
2.6
|
%
|
2.5
|
%
|
3.0
|
%
|
||
|
Other third-party payors
|
1.1
|
%
|
1.3
|
%
|
1.4
|
%
|
||
|
Workers' compensation
|
0.7
|
%
|
0.7
|
%
|
0.8
|
%
|
||
|
Patients
|
0.5
|
%
|
0.5
|
%
|
0.5
|
%
|
||
|
Other income
|
1.2
|
%
|
1.1
|
%
|
1.2
|
%
|
||
|
Total
|
100.0
|
%
|
100.0
|
%
|
100.0
|
%
|
||
Our payor mix is weighted heavily towards Medicare. We receive Medicare reimbursements under the IRF-PPS, the HH-PPS, and the Hospice-PPS. For additional information regarding Medicare reimbursement, see the “Sources of Revenues” section of Item 1,
Business
.
As part of the Balanced Budget Act of 1997, Congress created a program of private, managed healthcare coverage for Medicare beneficiaries. This program has been referred to as Medicare Part C, or “Medicare Advantage.” The program offers beneficiaries a range of Medicare coverage options by providing a choice between the traditional fee-for-service program (under Medicare Parts A and B) or enrollment in a health maintenance organization, preferred provider organization, point-of-service plan, provider sponsor organization, or an insurance plan operated in conjunction with a medical savings account.
Our consolidated
Net operating revenues
consist primarily of revenues derived from patient care services.
Net operating revenues
also include other revenues generated from management and administrative fees and other non-patient care services. These other revenues are included in “other income” in the above table.
51
Our Results
From
2016
through
2018
, our consolidated results of operations were as follows:
|
|
For the Year Ended December 31,
|
Percentage Change
|
|||||||||||||||
|
|
2018
|
2017
|
2016
|
2018 vs. 2017
|
2017 vs. 2016
|
||||||||||||
|
|
(In Millions)
|
|
|
||||||||||||||
|
Net operating revenues
|
$
|
4,277.3
|
|
$
|
3,913.9
|
|
$
|
3,642.6
|
|
9.3
|
%
|
7.4
|
%
|
||||
|
Operating expenses:
|
|
|
|
|
|
|
|
|
|
|
|||||||
|
Salaries and benefits
|
2,354.0
|
|
2,154.6
|
|
1,985.9
|
|
9.3
|
%
|
8.5
|
%
|
|||||||
|
Other operating expenses
|
585.1
|
|
531.6
|
|
490.6
|
|
10.1
|
%
|
8.4
|
%
|
|||||||
|
Occupancy costs
|
78.0
|
|
73.5
|
|
71.3
|
|
6.1
|
%
|
3.1
|
%
|
|||||||
|
Supplies
|
158.7
|
|
149.3
|
|
140.0
|
|
6.3
|
%
|
6.6
|
%
|
|||||||
|
General and administrative expenses
|
220.2
|
|
171.7
|
|
133.4
|
|
28.2
|
%
|
28.7
|
%
|
|||||||
|
Depreciation and amortization
|
199.7
|
|
183.8
|
|
172.6
|
|
8.7
|
%
|
6.5
|
%
|
|||||||
|
Government, class action, and related settlements
|
52.0
|
|
—
|
|
—
|
|
N/A
|
|
N/A
|
|
|||||||
|
Total operating expenses
|
3,647.7
|
|
3,264.5
|
|
2,993.8
|
|
11.7
|
%
|
9.0
|
%
|
|||||||
|
Loss on early extinguishment of debt
|
—
|
|
10.7
|
|
7.4
|
|
(100.0
|
)%
|
44.6
|
%
|
|||||||
|
Interest expense and amortization of debt discounts and fees
|
147.3
|
|
154.4
|
|
172.1
|
|
(4.6
|
)%
|
(10.3
|
)%
|
|||||||
|
Other income
|
(2.2
|
)
|
(4.1
|
)
|
(2.9
|
)
|
(46.3
|
)%
|
41.4
|
%
|
|||||||
|
Equity in net income of nonconsolidated affiliates
|
(8.7
|
)
|
(8.0
|
)
|
(9.8
|
)
|
8.8
|
%
|
(18.4
|
)%
|
|||||||
|
Income from continuing operations before income tax expense
|
493.2
|
|
496.4
|
|
482.0
|
|
(0.6
|
)%
|
3.0
|
%
|
|||||||
|
Provision for income tax expense
*
|
118.9
|
|
145.8
|
|
163.9
|
|
(18.4
|
)%
|
(11.0
|
)%
|
|||||||
|
Income from continuing operations
*
|
374.3
|
|
350.6
|
|
318.1
|
|
6.8
|
%
|
10.2
|
%
|
|||||||
|
Income (loss) from discontinued operations, net of tax
|
1.1
|
|
(0.4
|
)
|
—
|
|
(375.0
|
)%
|
N/A
|
|
|||||||
|
Net income
*
|
375.4
|
|
350.2
|
|
318.1
|
|
7.2
|
%
|
10.1
|
%
|
|||||||
|
Less: Net income attributable to noncontrolling interests
|
(83.1
|
)
|
(79.1
|
)
|
(70.5
|
)
|
5.1
|
%
|
12.2
|
%
|
|||||||
|
Net income attributable to Encompass Health
*
|
$
|
292.3
|
|
$
|
271.1
|
|
$
|
247.6
|
|
7.8
|
%
|
9.5
|
%
|
||||
(*)
2017 amounts have been revised to correct an error in our deferred tax assets as discussed in
Note 1,
Summary of Significant Accounting Policies
, “Revision of Previously Issued Financial Statements,” to the accompanying consolidated financial statements.
Operating Expenses as a % of Net Operating Revenues
|
|
For the Year Ended December 31,
|
|||||||
|
|
2018
|
2017
|
2016
|
|||||
|
Operating expenses:
|
||||||||
|
Salaries and benefits
|
55.0
|
%
|
55.0
|
%
|
54.5
|
%
|
||
|
Other operating expenses
|
13.7
|
%
|
13.6
|
%
|
13.5
|
%
|
||
|
Occupancy costs
|
1.8
|
%
|
1.9
|
%
|
2.0
|
%
|
||
|
Supplies
|
3.7
|
%
|
3.8
|
%
|
3.8
|
%
|
||
|
General and administrative expenses
|
5.1
|
%
|
4.4
|
%
|
3.7
|
%
|
||
|
Depreciation and amortization
|
4.7
|
%
|
4.7
|
%
|
4.7
|
%
|
||
|
Government, class action, and related settlements
|
1.2
|
%
|
—
|
%
|
—
|
%
|
||
|
Total operating expenses
|
85.3
|
%
|
83.4
|
%
|
82.2
|
%
|
||
52
In the discussion that follows, we use “same-store” comparisons to explain the changes in certain performance metrics and line items within our financial statements. We calculate same-store comparisons based on hospitals and home health locations open throughout both the full current period and prior periods presented. These comparisons include the financial results of market consolidation transactions in existing markets, as it is difficult to determine, with precision, the incremental impact of these transactions on our results of operations.
2018
Compared to
2017
Net Operating Revenues
Our consolidated
Net operating revenues
increased in
2018
compared to
2017
primarily from pricing and volume growth in our inpatient rehabilitation segment and volume growth in our home health and hospice segment. Our consolidated
Net operating revenues
in
2018
benefited from a year-over-year reduction in revenue reserves as a result of a reduction in pre-payment claims denials in our inpatient rehabilitation segment.
Salaries and Benefits
Salaries and benefits
are the most significant cost to us and represent an investment in our most important asset: our employees.
Salaries and benefits
include all amounts paid to full- and part-time employees who directly participate in or support the operations of our hospitals and home health and hospice agencies, including all related costs of benefits provided to employees. It also includes amounts paid for contract labor.
Salaries and benefits
increased in
2018
compared to
2017
primarily due to increased patient volumes, including an increase in the number of full-time equivalents as a result of our development activities, salary increases for our employees, and an increase in benefit costs.
Salaries and benefits
as a percent of
Net operating revenues
during
2018
was flat compared to
2017
.
Other Operating Expenses
Other operating expenses
include costs associated with managing and maintaining our hospitals and home health and hospice agencies. These expenses include such items as contract services, non-income related taxes, professional fees, utilities, insurance, and repairs and maintenance.
Other operating expenses
increased during
2018
compared to
2017
primarily due to increased patient volumes and hurricane-related expenses and losses.
Other operating expenses
increased as a percent of
Net operating revenues
during
2018
compared to
2017
due primarily to increases in contract services and provider taxes.
Supplies
Supplies
expense includes all costs associated with supplies used while providing patient care. Specifically, these costs include pharmaceuticals, food, needles, bandages, and other similar items.
Supplies
increased during
2018
compared to
2017
due primarily to increased patient volumes.
General and Administrative Expenses
General and administrative expenses
primarily include administrative expenses such as information technology services, human resources, corporate accounting, legal services, and internal audit and controls that are managed from our home office in Birmingham, Alabama. These expenses also include stock-based compensation expenses.
General and administrative expenses
increased in
2018
compared to
2017
in terms of dollars and as a percent of
Net operating revenues
due primarily to increased corporate salary and benefit costs, including expenses associated with stock appreciation rights, and costs associated with our rebranding. The 2018 SARs expense was approximately $56 million compared to approximately $26 million in 2017. The 2018 rebranding expenses were approximately $11 million compared to approximately $6 million in 2017. For additional information on stock appreciation rights, see Note 13,
Share-Based Payments
, to the accompanying consolidated financial statements, and on the rebranding, see the “Executive Overview” section of this Item.
53
Depreciation and Amortization
Depreciation and amortization
increased during
2018
compared to
2017
due to our capital expenditures and development activities throughout
2017
and
2018
. We expect
Depreciation and amortization
to increase going forward as a result of our recent and ongoing capital investments.
Government, Class Action, and Related Settlements
The amount in
Government, class action, and related settlements
in 2018 related primarily to a $48 million loss contingency accrual we established in the fourth quarter of 2018 for the potential settlement of the investigation being conducted by the United States Department of Justice. See Note 17,
Contingencies and Other Commitments
, to the accompanying consolidated financial statements for additional information on this matter.
Loss on Early Extinguishment of Debt
The
Loss on early extinguishment of debt
during 2017 primarily resulted from exercising the early redemption option on all $320 million of Convertible Notes resulting in the issuance of 8.9 million shares of common stock. See Note
9
,
Long-term Debt
, to the accompanying consolidated financial statements.
Interest Expense and Amortization of Debt Discounts and Fees
The decrease in
Interest expense and amortization of debt discounts and fees
in
2018
compared to
2017
primarily resulted from the redemption of the 2.0% Convertible Senior Subordinated Notes due 2043 in June 2017. Cash paid for interest approximated
$150 million
and
$151 million
in
2018
and
2017
, respectively. See Note
9
,
Long-term Debt
, to the accompanying consolidated financial statements.
Income from Continuing Operations Before Income Tax Expense
Our pre-tax income from continuing operations in
2018
decreased compared to
2017
due primarily to the contingency accrual we established in the fourth quarter of 2018, as discussed above.
Provision for Income Tax Expense
Our effective income tax rate for
2018
was
24.1%
which was greater than the federal statutory rate primarily due to: (1)
state and other income tax expense and (2) nondeductible settlements offset by (3)
the impact of noncontrolling interests. See
Note 1,
Summary of Significant Accounting Policies
, “Income Taxes,” for a discussion of the allocation of income or loss related to pass-through entities, which is referred to as the impact of noncontrolling interests in this discussion. Our
Provision for income tax expense
declined in
2018
compared to
2017
due primarily to the impact of the 2017 Tax Cuts and Jobs Act (the “Tax Act”) discussed below and in Note
15
,
Income Taxes
, to the accompanying consolidated financial statements.
Our effective income tax rate for
2017
was
29.4%
which was less than the federal statutory rate primarily due to: (1) the impact of noncontrolling interests, (2) the impact of the Tax Act and (3) share-based windfall tax benefits offset by (4) state and other income tax expense. On December 22, 2017, the US enacted the Tax Act. The Tax Act, which is commonly referred to as “US tax reform,” significantly changes US corporate income tax laws by, among other things, reducing the US corporate income tax rate from 35% to 21% starting in 2018.
Our cash payments for income taxes approximated $115 million, net of refunds, in 2018. These payments were based on estimates of taxable income for 2018. We estimate we will pay approximately $110 million to $130 million of cash income taxes, net of refunds, in 2019. Our estimate of 2019 cash taxes considers that some or all of the deferred revenue discussed in Note
15
,
Income Taxes
, to the accompanying consolidated financial statements, will be reversed. In
2018
and
2017
, current income tax expense was
$128.0 million
and
$85.0 million
, respectively.
In certain jurisdictions, we do not expect to generate sufficient income to use all of the available state NOLs and other credits prior to their expiration. This determination is based on our evaluation of all available evidence in these jurisdictions including results of operations during the preceding three years, our forecast of future earnings, and prudent tax planning strategies. It is possible we may be required to increase or decrease our valuation allowance at some future time if our forecast of future earnings varies from actual results on a consolidated basis or in the applicable tax jurisdiction, if the timing of future tax deductions differs from our expectations, or pursuant to changes in state tax laws and rates.
54
We recognize the financial statement effects of uncertain tax positions when it is more likely than not, based on the technical merits, a position will be sustained upon examination by and resolution with the taxing authorities. Total remaining gross unrecognized tax benefits were
$0.9 million
and
$0.3 million
as of December 31,
2018
and
2017
, respectively.
See Note
15
,
Income Taxes
, to the accompanying consolidated financial statements and the “Critical Accounting Estimates” section of this Item.
Net Income Attributable to Noncontrolling Interests
The increase in
Net income attributable to noncontrolling interests
during 2018 compared to the same period of 2017 primarily resulted from our 2017 joint ventures and increased profitability of our existing joint ventures. See Note 2,
Business Combinations
, to the accompanying consolidated financial statements of this report for information regarding our 2017 joint ventures.
2017 Compared to 2016
Net Operating Revenues
Our consolidated
Net operating revenues
increased in 2017 compared to 2016 primarily from pricing and volume growth in our inpatient rehabilitation segment and volume growth in our home health and hospice segment. Our consolidated
Net operating revenues
in 2017 benefited from a year-over-year reduction in revenue reserves as a result of a reduction in pre-payment claims denials in our inpatient rehabilitation segment.
Salaries and Benefits
Salaries and benefits
increased in 2017 compared to 2016 primarily due to increased patient volumes, including an increase in the number of full-time equivalents as a result of our 2017 and 2016 development activities, salary increases for our employees, and an increase in benefit costs.
Salaries and benefits
as a percent of
Net operating revenues
increased during 2017 compared to 2016 primarily as a result of an increase in full-time equivalents, which contributed to higher employees per occupied bed, and salary and benefit cost increases. Full-time equivalents increased due to staffing increases at the former Reliant hospitals since their acquisition on October 1, 2015 and the ramping up of new hospitals in Hot Springs, Arkansas; Bryan, Texas; Broken Arrow, Oklahoma; Modesto, California; Gulfport, Mississippi; Westerville, Ohio; Jackson, Tennessee; and Pearland, Texas.
Other Operating Expenses
Other operating expenses
increased during 2017 compared to 2016 primarily due to increased patient volumes and hurricane-related expenses and losses.
Other operating expenses
during 2016 included a $3.3 million gain from the divestiture of our home health pediatric services in November 2016. See Note 7,
Goodwill and Other Intangible Assets,
to the accompanying consolidated financial statements.
Other operating expenses
increased as a percent of
Net operating revenues
during 2017 compared to 2016 due to the aforementioned divestiture gain, IME adjustment described in the “Segment Results of Operations” section of this Item, and hurricane-related expenses and losses.
Supplies
Supplies
increased in terms of dollars during 2017 compared to 2016 due primarily to increased patient volumes.
General and Administrative Expenses
General and administrative expenses
increased in 2017 compared to 2016 in terms of dollars and as a percent of
Net operating revenues
due primarily to increased corporate salary and benefit costs, including expenses associated with stock appreciation rights, our rebranding and name change, and the TeamWorks clinical collaboration initiative. For additional information on stock appreciation rights, see Note 13,
Share-Based Payments
, to the accompanying consolidated financial statements, on the rebranding and name change, see the “Executive Overview” section of this Item, and on the TeamWorks clinical collaboration initiative, see Item 1,
Business
, “Overview of the Company—Competitive Strengths,” of this report.
Depreciation and Amortization
Depreciation and amortization
increased during 2017 compared to 2016 due to our acquisitions and capital expenditures throughout 2016 and 2017.
55
Loss on Early Extinguishment of Debt
The
Loss on early extinguishment of debt
during 2017 primarily resulted from exercising the early redemption option on all $320 million of Convertible Notes resulting in the issuance of 8.9 million shares of common stock. The
Loss on early extinguishment of debt
during 2016 resulted from the redemptions of our 2022 Notes in 2016. See Note 9,
Long-term Debt
, to the accompanying consolidated financial statements.
Interest Expense and Amortization of Debt Discounts and Fees
The decrease in
Interest expense and amortization of debt discounts and fees
in 2017 compared to 2016 primarily resulted from the redemptions of our 2022 Notes in 2016. Cash paid for interest approximated $151 million and $164 million in 2017 and 2016, respectively. See Note 9,
Long-term Debt
, to the accompanying consolidated financial statements.
Income from Continuing Operations Before Income Tax Expense
Our pre-tax income from continuing operations in 2017 increased compared to 2016 due to increased
Net operating revenues
as discussed above.
Provision for Income Tax Expense
Our effective income tax rate for 2017 was 29.4% which was less than the federal statutory rate primarily due to: (1) the impact of noncontrolling interests, (2) the impact of the Tax Act and (3) share-based windfall tax benefits offset by (4) state and other income tax expense. As discussed above, 2017 also included the impact of the Tax Act. Our effective income tax rate for 2016 was 34.0%. Our
Provision for income tax expense
in 2016 was less than the federal statutory rate primarily due to: (1) the impact of noncontrolling interests offset by (2) state and other income tax expense.
Total remaining gross unrecognized tax benefits were $0.3 million and $2.8 million as of December 31, 2017 and 2016, respectively. See Note 15,
Income Taxes
, to the accompanying consolidated financial statements and the “Critical Accounting Estimates” section of this Item.
Net Income Attributable to Noncontrolling Interests
The increase in
Net income attributable to noncontrolling interests
during 2017 compared to the same period of 2016 primarily resulted from increased profitability of our joint ventures and a net tax benefit resulting from the application of the Tax Act’s new corporate income tax rate to our joint venture entities’ deferred tax liabilities.
Impact of Inflation
The impact of inflation on the Company will be primarily in the area of labor costs. The healthcare industry is labor intensive. Wages and other expenses increase during periods of inflation and when labor shortages occur in the marketplace. There can be no guarantee we will not experience increases in the cost of labor, as the need for clinical healthcare professionals is expected to grow. In addition, increases in healthcare costs are typically higher than inflation and impact our costs under our employee benefit plans. Managing these costs remains a significant challenge and priority for us.
Suppliers pass along rising costs to us in the form of higher prices. Our supply chain efforts and our continual focus on monitoring and actively managing pharmaceutical costs has enabled us to accommodate increased pricing related to supplies and other operating expenses over the past few years. However, we cannot predict our ability to cover future cost increases.
It should be noted that we have little or no ability to pass on these increased costs associated with providing services to Medicare and Medicaid patients due to federal and state laws that establish fixed reimbursement rates.
Relationships and Transactions with Related Parties
Related party transactions were not material to our operations in 2018, 2017, or 2016, and therefore, are not presented as a separate discussion within this Item.
56
Segment Results of Operations
Our internal financial reporting and management structure is focused on the major types of services provided by Encompass Health. We manage our operations using two operating segments which are also our reportable segments: (1) inpatient rehabilitation and (2) home health and hospice. For additional information regarding our business segments, including a detailed description of the services we provide, financial data for each segment, and a reconciliation of total segment Adjusted EBITDA to income from continuing operations before income tax expense, see
Note 18,
Segment Reporting
, to the accompanying consolidated financial statements.
Inpatient Rehabilitation
During the years ended
December 31, 2018
,
2017
and
2016
, our inpatient rehabilitation segment derived its
Net operating revenues
from the following payor sources:
|
For the Year Ended December 31,
|
||||||||
|
|
2018
|
2017
|
2016
|
|||||
|
Medicare
|
73.2
|
%
|
73.6
|
%
|
73.7
|
%
|
||
|
Medicare Advantage
|
9.2
|
%
|
8.3
|
%
|
7.7
|
%
|
||
|
Managed care
|
10.3
|
%
|
10.7
|
%
|
11.0
|
%
|
||
|
Medicaid
|
3.0
|
%
|
3.0
|
%
|
2.9
|
%
|
||
|
Other third-party payors
|
1.5
|
%
|
1.6
|
%
|
1.7
|
%
|
||
|
Workers’ compensation
|
0.8
|
%
|
0.9
|
%
|
1.0
|
%
|
||
|
Patients
|
0.6
|
%
|
0.6
|
%
|
0.6
|
%
|
||
|
Other income
|
1.4
|
%
|
1.3
|
%
|
1.4
|
%
|
||
|
Total
|
100.0
|
%
|
100.0
|
%
|
100.0
|
%
|
||
57
Additional information regarding our inpatient rehabilitation segment’s operating results for the years ended
December 31, 2018
,
2017
and
2016
, is as follows:
|
For the Year Ended December 31,
|
Percentage Change
|
||||||||||||||||
|
2018
|
2017
|
2016
|
2018 vs. 2017
|
2017 vs. 2016
|
|||||||||||||
|
(In Millions, Except Percentage Change)
|
|||||||||||||||||
|
Net operating revenues:
|
|||||||||||||||||
|
Inpatient
|
$
|
3,247.9
|
|
$
|
3,039.3
|
|
$
|
2,853.9
|
|
6.9
|
%
|
6.5
|
%
|
||||
|
Outpatient and other
|
98.3
|
|
102.0
|
|
110.2
|
|
(3.6
|
)%
|
(7.4
|
)%
|
|||||||
|
Inpatient rehabilitation segment revenues
|
3,346.2
|
|
3,141.3
|
|
2,964.1
|
|
6.5
|
%
|
6.0
|
%
|
|||||||
|
Operating expenses:
|
|||||||||||||||||
|
Salaries and benefits
|
1,701.5
|
|
1,603.8
|
|
1,493.4
|
|
6.1
|
%
|
7.4
|
%
|
|||||||
|
Other operating expenses
|
502.3
|
|
462.5
|
|
431.5
|
|
8.6
|
%
|
7.2
|
%
|
|||||||
|
Supplies
|
140.6
|
|
135.7
|
|
128.8
|
|
3.6
|
%
|
5.4
|
%
|
|||||||
|
Occupancy costs
|
63.8
|
|
61.9
|
|
61.2
|
|
3.1
|
%
|
1.1
|
%
|
|||||||
|
Other income
|
(3.6
|
)
|
(4.1
|
)
|
(2.9
|
)
|
(12.2
|
)%
|
41.4
|
%
|
|||||||
|
Equity in net income of nonconsolidated affiliates
|
(7.5
|
)
|
(7.3
|
)
|
(9.1
|
)
|
2.7
|
%
|
(19.8
|
)%
|
|||||||
|
Noncontrolling interests
|
77.2
|
|
67.6
|
|
64.0
|
|
14.2
|
%
|
5.6
|
%
|
|||||||
|
Segment Adjusted EBITDA
|
$
|
871.9
|
|
$
|
821.2
|
|
$
|
797.2
|
|
6.2
|
%
|
3.0
|
%
|
||||
|
(Actual Amounts)
|
|||||||||||||||||
|
Discharges
|
179,846
|
|
171,922
|
|
165,305
|
|
4.6
|
%
|
4.0
|
%
|
|||||||
|
Net patient revenue per discharge
|
$
|
18,059
|
|
$
|
17,678
|
|
$
|
17,264
|
|
2.2
|
%
|
2.4
|
%
|
||||
|
Outpatient visits
|
488,754
|
|
576,345
|
|
640,702
|
|
(15.2
|
)%
|
(10.0
|
)%
|
|||||||
|
Average length of stay (days)
|
12.6
|
|
12.7
|
|
12.8
|
|
(0.8
|
)%
|
(0.8
|
)%
|
|||||||
|
Occupancy %
|
69.3
|
%
|
67.8
|
%
|
67.8
|
%
|
2.2
|
%
|
—
|
%
|
|||||||
|
# of licensed beds
|
8,966
|
|
8,851
|
|
8,504
|
|
1.3
|
%
|
4.1
|
%
|
|||||||
|
Full-time equivalents*
|
21,335
|
|
20,802
|
|
19,833
|
|
2.6
|
%
|
4.9
|
%
|
|||||||
|
Employees per occupied bed
|
3.43
|
|
3.47
|
|
3.44
|
|
(1.2
|
)%
|
0.9
|
%
|
|||||||
|
*
|
Full-time equivalents included in the above table represent our employees who participate in or support the operations of our hospitals and include an estimate of full-time equivalents related to contract labor.
|
We actively manage the productive portion of our
Salaries and benefits
utilizing certain metrics, including employees per occupied bed, or “EPOB.” This metric is determined by dividing the number of full-time equivalents, including an estimate of full-time equivalents from the utilization of contract labor, by the number of occupied beds during each period. The number of occupied beds is determined by multiplying the number of licensed beds by our occupancy percentage.
Operating Expenses as a % of Net Operating Revenues
|
|
For the Year Ended December 31,
|
|||||||
|
|
2018
|
2017
|
2016
|
|||||
|
Operating expenses:
|
||||||||
|
Salaries and benefits
|
50.8
|
%
|
51.1
|
%
|
50.4
|
%
|
||
|
Other operating expenses
|
15.0
|
%
|
14.7
|
%
|
14.6
|
%
|
||
|
Supplies
|
4.2
|
%
|
4.3
|
%
|
4.3
|
%
|
||
|
Occupancy costs
|
1.9
|
%
|
2.0
|
%
|
2.1
|
%
|
||
58
2018
Compared to
2017
Net Operating Revenues
Net operating revenues
were
6.5%
higher for 2018 compared to 2017. This increase included a
4.6%
increase in patient discharges and a
2.2%
increase in net patient revenue per discharge. Discharge growth included a
2.8%
increase in same-store discharges. Discharge growth from new stores resulted from our joint ventures in Gulfport, Mississippi (April 2017), Westerville, Ohio (April 2017), Jackson, Tennessee (July 2017), Murrells Inlet, South Carolina (September 2018) and Winston-Salem, North Carolina (October 2018), as well as wholly owned hospitals in Pearland, Texas (October 2017), Shelby County, Alabama (April 2018), and Bluffton, South Carolina (June 2018). Growth in net patient revenue per discharge primarily resulted from an increase in reimbursement rates from all payors and improvements in discharge destinations. The decrease in outpatient and other revenues in 2018 compared to 2017 was primarily due to the continued closures of hospital-based outpatient programs.
See
Note 2,
Business Combinations
, to the accompanying consolidated financial statements of this report for information regarding our joint ventures discussed above.
Adjusted EBITDA
The increase in Adjusted EBITDA for the inpatient rehabilitation segment in 2018 compared to 2017 primarily resulted from revenue growth, as discussed above. Expense ratios benefited from retroactive price adjustments and a year-over-year reduction in revenue reserves, as discussed above.
Salaries and benefits
as a percent of
Net operating revenues
benefited from labor management and higher volumes, which contributed to lower employees per occupied bed.
Other operating expenses
increased as a percent of
Net operating revenues
primarily due to increases in contract services and provider taxes.
2017 Compared to 2016
Net Operating Revenues
Net operating revenues
were 6.0% higher for 2017 compared to 2016. This increase included a 4.0% increase in patient discharges and a 2.4% increase in net patient revenue per discharge. Discharge growth included a
3.2
% increase in same-store discharges. Discharge growth from new stores resulted from our joint ventures in Hot Springs, Arkansas (February 2016), Bryan, Texas (August 2016), Broken Arrow, Oklahoma (August 2016), Gulfport, Mississippi (April 2017), Westerville, Ohio (April 2017), and Jackson, Tennessee (July 2017), as well as the opening of wholly owned hospitals in Modesto, California (October 2016) and Pearland, Texas (October 2017). Growth in net patient revenue per discharge resulted primarily from patient mix (higher percentage of stroke and neurological patients) offset by the negative impact of an approximate $5 million reduction in prior period cost report adjustments and a 2016 benefit of a retroactive indirect medical education (“IME”) adjustment of approximately $4 million at the former Reliant hospital in Woburn, Massachusetts. The decrease in outpatient and other revenues in 2017 compared to 2016 was primarily due to the closure of six outpatient programs in the latter half of 2016.
See Note 2,
Business Combinations
, to the accompanying consolidated financial statements of this report for information regarding our joint ventures discussed above.
Adjusted EBITDA
The increase in Adjusted EBITDA for the inpatient rehabilitation segment in 2017 compared to 2016 primarily resulted from revenue growth, as discussed above. A decline in revenue reserves
and flat group medical expenses also contributed to the growth. Expense ratios were negatively impacted by the aforementioned IME adjustment and hurricane-related expenses. The lack of growth in group medical expense favorably impacted
Salaries and benefits
as a percent of
Net operating revenues
and served to offset the impact of merit and incentive compensation increases and the ramping up of new stores on this ratio.
Other operating expenses
increased as a percent of
Net operating revenues
primarily due to increased provider tax expense in the fourth quarter of 2017 and the impact of favorable franchise tax recoveries in the fourth quarter of 2016.
59
Home Health and Hospice
During the years ended
December 31, 2018
,
2017
and
2016
, our home health and hospice segment derived its
Net operating revenues
from the following payor sources:
|
For the Year Ended December 31,
|
||||||||
|
|
2018
|
2017
|
2016
|
|||||
|
Medicare
|
85.3
|
%
|
85.7
|
%
|
83.4
|
%
|
||
|
Medicare Advantage
|
9.5
|
%
|
9.7
|
%
|
8.7
|
%
|
||
|
Managed care
|
3.6
|
%
|
3.8
|
%
|
3.9
|
%
|
||
|
Medicaid
|
1.2
|
%
|
0.6
|
%
|
3.8
|
%
|
||
|
Workers’ compensation
|
0.2
|
%
|
—
|
%
|
—
|
%
|
||
|
Patients
|
0.1
|
%
|
0.1
|
%
|
0.1
|
%
|
||
|
Other income
|
0.1
|
%
|
0.1
|
%
|
0.1
|
%
|
||
|
Total
|
100.0
|
%
|
100.0
|
%
|
100.0
|
%
|
||
60
Additional information regarding our home health and hospice segment’s operating results for the years ended
December 31, 2018
,
2017
and
2016
, is as follows:
|
For the Year Ended December 31,
|
Percentage Change
|
||||||||||||||||
|
2018
|
2017
|
2016
|
2018 vs. 2017
|
2017 vs. 2016
|
|||||||||||||
|
(In Millions, Except Percentage Change)
|
|||||||||||||||||
|
Net operating revenues:
|
|||||||||||||||||
|
Home health
|
$
|
814.6
|
|
$
|
702.4
|
|
$
|
630.8
|
|
16.0
|
%
|
11.4
|
%
|
||||
|
Hospice
|
116.5
|
|
70.2
|
|
47.7
|
|
66.0
|
%
|
47.2
|
%
|
|||||||
|
Home health and hospice segment revenues
|
931.1
|
|
772.6
|
|
678.5
|
|
20.5
|
%
|
13.9
|
%
|
|||||||
|
Operating expenses:
|
|||||||||||||||||
|
Cost of services sold (excluding depreciation and amortization)
|
438.4
|
|
363.3
|
|
333.1
|
|
20.7
|
%
|
9.1
|
%
|
|||||||
|
Support and overhead costs
|
323.5
|
|
277.2
|
|
237.2
|
|
16.7
|
%
|
16.9
|
%
|
|||||||
|
Other income
|
(0.5
|
)
|
—
|
|
—
|
|
100.0
|
%
|
N/A
|
|
|||||||
|
Equity in net income of nonconsolidated affiliates
|
(1.2
|
)
|
(0.7
|
)
|
(0.7
|
)
|
71.4
|
%
|
—
|
%
|
|||||||
|
Noncontrolling interests
|
8.5
|
|
6.9
|
|
6.5
|
|
23.2
|
%
|
6.2
|
%
|
|||||||
|
Segment Adjusted EBITDA
|
$
|
162.4
|
|
$
|
125.9
|
|
$
|
102.4
|
|
29.0
|
%
|
22.9
|
%
|
||||
|
(Actual Amounts)
|
|||||||||||||||||
|
Home health:
|
|||||||||||||||||
|
Admissions
|
137,396
|
|
124,870
|
|
106,712
|
|
10.0
|
%
|
17.0
|
%
|
|||||||
|
Recertifications
|
111,581
|
|
92,989
|
|
82,195
|
|
20.0
|
%
|
13.1
|
%
|
|||||||
|
Episodes
|
243,698
|
|
211,743
|
|
185,737
|
|
15.1
|
%
|
14.0
|
%
|
|||||||
|
Revenue per episode
|
$
|
2,968
|
|
$
|
2,984
|
|
$
|
3,017
|
|
(0.5
|
)%
|
(1.1
|
)%
|
||||
|
Episodic visits per episode
|
17.6
|
|
17.9
|
|
18.8
|
|
(1.7
|
)%
|
(4.8
|
)%
|
|||||||
|
Total visits
|
4,959,645
|
|
4,390,958
|
|
3,940,295
|
|
13.0
|
%
|
11.4
|
%
|
|||||||
|
Cost per visit
|
$
|
76
|
|
$
|
75
|
|
$
|
74
|
|
1.3
|
%
|
1.4
|
%
|
||||
|
Hospice:
|
|||||||||||||||||
|
Admissions
|
7,474
|
|
4,870
|
|
3,337
|
|
53.5
|
%
|
45.9
|
%
|
|||||||
|
Patient days
|
790,984
|
|
479,350
|
|
322,519
|
|
65.0
|
%
|
48.6
|
%
|
|||||||
|
Revenue per day
|
$
|
147
|
|
$
|
146
|
|
$
|
147
|
|
0.7
|
%
|
(0.7
|
)%
|
||||
Operating Expenses as a % of Net Operating Revenues
|
|
For the Year Ended December 31,
|
|||||||
|
|
2018
|
2017
|
2016
|
|||||
|
Operating expenses:
|
||||||||
|
Cost of services sold (excluding depreciation and amortization)
|
47.1
|
%
|
47.0
|
%
|
49.1
|
%
|
||
|
Support and overhead costs
|
34.7
|
%
|
35.9
|
%
|
35.0
|
%
|
||
2018
Compared to
2017
Net Operating Revenues
Revenue growth of
20.5%
in the home health and hospice segment was primarily driven by volume growth, including a
5.6%
increase in home health same-store admissions and the impact of the Camellia Healthcare acquisition in May 2018. The
61
year-over-year decrease in revenue per episode resulted from Medicare reimbursement rate cuts that were partially offset by changes in patient mix. Hospice revenue increased primarily due to acquisitions and same-store admission growth of 24.6%.
See
Note 2,
Business Combinations
, to the accompanying consolidated financial statements of this report for information regarding our acquisitions discussed above.
Adjusted EBITDA
The increase in Adjusted EBITDA during 2018 compared to 2017 primarily resulted from revenue growth, as discussed above. Expense ratios were negatively impacted by Medicare reimbursement rate cuts.
Cost of services
as a percent of
Net operating revenues
increased for 2018 compared to 2017 primarily due to merit increases and the integration of Camellia offset by continued focus on caregiver optimization and productivity in home health and increased scale and efficiencies in hospice.
Support and overhead costs
as a percent of
Net operating revenues
decreased for 2018 compared to 2017 primarily due to operating leverage resulting from revenue growth.
2017 Compared to 2016
Net Operating Revenues
Home health and hospice revenue was 13.9% higher during 2017 compared to 2016. This increase included a 17.0% increase in home health admissions and was impacted by a 1.1% decrease in revenue per episode. Home health revenue growth resulted from strong volume growth, which included an 11.4% increase in same-store admissions. The decrease in revenue per episode resulted from Medicare reimbursement rate cuts partially offset by changes in patient mix and reconciliation payments attributed to various alternative payment models (e.g., BPCI; ACOs). The increase in hospice revenue primarily resulted from acquisitions. For additional information on BPCI and ACOs, see Item 1A,
Risk Factors
.
The percentage of our home health and hospice revenue derived from Medicaid decreased during 2017 compared to 2016 as a result of the divestiture of our pediatric home health assets in November 2016. See Note 7,
Goodwill and Other Intangible Assets
, to the accompanying consolidated financial statements.
Adjusted EBITDA
The increase in Adjusted EBITDA during 2017 compared to 2016 primarily resulted from revenue growth and staffing productivity gains. Adjusted EBITDA for the segment during 2017 was impacted by Medicare reimbursement rate cuts, higher cost per visit (driven by an increased percentage of therapy patients) and salary and benefit cost increases as a result of continued investments in additional sales and marketing associates.
Liquidity and Capital Resources
Our primary sources of liquidity are cash on hand, cash flows from operations, and borrowings under our revolving credit facility.
The objectives of our capital structure strategy are to ensure we maintain adequate liquidity and flexibility. Pursuing and achieving those objectives allow us to support the execution of our operating and strategic plans and weather temporary disruptions in the capital markets and general business environment. Maintaining adequate liquidity is a function of our unrestricted
Cash and cash equivalents
and our available borrowing capacity. Maintaining flexibility in our capital structure is a function of, among other things, the amount of debt maturities in any given year, the options for debt prepayments without onerous penalties, and limiting restrictive terms and maintenance covenants in our debt agreements.
We have been disciplined in creating a capital structure that is flexible with no significant debt maturities prior to 2022. We continue to have a strong, well-capitalized balance sheet, including a substantial portfolio of owned real estate, and we have significant availability under our revolving credit facility. We continue to generate strong cash flows from operations, and we have significant flexibility with how we choose to invest our cash and return capital to shareholders.
See
Note 9,
Long-term Debt
, to the accompanying consolidated financial statements.
Current Liquidity
As of December 31,
2018
, we had
$69.2 million
in
Cash and cash equivalents
. This amount excludes $64.3 million in restricted cash ($59.0 million included in
Restricted cash
and $5.3 million included in
Other long-term assets
in our consolidated balance sheet) and $62.0 million of restricted marketable securities (included in
Other long-term assets
in our
62
consolidated balance sheet). Our restricted assets pertain primarily to obligations associated with our captive insurance company, as well as obligations we have under agreements with joint venture partners. See
Note 4,
Cash and Marketable Securities
, to the accompanying consolidated financial statements.
In addition to
Cash and cash equivalents
, as of December 31,
2018
, we had approximately $633 million available to us under our revolving credit facility. Our credit agreement governs the substantial majority of our senior secured borrowing capacity and contains a leverage ratio and an interest coverage ratio as financial covenants. Our leverage ratio is defined in our credit agreement as the ratio of consolidated total debt (less up to $100 million of cash on hand) to Adjusted EBITDA for the trailing four quarters. In calculating the leverage ratio under our credit agreement, we are permitted to use pro forma Adjusted EBITDA, the calculation of which includes historical income statement items and pro forma adjustments resulting from (1) the dispositions and repayments or incurrence of debt and (2) the investments, acquisitions, mergers, amalgamations, consolidations and operational changes from acquisitions to the extent such items or effects are not yet reflected in our trailing four-quarter financial statements. Our interest coverage ratio is defined in our credit agreement as the ratio of Adjusted EBITDA to consolidated interest expense, excluding the amortization of financing fees, for the trailing four quarters. As of December 31,
2018
, the maximum leverage ratio requirement per our credit agreement was 4.50x and the minimum interest coverage ratio requirement was 3.0x, and we were in compliance with these covenants. Based on Adjusted EBITDA for
2018
and the interest rate in effect under our credit agreement during the three-month period ended December 31,
2018
, if we had drawn on the first day and maintained the maximum amount of outstanding draws under our revolving credit facility for the entire year, we would still be in compliance with the maximum leverage ratio and minimum interest coverage ratio requirements.
We do not face near-term refinancing risk, as the amounts outstanding under our credit agreement do not mature until 2022, and our bonds all mature in 2023 and beyond. See the “Contractual Obligations” section below for information related to our contractual obligations as of December 31,
2018
.
We acquired a significant portion of our home health and hospice business when we purchased EHHI Holdings, Inc. (“EHHI”) on December 31, 2014. In the acquisition, we acquired all of the issued and outstanding equity interests of EHHI, other than equity interests contributed to Encompass Health Home Health Holdings, Inc. (“Holdings”), a subsidiary of Encompass Health and an indirect parent of EHHI, by certain sellers in exchange for shares of common stock of Holdings. Those sellers were members of EHHI management, and they contributed a portion of their shares of common stock of EHHI, valued at approximately $64 million on the acquisition date, in exchange for approximately 16.7% of the outstanding shares of common stock of Holdings. At any time after December 31, 2017, each management investor has the right (but not the obligation) to have his or her shares of Holdings stock repurchased by Encompass Health for a cash purchase price per share equal to the fair value. Specifically, up to one-third of each management investor’s shares of Holdings stock may be sold prior to December 31, 2018; two-thirds of each management investor’s shares of Holdings stock may be sold prior to December 31, 2019; and all of each management investor’s shares of Holdings stock may be sold thereafter. At any time after December 31, 2019, Encompass Health will have the right (but not the obligation) to repurchase all or any portion of the shares of Holdings stock owned by one or more management investors for a cash purchase price per share equal to the fair value. The fair value is determined using the product of the trailing twelve-month adjusted EBITDA measure for Holdings and a specified median market price multiple based on a basket of public home health companies and transactions, after adding cash and deducting indebtedness that includes the outstanding principal balance under any intercompany notes. In February 2018, each management investor exercised the right to sell one-third of his or her shares of Holdings stock to Encompass Health, representing approximately 5.6% of the outstanding shares of the common stock of Holdings. On February 21, 2018, Encompass Health settled the acquisition of those shares upon payment of approximately $65 million in cash. As of
December 31, 2018
, the fair value of those outstanding shares of Holdings owned by management investors is approximately $223 million. See also
Note 11,
Redeemable Noncontrolling Interests
, to the accompanying consolidated financial statements.
In conjunction with the EHHI acquisition, we granted stock appreciation rights (“SARs”) based on Holdings common stock to certain members of EHHI management at closing. Half of the SARs vested on December 31, 2018 with the remainder vesting on December 31, 2019. Upon exercise, each SAR must be settled for cash in the amount by which the per share fair value of Holdings’ common stock on the exercise date exceeds the per share fair value on the grant date. As of
December 31, 2018
, the fair value of the SARs is approximately $87 million, of which approximately $48 million is included in
Other current liabilities
and approximately $39 million is included in
Other long-term liabilities
in the consolidated balance sheet included in Part IV, Item 15,
Financial Statements
, of this report. See also Note 13,
Share-Based Payments
, to the accompanying consolidated financial statements. In February 2019, members of the management team exercised a portion of their vested SARs for approximately $13 million in cash.
We anticipate we will continue to generate strong cash flows from operations that, together with availability under our revolving credit facility, will allow us to invest in growth opportunities and continue to improve our existing business. We also
63
will continue to consider additional shareholder value-enhancing strategies such as repurchases of our common stock and distribution of common stock dividends, including the potential growth of the quarterly cash dividend on our common stock, recognizing that these actions may increase our leverage ratio. See also the “Authorizations for Returning Capital to Stakeholders” section of this Item.
See Item 1A,
Risk Factors
, for a discussion of risks and uncertainties facing us.
Sources and Uses of Cash
The following table shows the cash flows provided by or used in operating, investing, and financing activities for the years ended December 31,
2018
,
2017
, and
2016
(in millions):
|
|
For the Year Ended December 31,
|
||||||||||
|
|
2018
|
2017
|
2016
|
||||||||
|
Net cash provided by operating activities
|
$
|
762.4
|
|
$
|
658.3
|
|
$
|
640.2
|
|
||
|
Net cash used in investing activities
|
(424.5
|
)
|
(283.0
|
)
|
(229.9
|
)
|
|||||
|
Net cash used in financing activities
|
(321.2
|
)
|
(359.9
|
)
|
(416.4
|
)
|
|||||
|
Increase (decrease) in cash, cash equivalents, and restricted cash
|
$
|
16.7
|
|
$
|
15.4
|
|
$
|
(6.1
|
)
|
||
2018
Compared to
2017
Operating activities.
The increase in
Net cash provided by operating activities
during
2018
compared to
2017
primarily resulted f
rom revenue growth, as described above, and improved collection of accounts receivable as a result of fewer claims denials.
Investing activities
. The increase in
Net cash used in investing activities
during
2018
compared to
2017
resulted primarily from the acquisition of Camellia Healthcare described in
Note 2,
Business Combinations
, to the accompanying consolidated financial statements, and capital expenditures.
Financing activities
. The decrease in
Net cash used in financing activities
during
2018
compared to
2017
primarily resulted from the decrease in cash used for principal payments on net debt and repurchases of common stock offset by our purchase of one-third of the equity interests held by the home health and hospice management team during the first quarter of 2018. See also
Note 11,
Redeemable Noncontrolling Interests
, to the accompanying consolidated financial statements.
2017 Compared to 2016
Operating activities.
The increase in
Net cash provided by operating activities
during 2017 compared to 2016
primarily resulted f
rom revenue growth, as described above, and improved collection of accounts receivable offset by increased payments for income taxes following the exhaustion of our federal net operating loss in the first quarter of 2017.
Investing activities
. The increase in
Net cash used in investing activities
during 2017 compared to 2016 resulted primarily from the increase in cash used for capital expenditures as well as the proceeds received from the divestiture of our home health pediatric assets in 2016. See
Note 7,
Goodwill and Other Intangible Assets
, to the accompanying consolidated financial statements.
Financing activities
. The decrease in
Net cash used in financing activities
during 2017 compared to 2016 primarily resulted from
the
proceeds received from the exercising of
stock warrants and decreases in borrowings on the revolving credit facility, common stock repurchases, and principal debt paym
ents, including the redemption of $176 million of the 2022 Notes in March, May, and September of 2016. See
Note 9,
Long-term Debt
, to the accompanying consolidated financial statements.
64
Contractual Obligations
Our consolidated contractual obligations as of December 31,
2018
are as follows (in millions):
|
|
Total
|
2019
|
2020-2021
|
2022-2023
|
2024 and thereafter
|
||||||||||||||
|
Long-term debt obligations:
|
|
|
|
|
|
|
|
||||||||||||
|
Long-term debt, excluding revolving credit facility and capital lease obligations
(a)
|
$
|
2,218.7
|
|
$
|
19.1
|
|
$
|
35.4
|
|
$
|
547.3
|
|
$
|
1,616.9
|
|
||||
|
Revolving credit facility
|
30.0
|
|
—
|
|
—
|
|
30.0
|
|
—
|
|
|||||||||
|
Interest on long-term debt
(b)
|
730.6
|
|
124.6
|
|
246.8
|
|
218.0
|
|
141.2
|
|
|||||||||
|
Capital lease obligations
(c)
|
455.2
|
|
36.2
|
|
62.6
|
|
56.7
|
|
299.7
|
|
|||||||||
|
Operating lease obligations
(d)(e)
|
416.0
|
|
71.4
|
|
120.1
|
|
76.3
|
|
148.2
|
|
|||||||||
|
Purchase obligations
(e)(f)
|
141.6
|
|
45.9
|
|
72.1
|
|
17.1
|
|
6.5
|
|
|||||||||
|
Other long-term liabilities
(g)(h)
|
3.3
|
|
0.2
|
|
0.4
|
|
0.4
|
|
2.3
|
|
|||||||||
|
Total
|
$
|
3,995.4
|
|
$
|
297.4
|
|
$
|
537.4
|
|
$
|
945.8
|
|
$
|
2,214.8
|
|
||||
|
(a)
|
Included in long-term debt are amounts owed on our bonds payable and other notes payable. These borrowings are further explained in
Note 9,
Long-term Debt
,
to the accompanying consolidated financial statements.
|
|
(b)
|
Interest on our fixed rate debt is presented using the stated interest rate. Interest expense on our variable rate debt is estimated using the rate in effect as of December 31,
2018
. Interest pertaining to our credit agreement and bonds is included to their respective ultimate maturity dates. Interest related to capital lease obligations is excluded from this line. Future minimum payments, which are accounted for as interest, related to sale/leaseback transactions involving real estate accounted for as financings are included in this line (see
Note 6,
Property and Equipment
, and
Note 9,
Long-term Debt
, to the accompanying consolidated financial statements). Amounts exclude amortization of debt discounts, amortization of loan fees, or fees for lines of credit that would be included in interest expense in our consolidated statements of operations.
|
|
(c)
|
Amounts include interest portion of future minimum capital lease payments.
|
|
(d)
|
Our inpatient rehabilitation segment leases approximately 17% of its hospitals as well as other property and equipment under operating leases in the normal course of business. Our home health and hospice segment leases relatively small office spaces in the localities it serves, space for its corporate office, and other equipment under operating leases in the normal course of business. Some of our hospital leases contain escalation clauses based on changes in the Consumer Price Index while others have fixed escalation terms. The minimum lease payments do not include contingent rental expense. Some lease agreements provide us with the option to renew the lease or purchase the leased property. Our future operating lease obligations would change if we exercised these renewal options and if we entered into additional operating lease agreements. For more information, see
Note 6,
Property and Equipment
,
to the accompanying consolidated financial statements.
|
|
(e)
|
Future operating lease obligations and purchase obligations are not recognized in our consolidated balance sheet.
|
|
(f)
|
Purchase obligations include agreements to purchase goods or services that are enforceable and legally binding on Encompass Health and that specify all significant terms, including: fixed or minimum quantities to be purchased; fixed, minimum, or variable price provisions; and the approximate timing of the transaction. Purchase obligations exclude agreements that are cancelable without penalty. Our purchase obligations primarily relate to software licensing and support.
|
|
(g)
|
Because their future cash outflows are uncertain, the following noncurrent liabilities are excluded from the table above: general liability, professional liability, and workers’ compensation risks, noncurrent amounts related to third-party billing audits, stock appreciation rights, and deferred income taxes. Also, as of December 31,
2018
, we had
$0.9 million
of total gross unrecognized tax benefits. For more information, see
Note 10,
Self-Insured Risks
,
Note 13,
Share-Based Payments
,
Note 15,
Income Taxes
,
and
Note 17,
Contingencies and Other Commitments
,
to the accompanying consolidated financial statements.
|
65
|
(h)
|
The table above does not include
Redeemable noncontrolling interests
of
$261.7 million
because of the uncertainty surrounding the timing and amounts of any related cash outflows. See
Note 11,
Redeemable Noncontrolling Interests
, to the accompanying consolidated financial statements.
|
Our capital expenditures include costs associated with our hospital refresh program, de novo projects, capacity expansions, technology initiatives, and building and equipment upgrades and purchases. During the year ended December 31,
2018
, we made capital expenditures of approximately
$276 million
for property and equipment and capitalized software. These expenditures in
2018
are exclusive of approximately
$144 million
in net cash related to our acquisition activity. During
2019
, we expect to spend approximately $375 million to $445 million for capital expenditures. Approximately $160 million to $170 million of this budgeted amount is considered nondiscretionary expenditures, which we may refer to in other filings as “maintenance” expenditures. In addition, we expect to spend approximately $50 million to $100 million on home health and hospice acquisitions during 2019. Actual amounts spent will be dependent upon the timing of construction projects and acquisition opportunities for our home health and hospice business.
Authorizations for Returning Capital to Stakeholders
In October 2017, February 2018, and May 2018, our board of directors declared cash dividends of $0.25 per share that were paid in January 2018, April 2018, and July 2018, respectively. On July 24, 2018, our board of directors approved an increase in our quarterly dividend and declared a cash dividend of $0.27 per share, that was paid on October 15, 2018. On October 26, 2018, our board of directors declared a cash dividend of $0.27 per share, that was paid on January 15, 2019 to stockholders of record on January 2, 2019. On February 21, 2019, our board of directors declared a cash dividend of $0.27 per share, payable on April 15, 2019 to stockholders of record on April 1, 2019. We expect quarterly dividends to be paid in January, April, July, and October. However, the actual declaration of any future cash dividends, and the setting of record and payment dates as well as the per share amounts, will be at the discretion of our board of directors after consideration of various factors, including our capital position and alternative uses of funds. Cash dividends are expected to be funded using cash flows from operations, cash on hand, and availability under our revolving credit facility.
On October 28, 2013, we announced our board of directors authorized the repurchase of up to $200 million of our common stock, which amount was subsequently increased to $250 million. On July 24, 2018, our board approved resetting the aggregate common stock repurchase authorization to $250 million. As of December 31, 2018, approximately $250 million remained under this authorization. The repurchase authorization does not require the repurchase of a specific number of shares, has an indefinite term, and is subject to termination at any time by our board of directors. Subject to certain terms and conditions, including a maximum price per share and compliance with federal and state securities and other laws, the repurchases may be made from time to time in open market transactions, privately negotiated transactions, or other transactions, including trades under a plan established in accordance with Rule 10b5-1 under the Securities Exchange Act of 1934, as amended. Future repurchases under this authorization generally are expected to be funded using a combination of cash on hand and availability under our $700 million revolving credit facility.
Adjusted EBITDA
Management believes Adjusted EBITDA as defined in our credit agreement is a measure of our ability to service our debt and our ability to make capital expenditures. We reconcile Adjusted EBITDA to
Net income
and to
Net cash provided by operating activities
.
We use Adjusted EBITDA on a consolidated basis as a liquidity measure. We believe this financial measure on a consolidated basis is important in analyzing our liquidity because it is the key component of certain material covenants contained within our credit agreement, which is discussed in more detail in
Note 9,
Long-term Debt
, to the accompanying consolidated financial statements. These covenants are material terms of the credit agreement. Noncompliance with these financial covenants under our credit agreement—our interest coverage ratio and our leverage ratio—could result in our lenders requiring us to immediately repay all amounts borrowed. If we anticipated a potential covenant violation, we would seek relief from our lenders, which would have some cost to us, and such relief might be on terms less favorable to us than those in our existing credit agreement. In addition, if we cannot satisfy these financial covenants, we would be prohibited under our credit agreement from engaging in certain activities, such as incurring additional indebtedness, paying common stock dividends, making certain payments, and acquiring and disposing of assets. Consequently, Adjusted EBITDA is critical to our assessment of our liquidity.
In general terms, the credit agreement definition of Adjusted EBITDA, therein referred to as “Adjusted Consolidated
EBITDA,” allows us to add back to consolidated
Net income
interest expense, income taxes, and depreciation and amortization and then add back to consolidated
Net income
(1) all unusual or nonrecurring items reducing consolidated
Net income
(of which only up to $10 million in a year may be cash expenditures), (2) any losses from discontinued operations and
66
closed locations, (3) costs and expenses, including legal fees and expert witness fees, incurred with respect to litigation associated with stockholder derivative litigation, (4) share-based compensation expense, and (5) cost and expenses in connection with the Encompass Health rebranding. We also subtract from consolidated
Net income
all unusual or nonrecurring items to the extent they increase consolidated
Net income
.
Under the credit agreement, the Adjusted EBITDA calculation does not include net income attributable to noncontrolling interests and includes (1) gain or loss on disposal of assets and hedging and equity instruments, (2) professional fees unrelated to the stockholder derivative litigation, (3) unusual or nonrecurring cash expenditures in excess of $10 million, and (4) pro forma adjustments resulting from debt transactions and development activities. Items falling within the credit agreement’s “unusual or nonrecurring” classification may occur in future periods, but these items and amounts recognized can vary significantly from period to period and may not directly relate to our ongoing operating performance. Accordingly, these items may not be indicative of our ongoing liquidity or performance, so the Adjusted EBITDA calculation presented here includes adjustments for them.
Adjusted EBITDA is not a measure of financial performance under generally accepted accounting principles in the United States of America, and the items excluded from Adjusted EBITDA are significant components in understanding and assessing financial performance. Therefore, Adjusted EBITDA should not be considered a substitute for
Net income
or cash flows from operating, investing, or financing activities. Because Adjusted EBITDA is not a measurement determined in accordance with GAAP and is thus susceptible to varying calculations, Adjusted EBITDA, as presented, may not be comparable to other similarly titled measures of other companies. Revenues and expenses are measured in accordance with the policies and procedures described in
Note 1,
Summary of Significant Accounting Policies
, to the accompanying consolidated financial statements.
Our Adjusted EBITDA for the years ended December 31,
2018
,
2017
, and
2016
was as follows (in millions):
Reconciliation of Net Income to Adjusted EBITDA
|
|
For the Year Ended December 31,
|
||||||||||
|
|
2018
|
2017
|
2016
|
||||||||
|
Net income
*
|
$
|
375.4
|
|
$
|
350.2
|
|
$
|
318.1
|
|
||
|
(Income) loss from discontinued operations, net of tax, attributable to Encompass Health
|
(1.1
|
)
|
0.4
|
|
—
|
|
|||||
|
Provision for income tax expense
*
|
118.9
|
|
145.8
|
|
163.9
|
|
|||||
|
Interest expense and amortization of debt discounts and fees
|
147.3
|
|
154.4
|
|
172.1
|
|
|||||
|
Loss on early extinguishment of debt
|
—
|
|
10.7
|
|
7.4
|
|
|||||
|
Professional fees—accounting, tax, and legal
|
—
|
|
—
|
|
1.9
|
|
|||||
|
Government, class action, and related settlements
|
52.0
|
|
—
|
|
—
|
|
|||||
|
Net noncash loss on disposal of assets
|
5.7
|
|
4.6
|
|
0.7
|
|
|||||
|
Depreciation and amortization
|
199.7
|
|
183.8
|
|
172.6
|
|
|||||
|
Stock-based compensation expense
|
85.9
|
|
47.7
|
|
27.4
|
|
|||||
|
Net income attributable to noncontrolling interests
|
(83.1
|
)
|
(79.1
|
)
|
(70.5
|
)
|
|||||
|
Transaction costs
|
1.0
|
|
—
|
|
—
|
|
|||||
|
SARs mark-to-market impact on noncontrolling interests
|
(2.6
|
)
|
—
|
|
—
|
|
|||||
|
Change in fair market value of equity securities
|
1.9
|
|
—
|
|
—
|
|
|||||
|
Tax reform impact on noncontrolling interests
|
—
|
|
4.6
|
|
—
|
|
|||||
|
Adjusted EBITDA
|
$
|
901.0
|
|
$
|
823.1
|
|
$
|
793.6
|
|
||
(*)
2017 amounts have been revised to correct an error in our deferred tax assets as discussed in
Note 1,
Summary of Significant Accounting Policies
, “Revision of Previously Issued Financial Statements,” to the accompanying consolidated financial statements.
67
Reconciliation of Net Cash Provided by Operating Activities to Adjusted EBITDA
|
|
For the Year Ended December 31,
|
||||||||||
|
|
2018
|
2017
|
2016
|
||||||||
|
Net cash provided by operating activities
|
$
|
762.4
|
|
$
|
658.3
|
|
$
|
640.2
|
|
||
|
Professional fees—accounting, tax, and legal
|
—
|
|
—
|
|
1.9
|
|
|||||
|
Interest expense and amortization of debt discounts and fees
|
147.3
|
|
154.4
|
|
172.1
|
|
|||||
|
Equity in net income of nonconsolidated affiliates
|
8.7
|
|
8.0
|
|
9.8
|
|
|||||
|
Net income attributable to noncontrolling interests in continuing operations
|
(83.1
|
)
|
(79.1
|
)
|
(70.5
|
)
|
|||||
|
Amortization of debt-related items
|
(4.0
|
)
|
(8.7
|
)
|
(13.8
|
)
|
|||||
|
Distributions from nonconsolidated affiliates
|
(8.3
|
)
|
(8.6
|
)
|
(8.5
|
)
|
|||||
|
Current portion of income tax expense
|
128.0
|
|
85.0
|
|
31.0
|
|
|||||
|
Change in assets and liabilities
|
(46.0
|
)
|
7.4
|
|
30.1
|
|
|||||
|
Tax reform impact on noncontrolling interests
|
—
|
|
4.6
|
|
—
|
|
|||||
|
Operating cash used in discontinued operations
|
(0.8
|
)
|
0.6
|
|
0.7
|
|
|||||
|
Transaction costs
|
1.0
|
|
—
|
|
—
|
|
|||||
|
SARs mark-to-market impact on noncontrolling interests
|
(2.6
|
)
|
—
|
|
|||||||
|
Change in fair market value of equity securities
|
1.9
|
|
—
|
|
|||||||
|
Other
|
(3.5
|
)
|
1.2
|
|
0.6
|
|
|||||
|
Adjusted EBITDA
|
$
|
901.0
|
|
$
|
823.1
|
|
$
|
793.6
|
|
||
Growth in Adjusted EBITDA in 2018 compared to 2017 resulted primarily from revenue growth. Growth in Adjusted EBITDA in 2017 compared to 2016 also resulted primarily from revenue growth. For additional information see the “Results of Operations” and “Segment Results of Operations” sections of this Item.
Off-Balance Sheet Arrangements
In accordance with the definition under SEC rules, the following qualify as off-balance sheet arrangements:
|
•
|
any obligation under certain guarantees or contracts;
|
|
•
|
a retained or contingent interest in assets transferred to an unconsolidated entity or similar entity or similar arrangement that serves as credit, liquidity, or market risk support to that entity for such assets;
|
|
•
|
any obligation under certain derivative instruments; and
|
|
•
|
any obligation under a material variable interest held by the registrant in an unconsolidated entity that provides financing, liquidity, market risk, or credit risk support to the registrant, or engages in leasing, hedging, or research and development services with the registrant.
|
As of December 31,
2018
, we do not have any material off-balance sheet arrangements.
As part of our ongoing business, we do not participate in transactions that generate relationships with unconsolidated entities or financial partnerships, such as entities often referred to as structured finance or special purpose entities (“SPEs”), which would have been established for the purpose of facilitating off-balance sheet arrangements or other contractually narrow or limited purposes. As of December 31,
2018
, we are not involved in any unconsolidated SPE transactions.
Critical Accounting Estimates
Our consolidated financial statements are prepared in accordance with GAAP. In connection with the preparation of our financial statements, we are required to make assumptions and estimates about future events and apply judgments that affect the reported amounts of assets, liabilities, revenue, expenses, and the related disclosures. We base our assumptions, estimates, and judgments on historical experience, current trends, and other factors we believe to be relevant at the time we prepared our consolidated financial statements. On a regular basis, we review the accounting policies, assumptions, estimates, and judgments to ensure our consolidated financial statements are presented fairly and in accordance with GAAP. However,
68
because future events and their effects cannot be determined with certainty, actual results could differ from our assumptions and estimates, and such differences could be material.
Our significant accounting policies are discussed in
Note 1,
Summary of Significant Accounting Policies
, to the accompanying consolidated financial statements. We believe the following accounting estimates are the most critical to aid in fully understanding and evaluating our reported financial results, as they require our most difficult, subjective, or complex judgments, resulting from the need to make estimates about the effect of matters that are inherently uncertain. We have reviewed these critical accounting estimates and related disclosures with the audit committee of our board of directors.
Revenue Recognition
We recognize net operating revenue in the reporting period in which we perform the service based on our best estimate of the transaction price for the type of service provided to the patient. Our estimate of the transaction price includes estimates of price concessions for such items as contractual allowances (principally for patients covered by Medicare, Medicare Advantage, Medicaid, and other third-party payors), potential adjustments that may arise from payment and other reviews, and uncollectible amounts. See
Note 1,
Summary of Significant Accounting Policies
, “Net Operating Revenues,” to the accompanying consolidated financial statements of this report for a complete discussion of our revenue recognition policies.
Our patient accounting systems calculate contractual allowances on a patient-by-patient basis based on the rates in effect for each primary third-party payor. Certain other factors that are considered and could influence the estimated transaction price are assumed to remain consistent with the experience for patients discharged in similar time periods for the same payor classes, and additional adjustments are provided to account for these factors.
Management continually reviews the revenue transaction price estimation process to consider and incorporate updates to laws and regulations and the frequent changes in managed care contractual terms that result from contract renegotiations and renewals. In addition, laws and regulations governing the Medicare and Medicaid programs are complex and subject to interpretation. If actual results are not consistent with our assumptions and judgments, we may be exposed to gains or losses that could be material.
Due to complexities involved in determining amounts ultimately due under reimbursement arrangements with third-party payors, which are often subject to interpretation and review, we may receive reimbursement for healthcare services authorized and provided that is different from our estimates, and such differences could be material. However, we continually review the amounts actually collected in subsequent periods in order to determine the amounts by which our estimates differed. Historically, such differences have not been material from either a quantitative or qualitative perspective.
The collection of outstanding receivables from third-party payors and patients is our primary source of cash and is critical to our operating performance. Our primary collection risks relate to patient responsibility amounts and claims reviews conducted by MACs or other contractors.
69
The table below shows a summary of our net accounts receivable balances as of
December 31, 2018
and
2017
. Information on the concentration of total patient accounts receivable by payor class can be found in
Note 1,
Summary of Significant Accounting Policies
, “Accounts Receivable,” to the accompanying consolidated financial statements.
|
|
As of December 31,
|
||||||
|
|
2018
|
2017
|
|||||
|
|
(In Millions)
|
||||||
|
Current:
|
|||||||
|
0 - 30 Days
|
$
|
362.5
|
|
$
|
363.2
|
|
|
|
31 - 60 Days
|
43.7
|
|
45.6
|
|
|||
|
61 - 90 Days
|
18.4
|
|
18.3
|
|
|||
|
91 - 120 Days
|
10.0
|
|
8.8
|
|
|||
|
120 + Days
|
25.3
|
|
23.6
|
|
|||
|
Patient accounts receivable
|
459.9
|
|
459.5
|
|
|||
|
Other accounts receivable
|
7.8
|
|
12.6
|
|
|||
|
467.7
|
|
472.1
|
|
||||
|
Noncurrent patient accounts receivable
|
155.5
|
|
129.1
|
|
|||
|
Accounts receivable
|
$
|
623.2
|
|
$
|
601.2
|
|
|
Changes in general economic conditions (such as increased unemployment rates or periods of recession), business office operations, payor mix, or trends in federal or state governmental and private employer healthcare coverage could affect our collection of accounts receivable. Our collection risks include patient accounts for which the primary insurance carrier has paid the amounts covered by the applicable agreement, but patient responsibility amounts (deductibles and co-payments) remain outstanding and pre-payment claim reviews by our respective MACs. In addition, reimbursement claims made by health care providers are subject to audit from time to time by governmental payors and their agents. If actual results are not consistent with our assumptions and judgments, we may be exposed to gains or losses that could be material. See
Note 1,
Summary of Significant Accounting Policies
, “Net Operating Revenues” and “Accounts Receivable,” to the accompanying consolidated financial statements of this report.
Self-Insured Risks
We are self-insured for certain losses related to professional liability, general liability, and workers’ compensation risks. Although we obtain third-party insurance coverage to limit our exposure to these claims, a substantial portion of our professional liability, general liability, and workers’ compensation risks are insured through a wholly owned insurance subsidiary. See
Note 10,
Self-Insured Risks
, to the accompanying consolidated financial statements for a more complete discussion of our self-insured risks.
Our self-insured liabilities contain uncertainties because management must make assumptions and apply judgment to estimate the ultimate cost of reported claims and claims incurred but not reported as of the balance sheet date. Our reserves and provisions for professional liability, general liability, and workers’ compensation risks are based largely upon semi-annual actuarial calculations prepared by third-party actuaries.
Periodically, we review our assumptions and the valuations provided by third-party actuaries to determine the adequacy of our self-insurance reserves. The following are certain of the key assumptions and other factors that significantly influence our estimate of self-insurance reserves:
|
•
|
historical claims experience;
|
|
•
|
trending of loss development factors;
|
|
•
|
trends in the frequency and severity of claims;
|
|
•
|
coverage limits of third-party insurance;
|
|
•
|
demographic information;
|
70
|
•
|
statistical confidence levels;
|
|
•
|
medical cost inflation;
|
|
•
|
payroll dollars; and
|
|
•
|
hospital patient census.
|
The time period to resolve claims can vary depending upon the jurisdiction, the nature, and the form of resolution of the claims. The estimation of the timing of payments beyond a year can vary significantly. In addition, if current and future claims differ from historical trends, our estimated reserves for self-insured claims may be significantly affected. Our self-insurance reserves are not discounted.
Given the number of factors used to establish our self-insurance reserves, we believe there is limited benefit to isolating any individual assumption or parameter from the detailed computational process and calculating the impact of changing that single item. Instead, we believe the sensitivity in our reserve estimates is best illustrated by changes in the statistical confidence level used in the computations. Using a higher statistical confidence level increases the estimated self-insurance reserves. The following table shows the sensitivity of our recorded self-insurance reserves to the statistical confidence level (in millions):
|
Net self-insurance reserves as of December 31, 2018:
|
||
|
As reported, with 50% statistical confidence level
|
135.3
|
|
|
With 70% statistical confidence level
|
144.1
|
|
We believe our efforts to improve patient safety and overall quality of care, as well as our efforts to reduce workplace injuries, have helped contain our ultimate claim costs. See
Note 10,
Self-Insured Risks
, to the accompanying consolidated financial statements for additional information.
We believe our self-insurance reserves are adequate to cover projected costs. Due to the considerable variability that is inherent in such estimates, there can be no assurance the ultimate liability will not exceed management’s estimates. If actual results are not consistent with our assumptions and judgments, we may be exposed to gains or losses that could be material.
Goodwill
Absent any impairment indicators, we evaluate goodwill for impairment as of
October 1st
of each year. We test goodwill for impairment at the reporting unit level and are required to make certain subjective and complex judgments on a number of matters, including assumptions and estimates used to determine the fair value of our inpatient rehabilitation and home health and hospice reporting units. We assess qualitative factors in each reporting unit to determine whether it is necessary to perform the first step of the two-step quantitative goodwill impairment test. The quantitative impairment test is required only if we conclude it is more likely than not a reporting unit’s fair value is less than its carrying amount.
If, based on our qualitative assessment, we were to believe we must proceed to Step 1, we would determine the fair value of the applicable reporting unit using generally accepted valuation techniques including the income approach and the market approach. We would validate our estimates under the income approach by reconciling the estimated fair value of the reporting units determined under the income approach to our market capitalization and estimated fair value determined under the market approach. Values from the income approach and market approach would then be evaluated and weighted to arrive at the estimated aggregate fair value of the reporting units.
The income approach includes the use of each reporting unit’s projected operating results and cash flows that are discounted using a weighted-average cost of capital that reflects market participant assumptions. The projected operating results use management’s best estimates of economic and market conditions over the forecasted period including assumptions for pricing and volume, operating expenses, and capital expenditures. Other significant estimates and assumptions include cost-saving synergies and tax benefits that would accrue to a market participant under a fair value methodology. The market approach estimates fair value through the use of observable inputs, including the Company’s stock price.
See
Note 1,
Summary of Significant Accounting Policies
, “Goodwill and Other Intangibles,” and
Note 7,
Goodwill and Other Intangible Assets
, to the accompanying consolidated financial statements for additional information.
71
The following events and circumstances are certain of the qualitative factors we consider in evaluating whether it is more likely than not the fair value of a reporting unit is less than its carrying amount:
|
•
|
Macroeconomic conditions, such as deterioration in general economic conditions, limitations on accessing capital, or other developments in equity and credit markets;
|
|
•
|
Industry and market considerations and changes in healthcare regulations, including reimbursement and compliance requirements under the Medicare and Medicaid programs;
|
|
•
|
Cost factors, such as an increase in labor, supply, or other costs;
|
|
•
|
Overall financial performance, such as negative or declining cash flows or a decline in actual or forecasted revenue or earnings;
|
|
•
|
Other relevant company-specific events, such as material changes in management or key personnel or outstanding litigation;
|
|
•
|
Material events, such as a change in the composition or carrying amount of each reporting unit’s net assets, including acquisitions and dispositions; and
|
|
•
|
Consideration of the relationship of our market capitalization to our book value, as well as a sustained decrease in our share price.
|
In the fourth quarter of 2018, we performed our annual evaluation of goodwill and determined no adjustment to impair goodwill was necessary. If actual results are not consistent with our assumptions and estimates, we may be exposed to goodwill impairment charges. However, at this time, we continue to believe our inpatient rehabilitation and home health and hospice reporting units are not at risk for any impairment charges.
Income Taxes
We provide for income taxes using the asset and liability method. We also evaluate our tax positions and establish assets and liabilities in accordance with the applicable accounting guidance on uncertainty in income taxes. See
Note 1,
Summary of Significant Accounting Policies
, “Income Taxes,” and
Note 15,
Income Taxes
, to the accompanying consolidated financial statements for a more complete discussion of income taxes and our policies related to income taxes.
The application of income tax law is inherently complex. Laws and regulations in this area are voluminous and are often ambiguous. We are required to make many subjective assumptions and judgments regarding our income tax exposures. Interpretations of and guidance surrounding income tax laws and regulations change over time. As such, changes in our subjective assumptions and judgments can materially affect amounts recognized in our consolidated financial statements.
The ultimate recovery of certain of our deferred tax assets is dependent on the amount and timing of taxable income we will ultimately generate in the future, as well as other factors. A high degree of judgment is required to determine the extent a valuation allowance should be provided against deferred tax assets. On a quarterly basis, we assess the likelihood of realization of our deferred tax assets considering all available evidence, both positive and negative. Our operating performance in recent years, the scheduled reversal of temporary differences, our forecast of taxable income in future periods in each applicable tax jurisdiction, our ability to sustain a core level of earnings, and the availability of prudent tax planning strategies are important considerations in our assessment. Our forecast of future earnings includes assumptions about patient volumes, payor reimbursement, labor costs, hospital operating expenses, and interest expense. Based on the weight of available evidence, we determine if it is more likely than not our deferred tax assets will be realized in the future.
Our liability for unrecognized tax benefits contains uncertainties because management is required to make assumptions and to apply judgment to estimate the exposures associated with our various filing positions which are periodically audited by tax authorities. In addition, our effective income tax rate is affected by changes in tax law, the tax jurisdictions in which we operate, and the results of income tax audits.
During the year ended December 31, 2018, we decreased our valuation allowance by $2.1 million. As of December 31, 2018, we had a remaining valuation allowance of $33.7 million which primarily related to state NOLs. At the state jurisdiction level, we determined it was necessary to maintain a valuation allowance due to uncertainties related to our ability to utilize a portion of the NOLs before they expire. The amount of the valuation allowance has been determined for each tax jurisdiction based on the weight of all available evidence, as described above, including management’s estimates of taxable income for each jurisdiction in which we operate over the periods in which the related deferred tax assets will be recoverable.
72
While management believes the assumptions included in its forecast of future earnings are reasonable and it is more likely than not the net deferred tax asset balance as of December 31, 2018 will be realized, no such assurances can be provided. If management’s expectations for future operating results on a consolidated basis or at the state jurisdiction level vary from actual results due to changes in healthcare regulations, general economic conditions, or other factors, we may need to increase our valuation allowance, or reverse amounts recorded currently in the valuation allowance, for all or a portion of our deferred tax assets. Similarly, future adjustments to our valuation allowance may be necessary if the timing of future tax deductions is different than currently expected. Our income tax expense in future periods will be reduced or increased to the extent of offsetting decreases or increases, respectively, in our valuation allowance in the period when the change in circumstances occurs. These changes could have a significant impact on our future earnings.
Assessment of Loss Contingencies
We have legal and other contingencies that could result in significant losses upon the ultimate resolution of such contingencies. See
Note 1,
Summary of Significant Accounting Policies
, “Litigation Reserves,” and
Note 17,
Contingencies and Other Commitments
, to the accompanying consolidated financial statements for additional information.
We have provided for losses in situations where we have concluded it is probable a loss has been or will be incurred and the amount of loss is reasonably estimable. A significant amount of judgment is involved in determining whether a loss is probable and reasonably estimable due to the uncertainty involved in determining the likelihood of future events and estimating the financial statement impact of such events. If further developments or resolution of a contingent matter are not consistent with our assumptions and judgments, we may need to recognize a significant charge in a future period related to an existing contingent matter.
Recent Accounting Pronouncements
For information regarding recent accounting pronouncements, see
Note 1,
Summary of Significant Accounting Policies
, to the accompanying consolidated financial statements.
|
Item 7A.
|
Quantitative and Qualitative Disclosures about Market Risk
|
Our primary exposure to market risk is to changes in interest rates on our variable rate long-term debt. We use a sensitivity analysis model to evaluate the impact of interest rate changes on our variable rate debt. As of
December 31, 2018
, our primary variable rate debt outstanding related to
$30.0 million
in advances under our revolving credit facility and
$280.1 million
outstanding under our term loan facilities. Assuming outstanding balances were to remain the same, a 1% increase in interest rates would result in an incremental negative cash flow of approximately
$3.2 million
over the next 12 months, while a 1% decrease in interest rates would result in an incremental positive cash flow of approximately
$3.2 million
over the next 12 months.
The fair value of our fixed rate debt is determined using inputs, including quoted prices in nonactive markets, that are observable either directly or indirectly, or
Level 2
inputs within the fair value hierarchy, and is summarized as follows (in millions):
|
December 31, 2018
|
December 31, 2017
|
|||||||||||||||
|
Financial Instrument:
|
Book Value
|
Market Value
|
Book Value
|
Market Value
|
||||||||||||
|
5.125% Senior Notes due 2023
|
||||||||||||||||
|
Carrying Value
|
$
|
296.6
|
|
$
|
—
|
|
$
|
295.9
|
|
$
|
—
|
|
||||
|
Unamortized debt discount and fees
|
3.4
|
|
—
|
|
4.1
|
|
—
|
|
||||||||
|
Principal amount
|
300.0
|
|
298.5
|
|
300.0
|
|
306.8
|
|
||||||||
|
5.75% Senior Notes due 2024
|
||||||||||||||||
|
Carrying Value
|
1,194.7
|
|
—
|
|
1,193.9
|
|
—
|
|
||||||||
|
Unamortized debt discount and fees
|
5.3
|
|
—
|
|
6.1
|
|
—
|
|
||||||||
|
Principal amount
|
1,200.0
|
|
1,200.0
|
|
1,200.0
|
|
1,228.5
|
|
||||||||
|
5.75% Senior Notes due 2025
|
||||||||||||||||
|
Carrying Value
|
345.0
|
|
—
|
|
344.4
|
|
—
|
|
||||||||
|
Unamortized debt discount and fees
|
5.0
|
|
—
|
|
5.6
|
|
—
|
|
||||||||
|
Principal amount
|
350.0
|
|
339.5
|
|
350.0
|
|
364.9
|
|
||||||||
73
Foreign operations, and the related market risks associated with foreign currencies, are currently, and have been, insignificant to our financial position, results of operations, and cash flows.
See also
Note 9,
Long-term Debt
, to the accompanying consolidated financial statements.
|
Item 8.
|
Financial Statements and Supplementary Data
|
Our consolidated financial statements and related notes are filed together with this report. See the index to financial statements on page F-1 for a list of financial statements filed with this report.
|
Item 9.
|
Changes in and Disagreements with Accountants on Accounting and Financial Disclosure
|
None.
|
Item 9A.
|
Controls and Procedures
|
Evaluation of Disclosure Controls and Procedures
As of the end of the period covered by this report, an evaluation was carried out by our management, including our chief executive officer and chief financial officer, of the effectiveness of our disclosure controls and procedures as defined in Rules 13a-15(e) and 15d-15(e) of the Securities Exchange Act of 1934, as amended (the “Exchange Act”). Our disclosure controls and procedures are designed to ensure that information required to be disclosed in reports we file or submit under the Exchange Act is recorded, processed, summarized, and reported within the time periods specified in the rules and forms of the Securities and Exchange Commission and that such information is accumulated and communicated to our management, including our chief executive officer and chief financial officer, to allow timely decisions regarding required disclosures. Based on our evaluation, our chief executive officer and chief financial officer concluded that, as of December 31,
2018
, our disclosure controls and procedures were effective.
Management’s Report on Internal Control Over Financial Reporting
Our management is responsible for establishing and maintaining adequate internal control over financial reporting, as such term is defined in Rules 13a-15(f) and 15d-15(f) under the Exchange Act. Internal control over financial reporting is a process designed to provide reasonable assurance regarding the reliability of financial reporting and the preparation of financial statements for external purposes in accordance with generally accepted accounting principles in the United States of America. Internal control over financial reporting includes those policies and procedures that (1) pertain to the maintenance of records that, in reasonable detail, accurately and fairly reflect the transactions and dispositions of the assets of the Company; (2) provide reasonable assurance that transactions are recorded as necessary to permit preparation of financial statements in accordance with GAAP, and that receipts and expenditures of the Company are being made only in accordance with authorizations of management and directors of the Company; and (3) provide reasonable assurance regarding prevention or timely detection of unauthorized acquisition, use, or disposition of the Company’s assets that could have a material effect on its financial statements. Because of its inherent limitations, internal control over financial reporting may not prevent or detect misstatements. Also, projections of any evaluation of effectiveness to future periods are subject to the risk that controls may become inadequate because of changes in conditions or that the degree of compliance with the policies or procedures may deteriorate.
Under the supervision and with the participation of our management, including our chief executive officer and chief financial officer, we conducted an assessment of the effectiveness of our internal control over financial reporting as of December 31,
2018
. In making this assessment, management used the criteria set forth in
Internal Control-Integrated Framework
(2013) issued by the Committee of Sponsoring Organizations of the Treadway Commission, the COSO framework
.
Based on our evaluation, our chief executive officer and chief financial officer concluded that, as of December 31,
2018
, our internal control over financial reporting was effective.
The effectiveness of the Company’s internal control over financial reporting as of December 31,
2018
has been audited by PricewaterhouseCoopers LLP, an independent registered public accounting firm, as stated in their report which appears herein.
Changes in Internal Control Over Financial Reporting
There were no changes in the Company’s internal controls over financial reporting that occurred during the quarter ended December 31,
2018
that have materially affected, or are reasonably likely to materially affect, the Company’s internal control over financial reporting.
74
|
Item 9B.
|
Other Information
|
None.
75
PART III
We expect to file a definitive proxy statement relating to our
2019
Annual Meeting of Stockholders (the “
2019
Proxy Statement”) with the United States Securities and Exchange Commission, pursuant to Regulation 14A, not later than 120 days after the end of our most recent fiscal year. Accordingly, certain information required by Part III has been omitted under General Instruction G(3) to Form 10-K. Only the information from the
2019
Proxy Statement that specifically addresses disclosure requirements of Items 10-14 below is incorporated by reference.
|
Item 10.
|
Directors and Executive Officers of the Registrant
|
The information required by Item 10 is hereby incorporated by reference from our
2019
Proxy Statement under the captions “Items of Business Requiring Your Vote—Proposal 1—Election of Directors,” “Corporate Governance and Board Structure—Corporate Governance—Code of Ethics,” “—Board Structure and Committees—Audit Committee,” “—Board Composition and Director Nomination Process—Director Nominees Proposed by Stockholders,” “Section 16(a) Beneficial Ownership Reporting Compliance,” and “Executive Officers.”
|
Item 11.
|
Executive Compensation
|
The information required by Item 11 is hereby incorporated by reference from our
2019
Proxy Statement under the captions “Corporate Governance and Board Structure—Compensation of Directors,” “Compensation and Human Capital Committee Matters,” and “Executive Compensation.”
|
Item 12.
|
Security Ownership of Certain Beneficial Owners and Management and Related Stockholder Matters
|
The other information required by Item 12 is hereby incorporated by reference from our
2019
Proxy Statement under the caption “Security Ownership of Certain Beneficial Owners and Management.”
|
Item 13.
|
Certain Relationships and Related Transactions and Director Independence
|
The information required by Item 13 is hereby incorporated by reference from our
2019
Proxy Statement under the captions “Corporate Governance and Board Structure—Director Independence” and “Certain Relationships and Related Transactions.”
|
Item 14.
|
Principal Accountant Fees and Services
|
The information required by Item 14 is hereby incorporated by reference from our
2019
Proxy Statement under the caption “Items of Business Requiring Your Vote—Proposal 2—Ratification of Appointment of Independent Registered Public Accounting Firm.”
76
PART IV
|
Item 15.
|
Exhibits and Financial Statement Schedules
|
Financial Statements
See the accompanying index on page F-1 for a list of financial statements filed as part of this report.
Financial Statement Schedules
None.
Exhibits
See Exhibit Index immediately following page F-77 of this report.
|
Item 16.
|
Form 10-K Summary
|
Not applicable.
77
SIGNATURES
Pursuant to the requirements of Section 13 or 15(d) of the Securities Exchange Act of 1934, the Registrant has duly caused this Report to be signed on its behalf by the undersigned, thereunto duly authorized.
|
|
ENCOMPASS HEALTH CORPORATION
|
|
|
|
|
|
|
|
|
|
By:
|
/s/ M
ARK
J. T
ARR
|
|
|
|
|
Mark J. Tarr
|
|
|
|
|
President and Chief Executive Officer
|
|
|
|
Date:
|
February 27, 2019
|
|
[Signatures continue on the following page]
78
POWER OF ATTORNEY
Each person whose signature appears below hereby constitutes and appoints Patrick Darby his true and lawful attorney-in-fact and agent with full power of substitution and re-substitution, for him in his name, place and stead, in any and all capacities, to sign any and all amendments to this Report and to file the same, with all exhibits thereto, and other documents in connection therewith, with the Securities and Exchange Commission, and hereby grants to such attorney-in-fact and agent, full power and authority to do and perform each and every act and thing requisite and necessary to be done, as fully to all intents and purposes as he might or could do in person, hereby ratifying and confirming all that said attorney-in-fact and agent or his substitute or substitutes may lawfully do or cause to be done by virtue hereof.
Pursuant to the requirements of the Securities Exchange Act of 1934, this Report has been signed below by the following persons on behalf of the Registrant and in the capacities and on the dates indicated.
|
Signature
|
Capacity
|
Date
|
|
|
|
|
|
/s/ M
ARK
J. T
ARR
|
President and Chief Executive Officer and Director
|
February 27, 2019
|
|
Mark J. Tarr
|
|
|
|
|
|
|
|
/s/ D
OUGLAS
E.
C
OLTHARP
|
Executive Vice President and Chief Financial Officer
|
February 27, 2019
|
|
Douglas E. Coltharp
|
|
|
|
|
|
|
|
/s/ A
NDREW
L
.
P
RICE
|
Chief Accounting Officer
|
February 27, 2019
|
|
Andrew L. Price
|
|
|
|
|
|
|
|
/s/ L
EO
I. H
IGDON
, J
R
.
|
Chairman of the Board of Directors
|
February 27, 2019
|
|
Leo I. Higdon, Jr.
|
|
|
|
|
|
|
|
/s/ J
OHN
W. C
HIDSEY
|
Director
|
February 27, 2019
|
|
John W. Chidsey
|
|
|
|
|
|
|
|
/s/ D
ONALD
L. C
ORRELL
|
Director
|
February 27, 2019
|
|
Donald L. Correll
|
|
|
|
|
|
|
|
/s/ Y
VONNE
M. C
URL
|
Director
|
February 27, 2019
|
|
Yvonne M. Curl
|
|
|
|
/s/ C
HARLES
M. E
LSON
|
Director
|
February 27, 2019
|
|
Charles M. Elson
|
|
|
|
|
|
|
|
/s/ J
OAN
E. H
ERMAN
|
Director
|
February 27, 2019
|
|
Joan E. Herman
|
|
|
|
|
|
|
|
/s/ L
ESLYE
G. K
ATZ
|
Director
|
February 27, 2019
|
|
Leslye G. Katz
|
|
|
|
|
|
|
|
/s/ J
OHN
E. M
AUPIN
, J
R.
|
Director
|
February 27, 2019
|
|
John E. Maupin, Jr.
|
|
|
|
/s/ Nancy M. Schlichting
|
Director
|
February 27, 2019
|
|
Nancy M. Schlichting
|
|
|
|
|
|
|
|
/s/ L. E
DWARD
S
HAW
, J
R
.
|
Director
|
February 27, 2019
|
|
L. Edward Shaw, Jr.
|
|
|
79
|
Item 15.
|
Financial Statements
|
F-1
Report of Independent Registered Public Accounting Firm
To the Board of Directors and Shareholders of Encompass Health Corporation:
Opinions on the Financial Statements and Internal Control over Financial Reporting
We have audited the accompanying consolidated balance sheets of Encompass Health Corporation and its subsidiaries (the “Company”) as of December 31, 2018 and December 31, 2017, and the related consolidated statements of operations, comprehensive income, shareholders’ equity and cash flows for each of the three years in the period ended December 31, 2018, including the related notes (collectively referred to as the “consolidated financial statements”). We also have audited the Company's internal control over financial reporting as of December 31, 2018, based on criteria established in Internal Control - Integrated Framework (2013) issued by the Committee of Sponsoring Organizations of the Treadway Commission (COSO).
In our opinion, the consolidated financial statements referred to above present fairly, in all material respects, the financial position of the Company as of December 31, 2018 and December 31, 2017, and the results of its operations and its cash flows for each of the three years in the period ended December 31, 2018 in conformity with accounting principles generally accepted in the United States of America. Also in our opinion, the Company maintained, in all material respects, effective internal control over financial reporting as of December 31, 2018, based on criteria established in Internal Control - Integrated Framework (2013) issued by the COSO.
Change in Accounting Principle
As discussed in Note 1 to the consolidated financial statements, the Company changed the manner in which it accounts for net operating revenues in 2018.
Basis for Opinions
The Company's management is responsible for these consolidated financial statements, for maintaining effective internal control over financial reporting, and for its assessment of the effectiveness of internal control over financial reporting, included in Management's Report on Internal Control over Financial Reporting appearing under Item 9A. Our responsibility is to express opinions on the Company’s consolidated financial statements and on the Company's internal control over financial reporting based on our audits. We are a public accounting firm registered with the Public Company Accounting Oversight Board (United States) (“PCAOB”) and are required to be independent with respect to the Company in accordance with the U.S. federal securities laws and the applicable rules and regulations of the Securities and Exchange Commission and the PCAOB.
We conducted our audits in accordance with the standards of the PCAOB. Those standards require that we plan and perform the audits to obtain reasonable assurance about whether the consolidated financial statements are free of material misstatement, whether due to error or fraud, and whether effective internal control over financial reporting was maintained in all material respects.
Our audits of the consolidated financial statements included performing procedures to assess the risks of material misstatement of the consolidated financial statements, whether due to error or fraud, and performing procedures that respond to those risks. Such procedures included examining, on a test basis, evidence regarding the amounts and disclosures in the consolidated financial statements. Our audits also included evaluating the accounting principles used and significant estimates made by management, as well as evaluating the overall presentation of the consolidated financial statements. Our audit of internal control over financial reporting included obtaining an understanding of internal control over financial reporting, assessing the risk that a material weakness exists, and testing and evaluating the design and operating effectiveness of internal control based on the assessed risk. Our audits also included performing such other procedures as we considered necessary in the circumstances. We believe that our audits provide a reasonable basis for our opinions.
Definition and Limitations of Internal Control over Financial Reporting
A company’s internal control over financial reporting is a process designed to provide reasonable assurance regarding the reliability of financial reporting and the preparation of financial statements for external purposes in accordance with generally accepted accounting principles. A company’s internal control over financial reporting includes those policies and procedures that (i) pertain to the maintenance of records that, in reasonable detail, accurately and fairly reflect the transactions and dispositions of the assets of the company; (ii) provide reasonable assurance that transactions are recorded as necessary to permit preparation of financial statements in accordance with generally accepted accounting principles, and that receipts and expenditures of the company are being made only in accordance with authorizations of management and directors of the
F-2
company; and (iii) provide reasonable assurance regarding prevention or timely detection of unauthorized acquisition, use, or disposition of the company’s assets that could have a material effect on the financial statements.
Because of its inherent limitations, internal control over financial reporting may not prevent or detect misstatements. Also, projections of any evaluation of effectiveness to future periods are subject to the risk that controls may become inadequate because of changes in conditions, or that the degree of compliance with the policies or procedures may deteriorate.
/s/ PricewaterhouseCoopers LLP
Birmingham, Alabama
February 27, 2019
We have served as the Company’s auditor since 2003.
F-3
|
Encompass Health Corporation and Subsidiaries
Consolidated Statements of Operations
|
||
|
|
For the Year Ended December 31,
|
||||||||||
|
|
2018
|
2017
|
2016
|
||||||||
|
|
(In Millions, Except Per Share Data)
|
||||||||||
|
Net operating revenues
|
$
|
4,277.3
|
|
$
|
3,913.9
|
|
$
|
3,642.6
|
|
||
|
Operating expenses:
|
|
|
|
|
|
|
|||||
|
Salaries and benefits
|
2,354.0
|
|
2,154.6
|
|
1,985.9
|
|
|||||
|
Other operating expenses
|
585.1
|
|
531.6
|
|
490.6
|
|
|||||
|
Occupancy costs
|
78.0
|
|
73.5
|
|
71.3
|
|
|||||
|
Supplies
|
158.7
|
|
149.3
|
|
140.0
|
|
|||||
|
General and administrative expenses
|
220.2
|
|
171.7
|
|
133.4
|
|
|||||
|
Depreciation and amortization
|
199.7
|
|
183.8
|
|
172.6
|
|
|||||
|
Government, class action, and related settlements
|
52.0
|
|
—
|
|
—
|
|
|||||
|
Total operating expenses
|
3,647.7
|
|
3,264.5
|
|
2,993.8
|
|
|||||
|
Loss on early extinguishment of debt
|
—
|
|
10.7
|
|
7.4
|
|
|||||
|
Interest expense and amortization of debt discounts and fees
|
147.3
|
|
154.4
|
|
172.1
|
|
|||||
|
Other income
|
(2.2
|
)
|
(4.1
|
)
|
(2.9
|
)
|
|||||
|
Equity in net income of nonconsolidated affiliates
|
(8.7
|
)
|
(8.0
|
)
|
(9.8
|
)
|
|||||
|
Income from continuing operations before income tax expense
|
493.2
|
|
496.4
|
|
482.0
|
|
|||||
|
Provision for income tax expense
|
118.9
|
|
145.8
|
|
163.9
|
|
|||||
|
Income from continuing operations
|
374.3
|
|
350.6
|
|
318.1
|
|
|||||
|
Income (loss) from discontinued operations, net of tax
|
1.1
|
|
(0.4
|
)
|
—
|
|
|||||
|
Net income
|
375.4
|
|
350.2
|
|
318.1
|
|
|||||
|
Less: Net income attributable to noncontrolling interests
|
(83.1
|
)
|
(79.1
|
)
|
(70.5
|
)
|
|||||
|
Net income attributable to Encompass Health
|
$
|
292.3
|
|
$
|
271.1
|
|
$
|
247.6
|
|
||
|
Weighted average common shares outstanding:
|
|
|
|
|
|
|
|||||
|
Basic
|
97.9
|
|
93.7
|
|
89.1
|
|
|||||
|
Diluted
|
99.8
|
|
99.3
|
|
99.5
|
|
|||||
|
Earnings per common share:
|
|||||||||||
|
Basic earnings per share attributable to Encompass Health common shareholders:
|
|
|
|
|
|
|
|||||
|
Continuing operations
|
$
|
2.97
|
|
$
|
2.88
|
|
$
|
2.77
|
|
||
|
Discontinued operations
|
0.01
|
|
—
|
|
—
|
|
|||||
|
Net income
|
$
|
2.98
|
|
$
|
2.88
|
|
$
|
2.77
|
|
||
|
Diluted earnings per share attributable to Encompass Health common shareholders:
|
|||||||||||
|
Continuing operations
|
$
|
2.92
|
|
$
|
2.84
|
|
$
|
2.59
|
|
||
|
Discontinued operations
|
0.01
|
|
—
|
|
—
|
|
|||||
|
Net income
|
$
|
2.93
|
|
$
|
2.84
|
|
$
|
2.59
|
|
||
|
Amounts attributable to Encompass Health:
|
|
|
|
|
|
|
|||||
|
Income from continuing operations
|
$
|
291.2
|
|
$
|
271.5
|
|
$
|
247.6
|
|
||
|
Income (loss) from discontinued operations, net of tax
|
1.1
|
|
(0.4
|
)
|
—
|
|
|||||
|
Net income attributable to Encompass Health
|
$
|
292.3
|
|
$
|
271.1
|
|
$
|
247.6
|
|
||
The accompanying notes to consolidated financial statements are an integral part of these statements.
F-4
|
Encompass Health Corporation and Subsidiaries
Consolidated Statements of Comprehensive Income
|
||
|
|
For the Year Ended December 31,
|
||||||||||
|
|
2018
|
2017
|
2016
|
||||||||
|
|
(In Millions)
|
||||||||||
|
COMPREHENSIVE INCOME
|
|
|
|
||||||||
|
Net income
|
$
|
375.4
|
|
$
|
350.2
|
|
$
|
318.1
|
|
||
|
Other comprehensive loss, net of tax:
|
|
|
|
|
|
|
|||||
|
Net change in unrealized (loss) gain on available-for-sale securities:
|
|
|
|
|
|
|
|||||
|
Unrealized net holding (loss) gain arising during the period
|
—
|
|
(0.1
|
)
|
0.1
|
|
|||||
|
Other comprehensive (loss) income before income taxes
|
—
|
|
(0.1
|
)
|
0.1
|
|
|||||
|
Provision for income tax expense related to other comprehensive loss items
|
—
|
|
—
|
|
(0.1
|
)
|
|||||
|
Other comprehensive loss, net of tax:
|
—
|
|
(0.1
|
)
|
—
|
|
|||||
|
Comprehensive income
|
375.4
|
|
350.1
|
|
318.1
|
|
|||||
|
Comprehensive income attributable to noncontrolling interests
|
(83.1
|
)
|
(79.1
|
)
|
(70.5
|
)
|
|||||
|
Comprehensive income attributable to Encompass Health
|
$
|
292.3
|
|
$
|
271.0
|
|
$
|
247.6
|
|
||
The accompanying notes to consolidated financial statements are an integral part of these statements.
F-5
|
Encompass Health Corporation and Subsidiaries
Consolidated Balance Sheets
|
||
|
|
As of December 31,
|
||||||
|
|
2018
|
2017
|
|||||
|
|
(In Millions, Except Share Data)
|
||||||
|
Assets
|
|
|
|||||
|
Current assets:
|
|
|
|||||
|
Cash and cash equivalents
|
$
|
69.2
|
|
$
|
54.4
|
|
|
|
Restricted cash
|
59.0
|
|
62.4
|
|
|||
|
Accounts receivable
|
467.7
|
|
472.1
|
|
|||
|
Prepaid expenses and other current assets
|
66.2
|
|
113.3
|
|
|||
|
Total current assets
|
662.1
|
|
702.2
|
|
|||
|
Property and equipment, net
|
1,634.8
|
|
1,517.1
|
|
|||
|
Goodwill
|
2,100.8
|
|
1,972.6
|
|
|||
|
Intangible assets, net
|
443.4
|
|
403.1
|
|
|||
|
Deferred income tax assets
|
42.9
|
|
34.4
|
|
|||
|
Other long-term assets
|
291.0
|
|
235.1
|
|
|||
|
Total assets
(1)
|
$
|
5,175.0
|
|
$
|
4,864.5
|
|
|
|
Liabilities and Shareholders’ Equity
|
|
|
|
|
|||
|
Current liabilities:
|
|
|
|
|
|||
|
Current portion of long-term debt
|
$
|
35.8
|
|
$
|
32.3
|
|
|
|
Accounts payable
|
90.0
|
|
78.4
|
|
|||
|
Accrued payroll
|
188.4
|
|
172.1
|
|
|||
|
Accrued interest payable
|
24.4
|
|
24.7
|
|
|||
|
Other current liabilities
|
333.9
|
|
210.0
|
|
|||
|
Total current liabilities
|
672.5
|
|
517.5
|
|
|||
|
Long-term debt, net of current portion
|
2,478.6
|
|
2,545.4
|
|
|||
|
Self-insured risks
|
119.6
|
|
110.1
|
|
|||
|
Other long-term liabilities
|
85.6
|
|
75.2
|
|
|||
|
|
3,356.3
|
|
3,248.2
|
|
|||
|
Commitments and contingencies
|
|
|
|
|
|||
|
Redeemable noncontrolling interests
|
261.7
|
|
220.9
|
|
|||
|
Shareholders’ equity:
|
|
|
|
|
|||
|
Encompass Health shareholders’ equity:
|
|
|
|
|
|||
|
Common stock, $.01 par value; 200,000,000 shares authorized; issued: 112,492,690 in 2018; 111,690,547 in 2017
|
1.1
|
|
1.1
|
|
|||
|
Capital in excess of par value
|
2,588.7
|
|
2,747.4
|
|
|||
|
Accumulated deficit
|
(885.2
|
)
|
(1,176.2
|
)
|
|||
|
Accumulated other comprehensive loss
|
—
|
|
(1.3
|
)
|
|||
|
Treasury stock, at cost (13,566,209 shares in 2018 and 13,385,019 shares in 2017)
|
(427.9
|
)
|
(418.5
|
)
|
|||
|
Total Encompass Health shareholders’ equity
|
1,276.7
|
|
1,152.5
|
|
|||
|
Noncontrolling interests
|
280.3
|
|
242.9
|
|
|||
|
Total shareholders’ equity
|
1,557.0
|
|
1,395.4
|
|
|||
|
Total liabilities
(1)
and shareholders’ equity
|
$
|
5,175.0
|
|
$
|
4,864.5
|
|
|
|
(1)
|
Our consolidated assets as of
December 31, 2018
and
December 31, 2017
include total assets of variable interest entities of
$197.5 million
and
$264.1 million
, respectively, which cannot be used by us to settle the obligations of other entities. Our consolidated liabilities as of
December 31, 2018
and
December 31, 2017
include total liabilities of the variable interest entities of
$50.8 million
and
$52.5 million
, respectively. See
Note 3,
Variable Interest Entities
.
|
The accompanying notes to consolidated financial statements are an integral part of these statements.
F-6
|
Encompass Health Corporation and Subsidiaries
Consolidated Statements of Shareholders’ Equity
|
||
|
|
Encompass Health Common Shareholders
|
|
|
|||||||||||||||||||||||||||
|
|
Number of Common Shares Outstanding
|
Common Stock
|
Capital in Excess of Par Value
|
Accumulated
Deficit
|
Accumulated Other Comprehensive Loss
|
Treasury
Stock
|
Noncontrolling Interests
|
Total
|
||||||||||||||||||||||
|
(In Millions)
|
||||||||||||||||||||||||||||||
|
December 31, 2015
|
90.1
|
|
$
|
1.1
|
|
$
|
2,821.0
|
|
$
|
(1,696.0
|
)
|
$
|
(1.2
|
)
|
$
|
(527.4
|
)
|
$
|
167.9
|
|
$
|
765.4
|
|
|||||||
|
Net income
|
—
|
|
—
|
|
—
|
|
247.6
|
|
—
|
|
—
|
|
56.4
|
|
304.0
|
|
||||||||||||||
|
Receipt of treasury stock
|
(0.5
|
)
|
—
|
|
—
|
|
—
|
|
—
|
|
(11.6
|
)
|
—
|
|
(11.6
|
)
|
||||||||||||||
|
Dividends declared ($0.94 per share)
|
—
|
|
—
|
|
(84.9
|
)
|
—
|
|
—
|
|
—
|
|
—
|
|
(84.9
|
)
|
||||||||||||||
|
Stock-based compensation
|
—
|
|
—
|
|
21.4
|
|
—
|
|
—
|
|
—
|
|
—
|
|
21.4
|
|
||||||||||||||
|
Stock options exercised
|
0.6
|
|
—
|
|
13.1
|
|
—
|
|
—
|
|
(7.8
|
)
|
—
|
|
5.3
|
|
||||||||||||||
|
Distributions declared
|
—
|
|
—
|
|
—
|
|
—
|
|
—
|
|
—
|
|
(54.2
|
)
|
(54.2
|
)
|
||||||||||||||
|
Repurchases of common stock in open market
|
(1.7
|
)
|
—
|
|
—
|
|
—
|
|
—
|
|
(65.6
|
)
|
—
|
|
(65.6
|
)
|
||||||||||||||
|
Capital contributions from consolidated affiliates
|
—
|
|
—
|
|
—
|
|
—
|
|
—
|
|
—
|
|
19.6
|
|
19.6
|
|
||||||||||||||
|
Fair value adjustments to redeemable noncontrolling interests
|
—
|
|
—
|
|
(10.9
|
)
|
—
|
|
—
|
|
—
|
|
—
|
|
(10.9
|
)
|
||||||||||||||
|
Windfall tax benefits from share-based compensation
|
—
|
|
—
|
|
17.3
|
|
—
|
|
—
|
|
—
|
|
—
|
|
17.3
|
|
||||||||||||||
|
Other
|
0.4
|
|
—
|
|
4.0
|
|
—
|
|
—
|
|
(2.3
|
)
|
3.1
|
|
4.8
|
|
||||||||||||||
|
December 31, 2016
|
88.9
|
|
|
1.1
|
|
|
2,781.0
|
|
|
(1,448.4
|
)
|
|
(1.2
|
)
|
|
(614.7
|
)
|
|
192.8
|
|
|
910.6
|
|
|||||||
|
Net income
|
—
|
|
—
|
|
—
|
|
271.1
|
|
—
|
|
—
|
|
61.2
|
|
332.3
|
|
||||||||||||||
|
Receipt of treasury stock
|
(0.9
|
)
|
—
|
|
—
|
|
—
|
|
—
|
|
(19.8
|
)
|
—
|
|
(19.8
|
)
|
||||||||||||||
|
Dividends declared ($0.98 per share)
|
—
|
|
—
|
|
(95.2
|
)
|
—
|
|
—
|
|
—
|
|
—
|
|
(95.2
|
)
|
||||||||||||||
|
Stock-based compensation
|
—
|
|
—
|
|
21.3
|
|
—
|
|
—
|
|
—
|
|
—
|
|
21.3
|
|
||||||||||||||
|
Stock options exercised
|
1.1
|
|
—
|
|
20.4
|
|
—
|
|
—
|
|
(19.3
|
)
|
—
|
|
1.1
|
|
||||||||||||||
|
Stock warrants exercised
|
0.7
|
|
—
|
|
26.6
|
|
—
|
|
—
|
|
—
|
|
—
|
|
26.6
|
|
||||||||||||||
|
Distributions declared
|
—
|
|
—
|
|
—
|
|
—
|
|
—
|
|
—
|
|
(50.5
|
)
|
(50.5
|
)
|
||||||||||||||
|
Repurchases of common stock in open market
|
(0.9
|
)
|
—
|
|
—
|
|
—
|
|
—
|
|
(38.1
|
)
|
—
|
|
(38.1
|
)
|
||||||||||||||
|
Capital contributions from consolidated affiliates
|
—
|
|
—
|
|
—
|
|
—
|
|
—
|
|
—
|
|
46.2
|
|
46.2
|
|
||||||||||||||
|
Fair value adjustments to redeemable noncontrolling interests
|
—
|
|
—
|
|
(67.0
|
)
|
—
|
|
—
|
|
—
|
|
—
|
|
(67.0
|
)
|
||||||||||||||
|
Conversion of convertible debt, net of tax
|
8.9
|
|
—
|
|
53.7
|
|
—
|
|
—
|
|
274.5
|
|
—
|
|
328.2
|
|
||||||||||||||
|
Other
|
0.5
|
|
—
|
|
6.6
|
|
1.1
|
|
(0.1
|
)
|
(1.1
|
)
|
(6.8
|
)
|
(0.3
|
)
|
||||||||||||||
|
December 31, 2017
|
98.3
|
|
1.1
|
|
2,747.4
|
|
(1,176.2
|
)
|
(1.3
|
)
|
(418.5
|
)
|
242.9
|
|
1,395.4
|
|
||||||||||||||
|
Net income
|
—
|
|
—
|
|
—
|
|
292.3
|
|
—
|
|
—
|
|
69.2
|
|
361.5
|
|
||||||||||||||
|
Receipt of treasury stock
|
(0.2
|
)
|
—
|
|
—
|
|
—
|
|
—
|
|
(8.3
|
)
|
—
|
|
(8.3
|
)
|
||||||||||||||
|
Dividends declared ($1.04 per share)
|
—
|
|
—
|
|
(103.7
|
)
|
—
|
|
—
|
|
—
|
|
—
|
|
(103.7
|
)
|
||||||||||||||
|
Stock-based compensation
|
—
|
|
—
|
|
28.9
|
|
—
|
|
—
|
|
—
|
|
—
|
|
28.9
|
|
||||||||||||||
|
Stock options exercised
|
0.1
|
|
—
|
|
3.2
|
|
—
|
|
—
|
|
—
|
|
—
|
|
3.2
|
|
||||||||||||||
|
Distributions declared
|
—
|
|
—
|
|
—
|
|
—
|
|
—
|
|
—
|
|
(71.1
|
)
|
(71.1
|
)
|
||||||||||||||
|
Capital contributions from consolidated affiliates
|
—
|
|
—
|
|
—
|
|
—
|
|
—
|
|
—
|
|
38.8
|
|
38.8
|
|
||||||||||||||
|
Fair value adjustments to redeemable noncontrolling interests
|
—
|
|
—
|
|
(91.0
|
)
|
—
|
|
—
|
|
—
|
|
—
|
|
(91.0
|
)
|
||||||||||||||
|
Other
|
0.7
|
|
—
|
|
3.9
|
|
(1.3
|
)
|
1.3
|
|
(1.1
|
)
|
0.5
|
|
3.3
|
|
||||||||||||||
|
December 31, 2018
|
98.9
|
|
$
|
1.1
|
|
$
|
2,588.7
|
|
$
|
(885.2
|
)
|
$
|
—
|
|
$
|
(427.9
|
)
|
$
|
280.3
|
|
$
|
1,557.0
|
|
|||||||
The accompanying notes to consolidated financial statements are an integral part of these statements.
F-7
|
Encompass Health Corporation and Subsidiaries
Consolidated Statements of Cash Flows
|
||
|
|
For the Year Ended December 31,
|
||||||||||
|
|
2018
|
2017
|
2016
|
||||||||
|
|
(In Millions)
|
||||||||||
|
Cash flows from operating activities:
|
|
|
|
||||||||
|
Net income
|
$
|
375.4
|
|
$
|
350.2
|
|
$
|
318.1
|
|
||
|
(Income) loss from discontinued operations, net of tax
|
(1.1
|
)
|
0.4
|
|
—
|
|
|||||
|
Adjustments to reconcile net income to net cash provided by operating activities—
|
|
|
|
|
|
|
|||||
|
Provision for government, class action, and related settlements
|
52.0
|
|
—
|
|
—
|
|
|||||
|
Depreciation and amortization
|
199.7
|
|
183.8
|
|
172.6
|
|
|||||
|
Amortization of debt-related items
|
4.0
|
|
8.7
|
|
13.8
|
|
|||||
|
Loss on early extinguishment of debt
|
—
|
|
10.7
|
|
7.4
|
|
|||||
|
Equity in net income of nonconsolidated affiliates
|
(8.7
|
)
|
(8.0
|
)
|
(9.8
|
)
|
|||||
|
Distributions from nonconsolidated affiliates
|
8.3
|
|
8.6
|
|
8.5
|
|
|||||
|
Stock-based compensation
|
85.9
|
|
47.7
|
|
27.4
|
|
|||||
|
Deferred tax expense
|
(9.1
|
)
|
60.8
|
|
132.9
|
|
|||||
|
Other, net
|
9.2
|
|
3.4
|
|
0.1
|
|
|||||
|
Changes in assets and liabilities, net of acquisitions—
|
|
|
|
|
|
|
|||||
|
Accounts receivable
|
7.0
|
|
(31.5
|
)
|
(66.3
|
)
|
|||||
|
Prepaid expenses and other assets
|
11.5
|
|
(12.6
|
)
|
(3.3
|
)
|
|||||
|
Accounts payable
|
6.6
|
|
7.5
|
|
6.3
|
|
|||||
|
Accrued payroll
|
14.8
|
|
24.4
|
|
21.4
|
|
|||||
|
Other liabilities
|
6.1
|
|
4.8
|
|
11.8
|
|
|||||
|
Net cash provided by (used in) operating activities of discontinued operations
|
0.8
|
|
(0.6
|
)
|
(0.7
|
)
|
|||||
|
Total adjustments
|
388.1
|
|
307.7
|
|
322.1
|
|
|||||
|
Net cash provided by operating activities
|
762.4
|
|
658.3
|
|
640.2
|
|
|||||
|
Cash flows from investing activities:
|
|
|
|
||||||||
|
Acquisition of businesses, net of cash acquired
|
(143.9
|
)
|
(38.8
|
)
|
(48.1
|
)
|
|||||
|
Purchases of property and equipment
|
(254.5
|
)
|
(225.8
|
)
|
(177.7
|
)
|
|||||
|
Additions to capitalized software costs
|
(16.0
|
)
|
(19.2
|
)
|
(25.2
|
)
|
|||||
|
Proceeds from disposal of assets
|
0.4
|
|
12.3
|
|
23.9
|
|
|||||
|
Proceeds from sale of restricted investments
|
11.6
|
|
4.2
|
|
0.1
|
|
|||||
|
Purchases of restricted investments
|
(13.3
|
)
|
(8.5
|
)
|
(1.3
|
)
|
|||||
|
Other, net
|
(8.8
|
)
|
(7.2
|
)
|
(1.7
|
)
|
|||||
|
Net cash provided by investing activities of discontinued operations
|
—
|
|
—
|
|
0.1
|
|
|||||
|
Net cash used in investing activities
|
(424.5
|
)
|
(283.0
|
)
|
(229.9
|
)
|
|||||
(Continued)
F-8
|
Encompass Health Corporation and Subsidiaries
Consolidated Statements of Cash Flows (Continued)
|
||
|
|
For the Year Ended December 31,
|
||||||||||
|
|
2018
|
2017
|
2016
|
||||||||
|
|
(In Millions)
|
||||||||||
|
Cash flows from financing activities:
|
|
|
|
|
|
|
|||||
|
Principal payments on debt, including pre-payments
|
(20.6
|
)
|
(129.9
|
)
|
(202.1
|
)
|
|||||
|
Principal borrowings on notes
|
13.2
|
|
—
|
|
—
|
|
|||||
|
Borrowings on revolving credit facility
|
325.0
|
|
273.3
|
|
335.0
|
|
|||||
|
Payments on revolving credit facility
|
(390.0
|
)
|
(330.3
|
)
|
(313.0
|
)
|
|||||
|
Principal payments under capital lease obligations
|
(17.9
|
)
|
(15.3
|
)
|
(13.3
|
)
|
|||||
|
Repurchases of common stock, including fees and expenses
|
—
|
|
(38.1
|
)
|
(65.6
|
)
|
|||||
|
Dividends paid on common stock
|
(100.8
|
)
|
(91.5
|
)
|
(83.8
|
)
|
|||||
|
Purchase of equity interests in consolidated affiliates
|
(65.1
|
)
|
—
|
|
—
|
|
|||||
|
Proceeds from exercising stock warrants
|
—
|
|
26.6
|
|
—
|
|
|||||
|
Distributions paid to noncontrolling interests of consolidated affiliates
|
(75.4
|
)
|
(51.9
|
)
|
(64.9
|
)
|
|||||
|
Taxes paid on behalf of employees for shares withheld
|
(8.3
|
)
|
(19.8
|
)
|
(11.6
|
)
|
|||||
|
Contributions from consolidated affiliates
|
12.6
|
|
20.8
|
|
3.5
|
|
|||||
|
Other, net
|
6.1
|
|
(3.8
|
)
|
(0.6
|
)
|
|||||
|
Net cash used in financing activities
|
(321.2
|
)
|
(359.9
|
)
|
(416.4
|
)
|
|||||
|
Increase (decrease) in cash, cash equivalents, and restricted cash
|
16.7
|
|
15.4
|
|
(6.1
|
)
|
|||||
|
Cash, cash equivalents, and restricted cash at beginning of year
|
116.8
|
|
101.4
|
|
107.5
|
|
|||||
|
Cash, cash equivalents, and restricted cash at end of year
|
$
|
133.5
|
|
$
|
116.8
|
|
$
|
101.4
|
|
||
|
Reconciliation of Cash, Cash Equivalents, and Restricted Cash
|
|||||||||||
|
Cash and cash equivalents at beginning of period
|
$
|
54.4
|
|
$
|
40.5
|
|
$
|
61.6
|
|
||
|
Restricted cash at beginning of period
|
62.4
|
|
60.9
|
|
45.9
|
|
|||||
|
Cash, cash equivalents, and restricted cash at beginning of period
|
$
|
116.8
|
|
$
|
101.4
|
|
$
|
107.5
|
|
||
|
Cash and cash equivalents at end of period
|
$
|
69.2
|
|
$
|
54.4
|
|
$
|
40.5
|
|
||
|
Restricted cash at end of period
|
59.0
|
|
62.4
|
|
60.9
|
|
|||||
|
Restricted cash included in other long-term assets at end of period
|
5.3
|
|
—
|
|
—
|
|
|||||
|
Cash, cash equivalents, and restricted cash at end of period
|
$
|
133.5
|
|
$
|
116.8
|
|
$
|
101.4
|
|
||
|
Supplemental cash flow information:
|
|
|
|
||||||||
|
Cash (paid) received during the year for —
|
|
|
|
||||||||
|
Interest
|
$
|
(149.6
|
)
|
$
|
(150.5
|
)
|
$
|
(164.3
|
)
|
||
|
Income tax refunds
|
0.6
|
|
1.9
|
|
1.4
|
|
|||||
|
Income tax payments
|
(115.4
|
)
|
(96.4
|
)
|
(33.3
|
)
|
|||||
|
Supplemental schedule of noncash financing activities:
|
|||||||||||
|
Conversion of convertible debt
|
$
|
—
|
|
$
|
319.4
|
|
$
|
—
|
|
||
The accompanying notes to consolidated financial statements are an integral part of these statements.
F-9
|
Encompass Health Corporation and Subsidiaries
Notes to Consolidated Financial Statements
|
||
|
1.
|
Summary of Significant Accounting Policies
:
|
Organization and Description of Business—
Encompass Health Corporation, incorporated in Delaware in 1984, including its subsidiaries, is one of the nation’s largest providers of post-acute healthcare services, offering both facility-based and home-based post-acute services in
36
states and Puerto Rico through our network of inpatient rehabilitation hospitals, home health agencies, and hospice agencies. We manage our operations and disclose financial information using two reportable segments: (1) inpatient rehabilitation and (2) home health and hospice. See Note
18
,
Segment Reporting
.
On July 10, 2017, we announced the plan to rebrand and change our name from HealthSouth Corporation to Encompass Health Corporation. On October 20, 2017, our board of directors approved an amended and restated certificate of incorporation in order to change the name effective as of January 1, 2018. Along with the corporate name change, the NYSE ticker symbol for our common stock changed from “HLS” to “EHC.” Our operations in both business segments transitioned to the Encompass Health branding in 2018.
Basis of Presentation and Consolidation—
The accompanying consolidated financial statements of Encompass Health and its subsidiaries were prepared in accordance with generally accepted accounting principles in the United States of America and include the assets, liabilities, revenues, and expenses of all wholly-owned subsidiaries, majority-owned subsidiaries over which we exercise control, and, when applicable, entities in which we have a controlling financial interest.
We use the equity method to account for our investments in entities we do not control, but where we have the ability to exercise significant influence over operating and financial policies. Consolidated
Net income attributable to Encompass Health
includes our share of the net earnings of these entities. The difference between consolidation and the equity method impacts certain of our financial ratios because of the presentation of the detailed line items reported in the consolidated financial statements for consolidated entities compared to a one line presentation of equity method investments.
We use the cost method to account for our investments in entities we do not control and for which we do not have the ability to exercise significant influence over operating and financial policies. In accordance with the cost method, these investments are recorded at the lower of cost or fair value, as appropriate.
We eliminate all significant intercompany accounts and transactions from our financial results.
Variable Interest Entities
—
Any entity considered a variable interest entity (“VIE”) is evaluated to determine which party is the primary beneficiary and thus should consolidate the VIE. This analysis is complex, involves uncertainties, and requires significant judgment on various matters. In order to determine if we are the primary beneficiary of a VIE, we must determine what activities most significantly impact the economic performance of the entity, whether we have the power to direct those activities, and if our obligation to absorb losses or receive benefits from the VIE could potentially be significant to the VIE.
Use of Estimates and Assumptions—
The preparation of our consolidated financial statements in conformity with GAAP requires the use of estimates and assumptions that affect the reported amounts of assets and liabilities, the disclosure of contingent assets and liabilities at the date of the consolidated financial statements, and the reported amounts of revenues and expenses during the reporting periods. Significant estimates and assumptions are used for, but not limited to: (1) revenue reserves for contractual adjustments and uncollectible amounts; (2) fair value of acquired assets and assumed liabilities in business combinations; (3) asset impairments, including goodwill; (4) depreciable lives of assets; (5) useful lives of intangible assets; (6) economic lives and fair value of leased assets; (7) income tax valuation allowances; (8) uncertain tax positions; (9) fair value of stock options and restricted stock containing a market condition; (10) fair value of redeemable noncontrolling interests; (11) reserves for self-insured healthcare plans; (12) reserves for professional, workers’ compensation, and comprehensive general insurance liability risks; and (13) contingency and litigation reserves. Future events and their effects cannot be predicted with certainty; accordingly, our
F-10
|
Encompass Health Corporation and Subsidiaries
Notes to Consolidated Financial Statements
|
||
accounting estimates require the exercise of judgment. The accounting estimates used in the preparation of our consolidated financial statements will change as new events occur, as more experience is acquired, as additional information is obtained, and as our operating environment changes. We evaluate and update our assumptions and estimates on an ongoing basis and may employ outside experts to assist in our evaluation, as considered necessary. Actual results could differ from those estimates.
Risks and Uncertainties—
As a healthcare provider, we are required to comply with extensive and complex laws and regulations at the federal, state, and local government levels. These laws and regulations relate to, among other things:
|
•
|
licensure, certification, and accreditation;
|
|
•
|
policies, either at the national or local level, delineating what conditions must be met to qualify for reimbursement under Medicare (also referred to as coverage requirements);
|
|
•
|
coding and billing for services;
|
|
•
|
requirements of the
60%
compliance threshold under The Medicare, Medicaid and State Children’s Health Insurance Program (SCHIP) Extension Act of 2007;
|
|
•
|
relationships with physicians and other referral sources, including physician self-referral and anti-kickback laws;
|
|
•
|
quality of medical care;
|
|
•
|
use and maintenance of medical supplies and equipment;
|
|
•
|
maintenance and security of patient information and medical records;
|
|
•
|
acquisition and dispensing of pharmaceuticals and controlled substances; and
|
|
•
|
disposal of medical and hazardous waste.
|
In the future, changes in these laws or regulations or the manner in which they are enforced could subject our current or past practices to allegations of impropriety or illegality or could require us to make changes in our hospitals, equipment, personnel, services, capital expenditure programs, operating procedures, contractual arrangements, and patient admittance practices, as well as the way in which we deliver home health and hospice services.
If we fail to comply with applicable laws and regulations, we could be required to return portions of reimbursements deemed after the fact to have not been appropriate. We could also be subjected to liabilities, including (1) criminal penalties, (2) civil penalties, including monetary penalties and the loss of our licenses to operate one or more of our hospitals or agencies, and (3) exclusion or suspension of one or more of our hospitals from participation in the Medicare, Medicaid, and other federal and state healthcare programs which, if lengthy in duration and material to us, could potentially trigger a default under our credit agreement. Because Medicare comprises a significant portion of our
Net operating revenues
, failure to comply with the laws and regulations governing the Medicare program and related matters, including anti-kickback and anti-fraud requirements, could materially and adversely affect us. Specifically, reductions in reimbursements, substantial damages, and other remedies assessed against us could have a material adverse effect on our business, financial position, results of operation, and cash flows. Even the assertion of a violation, depending on its nature, could have a material adverse effect upon our stock price or reputation.
Historically, the United States Congress and some state legislatures have periodically proposed significant changes in regulations governing the healthcare system. Many of these changes have resulted in limitations on the increases in and, in some cases, significant roll-backs or reductions in the levels of payments to healthcare providers for services under many government reimbursement programs. There can be no assurance that future governmental initiatives will not result in pricing roll-backs or freezes or reimbursement reductions. Because we receive a significant percentage of our revenues from Medicare, such changes in legislation might have a material adverse effect on our financial position, results of operations, and cash flows.
F-11
|
Encompass Health Corporation and Subsidiaries
Notes to Consolidated Financial Statements
|
||
In addition, there are increasing pressures from many third-party payors to control healthcare costs and to reduce or limit increases in reimbursement rates for medical services. Our relationships with managed care and nongovernmental third-party payors are generally governed by negotiated agreements. These agreements set forth the amounts we are entitled to receive for our services. We could be adversely affected in some of the markets where we operate if we are unable to negotiate and maintain favorable agreements with third-party payors.
Our third-party payors may also, from time to time, request audits of the amounts paid, or to be paid, to us. We could be adversely affected in some of the markets where we operate if the auditing payor alleges substantial overpayments were made to us due to coding errors or lack of documentation to support medical necessity determinations.
As discussed in
Note 17,
Contingencies and Other Commitments
, we are a party to a number of lawsuits. We cannot predict the outcome of litigation filed against us. Substantial damages or other monetary remedies assessed against us could have a material adverse effect on our business, financial position, results of operations, and cash flows.
Net Operating Revenues—
Our
Net operating revenues
disaggregated by payor source and segment are as follows (in millions):
|
Inpatient Rehabilitation
|
Home Health and Hospice
|
Consolidated
|
|||||||||||||||||||||||||||||||||
|
Year Ended December 31,
|
Year Ended December 31,
|
Year Ended December 31,
|
|||||||||||||||||||||||||||||||||
|
2018
|
2017
|
2016
|
2018
|
2017
|
2016
|
2018
|
2017
|
2016
|
|||||||||||||||||||||||||||
|
Medicare
|
$
|
2,451.7
|
|
$
|
2,313.6
|
|
$
|
2,187.8
|
|
$
|
794.5
|
|
$
|
662.9
|
|
$
|
565.9
|
|
$
|
3,246.2
|
|
$
|
2,976.5
|
|
$
|
2,753.7
|
|
||||||||
|
Medicare Advantage
|
306.5
|
|
261.0
|
|
226.9
|
|
88.6
|
|
74.8
|
|
59.0
|
|
395.1
|
|
335.8
|
|
285.9
|
|
|||||||||||||||||
|
Managed care
|
343.3
|
|
335.6
|
|
325.4
|
|
33.2
|
|
29.1
|
|
26.2
|
|
376.5
|
|
364.7
|
|
351.6
|
|
|||||||||||||||||
|
Medicaid
|
101.3
|
|
93.2
|
|
84.5
|
|
11.6
|
|
4.3
|
|
25.8
|
|
112.9
|
|
97.5
|
|
110.3
|
|
|||||||||||||||||
|
Other third-party payors
|
49.0
|
|
49.9
|
|
50.3
|
|
—
|
|
—
|
|
—
|
|
49.0
|
|
49.9
|
|
50.3
|
|
|||||||||||||||||
|
Workers’ compensation
|
27.4
|
|
27.5
|
|
29.6
|
|
1.5
|
|
0.1
|
|
0.1
|
|
28.9
|
|
27.6
|
|
29.7
|
|
|||||||||||||||||
|
Patients
|
18.7
|
|
18.4
|
|
17.9
|
|
0.8
|
|
0.7
|
|
0.5
|
|
19.5
|
|
19.1
|
|
18.4
|
|
|||||||||||||||||
|
Other income
|
48.3
|
|
42.1
|
|
42.0
|
|
0.9
|
|
0.7
|
|
0.7
|
|
49.2
|
|
42.8
|
|
42.7
|
|
|||||||||||||||||
|
Total
|
$
|
3,346.2
|
|
$
|
3,141.3
|
|
$
|
2,964.4
|
|
$
|
931.1
|
|
$
|
772.6
|
|
$
|
678.2
|
|
$
|
4,277.3
|
|
$
|
3,913.9
|
|
$
|
3,642.6
|
|
||||||||
We record
Net operating revenues
on an accrual basis using our best estimate of the transaction price for the type of service provided to the patient. Our estimate of the transaction price includes estimates of price concessions for such items as contractual allowances, potential adjustments that may arise from payment and other reviews, and uncollectible amounts. Our accounting systems calculate contractual allowances on a patient-by-patient basis based on the rates in effect for each primary third-party payor. Adjustments related to payment reviews by third-party payors or their agents are based on our historical experience and success rates in the claims adjudication process.
Estimates for uncollectible amounts are based on the aging of our accounts receivable, our historical collection experience for each type of payor, and other relevant factors.
Management continually reviews the revenue transaction price estimation process to consider and incorporate updates to laws and regulations and the frequent changes in managed care contractual terms that result from contract renegotiations and renewals. Due to complexities involved in determining amounts ultimately due under reimbursement arrangements with third-party payors, which are often subject to interpretation, we may receive reimbursement for healthcare services authorized and provided that is different from our estimates, and such differences could be material. In addition, laws and regulations governing the Medicare and Medicaid programs are complex, subject to interpretation, and are routinely modified for provider reimbursement. All healthcare providers participating in the Medicare and Medicaid programs are required to meet certain financial reporting requirements. Federal regulations require submission of annual cost reports covering medical costs and expenses associated with the services provided under each hospital, home health, and hospice provider number to program beneficiaries. Annual cost reports required under the Medicare and Medicaid programs are subject to routine audits, which may result in adjustments to the amounts ultimately determined to be due to Encompass Health under these reimbursement programs. These audits often require several years to reach the final determination of amounts earned under the programs. If
F-12
|
Encompass Health Corporation and Subsidiaries
Notes to Consolidated Financial Statements
|
||
actual results are not consistent with our assumptions and judgments, we may be exposed to gains or losses that could be material.
The Centers for Medicare and Medicaid Services (“CMS”) has been granted authority to suspend payments, in whole or in part, to Medicare providers if CMS possesses reliable information an overpayment, fraud, or willful misrepresentation exists. If CMS suspects payments are being made as the result of fraud or misrepresentation, CMS may suspend payment at any time without providing prior notice to us. The initial suspension period is limited to 180 days. However, the payment suspension period can be extended almost indefinitely if the matter is under investigation by the United States Department of Health and Human Services Office of Inspector General (the “HHS-OIG”) or the United States Department of Justice (the “DOJ”). Therefore, we are unable to predict if or when we may be subject to a suspension of payments by the Medicare and/or Medicaid programs, the possible length of the suspension period, or the potential cash flow impact of a payment suspension. Any such suspension would adversely impact our financial position, results of operations, and cash flows.
Pursuant to legislative directives and authorizations from Congress, CMS has developed and instituted various Medicare audit programs under which CMS contracts with private companies to conduct claims and medical record audits. As a matter of course, we undertake significant efforts through training and education to ensure compliance with Medicare requirements. However, audits may lead to assertions we have been underpaid or overpaid by Medicare or submitted improper claims in some instances, require us to incur additional costs to respond to requests for records and defend the validity of payments and claims, and ultimately require us to refund any amounts determined to have been overpaid. In some circumstances auditors assert the authority to extrapolate denial rationales to large pools of claims not actually audited, which could increase the impact of the audit. We cannot predict when or how these audit programs will affect us.
Medicare Administrative Contractors (“MACs”), under programs known as “widespread probes,” have conducted pre-payment claim reviews of our Medicare billings and in some cases denied payment for certain diagnosis codes. The majority of the denials we have encountered in these probes relate to determinations regarding medical necessity and provision of therapy services. We dispute, or “appeal,” most of these denials, and for claims we choose to take to administrative law judge hearings, we have historically experienced a success rate of approximately
70%
. This historical success rate is a component of our estimate of transaction price as discussed above. The resolution of these disputes can take in excess of three years, and we cannot provide assurance as to our ongoing and future success of these disputes. When the amount collected related to denied claims differs from the amount previously estimated, these collection differences are recorded as an adjustment to
Net operating revenues
.
In August 2017, CMS announced the Targeted Probe and Educate (“TPE”) initiative. Under the TPE initiative, MACs use data analysis to identify healthcare providers with high claim error rates and items and services that have high national error rates. Once a MAC selects a provider for claims review, the initial volume of claims review is limited to 20 to 40 claims. The TPE initiative includes up to three rounds of claims review if necessary with corresponding provider education and a subsequent period to allow for improvement. If results do not improve sufficiently after three rounds, the MAC may refer the provider to CMS for further action, which may include extrapolation of error rates to a broader universe of claims or referral to a ZPIC or RAC (defined below). We cannot predict the impact of the TPE initiative on our ability to collect claims on a timely basis.
In connection with CMS approved and announced Recovery Audit Contractors (“RACs”) audits related to inpatient rehabilitation facilities (“IRFs”), we received requests from
2013
to
2018
to review certain patient files for discharges occurring from
2010
to
2018
. These RAC audits are focused on identifying Medicare claims that may contain improper payments. RAC contractors must have CMS approval before conducting these focused reviews which cover issues ranging from billing documentation to medical necessity. Medical necessity is an assessment by an independent physician of a patient’s ability to tolerate and benefit from intensive multi-disciplinary therapy provided in an IRF setting.
CMS has also established contractors known as the Zone Program Integrity Contractors (“ZPICs”). These contractors conduct audits with a focus on potential fraud and abuse issues. Like the RACs, the ZPICs conduct audits and have the ability to refer matters to the HHS-OIG or the DOJ. Unlike RACs, however, ZPICs do not receive a specific financial incentive based on the amount of the error as a result of ZPIC audits. We have, from time to time, received ZPIC record requests which have resulted in claim denials on paid claims. We have appealed substantially all ZPIC denials arising from these audits using the same process we follow for appealing other denials by contractors. CMS has announced its intention to rename ZPICs as Unified Program Integrity Contractors.
F-13
|
Encompass Health Corporation and Subsidiaries
Notes to Consolidated Financial Statements
|
||
To date, the Medicare claims that are subject to these post-payment audit requests represent less than
1%
of our Medicare patient discharges from
2010
to
2018
, and not all of these patient file requests have resulted in payment denial determinations by the audit contractor. Because we have confidence in the medical judgment of both the referring and admitting physicians who assess the treatment needs of their patients, we have appealed substantially all claim denials arising from these audits using the same process we follow for appealing denials of certain diagnosis codes by MACs. Due to the delays announced by CMS in the related adjudication process, we believe the resolution of any claims that are subsequently denied as a result of these claim audits could take in excess of three years. In addition, because we have limited experience with ZPICs and RACs in the context of claims reviews of this nature, we cannot provide assurance as to the timing or outcomes of these disputes. As such, we make estimates for these claims based on our historical experience and success rates in the claims adjudication process, which is the same process we follow for appealing denials of certain diagnosis codes by MACs. As the ultimate results of these audits impact our estimates of amounts determined to be due to Encompass Health under these reimbursement programs, our reserve for claims that are part of this post-payment claims review process are recorded to
Net operating revenues
. During
2018
,
2017
, and
2016
, our adjustment to
Net operating revenues
for claims that are part of this post-payment claims review process was not material.
Our performance obligations relate to contracts with a duration of less than one year. Therefore, we elected to apply the optional exemption to not disclose the aggregate amount of the transaction price allocated to performance obligations that are unsatisfied or partially unsatisfied at the end of the reporting period. These unsatisfied or partially unsatisfied performance obligations primarily relate to services provided at the end of the reporting period.
We are subject to changes in government legislation that could impact Medicare payment levels and changes in payor patterns that may impact the level and timing of payments for services rendered.
Inpatient Rehabilitation Revenues
Inpatient rehabilitation segment revenues are recognized over time as the services are provided to the patient. The performance obligation is the rendering of services to the patient during the term of their inpatient stay. Revenues are recognized (or measured) using the input method as therapy, nursing, and auxiliary services are provided based on our estimate of the respective transaction price. Revenues recognized by our inpatient rehabilitation segment are subject to a number of elements which impact both the overall amount of revenue realized as well as the timing of the collection of the related accounts receivable. Factors considered in determining the estimated transaction price include the patient’s total length of stay for in-house patients, each patient’s discharge destination, the proportion of patients with secondary insurance coverage and the level of reimbursement under that secondary coverage, and the amount of charges that will be disallowed by payors. Such additional factors are assumed to remain consistent with the experience for patients discharged in similar time periods for the same payor classes.
Home Health and Hospice Revenues
Home Health
Under the Medicare home health prospective payment system, we are paid by Medicare based on episodes of care. The performance obligation is the rendering of services to the patient during the term of the episode of care. An episode of care is defined as a length of stay up to 60 days, with multiple continuous episodes allowed. A base episode payment is established by the Medicare program through federal regulation. The base episode payment can be adjusted based on each patient’s health including clinical condition, functional abilities, and service needs, as well as for the applicable geographic wage index, low utilization, patient transfers, and other factors. The services covered by the episode payment include all disciplines of care in addition to medical supplies.
We bill a portion of reimbursement from each Medicare episode near the start of each episode, and the resulting cash payment is typically received before all services are rendered. As we provide home health services to our patients on a scheduled basis over the episode of care in a manner that approximates a pro rata pattern, revenue for the episode of care is recorded over an average length of treatment period using a calendar day prorating method. The amount of revenue recognized for episodes of care which are incomplete at period end is based on the pro rata number of days in the episode which have been completed as of the period end date. As of
December 31, 2018
and
December 31, 2017
, the difference between the cash
F-14
|
Encompass Health Corporation and Subsidiaries
Notes to Consolidated Financial Statements
|
||
received from Medicare for a request for anticipated payment on episodes in progress and the associated estimated revenue
was not material
and was recorded in
Other current liabilities
in our consolidated balance sheets.
We are subject to certain Medicare regulations affecting outlier revenue if our patient’s care was unusually costly. Regulations require a cap on all outlier revenue at 10% of total Medicare revenue received by each provider during a cost reporting year. Management has reviewed the potential cap. Adjustments to the transaction price for the outlier cap
were not material
as of
December 31, 2018
and
December 31, 2017
.
For episodic-based rates that are paid by other insurance carriers, including Medicare Advantage, we recognize revenue in a similar manner as discussed above for Medicare revenues. However, these rates can vary based upon the negotiated terms. For non-episodic-based revenue, revenue is recorded on an accrual basis based upon the date of service at amounts equal to our estimated per-visit transaction price. Price concessions, including contractual allowances for the differences between our standard rates and the applicable contracted rates, as well as estimated uncollectible amounts from patients, are recorded as decreases to the transaction price.
Hospice
Medicare revenues for hospice are recognized and recorded on an accrual basis using the input method based on the number of days a patient has been on service at amounts equal to an estimated daily or hourly payment rate. The performance obligation is the rendering of services to the patient during each day that they are on hospice care. The payment rate is dependent on whether a patient is receiving routine home care, general inpatient care, continuous home care or respite care. Adjustments to Medicare revenues are recorded based on an inability to obtain appropriate billing documentation or authorizations acceptable to the payor or other reasons unrelated to credit risk. Hospice companies are subject to two specific payment limit caps under the Medicare program. One limit relates to inpatient care days that exceed 20% of the total days of hospice care provided for the year. The second limit relates to an aggregate Medicare reimbursement cap calculated by the MAC. Adjustments to the transaction price for these caps
were not material
as of
December 31, 2018
and
December 31, 2017
.
For non-Medicare hospice revenues, we record gross revenue on an accrual basis based upon the date of service at amounts equal to our estimated per day transaction price. Price concessions, including contractual adjustments for the difference between our standard rates and the amounts estimated to be realizable from patients and third parties for services provided, are recorded as decreases to the transaction price and thus reduce our
Net operating revenues
.
Cash and Cash Equivalents—
Cash and cash equivalents
include highly liquid investments with maturities of three months or less when purchased. Carrying values of
Cash and cash equivalents
approximate fair value due to the short-term nature of these instruments.
We maintain amounts on deposit with various financial institutions, which may, at times, exceed federally insured limits. However, management periodically evaluates the credit-worthiness of those institutions, and we have not experienced any losses on such deposits.
Marketable Securities—
Effective January 1, 2018, in connection with the adoption of ASU 2016-01, we record all marketable securities with readily determinable fair values and for which we do not exercise significant influence at fair value and record the change in fair value for the reporting period in our consolidated statements of operations.
Prior to January 1, 2018, we recorded all marketable securities with readily determinable fair values and for which we did not exercise significant influence as available-for-sale securities. We carried the available-for-sale securities at fair value and reported unrealized holding gains or losses, net of income taxes, in
Accumulated other comprehensive loss
, which is a separate component of shareholders’ equity. We recognized realized gains and losses in our consolidated statements of operations using the specific identification method. Unrealized losses were charged against earnings when a decline in fair value was determined to be other than temporary. Management reviewed several factors to determine whether a loss was other than temporary, such as the length of time a security is in an unrealized loss position, the extent to which fair value is less than
F-15
|
Encompass Health Corporation and Subsidiaries
Notes to Consolidated Financial Statements
|
||
cost, the financial condition and near term prospects of the issuer, industry, or geographic area and our ability and intent to hold the security for a period of time sufficient to allow for any anticipated recovery in fair value.
Accounts Receivable—
We report accounts receivable from services rendered at their estimated transaction price which takes into account price concessions from federal and state agencies (under the Medicare and Medicaid programs), managed care health plans, commercial insurance companies, workers’ compensation programs, employers, and patients. Our accounts receivable are concentrated by type of payor. The concentration of patient service accounts receivable by payor class, as a percentage of total patient service accounts receivable, is as follows:
|
|
As of December 31,
|
||||
|
|
2018
|
2017
|
|||
|
Medicare
|
73.2
|
%
|
75.1
|
%
|
|
|
Managed care and other discount plans, including Medicare Advantage
|
19.3
|
%
|
17.4
|
%
|
|
|
Medicaid
|
2.8
|
%
|
2.4
|
%
|
|
|
Other third-party payors
|
2.7
|
%
|
2.9
|
%
|
|
|
Workers' compensation
|
1.1
|
%
|
1.3
|
%
|
|
|
Patients
|
0.9
|
%
|
0.9
|
%
|
|
|
Total
|
100.0
|
%
|
100.0
|
%
|
|
While revenues and accounts receivable from the Medicare program are significant to our operations, we do not believe there are significant credit risks associated with this government agency. We do not believe there are any other significant concentrations of revenues from any particular payor that would subject us to any significant credit risks in the collection of our accounts receivable.
Accounts requiring collection efforts are reviewed via system-generated work queues that automatically stage (based on age and size of outstanding balance) accounts requiring collection efforts for patient account representatives. Collection efforts include contacting the applicable party (both in writing and by telephone), providing information (both financial and clinical) to allow for payment or to overturn payor decisions to deny payment, and arranging payment plans with self-pay patients, among other techniques. When we determine all in-house efforts have been exhausted or it is a more prudent use of resources, accounts may be turned over to a collection agency.
The collection of outstanding receivables from Medicare, managed care payors, other third-party payors, and patients is our primary source of cash and is critical to our operating performance. While it is our policy to verify insurance prior to a patient being admitted, there are various exceptions that can occur. Such exceptions include instances where we are (1) unable to obtain verification because the patient’s insurance company was unable to be reached or contacted, (2) a determination is made that a patient may be eligible for benefits under various government programs, such as Medicaid, and it takes several days, weeks, or months before qualification for such benefits is confirmed or denied, and (3) the patient is transferred to our hospital from an acute care hospital without having access to a credit card, cash, or check to pay the applicable patient responsibility amounts (i.e., deductibles and co-payments).
Our primary collection risks relate to patient responsibility amounts and claims reviews conducted by MACs or other contractors. Patient responsibility amounts include accounts for which the patient was the primary payor or the primary insurance carrier has paid the amounts covered by the applicable agreement, but patient co-payment amounts remain outstanding. Changes in the economy, such as increased unemployment rates or periods of recession, can further exacerbate our ability to collect patient responsibility amounts.
If actual results are not consistent with our assumptions and judgments, we may be exposed to gains or losses that could be material. Changes in general economic conditions, business office operations, payor mix, or trends in federal or state governmental and private employer healthcare coverage could affect our collection of accounts receivable, financial position, results of operations, and cash flows.
F-16
|
Encompass Health Corporation and Subsidiaries
Notes to Consolidated Financial Statements
|
||
Property and Equipment—
We report land, buildings, improvements, vehicles, and equipment at cost, net of accumulated depreciation and amortization and any asset impairments. We report assets under capital lease obligations at the lower of fair value or the present value of the aggregate future minimum lease payments at the beginning of the lease term. We depreciate our assets using the straight-line method over the shorter of the estimated useful life of the assets or life of the lease term, excluding any lease renewals, unless the lease renewals are reasonably assured. Useful lives are generally as follows:
|
|
Years
|
||
|
Buildings
|
10 to 30
|
||
|
Leasehold improvements
|
2 to 15
|
||
|
Vehicles
|
5
|
||
|
Furniture, fixtures, and equipment
|
3 to 10
|
||
|
Assets under capital lease obligations:
|
|||
|
Real estate
|
15 to 25
|
||
|
Vehicles
|
3
|
||
|
Equipment
|
3 to 5
|
||
Maintenance and repairs of property and equipment are expensed as incurred. We capitalize replacements and betterments that increase the estimated useful life of an asset. We capitalize pre-acquisition costs when they are directly identifiable with a specific property, the costs would be capitalizable if the property were already acquired, and acquisition of the property is probable. We capitalize interest expense on major construction and development projects while in progress.
We retain fully depreciated assets in property and accumulated depreciation accounts until we remove them from service. In the case of sale, retirement, or disposal, the asset cost and related accumulated depreciation balances are removed from the respective accounts, and the resulting net amount, less any proceeds, is included as a component of income from continuing operations in the consolidated statements of operations. However, if the sale, retirement, or disposal involves a discontinued operation, the resulting net amount, less any proceeds, is included in the results of discontinued operations.
We account for operating leases by recognizing rents, including any rent holidays, on a straight-line basis over the term of the lease.
Goodwill and Other Intangible Assets—
We are required to test our goodwill and indefinite-lived intangible asset for impairment at least annually, absent some triggering event that would accelerate an impairment assessment. Absent any impairment indicators, we perform this impairment testing as of
October 1st
of each year. We recognize an impairment charge for any amount by which the carrying amount of the asset exceeds its implied fair value. We present an impairment charge as a separate line item within income from continuing operations in the consolidated statements of operations, unless the impairment is associated with a discontinued operation. In that case, we include the impairment charge, on a net-of-tax basis, within the results of discontinued operations.
We assess qualitative factors in our inpatient rehabilitation and home health and hospice reporting units to determine whether it is necessary to perform the first step of the two-step quantitative impairment test. If, based on this qualitative assessment, we were to believe we must proceed to Step 1, we would determine the fair value of our reporting units using generally accepted valuation techniques including the income approach and the market approach. The income approach includes the use of each reporting unit’s discounted projected operating results and cash flows. This approach includes many assumptions related to pricing and volume, operating expenses, capital expenditures, discount factors, tax rates, etc. Changes in economic and operating conditions impacting these assumptions could result in goodwill impairment in future periods. We reconcile the estimated fair value of our reporting units to our market capitalization. When we dispose of a hospital or home health or hospice agency, goodwill is allocated to the gain or loss on disposition using the relative fair value methodology.
F-17
|
Encompass Health Corporation and Subsidiaries
Notes to Consolidated Financial Statements
|
||
We assess qualitative factors related to our indefinite-lived intangible asset to determine whether it is necessary to perform the first step of the two-step quantitative impairment test. If, based on this qualitative assessment, we were to believe we must proceed to Step 1, we would determine the fair value of our indefinite-lived intangible asset using generally accepted valuation techniques including the relief-from-royalty method. This method is a form of the income approach in which value is equated to a series of cash flows and discounted at a risk-adjusted rate. It is based on a hypothetical royalty, calculated as a percentage of forecasted revenue, that we would otherwise be willing to pay to use the asset, assuming it were not already owned. This approach includes assumptions related to pricing and volume, as well as a royalty rate a hypothetical third party would be willing to pay for use of the asset. When making our royalty rate assumption, we consider rates paid in arms-length licensing transactions for assets comparable to our asset.
We amortize the cost of intangible assets with finite useful lives over their respective estimated useful lives to their estimated residual value. As of
December 31, 2018
,
none
of our finite useful lived intangible assets has an estimated residual value. We also review these assets for impairment whenever events or changes in circumstances indicate we may not be able to recover the asset’s carrying amount.
The range of estimated useful lives and the amortization basis for our intangible assets, excluding goodwill, are generally as follows:
|
|
Estimated Useful Life
and Amortization Basis
|
||||
|
Certificates of need
|
10 to 30 years using straight-line basis
|
||||
|
Licenses
|
10 to 20 years using straight-line basis
|
||||
|
Noncompete agreements
|
1 to 18 years using straight-line basis
|
||||
|
Trade names:
|
|||||
|
Encompass
|
indefinite-lived asset
|
||||
|
All other
|
1 to 20 years using straight-line basis
|
||||
|
Internal-use software
|
3 to 7 years using straight-line basis
|
||||
|
Market access assets
|
20 years using accelerated basis
|
||||
We capitalize the costs of obtaining or developing internal-use software, including external direct costs of material and services and directly related payroll costs. Amortization begins when the internal-use software is ready for its intended use. Costs incurred during the preliminary project and post-implementation stages, as well as maintenance and training costs, are expensed as incurred.
Our market access assets are valued using discounted cash flows under the income approach. The value of the market access assets is attributable to our ability to gain access to and penetrate an acquired facility’s historical market patient base. To determine this value, we first develop a debt-free net cash flow forecast under various patient volume scenarios. The debt-free net cash flow is then discounted back to present value using a discount factor, which includes an adjustment for company-specific risk. As noted in the above table, we amortize these assets over 20 years using an accelerated basis that reflects the pattern in which we believe the economic benefits of the market access will be consumed.
Impairment of Long-Lived Assets and Other Intangible Assets—
We assess the recoverability of long-lived assets (excluding goodwill and our indefinite-lived asset) and identifiable acquired intangible assets with finite useful lives, whenever events or changes in circumstances indicate we may not be able to recover the asset’s carrying amount. We measure the recoverability of assets to be held and used by a comparison of the carrying amount of the asset to the expected net future cash flows to be generated by that asset, or, for identifiable intangibles with finite useful lives, by determining whether the amortization of the intangible asset balance over its remaining life can be recovered through undiscounted future cash flows. The amount of impairment of identifiable intangible assets with finite useful lives, if any, to be recognized is measured based on projected discounted future cash flows. We measure the amount of impairment of other long-lived assets (excluding goodwill) as the amount by which the carrying value of the asset exceeds the fair market value of the asset, which is generally determined based on projected discounted future cash flows or appraised
F-18
|
Encompass Health Corporation and Subsidiaries
Notes to Consolidated Financial Statements
|
||
values. We classify long-lived assets to be disposed of other than by sale as held and used until they are disposed. We report long-lived assets to be disposed of by sale as held for sale and recognize those assets in the balance sheet at the lower of carrying amount or fair value less cost to sell, and we cease depreciation.
Investments in and Advances to Nonconsolidated Affiliates—
Investments in entities we do not control but in which we have the ability to exercise significant influence over the operating and financial policies of the investee are accounted for under the equity method. Equity method investments are recorded at original cost and adjusted periodically to recognize our proportionate share of the investees’ net income or losses after the date of investment, additional contributions made, dividends or distributions received, and impairment losses resulting from adjustments to net realizable value. We record equity method losses in excess of the carrying amount of an investment when we guarantee obligations or we are otherwise committed to provide further financial support to the affiliate.
We use the cost method to account for equity investments for which the equity securities do not have readily determinable fair values and for which we do not have the ability to exercise significant influence. Under the cost method of accounting, private equity investments are carried at cost and are adjusted only for other-than-temporary declines in fair value, additional investments, or distributions deemed to be a return of capital.
Management periodically assesses the recoverability of our equity method and cost method investments and equity method goodwill for impairment. We consider all available information, including the recoverability of the investment, the earnings and near-term prospects of the affiliate, factors related to the industry, conditions of the affiliate, and our ability, if any, to influence the management of the affiliate. We assess fair value based on valuation methodologies, as appropriate, including discounted cash flows, estimates of sales proceeds, and external appraisals, as appropriate. If an investment or equity method goodwill is considered to be impaired and the decline in value is other than temporary, we record an appropriate write-down.
Financing Costs—
We amortize financing costs using the effective interest method over the expected life of the related debt. Excluding financing costs related to our revolving line of credit (which is included in
Other long-term assets
), financing costs are presented as a direct deduction from the face amount of the financings. The related expense is included in
Interest expense and amortization of debt discounts and fees
in our consolidated statements of operations.
We accrete discounts and amortize premiums using the effective interest method over the expected life of the related debt, and we report discounts or premiums as a direct deduction from, or addition to, the face amount of the financing. The related income or expense is included in
Interest expense and amortization of debt discounts and fees
in our consolidated statements of operations.
Fair Value Measurements—
Fair value is an exit price, representing the amount that would be received to sell an asset or paid to transfer a liability in an orderly transaction between market participants. As such, fair value is a market-based measurement that should be determined based on assumptions market participants would use in pricing an asset or liability.
The basis for these assumptions establishes a three-tier fair value hierarchy, which prioritizes the inputs used in measuring fair value as follows:
|
•
|
Level 1
– Observable inputs such as quoted prices in active markets;
|
|
•
|
Level 2
– Inputs, other than quoted prices in active markets, that are observable either directly or indirectly; and
|
|
•
|
Level 3
– Unobservable inputs in which there is little or no market data, which require the reporting entity to develop its own assumptions.
|
F-19
|
Encompass Health Corporation and Subsidiaries
Notes to Consolidated Financial Statements
|
||
Assets and liabilities measured at fair value are based on one or more of three valuation techniques. The three valuation techniques are as follows:
|
•
|
Market approach
– Prices and other relevant information generated by market transactions involving identical or comparable assets or liabilities;
|
|
•
|
Cost approach
– Amount that would be required to replace the service capacity of an asset (i.e., replacement cost); and
|
|
•
|
Income approach
– Techniques to convert future cash flows to a single present amount based on market expectations (including present value techniques, option-pricing models, and lattice models).
|
Our financial instruments consist mainly of cash and cash equivalents, restricted cash, restricted marketable securities, accounts receivable, accounts payable, letters of credit, and long-term debt. The carrying amounts of cash and cash equivalents, restricted cash, accounts receivable, and accounts payable approximate fair value because of the short-term maturity of these instruments. The fair value of our letters of credit is deemed to be the amount of payment guaranteed on our behalf by third-party financial institutions. We determine the fair value of our long-term debt using quoted market prices, when available, or discounted cash flows based on various factors, including maturity schedules, call features, and current market rates.
On a recurring basis, we are required to measure our restricted marketable securities at fair value. The fair values of our restricted marketable securities are determined based on quoted market prices in active markets or quoted prices, dealer quotations, or alternative pricing sources supported by observable inputs in markets that are not considered to be active.
On a nonrecurring basis, we are required to measure property and equipment, goodwill, other intangible assets, investments in nonconsolidated affiliates, and assets and liabilities of discontinued operations at fair value. Generally, assets are recorded at fair value on a nonrecurring basis as a result of impairment charges or similar adjustments made to the carrying value of the applicable assets. The fair value of our property and equipment is determined using discounted cash flows and significant unobservable inputs, unless there is an offer to purchase such assets, which could be the basis for determining fair value. The fair value of our intangible assets, excluding goodwill, is determined using discounted cash flows and significant unobservable inputs. The fair value of our investments in nonconsolidated affiliates is determined using quoted prices in private markets, discounted cash flows or earnings, or market multiples derived from a set of comparables. The fair value of our assets and liabilities of discontinued operations is determined using discounted cash flows and significant unobservable inputs unless there is an offer to purchase such assets and liabilities, which would be the basis for determining fair value. The fair value of our goodwill is determined using discounted projected operating results and cash flows, which involve significant unobservable inputs.
See also the “Redeemable Noncontrolling Interests” section of this note.
Noncontrolling Interests in Consolidated Affiliates—
The consolidated financial statements include all assets, liabilities, revenues, and expenses of less-than-100%-owned affiliates we control. Accordingly, we have recorded noncontrolling interests in the earnings and equity of such entities. We record adjustments to noncontrolling interests for the allocable portion of income or loss to which the noncontrolling interests holders are entitled based upon their portion of the subsidiaries they own. Distributions to holders of noncontrolling interests are adjusted to the respective noncontrolling interests holders’ balance.
Redeemable Noncontrolling Interests—
Certain of our joint venture agreements contain provisions that allow our partners to require us to purchase their interests in the joint venture at fair value at certain points in the future. Likewise, certain members of the home health and hospice management team hold similar put rights regarding their interests in our home health and hospice business, as discussed in
Note 11,
Redeemable Noncontrolling Interests
. Because these noncontrolling interests provide for redemption features that are not solely within our control, we classify them as
Redeemable noncontrolling interests
outside of permanent equity in our consolidated balance sheets. At the end of each reporting period, we compare the carrying value of the
Redeemable noncontrolling interests
to their estimated redemption value. If the estimated redemption value is greater than the current
F-20
|
Encompass Health Corporation and Subsidiaries
Notes to Consolidated Financial Statements
|
||
carrying value, the carrying value is adjusted to the estimated redemption value, with the adjustments recorded through equity in the line item
Capital in excess of par value
.
The fair value of the
Redeemable noncontrolling interests
related to our home health segment is determined using the product of a 12-month specified performance measure and a specified median market price multiple based on a basket of public health companies and publicly disclosed home health acquisitions with a value of $400 million or more. The fair value of our
Redeemable noncontrolling interests
in our joint venture hospitals is determined primarily using the income approach. The income approach includes the use of the hospital’s projected operating results and cash flows discounted using a rate that reflects market participant assumptions for the applicable hospitals, or
Level 3
inputs. The projected operating results use management’s best estimates of economic and market conditions over the forecasted periods including assumptions for pricing and volume, operating expenses, and capital expenditures.
Share-Based Payments—
Encompass Health has shareholder-approved stock-based compensation plans that provide for the granting of stock-based compensation to certain employees and directors. All share-based payments to employees, excluding stock appreciation rights (“SARs”), are recognized in the financial statements based on their estimated grant-date fair value and amortized on a straight-line basis over the applicable requisite service period. Share-based payments to employees in the form of SARs are recognized in the financial statements based on their current fair value and expensed ratably over the applicable service period.
Litigation Reserves—
We accrue for loss contingencies associated with outstanding litigation for which management has determined it is probable a loss contingency exists and the amount of loss can be reasonably estimated. If the accrued amount associated with a loss contingency is greater than
$5.0 million
, we also accrue estimated future legal fees associated with the loss contingency. This requires management to estimate the amount of legal fees that will be incurred in the defense of the litigation. These estimates are based on our expectations of the scope, length to complete, and complexity of the claims. In the future, additional adjustments may be recorded as the scope, length to complete, or complexity of outstanding litigation changes.
Advertising Costs—
We expense costs of print, radio, television, and other advertisements as incurred. Advertising expenses, primarily included in
Other operating expenses
within the accompanying consolidated statements of operations, were
$6.7 million
,
$6.3 million
, and
$7.5 million
in each of the years ended December 31,
2018
,
2017
, and
2016
, respectively.
Income Taxes—
We provide for income taxes using the asset and liability method
.
This approach recognizes the amount of income taxes payable or refundable for the current year, as well as deferred tax assets and liabilities for the future tax consequence of events recognized in the consolidated financial statements and income tax returns. Deferred income tax assets and liabilities are adjusted to recognize the effects of changes in tax laws or enacted tax rates.
A valuation allowance is required when it is more likely than not some portion of the deferred tax assets will not be realized. Realization is dependent on generating sufficient future taxable income in the applicable tax jurisdiction. On a quarterly basis, we assess the likelihood of realization of our deferred tax assets considering all available evidence, both positive and negative. Our most recent operating performance, the scheduled reversal of temporary differences, our forecast of taxable income in future periods by jurisdiction, our ability to sustain a core level of earnings, and the availability of prudent tax planning strategies are important considerations in our assessment.
We evaluate our tax positions and establish assets and liabilities in accordance with the applicable accounting guidance on uncertainty in income taxes. We review these tax uncertainties in light of changing facts and circumstances, such as the progress of tax audits, and adjust them accordingly.
We have used the with-and-without method to determine when we will recognize excess tax benefits from stock-based compensation. Under this method in 2016, we recognized these excess tax benefits only after we fully realized the tax benefits of net operating losses.
F-21
|
Encompass Health Corporation and Subsidiaries
Notes to Consolidated Financial Statements
|
||
Encompass Health and its corporate subsidiaries file a consolidated federal income tax return. Some subsidiaries consolidated for financial reporting purposes are not part of the consolidated group for federal income tax purposes and file separate federal income tax returns. State income tax returns are filed on a separate, combined, or consolidated basis in accordance with relevant state laws and regulations. Partnerships, limited liability companies, and other pass-through entities we consolidate or account for using the equity method of accounting file separate federal and state income tax returns. We include the allocable portion of each pass-through entity’s income or loss in our federal income tax return. We allocate the remaining income or loss of each pass-through entity to the other partners or members who are responsible for their portion of the taxes.
Assets and Liabilities in and Results of Discontinued Operations—
Effective January 1, 2015, in connection with a new standard issued by the FASB, we changed our criteria for determining which disposals are presented as discontinued operations. Historically, any component that had been disposed of or was classified as held for sale qualified for discontinued operations reporting unless there was significant continuing involvement with the disposed component or continuing cash flows. In contrast, we now report the disposal of the component, or group of components, as discontinued operations only when it represents a strategic shift that has, or will have, a major effect on our operations and financial results. As a result, the sale or disposal of a single Encompass Health facility or location no longer qualifies as a discontinued operation. This accounting change was made prospectively. No new components were recognized as discontinued operations since this guidance became effective.
In the period a component of an entity has been disposed of or classified as held for sale, we reclassify the results of operations for current and prior periods into a single caption titled
(Loss) income from discontinued operations, net of tax
. In addition, we classify the assets and liabilities of those components as current and noncurrent assets and liabilities within
Prepaid expenses and other current assets
,
Other long-term assets
,
Other current liabilities
, and
Other long-term liabilities
in our consolidated balance sheets. We also classify cash flows related to discontinued operations as one line item within each category of cash flows in our consolidated statements of cash flows.
Earnings per Common Share—
The calculation of earnings per common share is based on the weighted-average number of our common shares outstanding during the applicable period. The calculation for diluted earnings per common share recognizes the effect of all potential dilutive common shares, including warrants, that were outstanding during the respective periods, unless their impact would be antidilutive. The calculation of earnings per common share also considers the effect of participating securities. Stock-based compensation awards that contain nonforfeitable rights to dividends and dividend equivalents, such as our restricted stock units, are considered participating securities and are included in the computation of earnings per common share pursuant to the two-class method. In applying the two-class method, earnings are allocated to both common stock shares and participating securities based on their respective weighted-average shares outstanding for the period.
We used the if-converted method to include our convertible senior subordinated notes in our computation of diluted earnings per share. All other potential dilutive shares, including warrants, are included in our weighted-average diluted share count using the treasury stock method.
Treasury Stock—
Shares of common stock repurchased by us are recorded at cost as treasury stock. When shares are reissued, we use an average cost method to determine cost. The difference between the cost of the shares and the re-issuance price is added to or deducted from
Capital in excess of par value
. We account for the retirement of treasury stock as a reduction of retained earnings. However, due to our
Accumulated deficit
, the retirement of treasury stock is currently recorded as a reduction of
Capital in excess of par value
.
Comprehensive Income—
Comprehensive income
is comprised of
Net income
and changes in unrealized gains or losses on available-for-sale securities and is included in the consolidated statements of comprehensive income.
F-22
|
Encompass Health Corporation and Subsidiaries
Notes to Consolidated Financial Statements
|
||
Recent Adopted Accounting Pronouncements
—
In May 2014, the FASB issued ASU 2014-09, “Revenue from Contracts with Customers” and has subsequently issued supplemental and/or clarifying ASUs (collectively “ASC 606”). ASC 606 outlines a five-step framework that supersedes the principles for recognizing revenue and eliminates industry-specific guidance. In addition, ASC 606 revises current disclosure requirements in an effort to help financial statement users better understand the nature, amount, timing, and uncertainty of revenue that is recognized. We adopted ASC 606 on January 1, 2018 using the full retrospective model. The primary impact of adopting under ASC 606 is that all amounts we previously presented as
Provision for doubtful accounts
are now considered an implicit price concession in determining
Net operating revenues
. Such concessions reduce the transaction price and therefore
Net operating revenues
, as shown below. Adopting ASC 606 on January 1, 2018 using the full retrospective transition method had the following impact to our previously reported consolidated statements of operations (in millions):
|
For the Year Ended December 31, 2017
|
For the Year Ended December 31, 2016
|
|||||||||||||||||||||||
|
As Reported
|
Adjustment for ASC 606
|
Recasted
|
As Reported
|
Adjustment for ASC 606
|
Recasted
|
|||||||||||||||||||
|
Net operating revenues
|
$
|
3,971.4
|
|
$
|
(57.5
|
)
|
$
|
3,913.9
|
|
$
|
3,707.2
|
|
$
|
(64.6
|
)
|
$
|
3,642.6
|
|
||||||
|
Provision for doubtful accounts
|
$
|
52.4
|
|
$
|
(52.4
|
)
|
$
|
—
|
|
$
|
61.2
|
|
$
|
(61.2
|
)
|
$
|
—
|
|
||||||
|
Other operating expenses
|
$
|
536.7
|
|
$
|
(5.1
|
)
|
$
|
531.6
|
|
$
|
492.1
|
|
$
|
(3.4
|
)
|
$
|
488.7
|
|
||||||
In addition, the adoption of ASC 606 resulted in increased disclosure, including qualitative and quantitative disclosures about the nature, amount, timing and uncertainty of revenue and cash flows arising from contracts with customers. See the “Net Operating Revenues” and “Accounts Receivable” section of this note. Except for the adjustments discussed above, the adoption of ASC 606 did not have a material impact on our consolidated financial statements.
In January 2016, the FASB issued ASU No. 2016-01, “Financial Instruments - Overall (Topic 825): Recognition and Measurement of Financial Assets and Financial Liabilities.” This standard revises the classification and measurement of investments in certain equity investments and the presentation of certain fair value changes for certain financial liabilities measured at fair value. This revised standard requires the change in fair value of many equity investments to be recognized in
Net income
. This revised standard requires a modified retrospective application with a cumulative effect adjustment recognized in retained earnings as of the date of adoption and was effective for our interim and annual periods beginning January 1, 2018. Beginning in the first quarter of 2018, we recognized mark-to-market gains and losses associated with our marketable securities through
Net income
instead of
Accumulated other comprehensive income
. The adoption of this guidance resulted in an immaterial impact to our consolidated financial statements. See the “Marketable Securities” section of this note.
In August 2016, the FASB issued ASU 2016-15, “Statement of Cash Flows (Topic 230), Classification of Certain Cash Receipts and Cash Payments,” to reduce diversity in practice in how certain transactions are classified in the statement of cash flows. In addition, the standard clarifies when cash receipts and cash payments have aspects of more than one class of cash flows and cannot be separated, classification will depend on the predominant source or use. The new guidance requires retrospective application and was effective for our annual reporting period beginning January 1, 2018, including interim periods within that reporting period. The clarification that debt prepayment premiums or debt extinguishment costs should be classified as financing activities resulted in an immaterial increase in certain prior period operating cash inflows and a corresponding increase in financing cash outflows.
In November 2016, the FASB issued ASU 2016-18, “Statement of Cash Flows (Topic 230), Restricted Cash,” to clarify how entities should present restricted cash and restricted cash equivalents in the statement of cash flows. The new guidance requires amounts generally described as restricted cash and restricted cash equivalents be included with
Cash and cash equivalents
when reconciling the total beginning and ending amounts for the periods shown on the statement of cash flows. The new guidance requires retrospective application and is effective for our annual reporting period beginning January 1, 2018, including interim periods within that reporting period. The adoption of this guidance resulted in an immaterial decrease to previously reported
Net Cash used in investing activities
and a corresponding increase to previously reported
Increase in cash and cash equivalents
(which is now captioned
Increase in cash, cash equivalents, and restricted cash
, pursuant to the adoption of this guidance). In addition, as noted above, we added a reconciliation of cash, cash equivalents, and restricted cash to the consolidated statements of cash flows.
F-23
|
Encompass Health Corporation and Subsidiaries
Notes to Consolidated Financial Statements
|
||
Recent Accounting Pronouncements Not Yet Adopted—
In February 2016, the FASB issued ASU 2016-02, “Leases (Topic 842),” and has subsequently issued supplemental and/or clarifying ASUs (collectively “ASC 842”), in order to increase transparency and comparability by recognizing lease assets and liabilities on the balance sheet and disclosing key information about leasing arrangements. Under ASC 842, lessees will recognize a right-of-use asset and a corresponding lease liability for all leases with a term longer than 12 months. The liability will be equal to the present value of future minimum lease payments and the corresponding asset may be subject to adjustment, such as for the impact of straight-line rent. For income statement purposes, the FASB retained a dual model, requiring leases to be classified as either operating or finance. Operating leases will result in straight-line expense while finance leases will result in an expense pattern similar to current capital leases. Classification will be based on criteria that are similar to those applied in current lease accounting. ASC 842 will be effective for us beginning on January 1, 2019. We will adopt ASC 842 on January 1, 2019 using the modified retrospective transition approach and will recognize any cumulative-effect adjustment to the opening balance of
Capital in excess of par value
in that period. We will apply the transition provisions using the effective date as our date of initial application. Therefore, financial information will not be updated and the disclosures required under ASC 842 will not be provided for dates and periods before January 1, 2019. ASC 842 provides optional practical expedients in transition. We expect to elect the ‘package of practical expedients’, which permits us not to reassess under ASC 842 our prior conclusions about lease identification, lease classification and initial direct costs, and the practical expedient to not reassess certain land easements. We do not expect to elect the use-of-hindsight practical expedient during the transition to ASC 842.
We have substantially completed our assessment of the impact ASC 842 may have on our consolidated financial statements by validating our current portfolio of leases, including a review of historical accounting policies and practices to identify potential differences in applying the new guidance. In addition, the adoption of ASC 842 will result in increased disclosure, including qualitative and quantitative disclosures about the nature, amount, timing and uncertainty of cash flows arising from leases. We have also received, tested, and implemented the necessary updates to our leasing software to be ready for adoption. Based on our current assessment, we estimate the adoption of ASC 842 will result in an increase of approximately
$330 million
to
$370 million
in assets and liabilities to our consolidated balance sheet, with no significant change to our consolidated statements of operations or cash flows. ASC 842 also provides practical expedients for an entity’s ongoing accounting. We currently expect to elect the short-term lease recognition exemption for all leases that qualify and the practical expedient to not separate lease and non-lease components for all of our leases. See
Note 6,
Property and Equipment
, for disclosure related to our operating leases.
In June 2016, the FASB issued ASU 2016-13, “Financial Instruments – Credit Losses (Topic 326),” which provides guidance for accounting for credit losses on financial instruments. The new guidance introduces an approach based on expected losses to estimate credit losses on certain types of financial instruments and modifies the impairment model for available-for-sale debt securities. The new guidance is effective for us beginning January 1, 2020, including interim periods within that reporting period. Early adoption is permitted beginning January 1, 2019. We continue to review the requirements of this standard and any potential impact it may have on our consolidated financial statements.
In August 2018, the FASB issued ASU 2018-15, “Intangibles—Goodwill and Other—Internal-Use Software (Subtopic 350-40): Customer’s Accounting for Implementation Costs Incurred in a Cloud Computing Arrangement That Is a Service Contract.” The update helps entities evaluate the accounting for fees paid by a customer in a cloud computing arrangement (hosting arrangement), by providing guidance in determining when the arrangement includes a software license. It requires entities to account for such costs consistent with the guidance on capitalizing costs associated with developing or obtaining internal-use software. The new guidance is effective for us beginning January 1, 2020, including interim periods within that reporting period. Early adoption is permitted. We continue to review the requirements of this standard and any potential impact it may have on our consolidated financial statements.
We do not believe any other recently issued, but not yet effective, accounting standards will have a material effect on our consolidated financial position, results of operations, or cash flows.
F-24
|
Encompass Health Corporation and Subsidiaries
Notes to Consolidated Financial Statements
|
||
Revision of Previously Issued Financial Statements
—
During the preparation of our December 31, 2018 financial statements, an error was identified in the accounting for deferred tax assets related to fair value adjustments to redeemable noncontrolling interests. Because the discharge of the redeemable noncontrolling interest, either through the purchase of shares or the sale of the home health and hospice segment, would not result in a tax deduction or tax loss reported in the income tax return, the GAAP to tax basis difference does not meet the definition of a temporary difference. Accordingly, a deferred tax asset and corresponding increase to capital in excess of par value should not have been recognized in prior periods. In addition, the overstatement of deferred tax assets resulted in a $14.8 million overstatement of our
Provision for income tax expense
in 2017 due to the revaluation of our deferred tax assets and liabilities in connection with the 2017 Tax Cuts and Jobs Act (the “Tax Act”). We assessed the materiality of the errors in deferred tax assets and related balances and concluded they were not material to any previously issued financial statements or disclosures. However, we have revised our prior period financial statements to reflect the correction of the errors, as disclosed in the tables below. See Note 19, “
Quarterly Data (Unaudited)
,” for the impact of this revision on our unaudited quarterly results.
The impact on our consolidated financial statements are as follows:
|
Consolidated Balance Sheet
|
|||||||||||
|
As Reported
|
Adjustment
|
As Revised
|
|||||||||
|
As of December 31, 2017
|
(In Millions)
|
||||||||||
|
Deferred income tax assets
|
$
|
63.6
|
|
$
|
(29.2
|
)
|
$
|
34.4
|
|
||
|
Total assets
|
4,893.7
|
|
(29.2
|
)
|
4,864.5
|
|
|||||
|
Capital in excess of par value
|
2,791.4
|
|
(44.0
|
)
|
2,747.4
|
|
|||||
|
Accumulated deficit
|
(1,191.0
|
)
|
14.8
|
|
(1,176.2
|
)
|
|||||
|
Total Encompass Health shareholders’ equity
|
1,181.7
|
|
(29.2
|
)
|
1,152.5
|
|
|||||
|
Total shareholders’ equity
|
1,424.6
|
|
(29.2
|
)
|
1,395.4
|
|
|||||
|
Total liabilities and shareholders’ equity
|
4,893.7
|
|
(29.2
|
)
|
4,864.5
|
|
|||||
|
Consolidated Statement of Operations
|
|||||||||||
|
As Reported
|
Adjustment
|
As Revised
|
|||||||||
|
For the Year Ended December 31, 2017
|
(In Millions, Except Per Share Data)
|
||||||||||
|
Provision for income tax expense
|
$
|
160.6
|
|
$
|
(14.8
|
)
|
$
|
145.8
|
|
||
|
Income from continuing operations
|
335.8
|
|
14.8
|
|
350.6
|
|
|||||
|
Net income
|
335.4
|
|
14.8
|
|
350.2
|
|
|||||
|
Net income attributable to Encompass Health
|
256.3
|
|
14.8
|
|
271.1
|
|
|||||
|
Basic earnings per share attributable to Encompass Health common shareholders
|
2.73
|
|
0.15
|
|
2.88
|
|
|||||
|
Diluted earnings per share attributable to Encompass Health common shareholders
|
2.69
|
|
0.15
|
|
2.84
|
|
|||||
|
Consolidated Statement of Comprehensive Income
|
|||||||||||
|
As Reported
|
Adjustment
|
As Revised
|
|||||||||
|
For the Year Ended December 31, 2017
|
(In Millions)
|
||||||||||
|
Net income
|
$
|
335.4
|
|
$
|
14.8
|
|
$
|
350.2
|
|
||
|
Comprehensive income
|
335.3
|
|
14.8
|
|
350.1
|
|
|||||
|
Comprehensive income attributable to Encompass Health
|
256.2
|
|
14.8
|
|
271.0
|
|
|||||
F-25
|
Encompass Health Corporation and Subsidiaries
Notes to Consolidated Financial Statements
|
||
|
Consolidated Statement of Shareholders’ Equity
|
|||||||||||
|
As Reported
|
Adjustment
|
As Revised
|
|||||||||
|
For the Year Ended December 31, 2017
|
(In Millions)
|
||||||||||
|
Fair value adjustments to redeemable noncontrolling interests
|
$
|
(41.0
|
)
|
$
|
(26.0
|
)
|
$
|
(67.0
|
)
|
||
|
Capital in excess of par value
|
2,791.4
|
|
(44.0
|
)
|
2,747.4
|
|
|||||
|
Accumulated deficit
|
(1,191.0
|
)
|
14.8
|
|
(1,176.2
|
)
|
|||||
|
Total shareholders’ equity
|
1,424.6
|
|
(29.2
|
)
|
1,395.4
|
|
|||||
|
For the Year Ended December 31, 2016
|
|||||||||||
|
Fair value adjustments to redeemable noncontrolling interests
|
$
|
(6.7
|
)
|
$
|
(4.2
|
)
|
$
|
(10.9
|
)
|
||
|
Capital in excess of par value
|
2,799.1
|
|
(18.1
|
)
|
2,781.0
|
|
|||||
|
Total shareholders’ equity
|
928.7
|
|
(18.1
|
)
|
910.6
|
|
|||||
|
For the Year Ended December 31, 2015
|
|||||||||||
|
Capital in excess of par value
|
$
|
2,834.9
|
|
$
|
(13.9
|
)
|
$
|
2,821.0
|
|
||
|
Total shareholders’ equity
|
779.3
|
|
(13.9
|
)
|
765.4
|
|
|||||
|
Consolidated Statement of Cash Flows
|
|||||||||||
|
As Reported
|
Adjustment
|
As Revised
|
|||||||||
|
For the Year Ended December 31, 2017
|
(In Millions)
|
||||||||||
|
Net income
|
$
|
335.4
|
|
$
|
14.8
|
|
$
|
350.2
|
|
||
|
Deferred tax expense
|
75.6
|
|
(14.8
|
)
|
60.8
|
|
|||||
The impact of the revision has been reflected throughout the financial statements, including the applicable footnotes, as appropriate.
|
2.
|
Business Combinations
:
|
2018 Acquisitions
Inpatient Rehabilitation
During 2018, we completed the following inpatient rehabilitation acquisitions, none of which were individually material to our financial position, results of operations, or cash flows. Each acquisition was made to enhance our position and ability to provide inpatient rehabilitation services to patients in the applicable geographic areas.
|
•
|
In September 2018, we acquired approximately
62%
of a
29
-bed inpatient rehabilitation unit, including a
60
-bed certificate of need, in Murrells Inlet, South Carolina through a joint venture with Tidelands Health. The acquisition was funded through contributions of funds to be utilized by the consolidated joint venture to build a
46
-bed de novo inpatient rehabilitation satellite location.
|
|
•
|
In October 2018, we acquired approximately
50%
of the
68
-bed inpatient rehabilitation unit in Winston-Salem, North Carolina, through a joint venture with Novant Health Inc. This acquisition was funded through a contribution of a
68
‑bed de novo inpatient rehabilitation hospital to the consolidated joint venture.
|
|
•
|
In November 2018, we acquired approximately
68%
of an
17
-bed inpatient rehabilitation unit in Littleton, Colorado through a joint venture with Portercare Adventist Health System. The acquisition was funded through the contribution of our existing inpatient rehabilitation hospital in Littleton, Colorado to the consolidated joint venture.
|
F-26
|
Encompass Health Corporation and Subsidiaries
Notes to Consolidated Financial Statements
|
||
We accounted for these transactions under the acquisition method of accounting and reported the results of operations of the acquired hospitals from its respective date of acquisition. Assets acquired were recorded at their estimated fair values as of the acquisition date. Estimated fair values were based on various valuation methodologies including: an income approach using primarily discounted cash flow techniques for the noncompete intangible asset; an income approach utilizing the relief from royalty method for the trade name intangible asset; and an income approach utilizing the excess earnings method for the certificate of need intangible asset. The aforementioned income methods utilize management’s estimates of future operating results and cash flows discounted using a weighted-average cost of capital that reflects market participant assumptions. The excess of the fair value of the consideration conveyed over the fair value of the assets acquired was recorded as goodwill. The goodwill reflects our expectations of our ability to gain access to and penetrate the acquired hospital’s historical patient base and the benefits of being able to leverage operational efficiencies with favorable growth opportunities based on positive demographic trends in this market.
None
of the goodwill recorded as a result from these transactions is deductible for federal income tax purposes.
The fair value of the assets acquired at the acquisition date were as follows (in millions):
|
Property and equipment
|
$
|
0.1
|
|
|
Identifiable intangible assets:
|
|
|
|
|
Noncompete agreements (useful lives of 2 to 3 years)
|
1.4
|
|
|
|
Trade names (useful lives of 20 years)
|
2.3
|
|
|
|
Certificates of need (useful lives of 20 years)
|
12.5
|
|
|
|
Goodwill
|
23.2
|
|
|
|
Total assets acquired
|
39.5
|
|
|
|
Total liabilities assumed
|
(0.2
|
)
|
|
|
Net assets acquired
|
$
|
39.3
|
|
Information regarding the net cash paid for the inpatient rehabilitation acquisitions during 2018 is as follows (in millions):
|
Fair value of assets acquired
|
$
|
16.3
|
|
|
Goodwill
|
23.2
|
|
|
|
Fair value of liabilities assumed
|
(0.2
|
)
|
|
|
Fair value of noncontrolling interest owned by joint venture partner
|
(39.3
|
)
|
|
|
Net cash paid for acquisition
|
$
|
—
|
|
Home Health and Hospice
Camellia Acquisition
On May 1, 2018, we completed the previously announced acquisition of privately owned Camellia Healthcare and affiliated entities (“Camellia”). The Camellia portfolio consists of hospice, home health and private duty locations in Mississippi, Alabama, Louisiana and Tennessee. The acquisition leverages our home health and hospice operating platform across key certificate of need states and strengthens our geographic presence in the Southeastern United States. We funded the cash purchase price of the acquisition with cash on hand and borrowings under our revolving credit facility.
We accounted for this transaction under the acquisition method of accounting and reported the results of operations of Camellia from its date of acquisition. Assets acquired and liabilities assumed were recorded at their estimated fair values as of the acquisition date. Estimated fair values were based on various valuation methodologies including: replacement cost and continued use methods for property and equipment; an income approach using primarily discounted cash flow techniques for the noncompete and certain license intangible assets; an income approach utilizing the relief-from-royalty method for the trade name intangible asset; and an income approach utilizing the excess earnings method for the certificate of need and certain
F-27
|
Encompass Health Corporation and Subsidiaries
Notes to Consolidated Financial Statements
|
||
license intangible assets. The aforementioned income methods utilize management’s estimates of future operating results and cash flows discounted using a weighted-average cost of capital that reflects market participant assumptions. For all other assets and liabilities, the fair value was assumed to represent carrying value due to their short maturities. The excess of the fair value of the consideration conveyed over the fair value of the net assets acquired was recorded as goodwill. All goodwill recorded as a result from this transaction is deductible for federal income tax purposes. The goodwill reflects our expectations of favorable growth opportunities in the home health and hospice markets based on positive demographic trends.
The fair value of the assets acquired and liabilities assumed at the acquisition date were as follows (in millions):
|
Cash and cash equivalents
|
$
|
1.3
|
|
|
Prepaid expenses and other current assets
|
0.3
|
|
|
|
Property and equipment, net
|
0.6
|
|
|
|
Identifiable intangible assets:
|
|
||
|
Noncompete agreements (useful lives of 5 years)
|
0.5
|
|
|
|
Trade name (useful life of 1 year)
|
1.4
|
|
|
|
Certificates of need (useful lives of 10 years)
|
16.6
|
|
|
|
Licenses (useful lives of 10 years)
|
21.6
|
|
|
|
Goodwill
|
96.1
|
|
|
|
Total assets acquired
|
138.4
|
|
|
|
Liabilities assumed:
|
|||
|
Accounts payable
|
1.7
|
|
|
|
Accrued payroll
|
4.0
|
|
|
|
Total liabilities assumed
|
5.7
|
|
|
|
Net assets acquired
|
$
|
132.7
|
|
Information regarding the net cash paid for Camellia is as follows (in millions):
|
Fair value of assets acquired, net of $1.3 million of cash acquired
|
$
|
41.0
|
|
|
Goodwill
|
96.1
|
|
|
|
Fair value of liabilities assumed
|
(5.7
|
)
|
|
|
Net cash paid for acquisition
|
$
|
131.4
|
|
Other Home Health and Hospice Acquisitions
During 2018, we completed the following home health acquisitions,
none
of which were individually material to our financial position, results of operations, or cash flows. Each acquisition was made to enhance our position and ability to provide post-acute healthcare services to patients in the applicable geographic areas. Each acquisition was funded using cash on hand.
|
•
|
In January 2018, we acquired the assets of
one
hospice location from Golden Age Hospice, Inc. in Oklahoma City, Oklahoma.
|
|
•
|
In June 2018, we acquired the assets of
one
hospice location from Medical Services of America in Las Vegas, Nevada.
|
|
•
|
In November 2018, we acquired the assets of
one
home health and
one
hospice location from Tenet Hospital Limited in Birmingham, Alabama and El Paso, Texas. We also acquired
75%
of the assets of a home health location in Talladega, Alabama through a joint venture with Tenet Hospital Limited.
|
F-28
|
Encompass Health Corporation and Subsidiaries
Notes to Consolidated Financial Statements
|
||
|
•
|
In December 2018, we acquired
75%
of the assets of a hospice location in Talladega, Alabama through a joint venture with Tenet Hospital Limited.
|
We accounted for these transactions under the acquisition method of accounting and reported the results of operations of the acquired locations from their respective dates of acquisition. Assets acquired were recorded at their estimated fair values as of the respective acquisition dates. The fair values of identifiable intangible assets were based on valuations using an income approach. The income approach is based on management’s estimates of future operating results and cash flows discounted using a weighted-average cost of capital that reflects market participant assumptions. The excess of the fair value of the consideration conveyed over the fair value of the net assets acquired was recorded as goodwill. The goodwill reflects our expectations of our ability to utilize the acquired locations’ mobile workforce and established relationships within each community and the benefits of being able to leverage operational efficiencies with favorable growth opportunities based on positive demographic trends in these markets. All goodwill recorded as a result of these transactions is deductible for federal income tax purposes.
The fair value of the assets acquired at the acquisition date were as follows (in millions):
|
Total current assets
|
$
|
0.1
|
|
|
Identifiable intangible assets:
|
|||
|
Noncompete agreements (useful lives of 5 years)
|
0.2
|
|
|
|
Certificates of need (useful lives of 10 years)
|
2.5
|
|
|
|
Licenses (useful lives of 10 years)
|
1.5
|
|
|
|
Goodwill
|
8.9
|
|
|
|
Total assets acquired
|
$
|
13.2
|
|
|
Total liabilities assumed
|
(0.1
|
)
|
|
|
Net assets acquired
|
$
|
13.1
|
|
Information regarding the net cash paid for the other home health and hospice acquisitions during each period presented is as follows (in millions):
|
Fair value of assets acquired
|
$
|
4.3
|
|
|
Goodwill
|
8.9
|
|
|
|
Fair value of liabilities assumed
|
(0.1
|
)
|
|
|
Fair value of noncontrolling interest owned by joint venture partner
|
(0.6
|
)
|
|
|
Net cash paid for acquisitions
|
$
|
12.5
|
|
F-29
|
Encompass Health Corporation and Subsidiaries
Notes to Consolidated Financial Statements
|
||
Pro Forma Results of Operations
The following table summarizes the results of operations of the above mentioned acquisitions from their respective dates of acquisition included in our consolidated results of operations and the unaudited pro forma results of operations of the combined entity had the date of the acquisitions been January 1, 2017 (in millions):
|
Net Operating Revenues
|
Net (Loss) Income Attributable to Encompass Health
|
||||||
|
Acquired entities only: Actual from acquisition date to December 31, 2018
|
|||||||
|
Inpatient Rehabilitation
|
$
|
9.1
|
|
$
|
(1.6
|
)
|
|
|
Camellia
|
50.0
|
|
(0.9
|
)
|
|||
|
All Other Home Health and Hospice
|
3.5
|
|
(0.3
|
)
|
|||
|
Combined entity: Supplemental pro forma from 01/01/2018-12/31/2018 (unaudited)
|
4,337.4
|
|
300.0
|
|
|||
|
Combined entity: Supplemental pro forma from 01/01/2017-12/31/2017 (unaudited)
|
4,039.9
|
|
289.0
|
|
|||
The information presented above is for illustrative purposes only and is not necessarily indicative of results that would have been achieved if the acquisitions had occurred as of the beginning of our 2017 period.
2017 Acquisitions
Inpatient Rehabilitation
During
2017
, we completed the following inpatient rehabilitation acquisitions, none of which were individually material to our financial position, results of operations, or cash flows. Each acquisition was made to enhance our position and ability to provide inpatient rehabilitation services to patients in the applicable geographic areas.
|
•
|
In April 2017, we acquired
80%
of the
33
-bed inpatient rehabilitation unit of Memorial Hospital at Gulfport in Gulfport, Mississippi, through a joint venture with Memorial Hospital at Gulfport. This acquisition was funded on March 31, 2017 using cash on hand.
|
|
•
|
In April 2017, we also acquired approximately
80%
of the inpatient rehabilitation unit of Mount Carmel West in Columbus, Ohio, through a joint venture with Mount Carmel Health System. This acquisition was funded through a contribution of a
60
‑bed de novo inpatient rehabilitation hospital to the consolidated joint venture.
|
|
•
|
In July 2017, we acquired
50%
of the inpatient rehabilitation unit at Jackson-Madison County General Hospital through a joint venture with West Tennessee Healthcare. The acquisition was funded through a contribution of our existing inpatient rehabilitation hospital in Martin, Tennessee to the consolidated joint venture.
|
|
•
|
In September 2017, we acquired
75%
of Heritage Valley Beaver Hospital’s inpatient rehabilitation unit in Beaver, Pennsylvania, through a joint venture with Heritage Valley Health System, Inc. The acquisition was funded through the exchange of
25%
of our existing inpatient rehabilitation hospital in Sewickley, Pennsylvania.
|
We accounted for these transactions under the acquisition method of accounting and reported the results of operations of the acquired hospitals from their respective dates of acquisition. Assets acquired were recorded at their estimated fair values as of the respective acquisition dates. The fair values of the identifiable intangible assets were based on valuations using the income approach. The income approach is based on management’s estimates of future operating results and cash flows discounted using a weighted-average cost of capital that reflects market participant assumptions. The excess of the fair value of the consideration conveyed over the fair value of the net assets acquired was recorded as goodwill. The goodwill reflects our expectations of our ability to gain access to and penetrate the acquired hospital’s historical patient base and the benefits of being able to leverage operational efficiencies with favorable growth opportunities based on positive demographic trends in these markets.
None
of the goodwill recorded as a result of these transactions is deductible for federal income tax purposes.
F-30
|
Encompass Health Corporation and Subsidiaries
Notes to Consolidated Financial Statements
|
||
The fair value of the assets acquired at the acquisition date were as follows (in millions):
|
Property and equipment
|
$
|
0.1
|
|
|
Identifiable intangible assets:
|
|
|
|
|
Noncompete agreements (useful lives of 2 to 3 years)
|
0.6
|
|
|
|
Trade name (useful life of 20 years)
|
0.5
|
|
|
|
Certificate of need (useful life of 20 years)
|
9.8
|
|
|
|
Goodwill
|
24.0
|
|
|
|
Total assets acquired
|
$
|
35.0
|
|
Information regarding the net cash paid for the inpatient rehabilitation acquisitions during
2017
is as follows (in millions):
|
Fair value of assets acquired
|
$
|
11.0
|
|
|
Goodwill
|
24.0
|
|
|
|
Fair value of noncontrolling interest owned by joint venture partner
|
(24.1
|
)
|
|
|
Net cash paid for acquisition
|
$
|
10.9
|
|
Home Health and Hospice
During
2017
, we completed the following home health acquisitions,
none
of which were individually material to our financial position, results of operations, or cash flows. Each acquisition was made to enhance our position and ability to provide post-acute healthcare services to patients in the applicable geographic areas. Each acquisition was funded using cash on hand.
|
•
|
In February 2017, we acquired the assets of Celtic Healthcare of Maryland, Inc., a home health provider with locations in Owings Mill, Maryland and Rockville, Maryland.
|
|
•
|
In February 2017, we also acquired the assets of
two
home health locations from Community Health Services, Inc., located in Owensboro, Kentucky and Elizabethtown, Kentucky.
|
|
•
|
In May 2017, we acquired the assets of
two
home health locations from Bio Care Home Health Services, Inc. and Kinsman Enterprises, Inc., located in Irving, Texas and Longview, Texas.
|
|
•
|
In July 2017, we acquired the assets of
four
home health locations from VNA Healthtrends, located in Bourbonnais, Illinois; Des Plaines, Illinois; Schererville, Indiana; and Tempe, Arizona.
|
|
•
|
In August 2017, we acquired the assets of
two
home health locations from VNA Healthtrends, located in Canton, Ohio and Forsyth, Illinois.
|
|
•
|
In October 2017, we acquired the assets of a home health location from Ware Visiting Nurses Services, Inc. located in Savannah, Georgia; and
|
|
•
|
In October 2017, we also acquired the assets of a home health location from Pickens County Health Care Authority located in Carrollton, Alabama.
|
We accounted for these transactions under the acquisition method of accounting and reported the results of operations of the acquired locations from their respective dates of acquisition. Assets acquired or liabilities assumed were recorded at their estimated fair values as of the respective acquisition dates. The fair values of identifiable intangible assets were based on valuations using the cost and income approaches. The cost approach is based on amounts that would be required to replace the asset (i.e., replacement cost). The income approach is based on management’s estimates of future operating results and cash flows discounted using a weighted-average cost of capital that reflects market participant assumptions. The excess of the fair value of the consideration conveyed over the fair value of the net assets acquired was recorded as goodwill. The goodwill
F-31
|
Encompass Health Corporation and Subsidiaries
Notes to Consolidated Financial Statements
|
||
reflects our expectations of our ability to utilize the acquired locations’ mobile workforce and established relationships within each community and the benefits of being able to leverage operational efficiencies with favorable growth opportunities based on positive demographic trends in these markets. All of the goodwill recorded as a result of these transactions is deductible for federal income tax purposes.
The fair value of the assets acquired and liabilities assumed at the acquisition date were as follows (in millions):
|
Total current assets
|
$
|
0.1
|
|
|
Identifiable intangible asset:
|
|||
|
Noncompete agreements (useful lives of 5 years)
|
0.8
|
|
|
|
Trade name (useful life of 1 year)
|
0.1
|
|
|
|
Certificates of need (useful lives of 10 years)
|
1.8
|
|
|
|
Licenses (useful lives of 10 years)
|
4.0
|
|
|
|
Goodwill
|
21.4
|
|
|
|
Total assets acquired
|
28.2
|
|
|
|
Total liabilities assumed
|
(0.3
|
)
|
|
|
Net assets acquired
|
$
|
27.9
|
|
Information regarding the net cash paid for the home health acquisitions during
2017
is as follows (in millions):
|
Fair value of assets acquired
|
$
|
6.8
|
|
|
Goodwill
|
21.4
|
|
|
|
Fair value of liabilities assumed
|
(0.3
|
)
|
|
|
Net cash paid for acquisitions
|
$
|
27.9
|
|
Pro Forma Results of Operations
The following table summarizes the results of operations of the above mentioned acquisitions from their respective dates of acquisition included in our consolidated results of operations and the unaudited pro forma results of operations of the combined entity had the date of the acquisitions been January 1, 2016 (in millions):
|
|
Net Operating Revenues
|
|
Net (Loss) Income Attributable to Encompass Health
|
||||
|
Acquired entities only: Actual from acquisition date to December 31, 2017
|
$
|
32.9
|
|
|
$
|
(6.3
|
)
|
|
Combined entity: Supplemental pro forma from 01/01/2017-12/31/2017 (unaudited)
|
3,996.1
|
|
|
260.3
|
|
||
|
Combined entity: Supplemental pro forma from 01/01/2016-12/31/2016 (unaudited)
|
3,771.5
|
|
|
254.8
|
|
||
The information presented above is for illustrative purposes only and is not necessarily indicative of results that would have been achieved if the acquisitions had occurred as of the beginning of our 2016 reporting period.
2016 Acquisitions
Inpatient Rehabilitation
During 2016, we completed the following inpatient rehabilitation hospital acquisitions, none of which were individually material to our financial position, results of operations, or cash flows. Each acquisition was made to enhance our position and ability to provide inpatient rehabilitation services to patients in the applicable geographic areas. Each acquisition was funded through a contribution to the respective consolidated joint venture.
F-32
|
Encompass Health Corporation and Subsidiaries
Notes to Consolidated Financial Statements
|
||
|
•
|
In February 2016, we acquired
50%
of the inpatient rehabilitation hospital at CHI St. Vincent Hot Springs, a
20
-bed inpatient rehabilitation hospital in Hot Springs, Arkansas, through a joint venture with St. Vincent Community Health Services, Inc.
|
|
•
|
In August 2016, we acquired
50%
of the inpatient rehabilitation hospital at St. Joseph Regional Health Center, a
19
-bed inpatient rehabilitation hospital in Bryan, Texas, through a joint venture with St. Joseph Health System.
|
|
•
|
In August 2016, we also acquired
51%
of the inpatient rehabilitation hospital at The Bernsen Rehabilitation Center at St. John, a
24
-bed inpatient rehabilitation hospital in Broken Arrow, Oklahoma, through a joint venture with St. John Health System.
|
We accounted for these transactions under the acquisition method of accounting and reported the results of operations of the acquired hospitals from their respective dates of acquisition. Assets acquired and liabilities assumed, if any, were recorded at their estimated fair values as of the respective acquisition dates. The fair values of the identifiable intangible assets were based on valuations using the income approach. The income approach is based on management’s estimates of future operating results and cash flows discounted using a weighted-average cost of capital that reflects market participant assumptions. The excess of the fair value of the consideration conveyed over the fair value of the net assets acquired was recorded as goodwill. The goodwill reflects our expectations of our ability to gain access to and penetrate the acquired hospital’s historical patient base and the benefits of being able to leverage operational efficiencies with favorable growth opportunities based on positive demographic trends in these markets.
None
of the goodwill recorded as a result of these transactions is deductible for federal income tax purposes.
The fair value of the assets acquired at the acquisition date were as follows (in millions):
|
Property and equipment
|
$
|
5.3
|
|
|
Identifiable intangible assets:
|
|
|
|
|
Noncompete agreements (useful lives of 1 to 3 years)
|
0.4
|
|
|
|
Trade names (useful lives of 20 years)
|
1.0
|
|
|
|
Goodwill
|
9.4
|
|
|
|
Total assets acquired
|
$
|
16.1
|
|
Information regarding the net cash paid for all inpatient rehabilitation acquisitions during 2016 is as follows (in millions):
|
Fair value of assets acquired
|
$
|
6.7
|
|
|
Goodwill
|
9.4
|
|
|
|
Fair value of noncontrolling interest owned by joint venture partner
|
(16.1
|
)
|
|
|
Net cash paid for acquisition
|
$
|
—
|
|
See also
Note 8,
Investments in and Advances to Nonconsolidated Affiliates
.
Home Health and Hospice
During 2016, we completed the following home health and hospice acquisitions, none of which were individually material to our financial position, results of operations, or cash flows. Each acquisition was made to enhance our position and ability to provide post-acute healthcare services to patients in the applicable geographic areas. Each acquisition was funded using cash on hand.
|
•
|
In May 2016, we acquired Home Health Agency of Georgia, LLC, a home health and hospice provider with
two
home health locations and
two
hospice locations in the Greater Atlanta area.
|
|
•
|
In July 2016, we acquired Advantage Health Inc., a home health provider with
one
location in Yuma, Arizona.
|
F-33
|
Encompass Health Corporation and Subsidiaries
Notes to Consolidated Financial Statements
|
||
|
•
|
In September 2016, we acquired
three
hospice agencies from Sotto International, Inc. located in Texarkana, Arkansas; Magnolia, Arkansas; and Texarkana, Texas.
|
|
•
|
In October 2016, we acquired
two
home health agencies from Summit Home Health Care, Inc. located in Cheyenne, Wyoming and Laramie, Wyoming.
|
|
•
|
In October 2016, we also acquired LightHouse Health Care, Inc., a home health provider with
one
location in Springfield, Virginia.
|
|
•
|
In November 2016, we acquired Gulf City Home Care, Inc., a home health provider with
one
location in Sarasota, Florida.
|
|
•
|
In November 2016, we also acquired Honor Hospice, LLC, a hospice provider with
one
location in Wheat Ridge, Colorado.
|
We accounted for all of these transactions under the acquisition method of accounting and reported the results of operations of the acquired locations from their respective dates of acquisition. Assets acquired and liabilities assumed were recorded at their estimated fair values as of the respective acquisition dates. The fair values of identifiable intangible assets were based on valuations using the cost and income approaches. The cost approach is based on amounts that would be required to replace the asset (i.e., replacement cost). The income approach is based on management’s estimates of future operating results and cash flows discounted using a weighted-average cost of capital that reflects market participant assumptions. The excess of the fair value of the consideration conveyed over the fair value of the net assets acquired was recorded as goodwill. The goodwill reflects our expectations of our ability to utilize the acquired locations’ mobile workforce and established relationships within each community and the benefits of being able to leverage operational efficiencies with favorable growth opportunities based on positive demographic trends in these markets. All goodwill recorded as a result of these transactions is deductible for federal income tax purposes.
The fair value of the assets acquired and liabilities assumed at the acquisition date were as follows (in millions):
|
Identifiable intangible asset:
|
|
|
|
|
Noncompete agreements (useful lives of 5 years)
|
$
|
1.1
|
|
|
Trade names (useful lives of 1 year)
|
0.7
|
|
|
|
Certificate of needs (useful lives of 10 years)
|
1.9
|
|
|
|
Licenses (useful lives of 10 years)
|
3.4
|
|
|
|
Goodwill
|
41.4
|
|
|
|
Total assets acquired
|
48.5
|
|
|
|
Total liabilities assumed
|
(0.4
|
)
|
|
|
Net assets acquired
|
$
|
48.1
|
|
Information regarding the net cash paid for home health and hospice acquisitions during 2016 is as follows (in millions):
|
Fair value of assets acquired
|
$
|
7.1
|
|
|
Goodwill
|
41.4
|
|
|
|
Fair value of liabilities assumed
|
(0.4
|
)
|
|
|
Net cash paid for acquisitions
|
$
|
48.1
|
|
F-34
|
Encompass Health Corporation and Subsidiaries
Notes to Consolidated Financial Statements
|
||
Pro Forma Results of Operations
The following table summarizes the results of operations of the above mentioned inpatient rehabilitation hospitals and home health and hospice agencies from their respective dates of acquisition included in our consolidated results of operations and the unaudited pro forma results of operations of the combined entity had the date of the acquisitions been January 1, 2015 (in millions):
|
Net Operating Revenues
|
Net (Loss) Income Attributable to Encompass Health
|
||||||
|
Acquired entities only: Actual from acquisition date to December 31, 2016
|
$
|
27.4
|
|
$
|
(2.2
|
)
|
|
|
Combined entity: Supplemental pro forma from 1/01/2016-12/31/2016 (unaudited)
|
3,745.6
|
|
252.2
|
|
|||
|
Combined entity: Supplemental pro forma from 1/01/2015-12/31/2015 (unaudited)
|
3,217.1
|
|
187.3
|
|
|||
The information presented above is for illustrative purposes only and is not necessarily indicative of results that would have been achieved if the acquisitions had occurred as of the beginning of our 2015 reporting period.
|
3.
|
Variable Interest Entities
:
|
As of
December 31, 2018
and
December 31, 2017
, we consolidated
eight
and ten, respectively, limited partnership-like entities that are variable interest entities (“VIEs”) and of which we are the primary beneficiary. Our ownership percentages in these entities range from
50.0%
to
75.0%
as of
December 31, 2018
. Through partnership and management agreements with or governing each of these entities, we manage all of these entities and handle all day-to-day operating decisions. Accordingly, we have the decision making power over the activities that most significantly impact the economic performance of our VIEs and an obligation to absorb losses or receive benefits from the VIE that could potentially be significant to the VIE. These decisions and significant activities include, but are not limited to, marketing efforts, oversight of patient admissions, medical training, nurse and therapist scheduling, provision of healthcare services, billing, collections and creation and maintenance of medical records. The terms of the agreements governing each of our VIEs prohibit us from using the assets of each VIE to satisfy the obligations of other entities.
F-35
|
Encompass Health Corporation and Subsidiaries
Notes to Consolidated Financial Statements
|
||
The carrying amounts and classifications of the consolidated VIEs’ assets and liabilities, which are included in our consolidated balance sheet, are as follows (in millions):
|
December 31, 2018
|
December 31, 2017
|
||||||
|
Assets
|
|
||||||
|
Current assets:
|
|
||||||
|
Cash and cash equivalents
|
$
|
0.3
|
|
$
|
1.2
|
|
|
|
Accounts receivable
|
31.0
|
|
32.6
|
|
|||
|
Other current assets
|
4.9
|
|
5.6
|
|
|||
|
Total current assets
|
36.2
|
|
39.4
|
|
|||
|
Property and equipment, net
|
111.5
|
|
142.8
|
|
|||
|
Goodwill
|
15.9
|
|
73.5
|
|
|||
|
Intangible assets, net
|
4.3
|
|
7.7
|
|
|||
|
Deferred income tax assets
|
0.6
|
|
0.7
|
|
|||
|
Other long-term assets
|
29.0
|
|
—
|
|
|||
|
Total assets
|
$
|
197.5
|
|
$
|
264.1
|
|
|
|
Liabilities
|
|||||||
|
Current liabilities:
|
|||||||
|
Current portion of long-term debt
|
$
|
0.6
|
|
$
|
1.8
|
|
|
|
Accounts payable
|
5.2
|
|
6.5
|
|
|||
|
Accrued payroll
|
7.0
|
|
7.1
|
|
|||
|
Accrued interest payable
|
—
|
|
0.2
|
|
|||
|
Other current liabilities
|
38.0
|
|
8.6
|
|
|||
|
Total current liabilities
|
50.8
|
|
24.2
|
|
|||
|
Long-term debt, net of current portion
|
—
|
|
28.3
|
|
|||
|
Total liabilities
|
$
|
50.8
|
|
$
|
52.5
|
|
|
|
4.
|
Cash and Marketable Securities
:
|
The components of our investments as of
December 31, 2018
are as follows (in millions):
|
|
Cash & Cash Equivalents
|
Restricted Cash
|
Restricted Marketable Securities
|
Total
|
|||||||||||
|
Cash
|
$
|
69.2
|
|
$
|
64.3
|
|
$
|
—
|
|
$
|
133.5
|
|
|||
|
Marketable securities
|
—
|
|
—
|
|
62.0
|
|
62.0
|
|
|||||||
|
Total
|
$
|
69.2
|
|
$
|
64.3
|
|
|
$
|
62.0
|
|
$
|
195.5
|
|
||
F-36
|
Encompass Health Corporation and Subsidiaries
Notes to Consolidated Financial Statements
|
||
The components of our investments as of
December 31, 2017
are as follows (in millions):
|
|
Cash & Cash Equivalents
|
Restricted Cash
|
Restricted Marketable Securities
|
Total
|
|||||||||||
|
Cash
|
$
|
54.4
|
|
$
|
62.4
|
|
$
|
—
|
|
$
|
116.8
|
|
|||
|
Marketable securities
|
—
|
|
—
|
|
62.0
|
|
62.0
|
|
|||||||
|
Total
|
$
|
54.4
|
|
$
|
62.4
|
|
$
|
62.0
|
|
$
|
178.8
|
|
|||
Restricted Cash—
As of
December 31, 2018
and
2017
,
Restricted cash
consisted of the following (in millions):
|
|
As of December 31,
|
||||||
|
|
2018
|
2017
|
|||||
|
Current:
|
|||||||
|
Affiliate cash
|
$
|
16.4
|
|
$
|
18.1
|
|
|
|
Self-insured captive funds
|
42.6
|
|
44.3
|
|
|||
|
59.0
|
|
62.4
|
|
||||
|
Noncurrent:
|
|||||||
|
Self-insured captive funds
|
5.3
|
|
—
|
|
|||
|
Total restricted cash
|
$
|
64.3
|
|
$
|
62.4
|
|
|
Affiliate cash represents cash accounts maintained by joint ventures in which we participate where one or more of our external partners requested, and we agreed, that the joint venture’s cash not be commingled with other corporate cash accounts and be used only to fund the operations of those joint ventures. Self-insured captive funds represent cash held at our wholly owned insurance captive, HCS, Ltd., as discussed in
Note 10,
Self-Insured Risks
. These funds are committed to pay third-party administrators for claims incurred and are restricted by insurance regulations and requirements. These funds cannot be used for purposes outside HCS without the permission of the Cayman Islands Monetary Authority.
The classification of restricted cash held by HCS as current or noncurrent depends on the classification of the corresponding claims liability.
Marketable Securities—
Restricted marketable securities at both balance sheet dates represent restricted assets held at HCS. HCS insures a substantial portion of Encompass Health’s professional liability, workers’ compensation, and other insurance claims. These funds are committed for payment of claims incurred, and the classification of these marketable securities as current or noncurrent depends on the classification of the corresponding claims liability. As of
December 31, 2018
and
2017
,
$62.0 million
and
$44.2 million
, respectively, of restricted marketable securities are included in
Other long-term assets
in our consolidated balance sheets. As of
December 31, 2018
,
$1.7 million
of unrealized net losses were recognized in our consolidated statement of operations during 2018 on marketable securities were still held at the reporting date.
A summary of our restricted marketable securities as of
December 31, 2017
, as required for equity securities prior to ASU No. 2016-01, is as follows (in millions):
|
|
Cost
|
Gross Unrealized Gains
|
Gross Unrealized Losses
|
Fair Value
|
|||||||||||
|
Marketable securities
|
$
|
64.0
|
|
$
|
0.3
|
|
$
|
(2.3
|
)
|
$
|
62.0
|
|
|||
F-37
|
Encompass Health Corporation and Subsidiaries
Notes to Consolidated Financial Statements
|
||
Cost in the above table includes adjustments made to the cost basis of our equity securities for other-than-temporary impairments. During the years ended December 31,
2017
, and
2016
, we did not record any impairment charges related to our restricted marketable securities.
Investing information related to our restricted marketable securities is as follows (in millions):
|
|
For the Year Ended December 31,
|
||||||||||
|
|
2018
|
2017
|
2016
|
||||||||
|
Proceeds from sales of restricted marketable securities
|
$
|
11.4
|
|
$
|
4.0
|
|
$
|
—
|
|
||
|
Gross realized losses
|
$
|
(0.6
|
)
|
$
|
—
|
|
$
|
—
|
|
||
Our portfolio of marketable securities is comprised of investments in mutual funds that hold investments in a variety of industries and geographies. As discussed in
Note 1,
Summary of Significant Accounting Policies
, “Marketable Securities,” and prior to ASU No. 2016-01, when our portfolio included marketable securities with unrealized losses that are not deemed to be other-than-temporarily impaired, we examined the severity and duration of the impairments in relation to the cost of the individual investments. We also considered the industry and geography in which each investment is held and the near-term prospects for a recovery in each.
|
5.
|
Accounts Receivable
:
|
Accounts receivable consists of the following (in millions):
|
|
As of December 31,
|
||||||
|
|
2018
|
2017
|
|||||
|
Current:
|
|||||||
|
Patient accounts receivable
|
$
|
459.9
|
|
$
|
459.5
|
|
|
|
Other accounts receivable
|
7.8
|
|
12.6
|
|
|||
|
467.7
|
|
472.1
|
|
||||
|
Noncurrent patient accounts receivable
|
155.5
|
|
129.1
|
|
|||
|
Accounts receivable
|
$
|
623.2
|
|
$
|
601.2
|
|
|
Because the resolution of claims that are part of Medicare audit programs can take in excess of three years, we review the patient receivables that are part of this adjudication process to determine their appropriate classification as either current or noncurrent. Amounts considered noncurrent are included in
Other long-term assets
in our consolidated balance sheet.
F-38
|
Encompass Health Corporation and Subsidiaries
Notes to Consolidated Financial Statements
|
||
|
6.
|
Property and Equipment
:
|
Property and equipment consists of the following (in millions):
|
|
As of December 31,
|
||||||
|
|
2018
|
2017
|
|||||
|
Land
|
$
|
142.4
|
|
$
|
125.4
|
|
|
|
Buildings
|
1,875.2
|
|
1,712.4
|
|
|||
|
Leasehold improvements
|
147.5
|
|
138.1
|
|
|||
|
Vehicles
|
24.6
|
|
16.2
|
|
|||
|
Furniture, fixtures, and equipment
|
441.6
|
|
461.5
|
|
|||
|
|
2,631.3
|
|
2,453.6
|
|
|||
|
Less: Accumulated depreciation and amortization
|
(1,147.0
|
)
|
(1,097.8
|
)
|
|||
|
|
1,484.3
|
|
1,355.8
|
|
|||
|
Construction in progress
|
150.5
|
|
161.3
|
|
|||
|
Property and equipment, net
|
$
|
1,634.8
|
|
$
|
1,517.1
|
|
|
As of
December 31, 2018
, approximately
70%
of our consolidated
Property and equipment, net
held by Encompass Health Corporation and its guarantor subsidiaries was pledged to the lenders under our credit agreement. See
Note 9,
Long-term Debt
, and
Note 20,
Condensed Consolidating Financial Information
.
In February 2016, we entered into a development/lease agreement with CR HQ, LLC (the “Developer”) to construct our new home office in Birmingham, Alabama. Under the terms of this agreement, the Developer is responsible for all costs of constructing the new facility ‘shell’ which is being leased to us for an initial term of
15
years with
four
,
five
-year renewal options. The lease commenced in April of 2018. We were responsible for the costs associated with improvements to the interior of the building. Due to the nature and extent of the tenant improvements we made to the new home office and certain provisions of the development/lease agreement, we were deemed to be the accounting owner of the new home office during the construction period. Construction commenced in the second quarter of 2016. As of
December 31, 2018
and
2017
,
Property and equipment, net
includes
$55.0 million
and
$49.8 million
, respectively, for the construction costs incurred by the Developer, and
Long-term debt, net of current portion
includes a corresponding financing obligation liability of
$54.8 million
and
$49.5 million
, respectively. The remaining corresponding financing obligation liability of
$0.2 million
and
$0.3 million
as of
December 31, 2018
and 2017 is included in the
Current portion of long-term debt
. The amounts recorded for construction costs and the corresponding liability are noncash activities for purposes of our consolidated statement of cash flows. See
Note 9,
Long-term Debt
.
Information related to fully depreciated assets and assets under capital lease obligations is as follows (in millions):
|
|
As of December 31,
|
||||||
|
|
2018
|
2017
|
|||||
|
Fully depreciated assets
|
$
|
311.7
|
|
$
|
318.6
|
|
|
|
Assets under capital lease obligations:
|
|
|
|
|
|||
|
Buildings
|
$
|
329.6
|
|
$
|
329.6
|
|
|
|
Vehicles
|
21.1
|
|
13.0
|
|
|||
|
Equipment
|
0.3
|
|
0.3
|
|
|||
|
|
351.0
|
|
342.9
|
|
|||
|
Less: Accumulated amortization
|
(126.9
|
)
|
(104.6
|
)
|
|||
|
Assets under capital lease obligations, net
|
$
|
224.1
|
|
$
|
238.3
|
|
|
F-39
|
Encompass Health Corporation and Subsidiaries
Notes to Consolidated Financial Statements
|
||
The amount of depreciation expense, amortization expense relating to assets under capital lease obligations, interest capitalized, and rent expense under operating leases is as follows (in millions):
|
|
For the Year Ended December 31,
|
||||||||||
|
|
2018
|
2017
|
2016
|
||||||||
|
Depreciation expense
|
$
|
124.2
|
|
$
|
111.8
|
|
$
|
102.3
|
|
||
|
Amortization expense
|
$
|
24.1
|
|
$
|
22.7
|
|
$
|
21.8
|
|
||
|
Interest capitalized
|
$
|
6.0
|
|
$
|
3.7
|
|
$
|
2.0
|
|
||
|
Rent expense:
|
|
|
|
|
|
|
|||||
|
Minimum rent payments
|
$
|
69.8
|
|
$
|
66.5
|
|
$
|
62.6
|
|
||
|
Contingent and other rents
|
24.9
|
|
24.1
|
|
29.4
|
|
|||||
|
Other
|
9.1
|
|
8.9
|
|
4.0
|
|
|||||
|
Total rent expense
|
$
|
103.8
|
|
$
|
99.5
|
|
$
|
96.0
|
|
||
Leases—
We lease certain land, buildings, and equipment under noncancelable operating leases generally expiring at various dates through
2037
. We also lease certain buildings and equipment under capital leases generally expiring at various dates through
2037
. Operating leases generally have
1
- to
20
-year terms, with one or more renewal options, with terms to be negotiated at the time of renewal. Various facility leases include provisions for rent escalation to recognize increased operating costs or require us to pay certain maintenance and utility costs. Contingent rents are included in rent expense in the year incurred.
Some facilities are subleased to other parties. Rental income from subleases approximated
$3.0 million
,
$2.9 million
, and
$4.1 million
for the years ended
December 31, 2018
,
2017
, and
2016
, respectively. Total expected future minimum rentals under these noncancelable subleases approximated
$2.6 million
as of
December 31, 2018
.
Certain leases contain annual escalation clauses based on changes in the Consumer Price Index while others have fixed escalation terms. The excess of cumulative rent expense (recognized on a straight-line basis) over cumulative rent payments made on leases with fixed escalation terms is recognized as straight-line rental accrual and is included in
Other long-term liabilities
in the accompanying consolidated balance sheets, as follows (in millions):
|
|
As of December 31,
|
||||||
|
|
2018
|
2017
|
|||||
|
Straight-line rental accrual
|
$
|
12.1
|
|
$
|
11.2
|
|
|
F-40
|
Encompass Health Corporation and Subsidiaries
Notes to Consolidated Financial Statements
|
||
Future minimum lease payments at
December 31, 2018
, for those leases having an initial or remaining noncancelable lease term in excess of one year, are as follows (in millions):
|
Year Ending December 31,
|
Operating Leases
|
Capital Lease Obligations
|
Total
|
|||||||||
|
2019
|
$
|
71.4
|
|
$
|
36.2
|
|
$
|
107.6
|
|
|||
|
2020
|
65.8
|
|
32.3
|
|
98.1
|
|
||||||
|
2021
|
54.3
|
|
30.3
|
|
84.6
|
|
||||||
|
2022
|
41.0
|
|
28.7
|
|
69.7
|
|
||||||
|
2023
|
35.3
|
|
28.0
|
|
63.3
|
|
||||||
|
2024 and thereafter
|
148.2
|
|
299.7
|
|
447.9
|
|
||||||
|
|
$
|
416.0
|
|
455.2
|
|
$
|
871.2
|
|
||||
|
Less: Interest portion
|
|
|
(191.4
|
)
|
|
|
||||||
|
Obligations under capital leases
|
|
|
$
|
263.8
|
|
|
|
|||||
In addition to the above, and as discussed in
Note 9,
Long-term Debt
, “Other Notes Payable,” we have
three
sale/leaseback transactions involving real estate accounted for as financings. Future minimum payments, two of which are accounted for as interest, under these obligations are
$7.5 million
in year one,
$7.5 million
in year two,
$7.6 million
in year three,
$7.5 million
in year four,
$6.8 million
in year five, and
$82.2 million
thereafter.
|
7.
|
Goodwill and Other Intangible Assets
:
|
The following table shows changes in the carrying amount of
Goodwill
for the years ended
December 31, 2018
,
2017
, and
2016
(in millions):
|
|
Inpatient Rehabilitation
|
Home Health and Hospice
|
Consolidated
|
||||||||
|
Goodwill as of December 31, 2015
|
$
|
1,133.1
|
|
$
|
757.0
|
|
$
|
1,890.1
|
|
||
|
Acquisitions
|
8.9
|
|
42.5
|
|
51.4
|
|
|||||
|
Divestiture of pediatric home health services
|
—
|
|
(14.3
|
)
|
(14.3
|
)
|
|||||
|
Goodwill as of December 31, 2016
|
1,142.0
|
|
785.2
|
|
1,927.2
|
|
|||||
|
Acquisitions
|
24.0
|
|
21.4
|
|
45.4
|
|
|||||
|
Goodwill as of December 31, 2017
|
1,166.0
|
|
806.6
|
|
1,972.6
|
|
|||||
|
Acquisitions
|
23.2
|
|
105.0
|
|
128.2
|
|
|||||
|
Goodwill as of December 31, 2018
|
$
|
1,189.2
|
|
$
|
911.6
|
|
$
|
2,100.8
|
|
||
Goodwill
increased in 2016 as a result of our acquisitions of inpatient and home health and hospice operations offset by the divestiture of our pediatric home health assets to Thrive Skilled Pediatric Care in November 2016 for approximately
$21 million
. We recorded a
$3.3 million
gain as part of
Other operating expenses
in our consolidated statements of operations during the year ended December 31, 2016.
Goodwill
increased in 2017 as a result of our acquisitions of inpatient and home health operations.
Goodwill
increased in 2018 as a result of our acquisitions of Camellia and other inpatient and home health and hospice operations. See
Note 2,
Business Combinations
.
We performed impairment reviews as of October 1,
2018
,
2017
, and
2016
and concluded no
Goodwill
impairment existed. As of
December 31, 2018
, we had no accumulated impairment losses related to
Goodwill
.
F-41
|
Encompass Health Corporation and Subsidiaries
Notes to Consolidated Financial Statements
|
||
The following table provides information regarding our other intangible assets (in millions):
|
|
Gross Carrying Amount
|
Accumulated Amortization
|
Net
|
||||||||
|
Certificates of need:
|
|
|
|
||||||||
|
2018
|
$
|
148.3
|
|
$
|
(28.2
|
)
|
$
|
120.1
|
|
||
|
2017
|
113.7
|
|
(19.5
|
)
|
94.2
|
|
|||||
|
Licenses:
|
|
|
|
|
|
|
|||||
|
2018
|
$
|
169.1
|
|
$
|
(82.2
|
)
|
$
|
86.9
|
|
||
|
2017
|
146.0
|
|
(71.6
|
)
|
74.4
|
|
|||||
|
Noncompete agreements:
|
|
|
|
|
|
|
|||||
|
2018
|
$
|
65.6
|
|
$
|
(58.6
|
)
|
$
|
7.0
|
|
||
|
2017
|
63.5
|
|
(55.4
|
)
|
8.1
|
|
|||||
|
Trade name - Encompass:
|
|||||||||||
|
2018
|
$
|
135.2
|
|
$
|
—
|
|
$
|
135.2
|
|
||
|
2017
|
135.2
|
|
—
|
|
135.2
|
|
|||||
|
Trade names - all other:
|
|
|
|
|
|
|
|||||
|
2018
|
$
|
38.9
|
|
$
|
(19.4
|
)
|
$
|
19.5
|
|
||
|
2017
|
35.1
|
|
(16.4
|
)
|
18.7
|
|
|||||
|
Internal-use software:
|
|
|
|
|
|
|
|||||
|
2018
|
$
|
161.3
|
|
$
|
(89.3
|
)
|
$
|
72.0
|
|
||
|
2017
|
201.6
|
|
(132.3
|
)
|
69.3
|
|
|||||
|
Market access assets:
|
|||||||||||
|
2018
|
$
|
13.2
|
|
$
|
(10.5
|
)
|
$
|
2.7
|
|
||
|
2017
|
13.2
|
|
(10.0
|
)
|
3.2
|
|
|||||
|
Total intangible assets:
|
|
|
|
|
|
|
|||||
|
2018
|
$
|
731.6
|
|
$
|
(288.2
|
)
|
$
|
443.4
|
|
||
|
2017
|
708.3
|
|
(305.2
|
)
|
403.1
|
|
|||||
Amortization expense for other intangible assets is as follows (in millions):
|
|
For the Year Ended December 31,
|
||||||||||
|
|
2018
|
2017
|
2016
|
||||||||
|
Amortization expense
|
$
|
51.4
|
|
$
|
49.3
|
|
$
|
48.5
|
|
||
Total estimated amortization expense for our other intangible assets for the next five years is as follows (in millions):
|
Year Ending December 31,
|
Estimated Amortization Expense
|
||
|
2019
|
$
|
56.9
|
|
|
2020
|
43.3
|
|
|
|
2021
|
35.7
|
|
|
|
2022
|
29.6
|
|
|
|
2023
|
27.0
|
|
|
F-42
|
Encompass Health Corporation and Subsidiaries
Notes to Consolidated Financial Statements
|
||
|
8.
|
Investments in and Advances to Nonconsolidated Affiliates
:
|
Investments in and advances to nonconsolidated affiliates as of
December 31, 2018
represents our investment in
five
partially owned subsidiaries, of which
four
are general or limited partnerships, limited liability companies, or joint ventures in which Encompass Health or one of its subsidiaries is a general or limited partner, managing member, member, or venturer, as applicable. We do not control these affiliates but have the ability to exercise significant influence over the operating and financial policies of certain of these affiliates. Our ownership percentages in these affiliates range from approximately
19%
to
60%
. We account for these investments using the cost and equity methods of accounting. Our investments, which are included in
Other long-term assets
in our consolidated balance sheets, consist of the following (in millions):
|
|
As of December 31,
|
||||||
|
|
2018
|
2017
|
|||||
|
Equity method investments:
|
|
|
|||||
|
Capital contributions
|
$
|
0.9
|
|
$
|
0.9
|
|
|
|
Cumulative share of income
|
114.0
|
|
105.3
|
|
|||
|
Cumulative share of distributions
|
(102.7
|
)
|
(94.5
|
)
|
|||
|
|
12.2
|
|
11.7
|
|
|||
|
Cost method investments:
|
|
|
|
|
|||
|
Capital contributions, net of distributions and impairments
|
—
|
|
0.2
|
|
|||
|
Total investments in and advances to nonconsolidated affiliates
|
$
|
12.2
|
|
$
|
11.9
|
|
|
The following summarizes the combined assets, liabilities, and equity and the combined results of operations of our equity method affiliates (on a 100% basis, in millions):
|
|
As of December 31,
|
||||||
|
|
2018
|
2017
|
|||||
|
Assets—
|
|
|
|||||
|
Current
|
$
|
9.9
|
|
$
|
10.1
|
|
|
|
Noncurrent
|
17.8
|
|
18.3
|
|
|||
|
Total assets
|
$
|
27.7
|
|
$
|
28.4
|
|
|
|
Liabilities and equity—
|
|
|
|
|
|||
|
Current liabilities
|
$
|
1.4
|
|
$
|
2.7
|
|
|
|
Noncurrent liabilities
|
0.1
|
|
0.2
|
|
|||
|
Partners’ capital and shareholders’ equity—
|
|
|
|
|
|||
|
Encompass Health
|
12.2
|
|
11.7
|
|
|||
|
Outside partners
|
14.0
|
|
13.8
|
|
|||
|
Total liabilities and equity
|
$
|
27.7
|
|
$
|
28.4
|
|
|
F-43
|
Encompass Health Corporation and Subsidiaries
Notes to Consolidated Financial Statements
|
||
Condensed statements of operations (in millions):
|
|
For the Year Ended December 31,
|
||||||||||
|
|
2018
|
2017
|
2016
|
||||||||
|
Net operating revenues
|
$
|
42.6
|
|
$
|
40.9
|
|
$
|
44.8
|
|
||
|
Operating expenses
|
(25.6
|
)
|
(24.1
|
)
|
(24.3
|
)
|
|||||
|
Income from continuing operations, net of tax
|
17.1
|
|
17.0
|
|
20.5
|
|
|||||
|
Net income
|
17.1
|
|
17.0
|
|
20.5
|
|
|||||
|
9.
|
Long-term Debt
:
|
Our long-term debt outstanding consists of the following (in millions):
|
|
As of December 31,
|
||||||
|
|
2018
|
2017
|
|||||
|
Credit Agreement—
|
|||||||
|
Advances under revolving credit facility
|
$
|
30.0
|
|
$
|
95.0
|
|
|
|
Term loan facilities
|
280.1
|
|
294.7
|
|
|||
|
Bonds payable—
|
|||||||
|
5.125% Senior Notes due 2023
|
296.6
|
|
295.9
|
|
|||
|
5.75% Senior Notes due 2024
|
1,194.7
|
|
1,193.9
|
|
|||
|
5.75% Senior Notes due 2025
|
345.0
|
|
344.4
|
|
|||
|
Other notes payable
|
104.2
|
|
82.3
|
|
|||
|
Capital lease obligations
|
263.8
|
|
271.5
|
|
|||
|
|
2,514.4
|
|
2,577.7
|
|
|||
|
Less: Current portion
|
(35.8
|
)
|
(32.3
|
)
|
|||
|
Long-term debt, net of current portion
|
$
|
2,478.6
|
|
$
|
2,545.4
|
|
|
The following chart shows scheduled principal payments due on long-term debt for the next five years and thereafter (in millions):
|
Year Ending December 31,
|
Face Amount
|
Net Amount
|
||||||
|
2019
|
$
|
36.5
|
|
$
|
36.5
|
|
||
|
2020
|
33.0
|
|
33.0
|
|
||||
|
2021
|
28.4
|
|
28.4
|
|
||||
|
2022
|
291.9
|
|
290.7
|
|
||||
|
2023
|
313.4
|
|
310.1
|
|
||||
|
Thereafter
|
1,826.2
|
|
1,815.7
|
|
||||
|
Total
|
$
|
2,529.4
|
|
$
|
2,514.4
|
|
||
As a result of the
2017
and
2016
redemptions discussed below, we recorded a
$10.7 million
, and
$7.4 million
Loss on early extinguishment of debt
in
2017
and
2016
, respectively. There were no redemptions resulting in a
Loss on early extinguishment of debt
during 2018.
F-44
|
Encompass Health Corporation and Subsidiaries
Notes to Consolidated Financial Statements
|
||
Senior Secured Credit Agreement—
Credit Agreement
In September 2017, we amended our existing credit agreement, previously amended on July 29, 2015 (the “Credit Agreement”). The Credit Agreement provided for a
$300 million
term loan commitment and a
$700 million
revolving credit facility, with a
$260 million
letter of credit subfacility and a swingline loan subfacility, all of which mature in September 2022. Outstanding term loan borrowings are payable in equal consecutive quarterly installments, commencing on December 31, 2017, of
1.25%
of the aggregate principal amount of the term loans outstanding as of December 31, 2017, with the remainder due at maturity. We have the right at any time to prepay, in whole or in part, any borrowing under the term loan facilities.
Amounts drawn on the term loan facilities and the revolving credit facility bear interest at a rate per annum of, at our option, (1) LIBOR or (2) the higher of (a) Barclays Bank PLC’s (“Barclays”) prime rate and (b) the federal funds rate plus
0.5%
, in each case, plus, in each case, an applicable margin that varies depending upon our leverage ratio. We are also subject to a commitment fee of
0.375%
per annum on the daily amount of the unutilized commitments under the term loan facilities and revolving credit facility. The current interest rate on borrowings under the Credit Agreement is LIBOR plus
1.50%
.
The Credit Agreement contains affirmative and negative covenants and default and acceleration provisions, including a minimum interest coverage ratio and a maximum leverage ratio that change over time. Under one such negative covenant, we are restricted from paying common stock dividends, prepaying certain senior notes, making certain investments, and repurchasing preferred and common equity unless (1) we are not in default under the terms of the Credit Agreement and (2) our senior secured leverage ratio, as defined in the Credit Agreement, does not exceed
2x
. In the event the senior secured leverage ratio exceeds 2x, these payments are subject to a limit of
$200 million
plus an amount equal to a portion of available excess cash flows each fiscal year. Our obligations under the Credit Agreement are secured by the current and future personal property of the Company and its subsidiary guarantors. The maximum leverage ratio in the financial covenants is
4.50x
through September 2019 and
4.25x
from then until maturity.
As of December 31, 2018 and 2017
, $30 million and
$95 million
were drawn under the revolving credit facility with an interest rate of
3.9%
and
3.1%
, respectively. Amounts drawn as of December 31, 2018 and 2017 exclude
$37.4 million
and
$35.4 million
, respectively,
utilized under the letter of credit subfacility, which were being used in the ordinary course of business to secure workers’ compensation and other insurance coverages and for general corporate purposes. Currently, there are no undrawn term loan commitments under the Credit Agreement. The 2017 amendment to our existing credit agreement included a net repayment of approximately
$110 million
to our existing term loan facility.
2016 Credit Agreement
In June and July 2015, we amended our existing credit agreement (the “2016 Credit Agreement”). The 2016 Credit Agreement provided for
$500 million
of term loan commitments and a
$600 million
revolving credit facility, with a
$260 million
letter of credit subfacility and a swingline loan subfacility, all of which would have matured in July 2020. Outstanding term loan borrowings were payable in equal consecutive quarterly installments, commencing on March 31, 2016, of
1.25%
of the aggregate principal amount of the term loans outstanding as of December 31, 2015, with the remainder due at maturity. The 2016 Credit Agreement contained the same affirmative and negative covenants and default and acceleration provisions as the Credit Agreement, except for the senior secured leverage ratio couldn’t exceed 1.75x under the negative covenant described above and the maximum leverage ratio was 4.50x through June 2017 and 4.25x from then until maturity.
Bonds Payable—
Nonconvertible Notes
The Company’s 2023 Notes, 2024 Notes, and 2025 Notes (collectively, the “Senior Notes”) were issued pursuant to an indenture (the “Base Indenture”) dated as of December 1, 2009 between us and The Bank of Nova Scotia Trust Company of New York, as trustee (the “Original Trustee”), as supplemented by each Senior Notes respective supplemental indenture (together with the Base Indenture, the “Indenture”), among us, the Subsidiary Guarantors (as defined in the Indenture), and the Original Trustee. The Original Trustee notified us of its intention to discontinue its corporate trust operations and, accordingly, to resign upon the appointment of a successor trustee. Effective July 29, 2013, Wells Fargo Bank, National Association, was
F-45
|
Encompass Health Corporation and Subsidiaries
Notes to Consolidated Financial Statements
|
||
appointed as successor trustee under the Indenture.
Pursuant to the terms of the Indenture, the Senior Notes are jointly and severally guaranteed on a senior, unsecured basis by all of our existing and future subsidiaries that guarantee borrowings under our Credit Agreement and other capital markets debt (see
Note 20,
Condensed Consolidating Financial Information
). The Senior Notes are senior, unsecured obligations of Encompass Health and rank equally with our other senior indebtedness, senior to any of our subordinated indebtedness, and effectively junior to our secured indebtedness to the extent of the value of the collateral securing such indebtedness.
Upon the occurrence of a change in control (as defined in the Indenture), each holder of the Senior Notes may require us to repurchase all or a portion of the notes in cash at a price equal to
101%
of the principal amount of the Senior Notes to be repurchased, plus accrued and unpaid interest.
The Senior Notes contain covenants and default and acceleration provisions, that, among other things, limit our and certain of our subsidiaries’ ability to (1) incur additional debt, (2) make certain restricted payments, (3) consummate specified asset sales, (4) incur liens, and (5) merge or consolidate with another person.
2023 Notes
In March 2015, we issued
$300 million
of 5
.125% Senior Notes due 2023 (“the 2023 Notes”)
at par, which resulted in approximately
$295 million
in net proceeds from the public offering. The 2023 Notes mature on March 15, 2023 and bear interest at a per annum rate of
5.125%
.
Inclusive of financing costs, the effective interest rate on the 2023 Notes is
5.4%
.
Interest on the 2023 Notes is payable semiannually in arrears on March 15 and September 15, beginning on September 15, 2015.
We may redeem the 2023 Notes, in whole or in part, at any time on or after March 15, 2018 at the redemption prices set forth below:
|
Period
|
Redemption Price*
|
||
|
2018
|
103.844
|
%
|
|
|
2019
|
102.563
|
%
|
|
|
2020
|
101.281
|
%
|
|
|
2021 and thereafter
|
100.000
|
%
|
|
* Expressed in percentage of principal amount
2024 Notes
In September 2012, we completed a public offering of
$275 million
aggregate principal amount of the 5.75% Senior Notes due 2024 (“the 2024 Notes”) at par. In September 2014, we issued an additional
$175 million
of the 2024 Notes at a price of
103.625%
of the principal amount, in January 2015, we issued an additional
$400 million
of the 2024 Notes at a price of
102%
of the principal amount, and in August 2015, we issued an additional
$350 million
of our 2024 Notes at a price of
100.5%
of the principal amount. The 2024 Notes mature on
November 1, 2024
and bear interest at a per annum rate of
5.75%
. Inclusive of premiums and financing costs, the effective interest rate on the 2024 Notes is
5.8%
. Interest is payable
semiannually in arrears on May 1 and November 1 of each year.
F-46
|
Encompass Health Corporation and Subsidiaries
Notes to Consolidated Financial Statements
|
||
We may redeem the 2024 Notes, in whole or in part,
at any time on or after November 1, 2017,
at the redemption prices set forth below:
|
Period
|
Redemption
Price*
|
||
|
2018
|
101.917
|
%
|
|
|
2019
|
100.958
|
%
|
|
|
2020 and thereafter
|
100.000
|
%
|
|
* Expressed in percentage of principal amount
2025 Notes
In September 2015, we issued
$350 million
of 5.75% Senior Notes due 2025 (“the 2025 Notes”) at par. The 2025 Notes mature on
September 15, 2025
and bear interest at a per annum rate of
5.75%
. Inclusive of financing costs, the effective interest rate on the 2025 Notes is
6.0%
. Interest on the 2025 Notes is payable semiannually in arrears on March 15 and September 15, beginning on March 15, 2016.
We may redeem the 2025 Notes, in whole or in part, at any time on or after September 15, 2020, at the redemption prices set forth below:
|
Period
|
Redemption
Price*
|
||
|
2020
|
102.875
|
%
|
|
|
2021
|
101.917
|
%
|
|
|
2022
|
100.958
|
%
|
|
|
2023 and thereafter
|
100.000
|
%
|
|
* Expressed in percentage of principal amount
Former 2022 Notes
In March and May 2016, we redeemed
$50.0 million
of the outstanding principal amount of our former senior notes due 2022 (“the Former 2022 Notes”). Pursuant to the terms of the Former 2022 Notes, these optional redemptions were made at a price of
103.875%
, which resulted in a total cash outlay of approximately
$104 million
. We used cash on hand and capacity under our revolving credit facility to fund these redemptions.
In September 2016, we redeemed the remaining outstanding principal amount of
$76 million
of the Former 2022 Notes. Pursuant to the terms of these notes, these optional redemptions were made at a price of
102.583%
, which resulted in a total cash outlay of approximately
$78 million
. We used cash on hand and capacity under our revolving credit facility to fund this redemption. The Former 2022 Notes would have matured on September 15, 2022. Inclusive of premiums and financing costs, the effective interest rate on the Former 2022 Notes was
7.9%
. Interest was payable semiannually in arrears on March 15 and September 15 of each year.
Convertible Notes
Former Convertible Senior Subordinated Notes Due 2043
In November 2013, we exchanged
$320 million
in aggregate principal amount of newly issued 2.00% Convertible Senior Subordinated Notes due 2043 (the “Former Convertible Notes”) for
257,110
shares of our outstanding
6.50%
Series A Convertible Perpetual Preferred Stock. Our Former Convertible Notes were issued pursuant to an indenture dated November 18, 2013 (the “ Former Convertible Notes Indenture”) between us and Wells Fargo Bank, National Association, as trustee and conversion agent.
F-47
|
Encompass Health Corporation and Subsidiaries
Notes to Consolidated Financial Statements
|
||
In May 2017, we provided notice of our intent to exercise our early redemption option on the $320 million outstanding principal amount of the Former Convertible Notes. Pursuant to the Former Convertible Notes Indenture, the holders had the right to convert their Former Convertible Notes into shares of our common stock at a conversion rate of
27.2221 shares per $1,000 principal amount
of Former Convertible Notes, which rate was increased by the make-whole premium. Holders of
$319.4 million
in principal of these Former Convertible Notes chose to convert their notes to shares of our common stock resulting in the issuance of
8.9 million
shares from treasury stock, including
0.2 million
shares due to the make-whole premium. Approximately
8.6 million
of these shares were included in
Diluted earnings per share attributable to Encompass Health common shareholders
as of March 31, 2017
.
We redeemed the remaining
$0.6 million
in principal at par in cash. The redemption and all conversions occurred in the second quarter of 2017. The Former Convertible Notes would have matured on December 1, 2043. Inclusive of discounts and financing costs, the effective interest rate on the Former Convertible Notes was
6.0%
. Interest was payable semiannually in arrears in cash on June 1 and December 1 of each year.
Other Notes Payable—
Our notes payable consist of the following (in millions):
|
As of December 31,
|
|||||||||
|
2018
|
2017
|
Interest Rates
|
|||||||
|
Sale/leaseback transactions involving real estate accounted for as financings
|
$
|
82.8
|
|
$
|
77.7
|
|
7.5% to 11.2%
|
||
|
Construction of a new hospital
|
14.6
|
|
4.4
|
|
LIBOR + 2.5%;
4.8% to 5.0% and 3.9% as of December 31, 2018 and 2017, respectively |
||||
|
Other
|
6.8
|
|
0.2
|
|
4.3% to 6.8%
|
||||
|
Other notes payable
|
$
|
104.2
|
|
$
|
82.3
|
|
|||
See also
Note 6,
Property and Equipment
.
Capital Lease Obligations—
We engage in a significant number of leasing transactions including real estate and other equipment utilized in operations. Leases meeting certain accounting criteria have been recorded as an asset and liability at the lower of fair value or the net present value of the aggregate future minimum lease payments at the inception of the lease. Interest rates used in computing the net present value of the lease payments generally ranged from
2%
to
11%
based on our incremental borrowing rate at the inception of the lease. Our leasing transactions include arrangements for vehicles with major finance companies who retain ownership in the equipment during the term of the lease and with a variety of both small and large real estate owners.
|
10.
|
Self-Insured Risks
:
|
We insure a substantial portion of our professional liability, general liability, and workers’ compensation risks through a self-insured retention program (“SIR”) underwritten by our consolidated wholly owned offshore captive insurance subsidiary, HCS, Ltd., which we fund via regularly scheduled premium payments. HCS is an insurance company licensed by the Cayman Island Monetary Authority. We use HCS to fund our first layer of insurance coverage up to approximately
$30 million
for annual aggregate losses associated with general and professional liability risks. Workers’ compensation exposures are capped on a per claim basis. Risks in excess of specified limits per claim and in excess of our aggregate SIR amount are covered by unrelated commercial carriers.
F-48
|
Encompass Health Corporation and Subsidiaries
Notes to Consolidated Financial Statements
|
||
The following table presents the changes in our self-insurance reserves for the years ended
December 31, 2018
,
2017
, and
2016
(in millions):
|
2018
|
2017
|
2016
|
|||||||||
|
Balance at beginning of period, gross
|
$
|
171.0
|
|
$
|
171.4
|
|
$
|
142.1
|
|
||
|
Less: Reinsurance receivables
|
(39.9
|
)
|
(41.4
|
)
|
(26.6
|
)
|
|||||
|
Balance at beginning of period, net
|
131.1
|
|
130.0
|
|
115.5
|
|
|||||
|
Increase for the provision of current year claims
|
47.1
|
|
44.7
|
|
43.5
|
|
|||||
|
Decrease for the provision of prior year claims
|
(8.7
|
)
|
(3.0
|
)
|
(0.1
|
)
|
|||||
|
Expenses related to discontinued operations
|
(0.2
|
)
|
(0.5
|
)
|
(0.4
|
)
|
|||||
|
Payments related to current year claims
|
(7.0
|
)
|
(5.0
|
)
|
(5.0
|
)
|
|||||
|
Payments related to prior year claims
|
(27.0
|
)
|
(35.1
|
)
|
(23.5
|
)
|
|||||
|
Balance at end of period, net
|
135.3
|
|
131.1
|
|
130.0
|
|
|||||
|
Add: Reinsurance receivables
|
25.6
|
|
39.9
|
|
41.4
|
|
|||||
|
Balance at end of period, gross
|
$
|
160.9
|
|
$
|
171.0
|
|
$
|
171.4
|
|
||
As of
December 31, 2018
and
2017
,
$41.3 million
and
$60.9 million
, respectively, of these reserves are included in
Other current liabilities
in our consolidated balance sheets.
Provisions for these risks are based primarily upon actuarially determined estimates. These reserves represent the unpaid portion of the estimated ultimate cost of all reported and unreported losses incurred through the respective consolidated balance sheet dates. The reserves are estimated using individual case-basis valuations and actuarial analyses. Those estimates are subject to the effects of trends in loss severity and frequency. The estimates are continually reviewed and adjustments are recorded as experience develops or new information becomes known. The changes to the estimated ultimate loss amounts are included in current operating results.
The reserves for these self-insured risks cover approximately
1,000
individual claims at
December 31, 2018
and
2017
, and estimates for potential unreported claims. The time period required to resolve these claims can vary depending upon the jurisdiction, the nature, and the form of resolution of the claims. The estimation of the timing of payments beyond a year can vary significantly. Although considerable variability is inherent in reserve estimates, management believes the reserves for losses and loss expenses are adequate; however, there can be no assurance the ultimate liability will not exceed management’s estimates.
|
11.
|
Redeemable Noncontrolling Interests
:
|
The following is a summary of the activity related to our
Redeemable noncontrolling interests
(in millions):
|
For the Year Ended December 31,
|
|||||||||||
|
2018
|
2017
|
2016
|
|||||||||
|
Balance at beginning of period
|
$
|
220.9
|
|
$
|
138.3
|
|
$
|
121.1
|
|
||
|
Net income attributable to noncontrolling interests
|
13.9
|
|
17.9
|
|
14.1
|
|
|||||
|
Distributions declared
|
(8.6
|
)
|
(4.6
|
)
|
(7.8
|
)
|
|||||
|
Contribution to joint venture
|
9.6
|
|
2.3
|
|
—
|
|
|||||
|
Purchase of redeemable noncontrolling interests
|
(65.1
|
)
|
—
|
|
—
|
|
|||||
|
Change in fair value
|
91.0
|
|
67.0
|
|
10.9
|
|
|||||
|
Balance at end of period
|
$
|
261.7
|
|
$
|
220.9
|
|
$
|
138.3
|
|
||
F-49
|
Encompass Health Corporation and Subsidiaries
Notes to Consolidated Financial Statements
|
||
The following table reconciles the net income attributable to nonredeemable
Noncontrolling interests
, as recorded in the shareholders’ equity section of the consolidated balance sheets, and the net income attributable to
Redeemable noncontrolling interests
, as recorded in the mezzanine section of the consolidated balance sheets, to the
Net income attributable to noncontrolling interests
presented in the consolidated statements of operations (in millions):
|
For the Year Ended December 31,
|
|||||||||||
|
2018
|
2017
|
2016
|
|||||||||
|
Net income attributable to nonredeemable noncontrolling interests
|
$
|
69.2
|
|
$
|
61.2
|
|
$
|
56.4
|
|
||
|
Net income attributable to redeemable noncontrolling interests
|
13.9
|
|
17.9
|
|
14.1
|
|
|||||
|
Net income attributable to noncontrolling interests
|
$
|
83.1
|
|
$
|
79.1
|
|
$
|
70.5
|
|
||
On December 31, 2014, we acquired
83.3%
of our home health and hospice business when we purchased EHHI Holdings, Inc. (“EHHI”). In the acquisition, we acquired all of the issued and outstanding equity interests of EHHI, other than equity interests contributed to Encompass Health Home Health Holdings, Inc. (“Holdings”), a subsidiary of Encompass Health and an indirect parent of EHHI, by certain sellers in exchange for shares of common stock of Holdings. Those sellers were members of EHHI management, and they contributed a portion of their shares of common stock of EHHI, valued at approximately
$64 million
on the acquisition date, in exchange for approximately
16.7%
of the outstanding shares of common stock of Holdings. At any time after December 31, 2017, each management investor has the right (but not the obligation) to have his or her shares of Holdings stock repurchased by Encompass Health for a cash purchase price per share equal to the fair value. Specifically, up to one-third of each management investor’s shares of Holdings stock may be sold prior to December 31, 2018; two-thirds of each management investor’s shares of Holdings stock may be sold prior to December 31, 2019; and all of each management investor’s shares of Holdings stock may be sold thereafter. At any time after December 31, 2019, Encompass Health will have the right (but not the obligation) to repurchase all or any portion of the shares of Holdings stock owned by one or more management investors for a cash purchase price per share equal to the fair value. In February 2018, each management investor exercised the right to sell one-third of his or her shares of Holdings stock to Encompass Health, representing approximately
5.6%
of the outstanding shares of the common stock of Holdings. On February 21, 2018, Encompass Health settled the acquisition of those shares upon payment of approximately
$65 million
in cash. As of
December 31, 2018
, the value of those outstanding shares of Holdings was approximately
$223 million
. See also
Note 12,
Fair Value Measurements
.
F-50
|
Encompass Health Corporation and Subsidiaries
Notes to Consolidated Financial Statements
|
||
|
12.
|
Fair Value Measurements
:
|
Our financial assets and liabilities that are measured at fair value on a recurring basis are as follows (in millions):
|
|
|
Fair Value Measurements at Reporting Date Using
|
||||||||||||||||
|
As of December 31, 2018
|
Fair Value
|
Quoted Prices in Active Markets for Identical Assets
(Level 1)
|
Significant Other Observable Inputs
(Level 2)
|
Significant Unobservable Inputs
(Level 3)
|
Valuation Technique
(1)
|
|||||||||||||
|
Other long-term assets:
|
|
|
|
|
|
|
|
|
|
|||||||||
|
Restricted marketable securities
|
$
|
62.0
|
|
$
|
6.4
|
|
$
|
55.6
|
|
$
|
—
|
|
M
|
|||||
|
Redeemable noncontrolling interests
|
261.7
|
|
—
|
|
—
|
|
261.7
|
|
I
|
|||||||||
|
As of December 31, 2017
|
|
|
|
|
|
|
|
|
|
|||||||||
|
Prepaid expenses and other current assets:
|
||||||||||||||||||
|
Current portion of restricted marketable securities
|
$
|
17.8
|
|
$
|
—
|
|
$
|
17.8
|
|
$
|
—
|
|
M
|
|||||
|
Other long-term assets:
|
|
|
|
|
|
|
|
|
|
|||||||||
|
Restricted marketable securities
|
44.2
|
|
—
|
|
44.2
|
|
—
|
|
M
|
|||||||||
|
Redeemable noncontrolling interests
|
220.9
|
|
—
|
|
—
|
|
220.9
|
|
I
|
|||||||||
|
(1)
|
The three valuation techniques are: market approach (M), cost approach (C), and income approach (I).
|
In addition to assets and liabilities recorded at fair value on a recurring basis, we are also required to record assets and liabilities at fair value on a nonrecurring basis. Generally, assets are recorded at fair value on a nonrecurring basis as a result of impairment charges or similar adjustments made to the carrying value of the applicable assets. During the years ended
December 31, 2018
,
2017
, and
2016
, we did not record any gains or losses related to our nonfinancial assets and liabilities that are recognized or disclosed at fair value in the financial statements on a nonrecurring basis as part of our continuing operations.
F-51
|
Encompass Health Corporation and Subsidiaries
Notes to Consolidated Financial Statements
|
||
As discussed in
Note 1,
Summary of Significant Accounting Policies
, “Fair Value Measurements,” the carrying value equals fair value for our financial instruments that are not included in the table below and are classified as current in our consolidated balance sheets. The carrying amounts and estimated fair values for our other financial instruments are presented in the following table (in millions):
|
|
As of December 31, 2018
|
As of December 31, 2017
|
|||||||||||||
|
|
Carrying Amount
|
Estimated Fair Value
|
Carrying Amount
|
Estimated Fair Value
|
|||||||||||
|
Long-term debt:
|
|
|
|
|
|
|
|
|
|||||||
|
Advances under revolving credit facility
|
$
|
30.0
|
|
$
|
30.0
|
|
$
|
95.0
|
|
$
|
95.0
|
|
|||
|
Term loan facilities
|
280.1
|
|
281.3
|
|
294.7
|
|
296.3
|
|
|||||||
|
5.125% Senior Notes due 2023
|
296.6
|
|
298.5
|
|
295.9
|
|
306.8
|
|
|||||||
|
5.75% Senior Notes due 2024
|
1,194.7
|
|
1,200.0
|
|
1,193.9
|
|
1,228.5
|
|
|||||||
|
5.75% Senior Notes due 2025
|
345.0
|
|
339.5
|
|
344.4
|
|
364.9
|
|
|||||||
|
Other notes payable
|
104.2
|
|
104.2
|
|
82.3
|
|
82.3
|
|
|||||||
|
Financial commitments:
|
|
|
|
|
|
|
|
|
|||||||
|
Letters of credit
|
—
|
|
37.4
|
|
—
|
|
35.4
|
|
|||||||
Fair values for our long-term debt and financial commitments are determined using inputs, including quoted prices in nonactive markets, that are observable either directly or indirectly, or
Level 2
inputs within the fair value hierarchy. See
Note 1,
Summary of Significant Accounting Policies
, “Fair Value Measurements” and “Redeemable Noncontrolling Interests.”
|
13.
|
Share-Based Payments
:
|
The Company has awarded employee stock-based compensation in the form of stock options, SARs, and restricted stock awards (“RSAs”) under the terms of share-based incentive plans designed to align employee and executive interests to those of its stockholders. All employee stock-based compensation awarded between January 1, 2015 and May 8, 2016 was issued under the Amended and Restated 2008 Equity Incentive Plan (the “2008 Plan”), a stockholder-approved plan that reserved and provided for the grant of up to
nine million
shares of common stock. This plan allowed the grants of nonqualified stock options, incentive stock options, restricted stock, SARs, performance shares, performance share units, dividend equivalents, restricted stock units (“RSUs”), and/or other stock-based awards. No additional stock-based compensation was or will be issued from the 2008 Plan.
In May 2016, our stockholders approved the 2016 Omnibus Performance Incentive Plan, which reserves and provides for the grant of up to
14,000,000
shares of common stock. All employee stock-based compensation awarded after May 8, 2016 was issued under this plan. This plan allows for the same types of equity grants as the 2008 Plan.
Stock Options—
Under our share-based incentive plans, officers and employees are given the right to purchase shares of Encompass Health common stock at a fixed grant price determined on the day the options are granted. The terms and conditions of the options, including exercise prices and the periods in which options are exercisable, are generally at the discretion of the compensation and human capital committee of our board of directors. However, no options are exercisable beyond
ten years
from the date of grant. Granted options vest over the awards’ requisite service periods, which are generally
three years
.
F-52
|
Encompass Health Corporation and Subsidiaries
Notes to Consolidated Financial Statements
|
||
The fair values of the options granted during the years ended
December 31, 2018
,
2017
, and
2016
have been estimated at the grant date using the Black-Scholes option-pricing model with the following weighted-average assumptions:
|
|
For the Year Ended December 31,
|
|||||||
|
|
2018
|
2017
|
2016
|
|||||
|
Expected volatility
|
29.2
|
%
|
30.5
|
%
|
37.2
|
%
|
||
|
Risk-free interest rate
|
2.7
|
%
|
2.1
|
%
|
1.6
|
%
|
||
|
Expected life (years)
|
7.1
|
|
7.7
|
|
7.5
|
|
||
|
Dividend yield
|
2.2
|
%
|
2.2
|
%
|
2.1
|
%
|
||
The Black-Scholes option-pricing model was developed for use in estimating the fair value of traded options which have no vesting restrictions and are fully transferable. In addition, the Black-Scholes option-pricing model requires the input of highly subjective assumptions, including the expected stock price volatility. We estimate our expected term through an analysis of actual, historical post-vesting exercise, cancellation, and expiration behavior by our employees and projected post-vesting activity of outstanding options. We calculate volatility based on the historical volatility of our common stock over the period commensurate with the expected term of the options. The risk-free interest rate is the implied daily yield currently available on U.S. Treasury issues with a remaining term closely approximating the expected term used as the input to the Black-Scholes option-pricing model. We estimated our dividend yield based on our annual dividend rate and our stock price on the dividend payment dates. Under the Black-Scholes option-pricing model, the weighted-average grant date fair value per share of employee stock options granted during the years ended
December 31, 2018
,
2017
, and
2016
was
$14.57
,
$11.55
, and
$11.55
, respectively.
A summary of our stock option activity and related information is as follows:
|
|
Shares
(In Thousands)
|
Weighted- Average Exercise Price per Share
|
Weighted- Average Remaining Life (Years)
|
Aggregate Intrinsic Value
(In Millions)
|
||||||||
|
Outstanding, December 31, 2017
|
557
|
|
$
|
30.53
|
|
|
|
|||||
|
Granted
|
95
|
|
53.79
|
|
|
|
||||||
|
Exercised
|
(115
|
)
|
27.79
|
|
|
|
||||||
|
Forfeitures
|
—
|
|
—
|
|
|
|
||||||
|
Expirations
|
—
|
|
—
|
|
|
|
||||||
|
Outstanding, December 31, 2018
|
537
|
|
35.22
|
|
5.9
|
$
|
14.2
|
|
||||
|
Exercisable, December 31, 2018
|
317
|
|
27.65
|
|
4.1
|
10.8
|
|
|||||
We recognized approximatel
y
$1.1 million
,
$0.8 million
, and
$1.6 million
of compensation expense related to our stock options for the years ended
December 31, 2018
,
2017
, and
2016
, respectively. As of
December 31, 2018
, there was
$1.6 million
o
f unrecognized compensation cost related to unvested stock options. This cost is expected to be recognized over a weighted-average period
of
21
months. The total intrinsic value of options exercised during the years ended December 31,
2018
,
2017
, and
2016
was
$5.2 million
,
$29.0 million
, and
$9.1 million
, respectively.
Stock Appreciation Rights—
In conjunction with the EHHI acquisition, we granted SARs based on Encompass Health Home Health Holdings, Inc. (“Holdings”) common stock to certain members of EHHI management at closing on December 31, 2014. Under a separate plan, we granted
122,976
SARs that vest based on continued employment and an additional maximum number of
129,124
SARs that vest based on continued employment and the extent of the attainment of a specified 2017 performance measure. The maximum number of performance SARs was achieved. In general terms, half of the SARs of each type will vest on December 31, 2018 with the remainder vesting on December 31, 2019. The SARs that ultimately vest will expire on the tenth
F-53
|
Encompass Health Corporation and Subsidiaries
Notes to Consolidated Financial Statements
|
||
anniversary of the grant date or within a specified period following any earlier termination of employment. Upon exercise, each SAR must be settled for cash in the amount by which the per share fair value of Holdings’ common stock on the exercise date exceeds the per share fair value on the grant date. The fair value of Holdings’ common stock is determined using the product of the trailing 12-month specified performance measure for Holdings and a specified median market price multiple based on a basket of public home health companies and publicly disclosed home health acquisitions with a value of $400 million or more.
The fair value of the SARs granted in conjunction with the EHHI acquisition has been estimated using the Black-Scholes option-pricing model with the following weighted-average assumptions:
|
As of December 31,
|
|||||
|
2018
|
2017
|
||||
|
Expected volatility
|
27.1
|
%
|
28.7
|
%
|
|
|
Risk-free interest rate
|
2.6
|
%
|
1.9
|
%
|
|
|
Expected life (years)
|
1.3
|
|
2.1
|
|
|
|
Dividend yield
|
—
|
%
|
—
|
%
|
|
We did not include a dividend payment as part of our pricing model because Holdings currently does not pay dividends on its common stock. Under the Black-Scholes option-pricing model, the weighted-average fair value per share of SARs granted in conjunction with the EHHI acquisition was
$419.28
and
$199.41
as of
December 31, 2018
and
2017
, respectively. As of
December 31, 2018
, the fair value of the SARs is approximately
$87 million
, of which approximately
$48 million
is included in
Other current liabilities
and approximately
$39 million
is included in
Other long-term liabilities
in the consolidated balance sheet.
We recognized approximately
$56.2 million
,
$26.0 million
, and
$5.8 million
of compensation expense related to our SARs for the years ended
December 31, 2018
,
2017
and
2016
, respectively. As of
December 31, 2018
, there was
$9.7 million
of unrecognized compensation cost related to unvested SARs. This cost is expected to be recognized over a weighted-average period of
12
months.
The remaining unrecognized compensation expense for our SARs may vary each reporting period based on changes in both operational performance and the specified median market multiple. As of
December 31, 2018
,
231,092
SARs were outstanding.
Restricted Stock—
The RSAs granted in
2018
,
2017
, and
2016
included service-based awards and performance-based awards (that also included a service requirement). These awards generally vest over a three-year requisite service period. For RSAs with a service and/or performance requirement, the fair value of the RSA is determined by the closing price of our common stock on the grant date.
A summary of our issued restricted stock awards is as follows (share information in thousands):
|
|
Shares
|
Weighted-Average Grant Date Fair Value
|
||||
|
Nonvested shares at December 31, 2017
|
673
|
|
$
|
40.90
|
|
|
|
Granted
|
687
|
|
37.61
|
|
||
|
Vested
|
(439
|
)
|
42.60
|
|
||
|
Forfeited
|
(14
|
)
|
40.00
|
|
||
|
Nonvested shares at December 31, 2018
|
907
|
|
37.61
|
|
||
The weighted-average grant-date fair value of restricted stock granted during the years ended
December 31, 2017
and
2016
was
$42.85
and
$33.56
per share, respectively. We recognized approximate
ly
$27.1 million
,
$19.6 million
, and
$18.7 million
of compensation expense related to our restricted stock awards for the years ended
December 31, 2018
,
2017
, and
2016
,
F-54
|
Encompass Health Corporation and Subsidiaries
Notes to Consolidated Financial Statements
|
||
respectively. As of
December 31, 2018
, there was
$29.9 million
of unrecognized compensation expense related to unvested restricted stock. This cost is expected to be recognized over a weighted-average period of
20
months. T
he remaining unrecognized compensation expense for the performance-based awards may vary each reporting period based on changes in the expected achievement of performance measures. The total fair value of shares vested during the years ended December 31,
2018
,
2017
, and
2016
wa
s
$22.1 million
,
$17.7 million
, and
$24.3 million
, respectively. We accrue dividends on outstanding RSAs which are paid upon vesting.
Nonemployee Stock-Based Compensation Plans—
During the years ended
December 31, 2018
,
2017
, and
2016
, we provided incentives to our nonemployee members of our board of directors through the issuance of RSUs out of our share-based incentive plans. RSUs are fully vested when awarded and receive dividend equivalents in the form of additional RSUs upon the payment of a cash dividend on our common stock. During the years ended
December 31, 2018
,
2017
, and
2016
, we
issued
24,771
,
27,594
, and
32,031
RSUs, respectively, with a fair value of
$62.88
,
$47.30
, and
$40.75
, respectively, per unit. We recognized approximately
$1.6 million
,
$1.3 million
, and
$1.3 million
, respectively, of compensation expense upon their issuance in
2018
,
2017
, and
2016
. There was
no
unrecognized compensation related to unvested shares as of
December 31, 2018
.
During the years ended
2018
,
2017
, and
2016
, we issued an a
dditional
8,045
,
9,968
, and
10,248
, respectively, of RSUs as dividend equivalents. As of
December 31, 2018
,
504,512
RSUs were ou
tstanding.
|
14.
|
Employee Benefit Plans
:
|
Substantially all Encompass Health hospital employees are eligible to enroll in Encompass Health-sponsored healthcare plans, including coverage for medical and dental benefits. Our primary healthcare plans are national plans administered by third-party administrators. We are self-insured for these plans. During
2018
,
2017
, and
2016
, costs associated with these plans, net of amounts paid by employees, approximated
$134.9 million
,
$120.8 million
, and
$119.0 million
, respectively.
The Encompass Health Retirement Investment Plan is a qualified 401(k) savings plan. The plan allows eligible employees to contribute up to
100%
of their pay on a pre-tax basis into their individual retirement account in the plan subject to the normal maximum limits set annually by the Internal Revenue Service. Encompass Health’s employer matching contribution is
50% of the first 6% of each participant’s elective deferrals
. All contributions to the plan are in the form of cash. Employees who are at least
21
years of age are eligible to participate in the plan. Employer contributions vest
100%
after
three
years of service. Participants are always fully vested in their own contributions.
Employer contributions to the Encompass Health Retirement Investment Plan approximated
$19.8 million
,
$18.2 million
, and
$16.6 million
in
2018
,
2017
, and
2016
, respectively. In
2018
,
2017
, and
2016
, approximately
$2.4 million
,
$1.4 million
, and
$0.6 million
, respectively, from the plan’s forfeiture account were used to fund the matching contributions in accordance with the terms of the plan.
Senior Management Bonus Program—
We maintain a Senior Management Bonus Program to reward senior management for performance based on a combination of corporate or regional goals and individual goals. The corporate and regional goals are approved on an annual basis by our board of directors as part of our routine budgeting and financial planning process. The individual goals, which are weighted according to importance, are determined between each participant and his or her immediate supervisor. The program applies to persons who join the Company in, or are promoted to, senior management positions. In
2019
, we expect to pay approximately
$20.4 million
under the program for the year ended
December 31, 2018
. In March
2018
and February
2017
, we paid
$14.7 million
and
$11.2 million
, respectively, under the program for the years ended
December 31, 2017
and
2016
.
|
15.
|
Income Taxes
:
|
On December 22, 2017, the US enacted the 2017 Tax Cuts and Jobs Act (the “Tax Act”). The Tax Act, which is commonly referred to as “US tax reform,” significantly changes US corporate income tax laws by, among other things, reducing the US corporate income tax rate from 35% to 21% starting in 2018. As a result, we recorded a net benefit of
$13.6 million
during the fourth quarter of 2017. This amount, which is included in
Provision for income tax expense
in the
F-55
|
Encompass Health Corporation and Subsidiaries
Notes to Consolidated Financial Statements
|
||
consolidated statement of operations, consists of three components: (i) a
$5.8 million
credit resulting from the remeasurement of our net federal deferred tax assets based on the new lower corporate income tax rate, (ii) a
$13.8 million
credit resulting from the remeasurement of our net state deferred tax assets as a result of the decreased federal benefit implicit in the new lower corporate income tax rate, and (iii) a
$5.8 million
charge resulting from the remeasurement of our net valuation allowances for state NOLs as a result of the decreased federal benefit implicit in the new lower corporate income tax rate. In addition, we adopted the Tax Act’s provisions allowing for 100% bonus depreciation on qualifying assets placed in service after September 27, 2017, which resulted in additional bonus depreciation deductions of
$8.8 million
in the fourth quarter of 2017. Certain amounts related to the impact of the Tax Act have been revised due to a correction of an error in our deferred tax assets. See
Note 1,
Summary of Significant Accounting Policies
, “Revision of Previously Issued Financial Statements,” for additional information on this revision.
The significant components of the
Provision for income tax expense
related to continuing operations are as follows (in millions):
|
|
For the Year Ended December 31,
|
||||||||||
|
|
2018
|
2017
|
2016
|
||||||||
|
Current:
|
|
|
|
||||||||
|
Federal
|
$
|
103.8
|
|
$
|
72.2
|
|
$
|
16.1
|
|
||
|
State and other
|
24.2
|
|
12.8
|
|
14.9
|
|
|||||
|
Total current expense
|
128.0
|
|
85.0
|
|
31.0
|
|
|||||
|
Deferred:
|
|
|
|
|
|
|
|||||
|
Federal
|
(13.7
|
)
|
58.4
|
|
130.5
|
|
|||||
|
State and other
|
4.6
|
|
2.4
|
|
2.4
|
|
|||||
|
Total deferred expense
|
(9.1
|
)
|
60.8
|
|
132.9
|
|
|||||
|
Total income tax expense related to continuing operations
|
$
|
118.9
|
|
$
|
145.8
|
|
$
|
163.9
|
|
||
A reconciliation of differences between the federal income tax at statutory rates and our actual income tax expense on our income from continuing operations, which include federal, state, and other income taxes, is presented below:
|
|
For the Year Ended December 31,
|
|||||||
|
|
2018
|
2017
|
2016
|
|||||
|
Tax expense at statutory rate
|
21.0
|
%
|
35.0
|
%
|
35.0
|
%
|
||
|
Increase (decrease) in tax rate resulting from:
|
|
|
|
|
|
|
||
|
State and other income taxes, net of federal tax benefit
|
4.5
|
%
|
3.5
|
%
|
3.8
|
%
|
||
|
(Decrease) increase in valuation allowance
|
(0.4
|
)%
|
0.4
|
%
|
0.1
|
%
|
||
|
Nondeductible government, class action, and related settlements
|
2.7
|
%
|
—
|
%
|
—
|
%
|
||
|
Noncontrolling interests
|
(3.2
|
)%
|
(4.6
|
)%
|
(4.4
|
)%
|
||
|
Share-based windfall tax benefits
|
(0.4
|
)%
|
(1.8
|
)%
|
—
|
%
|
||
|
Tax Act
|
—
|
%
|
(2.8
|
)%
|
—
|
%
|
||
|
Other, net
|
(0.1
|
)%
|
(0.3
|
)%
|
(0.5
|
)%
|
||
|
Income tax expense
|
24.1
|
%
|
29.4
|
%
|
34.0
|
%
|
||
The
Provision for income tax expense
in 2018 was greater than the federal statutory rate primarily due to:
(1) state and other income tax expense and (2) nondeductible settlements offset by (3) the impact of noncontrolling interests. See
Note 1,
Summary of Significant Accounting Policies
, “Income Taxes,” for a discussion of the allocation of income or loss related to pass-through entities, which is referred to as the impact of noncontrolling interests in this discussion.
The
Provision for income tax expense
in 2017 was less than the federal statutory rate primarily due to: (1) the impact of noncontrolling interests, (2) the
F-56
|
Encompass Health Corporation and Subsidiaries
Notes to Consolidated Financial Statements
|
||
impact of the Tax Act and (3) share-based windfall tax benefits offset by (4) state and other income tax expense. The
Provision for income tax expense
in 2016 was less than the federal statutory rate primarily due to: (1) the impact of noncontrolling interests offset by (2) state and other income tax expense.
Deferred income taxes recognize the net tax effects of temporary differences between the carrying amounts of assets and liabilities for financial reporting purposes and amounts used for income tax purposes and the impact of available NOLs. The significant components of our deferred tax assets and liabilities are presented in the following table (in millions):
|
|
As of December 31,
|
||||||
|
|
2018
|
2017
|
|||||
|
Deferred income tax assets:
|
|
|
|||||
|
Net operating loss
|
$
|
66.0
|
|
$
|
77.3
|
|
|
|
Property, net
|
30.8
|
|
36.3
|
|
|||
|
Insurance reserve
|
16.8
|
|
19.9
|
|
|||
|
Stock-based compensation
|
33.0
|
|
19.5
|
|
|||
|
Revenue reserves
|
6.1
|
|
14.0
|
|
|||
|
Other accruals
|
22.5
|
|
20.4
|
|
|||
|
Tax credits
|
4.7
|
|
2.8
|
|
|||
|
Other
|
0.6
|
|
0.5
|
|
|||
|
Total deferred income tax assets
|
180.5
|
|
190.7
|
|
|||
|
Less: Valuation allowance
|
(33.7
|
)
|
(35.8
|
)
|
|||
|
Net deferred income tax assets
|
146.8
|
|
154.9
|
|
|||
|
Deferred income tax liabilities:
|
|
|
|
|
|||
|
Deferred revenue
|
—
|
|
(28.9
|
)
|
|||
|
Intangibles
|
(88.5
|
)
|
(80.0
|
)
|
|||
|
Carrying value of partnerships
|
(15.2
|
)
|
(11.4
|
)
|
|||
|
Other
|
(0.2
|
)
|
(0.2
|
)
|
|||
|
Total deferred income tax liabilities
|
(103.9
|
)
|
(120.5
|
)
|
|||
|
Net deferred income tax assets
|
$
|
42.9
|
|
$
|
34.4
|
|
|
We have state NOLs of
$66.0 million
that expire in various amounts at varying times through
2031
. For the years ended December 31,
2018
,
2017
, and
2016
, the net changes in our valuation allowance were
$2.1 million
,
($7.9) million
, and
($0.3) million
, respectively. The decrease in our valuation allowance in 2018 related primarily to expirations of state net operating losses. The increase in our valuation allowance in 2017 related primarily to the impact of remeasuring our state NOL deferred tax assets and their corresponding valuation allowances pursuant to the Tax Act. The increase in our valuation allowance in 2016 related primarily to the valuation of our tax credits.
As of December 31,
2018
, we have a remaining valuation allowance of
$33.7 million
. This valuation allowance remains recorded due to uncertainties regarding our ability to utilize a portion of our state NOLs and other credits before they expire. The amount of the valuation allowance has been determined for each tax jurisdiction based on the weight of all available evidence including management’s estimates of taxable income for each jurisdiction in which we operate over the periods in which the related deferred tax assets will be recoverable. It is possible we may be required to increase or decrease our valuation allowance at some future time if our forecast of future earnings varies from actual results on a consolidated basis or in the applicable state tax jurisdictions, or if the timing of future tax deductions or credit utilizations differs from our expectations.
During the third quarter of 2016, we filed a non-automatic tax accounting method change related to billings denied under pre-payment claims reviews conducted by certain of our Medicare Administrative Contractors. In March 2017, the IRS approved our request resulting in additional cash tax benefits of approximately
$51.3 million
through December 31, 2017. These benefits are expected to reverse as pre-payment claims denials are settled and collected. This change did not have a
F-57
|
Encompass Health Corporation and Subsidiaries
Notes to Consolidated Financial Statements
|
||
material impact on our effective tax rate. The Tax Act included revisions to Internal Revenue Code §451 that may eliminate this deferral of revenue for tax purposes. We are currently evaluating this provision of the Tax Act and its future impact on the method change we received in March 2017.
As of January 1,
2016
, total remaining gross unrecognized tax benefits were
$2.9 million
, all of which would have affected our effective tax rate if recognized. The amount of unrecognized tax benefits did not change significantly during
2016
. Total remaining gross unrecognized tax benefits were
$2.8 million
as of December 31,
2016
, all of which would have affected our effective tax rate if recognized. The amount of unrecognized tax benefits decreased
$2.5 million
during 2017, primarily related to the favorable settlement of a federal interest claim. Total remaining gross unrecognized tax benefits were
$0.3 million
as of December 31,
2017
, all of which would have affected our effective tax rate if recognized. The amount of unrecognized tax benefits did not change significantly during
2018
. Total remaining gross unrecognized tax benefits were
$0.9 million
as of December 31,
2018
, all of which would affect our effective tax rate if recognized.
A reconciliation of the beginning and ending liability for unrecognized tax benefits is as follows (in millions):
|
|
Gross Unrecognized Income Tax Benefits
|
Accrued Interest and Penalties
|
|||||
|
January 1, 2016
|
$
|
2.9
|
|
$
|
—
|
|
|
|
Gross amount of increases in unrecognized tax benefits related to prior periods
|
0.3
|
|
—
|
|
|||
|
Gross amount of decreases in unrecognized tax benefits related to prior periods
|
(0.4
|
)
|
—
|
|
|||
|
Gross amount of increases in unrecognized tax benefits related to current period
|
0.1
|
|
—
|
|
|||
|
Gross amount of decreases in unrecognized tax benefits related to current period
|
(0.1
|
)
|
—
|
|
|||
|
December 31, 2016
|
2.8
|
|
—
|
|
|||
|
Gross amount of decreases in unrecognized tax benefits related to prior periods
|
(0.4
|
)
|
—
|
|
|||
|
Decreases in unrecognized tax benefits relating to settlements with taxing authorities
|
(2.1
|
)
|
—
|
|
|||
|
December 31, 2017
|
0.3
|
|
—
|
|
|||
|
Gross amount of increases in unrecognized tax benefits related to prior periods
|
0.8
|
|
0.1
|
|
|||
|
Reductions to unrecognized tax benefits as a result of a lapse of the applicable statute of limitations
|
(0.2
|
)
|
—
|
|
|||
|
December 31, 2018
|
$
|
0.9
|
|
$
|
0.1
|
|
|
Our continuing practice is to recognize interest and penalties related to income tax matters in income tax expense. Interest recorded as part of our income tax provision during
2018
,
2017
, and
2016
was not material. Accrued interest income related to income taxes as of December 31,
2018
and
2017
was not material.
In December 2016, we signed an agreement with the IRS to participate in their Compliance Assurance Process (“CAP”) for the 2017 tax year. CAP is a program in which we and the IRS endeavor to agree on the treatment of significant tax positions prior to the filing of our federal income tax returns. We renewed this agreement in January 2018 for the 2018 tax year and in December 2018 for the 2019 tax year. As a result of these agreements, the IRS is currently examining the 2017, 2018 and 2019 tax years. In May 2018, the IRS issued a no-change Revenue Agent’s Report effectively closing our 2016 tax year audit. The statute of limitations has expired or we have settled federal income tax examinations with the IRS for all tax years through 2016. Our state income tax returns are also periodically examined by various regulatory taxing authorities. We are currently under audit by one state for tax years ranging from 2013 through 2015.
For the tax years that remain open under the applicable statutes of limitations, amounts related to unrecognized tax benefits have been considered by management in its estimate of our potential net recovery of prior years’ income taxes. Based on discussions with taxing authorities, we anticipate
$0.5 million
of our unrecognized tax benefits will be released within the next 12 months.
F-58
|
Encompass Health Corporation and Subsidiaries
Notes to Consolidated Financial Statements
|
||
See also
Note 1,
Summary of Significant Accounting Policies
, “Recent Accounting Pronouncements.”
|
16.
|
Earnings per Common Share
:
|
The following table sets forth the computation of basic and diluted earnings per common share (in millions, except per share amounts):
|
|
For the Year Ended December 31,
|
||||||||||
|
|
2018
|
2017
|
2016
|
||||||||
|
Basic:
|
|||||||||||
|
Numerator:
|
|
|
|
||||||||
|
Income from continuing operations
*
|
$
|
374.3
|
|
$
|
350.6
|
|
$
|
318.1
|
|
||
|
Less: Net income attributable to noncontrolling interests included in continuing operations
|
(83.1
|
)
|
(79.1
|
)
|
(70.5
|
)
|
|||||
|
Less: Income allocated to participating securities
*
|
(0.9
|
)
|
(0.9
|
)
|
(0.8
|
)
|
|||||
|
Income from continuing operations attributable to Encompass Health common shareholders
*
|
290.3
|
|
270.6
|
|
246.8
|
|
|||||
|
Income (loss) from discontinued operations, net of tax, attributable to Encompass Health common shareholders
|
1.1
|
|
(0.4
|
)
|
—
|
|
|||||
|
Net income attributable to Encompass Health common shareholders
*
|
$
|
291.4
|
|
$
|
270.2
|
|
$
|
246.8
|
|
||
|
Denominator:
|
|
|
|
|
|
|
|||||
|
Basic weighted average common shares outstanding
|
97.9
|
|
93.7
|
|
89.1
|
|
|||||
|
Basic earnings per share attributable to Encompass Health common shareholders:
*
|
|
|
|
|
|
|
|||||
|
Continuing operations
|
$
|
2.97
|
|
$
|
2.88
|
|
$
|
2.77
|
|
||
|
Discontinued operations
|
0.01
|
|
—
|
|
—
|
|
|||||
|
Net income
|
$
|
2.98
|
|
$
|
2.88
|
|
$
|
2.77
|
|
||
|
Diluted:
|
|||||||||||
|
Numerator:
|
|||||||||||
|
Income from continuing operations
*
|
$
|
374.3
|
|
$
|
350.6
|
|
$
|
318.1
|
|
||
|
Less: Net income attributable to noncontrolling interests included in continuing operations
|
(83.1
|
)
|
(79.1
|
)
|
(70.5
|
)
|
|||||
|
Add: Interest on convertible debt, net of tax
|
—
|
|
4.6
|
|
9.7
|
|
|||||
|
Add: Loss on extinguishment of convertible debt, net of tax
|
—
|
|
6.2
|
|
—
|
|
|||||
|
Income from continuing operations attributable to Encompass Health common shareholders
*
|
291.2
|
|
282.3
|
|
257.3
|
|
|||||
|
Income (loss) from discontinued operations, net of tax, attributable to Encompass Health common shareholders
|
1.1
|
|
(0.4
|
)
|
—
|
|
|||||
|
Net income attributable to Encompass Health common shareholders
*
|
$
|
292.3
|
|
$
|
281.9
|
|
$
|
257.3
|
|
||
|
Denominator:
|
|
|
|
|
|
|
|||||
|
Diluted weighted average common shares outstanding
|
99.8
|
|
99.3
|
|
99.5
|
|
|||||
|
Diluted earnings per share attributable to Encompass Health common shareholders:
*
|
|
|
|
|
|
|
|||||
|
Continuing operations
|
$
|
2.92
|
|
$
|
2.84
|
|
$
|
2.59
|
|
||
|
Discontinued operations
|
0.01
|
|
—
|
|
—
|
|
|||||
|
Net income
|
$
|
2.93
|
|
$
|
2.84
|
|
$
|
2.59
|
|
||
(*)
2017 amounts have been revised to correct an error in our deferred tax assets as discussed in
Note 1,
Summary of Significant Accounting Policies
, “Revision of Previously Issued Financial Statements.”
F-59
|
Encompass Health Corporation and Subsidiaries
Notes to Consolidated Financial Statements
|
||
The following table sets forth the reconciliation between basic weighted average common shares outstanding and diluted weighted average common shares outstanding (in millions):
|
For the Year Ended December 31,
|
||||||||
|
2018
|
2017
|
2016
|
||||||
|
Basic weighted average common shares outstanding
|
97.9
|
|
93.7
|
|
89.1
|
|
||
|
Convertible senior subordinated notes
|
—
|
|
4.0
|
|
8.5
|
|
||
|
Restricted stock awards, dilutive stock options, and restricted stock units
|
1.9
|
|
1.6
|
|
1.9
|
|
||
|
Diluted weighted average common shares outstanding
|
99.8
|
|
99.3
|
|
99.5
|
|
||
There were no antidilutive options to purchase shares of common stock outstanding as of December 31, 2018. Options to purchase approximately
0.2 million
shares of common stock were outstanding as of December 31, 2017, but were not included in the computation of diluted weighted-average shares because to do so would have been antidilutive.
In February 2014, our board of directors approved an increase in our common stock repurchase authorization from
$200 million
to
$250 million
. The repurchase authorization does not require the repurchase of a specific number of shares, has an indefinite term, and is subject to termination at any time by our board of directors. On July 24, 2018, the Company's board approved resetting the aggregate common stock repurchase authorization to
$250 million
. During
2017
and
2016
, we repurchased
0.9 million
, and
1.7 million
shares of our common stock in the open market for
$38.1 million
, and
$65.6 million
, respectively. There were
no
repurchases of our common stock during 2018.
In July 2015, our board of directors approved an increase in the quarterly cash dividend and declared a dividend of
$0.23
per share. The cash dividend of
$0.23
per common share was declared and paid each quarter through July 2016. In July 2016, our board of directors approved an increase in the quarterly cash dividend on our common stock and declared a dividend of
$0.24
per share. The cash dividend of
$0.24
per common share was declared and paid each quarter through July 2017. In July 2017, our board of directors approved an increase in our quarterly dividend and declared a cash dividend of
$0.25
per share. The cash dividend of
$0.25
per common share was declared and paid in each quarter through July 2018. In July 2018, our board of directors approved an increase in our quarterly dividend and declared a cash dividend of
$0.27
per share. The cash dividend of
$0.27
per common share was declared in July 2018 and October 2018 and paid in October 2018 and January 2019, respectively. As of
December 31, 2018
and
2017
, accrued common stock dividends of
$28.4 million
and
$25.4 million
were included in
Other current liabilities
in our consolidated balance sheet. Future dividend payments are subject to declaration by our board of directors.
On September 30, 2009, we issued
5.0 million
shares of common stock and
8.2 million
common stock warrants in full satisfaction of our obligation to do so under the January 2007 comprehensive settlement of the consolidated securities action brought against us by our stockholders and bondholders. Prior to their expiration on January 17, 2017, the warrants were exercisable at a price of
$41.40
per share by means of a cash or a cashless exercise at the option of the holder. The warrants were not assumed exercised for dilutive shares outstanding because they were antidilutive in 2016.
F-60
|
Encompass Health Corporation and Subsidiaries
Notes to Consolidated Financial Statements
|
||
The following table summarizes information relating to these warrants and their activity through their expiration date (number of warrants in millions):
|
Number of Warrants
|
Weighted Average Exercise Price
|
|||||
|
Common stock warrants outstanding as of December 31, 2016
|
8.2
|
|
$
|
41.40
|
|
|
|
Cashless exercise
|
(6.5
|
)
|
41.40
|
|
||
|
Cash exercise
|
(0.6
|
)
|
41.40
|
|
||
|
Expired
|
(1.1
|
)
|
41.40
|
|
||
|
Common stock warrants outstanding as of January 17, 2017
|
—
|
|
||||
The above exercises resulted in the issuance of
0.7 million
shares of common stock in January 2017. Cash exercises resulted in gross proceeds of
$26.7 million
in January 2017.
See also
Note 9,
Long-term Debt
.
|
17.
|
Contingencies and Other Commitments
:
|
We operate in a highly regulated industry in which healthcare providers are routinely subject to litigation. As a result, various lawsuits, claims, and legal and regulatory proceedings have been and can be expected to be instituted or asserted against us. The resolution of any such lawsuits, claims, or legal and regulatory proceedings could materially and adversely affect our financial position, results of operations, and cash flows in a given period.
Nichols Litigation—
We have been named as a defendant in a lawsuit filed March 28, 2003 by several individual stockholders in the Circuit Court of Jefferson County, Alabama, captioned
Nichols v. HealthSouth Corp
. The plaintiffs allege that we, some of our former officers, and our former investment bank engaged in a scheme to overstate and misrepresent our earnings and financial position. The plaintiffs are seeking compensatory and punitive damages. This case was stayed in the Circuit Court on August 8, 2005. The plaintiffs filed an amended complaint on November 9, 2010 to which we responded with a motion to dismiss filed on December 22, 2010. During a hearing on February 24, 2012, plaintiffs’ counsel indicated his intent to dismiss certain claims against us. Instead, on March 9, 2012, the plaintiffs amended their complaint to include additional securities fraud claims against Encompass Health and add several former officers to the lawsuit. On September 12, 2012, the plaintiffs further amended their complaint to request certification as a class action. One of those named officers has repeatedly attempted to remove the case to federal district court, most recently on December 11, 2012. We filed our latest motion to remand the case back to state court on January 10, 2013. On September 27, 2013, the federal court remanded the case back to state court. On November 25, 2014, the plaintiffs filed another amended complaint to assert new allegations relating to the time period of 1997 to 2002. On December 10, 2014, we filed a motion to dismiss on the grounds the plaintiffs lack standing because their claims are derivative in nature, and the claims are time-barred by the statute of limitations. On May 26, 2016, the court granted our motion to dismiss. The plaintiffs appealed the dismissal of the case to the Supreme Court of Alabama on June 28, 2016. On March 23, 2018, the supreme court reversed the trial court’s dismissal, holding that the plaintiffs’ claims were not derivative or time-barred, and remanded the case for further proceedings. On April 6, 2018, we filed an application for rehearing with the Alabama Supreme Court.
We intend to vigorously defending ourselves in this case. Based on the stage of litigation, review of the current facts and circumstances as we understand them, the nature of the underlying claim, the results of the proceedings to date, and the nature and scope of the defense we continue to mount, we do not believe an adverse judgment or settlement is probable in this matter, and it is also not possible to estimate an amount of loss, if any, or range of possible loss that might result from an adverse judgment or settlement of this case.
F-61
|
Encompass Health Corporation and Subsidiaries
Notes to Consolidated Financial Statements
|
||
Other Litigation—
One
of our hospital subsidiaries was named as a defendant in a lawsuit filed August 12, 2013 by an individual in the Circuit Court of Etowah County, Alabama, captioned
Honts
v. HealthSouth Rehabilitation Hospital of Gadsden, LLC.
The plaintiff alleged that her mother, who died more than three months after being discharged from our hospital, received an unprescribed opiate medication at the hospital. We deny the patient received any such medication, accounted for all the opiates at the hospital and argued the plaintiff established no causal liability between the actions of our staff and her mother’s death. The plaintiff sought recovery for punitive damages. On May 18, 2016, the jury in this case returned a verdict in favor of the plaintiff for
$20.0 million
. On June 17, 2016, we filed a renewed motion for judgment as a matter of law or, in the alternative, a motion for new trial or, in the further alternative, a motion seeking reduction of the damages awarded (collectively, the “post-judgment motions”). The trial court denied the post-judgment motions. We appealed the verdict as well as the rulings on the post-judgment motions to the Supreme Court of Alabama on October 12, 2016. On September 28, 2018, the supreme court reversed the trial court’s judgment and remanded the case for a new trial. On October 12, 2018, the plaintiff filed an application for rehearing with the supreme court, and we filed a brief in opposition to the rehearing application on October 25, 2018.
As a result of the original judgment, we recorded a net charge of
$5.7 million
to
Other operating expenses
in our consolidated statements of operations for the year ended December 31, 2016. As of June 30, 2018, we maintained a liability of
$20.1 million
in
Accrued expenses and other current liabilities
in our condensed consolidated balance sheet with a corresponding receivable of
$15.5 million
in
Other current assets
for the portion of the liability we would expect to be covered through our excess insurance coverages. The portion of this liability that would be a covered claim through our captive insurance subsidiary, HCS, Ltd. is
$6.0 million
.
As a result of the Alabama Supreme Court’s reversal, we reduced the associated liability, and no longer maintain an insurance receivable in our consolidated balance sheet because we do not believe the liability exceeds the retention level. As of December 31, 2018, we maintained a liability included in
Other current liabilities
in our consolidated balance sheet in connection with this matter. We continue to believe in the merits of our defenses and counterarguments, and we intend to vigorously defend ourselves in the re-trial of this case.
Governmental Inquiries and Investigations—
On March 4, 2013, we received document subpoenas from an office of the HHS-OIG addressed to
four
of our hospitals. Those subpoenas also requested complete copies of medical records for
100
patients treated at each of those hospitals between September 2008 and June 2012. The investigation is being conducted by the United States Department of Justice (the “DOJ”). On April 24, 2014, we received document subpoenas relating to an additional
seven
of our hospitals. The new subpoenas reference substantially similar investigation subject matter as the original subpoenas and request materials from the period January 2008 through December 2013.
Two
of the four hospitals addressed in the original set of subpoenas have received supplemental subpoenas to cover this new time period. The most recent subpoenas do not include requests for specific patient files. However, in February 2015, DOJ requested the voluntary production of the medical records of an additional
70
patients, some of whom were treated in hospitals not subject to the subpoenas, and we provided these records. We have not received any subsequent requests for medical records from DOJ.
All of the subpoenas were in connection with an investigation of alleged improper or fraudulent claims submitted to Medicare and Medicaid and requested documents and materials relating to practices, procedures, protocols and policies, of certain pre- and post-admissions activities at these hospitals including, among other things, marketing functions, pre-admission screening, post-admission physician evaluations, patient assessment instruments, individualized patient plans of care, and compliance with the Medicare
60%
rule. Under the Medicare rule commonly referred to as the “
60%
rule,” an inpatient rehabilitation hospital must treat
60%
or more of its patients from at least one of a specified list of medical conditions in order to be reimbursed at the inpatient rehabilitation hospital payment rates, rather than at the lower acute care hospital payment rates.
We have been cooperating fully with DOJ in connection with this investigation. Based on recent discussions with the government as well as the burdens and distractions associated with continuing the investigation and the likely costs of future litigation, we now estimate a settlement value of
$48 million
and have accrued a loss contingency in that amount which is included in
Other current liabilities
in our consolidated balance sheet. Discussions are ongoing, and until they are concluded, there can be no certainty about the nature, timing or likelihood of a settlement.
F-62
|
Encompass Health Corporation and Subsidiaries
Notes to Consolidated Financial Statements
|
||
Other Matters—
The False Claims Act allows private citizens, called “relators,” to institute civil proceedings on behalf of the United States alleging violations of the False Claims Act. These lawsuits, also known as “whistleblower” or “
qui tam
” actions, can involve significant monetary damages, fines, attorneys’ fees and the award of bounties to the relators who successfully prosecute or bring these suits to the government.
Qui tam
cases are sealed at the time of filing, which means knowledge of the information contained in the complaint typically is limited to the relator, the federal government, and the presiding court. The defendant in a
qui tam
action may remain unaware of the existence of a sealed complaint for years. While the complaint is under seal, the government reviews the merits of the case and may conduct a broad investigation and seek discovery from the defendant and other parties before deciding whether to intervene in the case and take the lead on litigating the claims. The court lifts the seal when the government makes its decision on whether to intervene. If the government decides not to intervene, the relator may elect to continue to pursue the lawsuit individually on behalf of the government. It is possible that
qui tam
lawsuits have been filed against us, which suits remain under seal, or that we are unaware of such filings or precluded by existing law or court order from discussing or disclosing the filing of such suits. We may be subject to liability under one or more undisclosed
qui tam
cases brought pursuant to the False Claims Act.
It is our obligation as a participant in Medicare and other federal healthcare programs to routinely conduct audits and reviews of the accuracy of our billing systems and other regulatory compliance matters. As a result of these reviews, we have made, and will continue to make, disclosures to the HHS-OIG and CMS relating to amounts we suspect represent over-payments from these programs, whether due to inaccurate billing or otherwise. Some of these disclosures have resulted in, or may result in, Encompass Health refunding amounts to Medicare or other federal healthcare programs.
Other Commitments—
We are a party to service and other contracts in connection with conducting our business. Minimum amounts due under these agreements are
$45.9 million
in
2019
,
$44.0 million
in
2020
,
$28.1 million
in
2021
,
$9.5 million
in
2022
,
$7.6 million
in
2023
, and
$6.5 million
thereafter. These contracts primarily relate to software licensing and support.
|
18.
|
Segment Reporting
:
|
Our internal financial reporting and management structure is focused on the major types of services provided by Encompass Health. We manage our operations using two operating segments which are also our reportable segments: (1) inpatient rehabilitation and (2) home health and hospice. These reportable operating segments are consistent with information used by our chief executive officer, who is our chief operating decision maker, to assess performance and allocate resources. The following is a brief description of our reportable segments:
|
•
|
Inpatient Rehabilitation
- Our national network of inpatient rehabilitation hospitals stretches across
32
states and Puerto Rico, with a concentration of hospitals in the eastern half of the United States and Texas. As of
December 31, 2018
, we operate
130
inpatient rehabilitation hospitals, including
one
hospital that operates as a joint venture which we account for using the equity method of accounting. We are the sole owner of
85
of these hospitals. We retain
50.0%
to
97.5%
ownership in the remaining
45
jointly owned hospitals. In addition, we manage
five
inpatient rehabilitation units through management contracts. We provide specialized rehabilitative treatment on both an inpatient and outpatient basis. Our inpatient rehabilitation hospitals provide a higher level of rehabilitative care to patients who are recovering from conditions such as stroke and other neurological disorders, cardiac and pulmonary conditions, brain and spinal cord injuries, complex orthopedic conditions, and amputations.
|
|
•
|
Home Health and Hospice
- As of
December 31, 2018
, we provide home health and hospice services in
278
locations across
30
states with concentrations in the Southeast and Texas. In addition,
two
of these agencies operate as joint ventures which we account for using the equity method of accounting. We are the sole owner of
270
of these locations We retain
50.0%
to
81.0%
ownership in the remaining
eight
jointly owned locations. Our home health services include a comprehensive range of Medicare-certified home nursing services to adult patients in need of care. These services include, among others, skilled nursing, physical, occupational, and speech therapy, medical social work, and home health aide services. Our hospice services include in-home services to terminally
|
F-63
|
Encompass Health Corporation and Subsidiaries
Notes to Consolidated Financial Statements
|
||
ill patients and their families to address patients’ physical needs, including pain control and symptom management, and to provide emotional and spiritual support.
The accounting policies of our reportable segments are the same as those described in
Note 1,
Summary of Significant Accounting Policies
. All revenues for our services are generated through external customers. See
Note 1,
Summary of Significant Accounting Policies
, “Net Operating Revenues,” for the payor composition of our revenues. No corporate overhead is allocated to either of our reportable segments. Our chief operating decision maker evaluates the performance of our segments and allocates resources to them based on adjusted earnings before interest, taxes, depreciation, and amortization (“Segment Adjusted EBITDA”).
Selected financial information for our reportable segments is as follows (in millions):
|
Inpatient Rehabilitation
|
Home Health and Hospice
|
||||||||||||||||||||||
|
For the Year Ended December 31,
|
For the Year Ended December 31,
|
||||||||||||||||||||||
|
2018
|
2017
|
2016
|
2018
|
2017
|
2016
|
||||||||||||||||||
|
Net operating revenues
|
$
|
3,346.2
|
|
$
|
3,141.3
|
|
$
|
2,964.1
|
|
$
|
931.1
|
|
$
|
772.6
|
|
$
|
678.5
|
|
|||||
|
Operating expenses:
|
|||||||||||||||||||||||
|
Inpatient rehabilitation:
|
|||||||||||||||||||||||
|
Salaries and benefits
|
1,701.5
|
|
1,603.8
|
|
1,493.4
|
|
—
|
|
—
|
|
—
|
|
|||||||||||
|
Other operating expenses
|
502.3
|
|
462.5
|
|
431.5
|
|
—
|
|
—
|
|
—
|
|
|||||||||||
|
Supplies
|
140.6
|
|
135.7
|
|
128.8
|
|
—
|
|
—
|
|
—
|
|
|||||||||||
|
Occupancy costs
|
63.8
|
|
61.9
|
|
61.2
|
|
—
|
|
—
|
|
—
|
|
|||||||||||
|
Home health and hospice:
|
|||||||||||||||||||||||
|
Cost of services sold (excluding depreciation and amortization)
|
—
|
|
—
|
|
—
|
|
438.4
|
|
363.3
|
|
333.1
|
|
|||||||||||
|
Support and overhead costs
|
—
|
|
—
|
|
—
|
|
323.5
|
|
277.2
|
|
237.2
|
|
|||||||||||
|
2,408.2
|
|
2,263.9
|
|
2,114.9
|
|
761.9
|
|
640.5
|
|
570.3
|
|
||||||||||||
|
Other income
|
(3.6
|
)
|
(4.1
|
)
|
(2.9
|
)
|
(0.5
|
)
|
—
|
|
—
|
|
|||||||||||
|
Equity in net income of nonconsolidated affiliates
|
(7.5
|
)
|
(7.3
|
)
|
(9.1
|
)
|
(1.2
|
)
|
(0.7
|
)
|
(0.7
|
)
|
|||||||||||
|
Noncontrolling interests
|
77.2
|
|
67.6
|
|
64.0
|
|
8.5
|
|
6.9
|
|
6.5
|
|
|||||||||||
|
Segment Adjusted EBITDA
|
$
|
871.9
|
|
$
|
821.2
|
|
$
|
797.2
|
|
$
|
162.4
|
|
$
|
125.9
|
|
$
|
102.4
|
|
|||||
|
Capital expenditures
|
$
|
264.6
|
|
$
|
238.0
|
|
$
|
198.3
|
|
$
|
11.6
|
|
$
|
10.7
|
|
$
|
8.7
|
|
|||||
|
Inpatient Rehabilitation
|
Home Health and Hospice
|
Encompass Health Consolidated
|
|||||||||
|
As of December 31, 2018
|
|||||||||||
|
Total assets
|
$
|
3,900.9
|
|
$
|
1,314.6
|
|
$
|
5,175.0
|
|
||
|
Investments in and advances to nonconsolidated affiliates
|
9.5
|
|
2.7
|
|
12.2
|
|
|||||
|
As of December 31, 2017
|
|||||||||||
|
Total assets
*
|
$
|
3,759.9
|
|
$
|
1,150.5
|
|
$
|
4,864.5
|
|
||
|
Investments in and advances to nonconsolidated affiliates
|
9.3
|
|
2.6
|
|
11.9
|
|
|||||
(*)
2017 amounts have been revised to correct an error in our deferred tax assets as discussed in
Note 1,
Summary of Significant Accounting Policies
, “Revision of Previously Issued Financial Statements.”
F-64
|
Encompass Health Corporation and Subsidiaries
Notes to Consolidated Financial Statements
|
||
Segment reconciliations (in millions):
|
For the Year Ended December 31,
|
|||||||||||
|
2018
|
2017
|
2016
|
|||||||||
|
Total segment Adjusted EBITDA
|
$
|
1,034.3
|
|
$
|
947.1
|
|
$
|
899.6
|
|
||
|
General and administrative expenses
|
(220.2
|
)
|
(171.7
|
)
|
(133.4
|
)
|
|||||
|
Depreciation and amortization
|
(199.7
|
)
|
(183.8
|
)
|
(172.6
|
)
|
|||||
|
Loss on disposal of assets
|
(5.7
|
)
|
(4.6
|
)
|
(0.7
|
)
|
|||||
|
Government, class action, and related settlements
|
(52.0
|
)
|
—
|
|
—
|
|
|||||
|
Professional fees
—
accounting, tax, and legal
|
—
|
|
—
|
|
(1.9
|
)
|
|||||
|
Loss on early extinguishment of debt
|
—
|
|
(10.7
|
)
|
(7.4
|
)
|
|||||
|
Interest expense and amortization of debt discounts and fees
|
(147.3
|
)
|
(154.4
|
)
|
(172.1
|
)
|
|||||
|
Net income attributable to noncontrolling interests
|
83.1
|
|
79.1
|
|
70.5
|
|
|||||
|
SARs mark-to-market impact on noncontrolling interests
|
2.6
|
|
—
|
|
—
|
|
|||||
|
Change in fair market value of equity securities
|
(1.9
|
)
|
—
|
|
—
|
|
|||||
|
Tax reform impact on noncontrolling interests
|
—
|
|
(4.6
|
)
|
—
|
|
|||||
|
Income from continuing operations before income tax expense
|
$
|
493.2
|
|
$
|
496.4
|
|
$
|
482.0
|
|
||
|
As of December 31, 2018
|
As of December 31, 2017
|
||||||
|
Total assets for reportable segments
*
|
$
|
5,215.5
|
|
$
|
4,910.4
|
|
|
|
Reclassification of noncurrent deferred income tax liabilities to net noncurrent deferred income tax assets
|
(40.5
|
)
|
(45.9
|
)
|
|||
|
Total consolidated assets
*
|
$
|
5,175.0
|
|
$
|
4,864.5
|
|
|
(*)
2017 amounts have been revised to correct an error in our deferred tax assets as discussed in
Note 1,
Summary of Significant Accounting Policies
, “Revision of Previously Issued Financial Statements.”
Additional detail regarding the revenues of our operating segments by service line follows (in millions):
|
For the Year Ended December 31,
|
|||||||||||
|
2018
|
2017
|
2016
|
|||||||||
|
Inpatient rehabilitation:
|
|||||||||||
|
Inpatient
|
$
|
3,247.9
|
|
$
|
3,039.3
|
|
$
|
2,853.9
|
|
||
|
Outpatient and other
|
98.3
|
|
102.0
|
|
110.2
|
|
|||||
|
Total inpatient rehabilitation
|
3,346.2
|
|
3,141.3
|
|
2,964.1
|
|
|||||
|
Home health and hospice:
|
|||||||||||
|
Home health
|
814.6
|
|
702.4
|
|
630.8
|
|
|||||
|
Hospice
|
116.5
|
|
70.2
|
|
47.7
|
|
|||||
|
Total home health and hospice
|
931.1
|
|
772.6
|
|
678.5
|
|
|||||
|
Total net operating revenues
|
$
|
4,277.3
|
|
$
|
3,913.9
|
|
$
|
3,642.6
|
|
||
F-65
|
Encompass Health Corporation and Subsidiaries
Notes to Consolidated Financial Statements
|
||
|
19.
|
Quarterly Data (Unaudited)
:
|
|
|
2018
|
|||||||||||||||||||
|
|
First
|
Second
|
Third
|
Fourth
|
Total
|
|||||||||||||||
|
|
(In Millions, Except Per Share Data)
|
|||||||||||||||||||
|
Net operating revenues
|
$
|
1,046.0
|
|
$
|
1,067.7
|
|
$
|
1,067.6
|
|
$
|
1,096.0
|
|
$
|
4,277.3
|
|
|||||
|
Operating earnings
(a)
|
150.0
|
|
157.3
|
|
154.5
|
|
93.4
|
|
555.2
|
|
||||||||||
|
Provision for income tax expense
|
30.0
|
|
29.3
|
|
30.2
|
|
29.4
|
|
118.9
|
|
||||||||||
|
Income from continuing operations
|
105.7
|
|
113.0
|
|
109.4
|
|
46.2
|
|
374.3
|
|
||||||||||
|
(Loss) income from discontinued operations, net of tax
|
(0.5
|
)
|
0.2
|
|
(0.1
|
)
|
1.5
|
|
1.1
|
|
||||||||||
|
Net income
|
105.2
|
|
113.2
|
|
109.3
|
|
47.7
|
|
375.4
|
|
||||||||||
|
Less: Net income attributable to noncontrolling interests
|
(21.4
|
)
|
(21.4
|
)
|
(20.7
|
)
|
(19.6
|
)
|
(83.1
|
)
|
||||||||||
|
Net income attributable to Encompass Health
|
$
|
83.8
|
|
$
|
91.8
|
|
$
|
88.6
|
|
$
|
28.1
|
|
$
|
292.3
|
|
|||||
|
Earnings per common share:
|
||||||||||||||||||||
|
Basic earnings per share attributable to Encompass Health common shareholders:
(b)
|
||||||||||||||||||||
|
Continuing operations
|
$
|
0.86
|
|
$
|
0.93
|
|
$
|
0.90
|
|
$
|
0.27
|
|
$
|
2.97
|
|
|||||
|
Discontinued operations
|
(0.01
|
)
|
—
|
|
—
|
|
0.02
|
|
0.01
|
|
||||||||||
|
Net income
|
$
|
0.85
|
|
$
|
0.93
|
|
$
|
0.90
|
|
$
|
0.29
|
|
$
|
2.98
|
|
|||||
|
Diluted earnings per share attributable to Encompass Health common shareholders:
(b)
|
||||||||||||||||||||
|
Continuing operations
|
$
|
0.85
|
|
$
|
0.92
|
|
$
|
0.89
|
|
$
|
0.26
|
|
$
|
2.92
|
|
|||||
|
Discontinued operations
|
(0.01
|
)
|
—
|
|
—
|
|
0.02
|
|
0.01
|
|
||||||||||
|
Net income
|
$
|
0.84
|
|
$
|
0.92
|
|
$
|
0.89
|
|
$
|
0.28
|
|
$
|
2.93
|
|
|||||
|
(a)
|
We define operating earnings as income from continuing operations attributable to Encompass Health before (1) loss on early extinguishment of debt; (2) interest expense and amortization of debt discounts and fees; (3) other income; and (4) income tax expense.
|
|
(b)
|
Per share amounts may not sum due to the weighted average common shares outstanding during each quarter compared to the weighted average common shares outstanding during the entire year.
|
F-66
|
Encompass Health Corporation and Subsidiaries
Notes to Consolidated Financial Statements
|
||
|
|
2017
|
|||||||||||||||||||
|
|
First
|
Second
|
Third
|
Fourth
|
Total
|
|||||||||||||||
|
|
(In Millions, Except Per Share Data)
|
|||||||||||||||||||
|
Net operating revenues
|
$
|
957.1
|
|
$
|
966.4
|
|
$
|
981.6
|
|
$
|
1,008.8
|
|
$
|
3,913.9
|
|
|||||
|
Operating earnings
(a)
|
147.1
|
|
141.3
|
|
145.2
|
|
144.7
|
|
578.3
|
|
||||||||||
|
Provision for income tax expense
(b)
|
39.7
|
|
28.6
|
|
43.1
|
|
34.4
|
|
145.8
|
|
||||||||||
|
Income from continuing operations
(b)
|
84.7
|
|
79.2
|
|
85.2
|
|
101.5
|
|
350.6
|
|
||||||||||
|
(Loss) income from discontinued operations, net of tax
|
(0.3
|
)
|
0.2
|
|
(0.1
|
)
|
(0.2
|
)
|
(0.4
|
)
|
||||||||||
|
Net income
(b)
|
84.4
|
|
79.4
|
|
85.1
|
|
101.3
|
|
350.2
|
|
||||||||||
|
Less: Net income attributable to noncontrolling interests
|
(17.6
|
)
|
(16.4
|
)
|
(19.2
|
)
|
(25.9
|
)
|
(79.1
|
)
|
||||||||||
|
Net income attributable to Encompass Health
(b)
|
$
|
66.8
|
|
$
|
63.0
|
|
$
|
65.9
|
|
$
|
75.4
|
|
$
|
271.1
|
|
|||||
|
Earnings per common share:
|
||||||||||||||||||||
|
Basic earnings per share attributable to Encompass Health common shareholders:
(b) (c)
|
||||||||||||||||||||
|
Continuing operations
|
$
|
0.75
|
|
$
|
0.70
|
|
$
|
0.67
|
|
$
|
0.77
|
|
$
|
2.88
|
|
|||||
|
Discontinued operations
|
—
|
|
—
|
|
—
|
|
—
|
|
—
|
|
||||||||||
|
Net income
|
$
|
0.75
|
|
$
|
0.70
|
|
$
|
0.67
|
|
$
|
0.77
|
|
$
|
2.88
|
|
|||||
|
Diluted earnings per share attributable to Encompass Health common shareholders:
(b) (c) (d)
|
||||||||||||||||||||
|
Continuing operations
|
$
|
0.70
|
|
$
|
0.70
|
|
$
|
0.67
|
|
$
|
0.76
|
|
$
|
2.84
|
|
|||||
|
Discontinued operations
|
—
|
|
—
|
|
—
|
|
—
|
|
—
|
|
||||||||||
|
Net income
|
$
|
0.70
|
|
$
|
0.70
|
|
$
|
0.67
|
|
$
|
0.76
|
|
$
|
2.84
|
|
|||||
|
(a)
|
We define operating earnings as income from continuing operations attributable to Encompass Health before (1) loss on early extinguishment of debt; (2) interest expense and amortization of debt discounts and fees; (3) other income; and (4) income tax expense.
|
|
(b)
|
During the preparation of our December 31, 2018 financial statements, an error was identified in the accounting for deferred tax assets as described further in
Note 1,
Summary of Significant Accounting Policies
, “Revision of Previously Issued Financial Statements.” The financial results included in the table above reflects the revision of our quarterly results for the three months and year ended December 31, 2017 to reflect the $14.8 million reduction in our
Provision for income tax expense
as shown in the table below. The revision of unaudited financial statements for the quarter and year-to-date periods ended March 31, June 30, and September 30, 2018 related to the statement of shareholders’ equity, will be affected in connection with the filing of our 2019 Form 10-Qs.
|
|
As Reported
|
Adjustment
|
As Revised
|
|||||||||
|
For the Three Months Ended December 31, 2017
|
(In Millions, Except Per Share Data)
|
||||||||||
|
Provision for income tax expense
|
$
|
49.2
|
|
$
|
(14.8
|
)
|
$
|
34.4
|
|
||
|
Income from continuing operations
|
86.7
|
|
14.8
|
|
101.5
|
|
|||||
|
Net income
|
86.5
|
|
14.8
|
|
101.3
|
|
|||||
|
Net income attributable to Encompass Health
|
60.6
|
|
14.8
|
|
75.4
|
|
|||||
|
Basic earnings per share attributable to Encompass Health common shareholders
|
0.62
|
|
0.15
|
|
0.77
|
|
|||||
|
Diluted earnings per share attributable to Encompass Health common shareholders
|
0.61
|
|
0.15
|
|
0.76
|
|
|||||
|
(c)
|
Per share amounts may not sum due to the weighted average common shares outstanding during each quarter compared to the weighted average common shares outstanding during the entire year.
|
F-67
|
Encompass Health Corporation and Subsidiaries
Notes to Consolidated Financial Statements
|
||
|
(d)
|
For the second quarter of 2017, adding back the loss on extinguishment of convertible debt, net of tax to our
Income from continuing operations attributable to Encompass Health common shareholders
causes a per share increase when calculating diluted earnings per common share resulting in an antidilutive per share amount. Therefore, basic and diluted earnings per common share are the same for the three months ended June 30, 2017.
|
|
20.
|
Condensed Consolidating Financial Information
:
|
The accompanying condensed consolidating financial information has been prepared and presented pursuant to SEC Regulation S-X, Rule 3-10, “Financial Statements of Guarantors and Issuers of Guaranteed Securities Registered or Being Registered.” Each of the subsidiary guarantors is
100%
owned by Encompass Health, and all guarantees are full and unconditional and joint and several, subject to certain customary conditions for release. Encompass Health’s investments in its consolidated subsidiaries, as well as guarantor subsidiaries’ investments in nonguarantor subsidiaries and nonguarantor subsidiaries’ investments in guarantor subsidiaries, are presented under the equity method of accounting with the related investment presented within the line items
Intercompany receivable
and
Intercompany payable
in the accompanying condensed consolidating balance sheets.
The terms of our credit agreement allow us to declare and pay cash dividends on our common stock so long as: (1) we are not in default under our credit agreement and (2) our senior secured leverage ratio (as defined in our credit agreement) remains less than or equal to
2
x. The terms of our senior note indenture allow us to declare and pay cash dividends on our common stock so long as (1) we are not in default, (2) the consolidated coverage ratio (as defined in the indenture) exceeds
2
x or we are otherwise allowed under the indenture to incur debt, and (3) we have capacity under the indenture’s restricted payments covenant to declare and pay dividends. See
Note 9,
Long-term Debt
.
Periodically, certain wholly owned subsidiaries of Encompass Health make dividends or distributions of available cash and/or intercompany receivable balances to their parents. In addition, Encompass Health makes contributions to certain wholly owned subsidiaries. When made, these dividends, distributions, and contributions impact the
Intercompany receivable
,
Intercompany payable
, and
Encompass Health shareholders’ equity
line items in the accompanying condensed consolidating balance sheet but have no impact on the consolidated financial statements of Encompass Health Corporation.
During the preparation of our December 31, 2018 financial statements, an error was identified in our deferred tax assets as discussed in
Note 1,
Summary of Significant Accounting Policies
, “Revision of Previously Issued Financial Statements.” We have revised our supplemental guarantor condensed consolidating statements of operations for the year ended December 31, 2017, and condensed consolidating balance sheet as of December 31, 2017, to reflect the impact of such revision. The errors did not impact the total cash flows from operating, investing, or financing activities in the condensed consolidating statement of cash flows. The impact on our condensed consolidating financial statements is as follows:
|
Condensed Consolidating Statement of Operations
|
|||||||||||
|
For the Year Ended December 31, 2017
|
|||||||||||
|
|
As Reported
|
Adjustment
|
As Revised
|
||||||||
|
Encompass Health Corporation
|
(In Millions)
|
||||||||||
|
Provision for income tax expense
|
$
|
(90.2
|
)
|
$
|
(14.8
|
)
|
$
|
(105.0
|
)
|
||
|
Income from continuing operations
|
256.7
|
|
14.8
|
|
271.5
|
|
|||||
|
Net income
|
256.3
|
|
14.8
|
|
271.1
|
|
|||||
|
Net income attributable to Encompass Health
|
256.3
|
|
14.8
|
|
271.1
|
|
|||||
|
Comprehensive income
|
256.2
|
|
14.8
|
|
271.0
|
|
|||||
|
Comprehensive income attributable to Encompass Health
|
256.2
|
|
14.8
|
|
271.0
|
|
|||||
F-68
|
Encompass Health Corporation and Subsidiaries
Notes to Consolidated Financial Statements
|
||
|
Condensed Consolidating Balance Sheet
|
|||||||||||
|
As of December 31, 2017
|
|||||||||||
|
As Reported
|
Adjustment
|
As Revised
|
|||||||||
|
Encompass Health Corporation
|
(In Millions)
|
||||||||||
|
Deferred income tax assets
|
$
|
97.4
|
|
$
|
(29.2
|
)
|
$
|
68.2
|
|
||
|
Total assets
|
3,681.2
|
|
(29.2
|
)
|
3,652.0
|
|
|||||
|
Encompass Health shareholders’ equity
|
1,181.7
|
|
(29.2
|
)
|
1,152.5
|
|
|||||
|
Total shareholders’ equity
|
1,181.7
|
|
(29.2
|
)
|
1,152.5
|
|
|||||
|
Total liabilities and shareholders’ equity
|
3,681.2
|
|
(29.2
|
)
|
3,652.0
|
|
|||||
F-69
|
Encompass Health Corporation and Subsidiaries
Notes to Consolidated Financial Statements
Condensed Consolidating Statement of Operations
|
||
|
|
For the Year Ended December 31, 2018
|
||||||||||||||||||
|
|
Encompass Health Corporation
|
Guarantor Subsidiaries
|
Nonguarantor Subsidiaries
|
Eliminating Entries
|
Encompass Health Consolidated
|
||||||||||||||
|
|
(In Millions)
|
||||||||||||||||||
|
Net operating revenues
|
$
|
21.0
|
|
$
|
2,325.6
|
|
$
|
2,061.0
|
|
$
|
(130.3
|
)
|
$
|
4,277.3
|
|
||||
|
Operating expenses:
|
|
|
|
|
|
|
|
|
|
|
|||||||||
|
Salaries and benefits
|
49.5
|
|
1,120.0
|
|
1,205.9
|
|
(21.4
|
)
|
2,354.0
|
|
|||||||||
|
Other operating expenses
|
37.9
|
|
340.7
|
|
256.3
|
|
(49.8
|
)
|
585.1
|
|
|||||||||
|
Occupancy costs
|
1.9
|
|
95.5
|
|
39.7
|
|
(59.1
|
)
|
78.0
|
|
|||||||||
|
Supplies
|
—
|
|
94.7
|
|
64.0
|
|
—
|
|
158.7
|
|
|||||||||
|
General and administrative expenses
|
161.0
|
|
—
|
|
59.2
|
|
—
|
|
220.2
|
|
|||||||||
|
Depreciation and amortization
|
14.3
|
|
106.0
|
|
79.4
|
|
—
|
|
199.7
|
|
|||||||||
|
Government, class action, and related settlements
|
52.0
|
|
—
|
|
—
|
|
—
|
|
52.0
|
|
|||||||||
|
Total operating expenses
|
316.6
|
|
1,756.9
|
|
1,704.5
|
|
(130.3
|
)
|
3,647.7
|
|
|||||||||
|
Interest expense and amortization of debt discounts and fees
|
124.2
|
|
20.6
|
|
27.7
|
|
(25.2
|
)
|
147.3
|
|
|||||||||
|
Other income
|
(22.4
|
)
|
(1.0
|
)
|
(4.0
|
)
|
25.2
|
|
(2.2
|
)
|
|||||||||
|
Equity in net income of nonconsolidated affiliates
|
—
|
|
(7.5
|
)
|
(1.2
|
)
|
—
|
|
(8.7
|
)
|
|||||||||
|
Equity in net income of consolidated affiliates
|
(465.0
|
)
|
(65.8
|
)
|
—
|
|
530.8
|
|
—
|
|
|||||||||
|
Management fees
|
(153.1
|
)
|
112.7
|
|
40.4
|
|
—
|
|
—
|
|
|||||||||
|
Income from continuing operations before income tax (benefit) expense
|
220.7
|
|
509.7
|
|
293.6
|
|
(530.8
|
)
|
493.2
|
|
|||||||||
|
Provision for income tax (benefit) expense
|
(70.5
|
)
|
136.4
|
|
53.0
|
|
—
|
|
118.9
|
|
|||||||||
|
Income from continuing operations
|
291.2
|
|
373.3
|
|
240.6
|
|
(530.8
|
)
|
374.3
|
|
|||||||||
|
Income from discontinued operations, net of tax
|
1.1
|
|
—
|
|
—
|
|
—
|
|
1.1
|
|
|||||||||
|
Net income
|
292.3
|
|
373.3
|
|
240.6
|
|
(530.8
|
)
|
375.4
|
|
|||||||||
|
Less: Net income attributable to noncontrolling interests
|
—
|
|
—
|
|
(83.1
|
)
|
—
|
|
(83.1
|
)
|
|||||||||
|
Net income attributable to Encompass Health
|
$
|
292.3
|
|
$
|
373.3
|
|
$
|
157.5
|
|
$
|
(530.8
|
)
|
$
|
292.3
|
|
||||
|
Comprehensive income
|
$
|
292.3
|
|
$
|
373.3
|
|
$
|
240.6
|
|
$
|
(530.8
|
)
|
$
|
375.4
|
|
||||
|
Comprehensive income attributable to Encompass Health
|
$
|
292.3
|
|
$
|
373.3
|
|
$
|
157.5
|
|
$
|
(530.8
|
)
|
$
|
292.3
|
|
||||
F-70
|
Encompass Health Corporation and Subsidiaries
Notes to Consolidated Financial Statements
Condensed Consolidating Statement of Operations
|
||
|
|
For the Year Ended December 31, 2017
|
||||||||||||||||||
|
|
Encompass Health Corporation
|
Guarantor Subsidiaries
|
Nonguarantor Subsidiaries
|
Eliminating Entries
|
Encompass Health Consolidated
|
||||||||||||||
|
|
(In Millions)
|
||||||||||||||||||
|
Net operating revenues
|
$
|
21.3
|
|
$
|
2,228.0
|
|
$
|
1,790.7
|
|
$
|
(126.1
|
)
|
$
|
3,913.9
|
|
||||
|
Operating expenses:
|
|
|
|
|
|
|
|
|
|
|
|||||||||
|
Salaries and benefits
|
34.7
|
|
1,077.4
|
|
1,063.5
|
|
(21.0
|
)
|
2,154.6
|
|
|||||||||
|
Other operating expenses
|
32.8
|
|
321.8
|
|
225.6
|
|
(48.6
|
)
|
531.6
|
|
|||||||||
|
Occupancy costs
|
1.9
|
|
93.4
|
|
34.7
|
|
(56.5
|
)
|
73.5
|
|
|||||||||
|
Supplies
|
—
|
|
93.2
|
|
56.1
|
|
—
|
|
149.3
|
|
|||||||||
|
General and administrative expenses
|
143.7
|
|
—
|
|
28.0
|
|
—
|
|
171.7
|
|
|||||||||
|
Depreciation and amortization
|
8.8
|
|
103.4
|
|
71.6
|
|
—
|
|
183.8
|
|
|||||||||
|
Total operating expenses
|
221.9
|
|
1,689.2
|
|
1,479.5
|
|
(126.1
|
)
|
3,264.5
|
|
|||||||||
|
Loss on early extinguishment of debt
|
10.7
|
|
—
|
|
—
|
|
—
|
|
10.7
|
|
|||||||||
|
Interest expense and amortization of debt discounts and fees
|
130.5
|
|
21.1
|
|
23.8
|
|
(21.0
|
)
|
154.4
|
|
|||||||||
|
Other (income) loss
|
(21.7
|
)
|
0.2
|
|
(3.6
|
)
|
21.0
|
|
(4.1
|
)
|
|||||||||
|
Equity in net income of nonconsolidated affiliates
|
—
|
|
(7.3
|
)
|
(0.7
|
)
|
—
|
|
(8.0
|
)
|
|||||||||
|
Equity in net income of consolidated affiliates
|
(341.6
|
)
|
(40.3
|
)
|
—
|
|
381.9
|
|
—
|
|
|||||||||
|
Management fees
|
(145.0
|
)
|
108.3
|
|
36.7
|
|
—
|
|
—
|
|
|||||||||
|
Income from continuing operations before income tax (benefit) expense
|
166.5
|
|
456.8
|
|
255.0
|
|
(381.9
|
)
|
496.4
|
|
|||||||||
|
Provision for income tax (benefit) expense
|
(105.0
|
)
|
182.3
|
|
68.5
|
|
—
|
|
145.8
|
|
|||||||||
|
Income from continuing operations
|
271.5
|
|
274.5
|
|
186.5
|
|
(381.9
|
)
|
350.6
|
|
|||||||||
|
Loss from discontinued operations, net of tax
|
(0.4
|
)
|
—
|
|
—
|
|
—
|
|
(0.4
|
)
|
|||||||||
|
Net income
|
271.1
|
|
274.5
|
|
186.5
|
|
(381.9
|
)
|
350.2
|
|
|||||||||
|
Less: Net income attributable to noncontrolling interests
|
—
|
|
—
|
|
(79.1
|
)
|
—
|
|
(79.1
|
)
|
|||||||||
|
Net income attributable to Encompass Health
|
$
|
271.1
|
|
$
|
274.5
|
|
$
|
107.4
|
|
$
|
(381.9
|
)
|
$
|
271.1
|
|
||||
|
Comprehensive income
|
$
|
271.0
|
|
$
|
274.5
|
|
$
|
186.5
|
|
$
|
(381.9
|
)
|
$
|
350.1
|
|
||||
|
Comprehensive income attributable to Encompass Health
|
$
|
271.0
|
|
$
|
274.5
|
|
$
|
107.4
|
|
$
|
(381.9
|
)
|
$
|
271.0
|
|
||||
F-71
|
Encompass Health Corporation and Subsidiaries
Notes to Consolidated Financial Statements
Condensed Consolidating Statement of Operations
|
||
|
|
For the Year Ended December 31, 2016
|
||||||||||||||||||
|
|
Encompass Health Corporation
|
Guarantor Subsidiaries
|
Nonguarantor Subsidiaries
|
Eliminating Entries
|
Encompass Health Consolidated
|
||||||||||||||
|
|
(In Millions)
|
||||||||||||||||||
|
Net operating revenues
|
$
|
20.1
|
|
$
|
2,129.9
|
|
$
|
1,610.5
|
|
$
|
(117.9
|
)
|
$
|
3,642.6
|
|
||||
|
Operating expenses:
|
|
|
|
|
|
|
|
|
|
|
|||||||||
|
Salaries and benefits
|
45.5
|
|
1,006.1
|
|
952.6
|
|
(18.3
|
)
|
1,985.9
|
|
|||||||||
|
Other operating expenses
|
27.4
|
|
309.8
|
|
199.7
|
|
(46.3
|
)
|
490.6
|
|
|||||||||
|
Occupancy costs
|
2.9
|
|
89.8
|
|
31.9
|
|
(53.3
|
)
|
71.3
|
|
|||||||||
|
Supplies
|
—
|
|
89.9
|
|
50.1
|
|
—
|
|
140.0
|
|
|||||||||
|
General and administrative expenses
|
126.7
|
|
—
|
|
6.7
|
|
—
|
|
133.4
|
|
|||||||||
|
Depreciation and amortization
|
9.4
|
|
102.8
|
|
60.4
|
|
—
|
|
172.6
|
|
|||||||||
|
Total operating expenses
|
211.9
|
|
1,598.4
|
|
|
1,301.4
|
|
|
(117.9
|
)
|
2,993.8
|
|
|||||||
|
Loss on early extinguishment of debt
|
7.4
|
|
—
|
|
—
|
|
—
|
|
7.4
|
|
|||||||||
|
Interest expense and amortization of debt discounts and fees
|
147.3
|
|
21.6
|
|
23.1
|
|
(19.9
|
)
|
172.1
|
|
|||||||||
|
Other income
|
(19.6
|
)
|
(0.4
|
)
|
(2.8
|
)
|
19.9
|
|
(2.9
|
)
|
|||||||||
|
Equity in net income of nonconsolidated affiliates
|
—
|
|
(9.0
|
)
|
(0.8
|
)
|
—
|
|
(9.8
|
)
|
|||||||||
|
Equity in net income of consolidated affiliates
|
(347.2
|
)
|
(41.2
|
)
|
—
|
|
388.4
|
|
—
|
|
|||||||||
|
Management fees
|
(136.2
|
)
|
103.1
|
|
33.1
|
|
—
|
|
—
|
|
|||||||||
|
Income from continuing operations before income tax (benefit) expense
|
156.5
|
|
457.4
|
|
|
256.5
|
|
|
(388.4
|
)
|
482.0
|
|
|||||||
|
Provision for income tax (benefit) expense
|
(91.1
|
)
|
182.6
|
|
72.4
|
|
—
|
|
163.9
|
|
|||||||||
|
Income from continuing operations
|
247.6
|
|
274.8
|
|
|
184.1
|
|
|
(388.4
|
)
|
318.1
|
|
|||||||
|
Income from discontinued operations, net of tax
|
—
|
|
—
|
|
—
|
|
—
|
|
—
|
|
|||||||||
|
Net income
|
247.6
|
|
274.8
|
|
|
184.1
|
|
|
(388.4
|
)
|
318.1
|
|
|||||||
|
Less: Net income attributable to noncontrolling interests
|
—
|
|
—
|
|
(70.5
|
)
|
—
|
|
(70.5
|
)
|
|||||||||
|
Net income attributable to Encompass Health
|
$
|
247.6
|
|
$
|
274.8
|
|
|
$
|
113.6
|
|
|
$
|
(388.4
|
)
|
$
|
247.6
|
|
||
|
Comprehensive income
|
$
|
247.6
|
|
$
|
274.8
|
|
$
|
184.1
|
|
$
|
(388.4
|
)
|
$
|
318.1
|
|
||||
|
Comprehensive income attributable to Encompass Health
|
$
|
247.6
|
|
$
|
274.8
|
|
$
|
113.6
|
|
$
|
(388.4
|
)
|
$
|
247.6
|
|
||||
F-72
|
Encompass Health Corporation and Subsidiaries
Notes to Consolidated Financial Statements
Condensed Consolidating Balance Sheet
|
||
|
|
As of December 31, 2018
|
||||||||||||||||||
|
|
Encompass Health Corporation
|
Guarantor Subsidiaries
|
Nonguarantor Subsidiaries
|
Eliminating Entries
|
Encompass Health Consolidated
|
||||||||||||||
|
|
(In Millions)
|
||||||||||||||||||
|
Assets
|
|
|
|
|
|
||||||||||||||
|
Current assets:
|
|
|
|
|
|
||||||||||||||
|
Cash and cash equivalents
|
$
|
41.5
|
|
$
|
2.9
|
|
$
|
24.8
|
|
$
|
—
|
|
$
|
69.2
|
|
||||
|
Restricted cash
|
—
|
|
—
|
|
59.0
|
|
—
|
|
59.0
|
|
|||||||||
|
Accounts receivable, net
|
—
|
|
268.1
|
|
199.6
|
|
—
|
|
467.7
|
|
|||||||||
|
Prepaid expenses and other current assets
|
36.3
|
|
17.5
|
|
31.2
|
|
(18.8
|
)
|
66.2
|
|
|||||||||
|
Total current assets
|
77.8
|
|
288.5
|
|
|
314.6
|
|
|
(18.8
|
)
|
662.1
|
|
|||||||
|
Property and equipment, net
|
123.9
|
|
1,015.3
|
|
495.6
|
|
—
|
|
1,634.8
|
|
|||||||||
|
Goodwill
|
—
|
|
854.6
|
|
1,246.2
|
|
—
|
|
2,100.8
|
|
|||||||||
|
Intangible assets, net
|
21.4
|
|
94.6
|
|
327.4
|
|
—
|
|
443.4
|
|
|||||||||
|
Deferred income tax assets
|
47.9
|
|
28.9
|
|
—
|
|
(33.9
|
)
|
42.9
|
|
|||||||||
|
Other long-term assets
|
47.9
|
|
101.3
|
|
141.8
|
|
—
|
|
291.0
|
|
|||||||||
|
Intercompany notes receivable
|
535.3
|
|
—
|
|
—
|
|
(535.3
|
)
|
—
|
|
|||||||||
|
Intercompany receivable and investments in consolidated affiliates
|
2,904.4
|
|
515.7
|
|
—
|
|
(3,420.1
|
)
|
—
|
|
|||||||||
|
Total assets
|
$
|
3,758.6
|
|
$
|
2,898.9
|
|
|
$
|
2,525.6
|
|
|
$
|
(4,008.1
|
)
|
$
|
5,175.0
|
|
||
|
Liabilities and Shareholders’ Equity
|
|
|
|
|
|
|
|
|
|
|
|||||||||
|
Current liabilities:
|
|
|
|
|
|
|
|
|
|
|
|||||||||
|
Current portion of long-term debt
|
$
|
35.0
|
|
$
|
6.8
|
|
$
|
11.5
|
|
$
|
(17.5
|
)
|
$
|
35.8
|
|
||||
|
Accounts payable
|
8.9
|
|
46.1
|
|
35.0
|
|
—
|
|
90.0
|
|
|||||||||
|
Accrued payroll
|
35.0
|
|
68.5
|
|
84.9
|
|
—
|
|
188.4
|
|
|||||||||
|
Accrued interest payable
|
22.3
|
|
2.2
|
|
0.2
|
|
(0.3
|
)
|
24.4
|
|
|||||||||
|
Other current liabilities
|
154.5
|
|
4.8
|
|
175.6
|
|
(1.0
|
)
|
333.9
|
|
|||||||||
|
Total current liabilities
|
255.7
|
|
128.4
|
|
|
307.2
|
|
|
(18.8
|
)
|
672.5
|
|
|||||||
|
Long-term debt, net of current portion
|
2,188.7
|
|
235.2
|
|
54.7
|
|
—
|
|
2,478.6
|
|
|||||||||
|
Intercompany notes payable
|
—
|
|
—
|
|
535.3
|
|
(535.3
|
)
|
—
|
|
|||||||||
|
Self-insured risks
|
16.1
|
|
—
|
|
103.5
|
|
—
|
|
119.6
|
|
|||||||||
|
Other long-term liabilities
|
21.4
|
|
17.1
|
|
80.9
|
|
(33.8
|
)
|
85.6
|
|
|||||||||
|
Intercompany payable
|
—
|
|
—
|
|
44.7
|
|
(44.7
|
)
|
—
|
|
|||||||||
|
|
2,481.9
|
|
380.7
|
|
|
1,126.3
|
|
|
(632.6
|
)
|
3,356.3
|
|
|||||||
|
Commitments and contingencies
|
|
|
|
|
|
|
|
|
|
|
|||||||||
|
Redeemable noncontrolling interests
|
—
|
|
—
|
|
261.7
|
|
—
|
|
261.7
|
|
|||||||||
|
Shareholders’ equity:
|
|
|
|
|
|
|
|
|
|
|
|||||||||
|
Encompass Health shareholders’ equity
|
1,276.7
|
|
2,518.2
|
|
857.3
|
|
(3,375.5
|
)
|
1,276.7
|
|
|||||||||
|
Noncontrolling interests
|
—
|
|
—
|
|
280.3
|
|
—
|
|
280.3
|
|
|||||||||
|
Total shareholders’ equity
|
1,276.7
|
|
2,518.2
|
|
|
1,137.6
|
|
|
(3,375.5
|
)
|
1,557.0
|
|
|||||||
|
Total liabilities and shareholders’ equity
|
$
|
3,758.6
|
|
$
|
2,898.9
|
|
|
$
|
2,525.6
|
|
|
$
|
(4,008.1
|
)
|
$
|
5,175.0
|
|
||
F-73
|
Encompass Health Corporation and Subsidiaries
Notes to Consolidated Financial Statements
Condensed Consolidating Balance Sheet
|
||
|
|
As of December 31, 2017
|
||||||||||||||||||
|
|
Encompass Health Corporation
|
Guarantor Subsidiaries
|
Nonguarantor Subsidiaries
|
Eliminating Entries
|
Encompass Health Consolidated
|
||||||||||||||
|
|
(In Millions)
|
||||||||||||||||||
|
Assets
|
|
|
|
|
|
||||||||||||||
|
Current assets:
|
|
|
|
|
|
||||||||||||||
|
Cash and cash equivalents
|
$
|
34.3
|
|
$
|
2.9
|
|
$
|
17.2
|
|
$
|
—
|
|
$
|
54.4
|
|
||||
|
Restricted cash
|
—
|
|
—
|
|
62.4
|
|
—
|
|
62.4
|
|
|||||||||
|
Accounts receivable, net
|
—
|
|
285.2
|
|
186.9
|
|
—
|
|
472.1
|
|
|||||||||
|
Prepaid expenses and other current assets
|
61.4
|
|
21.7
|
|
48.7
|
|
(18.5
|
)
|
113.3
|
|
|||||||||
|
Total current assets
|
95.7
|
|
309.8
|
|
|
315.2
|
|
|
(18.5
|
)
|
702.2
|
|
|||||||
|
Property and equipment, net
|
101.8
|
|
991.5
|
|
423.8
|
|
—
|
|
1,517.1
|
|
|||||||||
|
Goodwill
|
—
|
|
854.6
|
|
1,118.0
|
|
—
|
|
1,972.6
|
|
|||||||||
|
Intangible assets, net
|
11.8
|
|
105.1
|
|
286.2
|
|
—
|
|
403.1
|
|
|||||||||
|
Deferred income tax assets
|
68.2
|
|
8.4
|
|
—
|
|
(42.2
|
)
|
34.4
|
|
|||||||||
|
Other long-term assets
|
49.2
|
|
100.5
|
|
85.4
|
|
—
|
|
235.1
|
|
|||||||||
|
Intercompany notes receivable
|
486.2
|
|
—
|
|
—
|
|
(486.2
|
)
|
—
|
|
|||||||||
|
Intercompany receivable and investments in consolidated affiliates
|
2,839.1
|
|
311.3
|
|
—
|
|
(3,150.4
|
)
|
—
|
|
|||||||||
|
Total assets
|
$
|
3,652.0
|
|
$
|
2,681.2
|
|
|
$
|
2,228.6
|
|
|
$
|
(3,697.3
|
)
|
$
|
4,864.5
|
|
||
|
Liabilities and Shareholders’ Equity
|
|
|
|
|
|
|
|
|
|
|
|||||||||
|
Current liabilities:
|
|
|
|
|
|
|
|
|
|
|
|||||||||
|
Current portion of long-term debt
|
$
|
32.8
|
|
$
|
7.4
|
|
$
|
9.6
|
|
$
|
(17.5
|
)
|
$
|
32.3
|
|
||||
|
Accounts payable
|
10.4
|
|
43.5
|
|
24.5
|
|
—
|
|
78.4
|
|
|||||||||
|
Accrued payroll
|
36.1
|
|
63.8
|
|
72.2
|
|
—
|
|
172.1
|
|
|||||||||
|
Accrued interest payable
|
21.9
|
|
2.6
|
|
0.2
|
|
—
|
|
24.7
|
|
|||||||||
|
Other current liabilities
|
108.8
|
|
15.6
|
|
86.6
|
|
(1.0
|
)
|
210.0
|
|
|||||||||
|
Total current liabilities
|
210.0
|
|
132.9
|
|
|
193.1
|
|
|
(18.5
|
)
|
517.5
|
|
|||||||
|
Long-term debt, net of current portion
|
2,258.5
|
|
242.2
|
|
44.7
|
|
—
|
|
2,545.4
|
|
|||||||||
|
Intercompany notes payable
|
—
|
|
—
|
|
486.2
|
|
(486.2
|
)
|
—
|
|
|||||||||
|
Self-insured risks
|
9.6
|
|
—
|
|
100.5
|
|
—
|
|
110.1
|
|
|||||||||
|
Other long-term liabilities
|
21.4
|
|
17.8
|
|
78.1
|
|
(42.1
|
)
|
75.2
|
|
|||||||||
|
Intercompany payable
|
—
|
|
—
|
|
144.8
|
|
(144.8
|
)
|
—
|
|
|||||||||
|
|
2,499.5
|
|
392.9
|
|
|
1,047.4
|
|
|
(691.6
|
)
|
3,248.2
|
|
|||||||
|
Commitments and contingencies
|
|
|
|
|
|
|
|
|
|
|
|||||||||
|
Redeemable noncontrolling interests
|
—
|
|
—
|
|
220.9
|
|
—
|
|
220.9
|
|
|||||||||
|
Shareholders’ equity:
|
|
|
|
|
|
|
|
|
|
|
|||||||||
|
Encompass Health shareholders’ equity
|
1,152.5
|
|
2,288.3
|
|
717.4
|
|
(3,005.7
|
)
|
1,152.5
|
|
|||||||||
|
Noncontrolling interests
|
—
|
|
—
|
|
242.9
|
|
—
|
|
242.9
|
|
|||||||||
|
Total shareholders’ equity
|
1,152.5
|
|
2,288.3
|
|
|
960.3
|
|
|
(3,005.7
|
)
|
1,395.4
|
|
|||||||
|
Total liabilities and shareholders’ equity
|
$
|
3,652.0
|
|
$
|
2,681.2
|
|
|
$
|
2,228.6
|
|
|
$
|
(3,697.3
|
)
|
$
|
4,864.5
|
|
||
F-74
|
Encompass Health Corporation and Subsidiaries
Notes to Consolidated Financial Statements
Condensed Consolidating Statement of Cash Flows
|
||
|
|
For the Year Ended December 31, 2018
|
||||||||||||||||||
|
|
Encompass Health Corporation
|
Guarantor Subsidiaries
|
Nonguarantor Subsidiaries
|
Eliminating Entries
|
Encompass Health Consolidated
|
||||||||||||||
|
|
(In Millions)
|
||||||||||||||||||
|
Net cash (used in) provided by operating activities
|
$
|
(10.6
|
)
|
$
|
417.8
|
|
$
|
355.2
|
|
$
|
—
|
|
$
|
762.4
|
|
||||
|
Cash flows from investing activities:
|
|
|
|
|
|
|
|
|
|
|
|||||||||
|
Acquisition of businesses, net of cash acquired
|
(131.4
|
)
|
—
|
|
(12.5
|
)
|
—
|
|
(143.9
|
)
|
|||||||||
|
Purchases of property and equipment
|
(34.1
|
)
|
(133.0
|
)
|
(87.4
|
)
|
—
|
|
(254.5
|
)
|
|||||||||
|
Additions to capitalized software costs
|
(14.1
|
)
|
(0.1
|
)
|
(1.8
|
)
|
—
|
|
(16.0
|
)
|
|||||||||
|
Proceeds from disposal of assets
|
—
|
|
—
|
|
0.4
|
|
—
|
|
0.4
|
|
|||||||||
|
Proceeds from sale of restricted investments
|
—
|
|
—
|
|
11.6
|
|
—
|
|
11.6
|
|
|||||||||
|
Purchases of restricted investments
|
—
|
|
—
|
|
(13.3
|
)
|
—
|
|
(13.3
|
)
|
|||||||||
|
Proceeds from repayment of intercompany note receivable
|
87.0
|
|
—
|
|
—
|
|
(87.0
|
)
|
—
|
|
|||||||||
|
Other
|
(8.5
|
)
|
2.8
|
|
(3.1
|
)
|
—
|
|
(8.8
|
)
|
|||||||||
|
Net cash used in investing activities
|
(101.1
|
)
|
(130.3
|
)
|
|
(106.1
|
)
|
|
(87.0
|
)
|
|
(424.5
|
)
|
||||||
|
Cash flows from financing activities:
|
|
|
|
|
|
|
|
|
|
|
|||||||||
|
Principal payments on debt, including pre-payments
|
(17.6
|
)
|
—
|
|
(3.0
|
)
|
—
|
|
(20.6
|
)
|
|||||||||
|
Principal borrowings on notes
|
—
|
|
—
|
|
13.2
|
|
—
|
|
13.2
|
|
|||||||||
|
Principal payments on intercompany note payable
|
—
|
|
—
|
|
(87.0
|
)
|
87.0
|
|
—
|
|
|||||||||
|
Borrowings on revolving credit facility
|
325.0
|
|
—
|
|
—
|
|
—
|
|
325.0
|
|
|||||||||
|
Payments on revolving credit facility
|
(390.0
|
)
|
—
|
|
—
|
|
—
|
|
(390.0
|
)
|
|||||||||
|
Principal payments under capital lease obligations
|
—
|
|
(7.6
|
)
|
(10.3
|
)
|
—
|
|
(17.9
|
)
|
|||||||||
|
Dividends paid on common stock
|
(100.7
|
)
|
—
|
|
(0.1
|
)
|
—
|
|
(100.8
|
)
|
|||||||||
|
Purchase of equity interests in consolidated affiliates
|
(65.1
|
)
|
—
|
|
—
|
|
—
|
|
(65.1
|
)
|
|||||||||
|
Distributions paid to noncontrolling interests of consolidated affiliates
|
—
|
|
—
|
|
(75.4
|
)
|
—
|
|
(75.4
|
)
|
|||||||||
|
Taxes paid on behalf of employees for shares withheld
|
(7.4
|
)
|
—
|
|
(0.9
|
)
|
—
|
|
(8.3
|
)
|
|||||||||
|
Contributions from consolidated affiliates
|
—
|
|
—
|
|
12.6
|
|
—
|
|
12.6
|
|
|||||||||
|
Other
|
3.0
|
|
—
|
|
3.1
|
|
—
|
|
6.1
|
|
|||||||||
|
Change in intercompany advances
|
371.7
|
|
(279.9
|
)
|
(91.8
|
)
|
—
|
|
—
|
|
|||||||||
|
Net cash provided by (used in) financing activities
|
118.9
|
|
(287.5
|
)
|
|
(239.6
|
)
|
|
87.0
|
|
(321.2
|
)
|
|||||||
|
Increase in cash, cash equivalents, and restricted cash
|
7.2
|
|
—
|
|
|
9.5
|
|
|
—
|
|
16.7
|
|
|||||||
|
Cash, cash equivalents, and restricted cash at beginning of year
|
34.3
|
|
2.9
|
|
79.6
|
|
—
|
|
116.8
|
|
|||||||||
|
Cash, cash equivalents, and restricted cash at end of year
|
$
|
41.5
|
|
$
|
2.9
|
|
|
$
|
89.1
|
|
|
$
|
—
|
|
$
|
133.5
|
|
||
|
Reconciliation of Cash, Cash Equivalents, and Restricted Cash
|
|||||||||||||||||||
|
Cash and cash equivalents at beginning of period
|
$
|
34.3
|
|
$
|
2.9
|
|
$
|
17.2
|
|
$
|
—
|
|
$
|
54.4
|
|
||||
|
Restricted cash at beginning of period
|
—
|
|
—
|
|
62.4
|
|
—
|
|
62.4
|
|
|||||||||
|
Cash, cash equivalents, and restricted cash at beginning of period
|
$
|
34.3
|
|
$
|
2.9
|
|
$
|
79.6
|
|
$
|
—
|
|
$
|
116.8
|
|
||||
|
Cash and cash equivalents at end of period
|
$
|
41.5
|
|
$
|
2.9
|
|
$
|
24.8
|
|
$
|
—
|
|
$
|
69.2
|
|
||||
|
Restricted cash at end of period
|
—
|
|
—
|
|
59.0
|
|
—
|
|
59.0
|
|
|||||||||
|
Restricted cash included in other long-term assets at end of period
|
—
|
|
—
|
|
5.3
|
|
—
|
|
5.3
|
|
|||||||||
|
Cash, cash equivalents, and restricted cash at end of period
|
$
|
41.5
|
|
$
|
2.9
|
|
$
|
89.1
|
|
$
|
—
|
|
$
|
133.5
|
|
||||
|
Supplemental schedule of noncash financing activity:
|
|||||||||||||||||||
|
Intercompany note activity
|
$
|
(136.8
|
)
|
$
|
—
|
|
$
|
136.8
|
|
$
|
—
|
|
$
|
—
|
|
||||
F-75
|
Encompass Health Corporation and Subsidiaries
Notes to Consolidated Financial Statements
Condensed Consolidating Statement of Cash Flows
|
||
|
|
For the Year Ended December 31, 2017
|
||||||||||||||||||
|
|
Encompass Health Corporation
|
Guarantor Subsidiaries
|
Nonguarantor Subsidiaries
|
Eliminating Entries
|
Encompass Health Consolidated
|
||||||||||||||
|
|
(In Millions)
|
||||||||||||||||||
|
Net cash provided by operating activities
|
$
|
28.7
|
|
$
|
381.3
|
|
$
|
248.3
|
|
$
|
—
|
|
$
|
658.3
|
|
||||
|
Cash flows from investing activities:
|
|
|
|
|
|
|
|
|
|
|
|||||||||
|
Acquisition of businesses, net of cash acquired
|
(10.9
|
)
|
—
|
|
(27.9
|
)
|
—
|
|
(38.8
|
)
|
|||||||||
|
Purchases of property and equipment
|
(39.4
|
)
|
(106.1
|
)
|
(80.3
|
)
|
—
|
|
(225.8
|
)
|
|||||||||
|
Additions to capitalized software costs
|
(16.3
|
)
|
(0.2
|
)
|
(2.7
|
)
|
—
|
|
(19.2
|
)
|
|||||||||
|
Proceeds from disposal of assets
|
—
|
|
11.7
|
|
0.6
|
|
—
|
|
12.3
|
|
|||||||||
|
Proceeds from sale of restricted investments
|
—
|
|
—
|
|
4.2
|
|
—
|
|
4.2
|
|
|||||||||
|
Purchases of restricted investments
|
—
|
|
—
|
|
(8.5
|
)
|
—
|
|
(8.5
|
)
|
|||||||||
|
Proceeds from repayment of intercompany note receivable
|
51.0
|
|
—
|
|
—
|
|
(51.0
|
)
|
—
|
|
|||||||||
|
Other
|
(3.7
|
)
|
—
|
|
(3.5
|
)
|
—
|
|
(7.2
|
)
|
|||||||||
|
Net cash used in investing activities
|
(19.3
|
)
|
(94.6
|
)
|
(118.1
|
)
|
(51.0
|
)
|
(283.0
|
)
|
|||||||||
|
Cash flows from financing activities:
|
|
|
|
|
|
|
|
|
|
|
|||||||||
|
Principal payments on debt, including pre-payments
|
(126.9
|
)
|
—
|
|
(3.0
|
)
|
—
|
|
(129.9
|
)
|
|||||||||
|
Principal payments on intercompany notes payable
|
—
|
|
—
|
|
(51.0
|
)
|
51.0
|
|
—
|
|
|||||||||
|
Borrowings on revolving credit facility
|
273.3
|
|
—
|
|
—
|
|
—
|
|
273.3
|
|
|||||||||
|
Payments on revolving credit facility
|
(330.3
|
)
|
—
|
|
—
|
|
—
|
|
(330.3
|
)
|
|||||||||
|
Principal payments under capital lease obligations
|
—
|
|
(6.8
|
)
|
(8.5
|
)
|
—
|
|
(15.3
|
)
|
|||||||||
|
Repurchases of common stock, including fees and expenses
|
(38.1
|
)
|
—
|
|
—
|
|
—
|
|
(38.1
|
)
|
|||||||||
|
Dividends paid on common stock
|
(91.5
|
)
|
—
|
|
—
|
|
—
|
|
(91.5
|
)
|
|||||||||
|
Proceeds from exercising stock warrants
|
26.6
|
|
—
|
|
—
|
|
—
|
|
26.6
|
|
|||||||||
|
Distributions paid to noncontrolling interests of consolidated affiliates
|
—
|
|
—
|
|
(51.9
|
)
|
—
|
|
(51.9
|
)
|
|||||||||
|
Taxes paid on behalf of employees for shares withheld
|
(19.5
|
)
|
—
|
|
(0.3
|
)
|
—
|
|
(19.8
|
)
|
|||||||||
|
Contributions from consolidated affiliates
|
—
|
|
—
|
|
20.8
|
|
—
|
|
20.8
|
|
|||||||||
|
Other
|
(3.1
|
)
|
—
|
|
(0.7
|
)
|
—
|
|
(3.8
|
)
|
|||||||||
|
Change in intercompany advances
|
313.8
|
|
(278.6
|
)
|
(35.2
|
)
|
—
|
|
—
|
|
|||||||||
|
Net cash provided by (used in) financing activities
|
4.3
|
|
(285.4
|
)
|
|
(129.8
|
)
|
|
51.0
|
|
(359.9
|
)
|
|||||||
|
Increase in cash, cash equivalents, and restricted cash
|
13.7
|
|
1.3
|
|
|
0.4
|
|
|
—
|
|
15.4
|
|
|||||||
|
Cash, cash equivalents, and restricted cash at beginning of year
|
20.6
|
|
1.6
|
|
79.2
|
|
—
|
|
101.4
|
|
|||||||||
|
Cash, cash equivalents, and restricted cash at end of year
|
$
|
34.3
|
|
$
|
2.9
|
|
|
$
|
79.6
|
|
|
$
|
—
|
|
$
|
116.8
|
|
||
|
Reconciliation of Cash, Cash Equivalents, and Restricted Cash
|
|||||||||||||||||||
|
Cash and cash equivalents at beginning of period
|
$
|
20.6
|
|
$
|
1.6
|
|
$
|
18.3
|
|
$
|
—
|
|
$
|
40.5
|
|
||||
|
Restricted cash at beginning of period
|
—
|
|
—
|
|
60.9
|
|
—
|
|
60.9
|
|
|||||||||
|
Cash, cash equivalents, and restricted cash at beginning of period
|
$
|
20.6
|
|
$
|
1.6
|
|
$
|
79.2
|
|
$
|
—
|
|
$
|
101.4
|
|
||||
|
Cash and cash equivalents at end of period
|
$
|
34.3
|
|
$
|
2.9
|
|
$
|
17.2
|
|
$
|
—
|
|
$
|
54.4
|
|
||||
|
Restricted cash at end of period
|
—
|
|
—
|
|
62.4
|
|
—
|
|
62.4
|
|
|||||||||
|
Cash, cash equivalents, and restricted cash at end of period
|
$
|
34.3
|
|
$
|
2.9
|
|
$
|
79.6
|
|
$
|
—
|
|
$
|
116.8
|
|
||||
|
Supplemental schedule of noncash financing activities:
|
|||||||||||||||||||
|
Intercompany note activity
|
$
|
(8.8
|
)
|
$
|
—
|
|
$
|
8.8
|
|
$
|
—
|
|
$
|
—
|
|
||||
|
Conversion of convertible debt
|
$
|
319.4
|
|
$
|
—
|
|
$
|
—
|
|
$
|
—
|
|
$
|
319.4
|
|
||||
F-76
|
Encompass Health Corporation and Subsidiaries
Notes to Consolidated Financial Statements
Condensed Consolidating Statement of Cash Flows
|
||
|
|
For the Year Ended December 31, 2016
|
||||||||||||||||||
|
|
Encompass Health Corporation
|
Guarantor Subsidiaries
|
Nonguarantor Subsidiaries
|
Eliminating Entries
|
Encompass Health Consolidated
|
||||||||||||||
|
|
(In Millions)
|
||||||||||||||||||
|
Net cash provided by operating activities
|
$
|
60.3
|
|
$
|
327.4
|
|
$
|
252.5
|
|
$
|
—
|
|
$
|
640.2
|
|
||||
|
Cash flows from investing activities:
|
|
|
|
|
|
|
|
|
|
|
|||||||||
|
Acquisition of businesses, net of cash acquired
|
—
|
|
—
|
|
(48.1
|
)
|
—
|
|
(48.1
|
)
|
|||||||||
|
Purchases of property and equipment
|
(21.8
|
)
|
(77.4
|
)
|
(78.5
|
)
|
—
|
|
(177.7
|
)
|
|||||||||
|
Additions to capitalized software costs
|
(22.8
|
)
|
(0.2
|
)
|
(2.2
|
)
|
—
|
|
(25.2
|
)
|
|||||||||
|
Proceeds from disposal of assets
|
—
|
|
0.7
|
|
23.2
|
|
—
|
|
23.9
|
|
|||||||||
|
Proceeds from sale of restricted investments
|
—
|
|
—
|
|
0.1
|
|
—
|
|
0.1
|
|
|||||||||
|
Purchases of restricted investments
|
—
|
|
—
|
|
(1.3
|
)
|
—
|
|
(1.3
|
)
|
|||||||||
|
Funding of intercompany note receivable
|
(22.5
|
)
|
—
|
|
—
|
|
22.5
|
|
—
|
|
|||||||||
|
Proceeds from repayment of intercompany note receivable
|
52.0
|
|
—
|
|
—
|
|
(52.0
|
)
|
—
|
|
|||||||||
|
Other
|
(3.7
|
)
|
(0.2
|
)
|
2.2
|
|
—
|
|
(1.7
|
)
|
|||||||||
|
Net cash provided by investing activities of
discontinued operations
|
0.1
|
|
—
|
|
—
|
|
—
|
|
0.1
|
|
|||||||||
|
Net cash used in investing activities
|
(18.7
|
)
|
(77.1
|
)
|
|
(104.6
|
)
|
|
(29.5
|
)
|
(229.9
|
)
|
|||||||
|
Cash flows from financing activities:
|
|
|
|
|
|
|
|
|
|
|
|||||||||
|
Principal payments on debt, including pre-payments
|
(198.5
|
)
|
(1.3
|
)
|
(2.3
|
)
|
—
|
|
(202.1
|
)
|
|||||||||
|
Principal borrowings on intercompany notes payable
|
—
|
|
—
|
|
22.5
|
|
(22.5
|
)
|
—
|
|
|||||||||
|
Principal payments on intercompany notes payable
|
—
|
|
—
|
|
(52.0
|
)
|
52.0
|
|
—
|
|
|||||||||
|
Borrowings on revolving credit facility
|
335.0
|
|
—
|
|
—
|
|
—
|
|
335.0
|
|
|||||||||
|
Payments on revolving credit facility
|
(313.0
|
)
|
—
|
|
—
|
|
—
|
|
(313.0
|
)
|
|||||||||
|
Principal payments under capital lease obligations
|
(0.1
|
)
|
(5.9
|
)
|
(7.3
|
)
|
—
|
|
(13.3
|
)
|
|||||||||
|
Repurchases of common stock, including fees and expenses
|
(65.6
|
)
|
—
|
|
—
|
|
—
|
|
(65.6
|
)
|
|||||||||
|
Dividends paid on common stock
|
(83.8
|
)
|
—
|
|
—
|
|
—
|
|
(83.8
|
)
|
|||||||||
|
Distributions paid to noncontrolling interests of consolidated affiliates
|
—
|
|
—
|
|
(64.9
|
)
|
—
|
|
(64.9
|
)
|
|||||||||
|
Taxes paid on behalf of employees for shares withheld
|
(11.6
|
)
|
—
|
|
—
|
|
—
|
|
(11.6
|
)
|
|||||||||
|
Contributions from consolidated affiliates
|
—
|
|
—
|
|
3.5
|
|
—
|
|
3.5
|
|
|||||||||
|
Other
|
1.1
|
|
—
|
|
(1.7
|
)
|
—
|
|
(0.6
|
)
|
|||||||||
|
Change in intercompany advances
|
274.3
|
|
(242.7
|
)
|
(31.6
|
)
|
—
|
|
—
|
|
|||||||||
|
Net cash used in financing activities
|
(62.2
|
)
|
(249.9
|
)
|
|
(133.8
|
)
|
|
29.5
|
|
(416.4
|
)
|
|||||||
|
(Decrease) increase in cash, cash equivalents, and restricted cash
|
(20.6
|
)
|
0.4
|
|
|
14.1
|
|
|
—
|
|
(6.1
|
)
|
|||||||
|
Cash, cash equivalents, and restricted cash at beginning of year
|
41.2
|
|
1.2
|
|
65.1
|
|
—
|
|
107.5
|
|
|||||||||
|
Cash, cash equivalents, and restricted cash at end of year
|
$
|
20.6
|
|
$
|
1.6
|
|
|
$
|
79.2
|
|
|
$
|
—
|
|
$
|
101.4
|
|
||
|
Reconciliation of Cash, Cash Equivalents, and Restricted Cash
|
|||||||||||||||||||
|
Cash and cash equivalents at beginning of period
|
$
|
41.2
|
|
$
|
1.2
|
|
$
|
19.2
|
|
$
|
—
|
|
$
|
61.6
|
|
||||
|
Restricted cash at beginning of period
|
—
|
|
—
|
|
45.9
|
|
—
|
|
45.9
|
|
|||||||||
|
Cash, cash equivalents, and restricted cash at beginning of period
|
$
|
41.2
|
|
$
|
1.2
|
|
$
|
65.1
|
|
$
|
—
|
|
$
|
107.5
|
|
||||
|
Cash and cash equivalents at end of period
|
$
|
20.6
|
|
$
|
1.6
|
|
$
|
18.3
|
|
$
|
—
|
|
$
|
40.5
|
|
||||
|
Restricted cash at end of period
|
—
|
|
—
|
|
60.9
|
|
—
|
|
60.9
|
|
|||||||||
|
Cash, cash equivalents, and restricted cash at end of period
|
$
|
20.6
|
|
$
|
1.6
|
|
$
|
79.2
|
|
$
|
—
|
|
$
|
101.4
|
|
||||
|
Supplemental schedule of noncash financing activities:
|
|||||||||||||||||||
|
Intercompany note activity
|
$
|
(11.7
|
)
|
$
|
—
|
|
$
|
11.7
|
|
$
|
—
|
|
$
|
—
|
|
||||
F-77
EXHIBIT LIST
Effective as of January 1, 2018, we changed our name to Encompass Health Corporation. By operation of law, any reference to “HealthSouth” in these exhibits should be read as “Encompass Health” as set forth in the Exhibit List below.
|
No.
|
Description
|
|
|
|
|
|
|
|
|
|
|
|
||
|
|
|
|
|
|
|
|
|
|
|
|
|
|
|
|
|
|
|
|
|
|
|
|
|
|
|
|
|
|
|
|
|
|
|
|
|
|
|
|
|
|
|
|
|
|
|
|
|
|
|
|
|
101
|
Sections of the Encompass Health Corporation Annual Report on Form 10-K for the year ended December 31, 2018, formatted in XBRL (eXtensible Business Reporting Language), submitted in the following files:
|
|
|
101.INS
|
XBRL Instance Document
|
|
|
|
|
|
|
101.SCH
|
XBRL Taxonomy Extension Schema Document
|
|
|
|
|
|
|
101.CAL
|
XBRL Taxonomy Extension Calculation Linkbase Document
|
|
|
|
|
|
|
101.DEF
|
XBRL Taxonomy Extension Definition Linkbase Document
|
|
|
|
|
|
|
101.LAB
|
XBRL Taxonomy Extension Label Linkbase Document
|
|
|
|
|
|
|
101.PRE
|
XBRL Taxonomy Extension Presentation Linkbase Document
|
|
|
#
|
Schedules have been omitted pursuant to Item 601(b)(2) of Regulation S-K. A copy of any omitted schedule will be furnished supplementally to the Securities and Exchange Commission upon request.
|
|
+
|
Management contract or compensatory plan or arrangement.
|
|
*
|
Certain portions of this exhibit have been omitted pursuant to a request for confidential treatment. The nonpublic information has been filed separately with the Securities and Exchange Commission pursuant to Rule 24b-2 under the Securities Exchange Act of 1934, as amended.
|
TABLE OF CONTENTS
Part IItem 1. BusinessItem 1A. Risk FactorsItem 1B. Unresolved Staff CommentsItem 2. PropertiesItem 3. Legal ProceedingsItem 4. Mine Safety DisclosuresPart IIItem 5. Market For Registrant S Common Equity, Related Stockholder Matters and Issuer Purchases Of Equity SecuritiesItem 6. Selected Financial DataItem 7. Management S Discussion and Analysis Of Financial Condition and Results Of OperationsItem 7A. Quantitative and Qualitative Disclosures About Market RiskItem 8. Financial Statements and Supplementary DataItem 9. Changes in and Disagreements with Accountants on Accounting and Financial DisclosureItem 9A. Controls and ProceduresItem 9B. Other InformationPart IIIItem 10. Directors and Executive Officers Of The RegistrantItem 11. Executive CompensationItem 12. Security Ownership Of Certain Beneficial Owners and Management and Related Stockholder MattersItem 13. Certain Relationships and Related Transactions and Director IndependenceItem 14. Principal Accountant Fees and ServicesPart IVItem 15. Exhibits and Financial Statement SchedulesItem 16. Form 10-k SummaryItem 15. Financial Statements