EHEALTH, INC.
10-Ks and 10-Qs
|
|
|
|
|
|
|
|
|
|
|
|
|
|
|
|
|
|
|
|
|
|
|
|
|
|
|
|
|
|
|
|
|
|
|
|
|
|
|
|
|
|
|
|
|
|
|
|
|
|
|
|
|
|
|
|
UNITED STATES
SECURITIES AND EXCHANGE COMMISSION
WASHINGTON, D.C. 20549
|
FORM 10-K
|
☑
ANNUAL REPORT PURSUANT TO SECTION 13 OR 15(d) OF THE SECURITIES EXCHANGE ACT OF 1934
For the fiscal year ended
December 31, 2016
OR
☐
TRANSITION REPORT PURSUANT TO SECTION 13 OR 15(d) OF THE SECURITIES EXCHANGE ACT OF 1934
For the transition period from to
001-33071
(Commission File Number)
_____________________________________________
EHEALTH, INC.
(Exact name of registrant as specified in its charter)
_____________________________________________
|
Delaware
(State or other jurisdiction of
incorporation or organization)
|
|
56-2357876
(I.R.S Employer
Identification No)
|
440 EAST MIDDLEFIELD ROAD
MOUNTAIN VIEW, CALIFORNIA 94043
(Address of principal executive offices)
(650) 584-2700
(Registrant’s telephone number, including area code)
Securities registered pursuant to Section 12(b) of the Act:
|
Title of Each Class
|
Name of Each Exchange on Which Registered
|
|
Common Stock, par value $0.001 per share
|
The NASDAQ Stock Market LLC
|
|
|
(NASDAQ Global Select Market)
|
Securities registered pursuant to Section 12(g) of the Act:
None
Indicate by check mark if the registrant is a well-known seasoned issuer, as defined in Rule 405 of the Securities Act. YES☐ NO ☒
Indicate by check mark if the registrant is not required to file reports pursuant to Section 13 or Section 15(d) of the Act. YES☐ NO ☒
Indicate by check mark whether the registrant (1) has filed all reports required to be filed by Section 13 or 15(d) of the Securities Exchange Act of 1934 during the preceding 12 months (or for such shorter period that the registrant was required to file such reports), and (2) has been subject to such filing requirements for the past 90 days. YES ☒ NO ☐
1
Indicate by check mark whether the registrant has submitted electronically and posted on its corporate Web site, if any, every Interactive Data File required to be submitted and posted pursuant to Rule 405 of Regulations S-T (§232.405 of this chapter) during the preceding 12 months (or for such shorter period that the registrant was required to submit and post such files). YES ☒ NO ☐
Indicate by check mark if disclosure of delinquent filers pursuant to Item 405 of Regulation S-K is not contained herein, and will not be contained, to the best of registrant’s knowledge, in definitive proxy or information statements incorporated by reference in Part III of this Form 10-K or any amendment to this Form 10-K. ☒
Indicate by check mark whether the registrant is a large accelerated filer, an accelerated filer, a non-accelerated filer or a smaller reporting company. See definitions of “large accelerated filer,” “accelerated filer” and “smaller reporting company” in Rule 12b-2 of the Exchange Act. (Check one):
|
Large accelerated filer ☐
|
Accelerated filer ☒
|
Non-accelerated filer ☐
|
Smaller reporting company ☐
|
Indicate by check mark whether the registrant is a shell company (as defined in Rule 12b-2 of the Exchange Act). YES ☐ NO ☒
Based on the closing price of the registrant’s common stock on the last business day of the registrant’s most recently completed second fiscal quarter, which was June 30, 2016, the aggregate market value of its shares (based on a closing price of $14.02 per share) held by non-affiliates was
$110,816,113
. Shares of the registrant’s common stock held by each executive officer and director and by each entity or person that owned five percent or more of the registrant’s outstanding common stock were excluded in that such persons may be deemed to be affiliates. This determination of affiliate status is not necessarily a conclusive determination for other purposes.
The number of shares of the registrant’s common stock, par value $0.001 per share, outstanding as of
February 28, 2017
was
18,357,020
shares.
DOCUMENTS INCORPORATED BY REFERENCE
Portions of the registrant's Definitive Proxy Statement for the 2016 Annual Meeting of Stockholders, which is expected to be filed within 120 days after the Company’s fiscal year ended
December 31, 2016
, are incorporated by reference into Part III of this Annual Report on Form 10-K to the extent stated herein.
2
EHEALTH, INC.
FORM 10-K
TABLE OF CONTENTS
|
|
PART I
|
PAGE
|
|||
|
Item 1.
|
|||||
|
Item 1A.
|
|||||
|
Item 1B.
|
|||||
|
Item 2.
|
|||||
|
Item 3.
|
|||||
|
Item 4.
|
|||||
|
|
PART II
|
|
|||
|
Item 5.
|
|||||
|
Item 6.
|
|||||
|
Item 7.
|
|||||
|
Item 7A.
|
|||||
|
Item 8.
|
|||||
|
Item 9.
|
|||||
|
Item 9A.
|
|||||
|
Item 9B.
|
|||||
|
|
PART III
|
|
|||
|
Item 10.
|
|||||
|
Item 11.
|
|||||
|
Item 12.
|
|||||
|
Item 13.
|
|||||
|
Item 14.
|
|||||
|
Item 15.
|
|||||
|
|
|||||
|
|
|||||
|
Item 16.
|
|||||
3
PART I
ITEM 1. BUSINESS
In addition to historical information, this Annual Report on Form 10-K contains forward-looking statements within the meaning of Section 27A of the Securities Act of 1933 and Section 21E of the Securities Exchange Act of 1934.
These statements include, among other things, statements regarding our expectations relating to submitted applications and membership; our expectations relating to revenue, sources of revenue, cost of revenue, the collectability of our accounts receivable, operating expenses and profitability; our expectations regarding our strategy and investments and impact to our operating results; our efforts to accelerate growth in the Medicare Advantage and Medicare Supplement market; our focus on the small business market; our expectations regarding the impact of healthcare reform on our business; our ability to enroll and plans relating to the enrollment of individuals and families into qualified health plans through government health insurance exchanges; our expectations regarding commission rates, conversion rates, membership retention rates; our increased focus in public policy and lobbying efforts; our expectations relating to the seasonality of our business; our expectations relating to our business development and cross-selling efforts; our expectation relating to the renewal of Medicare-related health insurance plan and the timing of our generation of renewal commission revenue on those plans; the timing of our receipt of commission payments; our critical accounting policies and related estimates; our belief that cash generated from operations and our current cash and cash equivalents will be sufficient to fund operations for the next twelve months; future capital requirements; expected competition from government-run health insurance exchanges and other sources; the timing and source of our Medicare-related revenue; political, legislative and legal challenges; the merits of any lawsuits filed against us; as well as other statements regarding our future operations, financial condition, prospects and business strategies. These forward-looking statements are subject to certain risks and uncertainties that could cause our actual results to differ materially from those reflected in the forward-looking statements. Factors that could cause or contribute to such differences include, but are not limited to, those risks associated with the impact of healthcare reform; our ability to retain existing members and enroll a large number of new members during the annual healthcare reform open enrollment period and Medicare annual enrollment period; the impact of annual enrollment period for the purchase of individual and family health insurance and its timing on our recognition of revenue; our ability to sell qualified health insurance plans to subsidy-eligible individuals and to enroll subsidy eligible individuals through government-run health insurance exchanges; decreased conversion rates for health insurance exchange enrollments as a result of the federal exchange changes to enrollment; competition, including competition from government-run health insurance exchanges; seasonality of our business and the fluctuation of our operating results; our ability to retain existing members and limit member turnover; changes in consumer behaviors and their selection of individual and family health insurance products, including the selection of products for which we receive lower commissions; product offerings among carriers and the resulting impact on our commission revenue; carriers exiting the market of selling individual and family health insurance and the resulting impact on our supply and commission revenue; our ability to execute on our growth strategy in the Medicare and small business health insurance markets; the impact of increased health insurance costs on demand; our ability to timely receive and accurately predict the amount of commission payments from health insurance carriers; medical loss ratio requirements; delays in our receipt of items required to recognize Medicare revenue; changes in member conversion rates; our ability to accurately estimate membership; our relationships with health insurance carriers; customer concentration and consolidation of the health insurance industry; our success in marketing and selling health insurance plans and our unit cost of acquisition; our ability to hire, train and retain licensed health insurance agents and other employees; the need for health insurance carrier and regulatory approvals in connection with the marketing of Medicare-related insurance products; costs of acquiring new members; scalability of the Medicare business; lack of membership growth and retention rates; consumers satisfaction of our service; our ability to attract and to convert online visitors into paying members; changes in products offered on our ecommerce platform; changes in commission rates; maintaining and enhancing our brand identity; our ability to derive desired benefits from investments in our business, including membership growth initiatives; dependence on acceptance of the Internet as a marketplace for the purchase and sale of health insurance; reliance on marketing partners; timing of receipt and accuracy of commission reports; payment practices of health insurance carriers; dependence on our operations in China; changes in laws and regulations, including in connection with healthcare reform and/or with
1
respect to the marketing and sale of Medicare plans; compliance with insurance and other laws and regulations; exposure to security risks; and the performance, reliability and availability of our ecommerce platform and underlying network infrastructure. Other risks include the risks discussed under the heading “Risk Factors” in Part I, Item A of this report and those discussed in our other Securities and Exchange Commission filings.
The following discussion should be read in conjunction with our audited consolidated financial statements and related notes contained therein that appear elsewhere in this report. We undertake no obligation to revise or publicly release the results of any revision to these forward-looking statements. Given these risks and uncertainties, you are cautioned not to place undue reliance on such forward-looking statements.
General
eHealth, Inc. is the parent company of eHealthInsurance, a leading private health insurance exchange where individuals, families and small businesses can compare health insurance products from leading insurers side-by-side and purchase and enroll in coverage online through our websites (
www.eHealth.com, www.eHealthInsurance.com, www.eHealthMedicare.com, www.Medicare.com,
and
www.PlanPrescriber.com
) or telephonically through our customer care centers. We market thousands of Medicare, individual and family, small business and ancillary health insurance plans from the nation's leading health insurance carriers, and provide consumers with powerful decision support tools, an intuitive shopping experience, a large library of proprietary content and real time customer care support to help with their plan selection and enrollment. Our ecommerce platform can be accessed directly through our websites as well as through our network of marketing partners. We are licensed to sell health insurance in all 50 states and the District of Columbia. Our ecommerce technology also enables us to deliver consumers’ health insurance applications electronically to health insurance carriers. As a result, we simplify and streamline the complex and traditionally paper-intensive health insurance sales and purchasing process.
We were incorporated in Delaware in November 1997. Our headquarters are located at 440 East Middlefield Road, Mountain View, California 94043, and our telephone number is (650) 584-2700. We make our annual reports on Form 10-K, quarterly reports on Form 10-Q, current reports on Form 8-K, and amendments to those reports, available free of charge on the Investor Relations page of our web site (
www.ehealth.com
) as soon as reasonably practicable after we file these reports with the Securities and Exchange Commission. The information that can be accessed on or through our websites is not part of this Annual Report on Form 10-K. Further, a copy of this Annual Report on Form 10-K is located at the SEC’s Public Reference Room at 100 F Street, NE, Washington, D.C. 20549. Information on the operation of the Public Reference Room can be obtained by calling the SEC at 1-800-SEC-0330. The SEC maintains an Internet site that contains reports, proxy and information statements and other information regarding our filings at
http://www.sec.gov
.
In connection with recent changes in our executive management team, we implemented a new operating structure in October 2016 to focus on our growth opportunities and objectives while operating the business more efficiently. The new business structure is comprised of two operating segments: Medicare and Individual, Family and Small Business. These segments reflect the way our management evaluates our business performance and manages our operations. See Item 7, Management’s Discussion and Analysis of Financial Condition and Results of Operations - Segment Results of Operations, Note 1 Summary of Business and Significant Accounting Policies and Note 9 Operating Segments, Geographic Information and Significant Customers, in the Notes to Consolidated Financial Statements of this Annual Report on Form 10-K for more information on segment and geographic information.
Our Business Model
We implemented a new operating structure in October 2016 to focus on our growth opportunities and objectives, while operating the business more efficiently. The new business structure is comprised of two operating segments, Medicare and Individual, Family and Small Business.
Medicare Products
We actively market a large selection of Medicare-related health insurance plans through our Medicare ecommerce platforms (
www.eHealthMedicare.com, www.Medicare.com
and
www.PlanPrescriber.com
). Our Medicare ecommerce platforms and telephonic enrollment capabilities enable consumers to research, compare and purchase Medicare-related health insurance plans, including Medicare Advantage, Medicare Supplement and Medicare Part D prescription drug plans. To the extent that we assist in the sale of Medicare-related insurance plans as a health insurance agent, either online or telephonically, we generate revenue from commissions we receive from health insurance carriers. In the first effective plan year of a Medicare Advantage and Medicare Part D prescription drug plan, after the health insurance carrier approves the
2
application, we are paid a fixed commission that is prorated for the number of months remaining in the calendar year. Additionally, if the plan is the first Medicare Advantage or Medicare Part D prescription drug plan issued to the member, we may receive a higher commission rate that covers a full twelve-month period, regardless of the month the plan was effective. Beginning with and subsequent to the second plan year, we typically receive fixed, monthly commissions for Medicare Advantage plans and fixed, annual commissions for Medicare Part D prescription drug plans. We earn commission revenue for Medicare Advantage and Medicare Part D prescription drug plans for which we are the broker of record, typically until either the policy is cancelled or we otherwise do not remain the agent on the policy. Commission payments we receive for Medicare Supplement plans sold by us typically are a percentage of the premium on the policy and are paid to us until either the policy is cancelled or we otherwise do not remain the agent on the policy. As a result, much of our Medicare commission revenue for a given financial reporting period relates to policies that we sold prior to the beginning of the period and is recurring in nature. Additionally, Medicare Advantage and Medicare Part D prescription drug plan pricing is approved by the Centers for Medicare and Medicaid Services, or CMS, an agency of the United States Department of Health and Human Services, and is not subject to negotiation or discounting by health insurance carriers or our competitors. Similarly, Medicare Supplement plan pricing is set by the health insurance carrier and approved by state regulators and is not subject to negotiation or discounting by health insurance carriers or our competitors.
Individual, Family and Small Business Products
We actively market individual and family health insurance and small business health insurance plans through our ecommerce platforms (
www.eHealth.com
and
www.eHealthInsurance.com
), and generate revenue from commissions we receive from health insurance carriers whose health insurance plans are purchased through us, as well as commission override payments we receive for achieving sales volume thresholds or other objectives. In addition we market a variety of ancillary products including but not limited to dental, vision, life, short term disability and long term disability insurance. These ancillary products are offered to our individual and family and small business customers and are also sold on a standalone basis. The commission payments we receive for individual and family, small business and ancillary health insurance plans are a percentage of the premium our customers pay for those plans, or a flat amount per member per month depending on the carrier that is offering the plan, the state and the size of the small business. Commission payments are typically made to us on a monthly basis until either the policy is cancelled or we otherwise do not remain the agent on the policy. As a result, much of our revenue for a given financial reporting period relates to policies that we sold prior to the beginning of the period and is recurring in nature. Additionally, health insurance pricing, which is set by the health insurance carrier and approved by state regulators, is not subject to negotiation or discounting by health insurance carriers or our competitors.
Non-Commission Revenue Sources
In addition to our core business of marketing health insurance products to individuals, families and small businesses where we generate revenue from broker commissions, we have non-commission revenue sources including online sponsorship and advertising, technology licensing and lead referrals.
Online Sponsorship and Advertising
We generate revenue from our online sponsorship and advertising program that allows carriers to purchase advertising space in specific markets in a sponsorship area on our website and allows Medicare-related carriers to purchase advertising on a separate website developed, hosted and maintained by us. In return, we are typically paid a flat fee or, with respect to individual and family health insurance plans, a monthly fee and a performance-based fee based on metrics such as submitted health insurance applications.
Technology Licensing
We generate revenue from licensing the use of our health insurance ecommerce technology. Our technology platform enables health insurance carriers to market and distribute health insurance plans online. Health insurance carriers that license our technology typically pay us implementation fees and performance-based fees that are based on metrics such as submitted health insurance applications.
Lead Referrals
We generate revenue from referral fees paid to us based on Medicare-related and individual and family health insurance leads generated by our ecommerce platforms and our marketing activities that are delivered and sold to third parties.
Additional financial information about our company is included in Part II, Item 8,
Financial Statements and Supplementary Data
of this Annual Report on Form 10-K.
3
Industry Background
The purchase and sale of health insurance has historically been a complex, time-consuming and paper-intensive process. This complexity can make it difficult to make informed health insurance decisions. In addition, the human error that arises from traditional paper-intensive distribution has historically resulted in a high number of incomplete and inaccurate applications being submitted to health insurance carriers. Incomplete and inaccurate paper applications often result in back-and-forth communications, delay and additional cost. The Internet’s convenient, information-rich and interactive nature offers the opportunity to provide consumers with more organized information, a broader choice of plans and a more efficient process than have typically been available from traditional health insurance distribution channels.
Medicare is a federal program that provides persons sixty-five years of age and over, and some persons under the age of sixty-five who meet certain conditions, with hospital and medical insurance benefits. CMS, which administers this original Medicare program, also contracts with private health insurance carriers under the Medicare Advantage and Medicare Part D prescription drug programs for these health insurance carriers to provide health insurance and prescription drug benefits to Medicare-eligible individuals. Medicare Advantage plans replace original Medicare. Medicare Part D prescription drug plans provide prescription drug coverage that original Medicare does not provide. In addition, health insurance carriers offer Medicare Supplement health insurance plans, which help to pay health care costs not covered through original Medicare. Medicare-related insurance plans, including Medicare Advantage, Medicare Supplement and Medicare Part D prescription drug plans, are typically marketed and sold by insurance carriers, also known as plan sponsors, through a combination of dedicated internal sales representatives and licensed independent brokers and agents. CMS also offers plan information, comparison tools, call centers and online enrollment for Medicare Advantage and Medicare Part D prescription drug plans.
Individual and family products are typically purchased by consumers under 65 years of age that do not have coverage through their employer. Small business group health insurance addresses the needs of businesses with 100 employees or less. Our current strategy is to target small businesses with 20 or fewer employees while also serving customers across the small business market.
Individual, family and small business health insurance has historically been sold by independent insurance agents and, to a lesser degree, directly by insurance companies. Many of these agents are self-employed or part of small agencies, and they typically service only their local communities. In addition, many of these agents sell health insurance from a limited number of insurance carriers (in some cases only one), resulting in a reduced selection of plans for the consumer.
Health Care Reform
In March 2010, the federal Patient Protection and Affordable Care Act and related amendments in the Health Care and Education Reconciliation Act were signed into law. These health care reform laws contain provisions that have changed and will continue to change the health insurance industry in substantial ways. Among several other provisions, these laws and the regulations implementing them include a mandate requiring individuals to maintain health insurance or face tax penalties; a mandate that certain employers offer and contribute to their employees group health insurance coverage or face tax penalties if they do not do so; prohibitions against insurance companies using pre-existing health conditions as a reason to deny an application for health insurance; requirements for minimum individual and small business health insurance benefit levels, including prohibitions on lifetime coverage limits and limitations on annual coverage limits; medical loss ratio requirements that require each health insurance carrier to spend a certain percentage of their premium revenue on reimbursement for clinical services and activities that improve health care quality; establishment of state and/or federal health insurance exchanges to facilitate access to, and the purchase of, health insurance; an open enrollment period for the purchase of individual health insurance; Medicaid expansion so that a greater number of individuals will be insured under Medicaid programs; subsidies and cost-sharing credits to make health insurance more affordable for those below certain income levels and a requirement that individuals and families purchase individual and family and small business health insurance through a government health insurance exchange to receive healthcare reform subsidies and cost-sharing credits
Individuals and families cannot purchase individual and family health insurance outside the Affordable Care Act annual open enrollment period until the open enrollment period for the following year, unless they qualify for a special enrollment period as a result of certain events, such as losing employer-sponsored health insurance, moving to another state or becoming eligible or ineligible for a government subsidy for their health insurance. Moreover, in order to be eligible for a subsidy, qualified individuals must purchase subsidy-qualifying health plans, known as qualified health plans, through a government-run health insurance exchange during the open enrollment period or a special enrollment period.
4
Many health insurance carriers have reported significant losses in the individual and family health insurance market that they attribute to healthcare reform implementation. As a result of these losses, a number of major individual and family health insurance carriers have significantly limited their presence in this market or have exited it altogether. Health insurance carriers that have remained in the market have taken other actions, including reducing the commissions that we receive in connection with the sale of individual and family health insurance, reducing the number of individual and family health insurance products that they offer, changing their health care provider network structure, deductibles and other major aspects of the individual and family health insurance products that they sell, exiting certain geographic markets and reducing their marketing efforts, including the use of traditional and online health insurance agents like us.
We are party to an agreement with CMS that allows us to enroll subsidy-eligible individuals in qualified health insurance plans through the government-run health insurance exchange operated by the Federal government in the 36 states where the federal government is operating all or some part of the health insurance exchange. Pursuant to the agreement as well as applicable law and regulations, we must satisfy a number of conditions and requirements to enroll subsidy eligible individuals in qualified health plans. Because a large number of individuals have become eligible for subsidies as a result of health care reform, if we are not able to maintain functioning relationships with government-run health insurance exchanges to be able to enroll subsidy-eligible individuals over the Internet, we will have greater difficulty competing with government-run health insurance exchanges for members, could lose existing members and would be unable to enroll as many new individual and family health insurance members. At the beginning of 2016, CMS directed us to make changes to our process for enrolling subsidy-eligible individuals into qualified health plans through the federal health insurance exchange, including changes to the application form and process and to consumer disclosures provided on our website. These changes have negatively impacted the rate at which we were able to convert visitors to our website into submitted applications for qualified health plans.
While we have entered into relationships with state health insurance exchanges in states that do not utilize the federal health insurance exchange to be able to enroll individuals into qualified health plans, those state health insurance exchanges have not adopted qualified health insurance plan enrollment processes for health insurance agents that are efficient or entirely online. As a result, we generally do not enroll individuals and families in qualified health plans in these states.
The 2016 Presidential and Congressional elections resulted in the election of Donald Trump as President and a Republican-controlled Congress. These election results have the potential to lead to significant changes to the Affordable Care Act and the regulatory environment impacting the market for individual and family health insurance products. The new administration and Republican leadership have repeatedly communicated their intention to alter or repeal the Affordable Care Act. Committees in the House of Representatives have released draft bills amending the Affordable Care Act. Given the preliminary nature of the draft legislation in the House of Representatives and that any proposed legislation must be approved by the full House of Representatives and the United States Senate and signed into law by the President, it is difficult to estimate the impact of changes to the Affordable Care Act on our business and the overall market for health insurance , but the exchanges could harm our business and operating results. However, we believe that successful efforts to restrict or replace the Affordable Care Act and to give the private sector a greater role in the individual and family health insurance market than it has received since the enactment of the Affordable Care Act could be favorable to our business.
Our Strategy
Our objective is to continue to strengthen and grow our position as a leading private online engagement and distribution platform for health insurance sold to individuals, families and small businesses, and to enter new business areas where this platform may be leveraged.
Key elements of our strategy are to:
Position Our Individual and Family Health Insurance Business for Potential Market Changes.
The Affordable Care Act created a challenging environment for our individual and family health insurance business. As a result, we have been managing this business for profitability while our ability to enroll individuals and families has been constrained. We currently continue to pursue this strategy while investing profits that we generate from our individual and family health insurance business into growing our presence in the Medicare and small business group health insurance markets. At the same time we are carefully monitoring activities relating to the Affordable Care act and the post-election regulatory environment of the new Administration and retain the flexibility to pursue individual and family health insurance membership growth in the future should we see an opportunity do so.
5
Grow Our Medicare Opportunity
: We plan to leverage our technology strength and marketing expertise to accelerate our growth in Medicare product sales, primarily in the Medicare Advantage and Medicare Supplement markets. Our Medicare membership has expanded significantly since we entered the market, and we plan to continue investing for growth in this important area. To support our Medicare growth strategy, we continue to invest in the technology behind our online and telephonic enrollment platforms and further develop demand generation programs in the Medicare market which include broadening our network of marketing partners, enhancing our brand and making our online marketing programs more effective. Our goal is to become the leading consumer engagement platform, trusted information source and transaction engine for Medicare eligible individuals looking to understand their Medicare-related health insurance options and to enroll into a product that best fits their needs.
Offer the Best, Multi-Channel Consumer Experience.
We believe that providing the best consumer experience increases market adoption of our services, builds our brand awareness, drives word-of-mouth referrals and improves our visitor-to-member conversion rates. Our multi-channel approach of combing leading online information, decision support and enrollment capabilities with a licensed and well-trained telephonic, sales and support organization enhances the consumer experience. We intend to continue to further develop an online experience that empowers consumers with the knowledge, choice and services they need to select and purchase health insurance plans that best meet their needs.
Pursue the Large Opportunity in the Small Business Group Health Insurance Market:
We plan to leverage the strong platform built for our individual and family health insurance business to significantly expand our presence in the small business group health insurance market. We believe that our existing technology platform and extensive relationships with insurance carriers provides us with the opportunity to differentiate and grow our services in the small business market. We have an existing small group membership representing less than 5% of our total membership base. Historically, we have not actively invested in marketing small business health insurance products. We plan to focus on small business groups of 20 employees or less and to increase our small business health insurance product marketing expenditures, increase the number of health insurance agents dedicated to selling small business health insurance and invest in significant enhancements to the technology supporting the sales and enrollment process in this market.
Increase Our Cross-Selling Efforts:
We plan to pursue more aggressively the cross-selling opportunities and adjacencies that the Medicare-related and small business group health insurance markets present. We believe that by increasing the rate at which our members purchase ancillary products to complement the major medical health insurance products that we sell to them, we can achieve growth in the lifetime profitability of our members and provide for broader and stronger relationship with them. We have been successful in cross-selling ancillary products to our individual and family plan products, which has been an important contributor to our ability to maintain profitability in this business despite the decline in our membership base. Our goal is to replicate this strategy in the Medicare-related and small business health insurance markets.
Deepen and Expand Our Partnership with Leading Health Care Market Participants:
We plan to enhance our business development efforts and actively pursue partnerships and business relationships with the participants in the health care industry, including insurers, providers, and pharmacies. We believe that this will allow us to expand and diversify our consumer reach and provide our customers with a comprehensive selection of health insurance and related services and products.
Increase Our Brand Awareness.
We believe that building greater awareness of our brand is critical for our continued growth. A significant percentage of our website traffic is direct, and we intend to attempt to grow our direct website traffic by strengthening our brand awareness through a variety of marketing and public relations efforts.
Our Platforms and Technology
Our ecommerce platforms and consumer engagement solutions are built to provide market leading information, decision support and transactional services to health insurance customers across the country. Our ecommerce platforms organize and present voluminous and complex health insurance information in an objective format that empowers individuals, families and small businesses to research, analyze, compare and purchase a wide variety of health insurance plans. The plans we offer include Medicare-related health insurance, small business group insurance, major medical individual and family health insurance coverage (such as preferred provider organization, health maintenance organization and indemnity plans), health savings account-eligible insurance plans, and ancillary health insurance plans (primarily short-term, dental, life, vision and accident insurance plans).
6
Elements of our platforms include:
Plan Comparisons and Recommendations
. We offer online comparison and recommendation tools that process and simplify voluminous health insurance information according to each customer's specific insurance need. Our ecommerce platform enables consumers to compare health insurance plans in a side-by-side format based on plan characteristics such as price, plan type, deductible amount, co-payment amount and in-network and out-of-network benefits. Our recently developed Medicare plan comparison tool is designed to enable Medicare-eligible individuals to compare plan premiums, deductibles, out-of-pocket drug expenses, coverage limitations on medications and other aspects of Medicare-related health insurance plans. Our automated recommendation capability for individual and family health insurance presents a series of questions and recommends health insurance plans based on the consumer’s input. Our proprietary recommendation algorithms are carrier agnostic and are designed based on the several million customer assistance encounters our company has facilitated.
Online Rate Quoting and Comprehensive Plan Information.
Our ecommerce platforms instantly provide consumers online rate quotes and comprehensive plan benefit information from a large number of health insurance carriers. After entering relevant information on our website, our platforms allow consumers to instantly receive a list of applicable health insurance plans and rate and benefit information in an easy-to-understand format. The consumer can sort through the quoted plans based on price, health insurance carrier or deductible amount, or search the list of quoted plans to obtain a subset based on certain consumer preferences. Medicare-eligible individuals may also obtain annualized cost comparisons that include out-of-pocket estimates for their prescription drugs.
Online Application and Enrollment Forms
. Health insurance applications vary widely by carrier and state. Our proprietary graphical Application Designer Tool allows us to capture each individual and family health insurance application’s unique business rules and build a corresponding online application in XML format. Our online application process offers our consumers significant improvements over the traditional, paper-intensive application process. It employs dynamic business logic to help individuals and families complete application and enrollment forms correctly in real-time. This reduces delay resulting from application rework, a significant problem with traditional health insurance distribution, where incomplete applications are mailed back and forth between the consumer, the traditional agent and the carrier. We further simplify the enrollment process by accepting electronic signature and electronic payment from our consumers.
Electronic Processing Interchange.
Our Electronic Processing Interchange, or EPI, technology integrates our online application process with health insurance carriers’ technology systems, enabling us to electronically deliver our consumers’ applications to health insurance carriers. This expedites the application process by eliminating manual delivery and reducing the need for data entry and human review. Through EPI, we also receive alerts and data from carriers, such as notification of underwriting approval or a request from a carrier for a consumer’s medical records for underwriting purposes, which we then relay electronically to the consumer. These features of our service help prevent applications from becoming delayed or rejected through inactivity of the consumer or the carrier.
Back Office Systems.
Our proprietary back office customer relationship management systems enable us to provide a full range of customer service tasks in an efficient, highly scalable and personalized manner. Using these tools, we can track each consumer throughout the application process, obtain real-time updates from the carrier, generate automated emails specific to each consumer and access a cross-sell engine and dashboard to identify and track cross-sell opportunities. Our auto-email system is feature-rich with HTML capability, customizable merge tags, granular segmentation and tracking capability.
Carrier Relationships
We have developed strategic relationships with leading health insurance carriers in the United States, enabling us to offer thousands of health insurance plans online. We have relationships with a large number of Medicare-related, individual, family, small business and ancillary health insurance carriers, including large national carriers and well-established regional carriers. We typically enter into contractual agency relationships with health insurance carriers that are non-exclusive and terminable on short notice by either party for any reason. In addition, health insurance carriers often have the ability to terminate or amend our agreements unilaterally on short notice, including provisions in our agreements relating to our commission rates. The amendment or termination of an agreement we have with a health insurance carrier may adversely impact the commissions we are paid on health insurance plans that we have already sold through the carrier.
Revenue derived from Humana represented approximately
23%
of our total revenue in each of the years ended December 31, 2014, 2015 and 2016. Revenue derived from carriers owned by Anthem represented approximately 11%, 9% and 8% of our total revenue in 2014, 2015 and 2016, respectively. Revenue derived from carriers owned by UnitedHealthcare represented approximately 10%, 11% and 13% of our total revenue in 2014, 2015 and 2016, respectively. Revenue derived
7
from carriers owned by Aetna represented approximately 10% of our total revenue in each of the years ended December 31, 2014, 2015 and 2016.
Marketing
We focus on building brand awareness, increasing customer visits to our websites, increasing Medicare customer visits to our website and telephonic sales centers and converting these visitors into members. Our marketing initiatives are varied and numerous. They include:
Direct Marketing
. Our direct member acquisition channel consists of consumers who access our website addresses (
www.eHealth.com, www.eHealthInsurance.com, www.Medicare.com,
www.eHealthMedicare.com
and www
.PlanPrescriber.com
) either directly or through algorithmic search listings on Internet search engines and directories. Our direct marketing programs include direct mail, email marketing, retargeting campaigns and television, radio and print advertising.
Online Advertising.
Our online advertising member acquisition channel consists of consumers who access our website or call centers through paid keyword search advertising from search engines such as Google, Bing and Yahoo!, as well as various Internet marketing programs such as display advertising. Our online advertising programs are delivered across all Internet-enabled devices, including desktop computers, tablet computers and smart phones.
Marketing Partners
. Our marketing partner member acquisition channel consists of consumers who access our website and call centers through a pay-for-performance network, comprised of hundreds of partners that drive consumers to our ecommerce platform and call centers. These partners include online advertisers and content providers that are specialists in paid and unpaid (algorithmic) search, as well as specialists in other types of Internet marketing; financial and online services partners in industries such as banking, insurance, mortgage and association partners; affiliate programs; and off-line lead generators who specialize in traditional direct marketing channels, such as direct mail and television advertising. We also seek to enter with strategic relationships with health care industry participants such as pharmacies and other providers where our acquisition costs may be less or on a basis other than the basis we generally use to compensate our marketing partners.
We generally compensate our marketing partners for referrals based on the consumer submitting a health insurance application on our platform, regardless of whether the consumer's application is approved by the health insurance carrier. If a marketing partner is licensed to sell health insurance, we may share a percentage of the commission revenue we earn from the health insurance carrier for each member referred by that partner.
Technology and Content
We have a technology and content team that is responsible for ongoing enhancements to the features and functionality of our ecommerce platform, which we believe are critical to maintaining our technology leadership position in the industry. A large number of our technology and content employees are located in our subsidiary in Xiamen, China. There are many risks associated with having an operation and doing business in China. Information regarding risks involving our operations in China is included in Part I, Item 1A
Risk Factors
of this Annual Report on Form 10-K.
Government Regulation and Compliance
We distribute health insurance plans in all 50 states and in the District of Columbia. The health insurance industry is heavily regulated. In addition to the Affordable Care Act, each of these jurisdictions has its own rules and regulations relating to the offer and sale of health insurance plans, typically administered by a department of insurance. State insurance departments have administrative powers relating to, among other things: regulating premium prices; granting and revoking licenses to transact insurance business; approving individuals and entities to which, and circumstances under which, commissions can be paid; regulating advertising, marketing and trade practices; monitoring broker and agent conduct; and imposing continuing education requirements. We are required to maintain valid life and/or health agency and/or agent licenses in each jurisdiction in which we transact health insurance business.
In addition to state regulations, we also are subject to regulations and guidelines issued by CMS that place a number of requirements on health insurance carriers and agents and brokers in connection with the marketing and sale of Medicare Advantage and Medicare Part D prescription drug plans. We are subject to similar requirements of state insurance departments with respect to our marketing and sale of Medicare Supplement plans. CMS and state insurance department regulations and guidelines include a number of prohibitions regarding the ability to contact Medicare-eligible individuals and
8
place many restrictions on the marketing of Medicare-related plans. For example, our health insurance carrier partners are required to obtain CMS or state department of insurance approval of certain aspects of our platforms, call center scripts and other marketing materials we use to market Medicare-related plans. In addition, the laws and regulations applicable to the marketing and sale of Medicare-related plans are ambiguous, complex and, particularly with respect to regulations and guidance issued by CMS for Medicare Advantage and Medicare Part D prescription drug plans, change frequently.
We are subject to various federal and state privacy and security laws, regulations and requirements. These laws govern our collection, use, disclosure, protection and maintenance of the individually-identifiable information that we collect from consumers. For example, we are subject to the Health Insurance Portability and Accountability Act, or HIPAA. HIPAA and regulations adopted pursuant to HIPPA require us to maintain the privacy of individually-identifiable health information that we collect on behalf of health insurance carriers, implement measures to safeguard such information and provide notification in the event of a breach in the privacy or confidentiality of such information. The use and disclosure of certain data that we collect from consumers is also regulated in some instances by other federal laws, including the Gramm-Leach-Bliley Act, or GLBA, and state statutes implementing GLBA, which generally require brokers to provide customers with notice regarding how their non-public personal health and financial information is used and the opportunity to “opt out” of certain disclosures before sharing such information with a third party, and which generally require safeguards for the protection of personal information. Violations of these federal and state privacy and security laws may result in significant liability and expense.
Intellectual Property
We rely on a combination of trademark, copyright and trade secret laws in the United States and other jurisdictions as well as confidentiality procedures and contractual provisions to protect our proprietary technology and our brand. We also have filed patent applications that relate to certain of our technology and business processes.
Competition
The market for selling health insurance plans is highly competitive. Our competitors include government entities, including government-run health insurance exchanges established as a result of health care reform; health insurance carriers; other health insurance agents and brokers; and companies that use the Internet and other means to attract individuals interested in purchasing health insurance and generate revenue by referring these individuals to us or one of our competitors.
Government.
In connection with our marketing of Medicare related health insurance plans, we compete with the Federal government’s original Medicare program. CMS offers Medicare plan online enrollment, information, comparison tools, and has established call centers for the sale of Medicare Advantage and Medicare Part D prescription drug plans. CMS has regulatory authority over the Medicare Advantage program and can influence the competitiveness of Medicare Advantage and Medicare Part D prescription drug plans compared to the original Medicare program as well as the compensation that health insurance carriers are allowed to pay us.
As a part of health care reform, each state was required to establish a health insurance exchange where individuals, families and small businesses can purchase health insurance. For states that are not operating a health insurance exchange, the federal government has implemented and is operating the exchange for that state. The Federally-Facilitated Marketplace, or FFM, operated some part of the health insurance exchange in 36 states during 2016. Among other things, the FFM and government exchanges in the states not served by the FFM have websites where individuals and small businesses can shop for and purchase health insurance, and they also have offline customer support and enrollment capabilities. Qualified health insurance plans that individuals, and families must purchase in order to receive health care reform related financial assistance in the form of subsidies to purchase health insurance must be purchased through government health insurance exchanges.
Government exchanges have invested significant amounts to raise consumer awareness and drive consumers to their health insurance marketplaces through Internet, television, radio, email and print advertising. In addition, government exchanges rank highly in algorithmic Internet search rankings for terms related to health insurance. Government exchange marketing efforts have resulted in significant competition and also have increased the cost of generating demand for individual and family health insurance online. Notwithstanding our relationships with government-run health insurance exchanges to enroll individuals into qualified health plans through them, government-run health insurance exchanges are a significant source of competition given the large number of subsidy-eligible individuals that must purchase their health insurance through the exchanges to receive their subsidies and given that those individuals and families that we enroll through government exchanges establish a relationship with the government exchanges when we do so and may receive marketing directly from the government exchanges. We have entered into an agreement with CMS to allow us to enroll subsidy-eligible individuals in a qualified health insurance plans over the Internet through the FFM. While we have entered
9
into agreements with states that operate their own health insurance exchanges to be able to offer qualified health plans in those states, these states have not implemented a qualified health insurance enrollment process for health insurance agents that are efficient or entirely online, and we generally do not enroll subsidy-eligible individuals in qualified health plans in those states.
Insurance carriers.
Many health insurance carriers directly market and sell their plans to consumers through call centers and their own websites. Although we offer health insurance plans for many of these carriers, they also compete with us by offering their plans directly to consumers and to a much lesser extent to small businesses. Health insurance carriers have become more experienced in marketing their products directly to consumers both over the Internet and through more traditional channels, which has resulted in increased competition.
Other agents and brokers.
We compete with agents and brokers who offer and sell health insurance plans utilizing traditional offline distribution channels as well as the Internet. Our current competitors include the tens of thousands of local insurance agents across the United States who sell health insurance plans in their communities. A number of these agents operate websites and provide an online shopping experience for consumers interested in purchasing health insurance. In addition, a number of online health insurance agents like us generate demand over the Internet and sell health insurance to individuals over the Internet and using call centers. Some of these online agents have agreements with CMS, similar to us, that allow them to enroll subsidy-eligible individuals in qualified health insurance plans over the Internet in the states where the federal government is operating the health insurance exchange. As a result, we compete with these companies for consumers eligible for Affordable Care Act subsidies as well as for consumers who are not subsidy eligible.
Internet marketers.
There are many internet marketing companies that use the Internet to find consumers interested in purchasing health insurance and are compensated for referring those consumers to agents and health insurance carriers. We compete with internet marketing companies for individuals who are looking to purchase health insurance.
Seasonality
Much of our Medicare plan enrollment activity occurs during the annual open enrollment period, which occurs during our fourth quarter. In 2015 and 2016, our enrollments outside of the Medicare annual enrollment period were a significant portion of our total annual Medicare enrollments and we plan to attempt to further grow the contribution from non-annual open enrollment period sales, which would help to mitigate some of the traditional seasonality in our Medicare-related health insurance business. Additionally, substantially all Medicare Advantage and Medicare Part D prescription drug policies renew on January 1 of each year, resulting in our recognizing substantially all Medicare Advantage and Medicare Part D prescription drug plan annual renewal commission revenue in our first quarter. Accordingly, total Medicare plan-related commission revenue is highest in our first and fourth quarters and lowest in our second and third quarters.
The most recent open enrollment period for individual and family health insurance began on November 1, 2016 and ended on January 31, 2017, for coverage effective in 2017. CMS has proposed that the next annual open enrollment period for individual and family health insurance runs from November 1, 2017 through December 15, 2017 for coverage effective in 2018. Individuals and families generally will not be able to purchase individual and family health insurance outside of these open enrollment periods, unless they qualify for a special enrollment period by meeting certain qualifying events, such as losing employer-sponsored health insurance, moving to another state or becoming eligible or ineligible for a government subsidy for their health insurance, in which case they may purchase individual and family health insurance during a special enrollment period. We expect the number of applications submitted for individual and family health insurance will be highest during the first and fourth quarters of 2017 as a result of the annual open enrollment period and lowest during the second and third quarters of 2017, outside of the annual open enrollment period. Should the proposed CMS rule changing the dates for the upcoming open enrollment period become effective, we expect the seasonality of our individual and family health insurance business to be impacted. We expect a reduction in the number of individual and family health insurance applications that are submitted through us in the first quarter of 2018. We may also experience an increase in the number of individual and family health insurance applications in the fourth quarter of 2017.
Since a significant portion of our marketing and advertising expenses are driven by the number of health insurance applications submitted on our ecommerce platform, those expenses are influenced by seasonal submitted application patterns. As a result, we expect marketing and advertising expenses for individual and family health insurance will be highest during the first and fourth quarters of 2017 as a result of the annual open enrollment period and lowest during the second and third quarters of 2017, outside of the annual open enrollment period. In the event the proposed CMS rule changing the dates for the upcoming annual open enrollment period for individual and family health insurance becomes effective, it could cause more individuals to submit individual and family health insurance applications in the fourth quarter of 2017 rather than the first quarter of 2018, which could result in an increase in marketing and advertising expenses in the fourth quarter of 2017
10
compared to our expectations. We expect marketing and advertising expenses for Medicare-related plans will be highest during the fourth quarters of 2017 as a result of the Medicare annual open enrollment period and lower during the first, second and third quarters of 2017, outside of the annual open enrollment period.
Our net income (loss) in a given quarter is significantly impacted by the factors above. Accordingly, we expect our net income will be higher during our first quarter when we recognize substantially all of our Medicare Advantage and Medicare Part D prescription drug plan annual renewal commission revenue and our net income will be lowest (or net loss will be highest) during our fourth quarter when we incur a significant portion of our marketing and advertising expenses.
This seasonality is subject to change in future periods, particularly in connection with any change in the timing of the annual open enrollment periods.
Employees
As of December 31, 2016, we had 944 full-time employees, of which 28 were in marketing and advertising, 460 were in customer care and enrollment, 292 were in technology and content and 164 were in general and administrative.
None of our U.S. employees are represented by a labor union. As required under Chinese law, the employees in our Xiamen, China office established a labor union in January 2014. We have not experienced any work stoppages and consider our employee relations to be good.
ITEM 1A. RISK FACTORS
In addition to other information in this Annual Report on Form 10-K and in other filings we make with the Securities and Exchange Commission, the following risk factors should be carefully considered in evaluating our business as they may have a significant impact on our business, operating results and financial condition. If any of the following risks actually occurs, our business, financial condition, results of operations and future prospects could be materially and adversely affected. Because of the following factors, as well as other variables affecting our operating results, past financial performance should not be considered as a reliable indicator of future performance and investors should not use historical trends to anticipate results or trends in future periods.
Risks Related to Our Business
Changes and developments in the health insurance industry or in the health insurance system in the United States as a result of health care reform could harm our business.
Our business depends upon the private sector of the United States health insurance system, its relative role in financing health care delivery and health insurance carriers’ use of, and payment of commissions to, agents and brokers to market health insurance plans. In March 2010, the federal Patient Protection and Affordable Care Act and related amendments in the Health Care and Education Reconciliation Act were signed into law. These health care reform laws contain provisions that have and will continue to change the industry in which we operate in substantial ways. Among several other provisions, health care reform includes a mandate requiring individuals to maintain health insurance or face tax penalties; a mandate that certain employers offer their employees group health insurance coverage or face tax penalties; requirements relating to employer contribution to employee health coverage; prohibitions against insurance companies using pre-existing health conditions as a reason to deny an application for health insurance; prohibitions on rescission of health insurance; prohibitions on lifetime coverage limits; requirements for guaranteed renewability of health insurance plans; health insurance premium setting guidelines; limitations on deductibles and cost-sharing; medical loss ratio requirements that require each health insurance carrier to spend a certain percentage of their premium revenue on reimbursement for clinical services and activities that improve health care quality and, if they do not, to provide rebates to policyholders; minimum benefit levels for health insurance plans, including actuarial value standards and limitations on annual coverage limits; taxes and assessments on health insurance carriers; establishment of state and/or federal health insurance exchanges to facilitate access to, and the purchase of, health insurance; open enrollment periods for the purchase of individual and family health insurance; assistance for member run health insurance issuers; creation of multi-state health insurance plans to be offered on the exchanges and with oversight from the Office of Personnel Management; requirements for uniform disclosure relating to the costs and benefits of health insurance;
government subsidized high risk pools; an expansion of Medicaid so that more individuals will be insured under state Medicaid programs; and subsidies and cost-sharing credits to make health insurance more affordable for those below certain income levels. The implementation of health care reform has increased and could further increase our competition and could reduce or eliminate the need for health insurance agents or demand for the health insurance for individuals, families or small businesses that we sell; decrease the number of health insurance plans that we sell as well as the number of health
11
insurance carriers offering them; cause a substantial reduction in our membership and revenue; cause us to incur increased expense across our business and cause health insurance carriers to reduce our commissions and other amounts they pay for our services or change our relationship with them in other ways, any of which could materially harm our business, operating results and financial condition. In addition, various aspects of health care reform have caused and could continue to cause health insurance carriers to determine to limit the type of health insurance plans we sell and the geographies in which we sell them, to reduce or eliminate the commissions we receive from them as a result of our sale of health insurance plans, to exit the business of selling individual and family health insurance plans in particular jurisdictions or altogether, to eliminate certain categories of products or attempt to move members into new plans for which we receive lower or no commissions, any of which could materially harm our business, operating results and financial condition.
Under the Affordable Care Act, health insurance carriers offering coverage in the individual or small business health insurance market must ensure that such coverage meets certain actuarial value standards, includes certain minimum health benefits and is not subject to lifetime or, for most health insurance benefits, annual dollar amount coverage limits. Moreover, health insurance carriers cannot deny individuals health insurance for health reasons. Individuals also are required to hold plans providing minimum essential coverage to meet the mandate for health insurance and avoid a tax penalty. The cost of health insurance has generally increased and several health insurance carriers have indicated that they are suffering financial losses in their individual and family health insurance business.
As a result, major health insurance carriers and other health insurance carriers for which we have sold individual and family health insurance have exited the individual and family health insurance business altogether or in a large number of states. Some of these carriers have indicated that they only plan to sell individual and family health insurance through government exchanges. As a result, the number of individual and family health insurance plans offered on our website has been reduced, including many states and zip codes where we have no individual and family health insurance plans to offer. If these conditions persist, we anticipate that they will continue to decrease demand for the individual and family health insurance that we sell and harm our business, operating results and financial condition. In addition, a significant number of our members have purchased their individual and family health insurance from carriers exiting the individual and family health insurance market. These members have or will lose their health insurance plans and will need to shop for and purchase individual and family health insurance from another health insurance carrier if they desire to maintain individual and family health insurance. These circumstances could result in decreased retention rates in our membership, a reduction in our commission revenue and otherwise harm our business, operating results and financial condition. If additional health insurance carriers determine not to sell qualified health plans or exit the business of selling individual and family health insurance in certain states or altogether, the impact on our individual and family membership and commission revenue will likely be more pronounced.
In addition, we anticipate that premiums for individual and family health insurance will generally increase under the Affordable Care Act as it currently exists, perhaps substantially. If the cost of health insurance increases, we could experience a reduction in demand for the individual and family health insurance that we sell, which could cause us to suffer a substantial reduction in our membership, and materially harm our business, operating results and financial condition. Moreover, compared to the increased cost of individual and family health insurance plans, government subsidies to purchase health insurance and the health care reform tax penalty may not be sufficient enough to drive a substantial number of new entrants into the individual and family health insurance market or incentivize our existing members to maintain their individual and family health insurance plans, which could contribute to a decline in our membership and materially harm our business, operating results and financial condition.
The 2016 Presidential and Congressional elections resulted in the election of Donald Trump as President and a Republican-controlled Congress. These election results have the potential to lead to significant changes to the Affordable Care Act and the regulatory environment impacting the market for individual and family health insurance products. The new administration and Republican leadership have repeatedly communicated their intention to alter or repeal the Affordable Care Act. Committees in the House of Representatives have released draft bills amending the Affordable Care Act. Given the preliminary nature of the draft legislation in the House of Representatives and that any proposed legislation must be approved by the full House of Representatives and the United States Senate and signed into law by the President, it is difficult to predict the impact of changes to the Affordable Care Act on our business and the overall market for health insurance. While actions to repeal or modify the Affordable Care Act could be beneficial to our business, they may also harm our business and our ability to sell health insurance and result in a decrease in demand for the health insurance we sell, any of which could materially harm our business, operating results and financial condition. In addition, the President and the executive branch of the Federal government have a significant impact on the implementation of the provisions of the Affordable Care Act through the adoption of regulations, and President Trump’s administration could make changes impacting the implementation of the Affordable Care Act that harm our business, operating results and financial condition.
12
If we do not retain our existing members and enroll a large number of individuals and families into health insurance plans during the enrollment periods, our business will be harmed.
Medicare Advantage and Medicare Part D prescription drug plans are required to be purchased during an annual enrollment period, subject to certain exceptions. As a result of health care reform, individual and family health insurance is required to be purchased during an open enrollment period. Our revenue depends in large part on the number of paying individual and family and Medicare-related health insurance members we are successful in retaining and on those we acquire during the enrollment periods. We may not be successful in retaining or acquiring members for a number of reasons. If we are unsuccessful, our business, operating results and financial condition would be harmed. For example, we have experienced a decrease in our individual and family membership retention rates since the implementation of health care reform. We also experienced significantly lower individual and family health insurance application volumes during the last two open enrollment periods. These circumstances have resulted in lower individual and family health insurance plan membership. Open enrollment periods of limited duration in the individual and family health insurance markets have resulted, and may in the future result in a reduction in our membership and revenue; an increase in our expenses, particularly during the open enrollment periods; and otherwise may harm our business, operating results and financial condition, particularly given that the open enrollment period for individual and family health insurance overlaps with the annual enrollment period for the Medicare plans that we sell.
It may be difficult for the health insurance agents we employ and our systems and processes to handle as a business the increased volume of health insurance transactions that occur in a short period of time during the health care annual open enrollment period and/or the Medicare annual enrollment period. We hire a significant number of additional employees on a temporary or seasonal basis in a limited period of time to address the expected increase in the volume of health insurance transactions during the Medicare annual enrollment period. We must ensure that these employees are timely licensed, trained and certified and have the appropriate authority to sell health insurance in a number of states. We depend upon state departments of insurance, government exchanges and health insurance carriers for the licensing, certification and appointment of our health insurance agent employees. If our ability to market and sell individual and family health insurance or Medicare-related health insurance is constrained during an enrollment period for any reason, such as technology failures, reduced allocation of resources, any inability to timely license, train, certify and authorize our employees to sell health insurance, interruptions in the operation of our website or systems, or issues with government-run health insurance exchanges, we could suffer a reduction in our membership and our business, operating results and financial condition could be harmed. CMS recently proposed reducing the length of the open enrollment period for individual and family health insurance so that it runs from November 1 to December 15 for coverage to be effective in 2018. If this proposed rule becomes final, it could amplify the risks we face as a result of open enrollment periods. In addition, reduction in the amount of time we have to enroll individuals and families during the open enrollment period could result in a reduction in our membership and harm our business, operating results and financial condition.
If investments we make in enrollment periods do not result in a significant number of paying members, our business, operating results and financial condition would be harmed.
In an attempt to attract and enroll a large number of individuals during the Medicare annual enrollment period and the health care reform open enrollment period, we may invest in areas of our business, including technology and content, customer care and enrollment, and marketing and advertising. We have in the past made investments in areas of our business in advance of enrollment periods that have not resulted in the results we expected when making those investments. Any investment we make in either the Medicare annual enrollment period or the health care reform open enrollment period may not result in a significant number of paying members. If it does not, our business, operating results and financial condition would be harmed.
Our business may be harmed if we do not enroll subsidy-eligible individuals through government-run health insurance exchanges.
In order to offer the qualified health plans that individuals and families must purchase to receive Affordable Care Act subsidies, agents and brokers must meet certain conditions, such as receiving permission to do so from the health insurance exchange, entering into an agreement with the health insurance exchange, ensuring that the enrollment and subsidy application is completed through the state’s health insurance exchange (or the FFM in states that did not establish their own exchange) and complying with privacy, security and other standards, some of which have been recently issued and contain requirements that are new to us. In the event Internet-based agents and brokers such as us use the Internet for completion of qualified health plan selection purposes, their websites are required to meet certain additional conditions, such as compliance with standards for display of health plan and related information; providing consumers the ability to view all health plans offered on the government-run exchange; displaying certain health plan and other data available on the exchange; and providing a mechanism for consumers to withdraw from the application process on the agent or broker’s website. A large segment of the population is eligible for subsidies in connection with the purchase of health insurance, and a substantial number of our existing members are
13
eligible for subsidies. To the extent we enroll individuals and families into qualified health plans, we do so through our relationship with the FFM and have not focused on enrolling individuals into qualified health plans through exchanges in states operating their own health insurance exchanges. As a result, we may lose existing members who reside in states not supported by FFM and may not gain new subsidy-eligible members in those states, which could harm our business, operating results and financial condition. We also may experience difficulty in satisfying the conditions and requirements to offer qualified health plans to our existing members and new potential members and in enrolling them through the FFM. If we are not able to satisfy these conditions and requirements, or if we are not able to successfully adopt and maintain solutions that allow us to enroll large numbers of individuals and families in qualified plans over the Internet both during and outside of open enrollment periods, we will lose existing members and new members, and may incur additional expense, which would harm our business, operating results and financial condition.
In order to sell qualified health plans to subsidy eligible individuals during the open enrollment period, we must establish and maintain relationships with government-run health insurance exchanges, particularly the FFM, and given that at least a part of the qualified health insurance plan enrollment process must occur through the health insurance exchanges, we must maintain our technology platform to be able to enroll consumers in qualified health plans through the FFM in a scalable manner. If we are not able to adopt and maintain solutions to integrate with government-run health insurance exchanges or if the health insurance exchange websites and other processes are not consumer friendly, efficient and compatible with the process we have developed for enrolling individuals and families into qualified health plans through the exchanges, we would not be successful in retaining and acquiring members, and our business, operating results and financial condition would be harmed. The Centers for Medicare and Medicaid Services, or CMS, has broad authority over the requirements that we must meet in order to enroll individuals into qualified health plans through the FFM, and in addition to issuing new requirements, has the authority to interpret existing requirements. CMS directed us to alter our method of enrolling subsidy eligible individuals into qualified health insurance plans beginning in February 2016. The change required us to cease using the online process we developed for enrolling individuals into qualified health plans through the FFM and use a prescribed FFM process. As a result of the changes that we had to make to our online process in response to CMS requirements and that required that our customers visit the FFM website in the middle of the process to receive a subsidy eligibility determination, we experienced a reduction in the rate at which individuals and families starting the application process for qualified health plans and subsidies became members and a reduction in our membership. If these conditions persist, we could continue to experience loss of existing members and new potential members, and a reduction in our individual and family health insurance plan membership and commission revenue, which would harm our business, operating results and financial condition. While we intend to continue to offer consumers the ability to purchase qualified health plans through the FFM on our ecommerce platform, we have reduced our individual and family health insurance plan marketing expenses, which has resulted and could in the future result in a reduction in our individual and family and ancillary health insurance product membership and harm our business, operating results and financial condition. In addition, to the extent that we do enroll individuals into qualified health plans through the FFM, the FFM website, systems and infrastructure must be operational and not suffer significant outages or technical problems as a result of the number of individuals attempting to enroll in qualified health plans or for other reasons. If the FFM experiences these problems, our business, operating results and financial condition would be harmed.
We have entered into agreements with CMS relating to our ability to enroll individuals in qualified health plans through the FFM. The agreements contain comprehensive privacy and security and other requirements. In order to be able to enroll individuals into qualified health plans, we also must satisfy several other regulatory requirements and comply with additional laws and regulations. In order to enroll individuals into qualified health plans online through the FFM, we must among other things, maintain our agreements with the FFM which need to be renewed every year; satisfy the requirements contained in the relevant agreements as well as applicable laws and regulations; maintain a compliant Internet platform incorporating those requirements; maintain qualified health plan information from health insurance carriers and CMS and incorporate it into our web platform; maintain a privacy and security program to conform to the privacy and security requirements of our agreement with CMS as well as applicable laws and regulations; and adopt and maintain solutions to integrate with the FFM so that information may be passed to and from us relating to enrollment in qualified health plans and subsidy eligibility. If we do not comply with applicable laws, regulations and requirements, our ability to enroll individuals into qualified health plans through the FFM could be terminated and we may be required to pay significant monetary penalties, which would harm our business operating results and financial condition.
The laws, regulations and requirements applicable to enrolling individuals in qualified health plans through government-run health insurance exchanges are evolving. For example, we were required to translate significant portions of our website into Spanish for the recently closed open enrollment period in order to be able to offer qualified health plans to individuals in FFM states where greater than 10% of the state’s population is Spanish speaking (currently Texas). If it is determined that the manner in which we translated our website, or the extent to which our website has been translated, is insufficient, we may not be allowed to offer qualified health plans in those states. Our ability to maintain compliance with the various requirements to enroll individuals through the FFM has presented, and could in the future present, significant
14
challenges for us. If we are not successful in maintaining compliance, we will not be successful in enrolling individuals and families into qualified health plans, which would harm our business, operating results and financial condition.
The FFM may at any time cease allowing us to enroll individuals in qualified health plans or change the requirements for doing so and must allocate resources to ensuring, and otherwise ensure, that its technology platform functions properly to enroll individuals online with an adequate customer experience and that results in our receiving credit for enrollments so that we may be paid a commission. We also depend on the FFM to maintain and permit us to use certain access points to the FFM in order for us to be able to assist individuals in applying for subsidies and enrolling in qualified health plans online. If the FFM does not maintain or permit us to use these access points, if CMS requests further changes to our online process for enrolling individuals into qualified health plans, or if our technology and website or the FFM’s technology or website do not function or work together properly to allow us to assist with subsidy applications and enroll large numbers of individuals into qualified health plans in a short period of time, our business, operating results and financial condition would be harmed. In addition, instability or changes to either the FFM website, particularly the portions used by consumers who are referred by agents and brokers, or other FFM operations relating to agent and broker assisted enrollment in qualified health plans, could negatively impact our ability to retain existing members and add new members and would harm our business, operating results and financial condition.
We depend upon health insurance carriers and government-run health insurance exchanges to adopt and maintain systems and processes that can handle sales of individual and family health insurance outside of the open enrollment period to those who qualify for special enrollment periods, which may include systems and processes that verify whether individuals and families are permitted to purchase individual and family health insurance outside of the open enrollment period. If these systems and processes are not developed, are not maintained or are not compatible with our platform and processes for selling individual and family health insurance, our ability to sell individual and family health insurance outside of the open enrollment period will be negatively impacted, which could harm our business, operating results and financial condition.
If we do not successfully compete with government-run health insurance exchanges, our business may be harmed.
We compete with government-run health insurance exchanges, among others. The exchanges may elect whether or not we are able to enroll subsidy-eligible individuals in qualified health plans through them and determine the manner in which we may do so. The exchanges have websites where individuals and small businesses can shop for and purchase health insurance, and they also have offline customer support and enrollment capabilities. Individuals who are eligible for government subsidies in the form of premium tax credits and cost sharing reductions must apply for their subsidy and purchase qualified health plans through a government exchange to receive their subsidy. In the aggregate, government exchanges have greater resources, larger marketing budgets and greater public outreach capability than we do. They have and may in the future impact the process we use to enroll individuals and families through them in a manner that results in a reduction of the individuals and families that we are able to cost-effectively enroll through exchanges. In addition, individuals that utilize our platform and services to apply for subsidies and health insurance through government exchanges receive marketing and communications from the government exchanges after they do so. In the event our existing members purchase health insurance directly through health insurance exchanges without using us as their health insurance agent, as a result of their being eligible for a subsidy or otherwise, we will no longer receive commission revenue as a result of our sale of health insurance to them. Under regulations adopted as a part of health care reform, government-run health insurance exchanges are required to automatically re-enroll individuals and families into a qualified health insurance plan purchased through the exchange if the individuals or families do not take affirmative action, which may contribute to a reduction in our membership. Competitive pressure from government-run health insurance exchanges has resulted, and may in the future result, in our experiencing increased marketing costs, decreased traffic to our website, a reduction in our individual and family health insurance membership and revenue and may otherwise harm our business, operating results and financial condition.
Our revenue will be adversely impacted if commission rates decline or if consumers choose health insurance products for which we receive lower or no commissions.
Our revenue will be adversely impacted if our commission rates decline. The commission rates we receive are impacted by a variety of factors, including the particular health insurance plans chosen by our members, the carriers offering those plans, our members’ states of residence, the laws and regulations in those jurisdictions, the average premiums of plans purchased through us and health care reform. Our commission revenue per member has in the past decreased, and could in the future decrease, as a result of either reductions in contractual commission rates, unfavorable changes in health insurance carrier override commission programs, or the mix of carriers whose products we sell during a given period, all of which are beyond our control and may occur on short notice. To the extent these and other factors cause our commission revenue per member to decline, our revenue may decline and our business, operating results and financial condition would be harmed.
15
Our revenue will be adversely impacted if consumers enroll in Medicare or individual and family health insurance plans that reduce our average commission revenue per member. Due in part to health care reform, major health insurance carriers and other health insurance carriers have exited the individual and family health insurance market in certain jurisdictions or altogether or reduced individual and family health insurance selling efforts in a large number of states, leading to reduction in our commission rates and changes in the health insurance carrier composition of our commission revenue. Since our commission rates vary by carrier, a shift in the mix of products selected by our new members will have an impact on our average commission revenue per member. We do not plan to offer carriers’ individual and family health insurance products for sale on our website if we do not receive commissions for the sale of those plans. Given the significant losses that carriers have sustained in connection with their sale of individual and family health insurance, many health insurance carriers with which we have a relationship, including large national health insurance carriers, have reduced or eliminated commissions for individual and family health insurance, including for enrollments during the last open enrollment period for 2017 coverage and in a limited number of cases our renewal commissions for individual and family health insurance plans we sold in prior years. If these conditions persist or additional carriers reduce or eliminate commissions, our business operating results and financial conditions would be harmed.
Our business may be harmed if we lose our relationship with health insurance carriers or our relationship with health insurance carriers is modified.
We typically enter into contractual agency relationships with health insurance carriers that are non-exclusive and terminable on short notice by either party for any reason. In many cases, health insurance carriers also may amend the terms of our agreements unilaterally on short notice. Carriers may be unwilling to allow us to sell their existing or new health insurance plans, or desire to amend our agreements with them, for a variety of reasons, including for competitive or regulatory reasons, dissatisfaction with the economics of the members that we place with them or because they do not want to be associated with our brand. We may also terminate our relationship with health insurance carriers. In addition, many aspects of health care reform have caused, and may in the future cause, carriers to modify their relationship with us given the substantial changes in the industry in which we operate. Carriers may choose to exclude us from their most profitable or popular plans or may determine not to distribute health insurance plans in the Medicare, individual and family and small business markets in certain geographies or altogether. In the event we are not successful in gaining or maintaining the ability to sell Medicare, individual and family and qualified health insurance plans, if health insurance carriers pay us no commissions or reduced commissions in connection with the sale of these plans or if health insurance carriers change our relationship with them in other ways, we could lose a substantial number of existing and potential members and commission revenue, which would materially harm our business, operating results and financial condition. The termination of our relationship with a health insurance carrier by us or the health insurance carrier or the amendment of or change in our relationship with a carrier could reduce the variety of health insurance plans we offer, cause a loss of commission revenue or have other adverse impacts, which could harm our business, operating results and financial condition. It also could adversely impact, or cause the termination of, commissions for past and future sales, which would materially harm our business, operating results and financial condition. Our business could also be harmed if in the future we fail to develop new carrier relationships and are unable to offer consumers a variety of health insurance plans in each jurisdiction.
Given the significant losses that carriers have sustained in connection with their sale of individual and family health insurance as a result of health care reform, many health insurance carriers with which we have a relationship, including large national health insurance carriers, reduced or eliminated our commissions for selling individual and family health insurance, including individual and family health insurance we sold during the last open enrollment period for 2017 coverage, and in a limited number of cases our renewal commissions. As a result, we expect to see a meaningful reduction in our average commission rates for our aggregate individual and family health insurance plan membership in 2017 compared to 2016. In addition, the reduction in contractual commission rates and these carriers’ desire to not sell individual and family health insurance has reduced the number of plans that we are able to offer on our websites, which could result in less consumer demand for the individual and family health insurance that we sell, a reduction in our membership and harm our business operating results and financial condition. In the future and as a result of health care reform or for other reasons, an increasing number of health insurance carriers may decide to reduce our commissions, rely on their own internal distribution channels, including in-house agents and carrier websites, to sell their own plans, determine not sell individual and family health insurance or otherwise limit or prohibit us from selling their plans on their ecommerce platforms. In addition to reducing commission rates, health insurance carriers may determine to exit the individual and family health insurance business in certain states or increase premiums to a significant degree, which could cause our members’ health insurance to be terminated or our members to purchase new health insurance or drop it altogether. If we lose these members, our business, operating results and financial condition could be harmed. In addition, a reduction in the individual and family health insurance products that we are able to offer could adversely impact demand for our services and a reduction in our membership, which would harm our, business, operating results and financial results.
16
Changes in our management and key employees could affect our business and financial results.
Our success is depends upon the performance of our executive officers and key personnel. Our executive officers and employees can terminate their employment at any time. We have recently experienced significant changes in our senior management. Our former chief executive officer Gary L. Lauer resigned in May 2016, and Scott N. Flanders, a member of our board of directors, was appointed as our chief executive officer. In June 2016, William T. Shaughnessy resigned from his positions as president, chief operating officer and a member of our board of directors. Our former chief financial officer, Stuart M. Huizinga, resigned in July 2016, and our new chief financial officer David K. Francis began his service with us in July 2016. In October 2016, we announced the appointment of Robert S. Hurley as president, Medicare products and Tom G. Tsao as President, small business, individual and family products. Mr. Hurley previously served as executive vice president of sales and operations, and Mr. Tsao previously served as executive vice president, chief technology and product officer. Mr. Francis also added the responsibilities of chief operations officer to his responsibilities as chief financial officer. This transition in senior management could adversely impact our business, operating results and financial condition as it will take time for our executive officers to transition into their roles and integrate into our business. The transition and the departure of members of our senior management could result in further attrition in our senior management and key personnel, which could harm our business, operating results and financial condition.
The loss of the services of any of our executive officers or key employees could harm our business. For example, we appoint a single writing agent with each insurance carrier. If we lose the service of our appointed writing agent, the duties of writing agent will need to be transitioned to other company personnel. Due to our national reach and the large number of carrier partners whose policies are purchased by our members, this transition may be difficult and requires a significant period of time to complete. If the transition is not successful or takes too long to complete, our agency relationship with particular insurance carriers may be terminated, our commission payments could be discontinued or delayed and, as a result, our business, operating results and financial condition would be harmed. Our success is also dependent upon our ability to attract and retain qualified personnel for all areas of our organization. We may not be successful in attracting and retaining personnel on a timely basis, on competitive terms or at all. If we are unable to attract and retain the necessary personnel, our business would be harmed.
Our business may be harmed if we are not successful in executing on our strategic investments and initiatives.
We have conducted a strategic review of our business operations and examined potential areas of investment and strategic emphasis. As a result of this review, we have determined to invest in initiatives to accelerate growth in our Medicare product sales, including Medicare Advantage and Medicare Supplement plans. We also plan to invest resources in efforts to grow our small business group insurance business and pursue cross-selling and adjacent revenue opportunities in our Medicare and small business group business. Pursuing and investing in these initiatives will require significant investments in marketing and advertising, technology and product offerings, and customer care and enrollment, among others. Our pursuit of and investment in these initiatives involves risks and uncertainties described elsewhere in this Risk Factors section, including the initiatives resulting in insufficient revenue to offset any expenses associated with these new investments, inadequate return of capital on our investments, legal and regulatory compliance risks and issues not discovered in our strategic review that could cause us to fail to realize the anticipated benefits of our investments and incur unanticipated liabilities. Our pursuit of these strategic initiatives may not be successful. If we are not successful in executing our business strategy, our future profitability would be negatively impacted and our business, operating results and financial condition would be harmed.
Significant consolidation in the health insurance industry could alter our relationships with carriers and harm our business and financial results
The health insurance industry in the United States has experienced a substantial amount of consolidation, resulting in a decrease in the number of health insurance carriers. Consolidation in the health insurance industry could cause a loss of or changes in our relationship with carriers and reduction in our commission or other revenue, which could harm our business, operating results and financial condition. In the future, we may be forced to offer health insurance from a reduced number of insurance carriers or to derive a greater portion of our revenue from a more concentrated number of carriers as our business and the health insurance industry evolve. Revenue derived from Humana represented approximately 23% of our total revenue in each of the years ended December 31, 2014, 2015 and 2016. Revenue derived from carriers owned by UnitedHealthcare represented approximately 10%, 11% and 13% of our total revenue in the years ended December 31, 2014, 2015 and 2016, respectively. Revenue derived from carriers owned by Aetna represented approximately 10% of our total revenue in each of the years ended December 31, 2014, 2015 and 2016, respectively. We have several agreements that govern our sale of health insurance plans with these health insurance carriers. They may be unilaterally amended or terminated by the carrier on short notice and the amendment or termination could adversely impact or cause the termination of the commission payments that we receive from these health insurance carriers, including commissions on plans that we have already sold, which could materially harm our business, operating results and financial condition. Our revenue could be adversely impacted if we are unable to
17
maintain currently-existing levels of business with any of our significant health insurance carriers if we are unable to offset any loss of business with alternative health insurance carriers. We expect that a small number of health insurance carriers will account for a significant portion of our revenue for the foreseeable future and any impairment of our relationship with, or the material financial impairment of, these health insurance carriers could adversely affect our business.
Our future operating results are likely to fluctuate and could fall short of expectations.
Our operating results are likely to fluctuate as a result of a variety of factors, including the factors described elsewhere in this Risk Factors section, many of which are outside of our control. As a result, comparing our operating results on a period-to-period basis may not be meaningful and you should not rely on our past results as an indication of our future performance, particularly in light of the fact that our business and industry are undergoing substantial change as a result of health care reform and initiatives we determined to pursue as a result of our strategic review. If our revenue or operating results differ from our guidance or fall below the expectations of investors or securities analysts, the price of our common stock could decline substantially. In the past, when our revenue and operating results differed from our guidance and the expectations of investors or securities analysts, the price of our common stock was impacted.
Much of our revenue is commission revenue that we receive after an individual submits an application through us.
A significant component of our marketing and advertising expenses consists of expenses incurred in search engine advertising at the time a consumer clicks on an advertisement and payments owed to our marketing partners as a result of applications submitted through us. As a result of any timing difference between expense and associated revenue recognition, our operating results and cash flows may be adversely affected in periods where we experience a significant increase in new applicants. For example, the Medicare annual enrollment period and the implementation of health care reform open enrollment periods for individual and family health insurance have in the past caused a substantial number of health insurance applications to be submitted through us in a short period of time and a substantial increase in marketing and advertising expenses. Because commission revenue related to any submitted applications that result in paying members is not recognized until future periods, the marketing and advertising expense associated with the submitted applications has a negative impact on operating results and cash flows in the period in which the submitted applications were received. In addition, if we incur other unanticipated or one-time expenses in a particular quarter, lose a significant amount of our member base for any reason or our commission rates are reduced, through a change in the health insurance products chosen by our members, carrier reduction in our commission rates or otherwise, the impact of our incurring increased marketing and advertising expenses would be especially pronounced and we would likely be unable to offset these expenses by increasing sales within that quarter or to replace lost revenue in the quarter with revenue from new members and our business, operating results and financial condition would be harmed.
Seasonality may cause fluctuations in our financial results.
The seasonality of our business is outside of our control. For example, the health care reform open enrollment period has changed the seasonality of our individual and family health insurance business. Since the fourth quarter of 2013, we have experienced a greater number of individual and family health insurance submitted applications in the fourth quarter and first quarter and a lower number of submitted applications in the second and third quarter of the year compared to periods prior to the introduction of open enrollment periods. The seasonality in our business could change in the future for a number of reasons, including as a result of changes in timing of the Medicare or individual and family health plan annual open enrollment periods and changes in, and the enforceability of, the laws and regulations that govern the sale of health insurance. We may not be able to timely adjust to changes in the seasonality of our business. For example, if the timing of the open enrollment periods for Medicare-related health insurance or individual and family health insurance change, we may not be able to timely adapt to changes in customer demand. If we are not successful in responding to changes in the seasonality of our business, our business, operating results and financial condition could be harmed. Additional information regarding the seasonality in our business is included in Part I, Item 1
Business
and Item 7
Management’s Discussion and Analysis of Financial Condition and Results of Operations
and elsewhere in this Annual Report on Form 10-K.
Our revenue will be adversely impacted if our membership does not grow or if we are unable to retain our existing members.
Our estimated individual and family health insurance plan membership has declined substantially since the implementation of health care reform. Our revenue has been, and will continue to be, adversely impacted if our membership does not grow. We receive revenue from commissions health insurance carriers pay to us for health insurance plans sold through our ecommerce platform. When one of these plans is canceled, or if we otherwise do not remain the agent on the policy, we no longer receive the related commission revenue. Our members may choose to discontinue their health insurance plans for a variety of reasons. For example, our members may replace a health insurance policy purchased through us with a health insurance policy provided by a new or existing employer or may determine that they can no longer afford health
18
insurance. They may also determine that they do not like the benefits and physician network covered under the plan. In addition, our members may choose to purchase new plans through other sources or use a different agent, if, for example, they are not satisfied with our customer service or the health insurance plans that we offer. Consumers may also purchase health insurance plans directly from government-run health insurance exchanges, including as a result of the requirement that subsidy-eligible individuals must purchase qualified health plans through government-run health insurance exchanges to be able to receive a subsidy under health care reform, and we would not remain the agent on the policy. Health insurance carriers have in the past and may in the future terminate health insurance plans purchased and held by our members. A significant number of our individual and family health insurance plan members experienced termination of their plans so that the plans are not effective in 2017. If we are not successful in transferring members covered under a terminated plan to another policy that we offer, we will lose these members and associated commission revenue. Our cost of acquiring a new member is substantially greater than the cost involved in maintaining our relationship with an existing member. If we are not able to successfully retain existing members and limit member turnover, our revenue and operating margins will be adversely impacted and our business, operating results and financial condition would be harmed. In addition, the Medicare-related commission rates that we receive may be higher in the first calendar year of a policy if the policy is the first Medicare-related policy issued to the member. The individual and family commission rates that we receive are typically higher in the first twelve months of a policy. After the first twelve months, they generally decline significantly. As a result, if we do not add a sufficient number of members on new plans, our revenue will be negatively impacted.
Our operating results fluctuate depending upon CMS regulations, health insurance carrier payment practices and the timing of our receipt of commission reports from health insurance carriers.
The timing of our revenue depends upon the timing of our receipt of commission reports and associated payments from health insurance carriers. There have been instances where the report of commissions and payment has been delayed, such as during holiday periods or as a result of the health care reform open enrollment period. We also have experienced, and may in the future experience, a delay in receiving commission payments and reports as a result of a CMS regulation prohibiting carriers from paying commissions during the fourth quarter on Medicare Advantage and Medicare Part D prescription drug plans sold during the fourth quarter with an effective date in the following year. Any delay in our receipt of commission payments or reports could materially impact our financial results for a given quarter as we would not be able to recognize the related commission revenue in that quarter. In addition, much of our commission override revenue is not reported and paid to us in accordance with a scheduled pattern, and some is only reported and paid to us once per year. The timing of our revenue recognition could also result in a large amount of commission revenue from a carrier being recorded in a given quarter that is not indicative of the amount of revenue we may receive from that carrier in subsequent quarters, causing fluctuations in our operating results. We also could report revenue below the expectations of our investors or securities analysts in any particular period if a material report or payment from a health insurance carrier were delayed or not received within the time frame required for revenue recognition.
The Medicare annual enrollment period and the implementation of open enrollment periods under health care reform for the purchase of individual and family health insurance present a challenge as they require us to enroll a significant number of individuals into health insurance over a limited period of time. Significant increases in enrollment activity over a limited amount of time may also make it difficult for health insurance carriers to timely and accurately report commission information to us. To the extent health insurance carriers have difficulty in reporting timely and accurate commission information to us, we may be unable to recognize revenue in accordance with our revenue recognition policies, which could cause us to defer substantial revenue until such time our health insurance carriers are able to resume reporting timely and accurate commission information to us. CMS has proposed to reduce the length of the open enrollment period for individual and family health insurance. If this proposal becomes final, it could increase the challenges we face in connection with the open enrollment period and harm our business, operating results and financial condition.
The medical loss ratio requirements that are a part of health care reform
may
harm our business.
The Affordable Care Act contains provisions requiring health insurance carriers to maintain specified medical loss ratios. The medical loss ratio requirements for both individual and family and small business health insurance require health insurance companies to spend 80% of their premium revenue in each of their individual and small group health insurance businesses on reimbursement for clinical services and activities that improve health care quality. The medical loss ratio requirement for Medicare Advantage plans is 85%. If a health insurance carrier fails to meet medical loss ratio requirements, the health insurance carrier is required to rebate a portion of its premium revenue to its members to make up for the difference.
Carrier reaction to the individual and family medical loss ratio requirements was to significantly reduce the commissions we receive in connection with the sale of individual and family health insurance. Health insurance carriers may determine to reduce or further reduce our Medicare Advantage plan, individual and family, or small group commissions as a
19
result of the medical loss ratio requirements or other aspects of health care reform, including any increased expenses in complying with or dealing with the impact of health care reform, which would harm our business, operating results and financial condition. In addition, if health insurance companies fail to meet medical loss ratio requirements, we may be required to pay back commissions that are related to any premium amounts the carriers are required to rebate policyholders as a result, which would harm our business, operating results and financial condition. The medical loss ratio requirements also may cause certain health insurance carriers to limit the geographies in which they sell health insurance or exit certain markets altogether, place less reliance on agents to distribute their plans, or limit their health insurance offerings in any number of other ways, each of which would harm our business, operating results and financial condition. The implementation of medical loss ratio requirements has caused and could further cause health insurance carriers to reduce the amount they are willing to spend in connection with our sponsorship and advertising and technology licensing businesses, which also could harm our business, operating results and financial condition.
Our business may be harmed if we lose our relationship with health insurance carriers whose Medicare-related health insurance products we sell or if our relationship with those carriers changes.
Our Medicare plan-related revenue is concentrated in a small number of health insurance carriers. The success of our Medicare-related health insurance business depends upon our ability to enter into new and maintain existing relationships with health insurance carriers on favorable economic terms. The concentration of our Medicare plan sales in a limited number of health insurance carriers makes us vulnerable to changes in carrier commission rates and changes in the competitiveness of our carriers’ Medicare products. If our Medicare carriers reduce our commission rates, reduce the amount they pay us for advertising services, or the competitiveness of their products declines compared to original Medicare or the products of Medicare carriers with which we do not have a relationship, our business, operating results and financial condition would be harmed.
In addition, we may temporarily or permanently lose the ability to market and sell Medicare plans for our Medicare plan carriers. For instance, a carrier may terminate our relationship. Moreover, CMS heavily regulates the sale of Medicare Advantage and Medicare Part D prescription drug plans and has and will continue to penalize health insurance carriers for certain regulatory violations by suspending or terminating the carrier's ability to market and sell Medicare plans for significant periods of time. CMS also may require the carrier to terminate its membership and allow its members to move to other plans. Given the concentration of our Medicare plan sales in a small number of carriers, if we lose a relationship with a health insurance carrier to market their Medicare plans temporarily or permanently or if the health insurance carrier loses its Medicare product membership, our sales as a health insurance agent and Medicare plan related revenue could suffer significantly, and our business, operating results and financial condition would be harmed. The agreements that we have with health insurance carriers to sell Medicare plans may be unilaterally amended or terminated by the carrier on short notice and the amendment or termination could adversely impact, or cause the termination of, the commission payments that we receive for selling their Medicare plans, including commissions on plans that we have already sold, which could materially harm our business operating results and financial condition.
Our business may be harmed if we do not market Medicare plans effectively or if our websites and marketing materials are not timely approved.
Health insurance carriers whose Medicare plans we sell approve our websites, much of our marketing material and our call center scripts. We must receive these approvals in order for us to be able to generate Medicare plan demand and sell Medicare plans to Medicare-eligible individuals as a health insurance agent. Many of these materials also must be filed with CMS. In addition, we use Medicare plan cost and benefit data collected and made publicly available by CMS. In the event that CMS or a health insurance carrier requires change to, disapproves, or delays approval of our websites, our marketing material or call center scripts, or if CMS does not timely release Medicare plan cost and benefit data for the following year’s Medicare plans prior to the annual enrollment period, we could lose a significant source of Medicare plan demand and our ability to sell Medicare plans would be adversely impacted, each of which would harm our business, operating results and financial condition. CMS broadened its interpretation of rules and regulations relating to Medicare plan-related marketing material so that they apply to websites that we did not previously need to submit to health insurance carriers for approval and file with CMS. This broadened interpretation also applies the same approval and filing process to marketing material of our marketing partners. If we are not successful in timely submitting these marketing materials to health insurance carriers for approval, in gaining that approval and in filing the marketing material with CMS, our Medicare plan marketing could become less effective, which would harm our business, operating results and financial condition. Many of our marketing partners have not consented to the filing of their marketing material with CMS. If a marketing partner of ours does not consent to having its website or other marketing material filed with the CMS, does not make changes required by carriers or CMS or does not comply with the CMS marketing guidelines or other Medicare program related laws, rules and regulations, we may lose the ability to receive referrals
20
of individuals interested in purchasing Medicare plans from that marketing partner or our ability to receive referral could be delayed and our business, operating results and financial condition would be harmed.
In addition, each time we or our marketing partners substantively change our websites or call center scripts after they are filed with CMS, we may need to resubmit them to our health insurance carriers and have them filed with CMS. We are not permitted to make CMS filings ourselves. Given the review cycles our scripts, websites and other marketing material undergo, it is very difficult and time consuming to make changes to them, and our inability to timely make changes to these marketing materials, whether to comply with new rules and regulations or otherwise could adversely impact our ability to sell Medicare plans during the Medicare annual enrollment period or otherwise, which could adversely impact our business, operating results and financial condition. In addition, if a change to scripts or websites is required by CMS or health insurance carriers, we may be prevented from selling Medicare plans during this period of review, which would harm our business, operating results, and financial condition, particularly if it occurred during the annual enrollment period.
Our ability to sell Medicare-related health insurance plans as a health insurance agent depends upon our ability to timely hire, train and retain licensed health insurance agents for our customer care center.
In addition to our websites, we rely upon our customer care centers to sell Medicare plans. The success of our customer care center operations is largely dependent on licensed health insurance agents and other employees. In order to sell Medicare-related health insurance plans, our health insurance agent employees must first be licensed by the states in which they are selling plans and certified and appointed with the health insurance carrier that offers the plans in each state that the Medicare-related health insurance product is being sold by the agent. Because a significant number of Medicare plans are sold in the fourth quarter each year during the Medicare annual enrollment period, we hire and train a significant number of additional employees on a temporary or seasonal basis in a limited period of time. It may be difficult for the health insurance agents we employ and our systems and processes to handle the increased volume of health insurance transactions that occur in a short period of time during the Medicare annual enrollment period. We must also ensure that our health insurance agent employees are timely licensed in a significant number of states and certified and appointed with the health insurance carriers whose products we sell. We depend upon state departments of insurance and health insurance carriers for the licensing, certification and appointment of our health insurance agent employees. We may not be successful in timely hiring a sufficient number of additional licensed agents or other employees for the Medicare annual enrollment
period, and even if we are successful, these employees may experience delays in obtaining health insurance licenses and certifications and health insurance carrier appointments with our health insurance carrier partners. If we and our health insurance agent employees are not successful in these regards, our ability to sell Medicare-related health insurance plans will be impaired during the annual enrollment period, which would harm our business, operating results and financial condition.
Our ability to sell Medicare-related health insurance plans as a health insurance agent depends upon maintenance of functioning information technology systems.
The success of our Medicare plan customer care center operations is dependent on information technology systems. The vast majority of our Medicare plan members utilize our customer care center in connection with their purchase of a Medicare plan. CMS rules require that our health insurance agent employees utilize CMS-approved scripts in connection with the sale of Medicare plans and that we record and maintain the recording of telephonic interactions relating to the sale of Medicare plans. We rely on telephone, call recording, customer relationship management and other systems and technology in our Medicare customer care center operations, and we are dependent upon third parties for some of them, including our telephone and call recording systems. These systems have failed temporarily in the past. The effectiveness and stability of our Medicare customer care center systems and technology are critical to our ability to sell Medicare plans, particularly during the Medicare annual enrollment period, and the failure or interruption of any of these systems and technology or any inability to handle increased volume during the annual enrollment period would harm our business, operating results and financial condition.
Our success in selling Medicare-related health insurance will depend upon a number of factors some of which our outside of our control.
We determined to enter into the Medicare plan market because we believe the number of individuals becoming eligible for Medicare is increasing and these individuals are increasingly using the Internet to shop for health insurance plans. We also believe that, on average, member retention rates and the commissions that health insurance carriers pay in connection with the sale of Medicare plans compare favorably to the member retention rates and commissions we receive in connection with our sale of individual and family health insurance. Should we prove to be wrong, or should these circumstances reverse, our success in marketing Medicare plans would be materially and adversely impacted, which could harm our business, operating
21
results and financial condition. For instance, portions of health care reform impose significant changes to original Medicare and the Medicare Advantage program by, among other things, increasing benefits original Medicare provides, reducing payments to Medicare Advantage plans and imposing medical loss ratio requirements for Medicare Advantage plans. In addition, CMS has in the past determined to reduce the payments it makes to health insurance carriers in connection with the sale of Medicare Advantage plans and it may do so again in the future. These reductions have caused, and could in the future cause, the cost of Medicare Advantage plans to increase or the benefits under Medicare Advantage plans to decrease, either of which would impair our ability to sell Medicare Advantage plans and our business, operating results and financial condition could be harmed. They also may cause health insurance carriers to reduce our compensation, which would harm our business, operating results and financial condition.
The majority of our Medicare-related health insurance plan sales occur over the telephone. Telephone sales of Medicare related health insurance require a licensed health insurance agent to complete and are time consuming compared to sales over the Internet. Given the resources required in connection with telephonic Medicare related health insurance sales, it may prove difficult for us to continue to grow our Medicare-related health insurance sales compared to prior periods. Even if we are able to grow those sales, it may be expensive to add the additional resources necessary for the growth. If we are not able to scalably grow our Medicare related health insurance sales over the Internet or in other ways that require fewer resources, our business, operating results and financial condition would be harmed.
Our success in the Medicare plan market as a health insurance agent will also depend upon a number of additional factors, including:
|
•
|
our ability to continue to adapt our ecommerce platforms to market Medicare plans, including our development or acquisition of marketing tools and features important in the sale of Medicare plans online and the effective modification of our user experience;
|
|
•
|
our success in marketing to Medicare-eligible individuals and in entering into marketing partner relationships to drive Medicare-eligible individuals to our ecommerce platforms on a cost-effective basis;
|
|
•
|
our effectiveness in entering into and maintaining relationships with marketing partners that refer Medicare-eligible individuals to us;
|
|
•
|
our ability to hire and retain additional employees with experience in Medicare, including our ability to timely implement Medicare sales expertise into our customer care centers;
|
|
•
|
our ability to implement and maintain an effective information technology infrastructure for the sale of Medicare plans, including the infrastructure and systems that support our websites, call centers and call recording;
|
|
•
|
our ability to leverage technology in order to sell, and otherwise become more efficient at selling, Medicare-related plans over the telephone;
|
|
•
|
our ability to comply with the numerous, complex and changing laws and regulations and CMS guidelines relating to the marketing and sale of Medicare plans, including continuing to conform our online and offline sales processes to those laws and regulations; and
|
|
•
|
the effectiveness with which our competitors market the availability of Medicare plans from sources other than our ecommerce platforms.
|
As a result of these factors, we may prove unsuccessful in marketing Medicare plans and acting as a health insurance agent in connection with their sale, which would harm our business, operating results and financial condition. In addition, if our efforts to market Medicare plans during any annual enrollment period were impeded due to lack of health insurance carrier or CMS approval, or for other reasons, the impact on our business, operating results and financial condition would be significantly greater given the seasonality of our Medicare-related revenues, membership acquisition and expenses and the fact that much of the sales of Medicare plans occur during this period.
22
The marketing and sale of Medicare plans are subject to numerous, complex and frequently changing laws and regulations, and non-compliance or changes in laws and regulations could harm our business, operating results and financial condition.
The marketing and sale of Medicare plans are subject to numerous laws, regulations and guidelines at the federal and state level. The marketing and sale of Medicare Advantage and Medicare Part D prescription drug plans are principally regulated by CMS. The marketing and sale of Medicare Supplement plans are principally regulated on a state-by-state basis by state departments of insurance. The laws and regulations applicable to the marketing and sale of Medicare plans are numerous, ambiguous and complex, and, particularly with respect to regulations and guidance issued by CMS for Medicare Advantage and Medicare Part D prescription drug plans, change frequently. The telephone calls on which we enroll individuals into Medicare Advantage and Medicare Part D prescription drug plans are required to be recorded. Health insurance carriers audit these recordings for compliance and listen to them in connection with their investigation of complaints pursuant to CMS rules and regulations. In addition, Medicare eligible individuals often receive a special election period and the ability to change Medicare Advantage and Part D prescription drug plans outside the Medicare annual enrollment period in the event the sale of the plan was not in accordance with CMS rules and guidelines. Given CMS’s scrutiny of Medicare product health insurance carriers and the responsibility of the health insurance carriers for actions that we take, health insurance carriers may terminate our relationship with them or take other corrective action if our Medicare product sales, marketing and operations are not in compliance or gives rise to too many complaints. The termination of our relationship with health insurance carriers for this reason would reduce the products we are able to offer, result in the loss of commissions for past and future sales and would otherwise harm our business, operating results and financial condition.
As a result of the laws, regulations and guidelines relating to the sale of Medicare plans, we have altered, and likely will have to continue to alter, our websites and sales process to comply with several requirements that are not applicable to our sale of non-Medicare-related health insurance plans. For instance, many aspects of our online platforms and our marketing material and processes, as well as changes to these platforms, materials and processes, including call center scripts, must be filed on a regular basis with CMS and reviewed and approved by health insurance carriers in light of CMS requirements. In addition, certain aspects of our Medicare plan marketing partner relationships have been in the past, and will be in the future, subjected to CMS and health insurance carrier review. Changes to the laws, regulations and guidelines relating to Medicare plans, their interpretation or the manner in which they are enforced could be incompatible with these relationships, our platforms or our sale of Medicare plans. For instance, we recently experienced a reduction in lead volume from certain business development partners as a result of CMS rule related changes to their advertising. In addition, a change in sales and marketing guidelines issued by CMS resulted in our making changes to our Medicare product sales and marketing processes during the third quarter of 2016 that impacted the effectiveness of our call center agents in converting leads into submitted applications. In February 2015 CMS issued guidance indicating that third party websites and marketing material must be filed for approval with CMS. Health insurance carriers have interpreted this guidance to mean that websites and marketing material of our marketing partners must go through the process of CMS filing and review and approval by health insurance carriers. Our marketing partners may not consent to having their websites or other marketing material filed with CMS. In addition, we have a number of marketing partners who refer leads to us for Medicare-related health insurance products. Given the resources and review required of us and health insurance carriers prior to CMS filing, it is unlikely that we will be able to have all of our marketing partner websites and material filed and approved by CMS, which could harm our business, operating results and financial condition. Even for our marketing partner websites and marketing material that are filed with CMS, they may not make it through the review process in time for the Medicare annual enrollment period. Moreover, under CMS guidance, websites and marketing material must be refiled with CMS if changed, which make it difficult to adapt and optimize our own websites and marketing material as well as our marketing partner websites and marketing material in a short amount of time and could harm our business, operating results and financial condition.
Due to changes in CMS guidance or enforcement or interpretation of existing guidance applicable to our marketing and sale of Medicare products, or as a result of new laws, regulations and guidelines, CMS, state departments of insurance or health insurance carriers may determine to object to or not to approve aspects of our online platforms or marketing material and processes and may determine that certain existing aspects of our Medicare-related business are not in compliance. As a result, the progress of our Medicare operations could be slowed or we could be prevented from operating aspects of our Medicare revenue generating activities altogether, which would harm our business, operating results and financial condition, particularly if it occurred during the Medicare annual enrollment period.
CMS has in the past proposed changing the rules relating to compensation of agents in connection with the sale of Medicare Advantage and Medicare Part D prescription drug plans to reduce our compensation as a health insurance agent in connection with the sale of these plans. In the event CMS adopts regulations that have the effect of reducing the compensation that we receive in connection with the sale of Medicare Advantage and Medicare Part D prescription drug plans, our business, operating results and financial condition would be harmed. For instance, CMS recently proposed a rule that would prohibit
23
carriers from paying the administrative fees that constitute a significant portion of our Medicare Advantage and Medicare Part D prescription drug plan commission revenue on a per member basis. If the rule becomes final, it is unclear whether carriers will pay the administrative fees in another manner and, even if they do, the timeframe in which the alternative would be implemented. As a result, finalization of the rule could adversely impact our Medicare Advantage and Medicare Part D prescription drug plan commission revenue and harm our business, operating results and financial condition. CMS also issued a regulation prohibiting carriers from paying commissions during the fourth quarter on Medicare Advantage and Medicare Part D prescription drug plans sold during the fourth quarter with an effective date in the following year, which negatively impacts our operating cash flows in the fourth quarter of the year. This regulation also makes it more difficult for us to recognize revenue relating to our sale of Medicare Advantage and Medicare Part D prescription drug plans in the fourth quarter of the year, given that our revenue recognition policy requires us to receive either a cash payment or commission statement in the period we recognize revenue, provided we receive the second corroborating communication shortly following the period of recognition. If health insurance carriers do not send at least one of these communications during the fourth quarter, our recognition of revenue relating to our sale of these policies in the fourth quarter will be delayed until we receive the first communication, which would adversely impact our financial results in the fourth quarter. In the event the actions of the federal government, state governments or other circumstances decrease the demand for the Medicare related health insurance that we sell, or result in a reduction in the amount paid to us or impact the timing of our revenue recognition in connection with the sale of these plans, our business, operating results and financial condition could be harmed.
We may be unsuccessful in competing effectively against current and future competitors.
The market for selling health insurance plans is highly competitive. We compete with entities and individuals that offer and sell health insurance plans utilizing traditional distribution channels as well as the Internet. Our competitors include local insurance agents across the United States who sell health insurance plans in their communities. There also are a number of companies that operate websites, provide an online shopping experience for consumers interested in purchasing health insurance and act as a health insurance agent in connection with that purchase. Some local agents also use Internet advertising and “lead aggregator” services that use the Internet to find consumers interested in purchasing health insurance and are compensated for referring those consumers to health insurance agents or carriers. Many health insurance carriers also directly market and sell their plans to consumers through call centers, Internet advertising and their own websites. Although we offer health insurance plans for many of these carriers, they also compete with us by offering their plans directly to consumers. In connection with our marketing of Medicare plans, we compete with the original Medicare program. CMS also offers plan information, comparison tools, call centers and online enrollment for Medicare Advantage and Medicare Part D prescription drug plans. We compete with the FFM and state health insurance exchanges implemented as a result of health care reform in marketing individual and family health insurance products. Health care reform also has resulted in health insurance plan cost and benefit data being more readily accessible, which could facilitate additional competition.
To remain competitive against our current and future competitors, we will need to market our services effectively and continue to improve the online shopping experience and functionalities of our website and other platforms that our current and future customers may access to purchase health insurance products from us. If we cannot predict, develop and deliver the right shopping experience and functionality in a timely and cost-effective manner, or if we are not effective in cost-effectively driving a substantial number of consumers interested in purchasing health insurance to our website and customer care centers, we may not be able to compete successfully against our current or future competitors and our business, operating results and financial condition may be adversely affected.
Some of our current and potential competitors have longer operating histories, larger customer bases, greater brand recognition and significantly greater financial, technical, marketing and other resources than we do. As compared to us, our current and future competitors may be able to:
|
•
|
undertake more extensive marketing campaigns for their brands and services;
|
|
•
|
devote more resources to website and systems development;
|
|
•
|
negotiate more favorable commission rates and commission override payments; and
|
|
•
|
make more attractive offers to potential employees, marketing partners and third-party service providers.
|
In addition, CMS has the ability to regulate our marketing and sale of Medicare Advantage and Medicare Part D prescription drug plans, and government-run health insurance exchanges, including CMS with respect to the FFM, have the ability to regulate our marketing and sale of qualified health plans under health care reform. CMS and the exchanges could impact the commissions we receive in connection with the sale of these plans and impose other restrictions and limitations that
24
make it difficult for us to sell them. Competitive pressures may result in our experiencing increased marketing costs, decreased traffic to our website and loss of market share, or may otherwise harm our business, operating results and financial condition.
If we are not successful in cost-effectively converting visitors to our website
and customer call centers
into members
for which we receive commissions, our business and operating results would be harmed.
Our growth depends in large part upon growth in our membership. The rate at which consumers visiting our ecommerce platform and customer care centers seeking to purchase health insurance are converted into paying members is a significant factor in the growth of our membership. A number of factors have influenced, and could in the future influence, the conversion rate for any given period, some of which are outside of our control. These factors include:
|
•
|
changes in consumer shopping behavior due to circumstances outside of our control, such as economic conditions, consumers’ ability or willingness to pay for health insurance, availability of unemployment benefits or proposed or enacted legislative or regulatory changes impacting our business, including health care reform;
|
|
•
|
the quality of and changes to the consumer experience on our ecommerce platform or with our customer care center;
|
|
•
|
regulatory requirements, including those that make the experience on our online platforms cumbersome or difficult to navigate;
|
|
•
|
the variety, competitiveness and affordability of the health insurance plans that we offer;
|
|
•
|
system failures or interruptions in the operation of our ecommerce platform or call center operations;
|
|
•
|
changes in the mix of consumers who are referred to us through our direct, marketing partner and online advertising member acquisition channels;
|
|
•
|
health insurance carriers offering the health insurance plans for which consumers have expressed interest, and the degree to which our technology is integrated with those carriers;
|
|
•
|
health insurance carrier guidelines applicable to applications submitted by consumers, the amount of time a carrier takes to make a decision on that application and the percentage of submitted applications approved by health insurance carriers;
|
|
•
|
the percentage of our members who did not accept their approved policies and from whom we do not receive commission payments; and
|
|
•
|
our ability to enroll subsidy-eligible individuals in qualified health plans through government-run health insurance exchanges and the efficacy of the process we are required to use to do so.
|
Our conversion rates can be impacted by changes in the mix of consumers referred to us through our member acquisition channels. For example, under the current process we are required to use to enroll subsidy-eligible individuals into qualified health plans through the FFM, our conversion rate for subsidy-eligible individuals is relatively lower than for non-subsidy eligible individuals. In addition, we have experienced an increase in the percentage of mobile phone and tablet visitors to our platforms, and the conversion rate for individuals who use our mobile and tablet platforms to shop for and purchase health insurance has historically been lower than desktop and laptop users. We may make changes to our ecommerce platforms in response to regulatory requirements or undertake other initiatives in an attempt to improve consumer experience or for other reasons. These changes have in the past, and may in the future, have the unintended consequence of adversely impacting our conversion rates. A decline in the percentage of consumers who submit health insurance applications on our ecommerce platforms or telephonically via our customer care centers and are converted into members could cause an increase in our cost of acquiring members on a per member basis. To the extent the rate at which we convert consumers visiting our ecommerce platforms or telephonically via our customer care centers into members suffers, or in the event the number of mobile and tablet visitors to our platforms continue to increase, our membership growth rate may decline, which would harm our business, operating results and financial condition.
Our conversion rates are also impacted by changes in both the percentage of submitted applications that are approved by carriers as well as changes in the percentage of our members who do not accept their approved policies. Any decline in the percentage of submitted applications that result in paying members will adversely impact our commission revenue as well as
25
our membership, which could harm our business, operating results and financial condition. Given that individual and family health insurance purchasing is concentrated during the annual open enrollment period, we may experience a shift in the mix of individual and family health insurance products selected by our new members over a short period of time. Any reduction in our average commission revenue per member during the open enrollment period caused by such a shift or otherwise would also harm our business, operating results and financial condition.
Changes in the quality and affordability of the health insurance plans that carriers offer on our ecommerce platforms could harm our business and operating results.
The demand for health insurance marketed through our ecommerce platforms is impacted by, among other things, the variety, quality and price of the health insurance plans we offer. Many health insurance carriers, including major national health insurance carriers, have exited a large number of state insurance markets where we have historically represented their insurance plans or determined to pay reduced or no commissions for the sale of their plans. We have determined not to sell health insurance products for which we do not receive commissions. As a result of these circumstances, the number of individual and family health insurance plans we offer to sell on our website has reduced significantly and there are many states and zip codes we do not offer any individual and family health insurance. This reduction in supply has adversely impacted, and may in the future adversely impact, demand for the individual and family health insurance we sell. If our ability to sell a variety of high-quality, affordable health insurance plans in the Medicare, individual and family, small business and ancillary product markets is impaired, or our health insurance plan offerings are limited or terminated as a result of consolidation in the health insurance industry, health care reform or otherwise, our sales or average commission rate per member may decrease and our business, operating results and financial condition could be harmed. In addition, the cost of health insurance has increased substantially in many states as a result of health care reform implementation, which has reduced demand for individual and family health insurance. To the extent these conditions persist or worsen, our business, operating results and financial condition would be harmed.
If we are not able to maintain and enhance our brand, our business and operating results will be harmed.
We believe that maintaining and enhancing our brand identity is critical to our relationships with existing members, marketing partners and health insurance carriers and to our ability to attract new members, marketing partners and health insurance carriers. The promotion of our brand in these and other ways may require us to make substantial investments and we anticipate that, as our market becomes increasingly competitive, these branding initiatives may become increasingly difficult and expensive. Our brand promotion activities may not be successful or yield increased revenue, and to the extent that these activities yield increased revenue, the increased revenue may not offset the expenses we incur and our operating results could be harmed. If we do not successfully maintain and enhance our brand, our business may not grow and we could lose our relationships with health insurance carriers, marketing partners and/or members, which would harm our business, operating results and financial condition.
In addition, we have historically received media attention in connection with our public relations efforts. While we cannot be certain of the impact of media coverage on our business, if it were to be reduced or if we were to receive negative publicity, the number of consumers visiting our platforms or customer call centers could decrease, and our cost of acquiring members could increase as a result of a reduction in the number of members coming from our direct member acquisition channel, both of which could harm our business, operating results and financial condition.
System failures or capacity constraints could harm our business and operating results.
The performance, reliability and availability of our ecommerce platforms and underlying network infrastructures are critical to our financial results, our brand and our relationship with members, marketing partners and health insurance carriers. Although we regularly attempt to enhance our ecommerce platform and system infrastructure, system failures and interruptions may occur if we are unsuccessful in these efforts, if we are unable to accurately project the rate or timing of increases in our website traffic or for other reasons, some of which are completely outside our control. Although we have experienced only minor system failures and interruptions to date, we could experience significant failures and interruptions in the future, which would harm our business, operating results and financial condition. If these failures or interruptions occurred during the Medicare annual enrollment period or during the open enrollment period under health care reform, the negative impact on us would be particularly pronounced.
We rely in part upon third-party vendors, including data center and bandwidth providers, to operate our ecommerce platforms. We cannot predict whether additional network capacity will be available from these vendors as we need it, and our network or our suppliers’ networks might be unable to achieve or maintain a sufficiently high capacity of data transmission to allow us to process health insurance applications in a timely manner or effectively download data, especially if our website
26
traffic increases. Any system failure that causes an interruption in or decreases the responsiveness of our services would impair our revenue-generating capabilities and harm our business and operating results and damage our reputation. In addition, any loss of data could result in loss of customers and subject us to potential liability. Our database and systems are vulnerable to damage or interruption from human error, earthquakes, fire, floods, power loss, telecommunications failures, physical or electronic break-ins, computer viruses, acts of terrorism, other attempts to harm our systems and similar events. In addition, our operations are vulnerable to earthquakes in the San Francisco Bay Area and elsewhere in Northern California.
Consumers may access our customer care centers for assistance in connection with submitting health insurance applications. We depend upon third parties, including telephone service providers and third party software providers, to operate our customer care centers. Any failure of the systems that we rely upon in the operation of our customer care centers could negatively impact sales as well as our relationship with consumers and members, which could harm our business, operating results and financial condition.
We depend upon Internet search engines to attract a significant portion of the consumers who visit our website, and if we are unable to effectively advertise on search engines on a cost-effective basis, our business and operating results would be harmed.
We derive a significant portion of our website traffic from consumers who search for health insurance through Internet search engines, such as Google, Bing and Yahoo!. A critical factor in attracting consumers to our website is whether we are prominently displayed in response to an Internet search relating to health insurance. Search engines typically provide two types of search results, algorithmic listings and paid advertisements. We rely on both to attract consumers to our websites.
Algorithmic search result listings are determined and displayed in accordance with a set of formulas or algorithms developed by the particular Internet search engine. The algorithms determine the order of the listing of results in response to the consumer’s Internet search. From time to time, search engines revise these algorithms. In some instances, these modifications have caused our website to be listed less prominently in algorithmic search results, which has resulted in decreased traffic to our website. We may also be listed less prominently as a result of new websites or changes to existing websites that result in these websites receiving higher algorithmic rankings with the search engine. For example, government health insurance exchange websites appear prominently in algorithmic search results. Our website may become listed less prominently in algorithmic search results for other reasons, such as search engine technical difficulties, search engine technical changes and changes we make to our website. In addition, search engines have deemed the practices of some companies to be inconsistent with search engine guidelines and decided not to list their website in search result listings at all. If we are listed less prominently in, or removed altogether from, search result listings for any reason, the traffic to our websites would decline and we may not be able to replace this traffic, which in turn would harm our business, operating results and financial condition. If we decide to attempt to replace this traffic, we may be required to increase our marketing expenditures, which would also increase our cost of member acquisition and harm our business, operating results and financial condition.
We purchase paid advertisements on search engines in order to attract consumers to our website. We typically pay a search engine for prominent placement of our name and website when particular health insurance-related terms are searched for on the search engine, regardless of the algorithmic search result listings. The prominence of the placement of our advertisement is determined by a combination of factors, including the amount we are willing to pay and algorithms designed to determine the relevance of our paid advertisement to a particular search term. As with algorithmic search result listings, search engines may revise the algorithms relevant to paid advertisements and websites other than our ecommerce platform may become more optimized for the algorithms. These changes may result in our having to pay increased amounts to maintain our paid advertisement placement in response to a particular search term. We could also have to pay increased amounts should the market share of major search engines continue to become more concentrated with a single search engine. Additionally, we bid against our competitors and others for the display of these paid search engine advertisements. Many of our competitors, including many health insurance carriers and government-run health insurance exchanges, have greater resources with which to bid and better brand recognition than we do. We have experienced increased competition from health insurance carriers, government health insurance exchanges and some of our marketing partners for both algorithmic search result listings and for paid advertisements. This competition has increased the cost of paid internet search advertising and has increased our marketing and advertising expenses. This competition has increased substantially during the open enrollment periods for individual and family health insurance and Medicare related health insurance and may increase further if these open enrollment periods occur over the same period of time. If paid search advertising costs increase or become cost prohibitive, whether as a results of competition, algorithm changes or otherwise our advertising expenses could rise significantly or we could reduce or discontinue our paid search advertisements, either of which would harm our business, operating results and financial condition.
27
We rely significantly on marketing partners and our business and operating results would be harmed if we are unable to maintain effective relationships with our existing marketing partners or if we do not establish successful relationships with new marketing partners.
In addition to marketing through Internet search engines, we frequently enter into contractual marketing relationships with other online and offline businesses that promote us. These marketing partners include financial and online service companies, affiliate programs and online advertisers and content providers. We also have relationships with marketing partners, including pharmacy chains that promote our Medicare platforms to their customers. We compensate many of our marketing partners for their referrals on a submitted health insurance application basis and, if they are licensed to sell health insurance, may share a percentage of the commission we earn from the health insurance carrier for each member referred by the marketing partner.
Many factors influence the success of our relationship with our marketing partners, including:
|
•
|
the continued positive market presence, reputation and growth of the marketing partner;
|
|
•
|
the effectiveness of the marketing partner in marketing our website and services, including whether the marketing partner is successful in maintaining the prominence of its website in algorithmic search result listings and paid Internet advertisements;
|
|
•
|
the compliance of our marketing partners, and of the manner marketing partners refer consumers to our platforms, with applicable laws, regulations and guidelines;
|
|
•
|
the interest of the marketing partner’s customers in the health insurance plans that we offer on our ecommerce platform;
|
|
•
|
the contractual terms we negotiate with the marketing partner, including the marketing fees we agree to pay a marketing partner;
|
|
•
|
the percentage of the marketing partner’s customers that submit applications or purchase health insurance policies through our ecommerce platform;
|
|
•
|
the ability of a marketing partner to maintain efficient and uninterrupted operation of its website; and
|
|
•
|
our ability to work with the marketing partner to implement website changes, launch marketing campaigns and pursue other initiatives necessary to maintain positive consumer experiences and acceptable traffic volumes.
|
For instance, we partner with Internet lead aggregators who refer a significant number of consumers to our online platforms. Major search engines have in the past and may in the future determine not to list lead aggregator websites prominently in search result listings for various reasons, which would cause a significant reduction in the number of consumers referred to us through our marketing partner channel. While we have relationships with a large number of marketing partners, we depend upon referrals from a limited number of marketing partners for a significant portion of the submitted applications we receive from our marketing partner customer acquisition channel. Moreover, a significant portion of our referrals for the purchase of Medicare plans comes from a single marketing partner.
Given our reliance on our marketing partners, our business operating results and financial condition would be harmed if any of the following were to occur:
|
•
|
if we are unable to maintain successful relationships with our existing marketing partners, particularly marketing partners responsible for a significant number of our submitted applications;
|
|
•
|
if we fail to establish successful relationships with new marketing partners;
|
|
•
|
if we experience competition in our receipt of referrals from our high volume marketing partners; and
|
|
•
|
if we are required to pay increased amounts to our marketing partners.
|
To the extent that health care reform makes it less profitable or desirable for marketing partners to promote us to their customers, we may lose relationships with existing marketing partners or those marketing partners may refer fewer individuals
28
to us. We may also have difficulty entering into relationships with new marketing partners. We may also need to reduce the compensation that we pay to marketing partners to the extent that health care reform has the effect of reducing commissions for individual and family health insurance or causes our members to stay on their health insurance policies for a shorter period of time. There is no guarantee that we will be able to amend our agreements to reduce the compensation that we pay to acceptable levels in light of these factors. If we are not able to do so, our business, operating results and financial condition could be harmed. Competition for referrals from our marketing partners has increased particularly during the open enrollment periods for Medicare-related health insurance and individual and family health insurance. We may lose marketing partner referrals if our competitors pay marketing partners more than we do or be forced to pay increased fees to our marketing partners, which could harm our business, operating results and financial condition. If we lose marketing partner referrals during the Medicare or individual and family health insurance annual open enrollment periods, the adverse impact on our business would be particularly pronounced. In addition, the promulgation of laws, regulations or guidelines, or the interpretation of existing laws, regulations and guidelines, by state departments of insurance or by CMS, could cause our relationships with our marketing partners to be in non-compliance with those laws, regulations and guidelines. For instance, CMS issued guidance that health insurance carriers have interpreted to mean that websites and marketing material of our Medicare-related marketing partners must be filed with CMS before use. Before filing with CMS, these websites and marketing materials will need to undergo a review by health insurance carriers for whom we market Medicare products. Our marketing partners may not consent to having their websites or other marketing material filed with CMS, and we and health insurance carriers may not be able to dedicate the resources necessary to have the websites and marketing material reviewed. If we are not able to do so, our business, operating results and financial condition could be harmed. In addition, as a result of our acquisition of PlanPrescriber, we have marketing partner relationships with pharmacy chains that utilize aspects of our platform and tools. Our relationships with these pharmacy chains result in the referral of a significant number of individuals to us who are interested in purchasing Medicare-related health insurance plans. If CMS or state departments of insurance were to change existing laws, regulations or guidelines, or interpret existing laws, regulations or guidelines, to prohibit these arrangements, or if pharmacy partners otherwise decided to no longer utilize aspects of our platform and tools, we could experience a significant decline in the number of Medicare-eligible individuals who are referred to our platforms and customer care centers, which would harm our business, operating results and financial condition.
We rely on health insurance carriers to accurately and regularly prepare commission reports, and if these reports are inaccurate or not sent to us in a timely manner, our business and operating results could be harmed. We also may not recognize trends in our membership as a result of a lack of information from health insurance carriers.
We rely on health insurance carriers to timely and accurately report the amount of commissions earned by us, and we calculate our commission revenue, prepare our financial reports, projections and budgets and direct our marketing and other operating efforts based on the reports we receive from health insurance carriers. There have been instances where we have determined that policy cancellation data reported to us by a health insurance carrier has not been accurate. Although we recognize commissions reported to us net of estimated cancellations, the extent to which health insurance carriers are inaccurate in their reporting of policy cancellations could cause us to change our cancellation estimates, which could adversely impact our revenues. We apply judgment and make estimates based on historical data and current trends to independently determine whether or not carriers are accurately reporting commissions due to us. To the extent that health insurance carriers understate or fail to accurately report the amount of commissions due to us in a timely manner or at all, we will not recognize revenue to which we are entitled, which would harm our business, operating results and financial condition.
We depend on health insurance carriers and others for data related to our membership. For instance, with respect to health insurance plans other than small business health insurance, health insurance carriers do not directly report member cancellations to us, resulting in the need for us to determine cancellations using payment data that carriers provide. We infer cancellations from this payment data by analyzing whether payments from members have ceased for a period of time, and we may not learn of a cancellation for several months. With respect to our small business membership, many groups notify the carrier directly with respect to increases or decreases in group size and policy cancellations. Our insurance carrier partners often do not communicate this information to us, and it often takes a significant amount of time for us to learn about small business group cancellations and changes in our membership within the group itself. We often are not made aware of policy cancellations until the time of the group’s annual renewal.
A substantial number of our existing members may become eligible for health care reform subsidies in connection with their purchase of health insurance. In addition, the open enrollment periods applicable in connection with the sale of both individual and family health insurance and Medicare-related health insurance condenses purchasing activity over a limited period of time. The increased amount of health insurance purchasing activity and member movement as a result of health care reform over a limited period of time as well as any member turnover that we experience may make it difficult for health insurance carriers to accurately report commission information to us in a timely manner, which would also make it difficult or impossible for us to accurately report and estimate our membership at any given point in time. Delays in accurate reporting of
29
commissions may result in delays in recognition of commission revenue compared to historical patterns and our business, operating results and financial condition could be harmed. In addition, if we experience a disruption in our ability to accurately estimate our membership it could result in a decrease in our stock price as a result of uncertainty relating to our membership base.
After we have estimated membership for a period, we may receive information from health insurance carriers that would have impacted the estimate if we had received the information prior to the date of estimation. We may receive commission payments or other information that indicates that a member who was not included in our estimates for a prior period was in fact an active member at that time, or that a member who was included in our estimates was in fact not an active member of ours. We also reconcile information health insurance carriers provide to us and may determine that we were not historically paid commissions owed to us, which would cause us to have underestimated our membership. As a result of open enrollment periods, we may not receive information from our carriers on as timely a basis due to significant spikes in volume, which could impair the accuracy of our estimates of the number of our members. Additionally, health insurance carriers may require us to return commission payments paid in a prior period due to policy cancellations for members we previously estimated as being active. For these and other reasons, including if current trends in membership cancellation are inconsistent with past cancellation trends that we use to estimate our membership or if carriers subsequently report changes to the commission payments that they previously reported to us, our actual membership could be different from our estimates, perhaps materially. Total revenue per estimated member for the period would also change if our estimated membership changed. Our estimate regarding the average amount of time our members maintain their health insurance plans also could be inaccurate as it depends on the accuracy of our membership estimates.
Economic conditions and other factors beyond our control may negatively impact our business, operating results and financial condition.
Our revenue depends upon demand for health insurance in the individual and family and small business markets, which can be influenced by a variety of factors beyond our control. For instance, as a result of substantial health insurance premium inflation in recent years, we believe that many employers have sought to reduce the costs associated with providing health insurance to their employees, including offering fewer benefits to employees, reducing or eliminating dependent coverage, increasing employee health insurance premium contributions and eliminating health insurance benefits altogether. We have no control over the economic and other factors that influence these trends, and they may reverse. If economic or other factors beyond our control negatively impact our business, our business, operating results and financial condition could be harmed.
We believe that demand for the health insurance and services we offer are impacted by prevailing economic conditions. We cannot be certain of the future impact that economic conditions will have on our business. A softening of demand for health insurance and services offered by us, whether caused by changes in customer preferences or a weak U.S. economy, including as a result of disruptions in the global financial markets or a decrease in general consumer confidence, could adversely impact our operating results. Consumers may attempt to reduce expenses by cancelling existing health insurance purchased through us, determine not to purchase new health insurance through us, or purchase health insurance plans for which we receive lower commissions. To the extent the economy or other factors adversely impact our membership retention or the number or type of health insurance applications submitted through us and that are approved by health insurance carriers, our rate of growth will decline and our business and operating results will be harmed. A continuing negative economic environment could also adversely impact the health insurance carriers whose plans are offered on our ecommerce platform, and they may determine to reduce their commission rates or take other actions that would negatively impact our sale of health insurance as well as our sponsorship and technology licensing businesses.
There are many risks associated with our operations in China.
A portion of our operations is conducted in China. Among other things, we use employees in China to maintain and update our ecommerce platform. This and other information is delivered to us through secured communications over the Internet. Our business would be harmed if this connection temporarily failed, and we were prevented from promptly updating our software or implementing other changes to our database and systems. From time-to-time we receive inquiries from health insurance carriers relating to our operations in China and the security measures we have implemented to protect data that our employees in China may be able to access. As a part of these inquiries, we have implemented additional security measures relating to our operations in China. We may be required to implement further security measures to continue aspects of our operations in China, which could be time consuming and expensive and harm our operating results and financial condition. If we are required to move aspects of our operations from China to our offices in the United States as a result of inquiries from health insurance carriers or for other reasons, it could harm our business, operating results and financial condition. Our operations in China also expose us to different and unfamiliar laws, rules and regulations, including different intellectual
30
property laws, which are not as protective of our intellectual property as the laws in the United States, and different labor and tax laws. United States and Chinese trade laws may impose restrictions on the importation of programming or technology to or from the United States. Additionally, we have recently experienced greater competition for qualified personnel in China, which has raised market salaries and increased our compensation costs related to employees in China. If competition for personnel increases further, our compensation expenses could rise considerably or, if we determine to not increase compensation levels, our ability to attract and retain qualified personnel in China may be impaired, which could harm our business, operating results and financial condition. These risks could cause us to incur increased expenses and could harm our ability to effectively and successfully manage our operations in China, which in turn could cause our business, operating results and financial condition to suffer.
Our sponsorship and advertising business may not be successful.
We sell advertising space to health insurance carriers on our website through our sponsorship and advertising program. Our sponsorship and advertising program allows carriers to purchase advertising space in specific markets in a sponsorship area on our website. Health insurance carriers have generally determined not to spend on individual and family health insurance advertising through our sponsorship and advertising program as a result of the impact of health care reform on the profitability of their individual and family health insurance businesses. To the extent that economic conditions, health care reform or other factors impact the amount health insurance carriers are willing to pay for advertising on our ecommerce platform, our sponsorship and advertising program will be adversely impacted. Since much of our sponsorship revenue depends upon the number of applications we submit to health insurance carriers, a reduction in demand for the carrier’s product (such as outside open enrollment periods) would reduce our sponsorship revenue and our business, operating results and financial condition could be harmed. The success of our sponsorship and advertising program depends on a number of other factors, including the effectiveness of the sponsorship and advertising program as a cost-effective method for carriers to obtain additional members, consumer and health insurance carrier adoption of the Internet and our ecommerce platform as a medium for the purchase and sale of health insurance, our ability to attract consumers visiting our ecommerce platform and convert those consumers into members, the existence of a relationship between us and a diverse group of carriers that offer a number of health insurance plans in the markets in which we attempt to sell advertising, the cost, benefit and brand recognition of the health insurance plan that is the subject of the advertising, the impact the advertising has on the sale of the health insurance plan that is the subject of the advertising and the effectiveness of the carrier’s other means of advertising. In addition, while our practice of selling advertising is described on our ecommerce platform, it could cause consumers to perceive us as not objective, which could harm our brand and result in a decline in our health insurance sales. It also could adversely impact our relationship with health insurance carriers that do not purchase our advertising. As a result, our business, operating results and financial condition could be harmed.
We also develop, host and maintain carrier dedicated Medicare plan websites through our advertising program. Our success in doing so is dependent upon the same factors that could impact our sponsorship program. In addition, since we maintain relationships with a limited number of health insurance carriers to sell their Medicare plans, our Medicare plan-related advertising revenue is concentrated in a small number of health insurance carriers and our ability to generate Medicare plan-related advertising revenue would be harmed by the termination or non-renewal of any of these relationships as well as by a reduction in the amount a health insurance carrier is willing to pay for these services. Moreover, in light of the regulations applicable to the marketing and sale of Medicare plans, and given that these regulations are often unclear, change frequently and are subject to changing interpretations, we may in the future not be permitted to sell Medicare plan-related advertising. If we are not successful in generating Medicare plan-related advertising revenue, our business operating results and financial condition could be harmed.
We may not be able to adequately protect our intellectual property, which could harm our business and operating results.
We believe that our intellectual property is an essential asset of our business and that our technology infrastructure currently gives us a competitive advantage in the distribution of individual and family and small business health insurance. We rely on a combination of copyright, trademark and trade secret laws as well as confidentiality procedures and contractual provisions to establish and protect our intellectual property rights in the United States. We have not filed for protection of our intellectual property in any foreign jurisdiction other than China. We have Chinese-registered computer software copyrights for an internally-developed software system and a project management tool and have certain trademarks in China. We have not filed any patent applications in China. The efforts we have taken to protect our intellectual property may not be sufficient or effective, and our trademarks, copyrights and patents if issued, may be held invalid or unenforceable. Moreover, the law relating to intellectual property is not as developed in China, and our intellectual property rights may not be as respected in China as they are in the United States. Any United States or other patents issued to us may not be sufficiently broad to protect our proprietary technologies, and given the costs of obtaining patent protection, we may choose not to seek patent protection for
31
certain of our proprietary technologies. We may not be effective in policing unauthorized use of our intellectual property, trade secrets and other confidential information, and even if we do detect violations, litigation may be necessary to enforce our intellectual property rights. Any enforcement efforts we undertake, including litigation, could be time-consuming and expensive, could divert our management’s attention and may result in a court determining that our intellectual property or other rights are unenforceable. If we are not successful in cost-effectively protecting our intellectual property rights, trade secrets and confidential information, our business, operating results and financial condition could be harmed.
We may in the future be subject to intellectual property rights claims, which are extremely costly to defend, could require us to pay significant damages and could limit our ability to use certain technologies in the future.
There are a large number of patents, copyrights, trademarks and trade secrets applicable to the internet and technology industries and entities frequently enter into litigation based on allegations of infringement or other violations of intellectual property rights. We have received, and may in the future receive, notices that claim we have misappropriated, infringed or misused other parties’ intellectual property rights, and, to the extent we gain greater visibility, we face a higher risk of being the subject of intellectual property infringement claims. There may be third-party intellectual property rights, including issued or pending patents that cover significant aspects of our technologies or business methods or that cover third-party technology that we use as a part of our websites. Any intellectual property claim against us, with or without merit, could be time consuming, expensive to settle or litigate and could divert our management’s attention and other resources. These claims also could subject us to significant liability for damages and could result in our having to stop using technology found to be in violation of a third party’s rights. We might be required to seek a license for third-party intellectual property, which may not be available on reasonable terms or at all. Even if a license is available, we could be required to pay significant royalties, which would increase our operating expenses. We may also be required to develop alternative non-infringing technology, which could require significant effort and expense. If we cannot license or develop technology for any infringing aspect of our business, we would be forced to limit our services and may be unable to compete effectively. Any of these results would harm our business, operating results and financial condition.
Any legal liability, regulatory penalties, or negative publicity for the information on our website or that we otherwise distribute or provide could harm our business and operating results.
We provide information on our website, through our customer care centers and in other ways regarding health insurance in general and the health insurance plans we market and sell, including information relating to insurance premiums, coverage, benefits, provider networks, exclusions, limitations, availability, plan comparisons and insurance company ratings. A significant amount of both automated and manual effort is required to maintain the considerable amount of insurance plan information on our website. Separately, from time to time, we use the information provided on our website and otherwise collected by us to publish reports designed to educate consumers, facilitate public debate, and facilitate reform at the state and federal level. If the information we provide on our website, through our customer care centers or otherwise is not accurate or is construed as misleading, or if we do not properly assist individuals and businesses in purchasing health insurance, members, health insurance carriers and others could attempt to hold us liable for damages, our relationships with health insurance carriers could be terminated and regulators could attempt to subject us to penalties, revoke our licenses to transact health insurance business in a particular jurisdiction, and/or compromise the status of our licenses to transact health insurance business in other jurisdictions, which could result in our loss of our commission revenue. In the ordinary course of operating our business, we have received complaints that the information we provided was not accurate or was misleading. Although in the past we have resolved these complaints without significant financial cost, we cannot guarantee that we will be able to do so in the future. In addition, these types of claims could be time-consuming and expensive to defend, could divert our management’s attention and other resources, and could cause a loss of confidence in our services. As a result, whether or not we are able to successfully resolve these claims, they could harm our business, operating results and financial condition.
In the ordinary course of our business, we have received and may continue to receive inquiries from state regulators relating to various matters. We have become, and may in the future become, involved in litigation in the ordinary course of our business. If we are found to have violated laws or regulations, we could lose our relationship with health insurance carriers and be subject to various fines and penalties, including revocation of our licenses to sell insurance which would in turn potentially cause us to lose our commission revenue, and our business, operating results and financial condition would be materially harmed.
Acquisitions could disrupt our business and harm our financial condition and operating results
.
We may decide to acquire businesses, products and technologies. Our ability as an organization to successfully make and integrate acquisitions is unproven. Acquisitions could require significant capital infusions and could involve many risks, including the following:
32
|
•
|
an acquisition may negatively impact our results of operations because it will require us to incur transaction expenses, and after the transaction, may require us to incur charges and substantial debt or liabilities, may require the amortization, write down or impairment of amounts related to deferred compensation, goodwill and other intangible assets, or may cause adverse tax consequences, substantial depreciation or deferred compensation charges;
|
|
•
|
an acquisition undertaken for strategic business purposes may negatively impact our results of operations;
|
|
•
|
we may encounter difficulties in assimilating and integrating the business, technologies, products, personnel or operations of companies that we acquire, particularly if key personnel of the acquired company decide not to work for us;
|
|
•
|
an acquisition may disrupt our ongoing business, divert resources, increase our expenses and distract our management;
|
|
•
|
we may be required to implement or improve internal controls, procedures and policies appropriate for a public company at a business that prior to the acquisition lacked these controls, procedures and policies;
|
|
•
|
the acquired businesses, products or technologies may not generate sufficient revenue to offset acquisition costs or to maintain our financial results;
|
|
•
|
we may have to issue equity securities to complete an acquisition, which would dilute our stockholders’ ownership and could adversely affect the market price of our common stock; and
|
|
•
|
acquisitions may involve the entry into geographic or business markets in which we have little or no prior experience.
|
We cannot assure you that we will be able to identify or consummate any future acquisition on favorable terms, or at all. If we do pursue an acquisition, it is possible that we may not realize the anticipated benefits from the acquisition or that the financial markets or investors will negatively view the acquisition. Even if we successfully complete an acquisition, it could harm our business, operating results and financial condition.
If we fail to maintain proper and effective internal controls, our ability to produce accurate financial statements could be impaired, which could adversely affect our operating results, our ability to operate our business and our stock price.
We have a complex business organization. Ensuring that we have adequate internal financial and accounting controls and procedures in place to help ensure that we can produce accurate financial statements on a timely basis is a costly and time-consuming effort that needs to be re-evaluated frequently and is complicated by the expansion of our business operations. Our management, including our chief executive officer and chief financial officer, does not expect that our internal control over financial reporting will prevent all errors or all fraud. A control system, no matter how well designed and operated, can provide only reasonable, not absolute, assurance that the control system’s objectives will be met. Further, the design of a control system must reflect the fact that there are resource constraints, and the benefits of controls must be considered relative to their costs. Controls can be circumvented by the individual acts of some persons, by collusion of two or more people, or by management override of the controls. Over time, controls may become inadequate because changes in conditions or deterioration in the degree of compliance with policies or procedures may occur. Because of the inherent limitations in a cost-effective control system, misstatements due to error or fraud may occur and not be detected. We cannot assure that significant deficiencies or material weaknesses in our internal control over financial reporting will not be identified in the future. Any failure to maintain or implement required new or improved controls, or any difficulties we encounter in their implementation, could result in significant deficiencies or material weaknesses, cause us to fail to timely meet our periodic reporting obligations, or result in material misstatements in our financial statements. Any such failure could also adversely affect the results of periodic management evaluations and annual auditor attestation reports regarding disclosure controls and the effectiveness of our internal control over financial reporting required under Section 404 of the Sarbanes-Oxley Act of 2002 and the rules promulgated thereunder. The existence of a material weakness could result in errors in our financial statements that could result in a restatement of financial statements, cause us to fail to timely meet our reporting obligations and cause investors to lose confidence in our reported financial information, leading to a decline in our stock price and potential lawsuits against us.
33
Changes in our provision for income taxes or adverse outcomes resulting from examination of our income or other tax returns could adversely affect our results.
Our provision for income taxes is subject to volatility and could be adversely affected by earnings differing materially from our projections, changes in the valuation of our deferred tax assets and liabilities, expiration of or lapses in the research and development tax credit laws, tax effects of share-based compensation, outcomes as a result of tax examinations or by changes in tax laws, regulations, accounting principles, including accounting for uncertain tax positions, or interpretations thereof. The related domestic deferred tax assets remain available for use in future periods and will reduce our tax provision if taxable income is generated. To the extent that our provision for income taxes is subject to volatility or adverse outcomes as a result of tax examinations, our operating results could be harmed.
Significant judgment is required to determine the recognition and measurement attribute prescribed in U.S. generally accepted accounting principles (“U.S. GAAP”) relating to accounting for income taxes. In addition, U.S. GAAP applies to all income tax positions, including the potential recovery of previously paid taxes, which if settled unfavorably could adversely impact our provision for income taxes or additional paid-in capital. In addition, we are subject to examinations of our income tax returns by the Internal Revenue Service and other tax authorities. We assess the likelihood of adverse outcomes resulting from these examinations to determine the adequacy of our provision for income taxes. There may be exposure that the outcomes from these examinations will have an adverse effect on our operating results and financial condition.
Regulation of the sale of health insurance is subject to change, and future regulations could harm our business and operating results.
The laws and regulations governing the offer, sale and purchase of health insurance are subject to change, and future changes may be adverse to our business. For example, a long standing provision in each state’s law that we believe is advantageous to our business is that once health insurance premiums are set by the carrier and approved by state regulators, they are fixed and not generally subject to negotiation or discounting by insurance companies or agents. Additionally, state regulations generally prohibit carriers, agents and brokers from providing financial incentives, such as rebates, to their members in connection with the sale of health insurance. As a result, we do not currently compete with carriers or other agents and brokers on the price of the health insurance plans offered on our website. If these regulations change, we could be forced to reduce prices or provide rebates or other incentives for the health insurance plans sold through our ecommerce platform, which would harm our business, operating results and financial condition.
States have, and will continue, to adopt new laws and regulations in response to health care reform legislation. It is difficult to predict how these new laws and regulations will impact our business, but in some cases such laws and regulations could amplify the adverse impacts of health care reform, or states may adopt new requirements that adversely impact our business, operating results and financial condition.
We are also subject to additional insurance regulatory risks, because we use the Internet as a distribution platform. In many cases, it is not clear how existing insurance laws and regulations apply to Internet-related health insurance advertisements and transactions. To the extent that new laws or regulations are adopted that conflict with the way we conduct our business, or to the extent that existing laws and regulations are interpreted adversely to us, our business, operating results and financial condition would be harmed.
If we fail to comply with the numerous
state
laws and regulations that are applicable to the sale of health insurance, our business and operating results
could be harmed.
The sale of health insurance is heavily regulated by each state in the United States. For instance, in addition to the impact and changes in regulations resulting from health care reform, state regulators require us to maintain a valid license in each state in which we transact health insurance business and further require that we adhere to sales, documentation and administration practices specific to that state. In addition, each employee who transacts health insurance business on our behalf must maintain a valid license in one or more states. Because we do business in all 50 states and the District of Columbia, compliance with health insurance-related laws, rules and regulations is difficult and imposes significant costs on our business. Each jurisdiction’s insurance department typically has the power, among other things, to:
|
•
|
grant and revoke licenses to transact insurance business;
|
|
•
|
conduct inquiries into the insurance-related activities and conduct of agents and agencies;
|
34
|
•
|
require and regulate disclosure in connection with the sale and solicitation of health insurance;
|
|
•
|
authorize how, by which personnel and under what circumstances insurance premiums can be quoted and published and an insurance policy sold;
|
|
•
|
approve which entities can be paid commissions from carriers and the circumstances under which they may be paid;
|
|
•
|
regulate the content of insurance-related advertisements, including web pages, and other marketing practices;
|
|
•
|
approve policy forms, require specific benefits and benefit levels and regulate premium rates;
|
|
•
|
impose fines and other penalties; and
|
|
•
|
impose continuing education requirements.
|
Due to the complexity, periodic modification and differing interpretations of insurance laws and regulations, we may not have always been, and we may not always be, in compliance with them. New insurance laws, regulations and guidelines also may not be compatible with the sale of health insurance over the Internet or with various aspects of our platform or manner of marketing or selling health insurance plans. Failure to comply with insurance laws, regulations and guidelines or other laws and regulations applicable to our business could result in significant liability, additional department of insurance licensing requirements, the revocation of licenses in a particular jurisdiction and/or our inability to sell health insurance plans, which could significantly increase our operating expenses, result in the loss of our commission revenue and otherwise harm our business, operating results and financial condition. Moreover, an adverse regulatory action in one jurisdiction could result in penalties and adversely affect our license status or reputation in other jurisdictions due to the requirement that adverse regulatory actions in one jurisdiction be reported to other jurisdictions. Even if the allegations in any regulatory or other action against us are proven false, any surrounding negative publicity could harm consumer, marketing partner or health insurance carrier confidence in us, which could significantly damage our brand. Changes in insurance laws, regulations and guidelines may also be incompatible with various aspects of our business and require that we make significant modifications to our existing technology or practices, which may be costly and time-consuming to implement and could also harm our business, operating results and financial condition.
In addition, we have received, and may in the future receive, inquiries from regulators regarding our marketing and business practices. We typically respond by explaining how we believe we are in compliance with relevant regulations or may modify our practices in connection with the inquiry. Any modification of our marketing or business practices in response to future regulatory inquiries could harm our business, operating results or financial condition.
Our business is subject to security risks and, if we are unable to safeguard the security and privacy of confidential data, including personal health information, our business will be harmed.
Our services involve the collection and storage of confidential information of consumers and the transmission of this information to their chosen health insurance carriers and to government. For example, we collect names, addresses, Social Security and credit card numbers, and information regarding the medical history of consumers. As a result, we are subject to various laws and regulations regarding the collection, maintenance, protection, use, transmission, disclosure and disposal of sensitive personal information. We cannot guarantee that our facilities and systems, and those of our third party service providers, will be free of security breaches, acts of vandalism, computer viruses, misplaced or lost data, programming and/or human errors or other similar events. Compliance with privacy and security laws, requirements and regulations may result in cost increases due to new constraints on our business, the development of new processes, the effects of potential non-compliance by us or third party service providers, and enforcement actions. We may be required to expend significant amounts and other resources to protect against security breaches or to alleviate problems caused by security breaches. Despite our implementation of security measures, techniques used to obtain unauthorized access or to sabotage systems change frequently. As a result, we may be unable to anticipate these techniques or to implement adequate preventative measures. Additionally, our third party service providers may cause security breaches for which we are responsible.
Any compromise or perceived compromise of our security by us or by one of our vendors could damage our reputation, cause the termination of relationships with government-run health insurance exchanges and our members, marketing partners and health insurance carriers, reduce demand for our services and subject us to significant liability and expense as well as regulatory action and lawsuits, which would harm our business, operating results and financial condition. In addition, in the event that additional data security laws are implemented, or our health insurance carrier or other partners determine to impose
35
requirements on us relating to data security, we may not be able to timely comply with such requirements or such requirements may not be compatible with our current processes. Changing our processes could be time consuming and expensive, and failure to timely implement required changes could result in our inability to sell health insurance plans in a particular jurisdiction or for a particular health insurance carrier or subject us to liability for non-compliance, any of which would damage our business, operating results and financial condition. For instance, health insurance carriers may require us to be compliant with Payment Card Industry, or PCI, security standards in order to accept credit card information from consumers. PCI compliance is generally assessed on an annual basis, and we may not always be compliant with PCI standards. If we are not in compliance with PCI standards, we may not be able to accept credit card information from consumers and our relationship with health insurance carriers could be adversely impacted or terminated, which would harm our business, operating results and financial condition.
Government regulation of the Internet could adversely affect our business.
The laws governing general commerce on the Internet remain unsettled and it may take years to fully determine whether and how existing laws such as those governing intellectual property, privacy and taxation apply to the Internet. In addition, the growth and development of the market for electronic commerce may prompt calls for more stringent consumer protection laws that may impose additional burdens on companies conducting business over the Internet. Any new laws or regulations or new interpretations of existing laws or regulations relating to the Internet could harm our business and we could be forced to incur substantial costs in order to comply with them, which would harm our business, operating results and financial condition.
Our business could be harmed if we are unable to correspond with our consumers or market the availability of our ecommerce platform by email.
We use email to market our services to potential members and as the primary means of communicating with our existing members. The laws and regulations governing the use of email for marketing purposes continue to evolve and the growth and development of the market for commerce over the Internet may lead to the adoption of additional laws. If new laws or regulations are adopted, or existing laws and regulations are interpreted, to impose additional restrictions on our ability to send email to our members or potential members, we may not be able to communicate with them in a cost-effective manner. In addition to legal restrictions on the use of email, Internet service providers, e-mail service providers and others attempt to block the transmission of unsolicited email, commonly known as “spam.” Many Internet and e-mail service providers have relationships with organizations whose purpose it is to detect and notify the Internet and e-mail service providers of entities that the organization believes is sending unsolicited e-mail. If an Internet or e-mail service provider identifies email from us as “spam” as a result of reports from these organizations or otherwise, we can be placed on a restricted list that will block our email to members or potential members. If we are unable to communicate by email with our members and potential members as a result of legislation, blockage or otherwise, our business, operating results and financial condition would be harmed.
Consumers depend upon third-party service providers to access our website, and our business and operating results could be harmed as a result of technical difficulties experienced by these service providers.
Consumers using our website depend upon Internet, online and other service providers for access to our website. Many of these service providers have experienced significant outages, delays and other difficulties in the past and could experience them in the future. Any significant interruption in access to our website or increase in our website’s response time as a result of these difficulties could damage our relationship with insurance carriers, marketing partners and existing and potential members and could harm our business, operating results and financial condition.
Risks Related to the Ownership of Our Common Stock
The trading price of our common stock may be subject to significant fluctuations and volatility, and our stockholders may be unable to resell their shares at a profit.
The stock markets, in general, and the markets for high technology stocks in particular, have historically experienced high levels of volatility. The market for technology stocks has been extremely volatile and frequently reaches levels that bear no relationship to the past or present operating performance of those companies. These broad market fluctuations may adversely affect the trading price of our common stock. In addition, the trading price of our common stock has been subject to significant fluctuations and may continue to fluctuate or decline, particularly as a result of developments relating to health care reform legislation and the implementation of health care reform. Other factors that could cause fluctuations in the trading price of our common stock include, but are not limited to, the following:
36
|
•
|
price and volume fluctuations in the overall stock market from time to time;
|
|
•
|
significant volatility in the market price and trading volume of technology companies in general, and companies in our industry;
|
|
•
|
actual or anticipated changes in our results of operations or fluctuations in our operating results;
|
|
•
|
actual or anticipated changes in the expectations of investors or securities analysts, including changes in financial estimates or investment recommendations by securities analysts who follow our business and changes in perceptions relating to the economy;
|
|
•
|
speculation in the press or investment community;
|
|
•
|
technological advances or introduction of new products by us or our competitors;
|
|
•
|
actual or anticipated developments in our competitors’ businesses or the competitive landscape generally;
|
|
•
|
litigation involving us, our industry or both;
|
|
•
|
actual or anticipated legal or regulatory developments in the United States or foreign countries, including health care reform legislation in the United States;
|
|
•
|
major catastrophic events;
|
|
•
|
announcements or developments relating to the economy;
|
|
•
|
our sale of common stock or other securities in the future;
|
|
•
|
the trading volume of our common stock, as well as sales of large blocks of our stock; or
|
|
•
|
departures of key personnel.
|
These factors, as well as general economic and political conditions and the announcement of proposed and completed acquisitions or other significant transactions, or any difficulties associated with such transactions, by us or our strategic partners, customers or our current competitors, may materially adversely affect the market price of our common stock in the future. In the past, following periods of volatility in the market price of a company’s securities, securities class action litigation has often been instituted against that company. Such litigation could result in substantial cost and a diversion of management’s attention and resources. In addition, volatility, lack of positive performance in our stock price or changes to our overall compensation program, including our equity incentive program, may adversely affect our ability to retain key employees.
Our actual operating results may differ significantly from our guidance.
From time to time, we have released, and may continue to release guidance in earnings conference calls, earnings releases, or otherwise, regarding our future performance that represents our management's estimates as of the date of release. This guidance, which includes forward-looking statements, has been and will be based on projections prepared by our management. These projections are not prepared with a view toward compliance with published guidelines of the American Institute of Certified Public Accountants, and neither our registered public accountants nor any other independent expert or outside party compiles or examines the projections. Accordingly, no such person expresses any opinion or any other form of assurance with respect to the projections.
Projections are based upon a number of assumptions and estimates that, while presented with numerical specificity, are inherently subject to significant business, economic and competitive uncertainties and contingencies, many of which are beyond our control and are based upon specific assumptions with respect to future business decisions, some of which will change. We may state possible outcomes as high and low ranges. Any range we provide is not intended to imply that actual results could not fall outside of the suggested ranges. The principal reason that we release guidance is to provide a basis for our management to discuss our business outlook with analysts and investors and we may decide to suspend guidance at any time. We do not accept any responsibility for any projections or reports published by any such third parties.
37
Guidance is necessarily speculative in nature, and it can be expected that some or all of the assumptions underlying the guidance furnished by us will not materialize or will vary significantly from actual results. Accordingly, our guidance is only an estimate of what management believes is realizable as of the date of release. Our actual results have, and may in the future, vary from our guidance and the variations may be material. In light of the foregoing, investors are urged not to rely upon our guidance in making an investment decision regarding our common stock.
Any failure to successfully implement our operating strategy or the occurrence of any of the events or circumstances set forth in this “Risk Factors” section in this Annual Report on Form 10-K could result in the actual operating results being different from our guidance, and the differences may be adverse and material.
A limited number of stockholders have the ability to influence the outcome of director elections and other matters requiring stockholder approval.
A small number of stockholders and their affiliated entities beneficially owned more than 50% percent of our outstanding common stock as of
December 31, 2016
. These stockholders, if they act together, could exert substantial influence over matters requiring approval by our stockholders, including the election of directors, the amendment of our certificate of incorporation and bylaws and the approval of mergers or other business combination transactions. This concentration of ownership may discourage, delay or prevent a change in control of our company, which could deprive our stockholders of an opportunity to receive a premium for their stock as part of a sale of our company and might reduce our stock price. These actions may be taken even if they are opposed by other stockholders.
Certain provisions in our charter documents and Delaware law could discourage takeover attempts and lead to management entrenchment.
Our certificate of incorporation and bylaws contain provisions that could have the effect of delaying or preventing changes in control or changes in our management without the consent of our board of directors. These provisions include:
|
•
|
a classified board of directors with three-year staggered terms, which may delay the ability of stockholders to change the membership of a majority of our board of directors;
|
|
•
|
cumulative voting in the election of directors is prohibited, which limits the ability of minority stockholders to elect director candidates;
|
|
•
|
the exclusive right of our board of directors to elect a director to fill a vacancy created by the expansion of the board of directors or the resignation, death or removal of a director, which prevents stockholders from being able to fill vacancies on our board of directors;
|
|
•
|
the ability of our board of directors to determine to issue shares of preferred stock and to determine the price and other terms of those shares, including preferences and voting rights, without stockholder approval, which could be used to significantly dilute the ownership of a hostile acquiror;
|
|
•
|
a prohibition on stockholder action by written consent, which forces stockholder action to be taken at an annual or special meeting of our stockholders;
|
|
•
|
the requirement that a special meeting of stockholders may be called only by the chairman of the board of directors, the chief executive officer or the board of directors, which may delay the ability of our stockholders to force consideration of a proposal or to take action, including the removal of directors; and
|
|
•
|
advance notice procedures that stockholders must comply with in order to nominate candidates to our board of directors or to propose matters to be acted upon at a stockholders’ meeting, which may discourage or deter a potential acquiror from conducting a solicitation of proxies to elect the acquiror’s own slate of directors or otherwise attempting to obtain control of us.
|
We are also subject to certain anti-takeover provisions under Delaware law. Under Delaware law, a corporation may, in general, not engage in a business combination with any holder of 15% or more of its capital stock unless the holder has held the stock for three years or, among other things, the board of directors has approved the transaction.
38
ITEM 1B. UNRESOLVED STAFF COMMENTS
None.
ITEM 2. PROPERTIES
The following table sets forth the location, approximate square footage and primary use of each of the principal properties we occupied at
December 31, 2016
:
|
Location
|
Approximate Square Footage
|
Primary Use
|
||
|
Mountain View, California – 340 and 440 East Middlefield Road
|
36,012
|
Corporate headquarters, marketing and advertising, technology and content and general and administrative
|
||
|
Gold River, California
|
44,738
|
customer care and enrollment, technology and content and general and administrative
|
||
|
South Jordan, Utah
|
27,830
|
customer care and enrollment
|
||
|
Xiamen, China
|
52,930
|
technology and content, customer care and enrollment, marketing and advertising and general and administrative
|
||
We lease all of our principal properties. In addition, we also lease office facilities in San Francisco, California and Westford, Massachusetts for marketing and advertising, technology and content, customer care and enrollment, and general and administrative personnel. We believe our existing facilities are adequate for our current needs and that suitable additional space will be available in the future to accommodate any expansion of our operations, if necessary. As of December 31, 2015 we had 11,275 square feet of excess space available in our Gold River, California facility that we had vacated as a result of a workforce reduction. We reoccupied approximately 5,400 square feet of this previously vacated office space in 2016.
ITEM 3. LEGAL PROCEEDINGS
On January 26, 2017, a purported class action lawsuit was filed against the Company in the Superior Court of the State of California, County of Santa Clara. The complaint alleges that the Company negligently failed to take necessary precautions required to protect from unauthorized disclosure of personally identifiable information contained on Form W-2s of certain of our current and former employees. The complaint purports to allege causes of action against the Company for negligence, violation of Section 17200 et seq. of the California Business & Professions Code, declaratory relief and breach of implied contract. The complaint seeks actual damages, punitive damages, statutory damages, costs, including experts’ fees and attorneys’ fees, pre-judgment and post-judgment interest as prescribed by law and equitable, injunctive and declaratory relief as appropriate. Because the case is at a preliminary stage, we cannot estimate the likelihood of liability or the amount of potential damages.
In the ordinary course of our business, we have received and may continue to receive inquiries from state regulators relating to various matters. We have become, and may in the future become, involved in litigation in the ordinary course of our business. If we are found to have violated laws or regulations in any jurisdiction, we could be subject to various fines and penalties, including revocation of our license to sell insurance in those states, and our business, operating results and financial condition would be harmed. Revocation of any of our licenses or penalties in one jurisdiction could cause our license to be revoked or for us to face penalties in other jurisdictions. In addition, without a health insurance license in a jurisdiction, carriers would not pay us commissions for the products we sold in that jurisdiction, and we would not be able to sell new health insurance products in that jurisdiction. We could also be harmed to the extent that related publicity damages our reputation as a trusted source of objective information relating to health insurance and its affordability. It could also be costly to defend ourselves regardless of the outcome.
ITEM 4. MINE SAFETY DISCLOSURES
Not applicable.
39
PART II
|
ITEM 5.
|
MARKET FOR REGISTRANT'S COMMON EQUITY, RELATED STOCKHOLDER MATTER AND ISSUER PURCHASES OF EQUITY SECURITIES
|
Our common stock has been quoted on The NASDAQ Global Market under the symbol “EHTH” since our initial public offering on October 13, 2006. Prior to that time, there was no public market for our stock. As of
February 28, 2017
, there were 31 stockholders of record of our common stock (which does not include the number of stockholders holding shares of our common stock in “street name”) and the closing price of our common stock was $10.96 per share on
February 28, 2017
as reported by The NASDAQ Global Market.
The following table sets forth for the indicated period the closing high and low sales prices for our common stock as reported on The NASDAQ Global Market.
|
|
High
|
Low
|
|||||
|
First Quarter 2016
|
$
|
10.96
|
|
$
|
8.14
|
|
|
|
Second Quarter 2016
|
$
|
15.14
|
|
$
|
8.45
|
|
|
|
Third Quarter 2016
|
$
|
14.39
|
|
$
|
8.98
|
|
|
|
Fourth Quarter 2016
|
$
|
11.61
|
|
$
|
6.38
|
|
|
|
Year 2016
|
$
|
15.14
|
|
$
|
6.38
|
|
|
|
|
High
|
Low
|
|||||
|
First Quarter 2015
|
$
|
24.23
|
|
$
|
9.10
|
|
|
|
Second Quarter 2015
|
$
|
13.50
|
|
$
|
9.31
|
|
|
|
Third Quarter 2015
|
$
|
16.27
|
|
$
|
12.11
|
|
|
|
Fourth Quarter 2015
|
$
|
13.43
|
|
$
|
9.98
|
|
|
|
Year 2015
|
$
|
24.23
|
|
$
|
9.10
|
|
|
Dividend Policy
We have never declared or paid any cash dividend on our common stock. We currently do not expect to pay any dividends in the foreseeable future.
Unregistered Sales of Equity Securities
During the year ended
December 31, 2016
, we did not issue or sell any shares of our common stock or other equity securities pursuant to unregistered transactions in reliance upon an exemption from the registration requirements of the Securities Act of 1933, as amended.
Securities Authorized for Issuance under Equity Compensation Plans
See Item 12, “Security Ownership of Certain Beneficial Owners and Management and Related Stockholder Matters” for information regarding securities authorized for issuance.
Issuer Purchases of Equity Securities
We did not repurchase any of our common stock during the year and quarter ended
December 31, 2016
.
STOCK PERFORMANCE GRAPH
The following information relating to the price performance of our common stock shall not be deemed “filed” with the Securities and Exchange Commission or “soliciting material” under the Securities Exchange Act of 1934, as amended, or subject to Regulation 14A or 14C, or to liabilities under Section 18 of the Exchange Act, except to the extent that we specifically request that such information be treated as soliciting material or to the extent that we specifically incorporate this information by reference.
The graph below matches our cumulative total stockholder return on our common stock with the cumulative 5-year total returns on the NASDAQ Composite index and the Research Data Group (“RDG”) Internet Composite index. The graph
40
tracks the performance of a $100 investment in our common stock and in each index (with the reinvestment of all dividends) from December 31, 2011 to December 31, 2016.
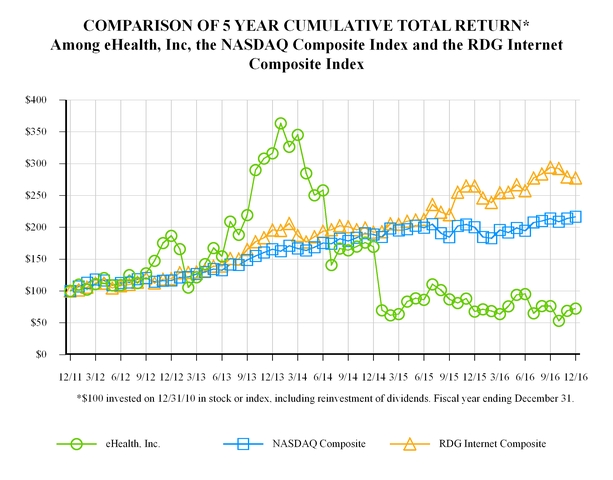
|
12/31/11
|
12/31/12
|
12/31/13
|
12/31/14
|
12/31/15
|
12/31/16
|
||||||||||||||||||
|
eHealth, Inc.
|
$
|
100.00
|
|
$
|
186.94
|
|
$
|
316.26
|
|
$
|
169.52
|
|
$
|
67.89
|
|
$
|
72.45
|
|
|||||
|
NADAQ Composite
|
100.00
|
|
116.41
|
|
165.24
|
|
188.69
|
|
200.32
|
|
216.54
|
|
|||||||||||
|
RDG Internet Composite
|
100.00
|
|
119.34
|
|
195.22
|
|
192.42
|
|
264.96
|
|
277.56
|
|
|||||||||||
The stock price performance included in this graph is not necessarily indicative of future stock price performance.
41
|
ITEM 6.
|
SELECTED CONSOLIDATED FINANCIAL DATA
|
The following selected consolidated financial data should be read in conjunction with “Management’s Discussion and Analysis of Financial Condition and Results of Operations” and with our consolidated financial statements and accompanying notes included in this Annual Report on Form 10-K.
|
Consolidated Statements of Operations Data (in thousands, except per share amounts):
|
|||||||||||||||||||
|
Year Ended December 31,
|
|||||||||||||||||||
|
|
2012
|
2013
|
2014
|
2015
|
2016
|
||||||||||||||
|
Revenue:
|
|
|
|
|
|
|
|
|
|
|
|||||||||
|
Commission
|
$
|
130,663
|
|
$
|
153,383
|
|
$
|
158,626
|
|
$
|
171,257
|
|
$
|
170,850
|
|
||||
|
Other
|
24,810
|
|
25,797
|
|
21,051
|
|
18,284
|
|
16,110
|
|
|||||||||
|
Total revenue
|
155,473
|
|
179,180
|
|
179,677
|
|
189,541
|
|
186,960
|
|
|||||||||
|
Operating costs and expenses:
|
|
|
|
|
|
|
|
|
|
|
|||||||||
|
Cost of revenue
|
4,783
|
|
5,461
|
|
4,494
|
|
4,178
|
|
3,176
|
|
|||||||||
|
Marketing and advertising
(1)
|
57,789
|
|
71,660
|
|
69,732
|
|
75,571
|
|
72,213
|
|
|||||||||
|
Customer care and enrollment
(1)
|
30,282
|
|
35,099
|
|
42,745
|
|
42,540
|
|
47,930
|
|
|||||||||
|
Technology and content
(1)
|
21,406
|
|
32,579
|
|
40,390
|
|
36,351
|
|
32,749
|
|
|||||||||
|
General and administrative
(1)
|
26,169
|
|
29,235
|
|
27,549
|
|
30,858
|
|
36,004
|
|
|||||||||
|
Restructuring
(1)
|
—
|
|
—
|
|
—
|
|
4,541
|
|
(297
|
)
|
|||||||||
|
Amortization of intangible assets
|
1,615
|
|
1,414
|
|
1,529
|
|
1,153
|
|
1,040
|
|
|||||||||
|
Total operating costs and expenses
|
142,044
|
|
175,448
|
|
186,439
|
|
195,192
|
|
192,815
|
|
|||||||||
|
Income (loss) from operations
|
13,429
|
|
3,732
|
|
(6,762
|
)
|
(5,651
|
)
|
(5,855
|
)
|
|||||||||
|
Other income (expense), net
|
23
|
|
(92
|
)
|
(98
|
)
|
45
|
|
102
|
|
|||||||||
|
Income (loss) before provision (benefit) for income taxes
|
13,452
|
|
3,640
|
|
(6,860
|
)
|
(5,606
|
)
|
(5,753
|
)
|
|||||||||
|
Provision (benefit) for income taxes
|
6,370
|
|
1,917
|
|
9,345
|
|
(843
|
)
|
(871
|
)
|
|||||||||
|
Net income (loss)
|
$
|
7,082
|
|
$
|
1,723
|
|
$
|
(16,205
|
)
|
$
|
(4,763
|
)
|
$
|
(4,882
|
)
|
||||
|
Net income (loss) per share:
|
|
|
|
|
|
|
|
|
|||||||||||
|
Basic
|
$
|
0.36
|
|
$
|
0.09
|
|
$
|
(0.88
|
)
|
$
|
(0.26
|
)
|
$
|
(0.27
|
)
|
||||
|
Diluted
|
$
|
0.34
|
|
$
|
0.09
|
|
$
|
(0.88
|
)
|
$
|
(0.26
|
)
|
$
|
(0.27
|
)
|
||||
|
Weighted average number of shares used in per share amounts:
|
|
|
|
|
|
|
|
|
|
|
|||||||||
|
Basic
|
19,867
|
|
19,145
|
|
18,367
|
|
18,008
|
|
18,272
|
|
|||||||||
|
Diluted
|
20,753
|
|
19,846
|
|
18,367
|
|
18,008
|
|
18,272
|
|
|||||||||
|
(1)
|
Includes stock-based compensation as follows:
|
|
|
Year Ended December 31,
|
||||||||||||||||||
|
|
2012
|
2013
|
2014
|
2015
|
2016
|
||||||||||||||
|
Marketing and advertising
|
$
|
1,215
|
|
$
|
2,112
|
|
$
|
1,692
|
|
$
|
1,950
|
|
$
|
1,237
|
|
||||
|
Customer care and enrollment
|
321
|
|
342
|
|
386
|
|
477
|
|
497
|
|
|||||||||
|
Technology and content
|
1,021
|
|
1,641
|
|
1,611
|
|
1,728
|
|
1,836
|
|
|||||||||
|
General and administrative
|
3,065
|
|
3,707
|
|
2,188
|
|
2,734
|
|
3,696
|
|
|||||||||
|
Restructuring
|
—
|
|
—
|
|
—
|
|
113
|
|
—
|
|
|||||||||
|
Total
|
$
|
5,622
|
|
$
|
7,802
|
|
$
|
5,877
|
|
$
|
7,002
|
|
$
|
7,266
|
|
||||
42
|
|
As of December 31,
|
||||||||||||||||||
|
|
2012
|
2013
|
2014
|
2015
|
2016
|
||||||||||||||
|
Consolidated Balance Sheet Data (in thousands):
|
|
||||||||||||||||||
|
Cash and cash equivalents
|
$
|
140,849
|
|
$
|
107,055
|
|
$
|
51,415
|
|
$
|
62,710
|
|
$
|
61,781
|
|
||||
|
Working capital
|
135,249
|
|
97,220
|
|
39,738
|
|
45,606
|
|
48,218
|
|
|||||||||
|
Total assets
|
196,301
|
|
166,426
|
|
106,664
|
|
113,319
|
|
108,899
|
|
|||||||||
|
Non-current liabilities
|
4,625
|
|
6,165
|
|
6,449
|
|
4,962
|
|
3,374
|
|
|||||||||
|
Retained earnings
|
28,743
|
|
30,466
|
|
14,261
|
|
9,498
|
|
4,616
|
|
|||||||||
|
Total stockholders’ equity
|
170,867
|
|
133,017
|
|
73,478
|
|
76,421
|
|
77,601
|
|
|||||||||
|
Year Ended December 31,
|
|||||||||||
|
|
2014
|
2015
|
2016
|
||||||||
|
Revenue By Segment Data (in thousands):
|
|
|
|
||||||||
|
Medicare
|
$
|
44,479
|
|
$
|
63,163
|
|
$
|
80,269
|
|
||
|
Individual, Family and Small Business
|
135,198
|
|
126,378
|
|
106,691
|
|
|||||
|
Total revenue
|
$
|
179,677
|
|
$
|
189,541
|
|
$
|
186,960
|
|
||
43
|
ITEM 7.
|
MANAGEMENT'S DISCUSSION AND ANALYSIS OF FINANCIAL CONDITION AND RESULTS OF OPERATIONS
|
Overview
We are a leading private health insurance exchange for individuals, families and small businesses. Through our website addresses (
www.eHealth.com
,
www.eHealthInsurance.com
,
www.eHealthMedicare.com, www.Medicare.com
and
www.PlanPrescriber.com)
, consumers can get quotes from leading health insurance carriers, compare plans side-by-side, and apply for and purchase Medicare-related, individual and family, small business and ancillary health insurance plans. Our ecommerce technology also enables us to deliver consumers’ health insurance applications electronically to health insurance carriers. As a result, we simplify and streamline the complex and traditionally paper-intensive health insurance sales and purchasing process.
We have invested heavily in technology and content related to our ecommerce platforms. We have also invested significant time and resources in obtaining licenses to sell health insurance in all 50 states and the District of Columbia, developing member acquisition programs, obtaining necessary regulatory approvals of our websites and establishing relationships and appointments with leading health insurance carriers, enabling us to offer thousands of health insurance plans online. Our ecommerce platforms can be accessed directly through our websites as well as through our network of marketing partners.
During the fourth quarter of 2016, we began evaluating our business performance and managing our operations as two distinct reporting segments - Medicare and Individual, Family and Small Business. For more information on segment and geographic information, see Note1
Summary of Business and Significant Accounting Policies
and Note 9
Operating Segments, Geographic Information and Significant Customers
in the Notes to Consolidated Financial Statements of this Annual Report on Form 10-K.
Sources of Revenue
Commission Revenues
We generate revenue primarily from commissions we receive from health insurance carriers whose health insurance policies are purchased through our ecommerce platforms. Commission revenue represented
88%
,
90%
and
91%
of our total revenue in the years ended
December 31, 2014
,
2015
and
2016
, respectively.
We typically enter into contractual agency relationships with health insurance carriers that are non-exclusive and terminable on short notice by either party for any reason. In addition, health insurance carriers often have the ability to terminate or amend our agreements unilaterally on short notice, including provisions in our agreements relating to our commission rates. The amendment or termination of an agreement we have with a health insurance carrier may adversely impact the commissions we are paid on health insurance plans that we have already sold through the carrier. See
Critical Accounting Policies and Estimates
for details regarding our recognition of commission revenue.
We actively market a large selection of Medicare-related health insurance plans through our Medicare ecommerce platforms (
www.eHealthMedicare.com
,
www.Medicare.com
and
www.PlanPrescriber.com
). Our Medicare ecommerce platforms and telephonic enrollment capabilities enable consumers to research, compare and purchase Medicare-related health insurance plans, including Medicare Advantage, Medicare Supplement and Medicare Part D prescription drug plans. To the extent that we assist in the sale of Medicare-related insurance plans as a health insurance agent, either online or telephonically, we generate revenue from commissions we receive from health insurance carriers. Medicare Advantage and Medicare Part D prescription drug plan pricing is set by health insurance carriers and approved by the Centers for Medicare and Medicaid Services or CMS, an agency of the United States Department of Health and Human Services, and is not subject to negotiation or discounting by health insurance carriers or our competitors. Similarly, Medicare Supplement plan pricing is set by the health insurance carrier and approved by state regulators and is not subject to negotiation or discounting by health insurance carriers or our competitors.
We have historically sold a significant portion of the Medicare plans that we sell during the year
in the fourth quarter during the Medicare annual enrollment period, when Medicare-eligible individuals are permitted to change their Medicare Advantage and Medicare Part D prescription drug coverage for the following year. During 2014, 2015 and 2016, 62%, 56% and 49%, respectively, of our Medicare plan-related applications were submitted during the fourth quarter.
44
As a result, we generate a significant portion of our commission revenues related to new Medicare plan-related enrollments in the fourth quarter. During the first quarter, we recognize substantially all of our Medicare Advantage and Medicare Part D prescription drug plan renewal commission revenue as substantially all Medicare Advantage and Medicare Part D policies renew on January 1 of each year. CMS recently proposed a rule that would prohibit carriers from paying administrative fees on a per member basis. These fees constitute a significant portion of our Medicare Advantage and Medicare Part D prescription drug plan commission revenue. While many have commented on and objected to the proposed rule, should the rule become final, it is unclear whether carriers will pay the administrative fees in another manner and when they would begin to do so and our Medicare Advantage and Medicare Part D prescription drug plan commission revenue could be adversely impacted, which would harm our business, operating results and financial condition.
In addition to Medicare plans, we also actively market individual and family, small business and ancillary health insurance plans through our ecommerce platforms (
www.eHealth.com
and
www.eHealthInsurance.com
), and generate revenue from commissions we receive from health insurance carriers whose plans are purchased through us, as well as commission override payments we receive for achieving sales volume thresholds or other objectives. We market a variety of ancillary products including but not limited to short-term health insurance, dental, vision, life, short term disability and long term disability insurance. These ancillary products are offered to our members on a standalone basis and with other products.
In March 2010, the federal Patient Protection and Affordable Care Act and related amendments in the Health Care and Education Reconciliation Act were signed into law. These health care reform laws contain provisions that changed and will continue to change the health insurance industry in substantial ways. We have described various aspects of health care reform in
Part I, Item 1., Business - Health Care Reform
and
Part I, Item 1A., Risk Factors - Risks Related to Our Business
. Various aspects of health care reform may impact our business positively. For instance, the mandate that individuals and families have qualified health insurance or face a tax penalty and the government providing individuals and families’ subsidies in the form of premium tax credits and cost sharing reductions are provisions in the law that could benefit our business. Notwithstanding these aspects of health care reform, the implementation of health care reform has significantly reduced our individual and family health insurance membership and individual and family health insurance commission revenue and could in the future have a material adverse effect on our business and results of operations.
Health care reform established annual open enrollment periods for the purchase of individual and family health insurance. The initial open enrollment period under health care reform began in October 2013 and ended in March 2014 for coverage effective in 2014. Subsequent open enrollment periods for individual and family health insurance have begun in November and ended on January 31 in the following year. Individuals and families generally are not able to purchase individual and family health insurance outside of the annual enrollment periods, unless they qualify for a special enrollment period as a result of certain qualifying events, such as losing employer-sponsored health insurance or moving to another state. The open enrollment period has changed the seasonality of our individual and family health insurance business and individual and family health insurance submitted applications. It also presents challenges to our ability to enroll a significant number of individuals and families into health insurance over a limited period of time and significantly reduces our ability to obtain new health insurance members outside of the open enrollment period. In addition, CMS tightened the requirements for individuals to qualify for a special enrollment period starting in 2016. We have not enrolled a significant number of individuals in individual and family health insurance outside of the open enrollment period.
A substantial number of individuals and families are eligible for subsidies under health care reform. Health care reform’s establishment of government-run health insurance exchanges through which individuals and families must purchase qualified health plans to receive government subsidies has increased our competition as individual and families may purchase qualified health plans directly from government exchanges. While they are not required to do so, government-run exchanges are permitted to allow agents and brokers to enroll individuals and families into qualified health plans through government-run exchanges. We have entered into an agreement with, and enrolled individuals and families into qualified health plans through, the Federally Facilitated Marketplace or FFM, run by CMS. The FFM operated some part of the health insurance exchange in 36 states during the last health care reform open enrollment period.
Our ability to act as a health insurance agent for subsidy-eligible individuals purchasing qualified health plans through the FFM depends upon the FFM developing and maintaining an efficient, scalable and online enrollment process and our ability to successfully enter into and maintain our agreement and integrate with the FFM. CMS has discretion to allow us to enroll individuals in qualified health plans through the FFM and broad authority over the requirements that we must meet in order to be able to do so. In order to enroll individuals in subsidy-eligible plans over the Internet through the FFM, we need to meet a number of requirements relating to the display of information on our websites as well as new and comprehensive privacy and security requirements. These requirements are evolving. Our ability to maintain compliance with the various requirements to enroll individuals through the FFM has presented, and could in the future present, significant challenges for us.
45
CMS directed us and other web-based entities to make changes after the end of the last open enrollment period to the process we developed for enrolling individuals into qualified health plans through the FFM. As a result of the changes that we made to our online process in response to CMS requirements, which require that we use a different and more cumbersome pathway through which individuals are enrolled in qualified health plans, we experienced a substantial reduction in the rate at which individuals and families starting the application process for qualified health plans and subsidies became members. Near the time CMS directed us to change our process for enrolling individuals in qualified health plans, CMS indicated that it anticipated it would improve the alternative process that CMS directed us to use. To date, CMS has not made meaningful improvements to the process and has indicated that it no longer anticipates making important improvements. The reduced conversion rates for the process that CMS has directed us to use for enrolling individuals in qualified health plans persisted throughout the open enrollment period that began on November 1, 2016 and ended January 31, 2017. These reduced conversion rates resulted in higher marketing and advertising costs per submitted application and reduced the cost-effectiveness of our direct and online marketing programs. As a result, we reduced our individual and family health insurance marketing expenditures both outside of the open enrollment period in 2016 as well as during the recently-ended open enrollment period. These circumstances resulted in our enrolling a significantly lower number of individuals and families into individual and family health insurance plans, which positively impacted our 2016 financial results due to the reduction in marketing and advertising expenses, but will significantly reduce our individual and family health insurance membership and commission revenue in 2017 compared to 2016.
Health insurance carriers have the ability to enter into or withdraw from health insurance markets and unilaterally change their relationship with us in various ways, including by altering the geographic areas in which they permit us to sell their products and changing the commission rates they pay us. As a result of higher medical utilization rates than carriers projected under healthcare reform and for other reasons related to healthcare reform, several health insurance carriers for which we have sold individual and family health insurance, including large national carriers, recently have exited the individual and family health insurance market altogether or in a large number of states. Some of these carriers have announced that they will sell individual and family health insurance through government exchanges, such as the FFM. These circumstances have resulted in our offering a reduced number of individual and family health insurance plans on our website, including several states and zip codes where we have no individual and family health insurance plans to offer. This reduction in supply has led to a decrease in demand for the individual and family health insurance that we sell. In addition, a significant number of our individual and family health insurance members purchased their individual and family health insurance from carriers exiting the individual and family health insurance market. As a result, we anticipate that we will see decreased retention rates in our individual and family membership, because those members would need to move to a plan offered by another health insurance carrier if they desired to maintain individual and family health insurance. If they did not purchase their new individual and family health insurance plan through us, they would no longer be our members and we would no longer receive the related commission revenue. If additional health insurance carriers determine not to sell individual and family health insurance in certain states or altogether, the impact on our individual and family membership and commission revenue will likely be more pronounced. We believe decreased retention rates and a reduction in the demand for individual and family health insurance plans that we sell will contribute to significantly reduced individual and family insurance membership and commission revenue for us in 2017 compared to 2016.
Given the significant losses that carriers have sustained in connection with their sale of individual and family health insurance, several health insurance carriers with which we have a relationship, including large national health insurance carriers, have made changes to the commissions they pay us in markets that they have not exited, including reducing or eliminating our commissions for individual and family health insurance enrollments outside of the open enrollment period, reducing or eliminating our commissions for individual and family health insurance plans sold during the recently ended open enrollment period and/or reducing our 2017 renewal commissions for individual and family health insurance plans we previously sold in prior years. As a result, we expect to see a meaningful reduction in our average commission rates for plans sold during the recently ended open enrollment period compared to the last open enrollment period and for our aggregate individual and family health insurance plan membership in 2017 compared to 2016. Many carriers have increased premiums on the individual and family health insurance that they sell as a result of the health care reform. While we do expect to see premium inflation to offset some of the negative impact of lower commission rates, given that some of the carriers pay us based on percentage of premiums, increased premiums have, and may continue to adversely impact demand for the individual and family health insurance that we sell.
Our commission revenue is influenced by a number of factors including:
|
•
|
the number of applications for Medicare-related, individual, family and small business and ancillary health insurance we submit to health insurance carriers;
|
|
•
|
the number of members on submitted applications;
|
|
•
|
the rate at which the individuals on those applications turn into paying members;
|
46
|
•
|
the commission rates we receive for the health insurance plans that we sell; and
|
|
•
|
our membership retention.
|
Submitted Applications.
Historically, we have experienced a significant increase in the number of Medicare-related submitted applications during the Medicare annual enrollment period, which occurs during the fourth quarter of each year. During 2016, we also experienced an increase in the number of Medicare-related applications submitted during the first, second and third quarters compared to the fourth quarter. Medicare Advantage applications submitted during the first, second and third quarters accounted for 54% of our total Medicare submitted applications in 2016, compared to 45% in 2015. Total Medicare product applications submitted outside of the annual enrollment period accounted for 51% of our total Medicare submitted applications in 2016, while 49% were submitted during the annual enrollment period in 2016. In 2016, submitted applications for Medicare Advantage products grew 26% compared to 2015, while submitted applications for all Medicare products, which also include Medicare Supplement and Medical Part D prescription drug plans, grew 38%. These growth rates represent a deceleration compared to strong growth rates we experienced in our Medicare business in the first half of 2016. The deceleration was driven in large part by the lingering impact of changes we made to our sales and marketing processes in response to compliance requirements issued by CMS, which impacted the effectiveness of our call center agents in converting leads into submitted applications during 2016.
The number of individual and family health insurance applications submitted through us has historically been highest during the Affordable Care Act open enrollment period, which has begun in the fourth quarter and run into the first quarter of the following year. Individual and family applications submitted through us during the first quarter of 2016 were lower than the number of applications submitted through us during the fourth quarter of 2015, and 47% below the number of applications submitted through us during the first quarter of 2015. During the second and third quarters of 2016, individual and family applications submitted through us decreased 59% and 60%, respectively, compared to the second and third quarters of 2015. The second and third quarters are outside of the Affordable Care Act open enrollment period and the number of individual and family health insurance submitted applications submitted during these periods has historically decreased compared to the first and fourth quarters. In connection with the recently completed open enrollment period that began on November 1, 2016, the number of individual and family health insurance submitted applications during the fourth quarter of 2016 increased significantly compared to the second and third quarters of 2016, but decreased 61% compared to the fourth quarter of 2015.
Members per Submitted Application
. For Medicare-related health insurance, there is only one individual on a submitted application. However, for individual and family and certain ancillary health insurance plans, there may be more than one member per submitted application. We experienced a decline in the average number of members on individual and family health insurance applications submitted in the first quarter of 2015 compared to the second through fourth quarters of 2014, but consistent with the first quarter of 2014. The average improved in the second through fourth quarters of 2015 compared to the first quarter of 2015, but did not return to the same levels as the second through fourth quarters of 2014, and did not return to historical pre healthcare reform rates. In the first quarter of 2016, we experienced a decline in the average number of members on individual and family health insurance applications submitted through us compared to the first quarter of 2015, but again experienced an increase during the second through fourth quarters of 2016 compared to the second through fourth quarters of 2015.
Approval Rates and Initial Payment Rates
. Approval rates for Medicare-related health insurance remained relatively consistent in 2014, 2015 and 2016. Initial payment rates for approved Medicare-related health insurance plans remained relatively consistent in 2014 and 2015, but declined slightly in 2016 due to a change in carrier mix. As a result of the health care reform prohibition on using pre-existing health conditions as a reason to deny health insurance applications, we have experienced higher approval rates on individual and family plan applications submitted during the open enrollment periods compared to periods before health care reform implementation. Individual and family health insurance approval rates have historically been lower outside of the open enrollment period than for applications submitted during the open enrollment period. In addition, during the first and second quarters of 2015, our individual and family plan commission revenue benefited from carriers paying us earlier on policies approved during the open enrollment period that ended in 2015 compared to the prior open enrollment period. The timing of carrier payments received during 2016 were similar to 2015. We believe that the more timely payment of commissions resulted from carriers being better prepared to handle large application volumes, and we also took steps to work with health insurance carriers to ensure that their processes resulted in more timely commission payments to us in 2015 and 2016.
Commission Rates
. The average commission dollars per-member-per-month that we receive for new health insurance plan members varies based upon a number of factors, including the ratio of policies that we sold for which we receive per member-per-month commissions compared to percentage-of-premium commissions, the premiums on the policies we sold, the mix of our members by health insurance carrier and the commission rates we receive from each carrier. Additionally, commission rates may vary by carrier, by geography and by the type of plan purchased by a member.
47
In the first plan year of a Medicare Advantage and Medicare Part D prescription drug plan, after the health insurance carrier approves the application but during the effective year of the plan, we are paid a fixed annual commission that is prorated for the number of months remaining in the calendar year. Additionally, if the plan is the first Medicare Advantage or Medicare Part D prescription drug plan issued to the member, we may receive a higher commission rate that covers a full twelve-month period, regardless of the month the plan was effective. Beginning with and subsequent to the second plan year, we typically receive fixed, monthly or annual commissions. During 2015 and 2016, for certain categories of enrollments that occur outside of the annual enrollment period, CMS allowed carriers to either prorate the commission payment for the number of months remaining in the calendar year or pay the broker a full year of commissions up-front. During 2016, a number of carriers for which we sell Medicare products recently changed from paying us a full-year of commissions up-front to pro-rating their payments based on the number of months remaining in the calendar year, which negatively impacted our Medicare commission revenue in second half of 2016 compared to the same period in 2015. We earn commission revenue for Medicare Advantage and Medicare Part D prescription drug plans for which we are the broker of record, typically until either the policy is cancelled or we otherwise do not remain the agent on the policy. Commission payments we receive for Medicare Supplement policies sold by us are typically a percentage of the premium on the policy and paid to us until the policy is cancelled or we otherwise do not remain the agent on the policy. CMS recently proposed a rule that would prohibit carriers from paying administrative fees on a per member basis. These fees constitute a significant portion of our Medicare Advantage and Medicare Part D prescription drug plan commission revenue. While many have commented on and objected to the proposed rule, should the rule become final, it is unclear whether carriers will pay the administrative fees in another manner and when they would begin to do so and our Medicare Advantage and Medicare Part D prescription drug plan commission revenue could be adversely impacted, which would harm our business, operating results and financial condition.
See
Critical Accounting Policies and Estimates
in Part II, Item 7 of our Annual Report on Form 10-K for the year ended December 31, 2016 for details regarding our recognition of Medicare plan commission revenue.
Historically, the commission payments we receive for individual and family, small business and ancillary health insurance plans we sold were a percentage of the premium our customers pay for those plans. Effective January 1, 2014, many carriers began paying our individual and family health insurance commissions at a flat amount per member per month. Commission payments are typically made until either the policy is cancelled or we otherwise do not remain the agent on the policy.
As a result of our commission structure, much of our revenue for a given financial reporting period relates to health insurance plans that we sold prior to the beginning of the period and is recurring in nature. However, the increased volume of health insurance applications submitted during the annual open enrollment periods compared to applications submitted outside of the annual open enrollment period has caused us to experience shifts in the concentration of our membership by health insurance carrier and type of plan purchased and corresponding fluctuations in our average commission rate. For example, we observed higher commissions on many of the individual and family health insurance plans that we sold during the 2015 open enrollment period for coverage effective in 2016 compared to policies that we sold during the 2014 open enrollment period for coverage effective in 2015. Recently, given the significant losses that carriers have sustained in connection with their sale of individual and family health insurance, several health insurance carriers with which we have a relationship, including large national health insurance carriers, made changes to the commissions they pay us, including reducing or eliminating our commissions for individual and family health insurance enrollments outside of the open enrollment period, reducing or eliminating our commissions for individual and family health insurance plans sold during the recently ended open enrollment period and/or reducing our 2017 renewal commissions for individual and family health insurance plans we previously sold in prior years. As a result, we expect to see a meaningful reduction in our average commission rates for plans sold during the recently ended open enrollment period compared to the last open enrollment period and for our aggregate individual and family health insurance plan membership in 2017 compared to 2016.
Retention Rates
. Our commission revenue is also influenced by our member retention rates. Retention rates are typically lower in the first policy year. Our individual and family plan membership retention rates were negatively impacted by health care reform throughout 2014, 2015 and 2016. The number of new individual and family health insurance members added during the second, third and fourth quarters of 2016 and the second, third and fourth quarters of 2015 was not enough to offset the loss of existing members, resulting in a decline in our individual and family health insurance estimated membership during those periods.
As described in greater detail in
Summary of Selected Metrics
, our individual and family plan membership estimates are based on historical member retention rates as we do not learn of membership cancellations for a period of time. Our actual retention rates during 2016 were less than the retention rates we experienced in our individual and family health insurance business in prior years. We believe the decreased retention rates related to premium inflation in the individual and family plan market and carriers exiting the individual and family health insurance market altogether or in certain jurisdictions.
48
We still have not received sufficient information from carriers to have a view of the retention rates that resulted during the annual open enrollment period for individual and family health insurance.
Other Revenue
In addition to our core business of marketing health insurance products to individuals and small businesses where we generate revenue, we earn non-commission revenue including from online sponsorship and advertising commission, technology licensing and lead referrals.
Online Sponsorship and Advertising
. We generate revenue from our online sponsorship and advertising program that allows carriers to purchase advertising space in specific markets in a sponsorship area on our website and allows Medicare-related carriers to purchase advertising on a separate website developed, hosted and maintained by us. In return, we are typically paid a flat fee or, with respect to individual and family health insurance plans, a monthly fee and a performance-based fee based on metrics such as submitted health insurance applications. Health insurance carriers commit to sponsorship and advertising on a quarterly basis, if at all, and generally determine prior to the quarter whether to purchase sponsorship and advertising from us and how much they are willing to spend.
Technology Licensing.
We generate revenue from licensing the use of our health insurance ecommerce technology. Our technology platform enables health insurance carriers to market and distribute health insurance plans online. Health insurance carriers that license our technology typically pay us implementation fees and performance-based fees that are based on metrics such as submitted health insurance applications.
Lead Referrals.
We generate revenue from referral fees paid to us based on Medicare-related and individual and family health insurance leads generated by our ecommerce platforms that are delivered and sold to third parties.
See
Critical Accounting Policies and Estimates
in Part II, Item 7 of this Annual Report on Form 10-K for details regarding our recognition of online sponsorship and advertising revenue, technology licensing revenue and lead referral revenue.
Member Acquisition
Marketing initiatives are an important component of our strategy to increase revenue. Our marketing initiatives are focused on three primary member acquisition channels: direct, marketing partners and online advertising and are primarily designed to encourage consumers to complete an application for health insurance. For the years ended December 31, 2014, 2015 and
2016
, applications submitted through us for Medicare-related, individual and family, small business and ancillary health insurance from our three member acquisition channels as a percentage of all health insurance applications submitted on our websites were as follows:
|
Year Ended December 31,
|
|||||
|
|
2014
|
2015
|
2016
|
||
|
Source of total submitted applications
(as a percentage of total submitted applications for the year): |
|||||
|
Direct
|
53%
|
51%
|
53%
|
||
|
Marketing partners
|
30%
|
37%
|
34%
|
||
|
Online advertising
|
17%
|
12%
|
13%
|
||
|
Total
|
100%
|
100%
|
100%
|
||
Direct
. Our direct member acquisition channel consists of consumers who access our website addresses, (
www.eHealth.com,
www.eHealthInsurance.com, www.eHealthMedicare.com, www.Medicare.com
and
www.PlanPrescriber.com
) either directly, through algorithmic natural search listings on Internet search engines and directories, or other forms of marketing, such as retargeting campaigns, television advertising, direct mail and email marketing.
Marketing Partners
. Our marketing partner member acquisition channel consists of consumers who access our websites through a network of affiliate partners and financial services and other companies. We compensate a significant number of our marketing partners by paying a fee each time a consumer referral from a partner results in a submitted health
49
insurance application, regardless of whether the consumer’s application is approved by the health insurance carrier. Some of our marketing partners have tiered arrangements in which the amount of the fee increases as the volume of submitted applications we receive from the marketing partner increases over a particular period. We recognize these expenditures in the period when a marketing partner’s referral results in the submission of a health insurance application. Growth in our marketing partner channel depends upon our expanding marketing programs with our existing marketing partners and adding new marketing partners. While we have relationships with a large number of marketing partners, we depend upon referrals from a limited number of marketing partners for a significant portion of the submitted applications we receive from our marketing partner customer acquisition channel. Moreover, a significant portion of our referrals for the purchase of Medicare plans comes from a single marketing partner.
Online Advertising
. Our online advertising member acquisition channel consists of consumers who access our websites through paid keyword search advertising from search engines such as Google, Bing and Yahoo!, as well as various Internet marketing programs such as display advertising. We incur expenses associated with search advertising in the period in which the consumer clicks on the advertisement.
Operating Costs and Expenses
Cost of Revenue
Included in cost of revenue are payments related to health insurance policies sold to members who were referred to our website by marketing partners with whom we have revenue-sharing arrangements. In order to enter into a revenue-sharing arrangement, marketing partners must be licensed to sell health insurance in the state where the policy is sold. Costs related to revenue-sharing arrangements are expensed as the related revenue is recognized.
Additionally, cost of revenue includes the amortization of consideration we paid to certain broker partners in connection with the transfer of their health insurance members to us as the new broker of record on the underlying policies. These transfers include primarily Medicare plan members. Consideration for all book-of-business transfers is being amortized to cost of revenue as we recognize commission revenue related to the transferred members.
Marketing and Advertising
Marketing and advertising expenses consist primarily of member acquisition expenses associated with our direct, marketing partner and online advertising member acquisition channels, in addition to compensation and other expenses related to marketing, business development, partner management, public relations and carrier relations personnel who support our offerings.
Since a significant portion of our marketing and advertising expenses consists of expenses incurred as a result of payments owed to our marketing partners in connection with health insurance applications submitted on our ecommerce platforms and other forms of marketing, such as direct mail, email marketing, television, radio and retargeting campaigns, those expenses are influenced by seasonal submitted application patterns. As a result of the annual open enrollment periods for both Medicare-related and individual and family health insurance, marketing and advertising expenses have increased during the fourth quarter of each year. Additionally, since the health care reform open enrollment periods for individual and family health insurance has continued into the following year, marketing and advertising expenses increase during the first quarter of each year, but to a lesser extent than the fourth quarter. During the second and third quarters, marketing and advertising expenses decrease, consistent with the decrease in submitted applications compared to periods during the open enrollment periods. We expect these seasonal trends to continue in 2017.
Because the total volume of submitted applications that we receive from our marketing partners is largely outside of our control, particularly during any short-term period, and because of our tiered marketing partner arrangements, we could incur expenses in excess of, or below, the amounts we had planned in periods of rapid change in the volume of submitted applications from marketing partner referrals. Similar to our marketing partner channel, expenses in our online advertising channel will increase or decrease in relation to any increase or decrease in consumers referred to our website as a result of search engine advertising. Increases in submitted applications resulting from marketing partner referrals or visitors to our website from our online advertising channel has in the past and could in the future result in marketing and advertising expenses significantly higher than our expectations. This has in the past and could in the future negatively impact our profitability during such periods because the revenue (if any) derived from submitted applications that are approved by health insurance carriers is not recognized until future periods.
50
We experienced substantially reduced conversion rates for qualified health plans during the recently completed open enrollment period, compared to the open enrollment period before it. As a result, we reduced our individual and family health insurance marketing expenditures during the recently completed open enrollment period and enrolled a significantly lower number of individuals into individual and family health plans as a result, which will significantly and negatively impact our individual and family health insurance commission revenue in 2017.
Customer Care and Enrollment
Customer care and enrollment expenses primarily consist of compensation and benefits costs for personnel engaged in assistance to applicants who call our customer care center and for enrollment personnel who assist applicants during the enrollment process. In preparation for the Medicare annual enrollment period during 2014, 2015 and 2016, and to a lesser extent the open enrollment period for individual and family health insurance plans during 2014, 2015 and 2016, we began ramping up our customer care center staff during our second and third quarters to handle the anticipated increased volume of health insurance transactions. Additionally, in the first quarter of 2015, we retained some Medicare sales and enrollment personnel to handle the increased volume of individual and family plan applications during the annual open enrollment period for individual and family health insurance that ended on February 15, 2015. In the first quarter of 2016 and 2017, we retained substantially all of our Medicare sales and enrollment personnel to handle the anticipated increased volume of Medicare-related applications outside of the open enrollment period.
Technology and Content
Technology and content expenses consist primarily of compensation and benefits costs for personnel associated with developing and enhancing our website technology as well as maintaining our website. A majority of our technology and content group is located at our wholly-owned subsidiary in China, where technology development costs are generally lower than in the United States.
General and Administrative
General and administrative expenses include compensation and benefits costs for staff working in our executive, finance, investor relations, government affairs, legal, human resources, internal audit, facilities and internal information technology departments. These expenses also include fees paid for outside professional services, including audit, tax, legal, government affairs and information technology fees. We incurred significant general and administrative expenses in the second and third quarters of 2016 in connection with the departure of our chief executive officer and chief financial officer, a strategic review of our business as well as government affairs and lobbying expenses relating to our individual and family health insurance business.
Restructuring Charge
On March 10, 2015, we implemented an organizational restructuring and cost reduction plan. As part of the plan, we eliminated approximately 160 full-time positions, representing approximately 15% of our workforce primarily in our technology and content and customer care and enrollment groups, and to a lesser extent, in our marketing and advertising and general and administrative groups. We incurred a pre-tax restructuring charge of approximately $3.9 million for employee termination benefits and related costs and $0.6 million for facility and other termination costs. The majority of the restructuring charge was recorded in the first quarter of 2015, when the activities comprising the plan were substantially completed.
In the second and third quarters of 2016, we reversed $0.3 million related to facility exit costs as we reoccupied office space we had previously vacated and were also released from a lease for other office space we had previously vacated.
Changes in Senior Management
In May 2016, we announced the resignation of Gary L. Lauer from his positions as chairperson of our board of directors and chief executive officer and the appointment of Scott N. Flanders, a member of our board of directors, as our chief executive officer. These executive changes increased general and administrative expenses, including severance costs, other personnel costs and stock-based compensation in the second quarter of 2016.
In June 2016, we announced the resignation of William T. Shaughnessy from his positions as president, chief operating officer and a member of our board of directors. This executive departure increased marketing and advertising expenses, including severance costs, other personnel costs and stock-based compensation in the second quarter of 2016. The
51
cost of this executive’s departure, including severance costs, other personnel costs and stock-based compensation was charged to marketing and advertising.
In July 2016, we announced the resignation of Stuart M. Huizinga from his positions as our senior vice president and chief financial officer and the appointment of David K. Francis as our senior vice president and chief financial officer. Mr. Huizinga continued to serve as our principal financial officer and principal accounting officer to help finalize our Quarterly Report on Form 10-Q for the quarter ended June 30, 2016, and he resigned such roles on September 30, 2016, at which time Mr. Francis began his service as our principal financial officer and Jay W. Jennings, senior vice president of finance, began his service as our principal accounting officer. These executive changes resulted in increased general and administrative expenses, including severance costs, other personnel costs and stock-based compensation in the third quarter of 2016.
In October 2016, we announced the appointment of Robert S. Hurley as president of our Medicare segment and Tom G. Tsao as president of our Individual, Family and Small Business segment. Mr. Hurley previously served as executive vice president of sales and operations, and Mr. Tsao previously served as executive vice president, chief technology and product officer. We also announced that Mr. Francis added the responsibilities of chief operations officer to his current responsibilities as senior vice president and chief financial officer. Among his other responsibilities, Mr. Francis heads key operational aspects of our business, including telesales and product and technology development.
Strategic Review
In connection with recent changes in our executive management team, we conducted a strategic review of our business operations, examining potential areas of investment and strategic emphasis. As a result of this review, we have identified the following three key growth opportunities:
|
•
|
Leverage our technology strength and marketing expertise to accelerate our growth in Medicare product sales, including Medicare Advantage and Medicare Supplement plans.
|
|
•
|
Utilize the strong platform built for our individual and family health insurance business to pursue large, attractive opportunities in the small business group insurance market.
|
|
•
|
Pursue cross-selling and adjacent revenue opportunities in our Medicare and small business group businesses.
|
In each of these areas of strategic growth emphasis, we intend to invest in and expand our technology-based product offerings, update our technology platform, utilize strategic partnerships to expand our product and market reach, and invest in optimizing our brand and our websites. In our individual and family health insurance business, we plan to continue to focus on profitability and cash flow maximization, while further reducing our individual and family plan-related marketing expenses. We anticipate that the significant level of investment required to implement these strategic plans will have a negative impact on our earnings in 2017.
52
Summary of Selected Metrics
The following table shows certain selected quarterly metrics for
2015
and
2016
:
|
Key Metrics:
|
Three Months Ended
|
||||||||||||||||||||||
|
|
Mar. 31, 2015
|
Jun. 30, 2015
|
Sept. 30,
2015
|
Dec. 31,
2015
|
Mar. 31, 2016
|
Jun. 30, 2016
|
Sept. 30,
2016
|
Dec. 31,
2016
|
|||||||||||||||
|
Submitted applications:
|
|||||||||||||||||||||||
|
Medicare submitted applications (1)
|
20,200
|
|
18,600
|
|
19,200
|
|
74,300
|
|
30,900
|
|
32,700
|
|
24,100
|
|
85,300
|
|
|||||||
|
IFP submitted applications (2)
|
140,000
|
|
23,900
|
|
22,500
|
|
114,600
|
|
74,300
|
|
9,800
|
|
8,900
|
|
45,100
|
|
|||||||
|
Other submitted applications (3)
|
101,100
|
|
66,800
|
|
70,200
|
|
107,900
|
|
97,400
|
|
60,600
|
|
56,400
|
|
62,100
|
|
|||||||
|
Total submitted applications (4)
|
261,300
|
|
109,300
|
|
111,900
|
|
296,800
|
|
202,600
|
|
103,100
|
|
89,400
|
|
192,500
|
|
|||||||
|
Medicare Advantage submitted applications (5)
|
15,100
|
|
13,700
|
|
14,800
|
|
52,600
|
|
23,126
|
|
24,923
|
|
17,100
|
|
56,000
|
|
|||||||
|
Estimated membership:
|
|||||||||||||||||||||||
|
Medicare products (6)
|
155,600
|
|
169,100
|
|
182,700
|
|
228,900
|
|
220,300
|
|
242,700
|
|
242,500
|
|
304,900
|
|
|||||||
|
IFP products (7)
|
584,900
|
|
568,400
|
|
518,000
|
|
503,300
|
|
523,000
|
|
481,300
|
|
390,400
|
|
360,600
|
|
|||||||
|
Other products (8)
|
421,700
|
|
404,900
|
|
397,400
|
|
412,300
|
|
409,600
|
|
381,900
|
|
355,400
|
|
349,700
|
|
|||||||
|
Total estimated membership (9)
|
1,162,200
|
|
1,142,400
|
|
1,098,100
|
|
1,144,500
|
|
1,152,900
|
|
1,105,900
|
|
988,300
|
|
1,015,200
|
|
|||||||
|
Notes:
|
||
|
(1)
|
Medicare-related health insurance applications submitted on our website or through our customer care center during the period, including Medicare Advantage, Medicare Part D prescription drug and Medicare Supplement plans. Applications are counted as submitted when the applicant completes the application and either clicks the submit button on our website or provides verbal authorization to submit the application. The applicant may have additional actions to take before the application will be reviewed by the insurance carrier, such as providing additional information. In addition, an applicant may submit more than one application.
|
|
|
(2)
|
Major medical Individual and Family plan ("IFP") health insurance applications submitted on our website during the period. Applications are counted as submitted when the applicant completes the application, clicks the submit button on our website and submits the application to us. The applicant may have additional actions to take before the application will be reviewed by the insurance carrier, such as providing additional information. In addition, an applicant may submit more than one application. We define our IFP offerings as major medical individual and family health insurance plans, which does not include Medicare-related, small business or ancillary plans (primarily consisting of short-term, dental, life, vision, and accident insurance plans).
|
|
|
(3)
|
Applications for health insurance plans other than Medicare and IFP submitted on our website during the period. Applications for ancillary plans are counted as submitted when the applicant completes the application, clicks the submit button on our website and submits the application to us. Applications for small business plans are counted as submitted when the applicant completes the application, the employees complete their applications, the applicant submits the application to us and we submit the application to the carrier. The applicant may have additional actions to take before the application will be reviewed by the insurance carrier, such as providing additional information. In addition, an applicant may submit more than one application.
|
|
|
(4)
|
Applications for all health insurance plans submitted on our website or through our customer care center during the period. See notes (1), (2) and (3) above for more information as to what constitutes a submitted application.
|
|
|
(5)
|
Medicare Advantage plan health insurance applications submitted on our website or through our customer care center during the period. Applications are counted as submitted when the applicant completes the application and either clicks the submit button on our website or provides verbal authorization to submit the application. The applicant may have additional actions to take before the application will be reviewed by the insurance carrier, such as providing additional information. In addition, an applicant may submit more than one application. Medicare Advantage submitted applications are included in Medicare submitted applications - See Note1 above for more detail.
|
|
|
(6)
|
Estimated number of members active on Medicare-related health insurance as of the date indicated. See the note below for additional information regarding our calculation of Medicare estimated membership.
|
|
53
|
Notes:
|
||
|
(7)
|
Estimated number of members active on IFP health insurance plans as of the date indicated. See the note below for additional information regarding our calculation of IFP estimated membership.
|
|
|
(8)
|
Estimated number of members active on insurance plans other than Medicare-related health insurance and IFP health insurance plans as of the date indicated. See the note below for additional information regarding our calculation of other estimated membership.
|
|
|
(9)
|
Estimated number of members active on all insurance plans as of the date indicated. See the note below for additional information regarding our calculation of total estimated membership.
|
|
Note:
Health insurance carriers bill and collect insurance premiums paid by our members. Health insurance carriers do not report to us the number of members that we have as of a given date. The majority of our members who terminate their policies do so by discontinuing their premium payments to the carrier and do not inform us of the cancellation. Also, some of members pay their premiums less frequently than monthly. Given the number of months required to observe non-payment of commissions in order to confirm cancellations, we estimate the number of members who are active on insurance policies as of a specified date. We estimate the number of continuing members on all policies as of a specific date as follows:
|
•
|
For Medicare-related health insurance plans, we take the number of members for whom we have received or applied a commission payment during the month of estimation.
|
|
•
|
For IFP health insurance plans, we take the sum of (i) the number of IFP members for whom we have received or applied a commission payment for a month that is up to six months prior to the date of estimation after reducing that number using historical experience for assumed member cancellations over the period being estimated; and (ii) the number of approved members over that period (after reducing that number by the percentage of members who do not accept their approved policy from the same month of the previous year for estimated member cancellations through the date of the estimate). To the extent we determine we have received substantially all of the commission payments related to a given month during the period being estimated, we will take the number of members for whom we have received or applied a commission payment during the month of estimation.
|
|
•
|
For ancillary health insurance plans (such as short-term, dental, vision, accident and student), we take the sum of (i) the number of members for whom we have received or applied a commission payment for a month that is up to three months prior to the date of estimation (after reducing that number using historical experience for assumed member cancellations over the period being estimated); and (ii) the number of approved members over that period (after reducing that number using historical experience for an assumed number of members who do not accept their approved policy from the same month of the previous year and for estimated member cancellations through the date of the estimate). To the extent we determine we have received substantially all of the commission payments related to a given month during the period being estimated, we will take the number of members for whom we have received or applied a commission payment during the month of estimation. The one to three-month period varies by insurance product and is largely dependent upon the timeliness of commission payment and related reporting from the related carriers. For small business health insurance plans, we estimate the number of members using the number of initial members at the time the group is approved, and we update this number for changes in membership if such changes are reported to us by the group or carrier in the period it is reported. However, groups generally notify the carrier directly of policy cancellations and increases or decreases in group size without informing us. Health insurance carriers often do not communicate policy cancellation information or group size changes to us. We often are made aware of policy cancellations and group size changes at the time of annual renewal and update our membership statistics accordingly in the period they are reported.
|
A member who purchases and is active on multiple standalone insurance plans will be counted as a member more than once. For example, a member who is active on both an individual and family health insurance plan and a standalone dental plan will be counted as two continuing members.
After we have estimated membership for a period, we may receive information from health insurance carriers that would have impacted the estimate if we had received the information prior to the date of estimation. We may receive commission payments or other information that indicates that a member who was not included in our estimates for a prior period was in fact an active member at that time, or that a member who was included in our estimates was in fact not an active member of ours. For instance, we reconcile information carriers provide to us and may determine that we were not historically paid commissions owed to us, which would cause us to have underestimated membership. Conversely, carriers may require us to return commission payments paid in a prior period due to policy cancellations for members we previously estimated as being active. We do not update our estimated membership numbers reported in previous periods. Instead, we reflect updated information regarding our historical membership in the membership estimate for the current period. As a result of the delay in our receipt of information from insurance carriers, actual trends in our membership are most discernible over periods longer than from one quarter to the next. In addition, and as a result of the delay we experience in receiving information about our membership, it is difficult for us to determine with any certainty the impact of current conditions on our membership retention. Health care reform and its impacts as well as other factors could cause the assumptions and estimates that we make in connection with estimating our membership to be inaccurate, which would cause our membership estimates to be inaccurate.
54
Critical Accounting Policies and Estimates
The preparation of financial statements and related disclosures in conformity with U.S. generally accepted accounting principles, or U.S. GAAP, requires us to make judgments, assumptions, and estimates that affect the amounts reported in the consolidated financial statements and the accompanying notes. These estimates and assumptions are based on current facts, historical experience, and various other factors that we believe are reasonable under the circumstances to determine reported amounts of assets, liabilities, revenue and expenses that are not readily apparent from other sources. To the extent there are material differences between our estimates and the actual results, our future consolidated results of operations may be affected.
An accounting policy is considered to be critical if the nature of the estimates or assumptions is material due to the levels of subjectivity and judgment necessary to account for highly uncertain matters or the susceptibility of such matters to change, and the effect of the estimates and assumptions on financial condition or operating performance. The accounting policies we believe to reflect our more significant estimates, judgments and assumptions and are most critical to understanding and evaluating our reported financial results are as follows:
|
•
|
Revenue Recognition;
|
|
•
|
Stock-Based Compensation;
|
|
•
|
Realizability of Long-Lived Assets and;
|
|
•
|
Accounting for Income Taxes;
|
During the year ended
December 31, 2016
, there were no significant changes to our critical accounting policies and estimates.
Revenue Recognition
We recognize revenue for our services when each of the following four criteria is met: persuasive evidence of an arrangement exists; delivery has occurred or services have been rendered; the seller’s price to the buyer is fixed or determinable; and collectability is reasonably assured. Our revenue is primarily comprised of compensation paid to us by health insurance carriers related to insurance plans that have been purchased by a member who used our service. We define a member as an individual currently covered by an insurance plan, including Medicare-related, individual and family, small business and ancillary plans, for which we are entitled to receive compensation from an insurance carrier.
Commission Revenue
For both Medicare Advantage and Medicare Part D prescription drug plans, we receive a fixed, annual commission payment from insurance carriers once the plan is approved by the carrier and either a fixed, monthly or annual commission payment beginning with and subsequent to the second plan year. Additionally, commission rates may be higher in the first twelve months of the plan if the plan is the first Medicare Advantage or Medicare Part D prescription drug plan issued to the member. In the first plan year of a Medicare Advantage and Medicare Part D prescription drug plan, after the health insurance carrier approves the application but during the effective year of the plan, we are paid a fixed commission that is prorated for the number of months remaining in the calendar year. Additionally, if the plan is the first Medicare Advantage or Medicare Part D plan issued to the member, we may receive a higher commission rate that covers a full twelve-month period, regardless of the month the plan was effective. We earn commission revenue for Medicare Advantage and Medicare Part D prescription drug plans for which we are the broker of record, typically until either the policy is cancelled or we otherwise do not remain the agent on the policy. We recognize commission revenue for both Medicare Advantage and Medicare Part D prescription drug plans for the entire plan year once the annual or first monthly commission amount for the plan year is reported to us by the carrier, net of an estimate for future forfeiture amounts due to cancellations. For commissions paid to us on a monthly basis, we record a receivable for the commission amounts to be received over the remainder of the plan year, net of an estimate for commission amounts not expected to be collected due to policy cancellations, which is included in Accounts Receivable in the consolidated balance sheets. We determine that there is persuasive evidence of an arrangement when we have a commission agreement with a health insurance carrier. Our services are complete when a carrier has approved an application in the initial year and when a member has renewed in a renewal year. The seller’s price is fixed or determinable and collectability is reasonably assured when a carrier has approved an application and the carrier reports to us the annual or first monthly renewal commission amount for each plan year.
For individual and family, Medicare Supplement, small business and ancillary plans, our compensation generally represents a flat amount per member per month or a percentage of the premium amount collected by the carrier during the period that a member maintains coverage under a plan (commissions) and, to a much lesser extent, override commissions that health insurance carriers pay us for achieving certain objectives. Premium-based commissions are reported to us after the
55
premiums are collected by the carrier, generally on a monthly basis. We generally continue to receive the commission payment from the relevant insurance carrier until the health insurance plan is cancelled or we otherwise do not remain the agent on the policy. We recognize commission revenue for individual and family, Medicare Supplement, small business and ancillary plans as the commissions are reported to us by the carrier, net of an estimate for future forfeiture amounts due to policy cancellations. We determine that there is persuasive evidence of an arrangement when we have a commission agreement with a health insurance carrier, a carrier reports to us that it has approved an application submitted through our ecommerce platform and the applicant starts making payments on the plan. Our services are complete when a carrier has approved an application. The seller’s price is fixed or determinable and collectability is reasonably assured when commission amounts have been reported to us by a carrier.
We recognize individual and family, small business and ancillary commission override revenue when reported to us by a carrier based on the actual attainment of predetermined target sales levels or other objectives as determined by the carrier. Commission override revenue, which we recognize on the same basis as individual and family, small business and ancillary commissions, is generally reported to us in a more irregular pattern than such commissions.
Commissions for all health insurance plans we sell are reported to us by a cash payment and commission statement. We generally receive these communications simultaneously. In instances when we receive the cash payment and commission statement separately and in different accounting periods, we recognize revenue in the period that we receive the earliest communication, provided we receive the second corroborating communication shortly following the end of the accounting period. If the second corroborating communication is not received shortly following the end of the accounting period, we recognize revenue in the period the second communication is received. During 2014, CMS issued a regulation prohibiting carriers from paying commissions during the fourth quarter on Medicare Advantage and Medicare Part D prescription drug plans sold during the fourth quarter with an effective date in the following year. During the fourth quarters of 2014, 2015 and 2016, we recognized revenue for policies included on a commission statement received prior to the end of the year for which payment was received shortly after year-end and in connection with the carriers’ normal payment cycle during the first quarter of that following year. We use the data in the commission statements to help identify the members for which we are receiving a commission payment and the amount received for each member, and to estimate future forfeiture amounts due to policy cancellations. As a result, we recognize the net amount of compensation earned as the agent in the transaction.
Certain commission amounts are subject to forfeiture if the policy is subsequently cancelled and either the carrier takes back all or a portion of the commission they have paid to us or we will no longer receive monthly commission payments for the remainder of the plan year. We record an estimate for these forfeitures based on our historical cancellation experience using data provided on commission statements. Policy cancellations and the commission amounts, if any, to be taken back by the carrier are typically reported to us by health insurance carriers several months after the policy’s cancellation date. Our estimate for forfeitures payable to a carrier, which is included in Other Current Liabilities in the Consolidated Balance Sheets, includes an estimate of both the reporting time lag and the forfeiture amount, based on our historical experience by policy type. Similarly, our estimate for commission amounts not expected to be collected due to policy cancellations, which is recorded as a reduction of Accounts Receivable in the Consolidated Balance Sheets, includes an estimate of the annual policy cancellation rate, based on our historical experience by policy type. Changes in our historical trends would result in changes to our estimated forfeitures in future periods. There were no changes in our average forfeiture rates or reporting time lag during the years ended
December 31, 2014
,
2015
, and
2016
that had a material impact on our estimate for forfeitures.
We rely on all of our health insurance carriers to report accurately and in a timely manner the amount of commissions earned by us, and we calculate our commission revenue, prepare our financial reports, projections and budgets, and direct our marketing and other operating efforts based on the reports we receive from them. Each month we analyze the reports we receive from health insurance carriers by comparing them to the database we maintain on our members. It is often difficult for us to independently determine whether or not carriers are reporting all commissions due to us, primarily because members on Medicare-related, individual and family, small business and ancillary health insurance policies terminate their policies either by contacting the carrier directly instead of by informing us of the cancellation or by discontinuing their premium payments to the carrier. Also, some of our individual, family and small business members pay their premiums less frequently than monthly. This results in our having to identify underpayment or non-payment of commissions on a policy and follow up with a carrier to obtain an explanation and/or request correction of the amount of commissions paid to us.
Other Revenue
Our sponsorship and advertising program allows carriers to purchase advertising space in specific markets in a sponsorship area on our website. In return, we are typically paid a monthly fee, which is recognized over the period that advertising is displayed, and often a performance fee based on metrics such as submitted health insurance applications, which is recognized when the earned amount are fixed and determinable and all other revenue recognition criteria has been met. We
56
also offer Medicare advertising services, which include website development, hosting and maintenance. In these instances, we are typically paid a fixed, up-front fee, which we recognize as revenue over the service period.
Our commercial technology licensing business allows carriers the use of our ecommerce platform to offer their own health insurance policies on their websites and agents to utilize our technology to power their online quoting, content and application submission processes. Typically, we are paid a one-time implementation fee, which we recognize on a straight-line basis over the estimated term of the customer relationship (generally the initial term of the agreement), commencing once the technology is available for use by the third party, and a performance fee based on metrics such as submitted health insurance applications. The metrics used to calculate performance fees for both sponsorship and advertising and technology licensing are based on performance criteria that are either measured based on data tracked by us, or based on data tracked by the third party. In instances where the performance criteria data is tracked by us, we recognize revenue in the period of performance and when all other revenue recognition criteria have been met. In instances where the performance criteria data is tracked by the third party, we recognize revenue when the amounts earned are either fixed or determinable and collection is reasonably assured. Typically, this occurs through our receipt of a cash payment from the third party along with a detailed statement containing the data that is tracked by the third party.
Deferred revenue includes deferred technology licensing implementation fees and amounts billed for deliverables in multiple element arrangements that do not have stand-alone value from other, undelivered elements, as well as amounts billed or collected from sponsorship or technology licensing customers in advance of our performing our service for such customers. It also includes the amount by which both unbilled and billed services provided under our technology licensing arrangements exceed the straight-line revenue recognized to date. We defer commission amounts that have been paid to us related to transactions where our services are complete, but where we cannot currently estimate future forfeitures related to those amounts.
We allocate revenue to all units of accounting within an arrangement with multiple deliverables at the inception of the arrangement using the relative selling price method. The relative selling price method allocates any discount in an arrangement proportionally to each deliverable on the basis of each deliverable’s relative selling price. The relative selling price established for each deliverable is based on vendor-specific objective evidence of fair value (“VSOE”) if available, third-party evidence of selling price if VSOE is not available, or best estimate of selling price if neither VSOE nor third-party evidence is available. When used, the best estimate of selling price reflects our best estimates of what the selling prices of certain deliverables would be if they were sold regularly on a stand-alone basis. Our process for determining best estimate of selling price for deliverables without VSOE or third-party evidence of selling price considers multiple factors that may vary depending upon the unique facts and circumstances related to each deliverable. Key factors considered by us in developing the relative selling prices for our technology licensing fees include prices charged by us for similar offerings and our historical pricing practices. We may also consider additional factors as appropriate, including competition.
A deliverable constitutes a separate unit of accounting when it has stand-alone value and there are no customer-negotiated right of refunds for the delivered elements. If the arrangement includes a customer-negotiated right of refund relative to the delivered item, and the delivery and performance of the undelivered item is considered probable and substantially in our control, the delivered element constitutes a separate unit of accounting. In circumstances when the aforementioned criteria are not met, the deliverable is combined with the undelivered elements, and the allocation of the arrangement consideration and revenue recognition is determined for the combined unit as a single unit. Allocation of the consideration is determined at the inception of the arrangement on the basis of each unit’s relative selling price. After the arrangement consideration has been allocated to each unit of accounting based on their relative selling prices, we apply revenue recognition criteria separately to each respective unit of accounting in the arrangement in accordance with applicable accounting guidance.
Stock-Based Compensation
We recognize stock-based compensation expense in the accompanying Consolidated Statements of Comprehensive Loss based on the estimated fair value of our stock-based awards over their respective vesting periods, which is generally four years. The estimated grant date fair value of our stock options is determined using the Black-Scholes-Merton pricing model and a single option award approach. The weighted-average expected term for stock options granted is calculated using historical option exercise behavior. The dividend yield is determined by dividing the expected per share dividend during the coming year by the grant date stock price. Through
December 31, 2016
, we had not declared or paid any cash dividends, and we do not expect to pay any in the foreseeable future. We base the risk-free interest rate on the implied yield currently available on U.S. Treasury zero-coupon issues with a remaining term equal to the expected term of our stock options. Expected volatility is determined using a combination of the implied volatility of publicly traded options in our stock and historical volatility of our stock price. The estimated attainment of performance-based awards and related expense is based on the expectations of revenue target achievement. The estimated fair value of performance awards with market conditions is determined using the Monte-
57
Carlo simulation model. The assumptions used in calculating the fair value of stock-based payment awards and expected attainment of performance-based awards represent our best estimates, but these estimates involve inherent uncertainties and the application of management judgment. We will continue to use judgment in evaluating the expected term and volatility related to our own stock-based awards on a prospective basis, and incorporating these factors into the model. Changes in key assumptions could significantly impact the valuation of such instruments.
Realizability of Long-Lived Assets
We assess the realizability of our long-lived assets, including intangible assets and goodwill, whenever events or changes in circumstances indicate the carrying value of such assets may not be recoverable. Factors that we consider in deciding when to perform an impairment review include significant negative industry or economic trends or significant changes or planned changes in our use of the assets. Additionally, we test goodwill and our other indefinite-lived intangible assets for impairment on an annual basis on or about November 30 of each year. When performing the annual goodwill impairment test we first assess qualitative factors to determine whether it is “more likely than not” that the fair value of our reporting unit is less than its carrying amount as a basis for determining whether it is necessary to perform the two-step goodwill impairment test. When performing the annual impairment test for indefinite-lived intangible assets other than goodwill we first assess qualitative factors to determine whether it is “more likely than not” that the indefinite-lived intangible is impaired.
If events or changes in circumstances indicate the carrying value of such assets may not be recoverable, for long lived assets other than goodwill, including intangible assets with finite useful lives, which include purchased technology, pharmacy relationships, trade names, and trademarks, we measure the recoverability of assets that will continue to be used in our operations by comparing the carrying value of the asset grouping to our estimate of the related total future undiscounted net cash flows. For assets related to our book-of-business transfers, we compare the carrying amount of each asset to the commission revenue expected to be generated by the policies included in each respective book-of-business. Our estimates of commission revenue expected to be generated by each book-of-business include subjective judgments regarding expected policy cancellations. If an asset grouping’s carrying value is not recoverable through the related undiscounted cash flows, the asset grouping is considered to be impaired. The impairment charge is calculated as the amount by which the asset grouping’s carrying value exceeds its fair value, which is defined as the price that would be received from selling an asset in an orderly transaction between market participants at the measurement date.
We must make subjective judgments in determining the independent cash flows that can be related to specific asset groupings. In addition, we must make subjective judgments regarding the remaining useful lives of assets with finite useful lives. When we determine that the useful life of an asset is shorter than we had originally estimated, we accelerate the rate of amortization over the new remaining useful life of the asset.
Accounting for Income Taxes
We account for income taxes using the liability method. Deferred income taxes are determined based on the differences between the financial reporting and tax bases of assets and liabilities, using enacted statutory tax rates in effect for the year in which the differences are expected to reverse.
Since tax laws and financial accounting standards differ in their recognition and measurement of assets, liabilities, equity, revenues, expenses, gains and losses, differences arise between the amount of taxable income and pretax financial income for a year and between the tax bases of assets or liabilities and their reported amounts in our financial statements. Because we assume that the reported amounts of assets and liabilities will be recovered and settled, respectively, a difference between the tax basis of an asset or a liability and its reported amount in the balance sheet will result in a taxable or a deductible amount in some future years when the related liabilities are settled or the reported amounts of the assets are recovered, which gives rise to a deferred tax asset or liability. We must then assess the likelihood that our deferred tax assets will be recovered from future taxable income and to the extent we believe that recovery does not meet the more likely than not criteria, we must establish a valuation allowance. Management judgment is required in determining any valuation allowance recorded against our net deferred tax assets.
As part of the process of preparing our consolidated financial statements, we are required to estimate our income taxes. This process involves estimating our actual current tax expense together with assessing temporary differences that may result in deferred tax assets.
Assessing the realizability of our deferred tax assets is dependent upon several factors, including the likelihood and amount, if any, of future taxable income in relevant jurisdictions during the periods in which those temporary differences become deductible. We forecast taxable income by considering all available positive and negative evidence, including our
58
history of operating income and losses and our financial plans and estimates that we use to manage the business. These assumptions require significant judgment about future taxable income. As at the year ended
December 31, 2016
, our valuation allowance is
$19.4 million
, which represents a full valuation allowance against our federal and state deferred tax assets. Any future change in the valuation allowance could have an effect on the income tax provision in our Consolidated Statement of Comprehensive Loss.
Future changes in various factors, such as the amount of stock-based compensation we record during the period and the related tax benefit we realize upon the exercise of employee stock options, potential limitations on the use of our federal and state net operating loss credit carry forwards, pending or future tax law changes including rate changes and the tax benefit from or limitations on our ability to utilize research and development credits, the amount of non-deductible lobbying and acquisition-related costs, changes in our valuation allowance and state and foreign taxes, would impact our estimates, and as a result, could affect our effective tax rate and the amount of income tax expense we record, and pay, in future periods.
Results of Operations
The following table sets forth our operating results and related percentage of total revenues for the years ended
December 31, 2014
,
2015
and
2016
(dollars in thousands):
|
|
Year Ended December 31,
|
|||||||||||||||||||
|
|
2014
|
2015
|
2016
|
|||||||||||||||||
|
Revenue
|
|
|
|
|
|
|
|
|
|
|
|
|
||||||||
|
Commission
|
$
|
158,626
|
|
88
|
%
|
$
|
171,257
|
|
90
|
%
|
$
|
170,850
|
|
91
|
%
|
|||||
|
Other
|
21,051
|
|
12
|
|
18,284
|
|
10
|
|
16,110
|
|
9
|
|
||||||||
|
Total revenue
|
179,677
|
|
100
|
|
189,541
|
|
100
|
|
186,960
|
|
100
|
|
||||||||
|
Operating costs and expenses:
|
|
|
|
|
|
|
|
|
|
|
|
|
||||||||
|
Cost of revenue
|
4,494
|
|
3
|
|
4,178
|
|
2
|
|
3,176
|
|
2
|
|
||||||||
|
Marketing and advertising
|
69,732
|
|
39
|
|
75,571
|
|
40
|
|
72,213
|
|
38
|
|
||||||||
|
Customer care and enrollment
|
42,745
|
|
24
|
|
42,540
|
|
22
|
|
47,930
|
|
26
|
|
||||||||
|
Technology and content
|
40,390
|
|
22
|
|
36,351
|
|
19
|
|
32,749
|
|
17
|
|
||||||||
|
General and administrative
|
27,549
|
|
15
|
|
30,858
|
|
16
|
|
36,004
|
|
19
|
|
||||||||
|
Restructuring charges
|
—
|
|
—
|
|
4,541
|
|
3
|
|
(297
|
)
|
—
|
|
||||||||
|
Amortization of intangible assets
|
1,529
|
|
1
|
|
1,153
|
|
1
|
|
1,040
|
|
1
|
|
||||||||
|
Total operating costs and expenses
|
186,439
|
|
104
|
|
195,192
|
|
103
|
|
192,815
|
|
103
|
|
||||||||
|
Loss from operations
|
(6,762
|
)
|
(4
|
)
|
(5,651
|
)
|
(3
|
)
|
(5,855
|
)
|
(3
|
)
|
||||||||
|
Other income (expense), net
|
(98
|
)
|
0
|
|
45
|
|
0
|
|
102
|
|
0
|
|
||||||||
|
Loss before provision (benefit) for income taxes
|
(6,860
|
)
|
(4
|
)
|
(5,606
|
)
|
(3
|
)
|
(5,753
|
)
|
(3
|
)
|
||||||||
|
Provision (benefit) for income taxes
|
9,345
|
|
5
|
|
(843
|
)
|
—
|
|
(871
|
)
|
—
|
|
||||||||
|
Net loss
|
$
|
(16,205
|
)
|
(9
|
)%
|
$
|
(4,763
|
)
|
(3
|
)%
|
$
|
(4,882
|
)
|
(3
|
)%
|
|||||
Operating costs and expenses include the following amounts of stock-based compensation expense (in thousands):
|
|
Year Ended December 31,
|
||||||||||
|
|
2014
|
2015
|
2016
|
||||||||
|
Marketing and advertising
|
$
|
1,692
|
|
$
|
1,950
|
|
$
|
1,237
|
|
||
|
Customer care and enrollment
|
386
|
|
477
|
|
497
|
|
|||||
|
Technology and content
|
1,611
|
|
1,728
|
|
1,836
|
|
|||||
|
General and administrative
|
2,188
|
|
2,734
|
|
3,696
|
|
|||||
|
Restructuring
|
$
|
—
|
|
$
|
113
|
|
$
|
—
|
|
||
|
|
$
|
5,877
|
|
$
|
7,002
|
|
$
|
7,266
|
|
||
59
Years
Ended
December 31, 2014
,
2015
and
2016
Revenue
The following table presents our commission, other revenue and total revenue for the years ended
December 31, 2014
,
2015
and
2016
and the dollar and percentage changes from the prior year (dollars in thousands):
|
|
Year Ended
|
Change
|
Year Ended
|
Change
|
Year Ended
|
||||||||||||||||||||
|
|
December 31, 2014
|
$
|
%
|
December 31, 2015
|
$
|
%
|
December 31, 2016
|
||||||||||||||||||
|
Commission
|
$
|
158,626
|
|
$
|
12,631
|
|
8
|
%
|
$
|
171,257
|
|
$
|
(407
|
)
|
—
|
%
|
$
|
170,850
|
|
||||||
|
Percentage of total revenue
|
88
|
%
|
|
|
|
|
90
|
%
|
|
|
|
|
91
|
%
|
|||||||||||
|
Other
|
21,051
|
|
(2,767
|
)
|
(13
|
)%
|
18,284
|
|
(2,174
|
)
|
(12
|
)%
|
16,110
|
|
|||||||||||
|
Percentage of total revenue
|
12
|
%
|
|
|
|
|
10
|
%
|
|
|
|
|
9
|
%
|
|||||||||||
|
Total revenue
|
$
|
179,677
|
|
$
|
9,864
|
|
5
|
%
|
$
|
189,541
|
|
$
|
(2,581
|
)
|
(1
|
)%
|
$
|
186,960
|
|
||||||
2016
compared to
2015
—Commission revenue decreased $0.4 million in the year ended December 31, 2016 compared to the year ended December 31, 2015, due to a $17.2 million decrease in Individual, Family and Small Business commission revenue, partially offset by a $16.8 million increase in Medicare commission revenue. The decrease in Individual, Family and Small Business commission revenue is primarily due to a 28% decrease in individual and family health insurance estimated membership for the year ended December 31, 2016 compared to the year ended December 31, 2015. The increase in Medicare commission revenue is primarily due to a 33% increase in Medicare estimated membership for the year ended December 31, 2016 compared to the year ended December 31, 2015.
Other revenue decreased
$2.2 million
, or
12%
, in the year ended December 31, 2016, compared to the year ended December 31, 2015 due to a $1.4 million decrease in licensing fees, a $0.5 million decrease in online sponsorship and advertising revenue and a $0.3 million decrease in lead generation revenue.
We expect commission revenue to decrease in 2017 compared to 2016, primarily as a result of a decrease in Individual, Family and Small Business commission revenue, partially offset by an increase in Medicare commission revenues. We also expect other revenue to decrease in absolute dollars in 2017 compared to 2016.
2015
compared to
2014
—Commission revenue increased
$12.6 million
, or
8%
, in the year ended
December 31, 2015
compared to the year ended
December 31, 2014
, primarily due to a $22.1 million increase in Medicare commission revenue, partially offset by a $9.5 million decrease in Individual, Family and Small Business commission revenue. The increase in Medicare related commission revenue is due to a 60% increase in Medicare membership for the year ended December 31, 2015 compared to the year ended December 31, 2014. The decrease in Individual, Family and Small Business commission revenue is primarily due to an 11% decrease individual and family plan estimated membership for the year ended December 31, 2015 compared to the year ended December 31, 2014.
Other revenue decreased
$2.8 million
, or
13%
, in the year ended
December 31, 2015
compared to the year ended
December 31, 2014
, due primarily to a $3.4 million decrease in online sponsorship and advertising revenue and a $1.2 million decrease in technology licensing revenue, partially offset by a $1.9 million increase in lead generation revenue.
Cost of Revenue
The following table presents our cost of revenue for the years ended
December 31, 2014
,
2015
and
2016
and the dollar and percentage changes from the prior year (dollars in thousands):
|
|
Year Ended
|
Change
|
Year Ended
|
Change
|
Year Ended
|
|||||||||||||||||||
|
|
December 31, 2014
|
$
|
%
|
December 31, 2015
|
$
|
%
|
December 31, 2016
|
|||||||||||||||||
|
Cost of revenue
|
$
|
4,494
|
|
$
|
(316
|
)
|
(7
|
)%
|
$
|
4,178
|
|
$
|
(1,002
|
)
|
(24
|
)%
|
3,176
|
|
||||||
|
Percentage of total revenue
|
3
|
%
|
|
|
|
|
2
|
%
|
|
|
|
|
2
|
%
|
||||||||||
60
2016
compared to
2015
—Cost of revenue decreased
$1.0 million
, or
24%
, in the year ended
December 31, 2016
compared to the year ended
December 31, 2015
, due primarily to a $0.5 million decrease in payments related to health insurance policies sold to members who were referred to our website by marketing partners with whom we have revenue-sharing arrangements and a $0.4 million decrease in amortization expense associated with the consideration we paid to a broker partner in connection with the transfer of several Medicare plan books-of-business to us whereby we became the broker of record on the underlying policies.
We expect cost of revenue to remain relatively consistent in 2017 compared to 2016.
2015
compared to
2014
—Cost of revenue decreased
$0.3 million
, or
7%
, in the year ended
December 31, 2015
compared to the year ended
December 31, 2014
, due primarily to a decrease in amortization expense associated with the consideration we paid to a broker partner in connection with the transfer of several Medicare plan books-of-business to us whereby we became the broker of record on the underlying policies.
Marketing and Advertising
The following table presents our marketing and advertising expenses for the years ended
December 31, 2014
,
2015
and
2016
and the dollar and percentage changes from the prior year (dollars in thousands):
|
|
Year Ended
|
Change
|
Year Ended
|
Change
|
Year Ended
|
||||||||||||||||||||
|
|
December 31, 2014
|
$
|
%
|
December 31, 2015
|
$
|
%
|
December 31, 2016
|
||||||||||||||||||
|
Marketing and advertising
|
$
|
69,732
|
|
$
|
5,839
|
|
8
|
%
|
$
|
75,571
|
|
$
|
(3,358
|
)
|
(4
|
)%
|
$
|
72,213
|
|
||||||
|
Percentage of total revenue
|
39
|
%
|
|
|
|
|
40
|
%
|
|
|
|
|
38
|
%
|
|||||||||||
2016
compared to
2015
—
Marketing and advertising expenses decreased
$3.4 million
, or
4%
, in the year ended
December 31, 2016
compared to the year ended
December 31, 2015
, due to a $1.9 million decrease in compensation, benefits and other personnel costs resulting from lower headcount, including executive officer departures, a $0.8 million decrease in variable advertising costs and a $0.7 million decrease in stock-based compensation expense largely due to reversal of stock-based compensation resulting from executive officer departures. The decrease in variable advertising costs resulted from a $2.7 million reduction in direct marketing expenses and a $2.3 million reduction in fees we pay to marketing partners for referrals that result in the submission of a health insurance application on our website, partially offset by a $4.2 million increase in online advertising costs.
We expect our marketing and advertising expenses to decrease in absolute dollars in 2017 compared to 2016 due primarily to a reduction in our investment in acquiring new members.
2015 compared to
2014—
Marketing and advertising expenses increased
$5.8 million
, or
8%
, in the year ended
December 31, 2015
compared to the year ended
December 31, 2014
,primarily due to an increase of $5.6 million in variable advertising costs, and to a lesser extent an increase in compensation, benefits and other personnel costs. This was partially offset by a $0.8 million decrease in public relation costs, as well as a decrease in costs resulting from the reduction-in-force we announced in March 2015. The increase in variable advertising costs resulted from an increase of $17.2 million in the fees we pay to marketing partners for referrals that result in the submission of a health insurance application on our website and an increase of $2.9 million in direct marketing expenses, partially offset by a decrease of $14.5 million in online advertising costs.
61
Customer Care and Enrollment
The following table presents our customer care and enrollment expenses for the years ended
December 31, 2014
,
2015
, and
2016
and the dollar and percentage changes from the prior year (dollars in thousands):
|
|
Year Ended
|
Change
|
Year Ended
|
Change
|
Year Ended
|
||||||||||||||||||||
|
|
December 31, 2014
|
$
|
%
|
December 31, 2015
|
$
|
%
|
December 31, 2016
|
||||||||||||||||||
|
Customer care and enrollment
|
$
|
42,745
|
|
$
|
(205
|
)
|
—
|
%
|
$
|
42,540
|
|
$
|
5,390
|
|
13
|
%
|
$
|
47,930
|
|
||||||
|
Percentage of total revenue
|
24
|
%
|
|
|
|
|
22
|
%
|
|
|
|
|
26
|
%
|
|||||||||||
2016
compared to
2015
—
Customer care and enrollment expenses increased
$5.4 million
, or
13%
, in the year ended
December 31, 2016
compared to the year ended
December 31, 2015
, due to a $4.1 million increase in compensation, benefits and other personnel costs primarily relating to our Medicare business and a $0.9 million increase in facilities and other operating costs.
We expect customer care and enrollment expenses to increase in absolute dollars in 2017 compared to 2016 as we hire additional customer care center personnel in connection with the expected growth in our Medicare and Individual, Family and Small Business segments.
2015
compared to
2014
—
Customer care and enrollment expenses decreased
$0.2 million
, or
0.5%
, in the year ended
December 31, 2015
compared to the year ended
December 31, 2014
, due primarily to a decrease in compensation, benefits and other personnel costs due to the reduction in force announced in March 2015 which was focused primarily on individual and family health insurance, partially offset by additions associated with customer care center personnel hired in connection with the expected growth of Medicare.
Technology and Content
The following table presents our technology and content expenses for the years ended
December 31, 2014
,
2015
and
2016
and the dollar and percentage changes from the prior year (dollars in thousands):
|
|
Year Ended
|
Change
|
Year Ended
|
Change
|
Year Ended
|
||||||||||||||||||||
|
|
December 31, 2014
|
$
|
%
|
December 31, 2015
|
$
|
%
|
December 31, 2016
|
||||||||||||||||||
|
Technology and content
|
$
|
40,390
|
|
$
|
(4,039
|
)
|
(10
|
)%
|
$
|
36,351
|
|
$
|
(3,602
|
)
|
(10
|
)%
|
$
|
32,749
|
|
||||||
|
Percentage of total revenue
|
22
|
%
|
|
|
|
|
19
|
%
|
|
|
|
|
17
|
%
|
|||||||||||
2016
compared to
2015
—
Technology and content expenses decreased
$3.6 million
, or
10%
, in the year ended
December 31, 2016
compared to the year ended
December 31, 2015
, due to a decrease in compensation, benefits and other personnel costs resulting from lower headcount.
We expect technology and content expenses to increase in absolute dollars in 2017 compared to 2016 due to planned investment in technology related to both our Medicare and Individual, Family and Small Business segments.
2015
compared to
2014
—
Technology and content expenses decreased
$4.0 million
, or
10%
, in the year ended
December 31, 2015
compared to the year ended
December 31, 2014
, primarily due to a decrease in compensation, benefits and other personnel costs resulting from the reduction-in-force announced in March 2015.
62
General and Administrative
The following table presents our general and administrative expenses for the years ended
December 31, 2014
,
2015
and
2016
and the dollar and percentage changes from the prior year (dollars in thousands):
|
|
Year Ended
|
Change
|
Year Ended
|
Change
|
Year Ended
|
||||||||||||||||||||
|
|
December 31, 2014
|
$
|
%
|
December 31, 2015
|
$
|
%
|
December 31, 2016
|
||||||||||||||||||
|
General and administrative
|
$
|
27,549
|
|
$
|
3,309
|
|
12
|
%
|
$
|
30,858
|
|
$
|
5,146
|
|
17
|
%
|
$
|
36,004
|
|
||||||
|
Percentage of total revenue
|
15
|
%
|
|
|
|
|
16
|
%
|
|
|
|
|
19
|
%
|
|||||||||||
2016
compared to
2015
—
General and administrative expenses increased
$5.1 million
, or
17%
, in the year ended
December 31, 2016
compared to the year ended
December 31, 2015
, due to an increase of $2.7 million in compensation, benefits and other personnel costs primarily resulting from severance and relocation costs related to executive officer changes, a $0.9 million increase in stock based compensation expense resulting from executive officer changes, a $0.9 million increase in third party fees related to a review and analysis of strategic plans, a $0.8 million increase in legal fees and a $0.2 million increase in lobbying fees.
We expect general and administrative expenses to remain relatively consistent in 2017 compared to 2016.
2015
compared to
2014
—
General and administrative expenses increased
$3.3 million
, or
12%
, in the year ended
December 31, 2015
compared to the year ended
December 31, 2014
,due primarily to increases of $2.5 million in annual performance bonus expense, $1.1 million in legal expenses, $0.6 million in stock-based compensation expense and $0.4 million in other corporate fees of $0.4 million, partially offset by decreases of $1.0 million in compensation, benefits and other personnel costs resulting from the reduction-in-force announced in March 2015 and $0.6 million in lobbying expenses.
Restructuring Charge (benefit)
The following table presents our restructuring charge (benefit) for the years ended
December 31, 2014
,
2015
and
2016
and the dollar and percentage changes from the prior year (dollars in thousands):
|
|
Year Ended
|
Change
|
Year Ended
|
Change
|
Year Ended
|
|||||||||||||||||||
|
|
December 31, 2014
|
$
|
%
|
December 31, 2015
|
$
|
%
|
December 31, 2016
|
|||||||||||||||||
|
Restructuring
|
$
|
—
|
|
$
|
4,541
|
|
N/A
|
$
|
4,541
|
|
$
|
(4,838
|
)
|
(9
|
)%
|
$
|
(297
|
)
|
||||||
|
Percentage of total revenue
|
—
|
%
|
|
|
|
3
|
%
|
|
|
|
|
—
|
|
|||||||||||
On March 10, 2015, we implemented an organizational restructuring and cost reduction plan. As part of the plan, we eliminated approximately 160 full-time positions, representing approximately 15% of our workforce primarily in our technology and content and customer care and enrollment groups, and to a lesser extent, in our marketing and advertising and general and administrative groups. We incurred a pre-tax restructuring charge of approximately $3.9 million for employee termination benefits and related costs and $0.6 million for facility and other termination costs. The majority of the restructuring charge was recorded in the first quarter of 2015, when the activities comprising the plan were substantially completed.
In the second and third quarters of 2016, we reversed $0.3 million related to facility exit costs as we reoccupied office space we had previously vacated and were also released from a lease for other office space we had previously vacated.
63
Amortization of Intangible Assets
The following table presents our intangible asset amortization expense for the years ended
December 31, 2014
,
2015
and
2016
and the dollar change from the prior year (dollars in thousands):
|
|
Year Ended
|
Change
|
Year Ended
|
Change
|
Year Ended
|
||||||||||||||
|
|
December 31, 2014
|
$
|
December 31, 2015
|
$
|
December 31, 2016
|
||||||||||||||
|
Amortization of intangible assets
|
$
|
1,529
|
|
$
|
(376
|
)
|
$
|
1,153
|
|
$
|
(113
|
)
|
$
|
1,040
|
|
||||
|
Percentage of total revenue
|
1
|
%
|
|
1
|
%
|
|
1
|
%
|
|||||||||||
2016
compared to
2015
—
Amortization expense related to intangible assets purchased through our acquisition of PlanPrescriber decreased for the year ended
December 31, 2016
compared to the year ended
December 31, 2015
, due to certain assets that have been fully amortized compared to the prior period.
We expect amortization expense of intangible assets in to be relatively consistent in 2017 compared to 2016.
2015
compared to
2014
—
Amortization expense related to intangible assets purchased through our acquisition of PlanPrescriber decreased for the year ended
December 31, 2015
compared to the year ended
December 31, 2014
, due to certain assets that have been fully amortized compared to the prior period, as well as a $0.1 million impairment charge recorded in 2014 related to certain acquired intangible assets.
Other Income
(Expense), Net
The following table presents our other income (expense), net for the years ended
December 31, 2014
,
2015
and
2016
and the dollar change from the prior year (dollars in thousands):
|
|
Year Ended
|
Change
|
Year Ended
|
Change
|
Year Ended
|
||||||||||||||
|
|
December 31, 2014
|
$
|
December 31, 2015
|
$
|
December 31, 2016
|
||||||||||||||
|
Other income (expense), net
|
$
|
(98
|
)
|
$
|
143
|
|
$
|
45
|
|
$
|
57
|
|
$
|
102
|
|
||||
|
Percentage of total revenue
|
—
|
%
|
|
—
|
%
|
|
—
|
%
|
|||||||||||
Other income (expense), net, in 2014, 2015 and 2016 primarily consisted of interest income earned on our invested cash, cash equivalents and marketable securities balances, offset by administrative bank fees, investment management fees and interest expense on capital lease obligations.
2016
compared to
2015
—
Other income (expense), net increased $0.1 million in 2016 compared to 2015 primarily due to an increase in investment interest income.
2015
compared to
2014
—
Other income, net increased in 2015 compared to 2014 due primarily to an increase in investment interest income and foreign exchange gains, partially offset by administrative bank fees, foreign exchange losses, management fees and interest expense on our capital lease obligations.
Provision (Benefit) for Income Taxes
The following table presents our provision (benefit) for income taxes for the years ended
December 31, 2014
,
2015
and
2016
and the dollar change from the prior year (dollars in thousands):
|
|
Year Ended
|
Change
|
Year Ended
|
Change
|
Year Ended
|
||||||||||||||
|
|
December 31, 2014
|
$
|
December 31, 2015
|
$
|
December 31, 2016
|
||||||||||||||
|
Provision (benefit) for income taxes
|
$
|
9,345
|
|
$
|
(10,188
|
)
|
$
|
(843
|
)
|
$
|
(28
|
)
|
$
|
(871
|
)
|
||||
|
Percentage of total revenue
|
5
|
%
|
|
—
|
%
|
|
—
|
%
|
|||||||||||
64
2016
compared to
2015
—We recorded a benefit for income taxes of $0.8 million and $0.9 million during the years ended December 31, 2015 and 2016, respectively. The benefit for income taxes in 2015 and 2016, primarily related to a decrease in our liability for unrecognized tax benefits due to the expiration of the related statute of limitations, partially offset by a provision for income taxes related to a minimum taxes and a foreign tax rate differential.
As a result of the valuation allowance against our U.S. deferred tax assets, we expect the annual effective tax rate to remain consistent in 2017 compared to 2016, excluding the impact of quarterly discrete items.
2015
compared to
2014
—In 2015, we recorded a benefit for income taxes of
$0.8 million
compared to a provision of
$9.3 million
in 2014 due primarily to valuation allowance adjustments in 2014.
Segment Information
We report segment information based on how our chief executive officer, who is our chief operating decision maker, or CODM, regularly reviews our operating results, allocates resources, and makes decisions regarding our business operations. The performance measures of our operating segments include revenues and profit and loss.
In connection with recent changes in our executive management team, we implemented a new operating structure in October 2016 to focus on our growth opportunities and objectives, while operating the business more efficiently. The new business structure is comprised of two operating segments, Medicare and Individual, Family and Small Business. These operating segments reflect the way our CODM views and evaluates our business performance and manages operations as well as allocates resources. Our CODM does not separately evaluate assets by segment, and therefore assets by segment are not presented.
The Medicare segment consists primarily of commissions earned from our sale of Medicare-related health insurance plans, including Medicare Advantage, Medicare Supplement and Medicare Part D prescription drug plans, and to a lesser extent, ancillary products sold to our Medicare-eligible customers, including but not limited to, dental, vision, life, short term disability and long term disability insurance, as well as our advertising program that allows Medicare-related carriers to purchase advertising on a separate website developed, hosted and maintained by us and our delivery and sale to third parties of Medicare-related health insurance leads generated by our ecommerce platforms and our marketing activities.
The Individual, Family and Small Business segment consists primarily of commissions earned from our sale of individual and family and small business health insurance plans and ancillary products sold to our non-Medicare-eligible customers, including but not limited to, dental, vision, life, short term disability and long term disability insurance. To a lesser extent, the Individual, Family and Small Business segment consists of amounts earned from our online sponsorship program that allows carriers to purchase advertising space in specific markets in a sponsorship area on our website, our licensing to third parties the use of our health insurance ecommerce technology and our delivery and sale to third parties of individual and family health insurance leads generated by our ecommerce platforms and our marketing activities.
Marketing and advertising, customer care and enrollment, technology and content and general and administrative operating expenses that are directly attributable to a segment are reported within the applicable segment. Indirect marketing and advertising, customer care and enrollment and technology and content operating expenses are allocated to each segment based on usage. Other indirect general and administrative operating expenses are managed in a corporate shared services environment and, since they are not the responsibility of segment operating management, are not allocated to the operating segments and instead reported within Corporate.
Segment profit (loss) is calculated as total revenue for the applicable segment less direct and allocated marketing and advertising, customer care and enrollment, technology and content and general and administrative operating expenses, excluding stock-based compensation, depreciation and amortization expense and amortization of intangible assets.
65
The following table presents summary results of our operating segments for the years ended December 31, 2014, 2015 and 2016 (in thousands):
|
Year Ended December 31,
|
|||||||||||
|
|
2014
|
2015
|
2016
|
||||||||
|
Revenue
|
|
|
|
||||||||
|
Medicare
|
$
|
44,479
|
|
$
|
63,163
|
|
$
|
80,269
|
|
||
|
Individual, Family and Small Business
|
135,198
|
|
126,378
|
|
106,691
|
|
|||||
|
Total revenue
|
$
|
179,677
|
|
$
|
189,541
|
|
$
|
186,960
|
|
||
|
Segment profit (loss)
|
|||||||||||
|
Medicare segment loss
|
$
|
(29,625
|
)
|
$
|
(23,284
|
)
|
$
|
(33,141
|
)
|
||
|
Individual, Family and Small Business segment profit
|
55,989
|
|
59,499
|
|
67,905
|
|
|||||
|
Total segment profit (loss)
|
26,364
|
|
36,215
|
|
34,764
|
|
|||||
|
Corporate
|
(21,528
|
)
|
(25,135
|
)
|
(29,071
|
)
|
|||||
|
Stock-based compensation expense
|
(5,877
|
)
|
(6,889
|
)
|
(7,266
|
)
|
|||||
|
Depreciation and amortization
|
(4,192
|
)
|
(4,148
|
)
|
(3,539
|
)
|
|||||
|
Restructuring (charge) benefit
|
—
|
|
(4,541
|
)
|
297
|
|
|||||
|
Amortization of intangible assets
|
(1,529
|
)
|
(1,153
|
)
|
(1,040
|
)
|
|||||
|
Other income (expense), net
|
(98
|
)
|
45
|
|
$
|
102
|
|
||||
|
Loss before provision (benefit) for income taxes
|
$
|
(6,860
|
)
|
$
|
(5,606
|
)
|
$
|
(5,753
|
)
|
||
2016 compared to 2015
Revenue
Revenue from our Medicare segment increased $17.1 million, or 27%, for the year ended December 31, 2016 compared to the year ended December 31, 2015 largely attributable to a $16.8 million increase in commission revenue. The increase in commission revenue was primarily due to a 33% increase in Medicare estimated membership for the year ended December 31, 2016 compared to the year ended December 31, 2015.
Revenue from our Individual, Family and Small Business segment decreased $19.7 million, or 16%, for the year ended December 31, 2016 compared to the year ended December 31, 2015. The decrease in commission revenue was primarily due to 28% decrease in individual and family health insurance estimated membership for the year ended December 31, 2016 compared to the year ended December 31, 2015.
Segment Profit (Loss)
Loss from our Medicare segment was $33.1 million for the year ended December 31, 2016, a $9.8 million, or 42% increase compared to a loss of $23.3 million for the year ended December 31, 2015. The increase in loss in the Medicare segment in 2016 compared to 2015 was primarily due to an increase in marketing and advertising and customer care and enrollment expenses in the Medicare segment as we continued to invest in growth of our Medicare business, and was only partially offset by an increase in revenue from the Medicare segment.
Profit from our Individual, Family and Small Business segment was $67.9 million for the year ended December 31, 2016, a $8.4 million, or 14% increase compared to profit of $59.5 million from the Individual, Family and Small Business segment for the year ended December 31, 2015. The increase in profit from the Individual, Family and Small Business segment in 2016 compared to 2015 was primarily due to a decrease in marketing and advertising expense from the Individual, Family and Small Business segment, partially offset by the decrease in revenue from the Individual, Family and Small Business segment.
66
2015 compared to 2014
Revenue
Revenue from our Medicare segment increased $18.7 million, or 42%, for the year ended December 31, 2015 compared to the year ended December 31, 2014 largely attributable to a $22.1 million increase in commission revenue. The increase in revenue was primarily due to a 60% increase in Medicare estimated membership for the year ended December 31, 2015 compared to the year ended December 31, 2014.
Revenue from our Individual, Family and Small Business segment decreased $8.8 million, or 7%, for the year ended December 31, 2015 compared to the year ended December 31, 2014. The decrease in commission revenue was primarily due to an 11% decrease in individual and family plan estimated membership for the year ended December 31, 2015 compared to the year ended December 31, 2014.
Segment Profit (Loss)
Loss from our Medicare segment was $23.3 million for the year ended December 31, 2015, a $6.3 million, or 21%, decrease compared to a loss of $29.6 million for the year ended December 31, 2014. The decrease in loss from the Medicare segment in 2015 compared to 2014 was primarily due to an increase in revenue from the Medicare segment partially offset by the increase in marketing and advertising and customer care and enrollment expenses to support the revenue growth of the Medicare segment.
Profit from our Individual, Family and Small Business segment was $59.5 million for the year ended December 31, 2015, a $3.5 million, or 6% increase compared to profit of $56.0 million profit from the Individual, Family and Small Business for the year ended December 31, 2014. The increase in profits from Individual, Family and Small Business segment in 2016 compared to 2015 was primarily due to a decrease in marketing and advertising expense from the Individual, Family and Small Business segment, partially offset by the decrease in revenue from the Individual, Family and Small Business segment.
Liquidity and Capital Resources
At
December 31, 2016
, our cash and cash equivalents totaled
$61.8 million
. Cash equivalents, which are comprised of financial instruments with an original maturity of 90 days or less from the date of purchase, primarily consist of money market funds. At
December 31, 2015
, our cash and cash equivalents totaled
$62.7 million
. The increase in cash and cash equivalents reflects
$4.1 million
provided by operating activities, offset by
$3.7 million
used to purchase property and equipment and other assets and
$1.2 million
used in net-share settled equity awards.
On March 31, 2014, we announced that our board of directors approved a stock repurchase program authorizing us to purchase up to $50 million of our common stock. Purchases under this program were made in the open market and complied with Rule 10b-18 under the Securities Exchange Act of 1934, as amended. We completed this stock repurchase program in July 2014 having repurchased in the aggregate 1.4 million shares for approximately $50.0 million at an average price of $36.91 per share including commissions. The cost of the repurchase was funded from available working capital. There were no stock repurchase during the years ended December 31, 2015 and 2016.
For accounting purposes, common stock repurchased under our stock repurchase programs is recorded based upon the settlement date of the applicable trade. Such repurchased shares are held in treasury and are presented using the cost method.
In addition to the shares repurchased under our past repurchase programs as of
December 31, 2016
we have in treasury
471,702
shares that were surrendered by employees to satisfy tax withholdings due in connection with the vesting of certain restricted stock units. As of
December 31, 2015
and
2016
, we had a total of
11,025,933
shares and
11,135,590
shares, respectively, held in treasury.
67
The following table presents a summary of our cash flows for the years ended
December 31, 2014
,
2015
and
2016
(in thousands):
|
|
Year Ended December 31,
|
||||||||||
|
|
2014
|
2015
|
2016
|
||||||||
|
Net cash provided by operating activities
|
$
|
1,779
|
|
$
|
13,696
|
|
$
|
4,083
|
|
||
|
Net cash used in investing activities
|
$
|
(8,104
|
)
|
$
|
(2,996
|
)
|
$
|
(3,726
|
)
|
||
|
Net cash (used in) provided by financing activities
|
$
|
(49,331
|
)
|
$
|
577
|
|
$
|
(1,269
|
)
|
||
Operating Activities
Cash provided by operating activities primarily consists of net income, adjusted for certain non-cash items including deferred income taxes, depreciation and amortization, including amortization of intangible assets, stock-based compensation expense and the effect of changes in working capital and other activities.
The timing of the recognition of our commission revenue depends upon the timing of our receipt of commission reports and associated commission payments from health insurance carriers. If we were to experience a delay in receiving a commission payment from a health insurance carrier at the end of a quarter, our operating cash flows for that quarter could be adversely impacted. Additionally, commission override payments are reported to us in a more irregular pattern than premium commissions. For example, a carrier may make a commission override payment to us on an annual basis, which would positively impact our cash flows in the quarter the payment is received.
A significant portion of our marketing and advertising expenses is driven by the number of health insurance applications submitted on our ecommerce platform. Since our marketing and advertising costs are expensed and generally paid as incurred and the revenue and cash earned from approved applications is recognized and paid as commissions are subsequently reported to us, our operating cash flows could be adversely impacted by a substantial increase in the volume of applications submitted during a quarter or positively impacted by a substantial decline in the volume of applications submitted during a quarter. During the Medicare annual enrollment period, we experience an increase in the number of submitted Medicare-related health insurance applications and marketing and advertising expenses compared to outside of Medicare annual enrollment periods. During open enrollment periods for individual and family health insurance plans, we experience an increase in the number of submitted individual and family plan health insurance applications and marketing and advertising expenses compared to outside of open enrollment periods. The timing of open enrollment periods for individual and family health insurance and the Medicare annual enrollment period for Medicare-related health insurance affect the positive or negative impacts of our cash flows during each quarter. Consistent with prior years, marketing and advertising costs increased during the fourth quarter of 2015 compared to the third quarter of 2015 due to an increase in submitted applications for individual and family health insurance during the open enrollment period and due to an increase in submitted applications for Medicare plans during the annual enrollment period. We expect marketing and advertising costs to increase during the fourth quarter of 2017 due to an increase in submitted applications for Medicare plans during the annual enrollment period and the first and fourth quarters of 2017 due to an increase in submitted applications during the annual open enrollment period for individual and family health insurance. We expect marketing and advertising costs to decrease during the second and third quarters compared to cost levels during the first and fourth quarters due to a reduction in the number of health insurance applications we expect outside of annual open enrollment periods.
All Medicare Advantage and Medicare Part D prescription drug policies are renewed on January 1, resulting in our recording substantially all Medicare Advantage and Medicare Part D prescription drug plan renewal commission revenue in the first quarters starting January 1, 2015. As a result, we did not recognize significant Medicare renewal commission revenue in the second quarter and third quarters of 2015 and 2016 and did not record significant Medicare renewal commission revenue in the fourth quarters of 2016. Typically, renewal commissions for Medicare Advantage products are paid monthly. As a result, the majority of renewal commissions for Medicare Advantage products has been collected in quarters subsequent to the first quarter.
2016—
Our operating activities provided cash of
$4.1 million
during the year ended December 31, 2016 and consisted of net loss of
$4.9 million
, increased by non-cash items of
$14.3 million
and decreased from changes in net operating assets and liabilities balances and other activities during the year ended December 31, 2016 of
$5.3 million
. Adjustments for non-cash items primarily consisted of
$7.2 million
of depreciation and amortization, including amortization of internally-developed software, book-of-business consideration and intangible assets and
$7.3 million
of stock-based compensation expense.
68
The cash decrease resulting from changes in net operating assets and liabilities balances during the year ended December 31, 2016 primarily consisted of a decrease of
$3.5 million
in accrued marketing expenses, a decrease of
$3.5 million
in accrued compensation and benefits, $1.1 million decrease in accrued expense and other liabilities and a
$0.5 million
increase in prepaid expenses and other current assets. These decreases were partially offset by an increase of
$2.2 million
in accounts payable, a
$0.6 million
increase in deferred revenue and
$0.4 million
decrease in accounts receivable.
2015—
Our operating activities generated cash of $13.7 million during the year ended December 31, 2015 and consisted of net loss of $4.8 million, increased by non-cash items of $15.2 million and cash from working capital and other activities of $3.3 million. Adjustments for non-cash items primarily consisted of $7.0 million of stock-based compensation expense, $4.1 million of depreciation and amortization, $2.0 million of amortization of book-of-business consideration and $1.2 million of amortization of intangible assets. Cash from working capital and other activities primarily consisted of an increase of $6.2 million in accrued compensation and benefits, an increase of $2.0 million in accrued marketing expenses and a $1.0 million decrease in prepaid expense and other assets, partially offset by an increase of $1.4 million in accounts receivable, a decrease of $0.6 million in deferred revenue, a $1.2 million decrease in current liabilities and an decrease of $2.9 million in accounts payable. Accounts receivable increased mainly due to increased accrued Medicare commissions on applications sold in the fourth quarter.
2014—
Our operating activities generated cash of $1.8 million during the year ended December 31, 2014 and consisted of net loss of $16.2 million, increased by non-cash items of $22.9 million and cash used in working capital and other activities of $4.9 million. Adjustments for non-cash items primarily consisted of $9.2 million of deferred income taxes, $5.9 million of stock-based compensation expense, $4.2 million of depreciation and amortization, $2.0 million of amortization of book-of-business consideration and $1.5 million of amortization of intangible assets. Cash used in working capital and other activities primarily consisted of a decrease of $1.1 million in deferred revenue, a decrease of $2.1 million in accrued compensation and benefits, an increase of $3.6 million in accounts receivable and a $0.6 million increase in prepaid expense and other assets, partially offset by an increase of $0.5 million in accrued marketing expenses, a $0.4 million increase in other current liabilities and an increase of $1.6 million in accounts payable. Accounts receivable increased mainly due to increased commission receivables arising from CMS rule changes surrounding the timing of payments. Accounts payable increased due to increased marketing and advertising expenses during the open enrollment period.
Investing Activities
Our investing activities primarily consist of purchases of computer hardware and software to enhance our website and customer care operations, leasehold improvements related to facilities expansion, internal-use software and the purchase of certain intangible assets.
2016
—Net cash used in investing activities of
$3.7 million
during the year ended December 31, 2016 was due to purchases of property and equipment and other assets.
2015
—Net cash used in investing activities of $3.0 million during the year ended December 31, 2015 was due to $3.0 million used to purchase computer hardware and software, and other assets.
2014
—Net cash used in investing activities of $8.1 million during the year ended December 31, 2014 was due to $3.6 million used to purchase property and equipment and $4.5 million used in the purchase of an intangible asset, the Internet domain name www.Medicare.com. Additional non-cash consideration for www.Medicare.com included settlement of a $0.3 million outstanding receivable from the owner upon completion of the purchase.
Financing Activities
2016
—Net cash used in financing activities of
$1.3 million
during the year ended December 31, 2016 was primarily due to
$1.2 million
used to net-share settle the tax obligation related to vesting equity awards.
2015
—Net cash provided by financing activities of $0.6 million during the year ended December 31, 2015 was due to proceeds of $1.6 million from the exercise of common stock options offset by $0.9 million used to net-share settle the tax obligation related to vesting equity awards.
2014
—Net cash used in financing activities of $49.3 million during the year ended December 31, 2014 was due to $50.0 million used to repurchase 1.4 million shares of our common stock and $3.5 million used to net-share settle the tax obligation related to vesting equity awards, partially offset by $4.1 million of net proceeds from the exercise of common stock options and $0.1 million of excess tax benefits from stock-based compensation.
69
Future Needs
We believe that cash generated from operations and our current cash and cash equivalents will be sufficient to fund our operations for at least twelve months after the filing date of this Annual Report on Form 10-K. Our future capital requirements will depend on many factors, including our level of investment in technology marketing and advertising and customer care initiatives. In addition, our cash position could be impacted by acquisitions and investments we make to pursue our growth strategy. We currently do not have any bank debt, line of credit facilities or other borrowing arrangements. To the extent that available funds are insufficient to fund our future activities, we may need to raise additional capital through public or private equity or debt financing to the extent such funding sources are available.
Contractual Obligations and Commitments
Operating Lease Obligations
We lease our operating facilities and certain of our equipment and furniture and fixtures under various operating leases, the latest of which expires in July 2023. Certain of these leases have free or escalating rent payment provisions. We recognize rent expense on our operating leases on a straight-line basis over the terms of the leases, although actual cash payment obligations under certain of these agreements fluctuate over the terms of the agreements.
In connection with our Mountain View, California office lease agreement, we entered into a financial guarantee consisting of a standby letter of credit for $0.6 million, which may be reduced in increments of 25% of the original amount thereof on the first, second and third anniversaries of the commencement date, subject to our compliance with the applicable conditions to such reductions set forth in the lease. The remaining balance on the financial guarantee is
$0.1 million
as of
December 31, 2016
.
Service and Licensing Obligations
We have entered into service and licensing agreements with third party vendors to provide various services, including network access, equipment maintenance and software licensing. The terms of these services and licensing agreements are generally up to three years. We record the related service and licensing expenses on a straight-line basis, although actual cash payment obligations under certain of these agreements fluctuate over the terms of the agreements.
The following table presents a summary of our future minimum payments under non-cancellable operating lease agreements and contractual service and licensing obligations as of
December 31, 2016
(in thousands):
|
Years Ending December 31,
|
Operating Lease Obligations
|
Service and Licensing Obligations
|
Total Obligations
|
||||||||
|
2017
|
$
|
4,543
|
|
$
|
2,247
|
|
$
|
6,790
|
|
||
|
2018
|
2,959
|
|
849
|
|
3,808
|
|
|||||
|
2019
|
908
|
|
210
|
|
1,118
|
|
|||||
|
2020
|
909
|
|
168
|
|
1,077
|
|
|||||
|
2021
|
929
|
|
—
|
|
929
|
|
|||||
|
Thereafter
|
1,516
|
|
—
|
|
1,516
|
|
|||||
|
Total
|
$
|
11,764
|
|
$
|
3,474
|
|
$
|
15,238
|
|
||
As of December 31, 2016, liability for uncertain tax positions was $1.6 million and we accrued $0.3 million of interest associated with our uncertain tax positions. This amount is included in Non-current Liabilities in our Consolidated Balance Sheet as of December 31, 2016. We are unable to conclude on the range of cash payments that will be made within the next twelve months associated with our uncertain tax positions.
Off-Balance Sheet Arrangements
We do not have any off-balance sheet arrangements, investments in special purpose entities or undisclosed borrowings or debt. Additionally, we are not a party to any derivative contracts or synthetic leases.
70
Recent Accounting Pronouncements
See
Note 1 of
Notes to Consolidated Financial Statements
for recently issued accounting standards that could have an effect on us.
Our financial instruments that are exposed to concentrations of credit risk principally consist of cash and cash equivalents and accounts receivable. As of
December 31, 2015
and
2016
, our cash and cash equivalents were invested as follows (in thousands):
|
|
December 31, 2015
|
December 31, 2016
|
|||||
|
Cash
(1)
|
$
|
8,086
|
|
$
|
4,066
|
|
|
|
Money market funds
(2)
|
54,624
|
|
57,715
|
|
|||
|
Total cash and cash equivalents
|
$
|
62,710
|
|
$
|
61,781
|
|
|
|
(1)
|
We deposit our cash and cash equivalents in accounts with major banks and financial institutions and such deposits are in excess of federally insured limits. We also have deposits with major banks in China that are denominated in both U.S. dollars and Chinese Yuan Renminbi and are not insured by the U.S. federal government.
|
|
(2)
|
At
December 31, 2015
and
2016
money market funds consisted of U.S. government-sponsored enterprise bonds and discount notes, U.S. government treasury bills and notes and repurchase agreements collateralized by U.S. government obligations.
|
We do not require collateral or other security for our accounts receivable. As of
December 31, 2016
,
three
customers represented
23%
,
20%
, and
11%
, respectively, for a combined total of
54%
of our
$9.2 million
outstanding accounts receivable balance. As of December 31, 2015, three customers represented 24%, 18%, and 15%, respectively, for a combined total of 57% of our $9.6 million outstanding accounts receivable balance. No other customers represented 10% or more of our total accounts receivable at December 31, 2015 and December 31, 2016. We believe the potential for collection issues with any of our customers is minimal as of December 31, 2016. Accordingly, our estimate for uncollectible amounts at December 31, 2016 was not material.
Significant Customers
Substantially all revenue for the years ended
December 31, 2014
,
2015
, and
2016
was generated from customers located in the United States. Carriers representing 10% or more of our total revenue in the years ended December 31, 2014, 2015 and 2016 are presented in the table below:
|
|
Year Ended December 31,
|
|||||||
|
|
2014
|
2015
|
2016
|
|||||
|
Humana
|
23
|
%
|
23
|
%
|
23
|
%
|
||
|
UnitedHealthcare
1
|
10
|
%
|
11
|
%
|
13
|
%
|
||
|
Aetna
2
|
10
|
%
|
10
|
%
|
10
|
%
|
||
|
Anthem
3
|
11
|
%
|
9
|
%
|
8
|
%
|
||
|
(1)
|
UnitedHealthcare also includes other carriers owned by UnitedHealthcare.
|
|
(2)
|
Aetna also includes other carriers owned by Aetna.
|
|
(3)
|
Anthem (formerly Wellpoint) also includes other carriers owned by Anthem.
|
Foreign Currency Exchange Risk
To date, substantially all of our revenue has been derived from transactions denominated in United States Dollars. We have exposure to adverse changes in exchange rates associated with operating expenses of our foreign operations, which are denominated in Chinese Yuan Renminbi. Foreign currency fluctuations have not had a material impact historically on our results of operations; however, there can be no assurance that future fluctuations will not have material adverse effects on our results of operations. We have not engaged in any foreign currency hedging or other derivative transactions to date.
71
Index to the Consolidated Financial Statements
The supplementary financial information required by this Item 8 is included in
Note 10
to the Consolidated Financial Statements under the caption “
Selected Quarterly Financial Data (Unaudited)
.”
72
Report of Independent Registered Public Accounting Firm
The Board of Directors and Stockholders of eHealth, Inc.
We have audited the accompanying consolidated balance sheets of eHealth, Inc. as of
December 31, 2016
and
2015
, and the related consolidated statements of comprehensive loss, stockholders’ equity and cash flows for each of the three years in the period ended
December 31, 2016
. These financial statements are the responsibility of the Company's management. Our responsibility is to express an opinion on these financial statements based on our audits.
We conducted our audits in accordance with the standards of the Public Company Accounting Oversight Board (United States). Those standards require that we plan and perform the audit to obtain reasonable assurance about whether the financial statements are free of material misstatement. An audit includes examining, on a test basis, evidence supporting the amounts and disclosures in the financial statements. An audit also includes assessing the accounting principles used and significant estimates made by management, as well as evaluating the overall financial statement presentation. We believe that our audits provide a reasonable basis for our opinion.
In our opinion, the financial statements referred to above present fairly, in all material respects, the consolidated financial position of eHealth, Inc. at
December 31, 2016
and
2015
, and the consolidated results of its operations and its cash flows for each of the three years in the period ended
December 31, 2016
, in conformity with U.S. generally accepted accounting principles.
We also have audited, in accordance with the standards of the Public Company Accounting Oversight Board (United States), eHealth, Inc.’s internal control over financial reporting as of
December 31, 2016
, based on criteria established in Internal Control-Integrated Framework issued by the Committee of Sponsoring Organizations of the Treadway Commission (2013 framework) and our report dated
March 15, 2017
expressed an unqualified opinion thereon.
/s/ Ernst & Young LLP
Redwood City, California
March 15, 2017
73
EHEALTH, INC.
(In thousands, except share and per share information)
|
|
December 31, 2015
|
December 31, 2016
|
|||||
|
Assets
|
|
|
|||||
|
Current assets:
|
|
|
|||||
|
Cash and cash equivalents
|
$
|
62,710
|
|
$
|
61,781
|
|
|
|
Accounts receivable
|
9,647
|
|
9,213
|
|
|||
|
Prepaid expenses and other current assets
|
5,185
|
|
5,148
|
|
|||
|
Total current assets
|
77,542
|
|
76,142
|
|
|||
|
Property and equipment, net
|
7,364
|
|
5,608
|
|
|||
|
Other assets
|
4,697
|
|
4,473
|
|
|||
|
Intangible assets, net
|
9,620
|
|
8,580
|
|
|||
|
Goodwill
|
14,096
|
|
14,096
|
|
|||
|
Total assets
|
$
|
113,319
|
|
$
|
108,899
|
|
|
|
Liabilities and stockholders’ equity
|
|
|
|||||
|
Current liabilities:
|
|
|
|||||
|
Accounts payable
|
$
|
3,012
|
|
$
|
5,112
|
|
|
|
Accrued compensation and benefits
|
14,386
|
|
10,920
|
|
|||
|
Accrued marketing expenses
|
10,698
|
|
7,158
|
|
|||
|
Deferred revenue
|
392
|
|
959
|
|
|||
|
Other current liabilities
|
3,448
|
|
3,775
|
|
|||
|
Total current liabilities
|
31,936
|
|
27,924
|
|
|||
|
Non-current liabilities
|
4,962
|
|
3,374
|
|
|||
|
Commitments and contingencies (see Note 8)
|
—
|
|
—
|
|
|||
|
Stockholders’ equity:
|
|
|
|
||||
|
Preferred stock: $0.001 par value; Authorized shares: 10,000,000; Issued and outstanding shares: none
|
—
|
|
—
|
|
|||
|
Common stock: $0.001 par value; Authorized shares: 100,000,000; Issued shares: 29,170,903 and 29,492,141 at December 31, 2015 and 2016, respectively; Outstanding shares: 18,144,970 and 18,356,551 at December 31, 2015 and 2016, respectively
|
29
|
|
29
|
|
|||
|
Additional paid-in capital
|
266,699
|
|
272,778
|
|
|||
|
Treasury stock, at cost: 11,025,933 and 11,135,590 shares at December 31, 2015 and 2016, respectively
|
(199,998
|
)
|
(199,998
|
)
|
|||
|
Retained earnings
|
9,498
|
|
4,616
|
|
|||
|
Accumulated other comprehensive income
|
193
|
|
176
|
|
|||
|
Total stockholders’ equity
|
76,421
|
|
77,601
|
|
|||
|
Total liabilities and stockholders’ equity
|
$
|
113,319
|
|
$
|
108,899
|
|
|
The accompanying notes are an integral part of these consolidated financial statements.
74
EHEALTH, INC.
(In thousands, except per share amounts)
|
|
Year Ended December 31,
|
||||||||||
|
|
2014
|
2015
|
2016
|
||||||||
|
Revenue
|
|
|
|
||||||||
|
Commission
|
$
|
158,626
|
|
$
|
171,257
|
|
$
|
170,850
|
|
||
|
Other
|
21,051
|
|
18,284
|
|
16,110
|
|
|||||
|
Total revenue
|
179,677
|
|
189,541
|
|
186,960
|
|
|||||
|
Operating costs and expenses:
|
|
|
|
||||||||
|
Cost of revenue
|
4,494
|
|
4,178
|
|
3,176
|
|
|||||
|
Marketing and advertising
|
69,732
|
|
75,571
|
|
72,213
|
|
|||||
|
Customer care and enrollment
|
42,745
|
|
42,540
|
|
47,930
|
|
|||||
|
Technology and content
|
40,390
|
|
36,351
|
|
32,749
|
|
|||||
|
General and administrative
|
27,549
|
|
30,858
|
|
36,004
|
|
|||||
|
Restructuring charges
|
—
|
|
4,541
|
|
(297
|
)
|
|||||
|
Amortization of intangible assets
|
1,529
|
|
1,153
|
|
1,040
|
|
|||||
|
Total operating costs and expenses
|
186,439
|
|
195,192
|
|
192,815
|
|
|||||
|
Loss from operations
|
(6,762
|
)
|
(5,651
|
)
|
(5,855
|
)
|
|||||
|
Other income (expense), net
|
(98
|
)
|
45
|
|
102
|
|
|||||
|
Loss before provision (benefit) for income taxes
|
(6,860
|
)
|
(5,606
|
)
|
(5,753
|
)
|
|||||
|
Provision (benefit) for income taxes
|
9,345
|
|
(843
|
)
|
(871
|
)
|
|||||
|
Net loss
|
$
|
(16,205
|
)
|
$
|
(4,763
|
)
|
$
|
(4,882
|
)
|
||
|
Net loss per share:
|
|
|
|
||||||||
|
Basic
|
$
|
(0.88
|
)
|
$
|
(0.26
|
)
|
$
|
(0.27
|
)
|
||
|
Diluted
|
$
|
(0.88
|
)
|
$
|
(0.26
|
)
|
$
|
(0.27
|
)
|
||
|
Weighted-average number of shares used in per share amounts:
|
|
|
|
||||||||
|
Basic
|
18,367
|
|
18,008
|
|
18,272
|
|
|||||
|
Diluted
|
18,367
|
|
18,008
|
|
18,272
|
|
|||||
|
Comprehensive loss:
|
|
|
|
|
|
|
|||||
|
Net loss
|
$
|
(16,205
|
)
|
$
|
(4,763
|
)
|
$
|
(4,882
|
)
|
||
|
Foreign currency translation adjustment, net of taxes
|
19
|
|
14
|
|
(17
|
)
|
|||||
|
Comprehensive loss
|
$
|
(16,186
|
)
|
$
|
(4,749
|
)
|
$
|
(4,899
|
)
|
||
The accompanying notes are an integral part of these consolidated financial statements.
75
EHEALTH, INC.
CONSOLIDATED STATEMENTS OF STOCKHOLDERS’ EQUITY
(In thousands)
|
|
Common Stock
|
|
Treasury Stock
|
|
|
|
|||||||||||||||||||||||
|
|
Shares
|
Amount
|
Additional Paid-in
Capital
|
Shares
|
Amount
|
Retained Earnings
|
Accumulated Other Comprehensive Income
|
Total Stockholders’ Equity
|
|||||||||||||||||||||
|
Balance at December 31, 2013
|
28,300
|
|
$
|
28
|
|
$
|
252,361
|
|
(9,519
|
)
|
$
|
(149,998
|
)
|
$
|
30,466
|
|
$
|
160
|
|
$
|
133,017
|
|
|||||||
|
Issuance of common stock in connection with exercise of common stock options and release of vested restricted stock units, net of cash used to net settle equity awards
|
476
|
|
1
|
|
595
|
|
(72
|
)
|
—
|
|
—
|
|
—
|
|
596
|
|
|||||||||||||
|
Stock-based compensation expense
|
—
|
|
—
|
|
5,904
|
|
—
|
|
—
|
|
—
|
|
—
|
|
5,904
|
|
|||||||||||||
|
Excess tax benefits from stock-based compensation
|
—
|
|
—
|
|
147
|
|
—
|
|
—
|
|
—
|
|
—
|
|
147
|
|
|||||||||||||
|
Foreign currency translation adjustment, net of taxes
|
—
|
|
—
|
|
—
|
|
—
|
|
—
|
|
—
|
|
19
|
|
19
|
|
|||||||||||||
|
Repurchase of common stock
|
—
|
|
—
|
|
—
|
|
(1,355
|
)
|
(50,000
|
)
|
—
|
|
—
|
|
(50,000
|
)
|
|||||||||||||
|
Net loss
|
—
|
|
—
|
|
—
|
|
—
|
|
—
|
|
(16,205
|
)
|
—
|
|
(16,205
|
)
|
|||||||||||||
|
Balance at December 31, 2014
|
28,776
|
|
29
|
|
259,007
|
|
(10,946
|
)
|
(199,998
|
)
|
14,261
|
|
$
|
179
|
|
73,478
|
|
||||||||||||
|
Issuance of common stock in connection with exercise of common stock options and release of vested restricted stock units, net of cash used to net settle equity awards
|
395
|
|
—
|
|
662
|
|
(80
|
)
|
—
|
|
—
|
|
—
|
|
662
|
|
|||||||||||||
|
Stock-based compensation expense
|
—
|
|
—
|
|
7,030
|
|
—
|
|
—
|
|
—
|
|
—
|
|
7,030
|
|
|||||||||||||
|
Foreign currency translation adjustment, net of taxes
|
—
|
|
—
|
|
—
|
|
—
|
|
—
|
|
—
|
|
14
|
|
14
|
|
|||||||||||||
|
Net loss
|
—
|
|
—
|
|
—
|
|
—
|
|
—
|
|
(4,763
|
)
|
—
|
|
(4,763
|
)
|
|||||||||||||
|
Balance at December 31, 2015
|
29,171
|
|
29
|
|
266,699
|
|
(11,026
|
)
|
(199,998
|
)
|
9,498
|
|
193
|
|
76,421
|
|
|||||||||||||
|
Issuance of common stock in connection with exercise of common stock options and release of vested restricted stock units, net of cash used to net settle equity awards
|
321
|
|
—
|
|
(1,187
|
)
|
(110
|
)
|
—
|
|
—
|
|
—
|
|
(1,187
|
)
|
|||||||||||||
|
Stock-based compensation expense
|
—
|
|
—
|
|
7,266
|
|
—
|
|
—
|
|
—
|
|
—
|
|
7,266
|
|
|||||||||||||
|
Foreign currency translation adjustment, net of taxes
|
—
|
|
—
|
|
—
|
|
—
|
|
—
|
|
—
|
|
(17
|
)
|
(17
|
)
|
|||||||||||||
|
Net loss
|
—
|
|
—
|
|
—
|
|
—
|
|
—
|
|
(4,882
|
)
|
—
|
|
(4,882
|
)
|
|||||||||||||
|
Balance at December 31, 2016
|
29,492
|
|
$
|
29
|
|
$
|
272,778
|
|
(11,136
|
)
|
$
|
(199,998
|
)
|
$
|
4,616
|
|
$
|
176
|
|
$
|
77,601
|
|
|||||||
The accompanying notes are an integral part of these consolidated financial statements.
76
EHEALTH, INC.
(In thousands)
|
|
Year Ended December 31,
|
||||||||||
|
|
2014
|
2015
|
2016
|
||||||||
|
Operating activities
|
|
|
|
|
|
||||||
|
Net loss
|
$
|
(16,205
|
)
|
$
|
(4,763
|
)
|
$
|
(4,882
|
)
|
||
|
Adjustments to reconcile net loss to net cash provided by operating activities:
|
|
|
|
|
|
|
|||||
|
Deferred income taxes
|
9,163
|
|
101
|
|
114
|
|
|||||
|
Depreciation and amortization
|
4,192
|
|
4,148
|
|
3,539
|
|
|||||
|
Amortization of internally developed software
|
483
|
|
627
|
|
936
|
|
|||||
|
Amortization of book-of-business consideration
|
1,998
|
|
2,006
|
|
1,649
|
|
|||||
|
Amortization of intangible assets
|
1,529
|
|
1,153
|
|
1,040
|
|
|||||
|
Stock-based compensation expense
|
5,877
|
|
7,002
|
|
7,266
|
|
|||||
|
Other non-cash items
|
154
|
|
106
|
|
(233
|
)
|
|||||
|
Changes in operating assets and liabilities:
|
|
|
|
|
|
|
|||||
|
Accounts receivable
|
(3,614
|
)
|
(1,447
|
)
|
434
|
|
|||||
|
Prepaid expenses and other current assets
|
(1,033
|
)
|
997
|
|
(486
|
)
|
|||||
|
Accounts payable
|
1,581
|
|
(2,949
|
)
|
2,227
|
|
|||||
|
Accrued compensation and benefits
|
(2,084
|
)
|
6,180
|
|
(3,466
|
)
|
|||||
|
Accrued marketing expenses
|
480
|
|
1,991
|
|
(3,540
|
)
|
|||||
|
Deferred revenue
|
(1,143
|
)
|
(642
|
)
|
567
|
|
|||||
|
Accrued restructuring charges
|
—
|
|
433
|
|
(433
|
)
|
|||||
|
Other current liabilities
|
401
|
|
(1,247
|
)
|
(649
|
)
|
|||||
|
Net cash provided by operating activities
|
1,779
|
|
13,696
|
|
4,083
|
|
|||||
|
Investing activities
|
|
|
|
|
|
||||||
|
Purchases of property and equipment and other assets
|
(3,604
|
)
|
(2,996
|
)
|
(3,726
|
)
|
|||||
|
Purchase of intangible asset
|
(4,500
|
)
|
—
|
|
—
|
|
|||||
|
Net cash used in investing activities
|
(8,104
|
)
|
(2,996
|
)
|
(3,726
|
)
|
|||||
|
Financing activities
|
|
|
|
|
|
||||||
|
Net proceeds from exercise of common stock options
|
4,112
|
|
1,572
|
|
62
|
|
|||||
|
Cash used to net-share settle equity awards
|
(3,516
|
)
|
(922
|
)
|
(1,248
|
)
|
|||||
|
Excess tax benefits from stock-based compensation
|
147
|
|
—
|
|
—
|
|
|||||
|
Repurchase of common stock
|
(50,000
|
)
|
—
|
|
—
|
|
|||||
|
Principal payments in connection with capital leases
|
(74
|
)
|
(73
|
)
|
(83
|
)
|
|||||
|
Net cash provided by (used in) financing activities
|
(49,331
|
)
|
577
|
|
(1,269
|
)
|
|||||
|
Effect of exchange rate changes on cash and cash equivalents
|
16
|
|
18
|
|
(17
|
)
|
|||||
|
Net increase (decrease) in cash and cash equivalents
|
(55,640
|
)
|
11,295
|
|
(929
|
)
|
|||||
|
Cash and cash equivalents at beginning of period
|
107,055
|
|
51,415
|
|
62,710
|
|
|||||
|
Cash and cash equivalents at end of period
|
$
|
51,415
|
|
$
|
62,710
|
|
$
|
61,781
|
|
||
|
Supplemental disclosure of non-cash investing and financing activities
|
|
|
|
|
|||||||
|
Capital lease obligations incurred
|
$
|
93
|
|
$
|
156
|
|
$
|
51
|
|
||
|
Settlement of receivables in connection with purchase of intangible asset
|
$
|
307
|
|
$
|
—
|
|
$
|
—
|
|
||
|
Supplemental disclosure of cash flows
|
|
|
|
|
|||||||
|
Cash paid for interest
|
$
|
26
|
|
$
|
34
|
|
$
|
14
|
|
||
|
Cash paid for income taxes, net of refunds
|
$
|
5
|
|
$
|
6
|
|
$
|
628
|
|
||
The accompanying notes are an integral part of these consolidated financial statements.
77
EHEALTH, INC.
NOTES TO CONSOLIDATED FINANCIAL STATEMENTS
Description of Business—
eHealth, Inc. (the “Company,” “eHealth,” “we” or “us”) is a leading private health insurance exchange for individuals, families and small businesses in the United States. Through our website addresses (
www.eHealth.com
,
www.eHealthInsurance.com
,
www.eHealthMedicare.com, www.Medicare.com
and
www.PlanPrescriber.com)
, consumers can get quotes from leading health insurance carriers, compare plans side-by-side, and apply for and purchase Medicare-related, individual and family, small business and ancillary health insurance plans. We actively market the availability of Medicare-related insurance plans and offer Medicare plan comparison tools and educational materials for Medicare-related insurance plans, including Medicare Advantage, Medicare Supplement and Medicare Part D prescription drug plans. Our ecommerce technology also enables us to deliver consumers’ health insurance applications electronically to health insurance carriers. We are licensed to market and sell health insurance in all
50
states and the District of Columbia.
Principles of Consolidation—
The consolidated financial statements include the accounts of eHealth, Inc. and its wholly-owned subsidiaries. All intercompany accounts and transactions have been eliminated in consolidation. The consolidated financial statements have been prepared in accordance with U.S. generally accepted accounting principles (“U.S. GAAP”).
Operating Segments-
We report segment information based on how our chief executive officer, who is our chief operating decision maker ("CODM"), regularly reviews our operating results, allocates resources and makes decisions regarding our business operations. The performance measures of our segments include total revenue and profit (loss). In connection with recent changes in our executive management team, we implemented a new operating structure in October 2016 to focus on our growth opportunities and objectives, while operating the business more efficiently. The new business structure is comprised of
two
operating segments, Medicare and Individual, Family and Small Business. These operating segments reflect the way our CODM views and evaluates our business performance and manages operations as well as allocates resources.
The Medicare segment consists primarily of commissions earned from our sale of Medicare-related health insurance plans, including Medicare Advantage, Medicare Supplement and Medicare Part D prescription drug plans, and to a lesser extent, ancillary products sold to our Medicare-eligible customers, including but not limited to, dental, vision, life, short term disability and long term disability insurance, as well as our advertising program that allows Medicare-related carriers to purchase advertising on a separate website developed, hosted and maintained by us and our delivery and sale to third parties of Medicare-related health insurance leads generated by our ecommerce platforms and our marketing activities.
The Individual, Family and Small Business segment consists primarily of commissions earned from our sale of individual and family and small business health insurance plans and ancillary products sold to our non-Medicare-eligible customers, including but not limited to, dental, vision, life, short term disability and long term disability insurance. To a lesser extent, the Individual, Family and Small Business segment consists of amounts earned from our online sponsorship program that allows carriers to purchase advertising space in specific markets in a sponsorship area on our website, our licensing to third parties the use of our health insurance ecommerce technology and our delivery and sale to third parties of individual and family health insurance leads generated by our ecommerce platforms and our marketing activities.
Marketing and advertising, customer care and enrollment, technology and content and general and administrative operating expenses that are directly attributable to a segment are reported within the applicable segment. Indirect marketing and advertising, customer care and enrollment and technology and content operating expenses are allocated to each segment based on usage. Other indirect general and administrative operating expenses are managed in a corporate shared services environment and, since they are not the responsibility of segment operating management, are not allocated to the
two
operating segments and are presented as a reconciling item to our consolidated financial results.
Segment profit (loss) is calculated as total revenue for the applicable segment less direct and allocated marketing and advertising, customer care and enrollment, technology and content and general and administrative operating expenses, excluding stock-based compensation, depreciation and amortization expense and amortization of intangible assets.
Use of Estimates
—The preparation of consolidated financial statements and related disclosures in conformity with U.S. GAAP requires management to make estimates, judgments and assumptions that affect the amounts reported and disclosed in the consolidated financial statements and accompanying notes. On an ongoing basis, we evaluate our estimates, including those related to, but not limited to, the useful lives of intangible assets, fair value of investments, fair value of our acquired Medicare books-of-business, recoverability of intangible assets, estimates for commission forfeitures, valuation allowance for
78
EHEALTH, INC.
NOTES TO CONSOLIDATED FINANCIAL STATEMENTS
deferred income taxes, provision for income taxes and the assumptions used in determining stock-based compensation. We base our estimates of the carrying value of certain assets and liabilities on historical experience and on various other assumptions that we believe to be reasonable. Actual results may differ from these estimates.
Cash Equivalents
—We consider all investments with an original maturity of 90 days or less from the date of purchase to be cash equivalents. Cash and cash equivalents are stated at fair value.
Property and Equipment
—Property and equipment are stated at cost, less accumulated depreciation and amortization. Capital lease amortization expenses are included in depreciation expense in our Consolidated Statements of Comprehensive Loss. Depreciation and amortization is computed using the straight-line method based on estimated useful lives as follows:
|
Computer equipment and software
|
|
3 to 5 years
|
|
Office equipment and furniture
|
|
5 years
|
|
Leasehold improvements
|
|
Lesser of useful life (typically 5 to 10 years) or related lease term
|
Maintenance and minor replacements are expensed as incurred.
See
Note 2
– Balance Sheet Accounts
of the Notes to Consolidated Financial Statements for additional information regarding our property and equipment.
Goodwill and Intangible Assets
—Goodwill represents the excess of the consideration paid over the estimated fair value of assets acquired and liabilities assumed in a business combination. In the event that we realign our reporting units, we allocate our goodwill to the new reporting units using the relative fair value approach. We test our goodwill for impairment on an annual basis in the fourth quarter of each year or whenever events or changes in circumstances indicate that the asset may be impaired. Factors that we consider in deciding when to perform an impairment review include significant negative industry or economic trends or significant changes or planned changes in our use of the intangible assets. We measure the recoverability of assets that will continue to be used in our operations by comparing the carrying value of the asset grouping to our estimate of the related total future undiscounted net cash flows. If an asset grouping’s carrying value is not recoverable through the related undiscounted cash flows, the asset grouping is considered to be impaired. The impairment is measured by comparing the difference between the asset grouping’s carrying value and its fair value. Fair value is the price that would be received from selling an asset in an orderly transaction between market participants at the measurement date.
Prior to 2016, we operated as
one
operating segment. In the fourth quarter of 2016, we implemented a new operating structure which is comprised of
two
operating segments, Medicare and Individual, Family and Small Business. For the 2016 annual goodwill impairment assessment, we allocated
$3.7 million
and
$10.4 million
of the carrying value of the goodwill to the Medicare and Individual, Family and Small Business segments, respectively, based on the relative fair value of the operating segments. No goodwill impairment has been identified in any of the years presented.
Intangible assets with finite useful lives, which include purchased technology, pharmacy and customer relationships, trade names, and certain trademarks, are amortized over their estimated useful lives and are reviewed for impairment whenever events or changes in circumstances indicate a reduction in their fair values below their respective carrying amounts.
Goodwill and intangible assets are considered non-financial assets and therefore, subsequent to their initial recognition are not revalued at fair value each reporting period unless an impairment charge is recognized.
We must make subjective judgments in determining the independent cash flows that can be related to specific asset groupings. In addition, we must make subjective judgments regarding the remaining useful lives of assets with finite useful lives. When we determine that the useful life of an asset is shorter than we had originally estimated, we accelerate the rate of amortization over the assets’ new, remaining useful life. We evaluated the remaining useful lives of our intangible assets with finite lives in the fourth quarter of 2016 and determined no material adjustments to the remaining lives were required.
Book-of-Business Transfers—
We have entered into several agreements with a broker partner, whereby the partner transferred certain of its existing Medicare plan members to us as the broker of record on the underlying policies. The first of these book-of-business transfers occurred in November 2010 and the most recent in June 2012. Total consideration for these books-of-business amounted to
$13.9 million
. Consideration for these books-of-business is included in Prepaid Expenses and Other Current Assets and in Other Assets in the accompanying Consolidated Balance Sheets. The consideration, which was based on the discounted commissions expected to be received over the remaining life of each transferred Medicare plan member, is being amortized to cost of revenue in the Consolidated Statements of Comprehensive Loss and is presented as
79
EHEALTH, INC.
NOTES TO CONSOLIDATED FINANCIAL STATEMENTS
Amortization of Book-of-Business Consideration in the Consolidated Statements of Cash Flows as we recognize commission revenue related to the transferred Medicare plan members. The amount of consideration we amortize to cost of revenue each quarter is proportional to the amount of commission revenue we recognize on the underlying policies each quarter in relation to the total amount of remaining commission revenue expected to be recognized. Amortization expense recorded to Cost of
Revenue for these books-of-business for the years ended
December 31, 2014
,
2015
and
2016
totaled
$2.0 million
,
$2.0 million
and
$1.6 million
, respectively.
Other Long-Lived Assets
—We evaluate other long-lived assets for impairment whenever events or changes in circumstances indicate that the carrying amount of an asset may not be recoverable. If such assets are considered to be impaired, the impairment to be recognized is measured by the amount by which the carrying amount of the asset exceeds its fair value.
Revenue Recognition
—We recognize revenue for our services when each of the following four criteria is met: persuasive evidence of an arrangement exists; delivery has occurred or services have been rendered; the seller’s price to the buyer is fixed or determinable; and collectability is reasonably assured. Our revenue is primarily comprised of compensation paid to us by health insurance carriers related to insurance plans that have been purchased by a member who used our service. We define a member as an individual currently covered by an insurance plan, including individual and family, Medicare-related, small business and ancillary plans, for which we are entitled to receive compensation from an insurance carrier.
For both Medicare Advantage and Medicare Part D prescription drug plans, we receive a fixed, annual commission payment from insurance carriers once the plan is approved by the carrier and either a fixed, monthly or annual commission payment beginning with and subsequent to the second plan year. Additionally, commission rates may be higher in the first twelve months of the plan if the plan is the first Medicare Advantage or Medicare Part D prescription drug plan issued to the member. In the first plan year of a Medicare Advantage and Medicare Part D prescription drug plan, after the health insurance carrier approves the application but during the effective year of the plan, we are paid a fixed commission that is prorated for the number of months remaining in the calendar year. Additionally, if the plan is the first Medicare Advantage or Medicare Part D plan issued to the member, we may receive a higher commission rate that covers a full twelve-month period, regardless of the month the plan was effective. We earn commission revenue for Medicare Advantage and Medicare Part D prescription drug plans for which we are the broker of record, typically until either the policy is cancelled or we otherwise do not remain the agent on the policy. We recognize commission revenue for both Medicare Advantage and Medicare Part D prescription drug plans for the entire plan year once the annual or first monthly commission amount for the plan year is reported to us by the carrier, net of an estimate for future forfeiture amounts due to plan cancellations. For commissions paid to us on a monthly basis, we record a receivable for the commission amounts to be received over the remainder of the plan year, net of an estimate for commission amounts not expected to be collected due to plan cancellations, which is included in Accounts Receivable in the accompanying Consolidated Balance Sheets. We continue to receive the commission payments from the relevant insurance carrier typically until either the policy is cancelled or we otherwise do not remain the agent on the policy. We determine that there is persuasive evidence of an arrangement when we have a commission agreement with a health insurance carrier. Our services are complete when a carrier has approved an application in the initial year and when a member has renewed in a renewal year. The seller’s price is fixed or determinable and collectability is reasonably assured when a carrier has approved an application and the carrier reports to us the annual or first monthly renewal commission amount for each plan year.
For individual and family, Medicare Supplement, small business and ancillary plans, our compensation generally represents a flat amount per member per month or a percentage of the premium amount collected by the carrier during the period that a member maintains coverage under a plan (commissions) and, to a much lesser extent, override commissions that health insurance carriers pay us for achieving certain objectives. Premium-based commissions are reported to us after the premiums are collected by the carrier, generally on a monthly basis. We generally continue to receive the commission payment from the relevant insurance carrier until the health insurance plan is cancelled or we otherwise do not remain the agent on the policy. We recognize commission revenue for individual and family, Medicare Supplement, small business and ancillary plans as the commissions are reported to us by the carrier, net of an estimate for future forfeiture amounts due to policy cancellations. We determine that there is persuasive evidence of an arrangement when we have a commission agreement with a health insurance carrier, a carrier reports to us that it has approved an application submitted through our ecommerce platform and the applicant starts making payments on the plan. Our services are complete when a carrier has approved an application. The seller’s price is fixed or determinable and collectability is reasonably assured when commission amounts have been reported to us by a carrier.
We recognize individual and family, small business and ancillary commission override revenue when reported to us by a carrier based on the actual attainment of predetermined target sales levels or other objectives as determined by the carrier. Commission override revenue, which we recognize on the same basis as individual and family, small business and ancillary commissions, is generally reported to us in a more irregular pattern than such commissions.
80
EHEALTH, INC.
NOTES TO CONSOLIDATED FINANCIAL STATEMENTS
Commissions for all health insurance plans we sell are reported to us by a cash payment and commission statement. We generally receive these communications simultaneously. In instances when we receive the cash payment and commission statement separately and in different accounting periods, we recognize revenue in the period that we receive the earliest communication, provided we receive the second corroborating communication shortly following the end of the accounting period. If the second corroborating communication is not received shortly following the end of the accounting period, we recognize revenue in the period the second communication is received. During 2014, the Centers for Medicare and Medicaid Services (“CMS”) issued a regulation prohibiting carriers from paying commissions during the fourth quarter on Medicare Advantage and Medicare Part D prescription drug plans sold during the fourth quarter with an effective date in the following year. During the fourth quarters of 2014, 2015 and 2016, we recognized revenue for policies included on a commission statement received prior to December 31, 2014, 2015 and 2016, respectively, for which payment was received shortly after year-end and in connection with the carriers’ normal payment cycle during the first quarters of 2015, 2016 and 2017. We use the data in the commission statements to help identify the members for which we are receiving a commission payment and the amount received for each member, and to estimate future forfeiture amounts due to policy cancellations. As a result, we recognize the net amount of compensation earned as the agent in the transaction. Changes in our historical trends would result in changes to our estimated forfeitures in future periods. There were no changes in our average forfeiture rates or reporting time lag during the years ended
December 31, 2014
,
2015
and
2016
, which had a material impact on our estimate for forfeitures.
Certain commission amounts are subject to forfeiture if the plan is subsequently cancelled and either the carrier takes back all or a portion of the commission they have paid to us or we will no longer receive monthly commission payments for the remainder of the plan year. We record an estimate for these forfeitures based on our historical cancellation experience using data provided on commission statements. Policy cancellations and the commission amounts, if any, to be taken back by the carrier are typically reported to us by health insurance carriers several months after the policy’s cancellation date. Our estimate for forfeitures payable to a carrier, which is included in Other Current Liabilities in the Consolidated Balance Sheets, includes an estimate of both the reporting time lag and the forfeiture amount, based on our historical experience by policy type. Similarly, our estimate for commission amounts not expected to be collected due to policy cancellations, which is recorded as a reduction of Accounts Receivable in the Consolidated Balance Sheets, includes an estimate of the annual policy cancellation rate, based on our historical experience by policy type.
Other Revenue
Our sponsorship and advertising program allows carriers to purchase advertising space in specific markets in a sponsorship area on our website. In return, we are typically paid a monthly fee, which is recognized over the period that advertising is displayed, and often a performance fee based on metrics such as submitted health insurance applications, which is recognized when the earned amount are fixed and determinable. We also offer Medicare advertising services, which include website development, hosting and maintenance. In these instances, we are typically paid a fixed, up-front fee, which we recognize as revenue over the service period.
Our commercial technology licensing business allows carriers the use of our ecommerce platform to offer their own health insurance policies on their websites and agents to utilize our technology to power their online quoting, content and application submission processes. Typically, we are paid a one-time implementation fee, which we recognize on a straight-line basis over the estimated term of the customer relationship (generally the initial term of the agreement), commencing once the technology is available for use by the third party, and a performance fee based on metrics such as submitted health insurance applications. The metrics used to calculate performance fees for both sponsorship and advertising and technology licensing are based on performance criteria that are either measured based on data tracked by us, or based on data tracked by the third party. In instances where the performance criteria data is tracked by us, we recognize revenue in the period of performance and when all other revenue recognition criteria has been met. In instances where the performance criteria data is tracked by the third party, we recognize revenue when the amounts earned are either fixed or determinable and collection is reasonably assured. Typically, this occurs through our receipt of a cash payment from the third party along with a detailed statement containing the data that is tracked by the third party.
Deferred Revenue
—
Deferred revenue includes deferred technology licensing implementation fees and amounts billed for deliverables, including professional services, in multiple element arrangements that do not have stand-alone value from other, undelivered elements, as well as amounts billed or collected from sponsorship or technology licensing customers in advance of our performing our service for such customers. It also includes the amount by which both unbilled and billed services provided under our technology licensing arrangements exceed the straight-line revenue recognized to date. We defer commission amounts that have been paid to us related to transactions where our services are complete, but where we cannot currently estimate future forfeitures related to those amounts.
81
EHEALTH, INC.
NOTES TO CONSOLIDATED FINANCIAL STATEMENTS
We allocate revenue to all units of accounting within an arrangement with multiple deliverables at the inception of the arrangement using the relative selling price method. The relative selling price method allocates any discount in an arrangement proportionally to each deliverable on the basis of each deliverable’s relative selling price. The relative selling price established for each deliverable is based on vendor-specific objective evidence of fair value (“VSOE”) if available, third-party evidence of selling price if VSOE is not available, or best estimate of selling price if neither VSOE nor third-party evidence is available. When used, the best estimate of selling price reflects our best estimates of what the selling prices of certain deliverables would be if they were sold regularly on a stand-alone basis. Our process for determining best estimate of selling price for deliverables without VSOE or third-party evidence of selling price considers multiple factors that may vary depending upon the unique facts and circumstances related to each deliverable. Key factors considered by us in developing the relative selling prices for our technology licensing fees include prices charged by us for similar offerings and our historical pricing practices. We may also consider additional factors as appropriate, including competition.
A deliverable constitutes a separate unit of accounting when it has stand-alone value and there are no customer-negotiated right of refunds for the delivered elements. If the arrangement includes a customer-negotiated right of refund relative to the delivered item, and the delivery and performance of the undelivered item is considered probable and substantially in our control, the delivered element constitutes a separate unit of accounting. In circumstances when the aforementioned criteria are not met, the deliverable is combined with the undelivered elements, and the allocation of the arrangement consideration and revenue recognition is determined for the combined unit as a single unit. Allocation of the consideration is determined at the inception of the arrangement on the basis of each unit’s relative selling price. After the arrangement consideration has been allocated to each unit of accounting based on their relative selling prices, we apply revenue recognition criteria separately to each respective unit of accounting in the arrangement in accordance with applicable accounting guidance.
Cost of Revenue—
Included in cost of revenue are payments related to health insurance policies sold to members who were referred to our website by marketing partners with whom we have revenue-sharing arrangements. In order to enter into a revenue-sharing arrangement, marketing partners must be licensed to sell health insurance in the state where the policy is sold. Costs related to revenue-sharing arrangements are expensed as the related revenue is recognized.
Additionally, cost of revenue includes the amortization of consideration we paid to a broker partner in connection with the transfer of their Medicare-related health insurance members to us as the new broker of record on the underlying policies.
Marketing and Advertising Expenses—
Marketing and advertising expenses consist primarily of member acquisition expenses associated with our direct, marketing partner and online advertising member acquisition channels, in addition to compensation and other expenses related to marketing, business development, partner management, public relations and carrier relations personnel who support our offerings. Advertising costs incurred in the years ended
December 31, 2014
,
2015
and
2016
totaled
$61.3 million
,
$66.5 million
and
$64.8 million
, respectively.
Our direct channel expenses primarily consist of costs for direct mail, email marketing, television, radio and retargeting campaigns. Advertising costs for our direct channel are expensed the first time the related advertising takes place. Our marketing partner channel expenses primarily consist of fees paid to marketing partners with which we have a relationship. Our online advertising channel expenses primarily consist of paid keyword search advertising on search engines. Advertising costs for our marketing partner channel and our online advertising channel are expensed as incurred.
Research and Development Expenses
—Research and development expenses consist primarily of compensation and related expenses incurred for employees on our engineering and technical teams. Research and development costs, which totaled
$12.1 million
,
$10.6 million
and
$8.9 million
for the years ended
December 31, 2014
,
2015
and
2016
, respectively, are included in technology and content expense in the accompanying Consolidated Statements of Comprehensive Loss.
Deferred Contract Costs
—
Deferred contract costs primarily represent direct costs related to professional services provided in connection with technology licensing arrangements that are accounted for as a single unit of accounting. The direct professional services costs are deferred up until the commencement of revenue recognition of the single unit and then recognized as cost of revenue ratably over the same period as the related revenue.
Internal-Use Software and Website Development Costs—
We capitalize costs of materials, consultants and compensation and benefits costs of employees who devote time to the development of internal-use software during the application development stage. Our judgment is required in determining the point at which various projects enter the phases at which costs may be capitalized, in assessing the ongoing value of the capitalized costs and in determining the estimated useful lives over which the costs are amortized, which is generally
three
years. For the years ended
December 31, 2014
,
2015
and
82
EHEALTH, INC.
NOTES TO CONSOLIDATED FINANCIAL STATEMENTS
2016
, we capitalized
$1.2 million
,
$1.1 million
and
$1.8 million
in internal-use software and website development costs, respectively, and recorded amortization expense of
$0.2 million
,
$0.6 million
and
$0.9 million
, respectively.
Stock-Based Compensation—
We recognize stock-based compensation expense in the accompanying Consolidated Statements of Comprehensive Loss based on the fair value of our stock-based awards over their respective vesting periods, which is generally
four years
. The estimated grant date fair value of our stock options is determined using the Black-Scholes-Merton pricing model and a single option award approach. The weighted-average expected term for stock options granted is calculated using historical option exercise behavior. The dividend yield is determined by dividing the expected per share dividend during the coming year by the grant date stock price. Through
December 31, 2016
, we had not declared or paid any cash dividends, and we do not expect to pay any in the foreseeable future. We base the risk-free interest rate on the implied yield currently available on U.S. Treasury zero-coupon issues with a remaining term equal to the expected term of our stock options. Expected volatility is determined using a combination of the implied volatility of publicly traded options in our stock and historical volatility of our stock price. The estimated attainment of performance-based awards and related expense is based on the expectations of revenue target achievement. The estimated fair value of performance awards with market conditions is determined using the Monte-Carlo simulation model. The assumptions used in calculating the fair value of stock-based payment awards and expected attainment of performance-based awards represent our best estimates, but these estimates involve inherent uncertainties and the application of management judgment. We will continue to use judgment in evaluating the expected term and volatility related to our own stock-based awards on a prospective basis, and incorporating these factors into the model. Changes in key assumptions could significantly impact the valuation of such instruments.
401(k) Plan
—In September 1998, our board of directors adopted a defined contribution retirement plan (401(k) Plan), which qualifies under Section 401(k) of the Internal Revenue Code of 1986. Participation in the 401(k) Plan is available to substantially all employees in the United States. Employees can contribute up to
25%
of their salary, up to the federal maximum allowable limit, on a before-tax basis to the 401(k) Plan. Employee contributions are fully vested when contributed. Our contributions to the 401(k) Plan are discretionary and are expensed when incurred. We also match employee contributions to our 401(k) Plan at 25% of an employee’s contribution each pay period, up to a maximum of
1%
of the employee’s salary during such pay period. Our matching contributions are expensed as incurred and vest one-third for each of the first
three
years of the recipient’s service. The recipient is fully vested in all 401(k) Plan matching contributions after three years of service. We recognized expense of
$0.4 million
,
$0.3 million
, and
$0.3 million
for the years ended
December 31, 2014
,
2015
and
2016
, respectively, related to 401(k) matching contributions.
Income Taxes
—We account for income taxes using the liability method. Deferred income taxes are determined based on the differences between the financial reporting and tax bases of assets and liabilities, using enacted statutory tax rates in effect for the year in which the differences are expected to reverse.
We utilize a two-step approach for evaluating uncertain tax positions. Step one,
Recognition
, requires a company to determine if the weight of available evidence indicates that a tax position is more likely than not to be sustained upon audit, including resolution of related appeals or litigation processes, if any. Step two,
Measurement
, is based on the largest amount of benefit, which is more likely than not to be realized on ultimate settlement. We record interest and penalties related to uncertain tax positions as income tax expense in the consolidated financial statements.
Seasonality—
A greater number of our Medicare-related health insurance plans are sold in our fourth quarter during the Medicare annual enrollment period when Medicare-eligible individuals are permitted to change their Medicare Advantage and Medicare Part D prescription drug coverage for the following year. Additionally, substantially all of the Medicare Advantage and Medicare Part D prescription drug policies we have sold renew on January 1 of each year, resulting in our recognizing substantially all renewal Medicare Advantage and Medicare Part D prescription drug plan commission revenue in our first quarter. Our Medicare plan-related commission revenue is highest in our first quarter and is higher in our fourth quarter compared to our second and third quarters.
The majority of our individual and family health insurance plans are sold in the annual open enrollment period as defined under the federal Patient Protection and Affordable Care Act and related amendments in the Health Care and Education Reconciliation Act. Individuals and families generally are not able to purchase individual and family health insurance outside of these open enrollment periods, unless they qualify for a special enrollment period as a result of certain qualifying events, such as losing employer-sponsored health insurance or moving to another state.
83
EHEALTH, INC.
NOTES TO CONSOLIDATED FINANCIAL STATEMENTS
Recent Accounting Pronouncement
In May 2014, the Financial Accounting Standard Board (“FASB”) issued Accounting Standards Update (“ASU”) 2014-09
Revenue from Contracts with Customers
, requiring an entity to recognize revenue when it transfers promised goods or services to customers in an amount that reflects the consideration to which the entity expects to be entitled to in exchange for those goods or services. ASU 2014-09 will supersede nearly all existing revenue recognition guidance under U.S. GAAP when it becomes effective. ASU 2014-09 may be adopted retrospectively to each prior reporting period presented (full retrospective method), or retrospectively with the cumulative effect of initially applying the guidance recognized at the date of initial application (modified retrospective method). We currently anticipate adopting this new accounting standard on January 1, 2018 using the full retrospective method to restate each prior reporting period presented. We anticipate the adoption of this new standard will have a material impact on our consolidated financial statements. Under the new standard, we currently expect to recognize Medicare-related, individual and family and ancillary health insurance plan commission revenue equal to the estimated life-time value of a policy at the time when the policy is sold as opposed to our current treatment of recognizing revenue over the life of the policy. ASU 2014-09 will require us to make significant estimates, including, but not limited to, the estimated consideration to be paid to us over the estimated life of policies sold for which we are the broker of record.
In February 2016, the FASB issued ASU No. 2016-02
Leases (Topic 842).
ASU 2016-02 requires lessees to put leases on their balance sheets but recognize expenses on their income statements; for lessors, the guidance modifies the classification criteria and the accounting for sales-type and direct finance leases. The guidance also eliminates existing real estate-specific provisions for all entities. The new standard is effective for annual reporting periods beginning after December 15, 2018, including interim periods within that reporting period. Early adoption is permitted. We are currently in the process of evaluating the impact of the adoption of ASU 2016-02 on our consolidated financial statements.
In April 2016, the FASB issued ASU No. 2016-10,
Identifying Performance Obligations and Licensing
. ASU 2016-10 provides guidance in identifying performance obligations and determining the appropriate accounting for licensing arrangements. The effective date and transition requirements for this ASU are the same as the effective date and transition requirements in Topic 606 (and any other Topic amended by ASU 2014-09). We are currently in the process of evaluating the impact of the adoption of ASU 2016-10 on our consolidated financial statements.
In August 2016, the FASB issued ASU No. 2016-15
Statement of Cash Flows (Topic 230): Classification of Certain Cash Receipts and Cash Payments
. ASU 2016-15 provides guidance on how certain cash receipts and cash payments are presented on the statement of cash flows. ASU 2016-15 is effective for annual reporting periods beginning after December 15, 2017. Early adoption is permitted. We are currently in the process of evaluating the impact of the adoption of ASU 2016-15 on our consolidated financial statements.
In November 2016, the FASB issued ASU No. 2016-18,
Statement of Cash Flows (Topic 230): Restricted Cash
, which clarifies guidance on the classification and presentation of restricted cash in the statement of cash flows. Under the ASU, changes in restricted cash and restricted cash equivalents would be included along with those of cash and cash equivalents in the statement of cash flows. As a result, entities would no longer present transfers between cash/equivalents and restricted cash/equivalents in the statement of cash flows. In addition, a reconciliation between the balance sheet and the statement of cash flows would be disclosed when the balance sheet includes more than one line item for cash/equivalents and restricted cash/equivalents. ASU 2016-18 will be effective for us beginning on January 1, 2018 and will be applied on a retrospective basis. Early adoption is permitted. We do not expect this ASU to have a material impact on the Company’s consolidated results of operations and financial condition.
In January 2017, the FASB issued ASU No. 2017-04,
Simplifying the Test for Goodwill Impairment
. Under the new standard, goodwill impairment would be measured as the amount by which a reporting unit’s carrying value exceeds its fair value, not to exceed the carrying value of goodwill. This ASU eliminates existing guidance that requires an entity to determine goodwill impairment by calculating the implied fair value of goodwill by hypothetically assigning the fair value of a reporting unit to all of its assets and liabilities as if that reporting unit had been acquired in a business combination. The new standard is effective for annual periods, and interim periods within those annual periods, beginning after December 15, 2019 with early adoption permitted for annual goodwill impairment tests performed after January 1, 2017. The standard must be applied prospectively. Upon adoption, the standard will impact how we assess goodwill for impairment. We are currently considering our timing of adoption.
Recently Adopted Accounting Standards
In April 2015, the FASB issued ASU No. 2015-05,
Intangibles - Goodwill and Other - Internal-Use Software (Subtopic 350-40): Customer’s Accounting for Fees Paid in a Cloud Computing Arrangement
. ASU 2015-05 provides guidance
84
EHEALTH, INC.
NOTES TO CONSOLIDATED FINANCIAL STATEMENTS
to clarify the customer’s accounting for fees paid in a cloud computing arrangement. It is effective for annual periods, and interim periods within those annual periods, beginning after December 15, 2015. We adopted this standard prospectively in the first quarter of 2016. Prior periods were not adjusted. The adoption of this standard did not have a material effect on our consolidated financial statements.
In March 2016, the FASB issued ASU No. 2016-09,
Improvements to Employee Share-Based Payment Accounting (Topic 718)
. ASU 2016-09 simplifies various aspects related to how share-based payments are accounted for and presented in the consolidated financial statements. The amendments include income tax consequences, the accounting for forfeitures, the classification of awards as either equity or liabilities and the classification on the statement of cash flows. It is effective for the first interim period beginning after December 15, 2016 and early adoption is permitted. We adopted this standard in the first quarter of 2016. In accordance with the provisions of ASU 2016-09, we classify the excess income tax benefits from stock-based compensation arrangements as a discrete item within income tax expense, rather than recognizing such excess income tax benefits in additional paid-in capital. We applied this guidance using a modified retrospective transition method effective January 1, 2016. The adoption of this guidance did not have a material effect to retained earnings or other components of equity or net assets at the beginning of the period of adoption. As a result of the adoption of the new guidance, we recorded approximately
$9.7 million
of additional deferred tax assets, which are fully offset by a valuation allowance. Under ASU 2016-09, excess income tax benefits from stock-based compensation arrangements are classified as cash flows from operations rather than as cash flows from financing activities. We elected to apply the cash flow classification guidance of ASU 2016-09 prospectively for the year ended December 31, 2016. Prior periods were not adjusted. Under ASU 2016-09, when shares are withheld from an employee's exercise of stock awards to fund our payment of the employee's taxes, the payment is classified as a financing activity. The adoption of this provision did not have a material effect on the cash flow statements from prior periods. In addition, we have elected to continue to estimate the number of stock-based awards expected to vest, as permitted by ASU 2016-09, rather than electing to account for forfeitures as they occur.
Cash and Cash Equivalents—
As of December 31,
2015
and
2016
, our cash equivalents consisted of money market accounts that invested in U.S. government-sponsored enterprise bonds and discount notes, U.S. government treasury bills and notes and repurchase agreements collateralized by U.S. government obligations. At December 31,
2015
and
2016
, our cash equivalents carried no unrealized gains or losses and we did not realize any significant gains or losses on sales of cash equivalents during the years ended
December 31, 2014
,
2015
and
2016
.
As of December 31,
2015
and 2014, our cash and cash equivalent balances were invested as follows (in thousands):
|
December 31, 2015
|
December 31, 2016
|
||||||
|
Cash
|
$
|
8,086
|
|
$
|
4,066
|
|
|
|
Money market funds
|
54,624
|
|
57,715
|
|
|||
|
Total cash and cash equivalents
|
$
|
62,710
|
|
$
|
61,781
|
|
|
We used observable prices in active markets in determining the classification of our money market funds as Level 1 as of December 31,
2015
and
2016
.
Concentration of Credit Risk
—
Our financial instruments that are exposed to concentrations of credit risk principally consist of cash, cash equivalents and accounts receivable. We invest our cash and cash equivalents with major banks and financial institutions and, at times, such investments are in excess of federally insured limits. We also have deposits with major banks in China that are denominated in both U.S. dollars and Chinese Yuan Renminbi and are not insured by the U.S. federal government.
Accounts Receivable—
We do not require collateral or other security for our accounts receivable. As of
December 31, 2015
,
three
customers represented
24%
,
18%
, and
15%
respectively, for a combined total of
57%
of our
$9.6 million
outstanding accounts receivable balance. As of
December 31, 2016
,
three
customers represented
23%
,
20%
and
11%
, respectively, for a combined total of
54%
of our
$9.2 million
outstanding accounts receivable balance. No other customers represented
10%
or more of our total accounts receivable at
December 31, 2015
and
December 31, 2016
. We believe the potential for collection issues with any of our customers was minimal as of
December 31, 2016
. Accordingly, our estimate for uncollectible amounts at
December 31, 2016
was not material.
85
As of December 31,
2015
and
2016
, our accounts receivable consisted of the following (in thousands):
|
December 31, 2015
|
December 31, 2016
|
||||||
|
Commissions receivable
|
$
|
6,136
|
|
$
|
7,265
|
|
|
|
Accounts receivable – for other revenue
|
3,511
|
|
1,948
|
|
|||
|
Total accounts receivable
|
$
|
9,647
|
|
$
|
9,213
|
|
|
The commissions receivable balance as of
December 31, 2015
and
December 31, 2016
is recorded net of a
$1.1 million
and
$1.6 million
estimated forfeiture, respectively. The estimated forfeiture is related to Medicare Advantage and Medicare Part D plans sold during the fourth quarter of 2015 and
2016
with effective dates in 2016 and 2017, respectively.
Prepaid Expenses and Other
Current
Assets—
Prepaid expenses and other current assets consisted of the following (in thousands):
|
|
December 31, 2015
|
December 31, 2016
|
|||||
|
Book-of-business transfers, net (current)
|
$
|
1,518
|
|
$
|
1,071
|
|
|
|
Prepaid maintenance contracts (current)
|
1,760
|
|
2,026
|
|
|||
|
Prepaid insurance
|
270
|
|
541
|
|
|||
|
Prepaid rent
|
364
|
|
370
|
|
|||
|
Other assets (current)
|
1,273
|
|
1,140
|
|
|||
|
Prepaid expenses and other current assets
|
$
|
5,185
|
|
$
|
5,148
|
|
|
Property and Equipment—
Property and equipment consisted of the following (in thousands)
|
|
December 31, 2015
|
December 31, 2016
|
|||||
|
Computer equipment and software
|
$
|
16,973
|
|
$
|
17,524
|
|
|
|
Office equipment and furniture
|
3,479
|
|
3,490
|
|
|||
|
Leasehold improvements
|
3,182
|
|
3,173
|
|
|||
|
Property and equipment, gross
|
23,634
|
|
24,187
|
|
|||
|
Less accumulated depreciation and amortization
|
(16,270
|
)
|
(18,579
|
)
|
|||
|
Property and equipment, net
|
$
|
7,364
|
|
$
|
5,608
|
|
|
Depreciation and amortization expense related to property and equipment totaled
$4.2 million
,
$4.1 million
and
$3.5 million
in the years ended
December 31, 2014
,
2015
and
2016
, respectively.
Other Assets—
Other assets consisted of the following (in thousands):
|
|
December 31, 2015
|
December 31, 2016
|
|||||
|
Book-of-business transfers, net (non-current)
|
$
|
1,866
|
|
$
|
665
|
|
|
|
Security deposits
|
607
|
|
589
|
|
|||
|
Capitalized project costs
|
1,832
|
|
2,735
|
|
|||
|
Deferred tax assets
|
204
|
|
204
|
|
|||
|
Other
|
188
|
|
280
|
|
|||
|
Other assets
|
$
|
4,697
|
|
$
|
4,473
|
|
|
Intangible Assets—
During the fourth quarter 2014, we recorded an impairment charge of
$0.1 million
related to certain acquired intangible assets that we concluded would not be utilized in future periods.
On March 31, 2014, we purchased an Internet domain name, www.Medicare.com, for
$4.8 million
. Cash consideration paid in connection with the purchase of the domain name totaled
$4.5 million
. The consideration paid also included
$0.3
86
million
of outstanding receivables from the owner of the domain name that were settled upon completion of the purchase. The related intangible asset was assigned an indefinite useful life. The carrying amounts, accumulated amortization, net carrying value and weighted average remaining life of our definite-lived amortizable intangible assets, as well as our indefinite-lived intangible trademarks, are presented in the tables below for (dollars in thousands, weighted-average useful life is as of December 31, 2015):
|
|
December 31, 2015
|
December 31, 2016
|
||||||||||||||||||||||
|
|
Gross Carrying Amount
|
Accumulated Amortization
|
Net Carrying Amount
|
Gross Carrying Amount
|
Accumulated Amortization
|
Net Carrying Amount
|
Weighted Average Remaining Life
|
|||||||||||||||||
|
Technology
|
$
|
1,700
|
|
$
|
(1,700
|
)
|
$
|
—
|
|
$
|
1,700
|
|
$
|
(1,700
|
)
|
$
|
—
|
|
zero
|
|||||
|
Pharmacy and customer relationships
|
10,100
|
|
(5,984
|
)
|
4,116
|
|
10,100
|
|
(6,934
|
)
|
3,166
|
|
3.3 years
|
|||||||||||
|
Trade names, trademarks and website addresses
|
907
|
|
(517
|
)
|
390
|
|
907
|
|
(607
|
)
|
300
|
|
3.3 years
|
|||||||||||
|
Total intangible assets subject to amortization
|
$
|
12,707
|
|
$
|
(8,201
|
)
|
4,506
|
|
$
|
12,707
|
|
$
|
(9,241
|
)
|
3,466
|
|
|
|||||||
|
Indefinite-lived trademarks and domain names
|
|
|
5,114
|
|
|
|
5,114
|
|
Indefinite
|
|||||||||||||||
|
Intangible assets
|
|
|
$
|
9,620
|
|
|
|
$
|
8,580
|
|
|
|||||||||||||
During the years ended
December 31, 2014
,
2015
and
2016
, amortization expense related to intangible assets totaled
$1.5 million
,
$1.2 million
and
$1.0 million
, respectively.
As of
December 31, 2016
, expected amortization expense in future periods is as follows (in thousands):
|
Years Ending December 31,
|
Pharmacy and Customer Relationships
|
Trade Names, Trademarks and Website Addresses
|
Total
|
||||||||
|
2017
|
$
|
950
|
|
$
|
90
|
|
$
|
1,040
|
|
||
|
2018
|
950
|
|
90
|
|
1,040
|
|
|||||
|
2019
|
950
|
|
90
|
|
1,040
|
|
|||||
|
2020
|
316
|
|
30
|
|
346
|
|
|||||
|
Total
|
$
|
3,166
|
|
$
|
300
|
|
$
|
3,466
|
|
||
Other Current Liabilities—
Other current liabilities consisted of the following (in thousands):
|
|
December 31, 2015
|
December 31, 2016
|
|||||
|
Payable to carriers –estimate for forfeitures
|
$
|
2,474
|
|
$
|
3,030
|
|
|
|
Professional fees
|
183
|
|
307
|
|
|||
|
Other accrued expenses
|
791
|
|
438
|
|
|||
|
Total other current liabilities
|
$
|
3,448
|
|
$
|
3,775
|
|
|
87
Non-current Liabilities—
Non-current liabilities consisted of the following (in thousands):
|
|
December 31, 2015
|
December 31, 2016
|
|||||
|
Deferred rent – non-current
|
$
|
1,068
|
|
$
|
830
|
|
|
|
Income tax payable – non-current
|
3,221
|
|
1,978
|
|
|||
|
Deferred tax liabilities
|
329
|
|
443
|
|
|||
|
Other non-current liabilities
|
344
|
|
123
|
|
|||
|
Total non-current liabilities
|
$
|
4,962
|
|
$
|
3,374
|
|
|
We define fair value as the price that would be received for an asset or paid to transfer a liability (an exit price) in the principal or most advantageous market for the asset or liability in an orderly transaction between market participants on the measurement date. Valuation techniques we use to measure fair value maximize the use of observable inputs and minimize the use of unobservable inputs. We classify the inputs used to measure fair value into the following hierarchy:
|
Level 1
|
|
Unadjusted quoted prices in active markets for identical assets or liabilities
|
|
Level 2
|
|
Unadjusted quoted prices in active markets for similar assets or liabilities, or
|
|
|
|
Unadjusted quoted prices for identical or similar assets or liabilities in markets that are not active, or
|
|
|
|
Inputs other than quoted prices that are observable for the asset or liability
|
|
Level 3
|
|
Unobservable inputs for the asset or liability
|
Our cash equivalents were invested in money market funds and were classified as Level 1. We endeavor to utilize the best available information in measuring fair value. We used observable prices in active markets in determining the classification of our money market funds as Level 1.
The following table is a summary our financial assets measured at fair value on a recurring basis and their classification within the fair value hierarchy (in thousands).
|
|
December 31, 2015
|
December 31, 2016
|
|||||||||||||||||||||
|
|
Carrying Value
|
Level 1
|
Total
|
Carrying Value
|
Level 1
|
Total
|
|||||||||||||||||
|
Assets
|
|||||||||||||||||||||||
|
Money market funds
|
$
|
54,624
|
|
$
|
54,624
|
|
$
|
54,624
|
|
$
|
57,715
|
|
$
|
57,715
|
|
$
|
57,715
|
|
|||||
|
Total assets measured and recorded at fair value
|
$
|
54,624
|
|
$
|
54,624
|
|
$
|
54,624
|
|
$
|
57,715
|
|
$
|
57,715
|
|
$
|
57,715
|
|
|||||
Preferred Stock
—Our board of directors has the authority, without any further action by our stockholders, to issue up to
110,000,000
shares, par value
$0.001
per share, of which
10,000,000
shares are designated as preferred stock. As of
December 31, 2015
and
2016
, there were
no
shares of preferred stock outstanding.
Common Stock
—On all matters submitted to our stockholders for vote, our common stockholders are entitled to
one
vote per share, voting together as a single class, and do not have cumulative voting rights. Accordingly, the holders of a majority of the shares of common stock entitled to vote in any election of directors can elect all of the directors standing for election, if they so choose. Subject to preferences that may apply to any shares of preferred stock outstanding, the holders of common stock are entitled to share equally in any dividends, when and if declared by our board of directors. Upon the occurrence of a liquidation, dissolution or winding-up, the holders of common stock are entitled to share equally in all assets remaining after the payment of any liabilities and the liquidation preferences on any outstanding preferred stock. Holders of common stock have no preemptive or conversion rights or other subscription rights and there are no redemption or sinking funds provisions applicable to the common stock.
88
EHEALTH, INC.
NOTES TO CONSOLIDATED FINANCIAL STATEMENTS
Shares Reserved
—We generally issue previously unissued common stock upon the exercise of stock options, the vesting of restricted stock units and upon granting of restricted common stock awards; however we may reissue previously acquired treasury shares to satisfy these future issuances. Shares of authorized but unissued common stock reserved for future issuance were as follows (in thousands):
|
|
December 31, 2016
|
|
|
Common stock:
|
|
|
|
Stock options issued and outstanding
|
975
|
|
|
Restricted stock units issued and outstanding
|
1,523
|
|
|
Shares available for grant
|
2,267
|
|
|
Total shares reserved
|
4,765
|
|
Stock
Plans—
On June 12, 2014, upon approval at the Annual Meeting of Stockholders, we adopted the 2014 Equity Incentive Plan (the “2014 Plan”). The 2014 Plan replaced the 2006 Equity Incentive Plan and
4,500,000
shares were authorized for issuance under the 2014 Plan. The 2014 Plan does not include an evergreen provision to automatically increase the number of shares available under it and increases in the number of shares authorized for issuance under the 2014 Plan require stockholder approval. Also, under the 2014 Plan the following shares are not recycled for future grant under the 2014 Plan: (i) shares used in connection with the exercise of an option and/or stock appreciation right to pay the exercise price or purchase price of such award or satisfy applicable tax withholding obligations; and (ii) the gross number of shares subject to stock appreciation rights that are exercised. Furthermore, the 2014 Plan included a provision that prohibits repricing of outstanding stock options or stock appreciation rights and formalized and updated procedures to qualify awards as “performance-based” compensation under Section 162(m) of the Internal Revenue Code in order to preserve full tax deductibility of such awards.
We previously granted options to purchase shares of our common stock and restricted stock units under our 2006 Equity Incentive Plan and 2005 Stock Plan. The 2006 Equity Incentive Plan was terminated with respect to the grant of additional awards on June 12, 2014, upon adoption of our 2014 Plan. The 2005 Stock Plan was terminated with respect to the grant of additional awards upon the effectiveness of the 2006 Equity Incentive Plan. We will continue to issue new shares of common stock upon vesting of restricted stock units and the exercise of stock options previously granted under the 2006 Equity Incentive Plan and 2005 Stock Plan.
Our stock options granted under the 2014 Plan, 2006 Plan and 2005 Stock Plan (collectively, the “Stock Plans”) generally vest over
4 years
at a rate of
25%
after
one year
and 1/48
th
per month thereafter. Our stock options granted prior to December 31, 2007 generally expire after
ten years
from the date of grant. Stock options granted subsequent to December 31, 2007 generally expire after
seven years
from the date of grant.
On
December 31,
2016
, no shares were subject to repurchase.
Our restricted stock unit awards granted under the 2014 Plan, 2006 Plan and 2005 Stock Plan generally vest over
four years
at a rate of
25%
after
one year
and
25%
annually thereafter.
We grant market-based restricted stock units to our executive officers and certain members of our senior management team. Each market-based stock unit represents a contingent right to receive certain shares of our common stock upon the attainment of certain stock prices over a four-year performance period. Once a stock price threshold is achieved, the portion of the award related to that threshold will vest on the one-year anniversary of the date of achievement, subject to the employee's continued service through each vesting date. Compensation expense related to these awards is recognized on an accelerated basis over the requisite service period.
89
EHEALTH, INC.
NOTES TO CONSOLIDATED FINANCIAL STATEMENTS
The following table summarizes activity under our 2014 Plan for the year ended December 31, 2016 (in thousands):
|
|
Shares Available for Grant
1
|
|
|
Shares available for grant December 31, 2015
1
|
3,542
|
|
|
Restricted stock units granted
2
|
(1,075
|
)
|
|
Options granted
|
(346
|
)
|
|
Restricted stock units cancelled
3
|
138
|
|
|
Options cancelled
|
8
|
|
|
Shares available for grant December 31, 2016
1
|
2,267
|
|
|
(1)
|
Shares available for grant do not include treasury stock shares that could be granted if we determined to do so.
|
|
(2)
|
Includes grants of restricted stock units with both service and performance-based vesting criteria to our executive officers.
|
|
(3)
|
Includes cancelled restricted stock units with both service and performance-based vesting criteria.
|
The following table summarizes stock option activity under the Stock Plans (in thousands, except weighted-average exercise price and weighted-average remaining contractual life data):
|
|
Number of Stock Options
1
|
Weighted Average Exercise Price
|
Weighted-Average Remaining Contractual Life (years)
|
Aggregate Intrinsic Value
2
|
||||||||
|
Balance outstanding at December 31, 2015
|
1,275
|
|
$
|
18.79
|
|
2.8
|
$
|
—
|
|
|||
|
Granted
|
346
|
|
$
|
13.14
|
|
|||||||
|
Exercised
|
(5
|
)
|
$
|
12.86
|
|
|
|
|||||
|
Cancelled
|
(641
|
)
|
$
|
16.77
|
|
|||||||
|
Balance outstanding at December 31, 2016
|
975
|
|
$
|
18.14
|
|
3.5
|
$
|
31
|
|
|||
|
Vested and expected to vest at December 31, 2016
|
934
|
|
$
|
18.34
|
|
3.4
|
$
|
29
|
|
|||
|
Exercisable at December 31, 2016
|
607
|
|
$
|
20.43
|
|
1.9
|
$
|
4
|
|
|||
|
(1)
|
Includes certain stock options with both service and market-based vesting criteria granted to our executive officers.
|
|
(2)
|
The aggregate intrinsic value is calculated as the difference between eHealth’s closing stock price as of December 31, 2015 and December 31, 2016 and the exercise price of in-the-money options as of those dates.
|
The following table provides information pertaining to our stock options for the year ended December 31, 2014, 2015 and 2016 (in thousands, except weighted-average fair values):
|
|
Year Ended December 31,
|
||||||||||
|
|
2014
|
2015
|
2016
|
||||||||
|
Weighted average fair value of options granted
|
$
|
14.10
|
|
$
|
5.67
|
|
$
|
4.46
|
|
||
|
Total fair value of options vested
|
$
|
2,338
|
|
$
|
1,602
|
|
$
|
1,243
|
|
||
|
Intrinsic value of options exercised
|
$
|
6,472
|
|
$
|
546
|
|
$
|
4
|
|
||
As of December 31,
2016
, there was
$1.6 million
of unrecognized stock-based compensation expense related to unvested stock options, which is expected to be recognized over the next
2.7 years
.
90
EHEALTH, INC.
NOTES TO CONSOLIDATED FINANCIAL STATEMENTS
The following table summarizes restricted stock unit activity under the Stock Plans (in thousands, except weighted-average grant date fair value and weighted-average remaining contractual life data):
|
Number of Restricted Stock Units
1
|
Weighted-Average Grant Date Fair Value
|
Weighted-Average Remaining Contractual Life (years)
|
Aggregate Intrinsic Value
2
|
|||||||||
|
Unvested as of December 31, 2015
|
966
|
|
$
|
15.62
|
|
2.8
|
$
|
9,636
|
|
|||
|
Granted
|
1,075
|
|
$
|
11.27
|
|
|
|
|
||||
|
Vested
|
(305
|
)
|
$
|
16.93
|
|
|
|
|
||||
|
Cancelled
|
(213
|
)
|
$
|
23.34
|
|
|
|
|
||||
|
Unvested as of December 31, 2016
|
1,523
|
|
$
|
12.83
|
|
2.8
|
$
|
13,901
|
|
|||
|
(1)
|
Includes certain restricted stock units with both service and performance-based or market-based vesting criteria granted to our executive officers.
|
|
(2)
|
The aggregate intrinsic value is calculated as eHealth’s closing stock price as of December 31, 2015 and December 31, 2016 multiplied by the number of restricted stock units outstanding as of December 31, 2015 and December 31, 2016, respectively.
|
The fair value of the restricted stock units is based on eHealth’s stock price on the date of grant. Compensation expense for awards that include only service-based vesting criteria is recognized on a straight-line basis over the vesting period. Compensation expense for awards that include both service and performance-based vesting criteria is recognized using accelerated attribution basis over the vesting period. As of December 31,
2016
, there was
$15.4 million
of unrecognized stock-based compensation expense related to restricted stock units, which is expected to be recognized over the next
2.4 years
.
Stock Repurchase Programs—
On March 31, 2014, we announced that our board of directors approved a stock repurchase program authorizing us to purchase up to
$50 million
of our common stock. Purchases under this program were made in the open market and complied with Rule 10b-18 under the Securities Exchange Act of 1934, as amended. We completed this stock repurchase program in July 2014 having repurchased in the aggregate
1.4 million
shares for approximately
$50 million
at an average price of
$36.91
per share including commissions. The cost of the repurchase was funded from available working capital.
For accounting purposes, common stock repurchased under our stock repurchase programs is recorded based upon the settlement date of the applicable trade. Such repurchased shares are held in treasury and are presented using the cost method.
We had no stock repurchase activity during the year ended December 31, 2016. In addition to
10,663,888
shares repurchased under our past repurchase programs as of December 31, 2016, we have in treasury
471,702
shares that were previously surrendered by employees to satisfy tax withholdings due in connection with the vesting of certain restricted stock units. As of December 31, 2015 and 2016, we had a total of
11,025,933
shares and
11,135,590
shares, respectively, held in treasury.
Stock-Based Compensation—
The fair value of stock options granted to employees for the years ended
December 31, 2014
,
2015
and
2016
was estimated using the following weighted average assumptions:
|
|
Year Ended December 31,
|
||||
|
|
2014
|
2015
|
2016
|
||
|
Expected term
|
4.2
|
4.3
|
4.4
|
||
|
Expected volatility
|
47.2%
|
64.1%
|
65.4%
|
||
|
Expected dividend yield
|
—%
|
—%
|
—%
|
||
|
Risk-free interest rate
|
1.41%
|
1.17%
|
1.12%
|
||
91
EHEALTH, INC.
NOTES TO CONSOLIDATED FINANCIAL STATEMENTS
The weighted-average fair value of the market-based restricted stock units was determined using the Monte Carlo simulation model using the following weighted average assumptions:
|
|
December 31, 2015
|
December 31, 2016
|
|
|
Expected term
|
2.6
|
2.1
|
|
|
Expected volatility
|
64.7%
|
67.9%
|
|
|
Expected dividend yield
|
—%
|
—%
|
|
|
Risk-free interest rate
|
1.13%
|
1.05%
|
|
|
Weighted average grant date fair value
|
$6.69
|
$9.64
|
|
There were no market-based restricted stock units granted during the year ended December 31, 2014.
The following table summarizes stock-based compensation expense recorded during the years ended
December 31, 2014
,
2015
and
2016
(in thousands):
|
Year Ended December 31,
|
|||||||||||
|
2014
|
2015
|
2016
|
|||||||||
|
Common stock options
|
$
|
2,215
|
|
$
|
1,522
|
|
$
|
1,015
|
|
||
|
Restricted stock units
|
3,662
|
|
5,480
|
|
6,251
|
|
|||||
|
Total stock-based compensation expense
|
$
|
5,877
|
|
$
|
7,002
|
|
$
|
7,266
|
|
||
The following table summarizes stock-based compensation expense by operating function for the years ended
December 31, 2014
,
2015
and
2016
(in thousands):
|
|
Year Ended December 31,
|
||||||||||
|
|
2014
|
2015
|
2016
|
||||||||
|
Marketing and advertising
|
$
|
1,692
|
|
$
|
1,950
|
|
$
|
1,237
|
|
||
|
Customer care and enrollment
|
386
|
|
477
|
|
497
|
|
|||||
|
Technology and content
|
1,611
|
|
1,728
|
|
1,836
|
|
|||||
|
General and administrative
|
2,188
|
|
2,734
|
|
3,696
|
|
|||||
|
Restructuring charges
|
—
|
|
113
|
|
—
|
|
|||||
|
Total stock-based compensation expense
|
$
|
5,877
|
|
$
|
7,002
|
|
$
|
7,266
|
|
||
During the year ended December 31, 2016, due to changes in our senior management, we accelerated the vesting dates of certain stock options and restricted stock units granted to
three
former employees. We recorded a
$0.5 million
incremental stock-based compensation expense in connection with this modification.
The components of our income (loss) before provision for income taxes were as follows (in thousands):
|
|
Year Ended December 31,
|
||||||||||
|
|
2014
|
2015
|
2016
|
||||||||
|
United States
|
$
|
(7,057
|
)
|
$
|
(6,041
|
)
|
$
|
(6,638
|
)
|
||
|
Foreign
|
197
|
|
435
|
|
885
|
|
|||||
|
Income (loss) before provision for income taxes
|
$
|
(6,860
|
)
|
$
|
(5,606
|
)
|
$
|
(5,753
|
)
|
||
92
EHEALTH, INC.
NOTES TO CONSOLIDATED FINANCIAL STATEMENTS
The provision (benefit) for income taxes consisted of the following (in thousands):
|
|
Year Ended December 31,
|
||||||||||
|
|
2014
|
2015
|
2016
|
||||||||
|
Current:
|
|
|
|
|
|
|
|||||
|
Federal
|
$
|
165
|
|
$
|
(584
|
)
|
$
|
(948
|
)
|
||
|
State
|
113
|
|
(457
|
)
|
(214
|
)
|
|||||
|
Foreign
|
14
|
|
97
|
|
178
|
|
|||||
|
Total current
|
292
|
|
(944
|
)
|
(984
|
)
|
|||||
|
Deferred:
|
|
|
|
|
|
|
|||||
|
Federal
|
7,935
|
|
121
|
|
104
|
|
|||||
|
State
|
1,292
|
|
10
|
|
24
|
|
|||||
|
Foreign
|
(174
|
)
|
(30
|
)
|
(15
|
)
|
|||||
|
Total deferred
|
9,053
|
|
101
|
|
113
|
|
|||||
|
Provision (benefit) for income taxes
|
$
|
9,345
|
|
$
|
(843
|
)
|
$
|
(871
|
)
|
||
The following table provides a reconciliation of the federal statutory income tax rate to our effective tax rate:
|
Year Ended December 31,
|
||||||||
|
2014
|
2015
|
2016
|
||||||
|
Tax provision (benefit) at U.S. statutory rate
|
35.0
|
%
|
35.0
|
%
|
35.0
|
%
|
||
|
State income taxes, net of federal benefit
|
(0.6
|
)
|
1.1
|
|
(4.6
|
)
|
||
|
Non-qualified stock option shortfalls, net
|
—
|
|
(31.6
|
)
|
(15.9
|
)
|
||
|
Lobbying
|
(6.3
|
)
|
(5.5
|
)
|
(6.2
|
)
|
||
|
Changes in valuation allowance
|
(162.5
|
)
|
21.8
|
|
14.5
|
|
||
|
Foreign income tax and income inclusion
|
(0.6
|
)
|
—
|
|
(7.5
|
)
|
||
|
Section 162(m) limitation
|
(2.7
|
)
|
—
|
|
—
|
|
||
|
Stock-based compensation
|
(0.8
|
)
|
(23.0
|
)
|
(12.6
|
)
|
||
|
Research and development credits
|
3.4
|
|
20.1
|
|
14.1
|
|
||
|
Other
|
(1.2
|
)
|
(2.9
|
)
|
(1.7
|
)
|
||
|
Effective tax rate
|
(136.3
|
)%
|
15.0
|
%
|
15.1
|
%
|
||
The 2014 and 2015 income tax rate reconciliations have been adjusted to conform to the current period presentation.
Our effective tax rate in 2014 differs from the federal statutory rate primarily due to the recording of a valuation allowance against our federal and state deferred tax assets. Our effective tax rate in 2015 and 2016 differ from the federal
statutory rate primarily due to the reversal of previously recorded reserves related to federal and state tax credits.
93
EHEALTH, INC.
NOTES TO CONSOLIDATED FINANCIAL STATEMENTS
Deferred income taxes reflect the net tax effects of temporary differences between the carrying amounts of assets and liabilities for financial reporting purposes and the amounts used for income tax purposes, together with net operating loss and tax credit carry forwards. Significant components of our deferred tax assets were as follows (in thousands):
|
|
December 31, 2015
|
December 31, 2016
|
|||||
|
Deferred tax assets:
|
|
|
|
|
|||
|
Accruals and reserves
|
$
|
4,108
|
|
$
|
2,242
|
|
|
|
Stock-based compensation
|
2,946
|
|
2,960
|
|
|||
|
Intangible assets
|
1,782
|
|
1,464
|
|
|||
|
Net operating losses
|
844
|
|
9,337
|
|
|||
|
Tax credits
|
1,547
|
|
4,399
|
|
|||
|
Other
|
843
|
|
70
|
|
|||
|
Total deferred tax assets
|
12,070
|
|
20,472
|
|
|||
|
Valuation allowance
|
(10,528
|
)
|
(19,430
|
)
|
|||
|
Total deferred tax assets net of valuation allowance
|
1,542
|
|
1,042
|
|
|||
|
Deferred tax liabilities – intangible assets
|
(1,667
|
)
|
(1,281
|
)
|
|||
|
Net deferred tax liabilities
|
$
|
(125
|
)
|
$
|
(239
|
)
|
|
Assessing the realizability of our deferred tax assets is dependent upon several factors, including the likelihood and amount, if any, of future taxable income in relevant jurisdictions during the periods in which those temporary differences become deductible. We forecast taxable income by considering all available positive and negative evidence, including our history of operating income and losses and our financial plans and estimates that we use to manage the business. These assumptions require significant judgment about future taxable income. As a result, the amount of deferred tax assets considered realizable is subject to adjustment in future periods if estimates of future taxable income change. As of
December 31, 2016
, the valuation allowance was
$19.4 million
, which represents a full valuation allowance against our federal and state deferred tax assets. The valuation allowance was recorded as a result of increased uncertainty regarding our future taxable income and a lack of sources of other taxable income.
The net valuation allowance decreased by
$1.2 million
during the year ended
December 31, 2015
and increased by
$8.9 million
during the year ended
December 31, 2016
.
We had net operating loss carry forwards at
December 31, 2016
of approximately
$18.8 million
and
$53.1 million
for federal income tax and state income tax purposes, respectively. Federal and state net operating loss carry forwards begin expiring in 2023
and 2017, respectively.
At
December 31, 2016
, we had tax credit carry forwards of approximately
$4.3 million
and
$3.6 million
for federal income tax and state income tax purposes, respectively, of which
$2.5 million
of the Federal tax credit carry forwards begin expiring in 2021. The remaining
$1.8 million
of federal tax credits and the state tax credits carry forward indefinitely.
Utilization of the net operating loss ("NOL") carryforwards and credits may be subject to a substantial annual limitation due to ownership changes that may have occurred or that could occur in the future, as required by Section 382 of the Internal Revenue Code of 1986, as amended, (the "Code"), and similar state provisions. These ownership change limitations may limit the amount of NOL carryforwards and other tax attributes that can be utilized annually to offset future taxable income and tax, respectively. In general, an “ownership change” as defined by Section 382 of the Code results from a transaction or series of transactions over a three-year period resulting in an ownership change of more than 50 percentage points (by value) of the outstanding stock of a company by certain stockholders. Our ability to use the remaining NOL carryforwards may be further limited if we experience a Section 382 ownership change as a result of future changes in our stock ownership.
94
EHEALTH, INC.
NOTES TO CONSOLIDATED FINANCIAL STATEMENTS
A reconciliation of the beginning and ending amount of our unrecognized tax benefits is as follows (in thousands):
|
|
Unrecognized
Tax Benefits
|
||
|
Balance at December 31, 2013
|
$
|
5,597
|
|
|
Increases based on tax positions related to the prior year
|
1,159
|
|
|
|
Balance at December 31, 2014
|
6,756
|
|
|
|
Increases based on tax positions related to the prior year
|
344
|
|
|
|
Decreases based on tax positions related to the prior year
|
(24
|
)
|
|
|
Lapse of statute of limitations
|
(1,301
|
)
|
|
|
Additions based on tax positions related to the current year
|
409
|
|
|
|
Balance at December 31, 2015
|
6,184
|
|
|
|
Lapse of statute of limitations
|
(1,236
|
)
|
|
|
Additions based on tax positions related to the current year
|
305
|
|
|
|
Balance at December 31, 2016
|
$
|
5,253
|
|
Tax positions are evaluated in a two-step process. We first determine whether it is more likely than not that a tax position will be sustained upon examination. If a tax position meets the more-likely-than-not recognition threshold, it is then measured to determine the amount of benefit to recognize in the financial statements. The tax position is measured as the largest amount of benefit that is greater than 50% likely of being realized upon ultimate settlement. As of
December 31, 2016
, the total amount of gross unrecognized tax benefits was
$5.3 million
, of which
$1.6 million
, if recognized, would impact our effective tax rate. As of
December 31, 2015
, the total amount of gross unrecognized tax benefits was
$6.2 million
, of which
$2.8 million
, if recognized, would affect our effective tax rate. As of December 31, 2014, the total amount of gross unrecognized tax benefits was
$6.8 million
, of which
$4.3 million
, if recognized, would affect our effective tax rate.
We record interest and penalties related to unrecognized tax benefits in income tax expense. At
December 31, 2016
, we had approximately
$0.3 million
accrued for estimated interest related to uncertain tax positions. For the year ended
December 31, 2016
, we recorded estimated interest of
$0.1 million
. We did not recorded an accrual for penalties.
Included in the balance of income tax liabilities, accrued interest, and accrued penalties at
December 31, 2016
is
$2.0 million
related to tax positions for which it is reasonably possible that the statute of limitations will expire in various jurisdictions and income tax exams will close within the next twelve months. Our 2009 and 2010 California income tax returns are currently under examination by the California Franchise Tax Board. Upon receipt of a formal Notice of Proposed Adjustment, we will assess the impact on the California unrecognized tax benefits related to 2009 and 2010 and we will record any necessary adjustments in 2017.
We are subject to taxation in various jurisdictions, including federal, state and foreign. Our federal and state income tax returns are generally not subject to examination by taxing authorities for fiscal years before 2001 due to our net operating losses.
Basic net loss per share is computed by dividing net loss by the weighted-average number of common shares outstanding for the period. Diluted net loss per share is computed by dividing the net loss for the period by the weighted average number of common and common equivalent shares outstanding during the period. Diluted net loss per share is computed giving effect to all potential dilutive common stock equivalent shares, including options and restricted stock units. The dilutive effect of outstanding awards is reflected in diluted net loss per share by application of the treasury stock method.
95
EHEALTH, INC.
NOTES TO CONSOLIDATED FINANCIAL STATEMENTS
The following table sets forth the computation of basic and diluted net loss per share (in thousands, except per share amounts):
|
|
Year Ended December 31,
|
||||||||||
|
|
2014
|
2015
|
2016
|
||||||||
|
Basic:
|
|
|
|
|
|
|
|||||
|
Numerator:
|
|
|
|
|
|
|
|||||
|
Net loss
|
$
|
(16,205
|
)
|
$
|
(4,763
|
)
|
$
|
(4,882
|
)
|
||
|
Denominator:
|
|
|
|
||||||||
|
Net weighted-average number of common stock shares outstanding
|
18,367
|
|
18,008
|
|
18,272
|
|
|||||
|
Net loss per share—basic:
|
$
|
(0.88
|
)
|
$
|
(0.26
|
)
|
$
|
(0.27
|
)
|
||
|
Diluted:
|
|
|
|
|
|
|
|||||
|
Numerator:
|
|
|
|
|
|
|
|||||
|
Net loss
|
$
|
(16,205
|
)
|
$
|
(4,763
|
)
|
$
|
(4,882
|
)
|
||
|
Denominator:
|
|
|
|
|
|
|
|||||
|
Net weighted average number of common stock shares outstanding
|
18,367
|
|
18,008
|
|
18,272
|
|
|||||
|
Weighted average number of options
|
—
|
|
—
|
|
—
|
|
|||||
|
Weighted average number of restricted stock units
|
—
|
|
—
|
|
—
|
|
|||||
|
Total common stock shares used in per share calculation
|
18,367
|
|
18,008
|
|
18,272
|
|
|||||
|
Net loss per share—diluted:
|
$
|
(0.88
|
)
|
$
|
(0.26
|
)
|
$
|
(0.27
|
)
|
||
For each of the years ended
December 31, 2014
,
2015
and
2016
, we had securities outstanding that could potentially dilute earnings per share, but the shares from the assumed conversion or exercise of these securities were excluded in the computation of diluted net loss per share as their effect would have been anti-dilutive. The number of outstanding weighted average anti-dilutive shares that were excluded from the computation of diluted net loss per share consisted of the following (in thousands):
|
|
Year Ended December 31,
|
|||||||
|
|
2014
|
2015
|
2016
|
|||||
|
Common stock options
|
1,815
|
|
1,484
|
|
1,222
|
|
||
|
Restricted stock units
|
728
|
|
866
|
|
768
|
|
||
|
Total
|
2,543
|
|
2,350
|
|
1,990
|
|
||
In March 2015, we implemented an organizational restructuring and cost reduction plan designed to rebalance our resources and help reduce our cost structure as a result of lower than expected individual and family health insurance plan membership and revenue. As part of the plan, we eliminated approximately
160
full-time positions in the United States, representing approximately
15%
of our workforce primarily in our technology and content and customer care and enrollment groups, and to a lesser extent, in our marketing and advertising and general and administrative groups. We incurred pre-tax restructuring charges of approximately
$3.9 million
for employee termination benefits and related costs as well as
$0.6 million
in other pre-tax restructuring charges, primarily consisting of facility exit costs. The majority of the restructuring charges were recorded in the first quarter of 2015, when the activities comprising the plan were approved and substantially completed. In March 2015, as part of our restructuring activities, we also eliminated certain positions in our China operation.
During 2016, we reversed
$0.3 million
accrued restructuring liability related to facility exit costs as we reoccupied office space we had previously vacated and were also released from a lease for other office space we had previously vacated.
96
EHEALTH, INC.
NOTES TO CONSOLIDATED FINANCIAL STATEMENTS
The following table summarizes the total cash and non-cash restructuring charges recorded during the year ended
December 31, 2015
and
2016
(in thousands):
|
Year Ended December 31,
|
|||||||
|
2015
|
2016
|
||||||
|
Employee termination costs
|
$
|
3,791
|
|
$
|
—
|
|
|
|
Non-cash employee termination costs - stock-based compensation
|
113
|
|
—
|
|
|||
|
Facility and other termination costs
|
637
|
|
(297
|
)
|
|||
|
Total restructuring charge (benefit)
|
$
|
4,541
|
|
$
|
(297
|
)
|
|
The following table summarizes the cash-based restructuring charges liability activity during the year ended
December 31, 2016
(in thousands):
|
Beginning balance
|
Charges
|
Payments
|
Benefits
|
Ending balance
|
|||||||||||||||
|
Employee termination costs
|
$
|
12
|
|
$
|
—
|
|
$
|
(12
|
)
|
$
|
—
|
|
$
|
—
|
|
||||
|
Facility and other termination costs
|
421
|
|
—
|
|
(124
|
)
|
(297
|
)
|
—
|
|
|||||||||
|
Total restructuring liability
|
$
|
433
|
|
$
|
—
|
|
$
|
(136
|
)
|
$
|
(297
|
)
|
$
|
—
|
|
||||
Operating Lease Obligations
We lease our office, operating facilities and certain of our equipment and furniture and fixtures under various operating leases, the latest of which expires in July 2023. Certain of these leases have free or escalating rent payment provisions. We recognize rent expense on our operating leases on a straight-line basis over the terms of the leases, although actual cash payment obligations under certain of these agreements fluctuate over the terms of the agreements.
In March 2012, we entered into an agreement to lease a building in Mountain View, California, adjacent to our headquarters office. The term of the operating lease is
ten
years from the date the building was delivered to us in August 2013. The base rent increases annually by
3%
. Future minimum payments related to this operating lease total
$5.9 million
over the remaining term of the lease plus our proportionate share of certain operating expenses, insurance costs and taxes for each calendar year during the lease.
In connection with the Mountain View, California office lease agreement, we entered into a financial guarantee consisting of a standby letter of credit for
$0.6 million
, which may be reduced in increments of
25%
of the original amount thereof on the first, second and third anniversaries of the commencement date, subject to our compliance with the applicable conditions to such reductions set forth in the lease. The remaining balance on the financial guarantee is
$0.1 million
as of
December 31, 2016
.
In April 2013, we entered into an agreement to lease approximately
20,000
square feet of office space in Westford, Massachusetts. The lease commenced in July 2013 and is for a term of
5
years and
3
months. Future minimum payments total approximately
$0.8 million
over the remaining term of the lease.
In August 2014, we renewed our agreement to lease and expanded to approximately
50,000
square feet of office space in Gold River, California. The lease commenced in August 2014 and is for a term of
4
years and
5
months. Future minimum payments will total approximately
$2.2 million
over the remaining term of the lease. In 2015, we vacated approximately
11,200
square feet of this leased office space as a result of a workforce reduction. We reoccupied approximately
5,400
square feet of this previously vacated office space in 2016.
Total rent expense under all operating leases was approximately
$5.3 million
,
$5.4 million
and
$4.5 million
for the years ended
December 31, 2014
,
2015
and
2016
, respectively.
97
EHEALTH, INC.
NOTES TO CONSOLIDATED FINANCIAL STATEMENTS
Service and Licensing Obligations
We have entered into service and licensing agreements with third party vendors to provide various services, including network access, equipment maintenance and software licensing. The terms of these services and licensing agreements are generally up to three years. As the benefits of these agreements are experienced uniformly over the applicable contractual periods, we record the related service and licensing expenses on a straight-line basis, although actual cash payment obligations under certain of these agreements fluctuate over the terms of the agreements.
The following table presents a summary of our future minimum payments under non-cancellable operating lease agreements and contractual service and licensing obligations as of
December 31, 2016
(in thousands):
|
Years Ending December 31,
|
Operating Lease Obligations
|
Service and Licensing Obligations
|
Total Obligations
|
||||||||
|
2017
|
$
|
4,543
|
|
$
|
2,247
|
|
$
|
6,790
|
|
||
|
2018
|
2,959
|
|
849
|
|
3,808
|
|
|||||
|
2019
|
908
|
|
210
|
|
1,118
|
|
|||||
|
2020
|
909
|
|
168
|
|
1,077
|
|
|||||
|
2021
|
929
|
|
—
|
|
929
|
|
|||||
|
Thereafter
|
1,516
|
|
—
|
|
1,516
|
|
|||||
|
Total
|
$
|
11,764
|
|
$
|
3,474
|
|
$
|
15,238
|
|
||
Legal Proceedings
—On January 26, 2017, a purported class action lawsuit was filed against the Company in the Superior Court of the State of California, County of Santa Clara. The complaint alleges that the Company negligently failed to take necessary precautions required to protect from unauthorized disclosure personally identifiable information contained on Form W-2s of certain of our current and former employees. The complaint purports to allege causes of action against the Company for negligence, violation of Section 17200 et seq. of the California Business & Professions Code, declaratory relief and breach of implied contract. The complaint seeks actual damages, punitive damages, statutory damages, costs, including experts’ fees and attorneys’ fees, pre-judgment and post-judgment interest as prescribed by law and equitable, injunctive and declaratory relief as appropriate. Because the case is at a preliminary stage, we cannot estimate the likelihood of liability or the amount of potential damages.
In the ordinary course of our business, we have received and may continue to receive inquiries from state regulators relating to various matters. We have become, and may in the future become, involved in litigation in the ordinary course of our business. If we are found to have violated laws or regulations in any of the states, we could be subject to various fines and penalties, including revocation of our license to sell insurance in those states, and our business and financial results would be harmed. Revocation of any of our licenses or penalties in one jurisdiction could cause our license to be revoked or for us to face penalties in other jurisdictions. In addition, without a health insurance license in a jurisdiction, carriers would not pay us commissions for the products we sold in that jurisdiction, and we would not be able to sell new health insurance products in that jurisdiction. We would also be harmed to the extent that related publicity damages our reputation as a trusted source of objective information relating to health insurance and its affordability. It could also be costly to defend ourselves regardless of the outcome. At
December 31, 2015
and
2016
, we had no material liabilities included in our Consolidated Balance Sheets for outstanding legal claims.
Guarantees and Indemnifications
—We have agreed to indemnify members of our board of directors and our executive officers for fees, expenses, judgments, fines and settlement amounts incurred in any action or proceeding, including actions or proceedings by or in the right of the Company, to which any of them is, or is threatened to be, made a party by reason of their service as a director or officer of the Company or service provided to another company or enterprise at our request. The term of the director and officer indemnification is perpetual as to events or occurrences that take place while the director or officer is, or was, serving at our request. As such, the maximum potential amount of future payment we could be required to make under these indemnification arrangements is unlimited. We, however, maintain directors and officers insurance coverage that limits our exposure under certain circumstances and that may allow us to recover a portion of future amounts paid. Accordingly, we have not recorded any liabilities for these agreements as of
December 31, 2015
and
2016
.
While we have made various guarantees included in contracts in the normal course of business, primarily in the form of indemnity obligations under certain circumstances, these guarantees do not represent significant commitments or contingent liabilities of the indebtedness of others. Accordingly, we have not recorded a liability related to these indemnification provisions.
98
Operating Segments
The following table presents summary results of our operating segments for the year ended December 31, 2014, 2015 and 2016 (in thousands):
|
Year Ended December 31,
|
|||||||||||
|
|
2014
|
2015
|
2016
|
||||||||
|
Revenue
|
|
|
|
||||||||
|
Medicare
|
$
|
44,479
|
|
$
|
63,163
|
|
$
|
80,269
|
|
||
|
Individual, Family and Small Business
|
135,198
|
|
126,378
|
|
106,691
|
|
|||||
|
Total revenue
|
$
|
179,677
|
|
$
|
189,541
|
|
$
|
186,960
|
|
||
|
Segment profit (loss)
|
|||||||||||
|
Medicare segment loss
|
$
|
(29,625
|
)
|
$
|
(23,284
|
)
|
$
|
(33,141
|
)
|
||
|
Individual, Family and Small Business segment profit
|
55,989
|
|
59,499
|
|
67,905
|
|
|||||
|
Total segment profit (loss)
|
26,364
|
|
36,215
|
|
34,764
|
|
|||||
|
Corporate
|
(21,528
|
)
|
(25,135
|
)
|
(29,071
|
)
|
|||||
|
Stock-based compensation expense
|
(5,877
|
)
|
(6,889
|
)
|
(7,266
|
)
|
|||||
|
Depreciation and amortization
|
(4,192
|
)
|
(4,148
|
)
|
(3,539
|
)
|
|||||
|
Restructuring (charge) benefit
|
—
|
|
(4,541
|
)
|
297
|
|
|||||
|
Amortization of intangible assets
|
(1,529
|
)
|
(1,153
|
)
|
(1,040
|
)
|
|||||
|
Other income (expense), net
|
(98
|
)
|
45
|
|
$
|
102
|
|
||||
|
Loss before provision (benefit) for income taxes
|
$
|
(6,860
|
)
|
$
|
(5,606
|
)
|
$
|
(5,753
|
)
|
||
There are no internal revenue transactions between our operating segments. Our CODM does not separately evaluate assets by segment, and therefore assets by segment are not presented.
Geographic Information
Our long-lived assets consisted primarily of property and equipment, internally-developed software, goodwill and other indefinite-lived intangible assets and finite-lived intangible assets. Our long-lived assets are attributed to the geographic location in which they are located. Long-lived assets by geographical area as of December 31, 2015 and 2016 were as follows (in thousands):
|
December 31, 2015
|
December 31, 2016
|
||||||
|
United States
|
$
|
35,341
|
|
$
|
32,162
|
|
|
|
China
|
436
|
|
$
|
391
|
|
||
|
Total
|
$
|
35,777
|
|
$
|
32,553
|
|
|
Significant Customers
Substantially all revenue for the years ended
December 31, 2014
,
2015
and
2016
was generated from customers located in the United States. Carriers representing 10% or more of our total revenue for the years ended
December 31, 2014
,
2015
and
2016
are presented in the table below:
|
|
Year Ended December 31,
|
|||||||
|
|
2014
|
2015
|
2016
|
|||||
|
Humana
|
23
|
%
|
23
|
%
|
23
|
%
|
||
|
UnitedHealthcare
1
|
10
|
%
|
11
|
%
|
13
|
%
|
||
|
Aetna
2
|
10
|
%
|
10
|
%
|
10
|
%
|
||
|
Anthem
3
|
11
|
%
|
9
|
%
|
8
|
%
|
||
|
(1)
|
UnitedHealthcare also includes other carriers owned by UnitedHealthcare.
|
|
(2)
|
Aetna also includes other carriers owned by Aetna.
|
|
(3)
|
Anthem (formerly Wellpoint) also includes other carriers owned by Anthem.
|
Selected summarized quarterly financial information for 2015 and 2016 is as follows (in thousands, except per share amounts):
|
For the Year Ended December 31, 2016
|
1
st
Quarter
|
2
ND
Quarter
|
3
RD
Quarter
|
4
TH
Quarter
|
Year
|
||||||||||||||
|
Revenue
|
$
|
73,844
|
|
$
|
37,277
|
|
$
|
32,079
|
|
$
|
43,760
|
|
$
|
186,960
|
|
||||
|
Income (loss) from operations
|
23,683
|
|
(5,809
|
)
|
(6,916
|
)
|
(16,813
|
)
|
$
|
(5,855
|
)
|
||||||||
|
Net income (loss)
|
18,034
|
|
(476
|
)
|
(5,736
|
)
|
(16,704
|
)
|
$
|
(4,882
|
)
|
||||||||
|
Net income (loss) per share:
|
|
|
|
|
|
|
|
|
|
|
|||||||||
|
Basic
|
$
|
0.99
|
|
$
|
(0.03
|
)
|
$
|
(0.31
|
)
|
$
|
(0.91
|
)
|
$
|
(0.27
|
)
|
||||
|
Diluted
|
$
|
0.99
|
|
$
|
(0.03
|
)
|
$
|
(0.31
|
)
|
$
|
(0.91
|
)
|
$
|
(0.27
|
)
|
||||
|
For the Year Ended December 31, 2015
|
1
st
Quarter
|
2
ND
Quarter
|
3
RD
Quarter
|
4
TH
Quarter
|
Year
|
||||||||||||||
|
Revenue
|
$
|
61,288
|
|
$
|
39,894
|
|
$
|
38,224
|
|
$
|
50,135
|
|
$
|
189,541
|
|
||||
|
Income (loss) from operations
|
(2,012
|
)
|
5,828
|
|
2,925
|
|
(12,392
|
)
|
$
|
(5,651
|
)
|
||||||||
|
Net income (loss)
|
(2,082
|
)
|
5,750
|
|
3,635
|
|
(12,066
|
)
|
$
|
(4,763
|
)
|
||||||||
|
Net income (loss) per share:
|
|
|
|
|
|
|
|
|
|
|
|||||||||
|
Basic
|
$
|
(0.12
|
)
|
$
|
0.32
|
|
$
|
0.20
|
|
$
|
(0.67
|
)
|
$
|
(0.26
|
)
|
||||
|
Diluted
|
$
|
(0.12
|
)
|
$
|
0.32
|
|
$
|
0.20
|
|
$
|
(0.67
|
)
|
$
|
(0.26
|
)
|
||||
|
ITEM 9.
|
CHANGES IN AND DISAGREEMENTS WITH ACCOUNTANTS ON ACCOUNTING AND FINANCIAL DISCLOSURE
|
None.
Evaluation of Our Disclosure Controls and Procedures
Our management, with the participation of our chief executive officer and chief financial officer, evaluated the effectiveness of our disclosure controls and procedures pursuant to Rules 13a-15(f) and 15d-15(f) under the Securities Exchange Act of 1934, as amended, as of the end of the period covered by this Annual Report on Form 10-K.
Based on management’s evaluation, our chief executive officer and chief financial officer concluded that our disclosure controls and procedures are effective to provide reasonable assurance that information we are required to disclose in reports that we file or submit under the Exchange Act is recorded, processed, summarized and reported within the time periods specified in Securities and Exchange Commission rules and forms, and that such information is accumulated and communicated to our management, including our chief executive officer and chief financial officer, as appropriate, to allow timely decisions regarding required disclosure.
Management’s Report on Internal Control over Financial Reporting
Our management is responsible for establishing and maintaining adequate internal control over financial reporting, as such term is defined in Rules 13a-15(f) and 15d-15(f) under the Securities Exchange Act of 1934, as amended. Under the supervision and with the participation of our management, including our chief executive officer and chief financial officer, we conducted an evaluation of the effectiveness of our internal control over financial reporting as of December 31, 2016 based on the guidelines established in
Internal Control—Integrated Framework
issued by the Committee of Sponsoring Organizations of the Treadway Commission (2013 framework). Our internal control over financial reporting includes policies and procedures that provide reasonable assurance regarding the reliability of financial reporting and the preparation of financial statements for external reporting purposes in accordance with U.S. generally accepted accounting principles.
Based on the results of our evaluation, our management concluded that our internal control over financial reporting was effective as of December 31, 2016. We reviewed the results of management’s assessment with our Audit Committee.
Ernst & Young LLP, our independent registered public accounting firm, has issued a report on the Company’s internal control over financial reporting as of December 31, 2016, which is presented below.
Changes in Internal Control Over Financial Reporting
There were no changes in our internal control over financial reporting that occurred during the three months ended December 31, 2016 that have materially affected, or are reasonably likely to materially affect, our internal control over financial reporting.
Inherent Limitations on Effectiveness of Controls
Our management, including our chief executive officer and chief financial officer, believes that our disclosure controls and our internal control over financial reporting are designed to provide reasonable assurance of achieving their objectives and are effective at the reasonable assurance level. However, our management does not expect that our disclosure controls or our internal control over financial reporting will prevent all errors and all fraud. A control system, no matter how well conceived and operated, can provide only reasonable, not absolute, assurance that the objectives of the control system are met. Further, the design of a control system must reflect the fact that there are resource constraints, and the benefits of controls must be considered relative to their costs. Because of the inherent limitations in all control systems, no evaluation of controls can provide absolute assurance that all control issues and instances of fraud, if any, have been detected. These inherent limitations include the realities that judgments in decision-making can be faulty, and that breakdowns can occur because of a simple error or mistake. Additionally, controls can be circumvented by the individual acts of some persons, by collusion of two or more people or by management override of the controls. The design of any system of controls also is based in part upon certain
101
assumptions about the likelihood of future events, and there can be no assurance that any design will succeed in achieving its stated goals under all potential future conditions; over time, controls may become inadequate because of changes in conditions, or the degree of compliance with policies or procedures may deteriorate. Because of the inherent limitations in a cost-effective control system, misstatements due to error or fraud may occur and not be detected.
102
Report of Independent Registered Public Accounting Firm
The Board of Directors and Stockholders of
eHealth,
Inc.
We have audited eHealth, Inc.’s internal control over financial reporting as of
December 31, 2016
, based on criteria established in Internal Control—Integrated Framework issued by the Committee of Sponsoring Organizations of the Treadway Commission (2013 framework) (the COSO criteria). eHealth, Inc.’s management is responsible for maintaining effective internal control over financial reporting, and for its assessment of the effectiveness of internal control over financial reporting included in the accompanying Management’s Report on Internal Control Over Financial Reporting. Our responsibility is to express an opinion on the company’s internal control over financial reporting based on our audit.
We conducted our audit in accordance with the standards of the Public Company Accounting Oversight Board (United States). Those standards require that we plan and perform the audit to obtain reasonable assurance about whether effective internal control over financial reporting was maintained in all material respects. Our audit included obtaining an understanding of internal control over financial reporting, assessing the risk that a material weakness exists, testing and evaluating the design and operating effectiveness of internal control based on the assessed risk, and performing such other procedures as we considered necessary in the circumstances. We believe that our audit provides a reasonable basis for our opinion.
A company’s internal control over financial reporting is a process designed to provide reasonable assurance regarding the reliability of financial reporting and the preparation of financial statements for external purposes in accordance with generally accepted accounting principles. A company’s internal control over financial reporting includes those policies and procedures that (1) pertain to the maintenance of records that, in reasonable detail, accurately and fairly reflect the transactions and dispositions of the assets of the company; (2) provide reasonable assurance that transactions are recorded as necessary to permit preparation of financial statements in accordance with generally accepted accounting principles, and that receipts and expenditures of the company are being made only in accordance with authorizations of management and directors of the company; and (3) provide reasonable assurance regarding prevention or timely detection of unauthorized acquisition, use, or disposition of the company’s assets that could have a material effect on the financial statements.
Because of its inherent limitations, internal control over financial reporting may not prevent or detect misstatements. Also, projections of any evaluation of effectiveness to future periods are subject to the risk that controls may become inadequate because of changes in conditions, or that the degree of compliance with the policies or procedures may deteriorate.
In our opinion, eHealth, Inc. maintained, in all material respects, effective internal control over financial reporting as of
December 31, 2016
, based on the COSO criteria.
We also have audited, in accordance with the standards of the Public Company Accounting Oversight Board (United States), the consolidated balance sheets of eHealth, Inc. as of
December 31, 2016
and 2015, and the related consolidated statements of comprehensive loss, stockholders’ equity, and cash flows for each of the three years in the period ended
December 31, 2016
of eHealth, Inc. and our report dated
March 15, 2017
expressed an unqualified opinion thereon.
/s/ Ernst & Young LLP
Redwood City, California
March 15, 2017
103
|
ITEM 9B.
|
OTHER INFORMATION
|
None.
104
|
ITEM 10.
|
DIRECTORS, EXECUTIVE OFFICERS AND CORPORATE GOVERNANCE
|
The information concerning our directors, executive officers, compliance with Section 16(a) of the Securities Exchange Act of 1934, as amended, and corporate governance required by this Item 10 of Form 10-K is incorporated by reference from the information contained in the Definitive Proxy Statement for the Annual Meeting of Stockholders, which is expected to be filed within 120 days after our fiscal year ended
December 31, 2016
.
We have adopted a code of ethics that applies to all employees, including our principal executive officer, Scott Flanders, principal financial officer, David Francis, and all other executive officers. The code of ethics is available on the about us/investor relations/corporate governance page of our website at
www.eHealth.com
. A copy may also be obtained without charge by contacting investor relations, attention Vice President of Investor Relations, 440 East Middlefield Road, Mountain View, CA 94043 or by calling (650) 210-3111.
We plan to post on our website at the address described above any future amendments or waivers of our Code of Conduct.
The information required by Item 11 of Form 10-K is incorporated herein by reference from the information contained in the Definitive Proxy Statement for the Annual Meeting of Stockholders, which is expected to be filed within 120 days after our fiscal year ended
December 31, 2016
.
|
ITEM 12.
|
SECURITY OWNERSHIP OF CERTAIN BENEFICIAL OWNERS AND MANAGEMENT AND RELATED STOCKHOLDER MATTERS
|
The information required by Item 12 of Form 10-K is incorporated herein by reference from the information contained in the Definitive Proxy Statement for the Annual Meeting of Stockholders, which is expected to be filed within 120 days after our fiscal year ended
December 31, 2016
.
|
ITEM 13.
|
CERTAIN RELATIONSHIPS AND RELATED TRANSACTIONS, AND DIRECTOR INDEPENDENCE
|
The information required by Item 13 of Form 10-K is incorporated herein by reference from the information contained in the Definitive Proxy Statement for the Annual Meeting of Stockholders, which is expected to be filed within 120 days after our fiscal year ended
December 31, 2016
.
|
ITEM 14.
|
PRINCIPAL ACCOUNTANT FEES AND SERVICES
|
The information required by Item 14 of Form 10-K is incorporated herein by reference from the information contained in the Definitive Proxy Statement for the Annual Meeting of Stockholders, which is expected to be filed within 120 days after our fiscal year ended
December 31, 2016
.
105
|
ITEM 15.
|
EXHIBITS AND FINANCIAL STATEMENT SCHEDULES
|
(a)
We have filed the following documents as part of this Annual Report on Form 10-K:
1. Consolidated Financial Statements
Information in response to this Item is included in Item 8 of Part II of this Annual Report on Form 10-K.
2. Financial Statement Schedules
All schedules are omitted because they are not applicable, not required or because the required information is included in the consolidated financial statements or notes thereto.
3. Exhibits
See Item 15(b) below.
(b)
Exhibits
—We have filed, or incorporated into this Annual Report on Form 10-K by reference, the exhibits listed on the accompanying Index to Exhibits of this Annual Report on Form 10‑K.
(c)
Financial Statement Schedule
—See Item 15(a) above.
|
ITEM 16.
|
FORM 10-K SUMMARY
|
None.
106
SIGNATURES
Pursuant to the requirements of Section 13 or 15(d) of the Securities Exchange Act of 1934, as amended, the registrant has duly caused this report to be signed on its behalf by the undersigned thereunto duly authorized.
March 15, 2017
eHealth, Inc.
|
/s/ SCOTT N. FLANDERS
|
|
/s/ DAVID K. FRANCIS
|
|
Scott N. Flanders
Chief Executive Officer
|
|
David K. Francis
Chief Financial Officer
|
|
|
/s/ JAY W. JENNINGS
|
|
|
|
Jay W. Jennings
Principal Accounting Officer
|
|
Pursuant to the requirements of the Securities Exchange Act of 1934, this report has been signed below by the following persons on behalf of the registrant and in the capacities indicated on
March 15, 2017
.
|
Signature
|
|
Title
|
|
|
|
|
|
/s/ SCOTT N. FLANDERS
|
|
Chief Executive Officer (Principal Executive Officer) and Director
|
|
Scott N. Flanders
|
|
|
|
|
|
|
|
/s/ DAVID K. FRANCIS
|
|
Chief Financial Officer (Principal Financial Officer)
|
|
David K. Francis
|
|
|
|
|
|
|
|
/s/ JAY W. JENNINGS
|
Senior Vice President of Finance (Principal Accounting Officer)
|
|
|
Jay W. Jennings
|
||
|
/s/ ELLEN O. TAUSCHER
|
|
Chair of Board of Directors
|
|
Ellen O. Tauscher
|
|
|
|
|
|
|
|
/s/ MICHAEL D. GOLDBERG
|
|
Director
|
|
Michael D. Goldberg
|
|
|
|
|
|
|
|
/s/ RANDALL S. LIVINGSTON
|
|
Director
|
|
Randall S. Livingston
|
|
|
|
|
|
|
|
/s/ JACK L. OLIVER III
|
|
Director
|
|
Jack L. Oliver III
|
|
|
|
|
|
|
107
EXHIBIT INDEX
|
|
|
|
Incorporation by Reference Herein
|
|||
|
Exhibit
Number
|
|
Description of Exhibit
|
|
Form
|
|
Date
|
|
3.1
|
Amended and Restated Certificate of Incorporation of the Registrant
|
Registration Statement on
Form S-l, as amended
(File No. 333-133526)
|
April 25, 2006
|
|||
|
3.2
|
Amended and Restated Bylaws of the Registrant
|
Current Report on Form 8‑K (File No. 001-33071)
|
November 17, 2008
|
|||
|
4.1
|
Form of the Registrant’s Common Stock Certificate
|
Registration Statement on
Form S-l, as amended
(File No. 333-133526)
|
June 28, 2006
|
|||
|
10.1*
|
Form of Indemnification Agreement entered into between the Registrant and its directors and officers
|
Registration Statement on
Form S-l, as amended
(File No. 333-133526)
|
April 25, 2006
|
|||
|
10.2*
|
Employment Agreement, dated May 31, 2016, between Scott N. Flanders and eHealth, Inc.
|
Quarterly Report on Form 10-Q
(File No. 001-33071)
|
August 8, 2016
|
|||
|
10.3*
|
Employment Agreement, dated July 11, 2016, between David Francis and eHealth, Inc.
|
Quarterly Report on Form 10-Q
(File No. 001-33071)
|
August 8, 2016
|
|||
|
10.4*
|
Form of Severance Letter with Robert Hurley and Tom Tsao
|
Quarterly Report on Form 10-Q
(File No. 001-33071)
|
August 8, 2016
|
|||
|
10.5*
|
Letter Agreement, dated November 17, 2005, between Jack L. Oliver III and the Registrant
|
Registration Statement on
Form S-l, as amended
(File No. 333-133526)
|
April 25, 2006
|
|||
|
10.6*
|
Employment Agreement, dated November 30, 1999, between Gary Lauer and eHealthInsurance Services, Inc.
|
Registration Statement on
Form S-l, as amended
(File No. 333-133526)
|
April 25, 2006
|
|||
|
10.6.1*
|
Letter Amendment, dated November 2007, amending Offer Letter dated November 30, 1999, between Gary Lauer and eHealthInsurance Services, Inc.
|
Quarterly Report on Form 10-Q
(File No. 001-33071)
|
November 14, 2007
|
|||
|
10.6.2*
|
Second Amendment to Offer Letter, dated December 27, 2008, amending Offer Letter dated November 30, 1999, as amended, between Gary Lauer and eHealthInsurance Services, Inc.
|
Annual Report on Form 10-K
(File No. 001-33071)
|
March 13, 2009
|
|||
|
10.6.3*
|
Management Retention Agreement, effective as of March 4, 2010, between eHealth, Inc. and Gary L. Lauer
|
Quarterly Report on Form 10-Q
(File No. 001-33071)
|
May 10, 2010
|
|||
|
10.6.4*
|
Separation Agreement and Release, dated May 31, 2016, between Gary L. Lauer and eHealth, Inc.
|
Quarterly Report on Form 10-Q
(File No. 001-33071)
|
August 8, 2016
|
|||
|
10.7*
|
Employment Agreement, dated May 4, 2000, between Stuart Huizinga and eHealthInsurance Services, Inc., as amended on August 22, 2000
|
Registration Statement on
Form S-l, as amended
(File No. 333-133526)
|
April 25, 2006
|
|||
|
10.7.1*
|
Transition Agreement and Release, dated July 11, 2016, between Stuart Huizinga and eHealth, Inc.
|
Quarterly Report on Form 10-Q
(File No. 001-33071)
|
August 8, 2016
|
|||
|
10.8*
|
Employment Agreement, dated March 9, 2012, between William Shaughnessy and eHealth, Inc.
|
Quarterly Report on Form 10-Q
(File No. 001-33071)
|
August 9, 2012
|
|||
|
10.8.1*
|
Separation Agreement and Release, dated June 27, 2016, between William Shaughnessy and eHealth, Inc.
|
Quarterly Report on Form 10-Q
(File No. 001-33071)
|
August 8, 2016
|
|||
|
10.9
|
Lease Agreement, dated May 2004, between eHealthInsurance Services, Inc. and Brian Avery, Trustee of the 1983 Avery Investments Trust, as amended
|
Registration Statement on
Form S-l, as amended
(File No. 333-133526)
|
April 25, 2006
|
|||
|
10.9.1
|
First Amendment to Lease Agreement, effective as of May 15, 2009, between eHealthInsurance Services, Inc. and Brian Avery, Trustee of the 1983 Avery Investments Trust
|
Current Report on Form 8‑K
(File No. 001-33071)
|
May 21, 2009
|
|||
|
10.9.2
|
Second Amendment to Lease Agreement, effective as of August 5, 2010 between eHealth Insurance Services, Inc. and Brian Avery, Trustee of the 1983 Avery Investments Trust
|
Current Report on Form 8‑K
(File No. 001-33071)
|
August 18, 2010
|
|||
108
|
10.9.3
|
Third Amendment to Lease Agreement, effective as of July 8, 2011, between eHealthInsurance Services, Inc. and Brian Avery, Trustee of the 1983 Avery Generations Trust
|
Current Report on Form 8-K
(File No. 001-33071)
|
July 12, 2011
|
|||
|
10.10
|
Standard Lease Agreement, dated June 10, 2004, between eHealthInsurance Services, Inc. and Gold Pointe E LLC, as amended
|
Registration Statement on
Form S-l, as amended
(File No. 333-133526)
|
April 25, 2006
|
|||
|
10.10.1
|
Fourth Amendment to Standard Lease Agreement (Office), effective as of November 6, 2007, between eHealthInsurance Services, Inc. and Carlsen Investments, LLC
|
Current Report on Form 8-K
(File No. 001-33071)
|
November 7, 2007
|
|||
|
10.10.2
|
Sixth Amendment to Lease and Acknowledgment to Standard Lease Agreement, dated August 29, 2012, between Carlsen Investments, LLC and eHealthInsurance Services, Inc.
|
Current Report on Form 8-K
(File No. 001-33071)
|
August 31, 2012
|
|||
|
10.10.3
|
Seventh Amendment to Lease and Acknowledgment to Standard Lease Agreement, dated August 6, 2014, between Carlsen Investments, LLC and eHealthInsurance Services, Inc.
|
Quarterly Report on Form 10-Q
(File No. 001-33071)
|
August 8, 2014
|
|||
|
10.10.4
|
Eighth Amendment to Standard Lease Agreement (Officer) and Partial Termination of Lease dated June 23, 2016 between Carlsen Investments, LLC and eHealthInsurance Services, Inc.
|
Current Report on Form 8-K
(File No. 001-33071)
|
June 28, 2016
|
|||
|
10.10.5
|
Ninth Amendment to Lease and Acknowledgment to Standard Lease Agreement (Office) dated August 17, 2016 between Carlsen Investments, LLC and eHealthInsurance Services, Inc.
|
Current Report on Form 8-K
(File No. 001-33071)
|
August 22, 2016
|
|||
|
10.11
|
Office Lease Contract, dated March 31, 2006, among Xiamen Torch Hi-tech Industrial Development Zone Finance Services Center, Xiamen Software Industry Investment & Development Co., Ltd. and eHealth China (Xiamen) Technology Co., Ltd.; Appendix 1 to Office Lease Contract; and Property Management Service Contract, dated April 4, 2006, between Xiamen Software Industry Investment & Development Co., Ltd. and eHealth China (Xiamen) Technology Co., Ltd.
|
Registration Statement on
Form S-l, as amended
(File No. 333-133526)
|
April 25, 2006
|
|||
|
10.11.1
|
Appendix 3 to Office Lease Contract, dated November 25, 2007, among Xiamen Torch Hi-tech Industrial Development Zone Finance Services Center, Xiamen Software Industry Investment & Development Co., Ltd. and eHealth China (Xiamen) Technology Co., Ltd.
|
Annual Report on Form 10-K
(File No. 001-33071)
|
March 17, 2008
|
|||
|
10.11.2
|
Amendment Two to Property Management Service Contract, effective January 16, 2008, between Xiamen Software Industry Investment & Development Co., Ltd. and eHealth China (Xiamen) Technology Co., Ltd.
|
Annual Report on Form 10-K
(File No. 001-33071)
|
March 17, 2008
|
|||
|
10.11.3
|
Appendix 4 to Office Lease Contract, dated March 27, 2008, among Xiamen Torch Hi-tech Industrial Development Zone Finance Services Center, Xiamen Software Industry Investment & Development Co., Ltd. and eHealth China (Xiamen) Technology Co., Ltd.
|
Quarterly Report on Form 10-Q
(File No. 001-33071)
|
May 12, 2008
|
|||
|
10.11.4
|
Appendix 5 to Office Lease Contract, dated May 19, 2009, among Xiamen Torch Hi-tech Industrial Development Zone Finance Services Center, Xiamen Software Industry Investment & Development Co., Ltd. and eHealth China (Xiamen) Technology Co., Ltd.
|
Current Report on Form 8‑K
(File No. 001-33071)
|
May 21, 2009
|
|||
|
10.11.5
|
Office Lease Contract, dated September 23, 2009, among Xiamen Torch Hi-tech Industrial Development Zone Finance Services Center, Xiamen Software Industry Investment & Development Co., Ltd. and eHealth China (Xiamen) Technology Co., Ltd.
|
Quarterly Report on Form 10-Q
(File No. 001-33071)
|
November 9, 2009
|
|||
|
10.11.6
|
Property Management Service Contract, effective September 24, 2009, between Xiamen Software Industry Investment & Development Co., Ltd. and eHealth China (Xiamen) Technology Co., Ltd.
|
Quarterly Report on Form 10-Q
(File No. 001-33071)
|
November 9, 2009
|
|||
|
10.11.7
|
Supplemental Agreement, effective as of April 1, 2013, between eHealth China (Xiamen) Technology Co., Ltd. and Xiamen Software Industry Investment & Development Co., Ltd.
|
Current Report on Form 8-K
(File No. 001-33071)
|
May 15, 2013
|
|||
109
|
10.11.8
|
Supplemental Agreement, effective as of September 9, 2013, between eHealth China (Xiamen) Technology Co., Ltd. and Xiamen Software Industry Investment & Development Co., Ltd.
|
Quarterly Report on Form 10-Q
(File No. 001-33071)
|
August 8, 2014
|
|||
|
10.11.9
|
Supplemental Agreement, effective as of September 1, 2014, between eHealth China (Xiamen) Technology Co., Ltd. and Xiamen Software Industry Investment & Development Co., Ltd.
|
Current Report on Form 8-K
(File No. 001-33071)
|
September 22, 2014
|
|||
|
10.11.10
|
Supplemental Agreement, effective as of September 15, 2014, between eHealth China (Xiamen) Technology Co., Ltd. and Xiamen Software Industry Investment & Development Co., Ltd.
|
Current Report on Form 8-K
(File No. 001-33071)
|
September 22, 2014
|
|||
|
10.11.11
|
Supplemental Agreement, effective as of September 1, 2015, between eHealth China (Xiamen) Technology Co., Ltd. and Xiamen Software Industry Investment & Development Co., Ltd.
|
Quarterly Report on Form 10-Q
(File No. 001-33071)
|
August 7, 2015
|
|||
|
10.12
|
Lease Agreement, dated March 23, 2012, between 340 Middlefield, LLC and eHealth, Inc.
|
Current Report on Form 8-K (File No. 001-33071)
|
March 27, 2012
|
|||
|
10.12.1
|
First Amendment to Lease Agreement, effective as of May 28, 2013, between 340 Middlefield, LLC and eHealth, Inc.
|
Current Report on Form 8-K (File No. 001-33071)
|
May 29, 2013
|
|||
|
10.13
|
Office Lease, dated May 7, 2012, between Lake Pointe Three, LC, and eHealthInsurance Services, Inc.
|
Quarterly Report on Form 10-Q (File No. 001-33071)
|
August 9, 2012
|
|||
|
10.13.1
|
Subordination, Non-Disturbance and Attornment Agreement dated as September 14, 2016 by and among Deutsche Bank, AG, SLC Lake Pointe Equities LLC and eHealthInsurance Services, Inc.
|
Quarterly Report on Form 10-Q
(File No. 001-33071)
|
November 8, 2016
|
|||
|
10.14*
|
Chief Executive Officer Bonus Plan 2016
|
Quarterly Report on Form 10-Q
(File No. 001-33071)
|
August 8, 2016
|
|||
|
10.15*
|
Executive Bonus Plan 2016
|
Quarterly Report on Form 10-Q
(File No. 001-33071)
|
May 9, 2016
|
|||
|
10.16*
|
eHealth, Inc. Performance Bonus Plan
|
Definitive Proxy Statement on Schedule 14A (File No. 001-33071)
|
April 28, 2014
|
|||
|
10.17*
|
2006 Equity Incentive Plan of the Registrant, as amended and restated June 15, 2010
|
Current Report on Form 8‑K (File No. 001-33071)
|
June 21, 2010
|
|||
|
10.17.1*
|
Form of Notice of Stock Option Grant and Stock Option Agreement under the 2006 Equity Incentive Plan of the Registrant
|
Annual Report on Form 10-K (File No. 001-33071)
|
March 21, 2007
|
|||
|
10.17.2*
|
Form of Notice of Stock Option Grant and Stock Option Agreement (Initial Director Grant) under the 2006 Equity Incentive Plan of the Registrant
|
Annual Report on Form 10-K (File No. 001-33071)
|
March 21, 2007
|
|||
|
10.17.3*
|
Form of Notice of Stock Option Grant and Stock Option Agreement (Annual Director Grant) under the 2006 Equity Incentive Plan of the Registrant
|
Annual Report on Form 10-K (File No. 001-33071)
|
March 21, 2007
|
|||
|
10.17.4*
|
Form of Notice of Stock Unit Grant and Stock Unit Agreement under the 2006 Equity Incentive Plan of the Registrant
|
Annual Report on Form 10-K (File No. 001-33071)
|
March 21, 2007
|
|||
|
10.17.5*
|
Form of Notice of Initial Outside Director Stock Unit Grant Under the 2006 Equity Incentive Plan of the Registrant
|
Annual Report on Form 10-K (File No. 001-33071)
|
March 13, 2009
|
|||
|
10.17.6*
|
Form of Notice of Annual Outside Director Stock Unit Grant Under the 2006 Equity Incentive Plan of the Registrant
|
Annual Report on Form 10-K (File No. 001-33071)
|
March 13, 2009
|
|||
|
10.17.7*
|
Form of Outside Director Stock Unit Agreement
|
Annual Report on Form 10-K (File No. 001-33071)
|
March 13, 2009
|
|||
|
10.17.8*
|
Form of Notice of Stock Unit Grant and Stock Unit Agreement (Performance-Based Vesting) under the 2006 Equity Incentive Plan of the Registrant
|
Quarterly Report on Form 10-Q (File No. 001-33071)
|
May 6, 2011
|
|||
|
10.17.9*
|
Form of Notice of Stock Unit Grant and Stock Unit Agreement (Performance-Based Vesting) under the 2006 Equity Incentive Plan of the Registrant
|
Quarterly Report on Form 10-Q (File No. 001-33071)
|
May 7, 2013
|
|||
|
10.18*
|
2014 Equity Incentive Plan of the Registrant
|
Definitive Proxy Statement on
Schedule 14A (File No. 001-33071)
|
April 28, 2014
|
|||
110
|
10.18.1*
|
Form of Notice of Stock Option Grant and Stock Option Agreement under the 2014 Equity Incentive Plan of the Registrant
|
Registration Statement on
Form S-8 (File No. 333-196675)
|
June 11, 2014
|
|||
|
10.18.2*
|
Form of Notice of Stock Unit Grant and Stock Unit Agreement under the 2014 Equity Incentive Plan of the Registrant
|
Registration Statement on
Form S-8 (File No. 333-196675)
|
June 11, 2014
|
|||
|
10.18.3*
|
Form of Notice of Stock Unit Grant and Stock Unit Agreement (Initial Director Grant) under the 2014 Equity Incentive Plan of the Registrant
|
Registration Statement on
Form S-8 (File No. 333-196675)
|
June 11, 2014
|
|||
|
10.18.4*
|
Form of Notice of Stock Unit Grant and Stock Unit Agreement (Annual Director Grant) under the 2014 Equity Incentive Plan of the Registrant
|
Registration Statement on
Form S-8 (File No. 333-196675)
|
June 11, 2014
|
|||
|
10.18.5
|
Form of Notice of Stock Option Grant and Stock Option Agreement (People’s Republic of China) under the 2014 Equity Incentive Plan of the Registrant
|
Registration Statement on
Form S-8 (File No. 333-196675)
|
June 11, 2014
|
|||
|
10.18.6
|
Form of Notice of Stock Unit Grant and Stock Unit Agreement (People’s Republic of China) under the 2014 Equity Incentive Plan of the Registrant
|
Registration Statement on
Form S-8 (File No. 333-196675)
|
June 11, 2014
|
|||
|
10.18.7*
|
Form of Notice of Stock Unit Grant and Stock Unit Agreement (Performance-Based Vesting) under the 2014 Equity Incentive Plan of the Registration
|
Current Report on Form 8-K
(File No. 001-33071)
|
March 23, 2015
|
|||
|
10.18.8*
|
Form of Notice of Stock Option Grant and Stock Option Agreement (Performance-Based Vesting) under the 2014 Equity Incentive Plan of eHealth, Inc.
|
Quarterly Report on Form 10-Q
(File No. 001-33071)
|
August 8, 2016
|
|||
|
10.18.9*
|
Form of Notice of Stock Unit Grant and Stock Unit Agreement (Performance-Based Vesting) under the 2014 Equity Incentive Plan of eHealth, Inc.
|
Quarterly Report on Form 10-Q
(File No. 001-33071)
|
August 8, 2016
|
|||
|
10.18.10*
|
Notice of Stock Option Grant and Stock Option Agreement (Performance-Based Vesting) granted to Scott N. Flanders on June 3, 2016
|
Quarterly Report on Form 10-Q
(File No. 001-33071)
|
August 8, 2016
|
|||
|
10.18.11*
|
Notice of Stock Unit Grant and Stock Unit Agreement (Performance-Based Vesting) granted to Scott N. Flanders on June 3, 2016
|
Quarterly Report on Form 10-Q
(File No. 001-33071)
|
August 8, 2016
|
|||
|
10.19*
|
Form of Deferral Election Form for Newly Eligible Individual with Existing Awards
|
Quarterly Report on Form 10-Q
(File No. 001-33071)
|
November 6, 2015
|
|||
|
10.19.1*
|
Form of Deferral Election Form for Eligible Individual for Awards to be Granted in the Next Calendar Year
|
Quarterly Report on Form 10-Q
(File No. 001-33071)
|
November 6, 2015
|
|||
|
21.1
|
List of Subsidiaries
|
Annual Report on Form 10-K (File No. 001-33071)
|
March 15, 2012
|
|||
|
23.1
|
†
|
|||||
|
31.1
|
†
|
|||||
|
31.2
|
†
|
|||||
|
32.1
|
‡
|
|||||
|
32.2
|
‡
|
|||||
† Filed herewith.
‡ Furnished herewith.
* Indicates a management contract or compensatory plan or arrangement.
111
TABLE OF CONTENTS
Part I, Item 1A. , Risk Factors - Risks Related To Our BusinessItem 7A. Quantitative and Qualitative Disclosures About Market RiskItem 8. Financial Statements and Supplementary DataNote 1 - Summary Of Business and Significant Accounting PoliciesNote 2 - Balance Sheet AccountsNote 3 - Fair Value MeasurementsNote 4 - Stockholder's EquityNote 5 - Income TaxesNote 6 - Net Loss Per ShareNote 7 - Restructuring ChargesNote 8 - Commitments and ContingenciesNote 9 - Operating Segments, Geographic Information and Significant CustomersNote 10 Selected Quarterly Financial Data (unaudited)Item 9. Changes in and Disagreements with Accountants on Accounting and Financial DisclosureItem 9A. Controls and ProceduresItem 9B. Other InformationPart IIIItem 10. Directors, Executive Officers and Corporate GovernanceItem 11. Executive CompensationItem 12. Security Ownership Of Certain Beneficial Owners and Management and Related Stockholder MattersItem 13. Certain Relationships and Related Transactions, and Director IndependenceItem 14. Principal Accountant Fees and ServicesPart IVItem 15. Exhibits and Financial Statement SchedulesItem 16. Form 10-k Summary