EMPLOYERS HOLDINGS, INC.
10-Ks and 10-Qs
|
|
|
|
|
|
|
|
|
|
|
|
|
|
|
|
|
|
|
|
|
|
|
|
|
|
|
|
|
|
|
|
|
|
|
|
|
|
|
|
|
|
|
|
|
|
|
|
|
|
|
|
|
|
|
|
UNITED STATES SECURITIES AND EXCHANGE COMMISSION
WASHINGTON, DC 20549
FORM 10-K
R
ANNUAL REPORT PURSUANT TO SECTION 13 OR 15(d) OF THE SECURITIES EXCHANGE ACT OF 1934
For the fiscal year ended
December 31, 2017
OR
o
TRANSITION REPORT PURSUANT TO SECTION 13 OR 15(d) OF THE SECURITIES EXCHANGE ACT OF 1934
For the transition period from ____ to ____
Commission file number: 001-33245
EMPLOYERS HOLDINGS, INC.
(Exact name of registrant as specified in its charter)
|
Nevada
(State or other jurisdiction
of incorporation or organization)
|
|
04-3850065
(I.R.S. Employer
Identification Number)
|
|
10375 Professional Circle, Reno, Nevada 89521
(Address of principal executive offices and zip code)
|
||
(888) 682-6671
(Registrant’s telephone number, including area code)
Securities registered pursuant to Section 12(b) of the Act:
|
Title of each class
|
Name of each exchange on which registered
|
|
|
Common Stock, $0.01 par value per share
|
New York Stock Exchange
|
|
Securities registered pursuant to Section 12(g) of the Act: None
Indicate by check mark if the registrant is a well-known seasoned issuer, as defined in Rule 405 of the Securities Act. Yes
R
No
o
Indicate by check mark if the registrant is not required to file reports pursuant to Section 13 or Section 15(d) of the Exchange Act.
Yes
o
No
R
Indicate by check mark whether the registrant: (1) has filed all reports required to be filed by Section 13 or 15(d) of the Securities Exchange Act of 1934 during the preceding 12 months (or for such shorter period that the registrant was required to file such reports), and (2) has been subject to such filing requirements for the past 90 days. Yes
R
No
o
Indicate by check mark whether the registrant has submitted electronically and posted on its corporate Web site, if any, every Interactive Data File required to be submitted and posted pursuant to Rule 405 of Regulation S-T (§232.405 of this chapter) during the preceding 12 months (or for such shorter period that the registrant was required to submit and post such files). Yes
R
No
o
Indicate by check mark if disclosure of delinquent filers pursuant to Item 405 of Regulation S-K is not contained herein, and will not be contained, to the best of registrant's knowledge, in definitive proxy or information statements incorporated by reference in Part III of this Form 10-K or any amendment to this Form 10-K.
R
Indicate by check mark whether the registrant is a large accelerated filer, an accelerated filer, a non-accelerated filer, a smaller reporting company, or an emerging growth company. See definitions of “large accelerated filer,” “accelerated filer,” “non-accelerated filer,” “smaller reporting company,” and "emerging growth company" in Rule 12b-2 of the Exchange Act. (Check one):
|
Large accelerated filer
R
|
Accelerated filer
o
|
Non-accelerated filer
o
|
Smaller reporting company
o
|
|
Emerging growth company
o
|
|||
If an emerging growth company, indicate by check mark if the registrant has elected not to use the extended transition period for complying with any new or revised financial accounting standards provided pursuant to Section 13(a) of the Exchange Act.
o
The aggregate market value of the voting and non-voting common equity held by non-affiliates of the registrant as of June 30,
2017
was
$1,180,291,866
.
Indicate by check mark whether the registrant is a shell company (as defined in Rule 12b-2 of the Exchange Act). Yes
o
No
R
|
Class
|
|
February 15, 2018
|
|
Common Stock, $0.01 par value per share
|
|
32,705,816 shares outstanding
|
DOCUMENTS INCORPORATED BY REFERENCE
Portions of the registrant's Definitive Proxy Statement relating to the
2018
Annual Meeting of Stockholders are incorporated by reference in Items 10, 11, 12, 13 and 14 of Part III of this report.
|
|
|
Page
No.
|
|
|
|
|
|
Item 1
|
||
|
Item 1A
|
||
|
Item 1B
|
||
|
Item 2
|
||
|
Item 3
|
||
|
Item 4
|
||
|
|
|
|
|
|
|
|
|
|
|
|
|
Item 5
|
||
|
Item 6
|
||
|
Item 7
|
||
|
Item 7A
|
||
|
Item 8
|
||
|
Item 9
|
||
|
Item 9A
|
||
|
Item 9B
|
||
|
Item 10
|
||
|
Item 11
|
||
|
Item 12
|
||
|
Item 13
|
||
|
Item 14
|
||
|
PART I
V
|
||
|
Item 15
|
||
2
FORWARD-LOOKING STATEMENTS
The Private Securities Litigation Reform Act of 1995 provides a safe harbor for forward-looking statements if accompanied by meaningful cautionary statements identifying important factors that could cause actual results to differ materially from those discussed. You should not place undue reliance on these statements, which speak only as of the date of this report. Forward-looking statements include those related to our expected financial position, business, financing plans, litigation, future premiums, revenues, earnings, pricing, investments, business relationships, expected losses, accident year loss estimates, loss experience, loss reserves, acquisitions, competition, the impact of changes in interest rates, rate increases with respect to our business, the impact of key business initiatives, future technologies, and planned investments. Statements including words such as “expect,” “intend,” “plan,” “believe,” “estimate,” “may,” “anticipate,” “will,” or similar statements of a future or forward-looking nature identify forward-looking statements.
We undertake no obligation to publicly update or revise any forward-looking statements, whether as a result of new information, future events or otherwise, except as required by law. All forward-looking statements address matters that involve risks and uncertainties that could cause actual results to differ materially from historical or anticipated results, depending on a number of factors. These risks and uncertainties include, but are not limited to, those set forth in Item 1A, “Risk Factors” and the other documents that we have filed with the Securities and Exchange Commission.
NOTE REGARDING RELIANCE ON STATEMENTS IN OUR CONTRACTS
The agreements included or incorporated by reference as exhibits to this Annual Report on Form 10-K may contain representations and warranties by each of the parties to the applicable agreement. These representations and warranties were made solely for the benefit of the other parties to the applicable agreement and:
|
•
|
were not intended to be treated as categorical statements of fact, but rather as a way of allocating the risk to one of the parties if those statements prove to be inaccurate;
|
|
•
|
may have been qualified in such agreement by disclosures that were made to the other party in connection with the negotiation of the applicable agreement;
|
|
•
|
may apply contract standards of “materiality” that are different from “materiality” under the applicable securities laws; and
|
|
•
|
were made only as of the date of the applicable agreement or such other date or dates as may be specified in the agreement.
|
Notwithstanding the inclusion of the foregoing cautionary statements, we acknowledge that we are responsible for considering whether additional specific disclosures of material information regarding material contractual provisions are required to make the statements in this report not misleading.
3
General
Employers Holdings, Inc. (EHI) is a holding company, which was incorporated in Nevada in 2005. Unless otherwise indicated, all references to “we,” “us,” “our,” the “Company” or similar terms refer to EHI together with its subsidiaries. Through our wholly owned insurance subsidiaries, Employers Insurance Company of Nevada, Employers Compensation Insurance Company, Employers Preferred Insurance Company, and Employers Assurance Company, we are engaged in the commercial property and casualty insurance industry, specializing in workers' compensation products and services. We had
672
full-time employees at
December 31, 2017
and our principal executive offices are located at 10375 Professional Circle in Reno, Nevada. Our insurance subsidiaries have each been assigned an A.M. Best Company (A.M. Best)
rating of “A-” (Excellent), with a “positive” outlook, which is the 4th highest of 13 A.M. Best ratings.
Our Annual Reports on Form 10-K, Quarterly Reports on Form 10-Q, Current Reports on Form 8-K, amendments to those reports, and Proxy Statements for our Annual Meetings of Stockholders are available free of charge on our website at
www.employers.com
as soon as reasonably practicable after they are electronically filed with or furnished to the Securities and Exchange Commission (SEC). Our website also provides access to reports filed by our Directors, executive officers and certain significant stockholders pursuant to Section 16 of the Securities Exchange Act of 1934. In addition, our Corporate Governance Guidelines, Code of Business Conduct and Ethics, Code of Ethics for Senior Financial Officers, and charters for the Audit, Board Governance and Nominating, Executive, Finance, Compensation, and Risk committees of our Board of Directors are available on our website. Copies of these documents may also be obtained free of charge by written request to Investor Relations, 10375 Professional Circle, Reno, Nevada 89521-4802. The SEC also maintains a website at
www.sec.gov
that contains the information that we file electronically with the SEC.
Property and Casualty Insurance in General
A widely-used measure of relative underwriting performance for an insurance company is the combined ratio. Combined ratio is calculated by adding: (i) the ratio of losses and loss adjustment expense (LAE) to earned premiums (known as the “loss and LAE ratio”); (ii) the ratio of commission expenses to earned premiums (known as the “commission expense ratio”); and (iii) the ratio of underwriting and other operating expenses to earned premiums (known as the “underwriting and operating expenses ratio”), with each component determined in accordance with U.S. generally accepted accounting principles (GAAP). A combined ratio under 100% indicates that an insurance company is generating an underwriting profit. A combined ratio over 100% indicates that an insurance company is generating an underwriting loss.
In insurance and reinsurance operations, “float” arises when premiums are received before losses and other expenses are paid, an interval that may extend over many years. During that time, the insurer has the opportunity to invest the money, thereby earning investment income and generating investment gains and losses.
Insurance companies operating at a GAAP combined ratio of greater than 100% can be profitable when investment income and net investment gains are taken into account. The length of time between receiving premiums and paying out losses and other expenses, commonly referred to as the “tail,” can significantly affect how profitable float can be. Long-tail losses, such as workers’ compensation, pay out over longer periods of time providing us the opportunity to generate significant investment earnings from float.
Underwriting income or loss is determined by deducting losses and LAE, commission expenses, and underwriting and other operating expenses from net premiums earned.
Our Strategy
Business Strategy
Our strategy is to pursue profitable growth opportunities across market cycles and maximize total investment returns within the constraints of prudent portfolio management. We pursue profitable growth opportunities by focusing on disciplined underwriting and claims management, utilizing medical provider networks designed to produce superior medical and indemnity outcomes, establishing and maintaining strong, long-term relationships with independent insurance agencies, development and implementation of new technologies, and developing important alternative distribution channels.
We continue to execute a number of ongoing business initiatives, including: focusing on internal and customer-facing business process excellence; accelerating the settlement of open claims; diversifying our risk exposure across geographic markets; utilizing a multi-company pricing platform; utilizing territory-specific pricing; and leveraging data-driven strategies to target, price, and underwrite profitable classes of business across all of our markets.
4
Capital Strategy
We believe that we have a strong capital position. We periodically reassess our capital needs to ensure an optimal use of capital consistent with our goal to create shareholder value over the long-term. Our capital strategy is focused on supporting our business operations by maintaining capital levels commensurate with our desired ratings from independent rating agencies, satisfying regulatory constraints and legal requirements, and sustaining a level of financial flexibility to prudently manage our business through insurance and economic cycles while allowing us to take advantage of investment opportunities, including acquisitions of insurance and insurance-related entities, as and when they arise.
We also believe in returning capital not needed for these purposes to our stockholders through regular quarterly dividends and, when feasible, common stock repurchases. During each of the years ended December 31, 2017, 2016, and 2015, we paid dividends on our common stock of $19.7 million, $11.5 million, and $7.7 million, respectively, and during the three-year period ending December 31, 2017, we repurchased $21.1 million of our common stock. Any future returns of capital to our stockholders are dependent on a variety of factors, including our financial position, holding company liquidity, share price, corporate and regulatory requirements, and other market and economic conditions.
Description of Business
We are a specialty provider of workers' compensation insurance focused on select small businesses in low to medium hazard industries. We employ a disciplined, conservative underwriting approach designed to individually select specific types of businesses, predominantly those in the lowest four of the seven workers' compensation insurance industry-defined hazard groups, that we believe will have fewer and less costly claims relative to other businesses in the same hazard groups. Workers' compensation is provided under a statutory system wherein most employers are required to provide coverage for their employees' medical, disability, vocational rehabilitation, and/or death benefit costs for work-related injuries or illnesses.
We operate as a single reportable segment and conduct operations in
37
states and the District of Columbia (D.C.), with a concentration in California, where over one-half of our business is generated.
In 1999, the Nevada State Industrial Insurance System (the Fund) entered into a retroactive 100% quota share reinsurance agreement (LPT Agreement) through a loss portfolio transfer transaction with third party reinsurers. The LPT Agreement commenced on June 30, 1999 and will remain in effect until all claims under the covered policies have closed, the LPT Agreement is commuted or terminated, upon the mutual agreement of the parties, or the reinsurers' aggregate maximum limit of liability is exhausted, whichever occurs first. The LPT Agreement does not provide for any additional termination terms. On January 1, 2000, we assumed all of the assets, liabilities and operations of the Fund, including the Fund's rights and obligations associated with the LPT Agreement.
We account for the LPT Agreement as retroactive reinsurance. Upon entry into the LPT Agreement, an initial deferred reinsurance gain (Deferred Gain) was recorded as a liability on our Consolidated Balance Sheets. We are entitled to receive a contingent profit commission under the LPT Agreement. The contingent profit commission is estimated based on both actual paid results to date and projections of expected paid losses under the LPT Agreement.
We had total assets of
$3.8 billion
at
December 31, 2017
and
2016
. The following table highlights key results of our operations for the last three years.
|
Years Ended December 31,
|
||||||||||||
|
2017
|
2016
|
2015
|
||||||||||
|
(in millions, except ratios)
|
||||||||||||
|
Net premiums written
|
$
|
723.7
|
|
$
|
694.6
|
|
$
|
689.3
|
|
|||
|
Total revenues
|
801.4
|
|
779.8
|
|
752.1
|
|
||||||
|
Net income
|
101.2
|
|
106.7
|
|
94.4
|
|
||||||
|
Combined ratio
|
90.5
|
%
|
91.8
|
%
|
94.1
|
%
|
||||||
|
Impact of the LPT Agreement
(1)
|
1.6
|
%
|
2.3
|
%
|
3.0
|
%
|
||||||
|
Combined ratio before the impact of the LPT Agreement
(1)
|
92.1
|
%
|
94.1
|
%
|
97.1
|
%
|
||||||
|
(1)
|
The impact of the LPT Agreement includes: (a) amortization of the Deferred Gain; (b) adjustments to LPT Agreement ceded reserves; and (c) adjustments to Contingent commission receivable–LPT Agreement. The Deferred Gain reflects the unamortized gain from our LPT Agreement. Under GAAP, this gain is deferred and is being amortized using the recovery method. Amortization is determined by the proportion of actual reinsurance recoveries to total estimated recoveries over the life of the LPT Agreement, except for the contingent profit commission, which is amortized through June 30, 2024. The amortization is reflected in losses and LAE. We periodically reevaluate the remaining direct reserves subject to the LPT Agreement and the expected losses and LAE subject to the contingent profit commission under the LPT Agreement. Our reevaluation results in corresponding adjustments, if needed, to loss reserves, ceded loss reserves, contingent commission receivable, and the Deferred Gain, with the net effect being an increase or decrease to our net income. Combined ratio before impact of the LPT Agreement is not a measurement of financial performance under GAAP, but rather reflects the difference in accounting treatment between statutory accounting principles and GAAP, and should not be considered in isolation or as an alternative to the combined ratio or any other measure of performance derived in accordance with GAAP.
|
5
Our insurance subsidiaries are domiciled in the following states:
|
State of Domicile
|
|
|
Employers Insurance Company of Nevada (EICN)
|
Nevada
|
|
Employers Compensation Insurance Company (ECIC)
|
California
|
|
Employers Preferred Insurance Company (EPIC)
|
Florida
|
|
Employers Assurance Company (EAC)
|
Florida
|
Products and Services
Workers' compensation provides insurance coverage for the statutorily prescribed benefits that employers are required to provide to their employees who may be injured or suffer illness in the course of employment. The level of benefits varies by state, the nature and severity of the injury or disease, and the wages of the injured worker. Each state has a statutory, regulatory, and adjudicatory system that sets the amount of wage replacement to be paid, determines the level of medical care required to be provided, establishes the degree of permanent impairment, and specifies the options in selecting healthcare providers. These state laws generally require two types of benefits for injured employees: (a) medical benefits, including expenses related to the diagnosis and treatment of an injury, disease, or both, as well as any required rehabilitation, and (b) indemnity payments, which consist of temporary wage replacement, permanent disability payments, and death benefits to surviving family members.
Disciplined Underwriting
Our strategy is to focus on disciplined underwriting and continue to pursue profitable growth opportunities across market cycles. We carefully monitor market trends to assess business opportunities that we expect will meet our pricing and risk standards. We price our policies based on the specific risks associated with each potential insured rather than solely on the industry class in which a potential insured is classified. Our disciplined underwriting approach, workers' compensation specialization, expertise in underwriting small businesses, and data-driven strategies are critical elements of our culture, which we believe allow us to offer competitive prices, diversify our risks, and out-perform the industry.
We execute our underwriting processes through automated systems and experienced underwriters with specific knowledge of the local markets in which we operate. We have developed automated underwriting templates for specific classes of business that produce faster quotes when certain underwriting criteria are met. Our underwriting guidelines consider many factors, such as type of business, nature of operations, and risk exposures, and are designed to minimize or prevent underwriting of certain classes of business that we view as being unattractive.
Loss Control
Our loss control professionals provide consultation to policyholders, as a component of our workers' compensation insurance product, to assist them in preventing or reducing the frequency and severity of losses and containing costs once claims occur. They also assist our underwriting personnel by conducting risk evaluations of potential and current policyholders and are an important part of our underwriting discipline.
Premium Audit
We conduct premium audits on substantially all of our policyholders annually upon the policy expiration. Premium audits allow us to comply with applicable state and reporting bureau requirements and to verify that policyholders have accurately reported their payroll and employee job classifications. We also selectively perform interim audits and/or update renewal payroll on policies in certain classes of business or if unusual claims are filed or concerns are raised regarding projected annual payrolls, which could result in substantial variances at final audit. These variances result in adjustments to our written and earned premiums, as well as our net losses and LAE, in the periods in which they become known.
Claims and Medical Case Management
The role of our claims department is to actively and efficiently investigate, evaluate, and pay claims, and to aid injured workers in returning to work in accordance with applicable laws and regulations. We have implemented rigorous claims guidelines and control procedures in our claims units and have claims operations throughout the markets we serve. We also provide medical case management services for those claims that we determine will benefit from such involvement.
We utilize an outcome-based medical network that incorporates predictive analytics to identify medical providers who achieve superior clinical outcomes for our injured workers that allows us to optimize our provider network and enhance the quality of care. We have also implemented a proactive pharmacy benefit management program that, along with our outcome-based medical network, focuses on reducing claims costs and accelerating injured workers' return to work. We recently implemented our Injured Employee Hotline that allows employees who are injured at work to receive professional nurse consultation by phone when
6
reporting the claim. This service has proven to reduce overall claims costs and is intended to ensure the injured worker receives appropriate and timely medical care.
In addition to our medical networks, we work closely with local vendors, including attorneys, medical professionals, pharmacy benefits managers, and investigators, to bring local expertise to our reported claims. We pay special attention to reducing costs and have established discounting arrangements with the aforementioned service providers. We use preferred provider organizations, bill review services, and utilization management to closely monitor medical costs. We actively pursue fraud and subrogation recoveries to mitigate claims costs. Subrogation rights are based upon state and federal laws, as well as the insurance policies we issue. Our fraud and subrogation efforts are handled through dedicated units.
Our claims department also provides claims management services for those claims incurred by the Fund, which were assumed by EICN and are subject to the LPT Agreement with dates of injury prior to July 1, 1995. Additional information regarding the LPT Agreement is set forth under “–Reinsurance–LPT Agreement.” We receive a management fee from the third party reinsurers equal to 7% of the loss payments on these claims.
Information Technology
Core Operating Systems
We have an efficient, cost-effective and scalable infrastructure that complements our geographic reach and business model. We continue to invest in technology to automate business processes and advanced data and analytics capabilities that will enable us to lower our expense ratios while growing premiums over the long-term and set a foundation for our future needs. Our technology saves our independent agents, brokers, and policyholders considerable time and maintains our competitiveness in our target markets.
Development and Implementation of New Technologies and Capabilities
We have recently initiated a plan of aggressive development and implementation of new technologies and capabilities that we believe will fundamentally transform and enhance the digital experience of our customers. We have chosen to reinvest the expected financial benefits from corporate income tax reform back into our business over the next several years by greatly accelerating the development and deployment of these new digital capabilities. We believe that these new technological and intellectual capabilities will support our future growth initiatives, provide us with greater pricing precision and flexibility and promote long-term value creation.
We expect that the development and implementation of these new technologies and capabilities will increase our underwriting and other operating expense ratio in 2018 and 2019, as compared to that experienced in prior years. However, we expect that these increased expenses will be more than offset by operational efficiency gains in future periods.
Business Continuity/Disaster Recovery
We maintain business continuity and disaster recovery plans for our critical business functions, including the restoration of information technology infrastructure and applications. We utilize two data centers that act as production facilities and as disaster recovery sites for each other. In addition, we utilize an off-site data storage facility for critical customer and systems data.
Cyber Security
Our operations rely on the secure processing, storage, and transmission of confidential and other information. Our business, including our ability to adequately price products and services, establish reserves, provide an effective and secure service to our customers and report our financial results in a timely and accurate manner, depends significantly on the integrity, availability and timeliness of the data we maintain, as well as the data held by third party outsourcers, service providers and systems.
In an effort to ensure the privacy, confidentiality and integrity of this data, we are continually enhancing our cyber and other information security in order to remain secure against emerging threats, as well as increasing our ability to detect, and recover from, a cyber-attack or unauthorized access.
Customers and Workers' Compensation Premiums
The workers' compensation insurance industry classifies risks into seven hazard groups, as defined by the National Council on Compensation Insurance (NCCI), based on severity of claims, with businesses in the first or lowest group having the lowest claims costs.
We target select small businesses engaged in low to medium hazard industries. Our historical loss experience has been more favorable for lower industry-defined hazard groups than for higher hazard groups. Further, we believe it is generally less costly to service and manage the risks associated with these lower hazard groups. Our underwriters use their local market expertise and disciplined underwriting to select specific types of businesses and risks within the classes of business we underwrite that allow us to generate loss ratios that are better than the industry average.
7
We focus heavily on our in-force premiums, which represent the initial premium on all policies that have not expired or have not been canceled. The following table shows a reconciliation of our gross premiums earned during the years ended
December 31, 2017
,
2016
, and
2015
to in-force premiums as of
December 31, 2017
,
2016
, and
2015
:
|
2017
|
2016
|
2015
|
||||||||||
|
(in millions)
|
||||||||||||
|
Gross premiums earned
|
$
|
722.5
|
|
$
|
701.6
|
|
$
|
698.8
|
|
|||
|
Less: Final audit and retroactive adjustments
|
85.5
|
|
72.6
|
|
66.5
|
|
||||||
|
Less: Involuntary premium
|
10.2
|
|
10.4
|
|
12.8
|
|
||||||
|
In-force premium
|
$
|
626.9
|
|
$
|
618.6
|
|
$
|
619.5
|
|
|||
The following table sets forth our in-force premiums by hazard group and as a percentage of our total in-force premiums as of December 31:
|
Hazard
Group
|
2017
|
Percentage
of 2017 Total |
2016
|
Percentage
of 2016 Total |
2015
|
Percentage
of 2015 Total |
|||||||||||||||
|
(in millions, except percentages)
|
|||||||||||||||||||||
|
A
|
$
|
176.9
|
|
28.2
|
%
|
$
|
162.6
|
|
26.3
|
%
|
$
|
159.6
|
|
25.8
|
%
|
||||||
|
B
|
159.4
|
|
25.4
|
|
161.0
|
|
26.0
|
|
159.2
|
|
25.7
|
|
|||||||||
|
C
|
188.0
|
|
30.0
|
|
195.7
|
|
31.7
|
|
203.5
|
|
32.8
|
|
|||||||||
|
D
|
91.9
|
|
14.7
|
|
88.0
|
|
14.2
|
|
86.0
|
|
13.9
|
|
|||||||||
|
E
|
9.4
|
|
1.5
|
|
9.8
|
|
1.6
|
|
9.7
|
|
1.6
|
|
|||||||||
|
F
|
1.0
|
|
0.2
|
|
1.3
|
|
0.2
|
|
1.4
|
|
0.2
|
|
|||||||||
|
G
|
0.3
|
|
<0.1
|
|
0.2
|
|
<0.1
|
|
0.1
|
|
<0.1
|
|
|||||||||
|
Total
|
$
|
626.9
|
|
100.0
|
%
|
$
|
618.6
|
|
100.0
|
%
|
$
|
619.5
|
|
100.0
|
%
|
||||||
In-force premiums for our top ten types of insureds and as a percentage of our total in-force premiums as of
December 31, 2017
were as follows:
|
Employer Classifications
|
In-force Premiums
|
Percentage
of Total
|
|||||
|
(in millions, except percentages)
|
|||||||
|
Restaurants and Other Eating Places
|
$
|
173.4
|
|
27.6
|
%
|
||
|
Automobile Dealers
|
46.2
|
|
7.4
|
|
|||
|
Traveler Accommodation
|
45.8
|
|
7.3
|
|
|||
|
Offices of Physicians
|
25.3
|
|
4.0
|
|
|||
|
Activities Related to Real Estate
|
21.3
|
|
3.4
|
|
|||
|
Grocery Stores
|
20.5
|
|
3.3
|
|
|||
|
Other Store Retailers
|
19.3
|
|
3.1
|
|
|||
|
Nondurable Goods Merchant Wholesalers
|
17.7
|
|
2.8
|
|
|||
|
Services to Buildings and Dwellings
|
17.6
|
|
2.8
|
|
|||
|
Automotive Repair and Maintenance
|
14.9
|
|
2.4
|
|
|||
|
Total
|
$
|
402.0
|
|
64.1
|
%
|
||
We currently write business in
37
states and D.C.
Our business is concentrated in California, which makes the results of our operations more dependent on the trends that are unique to that state and that may differ from national trends. State and federal legislation and regulation, court decisions, local competition, economic and employment trends, and workers' compensation medical cost trends can materially impact our financial results.
As of
December 31, 2017
, our policyholders had average annual in-force premiums of
$7,333
.
We are not dependent on any single policyholder and the loss of any single policyholder would not have a material adverse effect on our business.
8
The following table shows our in-force premiums and number of policies in-force for each state with at least five percent of our in-force premiums and all other states combined as of December 31:
|
2017
|
2016
|
2015
|
|||||||||||||||||||
|
State
|
In-force Premiums
|
Policies
In-force
|
In-force Premiums
|
Policies
In-force
|
In-force Premiums
|
Policies
In-force
|
|||||||||||||||
|
(dollars in millions)
|
|||||||||||||||||||||
|
California
|
$
|
349.4
|
|
40,573
|
|
$
|
348.3
|
|
42,120
|
|
$
|
352.2
|
|
44,080
|
|
||||||
|
Florida
|
41.8
|
|
5,625
|
|
35.2
|
|
5,263
|
|
29.4
|
|
4,735
|
|
|||||||||
|
Illinois
|
25.6
|
|
2,893
|
|
30.6
|
|
3,106
|
|
32.5
|
|
3,286
|
|
|||||||||
|
Other (34 states and D.C.)
|
210.1
|
|
36,403
|
|
204.5
|
|
34,333
|
|
205.3
|
|
32,395
|
|
|||||||||
|
Total
|
$
|
626.9
|
|
85,494
|
|
$
|
618.6
|
|
84,822
|
|
$
|
619.5
|
|
84,496
|
|
||||||
From
2015
through
2017
, our total in-force premiums and number of policies in-force increased slightly, while in-force premiums and policy count in California decreased
0.8%
and
8.0%
, respectively, reflecting our efforts to continue to diversify and grow our business in new and profitable markets. We cannot be certain how these trends will ultimately impact our consolidated financial position and results of operations.
Our premiums are generally a function of the applicable premium rate, the amount of the insured's payroll, and if applicable, a factor reflecting the insured's historical loss experience (experience modification factor). Premium rates vary by state according to the nature of the employees' duties and the business of the employer. The premium is computed by applying the applicable premium rate to each class of the insured's payroll after it has been appropriately classified. Total policy premium is determined after applying an experience modification factor and a further adjustment, known as a schedule rating adjustment, and other adjustments, which may be made in certain circumstances, to increase or decrease the policy premium. Schedule rating adjustments are made based on individual risk characteristics of the insured and subject to maximum amounts as established in our premium rate filings.
Our premium rates are based upon actuarial analyses for each state in which we do business, except in “administered pricing” states, primarily Florida,Wisconsin, and Idaho, where premium rates are set by state insurance regulators.
Pricing on our renewals showed an overall price decrease of 3.3% for the year ended December 31, 2017, versus the rate level in effect on such business a year earlier. Despite the competitive market conditions we currently face, through our efforts in 2017, we believe that we have continued to write attractive business in new and existing states and have strengthened our relationships with our business partners. Given the strength of our balance sheet, the execution of our underwriting, claims, and investment strategies, and our active capital management, we believe that we are well positioned for the current market cycle.
Losses and LAE Reserves and Loss Development
We are directly liable for losses and LAE under the terms of the insurance policies our insurance subsidiaries write. Significant periods of time can elapse between the occurrence of an insured loss, the reporting of the loss to us, and our payment of that loss. Loss reserves are reflected on our Consolidated Balance Sheets under the line item caption “Unpaid losses and loss adjustment expenses.” Estimating reserves is a complex process that involves a considerable degree of judgment by management and is inherently uncertain. Loss reserve estimates represent a significant risk to our business, which we attempt to mitigate by frequently and routinely reviewing loss cost trends.
For a detailed description of our reserves, the judgments, key assumptions and actuarial methodologies that we use to estimate our reserves, and the role of our consulting actuary, see “Item 7 –Management's Discussion and Analysis of Consolidated Financial Condition and Results of Operations –Critical Accounting Policies –Reserves for Losses and LAE” and Note
9
in the Notes to our Consolidated Financial Statements.
Reinsurance
Reinsurance is a transaction between insurance companies in which an original insurer, or ceding company, remits a portion of its premiums to a reinsurer, or assuming company, as payment for the reinsurer assuming a portion of the risk. Excess of loss reinsurance may be written in layers, in which a reinsurer or group of reinsurers accepts a band of coverage in excess of a specified amount, or retention, and up to a specified amount. Any liability exceeding the coverage limits of the reinsurance program is retained by the ceding company. The ceding company also bears the risk of a reinsurer's unwillingness or inability to pay. Consistent with general industry practices, we purchase excess of loss reinsurance to protect us against the impact of large individual, irregularly-occurring losses, and aggregate catastrophic losses from natural perils and terrorism, excluding nuclear, biological, chemical, and radiological events. Such reinsurance reduces the magnitude of such losses on our net income and the capital of our insurance subsidiaries.
9
Excess of Loss Reinsurance
Our current reinsurance program applies to all covered losses occurring between 12:01 a.m. July 1,
2017
and 12:01 a.m. July 1,
2018
and consists of one treaty covering excess of loss and catastrophic loss events in four layers of coverage. Our reinsurance coverage is
$190.0 million
in excess of our
$10.0 million
retention on a per occurrence basis, subject to certain exclusions. The coverage under our annual reinsurance programs that ended July 1, 2017 and 2016 was $190.0 million and $193.0 million, in excess of our $10.0 million and $7.0 million retention on a per occurrence basis, respectively. We are solely responsible for any losses we suffer above
$200.0 million
except those covered by the Terrorism Risk Insurance Program Reauthorization Act of 2015 (TRIPRA of 2015). See "—Terrorism Risk Insurance Program." Covered losses which occur prior to expiration or cancellation of the agreement continue to be obligations of the subscribing reinsurers, subject to the other conditions in the agreement. The subscribing reinsurers may terminate the agreement only for our breach of the obligations of the agreement. We are responsible for the losses if the subscribing reinsurer cannot or refuses to pay.
The agreement includes certain exclusions for which our subscribing reinsurers are not liable for losses, including but not limited to losses arising from the following: reinsurance assumed by us under pooling arrangements; financial guarantee and insolvency; certain nuclear risks; liability as a member, subscriber, or reinsurer of any pool, syndicate, or association, but not assigned risk plans; liability arising from participation or membership in any insolvency fund; loss or damage caused by war other than acts of terrorism or civil commotion; workers' compensation business covering persons employed in Minnesota; and any loss or damage caused by any act of terrorism involving biological, chemical, nuclear, or radioactive pollution or contamination. Our underwriting guidelines generally require that insured risks fall within the coverage provided in the reinsurance program. Executive review and approval would be required if we were to write risks outside the reinsurance program.
The agreement provides that we, or any subscribing reinsurer, may request commutation of any outstanding claim or claims 10 years after the effective date of termination or expiration of the agreements and provides a mechanism for the parties to achieve valuation for commutation. We may require a special commutation of the percentage share of any loss in the reinsurance program of any subscribing reinsurer that is in runoff.
We believe that our reinsurance program meets our current needs.
LPT Agreement
In 1999, the Fund
entered into a retroactive 100% quota share reinsurance agreement through a loss portfolio transfer transaction with third party reinsurers. The LPT Agreement commenced on June 30, 1999 and will remain in effect until all claims under the covered policies have closed, the agreement is commuted, or terminated, upon the mutual agreement of the parties, or the reinsurers' aggregate maximum limit of liability is exhausted, whichever occurs earlier. The LPT Agreement does not provide for any additional termination terms. On January 1, 2000, EICN assumed all of the assets, liabilities and operations of the Fund, including the Fund's rights and obligations associated with the LPT Agreement.
Under the LPT Agreement, the Fund initially ceded
$1.5 billion
in liabilities for the incurred but unpaid losses and LAE related to claims incurred prior to July 1, 1995, for consideration of
$775.0 million
in cash. The LPT Agreement, which ceded to the reinsurers substantially all of the Fund's outstanding losses as of June 30, 1999 for claims with original dates of injury prior to July 1, 1995, provides coverage for losses up to
$2.0 billion
, excluding losses for burial and transportation expenses. The estimated remaining liabilities subject to the LPT Agreement were approximately
$438.9 million
and
$465.5 million
, as of
December 31, 2017
and
2016
, respectively (See Note
10
in the Notes to our Consolidated Financial Statements). Losses and LAE paid with respect to the LPT Agreement totaled approximately
$749.3 million
and
$722.7 million
through
December 31, 2017
and
2016
, respectively.
The reinsurers agreed to assume responsibilities for the claims at the benefit levels which existed in June 1999. The LPT Agreement required each reinsurer to place assets supporting the payment of claims by them in a trust that requires collateral be held at a specified level. The level must not be less than the outstanding reserve for losses and a loss expense allowance equal to 7% of estimated paid losses discounted at a rate of 6%. If the assets held in trust fall below this threshold, we may require the reinsurers to contribute additional assets to maintain the required minimum level of collateral.
The value of these assets as of
December 31, 2017
and
2016
was
$380.8 million
and
$355.7 million
, respectively.
The reinsurers currently party to the LPT Agreement are Chubb Bermuda Insurance Limited, XL Re Limited, and National Indemnity Company. The contract provides that during the term of the agreement all reinsurers need to maintain a rating of not less than “A-” (Excellent) as determined by A.M. Best. Currently, each of the reinsurers party to the LPT Agreement has a rating that satisfies this requirement.
We account for the LPT Agreement as retroactive reinsurance. Upon entry into the LPT Agreement, an initial deferred reinsurance gain was recorded as a liability on our Consolidated Balance Sheets as Deferred Gain. We are also entitled to receive a contingent profit commission under the LPT Agreement. The contingent profit commission is estimated based on both actual paid results to
10
date and projections of expected paid losses under the LPT Agreement. As of
December 31, 2017
, our estimate of the ultimate expected contingent profit commission was
$67.8 million
, of which $36.4 million has been settled as of
December 31, 2017
.
Recoverability of Reinsurance
Reinsurance makes the assuming reinsurer liable to the ceding company to the extent of the reinsurance; however, it does not discharge the ceding company from its primary liability to its policyholders in the event the reinsurer cannot or refuses to pay its obligations under such reinsurance. We monitor the financial strength of our reinsurers and do not believe that we are currently exposed to any material credit risk through our reinsurance arrangements because our reinsurance is recoverable from large, well-capitalized reinsurance companies. At
December 31, 2017
,
$3.5 million
of our reinsurance recoverables were collateralized by cash or letters of credit and an additional
$380.8 million
was held in trust accounts for our benefit in support of reinsurance recoverables related to the LPT Agreement.
The following table provides information regarding our ceded reinsurance recoverables for losses and LAE as of
December 31, 2017
.
|
Reinsurer
|
A.M. Best
Rating
(1)
|
Total Paid Losses and LAE
|
Total Unpaid Losses and LAE
|
Total
|
||||||||||
|
(in millions)
|
||||||||||||||
|
ACE Property & Casualty Insurance Company
|
A++
|
$
|
—
|
|
$
|
2.1
|
|
$
|
2.1
|
|
||||
|
American Healthcare Indemnity Company
|
N/R
|
—
|
|
2.2
|
|
2.2
|
|
|||||||
|
Aspen Insurance UK Limited
|
A
|
—
|
|
4.8
|
|
4.8
|
|
|||||||
|
Chubb Bermuda Insurance Limited
|
A++
|
0.7
|
|
43.9
|
|
44.6
|
|
|||||||
|
Finial Reinsurance
|
A-
|
0.1
|
|
5.3
|
|
5.4
|
|
|||||||
|
Hannover Ruck SE
|
A+
|
—
|
|
9.6
|
|
9.6
|
|
|||||||
|
Lloyd's Syndicates
|
A
|
0.1
|
|
36.9
|
|
37.0
|
|
|||||||
|
Markel Bermuda Limited
|
A
|
—
|
|
1.3
|
|
1.3
|
|
|||||||
|
Munich Reinsurance America, Inc.
|
A+
|
—
|
|
4.1
|
|
4.1
|
|
|||||||
|
National Indemnity Company
|
A++
|
3.6
|
|
241.4
|
|
245.0
|
|
|||||||
|
National Union Fire Insurance Co of Pittsburgh
|
A
|
0.1
|
|
1.4
|
|
1.5
|
|
|||||||
|
Partner Reinsurance Co of the US
|
A
|
—
|
|
1.0
|
|
1.0
|
|
|||||||
|
ReliaStar Life Insurance Company
|
A
|
0.1
|
|
1.2
|
|
1.3
|
|
|||||||
|
Safety National Casualty Corporation
|
A+
|
—
|
|
1.8
|
|
1.8
|
|
|||||||
|
St Paul Fire & Marine Insurance Company
|
A++
|
—
|
|
4.1
|
|
4.1
|
|
|||||||
|
Swiss Reinsurance America Corporation
|
A+
|
0.1
|
|
9.1
|
|
9.2
|
|
|||||||
|
Tokio Marine America Insurance Company (TMAIC) (US)
|
A++
|
0.1
|
|
7.8
|
|
7.9
|
|
|||||||
|
XL Bermuda Ltd
|
A
|
2.3
|
|
153.6
|
|
155.9
|
|
|||||||
|
All Other
|
Various
|
—
|
|
5.4
|
|
5.4
|
|
|||||||
|
Total
|
$
|
7.2
|
|
$
|
537.0
|
|
$
|
544.2
|
|
|||||
|
(1)
|
A.M. Best's highest financial strength ratings for insurance companies are “A++” and “ A+” (Superior), “A” and “A-” (Excellent),
|
and “B++” and “B+” (Good).
We review the aging of our reinsurance recoverables on a quarterly basis and no material amounts due from our reinsurers have been written-off as uncollectible since our inception in 2000. At
December 31, 2017
, less than
1.0%
of our reinsurance recoverables on paid losses were greater than 90 days overdue.
Terrorism Risk Insurance Program
The Terrorism Risk Insurance Act of 2002 (2002 Act) was initially enacted in November 2002, modified and extended in 2005, again in 2007, and most recently in 2015. Now known as the Terrorism Risk Insurance Program Reauthorization Act of 2015 (TRIPRA of 2015), the program is designed to allow the insurance industry and the federal government to share losses from declared terrorist events according to a specific formula, and is in effect until December 31, 2020.
The workers' compensation laws of the various states generally do not permit the exclusion of coverage for losses arising from terrorism or nuclear, biological, chemical, or radiological attacks. In addition, we are not able to limit our losses arising from any one catastrophe or from any one claimant. Our reinsurance policies exclude coverage for losses arising out of nuclear, biological, chemical, or radiological attacks. Under TRIPRA of 2015, federal protection may be provided to the insurance industry for certain acts of foreign and domestic terrorism, including nuclear, biological, chemical, or radiological attacks.
11
The impacts of any future terrorist acts are unpredictable, and the ultimate impact on our insurance subsidiaries, if any, of losses from any future terrorist acts will depend upon their nature, extent, location, and timing. We monitor the geographic concentration of our policyholders to help mitigate the risk of loss from terrorist acts.
Investments
Our investment portfolio is structured to support our need for: (i) optimizing our risk-adjusted total return; (ii) providing adequate liquidity; (iii) facilitating financial strength and stability; and (iv) ensuring regulatory and legal compliance.
As of
December 31, 2017
, the total amortized cost of our investment portfolio was
$2.5 billion
and its fair value was
$2.7 billion
. These investments provide a steady source of income, which may fluctuate with changes in interest rates and our current investment strategies.
While we oversee all of our investment activities, we employ an independent investment manager (Investment Manager). Our Investment Manager follows our written investment guidelines based upon strategies approved by our Board of Directors and our asset allocation is reevaluated by management and reviewed by the Finance Committee of the Board of Directors on a quarterly basis. We also utilize our Investment Manager's investment advisory services to assist us in developing a tailored set of portfolio targets and objectives.
Additional information regarding our investment portfolio, including our approach to managing investment risk, is set forth under “Item 7 –Management's Discussion and Analysis of Consolidated Financial Condition and Results of Operations –Liquidity and Capital Resources –Investments” and “Item 7A –Quantitative and Qualitative Disclosures about Market Risk.”
Marketing and Distribution
We market our workers' compensation insurance products through independent local, regional, and national agents and brokers and through alternative distribution channels, including our partner ADP, Inc. (ADP) and national, regional, and local trade groups and associations.
Independent Insurance Agents and Brokers
We establish and maintain strong, long-term relationships with independent insurance agencies that actively market our products and services. We offer ease of doing business, provide responsive service, and pay competitive commissions. Our sales representatives and underwriters work closely with independent agencies to market and underwrite our business. This results in enhanced understanding of the businesses and risks we underwrite and the needs of prospective customers. We do not delegate underwriting authority to agents or brokers. We are not dependent on any one agency and the loss of any one agency would not be material to our operations.
We had approximately
4,000
independent agencies that marketed and sold our insurance products at
December 31, 2017
. Independent agencies generated
72.8%
,
74.7%
, and
75.8%
of in-force premiums at
December 31, 2017
,
2016
, and
2015
, respectively, and our largest agency generated
two
percent or less of our in-force premiums at each of
December 31, 2017
,
2016
, and
2015
.
Alternative Distribution Channels
We have developed and continue to add to important distribution channels for our products and services that serve as an alternative to our strong independent agency distribution channel. These alternative distribution channels utilize partnerships and alliances with entities such as payroll companies and health care and property and casualty insurers for which we provide workers’ compensation insurance coverage. Our small business, low to medium hazard workers’ compensation insurance products are jointly offered and marketed with and through our partners and alliances.
Alternative distribution channels generated
27.0%
,
25.1%
, and
23.9%
of our in-force premiums as of
December 31, 2017
,
2016
, and
2015
, respectively.
A significant concentration of our business is being generated by ADP. ADP is the largest payroll services provider in the United States servicing small and medium-sized businesses. As part of its services, ADP sells our workers' compensation insurance product along with its payroll and accounting services through its insurance agency and field sales staff primarily to small businesses. ADP generated
13.9%
,
12.4%
, and
11.5%
of our in-force premiums as of
December 31, 2017
,
2016
, and
2015
, respectively.
The majority of this business is written through ADP's small business unit, which has accounts of 1 to 50 employees. We pay ADP fees that are a percentage of premiums received for services provided through the ADP program.
Our relationship with ADP is non-exclusive; however, we believe we are a key partner of ADP for our selected markets and classes of business. Our agreement with ADP may be terminated at any time by either party without cause upon a 120 day notice.
12
Competition and Market Conditions
The insurance industry is highly competitive, and there is significant competition in the national workers' compensation industry that is based on price and quality of services. We compete with other specialty workers' compensation carriers, state agencies, multi-line insurance companies, professional employer organizations, self-insurance funds, and state insurance pools. Many of our competitors are significantly larger, more widely known, and/or possess considerably greater financial resources. Our primary competitors are AmTrust Financial Services, Inc., Berkshire Hathaway Homestate Companies, The Hartford Financial Services Group, Inc., ICW Group, and Travelers Insurance Group Holdings, Inc.
The workers' compensation sector continued to see average medical and indemnity claims costs increase, while the industry overall saw a decline in claim frequency in 2016, the most recent year for which industry data is available.
Regulation
State Insurance Regulation
Insurance companies are subject to regulation and supervision by the insurance regulator in the state in which they are domiciled and, to a lesser extent, other states in which they conduct business. These state agencies have broad regulatory, supervisory, and administrative powers, including, among other things, the power to grant and revoke licenses to transact business, license agencies, set the standards of solvency to be met and maintained, determine the nature of, and limitations on, investments and dividends, approve policy forms and rates in some states, periodically examine financial statements, determine the form and content of required financial statements, set the rates that we may charge in some states, and periodically examine market conduct.
Detailed annual and quarterly financial statements, prepared in accordance with statutory accounting principles (SAP), and other reports are required to be filed with the insurance regulator in each of the states in which we are licensed to transact business. The California Department of Insurance (California DOI), Florida Office of Insurance Regulation (Florida OIR), and Nevada Division of Insurance (Nevada DOI) periodically examine the statutory financial statements of their respective domiciliary insurance companies. In 2015, the California DOI and Nevada DOI completed financial examinations for ECIC and EICN, respectively, and in 2016, the Florida OIR completed its regularly scheduled exams for EPIC and EAC. There were no material findings.
Many states have laws and regulations that limit an insurer's ability to withdraw from a particular market. For example, states may limit an insurer's ability to cancel or not renew policies. Furthermore, certain states prohibit an insurer from withdrawing one or more lines of business from the state, except pursuant to a plan that is approved by the state insurance regulator. The state insurance regulator may disapprove a plan that may lead to market disruption. We are subject to laws and regulations of this type, and these laws and regulations may restrict our ability to exit unprofitable markets.
Holding Company Regulation.
Nearly all states have enacted legislation that regulates insurance holding company systems. Each insurance company in a holding company system is required to register with the insurance regulator of its state of domicile and furnish information concerning the operations of companies within the holding company system that may materially affect the operations, management or financial condition of the insurers within the system. All transactions within a holding company system affecting an insurer must have fair and reasonable terms, the charges or fees for services performed must be reasonable, the insurer's total statutory surplus following any transaction must be both reasonable in relation to its outstanding liabilities and adequate for its needs, and are subject to other standards and requirements established by law and regulation. Notice to state insurance regulators is required prior to the consummation of certain affiliated and other transactions involving our insurance subsidiaries and such transactions may be disapproved by the state insurance regulators.
Pursuant to applicable insurance holding company laws, EICN is required to register with the Nevada DOI, ECIC is required to register with the California DOI, and EPIC and EAC are required to register with the Florida OIR. Additionally, EPIC and EAC are commercially domiciled in California and are required to register with the California DOI. Under these laws, the respective state insurance regulators may examine us at any time, require disclosure of material transactions and require prior notice for, or approval of, certain transactions.
Change of Control.
Our insurance subsidiaries are domiciled in Florida, California and Nevada. The insurance laws of these states generally require that any person seeking to acquire control of a domestic insurance company obtain the prior approval of the state's insurance commissioner. In Florida, "control" is generally presumed to exist through the direct or indirect ownership of 5% or more of the voting securities of a domestic insurance company or of any entity that controls a domestic insurance company. In California and Nevada, "control" is presumed to exist through the direct or indirect ownership of 10% or more of the voting securities of a domestic insurance company or of any entity that controls a domestic insurance company. In addition, insurance laws in many states in which we are licensed require pre-notification to the state's insurance commissioner of a change in control of a non-domestic insurance company licensed in those states.
Statutory Accounting and Solvency Regulations.
State insurance regulators closely monitor the financial condition of insurance companies reflected in financial statements based on SAP and can impose significant financial and operating restrictions on an
13
insurance company that becomes financially impaired under SAP guidelines. State insurance regulators can generally impose restrictions or conditions on the activities of a financially impaired insurance company, including: the transfer or disposition of assets; the withdrawal of funds from bank accounts; payment of dividends or other distributions; the extension of credit or the advancement of loans; and investments of funds, including business acquisitions or combinations.
Financial, Dividend, and Investment Restrictions.
State laws require insurance companies to maintain minimum levels of surplus and place limits on the amount of premiums a company may write based on the amount of that company's surplus. These limitations may restrict the rate at which our insurance operations can grow.
State laws also require insurance companies to establish reserves for payments of policyholder liabilities and impose restrictions on the kinds of assets in which insurance companies may invest. These restrictions may require us to invest in assets more conservatively than we would if we were not subject to state restrictions and may prevent us from obtaining as high a return on our assets as we might otherwise be able to realize absent the restrictions.
The ability of EHI to pay dividends on common stock, repurchase common stock, and to pay other expenses will be dependent to a significant extent upon the ability of our insurance subsidiaries (EICN, ECIC, EPIC, and EAC) to pay dividends to their immediate holding company, Employers Group, Inc. (EGI) and, in turn, the ability of EGI to pay dividends to EHI. On December 31, 2016, the legal structure of our insurance subsidiaries changed such that all four of our insurance subsidiaries are now wholly owned by EGI (ECIC is no longer a wholly owned subsidiary of EICN and EAC is no longer a wholly owned subsidiary of EPIC). This change in legal structure allows each of our insurance subsidiaries to pay dividends directly to EGI. Additional information regarding financial, dividend, and investment restrictions is set forth in Note
15
in the Notes to our Consolidated Financial Statements.
Insurance Assessments.
All of the states where our insurance subsidiaries are licensed to transact business require property and casualty insurers doing business within the state to pay various insurance assessments. We accrue a liability for estimated insurance assessments as direct premiums are written, losses are recorded, or as other events occur in accordance with various states' laws and regulations, and defer these costs and recognize them as an expense as the related premiums are earned. Various mechanisms exist in some of these states for assessed insurance companies to recover certain assessments. Additional information regarding insurance assessments is set forth in Note
12
in the Notes to our Consolidated Financial Statements.
Pooling Arrangements.
As a condition to conducting business in some states, insurance companies are required to participate in mandatory workers' compensation shared market mechanisms, or pooling arrangements, which provide workers' compensation insurance coverage to private businesses that are otherwise unable to obtain coverage.
The National Association of Insurance Commissioners (NAIC).
The NAIC is a group formed by state insurance regulators to discuss issues and formulate policy with respect to regulation, reporting, and accounting of and by U.S. insurance companies. Although the NAIC has no legislative authority and insurance companies are at all times subject to the laws of their respective domiciliary states and other states in which they conduct business, the NAIC is influential in determining the form in which insurance laws are enacted. Model Insurance Laws, Regulations, and Guidelines (Model Laws) have been promulgated by the NAIC as a minimum standard by which state regulatory systems and regulations are measured. Adoption of state laws that provide for substantially similar regulations to those described in the Model Laws is a requirement for accreditation of state insurance regulatory agencies by the NAIC.
Under the Model Laws, insurers are required to maintain minimum levels of capital based on their investments and operations. These risk-based capital (RBC) requirements provide a standard by which regulators can assess the adequacy of an insurance company's capital and surplus relative to its operations. An insurance company must maintain capital and surplus of at least 200% of the RBC computed by the NAIC's RBC model, known as the “Authorized Control Level” of RBC. At
December 31, 2017
, each of our insurance subsidiaries had total adjusted capital in excess of the minimum RBC requirements.
The key financial ratios of the NAIC's Insurance Regulatory Information System (IRIS) were developed to assist state regulators in overseeing the financial condition of insurance companies. These ratios are reviewed by financial examiners of the NAIC and state insurance regulators for the purposes of detecting financial distress and preventing insolvency and to select those companies that merit highest priority in the allocation of the regulators' resources. IRIS identifies 13 key financial ratios and specifies a “usual range” for each. Departure from the usual ranges on four or more of the ratios can lead to inquiries from individual state insurance regulators as to certain aspects of an insurer's business. None of our insurance subsidiaries is currently subject to any action by any state regulator with respect to IRIS ratios.
Investing in our common stock involves risks.
In evaluating our company, you should carefully consider the risks described below, together with all the information included or incorporated by reference in this report. The risks facing our company include, but are not limited to, those described below. Additional risks that we are not presently aware of or that we currently believe are immaterial may also impair our business operations. The occurrence of one or more of these events could significantly and adversely
14
affect our business, financial condition, results of operations, cash flows, and stock price, and you could lose all or part of your investment.
Our liability for losses and LAE is based on estimates and may be inadequate to cover our actual losses and expenses.
We must establish and maintain reserves for our estimated losses and LAE. We establish loss reserves in our financial statements that represent an estimate of amounts needed to pay and administer claims with respect to insured claims that have occurred, including claims that have occurred but have not yet been reported to us. Loss reserves are estimates of the ultimate cost of individual claims based on actuarial estimation techniques, are inherently uncertain, and do not represent an exact measure of liability. Any changes in these estimates could be material and could have an adverse effect on our results of operations and financial condition during the period the changes are made.
Several factors contribute to the inherent uncertainty in establishing estimated losses, including the length of time to settle long-term, severe cases, claim cost inflation (deflation) trends, and uncertainties in the long-term outcome of legislative reforms. Judgment is required in applying actuarial techniques to determine the relevance of historical payment and claim settlement patterns under current facts and circumstances. In certain states, we have a relatively short operating history and must rely on a combination of industry experience and our specific experience regarding claims emergence and payment patterns, medical cost inflation, and claim cost trends, adjusted for future anticipated changes in claims-related and economic trends, as well as regulatory and legislative changes, to establish our best estimate of reserves for losses and LAE. As we receive new information and update our assumptions over time regarding the ultimate liability, our loss reserves may prove to be inadequate to cover our actual losses, and we have in the past made, and may in the future make, adjustments to our reserves based on a number of factors.
The insurance business is subject to extensive regulation and legislative changes, which impact the manner in which we operate our business.
Our insurance business is subject to extensive regulation by the applicable state agencies in the jurisdictions in which we operate, most significantly by the insurance regulators in California, Florida, and Nevada, the states in which our insurance subsidiaries are domiciled. Changes in laws and regulations could have a significant negative impact on our business. As of
December 31, 2017
, more than one-half of our in-force premiums were generated in California. Accordingly, we are particularly affected by regulation in California.
More generally, insurance regulators have broad regulatory powers designed to protect policyholders and claimants, and not stockholders or other investors. Regulations vary from state to state, but typically address or include:
|
•
|
standards of solvency, including RBC measurements;
|
|
•
|
restrictions on the nature, quality, and concentration of investments;
|
|
•
|
restrictions on the types of terms that we can include in the insurance policies we offer;
|
|
•
|
mandates that may affect wage replacement and medical care benefits paid under the workers' compensation system;
|
|
•
|
requirements for the handling and reporting of claims and procedures for adjusting claims;
|
|
•
|
restrictions on the way rates are developed and premiums are determined;
|
|
•
|
the manner in which agents may be appointed;
|
|
•
|
establishment of liabilities for unearned premiums, unpaid losses and LAE;
|
|
•
|
limitations on our ability to transact business with affiliates;
|
|
•
|
mergers, acquisitions, and divestitures involving our insurance subsidiaries;
|
|
•
|
licensing requirements and approvals that affect our ability to do business;
|
|
•
|
compliance with all applicable privacy laws;
|
|
•
|
compliance with cyber-security laws and regulations;
|
|
•
|
potential assessments for the settlement of covered claims under insurance policies issued by impaired, insolvent, or failed insurance companies or other assessments imposed by regulatory agencies; and
|
|
•
|
the amount of dividends that our insurance subsidiaries may pay to EGI and, in turn, the ability of EGI to pay dividends to EHI.
|
Workers' compensation insurance is statutorily provided for in all of the states in which we do business. State laws and regulations specify the form and content of policy coverage and the rights and benefits that are available to injured workers, their representatives, and medical providers. In “administered pricing” states, insurance rates are set by the state insurance regulators and are adjusted periodically. Rate competition is generally not permitted in these states. Of the states in which we currently operate, Florida, Wisconsin, and Idaho are administered pricing states. Additionally, we are exposed to the risk that other states in which we operate will adopt administered pricing laws.
Legislation and regulation impact our ability to investigate fraud and other abuses of the workers' compensation system in the states in which we do business. Our relationships with medical providers are also impacted by legislation and regulation, including penalties for failure to make timely payments.
15
Federal legislation typically does not directly impact our workers' compensation business, but our business can be indirectly affected by changes in healthcare, occupational safety and health, and tax and financial regulations. Since healthcare costs are the largest component of our loss costs, we may be impacted by changes in healthcare legislation, such as the effects of the Affordable Care Act, or any modification thereof, which could affect healthcare costs and delivery in the future. There is also the possibility of federal regulation of insurance.
This extensive regulation of our business may affect the cost or demand for our products and may limit our ability to obtain rate increases or to take other actions that we might desire to maintain our profitability. In addition, we may be unable to maintain all required approvals or comply fully with applicable laws and regulations, or the relevant governmental authority's interpretation of such laws and regulations. If that were to occur, we might lose our ability to conduct business in certain jurisdictions. Further, changes in the level of regulation of the insurance industry or changes in laws or regulations or interpretations by regulatory authorities could impact our operations, require us to bear additional costs of compliance, and impact our profitability.
If we fail to price our insurance policies appropriately, our business competitiveness, financial condition, and results of operations could be materially adversely affected.
Premiums are based on the particular class of business and our estimates of expected losses and LAE and other expenses related to the policies we underwrite. We analyze many factors when pricing a policy, including the policyholder's prior loss history and industry classification. Inaccurate information regarding a policyholder's past claims experience or inaccurate estimates of expected losses and LAE could put us at risk for mispricing our policies, which could have a material adverse effect on our business, financial condition, and results of operations. For example, when initiating coverage on a policyholder, we must rely on the information provided by the policyholder, agent, or the policyholder's previous insurer(s) to properly estimate future claims expense. In order to set premium rates accurately, we must utilize an appropriate pricing model which correctly assesses risks based on their individual characteristics and takes into account actual and projected industry characteristics.
Our concentration in California ties our performance to the business, economic, demographic, natural perils, competitive, and regulatory conditions in that state.
Our business is concentrated in California, where we generated
56%
of our in-force premiums as of
December 31, 2017
. Accordingly, the loss environment and unfavorable business, economic, demographic, natural perils, competitive, and regulatory conditions in California could negatively impact our business.
Many California businesses are dependent on tourism revenues, which are, in turn, dependent on a robust economy. A downturn in the national economy or the economy of California, or any other event that causes deterioration in tourism, could adversely impact small businesses, such as restaurants, that we have targeted as customers. The departure from California or insolvency of a significant number of small businesses could also have a material adverse effect on our financial condition and results of operations. California is also exposed to climate and environmental changes, natural perils such as earthquakes, and susceptible to the possibility of pandemics or terrorist acts. Additionally, the workers' compensation industry has seen an increase in claims litigation in California. Because of the concentration of our business in California, we may be exposed to losses and business, economic, and regulatory risks or risk from natural perils that are greater than the risks associated with companies with greater geographic diversification.
We rely on independent insurance agents and brokers.
We market and sell our insurance products primarily through independent, non-exclusive insurance agents and brokers. These agents and brokers are not obligated to promote our products and can and do sell our competitors' products. In addition, these agents and brokers may find it easier to promote the broader range of programs of some of our competitors than to promote our single-line workers' compensation insurance products. The loss of a number of our independent agents and brokers or the failure or inability of these agents to successfully market our insurance programs could have a material adverse effect on our business, financial condition, and results of operations.
We rely on our relationship with our principal distribution partner.
We have an agreement with our principal distribution partner, ADP, to market and service our insurance products through its sales forces and insurance agencies. ADP generated
13.9%
of our total in-force premiums as of
December 31, 2017
. Our agreement with ADP is not exclusive, and ADP may terminate the agreement without cause upon a 120 day notice. The termination of this agreement, our failure to maintain a good relationship with ADP, or its failure to successfully market our products may materially reduce our revenues and could have a material adverse effect on our results of operations. In addition, we are subject to the risk that ADP may face financial difficulties, reputational issues, or problems with respect to its own products and services, any of which may lead to decreased sales of our products and services. Moreover, if ADP consolidates or aligns itself with another company or changes its products that are currently offered with our workers' compensation insurance products, we may lose business or suffer decreased revenues.
16
We are also subject to credit risk with respect to ADP, as it collects premiums on our behalf for the workers' compensation products that are marketed together with its own products. Any failure to remit such premiums to us or to remit such amounts on a timely basis could have an adverse effect on our results of operations.
A downgrade in our financial strength rating could reduce the amount of business that we are able to write or result in the termination of certain of our agreements with our strategic partners.
Rating agencies rate insurance companies based on financial strength as an indication of an ability to pay claims. Our insurance subsidiaries are currently assigned a group letter rating of “A-” (Excellent) by A.M. Best, with a “positive” outlook, which is the rating agency that we believe has the most influence on our business. This rating is assigned to companies that, in the opinion of A.M. Best, have demonstrated an excellent overall performance when compared to industry standards. A.M. Best considers “A-” (Excellent) rated companies to have an excellent ability to meet their ongoing obligations to policyholders. This rating does not refer to our ability to meet non-insurance obligations.
The financial strength ratings of A.M. Best and other rating agencies are subject to periodic review using, among other things, proprietary capital adequacy models, and are subject to revision or withdrawal at any time. Insurers' financial strength ratings are directed toward the concerns of policyholders and insurance agents and are not intended for the protection of investors or as a recommendation to buy, hold, or sell securities. Our competitive position relative to other companies is determined in part by our financial strength rating. A reduction in our A.M. Best rating could adversely affect the amount of business we could write, as well as our relationships with independent agents and brokers and our principal distribution partners, reinsurers, and other business partners.
A.M. Best may increase the frequency and scope of its reviews, and request additional information from the companies that it rates, including additional information regarding the valuation of investment securities held. We cannot predict what actions rating agencies may take, or what actions we may take in response to the actions of rating agencies.
If we are unable to obtain reinsurance or collect on ceded reinsurance, our ability to write new policies and to renew existing policies could be adversely affected and our financial condition and results of operations could be materially adversely affected.
At
December 31, 2017
, we had
$544.2 million
of reinsurance recoverables for paid and unpaid losses and LAE, of which
$7.2 million
was due to us on paid claims.
We purchase reinsurance to protect us against the costs of severe claims and catastrophic events, including natural perils and acts of terrorism, excluding nuclear, biological, chemical, and radiological events. On July 1,
2017
, we entered into a new reinsurance program that is effective through June 30,
2018
. The reinsurance program consists of one treaty covering excess of loss and catastrophic loss events in four layers of coverage. Our reinsurance coverage is
$190.0 million
in excess of our
$10.0 million
retention on a per occurrence basis, subject to certain exclusions.
The availability, amount, and cost of reinsurance depend on market conditions and our loss experience and may vary significantly. We cannot be certain that our reinsurance agreements will be renewed or replaced prior to their expiration with terms satisfactory to us. If we are unable to renew or replace our reinsurance agreements with terms satisfactory to us, our net liability on individual risks would increase and we would have greater exposure to large and catastrophic losses, which could have a material adverse effect on our financial condition and results of operations.
In addition, we are subject to credit risk with respect to our reinsurers, and they may refuse to pay or delay payment of losses we cede to them. We remain liable to our policyholders even if we are unable to make recoveries that we believe we are entitled to under our reinsurance contracts. Losses may not be recovered from our reinsurers until claims are paid and, in the case of long-term workers' compensation cases, the creditworthiness of our reinsurers may change before we can recover amounts that we are entitled to. The inability of any of our reinsurers to meet their financial obligations could have a material adverse effect on our financial condition and results of operations.
We obtained reinsurance covering the losses incurred prior to July 1, 1995, and we could be liable for all of those losses if the coverage provided by the LPT Agreement proves inadequate or we fail to collect from the reinsurers that are party to such transaction.
On January 1, 2000, EICN assumed all of the assets, liabilities, and operations of the Fund, including losses incurred by the Fund prior to such date. EICN also assumed the Fund's rights and obligations associated with the LPT Agreement that the Fund entered into with third party reinsurers with respect to its losses incurred prior to July 1, 1995. See “Item 1 -Business -Reinsurance -LPT Agreement.” The reinsurers under the LPT Agreement agreed to assume responsibility for the claims at the benefit levels which existed in June 1999. Accordingly, if the Nevada legislature were to increase the benefits payable for the pre-July 1, 1995 claims, we would be responsible for the increased benefit costs to the extent of the legislative increase.
We could be liable for some or all of those ceded losses if the coverage provided by the LPT Agreement proves inadequate or we fail to collect from the reinsurers party to such transaction. As of
December 31, 2017
, the estimated remaining liabilities subject to the LPT Agreement were
$438.9 million
. If we are unable to collect on these reinsurance recoverables, our financial condition
17
and results of operations could be materially adversely affected.
The LPT Agreement requires each reinsurer to place assets supporting the payment of claims by them in individual trusts that require that collateral be held at a specified level. The collateralization level must not be less than the outstanding reserve for losses and a loss expense allowance equal to 7% of estimated paid losses discounted at a rate of 6%. If the assets held in trust fall below this threshold, we can require the reinsurers to contribute additional assets to maintain the required minimum level. The value of these assets at
December 31, 2017
was
$380.8 million
. If the value of the collateral in the trusts drops below the required minimum level and the reinsurers are unable to contribute additional assets, we could be responsible for substituting a new reinsurer or paying those claims without the benefit of reinsurance. One of the reinsurers has collateralized its obligations under the LPT Agreement by placing shares of stock of a publicly held corporation in a trust. The other reinsurers have placed U.S. treasury and fixed maturity securities in trusts to collateralize their obligations to us. The value of this collateral is subject to market fluctuations.
The LPT Agreement provides us with the ability to commute any contract with the reinsurers to the LPT Agreement if the credit rating of any such reinsurer were to fall below “A-” (Excellent) as determined by A.M. Best.
Intense competition and the fact that we write only a single line of insurance could adversely affect our ability to sell policies at rates we deem adequate.
The market for workers' compensation insurance products is highly competitive. Competition in our business is based on many factors, including premiums charged, services provided, financial ratings assigned by independent rating agencies, speed of claims payments, reputation, policyholder dividends, perceived financial strength, and general experience. In some cases, our competitors offer lower priced products than we do. If our competitors offer more competitive premiums, policyholder dividends, or payment plans, services or commissions to independent agents, brokers, and other distributors, we could lose market share, have to reduce our premium rates, or increase commission rates, which could adversely affect our profitability. We compete with regional and national insurance companies, professional employer organizations, third-party administrators, self-insured employers, and state insurance funds. Our main competitors vary from state to state, but are usually those companies that offer a full range of services in underwriting, loss control, and claims. We compete on the basis of the services that we offer to our policyholders and on ease of doing business rather than solely on price.
Many of our competitors are significantly larger and possess greater financial, marketing, and management resources than we do. Some of our competitors benefit financially by not being subject to federal income tax. Intense competitive pressure on prices can result from the actions of even a single large competitor. Competitors with more surplus than us have the potential to expand in our markets more quickly than we can. Greater financial resources also permit an insurer to gain market share through more competitive pricing, even if that pricing results in reduced underwriting margins or an underwriting loss.
Many of our competitors are multi-line carriers that can price the workers' compensation insurance they offer at a loss in order to obtain other lines of business at a profit. This creates a competitive disadvantage for us, as we only offer a single line of insurance. For example, a business may find it more efficient or less expensive to purchase multiple lines of commercial insurance coverage from a single carrier.
The property and casualty insurance industry is cyclical in nature and is characterized by periods of so-called “soft” market conditions, in which premium rates are stable or falling, insurance is readily available, and insurers' profits decline, and by periods of so-called “hard” market conditions, in which rates rise, insurance may be more difficult to find, and insurers' profits increase. According to the Insurance Information Institute, since 1970, the property and casualty insurance industry experienced hard market conditions from 1975 to 1978, 1984 to 1987, and 2001 to 2004. Although the financial performance of an individual insurance company is dependent on its own specific business characteristics, the profitability of most workers' compensation insurance companies generally tends to follow this cyclical market pattern. We believe the workers' compensation industry currently has excess underwriting capacity resulting in lower rate levels and smaller profit margins. We continue to experience price competition in our target markets.
Because of cyclicality in the workers' compensation market, due in large part to competition, capacity, and general economic factors, we cannot predict the timing or duration of changes in the market cycle. This cyclical pattern has in the past and could in the future adversely affect our financial condition and results of operations. If we are unable to compete effectively, our business, financial condition, and results of operations could be materially adversely affected.
We may be unable to realize our investment objectives and economic conditions in the financial markets could lead to investment losses.
Investment income is an important component of our revenue and net income. Our investment portfolio is managed by an independent asset manager that operates under investment guidelines approved by our Board of Directors. Although these guidelines stress diversification and capital preservation, our investments are subject to a variety of risks that are beyond our control, including risks related to general economic conditions, interest rate fluctuations, and market volatility. Interest rates are highly sensitive to many factors, including governmental monetary policies and domestic and international economic and political conditions. These and other factors affect the capital markets and, consequently, the value of our investment portfolio.
18
We are exposed to significant financial risks related to the capital markets, including the risk of potential economic loss principally arising from adverse changes in the fair value of financial instruments. The major components of market risk affecting us are interest rate risk, credit risk, and equity price risk. For more information regarding market risk, see "Item 7A–Quantitative and Qualitative Disclosures About Market Risk."
The outlook for our investment income is dependent on the future direction of interest rates, maturity schedules, and cash flow from operations that is available for investment. The fair values of fixed maturity securities that are “available-for-sale” fluctuate with changes in interest rates and cause fluctuations in our stockholders' equity. Any significant decline in our investment income or the value of our investments as a result of changes in interest rates, deterioration in the credit of companies or municipalities in which we have invested, decreased dividend payments, general market conditions, or events that have an adverse impact on any particular industry or geographic region in which we hold significant investments could have an adverse effect on our net income and, as a result, on our stockholders' equity and policyholder surplus.
The valuation of our investments, including the determination of the amount of impairments, includes estimates and assumptions and could result in changes to investment valuations that may adversely affect our financial condition and results of operations. We are required to measure equity securities at fair value with changes in fair value recognized in net income, which causes increased volatility in our results of operations. Equity securities represented
7.9%
of our total investment portfolio as of
December 31, 2017
. The use of internally developed valuation techniques may have a material effect on the estimated fair value amounts of our investments and our financial condition.
Additionally, we regularly review our entire investment portfolio, including the identification of other-than-temporary declines in fair value. The determination of the amount of impairments taken on our investments is based on our periodic evaluation and assessment of our investments and known and inherent risks associated with the various asset classes. There can be no assurance that we have accurately determined the level of other-than-temporary impairments reflected in our financial statements and additional impairments may need to be taken in the future. Historical trends may not be indicative of future impairments.
We may require additional capital in the future, which may not be available to us or may be available only on unfavorable terms.
Our future capital requirements will depend on many factors, including state regulatory requirements, our ability to write new business successfully, and to establish premium rates and reserves at levels sufficient to cover losses. If we have to raise additional capital, equity or debt financing may not be available on terms that are favorable to us. In the case of equity financings, there could be dilution to our stockholders and the securities may have rights, preferences, and privileges senior to our common stock. In the case of debt financings, we may be subject to covenants that restrict our ability to freely operate our business. If we cannot obtain adequate capital on favorable terms or at all, we may be unable to implement our future growth or operating plans and our business, financial condition, and results of operations could be materially adversely affected.
The capital and credit markets continue to experience volatility and disruption that could negatively affect market liquidity. These conditions could produce downward pressure on stock prices and limit the availability of credit for certain issuers without regard to those issuers' underlying financial strength. In addition, we could be forced to delay raising capital or be unable to raise capital on favorable terms, or at all, which could decrease our profitability, significantly reduce our financial flexibility, and cause rating agencies to reevaluate our financial strength ratings.
We are a holding company with no direct operations. We depend on the ability of our subsidiaries to transfer funds to us to meet our obligations, and our insurance subsidiaries' ability to pay dividends to us is restricted by law.
EHI is a holding company that transacts substantially all of its business through operating subsidiaries. Its primary assets are the shares of stock of our insurance subsidiaries. The ability of EHI to meet its operating and financing cash needs depends on the surplus and earnings of our subsidiaries, and upon the ability of our insurance subsidiaries to pay dividends to EGI and, in turn, the ability of EGI to pay dividends to EHI.
Payments of dividends by our insurance subsidiaries are restricted by state insurance laws, including laws establishing minimum solvency and liquidity thresholds, and could be subject to contractual restrictions in the future, including those imposed by indebtedness we may incur in the future. As a result, we may not be able to receive dividends from these subsidiaries and we may not receive dividends in the amounts necessary to meet our obligations or to pay dividends on our common stock.
A failure to effectively maintain, enhance and modernize our information technology systems could adversely affect our business.
Our success depends on our ability to maintain effective information technology systems, to enhance those systems to better support our business in an efficient and cost-effective manner and to develop new technologies and capabilities in pursuit of our long-term strategy. We have recently launched an initiative that is focused on developing new technologies and capabilities and enhancing our information technology infrastructure. If we fail to maintain or enhance our existing information technology systems or if we were to experience failure in developing and implementing new technologies, our relationships, ability to do business
19
with our clients and/or our competitive position may be adversely affected. We could also experience other adverse consequences, including additional costs or write-offs of capitalized costs, unfavorable underwriting and reserving decisions, internal control deficiencies and information security breaches resulting in loss or inappropriate disclosure of data. In addition, our system development initiatives may be more costly or time-consuming than anticipated and/or may not deliver the expected benefits upon completion.
We rely on our information technology and telecommunication systems, and the failure of these systems or cyber attacks on our systems could materially and adversely affect our business.
Our business is highly dependent upon the successful and uninterrupted functioning of our information technology and telecommunications systems. We rely on these systems to process new and renewal business, provide customer service, administer and make payments on claims, facilitate collections, and automatically underwrite and administer the policies we write. The failure of any of our systems could interrupt our operations or materially impact our ability to evaluate and write new business. Our information technology and telecommunications systems interface with and depend on third-party systems, and we could experience service denials if demand for such services exceeds capacity or such third-party systems fail or experience interruptions.
Certain events outside of our control, including cyber attacks on our systems, could render our systems inoperable such that we would be unable to service our agents, insureds, and injured workers, or meet certain regulatory requirements. If such an event were to occur and our systems were unable to be restored or secured within a reasonable timeframe, our business, financial condition, and results of operations could be adversely affected. Additionally, cyber attacks resulting in a breach of security could jeopardize the privacy, confidentiality, and integrity of our data or our customers' data, which could harm our reputation and expose us to possible liability.
Acts of terrorism and natural or man-made catastrophes could materially adversely impact our financial condition and results of operations.
Under our workers' compensation policies and applicable laws in the states in which we operate, we are required to provide workers' compensation benefits for losses arising from acts of terrorism. The impact of any terrorist act is unpredictable, and the ultimate impact on us would depend upon the nature, extent, location, and timing of such an act. We would be particularly adversely affected by a terrorist act affecting any metropolitan area where our policyholders have a large concentration of workers.
Notwithstanding the protection provided by the reinsurance we have purchased and any protection provided by the 2002 Act, or its extension, TRIPRA of 2015, the risk of severe losses to us from acts of terrorism has not been eliminated because our excess of loss reinsurance treaty program contains various sub-limits and exclusions limiting our reinsurers' obligation to cover losses caused by acts of terrorism. Our excess of loss reinsurance treaties do not protect against nuclear, biological, chemical, or radiological events. If such an event were to impact one or more of the businesses we insure, we would be entirely responsible for any workers' compensation claims arising out of such event, subject to the terms of the 2002 Act and TRIPRA of 2015 and could suffer substantial losses as a result.
Our operations also expose us to claims arising out of natural or man-made catastrophes because we may be required to pay benefits to workers who are injured in the workplace as a result of a catastrophe. Catastrophes can be caused by various unpredictable events, either natural or man-made. Any catastrophe occurring in the communities in which we operate or that have significant impacts on one or more of our targeted classes of business could expose us to potentially substantial losses and, accordingly, could have a material adverse effect on our financial condition and results of operations.
Administrative proceedings or legal actions involving our insurance subsidiaries could have a material adverse effect on our business, financial condition and results of operations.
Our insurance subsidiaries are involved in various administrative proceedings and legal actions in the normal course of their business. Our subsidiaries have responded to such actions and intend to defend these claims. These claims concern issues including eligibility for workers' compensation insurance coverage or benefits, the extent of injuries, wage determinations, disability ratings, and bad faith and extra-contractual liability. Adverse decisions in multiple administrative proceedings or legal actions could require us to pay significant amounts in the aggregate or to change the manner in which we administer claims, which could have a material adverse effect on our financial condition and results of operations.
Our business is largely dependent on the efforts of our management because of its industry expertise, knowledge of our markets, and relationships with the independent agents and brokers that sell our products.
Our success depends in substantial part upon our ability to attract and retain qualified executive officers, experienced underwriting and claims personnel, and other skilled employees who are knowledgeable about our business. The current success of our business is dependent in significant part on the efforts of our executive officers. Many of our regional and local officers are also important to our operations because of their industry expertise, knowledge of our markets, and relationships with the independent agents and brokers who sell our products. We have entered into employment agreements with certain of our key executives. Currently, we maintain key man life insurance for our Chief Executive Officer. If we were to lose the services of members of our management
20
team or key regional or local officers, we may be unable to find replacements satisfactory to us and our business. As a result, our operations may be disrupted and our financial performance and results of operations may be adversely affected.
Assessments and other surcharges for guaranty funds, second injury funds, and other mandatory pooling arrangements may reduce our profitability.
All states require insurance companies licensed to do business in their state to bear a portion of the unfunded obligations of insolvent insurance companies. These obligations are funded by assessments that can be expected to continue in the future in the states in which we operate. Many states also have laws that establish second injury funds to provide compensation to injured employees for aggravation of a prior condition or injury, which are funded by either assessments based on paid losses or premium. In addition, as a condition to the ability to conduct business in some states, insurance companies are required to participate in mandatory workers' compensation shared market mechanisms or pooling arrangements, which provide workers' compensation insurance coverage from private insurers. The effect of these assessments and mandatory shared market mechanisms or changes in them could reduce our profitability in any given period or limit our ability to grow our business.
State insurance laws, certain provisions of our charter documents, and Nevada corporation law could prevent or delay a change of control that could be beneficial to us and our stockholders.
Our insurance subsidiaries are domiciled in Florida, California, and Nevada. The insurance laws of these states generally require that any person seeking to acquire control of a domestic insurance company obtain the prior approval of the state's insurance commissioner. In Florida, "control" is generally presumed to exist through the direct or indirect ownership of 5% or more of the voting securities of a domestic insurance company or of any entity that controls a domestic insurance company. In California and Nevada, "control" is presumed to exist through the direct or indirect ownership of 10% or more of the voting securities of a domestic insurance company or of any entity that controls a domestic insurance company. In addition, insurance laws in many states in which we are licensed require pre-notification to the state's insurance commissioner of a change in control of a non-domestic insurance company licensed in those states. Because we have insurance subsidiaries domiciled in Florida, California, and Nevada, any transaction that would constitute a change in control of us would generally require the party acquiring control to obtain the prior approval of the insurance commissioners of these states and may require pre-notification of the change of control in these or other states in which we are licensed to transact business. The time required to obtain these approvals may result in a material delay of, or deter, any such transaction. These laws may discourage potential acquisition proposals or tender offers, and may delay, deter, or prevent a change of control, even if the acquisition proposal or tender offer is favorable to our stockholders.
Provisions of our amended and restated articles of incorporation and amended and restated by-laws could discourage, delay, or prevent a merger, acquisition, or other change in control of us, even if our stockholders might consider such a change in control to be favorable. These provisions could also discourage proxy contests and make it more difficult for stockholders to elect Directors and take other corporate actions. In particular, our amended and restated articles of incorporation and amended and restated by-laws currently include provisions:
|
•
|
dividing our Board of Directors into three classes;
|
|
•
|
eliminating the ability of our stockholders to call special meetings of stockholders;
|
|
•
|
permitting our Board of Directors to issue preferred stock in one or more series;
|
|
•
|
imposing advance notice requirements for nominations for election to our Board of Directors or for proposing matters that can be acted upon by stockholders at the stockholder meetings;
|
|
•
|
prohibiting stockholder action by written consent, thereby limiting stockholder action to that taken at an annual or special meeting of our stockholders; and
|
|
•
|
providing our Board of Directors with exclusive authority to adopt or amend our by-laws.
|
These provisions may make it difficult for stockholders to replace Directors and could have the effect of discouraging a future takeover attempt that is not approved by our Board of Directors, but which stockholders might consider favorable. Additionally, these provisions could limit the price that investors are willing to pay in the future for shares of our common stock.
Federal corporate tax reform considerations.
On December 22, 2017, the Tax Cuts and Jobs Act was enacted (Enactment), which significantly revised U.S. corporate income tax law by, among other things, reducing the corporate statutory income tax rate from 35% to 21%, beginning January 1, 2018. This reduction in the corporate statutory income tax rate required us to re-evaluate certain of our deferred tax assets and liabilities, as of the date of Enactment, to reflect the revised income tax rates applicable to future periods.
We were required to base certain of our income tax estimates and assumptions on incomplete information and/or preliminary interpretations of the effects of Enactment. As a result, we may need to reflect further adjustments to our deferred tax assets and liabilities recorded as of December 31, 2017 in future periods upon obtaining, preparing, or analyzing additional information about facts and circumstances that existed as of that date that, if known at that time, would have affected the income tax effects initially reported.
21
None.
As of February 1,
2018
, we leased
205,901
square feet of office space in
6
states, including our principal executive offices located in Reno, Nevada. We believe that our existing office space is adequate for our current needs. We will continue to enter into or exit lease agreements to address future space requirements, as necessary.
From time to time, we are involved in pending and threatened litigation in the normal course of business in which claims for monetary damages are asserted and/or insurance or reinsurance coverage is disputed.
Expected or actual reductions in our reinsurance recoveries due to reinsurance coverage disputes (as opposed to a reinsurer’s inability to pay) are not recorded as an uncollectible reinsurance recoverable. Rather, they are factored into the determination of, and are reflected in, our net loss and LAE reserves.
In the opinion of management, the ultimate liability, if any, arising from such pending or threatened litigation is not expected to have a material effect on our result of operations, liquidity, or financial position.
Not applicable.
22
Market Information, Holders, and Stockholder Dividends
Our common stock is listed on the New York Stock Exchange (NYSE) under the symbol “EIG.” There were
937
registered holders of record as of
February 15, 2018
. The high and low New York Stock Exchange sales prices and cash dividends declared per share of our common stock for the last two fiscal years were as follows:
|
2017
|
2016
|
|||||||||||||||||||||||
|
Stock Price
|
Cash Dividends Declared
|
Stock Price
|
Cash Dividends Declared
|
|||||||||||||||||||||
|
Quarter Ended
|
High
|
Low
|
High
|
Low
|
||||||||||||||||||||
|
March 31
|
$
|
40.55
|
|
$
|
35.60
|
|
$
|
0.15
|
|
$
|
29.21
|
|
$
|
22.58
|
|
$
|
0.09
|
|
||||||
|
June 30
|
43.55
|
|
36.50
|
|
0.15
|
|
30.53
|
|
27.07
|
|
0.09
|
|
||||||||||||
|
September 30
|
45.90
|
|
38.70
|
|
0.15
|
|
32.03
|
|
27.01
|
|
0.09
|
|
||||||||||||
|
December 31
|
50.45
|
|
44.35
|
|
0.15
|
|
39.75
|
|
29.25
|
|
0.09
|
|
||||||||||||
We currently expect that quarterly cash dividends will continue to be declared and paid to our stockholders in the future; however, any determination to declare and pay additional or future dividends will be at the discretion of our Board of Directors and will be dependent upon:
|
•
|
the surplus and earnings of our subsidiaries and their ability to pay dividends and/or other statutorily permissible payments to their parent;
|
|
•
|
our results of operations and cash flows;
|
|
•
|
our financial position and capital requirements;
|
|
•
|
general business conditions;
|
|
•
|
any legal, tax, regulatory, and/or contractual restrictions on the payment of dividends; and
|
|
•
|
any other factors our Board of Directors deems relevant.
|
Issuer Purchases of Equity Securities
The following table provides information with respect to the Company's repurchases of its common stock during the quarter ended
December 31, 2017
:
|
Period
|
Total Number of Shares Purchased
|
Average
Price Paid
Per Share
(1)
|
Total Number of Shares Purchased as Part of Publicly Announced Program
|
Approximate
Dollar Value of Shares that
May Yet be Purchased Under the Program
(2)
|
||||||||||
|
|
|
|
|
(in millions)
|
||||||||||
|
October 1 – October 31, 2017
|
—
|
|
$
|
—
|
|
—
|
|
$
|
28.9
|
|
||||
|
November 1 – November 30, 2017
|
—
|
|
—
|
|
—
|
|
28.9
|
|
||||||
|
December 1 – December 31, 2017
|
—
|
|
—
|
|
—
|
|
28.9
|
|
||||||
|
Total
|
—
|
|
$
|
—
|
|
—
|
|
|
|
|||||
|
(1)
|
Includes fees and commissions paid on stock repurchases.
|
|
(2)
|
On February 16, 2016, the Board of Directors authorized a share repurchase program for repurchases of up to $50.0 million of the Company's common stock (the 2016 Program). The 2016 Program provided that shares may be purchased at prevailing market prices through a variety of methods, including open market or private transactions, in accordance with applicable laws and regulations and as determined by management. The timing and actual number of shares repurchased depended on a variety of factors, including the share price, corporate and regulatory requirements, and other market and economic conditions. The 2016 Program expired on February 22, 2018.
|
On February 21, 2018, the Board of Directors authorized a share repurchase program for repurchases of up to $50.0 million of the Company's common stock (the 2018 Program). The 2018 Program provides that shares may be purchased at prevailing market prices from February 26, 2018 through February 26, 2020 through a variety of methods, including open market or private transactions, in accordance with applicable laws and regulations and as determined by management. The timing and actual number of shares that may be repurchased will depend on a variety of factors, including the share price, corporate and regulatory
23
requirements, and other market and economic conditions. Repurchases under the 2018 Program may be commenced, modified, or suspended from time to time without prior notice, and the program may be suspended or discontinued at any time.
Performance Graph
The following information compares the cumulative total return on $100 invested in the common stock of EHI, ticker symbol EIG, for the period commencing at the close of market on December 31, 2012 and ending on
December 31, 2017
with the cumulative total return on $100 invested in each of the Standard and Poor's (S&P) 500 Index (S&P 500) and the Standard and Poor's 500 Property-Casualty Insurance Index (S&P P&C Insurance Index). The calculation of cumulative total return assumes the reinvestment of dividends. The following graph and related information shall not be deemed to be “soliciting material” or to be “filed” with the SEC, nor shall such information be incorporated by reference into any filing pursuant to the Securities Act of 1933 or the Securities Exchange Act of 1934, except to the extent that we specifically incorporate it by reference into such filing.
Employers Holdings, Inc.
Cumulative Total Return Performance
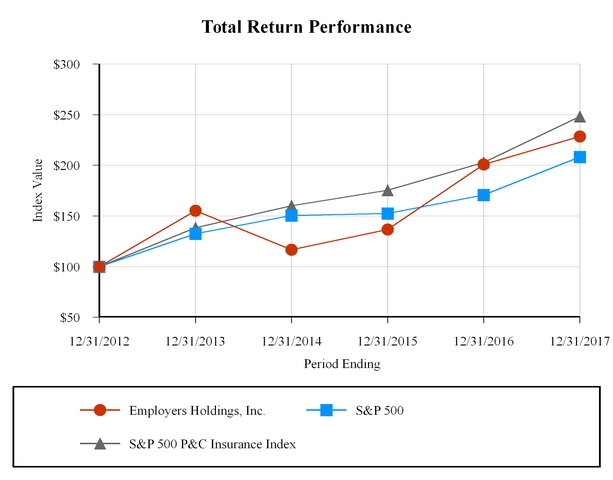
|
Period Ending
|
|||||||||||||||||||||||
|
12/31/2012
|
12/31/2013
|
12/31/2014
|
12/31/2015
|
12/31/2016
|
12/31/2017
|
||||||||||||||||||
|
Employers Holdings, Inc.
|
$
|
100.00
|
|
$
|
155.21
|
|
$
|
116.61
|
|
$
|
136.71
|
|
$
|
200.78
|
|
$
|
228.35
|
|
|||||
|
S&P 500
|
100.00
|
|
132.39
|
|
150.51
|
|
152.59
|
|
170.84
|
|
208.14
|
|
|||||||||||
|
S&P 500 P&C Insurance Index
|
100.00
|
|
138.29
|
|
160.06
|
|
175.32
|
|
202.85
|
|
248.26
|
|
|||||||||||
24
The following selected historical consolidated financial data should be read in conjunction with ''Item 7–Management's Discussion and Analysis of Consolidated Financial Condition and Results of Operations'' and the consolidated financial statements and related notes included elsewhere in this Annual Report on Form 10-K.
|
Years Ended December 31,
|
|||||||||||||||||||
|
2017
|
2016
|
2015
|
2014
|
2013
|
|||||||||||||||
|
Income Statement Data
|
(in millions, except per share amounts and ratios)
|
||||||||||||||||||
|
Revenues:
|
|||||||||||||||||||
|
Net premiums earned
|
$
|
716.5
|
|
$
|
694.8
|
|
$
|
690.4
|
|
$
|
684.5
|
|
$
|
642.3
|
|
||||
|
Net investment income
|
74.6
|
|
73.2
|
|
72.2
|
|
72.4
|
|
70.8
|
|
|||||||||
|
Net realized gains (losses) on investments
|
7.4
|
|
11.2
|
|
(10.7
|
)
|
16.3
|
|
9.5
|
|
|||||||||
|
Gain on redemption of notes payable
|
2.1
|
|
—
|
|
—
|
|
—
|
|
—
|
|
|||||||||
|
Other income
|
0.8
|
|
0.6
|
|
0.2
|
|
0.3
|
|
0.9
|
|
|||||||||
|
Total revenues
|
801.4
|
|
779.8
|
|
752.1
|
|
773.5
|
|
723.5
|
|
|||||||||
|
Total expenses
|
657.4
|
|
639.1
|
|
652.7
|
|
666.9
|
|
670.4
|
|
|||||||||
|
Net income before income taxes
|
144.0
|
|
140.7
|
|
99.4
|
|
106.6
|
|
53.1
|
|
|||||||||
|
Income tax expense (benefit)
|
42.8
|
|
34.0
|
|
5.0
|
|
5.9
|
|
(10.7
|
)
|
|||||||||
|
Net income
|
$
|
101.2
|
|
$
|
106.7
|
|
$
|
94.4
|
|
$
|
100.7
|
|
$
|
63.8
|
|
||||
|
Earnings per common share:
|
|||||||||||||||||||
|
Basic
|
$
|
3.11
|
|
$
|
3.29
|
|
$
|
2.94
|
|
$
|
3.19
|
|
$
|
2.05
|
|
||||
|
Diluted
|
3.06
|
|
3.24
|
|
2.90
|
|
3.14
|
|
2.00
|
|
|||||||||
|
Selected Operating Data
|
|||||||||||||||||||
|
Gross premiums written
(1)
|
$
|
729.7
|
|
$
|
701.4
|
|
$
|
697.7
|
|
$
|
697.7
|
|
$
|
689.9
|
|
||||
|
Net premiums written
(2)
|
$
|
723.7
|
|
$
|
694.6
|
|
$
|
689.3
|
|
$
|
687.6
|
|
$
|
678.5
|
|
||||
|
Net income before impact of the LPT Agreement
(3)(4)(5)
|
$
|
89.6
|
|
$
|
90.1
|
|
$
|
74.0
|
|
$
|
45.7
|
|
$
|
25.9
|
|
||||
|
Earnings per common share before impact of the LPT Agreement
(5)
|
|||||||||||||||||||
|
Basic
|
$
|
2.76
|
|
$
|
2.78
|
|
$
|
2.31
|
|
$
|
1.45
|
|
0.83
|
|
|||||
|
Diluted
|
2.71
|
|
2.73
|
|
2.27
|
|
1.43
|
|
0.81
|
|
|||||||||
|
Cash dividends declared per common share
|
0.60
|
|
0.36
|
|
0.24
|
|
0.24
|
|
0.24
|
|
|||||||||
|
As of December 31,
|
|||||||||||||||||||
|
2017
|
2016
|
2015
|
2014
|
2013
|
|||||||||||||||
|
Balance Sheet Data
|
(in millions)
|
||||||||||||||||||
|
Cash and cash equivalents
|
$
|
73.3
|
|
$
|
67.2
|
|
$
|
56.6
|
|
$
|
103.6
|
|
$
|
34.5
|
|
||||
|
Total investments
|
2,677.7
|
|
2,552.6
|
|
2,487.2
|
|
2,448.4
|
|
2,344.8
|
|
|||||||||
|
Reinsurance recoverable on paid and unpaid losses
|
544.2
|
|
588.7
|
|
635.9
|
|
680.2
|
|
751.1
|
|
|||||||||
|
Total assets
|
3,840.1
|
|
3,773.4
|
|
3,755.8
|
|
3,769.7
|
|
3,643.5
|
|
|||||||||
|
Unpaid losses and loss adjustment expense
|
2,266.1
|
|
2,301.0
|
|
2,347.5
|
|
2,369.7
|
|
2,330.5
|
|
|||||||||
|
Unearned premiums
|
318.3
|
|
310.3
|
|
308.9
|
|
310.8
|
|
304.0
|
|
|||||||||
|
Deferred reinsurance gain–LPT Agreement
(3)(4)
|
163.6
|
|
174.9
|
|
189.5
|
|
207.0
|
|
249.1
|
|
|||||||||
|
Notes payable
|
20.0
|
|
32.0
|
|
32.0
|
|
92.0
|
|
102.0
|
|
|||||||||
|
Total liabilities
|
2,892.4
|
|
2,932.8
|
|
2,995.0
|
|
3,082.9
|
|
3,074.8
|
|
|||||||||
|
Total stockholders' equity
|
947.7
|
|
840.6
|
|
760.8
|
|
686.8
|
|
568.7
|
|
|||||||||
|
Other Financial Data
|
|||||||||||||||||||
|
Total stockholders' equity including deferred reinsurance gain–LPT Agreement
(3)(4)(6)
|
$
|
1,111.3
|
|
$
|
1,015.5
|
|
$
|
950.3
|
|
$
|
893.8
|
|
$
|
817.8
|
|
||||
|
(1)
|
Gross premiums written is the sum of direct premiums written and assumed premiums written before the effect of ceded reinsurance. Direct premiums written are the premiums on all policies our insurance subsidiaries have issued during the year. Assumed premiums written are premiums that our insurance subsidiaries have received from any authorized state-mandated pools.
|
|
(2)
|
Net premiums written is the sum of direct premiums written and assumed premiums written less ceded premiums written. Ceded premiums written is the portion of direct premiums written that we cede to our reinsurers under our reinsurance contracts. (See Note
10
in the Notes to our Consolidated Financial Statements.)
|
|
(3)
|
In connection with our January 1, 2000 assumption of the assets, liabilities and operations of the Fund, EICN assumed the Fund's rights and obligations associated with the LPT Agreement, a retroactive 100% quota share reinsurance agreement with third party reinsurers, which substantially reduced our exposure to losses for pre-July 1, 1995 Nevada insured risks. Pursuant to the LPT Agreement, the Fund
|
25
initially ceded $1.5 billion in liabilities for incurred but unpaid losses and LAE, which represented substantially all of the Fund's outstanding losses as of June 30, 1999 for claims with original dates of injury prior to July 1, 1995.
|
(4)
|
Deferred reinsurance gain–LPT Agreement reflects the unamortized gain from our LPT Agreement. Under GAAP, this gain is deferred and is being amortized using the recovery method. Amortization is determined by the proportion of actual reinsurance recoveries to total estimated recoveries over the life of the LPT Agreement, except for the contingent profit commission, which is amortized through June 30, 2024. The amortization is reflected in losses and LAE. We periodically reevaluate the remaining direct reserves subject to the LPT Agreement and the expected losses and LAE subject to the contingent profit commission under the LPT Agreement. Our reevaluations result in corresponding adjustments, if needed, to reserves, ceded reserves, contingent commission receivable, and the Deferred Gain, with the net effect being an increase or decrease, as the case may be, to net income.
|
|
(5)
|
We define net income before impact of the LPT Agreement as net income before the impact of: (a) amortization of the Deferred Gain; (b) adjustments to the LPT Agreement ceded reserves; and (c) adjustments to Contingent commission receivable–LPT Agreement. These are not measurements of financial performance under GAAP, but rather reflect the difference in accounting treatment between SAP and GAAP, and should not be considered in isolation or as an alternative to any other measure of performance derived in accordance with GAAP.
|
We present net income before impact of the LPT Agreement because we believe that it is an important supplemental measure of our ongoing operating performance. This measure is used by analysts, investors, and other interested parties in evaluating us.
The LPT Agreement was a non-recurring transaction which does not affect our ongoing operations and consequently we believe these presentations are useful in providing a meaningful understanding of our operating performance. In addition, we believe these non-GAAP measures, as we have defined them, are helpful to our management in identifying trends in our performance because the items excluded have limited significance to our current and ongoing operations.
The table below shows the reconciliation of net income to net income before impact of the LPT Agreement for the periods presented:
|
Years Ended December 31,
|
|||||||||||||||||||
|
2017
|
2016
|
2015
|
2014
|
2013
|
|||||||||||||||
|
(in millions)
|
|||||||||||||||||||
|
Net income
|
$
|
101.2
|
|
$
|
106.7
|
|
$
|
94.4
|
|
$
|
100.7
|
|
$
|
63.8
|
|
||||
|
Less amortization of the Deferred Gain related to losses
|
9.3
|
|
9.7
|
|
9.5
|
|
11.2
|
|
12.9
|
|
|||||||||
|
Less amortization of the Deferred Gain related to contingent commission
|
2.0
|
|
2.0
|
|
1.9
|
|
1.9
|
|
1.7
|
|
|||||||||
|
Less impact of LPT Reserve Adjustments
(a)
|
—
|
|
3.1
|
|
6.4
|
|
31.1
|
|
19.0
|
|
|||||||||
|
Less impact of LPT Contingent Commission Adjustments
(b)
|
0.3
|
|
1.8
|
|
2.6
|
|
10.8
|
|
4.3
|
|
|||||||||
|
Net income before impact of the LPT Agreement
|
$
|
89.6
|
|
$
|
90.1
|
|
$
|
74.0
|
|
$
|
45.7
|
|
$
|
25.9
|
|
||||
|
(a)
|
Any adjustment to the estimated reserves ceded under the LPT Agreement results in a cumulative adjustment to the Deferred Gain, which is also included in losses and LAE incurred in the Consolidated Statements of Comprehensive Income, such that the Deferred Gain reflects the balance that would have existed had the revised reserves been recognized at the inception of the LPT Agreement (LPT Reserve Adjustment). (See Note
2
in the Notes to our Consolidated Financial Statements.)
|
|
(b)
|
Any adjustment to the contingent profit commission under the LPT Agreement results in a cumulative adjustment to the Deferred Gain, which is also recognized in losses and LAE incurred in our Consolidated Statements of Comprehensive Income, such that the Deferred Gain reflects the balance that would have existed had the revised contingent profit commission been recognized at the inception of the LPT Agreement (LPT Contingent Commission Adjustment). (See Note
2
in the Notes to our Consolidated Financial Statements.)
|
|
(6)
|
We define Total stockholders' equity including the Deferred Gain as total stockholders' equity plus the Deferred Gain. Total stockholders' equity including the Deferred Gain is not a measurement of financial position under GAAP and should not be considered in isolation or as an alternative to Total stockholders' equity or any other measure of financial health derived in accordance with GAAP.
|
We present Total stockholders' equity including the Deferred Gain because we believe that it is an important supplemental measure of financial position to be used by analysts, investors, and other interested parties in evaluating us. Furthermore, the LPT Agreement is a non-recurring transaction and the treatment of the Deferred Gain does not result in ongoing cash benefits or charges to our current operations. Consequently, we believe this presentation is useful in providing a meaningful understanding of our financial position.
The table below shows the reconciliation of Total stockholders' equity to Total stockholders' equity including the Deferred Gain for the periods presented:
|
As of December 31,
|
|||||||||||||||||||
|
2017
|
2016
|
2015
|
2014
|
2013
|
|||||||||||||||
|
(in millions)
|
|||||||||||||||||||
|
Total stockholders' equity
|
$
|
947.7
|
|
$
|
840.6
|
|
$
|
760.8
|
|
$
|
686.8
|
|
$
|
568.7
|
|
||||
|
Deferred Gain
|
163.6
|
|
174.9
|
|
189.5
|
|
207.0
|
|
249.1
|
|
|||||||||
|
Total stockholders' equity including the Deferred Gain
|
$
|
1,111.3
|
|
$
|
1,015.5
|
|
$
|
950.3
|
|
$
|
893.8
|
|
$
|
817.8
|
|
||||
26
The following discussion and analysis of our financial condition and results of operations should be read in conjunction with the consolidated financial statements, the accompanying notes thereto, and the financial statement schedules included in Item 8 and Item 15 of this report. In addition to historical information, the following discussion contains forward-looking statements that are subject to risks and uncertainties and other factors described in Item 1A of this report. Our actual results in future periods may differ from those referred to herein due to a number of factors, including the risks described in the sections entitled “Risk Factors” and “Forward-Looking Statements” elsewhere in this report.
Overview
We are a Nevada holding company. Through our insurance subsidiaries, we provide workers’ compensation insurance coverage to select, small businesses in low to medium hazard industries. Workers’ compensation insurance is provided under a statutory system wherein most employers are required to provide coverage for their employees’ medical, disability, vocational rehabilitation, and/or death benefit costs for work-related injuries or illnesses. We provide workers’ compensation insurance in
37
states and the District of Columbia, with a concentration in California, where over one-half of our business is generated. Our revenues are primarily comprised of net premiums earned, net investment income, and net realized gains on investments.
We target small businesses, as we believe that this market is traditionally characterized by fewer competitors, more attractive pricing, and stronger persistency when compared to the U.S. workers’ compensation insurance industry in general. We believe we are able to price our policies at levels that are competitive and profitable over the long-term given our expertise in underwriting this market segment. Our underwriting approach is to consistently underwrite small business accounts at appropriate and competitive prices without sacrificing long-term profitability and stability for short-term top-line revenue growth.
Our underwriting results have improved over the past several years. This improvement reflects the increased pricing flexibility afforded to us through the use of multiple writing companies within states and territorial pricing in California. In addition, our ongoing underwriting initiatives, which are described below, have allowed us to expand our operations while also focusing on under-performing classes of business, as needed.
Pricing on our renewals showed an overall price decrease of 3.3% for the year ended December 31, 2017, versus the rate level in effect on such business a year earlier. Despite the competitive market conditions we currently face, through our efforts in 2017, we believe that we have continued to write attractive business in new and existing states and have strengthened our relationships with our business partners. Given the strength of our balance sheet, the execution of our underwriting, claims, and investment strategies, and our active capital management, we believe that we are well positioned for the current market cycle.
On August 11, 2017, we entered into a stock purchase agreement (Purchase Agreement) with Partner Reinsurance Company of the U.S. (PRUS) with respect to the acquisition (Acquisition) of all of the outstanding shares of capital stock of PartnerRe Insurance Company of New York (PRNY). The purchase price is equal to the sum of: (i) the amount of statutory capital and surplus of PRNY at closing (which is currently estimated to be approximately $40.0 million); and (ii) $5.8 million. We expect to fund the Acquisition with cash on hand.
Pursuant to the Purchase Agreement, all liabilities and obligations of PRNY existing as of the closing date, whether known or unknown, will be assumed by PRUS. In addition, PartnerRe Ltd., the parent company of PRUS, has provided us with a Guaranty that unconditionally, absolutely and irrevocably guarantees the full and prompt payment and performance by PRUS of all of its obligations, liabilities and indemnities under the Purchase Agreement and the transactions contemplated thereby.
We will not be acquiring any employees or ongoing business operations pursuant to the Acquisition. The Acquisition is subject to certain closing conditions, including, among other things, approval from the Department of Financial Services of the State of New York.
27
Results of Operations
A primary measure of our performance is our ability to increase Adjusted stockholders' equity over the long-term. We believe that this measure is important to our investors, analysts, and other interested parties who benefit from having an objective and consistent basis for comparison with other companies within our industry. The following table shows a reconciliation of our Stockholders' equity on a GAAP basis to our Adjusted stockholders' equity.
|
December 31,
|
|||||||
|
2017
|
2016
|
||||||
|
(in millions, except share data)
|
|||||||
|
GAAP stockholders' equity
|
$
|
947.7
|
|
$
|
840.6
|
|
|
|
Deferred reinsurance gain–LPT Agreement
|
163.6
|
|
174.9
|
|
|||
|
Less: Accumulated other comprehensive income, net
|
107.4
|
|
74.5
|
|
|||
|
Adjusted stockholders' equity
(1)
|
$
|
1,003.9
|
|
$
|
941.0
|
|
|
|
(1)
|
Adjusted stockholders' equity is a non-GAAP measure consisting of total GAAP stockholders' equity plus the Deferred Gain, less Accumulated other comprehensive income, net.
|
Our net income was
$101.2 million
,
$106.7 million
, and
$94.4 million
in
2017
,
2016
, and
2015
, respectively, and our underwriting income was
$68.0 million
,
$57.3 million
, and
$40.4 million
for the same periods, respectively. The key factors that affected our financial performance during the previous two years included:
|
•
|
Losses and LAE decreased slightly in
2017
and
3%
in
2016
, each compared to the previous year;
|
|
•
|
Underwriting and other operating expenses increased
3%
in
2017
and
1%
in
2016
, each compared to the previous year;
|
|
•
|
Net realized gains (losses) on investments of
$7.4 million
,
$11.2 million
, and
$(10.7) million
in
2017
,
2016
, and
2015
, respectively; and
|
|
•
|
Income tax expense was
$42.8 million
($35.8 million excluding the impact of the enactment of tax reform),
$34.0 million
, and
$5.0 million
in
2017
,
2016
, and
2015
, respectively.
|
We continue to execute a number of ongoing business initiatives, including: focusing on internal and customer-facing business process excellence; accelerating the settlement of open claims; diversifying our risk exposure across geographic markets; utilizing a multi-company pricing platform; utilizing territory-specific pricing; development and implementation of new technologies and capabilities; and leveraging data-driven strategies to target, price, and underwrite profitable classes of business across all of our markets.
The following items were included in our 2017 results of operations: (1) favorable prior year accident year loss development of
$18.5 million
, including
$17.4 million
of favorable development on our voluntary business and
$1.1 million
of favorable development on our assigned risk business, which decreased our losses and LAE by the same amount; (2) a write-off of
$7.5 million
of previously capitalized costs relating to the development of information technology capabilities that had not yet been placed in service (See –Other expenses); (3) a
$7.0 million
increase in our income tax expense resulting from a reduction of our net deferred tax asset resulting from the enactment of the Tax Cuts and Jobs Act on December 22, 2017 (Enactment), which reduced the statutory rate from 35% to 21% beginning in 2018 (See –Income tax expense); and (4) an increase in the contingent commission receivable under the LPT Agreement, which resulted in a
$0.3 million
cumulative adjustment to the Deferred Gain, and reduced our losses and LAE by the same amount (LPT Contingent Commission Adjustment). Collectively, these items increased our net income before taxes by $11.3 million and increased our income tax expense by
$7.0 million
for the year ended December 31, 2017.
The following items were included in our 2016 results of operations: (1) favorable prior year accident year loss development of $18.4 million, including $17.0 million of favorable development on our voluntary business and $1.4 million of favorable development on our assigned risk business, which decreased our losses and LAE by the same amount; (2) favorable development in the estimated reserves ceded under the LPT Agreement, which resulted in a $3.1 million cumulative adjustment to the Deferred Gain and reduced our losses and LAE by the same amount (LPT Reserve Adjustment); and (3) an increase in the contingent commission receivable under the LPT Agreement, which resulted in a $1.8 million cumulative adjustment to the Deferred Gain, and reduced our losses and LAE by the same amount (LPT Contingent Commission Adjustment). Collectively, these items increased our net income before taxes by $23.3 million for the year ended December 31, 2016.
The following items were included in our 2015 results of operations: (1) favorable prior year accident year loss development of $7.2 million, including $9.0 million of favorable development on our voluntary business, partially offset by $1.8 million of unfavorable development on our assigned risk business, which decreased our losses and LAE by the same amount; (2) favorable development in the estimated reserves ceded under the LPT Agreement that resulted in a $6.4 million LPT Reserve Adjustment; (3) an increase in the contingent commission receivable under the LPT Agreement, which resulted in a $2.6 million LPT Contingent Commission Adjustment; and (4) a reallocation of $56.3 million of losses and LAE reserves from non-taxable periods prior to
28
January 1, 2000, which reduced our effective tax rate by 15.4 percentage points. Collectively, these items increased our net income before taxes by $16.2 million and decreased our income tax expense by $15.3 million for the year ended December 31, 2015.
The components of net income are set forth in the following table:
|
Years Ended December 31,
|
|||||||||||
|
2017
|
2016
|
2015
|
|||||||||
|
(in millions)
|
|||||||||||
|
Gross premiums written
|
$
|
729.7
|
|
$
|
701.4
|
|
$
|
697.7
|
|
||
|
Net premiums written
|
$
|
723.7
|
|
$
|
694.6
|
|
$
|
689.3
|
|
||
|
Net premiums earned
|
$
|
716.5
|
|
$
|
694.8
|
|
$
|
690.4
|
|
||
|
Net investment income
|
74.6
|
|
73.2
|
|
72.2
|
|
|||||
|
Net realized gains (losses) on investments
|
7.4
|
|
11.2
|
|
(10.7
|
)
|
|||||
|
Gain on redemption of notes payable
|
2.1
|
|
—
|
|
—
|
|
|||||
|
Other income
|
0.8
|
|
0.6
|
|
0.2
|
|
|||||
|
Total revenues
|
801.4
|
|
779.8
|
|
752.1
|
|
|||||
|
Losses and LAE
|
417.2
|
|
417.9
|
|
429.4
|
|
|||||
|
Commission expense
|
91.4
|
|
83.5
|
|
85.4
|
|
|||||
|
Underwriting and other operating expenses
|
139.9
|
|
136.1
|
|
135.2
|
|
|||||
|
Interest expense
|
1.4
|
|
1.6
|
|
2.7
|
|
|||||
|
Other expense
|
7.5
|
|
—
|
|
—
|
|
|||||
|
Total expenses
|
657.4
|
|
639.1
|
|
652.7
|
|
|||||
|
Income tax expense
|
42.8
|
|
34.0
|
|
5.0
|
|
|||||
|
Net income
|
$
|
101.2
|
|
$
|
106.7
|
|
$
|
94.4
|
|
||
|
Less amortization of the Deferred Gain related to losses
|
9.3
|
|
9.7
|
|
9.5
|
|
|||||
|
Less amortization of the Deferred Gain related to contingent commission
|
2.0
|
|
2.0
|
|
1.9
|
|
|||||
|
Less impact of LPT Reserve Adjustments
(1)
|
—
|
|
3.1
|
|
6.4
|
|
|||||
|
Less impact of LPT Contingent Commission Adjustments
(2)
|
0.3
|
|
1.8
|
|
2.6
|
|
|||||
|
Net income before impact of the LPT Agreement
(3)
|
$
|
89.6
|
|
$
|
90.1
|
|
$
|
74.0
|
|
||
|
(1)
|
LPT Reserve Adjustments result in a cumulative adjustment to the Deferred Gain, which is recognized in losses and LAE incurred on our Consolidated Statements of Comprehensive Income, such that the Deferred Gain reflects the balance that would have existed had the revised reserves been recognized at the inception of the LPT Agreement. (See Note
2
in the Notes to our Consolidated Financial Statements.)
|
|
(2)
|
LPT Contingent Commission Adjustments result in a cumulative adjustment to the Deferred Gain, which is recognized in losses and LAE incurred on our Consolidated Statements of Comprehensive Income, such that the Deferred Gain reflects the balance that would have existed had the revised contingent profit commission been recognized at the inception of the LPT Agreement. (See Note
2
in the Notes to our Consolidated Financial Statements.)
|
|
(3)
|
We define net income before impact of the LPT Agreement as net income before the impact of: (a) amortization of the Deferred Gain; (b) adjustments to the LPT Agreement ceded reserves; and (c) adjustments to the Contingent commission receivable –LPT Agreement. The Deferred Gain reflects the unamortized gain from the LPT Agreement. Under GAAP, this gain is deferred and is being amortized using the recovery method in which amortization is determined by the proportion of actual reinsurance recoveries to total estimated recoveries over the life of the LPT Agreement, except for the contingent profit commission, which is amortized through June 30, 2024. The amortization is reflected in losses and LAE. We periodically reevaluate the remaining direct reserves subject to the LPT Agreement and the expected losses and LAE subject to the contingent profit commission under the LPT Agreement. Our reevaluation results in corresponding adjustments, if needed, to reserves, ceded reserves, contingent commission receivable, and the Deferred Gain, with the net effect being an increase or decrease to our net income. Net income before impact of the LPT Agreement is not a measurement of financial performance under GAAP, but rather reflects the difference in accounting treatment between statutory and GAAP, and should not be considered in isolation or as an alternative to net income before income taxes or net income, or any other measure of performance derived in accordance with GAAP.
|
We present net income before impact of the LPT Agreement because we believe that it is an important supplemental measure of our ongoing operating performance to be used by analysts, investors and other interested parties in evaluating us. The LPT Agreement was a non-recurring transaction, under which the Deferred Gain does not affect our ongoing operations, and, consequently, we believe this presentation is useful in providing a meaningful understanding of our operating performance. In addition, we believe this non-GAAP measure, as we have defined it, is helpful to our management in identifying trends in our performance because the excluded item has limited significance in our current and ongoing operations.
29
Gross Premiums Written
Gross premiums written were
$729.7 million
,
$701.4 million
, and
$697.7 million
for the years ended
December 31, 2017
,
2016
, and
2015
, respectively. The increase in 2017 was primarily due to increases in new business premium written and final audit premiums, partially offset by declines in renewal business premium, year-over-year. Final audit premiums increased $10.8 million, compared to 2016, positively impacted by California Assembly Bill 2883 (AB 2883), which limited certain officers' payroll from being excluded from the calculation of premiums effective January 1, 2017. In October 2017, California passed Senate Bill 189 (SB 189), which expanded the scope of employees that qualify for these exclusions. SB 189 goes into effect on July 1, 2018 and is expected to reverse some of the benefits of AB 2883 beginning in 2018. The increase in gross premiums written in 2016 was primarily due to a $9.7 million increase in final audit premiums and growth in new business premium, partially offset by lower levels of renewal premiums, year-over-year. The declines in renewal premiums in 2016, compared to 2015, were due to declines in the LA Area of California, partially offset by increases in states outside California, as well as territories outside of the LA Area of California.
Net Premiums Written
Net premiums written were
$723.7 million
,
$694.6 million
, and
$689.3 million
for the years ended
December 31, 2017
,
2016
, and
2015
, respectively, which included
$6.0 million
,
$6.8 million
, and
$8.4 million
of reinsurance premiums ceded, respectively. The decreases in reinsurance premiums ceded from 2015 to 2017 reflect the increase in our retention on a per occurrence basis under our current excess of loss reinsurance program compared to earlier periods.
Net Premiums Earned
Net premiums earned were
$716.5 million
,
$694.8 million
, and
$690.4 million
for the years ended
December 31, 2017
,
2016
, and
2015
, respectively. Net premiums earned are primarily a function of the amount and timing of net premiums previously written.
The following table shows the percentage change in our in-force premiums, policy count, average policy size, and payroll exposure upon which our premiums are based as of
December 31, 2017
and
2016
,
respectively, overall, for California, where
56%
of our premiums were generated, and for all other states, excluding California:
|
Percentage Change
2017 Over 2016 |
Percentage Change
2016 Over 2015
|
||||||||||||||||
|
Overall
|
California
|
All Other States
|
Overall
|
|
California
|
All Other States
|
|||||||||||
|
In-force premiums
|
1.3
|
%
|
0.3
|
%
|
2.7
|
%
|
(0.1
|
)%
|
|
(1.1
|
)%
|
1.1
|
%
|
||||
|
In-force policy count
|
0.8
|
|
(3.7
|
)
|
5.2
|
|
0.4
|
|
|
(4.4
|
)
|
5.7
|
|
||||
|
Average in-force policy size
|
0.5
|
|
4.1
|
|
(2.4
|
)
|
(0.5
|
)
|
|
3.5
|
|
(4.3
|
)
|
||||
|
In-force payroll exposure
|
3.1
|
|
5.7
|
|
1.5
|
|
0.6
|
|
|
1.1
|
|
0.3
|
|
||||
Net Investment Income and Net Realized Gains (Losses) on Investments
We invest in fixed maturity securities, equity securities, short-term investments, and cash equivalents. Net investment income includes interest and dividends earned on our invested assets and amortization of premiums and discounts on our fixed maturity securities, less bank service charges and custodial and portfolio management fees. We have established a high quality/short duration bias in our investment portfolio.
Net investment income was
$74.6 million
,
$73.2 million
, and
$72.2 million
for the years ended
December 31, 2017
,
2016
, and
2015
, respectively. The average pre-tax book yield on our invested assets was
3.1%
,
3.1%
, and
3.2%
at
December 31, 2017
,
2016
, and
2015
, respectively. The average tax-equivalent yield on our invested assets (which adjusts the book yield of our investments in tax-advantaged securities to an equivalent pre-tax book yield) was
3.5%
,
3.6%
, and
3.8%
as of the same dates, respectively.
Realized gains and losses on our investments are reported separately from our net investment income. Realized gains and losses on investments include the gain or loss on a security at the time of sale compared to its original or adjusted cost (equity securities) or amortized cost (fixed maturity securities). Realized losses are also recognized when securities are written down as a result of an other-than-temporary impairment.
Net realized gains (losses) on investments were
$7.4 million
,
$11.2 million
, and
$(10.7) million
for the years ended
December 31, 2017
,
2016
, and
2015
, respectively. Net realized gains on investments in 2017 were primarily related to sales of municipal securities, whose proceeds were reinvested in taxable fixed maturity securities, and sales of equity securities as part of a routine rebalancing of our equity portfolio. Those gains were partially offset by $1.4 million in other-than temporary impairments of certain fixed maturity and equity securities due to our intent to sell those securities and/or the severity and duration of the change in fair value of those securities. Net realized gains on investments in 2016 were primarily the result of the sale of equity securities as part of a routine rebalancing of our equity portfolio to meet cash needs at the holding company, and to provide cash to support the internal restructuring of our insurance subsidiaries. Those gains were partially offset by $5.8 million in other-than-temporary impairments
30
of certain equity securities due to our intent to sell those securities, and the downturn in the energy sector during that year. Net realized losses on investments in 2015 were primarily the result of other-than-temporary impairments of certain equity securities during the fourth quarter due to the downturn in the energy sector during that year. Additional information regarding our Investments is set forth under “–Liquidity and Capital Resources–Investments” and Note
6
in the Notes to our Consolidated Financial Statements.
Other Income
Other income consists of net gains on fixed assets, non-investment interest, and other miscellaneous income. Other income was
$0.8 million
,
$0.6 million
, and
$0.2 million
for the years ended
December 31, 2017
,
2016
, and
2015
, respectively.
Losses and LAE, Commission Expenses, and Underwriting and Other Operating Expenses
The following table presents our calendar year combined ratios.
|
Years Ended December 31,
|
||||||||
|
2017
|
2016
|
2015
|
||||||
|
Loss and LAE ratio
|
58.2
|
%
|
60.1
|
%
|
62.2
|
%
|
||
|
Underwriting and other operating expenses ratio
|
19.5
|
|
19.7
|
|
19.5
|
|
||
|
Commission expense ratio
|
12.8
|
|
12.0
|
|
12.4
|
|
||
|
Combined ratio
|
90.5
|
%
|
91.8
|
%
|
94.1
|
%
|
||
We include all of the operating expenses of our holding company in the calculation of our combined ratio, which added approximately two percentage points to that ratio in each of the years ended
December 31, 2017
,
2016
, and
2015
.
Loss and LAE Ratio.
We analyze our loss and LAE ratios on both a calendar year and accident year basis.
The calendar year loss and LAE ratio is calculated by dividing the losses and LAE incurred during the calendar year, regardless of when the underlying insured event occurred, by the net premiums earned during that calendar year. The calendar year loss and LAE ratio includes changes made during the calendar year in reserves for losses and LAE established for insured events occurring in the current and prior years. The calendar year loss and LAE ratio for a particular year will not change in future periods.
The accident year loss and LAE ratio is calculated by dividing losses and LAE, regardless of when such losses and LAE are incurred, for insured events that occurred during a particular year by the net premiums earned for that year. The accident year loss and LAE ratio for a particular year can decrease or increase when recalculated in subsequent periods as the reserves established for insured events occurring during that year develop favorably or unfavorably. The accident year loss and LAE ratio is based on our statutory financial statements and is not derived from our GAAP financial information.
We analyze our calendar year loss and LAE ratio to measure our profitability in a particular year and to evaluate the adequacy of our premium rates charged in a particular year to cover expected losses and LAE from all periods, including development (whether favorable or unfavorable) of reserves established in prior periods. In contrast, we analyze our accident year loss and LAE ratios to evaluate our underwriting performance and the adequacy of the premium rates we charged in a particular year in relation to ultimate losses and LAE from insured events occurring during that year. The loss and LAE ratios provided in this report are calendar year basis, except where they are expressly identified as accident year loss and LAE ratios.
Losses and LAE represents our largest expense item and includes claim payments made, amortization of the Deferred Gain, LPT Reserve Adjustments, LPT Contingent Commission Adjustments, estimates for future claim payments and changes in those estimates for current and prior periods, and costs associated with investigating, defending, and adjusting claims. The quality of our financial reporting depends in large part on accurately predicting our losses and LAE, which are inherently uncertain as they are estimates of the ultimate cost of individual claims based on actuarial estimation techniques.
Our indemnity claims frequency (the number of claims expressed as a percentage of payroll) continued to decrease year-over-year in 2017 and 2016. In 2017, we saw a slight downward movement in medical and indemnity costs per claim that are reflected in our current accident year loss estimates. Total claims costs have also been reduced by cost savings associated with increased claims settlement activity that continued through 2017. We believe our current accident year loss estimate is adequate; however, ultimate losses will not be known with any certainty for many years. We assume that increasing medical and indemnity cost trends will continue to impact our long-term claims costs and current accident year loss estimate, which may be offset by rate increases. Additional information regarding our reserves for losses and LAE is set forth under “–Critical Accounting Policies–Reserves for Losses and LAE.”
Overall, losses and LAE were
$417.2 million
,
$417.9 million
, and
$429.4 million
for the years ended
December 31, 2017
,
2016
, and
2015
, respectively. The decrease in our losses and LAE from 2016 to 2017 was primarily due to a lower current accident year loss estimate year-over-year. Net favorable prior accident year loss development in 2017 was
$18.5 million
, which included
$17.4 million
of favorable development on our voluntary risk business and
$1.1 million
of favorable development related to our assigned
31
risk business. The decrease from 2015 to 2016 was primarily related to
$18.4 million
of net favorable prior accident year loss development (versus
$7.2 million
of net favorable development in 2015), which included
$17.0 million
of favorable development on our voluntary risk business and
$1.4 million
of favorable development related to our assigned risk business. The favorable prior accident year loss development in each period was the result of our determination that adjustments were necessary to reflect observed favorable paid loss trends in each of these years. Paid loss trends have been impacted by cost savings associated with accelerated claims settlement activity that continued through 2017. Additionally, there were favorable LPT Reserve Adjustments of
$3.1 million
and
$6.4 million
that decreased losses and LAE by those amounts for the years ended
December 31, 2016
and
2015
, respectively. There were no LPT Reserve Adjustments in 2017.
Our current accident year loss ratio estimates were
62.4%
,
65.2%
, and
66.2%
for the years ended
December 31, 2017
,
2016
, and
2015
, respectively. The decreasing trend in our current accident year loss estimates reflects the continued impact of key business initiatives, including: accelerating the settlement of open claims; diversifying our risk exposure across geographic markets; and leveraging data-driven strategies to target, underwrite, and price profitable classes of business across all of our markets. The current accident year loss estimate for the year ended December 31, 2016 included the impact of $6.5 million in large losses recognized in the second quarter of 2016, which increased the current accident year loss estimate for that year.
Excluding the impact from the LPT Agreement, losses and LAE would have been
$428.8 million
,
$434.5 million
, and
$449.8 million
, or
59.8%
,
62.5%
, and
65.2%
of net premiums earned, for the years ended
December 31, 2017
,
2016
, and
2015
, respectively.
The table below reflects losses and LAE reserve adjustments and the impact of the LPT on net income before taxes.
|
Years Ended December 31,
|
|||||||||||
|
2017
|
2016
|
2015
|
|||||||||
|
(in millions)
|
|||||||||||
|
Prior accident year favorable development, net
|
$
|
18.5
|
|
$
|
18.4
|
|
$
|
7.2
|
|
||
|
Amortization of the Deferred Gain related to losses
|
$
|
9.3
|
|
$
|
9.7
|
|
$
|
9.5
|
|
||
|
Amortization of the Deferred Gain related to contingent commission
|
2.0
|
|
2.0
|
|
1.9
|
|
|||||
|
Impact of LPT Reserve Adjustments
|
—
|
|
3.1
|
|
6.4
|
|
|||||
|
Impact of LPT Contingent Commission Adjustments
|
0.3
|
|
1.8
|
|
2.6
|
|
|||||
|
Total impact of the LPT
|
11.6
|
|
16.6
|
|
20.4
|
|
|||||
|
Total losses and LAE reserve adjustments
|
$
|
30.1
|
|
$
|
35.0
|
|
$
|
27.6
|
|
||
Underwriting and Other Operating Expenses Ratio.
Underwriting and other operating expenses are those costs that we incur to underwrite and maintain the insurance policies we issue, excluding commission. These expenses include premium taxes and certain other general expenses that vary with, and are primarily related to, producing new or renewal business. These policy acquisition costs are variable based on premiums earned. Policyholder dividends, changes in estimates of future write-offs of premiums receivable, general administrative expenses such as salaries and benefits, rent, office supplies, depreciation, and all other operating expenses not otherwise classified separately are also included in Underwriting and other operating expenses. These expenses are more fixed in nature and become a smaller percentage of net premiums earned as premiums increase.
Our underwriting and other operating expenses ratio was
19.5%
,
19.7%
, and
19.5%
, and our underwriting and other operating expenses were
$139.9 million
,
$136.1 million
, and
$135.2 million
for the years ended
December 31, 2017
,
2016
, and
2015
, respectively. During the year ended December 31, 2017, our compensation-related expenses increased $2.6 million and professional fees increased $1.9 million, partially offset by a $0.7 million decrease in our premium taxes and assessments, each as compared to 2016. During the year ended December 31, 2016, our compensation-related expenses increased $2.3 million and premium taxes and assessments increased $1.5 million, partially offset by a $3.1 million decrease in our bad debt expense, each as compared to 2015.
Commission Expense Ratio.
Commission expenses include direct commissions to our agents and brokers for the premiums that they produce for us, as well as incentive payments, other marketing costs, and fees. Some of our agency contracts contain incentive clauses, and the terms of those agency incentives are specific to individual contracts and vary as a result of agency performance.
Our commission expense ratio was
12.8%
,
12.0%
, and
12.4%
, and our commission expenses were
$91.4 million
,
$83.5 million
, and
$85.4 million
for the years ended
December 31, 2017
,
2016
, and
2015
, respectively. The increase in the commission expense ratio in 2017 was primarily the result of increases in agency incentive commissions and an increase in the percentage of business produced by our partnerships and alliances, which are subject to a higher commission rate. The decrease in our commission expense ratio in 2016, compared to 2015, was primarily due to lower agency incentives in 2016.
32
Other Expenses
We actively invest in technology and systems across our business with a view toward maximizing efficiency, facilitating customer self-service, and creating increased capacity that will allow us to lower our expense ratios while growing premiums.
During the third quarter of 2017, we wrote-off $7.5 million of previously capitalized costs relating to the development of information technology capabilities that had not yet been placed in service. This charge was the result of our continual evaluation of ongoing technology initiatives.
Income Tax Expense
On January 1, 2000, EICN assumed the assets, liabilities, and operations of the Fund pursuant to legislation passed in the 1999 Nevada Legislature (the Privatization). Prior to the Privatization, the Fund was part of the State of Nevada and therefore was not subject to federal income tax. Accordingly, our pre-Privatization loss and LAE reserve adjustments, LPT Reserve Adjustments and Deferred Gain amortization impact our net income but do not change our taxable income.
Income tax expense was
$42.8 million
($35.8 million excluding the impact of Enactment),
$34.0 million
, and
$5.0 million
for the years ended
December 31, 2017
,
2016
, and
2015
, respectively, representing effective tax rates of
29.7%
(24.9% excluding the impact of Enactment),
24.2%
, and
5.0%
for the years ended
December 31, 2017
,
2016
, and
2015
, respectively.
Enactment significantly revised U.S. corporate income tax law by, among other things, reducing the corporate statutory income tax rate from 35% to 21%, beginning January 1, 2018. This reduction in the corporate statutory income tax rate required us to re-evaluate certain of our deferred tax assets and liabilities, as of the date of Enactment, to reflect the revised income tax rates applicable to future periods.
Tax-advantaged investment income, LPT Contingent Commission Adjustments, Deferred Gain amortization and certain other adjustments reduced our income tax expense computed at a statutory rate of 35% by $14.6 million for the year-ended December 31, 2017. These reductions were partially offset by a
$7.0 million
increase in our income tax expense for the year ended December 31, 2017 due to the re-evaluation of our deferred tax assets and liabilities as of the date of Enactment. In 2016 and 2015, tax-advantaged investment income, LPT Reserve Adjustments, LPT Contingent Commission Adjustments, Deferred Gain amortization and certain other adjustments reduced our income tax expense computed at the statutory 35% rate by $15.3 million and $29.8 million, respectively.
For additional information regarding our income tax expense see Note
8
in the Notes to our Consolidated Financial Statements.
Liquidity and Capital Resources
Holding Company Liquidity
We are a holding company and our ability to fund our operations is contingent upon existing capital and the ability of our subsidiaries to pay dividends up to the holding company. Payment of dividends by our insurance subsidiaries is restricted by state insurance laws and regulations, including laws establishing minimum solvency and liquidity thresholds. We require cash to pay stockholder dividends, repurchase common stock, make interest and principal payments on any outstanding debt obligations, provide additional surplus to our insurance subsidiaries, and fund our operating expenses.
Our insurance subsidiaries' ability to pay dividends to their parent is based on reported capital, surplus, and dividends paid within the last 12 months. For 2018, the maximum dividends that may be paid by EICN, EPIC, and EAC without prior regulatory approval by the respective state insurance regulator are $19.9 million, $15.9 million, and $19.0 million, respectively. ECIC can pay $10.4 million of dividends through August 8, 2018 and $48.4 million thereafter without prior regulatory approval.
Total cash and investments at the holding company were
$74.8 million
at
December 31, 2017
, consisting of $39.6 million of cash and cash equivalents, $3.7 million of short-term investments, and $31.5 million of unaffiliated fixed maturity securities. We do not currently have a revolving credit facility because we currently believe that the holding company's cash needs for the foreseeable future will be met with its cash and investments on hand, as well as dividends available from our insurance subsidiaries.
Operating Subsidiaries' Liquidity
The primary sources of cash for our operating subsidiaries, which include our insurance and other operating subsidiaries,
are premium collections, investment income, sales and maturities of investments and reinsurance recoveries. The primary uses of cash for our operating subsidiaries are payments of losses and LAE, commission expenses, underwriting and other operating expenses, ceded reinsurance, investment purchases and dividends paid to their parent.
Total cash and investments held by our operating subsidiaries was $2,677.2 million at
December 31, 2017
, consisting of $34.7 million of cash and cash equivalents, $0.3 million of short-term investments, $2,431.9 million of fixed maturity securities, and $210.3 million of equity securities. Sources of immediate and unencumbered liquidity at our operating subsidiaries as of
December 31, 2017
consisted of $33.7 million of cash and cash equivalents, $205.6 million of publicly-traded equity securities
33
whose proceeds are available within three business days, and $1,346.3 million of highly liquid fixed maturity securities whose proceeds are available within three business days. We believe that our subsidiaries'
liquidity needs over the next 24 months will be met with cash from operations, investment income, and maturing investments.
Each of our insurance subsidiaries is a member of the Federal Home Loan Bank (FHLB). Membership allows our subsidiaries access to collateralized advances, which may be used to support and enhance liquidity management. The amount of advances that may be taken is dependent on statutory admitted assets on a per company basis. Currently, none of our subsidiaries has advances outstanding under the FHLB facility.
We purchase reinsurance to protect us against the costs of severe claims and catastrophic events. On July 1,
2017
,
we entered into a new reinsurance program that is effective through June 30,
2018
.
The reinsurance program consists of one treaty covering excess of loss and catastrophic loss events in four layers of coverage. Our reinsurance coverage is
$190.0 million
in excess of our
$10.0 million
retention on a per occurrence basis, subject to certain exclusions. We believe that our reinsurance program meets our needs and that we are sufficiently capitalized.
Our insurance subsidiaries
are required by law to maintain a certain minimum level of surplus on a statutory basis. Surplus is calculated by subtracting total liabilities from total admitted assets. The amount of capital in our
insurance subsidiaries
is maintained relative to standardized capital adequacy measures such as risk-based capital (RBC), as established by the National Association of Insurance Commissioners. The RBC standard was designed to provide a measure by which regulators can assess the adequacy of an insurance company's capital and surplus relative to its operations. An insurance company must maintain capital and surplus of at least 200% of RBC. Each of our
insurance subsidiaries
had total adjusted capital in excess of the minimum RBC requirements that correspond to any level of regulatory action at
December 31, 2017
.
Various state laws and regulations require us to hold investment securities or letters of credit on deposit with certain states in which we do business. Securities having a fair value of
$1,009.7 million
were on deposit at each of
December 31, 2017
and
2016
. These laws and regulations govern both the amount and types of investment securities that are eligible for deposit. Additionally, certain reinsurance contracts require company funds to be held in trust for the benefit of the ceding reinsurer to secure the outstanding liabilities we assumed. The fair value of fixed maturity securities held in trust for the benefit of our ceding reinsurers was
$24.5 million
and
$27.2 million
at
December 31, 2017
and
2016
,
respectively.
Sources of Liquidity
We monitor the cash flows of each of our subsidiaries individually, as well as collectively as a consolidated group. We use trend and variance analyses to project future cash needs, making adjustments to our forecasts as appropriate.
The table below shows our net cash flows. For additional information regarding our cash flows, see Item 8, Consolidated Statements of Cash Flows.
|
Years Ended December 31,
|
|||||||||||
|
2017
|
2016
|
2015
|
|||||||||
|
Cash and cash equivalents provided by (used in):
|
(in millions)
|
||||||||||
|
Operating activities
|
$
|
142.3
|
|
$
|
122.8
|
|
$
|
116.4
|
|
||
|
Investing activities
|
(110.2
|
)
|
(88.6
|
)
|
(101.2
|
)
|
|||||
|
Financing activities
|
(26.0
|
)
|
(23.6
|
)
|
(62.2
|
)
|
|||||
|
Increase (decrease) in cash and cash equivalents
|
$
|
6.1
|
|
$
|
10.6
|
|
$
|
(47.0
|
)
|
||
Operating Activities
Net cash provided by operating activities in
2017
included net premiums received of $702.4 million, and investment income received of $90.0 million. These operating cash inflows were partially offset by net claims payments of $419.2 million, underwriting and other operating expenses paid of $123.6 million, and commissions paid of $84.6 million.
Net cash provided by operating activities in
2016
included net premiums received of $694.9 million, and investment income received of $87.8 million. These operating cash inflows were partially offset by net claims payments of $433.7 million, underwriting and other operating expenses paid of $125.8 million, and commissions paid of $84.2 million.
Net cash provided by operating activities in
2015
included net premiums received of $678.9 million, and investment income received of $84.9 million. These operating cash inflows were partially offset by net claims payments of $427.7 million, underwriting and other operating expenses paid of $121.3 million, and commissions paid of $82.9 million.
Investing Activities
Net cash used in investing activities in
2017
,
2016
, and
2015
was primarily related to the investment of premiums received and the reinvestment of funds from maturities, redemptions, and interest income. These investing cash outflows were partially offset
34
by investment sales whose proceeds were used to fund claims payments, underwriting and other operating expenses, stockholder dividend payments, and for common stock repurchases during 2016.
Financing Activities
Net cash used in financing activities in
2017
was primarily related to stockholder dividend payments and the purchase of a note payable.
Net cash used in financing activities in
2016
included purchases of our common stock and payments of stockholder dividends. These financing cash outflows were partially offset by net proceeds from stock-based compensation, mainly proceeds from exercises of stock options.
Net cash used in financing activities in 2015 included payments of stockholder dividends and repayment of notes payable and capital leases. These financing cash outflows were partially offset by net proceeds from stock-based compensation, mainly proceeds and income tax benefits from exercises of stock options.
Dividends.
Dividends paid to stockholders were
$19.7 million
,
$11.5 million
, and
$7.7 million
in
2017
,
2016
, and
2015
, respectively. The declaration and payment of future dividends to common stockholders will be at the discretion of our Board of Directors and will depend upon many factors, including our financial position, capital requirements of our operating subsidiaries, legal and regulatory requirements, and any other factors our Board of Directors deems relevant. On
February 21, 2018
, the Board of Directors declared a
$0.20
dividend per share, payable
March 21, 2018
, to stockholders of record on
March 7, 2018
.
Share Repurchases.
On February 16, 2016, the Board of Directors authorized a share repurchase program for up to $50.0 million of our common stock from February 22, 2016 through February 22, 2018 (the 2016 Program). The 2016 Program provided that shares of common stock may be purchased at prevailing market prices through a variety of methods, including open market or private transactions, in accordance with applicable laws and regulations and as determined by management. The timing and actual number of shares repurchased depended on a variety of factors, including the share price, corporate and regulatory requirements, and other market and economic conditions. We made no repurchases of common stock during the year ended December 31, 2017. As of
December 31, 2017
, we had a remaining common stock repurchase authorization of
$28.9 million
under the 2016 Program. See Item 5, Issuer Purchases of Equity Securities. The 2016 Program expired on February 22, 2018.
On February 21, 2018, the Board of Directors authorized a share repurchase program for repurchases of up to $50.0 million of the Company's common stock (the 2018 Program). The 2018 Program provides that shares may be purchased at prevailing market prices from February 26, 2018 through February 26, 2020 through a variety of methods, including open market or private transactions, in accordance with applicable laws and regulations and as determined by management. The timing and actual number of shares that may be repurchased will depend on a variety of factors, including the share price, corporate and regulatory requirements, and other market and economic conditions. Repurchases under the 2018 Program may be commenced, modified, or suspended from time to time without prior notice, and the program may be suspended or discontinued at any time.
Capital Resources
As of
December 31, 2017
, the capital resources available to us consisted of: (i)
$20.0 million
in surplus notes maturing in 2034; (ii)
$947.7 million
of stockholders' equity; and (iii) the
$163.6 million
Deferred Gain.
The following outlines each component of our total capital resources:
Notes Payable.
The surplus notes bear interest at a rate of between 405 and 425 basis points in excess of the 90-day LIBOR per annum, payable quarterly. We may redeem the surplus notes at any time at their face value of $20.0 million, plus accrued and unpaid interest. The surplus notes mature in 2034.
Both the payment of interest and repayment of the surplus notes are subject to the prior approval of the Florida Department of Financial Services.
In May of 2017, EHI purchased one of EPIC's outstanding notes payable in the amount of $12.0 million for $9.9 million, resulting in a $2.1 million gain. As a result of this purchase, that note is considered redeemed and no longer outstanding on a consolidated basis.
35
Stockholders' Equity.
The following table summarizes our beginning and ending stockholders' equity balance and the changes thereto for each of the years ended
December 31, 2017
,
2016
, and
2015
:
|
December 31,
|
|||||||||||
|
2017
|
2016
|
2015
|
|||||||||
|
(in millions)
|
|||||||||||
|
Beginning Balance
|
$
|
840.6
|
|
$
|
760.8
|
|
$
|
686.8
|
|
||
|
Stock-based obligations
|
6.9
|
|
5.8
|
|
4.6
|
|
|||||
|
Stock options exercised
|
6.0
|
|
9.6
|
|
7.6
|
|
|||||
|
Shares withheld to satisfy minimum tax withholdings for certain stock-based obligations
|
(2.2
|
)
|
(0.6
|
)
|
(2.7
|
)
|
|||||
|
Grant date fair value adjustment
|
(0.2
|
)
|
—
|
|
—
|
|
|||||
|
Acquisition of common stock
|
—
|
|
(21.1
|
)
|
—
|
|
|||||
|
Dividends to common stockholders
|
(19.7
|
)
|
(11.5
|
)
|
(7.7
|
)
|
|||||
|
Excess tax benefit from stock-based compensation
|
—
|
|
—
|
|
1.1
|
|
|||||
|
Net income for the year
|
101.2
|
|
106.7
|
|
94.4
|
|
|||||
|
Change in net unrealized gains on investments, net of taxes
|
15.1
|
|
(9.1
|
)
|
(23.3
|
)
|
|||||
|
Ending Balance
|
$
|
947.7
|
|
$
|
840.6
|
|
$
|
760.8
|
|
||
Deferred Gain.
The Deferred Gain, which totaled
$163.6 million
and
$174.9 million
as of
December 31, 2017
and
2016
, respectively, reflects the unamortized gain from the LPT Agreement. See Note 2 in the Notes to our Consolidated Financial Statements.
Contractual Obligations and Commitments.
The following table identifies our long-term debt and contractual obligations as of
December 31, 2017
.
|
Payment Due By Period
|
|||||||||||||||||||
|
Total
|
Less Than
1-Year
|
1-3 Years
|
4-5 Years
|
More Than
5 Years
|
|||||||||||||||
|
(in millions)
|
|||||||||||||||||||
|
Operating leases
|
$
|
26.3
|
|
$
|
4.8
|
|
$
|
9.0
|
|
$
|
4.6
|
|
$
|
7.9
|
|
||||
|
Non-cancellable contracts
|
2.7
|
|
1.7
|
|
0.9
|
|
0.1
|
|
—
|
|
|||||||||
|
Notes payable
(1)
|
38.9
|
|
1.1
|
|
2.3
|
|
2.3
|
|
33.2
|
|
|||||||||
|
Capital leases
|
1.1
|
|
0.3
|
|
0.5
|
|
0.3
|
|
—
|
|
|||||||||
|
Unpaid losses and LAE reserves
(2)(3)
|
2,266.1
|
|
393.5
|
|
490.8
|
|
291.6
|
|
1,090.2
|
|
|||||||||
|
Total contractual obligations
|
$
|
2,335.1
|
|
$
|
401.4
|
|
$
|
503.5
|
|
$
|
298.9
|
|
$
|
1,131.3
|
|
||||
|
(1)
|
Notes payable includes payments of the principal and estimated interest expense on our surplus notes outstanding based on LIBOR plus a margin. The interest rates used ranged from
5.6%
to
5.7%
.
|
|
(2)
|
Estimated losses and LAE reserve payment patterns have been computed based on historical information. Our calculation of loss and LAE reserve payments by period is subject to the same uncertainties associated with determining the level of reserves and to the additional uncertainties arising from the difficulty of predicting when claims (including claims that have not yet been reported to us) will be paid. For a discussion of our reserving process, see ''–Critical Accounting Policies–Reserves for Losses and LAE.'' Actual payments of losses and LAE by period will vary, perhaps materially, from the above table to the extent that current estimates of losses and LAE reserves vary from actual ultimate claims amounts due to variations between expected and actual payout patterns.
|
|
(3)
|
The unpaid losses and LAE reserves are presented gross of reinsurance recoverables for unpaid losses, which were as follows for each of the periods presented above:
|
|
Recoveries Due By Period
|
|||||||||||||||||||
|
Total
|
Less Than
1 Year
|
1-3 Years
|
4-5 Years
|
More Than
5 Years
|
|||||||||||||||
|
(in millions)
|
|||||||||||||||||||
|
Reinsurance recoverables on unpaid losses and LAE
|
$
|
(537.0
|
)
|
$
|
(29.7
|
)
|
$
|
(56.1
|
)
|
$
|
(52.1
|
)
|
$
|
(399.1
|
)
|
||||
Investments
Our investment portfolio is structured to support our need for: (i) optimizing our risk-adjusted total return; (ii) providing adequate liquidity; (iii) facilitating financial strength and stability; and (iv) ensuring regulatory and legal compliance.
As of
December 31, 2017
, the total amortized cost of our investment portfolio was
$2.5 billion
and its fair value was
$2.7 billion
.
36
These investments provide a steady source of income, which may fluctuate with changes in interest rates and our current investment strategies.
Our Investment Manager follows our written investment guidelines based upon strategies approved by our Board of Directors and our asset allocation is reevaluated by management and reviewed by the Finance Committee of the Board of Directors on a quarterly basis. We also utilize our Investment Manager's investment advisory services to assist us in developing a tailored set of portfolio targets and objectives.
As of
December 31, 2017
, our investment portfolio, which is classified as available-for-sale, consisted of
92.0%
fixed maturity securities. We strive to limit the interest rate risk associated with fixed maturity investments by managing the duration of these securities. Our fixed maturity securities (excluding cash and cash equivalents) had a duration
of
4.2
at
December 31, 2017
.
To minimize interest rate risk, our portfolio is weighted toward short-term and intermediate-term bonds; however, our investment strategy balances consideration of duration, yield, and credit risk. Our investment guidelines require that the minimum weighted average quality of our fixed maturity securities portfolio be “AA-,” using ratings assigned by S&P. Our fixed maturity securities portfolio had a weighted average quality of “AA-”
as of
December 31, 2017
, with
54.9%
of the portfolio rated “AA” or better, based on market value.
We also have a portfolio of equity securities, which we record at fair value. We strive to limit the exposure to equity price risk associated with equity securities by diversifying our holdings across several industry sectors.
Equity securities represented
7.9%
of our investment portfolio at
December 31, 2017
.
We believe that our current asset allocation meets our strategy to preserve capital for claims and policy liabilities and to provide sufficient capital resources to support and grow our ongoing insurance operations.
The following table shows the estimated fair value, the percentage of the fair value to total invested assets, the average book yield, and the average tax equivalent yield (each based on the fair value of each category of invested assets)
as of
December 31, 2017
.
|
Category
|
Estimated Fair Value
|
Percentage of Total
|
Book Yield
|
Tax Equivalent Yield
(1)
|
|||||||||
|
(in millions, except percentages)
|
|||||||||||||
|
U.S. Treasuries
|
$
|
137.0
|
|
5.1
|
%
|
1.9
|
%
|
1.9
|
%
|
||||
|
U.S. Agencies
|
11.8
|
|
0.4
|
|
4.3
|
|
4.3
|
|
|||||
|
States and municipalities
|
642.5
|
|
24.0
|
|
3.2
|
|
4.6
|
|
|||||
|
Corporate securities
|
1,118.0
|
|
41.8
|
|
3.1
|
|
3.1
|
|
|||||
|
Residential mortgaged-backed securities
|
389.3
|
|
14.5
|
|
3.0
|
|
3.0
|
|
|||||
|
Commercial mortgaged-backed securities
|
106.0
|
|
4.0
|
|
2.8
|
|
2.8
|
|
|||||
|
Asset-backed securities
|
58.8
|
|
2.2
|
|
2.8
|
|
2.8
|
|
|||||
|
Equity securities
|
210.3
|
|
7.9
|
|
5.3
|
|
6.7
|
|
|||||
|
Short-term investments
|
4.0
|
|
0.1
|
|
1.1
|
|
1.1
|
|
|||||
|
Total investments
|
$
|
2,677.7
|
|
100.0
|
%
|
||||||||
|
Weighted average yield
|
3.1
|
%
|
3.5
|
%
|
|||||||||
|
(1)
|
Computed using a statutory income tax rate of 35%.
|
The following table shows the percentage of total estimated fair value of our fixed maturity securities as of
December 31, 2017
by credit rating category, using the lower of the ratings assigned by Moody's Investors Service or S&P.
|
Rating
|
Percentage of Total
Estimated Fair Value
|
||
|
“AAA”
|
8.5
|
%
|
|
|
“AA”
|
46.4
|
|
|
|
“A”
|
32.2
|
|
|
|
“BBB”
|
12.6
|
|
|
|
Below Investment Grade
|
0.3
|
|
|
|
Total
|
100.0
|
%
|
|
Investments that we currently own could be subject to default by the issuer or could suffer declines in fair value that become other-than-temporary. We regularly assess individual securities as part of our ongoing portfolio management, including the identification of other-than-temporary declines in fair value. Our other-than-temporary impairment assessment includes reviewing the extent and duration of declines in fair value of investments below amortized cost, historical and projected financial performance and near-term prospects of the issuer, the outlook for industry sectors, credit rating, and macro-economic changes. We also make a
37
determination as to whether it is not more likely than not that we will be required to sell the security before its fair value recovers above cost, or maturity.
We believe that we have appropriately identified the declines in the fair values of our unrealized losses for the years ended
December 31, 2017
,
2016
, and
2015
. We recognized impairments on fixed maturity securities of
$0.5 million
(consisting of
nine
securities) during the year ended
December 31, 2017
. The other-than-temporary impairments recognized during this year were the result of our intent to sell these securities. We determined that the remaining unrealized losses on fixed maturity securities were primarily the result of prevailing interest rates and not the credit quality of the issuers. The remaining fixed maturity securities whose fair value was less than amortized cost were not determined to be other-than-temporarily impaired given the lack of severity and duration of the impairment, the credit quality of the issuers, our intent to not sell the securities, and a determination that it is not more likely than not that we will be required to sell the securities until fair value recovers to above cost, or principal value upon maturity.
We recognized impairments on equity securities of
$0.9 million
(consisting of
seven
equity securities),
$5.8 million
(consisting of
thirty-seven
equity securities), and
$17.2 million
(consisting of
twenty-seven
equity securities) during the years ended December 31, 2017, 2016, and 2015, respectively. The other-than temporary impairments recognized during these years were the result of our intent to sell and/or the severity and duration of the change in fair values of these securities. The impairments on equity securities in 2016 and 2015 were primarily due to the downturn in the energy sector that occurred during the fourth quarter of 2015 and the first quarter of 2016. Certain unrealized losses on equity securities were not considered to be other-than-temporary due to the financial condition and near-term prospects of the issuers, and our intent to hold the securities until fair value recovers to above cost.
For additional information regarding our investments, including the cost or amortized cost, gross unrealized gains, gross unrealized losses, and estimated fair value of our investments, the amortized cost and estimated fair value of fixed maturity securities by contractual maturity, and net realized and unrealized investment gains (losses) on fixed maturity and equity securities, see Note
6
in the Notes to our Consolidated Financial Statements.
Off-Balance Sheet Arrangements
We have no off-balance sheet arrangements.
Critical Accounting Policies
The preparation of financial statements in accordance with GAAP requires both the use of estimates and judgment relative to the application of appropriate accounting policies. Our accounting policies are described in the Notes to our Consolidated Financial Statements, but we believe that the following matters are particularly important to understand our financial statements because changes in these estimates or changes in the assumptions used to make them could have a material impact on our results of operations, financial condition, and cash flows.
Reserves for Losses and LAE
Accounting for workers' compensation insurance requires us to estimate the liability for the expected ultimate cost of unpaid losses and LAE (loss reserves) as of a balance sheet date. Loss reserve estimates are inherently uncertain because the ultimate amount we pay for many of the claims we have incurred as of the balance sheet date will not be known for many years. Our estimate of loss reserves is intended to equal the difference between the expected ultimate losses and LAE of all claims that have occurred as of a balance sheet date and amounts already paid. We establish loss reserves based on our own analysis of emerging claims experience and environmental conditions in our markets and review of the results of various actuarial projections. Our aggregate carried loss reserves is the sum of our reserves for each accident year and represents our best estimate of outstanding loss reserves.
The amount by which estimated losses in the aggregate differ from those previously estimated for a specific time period is known as reserve “development.” Reserve development is unfavorable when losses ultimately settle for more than the amount reserved or subsequent estimates indicate a basis for reserve increases, causing the previously estimated loss reserves to be ''deficient.'' Reserve development is favorable when estimates of ultimate losses indicate a decrease in established reserves, causing the previously estimated loss reserves to be ''redundant.'' Development is reflected in our operating results through an adjustment to incurred losses and LAE during the period in which it is recognized.
Although claims for which reserves are established may not be paid for several years or more, we do not discount loss reserves in our financial statements for the time value of money, in accordance with GAAP.
The three main components of our loss reserves are case reserves, incurred but not reported (IBNR) loss reserves, and LAE reserves.
When claims are reported to us, we establish individual estimates of the ultimate cost of each claim (case reserves). These case reserves are continually monitored and revised in response to new information and for amounts paid.
38
IBNR is an actuarial estimate of future payments on claims that have occurred but have not yet been reported to us. In addition to this provision for late reported claims, we also estimate and make a provision for the extent to which the case reserves on known claims may develop and for additional payments on closed claims, known as “reopening.” IBNR reserves apply to the entire body of claims arising from a specific time period, rather than a specific claim. Most of our IBNR reserves relate to estimated future claim payments on recorded open claims.
LAE reserves are our estimate of the future expenses of investigating, administering, and settling claims that will be paid to manage claims that have occurred, including legal expenses. LAE reserves are established in the aggregate, rather than on a claim-by-claim basis. LAE reserves are categorized between defense and cost containment, and adjusting and other.
A portion of our obligations for losses and LAE are ceded to unaffiliated reinsurers. The amount of reinsurance that will be recoverable on our losses and LAE includes both the reinsurance recoverable from our excess of loss reinsurance contracts, as well as reinsurance recoverable under the terms of the LPT Agreement.
Our loss reserves (gross and net of reinsurance), including the main components of such reserves, were as follows:
|
As of December 31,
|
|||||||
|
2017
|
2016
|
||||||
|
(in millions)
|
|||||||
|
Case reserves
|
$
|
986.2
|
|
$
|
1,046.9
|
|
|
|
IBNR
|
964.4
|
|
937.8
|
|
|||
|
LAE reserves
|
315.5
|
|
316.3
|
|
|||
|
Gross unpaid losses and LAE reserves
|
2,266.1
|
|
2,301.0
|
|
|||
|
Less reinsurance recoverables on unpaid losses and LAE
|
537.0
|
|
580.0
|
|
|||
|
Net unpaid losses and LAE reserves
|
$
|
1,729.1
|
|
$
|
1,721.0
|
|
|
We use actuarial methods to analyze and estimate the aggregate amount of loss reserves. Management considers the results of various actuarial projection methods and their underlying assumptions, among other factors, in establishing loss reserves.
Judgment is required in the actuarial estimation of loss reserves, including the selection of various actuarial methodologies to project the ultimate cost of claims. Specifically, judgment is required in the following areas: the selection of projection parameters based on historical company data; the use of industry data and other benchmarks; the identification and quantification of potential changes in parameters from historical levels to current and future levels due to changes in future claims development expectations; and the weighting of differing reserve indications resulting from alternative methods and assumptions. The adequacy of our ultimate loss reserves is inherently uncertain and represents a significant risk to our business. We attempt to mitigate this risk through our claims management processes and by monitoring and reacting to statistics relating to the cost and duration of claims.
We retain an independent actuarial consulting firm (Consulting Actuary) to perform comprehensive studies of our loss reserves on a semi-annual basis. The role of the Consulting Actuary is to conduct sufficient analyses to produce a range of reasonable estimates, as well as a point estimate, of our loss reserves, and to present those results to our Internal Actuary and to management as supplemental data in selecting management's best estimate of ultimate losses.
We compile and aggregate our claims data by grouping the claims according to the year in which the claim occurred (“accident year”) when analyzing claim payment and emergence patterns and trends over time. Additionally, claims data is aggregated and compiled separately for different types of claims, claimant benefits and for different states, territories within states, or groups of states in which we do business.
Our Internal Actuary and the Consulting Actuary prepare reserve estimates for all accident years using our own historical claims data, industry data and many of the generally accepted actuarial methodologies for estimating loss reserves, such as paid loss development methods, incurred loss development methods, and Bornhuetter-Ferguson methods. These methods vary in their responsiveness to different information, characteristics, and dynamics in the data, and the results assist the actuary in considering these characteristics and dynamics in the historical data. The methods employed for each segment of claims data, and the relative weight accorded to each method, vary depending on the nature of the claims segment and on the age of the claims.
Each actuarial methodology requires the selection and application of various parameters and assumptions. The key parameters and assumptions include: the pattern with which our aggregate claims data will be paid or will emerge over time; the magnitude and changes in claim settlement activity, claims cost inflation rates; the effects of legislative benefit changes and/or judicial changes; and trends in the frequency of claims, both overall and by severity of claim. We believe the pattern with which our aggregate claims data will be paid or emerge over time, claim settlement activity, claims cost inflation rates, and claim frequencies are the most important parameters and assumptions.
Management, along with our Internal Actuary and the Consulting Actuary, separately analyze LAE and estimate unpaid LAE. These analyses rely primarily on examining the relationship between the aggregate amounts that have been spent on LAE
39
historically, compared with the volume of claims activity for the corresponding historical calendar periods. The portion of unpaid LAE that will be recoverable from reinsurers is estimated based on the contractual reinsurance terms.
The ranges of estimates of loss reserves produced by our Internal Actuary and the Consulting Actuary are intended to represent the range in which it is most likely that the ultimate losses will fall. These ranges are narrower than the range of indications produced by the individual methods applied because it is not likely that the high or low result will emerge for every claim segment and accident year. Each actuary's point estimate of loss reserves is based on a judgmental selection for each claim segment from within the range of results indicated by the different actuarial methods.
Management formally establishes loss reserves for financial statement purposes on a quarterly basis. In doing so, we make reference to the most current analyses of our Internal Actuary and of the Consulting Actuary, including a review of the assumptions and the results of the various actuarial methods used. Comprehensive studies are conducted in the second and fourth quarters by both our Internal Actuary and the Consulting Actuary. On the alternate quarters, the results of the preceding quarter's studies are updated for actual claim payment and case reserve activity by our Internal Actuary.
The aggregate carried reserve calculated by management represents our best estimate of our outstanding unpaid losses and LAE. In establishing management's best estimate of unpaid losses and LAE at December 31 for the last
three
years, management and our Internal Actuary reviewed and considered the following: (a) our Internal Actuary's and the Consulting Actuary's assumptions, point estimates, and ranges; (b) the inherent uncertainty of workers' compensation loss reserves; and (c) the potential for legislative and/or judicial reversal of California workers' compensation reforms. Management did not quantify a specific loss reserve increment for each uncertainty, but rather established an overall provision that represented management's best estimate of loss reserves in light of the historical data, actuarial assumptions, point estimate and range, and current facts and circumstances.
The table below provides the actuarial range of loss reserves that management considered when selecting its best estimate and our carried reserves.
|
As of December 31,
|
|||||||
|
2017
|
2016
|
||||||
|
(in millions)
|
|||||||
|
Low end of actuarial range
|
$
|
1,533.1
|
|
$
|
1,525.2
|
|
|
|
Carried reserves
|
1,729.1
|
|
1,721.0
|
|
|||
|
High end of actuarial range
|
1,916.5
|
|
1,884.8
|
|
|||
As of
December 31, 2017
,
California and Nevada loss reserves represented approximately 77% of our total loss reserves on
our Consolidated Balance Sheet.
In California,
our recent loss experience from 2012 through 2017, indicates a slight downward trend in medical severity and a slight upward trend in indemnity severity. The reduction in medical severity can be attributed to a number of factors including California Senate Bill 863 (SB 863), which was enacted in 2012 and largely became effective in 2013/2014. Among the more significant changes, SB 863 introduced independent medical review (IMR) into the dispute resolution process and also introduced filing fees for medical liens. On the indemnity side, various provisions of SB 863 resulted in an overall increase in certain benefits. Our indemnity claims frequency (the number of claims expressed as a percentage of payroll) has decreased year-over-year for the past three years. Aside from the impact of recent regulatory changes, we believe our increased emphasis on claims settlements, as well as our various underwriting initiatives, have contributed to more favorable trends in our California results.
In Nevada, we have compiled a lengthy history of workers' compensation claims payment patterns based on the business of the Fund and EICN, but the emergence and payment of claims in recent years has been more favorable than in the long-term history in Nevada with the Fund. The expected patterns of claim payments and emergence used in the projection of our ultimate claim payments are based on both long and short-term historical data. In recent evaluations, claim patterns have continued to emerge in a manner consistent with short-term historical data. Consequently, our selection of claim projection patterns has relied more heavily on patterns observed in recent years.
Our insurance subsidiaries
have been operating in a period characterized by changing environmental conditions in our major markets, entry into new markets, and operational changes. During periods characterized by such changes, at each evaluation, the actuaries and management must make judgments as to the relative weight to accord to long-term historical and more recent company data, external data, evaluations of environmental and operational changes, and other factors in selecting the methods to use in projecting ultimate losses and LAE, the parameters to incorporate in those methods, and the relative weights to accord to the different projection indications. At each evaluation, management has given weight to new data, recent indications, and evaluations of environmental conditions and changes that implicitly reflect management's expectation as to the degree to which the future will resemble the most recent information and most recent changes, compared with long-term claim payment, claims emergence, and claim cost inflation patterns.
40
We have actively driven a significant increase in claims settlement activity beginning in 2014 and continuing through 2017, which has primarily affected accident years 2009 and forward, that is the result of an internal initiative that emphasizes the settlement of open claims. This settlement activity has been recognized in the actuarial analysis using a methodology developed to adjust the data and loss development patterns to account for the settlements arising from this initiative.
Approximately 60% of our claims payments during the three years ended
December 31, 2017
related to medical care for injured workers. The utilization and cost of medical services in the future is a significant source of uncertainty in the establishment of loss reserves for workers' compensation. Our loss reserves are established based on reviewing the results of actuarial methods, most of which do not contain explicit medical claim cost inflation rates; however, because medical care may be provided to an injured worker over many years, and in some cases decades, the pace of medical claim cost inflation has a significant impact on our ultimate claim payments. For example, if the rate of medical claim cost inflation increases by 1% above the inflation rate that is implicitly included in the loss reserves at
December 31, 2017
,
we estimate that future medical costs over the lifetime of current claims would increase by approximately $90.0 million on a net-of-reinsurance basis.
The range of estimates of loss reserves produced by our actuarial reviews of medical cost inflation data provides some indication of the potential variability of future losses and LAE payments; however, the full range of potential variation is difficult to estimate because
our insurance subsidiaries
do not have a lengthy operating history in many of the states in which we now operate.
Our reserve estimates reflect expected increases in the costs of contested claims, but do not assume any losses resulting from significant new legal liability theories. Our reserve estimates also assume that there will not be significant future changes in the regulatory and legislative environment. In the event of significant new legal liability theories or new regulation or legislation, we will attempt to quantify its impact on our business.
If the actual loss reserves were at the high or the low end of the actuarial range, the impact on our financial results would have been as follows:
|
December 31,
|
|||||||
|
2017
|
2016
|
||||||
|
Increase (decrease) in reserves
|
(in millions)
|
||||||
|
At low end of range
|
$
|
(196.0
|
)
|
$
|
(195.8
|
)
|
|
|
At high end of range
|
187.4
|
|
163.8
|
|
|||
|
Increase (decrease) in stockholders' equity and net income
|
|||||||
|
At low end of range
|
$
|
127.4
|
|
$
|
127.3
|
|
|
|
At high end of range
|
(121.8
|
)
|
(106.5
|
)
|
|||
Actual losses are affected by a more complex combination of forces and dynamics than any one model or actuarial methodology can represent, and each methodology is an approximation of these complex forces and dynamics. None of the methods are designed or intended to produce an indication that is systematically higher or lower than the other methods. At any given evaluation date, some of the actuarial projection methods produce indications outside the actuary's selected range. Accordingly, we believe that the range of potential outcomes is considerably wider than the actuarially estimated range of the most likely outcomes. We have no basis for anticipating whether actual future payments of losses and LAE may be either greater than or less than the loss reserves currently on our Consolidated Balance Sheets.
Additionally, any adjustment to the estimated ceded reserves under the LPT Agreement results in a cumulative adjustment to the Deferred Gain, which is also included in losses and LAE incurred in the Consolidated Statements of Comprehensive Income, so that the Deferred Gain reflects the balance that would have existed had the revised reserves been recognized at the inception of the LPT Agreement. The table below provides the actuarial range of estimated liabilities for gross loss reserves under the LPT Agreement and our carried reserves.
|
As of December 31,
|
|||
|
2017
|
|||
|
(in millions)
|
|||
|
Low end of actuarial range
|
$
|
393.3
|
|
|
LPT carried reserves
|
438.9
|
|
|
|
High end of actuarial range
|
507.6
|
|
|
Reinsurance Recoverables
Reinsurance recoverables represent: (a) amounts currently due from reinsurers on paid losses and LAE; (b) amounts recoverable from reinsurers on estimates of reported losses; and (c) amounts recoverable from reinsurers on actuarial estimates of IBNR for losses and LAE. These recoverables are based on our current estimates of the underlying loss reserves, and are reported on our Consolidated Balance Sheets separately as assets, as reinsurance does not relieve us of our legal liability to policyholders. We bear
41
credit risk with respect to the reinsurers, which can be significant considering that some of the loss reserves remain outstanding for an extended period of time. Reinsurers may refuse or fail to pay losses that we cede to them, or they might delay payment. We are required to pay losses even if a reinsurer refuses or fails to meet its obligations under the applicable reinsurance agreement. We continually monitor the financial condition and financial strength ratings of our reinsurers. No material amounts due from reinsurers have been written-off as uncollectible since our inception in 2000, and we believe that amounts currently reflected in our consolidated financial statements will similarly not require any material prospective adjustment.
Under the LPT Agreement, the Fund initially ceded
$1.5 billion
in liabilities for the incurred but unpaid losses and LAE related to claims incurred prior to July 1, 1995 for consideration of
$775.0 million
in cash. The estimated remaining liabilities subject to the LPT Agreement were
$438.9 million
as of
December 31, 2017
. Losses and LAE paid with respect to the LPT Agreement totaled
$749.3 million
at
December 31, 2017
. We account for the LPT Agreement as retroactive reinsurance. Entry into the LPT Agreement resulted in a deferred reinsurance gain that was recorded on our Consolidated Balance Sheets as a liability. The Deferred Gain is being amortized using the recovery method, whereby the amortization is determined by the proportion of actual reinsurance recoveries to total estimated recoveries through the life of the LPT Agreement, and the amortization is reflected in losses and LAE. Changes in estimates of the reserves ceded under the LPT Agreement may significantly impact the Deferred Gain on our Consolidated Balance Sheets and losses and LAE in our Consolidated Statements of Comprehensive Income.
Additionally, we are entitled to receive a contingent profit commission under the LPT Agreement. The contingent profit commission is an amount based on the favorable difference between actual paid losses and LAE and expected paid losses and LAE as established in the LPT Agreement. The calculation of actual amounts paid versus expected amounts is determined every five years beginning June 30, 2004 for the first twenty-five years of the agreement. We are paid 30% of the favorable difference between the actual and expected losses and LAE paid at each calculation point. Each quarter, management records its best estimate of the estimated ultimate contingent profit commission through June 30, 2024, which is impacted by estimates for ceded losses and LAE. The related Deferred Gain is amortized using the recovery method, whereby the amortization is determined by the proportion of actual reinsurance recoveries to total estimated recoveries over the life of the contingent profit commission, or through June 30, 2024, and is recorded in losses and LAE incurred in the accompanying Consolidated Statements of Comprehensive Income. Changes in estimates of the reserves ceded under the LPT Agreement may significantly impact the Contingent commission receivable–LPT Agreement and the Deferred Gain on our Consolidated Balance Sheets and losses and LAE in our Consolidated Statements of Comprehensive Income.
Recognition of Premium Revenue
Premium revenue is recognized as earned over the period of the contract in proportion to the amount of insurance protection provided. At the end of the policy term, payroll-based premium audits are performed on substantially all policyholder accounts to determine net premiums earned for the policy year. Earned but unbilled premiums include estimated future audit premiums based on our historical experience. These estimates are subject to changes in policyholders' payrolls, economic conditions, and seasonality, and are continually reviewed and adjusted as experience develops or new information becomes known. Any such adjustments are included in current operations; however, they are partially offset by the resulting changes in losses and LAE, commission expenses, and premium taxes. Although considerable variability is inherent in such estimates, we believe that the net effect of any estimates currently reflected in our consolidated financial statements will similarly not require any material prospective adjustment.
Income Taxes
We account for income taxes under the asset and liability method, which requires the recognition of deferred tax assets and liabilities for the expected future tax consequences of events that have been included in the financial statements. Under this method, we determine deferred tax assets and liabilities on the basis of the differences between the financial statement and tax bases of assets and liabilities by using enacted tax rates in effect for the year in which the timing differences are expected to reverse. The effect of the recent change in tax rates on our deferred tax assets and liabilities was recognized in income as of the date of Enactment.
We record uncertain tax positions in accordance with ASC 740 on the basis of a two-step process. Recognition (Step 1) occurs when we conclude that a tax position, based solely on its technical merits, is more likely than not to be sustained upon examination. Measurement (Step 2) is addressed only if Step 1 has been satisfied. Under Step 2, the tax benefit is measured as the largest amount of benefit, determined on a cumulative probability basis, that is more likely than not to be realized upon ultimate settlement.
We recognize deferred tax assets when it is determined that such assets are more likely than not to be realized in future periods. In making such a determination, we consider all available positive and negative evidence, including future reversals of existing taxable temporary differences, projected future taxable income, projected future tax rates, tax-planning strategies, and results of recent operations. If we determine that we would be able to realize our deferred tax assets in the future in excess of their net recorded amount, we would make an adjustment to the deferred tax asset valuation allowance, which would reduce our provision for income taxes.
42
We were required to base certain of our income tax estimates and assumptions on incomplete information and/or preliminary interpretations of the effects of Enactment. As a result, we may need to reflect further adjustments to our deferred tax assets and liabilities recorded as of December 31, 2017 in future periods upon obtaining, preparing, or analyzing additional information about facts and circumstances that existed as of that date that, if known at that time, would have affected the income tax effects initially reported.
Valuation of Investments
Our investments in fixed maturity and equity securities are classified as available-for-sale and are reported at fair value with unrealized gains and losses excluded from earnings and reported as a separate component of stockholders' equity, net of deferred taxes, in accumulated other comprehensive income. Realized gains and losses resulting from sales of investments are recognized in operations on a specific-identification basis.
We use third party pricing services to assist us with our investment accounting function. The fair values of our available-for-sale fixed maturity and equity securities are based on quoted market prices, when available. These fair values are obtained primarily from third party pricing services, which generally use Level 1 or Level 2 inputs in accordance with GAAP guidance. The Company obtains a quoted price for each security from third party pricing services, which is derived through recently reported trades for identical or similar securities. For securities not actively traded, the third party pricing services may use quoted market prices of similar instruments or discounted cash flow analyses, incorporating inputs that are currently observable in the markets for similar securities. Inputs that are often used in the valuation methodologies include, but are not limited to, broker quotes, benchmark yields, credit spreads, default rates, and prepayment speeds. The Company also performs quarterly analysis on the prices received from third parties to determine whether the prices are reasonable estimates of fair value, including confirming the fair values of these securities through observable market prices using an alternative pricing source. If differences are noted in this review, the Company may obtain additional information from other pricing services to validate the quoted price (See Note
5
in the Notes to our Consolidated Financial Statements).
Impairment of Investment Securities.
When, in the opinion of management, a decline in the fair value of an equity security below its cost is considered to be “other-than-temporary,” the equity security's cost is written down to its fair value at the time the other-than-temporary decline is identified. If management has the intent to sell the debt security or more likely than not will be required to sell the debt security before its anticipated recovery, the investment is written down to its fair value and the entire impairment is recorded as a realized loss due to credit in the accompanying Consolidated Statements of Comprehensive Income. If management does not have the intent to sell or will not be required to sell the debt security but does not expect to recover the amortized cost basis of the debt security, the amount of the other-than-temporary impairment is bifurcated between credit loss and other loss and recorded as a component of realized gains and losses and in other comprehensive income, respectively, in the Consolidated Statements of Comprehensive Income. The amount of any write-down is determined by the difference between the cost or amortized cost of the debt security and its fair value at the time the other-than-temporary decline is identified.
Goodwill and Other Intangible Assets
We prepare an impairment analysis for goodwill and other intangible assets, whereby we identify whether events have occurred that may impact the carrying value of these assets and make assumptions regarding future events, such as cash flows and profitability. Differences between the assumptions used to prepare these valuations and actual results could materially impact the carrying amount of these assets and our operating results.
New Accounting Standards
Recently Issued Accounting Standards
In February 2018, the Financial Accounting Standards Board (FASB) issued
ASU Number 2018-02, Income Statement - Reporting Comprehensive Income (Topic 220)
. The amendments in this update allow a reclassification from accumulated other comprehensive income to retained earnings for stranded tax effects resulting from Enactment. This update becomes effective for fiscal years beginning after December 15, 2018, and interim periods within those fiscal years. Early adoption is permitted for reporting periods for which financial statements have not yet been issued and should be applied in the period of adoption or retrospectively to each period (or periods) in which the effect of the change in the U.S. federal corporate income tax rate in the Tax Cuts and Jobs Act is recognized. We elected to early adopt this update and, accordingly, reclassified
$17.8 million
of net tax effects resulting from Enactment from Accumulated other comprehensive income, net of tax, to Retained earnings at
December 31, 2017
.
In January 2017, the FASB issued
ASU Number 2017-04, Intangibles-Goodwill and Other (Topic 350)
. This update simplifies the measurement of goodwill by eliminating the performance of Step 2 in the goodwill impairment testing. This update allows the testing to be performed by comparing the fair value of a reporting unit with its carrying amount and recognizing an impairment charge when the carrying amount exceeds fair value. Additionally, this update eliminates the requirements of any reporting unit with a zero or negative carrying value to perform Step 2, but requires disclosure of the amount of goodwill allocated to a reporting unit with zero or negative carrying amount of net assets. This update becomes effective for fiscal years beginning after December
43
15, 2019. We do not expect that this update will have a material impact to our consolidated financial condition and results of operations.
In March 2017, the FASB issued
ASU Number 2017-08, Receivables - Nonrefundable Fees and Other Costs (Subtopic 310-20)
. This update shortens the amortization period on callable debt securities held at a premium to the earliest call date, which now closely aligns the amortization period of premiums and discounts to expectations incorporated in the market pricing on callable debt securities. This update becomes effective for fiscal years beginning after December 15, 2018 and interim periods within those fiscal years, and early adoption is permitted. We do not expect that adoption of this update will have a material impact on our consolidated financial condition and results of operations.
In January 2016, the FASB issued
ASU Number 2016-01,
Financial Instruments - Overall
(Subtopic 825-10). This update replaces the guidance to classify equity securities with readily determinable fair values into different categories (trading or available-for-sale) and requires equity securities to be measured at fair value with changes in fair value recognized through net income. Additionally, this update eliminates the disclosure of the method and significant assumptions used to estimate the fair value of financial instruments measured at amortized cost. It requires financial instruments to be measured at fair value using the exit price notion. Furthermore, this update clarifies that an evaluation of deferred tax assets related to available-for-sale securities is needed, in combination with an evaluation of other deferred tax assets, to determine if a valuation allowance is required. This update became effective for fiscal years beginning after December 15, 2017, including interim periods within those fiscal years. We determined this update will result in a reclassification adjustment, net of tax, to retained earnings from accumulated other comprehensive income, which will be determined based on the fair value of securities at the effective date of adoption.
In February 2016, the FASB issued
ASU Number 2016-02, Leases
(Topic 842). This update provides guidance on a new lessee model that includes the recognition of assets and liabilities arising from lease transactions on the balance sheet. Additionally, the update provides clarity on the definition of a lease and the distinction between finance and operating leases. Furthermore, the update requires certain qualitative and quantitative disclosures pertaining to the amounts recorded in the financial statements. This update becomes effective for annual reporting periods, including interim periods within those annual periods, beginning after December 15, 2018 and early adoption is permitted. We have not yet estimated the full impact that the adoption will have on our consolidated financial condition and results of operations. Currently, we are analyzing the impact of the new standard on our current accounting policies, internal controls and lease contracts. Upon completion of these and other assessments, we will evaluate the impact of adopting the new standard on our consolidated financial condition and results of operations.
In May 2014, the FASB issued
ASU Number 2014-09, Revenue from Contracts with Customers (Topic 606).
This update clarifies the principles for recognizing revenue and develops revenue standards to improve the common revenue recognition guidance. The updated guidance requires an entity to recognize revenue as performance obligations are met, in order to reflect the transfer of promised goods or services to customers in an amount that reflects the consideration the entity is entitled to receive for those goods or services. The following steps are applied in the updated guidance: (1) identify the contract(s) with a customer; (2) identify the performance obligations in the contract; (3) determine the transaction price; (4) allocate the transaction price to the performance obligations in the contract; and (5) recognize revenue when, or as, the entity satisfies a performance obligation. In August 2015, the FASB issued ASU 2015-14,
Revenue from Contracts with Customers (Topic 606)
: Deferral of the Effective Date, which deferred the effective date of ASU 2014-09 to annual reporting periods beginning after December 15, 2017, and interim reporting periods within that annual reporting period. Insurance contracts are not within the scope of this updated guidance and we have analyzed revenue streams within the current business operation and determined the adoption of this standard will not have an impact on our consolidated financial condition and results of operations.
Market risk is the risk of potential economic loss principally arising from adverse changes in the fair value of financial instruments. The major components of market risk affecting us are credit risk, interest rate risk, and equity price risk.
Credit Risk
Our investment portfolio is exposed to credit risk, which we attempt to manage through issuer and industry diversification. Our investment guidelines include limitations on the minimum rating of fixed maturity securities and concentrations of a single issuer.
We also bear credit risk with respect to the reinsurers, which can be significant considering that some loss reserves remain outstanding for an extended period of time. We are required to pay losses even if a reinsurer refuses or fails to meet its obligations to us under the applicable reinsurance agreement(s). We continually monitor the financial condition and financial strength ratings of our reinsurers. Additionally, we bear credit risk with respect to premiums receivable, which is generally diversified due to the large number of entities comprising our policyholder base and their dispersion across many different industries and geographies.
Interest Rate Risk
44
Investments
The fair value of our fixed maturity portfolio is exposed to interest rate risk, which is the risk of a decline in fair value resulting from changes in prevailing interest rates, which we strive to limit by managing duration. Our fixed maturity investments (excluding cash and cash equivalents) had a duration of
4.2
at
December 31, 2017
. To minimize interest rate risk, our portfolio is weighted toward short-term and intermediate-term bonds; however, our investment strategy balances consideration of duration, yield and credit risk. We continually monitor the changes in interest rates and the impact on our liquidity and ability to meet our obligations.
Sensitivity Analysis
The fair values or cash flows of market sensitive instruments are subject to potential losses in future earnings resulting from changes in interest rates and other market conditions. Our sensitivity analysis applies a hypothetical parallel shift in market rates and reflects what we believe are reasonably possible near-term changes in those rates (covering a period of time going forward up to one year from the date of the consolidated financial statements). Actual results may differ from the hypothetical change in market rates assumed in this disclosure. This sensitivity analysis does not reflect the results of any action that we may take to mitigate such hypothetical losses in fair value.
We use fair values to measure our potential loss in this model, which includes fixed maturity securities and short-term investments. For invested assets, we use modified duration modeling to calculate changes in fair values. Durations on invested assets are adjusted for call, put, and interest rate reset features. Invested asset portfolio durations are calculated on a market value weighted basis, excluding accrued investment income, using holdings as of
December 31, 2017
. The estimated changes in fair values on our fixed maturity securities and short-term investments, which had an aggregate value of
$2,467.4 million
as of
December 31, 2017
, based on specific changes in interest rates are as follows:
|
Hypothetical Changes in Interest Rates
|
Estimated Pre-tax Increase (Decrease) in Fair Value
|
||||||
|
(in millions, except percentages)
|
|||||||
|
300 basis point rise
|
$
|
(308.3
|
)
|
(12.5
|
)%
|
||
|
200 basis point rise
|
(208.5
|
)
|
(8.5
|
)
|
|||
|
100 basis point rise
|
(104.8
|
)
|
(4.2
|
)
|
|||
|
50 basis point decline
|
51.4
|
|
2.1
|
|
|||
|
100 basis point decline
|
101.8
|
|
4.1
|
|
|||
The most significant assessment of the effects of hypothetical changes in interest rates on investment income would be based on GAAP guidance related to “
Accounting for Nonrefundable Fees and Costs Associated with Originating or Acquiring Loans and Initial Direct Costs of Leases,
”
which requires amortization adjustments for mortgage-backed securities. The rates at which the mortgages underlying mortgage-backed securities are prepaid, and therefore the average life of mortgage-backed securities, can vary depending on changes in interest rates (for example, mortgages are prepaid faster and the average life of mortgage-backed securities falls when interest rates decline). Adjustments for changes in amortization are based on revised average life assumptions and would have an impact on investment income if a significant portion of our commercial and residential mortgage-backed securities were purchased at significant discounts or premiums to par value. As of
December 31, 2017
, the par value of our commercial and residential mortgage-backed securities holdings was
$480.8 million
, and the amortized cost was
102.9%
of par value. Since a majority of our mortgage-backed securities were purchased at a premium or discount that is significant as a percentage of par, an adjustment could have a significant effect on investment income. The commercial and residential mortgage-backed securities portion of the portfolio totaled
18.5%
of total investments as of
December 31, 2017
. Agency-backed residential mortgage pass-throughs totaled
$386.7 million
, or
99.3%
, of the residential mortgage-backed securities portion of the portfolio as of
December 31, 2017
.
Equity Price Risk
Equity price risk is the risk that we may incur losses in the fair value of the equity securities we hold in our available-for-sale investment portfolio. Adverse changes in the market prices of the equity securities we hold in our investment portfolio would result in decreases in the fair value of our total assets. We minimize our exposure to equity price risk by investing primarily in the equity securities of mid-to-large capitalization issuers and by diversifying our equity holdings across several industry sectors.
The table below shows the sensitivity of our equity securities to price changes as of
December 31, 2017
:
|
(in millions)
|
Cost
|
Fair Value
|
10% Fair Value Decrease
|
Pre-tax Impact on Total Equity Securities
|
10% Fair Value Increase
|
Pre-tax Impact on Total Equity Securities
|
|||||||||||||||||
|
Equity securities
|
$
|
116.7
|
|
$
|
210.3
|
|
$
|
189.3
|
|
$
|
(21.0
|
)
|
$
|
231.3
|
|
$
|
21.0
|
|
|||||
45
Effects of Inflation
Inflation could impact our financial statements and results of operations. Our estimates for losses and LAE include assumptions about the timing of closure and future payment of claims and claims handling expenses, such as medical treatments and litigation costs. To the extent inflation causes these costs to increase above established reserves, we will be required to increase those reserves for losses and LAE, reducing our earnings in the period in which the deficiency is identified. We consider inflation in the reserving process by reviewing cost trends and our historical reserving results. We also consider an estimate of increased costs in determining the adequacy of our rates, particularly as it relates to medical and hospital rates where historical inflation rates have exceeded general inflation rates.
Fluctuations in rates of inflation also influence interest rates, which in turn impact the market value of our investment portfolio and yields on new investments. Operating expenses, including payrolls, are also impacted to a certain degree by inflation.
|
|
Page
|
|
Management's Report on Internal Control Over Financial Reporting
|
|
|
Report of Independent Registered Public Accounting Firm on Internal Control over Financial Reporting
|
|
|
Report of Independent Registered Public Accounting Firm
|
|
|
Consolidated Balance Sheets as of December 31, 2017 and 2016
|
|
|
Consolidated Statements of Comprehensive Income for each of the years ended December 31, 2017, 2016 and 2015
|
|
|
Consolidated Statements of Stockholders' Equity for each of the years ended December 31, 2017, 2016 and 2015
|
|
|
Consolidated Statements of Cash Flows for each of the years ended December 31, 2017, 2016 and 2015
|
|
|
Notes to Consolidated Financial Statements
|
|
|
The following Financial Statement Schedules are filed in Item 15 of Part IV of this report:
|
|
|
Financial Statement Schedules:
|
|
|
Schedule II. Condensed Financial Information of Registrant
|
|
|
Pursuant to Rule 7-05 of Regulation S-X, Financial Statement Schedules I, III, IV, V, and VI have been omitted as the information to be set forth therein is included in the Notes to Consolidated Financial Statements.
|
|
46
MANAGEMENT'S REPORT ON INTERNAL CONTROL OVER FINANCIAL REPORTING
Management of Employers Holdings, Inc. and its Subsidiaries (collectively, the Company) is responsible for establishing and maintaining adequate internal control over financial reporting and for the assessment of the effectiveness of internal control over financial reporting. As defined by the Securities and Exchange Commission, internal control over financial reporting is a process designed by, or under the supervision of, the Company's principal executive officer and principal financial officer, and effected by the Company's Board of Directors, management and other personnel, to provide reasonable assurance regarding the reliability of financial reporting and the preparation of financial statements in accordance with U.S. generally accepted accounting principles (GAAP).
The Company's internal control over financial reporting includes policies and procedures that: (a) pertain to the maintenance of records that, in reasonable detail, accurately and fairly reflect the transactions and dispositions of the Company's assets; (b) provide reasonable assurance that transactions are recorded as necessary to permit preparation of financial statements in accordance with GAAP, and that receipts and expenditures of the Company are being made only in accordance with authorizations of its management and Board of Directors; and (c) provide reasonable assurance regarding prevention or timely detection of unauthorized acquisition, use or disposition of the Company's assets that could have a material effect on the financial statements.
Because of its inherent limitations, internal control over financial reporting may not prevent or detect all misstatements. Projections of any evaluation of effectiveness to future periods are subject to the risk that controls may become inadequate because of changes in conditions, or that the degree of compliance with the policies or procedures may deteriorate.
Management conducted an assessment of the effectiveness of the Company's internal control over financial reporting as of
December 31, 2017
based on criteria established in Internal Control–Integrated Framework issued by the Committee of Sponsoring Organizations of the Treadway Commission (2013 framework).
Based on this assessment, management did not identify any material weaknesses in the internal control over financial reporting and management has concluded that the Company's internal control over financial reporting was effective as of
December 31, 2017
.
The Company's independent registered public accounting firm, Ernst & Young LLP, has independently assessed the effectiveness of the Company's internal control over financial reporting. A copy of their report is included in Item 8 of this report.
March 1, 2018
47
REPORT OF INDEPENDENT REGISTERED PUBLIC ACCOUNTING FIRM
The Board of Directors and Stockholders
Employers Holdings, Inc. and Subsidiaries
Opinion on Internal Control over Financial Reporting
We have audited Employers Holdings, Inc. and Subsidiaries' internal control over financial reporting as of
December 31, 2017
, based on criteria established in Internal Control-Integrated Framework issued by the Committee of Sponsoring Organizations of the Treadway Commission (2013 framework) (the COSO criteria). In our opinion, Employers Holdings, Inc. and Subsidiaries' (the Company) maintained, in all material respects, effective internal control over financial reporting as of
December 31, 2017
, based on the COSO criteria.
We also have audited, in accordance with the standards of the Public Company Accounting Oversight Board (United States) (PCAOB), the consolidated balance sheets of Employers Holdings, Inc. and Subsidiaries as of
December 31, 2017
and
2016
, and the related consolidated statements of comprehensive income, stockholders’ equity and cash flows for each of the three years in the period ended
December 31, 2017
, the related notes and financial statement schedule listed in the Index at Item 15 and our report dated
March 1, 2018
expressed an unqualified opinion thereon.
Basis for Opinion
The Company’s management is responsible for maintaining effective internal control over financial reporting and for its assessment of the effectiveness of internal control over financial reporting included in the accompanying Management's Report on Internal Control over Financial Reporting. Our responsibility is to express an opinion on the Company’s internal control over financial reporting based on our audit. We are a public accounting firm registered with the PCAOB and are required to be independent with respect to the Company in accordance with the U.S. federal securities laws and the applicable rules and regulations of the Securities and Exchange Commission and the PCAOB.
We conducted our audit in accordance with the standards of the PCAOB. Those standards require that we plan and perform the audit to obtain reasonable assurance about whether effective internal control over financial reporting was maintained in all material respects.
Our audit included obtaining an understanding of internal control over financial reporting, assessing the risk that a material weakness exists, testing and evaluating the design and operating effectiveness of internal control based on the assessed risk, and performing such other procedures as we considered necessary in the circumstances. We believe that our audit provides a reasonable basis for our opinion.
Definition and Limitations of Internal Control Over Financial Reporting
A company’s internal control over financial reporting is a process designed to provide reasonable assurance regarding the reliability of financial reporting and the preparation of financial statements for external purposes in accordance with generally accepted accounting principles. A company’s internal control over financial reporting includes those policies and procedures that (1) pertain to the maintenance of records that, in reasonable detail, accurately and fairly reflect the transactions and dispositions of the assets of the company; (2) provide reasonable assurance that transactions are recorded as necessary to permit preparation of financial statements in accordance with generally accepted accounting principles, and that receipts and expenditures of the company are being made only in accordance with authorizations of management and directors of the company; and (3) provide reasonable assurance regarding prevention or timely detection of unauthorized acquisition, use, or disposition of the company’s assets that could have a material effect on the financial statements.
Because of its inherent limitations, internal control over financial reporting may not prevent or detect misstatements. Also, projections of any evaluation of effectiveness to future periods are subject to the risk that controls may become inadequate because of changes in conditions, or that the degree of compliance with the policies or procedures may deteriorate.
/s/ Ernst & Young LLP
San Francisco, California
March 1, 2018
48
REPORT OF INDEPENDENT REGISTERED PUBLIC ACCOUNTING FIRM
The Board of Directors and Stockholders
Employers Holdings, Inc. and Subsidiaries
Opinion on the Financial Statements
We have audited the accompanying consolidated balance sheets of Employers Holdings, Inc. and Subsidiaries (the Company) as of
December 31, 2017
and
2016
, the related consolidated statements of comprehensive income, stockholders' equity and cash flows for each of the three years in the period ended
December 31, 2017
, and the related notes and financial statement schedule listed in the Index at Item 15 (collectively referred to as the “consolidated financial statements”). In our opinion, the consolidated financial statements referred to above present fairly, in all material respects, the financial position of the Company at
December 31, 2017
and
2016
, and the results of their operations and their cash flows for each of the three years in the period ended
December 31, 2017
, in conformity with U.S. generally accepted accounting principles.
We also have audited, in accordance with the standards of the Public Company Accounting Oversight Board (United States), the Company’s internal control over financial reporting as of
December 31, 2017
, based on criteria established in Internal Control-Integrated Framework issued by the Committee of Sponsoring Organizations of the Treadway Commission (2013 framework) and our report dated
March 1, 2018
expressed an unqualified opinion thereon.
Basis for Opinion
These financial statements are the responsibility of the Company's management. Our responsibility is to express an opinion on the Company’s financial statements based on our audits. We are a public accounting firm registered with the PCAOB and are required to be independent with respect to the Company in accordance with the U.S. federal securities laws and the applicable rules and regulations of the Securities and Exchange Commission and the PCAOB.
We conducted our audits in accordance with the standards of the PCAOB. Those standards require that we plan and perform the audit to obtain reasonable assurance about whether the financial statements are free of material misstatement, whether due to error or fraud. Our audits included performing procedures to assess the risks of material misstatement of the financial statements, whether due to error or fraud, and performing procedures that respond to those risks. Such procedures included examining, on a test basis, evidence regarding the amounts and disclosures in the financial statements. Our audits also included evaluating the accounting principles used and significant estimates made by management, as well as evaluating the overall presentation of the financial statements. We believe that our audits provide a reasonable basis for our opinion.
/s/ Ernst & Young LLP
We have served as the Company’s auditor since 2002
San Francisco, California
March 1, 2018
49
|
Employers Holdings, Inc. and Subsidiaries
|
||||||||
|
|
||||||||
|
As of December 31,
|
||||||||
|
2017
|
2016
|
|||||||
|
Assets
|
(in millions, except share data)
|
|||||||
|
Investments:
|
|
|
||||||
|
Fixed maturity securities at fair value (amortized cost $2,421.0 at December 31, 2017 and $2,305.9 at December 31, 2016)
|
$
|
2,463.4
|
|
$
|
2,344.4
|
|
||
|
Equity securities at fair value (cost $116.7 at December 31, 2017 and $116.1 at December 31, 2016)
|
210.3
|
|
192.2
|
|
||||
|
Short-term investments at fair value (amortized cost $4.0 at December 31, 2017 and $16.0 at December 31, 2016)
|
4.0
|
|
16.0
|
|
||||
|
Total investments
|
2,677.7
|
|
2,552.6
|
|
||||
|
Cash and cash equivalents
|
73.3
|
|
67.2
|
|
||||
|
Restricted cash and cash equivalents
|
1.0
|
|
3.6
|
|
||||
|
Accrued investment income
|
19.6
|
|
20.6
|
|
||||
|
Premiums receivable (less bad debt allowance of $10.0 at December 31, 2017 and $9.8 at December 31, 2016)
|
326.7
|
|
304.7
|
|
||||
|
Reinsurance recoverable for:
|
|
|
||||||
|
Paid losses
|
7.2
|
|
8.7
|
|
||||
|
Unpaid losses
|
537.0
|
|
580.0
|
|
||||
|
Deferred policy acquisition costs
|
45.8
|
|
44.3
|
|
||||
|
Deferred income taxes, net
|
28.7
|
|
59.4
|
|
||||
|
Property and equipment, net
|
13.9
|
|
22.2
|
|
||||
|
Intangible assets, net
|
7.9
|
|
8.2
|
|
||||
|
Goodwill
|
36.2
|
|
36.2
|
|
||||
|
Contingent commission receivable–LPT Agreement
|
31.4
|
|
31.1
|
|
||||
|
Other assets
|
33.7
|
|
34.6
|
|
||||
|
Total assets
|
$
|
3,840.1
|
|
$
|
3,773.4
|
|
||
|
Liabilities and stockholders’ equity
|
|
|
|
|
||||
|
Claims and policy liabilities:
|
|
|
|
|
||||
|
Unpaid losses and loss adjustment expenses
|
$
|
2,266.1
|
|
$
|
2,301.0
|
|
||
|
Unearned premiums
|
318.3
|
|
310.3
|
|
||||
|
Total claims and policy liabilities
|
2,584.4
|
|
2,611.3
|
|
||||
|
Commissions and premium taxes payable
|
55.3
|
|
48.8
|
|
||||
|
Accounts payable and accrued expenses
|
23.7
|
|
24.2
|
|
||||
|
Deferred reinsurance gain—LPT Agreement
|
|
163.6
|
|
174.9
|
|
|||
|
Notes payable
|
20.0
|
|
32.0
|
|
||||
|
Other liabilities
|
45.4
|
|
41.6
|
|
||||
|
Total liabilities
|
$
|
2,892.4
|
|
$
|
2,932.8
|
|
||
|
Commitments and contingencies (Note 12)
|
|
|
|
|
||||
|
Stockholders’ equity:
|
|
|
|
|
||||
|
Common stock, $0.01 par value; 150,000,000 shares authorized; 56,695,174 and 56,226,277 shares issued and 32,597,819 and 32,128,922 shares outstanding at December 31, 2017 and 2016, respectively
|
$
|
0.6
|
|
$
|
0.6
|
|
||
|
Preferred stock, $0.01 par value; 25,000,000 shares authorized; none issued
|
—
|
|
—
|
|
||||
|
Additional paid-in capital
|
381.2
|
|
372.0
|
|
||||
|
Retained earnings
|
842.2
|
|
777.2
|
|
||||
|
Accumulated other comprehensive income, net of tax
|
107.4
|
|
74.5
|
|
||||
|
Treasury stock, at cost (24,097,355 shares at December 31, 2017 and December 31, 2016)
|
(383.7
|
)
|
(383.7
|
)
|
||||
|
Total stockholders’ equity
|
947.7
|
|
840.6
|
|
||||
|
Total liabilities and stockholders’ equity
|
$
|
3,840.1
|
|
$
|
3,773.4
|
|
||
See accompanying notes.
50
|
Employers Holdings, Inc. and Subsidiaries
|
||||||||||||
|
|
||||||||||||
|
|
Years Ended December 31,
|
|||||||||||
|
|
2017
|
2016
|
2015
|
|||||||||
|
Revenues
|
(in millions, except per share data)
|
|||||||||||
|
Net premiums earned
|
$
|
716.5
|
|
$
|
694.8
|
|
$
|
690.4
|
|
|||
|
Net investment income
|
74.6
|
|
73.2
|
|
72.2
|
|
||||||
|
Net realized gains (losses) on investments
|
7.4
|
|
11.2
|
|
(10.7
|
)
|
||||||
|
Gain on redemption of notes payable
|
2.1
|
|
—
|
|
—
|
|
||||||
|
Other income
|
0.8
|
|
0.6
|
|
0.2
|
|
||||||
|
Total revenues
|
801.4
|
|
779.8
|
|
752.1
|
|
||||||
|
Expenses
|
|
|
|
|
||||||||
|
Losses and loss adjustment expenses
|
417.2
|
|
417.9
|
|
429.4
|
|
||||||
|
Commission expense
|
91.4
|
|
83.5
|
|
85.4
|
|
||||||
|
Underwriting and other operating expenses
|
139.9
|
|
136.1
|
|
135.2
|
|
||||||
|
Interest expense
|
1.4
|
|
1.6
|
|
2.7
|
|
||||||
|
Other expenses
|
7.5
|
|
—
|
|
—
|
|
||||||
|
Total expenses
|
657.4
|
|
639.1
|
|
652.7
|
|
||||||
|
Net income before income taxes
|
144.0
|
|
140.7
|
|
99.4
|
|
||||||
|
Income tax expense
|
42.8
|
|
34.0
|
|
5.0
|
|
||||||
|
Net income
|
$
|
101.2
|
|
$
|
106.7
|
|
$
|
94.4
|
|
|||
|
Comprehensive income
|
||||||||||||
|
Unrealized gains (losses) during the period (net of taxes of $8.9, $(1.0), and $(16.3) for the years ended December 31, 2017, 2016, and 2015, respectively)
|
$
|
19.9
|
|
$
|
(1.8
|
)
|
$
|
(30.3
|
)
|
|||
|
Reclassification adjustment for net realized (gains) losses in net income (net of taxes of $2.6, $3.9, and $(3.7) for the years ended December 31, 2017, 2016, and 2015, respectively)
|
(4.8
|
)
|
(7.3
|
)
|
7.0
|
|
||||||
|
Other comprehensive income (loss), net of tax
|
15.1
|
|
(9.1
|
)
|
(23.3
|
)
|
||||||
|
Total comprehensive income
|
$
|
116.3
|
|
$
|
97.6
|
|
$
|
71.1
|
|
|||
|
Net realized gains (losses) on investments
|
|
|
|
|
||||||||
|
Net realized gains on investments before impairments on fixed maturity and equity securities
|
$
|
8.8
|
|
$
|
17.0
|
|
$
|
6.5
|
|
|||
|
Other than temporary impairments recognized in earnings
|
(1.4
|
)
|
(5.8
|
)
|
(17.2
|
)
|
||||||
|
Net realized gains (losses) on investments
|
$
|
7.4
|
|
$
|
11.2
|
|
$
|
(10.7
|
)
|
|||
|
Earnings per common share (Note 18):
|
|
|
|
|
||||||||
|
Basic
|
$
|
3.11
|
|
$
|
3.29
|
|
$
|
2.94
|
|
|||
|
Diluted
|
$
|
3.06
|
|
$
|
3.24
|
|
$
|
2.90
|
|
|||
|
Cash dividends declared per common share
|
$
|
0.60
|
|
$
|
0.36
|
|
$
|
0.24
|
|
|||
See accompanying notes.
51
|
Employers Holdings, Inc. and Subsidiaries
|
||||||||||||||||||||||||||
|
Consolidated Statements of Stockholders' Equity
|
||||||||||||||||||||||||||
|
Common Stock
|
Additional Paid-In Capital
|
Retained Earnings
|
Accumulated Other Comprehensive Income,
Net of Tax
|
Treasury Stock at Cost
|
Total Stockholders' Equity
|
|||||||||||||||||||||
|
Shares
|
Amount
|
|||||||||||||||||||||||||
|
(in millions, except share data)
|
||||||||||||||||||||||||||
|
Balance, January 1, 2015
|
54,866,802
|
|
$
|
0.6
|
|
$
|
346.6
|
|
$
|
595.3
|
|
$
|
106.9
|
|
$
|
(362.6
|
)
|
$
|
686.8
|
|
||||||
|
Stock-based obligations (Note 14)
|
—
|
|
—
|
|
4.6
|
|
—
|
|
—
|
|
—
|
|
4.6
|
|
||||||||||||
|
Stock options exercised
|
463,466
|
|
—
|
|
7.6
|
|
—
|
|
—
|
|
—
|
|
7.6
|
|
||||||||||||
|
Vesting of restricted and performance stock units, net of shares withheld to satisfy minimum tax withholding (Note 14)
|
259,186
|
|
—
|
|
(2.7
|
)
|
—
|
|
—
|
|
—
|
|
(2.7
|
)
|
||||||||||||
|
Dividends declared
|
—
|
|
—
|
|
—
|
|
(7.7
|
)
|
—
|
|
—
|
|
(7.7
|
)
|
||||||||||||
|
Excess tax benefit from stock-based compensation
|
—
|
|
1.1
|
|
—
|
|
—
|
|
—
|
|
1.1
|
|
||||||||||||||
|
Net income for the year
|
—
|
|
—
|
|
94.4
|
|
—
|
|
—
|
|
94.4
|
|
||||||||||||||
|
Change in net unrealized gains on investments, net of taxes of $(12.6)
|
—
|
|
—
|
|
—
|
|
(23.3
|
)
|
—
|
|
(23.3
|
)
|
||||||||||||||
|
Balance, December 31, 2015
|
55,589,454
|
|
$
|
0.6
|
|
$
|
357.2
|
|
$
|
682.0
|
|
$
|
83.6
|
|
$
|
(362.6
|
)
|
$
|
760.8
|
|
||||||
|
Balance, January 1, 2016
|
55,589,454
|
|
$
|
0.6
|
|
$
|
357.2
|
|
$
|
682.0
|
|
$
|
83.6
|
|
$
|
(362.6
|
)
|
$
|
760.8
|
|
||||||
|
Stock-based obligations (Note 14)
|
—
|
|
—
|
|
5.8
|
|
—
|
|
—
|
|
—
|
|
5.8
|
|
||||||||||||
|
Stock options exercised
|
586,132
|
|
—
|
|
9.6
|
|
—
|
|
—
|
|
—
|
|
9.6
|
|
||||||||||||
|
Vesting of restricted and performance stock units, net of shares withheld to satisfy minimum tax withholding (Note 14)
|
50,691
|
|
—
|
|
(0.6
|
)
|
—
|
|
—
|
|
—
|
|
(0.6
|
)
|
||||||||||||
|
Acquisition of common stock (Note 13)
|
—
|
|
—
|
|
—
|
|
—
|
|
—
|
|
(21.1
|
)
|
(21.1
|
)
|
||||||||||||
|
Dividends declared
|
—
|
|
—
|
|
—
|
|
(11.5
|
)
|
—
|
|
—
|
|
(11.5
|
)
|
||||||||||||
|
Net income for the year
|
—
|
|
—
|
|
106.7
|
|
—
|
|
—
|
|
106.7
|
|
||||||||||||||
|
Change in net unrealized gains on investments, net of taxes of $(4.9)
|
—
|
|
—
|
|
—
|
|
(9.1
|
)
|
—
|
|
(9.1
|
)
|
||||||||||||||
|
Balance, December 31, 2016
|
56,226,277
|
|
$
|
0.6
|
|
$
|
372.0
|
|
$
|
777.2
|
|
$
|
74.5
|
|
$
|
(383.7
|
)
|
$
|
840.6
|
|
||||||
|
Balance, January 1, 2017
|
56,226,277
|
|
$
|
0.6
|
|
$
|
372.0
|
|
$
|
777.2
|
|
$
|
74.5
|
|
$
|
(383.7
|
)
|
$
|
840.6
|
|
||||||
|
Stock-based obligations (Note 14)
|
—
|
|
—
|
|
6.9
|
|
—
|
|
—
|
|
—
|
|
6.9
|
|
||||||||||||
|
Stock options exercised
|
307,076
|
|
—
|
|
6.0
|
|
—
|
|
—
|
|
—
|
|
6.0
|
|
||||||||||||
|
Vesting of restricted and performance stock units, net of shares withheld to satisfy minimum tax withholding (Note 14)
|
161,821
|
|
—
|
|
(2.2
|
)
|
—
|
|
—
|
|
—
|
|
(2.2
|
)
|
||||||||||||
|
Grant date fair value adjustment
|
—
|
|
—
|
|
(1.5
|
)
|
1.3
|
|
—
|
|
—
|
|
(0.2
|
)
|
||||||||||||
|
Dividends declared
|
—
|
|
—
|
|
—
|
|
(19.7
|
)
|
—
|
|
—
|
|
(19.7
|
)
|
||||||||||||
|
Net income for the year
|
—
|
|
—
|
|
101.2
|
|
—
|
|
—
|
|
101.2
|
|
||||||||||||||
|
Net impact of tax Enactment on net unrealized gains on investments
|
—
|
|
—
|
|
—
|
|
(17.8
|
)
|
17.8
|
|
—
|
|
—
|
|
||||||||||||
|
Change in net unrealized gains on investments, net of taxes of $(6.3)
|
—
|
|
—
|
|
—
|
|
15.1
|
|
—
|
|
15.1
|
|
||||||||||||||
|
Balance, December 31, 2017
|
56,695,174
|
|
$
|
0.6
|
|
$
|
381.2
|
|
$
|
842.2
|
|
$
|
107.4
|
|
$
|
(383.7
|
)
|
$
|
947.7
|
|
||||||
See accompanying notes.
52
|
Employers Holdings, Inc. and Subsidiaries
|
||||||||||||
|
|
||||||||||||
|
|
Years Ended December 31,
|
|||||||||||
|
2017
|
2016
|
2015
|
||||||||||
|
Operating activities
|
(in millions)
|
|||||||||||
|
Net income
|
$
|
101.2
|
|
$
|
106.7
|
|
$
|
94.4
|
|
|||
|
Adjustments to reconcile net income to net cash provided by operating activities:
|
|
|
||||||||||
|
Depreciation and amortization
|
8.2
|
|
8.5
|
|
8.3
|
|
||||||
|
Stock-based compensation
|
6.8
|
|
5.8
|
|
4.6
|
|
||||||
|
Amortization of premium on investments, net
|
14.3
|
|
14.6
|
|
12.8
|
|
||||||
|
Allowance for doubtful accounts
|
0.2
|
|
(2.4
|
)
|
4.3
|
|
||||||
|
Deferred income tax expense (benefit)
|
24.2
|
|
13.4
|
|
(5.6
|
)
|
||||||
|
Net realized (gains) losses on investments
|
(7.4
|
)
|
(11.2
|
)
|
10.7
|
|
||||||
|
Gain on redemption of notes payable
|
(2.1
|
)
|
—
|
|
—
|
|
||||||
|
Write-off of previously capitalized costs
|
7.5
|
|
—
|
|
—
|
|
||||||
|
Excess tax benefits from stock-based compensation
|
—
|
|
—
|
|
(1.2
|
)
|
||||||
|
Change in operating assets and liabilities:
|
|
|
||||||||||
|
Premiums receivable
|
(22.2
|
)
|
(1.2
|
)
|
(9.6
|
)
|
||||||
|
Reinsurance recoverable on paid and unpaid losses
|
44.5
|
|
47.2
|
|
44.3
|
|
||||||
|
Current federal income taxes
|
(2.7
|
)
|
7.7
|
|
(3.9
|
)
|
||||||
|
Unpaid losses and loss adjustment expenses
|
(34.9
|
)
|
(46.5
|
)
|
(22.2
|
)
|
||||||
|
Unearned premiums
|
8.0
|
|
1.4
|
|
(1.9
|
)
|
||||||
|
Accounts payable, accrued expenses and other liabilities
|
(7.0
|
)
|
(4.2
|
)
|
8.6
|
|
||||||
|
Deferred reinsurance gain–LPT Agreement
|
(11.3
|
)
|
(14.6
|
)
|
(17.5
|
)
|
||||||
|
Contingent commission receivable–LPT Agreement
|
(0.3
|
)
|
(1.9
|
)
|
(2.8
|
)
|
||||||
|
Other
|
15.3
|
|
(0.5
|
)
|
(6.9
|
)
|
||||||
|
Net cash provided by operating activities
|
142.3
|
|
122.8
|
|
116.4
|
|
||||||
|
Investing activities
|
|
|
|
|
|
|
||||||
|
Purchases of fixed maturity securities
|
(592.3
|
)
|
(466.8
|
)
|
(476.9
|
)
|
||||||
|
Purchases of equity securities
|
(36.8
|
)
|
(49.1
|
)
|
(85.1
|
)
|
||||||
|
Purchases of short-term investments
|
(8.2
|
)
|
(10.0
|
)
|
—
|
|
||||||
|
Proceeds from sale of fixed maturity securities
|
249.8
|
|
132.4
|
|
105.4
|
|
||||||
|
Proceeds from sale of equity securities
|
41.2
|
|
80.4
|
|
34.7
|
|
||||||
|
Proceeds from maturities and redemptions of fixed maturity securities
|
215.7
|
|
230.6
|
|
323.9
|
|
||||||
|
Proceeds from maturities of short-term investments
|
20.2
|
|
—
|
|
—
|
|
||||||
|
Net change in unsettled investment purchases and sales
|
5.8
|
|
—
|
|
—
|
|
||||||
|
Capital expenditures and other
|
(8.2
|
)
|
(5.0
|
)
|
(11.5
|
)
|
||||||
|
Change in restricted cash and cash equivalents
|
2.6
|
|
(1.1
|
)
|
8.3
|
|
||||||
|
Net cash used in investing activities
|
(110.2
|
)
|
(88.6
|
)
|
(101.2
|
)
|
||||||
|
Financing activities
|
|
|
|
|
||||||||
|
Acquisition of common stock
|
—
|
|
(21.1
|
)
|
—
|
|
||||||
|
Cash transactions related to stock-based compensation
|
3.8
|
|
9.0
|
|
4.8
|
|
||||||
|
Dividends paid to stockholders
|
(19.7
|
)
|
(11.5
|
)
|
(7.7
|
)
|
||||||
|
Redemption of notes payable
|
(9.9
|
)
|
—
|
|
(60.0
|
)
|
||||||
|
Payments on capital leases
|
(0.2
|
)
|
—
|
|
(0.5
|
)
|
||||||
|
Excess tax benefits from stock-based compensation
|
—
|
|
—
|
|
1.2
|
|
||||||
|
Net cash used in financing activities
|
(26.0
|
)
|
(23.6
|
)
|
(62.2
|
)
|
||||||
|
Net increase (decrease) in cash and cash equivalents
|
6.1
|
|
10.6
|
|
(47.0
|
)
|
||||||
|
Cash and cash equivalents at the beginning of the period
|
67.2
|
|
56.6
|
|
103.6
|
|
||||||
|
Cash and cash equivalents at the end of the period
|
$
|
73.3
|
|
$
|
67.2
|
|
$
|
56.6
|
|
|||
|
Non-cash transactions
|
||||||||||||
|
Financed property and equipment purchases
|
$
|
0.4
|
|
$
|
0.7
|
|
$
|
0.3
|
|
|||
|
Non-cash exchange of fixed maturity investments for short-term investments
|
$
|
—
|
|
$
|
6.0
|
|
$
|
—
|
|
|||
See accompanying notes.
53
Employers Holdings, Inc. and Subsidiaries
Notes to Consolidated Financial Statements
|
December 31, 2017
|
1. Basis of Presentation and Summary of Operations
Nature of Operations and Organization
Employers Holdings, Inc. (EHI) is a Nevada holding company. Through its wholly owned insurance subsidiaries, Employers Insurance Company of Nevada (EICN), Employers Compensation Insurance Company (ECIC), Employers Preferred Insurance Company (EPIC), and Employers Assurance Company (EAC), EHI is engaged in the commercial property and casualty insurance industry, specializing in workers' compensation products and services. Unless otherwise indicated, all references to the “Company” refer to EHI, together with its subsidiaries.
In 1999, the Nevada State Industrial Insurance System (the Fund) entered into a retroactive 100% quota share reinsurance agreement (the LPT Agreement) through a loss portfolio transfer transaction with third party reinsurers. The LPT Agreement commenced on June 30, 1999 and will remain in effect until all claims under the covered policies have closed, the LPT Agreement is commuted or terminated, upon the mutual agreement of the parties, or the reinsurers' aggregate maximum limit of liability is exhausted, whichever occurs first. The LPT Agreement does not provide for any additional termination terms. On January 1, 2000, EICN assumed all of the assets, liabilities and operations of the Fund, including the Fund's rights and obligations associated with the LPT Agreement. See Notes
3
and
10
.
The Company accounts for the LPT Agreement as retroactive reinsurance. Upon entry into the LPT Agreement, an initial deferred reinsurance gain (the Deferred Gain) was recorded as a liability on the Company’s Consolidated Balance Sheets. The Company is entitled to receive a contingent profit commission under the LPT Agreement. The contingent profit commission is estimated based on both actual paid results to date and projections of expected paid losses under the LPT Agreement and is recorded as an asset on the Company's Consolidated Balance Sheets.
Basis of Presentation
The accompanying consolidated financial statements have been prepared in accordance with U.S. generally accepted accounting principles (GAAP). All intercompany transactions and balances have been eliminated in consolidation.
The Company operates as a single operating segment, workers’ compensation insurance, through its wholly owned subsidiaries. The Company considers an operating segment to be any component of its business whose operating results are regularly reviewed by the Company's chief operating decision maker to make decisions about resources to be allocated to the segment and assess its performance based on discrete financial information.
Use of Estimates
The preparation of the consolidated financial statements in conformity with GAAP requires management to make estimates and assumptions that affect the reported amounts of assets and liabilities and disclosure of contingent assets and liabilities at the date of the consolidated financial statements and the reported amounts of revenues and expenses during the reporting period. As a result, actual results could differ from these estimates. The most significant areas that require management judgment are the estimate of unpaid losses and loss adjustment expenses (LAE), evaluation of reinsurance recoverables, recognition of premium revenue, recoverability of deferred income taxes, and valuation of investments.
Pending Acquisition
On August 11, 2017, the Company entered into a stock purchase agreement (Purchase Agreement) with Partner Reinsurance Company of the U.S. (PRUS) with respect to the acquisition (Acquisition) of all of the outstanding shares of capital stock of PartnerRe Insurance Company of New York (PRNY). The purchase price is equal to the sum of: (i) the amount of statutory capital and surplus of PRNY at closing (which is currently estimated to be approximately
$40.0 million
); and (ii)
$5.8 million
. The Company expects to fund the Acquisition with cash on hand.
Pursuant to the Purchase Agreement, all liabilities and obligations of PRNY existing as of the closing date, whether known or unknown, will be assumed by PRUS. In addition, PartnerRe Ltd., the parent company of PRUS, has provided the Company with a Guaranty that unconditionally, absolutely and irrevocably guarantees the full and prompt payment and performance by PRUS of all of its obligations, liabilities and indemnities under the Purchase Agreement and the transactions contemplated thereby.
The Company will not be acquiring any employees or ongoing business operations pursuant to the Acquisition. The Acquisition is subject to certain closing conditions, including, among other things, approval from the Department of Financial Services of the State of New York.
54
2
. Changes in Estimates
The Company reduced its estimated loss and LAE reserves ceded under the LPT Agreement (LPT Reserve Adjustments) in each of the years
2016
and
2015
as a result of the determination that adjustments were necessary to reflect observed favorable paid loss trends in each of these years. There were
no
LPT Reserve Adjustments in 2017. The following table shows the financial statement impact related to the LPT Reserve Adjustments.
|
2016
|
2015
|
|||||||
|
(in millions, except per share data)
|
||||||||
|
LPT Reserve Adjustments
|
$
|
(5.0
|
)
|
$
|
(10.0
|
)
|
||
|
Cumulative adjustment to the Deferred Gain
(1)
|
(3.1
|
)
|
(6.4
|
)
|
||||
|
Net income impact from this change in estimate
|
3.1
|
|
6.4
|
|
||||
|
Earnings per common share impact from this change in estimate
|
||||||||
|
Basic
|
0.10
|
|
0.20
|
|
||||
|
Diluted
|
0.09
|
|
0.20
|
|
||||
|
(1)
|
The cumulative adjustments to the Deferred Gain were also recognized in losses and LAE incurred in the Company's Consolidated Statements of Comprehensive Income, so that the Deferred Gain reflects the balance that would have existed had the revised loss and LAE reserves been recognized at the inception of the LPT Agreement.
|
The Company increased its estimate of Contingent commission receivable – LPT Agreement (LPT Contingent Commission Adjustments) in each of
2017
,
2016
, and
2015
as a result of the determination that adjustments were necessary to reflect observed favorable paid loss trends in each of those years. The following table shows the impact to the Consolidated Statements of Comprehensive Income related to these changes in estimates.
|
2017
|
2016
|
2015
|
||||||||||
|
(in millions, except per share data)
|
||||||||||||
|
Change in estimate of Contingent commission receivable - LPT Agreement
|
$
|
0.3
|
|
$
|
1.9
|
|
$
|
2.8
|
|
|||
|
Cumulative adjustment to the Deferred Gain
(1)
|
(0.3
|
)
|
(1.8
|
)
|
(2.6
|
)
|
||||||
|
Net income impact from this change in estimate
|
0.3
|
|
1.8
|
|
2.6
|
|
||||||
|
Earnings per common share impact from this change in estimate
|
||||||||||||
|
Basic
|
0.01
|
|
0.06
|
|
0.08
|
|
||||||
|
Diluted
|
0.01
|
|
0.05
|
|
0.08
|
|
||||||
|
(1)
|
The cumulative adjustments to the Deferred Gain were also recognized in losses and LAE incurred in the Company's Consolidated Statements of Comprehensive Income, so that the Deferred Gain reflects the balance that would have existed had the revised loss and LAE reserves been recognized at the inception of the LPT Agreement.
|
The Company reallocated loss and LAE reserves from non-taxable periods prior to January 1, 2000 to taxable years, which reduced its effective tax rate in
2015
. These changes in estimates were the result of the determination that a reallocation of reserves among accident years was appropriate to address a continuation of observed loss trends in 2015. The following table shows the financial statement impact of these changes in estimates.
|
2015
|
||||
|
(in millions, except per share data)
|
||||
|
Loss and LAE reserves reallocated to taxable years
|
$
|
56.3
|
|
|
|
Impact to effective tax rate
|
(15.4
|
)%
|
||
|
Net income impact from this change in estimate
|
$
|
15.3
|
|
|
|
Earnings per common share impact from this change in estimate
|
||||
|
Basic
|
0.48
|
|
||
|
Diluted
|
0.47
|
|
||
No
reallocations of losses and LAE reserves from non-taxable periods were made in
2017
or
2016
.
3
. Summary of Significant Accounting Policies
Cash and Cash Equivalents
The Company considers all liquid investments with maturities of less than three months, as measured from the date of purchase, to be cash equivalents.
55
Restricted Cash and Cash Equivalents
Restricted cash and cash equivalents represent cash and cash equivalents held in trust in order to secure certain of the Company's obligations and, accordingly, are restricted as to withdrawal or usage. As of
December 31, 2017
and
2016
the Company held
$24.5 million
and
$27.2 million
, respectively, in trust for reinsurance obligations, of which
$1.0 million
and
$3.6 million
, respectively, represented restricted cash and cash equivalents.
Short-Term Investments
The Company considers all liquid investments with maturities of between three and twelve months, as measured from the date of purchase, to be short-term investments.
Investment Securities
The Company's investments in fixed maturity securities and equity securities are classified as available-for-sale and are reported at fair value with unrealized gains and losses excluded from earnings and reported as a separate component of stockholders' equity, net of deferred taxes, in accumulated other comprehensive income on the Company’s Consolidated Balance Sheets.
Investment income consists primarily of interest and dividends generated by investment securities. Interest is recorded as earned on an accrual basis and dividends are recorded as earned at the ex-dividend date. Interest income on mortgage-backed and asset-backed securities is determined using the effective-yield method based on estimated principal repayments. Mortgage-backed securities are adjusted for the effects of changes in prepayment assumptions on the related accretion of discount or amortization of premium of such securities using the retrospective method.
Realized gains and losses on investments are determined on a specific-identification basis.
When, in the opinion of management, a decline in the fair value of an equity security below its cost is considered to be “other-than-temporary,” the equity security's cost is written down to its fair value at the time the other-than-temporary decline is identified. The determination of an other-than-temporary decline for fixed maturity securities includes, in addition to other relevant factors, a presumption that if the market value is below cost by a significant amount for a period of time, a bifurcation of the write-down may be necessary based on the portion of the loss that is deemed to be a “credit loss”, which is considered a realized loss, and the portion that is deemed to be an “other than credit loss”, which is considered to be an unrealized loss. If management has the intent to sell the fixed maturity security or more likely than not will be required to sell the fixed maturity security before its anticipated recovery, the investment is written down to its fair value and the entire impairment is recorded as a realized loss in the Company's Consolidated Statements of Comprehensive Income. If management does not have the intent to sell or will not be required to sell the fixed maturity security but does not expect to recover the amortized cost basis of the fixed maturity security, the amount of the other-than-temporary impairment is bifurcated (see Note
6
).
Recognition of Revenue and Expense
Revenue Recognition
Premiums written are recognized as revenues, net of any applicable underlying reinsurance coverage, and are earned over the term of the related policy. At the end of the policy term, payroll-based premium audits are performed on substantially all policyholder accounts to determine the actual amount of net premiums earned for that policy year. Earned but unbilled premiums include estimated future audit premiums based on the Company's historical experience. These estimates are subject to changes in policyholders' payrolls, economic conditions, and seasonality, and are continually reviewed and adjusted as experience develops or new information becomes known. Any such adjustments are included in current operations; however, they are partially offset by the resulting changes in losses and LAE, commission expenses, and premium taxes. The Company's premiums receivable on its Consolidated Balance Sheets included
$64.2 million
and
$58.4 million
of additional premiums expected to be received from policyholders for final audits at
December 31, 2017
and
2016
, respectively.
The Company establishes a bad debt allowance on its premiums receivable through a charge included in underwriting and other operating expenses in its Consolidated Statements of Comprehensive Income. This bad debt allowance is determined based on estimates and assumptions to project future experience. After all collection efforts have been exhausted, the Company reduces the bad debt allowance for write-offs of premiums receivable that have been deemed uncollectible. The Company's bad debt allowance was
$10.0 million
and
$9.8 million
at
December 31, 2017
and
2016
, respectively. The Company had write offs, net of recoveries of amounts previously written off, of
$3.2 million
,
$6.0 million
, and
$2.4 million
for the years ended
December 31, 2017
,
2016
, and
2015
, respectively.
Deferred Policy Acquisition Costs
Policy acquisition costs, those costs that relate directly to the successful acquisition of new or renewal insurance contracts, including underwriting, policy issuance and processing, medical and inspection, and sales force contract selling are deferred and amortized as the related premiums are earned. Amortization of deferred policy acquisition costs for the years ended
December 31, 2017
,
2016
, and
2015
, was
$108.2 million
,
$104.5 million
, and
$103.9 million
, respectively.
56
If the sum of a policy’s expected losses and LAE and deferred policy acquisition costs exceeds the related unearned premiums and projected investment income, a premium deficiency is determined to exist. In this event, deferred policy acquisition costs are immediately expensed to the extent necessary to eliminate the premium deficiency. If the premium deficiency exceeds deferred acquisition costs then a liability is accrued for the excess deficiency. There were
no
premium deficiency adjustments recognized during the years ended
December 31, 2017
,
2016
, and
2015
.
Unpaid Loss and LAE Reserves
Unpaid loss and LAE reserves represent management's best estimate of the ultimate net cost of all reported and unreported losses incurred for the applicable periods, less payments made. The estimated reserves for losses and LAE include the accumulation of estimates for all claims reported prior to the balance sheet date, estimates of claims incurred but not reported, and estimates of expenses for investigating and adjusting all incurred and unadjusted claims (based on projections of relevant historical data). Amounts reported are subject to the impact of future changes in economic, regulatory and social conditions. Management believes that, subject to the inherent variability in any such estimate, the reserves are within a reasonable and acceptable range of adequacy. Estimates for claims prior to the balance sheet date are continually monitored and reviewed, and as settlements are made or reserves adjusted, the differences are reported in current operations. Salvage and subrogation recoveries are estimated based on a review of the level of historical salvage and subrogation recoveries.
Reinsurance
In the ordinary course of business, the Company may purchase excess of loss reinsurance in order to protect it against the impact of large and/or catastrophic losses. Additionally, the Company is a party to the LPT Agreement (see Note
10
). These reinsurance arrangements reduce the Company's exposure to such losses since its reinsurers are liable to the Company to the extent of the reinsurance protection provided. However, the Company remains liable for all losses it incurs to the extent that any reinsurer is unable or unwilling to make timely payments under its reinsurance agreements.
Balances due from reinsurers on unpaid losses, including an estimate of such recoverables related to reserves for incurred but not reported losses, are reported as reinsurance recoverables on the Company’s Consolidated Balance Sheets. Reinsurance recoverables on paid losses represents amounts currently due from reinsurers. Reinsurance recoverables on unpaid losses represents amounts that will be collectible from reinsurers once the losses are paid. Reinsurance recoverables on unpaid losses and LAE amounted to
$537.0 million
and
$580.0 million
at
December 31, 2017
and
2016
, respectively.
Ceded reinsurance premiums are accounted for on a basis consistent with those used in accounting for the underlying premiums, and are reported as reductions to arrive at net premiums written and earned.
Ceded losses and LAE are also accounted for on a basis consistent with those used in accounting for the original policies issued and the terms of the relevant reinsurance agreement, and are recorded as reductions to losses and LAE incurred.
Pursuant to the LPT Agreement, LAE is deemed to be
7%
of total losses paid and are payable to the Company as compensation for management of the claims under the LPT Agreement. The Deferred Gain is amortized using the recovery method, whereby the amortization is determined by the proportion of actual reinsurance recoveries to total estimated recoveries through the life of the LPT Agreement, and is recorded in losses and LAE incurred in the Company's Consolidated Statements of Comprehensive Income. Any adjustment to the estimated loss and LAE reserves ceded under the LPT Agreement results in a cumulative adjustment to the Deferred Gain, which is also recognized in losses and LAE incurred in the Company's Consolidated Statements of Comprehensive Income, such that the Deferred Gain reflects the balance that would have existed had the revised reserves been recognized at the inception of the LPT Agreement.
Additionally, the Company is entitled to receive a contingent profit commission under the LPT Agreement. The contingent profit commission is equal to
30%
of the favorable difference between actual paid losses and LAE and expected paid losses and LAE as established in the LPT Agreement based on losses paid through June 30, 2024. The contingent profit commission is paid
every five years
beginning June 30, 2004 for the first
25
years of the agreement. The Company could be required to return any previously received contingent profit commission, plus interest, in the event of unfavorable differences through June 30, 2024. The Company records an estimate of contingent profit commission in its Consolidated Balance Sheets as Contingent commission receivable–LPT Agreement and a corresponding liability is recorded as Deferred reinsurance gain–LPT Agreement. The Contingent commission receivable–LPT Agreement is reduced as amounts are received from participating reinsurers. The Deferred reinsurance gain–LPT Agreement is amortized using the recovery method. The amortization of the contingent profit commission is determined by the proportion of actual reinsurance recoveries to total estimated recoveries over the life of the contingent profit commission (through June 30, 2024), and is recorded in losses and LAE incurred in the Company's Consolidated Statements of Comprehensive Income. Any adjustment to the contingent profit commission under the LPT Agreement results in a cumulative adjustment to the Deferred Gain, which is also recognized in losses and LAE incurred in the Company's Consolidated Statements of Comprehensive Income, such that the Deferred Gain reflects the balance that would have existed had the revised contingent profit commission been recognized at the inception of the LPT Agreement.
57
Property and Equipment
Property and equipment are stated at cost less accumulated depreciation (see Note
7
). Expenditures for maintenance and repairs are charged against operations as incurred.
Electronic data processing equipment, software, furniture and equipment, and automobiles are depreciated using the
straight-line method over three to seven years
. Leasehold improvements are carried at cost less accumulated amortization. The Company amortizes leasehold improvements using the straight-line method over the lesser of the useful life of the asset or the remaining original lease term, excluding options or renewal periods. Leasehold improvements are generally
amortized over three to five years
.
Obligations Held Under Capital Leases
Leased property and equipment meeting capital lease criteria are capitalized at the lower of the present value of the related lease payments or the fair value of the leased asset at the inception of the lease. Amortization is calculated using the straight-line method based on the term of the lease and is included in the depreciation expense of property and equipment. See Note
12
for additional disclosures related to capital leases.
Income Taxes
The Company accounts for income taxes under the asset and liability method, which requires the recognition of deferred tax assets and liabilities for the expected future tax consequences of events that have been included in the Company's financial statements. Under this method, the Company determines deferred tax assets and liabilities on the basis of the differences between the financial statement and tax bases of assets and liabilities by using enacted tax rates in effect for the year in which the differences are expected to reverse. The effect of the recent change in tax rates on the Company's deferred tax assets and liabilities was recognized within continuing operations in income as of December 22, 2017, the date that the Tax Cuts and Jobs Act was enacted (Enactment) and created stranded tax effects within accumulated other comprehensive income that did not reflect the newly enacted tax rate. The Company reclassified the net tax effects from Accumulated other comprehensive income, net of tax, to Retained earnings as of the date of Enactment.
The Company records uncertain tax positions in accordance with ASC 740 on the basis of a two-step process. Recognition (Step 1) occurs when the Company concludes that a tax position, based solely on its technical merits, is more likely than not to be sustained upon examination. Measurement (Step 2) is addressed only if Step 1 has been satisfied. Under Step 2, the tax benefit is measured as the largest amount of benefit, determined on a cumulative probability basis, that is more likely than not to be realized upon ultimate settlement.
The Company recognizes deferred tax assets when it determines that such assets are more likely than not to be realized in future periods. In making such a determination, the Company considers all available positive and negative evidence, including future reversals of existing taxable temporary differences, tax-planning strategies, projected future taxable income, projected future tax rates, and results of recent operations. If the Company determines that it is not more likely than not that it could realize its deferred tax assets in future periods it would establish a deferred tax asset valuation allowance that would increase the Company's provision for income taxes. If the Company determines that it would be able to realize its deferred tax assets in the future in excess of its net recorded amount, the Company would make an adjustment to the deferred tax asset valuation allowance, which would reduce the provision for income taxes.
Credit Risk
Financial instruments that potentially subject the Company to concentrations of credit risk are primarily cash and cash equivalents (including restricted cash equivalents), short-term investments, investment securities, premiums receivable, and reinsurance recoverable balances.
The Company’s cash equivalents and short-term investments include investments in money market securities and securities backed by the U.S. government. The Company's investment securities are diversified throughout many industries and geographic regions and include investments in U.S. government and U.S. government-sponsored enterprises. The Company believes that it has no significant concentrations of credit risk from a single issue or issuer within its cash equivalents, short-term investments and investment securities other than concentrations in U.S. government and U.S. government-sponsored enterprises.
The Company's premiums receivable are generally diversified due to the large number of entities composing the Company's policyholder base and their dispersion across many different industries.
The Company monitors the financial condition of its reinsurers to minimize its exposure to significant losses from reinsurer insolvencies. The Company also obtains collateral from its reinsurers in order to mitigate the risks related to insolvencies. At
December 31, 2017
,
$3.5 million
of the Company's reinsurance recoverables were collateralized by cash or letters of credit and an additional
$380.8 million
was in trust accounts for reinsurance recoverables specifically related to the LPT Agreement.
58
Fair Value of Financial Instruments
The fair values of the Company's financial instruments have been determined using available market information and other appropriate valuation methodologies. Judgment is required in developing fair value estimates where quoted market prices are not available. Accordingly, these estimates are not necessarily indicative of the amounts that could be realized in a current market exchange. The use of different market assumptions or estimating methodologies may have an effect on the estimated fair value amounts.
The following methods and assumptions were used by the Company in estimating the fair value of its financial instruments:
Cash and cash equivalents, short-term investments, premiums receivable, accounts payable and accrued expenses, and other liabilities.
The carrying amounts for each of these financial instruments as reported in the Company's Consolidated Balance Sheets approximate their fair values.
Investment securities.
The Company’s investment securities are predominantly valued on the basis of actual market transactions or observable inputs. A small portion of the Company’s investment securities are valued on the basis of pricing models with significant unobservable inputs or nonbinding broker quotes. See Note
5
.
Goodwill and Other Intangible Assets
The Company tests for impairment of goodwill and non-amortizable intangible assets in the fourth quarter of each year. At the end of each quarter, management considers the results of the previous analysis as well as any recent developments that may constitute triggering events requiring the impairment analysis of goodwill and other intangible assets to be updated. The Company has assessed the effects of current economic conditions on the Company's financial condition and results of operations and changes in the Company's stock price and determined that there were no impairments of these assets as of
December 31, 2017
and
2016
.
Intangible assets related to state licenses are not subject to amortization. Intangibles related to insurance relationships are amortized in proportion to the expected period of benefit over the next year.
The gross carrying value, accumulated amortization, and net carrying value for the Company's intangible assets, by major class, as of December 31, were as follows:
|
2017
|
2016
|
||||||||||||||||||||||
|
Gross
Carrying
Value
|
Accumulated
Amortization
|
Net
Carrying
Value
|
Gross
Carrying
Value
|
Accumulated
Amortization
|
Net
Carrying
Value
|
||||||||||||||||||
|
(in millions)
|
|||||||||||||||||||||||
|
State licenses
|
$
|
7.7
|
|
$
|
—
|
|
$
|
7.7
|
|
$
|
7.7
|
|
$
|
—
|
|
$
|
7.7
|
|
|||||
|
Insurance relationships
|
9.4
|
|
$
|
(9.2
|
)
|
0.2
|
|
9.4
|
|
$
|
(8.9
|
)
|
0.5
|
|
|||||||||
|
Total
|
$
|
17.1
|
|
$
|
(9.2
|
)
|
$
|
7.9
|
|
$
|
17.1
|
|
$
|
(8.9
|
)
|
$
|
8.2
|
|
|||||
During the years ended
December 31, 2017
,
2016
, and
2015
, the Company recognized
$0.3 million
,
$0.3 million
, and
$0.5 million
in amortization expenses associated with its intangible assets, respectively. These amortization expenses are included in the Company's Consolidated Statements of Comprehensive Income in underwriting and other operating expenses. Future amortization expenses associated with the Company's intangible assets are expected to be as follows:
|
Year
|
Amount
|
|||
|
(in millions)
|
||||
|
2018
|
0.2
|
|
||
|
Total
|
$
|
0.2
|
|
|
Stock-Based Compensation
The Company provides stock-based compensation to its directors and certain of its employees, which is recognized in its Consolidated Statements of Comprehensive Income based on estimated fair values over the relevant service period (see Note
14
).
4. New Accounting Standards
Recently Issued Accounting Standards
In February 2018, the Financial Accounting Standards Board (FASB) issued
ASU Number 2018-02, Income Statement - Reporting Comprehensive Income (Topic 220)
. The amendments in this update allow a reclassification from accumulated other comprehensive income to retained earnings for stranded tax effects resulting from Enactment. This update becomes effective for fiscal years beginning after December 15, 2018, and interim periods within those fiscal years. Early adoption is permitted for reporting periods for which financial statements have not yet been issued and should be applied in the period of adoption or retrospectively to each
59
period (or periods) in which the effect of the change in the U.S. federal corporate income tax rate in the Tax Cuts and Jobs Act is recognized. The Company elected to early adopt this update and, accordingly, reclassified
$17.8 million
of net tax effects resulting from Enactment from Accumulated other comprehensive income, net of tax, to Retained earnings at
December 31, 2017
.
In January 2017, the FASB issued
ASU Number 2017-04, Intangibles-Goodwill and Other (Topic 350)
. This update simplifies the measurement of goodwill by eliminating the performance of Step 2 in the goodwill impairment testing. This update allows the testing to be performed by comparing the fair value of a reporting unit with its carrying amount and recognizing an impairment charge when the carrying amount exceeds fair value. Additionally, this update eliminates the requirements of any reporting unit with a zero or negative carrying value to perform Step 2, but requires disclosure of the amount of goodwill allocated to a reporting unit with zero or negative carrying amount of net assets. This update becomes effective for fiscal years beginning after December 15, 2019. The Company does not expect that this update will have a material impact to its consolidated financial condition and results of operations.
In March 2017, the FASB issued
ASU Number 2017-08, Receivables - Nonrefundable Fees and Other Costs (Subtopic 310-20)
. This update shortens the amortization period on callable debt securities held at a premium to the earliest call date, which now closely aligns the amortization period of premiums and discounts to expectations incorporated in the market pricing on callable debt securities. This update becomes effective for fiscal years beginning after December 15, 2018 and interim periods within those fiscal years, and early adoption is permitted. The Company does not expect that adoption of this update will have a material impact on its consolidated financial condition and results of operations.
In January 2016, the FASB issued
ASU Number 2016-01,
Financial Instruments - Overall
(Subtopic 825-10). This update replaces the guidance to classify equity securities with readily determinable fair values into different categories (trading or available-for-sale) and requires equity securities to be measured at fair value with changes in fair value recognized through net income. Additionally, this update eliminates the disclosure of the method and significant assumptions used to estimate the fair value of financial instruments measured at amortized cost. It requires financial instruments to be measured at fair value using the exit price notion. Furthermore, this update clarifies that an evaluation of deferred tax assets related to available-for-sale securities is needed, in combination with an evaluation of other deferred tax assets, to determine if a valuation allowance is required. This update became effective for fiscal years beginning after December 15, 2017, including interim periods within those fiscal years. The Company has determined this update will result in a reclassification adjustment, net of tax, to retained earnings from accumulated other comprehensive income, which will be determined based on the fair value of securities at the effective date of adoption.
In February 2016, the FASB issued
ASU Number 2016-02, Leases
(Topic 842). This update provides guidance on a new lessee model that includes the recognition of assets and liabilities arising from lease transactions on the balance sheet. Additionally, the update provides clarity on the definition of a lease and the distinction between finance and operating leases. Furthermore, the update requires certain qualitative and quantitative disclosures pertaining to the amounts recorded in the financial statements. This update becomes effective for annual reporting periods, including interim periods within those annual periods, beginning after December 15, 2018 and early adoption is permitted. Currently, the Company is analyzing the impact of the new standard on its current accounting policies, internal controls, and lease contracts. Upon completion of these and other assessments, the Company will evaluate the impact of adopting the new standard on its consolidated financial condition and results of operations.
In May 2014, the FASB issued
ASU Number 2014-09, Revenue from Contracts with Customers (Topic 606).
This update clarifies the principles for recognizing revenue and develops revenue standards to improve revenue recognition guidance. This update requires an entity to recognize revenue as performance obligations are met in order to reflect the transfer of promised goods or services to customers in an amount that reflects the consideration the entity is entitled to receive for those goods or services. In applying this guidance companies are required to: (1) identify the contract(s) with a customer; (2) identify the performance obligations in the contract(s); (3) determine the transaction price; (4) allocate the transaction price to the performance obligations in the contract(s); and (5) recognize revenue when, or as, the entity satisfies a performance obligation. In August 2015, the FASB issued
ASU 2015-14, Revenue from Contracts with Customers (Topic 606): Deferral of the Effective Date
, which deferred the effective date of ASU 2014-09 to annual reporting periods beginning after December 15, 2017, and interim reporting periods within that annual reporting period. Insurance contracts are not within the scope of this updated guidance. The Company has analyzed revenue streams within the current business operation and determined the adoption of this standard will not have an impact on its consolidated financial condition and results of operations.
60
5
. Fair Value of Financial Instruments
The carrying value and the estimated fair value of the Company's financial instruments as of
December 31,
were as follows:
|
2017
|
2016
|
||||||||||||||
|
Carrying Value
|
Estimated Fair Value
|
Carrying Value
|
Estimated Fair Value
|
||||||||||||
|
Financial assets
|
(in millions)
|
||||||||||||||
|
Investments (Note 6)
|
$
|
2,677.7
|
|
$
|
2,677.7
|
|
$
|
2,552.6
|
|
$
|
2,552.6
|
|
|||
|
Cash and cash equivalents
|
73.3
|
|
73.3
|
|
67.2
|
|
67.2
|
|
|||||||
|
Restricted cash and cash equivalents
|
1.0
|
|
1.0
|
|
3.6
|
|
3.6
|
|
|||||||
|
Financial liabilities
|
|||||||||||||||
|
Notes payable (Note 11)
|
$
|
20.0
|
|
$
|
23.6
|
|
$
|
32.0
|
|
$
|
33.0
|
|
|||
Assets and liabilities recorded at fair value on the Company's Consolidated Balance Sheets are categorized based upon the levels of judgment associated with the inputs used to measure their fair value. Level inputs are defined as follows:
|
•
|
Level 1 - Inputs are unadjusted quoted market prices for identical assets or liabilities in active markets at the measurement date.
|
|
•
|
Level 2 - Inputs other than Level 1 prices that are observable for similar assets or liabilities through corroboration with market data at the measurement date.
|
|
•
|
Level 3 - Inputs that are unobservable that reflect management's best estimate of what willing market participants would use in pricing the assets or liabilities at the measurement date.
|
The Company uses third party pricing services to assist with its investment accounting function. The ultimate pricing source varies depending on the investment security and pricing service used, but investment securities valued on the basis of observable inputs (Levels 1 and 2) are generally assigned values on the basis of actual transactions. Securities valued on the basis of pricing models with significant unobservable inputs or nonbinding broker quotes are classified as Level 3. The Company performs quarterly analyses on the prices it receives from third parties to determine whether the prices are reasonable estimates of fair value, including confirming the fair values of these securities through observable market prices using an alternative pricing source, as it is ultimately management’s responsibility to ensure that the fair values reflected in the Company’s consolidated financial statements are appropriate. If differences are noted in these analyses, the Company may obtain additional information from other pricing services to validate the quoted price.
The Company bases all of its estimates of fair value for assets on the bid price, when available, as it represents what a third-party market participant would be willing to pay in an arm's length transaction.
For securities not actively traded, third party pricing services may use quoted market prices of similar instruments or discounted cash flow analyses, incorporating inputs that are currently observable in the markets for similar securities. Inputs that are often used in the valuation methodologies include, but are not limited to, broker quotes, benchmark yields, credit spreads, default rates, and prepayment speeds. There were no adjustments to prices obtained from third party pricing services as of
December 31, 2017
and
2016
that were material to the consolidated financial statements.
These methods of valuation will only produce an estimate of fair value if there is objectively verifiable information to produce a valuation. If objectively verifiable information is not available, the Company would be required to produce an estimate of fair value using some of the same methodologies, making assumptions for market-based inputs that are unavailable.
The Company's estimates of fair value for its financial liabilities are based on a combination of the variable interest rates for notes with similar durations to discount the projection of future payments on notes payable. The fair value measurements for notes payable have been determined to be Level 2 at each of the periods presented.
Each of the Company's insurance operating subsidiaries is a member of the Federal Home Loan Bank of San Francisco (FHLB). Members are required to purchase stock in the FHLB in addition to maintaining collateral deposits that back any funds advanced. Investment in FHLB stock is recorded at cost, as purchases and sales of these securities are at par value with the issuer. FHLB stock is considered a restricted security and is periodically evaluated by the Company for impairment based on the ultimate recovery of par value. Due to the nature of FHLB stock, its carrying value approximates fair value and was determined by the Company to be Level 3 at each of the periods presented.
Certain of the Company's privately placed asset-backed securities (ABS) are designated as level 3 primarily due to restrictions on resale. Third party pricing based on actual transactions are typically not available for these securities due to the limited nature of observable pricing inputs.
61
The following table presents the items in the Company's Consolidated Balance Sheets that are stated at fair value and the corresponding fair value measurements.
|
December 31, 2017
|
December 31, 2016
|
||||||||||||||||||||||
|
Level 1
|
Level 2
|
Level 3
|
Level 1
|
Level 2
|
Level 3
|
||||||||||||||||||
|
(in millions)
|
|||||||||||||||||||||||
|
Fixed maturity securities
|
|||||||||||||||||||||||
|
U.S. Treasuries
|
$
|
—
|
|
$
|
137.0
|
|
$
|
—
|
|
$
|
—
|
|
$
|
127.4
|
|
$
|
—
|
|
|||||
|
U.S. Agencies
|
—
|
|
11.8
|
|
—
|
|
—
|
|
12.8
|
|
—
|
|
|||||||||||
|
States and municipalities
|
—
|
|
642.5
|
|
—
|
|
—
|
|
851.6
|
|
—
|
|
|||||||||||
|
Corporate securities
|
—
|
|
1,118.0
|
|
—
|
|
—
|
|
956.7
|
|
—
|
|
|||||||||||
|
Residential mortgage-backed securities
|
—
|
|
389.3
|
|
—
|
|
—
|
|
258.0
|
|
—
|
|
|||||||||||
|
Commercial mortgage-backed securities
|
—
|
|
106.0
|
|
—
|
|
—
|
|
95.5
|
|
—
|
|
|||||||||||
|
Asset-backed securities
|
—
|
|
58.8
|
|
—
|
|
—
|
|
35.4
|
|
7.0
|
|
|||||||||||
|
Total fixed maturity securities
|
$
|
—
|
|
$
|
2,463.4
|
|
$
|
—
|
|
$
|
—
|
|
$
|
2,337.4
|
|
$
|
7.0
|
|
|||||
|
Equity securities
|
|||||||||||||||||||||||
|
Industrial and miscellaneous
|
$
|
181.7
|
|
$
|
—
|
|
$
|
—
|
|
$
|
167.2
|
|
$
|
—
|
|
$
|
—
|
|
|||||
|
Non-redeemable preferred (FHLB stock)
|
—
|
|
—
|
|
4.7
|
|
—
|
|
—
|
|
4.9
|
|
|||||||||||
|
Other
|
23.9
|
|
—
|
|
—
|
|
20.1
|
|
—
|
|
—
|
|
|||||||||||
|
Total equity securities
|
$
|
205.6
|
|
$
|
—
|
|
$
|
4.7
|
|
$
|
187.3
|
|
$
|
—
|
|
$
|
4.9
|
|
|||||
|
Short-term investments
|
$
|
—
|
|
$
|
4.0
|
|
$
|
—
|
|
$
|
—
|
|
$
|
16.0
|
|
$
|
—
|
|
|||||
Certain cash equivalents, principally money market securities, are measured at fair value using the net asset value (NAV) per share. The following table presents cash equivalents at NAV and total cash and cash equivalents carried at fair value on the Company's Consolidated Balance Sheets.
|
December 31, 2017
|
|
December 31, 2016
|
|||||
|
Cash and cash equivalents at fair value
|
$
|
34.3
|
|
$
|
9.7
|
|
|
|
Cash equivalents measured at NAV, which approximates fair value
|
39.0
|
|
57.5
|
|
|||
|
Total cash and cash equivalents
|
$
|
73.3
|
|
$
|
67.2
|
|
|
The following table provides a reconciliation of the beginning and ending balances that are measured using Level 3 inputs for the year ended
December 31, 2017
.
|
Level 3 Securities
|
|||||||
|
2017
|
2016
|
||||||
|
(in millions)
|
|||||||
|
Beginning balance, January 1
|
$
|
11.9
|
|
$
|
—
|
|
|
|
Transfers out of Level 3
(1)
|
(7.0
|
)
|
—
|
|
|||
|
Purchases and sales, net
|
(0.2
|
)
|
11.9
|
|
|||
|
Ending balance, December 31
|
$
|
4.7
|
|
$
|
11.9
|
|
|
|
(1)
|
Transferred from Level 3 to Level 2 because observable market data became available for the securities.
|
62
6
. Investments
The cost or amortized cost, gross unrealized gains, gross unrealized losses, and estimated fair value of the Company’s investments were as follows:
|
Cost or Amortized
Cost
|
Gross
Unrealized
Gains
|
Gross
Unrealized
Losses
|
Estimated
Fair Value
|
|||||||||||||
|
At December 31, 2017
|
(in millions)
|
|||||||||||||||
|
Fixed maturity securities
|
|
|
|
|
||||||||||||
|
U.S. Treasuries
|
$
|
135.8
|
|
$
|
2.0
|
|
$
|
(0.8
|
)
|
$
|
137.0
|
|
||||
|
U.S. Agencies
|
11.3
|
|
0.5
|
|
—
|
|
11.8
|
|
||||||||
|
States and municipalities
|
617.0
|
|
25.5
|
|
—
|
|
642.5
|
|
||||||||
|
Corporate securities
|
1,103.4
|
|
18.0
|
|
(3.4
|
)
|
1,118.0
|
|
||||||||
|
Residential mortgage-backed securities
|
388.3
|
|
3.6
|
|
(2.6
|
)
|
389.3
|
|
||||||||
|
Commercial mortgage-backed securities
|
106.5
|
|
0.4
|
|
(0.9
|
)
|
106.0
|
|
||||||||
|
Asset-backed securities
|
58.7
|
|
0.3
|
|
(0.2
|
)
|
58.8
|
|
||||||||
|
Total fixed maturity securities
|
2,421.0
|
|
50.3
|
|
(7.9
|
)
|
2,463.4
|
|
||||||||
|
Equity securities
|
||||||||||||||||
|
Industrial and miscellaneous
|
100.8
|
|
81.5
|
|
(0.6
|
)
|
181.7
|
|
||||||||
|
Non-redeemable preferred (FHLB stock)
|
4.7
|
|
—
|
|
—
|
|
4.7
|
|
||||||||
|
Other
|
11.2
|
|
12.7
|
|
—
|
|
23.9
|
|
||||||||
|
Total equity securities
|
116.7
|
|
94.2
|
|
(0.6
|
)
|
210.3
|
|
||||||||
|
Short-term investments
|
4.0
|
|
—
|
|
—
|
|
4.0
|
|
||||||||
|
Total investments
|
$
|
2,541.7
|
|
$
|
144.5
|
|
$
|
(8.5
|
)
|
$
|
2,677.7
|
|
||||
|
At December 31, 2016
|
||||||||||||||||
|
Fixed maturity securities
|
||||||||||||||||
|
U.S. Treasuries
|
$
|
124.1
|
|
$
|
3.5
|
|
$
|
(0.2
|
)
|
$
|
127.4
|
|
||||
|
U.S. Agencies
|
11.9
|
|
0.9
|
|
—
|
|
12.8
|
|
||||||||
|
States and municipalities
|
833.0
|
|
24.7
|
|
(6.1
|
)
|
851.6
|
|
||||||||
|
Corporate securities
|
942.3
|
|
18.9
|
|
(4.5
|
)
|
956.7
|
|
||||||||
|
Residential mortgage-backed securities
|
255.9
|
|
4.7
|
|
(2.6
|
)
|
258.0
|
|
||||||||
|
Commercial mortgage-backed securities
|
96.1
|
|
0.4
|
|
(1.0
|
)
|
95.5
|
|
||||||||
|
Asset-backed securities
|
42.6
|
|
—
|
|
(0.2
|
)
|
42.4
|
|
||||||||
|
Total fixed maturity securities
|
2,305.9
|
|
53.1
|
|
(14.6
|
)
|
2,344.4
|
|
||||||||
|
Equity securities
|
||||||||||||||||
|
Industrial and miscellaneous
|
100.5
|
|
67.4
|
|
(0.7
|
)
|
167.2
|
|
||||||||
|
Non-redeemable preferred (FHLB stock)
|
4.9
|
|
—
|
|
—
|
|
4.9
|
|
||||||||
|
Other
|
10.7
|
|
9.4
|
|
—
|
|
20.1
|
|
||||||||
|
Total equity securities
|
116.1
|
|
76.8
|
|
(0.7
|
)
|
192.2
|
|
||||||||
|
Short-term investments
|
16.0
|
|
—
|
|
—
|
|
16.0
|
|
||||||||
|
Total investments
|
$
|
2,438.0
|
|
$
|
129.9
|
|
$
|
(15.3
|
)
|
$
|
2,552.6
|
|
||||
The amortized cost and estimated fair value of the Company's fixed maturity securities at
December 31, 2017
, by contractual maturity, are shown below. Expected maturities differ from contractual maturities because borrowers may have the right to call or prepay obligations with or without call or prepayment penalties.
|
Amortized Cost
|
Estimated Fair Value
|
|||||||
|
(in millions)
|
||||||||
|
Due in one year or less
|
$
|
220.5
|
|
$
|
221.3
|
|
||
|
Due after one year through five years
|
766.6
|
|
782.1
|
|
||||
|
Due after five years through ten years
|
754.7
|
|
772.1
|
|
||||
|
Due after ten years
|
125.7
|
|
133.8
|
|
||||
|
Mortgage and asset-backed securities
|
553.5
|
|
554.1
|
|
||||
|
Total
|
$
|
2,421.0
|
|
$
|
2,463.4
|
|
||
63
The following is a summary of investments that have been in a continuous unrealized loss position for less than 12 months and those that have been in a continuous unrealized loss position for 12 months or greater as of
December 31, 2017
and
2016
.
|
December 31, 2017
|
December 31, 2016
|
|||||||||||||||||||||
|
Estimated Fair Value
|
Gross Unrealized Losses
|
Number of Issues
|
Estimated Fair Value
|
Gross Unrealized Losses
|
Number of Issues
|
|||||||||||||||||
|
Less than 12 months:
|
(dollars in millions)
|
|||||||||||||||||||||
|
Fixed maturity securities
|
||||||||||||||||||||||
|
U.S. Treasuries
|
$
|
86.0
|
|
$
|
(0.5
|
)
|
28
|
|
$
|
33.3
|
|
$
|
(0.2
|
)
|
14
|
|
||||||
|
States and municipalities
|
—
|
|
—
|
|
—
|
|
200.9
|
|
(6.1
|
)
|
50
|
|
||||||||||
|
Corporate securities
|
307.6
|
|
(2.3
|
)
|
113
|
|
289.5
|
|
(4.1
|
)
|
101
|
|
||||||||||
|
Residential mortgage-backed securities
|
165.0
|
|
(0.8
|
)
|
45
|
|
137.5
|
|
(2.6
|
)
|
51
|
|
||||||||||
|
Commercial mortgage-backed securities
|
41.8
|
|
(0.2
|
)
|
19
|
|
48.0
|
|
(1.0
|
)
|
21
|
|
||||||||||
|
Asset-backed securities
|
29.3
|
|
(0.2
|
)
|
25
|
|
30.1
|
|
(0.2
|
)
|
20
|
|
||||||||||
|
Total fixed maturity securities
|
629.7
|
|
(4.0
|
)
|
230
|
|
739.3
|
|
(14.2
|
)
|
257
|
|
||||||||||
|
Equity securities
|
13.9
|
|
(0.6
|
)
|
24
|
|
13.6
|
|
(0.6
|
)
|
28
|
|
||||||||||
|
Total less than 12 months
|
$
|
643.6
|
|
$
|
(4.6
|
)
|
254
|
|
$
|
752.9
|
|
$
|
(14.8
|
)
|
285
|
|
||||||
|
12 months or greater:
|
||||||||||||||||||||||
|
Fixed maturity securities
|
||||||||||||||||||||||
|
U.S. Treasuries
|
$
|
23.4
|
|
$
|
(0.3
|
)
|
10
|
|
$
|
—
|
|
$
|
—
|
|
—
|
|
||||||
|
Corporate securities
|
53.2
|
|
(1.1
|
)
|
17
|
|
15.2
|
|
(0.4
|
)
|
5
|
|
||||||||||
|
Residential mortgage-backed securities
|
77.1
|
|
(1.8
|
)
|
32
|
|
—
|
|
—
|
|
—
|
|
||||||||||
|
Commercial mortgage-backed securities
|
25.1
|
|
(0.7
|
)
|
8
|
|
—
|
|
—
|
|
—
|
|
||||||||||
|
Total fixed maturity securities
|
178.8
|
|
(3.9
|
)
|
67
|
|
15.2
|
|
(0.4
|
)
|
5
|
|
||||||||||
|
12 months or greater
|
$
|
178.8
|
|
$
|
(3.9
|
)
|
67
|
|
$
|
16.9
|
|
$
|
(0.5
|
)
|
10
|
|
||||||
|
Total available-for-sale:
|
||||||||||||||||||||||
|
Fixed maturity securities
|
||||||||||||||||||||||
|
U.S. Treasuries
|
$
|
109.4
|
|
$
|
(0.8
|
)
|
38
|
|
$
|
33.3
|
|
$
|
(0.2
|
)
|
14
|
|
||||||
|
States and municipalities
|
—
|
|
—
|
|
—
|
|
200.9
|
|
(6.1
|
)
|
50
|
|
||||||||||
|
Corporate securities
|
360.8
|
|
(3.4
|
)
|
130
|
|
304.7
|
|
(4.5
|
)
|
106
|
|
||||||||||
|
Residential mortgage-backed securities
|
242.1
|
|
(2.6
|
)
|
77
|
|
137.5
|
|
(2.6
|
)
|
51
|
|
||||||||||
|
Commercial mortgage-backed securities
|
66.9
|
|
(0.9
|
)
|
27
|
|
48.0
|
|
(1.0
|
)
|
21
|
|
||||||||||
|
Asset-backed securities
|
29.3
|
|
(0.2
|
)
|
25
|
|
30.1
|
|
(0.2
|
)
|
20
|
|
||||||||||
|
Total fixed maturity securities
|
808.5
|
|
(7.9
|
)
|
297
|
|
754.5
|
|
(14.6
|
)
|
262
|
|
||||||||||
|
Equity securities
|
13.9
|
|
(0.6
|
)
|
24
|
|
15.3
|
|
(0.7
|
)
|
33
|
|
||||||||||
|
Total available-for-sale
|
$
|
822.4
|
|
$
|
(8.5
|
)
|
321
|
|
$
|
769.8
|
|
$
|
(15.3
|
)
|
295
|
|
||||||
The Company recognized impairments on fixed maturity securities of
$0.5 million
(consisting of
nine
securities) during the year ended
December 31, 2017
. The other-than-temporary impairments recognized during this year were the result of the Company's intent to sell these securities. There were
no
other-than-temporary impairments recognized on fixed maturity securities during the years ended
December 31, 2016
and
2015
. The Company determined that the remaining unrealized losses on fixed maturity securities at
December 31, 2017
,
2016
, and
2015
were primarily the result of changes in prevailing interest rates and not the credit quality of the issuers. The fixed maturity securities whose fair value was less than amortized cost were not determined to be other-than-temporarily impaired given the lack of severity and duration of the impairment, the credit quality of the issuers, the Company’s intent to not sell the securities, and a determination that it is not more likely than not that the Company will be required to sell the securities at an amount less than its amortized cost.
The Company recognized impairments on equity securities of
$0.9 million
(consisting of
seven
securities),
$5.8 million
(consisting of
thirty-seven
securities) and
$17.2 million
(consisting of
twenty-seven
securities) during the years ended
December 31, 2017
,
2016
, and
2015
, respectively. The other-than-temporary impairments recognized during these years were the result of the Company's intent to sell the securities and/or the severity and duration of the change in fair values of these securities. The impairments on equity securities in 2016 and 2015 were primarily due to the downturn in the energy sector that occurred during the fourth quarter of 2015 and the first quarter of 2016. Certain unrealized losses on equity securities were not considered to be other-than-temporary due to the financial condition and near-term prospects of the issuers, and the Company's intent to hold the securities until fair value recovers to above cost.
64
Net realized gains on investments and the change in unrealized gains (losses) on fixed maturity and equity securities are determined on a specific-identification basis and were as follows:
|
Years Ended December 31,
|
||||||||||||
|
2017
|
2016
|
2015
|
||||||||||
|
Net realized gains (losses) on investments
|
(in millions)
|
|||||||||||
|
Fixed maturity securities
|
||||||||||||
|
Gross gains
|
$
|
4.7
|
|
$
|
1.9
|
|
$
|
0.5
|
|
|||
|
Gross losses
|
(2.2
|
)
|
(0.7
|
)
|
(0.4
|
)
|
||||||
|
Net realized gains on fixed maturity securities
|
$
|
2.5
|
|
$
|
1.2
|
|
$
|
0.1
|
|
|||
|
Equity securities
|
||||||||||||
|
Gross gains
|
$
|
9.3
|
|
$
|
16.6
|
|
$
|
8.1
|
|
|||
|
Gross losses
|
(4.4
|
)
|
(6.6
|
)
|
(18.9
|
)
|
||||||
|
Net realized gains (losses) on equity securities
|
$
|
4.9
|
|
$
|
10.0
|
|
$
|
(10.8
|
)
|
|||
|
Total
|
$
|
7.4
|
|
$
|
11.2
|
|
$
|
(10.7
|
)
|
|||
|
Change in unrealized gains (losses)
|
||||||||||||
|
Fixed maturity securities
|
$
|
3.9
|
|
$
|
(28.9
|
)
|
$
|
(22.2
|
)
|
|||
|
Equity securities
|
17.5
|
|
14.9
|
|
(13.7
|
)
|
||||||
|
Total
|
$
|
21.4
|
|
$
|
(14.0
|
)
|
$
|
(35.9
|
)
|
|||
Net investment income was as follows:
|
Years Ended December 31,
|
||||||||||||
|
2017
|
2016
|
2015
|
||||||||||
|
(in millions)
|
||||||||||||
|
Fixed maturity securities
|
$
|
70.4
|
|
$
|
68.5
|
|
$
|
68.8
|
|
|||
|
Equity securities
|
6.9
|
|
7.4
|
|
5.9
|
|
||||||
|
Short-term investments
|
0.1
|
|
—
|
|
—
|
|
||||||
|
Cash equivalents and restricted cash
|
0.6
|
|
0.4
|
|
0.1
|
|
||||||
|
Gross investment income
|
78.0
|
|
76.3
|
|
74.8
|
|
||||||
|
Investment expenses
|
(3.4
|
)
|
(3.1
|
)
|
(2.6
|
)
|
||||||
|
Net investment income
|
$
|
74.6
|
|
$
|
73.2
|
|
$
|
72.2
|
|
|||
The Company is required by various state laws and regulations to hold securities or letters of credit in depository accounts with certain states in which it does business. These laws and regulations govern not only the amount but also the types of securities that are eligible for deposit. As of both
December 31, 2017
and
2016
, securities having a fair value of
$1,009.7 million
were on deposit.
Certain reinsurance contracts require the Company's funds to be held in trust for the benefit of the ceding reinsurer to secure the outstanding liabilities assumed by the Company. The fair value of fixed maturity securities and restricted cash and cash equivalents held in trust for the benefit of ceding reinsurers at
December 31, 2017
and
2016
was
$24.5 million
and
$27.2 million
, respectively.
65
7
. Property and Equipment
Property and equipment consists of the following:
|
As of December 31,
|
|||||||
|
2017
|
2016
|
||||||
|
(in millions)
|
|||||||
|
Furniture and equipment
|
$
|
1.7
|
|
$
|
2.3
|
|
|
|
Leasehold improvements
|
2.9
|
|
4.3
|
|
|||
|
Computers and software
|
54.2
|
|
59.0
|
|
|||
|
Automobiles
|
1.1
|
|
1.2
|
|
|||
|
Property and equipment, gross
|
59.9
|
|
66.8
|
|
|||
|
Accumulated depreciation
|
(46.0
|
)
|
(44.6
|
)
|
|||
|
Property and equipment, net
|
$
|
13.9
|
|
$
|
22.2
|
|
|
Depreciation expenses related to property and equipment for the years ended
December 31, 2017
,
2016
, and
2015
were
$7.9 million
,
$8.2 million
, and
$7.8 million
, respectively. Internally developed software costs of
$2.1 million
and
$1.3 million
were capitalized during each of the years ended
December 31, 2017
and
2016
, respectively.
Additionally, during the third quarter of 2017, the Company wrote-off
$7.5 million
of previously capitalized costs relating to the development of information technology capabilities that had not yet been placed in service, which is recognized in Other expenses in the Company's Consolidated Statements of Comprehensive Income. The Company incurred this charge as part of a continual evaluation of its ongoing technology initiatives.
8
. Income Taxes
The Company files a consolidated federal income tax return. The insurance subsidiaries pay premium taxes on gross premiums written in lieu of some states' income or franchise taxes.
The Tax Cuts and Jobs Act significantly revised U.S. corporate income tax law by, among other things, reducing the corporate statutory income tax rate from
35%
to
21%
, beginning
January 1, 2018
. This reduction in the corporate statutory income tax rate required the Company to re-evaluate certain of its deferred tax assets and liabilities, as of the date of Enactment, to reflect the revised income tax rates applicable to future periods.
The Company believes that it has made a reasonable estimate of the income tax effects of the Tax Cuts and Jobs Act as of and for the year ended December 31, 2017. However, the Company was required to base certain of its estimates and assumptions on incomplete information and/or preliminary interpretations of the effects of Enactment. As a result, the Company may need to reflect further adjustments to its deferred tax assets and liabilities recorded as of December 31, 2017 in future periods upon obtaining, preparing, or analyzing additional information about facts and circumstances that existed as of that date that, if known at that time, would have affected the income tax effects initially reported. The Company does not expect the amounts of any future income tax adjustments that may be required to be made to the Company’s deferred tax assets and liabilities as of December 31, 2017 to be material.
The Company's provision for income taxes consisted of the following:
|
Years Ended December 31,
|
|||||||||||
|
2017
|
2016
|
2015
|
|||||||||
|
Current tax expense:
|
(in millions)
|
||||||||||
|
Federal
|
$
|
17.9
|
|
$
|
20.3
|
|
$
|
9.5
|
|
||
|
State
|
0.7
|
|
0.3
|
|
1.1
|
|
|||||
|
Total current tax expense
|
18.6
|
|
20.6
|
|
10.6
|
|
|||||
|
Deferred federal tax expense (benefit):
|
|||||||||||
|
Impact of tax Enactment
|
7.0
|
|
—
|
|
—
|
|
|||||
|
Other
|
17.2
|
|
13.4
|
|
(5.6
|
)
|
|||||
|
Total deferred federal tax expense (benefit)
|
24.2
|
|
13.4
|
|
(5.6
|
)
|
|||||
|
Income tax expense
|
$
|
42.8
|
|
$
|
34.0
|
|
$
|
5.0
|
|
||
66
The difference between the statutory federal tax rate of
35%
and the Company's effective tax rate on net income before income taxes as reflected in the Consolidated Statements of Comprehensive Income was as follows:
|
Years Ended December 31,
|
|||||||||||
|
2017
|
2016
|
2015
|
|||||||||
|
(in millions)
|
|||||||||||
|
Expense computed at statutory rate
|
$
|
50.4
|
|
$
|
49.3
|
|
$
|
34.8
|
|
||
|
Tax-advantaged investment income
|
(7.6
|
)
|
(8.5
|
)
|
(8.6
|
)
|
|||||
|
Pre-Privatization reserve adjustments, excluding LPT
|
—
|
|
—
|
|
(15.3
|
)
|
|||||
|
LPT deferred gain amortization
|
(4.0
|
)
|
(4.7
|
)
|
(4.9
|
)
|
|||||
|
LPT Reserve Adjustment
|
—
|
|
(1.1
|
)
|
(2.2
|
)
|
|||||
|
Stock based compensation
|
(3.4
|
)
|
(1.6
|
)
|
—
|
|
|||||
|
Impact of tax Enactment
|
7.0
|
|
—
|
|
—
|
|
|||||
|
Other
|
0.4
|
|
0.6
|
|
1.2
|
|
|||||
|
Income tax expense
|
$
|
42.8
|
|
$
|
34.0
|
|
$
|
5.0
|
|
||
On January 1, 2000, EICN assumed the assets, liabilities, and operations of the Fund pursuant to legislation passed in the 1999 Nevada Legislature (the Privatization). Prior to the Privatization, the Fund was a part of the State of Nevada and therefore was not subject to federal income tax; accordingly, it did not take an income tax deduction with respect to the establishment of its unpaid loss and LAE reserves. Due to favorable loss experience after the Privatization, it was determined that certain of the pre-Privatization unpaid loss and LAE reserves assumed by EICN as part of the Privatization were no longer necessary and the unpaid loss and LAE reserves were reduced accordingly. Such a downward adjustment of pre-Privatization unpaid loss reserves increased GAAP net income by
$15.3 million
for the year ended
December 31, 2015
, but did not increase taxable income. There were
no
downward adjustments of pre-Privatization unpaid loss reserves for the years ended
December 31, 2017
and
2016
. A downward adjustment of pre-Privatization unpaid loss reserves, excluding the LPT, was
$56.3 million
for the year ended
December 31, 2015
.
The LPT Reserve Adjustments for the years ended
December 31, 2016
and
2015
increased GAAP net income by
$3.1 million
and
$6.4 million
, respectively, but did not increase taxable income. There were
no
LPT Reserve Adjustments in 2017. The LPT Contingent Commission Adjustments increased net income by
$0.3 million
,
$1.8 million
, and
$2.6 million
during
2017
,
2016
, and
2015
, respectively, but did not increase taxable income.
As of
December 31, 2017
and
2016
, the Company had
no
unrecognized tax benefits.
The Company paid
$21.3 million
,
$13.7 million
and
$12.7 million
in income taxes during the years ended
December 31, 2017
,
2016
, and
2015
, respectively.
Tax years 2014 through 2017 remained open and are subject to full examination by the federal taxing authority. The significant components of deferred income taxes, net, were as follows as of December 31:
|
2017
|
2016
|
||||||||||||||
|
Deferred Tax
|
Deferred Tax
|
||||||||||||||
|
Assets
|
Liabilities
|
Assets
|
Liabilities
|
||||||||||||
|
(in millions)
|
|||||||||||||||
|
Unrealized capital gains, net
|
$
|
—
|
|
$
|
28.5
|
|
$
|
—
|
|
$
|
40.1
|
|
|||
|
Deferred policy acquisition costs
|
—
|
|
9.7
|
|
—
|
|
15.7
|
|
|||||||
|
Intangible assets
|
—
|
|
1.7
|
|
—
|
|
2.9
|
|
|||||||
|
Loss reserve discounting for tax reporting
|
29.0
|
|
—
|
|
51.7
|
|
—
|
|
|||||||
|
Unearned premiums
|
12.8
|
|
—
|
|
20.9
|
|
—
|
|
|||||||
|
Allowance for bad debt
|
2.1
|
|
—
|
|
3.4
|
|
—
|
|
|||||||
|
Stock-based compensation
|
2.5
|
|
—
|
|
4.4
|
|
—
|
|
|||||||
|
Accrued liabilities
|
4.2
|
|
—
|
|
8.1
|
|
—
|
|
|||||||
|
Minimum tax credit
|
20.0
|
|
—
|
|
27.8
|
|
—
|
|
|||||||
|
Other
|
2.8
|
|
4.8
|
|
9.7
|
|
7.9
|
|
|||||||
|
Total
|
$
|
73.4
|
|
$
|
44.7
|
|
$
|
126.0
|
|
$
|
66.6
|
|
|||
|
Deferred income taxes, net
|
$
|
28.7
|
|
$
|
59.4
|
|
|||||||||
Enactment had
no
impact on the amount of the Company's minimum tax credit as of
December 31, 2017
. Despite a repeal of the corporate alternative minimum tax, the Company's minimum tax credit will be recognized (subject to annual limits) over the period from January 1, 2018 through December 31, 2021.
67
Deferred tax assets are required to be reduced by a valuation allowance if it is more likely than not that all or some portion of the deferred tax asset will not be realized. Realization of the deferred income tax asset is dependent on the Company generating sufficient taxable income in future years as the deferred income tax charges become deductible for tax reporting purposes. Although realization is not assured, management believes that it is more likely than not that the net deferred income tax asset will be realized.
The Company is required to discount its loss and LAE reserves for federal income tax purposes. The Company’s income tax deduction associated with its loss and LAE reserves is discounted using interest rates prescribed by the U.S. Treasury, as well as established loss payment patterns. Enactment changes the prescribed interest rates to rates based on corporate bond yield curves and extends the time periods associated with loss payment patterns, which will result in an acceleration of future income tax payments. These changes are effective for tax years beginning after 2017 and are subject to a transition rule that spreads the additional tax payment from the amount determined by applying these changes over the eight years beginning in 2018. This item is a taxable temporary difference and has no direct impact on the Company’s total income tax expense for 2017 and future years. The Company has not yet recorded any provisional amounts to its current and deferred income taxes to reflect these changes. During 2018, the Company will obtain, prepare, and analyze the necessary information to revise and complete its accounting for loss reserve discounting.
9
. Liability for Unpaid Losses and Loss Adjustment Expenses
Accounting for workers' compensation insurance requires the Company to estimate the liability for the expected ultimate cost of unpaid losses and LAE (loss reserves) as of a balance sheet date. Loss reserve estimates are inherently uncertain because the ultimate amount the Company will pay for many of the claims it has incurred as of the balance sheet date will not be known for many years. The estimate of loss reserves is intended to equal the difference between the expected ultimate losses and LAE of all claims that have occurred as of a balance sheet date and amounts already paid. The Company establishes loss reserves based on its own analysis of emerging claims experience and environmental conditions in its markets and review of the results of various actuarial projections. The Company's aggregate carried reserve for unpaid losses and LAE is the sum of its reserves for each accident year and represents its best estimate of outstanding loss reserves.
The amount by which estimated losses in the aggregate differ from those previously estimated for a specific time period is known as reserve “development.” Reserve development is unfavorable when losses ultimately settle for more than the amount reserved or subsequent estimates indicate a basis for reserve increases on open claims, causing the previously estimated loss reserves to be ''deficient.'' Reserve development is favorable when estimates of ultimate losses indicate a decrease in established reserves, causing the previously estimated loss reserves to be ''redundant.'' Development is reflected in the Company's operating results through an adjustment to incurred losses and LAE during the period in which it is recognized.
Although claims for which reserves are established may not be paid for several years or more, the Company does not discount loss reserves in its financial statements for the time value of money, in accordance with GAAP.
The three main components of reserves for unpaid losses and LAE are case reserves, incurred but not reported (IBNR) loss reserves, and LAE reserves.
When claims are reported, the Company establishes individual estimates of the ultimate cost of each claim (case reserves). These case reserves are continually monitored and revised in response to new information and for amounts paid.
IBNR is an actuarial estimate of future payments on claims that have occurred but have not yet been reported. In addition to this provision for late reported claims, the Company also estimates and makes a provision for the extent to which the case reserves on known claims may develop and for additional payments on closed claims, known as “reopening.” IBNR reserves apply to the entire body of claims arising from a specific time period, rather than a specific claim. Most of the Company's IBNR reserves relate to estimated future claim payments on recorded open claims.
LAE reserves are the Company's estimate of the future expenses of investigating, administering, and settling claims that will be paid to manage claims that have occurred, including legal expenses. LAE reserves are established in the aggregate, rather than on a claim-by-claim basis. LAE reserves are categorized between defense and cost containment, and adjusting and other.
A portion of the Company's obligations for losses and LAE are ceded to unaffiliated reinsurers. The amount of reinsurance that will be recoverable on its losses and LAE reserves includes both the reinsurance recoverable from excess of loss reinsurance contracts, as well as reinsurance recoverable under the terms of the LPT Agreement.
The Company uses actuarial methods to analyze and estimate the aggregate amount of unpaid losses and LAE. Management considers the results of various actuarial projection methods and their underlying assumptions, among other factors, in establishing reserves for unpaid losses and LAE.
Judgment is required in the actuarial estimation of loss reserves, including the selection of various actuarial methodologies to project the ultimate cost of claims. Specifically, judgment is required in the following areas: the selection of projection parameters based on historical company data; the use of industry data and other benchmarks; the identification and quantification of potential
68
changes in parameters from historical levels to current and future levels due to changes in future claims development expectations; and the weighting of differing reserve indications resulting from alternative methods and assumptions.
The following table represents a reconciliation of changes in the liability for unpaid losses and LAE.
|
Years Ended December 31,
|
|||||||||||
|
2017
|
2016
|
2015
|
|||||||||
|
(in millions)
|
|||||||||||
|
Unpaid losses and LAE at beginning of period
|
$
|
2,301.0
|
|
$
|
2,347.5
|
|
$
|
2,369.7
|
|
||
|
Less reinsurance recoverable, excluding bad debt allowance, on unpaid losses and LAE
|
580.0
|
|
628.2
|
|
669.5
|
|
|||||
|
Net unpaid losses and LAE at beginning of period
|
1,721.0
|
|
1,719.3
|
|
1,700.2
|
|
|||||
|
Losses and LAE, net of reinsurance, incurred during the period related to:
|
|||||||||||
|
Current year
|
447.3
|
|
452.9
|
|
456.9
|
|
|||||
|
Prior years
(1)
|
(18.5
|
)
|
(18.4
|
)
|
(7.2
|
)
|
|||||
|
Total net losses and LAE incurred during the period
(1)
|
428.8
|
|
434.5
|
|
449.7
|
|
|||||
|
Paid losses and LAE, net of reinsurance, related to:
|
|||||||||||
|
Current year
|
76.9
|
|
78.7
|
|
75.4
|
|
|||||
|
Prior years
(2)
|
343.8
|
|
354.1
|
|
355.2
|
|
|||||
|
Total net paid losses and LAE during the period
(2)
|
420.7
|
|
432.8
|
|
430.6
|
|
|||||
|
Ending unpaid losses and LAE, net of reinsurance
|
1,729.1
|
|
1,721.0
|
|
1,719.3
|
|
|||||
|
Reinsurance recoverable, excluding bad debt allowance, on unpaid losses and LAE
|
537.0
|
|
580.0
|
|
628.2
|
|
|||||
|
Unpaid losses and LAE at end of period
|
$
|
2,266.1
|
|
$
|
2,301.0
|
|
$
|
2,347.5
|
|
||
|
(1)
|
Losses and LAE, net of reinsurance, incurred during the period related to prior years and Total net losses and LAE incurred during the period included in the above table excludes the impact of the amortization of the Deferred Gain and LPT Reserve Adjustments (Note
10
). Including these amounts, Losses and LAE, net of reinsurance, incurred during the period related to prior years was
$(30.1) million
,
$(35.0) million
, and
$(27.6) million
and Total net losses and LAE incurred during the period was
$417.2 million
,
$417.9 million
, and
$429.4 million
for the years ended
December 31, 2017
,
2016
, and
2015
, respectively.
|
|
(2)
|
Paid losses and LAE, net of reinsurance, related to prior years and Total net paid losses and LAE during the period included in the above table excludes the impact of the amortization of the Deferred Gain and LPT Reserve Adjustments (Note
10
). Including these amounts, Paid losses and LAE, net of reinsurance, related to prior years was
$332.2 million
,
$337.5 million
, and
$334.8 million
and Total net paid losses and LAE during the period was
$409.1 million
,
$416.2 million
, and
$410.2 million
for the years ended
December 31, 2017
,
2016
, and
2015
, respectively.
|
In 2017, the Company had
$18.5 million
of favorable prior accident year loss development, which included
$17.4 million
of favorable development on its voluntary risk business and
$1.1 million
of favorable development related to its assigned risk business. In 2016, the Company had
$18.4 million
of favorable prior accident year loss development, which included
$17.0 million
of favorable development on its voluntary risk business and
$1.4 million
of favorable development related to its assigned risk business. In 2015, the Company had
$7.2 million
of favorable prior accident year loss development, which included
$9.0 million
of favorable prior accident year loss development on its voluntary risk business, which was partially offset by
$1.8 million
of unfavorable loss development related to its assigned risk business. The favorable prior accident year loss development on voluntary business in 2017 and 2016 was the result of the Company's determination that adjustments were necessary to reflect observed favorable paid loss trends. Paid loss trends have been impacted by cost savings associated with accelerated claims settlement activity that began in 2014 and continued through 2017.
In California, where the Company's operations began in 2002, the actuaries' and management's initial expectations of ultimate losses and patterns of loss emergence and payment were based on benchmarks derived from analyses of historical insurance industry data in California. No historical data from the Company's California insurance subsidiary existed prior to July 1, 2002; however, some historical data was available for the prior years for some of the market segments the Company entered in California, but was limited as to the number of loss reserve evaluation points available. The industry-based benchmarks were judgmentally adjusted for the anticipated impact of significant environmental changes, specifically the enactment of major changes to the statutory workers' compensation benefit structure and the manner in which claims are administered and adjudicated in California. The actual emergence and payment of claims by the Company's California insurance subsidiary have been more favorable than those initial expectations through 2008, due in part to the enactment of the major changes in the California workers' compensation environment. The Company's recent loss experience, from 2010 through 2016, indicates an upward trend in medical and indemnity costs that are reflected in its loss reserves. Loss experience in 2017 indicated a slight downward movement in medical and indemnity costs per claim. The Company's indemnity claims frequency (the number of claims expressed as a percentage of payroll) decreased
69
year-over-year for the past three years. The Company's reserve estimates assume that increasing medical cost trends will continue and will impact the Company's long-term claims costs and loss reserves.
The Company continues to develop its own loss experience in California and will rely more on its experience and less on historical industry data in projecting its reserve requirements as such data becomes available. As the actual experience of the Company emerges, it will continue to evaluate prior estimates, which may result in additional adjustments in reserves.
In Nevada, the Company has compiled a lengthy history of workers' compensation claims payment patterns based on the business of the Fund and EICN, but the emergence and payment of claims in recent years has been more favorable than in the long-term history in Nevada with the Fund. The expected patterns of claim payments and emergence used in the projection of the Company's ultimate claim payments are based on both the long and short-term historical paid data. In recent evaluations, claim patterns have continued to emerge in a manner consistent with short-term historical data. Consequently, the Company has relied more heavily on claim projection patterns observed in recent years in Nevada.
Loss reserves shown in the Company's Consolidated Balance Sheets are net of
$35.0 million
and
$28.1 million
for anticipated subrogation recoveries as of
December 31, 2017
and
2016
, respectively.
The Company compiles and aggregates its claims data by grouping the claims according to the year in which the claim occurred (“accident year”) when analyzing claim payment and emergence patterns and trends over time. For the purposes of defining claims frequency, the number of reported claims includes any claim that has case reserves and/or loss and LAE payments associated with them.
The Company analyzed the usefulness of disaggregation of its results and determined the characteristics associated with the policies and the related unpaid loss reserves, incurred losses, and payment patterns are similar in nature. As such, the following tables show the Company's historical incurred and cumulative paid losses and LAE development, net of reinsurance, as well as IBNR loss reserves and the number of reported claims on an aggregated basis as of
December 31, 2017
for each of the previous 10 accident years.
|
Incurred Losses and LAE, Net of Reinsurance
|
||||||||||||||||||||||||||||||||||||
|
Years Ended December 31,
|
As of December 31, 2017
|
|||||||||||||||||||||||||||||||||||
|
Accident Year
|
2008
(1)
|
2009
(1)
|
2010
(1)
|
2011
(1)
|
2012
(1)
|
2013
(1)
|
2014
(1)
|
2015
(1)
|
2016
(1)
|
2017
|
IBNR
|
Cumulative number of reported claims
|
||||||||||||||||||||||||
|
(in millions, except claims counts)
|
||||||||||||||||||||||||||||||||||||
|
2008
|
$
|
315.9
|
|
$
|
315.3
|
|
$
|
317.8
|
|
$
|
329.2
|
|
$
|
329.5
|
|
$
|
335.1
|
|
$
|
336.9
|
|
$
|
343.8
|
|
$
|
341.4
|
|
$
|
342.1
|
|
$
|
15.4
|
|
28,088
|
|
|
|
2009
|
255.4
|
|
266.9
|
|
279.0
|
|
280.1
|
|
283.6
|
|
283.7
|
|
291.2
|
|
290.5
|
|
290.5
|
|
13.5
|
|
22,673
|
|
||||||||||||||
|
2010
|
204.9
|
|
224.4
|
|
228.1
|
|
246.1
|
|
250.2
|
|
262.0
|
|
259.9
|
|
258.8
|
|
19.8
|
|
18,543
|
|
||||||||||||||||
|
2011
|
253.7
|
|
267.3
|
|
272.0
|
|
277.4
|
|
296.3
|
|
292.6
|
|
288.8
|
|
27.5
|
|
19,571
|
|
||||||||||||||||||
|
2012
|
348.8
|
|
359.9
|
|
360.9
|
|
386.4
|
|
388.2
|
|
382.8
|
|
50.7
|
|
25,972
|
|
||||||||||||||||||||
|
2013
|
452.6
|
|
460.6
|
|
478.6
|
|
472.6
|
|
468.9
|
|
73.6
|
|
28,816
|
|
||||||||||||||||||||||
|
2014
|
463.4
|
|
445.8
|
|
432.9
|
|
434.6
|
|
86.1
|
|
28,449
|
|
||||||||||||||||||||||||
|
2015
|
422.2
|
|
425.8
|
|
423.9
|
|
98.7
|
|
26,993
|
|
||||||||||||||||||||||||||
|
2016
|
419.0
|
|
414.6
|
|
140.8
|
|
25,305
|
|
||||||||||||||||||||||||||||
|
2017
|
412.4
|
|
244.6
|
|
21,214
|
|
||||||||||||||||||||||||||||||
|
Total
|
$
|
3,717.4
|
|
|||||||||||||||||||||||||||||||||
70
|
Cumulative Paid Losses and LAE, Net of Reinsurance
|
||||||||||||||||||||||||||||||
|
Years Ended December 31,
|
||||||||||||||||||||||||||||||
|
Accident Year
|
2008
(1)
|
2009
(1)
|
2010
(1)
|
2011
(1)
|
2012
(1)
|
2013
(1)
|
2014
(1)
|
2015
(1)
|
2016
(1)
|
2017
|
||||||||||||||||||||
|
(in millions)
|
||||||||||||||||||||||||||||||
|
2008
|
$
|
71.1
|
|
$
|
155.4
|
|
$
|
201.8
|
|
$
|
234.7
|
|
$
|
255.3
|
|
$
|
271.1
|
|
$
|
284.2
|
|
$
|
293.6
|
|
$
|
300.7
|
|
$
|
307.1
|
|
|
2009
|
59.0
|
|
130.6
|
|
174.1
|
|
202.0
|
|
219.3
|
|
232.1
|
|
242.3
|
|
249.5
|
|
255.1
|
|
||||||||||||
|
2010
|
47.1
|
|
105.6
|
|
143.8
|
|
171.7
|
|
190.7
|
|
206.2
|
|
215.4
|
|
221.3
|
|
||||||||||||||
|
2011
|
47.4
|
|
115.1
|
|
162.6
|
|
193.8
|
|
217.5
|
|
230.1
|
|
238.2
|
|
||||||||||||||||
|
2012
|
58.6
|
|
148.3
|
|
214.2
|
|
261.4
|
|
289.9
|
|
305.0
|
|
||||||||||||||||||
|
2013
|
68.5
|
|
184.4
|
|
263.8
|
|
317.4
|
|
346.1
|
|
||||||||||||||||||||
|
2014
|
65.3
|
|
172.7
|
|
248.9
|
|
297.2
|
|
||||||||||||||||||||||
|
2015
|
65.5
|
|
174.5
|
|
246.9
|
|
||||||||||||||||||||||||
|
2016
|
65.6
|
|
166.8
|
|
||||||||||||||||||||||||||
|
2017
|
63.5
|
|
||||||||||||||||||||||||||||
|
Total
|
$
|
2,447.3
|
|
|||||||||||||||||||||||||||
|
All outstanding liabilities for unpaid losses and LAE prior to 2007, net of reinsurance
|
364.2
|
|
||||||||||||||||||||||||||||
|
Total outstanding liabilities for unpaid losses and LAE, net of reinsurance
|
$
|
1,634.3
|
|
|||||||||||||||||||||||||||
|
(1)
|
Data presented for these calendar years is required supplementary information, which is unaudited.
|
The following table represents a reconciliation of claims development to the aggregate carrying amount of the liability for unpaid losses and LAE:
|
December 31, 2017
|
||||
|
(in millions)
|
||||
|
Liabilities for unpaid losses and LAE, net of reinsurance
|
$
|
1,634.3
|
|
|
|
Reinsurance recoverable on unpaid losses
|
537.0
|
|
||
|
Unallocated LAE (adjusting and other)
|
94.8
|
|
||
|
Total liability for unpaid losses and LAE
|
$
|
2,266.1
|
|
|
The following table presents the average annual percentage payout of incurred claims by age, net of reinsurance, as of
December 31, 2017
and is presented as required supplementary information, which is unaudited:
|
Average Annual Percentage Payout of Claims by Age, Net of Reinsurance
|
|||||||||||||||||||
|
Year 1
|
Year 2
|
Year 3
|
Year 4
|
Year 5
|
Year 6
|
Year 7
|
Year 8
|
Year 9
|
Year 10
|
||||||||||
|
16.7
|
%
|
24.3
|
%
|
16.1
|
%
|
10.8
|
%
|
6.9
|
%
|
4.7
|
%
|
3.4
|
%
|
2.5
|
%
|
2.0
|
%
|
1.9
|
%
|
10
. Reinsurance
The Company purchases reinsurance from third parties in the normal course of its business in order to manage its exposures. The Company's reinsurance coverage is provided on both a quota share and excess of loss basis.
The effects of reinsurance on the Company's written and earned premiums and on its losses and LAE incurred were as follows:
|
Years Ended December 31,
|
|||||||||||||||||||||||
|
2017
|
2016
|
2015
|
|||||||||||||||||||||
|
Written
|
Earned
|
Written
|
Earned
|
Written
|
Earned
|
||||||||||||||||||
|
(in millions)
|
|||||||||||||||||||||||
|
Direct premiums
|
$
|
719.5
|
|
$
|
712.5
|
|
$
|
691.0
|
|
$
|
691.0
|
|
$
|
684.9
|
|
$
|
686.0
|
|
|||||
|
Assumed premiums
|
10.2
|
|
10.0
|
|
10.4
|
|
10.6
|
|
12.8
|
|
12.8
|
|
|||||||||||
|
Gross premiums
|
729.7
|
|
722.5
|
|
701.4
|
|
701.6
|
|
697.7
|
|
698.8
|
|
|||||||||||
|
Ceded premiums
|
(6.0
|
)
|
(6.0
|
)
|
(6.8
|
)
|
(6.8
|
)
|
(8.4
|
)
|
(8.4
|
)
|
|||||||||||
|
Net premiums
|
$
|
723.7
|
|
$
|
716.5
|
|
$
|
694.6
|
|
$
|
694.8
|
|
$
|
689.3
|
|
$
|
690.4
|
|
|||||
|
Ceded losses and LAE incurred
|
$
|
(0.5
|
)
|
$
|
0.1
|
|
$
|
10.1
|
|
||||||||||||||
71
Ceded losses and LAE incurred includes the amortization of the Deferred Gain, LPT Reserve Adjustments, and LPT Contingent Commission Adjustments.
Excess of Loss Reinsurance
The Company has consistently maintained excess of loss reinsurance coverage to protect it against the impact of large and/or catastrophic losses in its workers' compensation business. The Company currently maintains reinsurance for losses from a single occurrence or catastrophic event in excess of
$10.0 million
and up to
$200.0 million
, subject to certain exclusions. This current reinsurance program is effective July 1,
2017
through June 30,
2018
. The coverage under the Company's annual reinsurance programs that ended July 1, 2017 and 2016 was
$190.0 million
and
$193.0 million
, in excess of its
$10.0 million
and
$7.0 million
retention on a per occurrence basis, respectively. The reinsurance coverage includes coverage for acts of terrorism, excluding nuclear, biological, chemical, and radiological events. Any liability outside the coverage limits of the reinsurance program is retained by the Company.
LPT Agreement
Recoverables from reinsurers on unpaid losses and LAE amounted to
$537.0 million
and
$580.0 million
at
December 31, 2017
and
2016
, respectively. At each of
December 31, 2017
and
2016
,
$438.9 million
and
$465.5 million
, respectively, of those recoverables was related to the LPT Agreement that was entered into in 1999 by the Fund and assumed by EICN. Under the LPT Agreement, substantially all of the Fund's losses and LAE on claims incurred prior to July 1, 1995, have been ceded to three unaffiliated reinsurers on a
100%
quota share basis. Investments totaling
$380.8 million
and
$355.7 million
at
December 31, 2017
and
2016
, respectively, have been placed in trust by the three reinsurers as security for payment of the reinsured claims. Under the LPT Agreement, initially
$1.5 billion
in liabilities for the incurred but unpaid losses and LAE related to claims incurred prior to July 1, 1995, were reinsured for consideration of
$775.0 million
. The LPT Agreement provides coverage up to
$2.0 billion
. Through
December 31, 2017
, the Company has paid losses and LAE claims totaling
$749.3 million
related to the LPT Agreement.
The Company amortized
$11.3 million
,
$11.7 million
, and
$11.4 million
of the Deferred Gain for the years ended
December 31, 2017
,
2016
, and
2015
, respectively. Additionally, the Deferred Gain was reduced by
$3.1 million
and
$6.4 million
for the years ended
December 31, 2016
and
2015
, respectively, due to favorable LPT Reserve Adjustments and by
$0.3 million
,
$1.8 million
, and
$2.6 million
for the years ended
December 31, 2017
,
2016
, and
2015
, respectively, due to favorable LPT Contingent Commission Adjustments (Note
2
).
11
. Notes Payable
Notes payable is comprised of the following:
|
December 31,
|
|||||||
|
2017
|
2016
|
||||||
|
(in millions)
|
|||||||
|
Dekania Surplus Note, due April 29, 2034
|
$
|
10.0
|
|
$
|
10.0
|
|
|
|
Alesco Surplus Note, due December 15, 2034
|
10.0
|
|
10.0
|
|
|||
|
ICONS Surplus Note, due May 24, 2034
|
—
|
|
12.0
|
|
|||
|
Total
|
$
|
20.0
|
|
$
|
32.0
|
|
|
EPIC has a
$10.0 million
surplus note to Dekania CDO II, Ltd. issued as part of a pooled transaction. The note matures in
2034
and became callable by the Company in
2009
. The terms of the note provide for quarterly interest payments at a rate
425
basis points in excess of the 90-day LIBOR. Both the payment of interest and repayment of the principal under this note and the surplus notes described in the succeeding two paragraphs are subject to the prior approval of the Florida Department of Financial Services. Interest paid during each of the years ended
December 31, 2017
,
2016
, and
2015
was
$0.6 million
,
$0.5 million
, and
$0.5 million
. Interest accrued as of
December 31, 2017
and
2016
was
$0.1 million
.
EPIC has a
$10.0 million
surplus note to Alesco Preferred Funding V, LTD issued as part of a pooled transaction. The note matures in
2034
and became callable by the Company in
2009
. The terms of the note provide for quarterly interest payments at a rate
405
basis points in excess of the 90-day LIBOR. Interest paid during each of the years ended
December 31, 2017
,
2016
, and
2015
was
$0.5 million
,
$0.5 million
, and
$0.4 million
, respectively. Interest accrued as of
December 31, 2017
and
2016
was less than
$0.1 million
.
EPIC had a
$12.0 million
surplus note to ICONS, Inc. issued as part of a pooled transaction. This note was purchased by EHI in May 2017 for
$9.9 million
, resulting in a
$2.1 million
gain, and is no longer deemed to be outstanding on a consolidated basis. Interest paid to third parties during each of the years ended
December 31, 2017
,
2016
, and
2015
was
$0.3 million
,
$0.6 million
and
$0.6 million
, respectively. Interest accrued as of
December 31, 2016
was
$0.1 million
.
72
In 2010, the Company entered into a credit facility, under which the Company was provided with: (a)
$100.0 million
line of credit through December 31, 2011; (b)
$90.0 million
line of credit from January 1, 2012 through December 31, 2012; (c)
$80.0 million
line of credit from January 1, 2013 through December 31, 2013; (d)
$70.0 million
line of credit from January 1, 2014 through December 31, 2014; and (e)
$60.0 million
line of credit from January 1, 2015 through December 31, 2015. Amounts outstanding bore interest at a rate equal to, at our option: (a) a fluctuating rate of
1.75%
above prime rate or (b) a fixed rate that is
1.75%
above the LIBOR rate then in effect. Interest paid during the year ended December 31, 2015 totaled
$1.3 million
. In accordance with the terms of the contract, the remaining principal balance of
$60.0 million
was repaid on the credit facility in 2015.
Principal payment obligations on notes payable outstanding at
December 31, 2017
, were as follows:
|
Year
|
Principal Due
|
|||
|
(in millions)
|
||||
|
2018 - 2022
|
$
|
—
|
|
|
|
Thereafter
|
20.0
|
|
||
|
Total
|
$
|
20.0
|
|
|
12
. Commitments and Contingencies
Leases
The Company leases office facilities and certain equipment under operating and capital leases. Most leases have renewal options, typically with increased rental rates during the option period. Certain of these leases contain options to purchase the property at amounts that approximate fair market value; other leases contain options to purchase at a bargain purchase price. At
December 31, 2017
, the remaining lease terms expire over the next
ten years
.
The future lease payments for the next
five years
on these non-cancelable operating and capital leases at
December 31, 2017
, were as follows:
|
Year
|
Operating Leases
|
Capital Leases
|
||||||
|
(in millions)
|
||||||||
|
2018
|
$
|
4.8
|
|
$
|
0.3
|
|
||
|
2019
|
4.8
|
|
0.3
|
|
||||
|
2020
|
4.2
|
|
0.2
|
|
||||
|
2021
|
2.8
|
|
0.2
|
|
||||
|
2022
|
1.8
|
|
0.1
|
|
||||
|
Thereafter
|
7.9
|
|
—
|
|
||||
|
Total
|
$
|
26.3
|
|
$
|
1.1
|
|
||
Included in the future minimum capital lease payments are future interest charges of
$0.1 million
. Facilities rent expense was
$4.8 million
,
$4.9 million
, and
$4.9 million
for the years ended
December 31, 2017
,
2016
, and
2015
, respectively.
Property held under capital leases is included in property and equipment as follows:
|
Asset Class
|
2017
|
2016
|
||||||
|
(in millions)
|
||||||||
|
Automobiles
|
1.1
|
|
1.2
|
|
||||
|
1.1
|
|
1.2
|
|
|||||
|
Accumulated amortization
|
(0.3
|
)
|
(0.6
|
)
|
||||
|
Total
|
$
|
0.8
|
|
$
|
0.6
|
|
||
Contingencies Surrounding Insurance Assessments
All of the states where the Company's insurance subsidiaries are licensed to transact business require property and casualty insurers doing business within the respective state to pay various insurance assessments. The Company accrues a liability for estimated insurance assessments as direct premiums are written, losses are recorded, or as other events occur in accordance with various states' laws and regulations, and defers these costs and recognizes them as an expense as the related premiums are earned. The Company had an accrued liability for guaranty fund assessments, second injury funds assessments, and other insurance assessments totaling
$12.4 million
and
$18.6 million
as of
December 31, 2017
and
2016
, respectively. These liabilities are generally expected to be paid over
one to eighty year periods
based on individual state's regulations. The Company also recorded an asset of
$14.1 million
and
$21.6 million
, as of
December 31, 2017
and
2016
, respectively, for prepaid policy charges still to be collected in the future from policyholders, or assessments that may be recovered through a reduction in future premium taxes in certain states.
73
These assets are expected to be realized over
one to ten year periods
in accordance with their type and each individual state's regulations.
13. Stockholders' Equity
Stock Repurchase Programs
On February 16, 2016, the Board of Directors authorized a share repurchase program for up to
$50.0 million
of the Company's common stock from February 22, 2016 through February 22, 2018 (the 2016 Program). The Company expects that its common stock may be purchased at prevailing market prices through a variety of methods, including open market or private transactions, in accordance with applicable laws and regulations and as determined by management. The timing and actual number of shares repurchased will depend on a variety of factors, including the share price, corporate and regulatory requirements, and other market and economic conditions. Repurchases under the 2016 Program may be commenced, modified, or suspended from time-to-time without prior notice, and the 2016 Program may be suspended or discontinued at any time. Through
December 31, 2017
, the Company has repurchased a total of
724,381
shares of common stock at an average price of
$29.08
per share, including commissions, for a total of
$21.1 million
under the 2016 Program. The Company made
no
repurchases of common stock during the year ended December 31, 2017.
Since the Company's initial public offering in January 2007 through
December 31, 2017
, the Company has repurchased a total of
24,097,355
shares of common stock at an average cost per share of
$15.92
, which is reported as treasury stock, at cost, on its Consolidated Balance Sheets.
14
. Stock-Based Compensation
The Employers Holdings, Inc. Amended and Restated Equity and Incentive Plan (the Plan) is administered by the Compensation Committee of the Board of Directors, which is authorized to grant, at its discretion, awards to officers, employees, non-employee directors, consultants, and independent contractors. The maximum number of common shares reserved for grants of awards under the Plan was
5,500,000
shares, prior to reductions for grants made. The Plan provides for the grant of stock options (both incentive stock options and nonqualified stock options), stock appreciation rights, shares of restricted stock, restricted stock units (RSUs), performance stock units (PSUs), and other stock-based awards.
Commencing in 2017, employees who were awarded RSUs and PSUs are entitled to receive dividend equivalents for eligible awards, payable in cash, when the underlying award vests and becomes payable. If the underlying award does not vest or is forfeited, dividend equivalents with respect to the underlying award will also fail to become payable and will be forfeited. These awards are not considered participating securities for the purposes of determining earnings per share.
As of
December 31, 2017
, the only incentive awards outstanding under the Plan were nonqualified stock options, RSUs, and PSUs.
Compensation costs are recognized based on expected performance, if applicable, net of any estimated forfeitures on a straight-line basis over the requisite employee service periods. Forfeiture rates are based on historical experience and are adjusted in subsequent periods for differences in actual forfeitures from those estimated. Net stock-based compensation expense recognized in the Company's Consolidated Statements of Comprehensive Income was as follows:
|
Years Ended December 31,
|
|||||||||||
|
2017
|
2016
|
2015
|
|||||||||
|
Stock-based compensation expense related to:
|
(in millions)
|
||||||||||
|
Stock options
|
$
|
0.5
|
|
$
|
0.7
|
|
$
|
1.0
|
|
||
|
RSUs
|
2.0
|
|
1.9
|
|
2.0
|
|
|||||
|
PSUs
|
4.3
|
|
3.2
|
|
1.6
|
|
|||||
|
Total
|
6.8
|
|
5.8
|
|
4.6
|
|
|||||
|
Less: related tax benefit
|
2.4
|
|
2.0
|
|
1.6
|
|
|||||
|
Net stock-based compensation expense
|
$
|
4.4
|
|
$
|
3.8
|
|
$
|
3.0
|
|
||
Stock Options
The fair value of the stock options granted is estimated using a Black-Scholes option pricing model that uses the assumptions noted in the following table. During the years ended
December 31, 2016
and
2015
, the expected stock price volatility used to value the stock options granted in
2016
and
2015
was based on the volatility of the Company's historical stock price since February 2007.
No
stock options were granted in
2017
. The expected term of the stock options granted in
2016
and
2015
was calculated using the 'plain-vanilla' calculation provided in the guidance of the SEC's SAB No. 107. The dividend yield was calculated using amounts authorized by the Board of Directors. The risk-free interest rate is the yield on the grant date of the stock options of U.S. Treasury zero coupon securities with a maturity comparable to the expected term of the stock options.
The Company anticipates issuing new shares of common stock upon the exercise of its outstanding stock options.
74
The fair value of the stock options granted during the years ended
December 31, 2016
and
2015
was calculated using the following weighted average assumptions:
|
2016
|
|
2015
|
|||
|
Expected volatility
|
38.0
|
%
|
38.0
|
%
|
|
|
Expected life (in years)
|
4.8
|
|
4.8
|
|
|
|
Dividend yield
|
1.3
|
%
|
1.0
|
%
|
|
|
Risk-free interest rate
|
1.4
|
%
|
1.6
|
%
|
|
|
Weighted average grant date fair values of stock options granted
|
$8.46
|
$7.63
|
|||
Changes in outstanding stock options for the year ended
December 31, 2017
were as follows:
|
Number of Stock Options
|
Weighted-Average Price
|
Weighted Average Remaining Contractual Life
|
||||||
|
Stock options outstanding at December 31, 2014
|
1,521,290
|
|
$
|
17.45
|
|
2.9 years
|
||
|
Granted
|
80,800
|
|
24.20
|
|
6.2 years
|
|||
|
Exercised
|
(463,466
|
)
|
16.43
|
|
||||
|
Forfeited
|
(17,079
|
)
|
20.21
|
|
|
|||
|
Stock options outstanding at December 31, 2015
|
1,121,545
|
|
18.31
|
|
2.8 years
|
|||
|
Granted
|
67,431
|
|
27.72
|
|
6.2 years
|
|||
|
Exercised
|
(586,132
|
)
|
16.39
|
|
|
|||
|
Expired
|
(6,075
|
)
|
22.48
|
|
|
|||
|
Forfeited
|
(32,673
|
)
|
24.35
|
|
|
|||
|
Stock options outstanding at December 31, 2016
|
564,096
|
|
21.04
|
|
3.3 years
|
|||
|
Exercised
|
(307,076
|
)
|
19.44
|
|
|
|||
|
Forfeited
|
(9,673
|
)
|
24.45
|
|
|
|||
|
Stock options outstanding at December 31, 2017
|
247,347
|
|
22.90
|
|
3.4 years
|
|||
|
Exercisable at December 31, 2017
|
156,517
|
|
21.71
|
|
2.8 years
|
|||
At
December 31, 2017
, the Company had yet to recognize
$0.5 million
of unamortized expense related to stock option grants and expects to recognize these costs on a straight-line basis over the next
27 months
. The fair value of stock options vested and the intrinsic value of outstanding and exercisable stock options as of December 31, were as follows:
|
2017
|
2016
|
2015
|
|||||||||
|
(in millions)
|
|||||||||||
|
Fair value of stock options vested
|
$
|
0.6
|
|
$
|
0.8
|
|
$
|
1.3
|
|
||
|
Intrinsic value of outstanding stock options
|
5.3
|
|
10.6
|
|
10.1
|
|
|||||
|
Intrinsic value of exercisable stock options
|
3.6
|
|
7.6
|
|
8.5
|
|
|||||
The intrinsic value of stock options exercised was
$7.6 million
,
$7.6 million
, and
$4.0 million
for the years ended
December 31, 2017
,
2016
, and
2015
.
RSUs
The Company has awarded RSUs to non-employee members of the Board of Directors and certain employees of the Company. The RSUs awarded to non-employee members of the Board of Directors generally vest on the first anniversary of the award date. RSU grants allow each non-employee Director to decide whether to defer settlement of the RSUs until six months after termination of Board service or settle the RSUs at vesting. Dividend equivalents are granted to Directors who elected to defer settlement of the RSUs after the grants vested. RSUs awarded to employees of the Company have a service vesting period of approximately
four years
from the date awarded and
vest 25% on or after each of the subsequent four anniversaries of such date
. These RSUs are subject to accelerated vesting in certain limited circumstances, such as: retirement, death or disability of the holder, or in connection with a change of control of the Company.
75
Changes in outstanding RSUs for the year ended
December 31, 2017
were as follows:
|
Number of RSUs
|
Weighted Average Grant Date Fair Value
|
||||||
|
RSUs outstanding at December 31, 2014
|
306,867
|
|
$
|
19.15
|
|
||
|
Granted
|
112,048
|
|
24.19
|
|
|||
|
Forfeited
|
(7,749
|
)
|
20.99
|
|
|||
|
Vested
|
(92,133
|
)
|
19.74
|
|
|||
|
RSUs outstanding at December 31, 2015
|
319,033
|
|
20.71
|
|
|||
|
Granted
|
100,218
|
|
28.20
|
|
|||
|
Forfeited
|
(21,872
|
)
|
24.87
|
|
|||
|
Vested
|
(72,995
|
)
|
21.56
|
|
|||
|
RSUs outstanding at December 31, 2016
|
324,384
|
|
22.55
|
|
|||
|
Granted
|
87,276
|
|
37.94
|
|
|||
|
Forfeited
|
(13,711
|
)
|
29.28
|
|
|||
|
Vested
|
(70,877
|
)
|
24.97
|
|
|||
|
RSUs outstanding at December 31, 2017
|
327,072
|
|
25.85
|
|
|||
|
Vested but unsettled RSUs at December 31, 2017
|
152,644
|
|
19.54
|
|
|||
At
December 31, 2017
, the Company had yet to recognize
$4.2 million
of unamortized expense related to outstanding RSUs and expects to recognize these costs on a straight-line basis over the next
39 months
. The grant date fair value of RSUs vested and the intrinsic value of vested RSUs for the years ended December 31, were as follows:
|
2017
|
2016
|
2015
|
|||||||||
|
(in millions)
|
|||||||||||
|
Grant date fair value of RSUs vested
|
$
|
1.8
|
|
$
|
1.6
|
|
$
|
1.7
|
|
||
|
Intrinsic value of RSUs vested
|
2.8
|
|
2.1
|
|
2.2
|
|
|||||
The intrinsic value of outstanding RSUs was
$14.5 million
,
$12.8 million
, and
$8.7 million
at
December 31, 2017
,
2016
, and
2015
.
PSUs
The Company has awarded PSUs to certain employees of the Company as follows:
|
Date of Grant
|
Target Number Awarded
|
Fair Value on Date of Grant
|
Aggregate Fair Value on Date of Grant
|
||||||||
|
(in millions)
|
|||||||||||
|
March 2015
(1)
|
110,000
|
|
$
|
24.20
|
|
$
|
2.7
|
|
|||
|
March 2016
(1)
|
97,236
|
|
27.72
|
|
2.7
|
|
|||||
|
March 2017
(1)
|
97,440
|
|
37.60
|
|
3.7
|
|
|||||
|
(1)
|
The PSUs awarded in March 2015, 2016 and 2017 were awarded to certain employees of the Company and have a performance period of two years followed by an additional one year vesting period. The PSU awards are subject to certain performance goals with payouts that range from
0%
to
200%
of the target awards. The values shown in the table represent the aggregate number of PSUs awarded at the target level.
|
At
December 31, 2017
, the Company had yet to recognize
$4.7 million
of unamortized expense related to PSU grants and expects to recognize these costs on a straight-line basis over the next
24 months
. This is based on the expectation of the Company achieving a
200%
of target rate for the
2015
PSUs, a
200%
of target rate for the
2016
PSUs, and a
127%
of target rate for the
2017
PSUs.
76
15
. Statutory Matters
Statutory Financial Data
The combined capital stock, surplus, and net income of the Company's insurance subsidiaries (EICN, ECIC, EPIC, and EAC), prepared in accordance with the statutory accounting practices (SAP) of the National Association of Insurance Commissioners (NAIC) as well as SAP permitted by the states of California, Florida, and Nevada, were as follows:
|
December 31,
|
|||||||
|
2017
|
2016
|
||||||
|
(in millions)
|
|||||||
|
Capital stock and unassigned surplus
|
$
|
510.6
|
|
$
|
447.1
|
|
|
|
Paid in capital
|
349.8
|
|
349.8
|
|
|||
|
Surplus notes
|
32.0
|
|
32.0
|
|
|||
|
Total statutory surplus
|
$
|
892.4
|
|
$
|
828.9
|
|
|
Net income for the Company's insurance subsidiaries prepared in accordance with SAP for the years ended
December 31, 2017
,
2016
and
2015
was
$116.8 million
,
$101.4 million
, and
$87.8 million
, respectively.
Treatment of the LPT Agreement, deferred policy acquisition costs, fair value of financial instruments, and the surplus notes (see Notes
5
,
10
, and
11
) are the primary differences in the SAP-basis capital stock and total surplus of the insurance subsidiaries of
$892.4 million
and
$828.9 million
, and the GAAP-basis equity of the Company of
$947.7 million
and
$840.6 million
as of
December 31, 2017
and
2016
, respectively. Under SAP accounting, the retroactive reinsurance gain resulting from the LPT Agreement is recorded as a special component of surplus (special surplus funds) in the initial year of the contract, and not reported as unassigned surplus until the Company has recovered amounts in excess of the original consideration paid. The special surplus funds are also reduced by the amount of extraordinary dividends as approved by the Nevada Division of Insurance. Under SAP, the surplus notes are recorded as a separate component of surplus. Under SAP, changes to the estimated contingent profit commission under the LPT Agreement are reflected in commission expense in the period that the estimate is revised.
Insurance Company Dividends and Regulatory Requirements and Restrictions
The ability of EHI to pay dividends on the Company's common stock and to pay other expenses will be dependent to a significant extent upon the ability of the Nevada domiciled insurance company, EICN, the California domiciled insurance company, ECIC, and the Florida domiciled insurance companies, EPIC and EAC, to pay dividends to their immediate holding company, Employers Group, Inc. (EGI) and, in turn, the ability of EGI to pay dividends to EHI. The amount of dividends each of the Company's subsidiaries may pay to their immediate parent is limited by the laws of its respective state of domicile.
On December 31, 2016, the legal structure of the Company's insurance subsidiaries changed such that all four of its insurance subsidiaries are now wholly owned by EGI (ECIC is no longer a wholly owned subsidiary of EICN and EAC is no longer a wholly owned subsidiary of EPIC). This change in legal structure allows each of the Company's insurance subsidiaries to pay dividends directly to EGI.
Nevada law limits the payment of cash dividends by EICN to its parent by providing that payments cannot be made except from available and accumulated surplus, otherwise unrestricted (unassigned), and derived from realized net operating profits and realized and unrealized capital gains. A stock dividend may be paid out of any available surplus. A cash or stock dividend prohibited by these restrictions may only be declared and distributed as an extraordinary dividend upon the prior approval of the Nevada Commissioner of Insurance (Nevada Commissioner). EICN may not pay such an extraordinary dividend or make an extraordinary distribution until the Nevada Commissioner either approves or does not disapprove the payment within
30 days
after receiving notice of its declaration. An extraordinary dividend or distribution is defined by statute to include any dividend or distribution of cash or property whose fair market value, together with that of other dividends or distributions made within the preceding 12 months, exceeds the lesser of: (a)
10%
of EICN's statutory surplus as regards to policyholders at the next preceding December 31; or (b) EICN's statutory net income, not including realized capital gains, for the 12-month period ending at the next preceding December 31. As of
December 31, 2017
, EICN had positive unassigned surplus of
$196.7 million
. During
2017
, EICN did not pay any dividends. The maximum dividends that may be paid in
2018
by EICN without prior regulatory approval from the Nevada Department of Insurance is
$19.9 million
.
Under Florida law, without regulatory approval, EPIC and EAC may pay dividends if they do not exceed the greater of: the lesser of
10%
of surplus or net income, not including realized capital gains, plus a 2-year carry forward;
10%
of surplus, with dividends payable limited to unassigned funds minus
25%
of unrealized capital gains; or, the lesser of
10%
of surplus or net investment income plus a 3-year carry forward with dividends payable limited to unassigned funds minus
25%
of unrealized capital gains. During
2017
, EPIC and EAC did not pay any dividends. The maximum dividends that may be paid in
2018
by EPIC and EAC without prior regulatory approval from the Florida Office of Insurance Regulation (FOIR) is
$15.9 million
and
$19.0 million
, respectively.
77
ECIC is subject to regulation by the California Department of Insurance (California DOI). The ability of ECIC to pay dividends was further limited by restrictions imposed by the California DOI in its approval of the Company's October 1, 2008 reinsurance pooling agreement. Under that approval: (a) ECIC must initiate discussions of its business plan with the California DOI if its net written premium to policyholder surplus ratio exceeds
1.5 to 1
; (b) ECIC will not exceed a ratio of net written premium to policyholder surplus of
2 to 1
without approval of the California DOI; (c) if at any time ECIC's policyholder surplus decreases to
80%
or less than the September 30, 2008 balance, ECIC shall cease issuing new policies in California, but may continue to renew existing policies until it has (i) received a capital infusion to bring its surplus position to the same level as that as of September 30, 2008 and (ii) submitted a new business plan to the California DOI; (d) ECIC will maintain a risk based capital (RBC) level of at least
350%
of the authorized control level; (e) should ECIC fail to comply with any commitments listed herein, ECIC will consent to any request by the California DOI to cease issuing new policies in California, but may continue to renew existing policies until such time that as ECIC is able to achieve full compliance with each commitment; and (f) the obligations listed shall only terminate with the written consent of the California DOI. During the years ended
December 31, 2017
,
2016
, and
2015
, ECIC was in compliance with these requirements.
Additionally, the California Insurance Holding Company System Regulatory Act limits the ability of ECIC to pay dividends to its parent. California law provides that, absent prior approval of the California Insurance Commissioner, dividends may only be declared from earned surplus. For purpose of this statute, earned surplus excludes amounts (1) derived from net appreciation in the value of assets not yet realized, or (2) derived from an exchange of assets, unless the assets received are currently realizable in cash. In addition, California law provides that the appropriate insurance regulatory authorities in the state of California must approve (or, within a 30 day notice period, not disapprove) any dividend that, together with all other such dividends paid during the preceding 12 months, exceeds the greater of: (a) 10% of the paying company's statutory surplus as regards to policyholders at the preceding December 31; or (b) 100% of net income for the preceding year. During
2017
, ECIC paid an ordinary dividend in the amount of
$38.0 million
to its parent company, EGI. ECIC can pay
$10.4 million
of dividends through August 8, 2018 and
$48.4 million
thereafter without prior regulatory approval, provided that no dividends are paid prior to August 8, 2018.
EPIC and EAC are subject to regulation by the Florida Department of Financial Services (FDFS). Florida statute Section 624.408 requires EPIC and EAC to maintain minimum capital and surplus of the greater of
$4.0 million
or
10%
of total liabilities. Florida statute Section 624.4095 requires EPIC and EAC to maintain a ratio of written premiums, defined as
1.25
times written premiums, to surplus of no greater than
10-to-1
for gross written premiums and
4-to-1
for net written premiums. During the years ended
December 31, 2017
,
2016
, and
2015
, EPIC and EAC were in compliance with these statutes.
Additionally, EICN, ECIC, EPIC, and EAC are required to comply with RBC requirements. RBC is a method of measuring the amount of capital appropriate for an insurance company to support its overall business operations in light of its size and risk profile. NAIC RBC standards are used by regulators to determine appropriate regulatory actions relating to insurers that show signs of weak or deteriorating conditions. As of
December 31, 2017
,
2016
, and
2015
, EICN, ECIC, EPIC, and EAC each had total adjusted capital above all regulatory action levels.
16. Accumulated Other Comprehensive Income
Accumulated other comprehensive income is comprised of unrealized gains on investments classified as available-for-sale, net of deferred tax expense. The following table summarizes the components of accumulated other comprehensive income:
|
Years Ended December 31,
|
|||||||
|
2017
|
2016
|
||||||
|
(in millions)
|
|||||||
|
Net unrealized gain on investments, before taxes
|
$
|
136.0
|
|
$
|
114.6
|
|
|
|
Deferred tax expense on net unrealized gains
|
(28.6
|
)
|
(40.1
|
)
|
|||
|
Total accumulated other comprehensive income
|
$
|
107.4
|
|
$
|
74.5
|
|
|
17. Employee Benefit and Retirement Plans
The Company maintains a 401(k) defined contribution plan covering all eligible Company employees (the Employers 401(k) Plan). Under the Employers 401(k) Plan, the Company's safe harbor matching consists of
100%
matching contribution on salary deferrals up to
3%
of compensation and then
50%
matching contribution on salary deferrals from
3%
to
5%
of compensation. The Company's matching contribution to the Employers 401(k) Plan was
$1.9 million
,
$1.9 million
, and
$1.8 million
for the years ended
December 31, 2017
,
2016
, and
2015
, respectively.
18
. Earnings Per Common Share
Basic earnings per share, which includes no dilution from outstanding stock-based awards, is computed by dividing net income by the weighted average number of common shares outstanding for the period. Diluted earnings per share reflect the potential dilutive impact of all outstanding stock-based awards on earnings per share. Diluted earnings per share includes common shares
78
assumed issued under the “treasury stock method,” which reflects the potential dilution that would occur if outstanding RSUs and PSUs vested, and stock options were to be exercised.
Commencing in 2017, certain stock-based compensation awards are eligible to receive dividend equivalents on awards that fully vest or become payable. These awards are not considered participating securities for the purposes of determining earnings per share.
The following table presents the net income and the weighted average shares outstanding used in the earnings per share common share calculations.
|
Years Ended December 31,
|
|||||||||||
|
2017
|
|
2016
|
|
2015
|
|||||||
|
(in millions, except share data)
|
|||||||||||
|
Net income
|
$
|
101.2
|
|
$
|
106.7
|
|
$
|
94.4
|
|
||
|
Weighted average number of shares outstanding–basic
|
32,501,576
|
|
32,434,580
|
|
32,070,911
|
|
|||||
|
Effect of dilutive securities:
|
|||||||||||
|
Stock options
|
208,602
|
|
246,562
|
|
286,764
|
|
|||||
|
PSUs
|
271,738
|
|
222,594
|
|
155,768
|
|
|||||
|
RSUs
|
78,844
|
|
73,099
|
|
48,010
|
|
|||||
|
Dilutive potential shares
|
559,184
|
|
542,255
|
|
490,542
|
|
|||||
|
Weighted average number of shares outstanding–diluted
|
33,060,760
|
|
32,976,835
|
|
32,561,453
|
|
|||||
Diluted earnings per share excludes those outstanding stock options and any other common stock equivalents in periods where the inclusion of such stock options and common stock equivalents would be anti-dilutive. The following table presents the number of stock options, PSUs and RSUs that were excluded from the Company's calculation of diluted earnings per share.
|
Years Ended December 31,
|
||||||||
|
2017
|
2016
|
2015
|
||||||
|
Stock options excluded as the exercise price was greater than the average market price
|
—
|
|
—
|
|
20,200
|
|
||
|
Stock options excluded under the treasury method, as the potential proceeds on settlement or exercise was greater than the value of shares acquired
|
—
|
|
89,221
|
|
257,405
|
|
||
19
. Selected Quarterly Financial Data (Unaudited)
Quarterly results for the years ended
December 31, 2017
and
2016
were as follows:
|
2017 Quarters Ended
|
||||||||||||||||
|
March 31
|
June 30
|
September 30
|
December 31
|
|||||||||||||
|
(in millions, except per share data)
|
||||||||||||||||
|
Net premiums earned
|
$
|
175.3
|
|
$
|
171.7
|
|
$
|
187.9
|
|
$
|
181.6
|
|
||||
|
Net realized gains on investments
|
2.2
|
|
1.1
|
|
4.1
|
|
—
|
|
||||||||
|
Losses and loss adjustment expenses
|
109.0
|
|
106.1
|
|
116.9
|
|
85.2
|
|
||||||||
|
Commission expense
|
21.5
|
|
21.5
|
|
23.7
|
|
24.7
|
|
||||||||
|
Underwriting and other operating expenses
|
35.9
|
|
32.6
|
|
33.6
|
|
37.8
|
|
||||||||
|
Other expenses
|
—
|
|
—
|
|
7.5
|
|
—
|
|
||||||||
|
Income tax expense
|
6.3
|
|
7.8
|
|
7.0
|
|
21.7
|
|
||||||||
|
Net income
|
23.2
|
|
24.8
|
|
21.9
|
|
31.3
|
|
||||||||
|
Earnings per common share:
|
||||||||||||||||
|
Basic
|
0.72
|
|
0.76
|
|
0.67
|
|
0.96
|
|
||||||||
|
Diluted
|
0.70
|
|
0.75
|
|
0.66
|
|
0.94
|
|
||||||||
79
|
2016 Quarters Ended
|
||||||||||||||||
|
March 31
|
June 30
|
September 30
|
December 31
|
|||||||||||||
|
(in millions, except per share data)
|
||||||||||||||||
|
Net premiums earned
|
$
|
172.6
|
|
$
|
176.9
|
|
$
|
173.3
|
|
$
|
172.0
|
|
||||
|
Net realized gains on investments
|
1.5
|
|
6.0
|
|
1.6
|
|
2.1
|
|
||||||||
|
Losses and loss adjustment expenses
|
107.3
|
|
111.7
|
|
109.0
|
|
89.9
|
|
||||||||
|
Commission expense
|
20.3
|
|
21.9
|
|
21.3
|
|
20.0
|
|
||||||||
|
Underwriting and other operating expenses
|
36.3
|
|
33.6
|
|
31.7
|
|
34.5
|
|
||||||||
|
Income tax expense
|
5.9
|
|
7.4
|
|
7.8
|
|
12.9
|
|
||||||||
|
Net income
|
21.8
|
|
26.8
|
|
22.6
|
|
35.5
|
|
||||||||
|
Earnings per common share:
|
||||||||||||||||
|
Basic
|
0.67
|
|
0.82
|
|
0.70
|
|
1.10
|
|
||||||||
|
Diluted
|
0.66
|
|
0.81
|
|
0.69
|
|
1.08
|
|
||||||||
Significant Quarterly Adjustments
The second quarter of 2017 was favorably impacted by a
$2.1 million
gain from EHI's purchase of a
$12.0 million
notes payable.
The third quarter of 2017 was negatively impacted by a write-off of
$7.5 million
of previously capitalized costs relating to the development of information technology capabilities that had not yet been placed in service.
The fourth quarter of 2017 was impacted by: (1) favorable prior accident year loss development of
$18.0 million
; (2) a reduction in our current accident year loss provision rate for that reduced Losses and LAE by
$10.6 million
; and (3)
$7.0 million
in additional income tax expense from a revaluation of the Company's net deferred tax asset resulting from Enactment.
The second quarter of 2016 was impacted by: (1) an increase in net realized gains on investments, which resulted from sales of equity securities, which were undertaken in order to meet certain cash needs at the holding company; and (2) an increase in losses and loss adjustment expenses primarily due to four large losses totaling
$6.5 million
recognized during the quarter.
The fourth quarter of 2016 was impacted by favorable prior accident year loss development of
$16.9 million
.
None.
Disclosure Controls and Procedures
We maintain disclosure controls and procedures (as defined in Rules 13a-15(e) and 15d-15(e) of the Securities Exchange Act of 1934, as amended (the Exchange Act)) designed to provide reasonable assurance that the information required to be reported in the Exchange Act filings is recorded, processed, summarized and reported within the time periods specified and pursuant to SEC regulations, including controls and procedures designed to ensure that this information is accumulated and communicated to management, including its chief executive officer and chief financial officer, as appropriate, to allow timely decisions regarding the required disclosure. It should be noted that, because of inherent limitations, our disclosure controls and procedures, however well designed and operated, can provide only reasonable, and not absolute, assurance that the objectives of the disclosure controls and procedures are met.
Our management, with the participation of our Chief Executive Officer and Chief Financial Officer, evaluated the effectiveness of our disclosure controls and procedures as of the end of the period covered by this report. Based upon that evaluation, our Chief Executive Officer and Chief Financial Officer have concluded that our disclosure controls and procedures were effective at a reasonable level of assurance as of
December 31, 2017
.
Management's Report on Internal Control Over Financial Reporting
Management's report regarding internal control over financial reporting is set forth in Item 8 of this report under the caption “Management's Report on Internal Control over Financial Reporting” and incorporated herein by reference.
Attestation Report of Independent Registered Public Accounting Firm
The attestation report of the Company's independent registered public accounting firm regarding internal control over financial reporting is set forth in Item 8 of this report under the caption “Report of Independent Registered Public Accounting Firm on Internal Control Over Financial Reporting” and incorporated herein by reference.
80
Changes in Internal Control Over Financial Reporting
There have not been any changes in our internal control over financial reporting (as such term is defined in Rules 13a-15(f) in the Exchange Act) during the fourth fiscal quarter of the year to which this report relates that have materially affected, or are reasonably likely to materially affect, our internal control over financial reporting.
None.
81
The information required by Item 10 with respect to our executive officers and key employees is included under the caption “Executive Officers of the Registrant” in our Proxy Statement for the
2018
Annual Meeting and is incorporated herein by reference.
The information required by Item 10 with respect to our Directors is included under the caption “Election of Directors” in our Proxy Statement for the
2018
Annual Meeting of Stockholders and is incorporated herein by reference.
The information required by Item 10 with respect to compliance with Section 16 of the Exchange Act is included under the caption “Section 16(a) Beneficial Ownership Reporting Compliance” in our Proxy Statement for the
2018
Annual Meeting of Stockholders and is incorporated herein by reference.
The information required by Item 10 with respect to our audit committee and our audit committee financial expert is included under the caption “The Board of Directors and its Committees - Audit Committee” in our Proxy Statement for the
2018
Annual Meeting of Stockholders and is incorporated herein by reference.
The information required by Item 10 with respect to our Code of Business Conduct and Ethics and our Code of Ethics for Senior Financial Officers is posted on our website at
www.employers.com
in the Investors section under “Governance.” We will post information regarding any amendment to, or waiver from, our Code of Business Conduct and Ethics on our website in the Investor section under Governance.
The information required by Item 11 is included under the captions “Compensation Discussion and Analysis,” “Compensation Committee Report” and “Compensation Committee Interlocks and Insider Participation” in our Proxy Statement for the
2018
Annual Meeting of Stockholders and is incorporated herein by reference.
Certain information required by Item 12 is included under the captions “Security Ownership of Certain Beneficial Owners and Management” and “Compensation Discussion and Analysis” in our Proxy Statement for the
2018
Annual Meeting of Stockholders and is incorporated herein by reference.
Equity and Incentive Plan
The following table gives information about our common stock that may be issued upon the exercise of options, warrants, and rights under all of our existing equity compensation plans as of
December 31, 2017
. We do not have any plans not approved by our stockholders. Our equity compensation plans are discussed further in Note
14
in the Notes to our Consolidated Financial Statements, which are included herein.
|
Plan Category
|
(a)
Number of securities
to be issued upon
exercise of outstanding
options, warrants, and
rights
|
(b)
Weighted-average
exercised price of
outstanding options,
warrants, and
rights
(4)
|
(c)
Number of securities remaining available for further issuance
under compensation plans
(excluding securities
reflected in column (a))
|
|||||||
|
Equity compensation plans approved by stockholders
(1)
:
|
||||||||||
|
Stock options
|
247,347
|
|
$
|
22.90
|
|
3,605,278
|
|
|||
|
RSUs
(2)
|
327,072
|
|
3,278,206
|
|
||||||
|
PSUs
(3)
|
304,676
|
|
2,973,530
|
|
||||||
|
Equity compensation plans not approved by stockholders
|
—
|
|
—
|
|
—
|
|
||||
|
Total
|
879,095
|
|
$
|
22.90
|
|
2,973,530
|
|
|||
|
(1)
|
The Plan is administered by the Compensation Committee of the Board of Directors, which is authorized to grant, at its discretion, awards to officers, employees, non-employee directors, consultants, and independent contractors. The maximum number of common shares currently being reserved for grants of awards under the Plan was
5,500,000
shares, prior to reductions for grants made.
|
The Plan provides for the grant of stock options (both incentive stock options and nonqualified stock options), stock appreciation rights, shares of restricted stock, RSUs, PSUs, and other stock-based awards. As of
December 31, 2017
, the only incentive awards outstanding under the Plan were nonqualified stock options, RSUs, and PSUs.
82
|
(2)
|
RSUs are phantom (as opposed to actual) shares of common stock which, depending on the individual award, vest in equal tranches over one- to four-year periods, subject to the recipient maintaining a continuous relationship with the Company through the applicable vesting date.
|
|
(3)
|
PSUs are phantom (as opposed to actual) shares of common stock, which are subject to a performance period of two to three years followed by an additional one-year vesting period, subject to the recipient maintaining a continuous relationship with the Company through the applicable vesting date. PSU awards are subject to certain performance goals with payouts that range from 0% to 200% of the target awards. The values shown in the table above represent the aggregate number of PSUs based on the expectation of the Company achieving an
200%
of target rate for the
2015
PSUs, a
200%
of target rate for the
2016
PSUs, and a
127%
of target rate for the
2017
PSUs at the target level.
|
|
(4)
|
Holders of RSUs and PSUs are not entitled to voting rights. Commencing in 2017, employees who were awarded RSUs and PSUs are entitled to receive dividend equivalents for eligible awards, payable in cash, when the underlying award vests and becomes payable. RSUs and PSUs do not require the payment of an exercise price, accordingly, there is no weighted average exercise price for these awards.
|
The information required by Item 13 is included under the captions “Certain Relationships and Related Transactions” and “Director Independence” in our Proxy Statement for the
2018
Annual Meeting of Stockholders and is incorporated herein by reference.
The information required by Item 14 with respect to the fees and services of Ernst & Young LLP, our independent registered public accounting firm, is included under the caption “Audit Matters” in our Proxy Statement for the
2018
Annual Meeting of Stockholders and is incorporated herein by reference.
83
The following consolidated financial statements are filed in Item 8 of Part II of this report:
|
|
Page
|
|
Report of Independent Registered Public Accounting Firm
|
|
|
Consolidated Balance Sheets as of December 31, 2017 and 2016
|
|
|
Consolidated Statements of Comprehensive Income for each of the three years ended December 31, 2017, 2016 and 2015
|
|
|
Consolidated Statements of Stockholders' Equity for each of the three years ended December 31, 2017, 2016 and 2015
|
|
|
Consolidated Statements of Cash Flows for each of the three years ended December 31, 2017, 2016 and 2015
|
|
|
Notes to Consolidated Financial Statements
|
|
|
Financial Statement Schedules:
|
|
|
Schedule II. Condensed Financial Information of Registrant
|
|
|
Pursuant to Rule 7-05 of Regulation S-X, Financial Statement Schedules I, III, IV, V, and VI have been omitted as the information to be set forth therein is included in the notes to the audited consolidated financial statements.
|
|
84
Schedule II. Condensed Financial Information of Registrant
|
Employers Holdings, Inc.
|
||||||||
|
Condensed Balance Sheets
|
||||||||
|
December 31,
|
||||||||
|
2017
|
2016
|
|||||||
|
Assets
|
(in millions, except share data)
|
|||||||
|
Investments:
|
||||||||
|
Investment in subsidiary
|
$
|
849.6
|
|
$
|
757.5
|
|
||
|
Fixed maturity securities at fair value (amortized cost $40.2 in 2017 and $14.7 in 2016)
|
41.4
|
|
16.0
|
|
||||
|
Short-term investments at fair value (amortized cost $3.7 at December 31, 2017)
|
3.7
|
|
—
|
|
||||
|
Total investments
|
894.7
|
|
773.5
|
|
||||
|
Cash and cash equivalents
|
39.6
|
|
41.4
|
|
||||
|
Accrued investment income
|
0.3
|
|
0.3
|
|
||||
|
Federal income taxes receivable
|
4.2
|
|
9.6
|
|
||||
|
Deferred income taxes, net
|
14.5
|
|
20.0
|
|
||||
|
Other assets
|
0.8
|
|
0.7
|
|
||||
|
Total assets
|
$
|
954.1
|
|
$
|
845.5
|
|
||
|
Liabilities and stockholders' equity
|
||||||||
|
Accounts payable and accrued expenses
|
$
|
4.5
|
|
$
|
4.8
|
|
||
|
Intercompany payable
|
1.9
|
|
0.1
|
|
||||
|
Total liabilities
|
6.4
|
|
4.9
|
|
||||
|
Stockholders' equity
:
|
||||||||
|
Common stock, $0.01 par value; 150,000,000 shares authorized; 56,695,174 and 56,226,277 shares issued and 32,597,819 and 32,128,922 shares outstanding at December 31, 2017 and 2016, respectively
|
0.6
|
|
0.6
|
|
||||
|
Preferred stock, $0.01 par value; 25,000,000 shares authorized; none issued
|
—
|
|
—
|
|
||||
|
Additional paid-in capital
|
381.2
|
|
372.0
|
|
||||
|
Retained earnings
|
842.2
|
|
777.2
|
|
||||
|
Accumulated other comprehensive income, net of tax
|
107.4
|
|
74.5
|
|
||||
|
Treasury stock, at cost (24,097,355 shares at December 31, 2017 and December 31, 2016)
|
(383.7
|
)
|
(383.7
|
)
|
||||
|
Total stockholders' equity
|
947.7
|
|
840.6
|
|
||||
|
Total liabilities and stockholders' equity
|
$
|
954.1
|
|
$
|
845.5
|
|
||
85
|
Employers Holdings, Inc.
|
||||||||||||
|
Condensed Statements of Income
|
||||||||||||
|
Years Ended December 31,
|
||||||||||||
|
2017
|
2016
|
2015
|
||||||||||
|
(in millions, except per share data)
|
||||||||||||
|
Revenues
|
||||||||||||
|
Net investment income
|
$
|
1.3
|
|
$
|
1.9
|
|
$
|
4.0
|
|
|||
|
Net realized gains on investments
|
—
|
|
8.0
|
|
2.4
|
|
||||||
|
Total revenues
|
1.3
|
|
9.9
|
|
6.4
|
|
||||||
|
Expenses
|
||||||||||||
|
Other operating expenses
|
15.2
|
|
13.8
|
|
13.8
|
|
||||||
|
Interest expense
|
—
|
|
—
|
|
1.1
|
|
||||||
|
Total expenses
|
15.2
|
|
13.8
|
|
14.9
|
|
||||||
|
Loss before income taxes and equity in earnings of subsidiary
|
(13.9
|
)
|
(3.9
|
)
|
(8.5
|
)
|
||||||
|
Income tax benefit
|
(5.8
|
)
|
(3.5
|
)
|
(3.3
|
)
|
||||||
|
Net loss before equity in earnings of subsidiary
|
(8.1
|
)
|
(0.4
|
)
|
(5.2
|
)
|
||||||
|
Equity in earnings of subsidiary
|
109.3
|
|
107.1
|
|
99.6
|
|
||||||
|
Net income
|
$
|
101.2
|
|
$
|
106.7
|
|
$
|
94.4
|
|
|||
|
Earnings per common share:
|
||||||||||||
|
Basic
|
$
|
3.11
|
|
$
|
3.29
|
|
$
|
2.94
|
|
|||
|
Diluted
|
$
|
3.06
|
|
$
|
3.24
|
|
$
|
2.90
|
|
|||
|
Cash dividends declared per common share
|
$
|
0.60
|
|
$
|
0.36
|
|
$
|
0.24
|
|
|||
86
|
Employers Holdings, Inc.
|
|||||||||||
|
Condensed Statement of Cash Flows
|
|||||||||||
|
Years Ended December 31,
|
|||||||||||
|
2017
|
2016
|
2015
|
|||||||||
|
(in millions)
|
|||||||||||
|
Operating activities
|
|||||||||||
|
Net income
|
$
|
101.2
|
|
$
|
106.7
|
|
$
|
94.4
|
|
||
|
Adjustments to reconcile net income to net cash provided by (used in) operating activities:
|
|||||||||||
|
Equity in undistributed earnings of subsidiary
|
(71.5
|
)
|
(107.1
|
)
|
(99.6
|
)
|
|||||
|
Realized gains on investments
|
—
|
|
(8.0
|
)
|
(2.4
|
)
|
|||||
|
Stock-based compensation
|
6.8
|
|
5.8
|
|
4.6
|
|
|||||
|
Excess tax benefits from stock-based compensation
|
—
|
|
—
|
|
(1.2
|
)
|
|||||
|
Amortization of premium on investments, net
|
0.1
|
|
0.4
|
|
0.9
|
|
|||||
|
Deferred income tax expense (benefit)
|
5.3
|
|
2.9
|
|
(4.6
|
)
|
|||||
|
Change in operating assets and liabilities:
|
|||||||||||
|
Accounts payable and accrued expenses
|
(0.3
|
)
|
(0.7
|
)
|
1.7
|
|
|||||
|
Federal income taxes
|
5.4
|
|
(7.9
|
)
|
4.9
|
|
|||||
|
Other assets
|
(0.1
|
)
|
0.8
|
|
0.4
|
|
|||||
|
Intercompany payable
|
1.8
|
|
0.3
|
|
0.1
|
|
|||||
|
Other
|
—
|
|
(0.4
|
)
|
1.2
|
|
|||||
|
Net cash provided by (used in) operating activities
|
48.7
|
|
(7.2
|
)
|
0.4
|
|
|||||
|
Investing activities
|
|||||||||||
|
Purchases of fixed maturity securities
|
(30.6
|
)
|
(31.0
|
)
|
(21.6
|
)
|
|||||
|
Purchases of equity securities
|
—
|
|
(3.6
|
)
|
(19.0
|
)
|
|||||
|
Purchases of short-term securities
|
(7.9
|
)
|
—
|
|
—
|
|
|||||
|
Proceeds from sale of fixed maturity securities
|
5.0
|
|
—
|
|
18.3
|
|
|||||
|
Proceeds from maturities and redemptions of investments
|
4.5
|
|
24.9
|
|
45.5
|
|
|||||
|
Proceeds from sale of equity securities
|
—
|
|
88.5
|
|
24.0
|
|
|||||
|
Capital contributions to subsidiary
|
(5.6
|
)
|
(8.0
|
)
|
—
|
|
|||||
|
Change in restricted cash equivalents
|
—
|
|
—
|
|
4.6
|
|
|||||
|
Net cash (used in) provided by investing activities
|
(34.6
|
)
|
70.8
|
|
51.8
|
|
|||||
|
Financing activities
|
|||||||||||
|
Acquisition of common stock
|
—
|
|
(21.1
|
)
|
—
|
|
|||||
|
Cash transactions related to stock-based compensation
|
3.8
|
|
9.0
|
|
4.8
|
|
|||||
|
Dividends paid to stockholders
|
(19.7
|
)
|
(11.5
|
)
|
(7.7
|
)
|
|||||
|
Payments on notes payable
|
—
|
|
—
|
|
(60.0
|
)
|
|||||
|
Excess tax benefits from stock-based compensation
|
—
|
|
—
|
|
1.2
|
|
|||||
|
Net cash used in financing activities
|
(15.9
|
)
|
(23.6
|
)
|
(61.7
|
)
|
|||||
|
Net (decrease) increase in cash and cash equivalents
|
(1.8
|
)
|
40.0
|
|
(9.5
|
)
|
|||||
|
Cash and cash equivalents at the beginning of the period
|
41.4
|
|
1.4
|
|
10.9
|
|
|||||
|
Cash and cash equivalents at the end of the period
|
$
|
39.6
|
|
$
|
41.4
|
|
$
|
1.4
|
|
||
87
Exhibits:
|
Exhibit
No.
|
Description of Exhibit
|
Included Herewith
|
Incorporated by Reference Herein
|
||||||||||
|
Form
|
File No.
|
Exhibit
|
Filing Date
|
||||||||||
|
3.1
|
|
10-K
|
001-33245
|
3.1
|
March 30, 2007
|
||||||||
|
3.2
|
|
10-Q
|
001-33245
|
3.1
|
April 27, 2017
|
||||||||
|
4.1
|
|
S-1/A
|
333-139092
|
4.1
|
January 18, 2007
|
||||||||
|
10.1
|
|
S-1/A
|
333-139092
|
10.1
|
January 18, 2007
|
||||||||
|
10.2
|
|
S-1/A
|
333-139092
|
10.2
|
January 18, 2007
|
||||||||
|
10.3
|
|
S-1/A
|
333-139092
|
10.3
|
January 18, 2007
|
||||||||
|
10.4
|
|
S-1/A
|
333-139092
|
10.4
|
January 18, 2007
|
||||||||
|
10.5
|
|
8-K
|
001-33245
|
10.1
|
August 15, 2017
|
||||||||
|
*10.6
|
|
10-Q
|
001-33245
|
10.1
|
August 7, 2009
|
||||||||
|
*10.7
|
|
8-K
|
001-33245
|
10.1
|
May 11, 2012
|
||||||||
|
*10.8
|
|
8-K
|
001-33245
|
10.1
|
December 16, 2016
|
||||||||
|
*10.9
|
|
8-K
|
001-33245
|
10.1
|
June 30, 2017
|
||||||||
|
*10.10
|
|
8-K
|
001-33245
|
10.2
|
June 30, 2017
|
||||||||
|
*10.11
|
|
8-K
|
001-33245
|
10.3
|
June 30, 2017
|
||||||||
|
*10.12
|
|
8-K
|
001-33245
|
10.4
|
June 30, 2017
|
||||||||
88
|
*10.13
|
|
8-K
|
001-33245
|
10.1
|
October 31, 2017
|
||||||||
|
*10.14
|
|
10-Q
|
001-33245
|
10.2
|
April 27, 2017
|
||||||||
|
*10.15
|
|
10-Q
|
001-33245
|
10.3
|
April 27, 2017
|
||||||||
|
*10.16
|
|
10-Q
|
001-33245
|
10.3
|
April 30, 2015
|
||||||||
|
*10.17
|
|
8-K
|
001-3324
|
10.1
|
May 22, 2015
|
||||||||
|
12.1
|
|
X
|
|||||||||||
|
21.1
|
|
X
|
|||||||||||
|
23.1
|
|
X
|
|||||||||||
|
31.1
|
|
X
|
|||||||||||
|
31.2
|
|
X
|
|||||||||||
|
32.1
|
|
X
|
|||||||||||
|
32.2
|
|
X
|
|||||||||||
|
101.INS
|
|
XBRL Instance Document
|
X
|
||||||||||
|
101.SCH
|
|
XBRL Taxonomy Extension Schema Document
|
X
|
||||||||||
|
101.CAL
|
|
XBRL Taxonomy Extension Calculation Linkbase Document
|
X
|
||||||||||
|
101.DEF
|
|
XBRL Taxonomy Definition Linkbase Document
|
X
|
||||||||||
|
101.LAB
|
|
XBRL Taxonomy Extension Label Linkbase Document
|
X
|
||||||||||
|
101.PRE
|
|
XBRL Taxonomy Extension Presentation Linkbase Document
|
X
|
||||||||||
————
*Represents management contracts and compensatory plans or arrangements.
|
(1)
|
Confidential treatment has been requested for certain confidential portions of this exhibit; these confidential portions have been omitted from this exhibit and filed separately with the Securities and Exchange Commission.
|
89
SIGNATURES
Pursuant to the requirements of Section 13 or 15(d) of the Securities Act of 1934, the registrant has duly caused this report to be signed on its behalf by the undersigned, thereunto duly authorized.
|
Date:
|
March 1, 2018
|
EMPLOYERS HOLDINGS, INC.
|
|
|
By:
|
/s/ Michael S. Paquette
|
||
|
Name: Michael S. Paquette
|
|||
|
Title: Executive Vice President and Chief Financial Officer
|
|||
Pursuant to the requirements of the Securities Exchange Act of 1934, this report has been signed by the following persons on behalf of the registrant and in the capacities and on the dates indicated.
|
Signature
|
Title
|
Date
|
|
/s/ Michael D. Rumbolz
|
Chairman of the Board
|
March 1, 2018
|
|
Michael D. Rumbolz
|
||
|
/s/ Douglas D. Dirks
|
President and Chief Executive Officer, Director (Principal Executive Officer)
|
March 1, 2018
|
|
Douglas D. Dirks
|
||
|
/s/ Michael S. Paquette
|
Executive Vice President and Chief Financial Officer (Principal Financial and Accounting Officer)
|
March 1, 2018
|
|
Michael S. Paquette
|
||
|
/s/ Richard W. Blakey
|
Director
|
March 1, 2018
|
|
Richard W. Blakey
|
||
|
/s/ Prasanna G. Dhoré
|
Director
|
March 1, 2018
|
|
Prasanna G. Dhoré
|
||
|
/s/ Valerie R. Glenn
|
Director
|
March 1, 2018
|
|
Valerie R. Glenn
|
||
|
/s/ James R. Kroner
|
Director
|
March 1, 2018
|
|
James R. Kroner
|
||
|
/s/ Michael J. McColgan
|
Director
|
March 1, 2018
|
|
Michael J. McColgan
|
||
|
/s/ Michael J. McSally
|
Director
|
March 1, 2018
|
|
Michael J. McSally
|
||
|
/s/ Ronald F. Mosher
|
Director
|
March 1, 2018
|
|
Ronald F. Mosher
|
||
|
/s/ Katherine W. Ong
|
Director
|
March 1, 2018
|
|
Katherine W. Ong
|
||
90
TABLE OF CONTENTS
Part IItem 1. BusinessItem 1A. Risk FactorsItem 1B. Unresolved Staff CommentsItem 2. PropertiesItem 3. Legal ProceedingsItem 4. Mine Safety DisclosuresPart IIItem 5. Market For Registrant's Common Equity, Related Stockholder Matters and Issuer Purchases Of Equity SecuritiesItem 6. Selected Financial DataItem 7. Management S Discussion and Analysis Of Consolidated Financial Condition and Results Of OperationsItem 7A. Quantitative and Qualitative Disclosures About Market RiskItem 8. Financial Statements and Supplementary DataItem 9. Changes in and Disagreements with Accountants on Accounting and Financial DisclosureItem 9A. Controls and ProceduresItem 9B. Other InformationPart IIIItem 10. Directors, Executive Officers, and Corporate GovernanceItem 11. Executive CompensationItem 12. Security Ownership Of Certain Beneficial Owners and Management and Related Stockholder MattersItem 13. Certain Relationships and Related Transactions, and Director IndependenceItem 14. Principal Accountant Fees and ServicesPart IVItem 15. Exhibits and Financial Statement Schedules