EDISON INTERNATIONAL
10-Ks and 10-Qs
|
|
|
|
|
|
|
|
|
|
|
|
|
|
|
|
|
|
|
|
|
|
|
|
|
|
|
|
|
|
|
|
|
|
|
|
|
|
|
|
|
|
|
|
|
|
|
|
|
|
|
|
|
|
|
|
UNITED STATES
SECURITIES AND EXCHANGE COMMISSION
Washington, D.C. 20549
FORM 10-K
Securities registered pursuant to Section 12(b) of the Act:
|
(Mark One)
|
|
|
þ
|
ANNUAL REPORT PURSUANT TO SECTION 13 OR 15(d) OF THE SECURITIES EXCHANGE ACT OF 1934
|
|
For the fiscal year ended December 31, 2014
|
|
|
o
|
TRANSITION REPORT PURSUANT TO SECTION 13 OR 15(d) OF THE SECURITIES EXCHANGE ACT OF 1934
|
|
For the transition period from to
|
|
|
Commission
File Number
|
Exact Name of Registrant
as specified in its charter
|
State or Other Jurisdiction of
Incorporation or Organization
|
IRS Employer
Identification Number
|
|||
|
1-9936
|
EDISON INTERNATIONAL
|
California
|
95-4137452
|
|||
|
1-2313
|
SOUTHERN CALIFORNIA EDISON COMPANY
|
California
|
95-1240335
|
|||
|
EDISON INTERNATIONAL
|
SOUTHERN CALIFORNIA EDISON COMPANY
|
|
|
2244 Walnut Grove Avenue
(P.O. Box 976)
Rosemead, California 91770
(Address of principal executive offices)
|
2244 Walnut Grove Avenue
(P.O. Box 800)
Rosemead, California 91770
(Address of principal executive offices)
|
|
|
(626) 302-2222
(Registrant's telephone number, including area code)
|
(626) 302-1212
(Registrant's telephone number, including area code)
|
|
|
Title of each class
|
Name of each exchange on which registered
|
|
|
Edison International:
Common Stock, no par value
|
NYSE LLC
|
|
|
Southern California Edison Company:
Cumulative Preferred Stock
|
NYSE MKT LLC
|
|
|
4.08% Series, 4.24% Series, 4.32% Series, 4.78% Series
|
||
Securities registered pursuant to Section 12(g) of the Act: None
Indicate by check mark if the registrant is a well-known seasoned issuer, as defined in Rule 405 of the Securities Act.
Edison International
Yes
þ
No
o
Southern California Edison Company
Yes
þ
No
o
Indicate by check mark if the registrant is not required to file reports pursuant to Section 13 or Section 15(d) of the Exchange Act.
Edison International
Yes
o
No
þ
Southern California Edison Company
Yes
o
No
þ
Indicate by check mark whether the registrant (1) has filed all reports required to be filed by Section 13 or 15(d) of the Securities Exchange Act of 1934 during the preceding 12 months (or for such shorter period that the registrant was required to file such reports), and (2) has been subject to such filing requirements for the past 90 days.
Edison International
Yes
þ
No
o
Southern California Edison Company
Yes
þ
No
o
Indicate by check mark whether the registrant has submitted electronically and posted on its corporate website, if any, every Interactive Data File required to be submitted and posted pursuant to Rule 405 of Regulation S-T (§ 232.405 of this chapter) during the preceding 12 months (or for such shorter period that the registrant was required to submit and post such files).
Edison International
Yes
þ
No
o
Southern California Edison Company
Yes
þ
No
o
Indicate by check mark if disclosure of delinquent filers pursuant to Item 405 of Regulation S-K is not contained herein, and will not be contained, to the best of registrant's knowledge, in definitive proxy or information statements incorporated by reference in Part III of this Form 10-K or any amendment to this Form 10-K.
Edison International
þ
Southern California Edison Company
þ
Indicate by check mark whether the registrant is a shell company (as defined in Rule 12b-2 of the Exchange Act).
|
Indicate by check mark whether the registrant is a large accelerated filer, an accelerated filer, a non-accelerated filer or a smaller reporting company. See the definitions of "accelerated filer," "large accelerated filer," and "smaller reporting company" in Rule 12b-12 of the Exchange Act. (Check One):
|
||||
|
Edison International
|
Large Accelerated Filer
þ
|
Accelerated Filer
o
|
Non-accelerated Filer
o
|
Smaller Reporting Company
o
|
|
Southern California Edison Company
|
Large Accelerated Filer
o
|
Accelerated Filer
o
|
Non-accelerated Filer
þ
|
Smaller Reporting Company
o
|
Edison International
Yes
o
No
þ
Southern California Edison Company
Yes
o
No
þ
Aggregate market value of voting and non-voting common equity held by non-affiliates of the registrants as of June 30, 2014, the last business day of the most recently completed second fiscal quarter:
Edison International Approximately $15.7 billion Southern California Edison Company Wholly owned by Edison International
|
Common Stock outstanding as of February 20, 2015:
|
||
|
Edison International
|
325,811,206 shares
|
|
|
Southern California Edison Company
|
434,888,104 shares (wholly owned by Edison International)
|
|
DOCUMENTS INCORPORATED BY REFERENCE
Designated portions of the Proxy Statement relating to registrants' joint 2015 Annual Meeting of Shareholders have been incorporated by reference into the parts of this report where indicated.
TABLE OF CONTENTS
|
SEC Form 10-K Reference Number
|
|||||
|
Part II, Item 7
|
|||||
i
|
Nuclear Decommissioning – A
sset Retirement Obligation
|
|||||
|
Part I, Item 1A
|
|||||
|
Part II, Item 7A
|
|||||
|
Part II, Item 8
|
|||||
ii
|
Part II, Item 6
|
|||||
|
Part II, Item 9A
|
|||||
|
Part II, Item 9B
|
|||||
|
Part II, Item 9
|
|||||
|
Part I, Item 1
|
|||||
iii
|
Part I, Item 1B
|
|||||
|
Part I, Item 2
|
|||||
|
Part I, Item 3
|
|||||
|
Part I, Item 3
|
|||||
|
Part I, Item 3
|
|||||
|
Part III, Item 10
|
|||||
|
Part III, Item 11
|
|||||
|
Part III, Item 12
|
|||||
|
Part III, Item 13
|
|||||
|
Part III, Item 14
|
|||||
|
Part II, Item 5
|
|||||
|
Part IV, Item 15
|
|||||
This is a combined Form 10-K separately filed by Edison International and Southern California Edison Company. Information contained herein relating to an individual company is filed by such company on its own behalf. Each company makes representations only as to itself and makes no other representation whatsoever as to any other company.
iv
GLOSSARY
The following terms and abbreviations appearing in the text of this report have the meanings indicated below.
|
Amended Plan of Reorganization
|
EME Chapter 11 Bankruptcy Plan of Reorganization as amended to incorporate the terms of the Settlement Agreement, dated February 19, 2014
|
|
|
AFUDC
|
allowance for funds used during construction
|
|
|
APS
|
|
Arizona Public Service Company, operator of Four Corners
|
|
ARO(s)
|
|
asset retirement obligation(s)
|
|
Bankruptcy Code
|
Chapter 11 of the United States Bankruptcy Code
|
|
|
Bankruptcy Court
|
United States Bankruptcy Court for the Northern District of Illinois, Eastern Division
|
|
|
Bcf
|
|
billion cubic feet
|
|
CAA
|
|
Clean Air Act
|
|
CAISO
|
|
California Independent System Operator
|
|
CARB
|
|
California Air Resources Board
|
|
Competitive Businesses
|
competitive businesses related to the generation or use of electricity
|
|
|
CPUC
|
|
California Public Utilities Commission
|
|
CRRs
|
|
congestion revenue rights
|
|
DOE
|
|
U.S. Department of Energy
|
|
EME
|
|
Edison Mission Energy
|
|
EME Settlement Agreement
|
|
Settlement Agreement by and among Edison Mission Energy, Edison International and the Consenting Noteholders identified therein, dated February 18, 2014
|
|
EMG
|
|
Edison Mission Group Inc., a wholly owned subsidiary of Edison International and the parent company of EME and Edison Capital
|
|
EPS
|
|
earnings per share
|
|
ERRA
|
|
energy resource recovery account
|
|
FERC
|
|
Federal Energy Regulatory Commission
|
|
Four Corners
|
|
coal fueled electric generating facility located in Farmington, New Mexico in
which SCE held a 48% ownership interest
|
|
GAAP
|
|
generally accepted accounting principles
|
|
GHG
|
|
greenhouse gas
|
|
GRC
|
|
general rate case
|
|
GWh
|
|
gigawatt-hours
|
|
HLBV
|
hypothetical liquidation at book value
|
|
|
IRS
|
Internal Revenue Service
|
|
|
ISO
|
Independent System Operator
|
|
|
MD&A
|
Management's Discussion and Analysis of Financial Condition and Results
of Operations in this report
|
|
|
MHI
|
Mitsubishi Heavy Industries, Inc. and related companies
|
|
|
Moody's
|
Moody's Investors Service
|
|
|
MW
|
megawatts
|
|
|
MWh
|
megawatt-hours
|
|
|
NAAQS
|
national ambient air quality standards
|
|
|
NEIL
|
Nuclear Electric Insurance Limited
|
|
|
NEM
|
net energy metering
|
|
|
NERC
|
North American Electric Reliability Corporation
|
|
|
NRC
|
Nuclear Regulatory Commission
|
|
|
ORA
|
CPUC's Office of Ratepayers Advocates
|
|
|
OII
|
Order Instituting Investigation
|
|
|
Palo Verde
|
large pressurized water nuclear electric generating facility located near
Phoenix, Arizona in which SCE holds a 15.8% ownership interest
|
|
|
PBOP(s)
|
postretirement benefits other than pension(s)
|
|
v
|
PG&E
|
Pacific Gas & Electric Company
|
|
|
PSD
|
Prevention of Significant Deterioration
|
|
|
QF(s)
|
qualifying facility(ies)
|
|
|
ROE
|
return on common equity
|
|
|
S&P
|
Standard & Poor's Ratings Services
|
|
|
San Onofre
|
retired nuclear generating facility located in south
San Clemente, California in which SCE holds a 78.21% ownership interest
|
|
|
San Onofre OII Settlement Agreement
|
Settlement Agreement by and among The Utility Reform Network, the CPUC's Office of Ratepayer Advocates, SDG&E, the Coalition of California Utility Employees, and Friends of the Earth, dated November 20, 2014
|
|
|
SCE
|
Southern California Edison Company
|
|
|
SDG&E
|
San Diego Gas & Electric
|
|
|
SEC
|
U.S. Securities and Exchange Commission
|
|
|
SED
|
Safety and Enforcement Division of the CPUC, formerly known as the Consumer Protection and Safety Division or CPSD
|
|
|
TURN
|
The Utility Reform Network
|
|
|
US EPA
|
U.S. Environmental Protection Agency
|
|
|
VIE(s)
|
variable interest entity(ies)
|
|
vi
FORWARD-LOOKING STATEMENTS
This Annual Report on Form 10-K contains "forward-looking statements" within the meaning of the Private Securities Litigation Reform Act of 1995. Forward-looking statements reflect Edison International's and SCE's current expectations and projections about future events based on Edison International's and SCE's knowledge of present facts and circumstances and assumptions about future events and include any statement that does not directly relate to a historical or current fact. Other information distributed by Edison International and SCE that is incorporated in this report, or that refers to or incorporates this report, may also contain forward-looking statements. In this report and elsewhere, the words "expects," "believes," "anticipates," "estimates," "projects," "intends," "plans," "probable," "may," "will," "could," "would," "should," and variations of such words and similar expressions, or discussions of strategy or of plans, are intended to identify forward-looking statements. Such statements necessarily involve risks and uncertainties that could cause actual results to differ materially from those anticipated. Some of the risks, uncertainties and other important factors that could cause results to differ from those currently expected, or that otherwise could impact Edison International and SCE, include, but are not limited to the:
|
•
|
ability of SCE to recover its costs in a timely manner from its customers through regulated rates;
|
|
•
|
decisions and other actions by the CPUC, the FERC, the NRC and other regulatory authorities and delays in regulatory actions, including potential for penalties or disallowances caused by non-compliance with applicable laws and regulations;
|
|
•
|
ability of Edison International or SCE to borrow funds and access the capital markets on reasonable terms;
|
|
•
|
extent of technological change in the generation, storage, transmission, distribution and use of electricity;
|
|
•
|
risks associated with the operation of transmission and distribution assets and power generating facilities including: public safety issues, failure, availability, efficiency, and output of equipment and availability and cost of spare parts;
|
|
•
|
risks inherent in the construction of transmission and distribution infrastructure replacement and expansion projects, including those related to project site identification, public opposition, environmental mitigation, construction, permitting, power curtailment costs (payments due under power contracts in the event there are delays in the construction of transmission that impact the ability to accept power delivery), and governmental approvals;
|
|
•
|
physical security of SCE's critical assets and personnel and the cyber security of SCE's critical industrial control systems for the operation of the electric grid and other assets and information technology systems for business and customer data;
|
|
•
|
risks associated with the retirement and decommissioning of nuclear generating facilities;
|
|
•
|
cost and availability of electricity, including the ability to procure sufficient resources to meet expected customer needs in the event of power plant outages or significant counterparty defaults under power-purchase agreements;
|
|
•
|
environmental and other public policy laws and regulations, at both the state and federal levels, or changes in the application of those laws, that could require additional expenditures or otherwise affect the cost and manner of doing business;
|
|
•
|
changes in interest rates and rates of inflation, including escalation rates, which may be adjusted by public utility regulators;
|
|
•
|
governmental, statutory, regulatory or administrative changes or initiatives affecting the electricity industry, including the market structure rules applicable to each market and price mitigation strategies adopted by the California Independent System Operator, Regional Transmission Organizations, and adjoining regions;
|
|
•
|
availability and creditworthiness of counterparties and the resulting effects on liquidity in the power and fuel markets and/or the ability of counterparties to pay amounts owed in excess of collateral provided in support of their obligations;
|
|
•
|
cost and availability of labor, equipment and materials or disruptions from labor disputes;
|
|
•
|
ability to obtain sufficient insurance, including insurance relating to SCE's nuclear facilities and wildfire-related liability, and to recover the costs of such insurance or in the absence of insurance the ability to recover uninsured losses;
|
|
•
|
effects of legal proceedings, changes in or interpretations of tax laws, rates or policies;
|
|
•
|
cost and availability of fuel for generating facilities and related transportation to the extent not recovered through regulated rate cost escalation provisions or balancing accounts;
|
1
|
•
|
cost and availability of emission credits or allowances for emission credits;
|
|
•
|
increasing competition in building new transmission systems in SCE's service territory due to FERC Order 1000 that may result in a decrease in new transmission investments by SCE; and
|
|
•
|
weather conditions and natural disasters.
|
See "Risk Factors" in this report for additional information on risks and uncertainties that could cause results to differ from those currently expected or that otherwise could impact Edison International, SCE or their subsidiaries.
Additional information about risks and uncertainties, including more detail about the factors described in this report, is contained throughout this report. Readers are urged to read this entire report, including the information incorporated by reference, and carefully consider the risks, uncertainties and other factors that affect Edison International's and SCE's businesses. Forward-looking statements speak only as of the date they are made and neither Edison International nor SCE are obligated to publicly update or revise forward-looking statements. Readers should review future reports filed by Edison International and SCE with the SEC.
Except when otherwise stated, references to each of Edison International, SCE, Edison Energy, EMG, EME or Edison Capital mean each such company with its subsidiaries on a consolidated basis. References to "Edison International Parent and Other" mean Edison International Parent and its consolidated non-utility subsidiaries.
2
MANAGEMENT'S DISCUSSION AND ANALYSIS OF FINANCIAL CONDITION AND RESULTS OF OPERATIONS
MANAGEMENT OVERVIEW
Highlights of Operating Results
Edison International is the parent holding company of SCE. SCE is a public utility primarily engaged in the business of supplying and delivering electricity to an approximately
50,000
square mile area of southern California. Edison International is also the parent company of subsidiaries that are engaged in competitive businesses related to the generation or use of electricity (the "Competitive Businesses"). Such competitive business activities are currently not material to report as a separate business segment. References to Edison International refer to the consolidated group of Edison International and its subsidiaries. References to Edison International Parent and Other refer to Edison International Parent and its competitive subsidiaries. Unless otherwise described, all of the information contained in this annual report relates to both filers.
|
(in millions)
|
2014
|
2013
|
2014 vs 2013 Change
|
2012
|
|||||||||||
|
Net income (loss) attributable to Edison International
|
|
|
|
|
|||||||||||
|
Continuing operations
|
|||||||||||||||
|
SCE
|
$
|
1,453
|
|
$
|
900
|
|
$
|
553
|
|
$
|
1,569
|
|
|||
|
Edison International Parent and Other
|
(26
|
)
|
(21
|
)
|
(5
|
)
|
(66
|
)
|
|||||||
|
Discontinued operations
|
185
|
|
36
|
|
149
|
|
(1,686
|
)
|
|||||||
|
Edison International
|
1,612
|
|
915
|
|
697
|
|
(183
|
)
|
|||||||
|
Less: Non-core items
|
|
|
|
|
|||||||||||
|
SCE
|
|||||||||||||||
|
Impairment and other charges
|
(72
|
)
|
(365
|
)
|
293
|
|
—
|
|
|||||||
|
2012 General Rate Case – repair deductions (2009 – 2011)
|
—
|
|
—
|
|
—
|
|
231
|
|
|||||||
|
Edison International Parent and Other
|
|||||||||||||||
|
Consolidated state deferred tax impacts related to EME
|
—
|
|
—
|
|
—
|
|
(37
|
)
|
|||||||
|
Gain on sale of Beaver Valley lease interest
|
—
|
|
7
|
|
(7
|
)
|
31
|
|
|||||||
|
Income from allocation of losses to tax equity investor
|
2
|
|
—
|
|
2
|
|
—
|
|
|||||||
|
Discontinued operations
|
185
|
|
36
|
|
149
|
|
(1,686
|
)
|
|||||||
|
Total non-core items
|
115
|
|
(322
|
)
|
437
|
|
(1,461
|
)
|
|||||||
|
Core earnings (losses)
|
|
|
|
||||||||||||
|
SCE
|
1,525
|
|
1,265
|
|
260
|
|
1,338
|
|
|||||||
|
Edison International Parent and Other
|
(28
|
)
|
(28
|
)
|
—
|
|
(60
|
)
|
|||||||
|
Edison International
|
$
|
1,497
|
|
$
|
1,237
|
|
$
|
260
|
|
$
|
1,278
|
|
|||
Edison International's earnings are prepared in accordance with GAAP used in the United States. Management uses core earnings internally for financial planning and for analysis of performance. Core earnings (losses) are also used when communicating with investors and analysts regarding Edison International's earnings results to facilitate comparisons of the Company's performance from period to period. Core earnings (losses) are a non-GAAP financial measure and may not be comparable to those of other companies. Core earnings (losses) are defined as earnings attributable to Edison International shareholders less income or loss from discontinued operations, income resulting from allocation of losses to tax equity investor under the HLBV accounting method and income or loss from significant discrete items that management does not consider representative of ongoing earnings, such as: exit activities, including sale of certain assets and other activities that are no longer continuing; asset impairments and certain tax, regulatory or legal settlements or proceedings.
SCE's 2014 core earnings increased
$260 million
for the year primarily due to higher authorized revenues from rate base growth, higher income tax benefits and lower severance costs. In the fourth quarter of 2014, the CPUC authorized an increase in SCE's revenue of $30 million ($18 million after-tax) due to a revised determination of rate base for deferred income taxes. Included in 2014 results is $19 million ($11 million after-tax) from a change in estimate of revenue under its FERC formula rate and $15 million ($9 million after-tax) of benefits related to generator settlements. See "Notes to Consolidated Financial
3
Statements—Note 14. Interest and Other Income and Other Expenses." SCE incurred severance costs (after-tax) related to workforce reductions of $2 million and $31 million in 2014 and 2013, respectively.
Edison International Parent and Other's core losses for 2014 included higher corporate and new business expenses, offset by higher income from Edison Capital's investments in affordable housing projects.
Consolidated non-core items for 2014 and 2013 for Edison International included:
|
•
|
Impairment and other charges of $163 million ($72 million after-tax) in 2014 related to the San Onofre OII Settlement Agreement (as discussed below) and $575 million (
$365 million
after-tax) in 2013 related to the permanent retirement of San Onofre Units 2 and 3. During the fourth quarter of 2014, SCE revised its estimated impact of the San Onofre OII Settlement by $68 million ($24 million after-tax) consistent with the advice filing for reimbursement of recorded costs. The total 2014 and 2013 charges resulting from the San Onofre issues and settlement were $738 million ($437 million after-tax). Such amounts do not reflect any recoveries from third parties by SCE. For further information, see "—Permanent Retirement of San Onofre and San Onofre OII Settlement" and "Notes to Consolidated Financial Statements—Note 1. Summary of Significant Accounting Policies—Impairment of Long-Lived Assets."
|
|
•
|
Income from discontinued operations, net of tax, included:
|
|
•
|
Income of
$168 million
in 2014 related to the impact of completing the transactions called for in the EME Settlement Agreement (as defined below).
|
|
•
|
Income tax benefits of $39 million during the fourth quarter of 2014 from resolution of uncertain tax positions from settlement of 2003 – 2006 tax years with the IRS and other tax impacts related to EME. See "Notes to Consolidated Financial Statements—Note 7. Income Taxes" for further information.
|
|
•
|
Income tax loss of $22 million in 2014 compared to a benefit of $36 million in 2013 from revised estimates of the tax impact of a tax deconsolidation of EME from Edison International as originally contemplated prior to the EME Settlement. For further information, see "—Resolution of Uncertainty Related to EME in Bankruptcy."
|
|
•
|
An income tax benefit of $7 million in the first quarter of 2013 from reduction in state income taxes related to the sale of Edison Capital's interest in Unit No. 2 of the Beaver Valley Power plant. The sale of Edison Capital's lease interest was completed in 2012. However, the final determination of state income taxes paid was not completed until the first quarter of 2013 which resulted in a change in the estimate of state income taxes due.
|
|
•
|
Income of $2 million related to losses allocated to tax equity investors under the HLBV accounting method. For further information, see "Notes to Consolidated Financial Statements—Note 1. Summary of Significant Accounting Policies." Edison International reflected in core earnings the operating results of the solar rooftop projects, related financings and the priority return to tax equity investor. The losses allocated to the tax equity investor under HLBV method results in income allocated to subsidiaries of Edison International, neither of which is due to the performance of the projects but rather due to the allocation of income tax attributes under the tax equity financing. Accordingly, Edison International has included the non-operating allocation of income as a non-core item.
|
See "Results of Operations" for discussion of SCE and Edison International Parent and Other results of operations, including a comparison of 2013 results to 2012.
Electricity Industry Trends
The electricity industry is undergoing extensive change, including technological advancements such as customer-owned generation, energy storage and customer-owned generation that may change the nature of energy generation and delivery. Recent trends in the electric industry include:
|
•
|
leveling of demand due to slower population growth, demand side management of energy and an increase in customer-owned generation;
|
|
•
|
public policy initiatives such as reducing GHG emissions and encouraging competition for the sale and delivery of electricity;
|
|
•
|
increased need for infrastructure replacement and grid development to accommodate new technologies; and
|
|
•
|
technological and financing innovation that facilitate conservation and customer-owned generation and changes in electricity generation, transmission and distribution.
|
4
The electric distribution grid is an important component of California's public policy goals to support a cleaner environment. These policy goals continue to advance as California moves forward in implementing AB 32, the California Global Warming Solutions Act of 2006. AB 32 established a comprehensive program to reduce GHG emissions and required regulations that would reduce California's GHG emissions to 1990 levels by 2020. California law currently requires retail sellers of electricity to procure 33% of their customers' electricity requirements from renewable resources. The Governor of California has proposed the next set of objectives for 2030 and beyond, which include increasing from 33% to 50% the electricity derived from renewable resources. Also included is a targeted 50% reduction of petroleum use in mobile vehicles, which may result in growth in electric vehicles and investment in charging infrastructure. California’s policy goals in these areas may create opportunities for the electric grid to enable GHG emission reductions by providing the supporting infrastructure to increase adoption of customer-owned generation, electric storage, and electric vehicles but they may increase customer rates and add technical complexity and risk to the safe and reliable operation of the electric grid.
Having considered these trends, SCE is investing in and strengthening its electric grid and driving operational and service excellence to improve system safety, reliability and service while controlling costs and rates. Edison International is investing, at much more modest levels, in Competitive Businesses to largely evaluate the attractiveness of new business models and potential competitive threats to the traditional utility business model.
Distribution Grid Development
The distribution grid needs investment to support two-way flows of electricity created by customer-owned generation as well as new technologies such as electric vehicles and energy storage and is critical to implementing California's public policy goals, including those to reduce GHG emissions. SCE is engaged in initiatives that are not currently addressed in the GRC, including preparing a Distribution Resources Plan and participating in the Charge Ready Program.
Distribution Resources Plan
AB 327 requires SCE and other California investor-owned utilities to submit a proposed Distribution Resources Plan by July 1, 2015. The goal of the Distribution Resources Plan is to facilitate the integration of distributed energy resources at optimal locations in a manner that minimizes overall system costs and maximizes customer benefits from these investments, while at the same time maintaining system safety and reliability. To accomplish this, the plan must evaluate locational benefits and costs of distributed resources located on the distribution system based upon reductions or increases in local generation capacity needs, avoided or increased investments in distribution infrastructure, safety benefits, reliability benefits, and any other savings distributed resources provide to the electric grid or costs to customers.
Charge Ready Program
SCE proposes to increase the availability of electric vehicle charging stations through its Charge Ready program. SCE proposes to work with cities, employers, apartment owners, charging equipment manufacturers and others to deploy up to 30,000 qualified charging stations at locations where cars may be parked for four hours or more. Under the proposal, SCE would build, own and maintain the electric infrastructure needed to serve the qualified charging stations at participating customer locations. Participating customers would install, own, maintain, and operate the charging stations.
The program proposes to begin with a $22 million pilot for installation of up to 1,500 chargers as well as a supporting market education effort. The results of this first phase will help shape Phase 2 of the program, which is expected to cost an additional $333 million over the next five years. SCE requested CPUC approval for its pilot by June 2015, and for Phase 2 by June 2016.
The CPUC issued a decision in December 2014 that reversed a prior prohibition on utility ownership of electric vehicle infrastructure and implemented a case-by-case evaluation requirement for proposed utility investments in electric vehicle infrastructure.
Capital Program
Total capital expenditures (including accruals) were
$4.0 billion
in 2014 and $3.5 billion in 2013. SCE's year-end rate base (excluding San Onofre) was $23.3 billion at December 31, 2014 compared to $21.1 billion at December 31, 2013.
SCE forecasts capital expenditures in the range of
$11.8 billion
to
$13.4 billion
for 2015 – 2017. Actual capital spending will be affected by: changes in regulatory, environmental and engineering design requirements; permitting and project delays; cost and availability of labor, equipment and materials; and other factors. These factors as well as major projects are discussed further under "—Liquidity and Capital Resources—SCE—Capital Investment Plan."
5
Regulatory Matters
2015 General Rate Case
In January 2015, SCE updated its forecasted 2015 base rate revenue requirement request to $5.713 billion, which would be an $80 million increase over currently authorized base rate revenue. The updated base rate revenue requirement request also proposed post-test year increases in 2016 and 2017 of $286 million and $315 million, respectively. The original request, filed in November 2013, included a 2015 base rate revenue requirement request of $6.462 billion, which was subsequently reduced to remove costs related to Four Corners and San Onofre, as directed by the ALJs assigned to the GRC and reflect changes after SCE's rebuttal testimony.
The ORA, recommended that SCE's originally requested 2015 base rate revenue requirement be decreased by approximately $607 million, comprised of approximately $302 million in operations and maintenance expense reductions and approximately $305 million in capital-related revenue requirement reductions. TURN recommended that SCE's originally requested 2015 base rate revenue requirements be decreased by approximately $412 million, comprised of approximately $131 million in operations and maintenance expense reductions and approximately $281 million in capital-related revenue requirement reductions. TURN's recommendation also included a reduction in revenue requirement related to income tax repair deductions that originated during the period 2012 – 2014.
A final 2015 GRC decision is not expected until later in 2015. SCE expects to recognize revenue based on the 2014 authorized revenue requirement until a GRC decision is issued. The CPUC has approved the establishment of a GRC memorandum account, which will make the 2015 revenue requirement ultimately adopted by the CPUC effective as of January 1, 2015. SCE cannot predict the revenue requirement the CPUC will ultimately authorize or provide assurance on the timing of a final decision.
Cost of Capital
In December 2014, the CPUC granted a one-year extension of the date to April 2016 when SCE must file the next cost of capital mechanism application, due to the stability of interest rates since the last cost of capital filing in 2012. As a result, SCE's current authorized cost of capital mechanism is extended through 2016, subject to the trigger mechanism.
The cost of capital trigger mechanism provides for an automatic annual adjustment to SCE's authorized cost of capital in September if the utility bond index changes beyond certain thresholds. The adjustment would apply to the following calendar year. The return on common equity will remain at 10.45% for 2015 and 2016, subject to any index changes that exceed the thresholds for 2016.
Edison International Dividend Policy
In December 2014, Edison International declared a 17.6% increase to the annual dividend rate from $1.42 per share to $1.67 per share. Edison International plans to increase its dividends to common shareholders to its target payout ratio of approximately 45% to 55% of SCE earnings in steps over time.
Permanent Retirement of San Onofre and San Onofre OII Settlement
Replacement steam generators were installed at San Onofre in 2010 and 2011. On January 31, 2012, a leak suddenly occurred in one of the heat transfer tubes in San Onofre's Unit 3 steam generators. The Unit was safely taken off-line and subsequent inspections revealed excessive tube wear. Unit 2 was off-line for a planned outage when areas of unexpected tube wear were also discovered. On June 6, 2013, SCE decided to permanently retire and decommission Units 2 and 3.
Settlement of San Onofre CPUC Proceedings
In October 2012, the CPUC issued an OII that consolidated all San Onofre issues in related CPUC regulatory proceedings to consider appropriate cost recovery for all San Onofre costs, including among other costs, the cost of the steam generator replacement project, substitute market power costs, capital expenditures, and operation and maintenance costs.
On November 20, 2014, the CPUC approved the Amended and Restated Settlement Agreement (the "San Onofre OII Settlement Agreement") that SCE had entered into with TURN, the ORA, SDG&E, the Coalition of California Utility Employees, and Friends of the Earth (together, the "Settling Parties"). The San Onofre OII Settlement Agreement resolved the CPUC's OII and related proceedings regarding the Steam Generator Replacement Project at San Onofre and the related outage and subsequent shutdown of San Onofre. The San Onofre OII Settlement Agreement does not affect proceedings related to recoveries from third parties described below, but does describe how shareholders and customers will share any
6
potential recoveries. SCE has recorded the effects of the San Onofre OII Settlement Agreement. Such amounts do not reflect any recoveries from third parties by SCE.
A lawsuit challenging the CPUC's authority to permit rate recovery of San Onofre costs and an application for rehearing of the CPUC’s decision approving the San Onofre OII Settlement Agreement were filed in November and December 2014, respectively. On February 9, 2015, SCE filed in the OII proceeding a Late-Filed Notice of
Ex Parte
Communication regarding a meeting in March 2013 between an SCE senior executive and the president of the CPUC, both of whom have since retired from their respective positions. In response, the Alliance for Nuclear Responsibility, one of the intervenors in the OII, filed an application requesting that the CPUC institute an investigation into whether sanctions should be imposed on SCE in connection with the
ex parte
communication. The application requests that the CPUC order SCE to produce all
ex parte
communications between SCE and the CPUC or its staff since January 31, 2012 and all internal SCE unprivileged communications that discuss such
ex parte
communications.
Third-Party Recoveries
San Onofre carries accidental property damage and carried accidental outage insurance issued by NEIL and has placed NEIL on notice of claims under both policies. For further discussion of potential NEIL insurance recoveries and how they would be shared with customers and SCE, see "Notes to Consolidated Financial Statements—Note 11. Commitments and Contingencies—Contingencies—San Onofre Related Matters."
SCE is also pursuing claims against MHI, which designed and supplied the RSGs. In October 2013, SCE sent MHI a formal request for binding arbitration under the auspices of the International Chamber of Commerce in accordance with the purchase contract seeking damages for all losses. In the request for arbitration, SCE alleges contract and tort claims and seeks at least $4 billion in damages on behalf of itself and its customers and in its capacity as Operating Agent for San Onofre. MHI has denied any liability and has asserted counterclaims for $41 million, for which SCE has denied any liability. The other
co-owners (SDG&E and Riverside) have been added as additional claimants in the arbitration, with party status. For further discussion of potential recoveries from MHI and how they would be shared with customers, see "Notes to Consolidated Financial Statements—Note 11. Commitments and Contingencies—Contingencies—San Onofre Related Matters."
Rate Impacts
Due to the implementation of the settlement as of December 31, 2014, including the refund of revenue related to the Steam Generator Replacement Project, the refund of the difference between authorized and recorded operation and maintenance expenses for 2013 and 2014, the refund from the reduction of returns on the balance of its San Onofre investment and the other elements of the settlement will result in a refund to customers of approximately $540 million. Such refunds under the San Onofre OII Settlement Agreement were effectuated through a reduction in SCE's ERRA undercollection. At December 31, 2014, SCE's ERRA undercollection was $1.03 billion. The ERRA undercollection is expected to continue to decrease during 2015 assuming:
|
•
|
approval of SCE's request to classify the majority of costs incurred at San Onofre since June 7, 2013 as decommissioning costs and provide reimbursement from SCE's nuclear decommissioning trust; and
|
|
•
|
approval of SCE's 2015 ERRA forecast application, with implementation of revised rates occurring during the first quarter of 2015.
|
These decreases will be impacted by over/undercollection of purchased power and fuel costs during 2015, including changes in natural gas and power prices.
SCE may finance unrecovered power procurement-related costs with commercial paper or other borrowing, subject to availability in the capital markets. Delays in approval of rate increases to recover undercollection of fuel and purchase power costs would adversely impact SCE's liquidity. For further information on 2015 ERRA forecast application, see "Liquidity—Regulatory Proceedings—ERRA Forecast Filing – 2015."
7
NRC Proceedings
For information on the NRC proceedings, see "Notes to Consolidated Financial Statements—Note 11. Commitments and Contingencies—Contingencies—San Onofre Related Matters."
Decommissioning
The decommissioning of a nuclear plant requires the management of three related activities: radiological decommissioning, non-radiological decommissioning and the management of spent nuclear fuel. The decommissioning process is expected to take many years. In June 2013, SCE began the initial activity phase of radiological decommissioning by filing with the NRC a certification of permanent cessation of power operations at San Onofre. Notifications of permanent removal of fuel from the reactor vessels were provided in June and July 2013 for Units 3 and 2, respectively. On September 23, 2014, SCE submitted its Post-Shutdown Decommissioning Activities Report ("PSDAR"), Irradiated Fuel Management Plan and Decommissioning Cost Estimate for San Onofre, Units 2 and 3 to the NRC. These submittals were subject to a ninety-day period for NRC review and acceptance, which expired on December 27, 2014. SCE is now permitted to start major radiological decommissioning activities pursuant to NRC regulations, provided SCE obtains all necessary environmental permits for decommissioning. During the second quarter of 2014, SCE updated its decommissioning cost estimate based on a site specific assessment. The decommissioning cost estimate in 2014 dollars is $4.4 billion (SCE share – $3.3 billion) and includes costs from June 7, 2013 through to the respective completion dates to decommission San Onofre Units 2 and 3 estimated to be in 2052. The decommissioning cost estimate is subject to a number of estimates including the cost of burial of nuclear waste, cost of removal of property, site remediation costs as well as a number of other assumptions and estimates, including when the federal government may remove spent fuel canisters from the San Onofre site, as to which there can be no assurance. The cost estimate is subject to change and such changes may be material. SCE's share of the present value of decommissioning costs using current discount rates was $3.0 billion at December 31, 2014. For further information, see "Notes to Consolidated Financial Statements—Note 1. Summary of Significant Accounting Policies—Asset Retirement Obligation."
SCE has nuclear decommissioning trust funds for San Onofre Units 2 and 3 of $3.4 billion as of December 31, 2014. If the decommissioning cost estimate and assumptions regarding trust performance do not change, SCE believes that future contributions to the trust funds will not be necessary. The CPUC must issue an order granting prior approval for withdrawal of decommissioning trust funds. SCE has filed a request with the CPUC to authorize release of trust funds for costs up to a specified cost cap of $214 million to cover SCE's share of 2013 decommissioning costs. The request also seeks CPUC approval for a process by which SCE will be able to seek the release of trust funds to cover decommissioning costs incurred in 2014 and future periods until the CPUC approves a permanent San Onofre decommissioning plan and cost recovery mechanism.
Depending on the ultimate interpretation of IRS regulations, which address the taxation of a qualified nuclear decommissioning trust, SCE may be restricted from withdrawing amounts from the qualified decommissioning trusts to pay for independent spent fuel storage installation ("ISFSI") where SCE is seeking, or plans to seek, recovery of the ISFSI costs in litigation against the DOE. For further information, see "Notes to Consolidated Financial Statements—Note 11. Commitments and Contingencies—Contingencies—Spent Nuclear Fuel." SCE intends to participate as part of an industry coalition in working with the IRS and the Department of Treasury to pursue an interpretation of the IRS regulations that is consistent with Congress’ intent when this tax provision was enacted by Congress in 1984. If SCE is unable to obtain timely reimbursement of such costs, it may delay decommissioning activities. Furthermore, expenditures incurred are expected to be funded by SCE until such time as a favorable determination is made or the DOE litigation for such period is resolved. For further information, see "Risk Factors—Risk Factors Relating to SCE—Operating Risks."
Decommissioning costs incurred in 2013 and 2014 have been recorded as operations and maintenance expenses pending the CPUC decision on access to the trusts for reimbursement. Accordingly, such costs have been recovered through GRC revenues. Costs incurred for 2013 have been found reasonable under the San Onofre OII. The CPUC will conduct a reasonableness review for 2014 costs and years going forward. Beginning in 2015, SCE must fund decommissioning costs until the CPUC approves SCE's request to access the trust funds. Currently, SCE expects that the CPUC would approve access to the trust in 2015. SCE's share of the estimated decommissioning costs to be incurred in 2015, subject to change, are approximately $200 million.
8
Resolution of Uncertainty Related to EME in Bankruptcy
In February 2014, Edison International, EME and the Consenting Noteholders entered into a settlement agreement (the "EME Settlement Agreement") pursuant to which EME amended its Plan of Reorganization to incorporate the terms of the EME Settlement Agreement, including extinguishing all existing claims between EME and Edison International. The Amended Plan of Reorganization, including the EME Settlement Agreement, was completed on April 1, 2014.
Under the EME Settlement Agreement, Edison International made the first of three cash payments to the Reorganization Trust of $225 million in April 2014. In August 2014, Edison International entered into an amendment of the Settlement Agreement that finalized the remaining matters related to the EME Settlement including setting the amount of the two remaining installment payments, including interest, at $204 million due on September 30, 2015 and $214 million due on September 30, 2016. As a result of the EME Settlement Agreement, Edison International recorded, as part of discontinued operations, income of $168 million during the year ended December 31, 2014 related to changes in estimates of the net impact of retaining income tax attributes less the above payment obligations and assumed liabilities. See "Notes to Consolidated Financial Statements—Note 15. Discontinued Operations." As part of the settlement, Edison International retained ownership interest of EME and tax attributes of approximately $1.2 billion. Edison International expects to realize the tax attributes over time, depending upon the tax position of Edison International.
9
RESULTS OF OPERATIONS
SCE
SCE's results of operations are derived mainly through two sources:
|
•
|
Utility earning activities – representing revenue authorized by the CPUC and FERC which is intended to provide SCE a reasonable opportunity to recover its costs and earn a return on its net investment in generation, transmission and distribution assets. The annual revenue requirements are comprised of authorized operation and maintenance costs, depreciation, taxes and a return consistent with the capital structure. Also, included in utility earnings activities are revenues or penalties related to incentive mechanisms, other operating revenue, and regulatory charges or disallowances.
|
|
•
|
Utility cost-recovery activities – representing CPUC- and FERC-authorized balancing accounts which allow for recovery of specific project or program costs, subject to reasonableness review or compliance with upfront standards. Utility cost-recovery activities include rates which provide recovery, subject to reasonableness review of, among other things, fuel costs, purchased power costs, public purpose related-program costs (including energy efficiency and demand-side management programs) and certain operation and maintenance expenses.
|
The following table is a summary of SCE's results of operations for the periods indicated.
|
2014
|
2013
|
2012
|
|||||||||||||||||||||||||
|
(in millions)
|
Utility
Earning
Activities
|
Utility
Cost-
Recovery
Activities
|
Total
Consolidated
|
Utility
Earning
Activities
|
Utility
Cost-
Recovery
Activities
|
Total
Consolidated
|
Utility
Earning
Activities
|
Utility
Cost-
Recovery
Activities
|
Total
Consolidated
|
||||||||||||||||||
|
Operating revenue
|
$
|
6,831
|
|
$
|
6,549
|
|
$
|
13,380
|
|
$
|
6,602
|
|
$
|
5,960
|
|
$
|
12,562
|
|
$
|
6,682
|
|
$
|
5,169
|
|
$
|
11,851
|
|
|
Purchased power and fuel
|
—
|
|
5,593
|
|
5,593
|
|
—
|
|
4,891
|
|
4,891
|
|
—
|
|
4,139
|
|
4,139
|
|
|||||||||
|
Operation and maintenance
|
2,106
|
|
951
|
|
3,057
|
|
2,348
|
|
1,068
|
|
3,416
|
|
2,518
|
|
1,026
|
|
3,544
|
|
|||||||||
|
Depreciation, decommissioning and amortization
|
1,720
|
|
—
|
|
1,720
|
|
1,622
|
|
—
|
|
1,622
|
|
1,562
|
|
—
|
|
1,562
|
|
|||||||||
|
Property and other taxes
|
318
|
|
—
|
|
318
|
|
307
|
|
—
|
|
307
|
|
296
|
|
(1
|
)
|
295
|
|
|||||||||
|
Impairment and other charges
|
163
|
|
—
|
|
163
|
|
575
|
|
—
|
|
575
|
|
32
|
|
—
|
|
32
|
|
|||||||||
|
Total operating expenses
|
4,307
|
|
6,544
|
|
10,851
|
|
4,852
|
|
5,959
|
|
10,811
|
|
4,408
|
|
5,164
|
|
9,572
|
|
|||||||||
|
Operating income
|
2,524
|
|
5
|
|
2,529
|
|
1,750
|
|
1
|
|
1,751
|
|
2,274
|
|
5
|
|
2,279
|
|
|||||||||
|
Interest expense
|
(528
|
)
|
(5
|
)
|
(533
|
)
|
(519
|
)
|
(1
|
)
|
(520
|
)
|
(494
|
)
|
(5
|
)
|
(499
|
)
|
|||||||||
|
Other income and expenses
|
43
|
|
—
|
|
43
|
|
48
|
|
—
|
|
48
|
|
94
|
|
—
|
|
94
|
|
|||||||||
|
Income before income taxes
|
2,039
|
|
—
|
|
2,039
|
|
1,279
|
|
—
|
|
1,279
|
|
1,874
|
|
—
|
|
1,874
|
|
|||||||||
|
Income tax expense
|
474
|
|
—
|
|
474
|
|
279
|
|
—
|
|
279
|
|
214
|
|
—
|
|
214
|
|
|||||||||
|
Net income
|
1,565
|
|
—
|
|
1,565
|
|
1,000
|
|
—
|
|
1,000
|
|
1,660
|
|
—
|
|
1,660
|
|
|||||||||
|
Preferred and preference stock dividend requirements
|
112
|
|
—
|
|
112
|
|
100
|
|
—
|
|
100
|
|
91
|
|
—
|
|
91
|
|
|||||||||
|
Net income available for common stock
|
$
|
1,453
|
|
$
|
—
|
|
$
|
1,453
|
|
$
|
900
|
|
$
|
—
|
|
$
|
900
|
|
$
|
1,569
|
|
$
|
—
|
|
$
|
1,569
|
|
|
Core earnings
1
|
$
|
1,525
|
|
$
|
1,265
|
|
$
|
1,338
|
|
||||||||||||||||||
|
Non-core earnings
|
|
|
|
|
|
|
|||||||||||||||||||||
|
Impairment and other charges
|
(72
|
)
|
(365
|
)
|
—
|
|
|||||||||||||||||||||
|
2012 General Rate Case – repair deductions (2009 – 2011)
|
—
|
|
—
|
|
231
|
|
|||||||||||||||||||||
|
Total SCE GAAP earnings
|
|
|
$
|
1,453
|
|
$
|
900
|
|
$
|
1,569
|
|
||||||||||||||||
|
1
|
See use of non-GAAP financial measures in "Management Overview—Highlights of Operating Results."
|
10
Utility Earning Activities
2014 vs 2013
Utility earning activities were primarily affected by the following:
|
•
|
Higher operating revenue of $229 million due to:
|
|
•
|
An increase in CPUC-related revenue of $370 million primarily related to the increase in authorized revenue to support rate base growth, including $30 million of additional revenue from revisions to its 2012 – 2014 GRC revenue requirement related to deferred income taxes.
|
|
•
|
An increase in FERC-related revenue of $130 million primarily related to rate base growth and higher operating costs, including $19 million of additional revenue from a change in estimate under the FERC formula rate mechanism.
|
|
•
|
Energy efficiency incentive awards were $22 million in 2014 compared to $14 million in 2013.
|
|
•
|
Generator settlements of $15 million. See "Notes to Consolidated Financial Statements—Note 10. Regulatory Assets and Liabilities—Regulatory Balancing Accounts."
|
|
•
|
A decrease in San Onofre-related estimated revenue of $188 million, as discussed below.
|
|
•
|
A decrease in Four Corners-related revenue of $105 million due to the sale of SCE's ownership interest in the Four Corners Generating Station in December 2013 (primarily offset in operation and maintenance and depreciation expense as indicated below).
|
|
•
|
Lower operation and maintenance expense of $242 million primarily due to:
|
|
•
|
A decrease in San Onofre-related expense of $179 million as discussed below and a decrease in Four Corners-related expense of $60 million due to the sale in December 2013.
|
|
•
|
A decrease in severance costs of $34 million (excluding San Onofre). In 2014 and 2013, SCE commenced multiple efforts to reduce its workforce in order to reflect SCE's strategic direction to optimize its cost structure, moderate customer rate increases and align its cost structure with its peers. Severance costs related to workforce reductions (excluding severance related to the permanent retirement of San Onofre Unit 2 and 3 recovered in the San Onofre OII Settlement Agreement) were $4 million in 2014 and $38 million in 2013 (See "Notes to Consolidated Financial Statements—Note 8. Compensation and Benefit Plans—Workforce Reductions"). SCE is continuing its efforts to improve operational efficiency. These efforts may lead to additional severance or other charges which cannot be estimated at this time.
|
|
•
|
A decrease of $30 million primarily related to lower customer service and outside service costs, as well as $20 million of planned outage costs at Mountainview in 2013.
|
|
•
|
An increase of $85 million of higher operating costs primarily related to transmission and distribution, information technology, legal, safety and insurance costs.
|
|
•
|
Higher depreciation, decommissioning and amortization expense of $98 million due to a $155 million increase in depreciation mainly related to transmission and distribution investments, partially offset by a decrease in San Onofre-related expense of $14 million discussed below and lower Four Corners-related expense of $45 million due to the sale in December 2013.
|
|
•
|
Impairment charge of $163 million ($72 million after-tax) in 2014 related to the San Onofre OII Settlement Agreement, as discussed below.
|
|
•
|
Higher interest expense of $9 million primarily due to lower capitalized interest (AFUDC debt) and higher long-term debt balances to support rate base growth.
|
|
•
|
Lower other income and expenses of $5 million primarily due to lower AFUDC equity income related to lower AFUDC rates and lower construction work in progress balances in 2014, lower interest income and higher other expenses, offset by $7 million in sales tax refund related to San Onofre discussed below and lower penalties. In 2014 and 2013, SCE incurred penalties of $15 million and $20 million, respectively, resulting from the San Bernardino and San Gabriel settlements in 2014 and Malibu Fire Order Instituting Investigation settlement in 2013. See "Notes to Consolidated Financial Statements—Note 14. Interest and Other Income and Other Expenses."
|
11
|
•
|
Higher income taxes of $195 million primarily due to higher pre-tax income. See "—Income Taxes" below for more information.
|
|
•
|
Higher preferred and preference stock dividends of $12 million related to a new issuance in 2014.
|
On June 6, 2013, SCE decided to permanently retire San Onofre Units 2 and 3. During 2014, SCE entered into the San Onofre OII Settlement Agreement to resolve CPUC regulatory issues associated with San Onofre. See "Management Overview—Permanent Retirement of San Onofre and San Onofre OII Settlement" above for more information. The following table summarizes the results of operations attributable to the San Onofre plant for the years ended December 31, 2014 and 2013, respectively, and is included in Utility Earnings above:
|
Years ended December 31,
|
|||||||||
|
(in millions)
|
2014
|
2013
|
|||||||
|
Revenue
|
$
|
166
|
|
1
|
$
|
354
|
|
||
|
Operating expenses
|
|||||||||
|
Operation and maintenance
|
93
|
|
272
|
|
5
|
|
|||
|
Depreciation and amortization
|
44
|
|
2
|
58
|
|
||||
|
Property and other taxes
|
16
|
|
3
|
23
|
|
||||
|
Impairment and other charges
|
163
|
|
4
|
575
|
|
||||
|
AFUDC
|
—
|
|
(6
|
)
|
|||||
|
Total operating expenses
|
316
|
|
922
|
|
|||||
|
Loss before taxes
|
$
|
(150
|
)
|
$
|
(568
|
)
|
|||
|
1
|
Includes a 2014 revenue adjustment of $11 million related to a CPUC decision to refund Unit 1 decommissioning costs to the Nuclear Decommissioning Trusts.
|
|
2
|
Represents amortization of the San Onofre regulatory asset beginning October 1, 2014.
|
|
3
|
Includes property and sales tax refunds of $5 million and $7 million related to replacement steam generators for the year ended December 31, 2014. The sales tax refund is included in "Interest and other income" on the consolidated income statements.
|
|
4
|
During the fourth quarter of 2014, SCE revised its estimated impact of the San Onofre OII Settlement by $68 million ($24 million after-tax) consistent with advice filing for reimbursement of recorded costs.
|
|
5
|
Includes severance costs of $63 million for the year ended December 31, 2013.
|
2013 vs 2012
Utility earning activities were primarily affected by the following:
|
•
|
Lower operating revenue of $80 million was primarily due to the following:
|
|
•
|
A decrease in San Onofre-related estimated revenue of $303 million primarily due to lower operating costs, no longer recognizing the return on San Onofre rate base and ceasing depreciation, beginning in June 2013.
|
|
•
|
An increase in CPUC-related revenue of $60 million primarily related to the increase in authorized revenue to support rate base growth and operating expenses which was partially offset by the lower CPUC-adopted 2013 return on common equity and Edison SmartConnect
®
revenue, resulting from the full deployment of the program in 2012.
|
|
•
|
An increase in FERC-related revenue of $170 million primarily related to rate base growth and higher operating costs.
|
|
•
|
Energy efficiency earnings were $14 million in 2013 compared to $15 million in 2012.
|
12
|
•
|
Lower operation and maintenance expense of $170 million was primarily due to the following:
|
|
•
|
A decrease in San Onofre-related expense of $170 million primarily due to lower operating costs of $109 million resulting from the early retirement of Units 2 and 3 in June 2013 and $35 million in 2012 related to the scheduled outage at Unit 2. In addition, SCE had lower incremental inspection and repair costs of $53 million (net of SCE's share of payments received from MHI in 2012), which were not offset in revenue above. These factors were partially offset by additional severance costs of $27 million ($63 million and $36 million in 2013 and 2012, respectively).
|
|
•
|
A decrease of $95 million in expense in 2013 due to the full deployment of the Edison SmartConnect
®
program in 2012.
|
|
•
|
A decrease in severance costs of $40 million due to the reductions in workforce (excluding San Onofre) that commenced in 2012.
|
|
•
|
An increase of $85 million of higher operating costs primarily related to information technology, safety, legal and insurance costs.
|
|
•
|
$45 million of planned outage costs at Mountainview, repair costs at Four Corners, and higher operating costs on CPUC- and FERC-related projects.
|
|
•
|
Higher depreciation, decommissioning and amortization expense of $60 million was primarily related to increased transmission and distribution investments, including capitalized software costs, offset by the impact of $67 million from ceasing depreciation on the San Onofre assets, beginning in June 2013.
|
|
•
|
$575 million impairment charge ($365 million after-tax) in 2013 related to the permanent retirement of San Onofre Units 2 and 3.
|
|
•
|
Lower interest income and other of $46 million primarily due to lower AFUDC equity related to lower rates and construction work in progress balances in 2013. In addition, SCE had higher other expenses due to a $20 million penalty that resulted from the Malibu Fire Order Instituting Investigation settlement that was imposed by the CPUC in 2013. See "Notes to Consolidated Financial Statements—Note 14. Interest and Other Income and Other Expenses."
|
|
•
|
Higher interest expense of $25 million primarily due to higher balances on long-term debt to support rate base growth and lower AFUDC debt due to lower rates and construction work in progress balances in 2013.
|
|
•
|
Higher income taxes of $65 million primarily due to lower income tax benefits, including lower repair deductions (as determined for income tax purposes). See "—Income Taxes" below for more information.
|
Utility Cost-Recovery Activities
2014 vs 2013
Utility cost-recovery activities were primarily affected by the following:
|
•
|
Higher purchased power and fuel expense of $702 million was primarily driven by an increased load related to warmer weather and higher power and gas prices experienced in 2014 relative to 2013, partially offset by lower fuel expense in 2014 due to the sale of Four Corners in December 2013 and generator settlements refunded to customers (see "Notes to Consolidated Financial Statements—Note 10. Regulatory Assets and Liabilities" for more information). In addition, in 2014, the CAISO issued invoices implementing a FERC order which revised FERC tariffs for costs associated with scheduling coordinator activities. The impact of implementing the order and revised invoices resulted in a transmission refund of $106 million reflected in operation and maintenance expense and a generation surcharge of $83 million reflected in purchased power expense. These transactions did not impact earnings as the net refund was provided to customers through a FERC balancing account mechanism. Fuel costs were $256 million in 2014 and $324 million in 2013.
|
|
•
|
Lower operation and maintenance expense of $117 million primarily due to the CAISO refund of $106 million mentioned above, a decrease in pension and postretirement benefit expenses and lower costs for the GHG cap-and-trade program related to utility owned generation, partially offset by higher spending on various public purpose programs and higher transmission access charges. See "Notes to Consolidated Financial Statements—Note 8. Compensation and Benefit Plans" for more information.
|
13
2013 vs 2012
Utility cost-recovery activities were primarily affected by the following:
|
•
|
Higher purchased power and fuel expense of $752 million was primarily driven by higher power and gas prices in 2013, partially offset by lower realized losses on economic hedging activities ($56 million in 2013 compared to $227 million in 2012) and by a $43 million credit received from the ISO for SCE’s share of a settlement between the FERC and an ISO participant. Fuel costs were $324 million in 2013 and $308 million in 2012.
|
|
•
|
Higher operation and maintenance expense of $42 million primarily due to costs for the GHG cap-and-trade program related to utility owned generation, higher costs related to transmission and distribution expenses, higher pension expenses, partially offset by lower spending on various public purpose programs.
|
Supplemental Operating Revenue Information
SCE's retail billed and unbilled revenue (excluding wholesale sales and balancing account over/undercollections) was $12.2 billion for 2014, $11.6 billion for 2013 and $11.2 billion for 2012.
The 2014 revenue reflects:
|
•
|
An increase of $428 million primarily due to the implementation of the 2014 ERRA rate increase in June 2014 and the increase in GRC authorized revenue, partially offset by the greenhouse gas auction revenue refunded to customers in April and October 2014, and
|
|
•
|
A sales volume increase of $226 million due to higher load requirements related to warmer weather experienced in 2014 compared to 2013.
|
The 2013 revenue reflects:
|
•
|
An increase of $435 million and a sales volume decrease of $29 million. The increase is primarily due to the implementation of the 2012 GRC decision.
|
The 2012 revenue reflects:
|
•
|
A sales volume increase of $1.4 billion, primarily due to SCE providing power that was previously provided by California Department of Water Resources (CDWR) contracts partially offset by:
|
|
•
|
A decrease of $344 million, resulting from rate adjustments in June 2011 and August 2012, primarily reflecting lower natural gas prices and refunds to customers of overcollected fuel and power procurement-related costs recorded through the ERRA balancing account.
|
As a result of the CPUC-authorized decoupling mechanism, SCE earnings are not affected by changes in retail electricity sales (see "Business—SCE—Overview of Ratemaking Process").
Income Taxes
SCE’s income tax provision increased by $195 million in 2014 compared to 2013. The effective tax rates were 23.2% and
21.8%
for 2014 and 2013, respectively. The effective tax rate increase in 2014 was primarily due to higher state income taxes.
SCE’s income tax provision increased by $65 million in 2013 compared to 2012. The effective tax rates were 21.8% and 11.4% for 2013 and 2012, respectively. The effective tax rate increase in 2013 was primarily due to lower tax benefits associated with repair deductions as discussed below.
The CPUC requires flow-through ratemaking treatment for the current tax benefit arising from certain property-related and other temporary differences, which reverse over time. The accounting treatment for these temporary differences results in recording regulatory assets and liabilities for amounts that would otherwise be recorded to deferred income tax expense.
See "Notes to Consolidated Financial Statements—Note 7. Income Taxes" for a reconciliation of the federal statutory rate of 35% to the effective income tax rates and "Management Overview—Permanent Retirement of San Onofre and San Onofre OII Settlement" above for more information.
14
Earnings Benefit from Repair Deductions
Edison International made a voluntary election in 2009 to change its tax-accounting method for certain repair costs incurred on SCE's transmission, distribution and generation assets. Regulatory treatment for the incremental deductions taken after the 2009 election to change SCE's tax accounting method for certain repair costs was included as part of SCE's 2012 GRC. The 2012 GRC decision retained flow-through treatment of repair deductions for regulatory purposes, which resulted in SCE recognizing an earnings benefit of $231 million from these incremental deductions taken in 2009, 2010 and 2011. Incremental repair deductions represent amounts recognized for regulatory accounting purposes in excess of amounts included in the authorized revenue requirements through the general rate case proceedings. The earnings benefit results from recognition of a regulatory asset for recovery of deferred income taxes in future periods. Incremental repair deductions for the years 2012 – 2014 resulted in additional income tax benefits of $133 million in 2014,
$89 million
in 2013 and
$115 million
in 2012.
For a discussion of the status of Edison International's income tax audits, see "Notes to Consolidated Financial Statements—Note 7. Income Taxes."
Edison International Parent and Other
Results of operations for Edison International Parent and Other includes amounts from other nonutility subsidiaries that are not significant as a reportable segment, as well as intercompany eliminations.
Loss from Continuing Operations
The following table summarizes the results of Edison International Parent and Other:
|
Years ended December 31,
|
|||||||||||
|
(in millions)
|
2014
|
2013
|
2012
|
||||||||
|
Edison Energy and subsidiaries
|
$
|
(5
|
)
|
$
|
(3
|
)
|
$
|
—
|
|
||
|
Edison Mission Group and subsidiaries
|
36
|
|
24
|
|
19
|
|
|||||
|
Corporate expenses and Other
|
(57
|
)
|
(42
|
)
|
(85
|
)
|
|||||
|
Total Edison International Parent and Other
|
$
|
(26
|
)
|
$
|
(21
|
)
|
$
|
(66
|
)
|
||
The loss from continuing operations of Edison International Parent and Other increased $5 million in 2014 due to:
|
•
|
An increase in the loss of Edison International Parent and Other primarily due to higher corporate expenses.
|
|
•
|
An increase in income from EMG and subsidiaries of $12 million primarily due to higher income from affordable housing projects, including asset sales and income tax benefits. EMG’s subsidiary, Edison Capital, continues to wind down its remaining affordable housing investments. Earnings from Edison Capital were $34 million in 2014 and $24 million in 2013.
|
|
•
|
A slight increase in losses of Edison Energy. Edison Energy and subsidiaries' 2014 operating activities primarily relate to construction of 26 megawatts of solar rooftop projects, including projects that will sell their output to third parties under long-term power sales agreements.
|
The loss from continuing operations of Edison International Parent and Other decreased $45 million in 2013 due to:
|
•
|
Higher losses in 2012 due to a $37 million charge resulting from Edison International's update to its estimated long-term California apportionment rate applicable to deferred income taxes as a result of changes related to EME.
|
|
•
|
The results for EMG include earnings from Edison Capital of $24 million in 2013 and $22 million in 2012. Edison Capital's 2013 results included income from the wind down of its asset portfolio while Edison Capital's 2012 results included higher income taxes. In addition, during 2012, Edison Capital sold its lease interest in Unit No. 2 of the Beaver Valley Nuclear Plant resulting in a $31 million benefit in 2012 and an additional income tax benefit of $7 million in 2013 from a revised estimate of state income taxes related to the sale. The results for EMG in 2012 also include a write-down of an investment.
|
15
Income (Loss) from Discontinued Operations (Net of Tax)
Income (loss) from discontinued operations, net of tax, was $185 million, $36 million and $(1.69) billion for the years ended
December 31, 2014
,
2013
and
2012
, respectively. The 2014 income reflects earnings of $168 million due to the completion of the Amended Plan of Reorganization, including transactions recorded in 2014 associated with the sale of substantially all of EME's assets to NRG Energy, Inc. and other transactions called for in the EME Settlement Agreement. The 2014 income also includes income tax benefits of $39 million from resolution of uncertain tax positions from settlement of 2003 – 2006 tax years with the IRS and other impacts related to EME. In addition, discontinued operations reflect an income tax loss of $22 million in 2014 compared to a benefit of $36 million in 2013 from revised estimates of the tax impact of a tax deconsolidation of EME from Edison International as originally contemplated prior to the EME Settlement.
The 2012 loss reflects an earnings charge of $1.3 billion due to the full impairment of the investment in EME during the fourth quarter of 2012 as a result of the deconsolidation of EME, recognition of losses previously deferred in accumulated other comprehensive income, a provision for losses from the EME bankruptcy and estimated tax impacts related to the tax deconsolidation and separation of EME from Edison International. The 2012 loss also reflects a $53 million earnings charge associated with the divestiture by Homer City of substantially all of its remaining assets and certain specified liabilities. For additional information, see "Notes to Consolidated Financial Statements—Note 15. Discontinued Operations."
LIQUIDITY AND CAPITAL RESOURCES
SCE
SCE's ability to operate its business, fund capital expenditures, and implement its business strategy is dependent upon its cash flow and access to the capital markets. SCE's overall cash flows fluctuate based on, among other things, its ability to recover its costs in a timely manner from its customers through regulated rates, changes in commodity prices and volumes, collateral requirements, interest obligations, dividend payments to Edison International, and the outcome of tax and regulatory matters.
SCE expects to fund its 2015 obligations, capital expenditures and dividends through operating cash flows, tax benefits and capital market financings of debt and preferred equity, as needed. SCE also has availability under its credit facilities to fund requirements.
The Tax Increase Prevention Act of 2014 extended 50% bonus depreciation for qualifying property retroactive to January 1, 2014 and through 2015 for certain long production period property. This extension is expected to benefit cash flow in 2015 as SCE utilizes net operating losses to reduce tax liabilities. The impact on cash flow represents an acceleration of tax benefits that would have otherwise been deductible over the life of the qualifying assets.
Available Liquidity
At December 31, 2014, SCE had
$2.27 billion
available under its $2.75 billion credit facility, for further details see "Notes to Consolidated Financial Statements—Note 5. Debt and Credit Agreements." SCE may finance unrecovered power procurement-related costs as well as other balancing account undercollections and working capital requirements to support operations and capital expenditures with commercial paper or other borrowings, subject to availability in the capital markets.
In January 2015, SCE issued $550 million of 1.845% amortizing first and refunding mortgage bonds due in 2022, $325 million of 2.40% first and refunding mortgage bonds due in 2022, $425 million of 3.6% first and refunding mortgage bonds due in 2045. The amortizing first and refunding mortgage bonds have been designated as a financing of the San Onofre regulatory asset. The proceeds were used to repay outstanding debt and for general corporate purposes.
Debt Covenant
The debt covenant in SCE's credit facility limits its debt to total capitalization ratio to less than or equal to 0.65 to 1. At December 31, 2014, SCE's debt to total capitalization ratio was 0.44 to 1.
16
Capital Investment Plan
SCE forecasts capital expenditures for 2015 – 2017 in the range of
$11.8 billion
to
$13.4 billion
. The high end of the range reflects the requested level of spending in the GRC and other CPUC proceedings. The low end of the range reflects a 12% reduction from requested levels using management judgment based on historical experience. The completion of projects, the timing of expenditures, and the associated cost recovery may be affected by permitting requirements and delays, construction schedules, availability of labor, equipment and materials, financing, legal and regulatory approvals and developments, community requests or protests, weather and other unforeseen conditions.
SCE's 2014 actual capital expenditures (including accruals) and the 2015 – 2017 forecast for major capital expenditures are set forth in the table below:
|
(in millions)
|
2014
Actual
|
2015
|
2016
|
2017
|
2015 – 2017 Total
|
|||||||||||
|
Transmission
|
$
|
888
|
|
$
|
785
|
|
$
|
1,323
|
|
$
|
1,238
|
|
$
|
3,346
|
|
|
|
Distribution
|
2,871
|
|
3,095
|
|
3,217
|
|
3,085
|
|
9,397
|
|
||||||
|
Generation
|
208
|
|
215
|
|
226
|
|
202
|
|
643
|
|
||||||
|
Total estimated capital expenditures
1
|
$
|
3,967
|
|
$
|
4,095
|
|
$
|
4,766
|
|
$
|
4,525
|
|
$
|
13,386
|
|
|
|
Total estimated capital expenditures for 2015 – 2017 (using the range discussed above)
|
$
|
3,604
|
|
$
|
4,194
|
|
$
|
3,981
|
|
$
|
11,779
|
|
||||
|
1
|
Included in SCE's capital expenditures plan are projected environmental capital expenditures of approximately 15% for each year presented. The projected environmental capital expenditures are to comply with laws, regulations, and other nondiscretionary requirements.
|
Capital expenditures for projects under CPUC jurisdiction are recovered through the authorized revenue requirement in SCE's general rate cases or through other CPUC-authorized mechanisms. Recovery of planned capital expenditures for projects under CPUC jurisdiction for 2015 through 2017 are subject to the outcome of the 2015 GRC or other CPUC approvals. Recovery for 2015 – 2017 planned expenditures for projects under FERC jurisdiction will be pursued through FERC-authorized mechanisms.
Transmission Projects
A summary of SCE's large transmission and substation projects during the next three years is presented below:
|
Project Name
|
Project Lifecycle Phase
|
Scheduled in Service Date
|
Direct Expenditures
1
(in millions)
|
2015 – 2017 Forecast (in millions)
|
||||
|
Tehachapi 4-11
|
In construction
|
2016 – 2017
|
$
|
2,430
|
|
$
|
500
|
|
|
West of Devers
|
In licensing
|
2019 – 2020
|
1,034
|
|
542
|
|
||
|
Coolwater-Lugo
|
In licensing
|
2018
|
740
|
|
602
|
|
||
|
1
|
Direct expenditures include direct labor, land and contract costs incurred for the respective projects and exclude overhead costs that are included in the capital expenditures forecasted for 2015 – 2017.
|
Tehachapi Project
The Tehachapi Project consists of new and upgraded electric transmission lines and substations between eastern Kern County and San Bernardino County and was undertaken to bring renewable resources in Kern County to energy consumers in the Los Angeles basin and the California energy grid. The project consists of eleven segments. Segments 1-3 were placed in service beginning in 2009 through 2013. Portions of segments 4-11 were placed in service in 2013 with the remaining portions expected to be in service in 2015 and 2017.
The maximum cost estimate used by the CPUC to determine public need for segments 4-11 was established in 2009 at $1.5 billion in 2009 dollars, which was lower than SCE’s requested cost estimate of $1.7 billion (cost estimates made in Tehachapi regulatory filings are in constant dollars in the year of the filing and include direct expenditures and corporate overhead costs). Subsequently, the estimated costs of the project increased due to a number of factors, including engineering scope/design changes, licensing delays, added environmental mitigation and compliance costs, and added construction costs. In addition, the CPUC ordered SCE to underground a 3.5-mile portion of the line that traverses Chino Hills; setting a
17
maximum cost estimate in 2013 of $224 million for the underground portion. The cost estimate that SCE had proposed in 2013 for the underground portion of the Tehachapi Project was $372 million. Separately, during 2013, the CPUC ordered SCE to implement FAA-related scope changes, such as aviation marking and lighting. Including the underground portion of the line, the CPUC has acknowledged a total maximum cost estimate to determine public need in 2013 of as much as $2.2 billion to $2.3 billion. Because SCE has not completed final engineering on all aspects of segments 4-11, SCE has not yet filed a petition for modification with the CPUC for the current 2014 cost estimate of $2.7 billion. Opposition in other communities affected by the project could potentially cause further delays and additional costs. Cost recovery for the project is subject to FERC review and approval.
West of Devers Project
West of Devers Project will upgrade SCE's existing West of Devers transmission line system by replacing a portion of the existing 220 kV transmission lines and associated structures with higher-capacity transmission lines and structures. The West of Devers project is intended to facilitate the delivery of electricity produced by new electric generation resources that are being developed or planned in eastern Riverside County.
Coolwater-Lugo Transmission Project
The Coolwater-Lugo Project will provide additional 220 kV transmission capacity needed in the Kramer Junction and Lucerne Valley areas of San Bernardino County to alleviate an existing bottleneck in order to facilitate interconnection of current and future renewable generation projects. The Coolwater-Lugo scope primarily consists of installing new transmission lines and new substation facilities. The operator of the Coolwater Generating Station has informed the CPUC of its intent to permanently retire the station. Under the CAISO's tariff, the operator will retain deliverability priority to the existing line for a period of at least three years, absent the commitment by the operator not to repower or restart the station. SCE believes it would be premature to delay licensing. However should the operator commit to not repower or restart the station, the capacity on the lines would become available to other generators. In addition, the upcoming CAISO deliverability reassessment study could affect the need for this project. SCE has obtained FERC approval for abandoned plant cost recovery in the event the project is not completed.
Competitive Transmission Projects
SCE no longer has a federally-based right to construct certain of the new transmission facilities in its service territory and must competitively bid on such projects. In January 2015, the CAISO reported that SCE was one of six bidders that it will consider to build and own the Delaney Colorado River transmission project. The CAISO estimated that the project will cost approximately $300 million, which is not included in the table above. SCE expects a CAISO decision on the project award in the second half of 2015. For more information on transmission infrastructure competition, see "Business—SCE—Competition."
Distribution Projects
Distribution expenditures include projects and programs to meet reliability, infrastructure replacement (including replacement of poles to meet current compliance and safety standards), customer load growth requirements, information and other technology and related facility requirements (sometimes referred to as "general plant").
Generation Projects
Generation expenditures include maintenance-related capital expenditures associated with Palo Verde and SCE's hydroelectric and gas-fired generation infrastructure and renewal of FERC operating licenses. Infrastructure expenditures include dam improvements, flowline and substation refurbishments, and powerline replacements. Equipment replacement expenditures include transformers, automation, switchgear, hydro turbine repowers, generator rewinds, and small generator replacements.
Regulatory Proceedings
Energy Efficiency Incentive Mechanism
In December 2014, the CPUC awarded SCE an incentive of $22 million for the 2012 and 2013 energy efficiency program years. The CPUC has not completed its assessment of energy efficiency fixed price contract cost accounting practices which could result in additional earnings of $6.2 million for the 2011 and 2012 program years. There is no assurance that the CPUC will make an award for any given year.
18
In November 2014, TURN and the ORA filed separate petitions with the CPUC asking for the rescission of the CPUC's December 2010 energy efficiency decision that awarded the California investor-owned utilities incentive awards, including a final, trued up incentive payment of $24.1 million to SCE for savings achieved by its 2006 – 2008 energy efficiency programs. Prior CPUC decisions had awarded SCE $50.4 million for savings achieved by its 2006 – 2008 energy efficiency programs. The TURN and ORA petitions allege that
ex parte
communications between PG&E and the former president of the CPUC, which were disclosed in an October 2014 report filed by PG&E, taint the entire 2010 energy efficiency decision and that the decision should be vacated. SCE disputes the assertion that SCE should be at risk to repay previously awarded incentives. It is currently uncertain how these petitions will be considered by the CPUC.
FERC Formula Rates
In November 2014, SCE filed its 2015 annual update with the FERC with the rates effective from January 1, 2015 to December 31, 2015. The update provided support for an increase in SCE's transmission revenue requirement of $89 million or 10.8% over amounts currently authorized in rates. The primary reason for the increase is the inclusion of costs associated with several large transmission projects that were completed in 2013, including Devers-Colorado River, Eldorado-Ivanpah, and the Red Bluff substation.
ERRA Forecast Filing
–
2015
Rates related to fuel and purchased power are set annually based on a forecast of the costs SCE expects to incur in the following year. Actual fuel and power costs that are either greater or less than the forecast are tracked in the ERRA balancing account and collected from or refunded to customers in subsequent periods depending upon whether the balancing account is under collected or over collected. In December 2014, the CPUC issued a proposed decision on SCE's 2015 ERRA forecast application adopting an annual revenue requirement of $5.59 billion, an increase of approximately $437 million over the 2014 revenue requirement. SCE expects to implement this requirement in rates in the first half of 2015.
Energy Storage Requirements
In October 2013, the CPUC issued a decision adopting policies and targets for energy storage procurement. Under the Energy Storage Procurement Framework and Design Program, SCE is required to procure a total of 580 MW (of the 1,325 total MW for the three California investor-owned utilities) of energy storage by 2020 and to install and deliver the storage to the electric grid by the end of 2024. SCE may request deferment of up to 80% of its procurement targets if it can show unreasonableness of cost or lack of an operationally viable number of bids in the solicitations. SCE is required to launch competitive solicitations in 2014, 2016, 2018, and 2020. SCE is also required to file an application for procuring the specified energy storage resources before each procurement cycle and solicitation. SCE's first Energy Storage Procurement Application was filed on March 1, 2014 and its first energy storage solicitation was launched on December 1, 2014. In October 2014, the CPUC issued a decision allowing the overall energy storage procurement target to be reduced by energy storage that is procured in other solicitations or developed by the utilities. The decision reduced SCE's original target for the 2014 energy storage solicitation from a 90 MW minimum to 16.3 MW, by crediting SCE for 50 MW of transmission-interconnected, 13.68 MW of distribution-interconnected, and 10 MW of customer-side energy storage capacity.
SCE Dividends
During 2014, SCE made $378 million in dividend payments to its parent, Edison International. Future dividend amounts and timing of distributions are dependent upon several factors including the level of capital expenditures, operating cash flows and earnings. See "Notes to Consolidated Financial Statements—Note 1. Summary of Significant Accounting Policies—SCE Dividend Restrictions" for discussion of dividend restrictions.
Margin and Collateral Deposits
Certain derivative instruments, power procurement contracts and other contractual arrangements contain collateral requirements. Future collateral requirements may differ from the requirements at
December 31, 2014
, due to the addition of incremental power and energy procurement contracts with collateral requirements, if any, and the impact of changes in wholesale power and natural gas prices on SCE's contractual obligations.
Some of the power procurement contracts contain provisions that require SCE to maintain an investment grade credit rating from the major credit rating agencies. If SCE's credit rating were to fall below investment grade, SCE may be required to pay the liability or post additional collateral.
19
The table below provides the amount of collateral posted by SCE to its counterparties as well as the potential collateral that would be required as of
December 31, 2014
.
|
(in millions)
|
||||
|
Collateral posted as of December 31, 2014
1
|
$
|
208
|
|
|
|
Incremental collateral requirements for power procurement contracts resulting from a potential downgrade of SCE's credit rating to below investment grade
|
112
|
|
||
|
Posted and potential collateral requirements
2
|
$
|
320
|
|
|
|
1
|
Net collateral provided to counterparties and other brokers consisted of
$61 million
of cash which was offset against net derivative liabilities on the consolidated balance sheets,
$36 million
of cash reflected in "Other current assets" on the consolidated balance sheets and
$111 million
in letters of credit and surety bonds.
|
|
2
|
SCE's total posted and potential collateral requirements may increase by $41 million based on SCE's forward positions as of
December 31, 2014
due to adverse market price movements over the remaining lives of the existing power procurement contracts using a 95% confidence level.
|
Regulatory Balancing Accounts
SCE's cash flows are affected by regulatory balancing accounts over- or under-collections. Over- and under-collections represent differences between cash collected in current rates for specified forecasted costs and the costs actually incurred. With some exceptions, SCE seeks to adjust rates on an annual basis or at other designated times to recover or refund the balances recorded in its balancing account. Under- or over-collections in these balancing accounts impact cash flows and can change rapidly. Over- and under-collections accrue interest based on a three-month commercial paper rate published by the Federal Reserve.
As of
December 31, 2014
, SCE had regulatory balancing account net over-collections of
$331 million
, primarily consisting of $1.36 billion of overcollections related to public purpose-related and energy efficiency program costs, GHG auction revenue and generator settlements. Over-collections for public purpose-related programs are expected to decrease as costs are incurred to fund programs established by the CPUC. Generator settlements over-collections are expected to be refunded through a rate adjustment in 2015. The overcollections were partially offset by under-collections of $1.03 billion related to fuel and power procurement-related costs. See "Management Overview—Permanent Retirement of San Onofre and San Onofre OII Settlement" for a discussion of the ERRA undercollection. See "Notes to Consolidated Financial Statements—Note 10. Regulatory Assets and Liabilities" for further information.
Edison International Parent and Other
Edison International Parent and Other's liquidity and its ability to pay operating expenses and dividends to common shareholders are dependent on dividends from SCE and access to bank and capital markets. At December 31, 2014, Edison International had $631 million available under its $1.25 billion credit facility. For further details, see "Notes to Consolidated Financial Statements—Note 5. Debt and Credit Agreements." Edison International may finance working capital requirements to support operations and capital expenditures with commercial paper or other borrowings, subject to availability in the capital markets. The debt covenant in Edison International's credit facility requires a consolidated debt to total capitalization ratio of less than or equal to
0.65
to
1
as defined in the credit agreement. The Edison International's consolidated debt to total capitalization ratio was
0.48
to
1
at December 31, 2014.
EME Settlement Agreement
In August 2014, Edison International entered into an amendment of the EME Settlement Agreement that finalized the remaining matters related to the EME Settlement. Edison International is obligated to make payments of $204 million on September 30, 2015 and $214 million on September 30, 2016. Edison International intends to make these payments from realization of state tax benefits or issuance of commercial paper or other borrowings. Edison International has $1.1 billion of net operating loss and tax credit carryforwards at December 31, 2014 retained by EME which are available to offset future consolidated taxable income or tax liabilities. As a result of the extension of 50% bonus depreciation for qualifying property under the Tax Increase Prevention Act of 2014, realization of these tax benefits has been deferred (currently forecasted through 2018). The timing of realization of these tax benefits may be further delayed in the event of future extensions of bonus depreciation and the value of the net operating loss carryforwards could be permanently reduced in the event that tax reform decreased the current corporate tax rate.
20
Edison Energy Subsidiary Financings
During the third quarter of 2014, indirect subsidiaries of Edison Energy entered into three non-recourse debt and tax equity financings designed to fund a portion of their capital requirements for approximately 35 megawatts of solar rooftop projects. The projects are expected to sell their output to third parties under long-term power purchase agreements with terms ranging from 15 to 20 years. Completion of the construction phase of these projects is expected by mid-2015, see "Notes to Consolidated Financial Statements—Note 5. Debt and Credit Agreements."
Historical Cash Flows
SCE
|
(in millions)
|
2014
|
2013
|
2012
|
||||||||
|
Net cash provided by operating activities
|
$
|
3,660
|
|
$
|
3,048
|
|
$
|
4,086
|
|
||
|
Net cash provided by financing activities
|
181
|
|
508
|
|
256
|
|
|||||
|
Net cash used by investing activities
|
(3,857
|
)
|
(3,547
|
)
|
(4,354
|
)
|
|||||
|
Net increase (decrease) in cash and cash equivalents
|
$
|
(16
|
)
|
$
|
9
|
|
$
|
(12
|
)
|
||
Net Cash Provided by Operating Activities
The following table summarizes major categories of net cash provided by operating activities as provided in more detail in SCE's consolidated statements of cash flows for 2014, 2013 and 2012.
|
Years ended December 31,
|
Change in cash flows
|
|||||||||||||||
|
(in millions)
|
2014
|
2013
|
2012
|
2014/2013
|
2013/2012
|
|||||||||||
|
Net income
|
$
|
1,565
|
|
$
|
1,000
|
|
$
|
1,660
|
|
|
||||||
|
Non cash items
1
|
2,381
|
|
2,631
|
|
1,911
|
|
||||||||||
|
Subtotal
|
$
|
3,946
|
|
$
|
3,631
|
|
$
|
3,571
|
|
$
|
315
|
|
$
|
60
|
|
|
|
Changes in cash flow resulting from working capital
2
|
79
|
|
(182
|
)
|
346
|
|
261
|
|
(528
|
)
|
||||||
|
Derivative assets and liabilities, net
|
(40
|
)
|
(30
|
)
|
(86
|
)
|
(10
|
)
|
56
|
|
||||||
|
Regulatory assets and liabilities, net
|
(358
|
)
|
(322
|
)
|
34
|
|
(36
|
)
|
(356
|
)
|
||||||
|
Other noncurrent assets and liabilities, net
|
33
|
|
(49
|
)
|
221
|
|
82
|
|
(270
|
)
|
||||||
|
Net cash provided by operating activities
|
$
|
3,660
|
|
$
|
3,048
|
|
$
|
4,086
|
|
$
|
612
|
|
$
|
(1,038
|
)
|
|
|
1
|
Non cash items include depreciation, decommissioning and amortization, allowance for equity during construction, impairment and other charges, deferred income taxes and investment tax credits and other.
|
|
2
|
Changes in working capital items include receivables, inventory, accounts payable, prepaid and accrued taxes, and other current assets and liabilities.
|
Net income and non cash items increased in 2014 by
$315 million
from 2013 and increased in 2013 by
$60 million
from 2012. The increase in both periods was primarily due to rate base growth. The factors that impacted these items are discussed under "Results of Operations—SCE—Utility Earning Activities." In 2012, SCE recognized $231 million of additional tax benefits related to repair deductions resulting from the 2012 GRC which are reflected in net income and an increase in regulatory assets.
Changes in cash flows related to working capital items increased in 2014 by
$261 million
and decreased by
$528 million
from 2012. In 2014, SCE had net tax refunds of approximately $88 million, compared to net tax payments of $28 million in 2013 and net tax refunds of $279 million in 2012. The refunds in 2014 and 2012 were due to net operating loss carrybacks to periods that SCE previously had taxable income. In 2014 and 2013, SCE had severance payments of $22 million and $151 million, respectively, related to the workforce reductions. During 2012, SCE had proceeds of $68 million from U.S. Treasury grants.
Net cash provided by operating activities was also impacted by changes in regulatory assets and liabilities, including changes in over (under) collections of balancing accounts. SCE has a number of balancing accounts under CPUC decisions, which impact cash flows based on differences between timing of collection of amounts through rates and accrual expenditures.
21
While some balancing accounts are discrete, (for example, the Four Corners memorandum account related to the sale of SCE's interest or the generator settlements), other balancing accounts are ongoing with changes generally collected in the following year. During 2014 and 2013, cash flows were lower, whereas in 2012 cash flows were higher due to the impact of regulatory assets and liabilities. The impact on cash flow from the two principal balancing accounts are:
|
•
|
ERRA undercollections for fuel and power procurement-related costs for 2014 and 2013 were $1.03 billion and $1.0 billion, respectively, due to the amount and price of power and fuel being higher than forecasted (see "—Regulatory Proceedings—ERRA Forecast Filing – 2015" above). In 2012, SCE had ERRA overcollections of $135 million. In December 2014, SCE reclassified $540 million from regulatory liabilities to ERRA for collection of GRC revenue in excess of cost of service related to San Onofre consistent with its advice filing in November 2014.
|
|
•
|
The base rate revenue account ("BRRBA") tracks differences between amounts authorized by the CPUC in the GRC proceedings and amounts billed to customers. SCE had BRRBA overcollections of $5 million and $247 million in 2014 and 2013, respectively, and undercollections of $505 million in 2012. During 2014, the BRRBA account decreased by $242 million due primarily to refunds to customers of approximately $150 million, related to the sale of Four Corners in December 2013. During 2013, the BRRBA account impacted cash flows by $752 million primarily due to the implementation of the 2012 GRC decision which resulted in a rate increase in January 2013 to collect both the 2012 and 2013 rate increases. During 2012, the BRRBA account decreased cash flows by $267 million primarily due to the delay in the 2012 GRC decision which was not received until November 2012.
|
Cash flows provided (used) by other noncurrent assets and liabilities were $33 million, $(49) million and $221 million in 2014, 2013 and 2012, respectively. Major factors affecting cash flow related to non-current assets and liabilities were activities related to SCE's nuclear decommissioning trusts and settlements relating to injuries and damages.
Net Cash Provided by Financing Activities
The following table summarizes cash provided by financing activities for 2014, 2013 and 2012. Issuances of debt and preference stock are discussed in "Notes to Consolidated Financial Statements—Note 5. Debt and Credit Agreements—Long-Term Debt" and "—Note 12. Preferred and Preference Stock of Utility."
|
(in millions)
|
2014
|
2013
|
2012
|
||||||||
|
Issuances of first and refunding mortgage bonds, net
|
$
|
498
|
|
$
|
1,973
|
|
$
|
391
|
|
||
|
Payments of senior notes
|
(600
|
)
|
(820
|
)
|
(6
|
)
|
|||||
|
Net increases (decreases) in short-term borrowings, net
|
490
|
|
(1
|
)
|
(250
|
)
|
|||||
|
Issuances of preference stock, net
|
269
|
|
387
|
|
804
|
|
|||||
|
Payments of common stock dividends to Edison International
|
(378
|
)
|
(486
|
)
|
(469
|
)
|
|||||
|
Redemptions of preference stock
|
—
|
|
(400
|
)
|
(75
|
)
|
|||||
|
Bonds remarketed, net
|
—
|
|
195
|
|
—
|
|
|||||
|
Bonds purchased
|
—
|
|
(196
|
)
|
—
|
|
|||||
|
Payments of preferred and preference stock dividends
|
(111
|
)
|
(101
|
)
|
(82
|
)
|
|||||
|
Settlement of stock-based awards (facilitated by a third party)
|
(188
|
)
|
(137
|
)
|
(103
|
)
|
|||||
|
Other
|
201
|
|
94
|
|
46
|
|
|||||
|
Net cash provided by financing activities
|
$
|
181
|
|
$
|
508
|
|
$
|
256
|
|
||
Net Cash Used by Investing Activities
Cash flows from investing activities are primarily due to capital expenditures and investing activities of the nuclear decommissioning trusts. Amounts paid for capital expenditures were $3.9 billion for 2014, $3.6 billion for 2013 and $4.1 billion for 2012, primarily related to transmission, distribution and generation facilities. Net purchases of nuclear decommissioning trusts' investments were $44 million, $98 million and $215 million for 2014, 2013 and 2012, respectively. See "Nuclear Decommissioning Trusts" below for further discussion. In December 2013, SCE completed the sale of its ownership interest in Units 4 and 5 of the Four Corners Generating Station which resulted in
$181 million
of proceeds received.
22
Nuclear Decommissioning Trusts
SCE's statement of cash flows includes activities of the Nuclear Decommissioning Trusts which are reflected in the following line items:
|
(in millions)
|
2014
|
2013
|
2012
|
||||||
|
Net cash provided by operating activities:
Nuclear decommissioning trusts
|
$
|
39
|
|
$
|
76
|
|
$
|
192
|
|
|
Net cash flow from investing activities:
Proceeds from sale of investments
|
10,079
|
|
5,617
|
|
2,122
|
|
|||
|
Purchases of investments
|
(10,123
|
)
|
(5,715
|
)
|
(2,337
|
)
|
|||
|
Net cash impact
|
$
|
(5
|
)
|
$
|
(22
|
)
|
$
|
(23
|
)
|
Net cash provided by operating activities of the nuclear decommissioning trusts relate to interest and dividends less administrative expenses, taxes and decommissioning costs. Such activities represent the source (use) of the funds for investing activities. The net cash impact represents the contributions made by SCE, as collected through rates, to the nuclear decommissioning trusts. In future periods, SCE expects decommissioning costs of San Onofre to increase significantly. Such amounts will be reflected as a decrease in SCE net cash provided by operating activities and will be funded from sales of investments of the nuclear decommissioning trusts once approved by the CPUC. Decommissioning costs incurred prior to CPUC approval will be funded by SCE and are reflected as cash flow used by operating activities. See "Notes to Consolidated Financial Statements—Note 9. Other Investments" for further information.
Edison International Parent and Other
The table below sets forth condensed historical cash flow from continuing operations for Edison International Parent and Other.
|
(in millions)
|
2014
|
2013
|
2012
|
||||||||
|
Net cash used by operating activities
|
$
|
(412
|
)
|
$
|
(81
|
)
|
$
|
(115
|
)
|
||
|
Net cash provided by financing activities
|
464
|
|
73
|
|
20
|
|
|||||
|
Net cash provided (used) by investing activities
|
(50
|
)
|
(25
|
)
|
108
|
|
|||||
|
Net increase (decrease) in cash and cash equivalents
|
$
|
2
|
|
$
|
(33
|
)
|
$
|
13
|
|
||
Net Cash Used by Continuing Operating Activities
Net cash from continuing operating activities decreased $331 million in 2014 compared to 2013 due to:
|
•
|
$225 million initial cash payment to the Reorganization Trust in April 2014 related to the EME Settlement Agreement, see "Management Overview—Resolution of Uncertainty Related to EME in Bankruptcy" for further information;
|
|
•
|
Net payments of $120 million to the IRS, which included a $189 million deposit related to open tax years 2003 through 2006; and
|
|
•
|
The timing of payments and receipts relating to interest and operating costs.
|
Net cash from continuing operating activities increased $34 million in 2013 compared to 2012 primarily due to the timing of payments and receipts relating to interest, operating costs and income taxes.
Net Cash Provided by Continuing Financing Activities
Net cash provided by continuing financing activities were as follows:
|
(in millions)
|
2014
|
2013
|
2012
|
|||||||||
|
Dividends paid to Edison International common shareholders
|
$
|
(463
|
)
|
$
|
(440
|
)
|
$
|
(424
|
)
|
|||
|
Dividends received from SCE
|
378
|
|
486
|
|
469
|
|
||||||
|
Debt financing, net
1
|
589
|
|
33
|
|
(15
|
)
|
||||||
|
1
|
Includes $5.1 million debt financing for Edison Energy, see "Notes to Consolidated Financial Statements—Note 5. Debt and Credit Agreements—Project Financings."
|
23
Net Cash Provided (Used) by Continuing Investing Activities
Net cash used by continuing investing activities during 2014 relate to Edison Energy's capital expenditures of $49 million.
Net cash provided by continuing investing activities during 2013 relate to Edison International's investment of $25 million in equity interests of competitive energy-related businesses, including the acquisition of SoCore Energy LLC, a distributed solar developer focused on commercial rooftop installations.
Contractual Obligations and Contingencies
Contractual Obligations
Edison International Parent and Other and SCE's contractual obligations as of
December 31, 2014
, for the years 2015 through 2019 and thereafter are estimated below.
|
(in millions)
|
Total
|
Less than
1 year
|
1 to 3 years
|
3 to 5 years
|
More than
5 years
|
|||||||||||||||
|
SCE:
|
||||||||||||||||||||
|
Long-term debt maturities and interest
1
|
$
|
18,714
|
|
$
|
757
|
|
$
|
1,764
|
|
$
|
1,225
|
|
$
|
14,968
|
|
|||||
|
Power purchase agreements:
2
|
||||||||||||||||||||
|
Renewable energy contracts
|
23,399
|
|
1,009
|
|
2,277
|
|
2,373
|
|
17,740
|
|
||||||||||
|
Qualifying facility contracts
|
969
|
|
254
|
|
408
|
|
238
|
|
69
|
|
||||||||||
|
Other power purchase agreements
|
4,875
|
|
830
|
|
1,453
|
|
1,088
|
|
1,504
|
|
||||||||||
|
Other operating lease obligations
3
|
623
|
|
102
|
|
206
|
|
114
|
|
201
|
|
||||||||||
|
Purchase obligations:
4
|
||||||||||||||||||||
|
Other contractual obligations
|
1,010
|
|
86
|
|
221
|
|
131
|
|
572
|
|
||||||||||
|
Total SCE
5,6
|
49,590
|
|
3,038
|
|
6,329
|
|
5,169
|
|
35,054
|
|
||||||||||
|
Edison International Parent and Other:
|
||||||||||||||||||||
|
Long-term debt maturities and interest
1
|
437
|
|
12
|
|
425
|
|
—
|
|
—
|
|
||||||||||
|
EME settlement payments
7
|
418
|
|
204
|
|
214
|
|
—
|
|
—
|
|
||||||||||
|
Total Edison International Parent and Other
5
|
855
|
|
216
|
|
639
|
|
—
|
|
—
|
|
||||||||||
|
Total Edison International
6,8
|
$
|
50,445
|
|
$
|
3,254
|
|
$
|
6,968
|
|
$
|
5,169
|
|
$
|
35,054
|
|
|||||
|
1
|
For additional details, see "Notes to Consolidated Financial Statements—Note 5. Debt and Credit Agreements." Amount includes interest payments totaling
$8.75 billion
and
$36 million
over applicable period of the debt for SCE and Edison International Parent and Other, respectively.
|
|
2
|
Certain power purchase agreements entered into with independent power producers are treated as operating or capital leases. For further discussion, see "Notes to Consolidated Financial Statements—Note 11. Commitments and Contingencies."
|
|
3
|
At December 31, 2014, SCE's minimum other operating lease payments were primarily related to vehicles, office space, nuclear fuel storage space and other equipment. For further discussion, see "Notes to Consolidated Financial Statements—Note 11. Commitments and Contingencies."
|
|
4
|
For additional details, see "Notes to Consolidated Financial Statements—Note 11. Commitments and Contingencies." At December 31, 2014, other commitments were primarily related to maintaining reliability and expanding SCE's transmission and distribution system.
|
|
5
|
At December 31, 2014, Edison International Parent and Other and SCE had estimated contributions to the pension and PBOP plans. SCE estimated contributions are $151 million, $156 million and $166 million in 2015, 2016 and 2017, respectively. Edison International Parent and Other estimated contributions are $27 million, $26 million and $23 million for the same respective periods. The estimated contributions are not available beyond 2017. These amounts represent estimates that are based on assumptions that are subject to change. See "Notes to Consolidated Financial Statements—Note 8. Compensation and Benefit Plans" for further information.
|
|
6
|
At December 31, 2014, Edison International and SCE had a total net liability recorded for uncertain tax positions of $576 million and $441 million, respectively, which is excluded from the table. Edison International and SCE cannot make reliable estimates of the cash flows by period due to uncertainty surrounding the timing of resolving these open tax issues with the IRS.
|
24
|
7
|
In August 2014, Edison International entered into an amendment of the Settlement Agreement to finalize the remaining matters related to the EME Settlement including setting the amount of the
2
installment payments,
see "Notes to Consolidated Financial Statements—Note 15. Discontinued Operations."
|
|
8
|
The contractual obligations table does not include derivative obligations and asset retirement obligations, which are discussed in "Notes to Consolidated Financial Statements—Note 6. Derivative Instruments," and "—Note 1. Summary of Significant Accounting Policies," respectively.
|
Contingencies
SCE has contingencies related to San Onofre, Four Corners Environmental Matters, Nuclear Insurance, Wildfire Insurance and Spent Nuclear Fuel which are discussed in "Notes to Consolidated Financial Statements—Note 11. Commitments and Contingencies."
Environmental Remediation
SCE records its environmental remediation liabilities when site assessments and/or remedial actions are probable and a range of reasonably likely cleanup costs can be estimated. SCE reviews its sites and measures the liability quarterly, by assessing a range of reasonably likely costs for each identified site using currently available information, including existing technology, presently enacted laws and regulations, experience gained at similar sites, and the probable level of involvement and financial condition of other potentially responsible parties. These estimates include costs for site investigations, remediation, operations and maintenance, monitoring and site closure. Unless there is a probable amount, SCE records the lower end of this reasonably likely range of costs (classified as "Other long-term liabilities") at undiscounted amounts as timing of cash flows is uncertain.
As of December 31, 2014, SCE had identified
20
material sites for remediation and recorded an estimated minimum liability of
$108 million
. SCE expects to recover
90%
of its remediation costs at certain sites. See "Notes to Consolidated Financial Statements—Note 11. Commitments and Contingencies" for further discussion.
Off-Balance Sheet Arrangements
EME has one leveraged lease investment and Edison Capital has investments in affordable housing projects that apply the equity method of accounting. These off-balance sheet transactions are not material to Edison International's consolidated financial statements. SCE has variable interests in power purchase contracts with variable interest entities and a variable interest in unconsolidated Trust I, Trust II and Trust III that issued $475 million (aggregate liquidation preference) of 5.625%, $400 million (aggregate liquidation preference) of 5.10% and $275 million (aggregate liquidation preference) of 5.75%, trust securities, respectively, to the public, see "Notes to Consolidated Financial Statements—Note 3. Variable Interest Entities."
Environmental Developments
For a discussion of environmental developments, see "Business—Environmental Regulation of Edison International and Subsidiaries."
MARKET RISK EXPOSURES
Edison International and SCE's primary market risks include fluctuations in interest rates, commodity prices and volumes, and counterparty credit. Derivative instruments are used to manage market risks including market risks of SCE's customers. For a further discussion of market risk exposures, including commodity price risk, credit risk and interest rate risk, see "Notes to Consolidated Financial Statements—Note 6. Derivative Instruments" and "
—N
ote 4. Fair Value Measurements."
25
Interest Rate Risk
Edison International and SCE are exposed to changes in interest rates primarily as a result of its financing and short-term investing and borrowing activities used for liquidity purposes, to fund business operations and to fund capital investments. The nature and amount of Edison International and SCE's long-term and short-term debt can be expected to vary as a result of future business requirements, market conditions and other factors. Fluctuations in interest rates can affect earnings and cash flows. Changes in interest rates may impact SCE's authorized rate of return for the period beyond 2015, see "Business—SCE—Overview of Ratemaking Process—CPUC" for further discussion. The following table summarizes the increase or decrease to the fair value of long-term debt including the current portion as of December 31, 2014, if the market interest rates were changed while leaving all other assumptions the same:
|
(in millions)
|
Carrying Value
|
Fair Value
|
10% Increase
|
10% Decrease
|
|||||||||||
|
Edison International
|
$
|
10,738
|
|
$
|
12,319
|
|
$
|
11,846
|
|
$
|
12,828
|
|
|||
|
SCE
|
9,924
|
|
11,479
|
|
11,008
|
|
11,986
|
|
|||||||
Commodity Price Risk
SCE and its customers are exposed to the risk of a change in the market price of natural gas, electric power and transmission congestion. SCE's hedging program is designed to reduce exposure to variability in market prices related to SCE's purchases and sales of electric power and natural gas. SCE expects recovery of its related hedging costs through the ERRA balancing account or CPUC-approved procurement plans, and as a result, exposure to commodity price is not expected to impact earnings, but may impact timing of cash flows. SCE's hedging program reduces customer exposure to variability in market prices. As part of this program, SCE enters into energy options, swaps, forward arrangements, tolling arrangements, and congestion revenue rights ("CRRs"). The transactions are pre-approved by the CPUC or executed in compliance with CPUC-approved procurement plans.
Fair Value of Derivative Instruments
The fair value of derivative instruments is included in the consolidated balance sheets unless subject to an exception under the applicable accounting guidance. Realized gains and losses from derivative instruments are expected to be recovered from or refunded to customers through regulatory mechanisms and, accordingly, changes in SCE's fair value have no impact on earnings. SCE does not use hedge accounting for these transactions due to this regulatory accounting treatment. For further discussion on fair value measurements and the fair value hierarchy, see "Notes to Consolidated Financial Statements
—
Note 4. Fair Value Measurements."
The fair value of outstanding derivative instruments used to mitigate exposure to commodity price risk was a net liability of $927 million and $821 million at December 31, 2014 and 2013, respectively. The following table summarizes the increase or decrease to the fair values of the net liability of derivative instruments included in the consolidated balance sheets as of December 31, 2014, if the electricity prices or gas prices were changed while leaving all other assumptions constant:
|
(in millions)
|
December 31, 2014
|
||
|
Increase in electricity prices by 10%
|
$
|
242
|
|
|
Decrease in electricity prices by 10%
|
(198
|
)
|
|
|
Increase in gas prices by 10%
|
(68
|
)
|
|
|
Decrease in gas prices by 10%
|
69
|
|
|
Credit Risk
For information related to credit risks, see "Notes to Consolidated Financial Statements—Note 6. Derivative Instruments."
Credit risk exposure from counterparties for power and gas trading activities is measured as the sum of net accounts receivable (accounts receivable less accounts payable) and the current fair value of net derivative assets (derivative assets less derivative liabilities) reflected on the consolidated balance sheets. SCE enters into master agreements which typically provide for a right of setoff. Accordingly, SCE's credit risk exposure from counterparties is based on a net exposure under these arrangements. SCE manages the credit risk on the portfolio for both rated and non-rated counterparties based on credit ratings using published ratings of counterparties and other publicly disclosed information, such as financial statements, regulatory filings, and press releases, to guide it in the process of setting credit levels, risk limits and contractual arrangements,
26
including master netting agreements. As of December 31, 2014, the amount of balance sheet exposure as described above broken down by the credit ratings of SCE's counterparties, was as follows:
|
December 31, 2014
|
|||||||||||
|
(in millions)
|
Exposure
2
|
Collateral
|
Net Exposure
|
||||||||
|
S&P Credit Rating
1
|
|
|
|
||||||||
|
A or higher
|
$
|
317
|
|
$
|
—
|
|
$
|
317
|
|
||
|
Not rated
3
|
5
|
|
(5
|
)
|
—
|
|
|||||
|
Total
|
$
|
322
|
|
$
|
(5
|
)
|
$
|
317
|
|
||
|
1
|
SCE assigns a credit rating based on the lower of a counterparty's S&P or Moody's rating. For ease of reference, the above table uses the S&P classifications to summarize risk, but reflects the lower of the two credit ratings.
|
|
2
|
Exposure excludes amounts related to contracts classified as normal purchases and sales and non-derivative contractual commitments that are not recorded on the consolidated balance sheets, except for any related net accounts receivable.
|
|
3
|
The exposure in this category relates to long-term power purchase agreements. SCE's exposure is mitigated by regulatory treatment.
|
CRITICAL ACCOUNTING ESTIMATES AND POLICIES
The accounting policies described below are considered critical to obtaining an understanding of Edison International and SCE's consolidated financial statements because their application requires the use of significant estimates and judgments by management in preparing the consolidated financial statements. Management estimates and judgments are inherently uncertain and may differ significantly from actual results achieved. Management considers an accounting estimate to be critical if the estimate requires significant assumptions and changes in the estimate or, the use of alternative estimates, could have a material impact on Edison International's results of operations or financial position. For more information on Edison International's accounting policies, see "Notes to Consolidated Financial Statements—Note 1. Summary of Significant Accounting Policies."
Rate Regulated Enterprises
Nature of Estimate Required.
SCE follows the accounting principles for rate-regulated enterprises which are required for entities whose rates are set by regulators at levels intended to recover the estimated costs of providing service, plus a return on net investment, or rate base. Regulators may also impose certain penalties or grant certain incentives. Due to timing and other differences in the collection of revenue, these principles allow a cost that would otherwise be charged as an expense by an unregulated entity to be capitalized as a regulatory asset if it is probable that such cost is recoverable through future rates; conversely the principles allow creation of a regulatory liability for amounts collected in rates to recover costs expected to be incurred in the future or amounts collected in excess of costs incurred and are refundable to customers.
Key Assumptions and Approach Used.
SCE's management assesses at the end of each reporting period whether regulatory assets are probable of future recovery by considering factors such as the current regulatory environment, the issuance of rate orders on recovery of the specific or a similar incurred cost to SCE or other rate-regulated entities, and other factors that would indicate that the regulator will treat an incurred cost as allowable for ratemaking purposes. Using these factors, management has determined that existing regulatory assets and liabilities are probable of future recovery or settlement. This determination reflects the current regulatory climate and is subject to change in the future.
Effect if Different Assumptions Used.
Significant management judgment is required to evaluate the anticipated recovery of regulatory assets, the recognition of incentives and revenue subject to refund, as well as the anticipated cost of regulatory liabilities or penalties. If future recovery of costs ceases to be probable, all or part of the regulatory assets and liabilities would have to be written off against current period earnings. At December 31, 2014, the consolidated balance sheets included regulatory assets of
$8.87 billion
and regulatory liabilities of
$6.29 billion
. If different judgments were reached on recovery of costs and timing of income recognition, SCE's earnings may vary from the amounts reported.
27
Income Taxes
Nature of Estimates Required.
As part of the process of preparing its consolidated financial statements, Edison International and SCE are required to estimate income taxes for each jurisdiction in which they operate. This process involves estimating actual current period tax expense together with assessing temporary differences resulting from differing treatment of items, such as depreciation, for tax and accounting purposes. These differences result in deferred tax assets and liabilities, which are included within Edison International and SCE's consolidated balance sheets, including net operating loss and tax credit carryforwards that can be used to reduce liabilities in future periods.
Edison International and SCE take certain tax positions they believe are in accordance with the applicable tax laws. However, these tax positions are subject to interpretation by the IRS, state tax authorities and the courts. Edison International and SCE determine uncertain tax positions in accordance with the authoritative guidance.
A portion of SCE's uncertain tax positions relate to tax deductions that are classified as flow-through items for regulatory purposes, including repair deductions that have increased significantly as a result of changes in guidance from the IRS. Flow-through items reduce current authorized revenue requirements in SCE's rate cases which also results in recording regulatory assets for future recovery of the related deferred tax expense. The difference between forecasted amounts in SCE's rate cases and actual repair deductions also result in increases or decreases in regulatory assets and a corresponding impact on earnings. SCE estimates the amount of unrecognized tax benefits for flow-through tax items using the same accounting guidance for uncertain tax positions. Accordingly, a change in the amount of flow-through tax items from a tax authority audit impacts the amount of regulatory tax benefits recognized by SCE. It is reasonably possible that within the next 12 months unrecognized tax benefits may decrease by approximately $96 million due to a change in estimate of a tax position subject to flow through regulatory treatment.
Key Assumptions and Approach Used.
Accounting for tax obligations requires management judgment. Edison International and SCE's management use judgment in determining whether the evidence indicates it is more likely than not, based solely on the technical merits, that a tax position will be sustained, and to determine the amount of tax benefits to be recognized. Judgment is also used in determining the likelihood a tax position will be settled and possible settlement outcomes. In assessing uncertain tax positions Edison International and SCE consider, among others, the following factors: the facts and circumstances of the position, regulations, rulings, and case law, opinions or views of legal counsel and other advisers, and the experience gained from similar tax positions. Edison International and SCE's management evaluates uncertain tax positions at the end of each reporting period and makes adjustments when warranted based on changes in fact or law.
Effect if Different Assumptions Used.
Actual income taxes may differ from the estimated amounts which could have a significant impact on the liabilities, revenue and expenses recorded in the financial statements. Edison International and SCE continue to be under audit or subject to audit for multiple years in various jurisdictions. Significant judgment is required to determine the tax treatment of particular tax positions that involve interpretations of complex tax laws. Such liabilities are based on judgment and a final determination could take many years from the time the liability is recorded. Furthermore, settlement of tax positions included in open tax years may be resolved by compromises of tax positions based on current factors and business considerations that may result in material adjustments to income taxes previously estimated.
Nuclear Decommissioning – Asset Retirement Obligation
Key Assumptions and Approach Used.
The liability to decommission SCE's nuclear power facilities is based on decommissioning studies performed in 2010 for Palo Verde and San Onofre Unit 1 and a 2014 updated decommissioning cost estimate for the retirement of San Onofre Units 2 and 3. See "Management Overview—Permanent Retirement of San Onofre and San Onofre OII Settlement" for further discussion of the plans for decommissioning of San Onofre. SCE currently estimates that it will spend approximately
$7.4 billion
through
2075
to decommission its nuclear facilities. Decommissioning cost estimates are updated in each Nuclear Decommissioning Triennial Proceeding. The current ARO estimates for San Onofre and Palo Verde are based on the assumptions from these decommissioning studies:
|
•
|
Decommissioning Costs. The estimated costs for labor, dismantling and disposal costs, site remediation, energy and miscellaneous costs.
|
|
•
|
Escalation Rates. Annual escalation rates are used to convert the decommissioning cost estimates in base year dollars to decommissioning cost estimates in future-year dollars. Escalation rates are primarily used for labor, material, equipment, energy and low level radioactive waste burial costs. SCE's current estimate is based on SCE's decommissioning cost methodology used for ratemaking purposes, escalated at rates ranging from
1.0%
to
7.3%
(depending on the cost element) annually.
|
28
|
•
|
Timing. Cost estimates for Palo Verde are based on an assumption that decommissioning will commence promptly after the current NRC operating licenses expire. The Palo Verde 1, 2, 3 operating licenses currently expire in 2045, 2046 and 2047 respectively. Cost estimates for San Onofre are based on an assumption that decommissioning commenced in 2013. For further information, see "Management Overview—Permanent Retirement of San Onofre and San Onofre OII Settlement."
|
|
•
|
Spent Fuel Dry Storage Costs. Cost estimates are based on an assumption that the DOE will begin to take spent fuel in 2024, and will remove the last spent fuel from the San Onofre and Palo Verde sites by 2049 and 2075, respectively. Costs for spent fuel monitoring are included until 2049 and 2075, respectively.
|
|
•
|
Changes in Decommissioning Technology, Regulation, and Economics. The current cost studies assume the use of current technologies under current regulations and at current cost levels.
|
Effect if Different Assumptions Used.
The ARO for decommissioning SCE's nuclear facilities was $2.7 billion at December 31, 2014. Changes in the estimated costs or timing of decommissioning, or in the assumptions and judgments by management underlying these estimates, could cause material revisions to the estimated total cost to decommission these facilities which could have a material effect on the recorded liability.
The following table illustrates the increase to the ARO liability if the cost escalation rate was adjusted while leaving all other assumptions constant:
|
(in millions)
|
Increase to ARO and
Regulatory Asset at
December 31, 2014
|
||
|
Uniform increase in escalation rate of 100 basis points
|
$
|
550
|
|
The increase in the ARO liability driven by an increase in the escalation rate would result in a decrease in the regulatory liability for recoveries in excess of ARO liabilities.
Pensions and Postretirement Benefits Other than Pensions ("PBOP(s)")
Nature of Estimate Required.
Authoritative accounting guidance requires companies to recognize the overfunded or underfunded status of defined benefit pension and other postretirement plans as assets and liabilities in the balance sheet; the assets and/or liabilities are normally offset through other comprehensive income (loss). In accordance with authoritative guidance for rate-regulated enterprises, regulatory assets and liabilities are recorded instead of charges and credits to other comprehensive income (loss) for its postretirement benefit plans that are recoverable in utility rates. Edison International and SCE have a fiscal year-end measurement date for all of its postretirement plans.
Edison International and SCE have adopted new mortality tables that the Society of Actuaries released in October 2014 that reflect an increase in life expectancy. At
December 31, 2014
, this adoption resulted in an increase in Edison International's pension plans' projected benefit obligation of
$214 million
, including
$199 million
for SCE, and an increase in Edison International's PBOP plans' accumulated projected benefit obligation of
$308 million
, including
$307 million
for SCE.
Key Assumptions of Approach Used.
Pension and other postretirement obligations and the related effects on results of operations are calculated using actuarial models. Two critical assumptions, discount rate and expected return on assets, are important elements of plan expense and liability measurement. Additionally, health care cost trend rates are critical assumptions for postretirement health care plans. These critical assumptions are evaluated at least annually. Other assumptions, which require management judgment, such as rate of compensation increases, rates of retirement, mortality and turnover, are evaluated periodically and updated to reflect actual experience.
As of December 31, 2014, Edison International's and SCE's pension plans had a
$4.5 billion
and
$4.0 billion
benefit obligation, respectively, and total 2014 expense for these plans was
$151 million
and
$141 million
, respectively. As of December 31, 2014, the benefit obligation for both Edison International's and SCE's PBOP plans was
$2.8 billion
and total 2014 expense for Edison International's and SCE's plans was both
$22 million
. Annual contributions made to most of SCE's pension plans are currently recovered through CPUC-approved regulatory mechanisms and are expected to be, at a minimum, equal to the related annual expense.
29
Edison International and SCE used the following critical assumptions to determine expense for pension and other postretirement benefit for 2014:
|
(in millions)
|
Pension
Plans
|
Postretirement
Benefits Other
than Pensions
|
||
|
Discount rate
1
|
4.50
|
%
|
5.00
|
%
|
|
Expected long-term return on plan assets
2
|
7.0
|
%
|
5.5
|
%
|
|
Assumed health care cost trend rates
3
|
*
|
|
7.8
|
%
|
|
*
|
Not applicable to pension plans.
|
|
1
|
The discount rate enables Edison International and SCE to state expected future cash flows at a present value on the measurement date. Edison International and SCE select its discount rate by performing a yield curve analysis. This analysis determines the equivalent discount rate on projected cash flows, matching the timing and amount of expected benefit payments. The AON-Hewitt yield curve is considered in determining the discount rate.
|
|
2
|
To determine the expected long-term rate of return on pension plan assets, current and expected asset allocations are considered, as well as historical and expected returns on plan assets. A portion of PBOP trusts asset returns are subject to taxation, so the
5.5%
rate of return on plan assets above is determined on an after-tax basis. Actual time-weighted, annualized returns on the pension plan assets were 8.1%, 11.3% and 7.4% for the one-year, five-year and ten-year periods ended December 31, 2014, respectively. Actual time-weighted, annualized returns on the PBOP plan assets were 8.7%, 10.8% and 6.3% over these same periods. Accounting principles provide that differences between expected and actual returns are recognized over the average future service of employees.
|
|
3
|
The health care cost trend rate gradually declines to
5.0%
for
2021
and beyond.
|
Pension expense is recorded for SCE based on the amount funded to the trusts, as calculated using an actuarial method required for ratemaking purposes, in which the impact of market volatility on plan assets is recognized in earnings on a more gradual basis. Any difference between pension expense calculated in accordance with ratemaking methods and pension expense calculated in accordance with authoritative accounting guidance for pension is accumulated as a regulatory asset or liability, and is expected, over time, to be recovered from or returned to customers. As of December 31, 2014, this cumulative difference amounted to a regulatory asset of $171 million, meaning that the accounting method has recognized more in expense than the ratemaking method since implementation of authoritative guidance for employers' accounting for pensions in 1987.
As of December 31, 2014, Edison International and SCE had unrecognized pension costs of
$762 million
and
$691 million
, and unrecognized PBOP costs of
$562 million
and
$558 million
, respectively. The unrecognized pension and PBOP costs primarily consisted of the cumulative impact of the reduced discount rates on the respective benefit obligations and the cumulative difference between the expected and actual rate of return on plan assets. Of these deferred costs,
$660 million
of SCE's pension costs and
$558 million
of SCE's PBOP costs are recorded as regulatory assets, and will be amortized to expense over the average expected future service of employees.
Edison International's and SCE's pension and PBOP plans are subject to limits established for federal tax deductibility. SCE funds its pension and PBOP plans in accordance with amounts allowed by the CPUC. Executive pension plans have no plan assets.
Effect if Different Assumptions Used.
Changes in the estimated costs or timing of pension and other postretirement benefit obligations, or the assumptions and judgments used by management underlying these estimates, could have a material effect on the recorded expenses and liabilities.
30
The following table summarizes the increase or (decrease) to projected benefit obligation for pension and the accumulated benefit obligation for PBOP if the discount rate were changed while leaving all other assumptions constant:
|
Edison International
|
SCE
|
||||||||||||||
|
(in millions)
|
Increase in discount rate by 1%
|
Decrease in discount rate by 1%
|
Increase in discount rate by 1%
|
Decrease in discount rate by 1%
|
|||||||||||
|
Change to projected benefit obligation for pension
|
$
|
(441
|
)
|
$
|
493
|
|
$
|
(378
|
)
|
$
|
417
|
|
|||
|
Change to accumulated benefit obligation for PBOP
|
(388
|
)
|
471
|
|
(387
|
)
|
469
|
|
|||||||
A one percentage point increase in the expected rate of return on pension plan assets would decrease both Edison International's and SCE's current year expense by $30 million and a one percentage point increase in the expected rate of return on PBOP plan assets would decrease both Edison International's and SCE's current year expense by $20 million.
The following table summarizes the increase or (decrease) to accumulated benefit obligation and annual aggregate service and interest costs for PBOP if the health care cost trend rate was changed while leaving all other assumptions constant:
|
Edison International
|
SCE
|
||||||||||||||
|
(in millions)
|
Increase in health care cost trend rate by 1%
|
Decrease in health care cost trend rate by 1%
|
Increase in health care cost trend rate by 1%
|
Decrease in health care cost trend rate by 1%
|
|||||||||||
|
Change to accumulated benefit obligation for PBOP
|
$
|
335
|
|
$
|
(271
|
)
|
$
|
334
|
|
$
|
(270
|
)
|
|||
|
Change to annual aggregate service and interest costs
|
15
|
|
(12
|
)
|
15
|
|
(12
|
)
|
|||||||
Accounting for Contingencies
Nature of Estimates Required.
Edison International and SCE record loss contingencies when management determines that the outcome of future events is probable of occurring and when the amount of the loss can be reasonably estimated. Gain contingencies are recognized in the financial statements when they are realized.
Key Assumptions and Approach Used.
The determination of a reserve for a loss contingency is based on management judgment and estimates with respect to the likely outcome of the matter, including the analysis of different scenarios. Liabilities are recorded or adjusted when events or circumstances cause these judgments or estimates to change. In assessing whether a loss is a reasonable possibility, Edison International and SCE may consider the following factors, among others: the nature of the litigation, claim or assessment, available information, opinions or views of legal counsel and other advisors, and the experience gained from similar cases. Edison International and SCE provide disclosures for material contingencies when there is a reasonable possibility that a loss or an additional loss may be incurred.
Effect if Different Assumptions Used.
Actual amounts realized upon settlement of contingencies may be different than amounts recorded and disclosed and could have a significant impact on the liabilities, revenue and expenses recorded on the consolidated financial statements. For a discussion of contingencies, guarantees and indemnities, see "Notes to Consolidated Financial Statements—Note 11. Commitments and Contingencies."
NEW ACCOUNTING GUIDANCE
New accounting guidance is discussed in "Notes to Consolidated Financial Statements—Note 1. Summary of Significant Accounting Policies—New Accounting Guidance."
31
RISK FACTORS
RISKS RELATING TO EDISON INTERNATIONAL
Edison International's liquidity depends on SCE's ability to pay dividends and tax allocation payments to Edison International and monetization of tax benefits retained by EME.
Edison International is a holding company and, as such, it has no operations of its own. Edison International's ability to meet its financial obligations and to pay dividends on its common stock is primarily dependent on the earnings and cash flows of SCE and its ability to make upstream distributions. Prior to paying dividends to Edison International, SCE has financial and regulatory obligations that must be satisfied, including, among others, debt service and preferred stock dividends. In addition, CPUC holding company rules require that SCE's dividend policy be established by SCE's Board of Directors on the same basis as if SCE were a stand-alone utility company, and that the capital requirements of SCE, as deemed to be necessary to meet SCE's service obligations, shall receive first priority from the Boards of Directors of both Edison International and SCE. SCE may also owe tax-allocation payments to Edison International under applicable tax-allocation agreements. The EME Settlement Agreement requires Edison International to make fixed payments to a newly formed trust under the control of EME's creditors (the "Reorganization Trust"). Edison International plans to use its credit facilities or incur new debt to fund a portion of the Reorganization Trust payments due to delays in monetizing tax benefits retained by EME as a result of the recent extension of bonus depreciation. Realization of such tax benefits may be furthered delayed or permanently reduced by future tax legislation that extends bonus depreciation or reduces the current corporate tax rate. Access to capital markets may be impacted by economic conditions that have an adverse effect on Edison International's liquidity. See "Risks Relating to Southern California Edison Company" below for further discussion.
Edison International's activities are concentrated in one industry and in one region.
Edison International does not have diversified sources of revenue or regulatory oversight. SCE comprises substantially all of Edison International's business, and Edison International's business is expected to remain concentrated in the electricity industry. Furthermore, Edison International's current business is concentrated almost entirely in southern California. As a result, Edison International's future performance may be affected by events and economic performance concentrated in southern California or by regional regulation or legislation.
RISKS RELATING TO SOUTHERN CALIFORNIA EDISON COMPANY
Regulatory Risks
SCE is subject to extensive regulation and the risk of adverse regulatory decisions and changes in applicable regulations or legislation.
SCE operates in a highly regulated environment. SCE's business is subject to extensive federal, state and local energy, environmental and other laws and regulations. Among other things, the CPUC regulates SCE's retail rates and capital structure, and the FERC regulates SCE's wholesale rates. The NRC regulates the decommissioning of San Onofre. The construction, planning, and siting of SCE's power plants and transmission lines in California are also subject to regulation by the CPUC.
SCE must periodically apply for licenses and permits from these various regulatory authorities and abide by their respective orders. Should SCE be unsuccessful in obtaining necessary licenses or permits or should these regulatory authorities initiate any investigations or enforcement actions or impose penalties or disallowances on SCE, SCE's business could be materially affected. The process of obtaining licenses and permits from regulatory authorities may be delayed or defeated by concerted community opposition and such delay or defeat could have a material effect on SCE's business.
The CPUC is considering rulemaking to govern communications between the CPUC officials, staff and the regulated utilities following investigations of violations by PG&E of the
ex parte
rules on communications with CPUC officials and staff. Changes to the rules and processes around
ex parte
communications could result in delayed decisions, increased investigations, enforcement actions and penalties. In addition, the CPUC or other parties may initiate investigations of past communications between public utilities, including SCE, and CPUC officials and staff that could result in reopening completed proceedings for reconsideration.
In addition, existing regulations may be revised or reinterpreted and new laws and regulations may be adopted or become applicable to SCE, or its facilities or operations, in a manner that may have a detrimental effect on SCE's business or result in significant additional costs. In addition, regulations adopted via the public initiative or legislative process may apply to SCE, or its facilities or operations, in a manner that may have a detrimental effect on SCE's business or result in significant additional costs.
32
SCE's financial results depend upon its ability to recover its costs and to earn a reasonable rate of return on capital investments in a timely manner from its customers through regulated rates.
SCE's ongoing financial results depend on its ability to recover from its customers in a timely manner its costs, including the costs of electricity purchased for its customers, through the rates it charges its customers as approved by the CPUC and FERC. SCE's financial results also depend on its ability to earn a reasonable return on capital, including long-term debt and equity. SCE's ability to recover its costs and earn a reasonable rate of return can be affected by many factors, including the time lag between when costs are incurred and when those costs are recovered in customers’ rates and differences between the forecast or authorized costs embedded in rates (which are set on a prospective basis) and the amount of actual costs incurred. The CPUC or the FERC may not allow SCE to recover costs on the basis that such costs were not reasonably or prudently incurred or for other reasons. Further, SCE may be required to incur expenses before the CPUC approves the recovery of such costs. For example, SCE has requested approval from the CPUC to reimburse decommissioning costs related to San Onofre Units 2 and 3 from the nuclear decommissioning trust, which is pending. For more information, see "Management Overview—Permanent Retirement of San Onofre and San Onofre OII Settlement—Decommissioning" in the MD&A. Changes in laws and regulations or changes in the political and regulatory environment also may have an adverse effect on the SCE's ability to timely recover its costs and earn its authorized rate of return. In addition, SCE may be required to incur costs to comply with new state laws or to implement new state policies before SCE is assured of cost recovery.
SCE's capital investment plan, increasing procurement of renewable power, increasing environmental regulations, leveling demand, and the cumulative impact of other public policy requirements, collectively place continuing upward pressure on customer rates. If SCE is unable to obtain a sufficient rate increase or modify its rate design to recover material amounts of its costs (including an adequate return on capital) in rates in a timely manner, its financial condition and results of operations could be materially affected. For further information on SCE's rate requests, see "Management Overview—Regulatory Matters—2015 General Rate Case" and "Liquidity and Capital Resources—SCE—Regulatory Proceedings—FERC Formula Rates" in the MD&A.
SCE's energy procurement activities are subject to regulatory and market risks that could materially affect its financial condition and liquidity.
SCE obtains energy, capacity, environmental credits and ancillary services needed to serve its customers from its own generating plants, and through contracts with energy producers and sellers. California law and CPUC decisions allow SCE to recover through the rates it is allowed to charge its customers reasonable procurement costs incurred in compliance with an approved procurement plan. Nonetheless, SCE's cash flows remain subject to volatility primarily resulting from changes in commodity prices. In addition, SCE is subject to the risks of unfavorable or untimely CPUC decisions about the compliance with SCE's procurement plan and the reasonableness of certain procurement-related costs.
SCE may not be able to hedge its risk for commodities on economic terms or fully recover the costs of hedges through the rates it is allowed to charge its customers, which could materially affect SCE's liquidity and results of operations, see "Market Risk Exposures" in the MD&A.
Financing Risks
As a capital intensive company, SCE relies on access to the capital markets. If SCE were unable to access the capital markets or the cost of financing were to substantially increase, its liquidity and operations could be materially affected.
SCE regularly accesses the capital markets to finance its activities and is expected to do so by its regulators as part of its obligation to serve as a regulated utility. SCE's needs for capital for its ongoing infrastructure investment program are substantial. SCE's ability to obtain financing, as well as its ability to refinance debt and make scheduled payments of principal, interest and preferred stock dividends, are dependent on numerous factors, including SCE's levels of indebtedness, maintenance of acceptable credit ratings, its financial performance, liquidity and cash flow, and other market conditions. SCE's inability to obtain additional capital from time to time could have a material effect on SCE's liquidity and operations.
Competitive and Market Risks
The electricity industry is undergoing extensive changes, including increased competition, technological advancements, and political and regulatory developments.
The electricity industry is undergoing extensive change, including technological advancements such as energy storage and customer-owned generation that may change the nature of energy generation and delivery. In addition, there has been public discussion regarding the possibility of future changes in the electric utility business model as a result of these developments. In October 2013, the CPUC held an open hearing to receive views from various sources on whether the current California
33
utility business model should be revised. It is possible that revisions to the traditional utility business model could materially affect SCE's business model and its financial condition and results of operations.
Demand for electricity from utilities has been leveling, while growth in customer-owned generation has increased. At the same time, significant investment is needed to replace aging infrastructure and convert the electric distribution grid to support two-way flows of electricity.
Customer-owned generation itself reduces the amount of electricity purchased from utilities and has the effect of increasing utility rates unless retail rates are designed to share the costs of the distribution grid across all customers that benefit from their use. For example, customers in California that generate their own power do not currently pay most transmission and distribution charges and non-bypassable charges, subject to limitations, which results in increased utility rates for those customers who do not own their generation. Such increases foster the public discussion regarding future changes in the electric utility business model.
In addition, the FERC has adopted changes that have opened transmission development to competition from independent developers, allowing such developers to compete with incumbent utilities for the construction and operation of transmission facilities. For more information, see "Business—SCE—Competition."
Operating Risks
SCE's financial condition and results of operations could be materially affected if it is unable to successfully manage the risks inherent in operating and maintaining its facilities.
SCE's infrastructure is aging and could pose a risk to system reliability. In order to mitigate this risk, SCE is engaged in a significant and ongoing infrastructure investment program. This substantial investment program elevates the operational risks and the need for superior execution in its activities. SCE's financial condition and results of operations could be materially affected if it is unable to successfully manage these risks as well as the risks inherent in operating and maintaining its facilities, the operation of which can be hazardous. SCE's inherent operating risks include such matters as the risks of human performance, workforce capabilities, public opposition to infrastructure projects, delays, environmental mitigation costs, difficulty in estimating costs or in recovering costs that are above original estimates, system limitations and degradation, and interruptions in necessary supplies.
SCE's operations may be affected if negotiations for new collective bargaining agreements are unsuccessful or relations with unionized employees deteriorate.
Approximately 30% of SCE's employees are covered by collective bargaining agreements with the International Brotherhood of Electrical Workers ("IBEW"). The IBEW collective bargaining agreements expired on December 31, 2014, but SCE and IBEW have agreed to allow the expired agreements to remain in force during ongoing negotiations for new agreements, subject to either party's right to terminate the agreements on 120 days written notice. If the current agreements are terminated, the negotiations are unsuccessful, or labor relations otherwise deteriorate, represented employees could strike, participate in work stoppages, slowdowns or other forms of labor disruption. These activities could delay projects, negatively impact capital expenditures and employee safety, and otherwise have an adverse effect on SCE's operations.
SCE's systems and network infrastructure may be vulnerable to physical and cyber attacks, intrusions or other catastrophic events that could result in their failure or reduced functionality.
Regulators, such as the NERC, and U.S. Government Departments, including the Departments of Defense, Homeland Security and Energy, have noted that threat sources continue to seek to exploit potential vulnerabilities in the U.S. national electric grid and other energy infrastructures and that such attacks and disruptions, both physical and cyber, are becoming increasingly sophisticated and dynamic. As SCE moves from an analog to a digital electric grid, new cyber security risks may be presented. An example of such new risks is the installation of "smart" meters in SCE's service territory. This technology may represent a new route for attacks on SCE's information systems. SCE's operations require the continuous availability of critical information technology systems and network infrastructure. SCE's systems have been, and will likely continue to be, subjected to computer attacks of malicious codes, unauthorized access attempts, and other illicit activities, but to date, SCE has not experienced a material cyber security breach. Although SCE actively monitors developments in this area and is involved in various industry groups and government initiatives, no security measures can completely shield such systems and infrastructure from vulnerabilities to cyber attacks, intrusions or other catastrophic events that could result in their failure or reduced functionality. If SCE's information technology systems security measures were to be breached or a critical system failure were to occur without timely recovery, SCE could be unable to fulfill critical business functions such as delivery of electricity to customers and/or sensitive confidential personal and other data could be compromised, which could result in violations of applicable privacy and other laws, financial loss to SCE or to its customers, loss of confidence in SCE's security
34
measures, customer dissatisfaction, and significant litigation exposure, all of which could materially affect SCE's financial condition and results of operations and materially damage the business reputation of Edison International and SCE.
Weather-related incidents and other natural disasters could materially affect SCE's financial condition and results of operations.
Weather-related incidents and other natural disasters, including storms, wildfires and earthquakes, can disrupt the generation and transmission of electricity, and can seriously damage the infrastructure necessary to deliver power to SCE's customers. These events can lead to lost revenues and increased expenses, including higher maintenance and repair costs. They can also result in regulatory penalties and disallowances, particularly if SCE encounters difficulties in restoring power to its customers. These occurrences could materially affect SCE's business, financial condition and results of operations, and the inability to restore power to SCE's customers could also materially damage the business reputation of SCE and Edison International.
The generation, transmission and distribution of electricity are dangerous and involve inherent risks of damage to private property and injury to employees and the general public.
Electricity is dangerous for employees and the general public should they come in contact with electrical current or equipment, including through downed power lines or if equipment malfunctions. Injuries and property damage caused by such events can subject SCE to liability that, despite the existence of insurance coverage, can be significant. The CPUC has increased its focus on public safety issues with an emphasis on heightened compliance with construction and operating standards and the potential for penalties being imposed on utilities. Additionally, the CPUC has delegated to its staff the authority to issue citations, which carry a fine of $50,000 per violation per day, to electric utilities subject to its jurisdiction for violations of safety rules found in statutes, regulations, and the General Orders of the CPUC. Such penalties and liabilities could be significant and materially affect SCE's liquidity and results of operations.
There are inherent risks associated with owning and decommissioning nuclear power generating facilities, including, among other things, potential harmful effects on the environment and human health and the danger of storage, handling and disposal of radioactive materials.
The cost of decommissioning Unit 2 and Unit 3 of San Onofre may not be recoverable through regulatory processes or otherwise. Inability to gain timely access to the nuclear decommissioning trust funds could negatively affect SCE's cash flows. Interpretations of tax regulations may further delay access to nuclear decommissioning trust funds for the purpose of building spent nuclear fuel storage.
The costs of decommissioning Unit 2 and Unit 3 are subject to reasonableness reviews by the CPUC. These costs may not be recoverable through regulatory processes or otherwise unless SCE can establish that the costs were reasonably incurred.
SCE expects to fund decommissioning costs with assets that are currently held in nuclear decommissioning trusts. SCE is required to request access to these trust funds from the CPUC and requests submitted in 2014 are pending. SCE is also required to proceed with the decommissioning of Units 2 and 3 and beginning in 2015, SCE must fund decommissioning costs until the CPUC approves SCE's request to access the trust. Based on the current estimate, SCE forecasts 2015 decommissioning costs of approximately $200 million. Decommissioning activities could be delayed and SCE's cash flows could be negatively impacted if timely access to the nuclear decommissioning trust funds is not obtained.
Depending on how the IRS or the Department of Treasury ultimately interpret IRS regulations addressing the taxation of a qualified nuclear decommissioning trust, SCE may be restricted from withdrawing amounts from its qualified decommissioning trust to pay for independent spent fuel storage installations ("ISFSI") where SCE is seeking, or plans to seek, recovery of the ISFSI costs in litigation against the DOE. Until the DOE litigation is resolved, SCE expects to pay for such ISFSI costs unless and until the IRS or the Department of Treasury issue guidance directed to either SCE or to all taxpayers, which provides that such ISFSI costs can be funded by qualified nuclear decommissioning trusts. If SCE is unable to obtain timely reimbursement of such costs, it may delay decommissioning activities and negatively impact SCE's cash flows. For more information on the spent fuel litigation, see "Notes to Consolidated Financial Statements—Note 11. Commitments and Contingencies—Contingencies—Spent Nuclear Fuel."
Existing insurance and ratemaking arrangements may not protect SCE fully against losses from a nuclear incident.
Despite the fact that San Onofre is being decommissioned, the presence of spent nuclear fuel still poses a potential risk of a nuclear incident. Federal law limits public liability claims from a nuclear incident to the amount of available financial protection, which is currently approximately $13.6 billion. SCE and other owners of the San Onofre and Palo Verde Nuclear Generating Stations have purchased the maximum private primary insurance available of $375 million per site. If nuclear
35
incident liability claims were to exceed $375 million, the remaining amount would be made up from contributions of approximately $12.2 billion made by all of the nuclear facility owners in the U.S., up to an aggregate total of $13.6 billion. There is no assurance that the CPUC would allow SCE to recover the required contribution made in the case of one or more nuclear incident claims that exceeded $375 million. If this public liability limit of $13.6 billion is insufficient, federal law contemplates that additional funds may be appropriated by Congress. There can be no assurance of SCE's ability to recover uninsured costs in the event the additional federal appropriations are insufficient. For more information on nuclear insurance risk, see "Notes to Consolidated Financial Statements—Note 11. Commitments and Contingencies—Contingencies—Nuclear Insurance."
SCE's insurance coverage for wildfires arising from its ordinary operations may not be sufficient.
Edison International has experienced increased costs and difficulties in obtaining insurance coverage for wildfires that could arise from SCE's ordinary operations. In addition, the insurance that has been obtained for wildfire liabilities may not be sufficient. Uninsured losses and increases in the cost of insurance may not be recoverable in customer rates. A loss which is not fully insured or cannot be recovered in customer rates could materially affect Edison International's and SCE's financial condition and results of operations. Furthermore, insurance for wildfire liabilities may not continue to be available at all or at rates or on terms similar to those presently available to Edison International. For more information on wildfire insurance risk, see "Notes to Consolidated Financial Statements—Note 11. Commitments and Contingencies—Contingencies—Wildfire Insurance."
Environmental Risks
SCE is subject to extensive environmental regulations that may involve significant and increasing costs and materially affect SCE.
SCE is subject to extensive and frequently changing environmental regulations and permitting requirements that involve significant and increasing costs and substantial uncertainty. SCE devotes significant resources to environmental monitoring, pollution control equipment, mitigation projects, and emission allowances to comply with existing and anticipated environmental regulatory requirements. However, the current trend is toward more stringent standards, stricter regulation, and more expansive application of environmental regulations. The adoption of laws and regulations to implement greenhouse gas controls could materially affect operations of power plants, which could in turn impact electricity markets and SCE's purchased power costs. SCE may also be exposed to risks arising from past, current or future contamination at its former or existing facilities or with respect to offsite waste disposal sites that have been used in its operations. Other environmental laws, particularly with respect to air emissions, disposal of ash, wastewater discharge and cooling water systems, are also generally becoming more stringent. The operation of SCE facilities under such laws and regulations may require substantial capital expenditures for environmental controls or cessation of operations. Current and future state laws and regulations in California also could increase the required amount of energy that must be procured from renewable resources. See "Business—Environmental Regulation of Edison International and Subsidiaries" for further discussion of environmental regulations under which SCE operates.
QUANTITATIVE AND QUALITATIVE DISCLOSURES ABOUT MARKET RISK
Information responding to this section is included in the MD&A under the heading "Market Risk Exposures."
FINANCIAL STATEMENTS AND SUPPLEMENTARY DATA
36
REPORT OF INDEPENDENT REGISTERED PUBLIC ACCOUNTING FIRM
To the Board of Directors and
Shareholders of Edison International
In our opinion, the accompanying consolidated balance sheets and the related consolidated statements of income, comprehensive income, changes in equity and cash flows present fairly, in all material respects, the financial position of Edison International and its subsidiaries at December 31, 2014 and 2013, and the results of their operations and their cash flows for each of the three years in the period ended December 31, 2014
in conformity with accounting principles generally accepted in the United States of America. In addition, in our opinion, the financial statement schedules appearing under Item 15 (a) (2) present fairly, in all material respects, the information set forth therein when read in conjunction with the related consolidated
financial statements. Also in our opinion, the Company maintained, in all material respects, effective internal control over financial reporting as of December 31, 2014, based on criteria established in
Internal Control - Integrated Framework (2013)
issued by the Committee of Sponsoring Organizations of the Treadway Commission (COSO). The Company's management is responsible for these financial statements and financial statement schedules, for maintaining effective internal control over financial reporting and for its assessment of the effectiveness of internal control over financial reporting, included in
Management's Report on Internal Control over Financial Reporting appearing under Item 9A. Our responsibility is to express opinions on these financial statements, on the financial statement schedules, and on the Company's internal control over financial reporting based on our integrated audits. We conducted our audits in accordance with the standards of the Public Company Accounting Oversight Board (United States). Those standards require that we plan and perform the audits to obtain reasonable assurance about whether the financial statements are free of material misstatement and whether effective internal control over financial reporting was maintained in all material respects. Our audits of the financial statements included examining, on a test basis, evidence supporting the amounts and disclosures in the financial statements, assessing the accounting principles used and significant estimates made by management, and evaluating the overall financial statement presentation. Our audit of internal control over financial reporting included obtaining an understanding of internal control over financial reporting, assessing the risk that a material weakness exists, and testing and evaluating the design and operating effectiveness of internal control based on the assessed risk. Our audits also included performing such other procedures as we considered necessary in the circumstances. We believe that our audits provide a reasonable basis for our opinions.
A company's internal control over financial reporting is a process designed to provide reasonable assurance regarding the reliability of financial reporting and the preparation of financial statements for external purposes in accordance with generally accepted accounting principles. A company's internal control over financial reporting includes those policies and procedures that (i) pertain to the maintenance of records that, in reasonable detail, accurately and fairly reflect the transactions and dispositions of the assets of the company; (ii) provide reasonable assurance that transactions are recorded as necessary to permit preparation of financial statements in accordance with generally accepted accounting principles, and that receipts and expenditures of the company are being made only in accordance with authorizations of management and directors of the company; and (iii) provide reasonable assurance regarding prevention or timely detection of unauthorized acquisition, use, or disposition of the company's assets that could have a material effect on the financial statements.
Because of its inherent limitations, internal control over financial reporting may not prevent or detect misstatements. Also, projections of any evaluation of effectiveness to future periods are subject to the risk that controls may become inadequate because of changes in conditions, or that the degree of compliance with the policies or procedures may deteriorate.
/s/ PricewaterhouseCoopers LLP
Los Angeles, California
February 24, 2015
37
REPORT OF INDEPENDENT REGISTERED PUBLIC ACCOUNTING FIRM
To the Board of Directors and
Shareholders of Southern California Edison Company
In our opinion, the accompanying consolidated balance sheets and the related consolidated statements of income, comprehensive income, changes
in equity and cash flows present fairly, in all material respects, the financial position of Southern California Edison Company and its subsidiaries at December 31, 2014 and 2013, and the results of their operations and their cash flows for each of the three years in the period ended December 31, 2014 in conformity with accounting principles generally accepted in the United States of America. In addition, in our opinion, the financial statement schedule appearing under Item 15 (a)(2) presents fairly, in all material respects, the information set forth therein when read in conjunction with the related consolidated financial statements. These financial statements and financial statement schedule are the responsibility of the Company's management. Our responsibility is to express an opinion on these financial statements and financial statement schedule based on our audits. We conducted our audits of these statements in accordance with the standards of the Public Company Accounting Oversight Board (United States). Those standards require that we plan and perform the audit to obtain reasonable assurance about whether the financial statements are free of material misstatement. An audit includes examining, on a test basis, evidence supporting the amounts and disclosures in the financial statements, assessing the accounting principles used and significant estimates made by management, and evaluating the overall financial statement presentation. We believe that our audits provide a reasonable basis for our opinion.
/s/ PricewaterhouseCoopers LLP
Los Angeles, California
February 24, 2015
38
(This page has been left blank intentionally.)
39
|
|
Edison International
|
||||||||||
|
|
|
||||||||||
|
Years ended December 31,
|
|||||||||||
|
(in millions, except per-share amounts)
|
2014
|
2013
|
2012
|
||||||||
|
Total operating revenue
|
$
|
13,413
|
|
$
|
12,581
|
|
$
|
11,862
|
|
||
|
Purchased power and fuel
|
5,593
|
|
4,891
|
|
4,139
|
|
|||||
|
Operation and maintenance
|
3,149
|
|
3,473
|
|
3,608
|
|
|||||
|
Depreciation, decommissioning and amortization
|
1,720
|
|
1,622
|
|
1,562
|
|
|||||
|
Property and other taxes
|
322
|
|
309
|
|
296
|
|
|||||
|
Impairment and other charges
|
157
|
|
571
|
|
(28
|
)
|
|||||
|
Total operating expenses
|
10,941
|
|
10,866
|
|
9,577
|
|
|||||
|
Operating income
|
2,472
|
|
1,715
|
|
2,285
|
|
|||||
|
Interest and other income
|
147
|
|
124
|
|
149
|
|
|||||
|
Interest expense
|
(560
|
)
|
(544
|
)
|
(521
|
)
|
|||||
|
Other expenses
|
(80
|
)
|
(74
|
)
|
(52
|
)
|
|||||
|
Income from continuing operations before income taxes
|
1,979
|
|
1,221
|
|
1,861
|
|
|||||
|
Income tax expense
|
443
|
|
242
|
|
267
|
|
|||||
|
Income from continuing operations
|
1,536
|
|
979
|
|
1,594
|
|
|||||
|
Income (loss) from discontinued operations, net of tax
|
185
|
|
36
|
|
(1,686
|
)
|
|||||
|
Net income (loss)
|
1,721
|
|
1,015
|
|
(92
|
)
|
|||||
|
Preferred and preference stock dividend requirements of utility
|
112
|
|
100
|
|
91
|
|
|||||
|
Other noncontrolling interests
|
(3
|
)
|
—
|
|
—
|
|
|||||
|
Net income (loss) attributable to Edison International common shareholders
|
$
|
1,612
|
|
$
|
915
|
|
$
|
(183
|
)
|
||
|
Amounts attributable to Edison International common shareholders:
|
|
|
|
||||||||
|
Income from continuing operations, net of tax
|
$
|
1,427
|
|
$
|
879
|
|
$
|
1,503
|
|
||
|
Income (loss) from discontinued operations, net of tax
|
185
|
|
36
|
|
(1,686
|
)
|
|||||
|
Net income (loss) attributable to Edison International common shareholders
|
$
|
1,612
|
|
$
|
915
|
|
$
|
(183
|
)
|
||
|
Basic earnings (loss) per common share attributable to Edison International common shareholders:
|
|
|
|
||||||||
|
Weighted-average shares of common stock outstanding
|
326
|
|
326
|
|
326
|
|
|||||
|
Continuing operations
|
$
|
4.38
|
|
$
|
2.70
|
|
$
|
4.61
|
|
||
|
Discontinued operations
|
0.57
|
|
0.11
|
|
(5.17
|
)
|
|||||
|
Total
|
$
|
4.95
|
|
$
|
2.81
|
|
$
|
(0.56
|
)
|
||
|
Diluted earnings (loss) per common share attributable to Edison International common shareholders:
|
|
|
|
||||||||
|
Weighted-average shares of common stock outstanding, including effect of dilutive securities
|
329
|
|
329
|
|
330
|
|
|||||
|
Continuing operations
|
$
|
4.33
|
|
$
|
2.67
|
|
$
|
4.55
|
|
||
|
Discontinued operations
|
0.56
|
|
0.11
|
|
(5.11
|
)
|
|||||
|
Total
|
$
|
4.89
|
|
$
|
2.78
|
|
$
|
(0.56
|
)
|
||
|
Dividends declared per common share
|
$
|
1.4825
|
|
$
|
1.3675
|
|
$
|
1.3125
|
|
||
The accompanying notes are an integral part of these consolidated financial statements.
40
|
Consolidated Statements of Comprehensive Income
|
Edison International
|
|||||||||||
|
Years ended December 31,
|
||||||||||||
|
(in millions)
|
2014
|
2013
|
2012
|
|||||||||
|
Net income (loss)
|
$
|
1,721
|
|
$
|
1,015
|
|
$
|
(92
|
)
|
|||
|
Other comprehensive income (loss), net of tax:
|
|
|
|
|||||||||
|
Pension and postretirement benefits other than pensions:
|
|
|
|
|||||||||
|
Net gain (loss) arising during the period plus amortization included in net income (loss)
|
(47
|
)
|
72
|
|
13
|
|
||||||
|
Prior service cost arising during the period plus amortization included in net loss
|
—
|
|
—
|
|
5
|
|
||||||
|
Unrealized gain (loss) on derivatives qualified as cash flow hedges:
|
|
|
|
|||||||||
|
Unrealized holding loss arising during the period
|
—
|
|
—
|
|
(21
|
)
|
||||||
|
Reclassification adjustments included in net loss
|
—
|
|
—
|
|
55
|
|
||||||
|
Other
|
2
|
|
2
|
|
—
|
|
||||||
|
Other comprehensive income (loss), net of tax
|
(45
|
)
|
74
|
|
52
|
|
||||||
|
Comprehensive income (loss)
|
1,676
|
|
1,089
|
|
(40
|
)
|
||||||
|
Less: Comprehensive income attributable to noncontrolling interests
|
109
|
|
100
|
|
91
|
|
||||||
|
Comprehensive income (loss) attributable to Edison International
|
$
|
1,567
|
|
$
|
989
|
|
$
|
(131
|
)
|
|||
The accompanying notes are an integral part of these consolidated financial statements.
41
|
|
Edison International
|
|||||||
|
December 31,
|
||||||||
|
(in millions)
|
2014
|
2013
|
||||||
|
ASSETS
|
|
|
||||||
|
Cash and cash equivalents
|
$
|
132
|
|
$
|
146
|
|
||
|
Receivables, less allowances of $68 and $66 for uncollectible accounts at respective dates
|
790
|
|
838
|
|
||||
|
Accrued unbilled revenue
|
632
|
|
596
|
|
||||
|
Inventory
|
281
|
|
256
|
|
||||
|
Derivative assets
|
102
|
|
122
|
|
||||
|
Regulatory assets
|
1,254
|
|
538
|
|
||||
|
Deferred income taxes
|
452
|
|
421
|
|
||||
|
Other current assets
|
376
|
|
395
|
|
||||
|
Total current assets
|
4,019
|
|
3,312
|
|
||||
|
Nuclear decommissioning trusts
|
4,799
|
|
4,494
|
|
||||
|
Other investments
|
207
|
|
207
|
|
||||
|
Total investments
|
5,006
|
|
4,701
|
|
||||
|
Utility property, plant and equipment, less accumulated depreciation and amortization of $8,132 and $7,493 at respective dates
|
32,859
|
|
30,379
|
|
||||
|
Nonutility property, plant and equipment, less accumulated depreciation of $76 and $74 at respective dates
|
122
|
|
76
|
|
||||
|
Total property, plant and equipment
|
32,981
|
|
30,455
|
|
||||
|
Derivative assets
|
219
|
|
251
|
|
||||
|
Regulatory assets
|
7,612
|
|
7,241
|
|
||||
|
Other long-term assets
|
349
|
|
686
|
|
||||
|
Total long-term assets
|
8,180
|
|
8,178
|
|
||||
|
Total assets
|
$
|
50,186
|
|
$
|
46,646
|
|
||
The accompanying notes are an integral part of these consolidated financial statements.
42
|
Consolidated Balance Sheets
|
Edison International
|
|||||||
|
|
|
|||||||
|
December 31,
|
||||||||
|
(in millions, except share amounts)
|
2014
|
2013
|
||||||
|
LIABILITIES AND EQUITY
|
|
|
||||||
|
Short-term debt
|
$
|
1,291
|
|
$
|
209
|
|
||
|
Current portion of long-term debt
|
504
|
|
601
|
|
||||
|
Accounts payable
|
1,580
|
|
1,407
|
|
||||
|
Accrued taxes
|
81
|
|
358
|
|
||||
|
Customer deposits
|
221
|
|
201
|
|
||||
|
Derivative liabilities
|
196
|
|
152
|
|
||||
|
Regulatory liabilities
|
401
|
|
767
|
|
||||
|
Other current liabilities
|
1,205
|
|
1,186
|
|
||||
|
Total current liabilities
|
5,479
|
|
4,881
|
|
||||
|
Long-term debt
|
10,234
|
|
9,825
|
|
||||
|
Deferred income taxes and credits
|
7,313
|
|
7,346
|
|
||||
|
Derivative liabilities
|
1,052
|
|
1,042
|
|
||||
|
Pensions and benefits
|
2,155
|
|
1,378
|
|
||||
|
Asset retirement obligations
|
2,821
|
|
3,418
|
|
||||
|
Regulatory liabilities
|
5,889
|
|
4,995
|
|
||||
|
Other deferred credits and other long-term liabilities
|
2,255
|
|
2,070
|
|
||||
|
Total deferred credits and other liabilities
|
21,485
|
|
20,249
|
|
||||
|
Total liabilities
|
37,198
|
|
34,955
|
|
||||
|
Commitments and contingencies (Note 11)
|
|
|
||||||
|
Redeemable noncontrolling interest
|
6
|
|
—
|
|
||||
|
Common stock, no par value (800,000,000 shares authorized; 325,811,206 shares issued and outstanding at respective dates)
|
2,445
|
|
2,403
|
|
||||
|
Accumulated other comprehensive loss
|
(58
|
)
|
(13
|
)
|
||||
|
Retained earnings
|
8,573
|
|
7,548
|
|
||||
|
Total Edison International's common shareholders' equity
|
10,960
|
|
9,938
|
|
||||
|
Noncontrolling interests - preferred and preference stock of utility
|
2,022
|
|
1,753
|
|
||||
|
Total equity
|
12,982
|
|
11,691
|
|
||||
|
Total liabilities and equity
|
$
|
50,186
|
|
$
|
46,646
|
|
||
The accompanying notes are an integral part of these consolidated financial statements.
43
|
|
Edison International
|
|||||||||||
|
Years ended December 31,
|
||||||||||||
|
(in millions)
|
2014
|
2013
|
2012
|
|||||||||
|
Cash flows from operating activities:
|
|
|
||||||||||
|
Net income (loss)
|
$
|
1,721
|
|
$
|
1,015
|
|
$
|
(92
|
)
|
|||
|
Less: Income (loss) from discontinued operations
|
185
|
|
36
|
|
(1,686
|
)
|
||||||
|
Income from continuing operations
|
1,536
|
|
979
|
|
1,594
|
|
||||||
|
Adjustments to reconcile to net cash provided by operating activities:
|
|
|||||||||||
|
Depreciation, decommissioning and amortization
|
1,815
|
|
1,696
|
|
1,634
|
|
||||||
|
Allowance for equity during construction
|
(65
|
)
|
(72
|
)
|
(96
|
)
|
||||||
|
Impairment and other charges
|
157
|
|
571
|
|
(28
|
)
|
||||||
|
Deferred income taxes and investment tax credits
|
522
|
|
345
|
|
141
|
|
||||||
|
Other
|
20
|
|
18
|
|
94
|
|
||||||
|
EME settlement payments
|
(225
|
)
|
—
|
|
—
|
|
||||||
|
Changes in operating assets and liabilities:
|
||||||||||||
|
Receivables
|
64
|
|
(56
|
)
|
(13
|
)
|
||||||
|
Inventory
|
(25
|
)
|
80
|
|
10
|
|
||||||
|
Accounts payable
|
14
|
|
45
|
|
14
|
|
||||||
|
Prepaid and accrued taxes
|
(100
|
)
|
(92
|
)
|
189
|
|
||||||
|
Other current assets and liabilities
|
(103
|
)
|
(155
|
)
|
114
|
|
||||||
|
Derivative assets and liabilities, net
|
(40
|
)
|
(30
|
)
|
262
|
|
||||||
|
Regulatory assets and liabilities, net
|
(358
|
)
|
(322
|
)
|
(314
|
)
|
||||||
|
Nuclear decommissioning trusts
|
39
|
|
76
|
|
192
|
|
||||||
|
Other noncurrent assets and liabilities
|
(3
|
)
|
(116
|
)
|
178
|
|
||||||
|
Operating cash flows from continuing operations
|
3,248
|
|
2,967
|
|
3,971
|
|
||||||
|
Operating cash flows from discontinued operations, net
|
—
|
|
—
|
|
(637
|
)
|
||||||
|
Net cash provided by operating activities
|
3,248
|
|
2,967
|
|
3,334
|
|
||||||
|
Cash flows from financing activities:
|
|
|
|
|||||||||
|
Long-term debt issued, net of discount and issuance costs of $6, $18 and $4 at respective periods
|
494
|
|
1,973
|
|
391
|
|
||||||
|
Long-term debt matured or repurchased
|
(607
|
)
|
(1,017
|
)
|
(6
|
)
|
||||||
|
Bonds remarketed, net
|
—
|
|
195
|
|
—
|
|
||||||
|
Preference stock issued, net
|
269
|
|
387
|
|
804
|
|
||||||
|
Preference stock redeemed
|
—
|
|
(400
|
)
|
(75
|
)
|
||||||
|
Short-term debt financing, net
|
1,079
|
|
32
|
|
(264
|
)
|
||||||
|
Cash contribution from redeemable noncontrolling interest
|
9
|
|
—
|
|
—
|
|
||||||
|
Dividends to noncontrolling interests
|
(111
|
)
|
(101
|
)
|
(82
|
)
|
||||||
|
Dividends paid
|
(463
|
)
|
(440
|
)
|
(424
|
)
|
||||||
|
Other
|
(25
|
)
|
(48
|
)
|
(68
|
)
|
||||||
|
Financing cash flows from continuing operations
|
645
|
|
581
|
|
276
|
|
||||||
|
Financing cash flows from discontinued operations, net
|
—
|
|
—
|
|
374
|
|
||||||
|
Net cash provided by financing activities
|
645
|
|
581
|
|
650
|
|
||||||
|
Cash flows from investing activities:
|
|
|
|
|||||||||
|
Capital expenditures
|
(3,906
|
)
|
(3,599
|
)
|
(4,149
|
)
|
||||||
|
Proceeds from sale of nuclear decommissioning trust investments
|
10,079
|
|
5,617
|
|
2,122
|
|
||||||
|
Purchases of nuclear decommissioning trust investments
|
(10,123
|
)
|
(5,715
|
)
|
(2,337
|
)
|
||||||
|
Proceeds from sale of assets
|
6
|
|
181
|
|
114
|
|
||||||
|
Other
|
37
|
|
(56
|
)
|
4
|
|
||||||
|
Investing cash flows from continuing operations
|
(3,907
|
)
|
(3,572
|
)
|
(4,246
|
)
|
||||||
|
Investing cash flows from discontinued operations, net
|
—
|
|
—
|
|
(1,037
|
)
|
||||||
|
Net cash used by investing activities
|
(3,907
|
)
|
(3,572
|
)
|
(5,283
|
)
|
||||||
|
Net decrease in cash and cash equivalents
|
(14
|
)
|
(24
|
)
|
(1,299
|
)
|
||||||
|
Cash and cash equivalents at beginning of year
|
146
|
|
170
|
|
1,469
|
|
||||||
|
Cash and cash equivalents at end of year
|
$
|
132
|
|
$
|
146
|
|
$
|
170
|
|
|||
The accompanying notes are an integral part of these consolidated financial statements.
44
|
Consolidated Statements of Changes in Equity
|
Edison International
|
||||||||||||||||||||||||||
|
|
Equity Attributable to Common Shareholders
|
Noncontrolling Interests
|
|
||||||||||||||||||||||||
|
(in millions)
|
Common
Stock |
Accumulated
Other Comprehensive Income (Loss) |
Retained
Earnings |
Subtotal
|
Other
|
Preferred
and Preference Stock |
Total
Equity |
||||||||||||||||||||
|
Balance at December 31, 2011
|
$
|
2,360
|
|
$
|
(139
|
)
|
$
|
7,834
|
|
$
|
10,055
|
|
$
|
2
|
|
$
|
1,029
|
|
$
|
11,086
|
|
||||||
|
Net income (loss)
|
—
|
|
—
|
|
(183
|
)
|
(183
|
)
|
—
|
|
91
|
|
(92
|
)
|
|||||||||||||
|
Other comprehensive income
|
—
|
|
52
|
|
—
|
|
52
|
|
—
|
|
—
|
|
52
|
|
|||||||||||||
|
Transfer of assets to Capistrano Wind Partners
|
(21
|
)
|
—
|
|
—
|
|
(21
|
)
|
—
|
|
—
|
|
(21
|
)
|
|||||||||||||
|
Common stock dividends declared ($1.3125 per share)
|
—
|
|
—
|
|
(428
|
)
|
(428
|
)
|
—
|
|
—
|
|
(428
|
)
|
|||||||||||||
|
Dividends, distributions to noncontrolling interests and other
|
—
|
|
—
|
|
—
|
|
—
|
|
(2
|
)
|
(91
|
)
|
(93
|
)
|
|||||||||||||
|
Stock-based compensation and other
|
(3
|
)
|
—
|
|
(77
|
)
|
(80
|
)
|
—
|
|
—
|
|
(80
|
)
|
|||||||||||||
|
Noncash stock-based compensation and other
|
37
|
|
—
|
|
1
|
|
38
|
|
—
|
|
—
|
|
38
|
|
|||||||||||||
|
Issuance of preference stock
|
—
|
|
—
|
|
—
|
|
—
|
|
—
|
|
804
|
|
804
|
|
|||||||||||||
|
Redemption of preference stock
|
—
|
|
—
|
|
(1
|
)
|
(1
|
)
|
—
|
|
(74
|
)
|
(75
|
)
|
|||||||||||||
|
Balance at December 31, 2012
|
$
|
2,373
|
|
$
|
(87
|
)
|
$
|
7,146
|
|
$
|
9,432
|
|
$
|
—
|
|
$
|
1,759
|
|
$
|
11,191
|
|
||||||
|
Net income
|
—
|
|
—
|
|
915
|
|
915
|
|
—
|
|
100
|
|
1,015
|
|
|||||||||||||
|
Other comprehensive income
|
—
|
|
74
|
|
—
|
|
74
|
|
—
|
|
—
|
|
74
|
|
|||||||||||||
|
Common stock dividends declared ($1.3675 per share)
|
—
|
|
—
|
|
(446
|
)
|
(446
|
)
|
—
|
|
—
|
|
(446
|
)
|
|||||||||||||
|
Dividends and distributions to noncontrolling interests
|
—
|
|
—
|
|
—
|
|
—
|
|
—
|
|
(100
|
)
|
(100
|
)
|
|||||||||||||
|
Stock-based compensation and other
|
5
|
|
—
|
|
(53
|
)
|
(48
|
)
|
—
|
|
—
|
|
(48
|
)
|
|||||||||||||
|
Noncash stock-based compensation and other
|
25
|
|
—
|
|
(6
|
)
|
19
|
|
—
|
|
(1
|
)
|
18
|
|
|||||||||||||
|
Issuance of preference stock
|
—
|
|
—
|
|
—
|
|
—
|
|
—
|
|
387
|
|
387
|
|
|||||||||||||
|
Redemption of preference stock
|
—
|
|
—
|
|
(8
|
)
|
(8
|
)
|
—
|
|
(392
|
)
|
(400
|
)
|
|||||||||||||
|
Balance at December 31, 2013
|
$
|
2,403
|
|
$
|
(13
|
)
|
$
|
7,548
|
|
$
|
9,938
|
|
$
|
—
|
|
$
|
1,753
|
|
$
|
11,691
|
|
||||||
|
Net income
|
—
|
|
—
|
|
1,612
|
|
1,612
|
|
—
|
|
112
|
|
1,724
|
|
|||||||||||||
|
Other comprehensive loss
|
—
|
|
(45
|
)
|
—
|
|
(45
|
)
|
—
|
|
—
|
|
(45
|
)
|
|||||||||||||
|
Common stock dividends declared ($1.4825 per share)
|
—
|
|
—
|
|
(483
|
)
|
(483
|
)
|
—
|
|
—
|
|
(483
|
)
|
|||||||||||||
|
Dividends to noncontrolling interests and other
|
—
|
|
—
|
|
—
|
|
—
|
|
—
|
|
(112
|
)
|
(112
|
)
|
|||||||||||||
|
Stock-based compensation and other
|
15
|
|
—
|
|
(104
|
)
|
(89
|
)
|
—
|
|
—
|
|
(89
|
)
|
|||||||||||||
|
Noncash stock-based compensation and other
|
27
|
|
—
|
|
—
|
|
27
|
|
—
|
|
—
|
|
27
|
|
|||||||||||||
|
Issuance of preference stock
|
—
|
|
—
|
|
—
|
|
—
|
|
—
|
|
269
|
|
269
|
|
|||||||||||||
|
Balance at December 31, 2014
|
$
|
2,445
|
|
$
|
(58
|
)
|
$
|
8,573
|
|
$
|
10,960
|
|
$
|
—
|
|
$
|
2,022
|
|
$
|
12,982
|
|
||||||
The accompanying notes are an integral part of these consolidated financial statements.
45
(This page has been left blank intentionally.)
46
|
Consolidated Statements of Income
|
Southern California Edison Company
|
|
|
Years ended December 31,
|
|||||||||||
|
(in millions)
|
2014
|
2013
|
2012
|
|||||||||
|
Operating revenue
|
$
|
13,380
|
|
$
|
12,562
|
|
$
|
11,851
|
|
|||
|
Purchased power and fuel
|
5,593
|
|
4,891
|
|
4,139
|
|
||||||
|
Operation and maintenance
|
3,057
|
|
3,416
|
|
3,544
|
|
||||||
|
Depreciation, decommissioning and amortization
|
1,720
|
|
1,622
|
|
1,562
|
|
||||||
|
Property and other taxes
|
318
|
|
307
|
|
295
|
|
||||||
|
Impairment and other charges
|
163
|
|
575
|
|
32
|
|
||||||
|
Total operating expenses
|
10,851
|
|
10,811
|
|
9,572
|
|
||||||
|
Operating income
|
2,529
|
|
1,751
|
|
2,279
|
|
||||||
|
Interest and other income
|
122
|
|
122
|
|
144
|
|
||||||
|
Interest expense
|
(533
|
)
|
(520
|
)
|
(499
|
)
|
||||||
|
Other expenses
|
(79
|
)
|
(74
|
)
|
(50
|
)
|
||||||
|
Income before income taxes
|
2,039
|
|
1,279
|
|
1,874
|
|
||||||
|
Income tax expense
|
474
|
|
279
|
|
214
|
|
||||||
|
Net income
|
1,565
|
|
1,000
|
|
1,660
|
|
||||||
|
Less: Preferred and preference stock dividend requirements
|
112
|
|
100
|
|
91
|
|
||||||
|
Net income available for common stock
|
$
|
1,453
|
|
$
|
900
|
|
$
|
1,569
|
|
|||
|
Consolidated Statements of Comprehensive Income
|
||||||||||||
|
|
Years ended December 31,
|
|||||||||||
|
(in millions)
|
2014
|
2013
|
2012
|
|||||||||
|
Net income
|
$
|
1,565
|
|
$
|
1,000
|
|
$
|
1,660
|
|
|||
|
Other comprehensive income (loss), net of tax:
|
|
|
|
|||||||||
|
Pension and postretirement benefits other than pensions:
|
|
|
|
|||||||||
|
Net gain (loss) arising during period plus amortization included in net income
|
(19
|
)
|
16
|
|
(5
|
)
|
||||||
|
Other
|
2
|
|
2
|
|
—
|
|
||||||
|
Other comprehensive income (loss), net of tax
|
(17
|
)
|
18
|
|
(5
|
)
|
||||||
|
Comprehensive income
|
$
|
1,548
|
|
$
|
1,018
|
|
$
|
1,655
|
|
|||
The accompanying notes are an integral part of these consolidated financial statements.
47
|
Consolidated Balance Sheets
|
Southern California Edison Company
|
|
December 31,
|
||||||||
|
(in millions)
|
2014
|
2013
|
||||||
|
ASSETS
|
|
|
||||||
|
Cash and cash equivalents
|
$
|
38
|
|
$
|
54
|
|
||
|
Receivables, less allowances of $68 and $66 for uncollectible accounts at respective dates
|
749
|
|
813
|
|
||||
|
Accrued unbilled revenue
|
632
|
|
596
|
|
||||
|
Inventory
|
275
|
|
256
|
|
||||
|
Derivative assets
|
102
|
|
122
|
|
||||
|
Regulatory assets
|
1,254
|
|
538
|
|
||||
|
Deferred income taxes
|
—
|
|
303
|
|
||||
|
Other current assets
|
390
|
|
393
|
|
||||
|
Total current assets
|
3,440
|
|
3,075
|
|
||||
|
Nuclear decommissioning trusts
|
4,799
|
|
4,494
|
|
||||
|
Other investments
|
158
|
|
140
|
|
||||
|
Total investments
|
4,957
|
|
4,634
|
|
||||
|
Utility property, plant and equipment, less accumulated depreciation and amortization of $8,132 and $7,493 at respective dates
|
32,859
|
|
30,379
|
|
||||
|
Nonutility property, plant and equipment, less accumulated depreciation of $75 and $70 at respective dates
|
69
|
|
72
|
|
||||
|
Total property, plant and equipment
|
32,928
|
|
30,451
|
|
||||
|
Derivative assets
|
219
|
|
251
|
|
||||
|
Regulatory assets
|
7,612
|
|
7,241
|
|
||||
|
Other long-term assets
|
300
|
|
398
|
|
||||
|
Total long-term assets
|
8,131
|
|
7,890
|
|
||||
|
Total assets
|
$
|
49,456
|
|
$
|
46,050
|
|
||
The accompanying notes are an integral part of these consolidated financial statements.
48
|
Consolidated Balance Sheets
|
Southern California Edison Company
|
|
December 31,
|
||||||||
|
(in millions, except share amounts)
|
2014
|
2013
|
||||||
|
LIABILITIES AND EQUITY
|
|
|
||||||
|
Short-term debt
|
$
|
667
|
|
$
|
175
|
|
||
|
Current portion of long-term debt
|
300
|
|
600
|
|
||||
|
Accounts payable
|
1,556
|
|
1,373
|
|
||||
|
Accrued taxes
|
87
|
|
57
|
|
||||
|
Customer deposits
|
221
|
|
201
|
|
||||
|
Derivative liabilities
|
196
|
|
152
|
|
||||
|
Regulatory liabilities
|
401
|
|
767
|
|
||||
|
Deferred income taxes
|
209
|
|
39
|
|
||||
|
Other current liabilities
|
1,183
|
|
1,034
|
|
||||
|
Total current liabilities
|
4,820
|
|
4,398
|
|
||||
|
Long-term debt
|
9,624
|
|
9,422
|
|
||||
|
Deferred income taxes and credits
|
8,288
|
|
7,841
|
|
||||
|
Derivative liabilities
|
1,052
|
|
1,042
|
|
||||
|
Pensions and benefits
|
1,672
|
|
951
|
|
||||
|
Asset retirement obligations
|
2,819
|
|
3,418
|
|
||||
|
Regulatory liabilities
|
5,889
|
|
4,995
|
|
||||
|
Other deferred credits and other long-term liabilities
|
2,010
|
|
1,845
|
|
||||
|
Total deferred credits and other liabilities
|
21,730
|
|
20,092
|
|
||||
|
Total liabilities
|
36,174
|
|
33,912
|
|
||||
|
Commitments and contingencies (Note 11)
|
|
|
|
|
||||
|
Common stock, no par value (560,000,000 shares authorized; 434,888,104 shares issued and outstanding at each date)
|
2,168
|
|
2,168
|
|
||||
|
Additional paid-in capital
|
618
|
|
592
|
|
||||
|
Accumulated other comprehensive loss
|
(28
|
)
|
(11
|
)
|
||||
|
Retained earnings
|
8,454
|
|
7,594
|
|
||||
|
Total common shareholder's equity
|
11,212
|
|
10,343
|
|
||||
|
Preferred and preference stock
|
2,070
|
|
1,795
|
|
||||
|
Total equity
|
13,282
|
|
12,138
|
|
||||
|
Total liabilities and equity
|
$
|
49,456
|
|
$
|
46,050
|
|
||
The accompanying notes are an integral part of these consolidated financial statements.
49
|
Consolidated Statements of Cash Flows
|
Southern California Edison Company
|
|||||||||||
|
|
|
Years ended December 31,
|
||||||||||
|
(in millions)
|
|
2014
|
|
2013
|
|
2012
|
||||||
|
Cash flows from operating activities:
|
|
|
|
|
|
|
||||||
|
Net income
|
|
$
|
1,565
|
|
|
$
|
1,000
|
|
|
$
|
1,660
|
|
|
Adjustments to reconcile to net cash provided by operating activities:
|
|
|
|
|
|
|
||||||
|
Depreciation, decommissioning and amortization
|
|
1,810
|
|
|
1,694
|
|
|
1,633
|
|
|||
|
Allowance for equity during construction
|
|
(65
|
)
|
|
(72
|
)
|
|
(96
|
)
|
|||
|
Impairment and other charges
|
|
163
|
|
|
575
|
|
|
32
|
|
|||
|
Deferred income taxes and investment tax credits
|
|
462
|
|
|
420
|
|
|
256
|
|
|||
|
Other
|
|
11
|
|
|
14
|
|
|
86
|
|
|||
|
Changes in operating assets and liabilities:
|
|
|
|
|
|
|
||||||
|
Receivables
|
|
64
|
|
|
(57
|
)
|
|
(23
|
)
|
|||
|
Inventory
|
|
(19
|
)
|
|
80
|
|
|
10
|
|
|||
|
Accounts payable
|
|
12
|
|
|
59
|
|
|
(9
|
)
|
|||
|
Prepaid and accrued taxes
|
|
129
|
|
|
(93
|
)
|
|
254
|
|
|||
|
Other current assets and liabilities
|
|
(107
|
)
|
|
(171
|
)
|
|
114
|
|
|||
|
Derivative assets and liabilities, net
|
|
(40
|
)
|
|
(30
|
)
|
|
(86
|
)
|
|||
|
Regulatory assets and liabilities, net
|
|
(358
|
)
|
|
(322
|
)
|
|
34
|
|
|||
|
Nuclear decommissioning trusts
|
|
39
|
|
|
76
|
|
|
192
|
|
|||
|
Other noncurrent assets and liabilities
|
|
(6
|
)
|
|
(125
|
)
|
|
29
|
|
|||
|
Net cash provided by operating activities
|
|
3,660
|
|
|
3,048
|
|
|
4,086
|
|
|||
|
Cash flows from financing activities:
|
|
|
|
|
|
|
||||||
|
Long-term debt issued, net of discount and issuance costs of $2, $18 and $4, at respective dates
|
|
498
|
|
|
1,973
|
|
|
391
|
|
|||
|
Long-term debt matured or repurchased
|
|
(607
|
)
|
|
(1,016
|
)
|
|
(6
|
)
|
|||
|
Bonds remarketed, net
|
|
—
|
|
|
195
|
|
|
—
|
|
|||
|
Preferred stock issued, net
|
|
269
|
|
|
387
|
|
|
804
|
|
|||
|
Preference stock redeemed
|
|
—
|
|
|
(400
|
)
|
|
(75
|
)
|
|||
|
Short-term debt financing, net
|
|
490
|
|
|
(1
|
)
|
|
(250
|
)
|
|||
|
Dividends paid
|
|
(489
|
)
|
|
(587
|
)
|
|
(551
|
)
|
|||
|
Other
|
20
|
|
(43
|
)
|
(57
|
)
|
||||||
|
Net cash provided by financing activities
|
|
181
|
|
|
508
|
|
|
256
|
|
|||
|
Cash flows from investing activities:
|
|
|
|
|
|
|
||||||
|
Capital expenditures
|
|
(3,857
|
)
|
|
(3,598
|
)
|
|
(4,149
|
)
|
|||
|
Proceeds from sale of nuclear decommissioning trust investments
|
|
10,079
|
|
|
5,617
|
|
|
2,122
|
|
|||
|
Purchases of nuclear decommissioning trust investments
|
|
(10,123
|
)
|
|
(5,715
|
)
|
|
(2,337
|
)
|
|||
|
Proceeds from sale of assets
|
|
4
|
|
|
181
|
|
|
—
|
|
|||
|
Other
|
|
40
|
|
|
(32
|
)
|
|
10
|
|
|||
|
Net cash used by investing activities
|
|
(3,857
|
)
|
|
(3,547
|
)
|
|
(4,354
|
)
|
|||
|
Net (decrease) increase in cash and cash equivalents
|
|
(16
|
)
|
|
9
|
|
|
(12
|
)
|
|||
|
Cash and cash equivalents, beginning of year
|
|
54
|
|
|
45
|
|
|
57
|
|
|||
|
Cash and cash equivalents, end of year
|
|
$
|
38
|
|
|
$
|
54
|
|
|
$
|
45
|
|
The accompanying notes are an integral part of these consolidated financial statements.
50
|
Consolidated Statements of Changes in Equity
|
Southern California Edison Company
|
|
|
Equity Attributable to Edison International
|
|
|
||||||||||||||||||||
|
(in millions)
|
Common
Stock |
Additional
Paid-in Capital |
Accumulated
Other Comprehensive Income (Loss) |
Retained
Earnings |
Preferred
and Preference Stock |
Total
Equity |
|||||||||||||||||
|
Balance at December 31, 2011
|
$
|
2,168
|
|
$
|
596
|
|
$
|
(24
|
)
|
$
|
6,173
|
|
$
|
1,045
|
|
$
|
9,958
|
|
|||||
|
Net income
|
—
|
|
—
|
|
—
|
|
1,660
|
|
—
|
|
1,660
|
|
|||||||||||
|
Other comprehensive loss
|
—
|
|
—
|
|
(5
|
)
|
—
|
|
—
|
|
(5
|
)
|
|||||||||||
|
Dividends declared on common stock
|
—
|
|
—
|
|
—
|
|
(469
|
)
|
—
|
|
(469
|
)
|
|||||||||||
|
Dividends declared on preferred and preference stock
|
—
|
|
—
|
|
—
|
|
(91
|
)
|
—
|
|
(91
|
)
|
|||||||||||
|
Stock-based compensation
|
—
|
|
(13
|
)
|
—
|
|
(44
|
)
|
—
|
|
(57
|
)
|
|||||||||||
|
Noncash stock-based compensation
|
—
|
|
18
|
|
—
|
|
—
|
|
—
|
|
18
|
|
|||||||||||
|
Issuance of preference stock
|
—
|
|
(21
|
)
|
—
|
|
—
|
|
825
|
|
804
|
|
|||||||||||
|
Redemption of preference stock
|
—
|
|
1
|
|
—
|
|
(1
|
)
|
(75
|
)
|
(75
|
)
|
|||||||||||
|
Balance at December 31, 2012
|
$
|
2,168
|
|
$
|
581
|
|
$
|
(29
|
)
|
$
|
7,228
|
|
$
|
1,795
|
|
$
|
11,743
|
|
|||||
|
Net income
|
—
|
|
—
|
|
—
|
|
1,000
|
|
—
|
|
1,000
|
|
|||||||||||
|
Other comprehensive income
|
—
|
|
—
|
|
18
|
|
—
|
|
—
|
|
18
|
|
|||||||||||
|
Dividends declared on common stock
|
—
|
|
—
|
|
—
|
|
(486
|
)
|
—
|
|
(486
|
)
|
|||||||||||
|
Dividends declared on preferred and preference stock
|
—
|
|
—
|
|
—
|
|
(100
|
)
|
—
|
|
(100
|
)
|
|||||||||||
|
Stock-based compensation
|
—
|
|
1
|
|
—
|
|
(44
|
)
|
—
|
|
(43
|
)
|
|||||||||||
|
Noncash stock-based compensation
|
—
|
|
15
|
|
—
|
|
4
|
|
—
|
|
19
|
|
|||||||||||
|
Issuance of preference stock
|
—
|
|
(13
|
)
|
—
|
|
—
|
|
400
|
|
387
|
|
|||||||||||
|
Redemption of preference stock
|
—
|
|
8
|
|
—
|
|
(8
|
)
|
(400
|
)
|
(400
|
)
|
|||||||||||
|
Balance at December 31, 2013
|
$
|
2,168
|
|
$
|
592
|
|
$
|
(11
|
)
|
$
|
7,594
|
|
$
|
1,795
|
|
$
|
12,138
|
|
|||||
|
Net income
|
—
|
|
—
|
|
—
|
|
1,565
|
|
—
|
|
1,565
|
|
|||||||||||
|
Other comprehensive loss
|
—
|
|
—
|
|
(17
|
)
|
—
|
|
—
|
|
(17
|
)
|
|||||||||||
|
Dividends declared on common stock
|
—
|
|
—
|
|
—
|
|
(525
|
)
|
—
|
|
(525
|
)
|
|||||||||||
|
Dividends declared on preferred and preference stock
|
—
|
|
—
|
|
—
|
|
(112
|
)
|
—
|
|
(112
|
)
|
|||||||||||
|
Stock-based compensation
|
—
|
|
20
|
|
—
|
|
(64
|
)
|
—
|
|
(44
|
)
|
|||||||||||
|
Noncash stock-based compensation
|
—
|
|
12
|
|
—
|
|
(4
|
)
|
—
|
|
8
|
|
|||||||||||
|
Issuance of preference stock
|
—
|
|
(6
|
)
|
—
|
|
—
|
|
275
|
|
269
|
|
|||||||||||
|
Balance at December 31, 2014
|
$
|
2,168
|
|
$
|
618
|
|
$
|
(28
|
)
|
$
|
8,454
|
|
$
|
2,070
|
|
$
|
13,282
|
|
|||||
The accompanying notes are an integral part of these consolidated financial statements.
51
NOTES TO CONSOLIDATED FINANCIAL STATEMENTS
Organization and Basis of Presentation
Edison International is the parent holding company of Southern California Edison Company ("SCE"). SCE is an investor-owned public utility primarily engaged in the business of supplying and delivering electricity to an approximately
50,000
square mile area of southern California. Edison International is also the parent company of subsidiaries that are engaged in competitive businesses related to the delivery or use of electricity (the "Competitive Businesses"). Such competitive business activities are currently not material to report as a separate business segment. These combined notes to the consolidated financial statements apply to both Edison International and SCE unless otherwise described. Edison International's consolidated financial statements include the accounts of Edison International, SCE and other wholly owned and controlled subsidiaries. References to Edison International refer to the consolidated group of Edison International and its subsidiaries. References to Edison International Parent and Other refer to Edison International Parent and its nonutility subsidiaries. SCE's consolidated financial statements include the accounts of SCE and its wholly owned and controlled subsidiaries. All intercompany transactions have been eliminated from the consolidated financial statements.
Edison International's and SCE's accounting policies conform to accounting principles generally accepted in the United States of America, including the accounting principles for rate-regulated enterprises, which reflect the ratemaking policies of the California Public Utility Commission ("CPUC") and the Federal Energy Regulatory Commission ("FERC"). SCE applies authoritative guidance for rate-regulated enterprises to the portion of its operations in which regulators set rates at levels intended to recover the estimated costs of providing service, plus a return on net investments in assets, or rate base. Regulators may also impose certain penalties or grant certain incentives. Due to timing and other differences in the collection of electric utility revenue, these principles require an incurred cost that would otherwise be charged to expense by a nonregulated entity to be capitalized as a regulatory asset if it is probable that the cost is recoverable through future rates; and conversely the principles require recording of a regulatory liability for amounts collected in rates to recover costs expected to be incurred in the future or amounts collected in excess of costs incurred and refundable to customers. SCE assesses, at the end of each reporting period, whether regulatory assets are probable of future recovery. See Note 10 for composition of regulatory assets and liabilities.
The preparation of financial statements in conformity with United States generally accepted accounting principles ("GAAP") requires management to make estimates and assumptions that affect the reported amounts of assets and liabilities and disclosure of contingent assets and liabilities at the date of the financial statements and the reported amounts of revenue and expenses during the reported period. Actual results could differ from those estimates.
Revision in Consolidated Statements of Cash Flows
The consolidated statements of cash flows of Edison International and SCE were revised to correct an error in the amount of purchases of nuclear decommissioning trust investments in the investing activities section of the consolidated statements of cash flows and in the amount attributable to the nuclear decommissioning trust in the operating activities section of the consolidated statements of cash flows. The revisions had no impact on the consolidated balance sheet, statements of income, comprehensive income, changes in equity or on the net change in cash and cash equivalents. Management believes the revisions do not have a material impact on the prior period financial statements. The following table presents the changes to the line items of the consolidated cash flow statements for the revision for the year ended December 31, 2013:
|
Edison International
|
SCE
|
||||||||||||||||||||||
|
(in millions)
|
As Reported
|
Adjustment
|
As Revised
|
As Reported
|
Adjustment
|
As Revised
|
|||||||||||||||||
|
Nuclear decommissioning trusts
|
$
|
312
|
|
$
|
(236
|
)
|
$
|
76
|
|
$
|
312
|
|
$
|
(236
|
)
|
$
|
76
|
|
|||||
|
Total cash provided by operating activities
|
3,203
|
|
(236
|
)
|
2,967
|
|
3,284
|
|
(236
|
)
|
3,048
|
|
|||||||||||
|
Purchases of nuclear decommissioning trust investments
|
(5,951
|
)
|
236
|
|
(5,715
|
)
|
(5,951
|
)
|
236
|
|
(5,715
|
)
|
|||||||||||
|
Total cash used by investing activities
|
(3,808
|
)
|
236
|
|
(3,572
|
)
|
(3,783
|
)
|
236
|
|
(3,547
|
)
|
|||||||||||
There were also errors identified which had an inconsequential impact on the year ended December 31, 2012, and accordingly, revision of this year was not necessary.
52
Cash Equivalents
Cash equivalents included investments in money market funds. Generally, the carrying value of cash equivalents equals the fair value, as these investments have original maturities of
3
months or less. The cash equivalents were as follows:
|
Edison International
|
SCE
|
||||||||||||||
|
December 31,
|
|||||||||||||||
|
(in millions)
|
2014
|
2013
|
2014
|
2013
|
|||||||||||
|
Money market funds
|
$
|
35
|
|
$
|
68
|
|
$
|
5
|
|
$
|
8
|
|
|||
Cash is temporarily invested until required for check clearing. Checks issued, but not yet paid by the financial institution, are reclassified from cash to accounts payable at the end of each reporting period as follows:
|
Edison International
|
SCE
|
||||||||||||||
|
December 31,
|
|||||||||||||||
|
(in millions)
|
2014
|
2013
|
2014
|
2013
|
|||||||||||
|
Book balances reclassified to accounts payable
|
$
|
180
|
|
$
|
168
|
|
$
|
177
|
|
$
|
163
|
|
|||
Allowance for Uncollectible Accounts
Allowances for uncollectible accounts are provided based upon a variety of factors, including historical amounts written-off, current economic conditions and assessment of customer collectability.
Inventory
Inventory is primarily composed of materials, supplies and spare parts, and stated at the lower of cost or market, cost being determined by the average cost method.
Energy Credits and Allowances
Renewable energy certificates or credits ("RECs") represent rights established by governmental agencies for the environmental, social, and other nonpower qualities of renewable electricity generation. A REC, and its associated attributes and benefits, can be sold separately from the underlying physical electricity associated with a renewable-based generation source in certain markets, including California. Retail sellers of electricity obtain RECs through renewable power purchase agreements, internal generation or separate purchases in the market to comply with renewables portfolio standards established by certain such governmental agencies. RECs are the mechanism used to verify renewables portfolio standard compliance and are recognized at the lower of weighted-average cost or market when amounts purchased are in excess of the amounts needed to comply with RPS requirements. The cost of purchased RECs is recoverable as part of the cost of purchased power.
SCE is allocated greenhouse gas ("GHG") allowances annually which it is then required to sell into quarterly auctions. GHG proceeds from the auctions are recorded as a regulatory liability to be refunded to customers. SCE purchases GHG allowances in quarterly auctions or from bilateral parties to satisfy its GHG emission compliance obligations and recovers such costs of GHG allowances from customers. GHG allowances held for use are classified as "Other current assets" on the consolidated balance sheets and are stated, similar to an inventory method, at the lower of weighted-average cost or market. SCE had GHG allowances of
$204 million
and
$135 million
at
December 31, 2014
and
2013
, respectively. GHG emission obligations were
$211 million
and
$128 million
at
December 31, 2014
and
2013
, respectively and are classified as "Other current liabilities" on the consolidated balance sheets.
Property, Plant and Equipment
Plant additions, including replacements and betterments, are capitalized. SCE capitalizes as part of plant additions direct material and labor and indirect costs such as construction overhead, administrative and general costs, pension and benefits, and property taxes. The CPUC authorizes a rate for each of the indirect costs which are allocated to each project based on either labor or total costs.
53
Estimated useful lives (authorized by the CPUC) and weighted-average useful lives of SCE's property, plant and equipment, are as follows:
|
|
Estimated Useful Lives
|
Weighted-Average
Useful Lives
|
|
Generation plant
|
10 years to 60 years
|
38 years
|
|
Distribution plant
|
20 years to 60 years
|
40 years
|
|
Transmission plant
|
40 years to 65 years
|
48 years
|
|
General plant and other
|
5 years to 60 years
|
22 years
|
Depreciation of utility property, plant and equipment is computed on a straight-line, remaining-life basis. Depreciation expense was
$1.33 billion
,
$1.31 billion
and
$1.26 billion
for
2014
,
2013
and
2012
, respectively. Depreciation expense stated as a percent of average original cost of depreciable utility plant was, on a composite basis,
4.0%
,
4.2%
and
4.3%
for
2014
,
2013
and
2012
, respectively. Replaced or retired property costs are charged to the accumulated depreciation.
Nuclear fuel for the Palo Verde Nuclear Power Plant is recorded as utility plant (nuclear fuel in the fabrication and installation phase is recorded as construction in progress) in accordance with CPUC ratemaking procedures. Nuclear fuel is amortized using the units of production method.
AFUDC represents the estimated cost of debt and equity funds that finance utility-plant construction and is capitalized during certain plant construction. AFUDC is recovered in rates through depreciation expense over the useful life of the related asset. AFUDC equity represents a method to compensate SCE for the estimated cost of equity used to finance utility plant additions and is recorded as part of construction in progress. AFUDC equity was
$65 million
,
$72 million
and
$96 million
in
2014
,
2013
and
2012
, respectively. AFUDC debt was
$25 million
,
$33 million
and
$40 million
in
2014
,
2013
and
2012
, respectively.
Major Maintenance
Major maintenance costs for SCE's power plant facilities and equipment are expensed as incurred.
Impairment of Long-Lived Assets
Impairments of long-lived assets are evaluated based on a review of estimated future cash flows expected to be generated whenever events or changes in circumstances indicate that the carrying amount of such investments or assets may not be recoverable. If the carrying amount of a long-lived asset exceeds expected future cash flows, undiscounted and without interest charges, an impairment loss is recognized in the amount of the excess of fair value over the carrying amount. Fair value is determined via market, cost and income based valuation techniques, as appropriate. SCE's impaired assets are recorded as a regulatory asset if it is deemed probable that such amounts will be recovered from customers.
Due to the decision to early retire San Onofre Units 2 and 3, GAAP required reclassification of the amounts recorded in property, plant and equipment and related tangible operating assets to a regulatory asset to the extent that management concluded it was probable of recovery through future rates. Regulatory assets may also be recorded to the extent management concludes it is probable that direct and indirect costs incurred to retire Units 2 and 3 as of each reporting date are recoverable through future rates. In accordance with these requirements and as a result of its decision to retire San Onofre Units 2 and 3, SCE reclassified
$1,521 million
of its total investment in San Onofre at May 31, 2013 to a regulatory asset ("San Onofre Regulatory Asset") and recorded an impairment charge of
$575 million
(
$365 million
after-tax) in the second quarter of 2013.
In March 2014, SCE entered into a settlement agreement with The Utility Reform Network ("TURN"), the CPUC's Office of Ratepayer Advocates ("ORA"), SDG&E, the Coalition of California Utility Employees, and Friends of the Earth (together, the "Settling Parties"). In September 2014, SCE and the Settling Parties entered into an Amended and Restated Settlement Agreement (the "San Onofre OII Settlement Agreement") which was approved by the CPUC on November 20, 2014. As a result of these developments, SCE recorded an additional pre-tax charge of approximately
$163 million
(approximately
$72 million
after-tax) during 2014. See Note 11 for further information on contingencies.
54
Nuclear Decommissioning and Asset Retirement Obligations
The fair value of a liability for an asset retirement obligation ("ARO") is recorded in the period in which it is incurred, including a liability for the fair value of a conditional ARO, if the fair value can be reasonably estimated even though uncertainty exists about the timing and/or method of settlement. When an ARO liability is initially recorded, SCE capitalizes the cost by increasing the carrying amount of the related long-lived asset. For each subsequent period, the liability is increased for accretion expense and the capitalized cost is depreciated over the useful life of the related asset.
AROs related to decommissioning of SCE's nuclear power facilities are based on site-specific studies conducted as part of each Nuclear Decommissioning Cost Triennial Proceeding ("NDCTP") conducted before the CPUC. Revisions of an ARO are established for updated site-specific decommissioning cost estimates. SCE adjusts its nuclear decommissioning obligation into a nuclear-related ARO regulatory asset and also records an ARO regulatory liability as a result of timing differences between the recognition of costs and the recovery of costs through the ratemaking process. For further discussion, see Notes 9 and 10.
The following table summarizes the changes in SCE's ARO liability, including San Onofre and Palo Verde:
|
December 31,
|
|||||||
|
(in millions)
|
2014
|
2013
|
|||||
|
Beginning balance
|
$
|
3,418
|
|
$
|
2,782
|
|
|
|
Accretion
1
|
192
|
|
182
|
|
|||
|
Revisions
|
(790
|
)
|
455
|
|
|||
|
Liabilities settled
|
(1
|
)
|
(1
|
)
|
|||
|
Ending balance
|
$
|
2,819
|
|
$
|
3,418
|
|
|
|
1
|
An ARO represents the present value of a future obligation. Accretion is an increase in the liability to account for the time value of money resulting from discounting.
|
Decommissioning costs, which are recovered through non-bypassable customer rates over the term of each nuclear facility's operating license, are recorded as a component of depreciation expense, with a corresponding credit to the ARO regulatory liability. Amortization of the ARO asset (included within the unamortized nuclear investment) and accretion of the ARO liability are deferred as increases to the ARO regulatory liability account, resulting in no impact on earnings.
SCE has collected in rates amounts for the future costs of removal of its nuclear assets, and has placed those amounts in independent trusts. The cost of removal amounts, in excess of amounts collected for assets not legally required to be removed, are classified as regulatory liabilities.
The recorded liability to decommission SCE's nuclear power facilities is
$2.7 billion
as of December 31, 2014, based on decommissioning studies performed in 2010 for Palo Verde, in 2011 for San Onofre Unit 1 and in 2014 for San Onofre Units 2 and 3 following the decision to permanently retire San Onofre. See Note 11 for further details.
The San Onofre work plan developed for the revised estimate accelerated decommissioning activities beginning in 2013 from the prior assumption of 2022. In addition, certain activities that were previously forecasted to be completed at the end of the decommissioning period were accelerated over the next ten years. Although the changes in the decommissioning cost estimate for these activities in current dollars did not change significantly, the changes in timing, as well as revised escalation rates, reduced the present value of future decommissioning costs (using the
6.30%
discount rate). The ARO liability related to San Onofre Units 2 and 3 decreased by
$688 million
in 2014 based on the updated decommissioning cost estimate. The total ARO liability related to San Onofre Units 2 and 3 at December 31, 2014 was
$2.1 billion
. Expenditures from June 7, 2013 through December 31, 2014 have been recorded as operation and maintenance costs and are treated as recoverable through GRC revenues, with the 2014 recorded costs being subject to customary prudency review. SCE has filed a request with the CPUC to authorize early release of nuclear decommissioning trust funds to recover SCE's share of costs from June 7, 2013 through the end of 2014. To the extent that costs are recovered from SCE's nuclear decommissioning trust as decommissioning costs, SCE intends to refund such amounts to customers as provided in the San Onofre OII Amended Settlement Agreement (as defined in Note 11). The ARO liability related to San Onofre Units 2 and 3 is lower than the present value of the decommissioning costs using current discount rates (approximately
$3.0 billion
at December 31, 2014).
In December 2014, SCE received a decision on its 2012 NDCTP for Palo Verde and San Onofre Unit 1. The total ARO liability related to Palo Verde decreased by
$253 million
in 2014 and San Onofre Unit 1 increased by
$124 million
based on the 2012 NDCTP estimate. The changes in the decommissioning cost estimate for Palo Verde reflect the license extension of
55
20
years as well as revised escalation rates, which reduced the present value of future decommissioning costs (using the
4.08%
discount rate).
Changes in the estimated costs, timing of decommissioning or the assumptions underlying these estimates could cause material revisions to the estimated total cost to decommission. SCE currently estimates that it will spend approximately
$7.4 billion
through
2075
to decommission its nuclear facilities. This estimate is based on SCE's decommissioning cost methodology used for ratemaking purposes, escalated at rates ranging from
1.0%
to
7.3%
(depending on the cost element) annually. These costs are expected to be funded from independent decommissioning trusts. SCE estimates annual after-tax earnings on the decommissioning funds of
3.3%
to
4.1%
. If the assumed return on trust assets is not earned or costs escalate at higher rates, it is probable that additional funds needed for decommissioning will be recoverable through rates in the future.
Decommissioning expense under the ratemaking method was
$5 million
for 2014, and
$22 million
in 2013 and 2012. Total expenditures for the decommissioning of San Onofre Unit 1 were
$602 million
from the beginning of the project in 1998 through December 31, 2014.
Due to regulatory recovery of SCE's nuclear decommissioning expense, prudently incurred costs for nuclear decommissioning activities do not affect SCE's earnings. SCE's nuclear decommissioning costs are subject to CPUC review through the tri-annual regulatory proceeding. SCE's nuclear decommissioning trust investments primarily consist of debt and equity investments that are classified as available-for-sale. Due to regulatory mechanisms, earnings and realized gains and losses (including other-than-temporary impairments) have no impact on electric utility revenue. Unrealized gains and losses on decommissioning trust funds increase or decrease the trust assets and the related regulatory asset or liability and have no impact on electric utility revenue or decommissioning expense. SCE reviews each security for other-than-temporary impairment on the last day of each month. If the fair value on the last day of two consecutive months is less than the cost for that security, SCE recognizes a loss for the other-than-temporary impairment. If the fair value is greater or less than the cost for that security at the time of sale, SCE recognizes a related realized gain or loss, respectively.
Deferred Financing Costs
Debt premium, discount and issuance expenses incurred in connection with obtaining financing are deferred and amortized on a straight-line basis. Under CPUC ratemaking procedures, SCE's debt reacquisition expenses are amortized over the remaining life of the reacquired debt or, if refinanced, the life of the new debt. SCE had unamortized losses on reacquired debt of
$201 million
and
$222 million
at
December 31, 2014
and
2013
, respectively, reflected as long-term "Regulatory assets" in the consolidated balance sheets. Edison International and SCE had unamortized debt issuance costs of
$83 million
and
$75 million
at
December 31, 2014
, respectively, and
$84 million
and
$79 million
at
December 31, 2013
, respectively, reflected in "Other long-term assets" on the consolidated balance sheets. Amortization of deferred financing costs charged to interest expense is as follows:
|
Edison International
|
SCE
|
||||||||||||||||||||||
|
Years ended December 31,
|
|||||||||||||||||||||||
|
(in millions)
|
2014
|
2013
|
2012
|
2014
|
2013
|
2012
|
|||||||||||||||||
|
Amortization of deferred financing costs charged to interest expense
|
$
|
36
|
|
$
|
33
|
|
$
|
30
|
|
$
|
32
|
|
$
|
32
|
|
$
|
29
|
|
|||||
Revenue Recognition
Revenue is recognized when electricity is delivered and includes amounts for services rendered but unbilled at the end of each reporting period and reflected in "Operating revenue" on the consolidated income statements. Rates charged to customers are based on CPUC- and FERC-authorized revenue requirements. CPUC rates are implemented subsequent to final approval.
CPUC and FERC rates decouple authorized revenue from the volume of electricity sales. Differences between amounts collected and authorized levels are either collected from or refunded to customers, and therefore, SCE earns revenue equal to amounts authorized.
SCE bills certain sales and use taxes levied by state or local governments to its customers. Included in these sales and use taxes are franchise fees, which SCE pays to various municipalities (based on contracts with these municipalities) in order to operate within the limits of the municipality. SCE bills these franchise fees to its customers based on a CPUC-authorized rate. These franchise fees, which are required to be paid regardless of SCE's ability to collect from the customer, are accounted for
56
on a gross basis and reflected in electric utility revenue and other operation and maintenance expense. SCE's franchise fees billed to customers and recorded as revenue were
$134 million
,
$116 million
and
$98 million
in
2014
,
2013
and
2012
, respectively. When SCE bills and collects taxes from customers, these taxes are remitted to the taxing authorities and are not recognized as electric utility revenue.
Power Purchase Agreements
SCE enters into power purchase agreements in the normal course of business. A power purchase agreement may be considered a variable interest in a variable interest entity. Under this classification, the power purchase agreement is evaluated to determine if SCE is the primary beneficiary in the variable interest entity, in which case, such entity would be consolidated. None of SCE's power purchase agreements resulted in consolidation of a variable interest entity at
December 31, 2014
and
2013
. See Note 3 for further discussion of power purchase agreements that are considered variable interests.
A power purchase agreement may also contain a lease for accounting purposes. This generally occurs when a power purchase agreement (signed or modified after June 30, 2003) designates a specific power plant in which the buyer purchases substantially all of the output and does not otherwise meet a fixed price per unit of output exception. SCE has a number of power purchase agreements that contain leases. SCE's recognition of lease expense conforms to the ratemaking treatment for SCE's recovery of the cost of electricity and is recorded in purchased power. These agreements are classified as operating leases as electricity is delivered at rates defined in power sales agreements. See Note 11 for further discussion of SCE's power purchase agreements, including agreements that are classified as capital leases for accounting purposes.
A power purchase agreement that does not contain a lease may be classified as a derivative subject to a normal purchase and sale exception, in which case the power purchase agreement is classified as an executory contract and accounted for on an accrual basis. Most of SCE's QF contracts are not required to be recorded on the consolidated balance sheets because they either do not meet the definition of a derivative or meet the normal purchase and sale exception. SCE purchases power under certain contracts that are not eligible for the normal purchase and sale exception and are recorded as a derivative on the consolidated balance sheets at fair value. See Note 6 for further information on derivatives and hedging activities.
Power purchase agreements that do not meet the above classifications are accounted for on an accrual basis.
Derivative Instruments
SCE records derivative instruments on its consolidated balance sheets as either assets or liabilities measured at fair value unless otherwise exempted from derivative treatment as normal purchases or sales. The normal purchases and sales exception requires, among other things, physical delivery in quantities expected to be used or sold over a reasonable period in the normal course of business. Realized gains and losses from SCE's derivative instruments are expected to be recovered from or refunded to customers through regulatory mechanisms and, therefore, SCE's fair value changes have no impact on purchased-power expenses or earnings. SCE does not use hedge accounting for derivative transactions due to regulatory accounting treatment.
Where SCE's derivative instruments are subject to a master netting agreement and certain criteria are met, SCE presents its derivative assets and liabilities on a net basis on its consolidated balance sheets. In addition, derivative positions are offset against margin and cash collateral deposits. The results of derivative activities are recorded as part of cash flows from operating activities on the consolidated statements of cash flows. See Note 6 for further information on derivative instruments.
Leases
SCE enters into power purchase agreements that may contain leases, as discussed under "Power Purchase Agreements" above. SCE has entered into a number of agreements to lease property and equipment in the normal course of business. Minimum lease payments under operating leases are levelized (total minimum lease payments divided by the number of years of the lease) and recorded as rent expense over the terms of the leases. Lease payments in excess of the minimum are recorded as rent expense in the year incurred.
Capital leases are reported as long-term obligations on the consolidated balance sheets in "Other deferred credits and other long-term liabilities." As a rate-regulated enterprise, SCE's capital lease amortization expense and interest expense are reflected in "Purchased power and fuel" on the consolidated statements of income.
57
Stock-Based Compensation
Stock options, performance shares, deferred stock units and restricted stock units have been granted under Edison International's long-term incentive compensation programs. Generally, Edison International does not issue new common stock for settlement of equity awards. Rather, a third party is used to purchase shares from the market and delivery for settlement of option exercises, performance shares and restricted stock units. Performance shares earned are settled half in cash and half in common stock; however, Edison International has discretion under certain of the awards to pay the half subject to cash settlement in common stock. Deferred stock units granted to management are settled in cash and represent a liability. Restricted stock units are settled in common stock; however, Edison International will substitute cash awards to the extent necessary to pay tax withholding or any government levies.
Stock-based compensation expense is recognized on a straight-line basis over the requisite service period. For awards granted to retirement-eligible participants stock compensation expenses are recognized on a prorated basis over the initial year or over the period between the date of grant and the date the participant first becomes eligible for retirement.
Tax benefits related to stock-based compensation are recognized as a reduction to deferred taxes until the related tax deductions reduce current income taxes. When such event occurs, the tax benefits are then recognized through additional paid in capital. SCE allocates the tax benefits based on the provisions in the tax laws that identify the sequence in which the amounts are utilized for tax purposes.
SCE Dividend Restrictions
The CPUC regulates SCE's capital structure which limits the dividends it may pay Edison International. SCE may make distributions to Edison International as long as the common equity component of SCE's capital structure remains at or above
48%
on a
13
-month weighted average basis. At
December 31, 2014
, SCE's
13
-month weighted-average common equity component of total capitalization was
48.4%
and the maximum additional dividend that SCE could pay to Edison International under this limitation was approximately
$87 million
. The remaining
$13.2 billion
of SCE's net assets are restricted.
Earnings Per Share
Edison International computes earnings per common share ("EPS") using the two-class method, which is an earnings allocation formula that determines EPS for each class of common stock and participating security. Edison International's participating securities are stock-based compensation awards payable in common shares, including performance shares and restricted stock units, which earn dividend equivalents on an equal basis with common shares once the awards are vested. EPS attributable to Edison International common shareholders was computed as follows:
|
Years ended December 31,
|
|||||||||||
|
(in millions)
|
2014
|
2013
|
2012
|
||||||||
|
Basic earnings per share – continuing operations:
|
|
||||||||||
|
Income from continuing operations attributable to common shareholders
|
$
|
1,427
|
|
$
|
879
|
|
$
|
1,503
|
|
||
|
Participating securities dividends
|
(1
|
)
|
—
|
|
—
|
|
|||||
|
Income from continuing operations available to common shareholders
|
$
|
1,426
|
|
$
|
879
|
|
$
|
1,503
|
|
||
|
Weighted average common shares outstanding
|
326
|
|
326
|
|
326
|
|
|||||
|
Basic earnings per share – continuing operations
|
$
|
4.38
|
|
$
|
2.70
|
|
$
|
4.61
|
|
||
|
Diluted earnings per share – continuing operations:
|
|
||||||||||
|
Income from continuing operations available to common shareholders
|
$
|
1,426
|
|
$
|
879
|
|
$
|
1,503
|
|
||
|
Income impact of assumed conversions
|
1
|
|
1
|
|
(1
|
)
|
|||||
|
Income from continuing operations available to common shareholders and assumed conversions
|
$
|
1,427
|
|
$
|
880
|
|
$
|
1,502
|
|
||
|
Weighted average common shares outstanding
|
326
|
|
326
|
|
326
|
|
|||||
|
Incremental shares from assumed conversions
|
3
|
|
3
|
|
4
|
|
|||||
|
Adjusted weighted average shares – diluted
|
329
|
|
329
|
|
330
|
|
|||||
|
Diluted earnings per share – continuing operations
|
$
|
4.33
|
|
$
|
2.67
|
|
$
|
4.55
|
|
||
58
In addition to the participating securities discussed above, Edison International also may award stock options which are payable in common shares and are included in the diluted earnings per share calculation. Stock option awards to purchase
125,345
,
3,977,894
and
7,492,552
shares of common stock for the years ended
December 31, 2014
,
2013
and
2012
, respectively, were outstanding, but were not included in the computation of diluted earnings per share because the exercise price of the awards was greater than the average market price of the common shares during the respective periods and, therefore, the effect would have been antidilutive.
Income Taxes
Edison International and SCE estimate their income taxes for each jurisdiction in which they operate. This involves estimating current period tax expense along with assessing temporary differences resulting from differing treatment of items (such as depreciation) for tax and accounting purposes. These differences result in deferred tax assets and liabilities, which are included in the consolidated balance sheets. Income tax expense includes the current tax liability from operations and the change in deferred income taxes during the year. Investment tax credits are deferred and amortized to income tax expense over the lives of the properties or the term of the power purchase agreement of the respective project while production tax credits are recognized in income tax expense in the period in which they are earned.
Interest income, interest expense and penalties associated with income taxes are reflected in "Income tax expense" on the consolidated statements of income.
Edison International's eligible subsidiaries are included in Edison International's consolidated federal income tax and combined state tax returns. Edison International has tax-allocation and payment agreements with certain of its subsidiaries. Pursuant to an income tax-allocation agreement approved by the CPUC, SCE's tax liability is computed as if it filed its federal and state income tax returns on a separate return basis.
Redeemable Noncontrolling Interest
Redeemable noncontrolling interest represents the portion of equity ownership in an entity that is not attributable to the equity holders of Edison International and which have rights to put their ownership back to a subsidiary of Edison International. Noncontrolling interest is initially recorded at fair value and is subsequently adjusted for income allocated to the noncontrolling interest and any distributions paid to the noncontrolling interest.
Certain solar rooftop projects for commercial customers are organized as limited liability companies and have a noncontrolling equity investor (referred to as tax equity investor) which is entitled to allocations of earnings, tax attributes and cash flows in accordance with contractual agreements that vary over time. This entity is consolidated for financial reporting purposes but is not subject to income taxes as the taxable income (loss) and investment tax credits are allocated to the respective owners. The total assets and liabilities of this entity consolidated at December 31, 2014 were
$64 million
and
$39 million
, respectively. Income (loss) of this entity is allocated to the noncontrolling interest based on the hypothetical liquidation at book value ("HLBV") accounting method. The HLBV accounting method is an approach that calculates the change in the claims of each member on the net assets of the investment at the beginning and end of each period. Each member’s claim is equal to the amount each party would receive or pay if the net assets of the investment were to liquidate at book value. Under the contract provisions, the tax equity investor’s claim on net assets decreases rapidly in early years due to allocation of tax benefits resulting in additional non-operating income allocated to Edison International (
$3 million
in 2014).
During the third quarter of 2014, indirect subsidiaries of Edison Energy entered into
three
non-recourse debt and tax equity financings designed to fund significantly all of their capital requirements for approximately
35
MW solar rooftop projects. The tax equity investors in these solar rooftop projects receive
99%
of taxable profits and losses and tax credits of the projects as determined for Federal income tax purposes for a
six
-year period following the completion of the portfolio of projects and receive a priority return of
2%
of their investment per year. After the
six
-year period, the tax equity investor receives
5%
of the taxable profits and losses and cash flow. A subsidiary of Edison International has a call option for a
nine
-month period following
five
years after completion of the portfolio of projects to purchase the tax equity investors interest at fair value as defined in the applicable agreement and the tax equity investor has the right to put its ownership interest to such subsidiary in the event that the call option is not exercised.
59
New Accounting Guidance
Accounting Guidance Not Yet Adopted
On May 28, 2014, the Financial Accounting Standards Board issued an accounting standards update on revenue recognition including enhanced disclosures. Under the new standard, revenue is recognized when (or as) a good or service is transferred to the customer and the customer obtains control of the good or service. Edison International and SCE are currently evaluating this new guidance which is effective January 1, 2017 and cannot determine the impact of this standard at this time.
SCE's property, plant and equipment included in the consolidated balance sheets is composed of the following:
|
December 31,
|
|||||||
|
(in millions)
|
2014
|
2013
|
|||||
|
Transmission
|
$
|
10,391
|
|
$
|
9,117
|
|
|
|
Distribution
|
19,255
|
|
17,874
|
|
|||
|
Generation
|
2,986
|
|
2,856
|
|
|||
|
General plant and other
|
4,889
|
|
4,674
|
|
|||
|
Accumulated depreciation
|
(8,132
|
)
|
(7,493
|
)
|
|||
|
29,389
|
|
27,028
|
|
||||
|
Construction work in progress
|
3,339
|
|
3,219
|
|
|||
|
Nuclear fuel, at amortized cost
|
131
|
|
132
|
|
|||
|
Total utility property, plant and equipment
|
$
|
32,859
|
|
$
|
30,379
|
|
|
Capitalized Software Costs
SCE capitalizes costs incurred during the application development stage of internal use software projects to property, plant, and equipment. SCE amortizes capitalized software costs ratably over the expected lives of the software, ranging from
5
to
15
years and commencing upon operational use. At
December 31, 2014
and
2013
, capitalized software costs included in general plant and other above, were
$1.7 billion
and
$1.6 billion
and accumulated amortization was
$1.0 billion
and
$839 million
, respectively. Amortization expense for capitalized software was
$271 million
,
$251 million
and
$217 million
in
2014
,
2013
and
2012
, respectively. At
December 31, 2014
, amortization expense is estimated to be approximately
$275 million
annually for
2015
through
2019
.
Jointly Owned Utility Projects
SCE owns interests in several generating stations and transmission systems for which each participant provides its own financing. SCE's proportionate share of these projects is reflected in the consolidated balance sheets and included in the above table. SCE's proportionate share of expenses for each project is reflected in the consolidated statements of income. A portion of the investments in Palo Verde generating stations is included in regulatory assets on the consolidated balance sheets. For further information see Note 10.
The following is SCE's investment in each project as of
December 31, 2014
:
|
(in millions)
|
Plant in Service
|
Construction Work in Progress
|
Accumulated
Depreciation
|
Nuclear Fuel
(at amortized cost)
|
Net Book Value
|
Ownership
Interest
|
|||||||||||
|
Transmission systems:
|
|||||||||||||||||
|
Eldorado
|
$
|
88
|
|
$
|
81
|
|
$
|
17
|
|
$
|
—
|
|
$
|
152
|
|
62%
|
|
|
Pacific Intertie
|
191
|
|
14
|
|
74
|
|
—
|
|
131
|
|
50%
|
||||||
|
Generating stations:
|
|||||||||||||||||
|
Palo Verde (nuclear)
|
1,871
|
|
83
|
|
1,529
|
|
131
|
|
556
|
|
16%
|
||||||
|
Total
|
$
|
2,150
|
|
$
|
178
|
|
$
|
1,620
|
|
$
|
131
|
|
$
|
839
|
|
||
In addition to the projects above, SCE has ownership interests in jointly owned power poles with other companies.
60
Sale of Interests in Four Corners Units 4 and 5
In December 2013, SCE completed the sale of its ownership interest in Units 4 and 5 of the Four Corners Generating Station, a coal-fired electric generating facility in New Mexico, to the operator of the facility, Arizona Public Service Company and received net proceeds of approximately
$181 million
. Under the sale agreement, SCE remains responsible for its pro-rata share of certain environmental liabilities, including penalties arising from environmental violations arising prior to the sale. The sale of Four Corners resulted in a
$166 million
benefit to SCE's customers and, therefore, did not affect SCE's earnings.
A VIE is defined as a legal entity that meets one of two conditions: (1) the equity owners do not have sufficient equity at risk, or (2) the holders of the equity investment at risk, as a group, lack any of the following three characteristics: decision-making rights, the obligation to absorb losses, or the right to receive the expected residual returns of the entity. The primary beneficiary is identified as the variable interest holder that has both the power to direct the activities of the VIE that most significantly impact the entity's economic performance and the obligation to absorb losses or the right to receive benefits from the entity that could potentially be significant to the VIE. The primary beneficiary is required to consolidate the VIE. A subsidiary of Edison International is the primary beneficiary of an entity that owns rooftop solar projects (for further information, see Note 1). Commercial and operating activities are generally the factors that most significantly impact the economic performance of such VIEs. Commercial and operating activities include construction, operation and maintenance, fuel procurement, dispatch and compliance with regulatory and contractual requirements.
Variable Interest in VIEs that are not Consolidated
Power Purchase Contracts
SCE has power purchase agreements ("PPAs") that are classified as variable interests in VIEs, including tolling agreements through which SCE provides the natural gas to fuel the plants and contracts with qualifying facilities ("QFs") that contain variable pricing provisions based on the price of natural gas. SCE has concluded that it is not the primary beneficiary of these VIEs since it does not control the commercial and operating activities of these entities. Since payments for capacity are the primary source of income, the most significant economic activity for these VIEs is the operation and maintenance of the power plants.
As of the balance sheet date, the carrying amount of assets and liabilities in SCE's consolidated balance sheet that relate to its involvement with VIEs result from amounts due under the PPAs or the fair value of derivative contracts. Under these contracts, SCE recovers the costs incurred through demonstration of compliance with its CPUC-approved long-term power procurement plans. SCE has no residual interest in the entities and has not provided or guaranteed any debt or equity support, liquidity arrangements, performance guarantees or other commitments associated with these contracts other than the purchase commitments described in Note 11. As a result, there is no significant potential exposure to loss to SCE from its variable interest in these VIEs. The aggregate contracted capacity dedicated to SCE for these VIE projects was
5,641
MW and
5,183
MW at
December 31, 2014
and
2013
, respectively, and the amounts that SCE paid to these projects were
$739 million
and
$715 million
for the years ended
December 31, 2014
and
2013
, respectively. These amounts are recoverable in customer rates, subject to reasonableness review.
Unconsolidated Trusts of SCE
SCE Trust I, Trust II, and Trust III were formed in 2012, 2013, and 2014, respectively, for the exclusive purpose of issuing
5.625%
,
5.10%
, and
5.75%
trust preference securities, respectively ("trust securities"). The trusts are VIEs. SCE has concluded that it is not the primary beneficiary of these VIEs as it does not have the obligation to absorb the expected losses or the right to receive the expected residual returns of the trusts. SCE Trust I, Trust II, and Trust III issued trust securities in the face amount of
$475 million
,
$400 million
, and
$275 million
, respectively, (cumulative, liquidation amount of
$25
per share) to the public and
$10,000
of common stock each to SCE. The trusts invested the proceeds of these trust securities in Series F, Series G, and Series H Preference Stock issued by SCE in the principal amount of
$475 million
,
$400 million
, and
$275 million
(cumulative,
$2,500
per share liquidation value), respectively, which have substantially the same payment terms as the trust securities.
The Series F, Series G, and Series H Preference Stock and the corresponding trust securities do not have a maturity date. Upon any redemption of any shares of the Series F, Series G, or Series H Preference Stock, a corresponding dollar amount of trust securities will be redeemed by the applicable trust (for further information see Note 12). The applicable trust will make distributions at the same rate and on the same dates on the applicable series of trust securities when and if the SCE board of directors declares and makes dividend payments on the Series F, Series G, or Series H Preference Stock. The applicable trusts will use any dividends it receives on the Series F, Series G, or Series H Preference Stock to make its corresponding
61
distributions on the applicable series of trust securities. If SCE does not make a dividend payment to any of these trusts, SCE would be prohibited from paying dividends on its common stock. SCE has fully and unconditionally guaranteed the payment of the trust securities and trust distributions, if and when SCE pays dividends on the Series F, Series G, or Series H Preference Stock.
The Trust I and Trust II balance sheets as of
December 31, 2014
, and
2013
consisted of investments of
$475 million
and
$400 million
in the Series F and Series G Preference Stock respectively,
$475 million
and
$400 million
of trust securities, respectively and
$10,000
each of common stock. The Trust III balance sheet as of
December 31, 2014
consisted of investments of
$275 million
in the Series H Preference Stock,
$275 million
of trust securities, and
$10,000
of common stock.
The following
table provides a summary of the trusts' income statements:
|
|
Years ended December 31,
|
||||||||||
|
(in millions)
|
Trust I
|
Trust II
|
Trust III
|
||||||||
|
2014
|
|
|
|
||||||||
|
Dividend income
|
$
|
27
|
|
$
|
20
|
|
$
|
13
|
|
||
|
Dividend distributions
|
27
|
|
20
|
|
13
|
|
|||||
|
2013
|
|
|
|
||||||||
|
Dividend income
|
$
|
27
|
|
$
|
19
|
|
*
|
|
|||
|
Dividend distributions
|
27
|
|
19
|
|
*
|
|
|||||
|
2012
|
|
|
|
||||||||
|
Dividend income
|
$
|
17
|
|
*
|
|
*
|
|
||||
|
Dividend distributions
|
17
|
|
*
|
|
*
|
|
|||||
* Not applicable
Recurring Fair Value Measurements
Fair value is defined as the price that would be received to sell an asset or paid to transfer a liability in an orderly transaction between market participants at the measurement date (referred to as an "exit price"). Fair value of an asset or liability considers assumptions that market participants would use in pricing the asset or liability, including assumptions about nonperformance risk. As of
December 31, 2014
and
2013
, nonperformance risk was not material for Edison International and SCE.
Assets and liabilities are categorized into a three-level fair value hierarchy based on valuation inputs used to determine fair value.
Level 1 – The fair value of Edison International and SCE's Level 1 assets and liabilities is determined using unadjusted quoted prices in active markets that are available at the measurement date for identical assets and liabilities. This level includes exchange-traded equity securities and derivatives, U.S. treasury securities and money market funds.
Level 2 – Edison International and SCE's Level 2 assets and liabilities include fixed income securities, primarily consisting of U.S. government and agency bonds, municipal bonds and corporate bonds, and over-the-counter derivatives. The fair value of fixed income securities is determined using a market approach by obtaining quoted prices for similar assets and liabilities in active markets and inputs that are observable, either directly or indirectly, for substantially the full term of the instrument.
The fair value of SCE's over-the-counter derivative contracts is determined using an income approach. SCE uses standard pricing models to determine the net present value of estimated future cash flows. Inputs to the pricing models include forward published or posted clearing prices from exchanges (New York Mercantile Exchange and Intercontinental Exchange) for similar instruments and discount rates. A primary price source that best represents trade activity for each market is used to develop observable forward market prices in determining the fair value of these positions. Broker quotes, prices from exchanges or comparison to executed trades are used to validate and corroborate the primary price source. These price quotations reflect mid-market prices (average of bid and ask) and are obtained from sources believed to provide the most liquid market for the commodity.
62
Level 3 – The fair value of SCE's Level 3 assets and liabilities is determined using the income approach through various models and techniques that require significant unobservable inputs. This level includes over-the-counter options, tolling arrangements and derivative contracts that trade infrequently such as congestion revenue rights ("CRRs") and long-term power agreements. Edison International Parent and Other does not have any Level 3 assets and liabilities.
Assumptions are made in order to value derivative contracts in which observable inputs are not available. Changes in fair value are based on changes to forward market prices, including extrapolation of short-term observable inputs into forecasted prices for illiquid forward periods. In circumstances where fair value cannot be verified with observable market transactions, it is possible that a different valuation model could produce a materially different estimate of fair value. Modeling methodologies, inputs and techniques are reviewed and assessed as markets continue to develop and more pricing information becomes available and the fair value is adjusted when it is concluded that a change in inputs or techniques would result in a new valuation that better reflects the fair value of those derivative contracts.
SCE
The following table sets forth assets and liabilities of SCE that were accounted for at fair value by level within the fair value hierarchy:
|
|
December 31, 2014
|
||||||||||||||||||
|
(in millions)
|
Level 1
|
Level 2
|
Level 3
|
Netting
and
Collateral
1
|
Total
|
||||||||||||||
|
Assets at fair value
|
|
|
|
|
|
||||||||||||||
|
Derivative contracts
|
$
|
—
|
|
$
|
—
|
|
$
|
321
|
|
$
|
—
|
|
$
|
321
|
|
||||
|
Other
|
33
|
|
—
|
|
—
|
|
—
|
|
33
|
|
|||||||||
|
Nuclear decommissioning trusts:
|
|
|
|
|
|
||||||||||||||
|
Stocks
2
|
2,031
|
|
—
|
|
—
|
|
—
|
|
2,031
|
|
|||||||||
|
Fixed income
3
|
703
|
|
1,350
|
|
—
|
|
—
|
|
2,053
|
|
|||||||||
|
Short-term investments, primarily cash equivalents
|
606
|
|
166
|
|
—
|
|
—
|
|
772
|
|
|||||||||
|
Subtotal of nuclear decommissioning trusts
4
|
3,340
|
|
1,516
|
|
—
|
|
—
|
|
4,856
|
|
|||||||||
|
Total assets
|
3,373
|
|
1,516
|
|
321
|
|
—
|
|
5,210
|
|
|||||||||
|
Liabilities at fair value
|
|
|
|
|
|
||||||||||||||
|
Derivative contracts
|
—
|
|
86
|
|
1,223
|
|
(61
|
)
|
1,248
|
|
|||||||||
|
Total liabilities
|
—
|
|
86
|
|
1,223
|
|
(61
|
)
|
1,248
|
|
|||||||||
|
Net assets (liabilities)
|
$
|
3,373
|
|
$
|
1,430
|
|
$
|
(902
|
)
|
$
|
61
|
|
$
|
3,962
|
|
||||
63
|
|
December 31, 2013
|
||||||||||||||||||
|
(in millions)
|
Level 1
|
Level 2
|
Level 3
|
Netting
and
Collateral
1
|
Total
|
||||||||||||||
|
Assets at fair value
|
|
|
|
|
|
||||||||||||||
|
Derivative contracts
|
$
|
—
|
|
$
|
11
|
|
$
|
372
|
|
$
|
(10
|
)
|
$
|
373
|
|
||||
|
Other
|
39
|
|
—
|
|
—
|
|
—
|
|
39
|
|
|||||||||
|
Nuclear decommissioning trusts:
|
|
|
|
|
|
|
|
|
|
|
|||||||||
|
Stocks
2
|
2,208
|
|
—
|
|
—
|
|
—
|
|
2,208
|
|
|||||||||
|
Fixed income
3
|
841
|
|
1,102
|
|
—
|
|
—
|
|
1,943
|
|
|||||||||
|
Short-term investments, primarily cash equivalents
|
331
|
|
—
|
|
—
|
|
—
|
|
331
|
|
|||||||||
|
Subtotal of nuclear decommissioning trusts
4
|
3,380
|
|
1,102
|
|
—
|
|
—
|
|
4,482
|
|
|||||||||
|
Total assets
|
3,419
|
|
1,113
|
|
372
|
|
(10
|
)
|
4,894
|
|
|||||||||
|
Liabilities at fair value
|
|
|
|
|
|
||||||||||||||
|
Derivative contracts
|
—
|
|
37
|
|
1,177
|
|
(20
|
)
|
1,194
|
|
|||||||||
|
Total liabilities
|
—
|
|
37
|
|
1,177
|
|
(20
|
)
|
1,194
|
|
|||||||||
|
Net assets (liabilities)
|
$
|
3,419
|
|
$
|
1,076
|
|
$
|
(805
|
)
|
$
|
10
|
|
$
|
3,700
|
|
||||
|
1
|
Represents the netting of assets and liabilities under master netting agreements and cash collateral across the levels of the fair value hierarchy. Netting among positions classified within the same level is included in that level.
|
|
2
|
Approximately
73%
and
70%
of SCE's equity investments were located in the United States at
December 31, 2014
and
2013
, respectively.
|
|
3
|
Includes corporate bonds, which were diversified and included collateralized mortgage obligations and other asset backed securities of
$49 million
and
$47 million
at
December 31, 2014
and
2013
, respectively.
|
|
4
|
Excludes net payables of
$57 million
at
December 31, 2014
and net receivables of
$12 million
at
2013
, which consist of interest and dividend receivables as well as receivables and payables related to SCE's pending securities sales and purchases.
|
Edison International
Assets measured at fair value consisted of money market funds of
$35 million
and
$68 million
at
December 31, 2014
and
2013
, respectively, classified as Level 1.
SCE Fair Value of Level 3
The following table sets forth a summary of changes in SCE's fair value of Level 3 net derivative assets and liabilities:
|
|
December 31,
|
|||||||
|
(in millions)
|
2014
|
2013
|
||||||
|
Fair value of net liabilities at beginning of period
|
$
|
(805
|
)
|
$
|
(791
|
)
|
||
|
Total realized/unrealized gains (losses):
|
||||||||
|
Included in regulatory assets and liabilities
1
|
(97
|
)
|
23
|
|
||||
|
Purchases
|
27
|
|
65
|
|
||||
|
Settlements
|
(27
|
)
|
(102
|
)
|
||||
|
Fair value of net liabilities at end of period
|
$
|
(902
|
)
|
$
|
(805
|
)
|
||
|
Change during the period in unrealized gains and losses related to assets and liabilities held at the end of the period
|
$
|
(166
|
)
|
$
|
33
|
|
||
|
1
|
Due to regulatory mechanisms, SCE's realized and unrealized gains and losses are recorded as regulatory assets and liabilities.
|
Edison International and SCE recognize the fair value for transfers in and transfers out of each level at the end of each reporting period. There were no transfers between any levels during
2014
and
2013
.
64
Valuation Techniques Used to Determine Fair Value
The process of determining fair value is the responsibility of SCE's risk management department, which report to SCE's chief financial officer. This department obtains observable and unobservable inputs through broker quotes, exchanges and internal valuation techniques that use both standard and proprietary models to determine fair value. Each reporting period, the risk and finance departments collaborate to determine the appropriate fair value methodologies and classifications for each derivative. Inputs are validated for reasonableness by comparison against prior prices, other broker quotes and volatility fluctuation thresholds. Inputs used and valuations are reviewed period-over-period and compared with market conditions to determine reasonableness.
The following table sets forth SCE's valuation techniques and significant unobservable inputs used to determine fair value for significant Level 3 assets and liabilities:
|
Fair Value (in millions)
|
Significant
|
Range
|
||||||||
|
Assets
|
Liabilities
|
Valuation Technique(s)
|
Unobservable Input
|
(Weighted Average)
|
||||||
|
Congestion revenue rights
|
||||||||||
|
December 31, 2014
|
$
|
317
|
|
$
|
—
|
|
Market simulation model
|
Load forecast
|
7,630 MW - 25,431 MW
|
|
|
Power prices
1
|
$1.65 - $109.95
|
|||||||||
|
Gas prices
2
|
$3.65 - $6.53
|
|||||||||
|
December 31, 2013
|
366
|
|
—
|
|
Market simulation model
|
Load forecast
|
7,603 MW - 24,896 MW
|
|||
|
Power prices
1
|
$(9.86) - $108.56
|
|||||||||
|
Gas prices
2
|
$3.50 - $7.10
|
|||||||||
|
Tolling
|
||||||||||
|
December 31, 2014
|
4
|
|
1,207
|
|
Option model
|
Volatility of gas prices
|
13% - 53% (20%)
|
|||
|
Volatility of power prices
|
25% - 42% (30%)
|
|||||||||
|
Power prices
|
$30.60 - $61.40 ($44.60)
|
|||||||||
|
December 31, 2013
|
5
|
|
1,175
|
|
Option model
|
Volatility of gas prices
|
16% - 35% (21%)
|
|||
|
Volatility of power prices
|
25% - 45% (30%)
|
|||||||||
|
Power prices
|
$38.00 - $63.90 ($47.40)
|
|||||||||
1
Prices are in dollars per megawatt-hour.
2
Prices are in dollars per million British thermal units.
Level 3 Fair Value Sensitivity
Congestion Revenue Rights
For CRRs, where SCE is the buyer, generally increases (decreases) in forecasted load in isolation would result in increases (decreases) to the fair value. In general, an increase (decrease) in electricity and gas prices at illiquid locations tends to result in increases (decreases) to fair value; however, changes in electricity and gas prices in opposite directions may have varying results on fair value.
Tolling Arrangements
The fair values of SCE's tolling arrangements contain intrinsic value and time value. Intrinsic value is the difference between the market price and strike price of the underlying commodity. Time value is made up of several components, including volatility, time to expiration, and interest rates. The option model for tolling arrangements reflects plant specific information such as operating and start-up costs.
For tolling arrangements where SCE is the buyer, increases in volatility of the underlying commodity prices would result in increases to fair value as it represents greater price movement risk. As power and gas prices increase, the fair value of tolling arrangements tends to increase. The valuation of tolling arrangements is also impacted by the correlation between gas and power prices. As the correlation increases, the fair value of tolling arrangements tends to decline.
65
Nuclear Decommissioning Trusts
SCE's investment policies and CPUC requirements place limitations on the types and investment grade ratings of the securities that may be held by the nuclear decommissioning trust funds. These policies restrict the trust funds from holding alternative investments and limit the trust funds' exposures to investments in highly illiquid markets. With respect to equity and fixed income securities, the trustee obtains prices from third-party pricing services which SCE is able to independently corroborate as described below. A primary price source is identified by the trustee based on asset type, class or issue for each security. The trustee monitors prices supplied by pricing services and may use a supplemental price source or change the primary price source of a given security if the trustee or SCE's investment managers challenge an assigned price and determine that another price source is considered to be preferable. Parameters and predetermined tolerance thresholds are established by asset class based on past experience and an understanding of valuation process techniques. The trustee "scrubs" prices against defined parameters' tolerances and performs research and resolves variances beyond the set parameters. SCE reviewed the process/procedures of both the pricing services and the trustee to gain an understanding of the inputs/assumptions and valuation techniques used to price each asset type/class and to reach a conclusion that their pricing controls are satisfactory. This consisted of SCE's review of their written detailed process/procedures and service organization control reports, as well as follow-up conversations based on our written questions. This assists SCE in determining if the valuations represent exit price fair value and that investments are appropriately classified in the fair value hierarchy. Additionally, SCE corroborates the fair values of securities by comparison to other market-based price sources obtained by SCE's investment managers. Differences outside established thresholds are followed-up with the trustee and resolved. The results of this process have demonstrated that vendor and trustee pricing controls are satisfactory. For each reporting period, SCE reviews the trustee determined fair value hierarchy and overrides the trustee level classification when appropriate.
Fair Value of Long-Term Debt Recorded at Carrying Value
The carrying value and fair value of Edison International and SCE's long-term debt (including current portion of long-term debt):
|
|
December 31, 2014
|
December 31, 2013
|
|||||||||||||
|
(in millions)
|
Carrying
Value
|
Fair
Value
|
Carrying
Value
|
Fair
Value
|
|||||||||||
|
Edison International
|
$
|
10,738
|
|
$
|
12,319
|
|
$
|
10,426
|
|
$
|
11,084
|
|
|||
|
SCE
|
9,924
|
|
11,479
|
|
10,022
|
|
10,656
|
|
|||||||
The fair value of Edison International and SCE's short-term and long-term debt is classified as Level 2 and is based on evaluated prices that reflect significant observable market information such as reported trades, actual trade information of similar securities, benchmark yields, broker/dealer quotes of new issue prices and relevant credit information.
The carrying value of Edison International and SCE's trade receivables and payables, other investments, and short-term debt approximates fair value.
66
The following table summarizes long-term debt (rates and terms are as of
December 31, 2014
) of Edison International and SCE:
|
December 31,
|
|||||||
|
(in millions)
|
2014
|
2013
|
|||||
|
Edison International Parent and Other:
|
|||||||
|
Debentures and notes:
|
|||||||
|
2015 – 2017 (0% to 3.75%)
|
$
|
817
|
|
$
|
400
|
|
|
|
Other long-term debt
|
2
|
|
4
|
|
|||
|
Current portion of long-term debt
|
(204
|
)
|
(1
|
)
|
|||
|
Unamortized debt discount, net
|
(5
|
)
|
—
|
|
|||
|
Total Edison International Parent and Other
|
610
|
|
403
|
|
|||
|
SCE:
|
|||||||
|
First and refunding mortgage bonds:
|
|
|
|||||
|
2015 – 2043 (1.125% to 6.05%)
|
8,875
|
|
8,975
|
|
|||
|
Pollution-control bonds:
|
|||||||
|
2028 – 2035 (1.375% to 5.0% and variable)
|
940
|
|
939
|
|
|||
|
Bonds repurchased
|
(161
|
)
|
(161
|
)
|
|||
|
Debentures and notes:
|
|||||||
|
2029 – 2053 (5.06% to 6.65%)
|
307
|
|
307
|
|
|||
|
Current portion of long-term debt
|
(300
|
)
|
(600
|
)
|
|||
|
Unamortized debt discount, net
|
(37
|
)
|
(38
|
)
|
|||
|
Total SCE
|
9,624
|
|
9,422
|
|
|||
|
Total Edison International
|
$
|
10,234
|
|
$
|
9,825
|
|
|
Edison International and SCE long-term debt maturities over the next five years are the following:
|
(in millions)
|
Edison International
|
SCE
|
|||||
|
2015
|
$
|
504
|
|
$
|
300
|
|
|
|
2016
|
615
|
|
400
|
|
|||
|
2017
|
900
|
|
500
|
|
|||
|
2018
|
400
|
|
400
|
|
|||
|
2019
|
—
|
|
—
|
|
|||
Project Financings
During 2014, indirect subsidiaries of Edison International entered into a
$31.6 million
non-recourse debt financing to support investment in approximately
35
megawatts of solar rooftop projects. The financing is required to be converted to a
7
-year term loan during 2015, subject to meeting specified conditions. As of December 31, 2014, there was
$5.1 million
outstanding under this financing at a weighted average interest rate of
2.67%
which is currently classified as short-term debt.
During 2014, an indirect subsidiary of Edison International entered into an
$80 million
non-recourse debt financing to support equity contributions in solar rooftop projects. The maturity date of any borrowings under this agreement is December 31, 2036. There were no loans outstanding under this agreement at December 31, 2014.
67
Liens and Security Interests
Almost all of SCE's properties are subject to a trust indenture lien. SCE has pledged first and refunding mortgage bonds as collateral for borrowed funds obtained from pollution-control bonds issued by government agencies. SCE has a debt covenant that requires a debt to total capitalization ratio be met. At
December 31, 2014
, SCE was in compliance with this debt covenant.
All of the properties subject to the Edison Energy project financings discussed above are subject to a lien.
Credit Agreements and Short-Term Debt
The following table summarizes the status of the credit facilities at
December 31, 2014
:
|
(in millions)
|
Edison International Parent
|
SCE
|
|||||
|
Commitment
|
$
|
1,250
|
|
$
|
2,750
|
|
|
|
Outstanding borrowings
|
(619
|
)
|
(367
|
)
|
|||
|
Outstanding letters of credit
|
—
|
|
(109
|
)
|
|||
|
Amount available
|
$
|
631
|
|
$
|
2,274
|
|
|
In 2014, SCE and Edison International Parent amended their credit facilities to extend the maturity dates to July 2019 for
$2.75 billion
and
$1.25 billion
, respectively. The credit facility for SCE is generally used to support commercial paper and letters of credit issued for procurement-related collateral requirements, balancing account undercollections and for general corporate purposes, including working capital requirements to support operations and capital expenditures. Borrowings under Edison International Parent's credit facility are used for general corporate purposes.
At
December 31, 2014
, SCE's outstanding commercial paper was
$367 million
at a weighted-average interest rate of
0.40%
. The commercial paper was supported by the
$2.75 billion
multi-year revolving credit facility. At
December 31, 2014
, letters of credit issued under SCE's credit facility aggregated
$109 million
and are scheduled to expire in
twelve months
or less. At
December 31, 2013
, the outstanding commercial paper was
$175 million
at a weighted-average interest rate of
0.24%
.
At
December 31, 2014
, Edison International Parent's outstanding commercial paper was
$619 million
at a weighted-average interest rate of
0.45%
. This commercial paper was supported by the
$1.25 billion
multi-year revolving credit facility. At
December 31, 2013
, the outstanding commercial paper was
$34 million
at a weighted-average interest rate of
0.55%
.
During the first quarter of 2014, SCE issued
$300 million
of floating rate first and refunding mortgage bonds due in January 2015. The proceeds from these bonds were used for working capital to fund the ERRA balancing account undercollections.
Financing Subsequent to December 31, 2014
In January 2015, SCE issued
$550 million
of
1.845%
amortizing first and refunding mortgage bonds due in 2022,
$325 million
of
2.40%
first and refunding mortgage bonds due in 2022, and
$425 million
of
3.6%
first and refunding mortgage bonds due in 2045. The proceeds were used to repay outstanding debt and for general corporate purposes.
Derivative financial instruments are used to manage exposure to commodity price risk. These risks are managed in part by entering into forward commodity transactions, including options, swaps and futures. To mitigate credit risk from counterparties in the event of nonperformance, master netting agreements are used whenever possible and counterparties may be required to pledge collateral depending on the creditworthiness of each counterparty and the risk associated with the transaction.
Commodity Price Risk
Commodity price risk represents the potential impact that can be caused by a change in the market value of a particular commodity. SCE's electricity price exposure arises from energy purchased from and sold to wholesale markets as a result of differences between SCE's load requirements and the amount of energy delivered from its generating facilities and power purchase agreements. SCE's natural gas price exposure arises from natural gas purchased for the Mountainview power plant and peaker plants, QF contracts where pricing is based on a monthly natural gas index and power purchase agreements in which SCE has agreed to provide the natural gas needed for generation, referred to as tolling arrangements.
68
Credit and Default Risk
Credit and default risk represents the potential impact that can be caused if a counterparty were to default on its contractual obligations and SCE would be exposed to spot markets for buying replacement power or selling excess power. In addition, SCE would be exposed to the risk of non-payment of accounts receivable, primarily related to the sales of excess power and realized gains on derivative instruments.
Certain power contracts contain master netting agreements or similar agreements, which generally allows counterparties subject to the agreement to setoff amounts when certain criteria are met, such as in the event of default. The objective of netting is to reduce credit exposure. Additionally, to reduce SCE's risk exposures counterparties may be required to pledge collateral depending on the credit worthiness of each counterparty and the risk associated with the transaction.
Certain power contracts contain a provision that requires SCE to maintain an investment grade rating from each of the major credit rating agencies, referred to as a credit-risk-related contingent feature. If SCE's credit rating were to fall below investment grade, SCE may be required to pay the derivative liability or post additional collateral. The net fair value of all derivative liabilities with these credit-risk-related contingent features was
$53 million
and
$49 million
as of
December 31, 2014
and
2013
, respectively, for which SCE has posted
$13 million
of collateral at
December 31, 2014
and
no
collateral at
December 31, 2013
to its counterparties. If the credit-risk-related contingent features underlying these agreements were triggered on
December 31, 2014
, SCE would be required to post
$40 million
of additional collateral of which
$25 million
is related to outstanding payables that are net of collateral already posted.
Fair Value of Derivative Instruments
SCE presents its derivative assets and liabilities on a net basis on its consolidated balance sheets when subject to master netting agreements or similar agreements. Derivative positions are offset against margin and cash collateral deposits. In addition, SCE has provided collateral in the form of letters of credit. Collateral requirements can vary depending upon the level of unsecured credit extended by counterparties, changes in market prices relative to contractual commitments and other factors. See Note 4 for a discussion of fair value of derivative instruments. The following table summarizes the gross and net fair values of SCE's commodity derivative instruments:
|
December 31, 2014
|
||||||||||||||||||||||||||||
|
|
Derivative Assets
|
Derivative Liabilities
|
Net
Liability |
|||||||||||||||||||||||||
|
(in millions)
|
Short-Term
|
Long-Term
|
Subtotal
|
Short-Term
|
Long-Term
|
Subtotal
|
||||||||||||||||||||||
|
Commodity derivative contracts
|
|
|
|
|
|
|
||||||||||||||||||||||
|
Gross amounts recognized
|
$
|
104
|
|
$
|
219
|
|
$
|
323
|
|
$
|
259
|
|
$
|
1,052
|
|
$
|
1,311
|
|
$
|
988
|
|
|||||||
|
Gross amounts offset in consolidated balance sheets
|
(2
|
)
|
—
|
|
(2
|
)
|
(2
|
)
|
—
|
|
(2
|
)
|
—
|
|
||||||||||||||
|
Cash collateral posted
1
|
—
|
|
—
|
|
—
|
|
(61
|
)
|
—
|
|
(61
|
)
|
(61
|
)
|
||||||||||||||
|
Net amounts presented in the consolidated balance sheets
|
$
|
102
|
|
$
|
219
|
|
$
|
321
|
|
$
|
196
|
|
$
|
1,052
|
|
$
|
1,248
|
|
$
|
927
|
|
|||||||
|
December 31, 2013
|
||||||||||||||||||||||||||||
|
|
Derivative Assets
|
Derivative Liabilities
|
Net
Liability |
|||||||||||||||||||||||||
|
(in millions)
|
Short-Term
|
Long-Term
|
Subtotal
|
Short-Term
|
Long-Term
|
Subtotal
|
||||||||||||||||||||||
|
Commodity derivative contracts
|
||||||||||||||||||||||||||||
|
Gross amounts recognized
|
$
|
141
|
|
$
|
251
|
|
$
|
392
|
|
$
|
178
|
|
$
|
1,045
|
|
$
|
1,223
|
|
$
|
831
|
|
|||||||
|
Gross amounts offset in consolidated balance sheets
|
(19
|
)
|
—
|
|
(19
|
)
|
(19
|
)
|
—
|
|
(19
|
)
|
—
|
|
||||||||||||||
|
Cash collateral posted
1
|
—
|
|
—
|
|
—
|
|
(7
|
)
|
(3
|
)
|
(10
|
)
|
(10
|
)
|
||||||||||||||
|
Net amounts presented in the consolidated balance sheets
|
$
|
122
|
|
$
|
251
|
|
$
|
373
|
|
$
|
152
|
|
$
|
1,042
|
|
$
|
1,194
|
|
$
|
821
|
|
|||||||
|
1
|
In addition, at
December 31, 2014
and
2013
, SCE had posted
$36 million
and
$19 million
, respectively, of collateral that is not offset against derivative liabilities and is reflected in "Other current assets" on the consolidated balance sheets.
|
69
Income Statement Impact of Derivative Instruments
SCE recognizes realized gains and losses on derivative instruments as purchased power expense and expects that such gains or losses will be part of the purchase power costs recovered from customers. As a result, realized gains and losses do not affect earnings, but may temporarily affect cash flows. Due to expected future recovery from customers, unrealized gains and losses are recorded as regulatory assets and liabilities and therefore also do not affect earnings. The results of derivative activities and related regulatory offsets are recorded in cash flows from operating activities in the consolidated statements of cash flows.
The following table summarizes the components of SCE's economic hedging activity:
|
|
Years ended December 31,
|
|||||||||||
|
(in millions)
|
2014
|
2013
|
2012
|
|||||||||
|
Realized losses
|
$
|
(57
|
)
|
$
|
(56
|
)
|
$
|
(227
|
)
|
|||
|
Unrealized gains (losses)
|
(147
|
)
|
93
|
|
125
|
|
||||||
Notional Volumes of Derivative Instruments
The following table summarizes the notional volumes of derivatives used for SCE hedging activities:
|
|
|
Economic Hedges
|
|||
|
Unit of
|
December 31,
|
||||
|
Commodity
|
Measure
|
2014
|
2013
|
||
|
Electricity options, swaps and forwards
|
GWh
|
3,618
|
|
6,274
|
|
|
Natural gas options, swaps and forwards
|
Bcf
|
83
|
|
12
|
|
|
Congestion revenue rights
|
GWh
|
122,859
|
|
149,234
|
|
|
Tolling arrangements
|
GWh
|
79,989
|
|
87,991
|
|
Current and Deferred Taxes
Edison International's sources of income (loss) before income taxes are:
|
Years ended December 31,
|
||||||||||||
|
(in millions)
|
2014
|
2013
|
2012
|
|||||||||
|
Income from continuing operations before income taxes
|
$
|
1,979
|
|
$
|
1,221
|
|
$
|
1,861
|
|
|||
|
Discontinued operations before income taxes
|
(525
|
)
|
—
|
|
(2,235
|
)
|
||||||
|
Income (loss) before income tax
|
$
|
1,454
|
|
$
|
1,221
|
|
$
|
(374
|
)
|
|||
70
The components of income tax expense (benefit) by location of taxing jurisdiction are:
|
Edison International
|
SCE
|
||||||||||||||||||||||
|
Years ended December 31,
|
|||||||||||||||||||||||
|
(in millions)
|
2014
|
2013
|
2012
|
2014
|
2013
|
2012
|
|||||||||||||||||
|
Current:
|
|||||||||||||||||||||||
|
Federal
|
$
|
(99
|
)
|
$
|
(97
|
)
|
$
|
—
|
|
$
|
(89
|
)
|
$
|
(119
|
)
|
$
|
—
|
|
|||||
|
State
|
20
|
|
(9
|
)
|
—
|
|
101
|
|
(19
|
)
|
50
|
|
|||||||||||
|
(79
|
)
|
(106
|
)
|
—
|
|
12
|
|
(138
|
)
|
50
|
|
||||||||||||
|
Deferred:
|
|
|
|
|
|
|
|||||||||||||||||
|
Federal
|
454
|
|
317
|
|
132
|
|
476
|
|
345
|
|
136
|
|
|||||||||||
|
State
|
68
|
|
31
|
|
135
|
|
(14
|
)
|
72
|
|
28
|
|
|||||||||||
|
522
|
|
348
|
|
267
|
|
462
|
|
417
|
|
164
|
|
||||||||||||
|
Total continuing operations
|
443
|
|
242
|
|
267
|
|
474
|
|
279
|
|
214
|
|
|||||||||||
|
Discontinued operations
1
|
(710
|
)
|
(36
|
)
|
(549
|
)
|
—
|
|
—
|
|
—
|
|
|||||||||||
|
Total
|
$
|
(267
|
)
|
$
|
206
|
|
$
|
(282
|
)
|
$
|
474
|
|
$
|
279
|
|
$
|
214
|
|
|||||
|
1
|
See Note 15 for a discussion of discontinued operations related to EME.
|
The components of net accumulated deferred income tax liability are:
|
Edison International
|
SCE
|
||||||||||||||
|
December 31,
|
|||||||||||||||
|
(in millions)
|
2014
|
2013
|
2014
|
2013
|
|||||||||||
|
Deferred tax assets:
|
|||||||||||||||
|
Property and software related
|
$
|
572
|
|
$
|
523
|
|
$
|
571
|
|
$
|
523
|
|
|||
|
Nuclear decommissioning trust assets in excess of nuclear ARO liability
|
441
|
|
569
|
|
441
|
|
569
|
|
|||||||
|
Loss and credit carryforwards
|
1,657
|
|
2,228
|
|
205
|
|
427
|
|
|||||||
|
Regulatory balancing accounts
|
18
|
|
139
|
|
18
|
|
139
|
|
|||||||
|
Pension and PBOPs
|
510
|
|
283
|
|
321
|
|
105
|
|
|||||||
|
Other
|
582
|
|
712
|
|
445
|
|
544
|
|
|||||||
|
Sub-total
|
3,780
|
|
4,454
|
|
2,001
|
|
2,307
|
|
|||||||
|
Less valuation allowance
|
29
|
|
1,380
|
|
—
|
|
—
|
|
|||||||
|
Total
|
3,751
|
|
3,074
|
|
2,001
|
|
2,307
|
|
|||||||
|
Deferred tax liabilities:
|
|
|
|
|
|||||||||||
|
Property-related
|
8,709
|
|
7,879
|
|
8,699
|
|
7,869
|
|
|||||||
|
Capitalized software costs
|
285
|
|
318
|
|
285
|
|
318
|
|
|||||||
|
Regulatory balancing accounts
|
577
|
|
625
|
|
577
|
|
625
|
|
|||||||
|
Nuclear decommissioning trust assets
|
441
|
|
569
|
|
441
|
|
569
|
|
|||||||
|
PBOPs
|
227
|
|
6
|
|
227
|
|
6
|
|
|||||||
|
Other
|
274
|
|
497
|
|
171
|
|
393
|
|
|||||||
|
Total
|
10,513
|
|
9,894
|
|
10,400
|
|
9,780
|
|
|||||||
|
Accumulated deferred income tax liability, net
|
$
|
6,762
|
|
$
|
6,820
|
|
$
|
8,399
|
|
$
|
7,473
|
|
|||
|
Classification of accumulated deferred income taxes, net:
|
|
|
|
|
|||||||||||
|
Included in deferred credits and other liabilities
|
$
|
7,214
|
|
$
|
7,241
|
|
$
|
8,190
|
|
$
|
7,737
|
|
|||
|
Included in current liabilities (assets)
|
(452
|
)
|
(421
|
)
|
209
|
|
(264
|
)
|
|||||||
71
Net Operating Loss and Tax Credit Carryforwards
The amounts of loss and credit carryforwards (after-tax) are as follows:
|
Edison International
|
SCE
|
||||||||||||||
|
December 31, 2014
|
|||||||||||||||
|
(in millions)
|
Loss Carryforwards
|
Credit Carryforwards
|
Loss Carryforwards
|
Credit Carryforwards
|
|||||||||||
|
2015 to 2019
|
$
|
3
|
|
$
|
—
|
|
$
|
14
|
|
$
|
—
|
|
|||
|
2020 to 2033
|
1,213
|
|
405
|
|
132
|
|
39
|
|
|||||||
|
No expiration date
|
—
|
|
36
|
|
—
|
|
20
|
|
|||||||
|
Total
|
$
|
1,216
|
|
$
|
441
|
|
$
|
146
|
|
$
|
59
|
|
|||
As of
December 31, 2014
, Edison International and SCE had federal net operating loss carryforwards related to the tax benefit on employee stock plans that would be recorded to additional paid-in capital when realized for the amount of
$42 million
and
$22 million
.
Change in Valuation Allowance Related to EME
EME's Plan of Reorganization, filed in December 2013, provided for the transfer of Edison International's ownership interest to the creditors which would result in a tax deconsolidation of EME. Under federal and state tax regulations, the tax deconsolidation of EME would reduce the amounts of net operating loss and tax credits carryforwards that Edison International would be eligible to use in future periods. As a result of EME's Plan of Reorganization that would result in a tax deconsolidation of EME, Edison International recorded a valuation allowance of
$1.38 billion
based on the estimated amount of such benefits as calculated under the applicable federal and state tax regulations as of December 31, 2013.
On April 1, 2014, under the Amended Plan of Reorganization, EME emerged from bankruptcy free of liabilities but remained an indirect wholly-owned subsidiary of Edison International, which will continue to be consolidated with Edison International for income tax purposes. Edison International anticipates realization of the federal and California tax benefits before they expire. Therefore, the valuation allowance on the federal and California tax benefits that Edison International recorded in 2013 was released in 2014. See Note 15 for discontinued operations related to the EME bankruptcy.
Effective Tax Rate
The table below provides a reconciliation of income tax expense computed at the federal statutory income tax rate to the income tax provision:
72
|
Edison International
|
SCE
|
||||||||||||||||||||||
|
|
Years ended December 31,
|
||||||||||||||||||||||
|
(in millions)
|
2014
|
2013
|
2012
|
2014
|
2013
|
2012
|
|||||||||||||||||
|
Income from continuing operations before income taxes
|
$
|
1,979
|
|
$
|
1,221
|
|
$
|
1,861
|
|
$
|
2,039
|
|
$
|
1,279
|
|
$
|
1,874
|
|
|||||
|
Provision for income tax at federal statutory rate of 35%
|
693
|
|
427
|
|
652
|
|
714
|
|
448
|
|
656
|
|
|||||||||||
|
Increase (decrease) in income tax from:
|
|
|
|
|
|
|
|
|
|
|
|||||||||||||
|
Items presented with related state income tax, net:
|
|
|
|
|
|
|
|
|
|
|
|||||||||||||
|
Repair deductions
|
—
|
|
—
|
|
(231
|
)
|
—
|
|
—
|
|
(231
|
)
|
|||||||||||
|
State tax, net of federal benefit
|
56
|
|
18
|
|
108
|
|
55
|
|
34
|
|
54
|
|
|||||||||||
|
Property-related
1
|
(252
|
)
|
(216
|
)
|
(223
|
)
|
(252
|
)
|
(216
|
)
|
(223
|
)
|
|||||||||||
|
Accumulated deferred income tax adjustments
|
—
|
|
—
|
|
(41
|
)
|
—
|
|
—
|
|
(41
|
)
|
|||||||||||
|
Change related to uncertain tax positions
|
5
|
|
14
|
|
40
|
|
12
|
|
14
|
|
36
|
|
|||||||||||
|
San Onofre OII settlement
|
(23
|
)
|
24
|
|
—
|
|
(23
|
)
|
24
|
|
—
|
|
|||||||||||
|
Other
|
(36
|
)
|
(25
|
)
|
(38
|
)
|
(32
|
)
|
(25
|
)
|
(37
|
)
|
|||||||||||
|
Total income tax expense from continuing operations
|
$
|
443
|
|
$
|
242
|
|
$
|
267
|
|
$
|
474
|
|
$
|
279
|
|
$
|
214
|
|
|||||
|
Effective tax rate
|
22.4
|
%
|
19.8
|
%
|
14.3
|
%
|
23.2
|
%
|
21.8
|
%
|
11.4
|
%
|
|||||||||||
|
1
|
Includes incremental repair benefit recorded in 2012 to 2014. See discussion of repair deductions below.
|
The CPUC requires flow-through ratemaking treatment for the current tax benefit arising from certain property-related and other temporary differences which reverse over time. Flow-through items reduce current authorized revenue requirements in SCE's rate cases and result in a regulatory asset for recovery of deferred income taxes in future periods. The difference between the authorized amounts in SCE's rate cases and the recorded flow-through items also result in increases or decreases in regulatory assets with a corresponding impact on the effective tax rate to the extent that recorded deferred amounts are expected to be recovered in future rates.
Repair Deductions
Edison International made a voluntary election in 2009 to change its tax accounting method for certain tax repair costs incurred on SCE's transmission, distribution and generation assets. Regulatory treatment for the 2009
–
2011 incremental repair deductions taken after the 2009 tax accounting method change resulted in SCE recognizing a
$231 million
earnings benefit in 2012. Incremental repair deductions represent amounts recognized for regulatory accounting purposes in excess of amounts included in the authorized revenue requirements through the General Rate Case ("GRC") proceedings. Incremental repair deductions for the years 2012 – 2014 resulted in additional income tax benefits of
$133 million
in 2014,
$89 million
in 2013, and
$115 million
in 2012.
SCE included estimated repair deductions in its 2015 GRC currently before the CPUC. As part of these proceedings, TURN recommended a reduction in revenue requirement related to repair deductions that originated during the period 2012
–
2014. SCE cannot predict the outcome of the 2015 GRC related to the treatment of repair deductions for prior periods.
Accounting for Uncertainty in Income Taxes
Authoritative guidance related to accounting for uncertainty in income taxes requires an enterprise to recognize, in its financial statements, the best estimate of the impact of a tax position by determining if the weight of the available evidence indicates it is more likely than not, based solely on the technical merits, that the position will be sustained upon examination. The guidance requires the disclosure of all unrecognized tax benefits, which includes both the reserves recorded for tax positions on filed tax returns and the unrecognized portion of affirmative claims.
73
Unrecognized Tax Benefits
The following table provides a reconciliation of unrecognized tax benefits for continuing and discontinued operations:
|
Edison International
|
SCE
|
||||||||||||||||||||||
|
December 31,
|
|||||||||||||||||||||||
|
(in millions)
|
2014
|
2013
|
2012
|
2014
|
2013
|
2012
|
|||||||||||||||||
|
Balance at January 1,
|
$
|
815
|
|
$
|
812
|
|
$
|
631
|
|
$
|
532
|
|
$
|
571
|
|
$
|
373
|
|
|||||
|
Tax positions taken during the current year:
|
|||||||||||||||||||||||
|
Increases
|
65
|
|
19
|
|
33
|
|
57
|
|
22
|
|
35
|
|
|||||||||||
|
Tax positions taken during a prior year:
|
|||||||||||||||||||||||
|
Increases
|
1
|
|
43
|
|
177
|
|
—
|
|
45
|
|
169
|
|
|||||||||||
|
Decreases
1
|
(143
|
)
|
(109
|
)
|
(11
|
)
|
(93
|
)
|
(106
|
)
|
(6
|
)
|
|||||||||||
|
Increases (decreases) – deconsolidation of EME
2
|
—
|
|
50
|
|
(18
|
)
|
—
|
|
—
|
|
—
|
|
|||||||||||
|
Decreases for settlements during the period
3
|
(162
|
)
|
—
|
|
—
|
|
(55
|
)
|
—
|
|
—
|
|
|||||||||||
|
Balance at December 31,
|
$
|
576
|
|
$
|
815
|
|
$
|
812
|
|
$
|
441
|
|
$
|
532
|
|
$
|
571
|
|
|||||
|
1
|
Decreases in prior year tax positions relate primarily to re-measurement of uncertain tax positions in connection with the settlement of the 2003
–
2006 IRS audit.
|
|
2
|
Unrecognized tax benefits of EME have been deconsolidated as a result of the bankruptcy filing by EME, except for tax liabilities for which Edison International and EME are jointly liable under the Internal Revenue Code and applicable state statutes. See Note 15 for further information. During 2013, Edison International increased the amount of unrecognized tax benefits related to the taxable gain on sale of EME’s international assets by approximately
$50 million
as a result of unfavorable developments during the fourth quarter of 2013.
|
|
3
|
In the fourth quarter of 2014, Edison International has settled all open tax positions with the IRS for taxable year 2003 through 2006. Edison International has previously made cash deposits which are sufficient to settle all outstanding liabilities for this audit cycle. Total liabilities included tax reserves, previously settled issues and the associated interest and penalties.
|
As of
December 31, 2014
and
2013
, if recognized,
$503 million
and
$653 million
respectively, of the unrecognized tax benefits would impact Edison International's effective tax rate; and
$370 million
and
$374 million
, respectively, of the unrecognized tax benefits would impact SCE's effective tax rate.
SCE estimates the amount of unrecognized regulatory tax benefits for flow-through tax items using the same accounting guidance for uncertain tax positions. Accordingly, a change in the amount of flow-through tax items from an audit by a tax authority impacts the amount of regulatory tax benefits recognized by SCE. It is reasonably possible that within the next 12 months unrecognized tax benefits may decrease by approximately
$96 million
due to a change in estimate of a tax position subject to flow through regulatory treatment.
Tax Disputes
Tax Years 2007 – 2009
The IRS examination phase of tax years 2007 through 2009 was completed during the first quarter of 2013. Edison International received a Revenue Agent Report from the IRS on February 28, 2013 which included a proposed adjustment to disallow a component of SCE's percentage
repair allowance deduction. The proposed adjustment to disallow a component of SCE's percentage repair allowance deduction, if sustained, would result in a federal tax liability of approximately
$76 million
, including interest through
December 31, 2014
. In December 2014, Edison International reached a tentative agreement with the IRS regarding SCE's percentage repair allowance deduction for 2007 to 2009, which if finalized, would result in a federal tax liability of approximately
$16 million
, including interest through
December 31, 2014
.
74
Tax Years 2010 – 2012
A Revenue Agent Report from the IRS is expected to be received from the examination phase of tax years 2010 through 2012 within the next six months. After receipt of the Revenue Agent Report, SCE expects to update its assessment of uncertain tax positions.
Accrued Interest and Penalties
The total amount of accrued interest and penalties related to income tax liabilities for continuing and discontinued operations are:
|
Edison International
|
SCE
|
||||||||||||||
|
Years ended December 31,
|
|||||||||||||||
|
(in millions)
|
2014
|
2013
|
2014
|
2013
|
|||||||||||
|
Accrued interest and penalties
|
$
|
338
|
|
$
|
406
|
|
$
|
64
|
|
$
|
88
|
|
|||
The net after-tax interest and penalties recognized in income tax expense for continuing and discontinued operations are:
|
Edison International
|
SCE
|
||||||||||||||||||||||
|
December 31,
|
|||||||||||||||||||||||
|
(in millions)
|
2014
|
2013
|
2012
|
2014
|
2013
|
2012
|
|||||||||||||||||
|
Net after-tax interest and penalties tax benefit (expense)
|
$
|
41
|
|
$
|
(3
|
)
|
$
|
(10
|
)
|
$
|
16
|
|
$
|
2
|
|
$
|
(11
|
)
|
|||||
Employee Savings Plan
The 401(k) defined contribution savings plan is designed to supplement employees' retirement income. The following employer contributions were made for continuing operations:
|
Edison International
|
SCE
|
||||||
|
(in millions)
|
Years ended December 31,
|
||||||
|
2014
|
$
|
71
|
|
$
|
70
|
|
|
|
2013
|
76
|
|
76
|
|
|||
|
2012
|
85
|
|
84
|
|
|||
Pension Plans and Postretirement Benefits Other Than Pensions
Pension Plans
Noncontributory defined benefit pension plans (some with cash balance features) cover most employees meeting minimum service requirements. SCE recognizes pension expense for its nonexecutive plan as calculated by the actuarial method used for ratemaking. The expected contributions (all by the employer) for Edison International and SCE are approximately
$119 million
and
$92 million
, respectively, for the year ending
December 31, 2015
. Annual contributions made by SCE to most of SCE's pension plans are anticipated to be recovered through CPUC-approved regulatory mechanisms. Annual contributions to these plans are expected to be, at a minimum, equal to the related annual expense.
The funded position of Edison International's pension is sensitive to changes in market conditions. Changes in overall interest rate levels significantly affect the company's liabilities, while assets held in the various trusts established to fund Edison International's long-term pension are affected by movements in the equity and bond markets. Due to SCE's regulatory recovery treatment, a regulatory asset has been recorded equal to the unfunded status (See Note 10).
75
Information on pension plan assets and benefit obligations for continuing and discontinued operations is shown below.
|
Edison International
|
SCE
|
||||||||||||||
|
Years ended December 31,
|
|||||||||||||||
|
(in millions)
|
2014
|
2013
|
2014
|
2013
|
|||||||||||
|
Change in projected benefit obligation
|
|
|
|||||||||||||
|
Projected benefit obligation at beginning of year
|
$
|
4,178
|
|
$
|
4,948
|
|
$
|
3,721
|
|
$
|
4,434
|
|
|||
|
Service cost
|
133
|
|
174
|
|
124
|
|
154
|
|
|||||||
|
Interest cost
|
181
|
|
182
|
|
159
|
|
164
|
|
|||||||
|
Actuarial (gain) loss
|
469
|
|
(330
|
)
|
386
|
|
(277
|
)
|
|||||||
|
Curtailment gain
|
(5
|
)
|
—
|
|
—
|
|
—
|
|
|||||||
|
Benefits paid
|
(449
|
)
|
(796
|
)
|
(391
|
)
|
(754
|
)
|
|||||||
|
Other
|
10
|
|
—
|
|
—
|
|
—
|
|
|||||||
|
Projected benefit obligation at end of year
|
$
|
4,517
|
|
$
|
4,178
|
|
$
|
3,999
|
|
$
|
3,721
|
|
|||
|
Change in plan assets
|
|
|
|
|
|||||||||||
|
Fair value of plan assets at beginning of year
|
$
|
3,477
|
|
$
|
3,542
|
|
$
|
3,236
|
|
$
|
3,320
|
|
|||
|
Actual return on plan assets
|
257
|
|
540
|
|
240
|
|
505
|
|
|||||||
|
Employer contributions
|
169
|
|
191
|
|
132
|
|
165
|
|
|||||||
|
Benefits paid
|
(449
|
)
|
(796
|
)
|
(391
|
)
|
(754
|
)
|
|||||||
|
Fair value of plan assets at end of year
|
$
|
3,454
|
|
$
|
3,477
|
|
$
|
3,217
|
|
$
|
3,236
|
|
|||
|
Funded status at end of year
|
$
|
(1,063
|
)
|
$
|
(701
|
)
|
$
|
(782
|
)
|
$
|
(485
|
)
|
|||
|
Amounts recognized in the consolidated balance sheets consist of
1
:
|
|||||||||||||||
|
Current liabilities
|
$
|
(27
|
)
|
$
|
(15
|
)
|
$
|
(5
|
)
|
$
|
(5
|
)
|
|||
|
Long-term liabilities
|
(1,036
|
)
|
(686
|
)
|
(777
|
)
|
(480
|
)
|
|||||||
|
$
|
(1,063
|
)
|
$
|
(701
|
)
|
$
|
(782
|
)
|
$
|
(485
|
)
|
||||
|
Amounts recognized in accumulated other comprehensive loss consist of:
|
|||||||||||||||
|
Net loss
|
$
|
102
|
|
$
|
30
|
|
$
|
31
|
|
$
|
33
|
|
|||
|
Amounts recognized as a regulatory asset:
|
|
|
|
|
|||||||||||
|
Prior service cost
|
$
|
20
|
|
$
|
25
|
|
$
|
20
|
|
$
|
25
|
|
|||
|
Net loss
|
640
|
|
328
|
|
640
|
|
328
|
|
|||||||
|
$
|
660
|
|
$
|
353
|
|
$
|
660
|
|
$
|
353
|
|
||||
|
Total not yet recognized as expense
|
$
|
762
|
|
$
|
383
|
|
$
|
691
|
|
$
|
386
|
|
|||
|
Accumulated benefit obligation at end of year
|
$
|
4,356
|
|
$
|
4,015
|
|
$
|
3,881
|
|
$
|
3,599
|
|
|||
|
Pension plans with an accumulated benefit obligation in excess of plan assets:
|
|||||||||||||||
|
Projected benefit obligation
|
$
|
4,517
|
|
$
|
4,178
|
|
$
|
3,999
|
|
$
|
3,721
|
|
|||
|
Accumulated benefit obligation
|
4,356
|
|
4,015
|
|
3,881
|
|
3,599
|
|
|||||||
|
Fair value of plan assets
|
3,454
|
|
3,477
|
|
3,217
|
|
3,236
|
|
|||||||
|
Weighted-average assumptions used to determine obligations at end of year:
|
|||||||||||||||
|
Discount rate
|
3.85
|
%
|
4.75
|
%
|
3.85
|
%
|
4.75
|
%
|
|||||||
|
Rate of compensation increase
|
4.0
|
%
|
4.0
|
%
|
4.0
|
%
|
4.0
|
%
|
|||||||
|
1
|
The SCE liability excludes a long-term payable due to Edison International Parent of
$121 million
and
$95 million
at December 31, 2014 and 2013, respectively, related to certain SCE postretirement benefit obligations transferred to Edison International Parent.
|
Edison International and SCE adopted new mortality tables that the Society of Actuaries released in October 2014 that reflect an increase in life expectancy. At
December 31, 2014
, this adoption resulted in an increase in Edison International's pension plans' projected benefit obligation of
$214 million
, including
$199 million
for SCE.
76
Pension expense components for continuing operations are:
|
Edison International
|
SCE
|
||||||||||||||||||||||
|
|
Years ended December 31,
|
||||||||||||||||||||||
|
(in millions)
|
2014
|
2013
|
2012
|
2014
|
2013
|
2012
|
|||||||||||||||||
|
Service cost
|
$
|
133
|
|
$
|
162
|
|
$
|
163
|
|
$
|
128
|
|
$
|
159
|
|
$
|
160
|
|
|||||
|
Interest cost
|
181
|
|
170
|
|
183
|
|
164
|
|
167
|
|
180
|
|
|||||||||||
|
Expected return on plan assets
|
(229
|
)
|
(222
|
)
|
(217
|
)
|
(213
|
)
|
(222
|
)
|
(217
|
)
|
|||||||||||
|
Settlement costs
1
|
45
|
|
87
|
|
5
|
|
42
|
|
85
|
|
4
|
|
|||||||||||
|
Curtailment gain
|
(4
|
)
|
—
|
|
—
|
|
—
|
|
—
|
|
—
|
|
|||||||||||
|
Amortization of prior service cost
|
5
|
|
5
|
|
3
|
|
5
|
|
5
|
|
3
|
|
|||||||||||
|
Amortization of net loss
2
|
12
|
|
39
|
|
61
|
|
7
|
|
35
|
|
57
|
|
|||||||||||
|
Expense under accounting standards
|
143
|
|
241
|
|
198
|
|
133
|
|
229
|
|
187
|
|
|||||||||||
|
Regulatory adjustment (deferred)
|
8
|
|
(53
|
)
|
(19
|
)
|
8
|
|
(53
|
)
|
(19
|
)
|
|||||||||||
|
Total expense recognized
|
$
|
151
|
|
$
|
188
|
|
$
|
179
|
|
$
|
141
|
|
$
|
176
|
|
$
|
168
|
|
|||||
|
1
|
Includes the amount of net loss reclassified from other comprehensive loss. The amount reclassified for Edison International was
$3 million
and
$2 million
for the years ended
December 31, 2014
and
2013
, respectively.
|
|
2
|
Includes the amount of net loss reclassified from other comprehensive loss. The amount reclassified for Edison International and SCE was
$9 million
and
$4 million
, respectively, for the year ended
December 31, 2014
. The amount reclassified for Edison International and SCE was
$11 million
and
$7 million
, respectively, for the year ended
December 31, 2013
.
|
Under GAAP, a settlement is recorded when lump-sum payments exceed estimated annual service and interest costs. Lump-sum payments to employees retiring in 2014 and 2013 from the SCE Retirement Plan (primarily due to workforce reductions described below) exceeded the estimated service and interest costs for those years. A settlement requires re-measurement of both the plan pension obligations and plan assets as of the date of the settlement. Re-measurement assumption changes result in actuarial gains and losses which are combined with previous unrecognized gains and losses. After re-measurement, GAAP requires an acceleration of a portion of unrecognized net losses attributable to such lump-sum payments as additional pension expense as reflected in the above table. The additional pension expense related to SCE did not impact net income as such amounts are probable of recovery through future rates.
The SCE Retirement Plan experienced total actuarial losses of
$374 million
, including
$357 million
for SCE during 2014 and gains of
$563 million
, including
$558 million
for SCE during 2013. The actuarial losses in 2014 were primarily due to a decrease in the discount rate (from
4.75%
at December 31, 2013 to
4.00%
as of August 31, 2014 and
3.85%
as of December 31, 2014) due to lower interest rates. The actuarial gains in 2013 were primarily due to an increase in the discount rate (from
3.75%
at
December 31, 2012
to
4.25%
as of May 31, 2013,
4.50%
as of August 31, 2013 and
4.75%
as of
December 31, 2013
) due to higher interest rates and better than expected performance of the plan assets.
77
Other changes in pension plan assets and benefit obligations recognized in other comprehensive loss for continuing operations:
|
Edison International
|
SCE
|
||||||||||||||||||||||
|
Years ended December 31,
|
|||||||||||||||||||||||
|
(in millions)
|
2014
|
2013
|
2012
|
2014
|
2013
|
2012
|
|||||||||||||||||
|
Net (gain) loss
|
$
|
85
|
|
$
|
(33
|
)
|
$
|
36
|
|
$
|
37
|
|
$
|
(24
|
)
|
$
|
20
|
|
|||||
|
Amortization of net loss and other
|
(13
|
)
|
(13
|
)
|
(10
|
)
|
(4
|
)
|
(7
|
)
|
(6
|
)
|
|||||||||||
|
Total recognized in other comprehensive loss
|
$
|
72
|
|
$
|
(46
|
)
|
$
|
26
|
|
$
|
33
|
|
$
|
(31
|
)
|
$
|
14
|
|
|||||
|
Total recognized in expense and other comprehensive loss
|
$
|
223
|
|
$
|
142
|
|
$
|
205
|
|
$
|
174
|
|
$
|
145
|
|
$
|
182
|
|
|||||
In accordance with authoritative guidance on rate-regulated enterprises, SCE records regulatory assets and liabilities instead of charges and credits to other comprehensive income (loss) for the portion of SCE's postretirement benefit plans that are recoverable in utility rates. The estimated pension amounts that will be amortized to expense in
2015
for continuing operations are as follows:
|
(in millions)
|
Edison International
|
SCE
|
|||||
|
Unrecognized net loss to be amortized
1
|
$
|
34
|
|
$
|
30
|
|
|
|
Unrecognized prior service cost to be amortized
|
5
|
|
5
|
|
|||
|
1
|
The amount of net loss expected to be reclassified from other comprehensive loss for Edison International's continuing operations and SCE is
$12 million
and
$8 million
, respectively.
|
Edison International and SCE used the following weighted-average assumptions to determine pension expense for continuing operations:
|
Years ended December 31,
|
||||||||
|
|
2014
|
2013
|
2012
|
|||||
|
Discount rate
|
4.5
|
%
|
4.13
|
%
|
4.5
|
%
|
||
|
Rate of compensation increase
|
4.0
|
%
|
4.5
|
%
|
4.5
|
%
|
||
|
Expected long-term return on plan assets
|
7.0
|
%
|
7.0
|
%
|
7.5
|
%
|
||
The following benefit payments, which reflect expected future service, are expected to be paid:
|
Edison International
|
SCE
|
||||||
|
(in millions)
|
Years ended December 31,
|
||||||
|
2015
|
$
|
489
|
|
$
|
448
|
|
|
|
2016
|
302
|
|
261
|
|
|||
|
2017
|
302
|
|
263
|
|
|||
|
2018
|
303
|
|
273
|
|
|||
|
2019
|
316
|
|
281
|
|
|||
|
2020 – 2024
|
1,557
|
|
1,414
|
|
|||
78
Postretirement Benefits Other Than Pensions ("PBOP(s)")
Most employees retiring at or after age
55
with at least
10
years of service may be eligible for postretirement medical, dental, vision and life insurance benefits. Eligibility for a company contribution toward the cost of these benefits in retirement depends on a number of factors, including the employee's years of service, hire date, and retirement date. Under the terms of the Edison International Health and Welfare Plan ("PBOP Plan") each participating employer (Edison International or its participating subsidiaries) is responsible for the costs and expenses of all PBOP benefits with respect to its employees and former employees. A participating employer may terminate the PBOP benefits with respect to its employees and former employees, as may SCE (as Plan sponsor), and, accordingly, the participants' PBOP benefits are not vested benefits.
The expected contributions (substantially all of which are expected to be made by SCE) for PBOP benefits are
$59 million
for the year ended
December 31, 2015
. Annual contributions related to SCE employees made to SCE plans are anticipated to be recovered through CPUC-approved regulatory mechanisms and are expected to be, at a minimum, equal to the total annual expense for these plans.
SCE has established three voluntary employee beneficiary associations trusts ("VEBA Trusts") that can only be used to pay for retiree health care benefits of SCE. Once funded into the VEBA Trusts, neither SCE nor Edison International can subsequently terminate benefits and recover remaining amounts in the VEBA Trusts. Participants of the PBOP Plan do not have a beneficial interest in the VEBA Trusts. The VEBA Trust assets are sensitive to changes in market conditions. Changes in overall interest rate levels significantly affect the company's liabilities, while assets held in the various trusts established to fund Edison International's other postretirement benefits are affected by movements in the equity and bond markets. Due to SCE's regulatory recovery treatment, the unfunded status is offset by a regulatory asset.
79
Information on PBOP Plan assets and benefit obligations is shown below:
|
Edison International
|
SCE
|
||||||||||||||
|
Years ended December 31,
|
|||||||||||||||
|
(in millions)
|
2014
|
2013
|
2014
|
2013
|
|||||||||||
|
Change in benefit obligation
|
|
|
|||||||||||||
|
Benefit obligation at beginning of year
|
$
|
2,220
|
|
$
|
2,460
|
|
$
|
2,211
|
|
$
|
2,452
|
|
|||
|
Service cost
|
40
|
|
49
|
|
40
|
|
48
|
|
|||||||
|
Interest cost
|
117
|
|
98
|
|
117
|
|
97
|
|
|||||||
|
Special termination benefits
|
3
|
|
11
|
|
3
|
|
11
|
|
|||||||
|
Actuarial (gain) loss
|
582
|
|
(313
|
)
|
582
|
|
(312
|
)
|
|||||||
|
Plan participants' contributions
|
19
|
|
18
|
|
19
|
|
18
|
|
|||||||
|
Benefits paid
|
(197
|
)
|
(103
|
)
|
(197
|
)
|
(103
|
)
|
|||||||
|
Benefit obligation at end of year
|
$
|
2,784
|
|
$
|
2,220
|
|
$
|
2,775
|
|
$
|
2,211
|
|
|||
|
Change in plan assets
|
|
|
|
|
|||||||||||
|
Fair value of plan assets at beginning of year
|
$
|
2,065
|
|
$
|
1,800
|
|
$
|
2,065
|
|
$
|
1,800
|
|
|||
|
Actual return on assets
|
180
|
|
317
|
|
180
|
|
317
|
|
|||||||
|
Employer contributions
|
19
|
|
33
|
|
19
|
|
33
|
|
|||||||
|
Plan participants' contributions
|
19
|
|
18
|
|
19
|
|
18
|
|
|||||||
|
Benefits paid
|
(197
|
)
|
(103
|
)
|
(197
|
)
|
(103
|
)
|
|||||||
|
Fair value of plan assets at end of year
|
$
|
2,086
|
|
$
|
2,065
|
|
$
|
2,086
|
|
$
|
2,065
|
|
|||
|
Funded status at end of year
|
$
|
(698
|
)
|
$
|
(155
|
)
|
$
|
(689
|
)
|
$
|
(146
|
)
|
|||
|
Amounts recognized in the consolidated balance sheets consist of:
|
|||||||||||||||
|
Current liabilities
|
$
|
(15
|
)
|
$
|
(17
|
)
|
$
|
(15
|
)
|
$
|
(16
|
)
|
|||
|
Long-term liabilities
|
(683
|
)
|
(138
|
)
|
(674
|
)
|
(130
|
)
|
|||||||
|
$
|
(698
|
)
|
$
|
(155
|
)
|
$
|
(689
|
)
|
$
|
(146
|
)
|
||||
|
Amounts recognized in accumulated other comprehensive loss consist of:
|
|
|
|
|
|||||||||||
|
Net loss
|
$
|
4
|
|
$
|
4
|
|
$
|
—
|
|
$
|
—
|
|
|||
|
Amounts recognized as a regulatory asset (liability):
|
|
|
|
|
|||||||||||
|
Prior service credit
|
$
|
(19
|
)
|
$
|
(54
|
)
|
$
|
(19
|
)
|
$
|
(54
|
)
|
|||
|
Net loss
|
577
|
|
69
|
|
577
|
|
69
|
|
|||||||
|
$
|
558
|
|
$
|
15
|
|
$
|
558
|
|
$
|
15
|
|
||||
|
Total not yet recognized as expense
|
$
|
562
|
|
$
|
19
|
|
$
|
558
|
|
$
|
15
|
|
|||
|
Weighted-average assumptions used to determine obligations at end of year:
|
|||||||||||||||
|
Discount rate
|
4.16
|
%
|
5.0
|
%
|
4.16
|
%
|
5.0
|
%
|
|||||||
|
Assumed health care cost trend rates:
|
|||||||||||||||
|
Rate assumed for following year
|
7.75
|
%
|
7.75
|
%
|
7.75
|
%
|
7.75
|
%
|
|||||||
|
Ultimate rate
|
5.0
|
%
|
5.0
|
%
|
5.0
|
%
|
5.0
|
%
|
|||||||
|
Year ultimate rate reached
|
2021
|
|
2020
|
|
2021
|
|
2020
|
|
|||||||
Edison International and SCE adopted new mortality tables that the Society of Actuaries released in October 2014 that reflect an increase in life expectancy. At
December 31, 2014
, this adoption resulted in an increase in Edison International's PBOP plans' accumulated projected benefit obligation of
$308 million
, including
$307 million
for SCE.
80
PBOP expense components for continuing operations are:
|
Edison International
|
SCE
|
||||||||||||||||||||||
|
|
Years ended December 31,
|
||||||||||||||||||||||
|
(in millions)
|
2014
|
2013
|
2012
|
2014
|
2013
|
2012
|
|||||||||||||||||
|
Service cost
|
$
|
40
|
|
$
|
49
|
|
$
|
47
|
|
$
|
40
|
|
$
|
48
|
|
$
|
47
|
|
|||||
|
Interest cost
|
117
|
|
98
|
|
108
|
|
117
|
|
97
|
|
108
|
|
|||||||||||
|
Expected return on plan assets
|
(108
|
)
|
(114
|
)
|
(108
|
)
|
(108
|
)
|
(114
|
)
|
(109
|
)
|
|||||||||||
|
Special termination benefits
1
|
3
|
|
11
|
|
2
|
|
3
|
|
11
|
|
2
|
|
|||||||||||
|
Amortization of prior service credit
|
(36
|
)
|
(36
|
)
|
(35
|
)
|
(35
|
)
|
(35
|
)
|
(35
|
)
|
|||||||||||
|
Amortization of net loss
|
6
|
|
24
|
|
39
|
|
5
|
|
24
|
|
39
|
|
|||||||||||
|
Total expense
|
$
|
22
|
|
$
|
32
|
|
$
|
53
|
|
$
|
22
|
|
$
|
31
|
|
$
|
52
|
|
|||||
|
1
|
Due to the reduction in workforce, SCE has incurred costs for extended retiree health care coverage.
|
In accordance with authoritative guidance on rate-regulated enterprises, SCE records regulatory assets and liabilities instead of charges and credits to other comprehensive income (loss) for the portion of SCE's postretirement benefit plans that are recoverable in utility rates. The estimated PBOP amounts that will be amortized to expense in
2015
for continuing operations are as follows:
|
(in millions)
|
Edison International
|
SCE
|
|||||
|
Unrecognized net loss to be amortized
|
$
|
23
|
|
$
|
23
|
|
|
|
Unrecognized prior service credit to be amortized
|
(12
|
)
|
(12
|
)
|
|||
Edison International and SCE used the following weighted-average assumptions to determine PBOP expense for continuing operations:
|
Years ended December 31,
|
||||||||
|
|
2014
|
2013
|
2012
|
|||||
|
Discount rate
|
5.0
|
%
|
4.25
|
%
|
4.75
|
%
|
||
|
Expected long-term return on plan assets
|
5.5
|
%
|
6.7
|
%
|
7.0
|
%
|
||
|
Assumed health care cost trend rates:
|
|
|
|
|||||
|
Current year
|
7.8
|
%
|
8.5
|
%
|
9.5
|
%
|
||
|
Ultimate rate
|
5.0
|
%
|
5.0
|
%
|
5.25
|
%
|
||
|
Year ultimate rate reached
|
2020
|
|
2020
|
|
2019
|
|
||
A one-percentage-point change in assumed health care cost trend rate would have the following effects on continuing operations:
|
Edison International
|
SCE
|
||||||||||||||
|
(in millions)
|
One-Percentage-Point Increase
|
One-Percentage-Point Decrease
|
One-Percentage-Point Increase
|
One-Percentage-Point Decrease
|
|||||||||||
|
Effect on accumulated benefit obligation as of December 31, 2014
|
$
|
335
|
|
$
|
(271
|
)
|
$
|
334
|
|
$
|
(270
|
)
|
|||
|
Effect on annual aggregate service and interest costs
|
15
|
|
(12
|
)
|
15
|
|
(12
|
)
|
|||||||
81
The following benefit payments are expected to be paid:
|
Edison International
|
SCE
|
||||||
|
(in millions)
|
Years ended December 31,
|
||||||
|
2015
|
$
|
108
|
|
$
|
108
|
|
|
|
2016
|
114
|
|
113
|
|
|||
|
2017
|
119
|
|
119
|
|
|||
|
2018
|
124
|
|
124
|
|
|||
|
2019
|
128
|
|
128
|
|
|||
|
2020 – 2024
|
707
|
|
705
|
|
|||
Plan Assets
Description of Pension and Postretirement Benefits Other than Pensions Investment Strategies
The investment of plan assets is overseen by a fiduciary investment committee. Plan assets are invested using a combination of asset classes, and may have active and passive investment strategies within asset classes. Target allocations for
2014
pension plan assets were
30%
for U.S. equities,
16%
for non-U.S. equities,
35%
for fixed income,
15%
for opportunistic and/or alternative investments and
4%
for other investments. Target allocations for
2014
PBOP plan assets (except for Represented VEBA which is
85%
for fixed income,
10%
for opportunistic/private equities, and
5%
global equities) are
41%
for U.S. equities,
17%
for non-U.S. equities,
34%
for fixed income,
7%
for opportunistic and/or alternative investments, and
1%
for other investments. Edison International employs multiple investment management firms. Investment managers within each asset class cover a range of investment styles and approaches. Risk is managed through diversification among multiple asset classes, managers, styles and securities. Plan, asset class and individual manager performance is measured against targets. Edison International also monitors the stability of its investment managers' organizations.
Allowable investment types include:
|
•
|
United States Equities: Common and preferred stocks of large, medium, and small companies which are predominantly United States-based.
|
|
•
|
Non-United States Equities: Equity securities issued by companies domiciled outside the United States and in depository receipts which represent ownership of securities of non-United States companies.
|
|
•
|
Fixed Income: Fixed income securities issued or guaranteed by the United States government, non-United States governments, government agencies and instrumentalities including municipal bonds, mortgage backed securities and corporate debt obligations. A portion of the fixed income positions may be held in debt securities that are below investment grade.
|
Opportunistic, Alternative and Other Investments:
|
•
|
Opportunistic: Investments in short to intermediate term market opportunities. Investments may have fixed income and/or equity characteristics and may be either liquid or illiquid.
|
|
•
|
Alternative: Limited partnerships that invest in non-publicly traded entities.
|
|
•
|
Other: Investments diversified among multiple asset classes such as global equity, fixed income currency and commodities markets. Investments are made in liquid instruments within and across markets. The investment returns are expected to approximate the plans' expected investment returns.
|
Asset class portfolio weights are permitted to range within plus or minus
3%
. Where approved by the fiduciary investment committee, futures contracts are used for portfolio rebalancing and to reallocate portfolio cash positions. Where authorized, a few of the plans' investment managers employ limited use of derivatives, including futures contracts, options, options on futures and interest rate swaps in place of direct investment in securities to gain efficient exposure to markets. Derivatives are not used to leverage the plans or any portfolios.
82
Determination of the Expected Long-Term Rate of Return on Assets
The overall expected long-term rate of return on assets assumption is based on the long-term target asset allocation for plan assets and capital markets return forecasts for asset classes employed. A portion of the PBOP trust asset returns are subject to taxation, so the expected long-term rate of return for these assets is determined on an after-tax basis.
Capital Markets Return Forecasts
SCE's capital markets return forecast methodologies primarily use a combination of historical market data, current market conditions, proprietary forecasting expertise, complex models to develop asset class return forecasts and a building block approach. The forecasts are developed using variables such as real risk-free interest, inflation, and asset class specific risk premiums. For equities, the risk premium is based on an assumed average equity risk premium of
5%
over cash. The forecasted return on private equity and opportunistic investments are estimated at a
2%
premium above public equity, reflecting a premium for higher volatility and lower liquidity. For fixed income, the risk premium is based off of a comprehensive modeling of credit spreads.
Fair Value of Plan Assets
The PBOP Plan and the Southern California Edison Company Retirement Plan Trust (Master Trust) assets include investments in equity securities, U.S. treasury securities, other fixed-income securities, common/collective funds, mutual funds, other investment entities, foreign exchange and interest rate contracts, and partnership/joint ventures. Equity securities, U.S. treasury securities, mutual and money market funds are classified as Level 1 as fair value is determined by observable, unadjusted quoted market prices in active or highly liquid and transparent markets. Common/collective funds are valued at the net asset value ("NAV") of shares held. Although common/collective funds are determined by observable prices, they are classified as Level 2 because they trade in markets that are less active and transparent. The fair value of the underlying investments in equity mutual funds and equity common/collective funds are based upon stock-exchange prices. The fair value of the underlying investments in fixed-income common/collective funds, fixed-income mutual funds and other fixed income securities including municipal bonds are based on evaluated prices that reflect significant observable market information such as reported trades, actual trade information of similar securities, benchmark yields, broker/dealer quotes, issuer spreads, bids, offers and relevant credit information. Foreign exchange and interest rate contracts are classified as Level 2 because the values are based on observable prices but are not traded on an exchange. Futures contracts trade on an exchange and therefore are classified as Level 1. The partnerships classified as Level 2 can be readily redeemed at NAV and the underlying investments are liquid, publicly traded fixed-income securities which have observable prices. The remaining partnerships/joint ventures are classified as Level 3 because fair value is determined primarily based upon management estimates of future cash flows. Other investment entities are valued similarly to common/collective funds and are therefore classified as Level 2. The Level 1 registered investment companies are either mutual or money market funds. The remaining funds in this category are readily redeemable at NAV and classified as Level 2 and are discussed further at footnote 7 to the pension plan master trust investments table below.
Edison International reviews the process/procedures of both the pricing services and the trustee to gain an understanding of the inputs/assumptions and valuation techniques used to price each asset type/class. The trustee and Edison International's validation procedures for pension and PBOP equity and fixed income securities are the same as the nuclear decommissioning trusts. For further discussion see Note 4. The values of Level 1 mutual and money market funds are publicly quoted. The trustees obtain the values of common/collective and other investment funds from the fund managers. The values of partnerships are based on partnership valuation statements updated for cash flows. SCE's investment managers corroborate the trustee fair values.
83
Pension Plan
The following table sets forth the Master Trust investments for Edison International and SCE that were accounted for at fair value as of
December 31, 2014
by asset class and level within the fair value hierarchy:
|
(in millions)
|
Level 1
|
Level 2
|
Level 3
|
Total
|
|||||||||||
|
U.S. government and agency securities
1
|
$
|
140
|
|
$
|
329
|
|
$
|
—
|
|
$
|
469
|
|
|||
|
Corporate stocks
2
|
716
|
|
14
|
|
—
|
|
730
|
|
|||||||
|
Corporate bonds
3
|
—
|
|
801
|
|
—
|
|
801
|
|
|||||||
|
Common/collective funds
4
|
—
|
|
524
|
|
—
|
|
524
|
|
|||||||
|
Partnerships/joint ventures
5
|
—
|
|
110
|
|
289
|
|
399
|
|
|||||||
|
Other investment entities
6
|
—
|
|
278
|
|
—
|
|
278
|
|
|||||||
|
Registered investment companies
7
|
113
|
|
30
|
|
—
|
|
143
|
|
|||||||
|
Interest-bearing cash
|
10
|
|
—
|
|
—
|
|
10
|
|
|||||||
|
Other
|
5
|
|
100
|
|
—
|
|
105
|
|
|||||||
|
Total
|
$
|
984
|
|
$
|
2,186
|
|
$
|
289
|
|
$
|
3,459
|
|
|||
|
Receivables and payables, net
|
|
|
|
|
|
|
(5
|
)
|
|||||||
|
Net plan assets available for benefits
|
|
|
|
|
|
|
$
|
3,454
|
|
||||||
|
SCE's share of net plan assets
|
$
|
3,217
|
|
||||||||||||
The following table sets forth the Master Trust investments that were accounted for at fair value as of
December 31, 2013
by asset class and level within the fair value hierarchy:
|
(in millions)
|
Level 1
|
|
Level 2
|
|
Level 3
|
|
Total
|
|
|||||||
|
U.S. government and agency securities
1
|
$
|
195
|
|
$
|
471
|
|
$
|
—
|
|
$
|
666
|
|
|||
|
Corporate stocks
2
|
653
|
|
—
|
|
—
|
|
653
|
|
|||||||
|
Corporate bonds
3
|
—
|
|
553
|
|
—
|
|
553
|
|
|||||||
|
Common/collective funds
4
|
—
|
|
546
|
|
—
|
|
546
|
|
|||||||
|
Partnerships/joint ventures
5
|
—
|
|
148
|
|
390
|
|
538
|
|
|||||||
|
Other investment entities
6
|
—
|
|
282
|
|
—
|
|
282
|
|
|||||||
|
Registered investment companies
7
|
112
|
|
81
|
|
—
|
|
193
|
|
|||||||
|
Interest-bearing cash
|
12
|
|
—
|
|
—
|
|
12
|
|
|||||||
|
Other
|
6
|
|
109
|
|
—
|
|
115
|
|
|||||||
|
Total
|
$
|
978
|
|
$
|
2,190
|
|
$
|
390
|
|
$
|
3,558
|
|
|||
|
Receivables and payables, net
|
|
|
|
|
|
|
(81
|
)
|
|||||||
|
Net plan assets available for benefits
|
|
|
|
|
|
|
$
|
3,477
|
|
||||||
|
SCE's share of net plan assets
|
$
|
3,236
|
|
||||||||||||
|
1
|
Level 1 U.S. government and agency securities are U.S. treasury bonds and notes. Level 2 primarily relates to the Federal National Mortgage Association and the Federal Home Loan Mortgage Corporation.
|
|
2
|
Corporate stocks are diversified. For
2014
and
2013
, respectively, performance is primarily benchmarked against the Russell Indexes (
59%
and
51%
) and Morgan Stanley Capital International (MSCI) index (
41%
and
49%
).
|
|
3
|
Corporate bonds are diversified. At
December 31, 2014
and
2013
, respectively, this category includes
$102 million
and
$78 million
for collateralized mortgage obligations and other asset backed securities of which
$15 million
and
$15 million
are below investment grade.
|
|
4
|
At
December 31, 2014
and
2013
, respectively, the common/collective assets were invested in equity index funds that seek to track performance of the Standard and Poor's (S&P 500) Index (
32%
and
27%
), Russell 1000 indexes (
18%
and
28%
) and the MSCI Europe, Australasia and Far East (EAFE) Index (
20%
and
15%
). A non-index U.S. equity fund representing
27%
and
23%
of this category for
2014
and
2013
, respectively, is actively managed. Another fund representing
3%
and
6%
of this category for
2014
and
2013
, respectively, is a global asset allocation fund.
|
84
|
5
|
Partnerships/joint venture Level 2 investments consist primarily of a partnership which invests in publicly traded fixed income securities, primarily from the banking and finance industry and U.S. government agencies. At
December 31, 2014
and
2013
, respectively, approximately
55%
and
64%
of the Level 3 partnerships are invested in (1) asset backed securities, including distressed mortgages and (2) commercial and residential loans and debt and equity of banks. The remaining Level 3 partnerships are invested in small private equity and venture capital funds. Investment strategies for these funds include branded consumer products, early stage technology, California geographic focus, and diversified US and non-US fund-of-funds.
|
|
6
|
Other investment entities were primarily invested in (1) emerging market equity securities, (2) a hedge fund that invests through liquid instruments in a global diversified portfolio of equity, fixed income, interest rate, foreign currency and commodities markets, and (3) domestic mortgage backed securities.
|
|
7
|
Level 1 of registered investment companies primarily consisted of a global equity mutual fund which seeks to outperform the MSCI World Total Return Index. Level 2 primarily consisted of a short-term bond fund.
|
At
December 31, 2014
and
2013
, approximately
65%
and
67%
, respectively, of the publicly traded equity investments, including equities in the common/collective funds, were located in the United States.
The following table sets forth a summary of changes in the fair value of Edison International's and SCE's Level 3 investments:
|
(in millions)
|
2014
|
2013
|
|||||
|
Fair value, net at beginning of period
|
$
|
390
|
|
$
|
414
|
|
|
|
Actual return on plan assets:
|
|||||||
|
Relating to assets still held at end of period
|
114
|
|
61
|
|
|||
|
Relating to assets sold during the period
|
(44
|
)
|
10
|
|
|||
|
Purchases
|
13
|
|
45
|
|
|||
|
Dispositions
|
(184
|
)
|
(140
|
)
|
|||
|
Transfers in and/or out of Level 3
|
—
|
|
—
|
|
|||
|
Fair value, net at end of period
|
$
|
289
|
|
$
|
390
|
|
|
Postretirement Benefits Other than Pensions
The following table sets forth the VEBA Trust assets for SCE that were accounted for at fair value as of
December 31, 2014
by asset class and level within the fair value hierarchy:
|
(in millions)
|
Level 1
|
Level 2
|
Level 3
|
Total
|
|||||||||||
|
Common/collective funds
1
|
$
|
—
|
|
$
|
431
|
|
$
|
—
|
|
$
|
431
|
|
|||
|
Corporate stocks
2
|
250
|
|
—
|
|
—
|
|
250
|
|
|||||||
|
Corporate notes and bonds
3
|
—
|
|
883
|
|
—
|
|
883
|
|
|||||||
|
Partnerships
4
|
—
|
|
19
|
|
105
|
|
124
|
|
|||||||
|
U.S. government and agency securities
5
|
207
|
|
36
|
|
—
|
|
243
|
|
|||||||
|
Registered investment companies
6
|
64
|
|
5
|
|
—
|
|
69
|
|
|||||||
|
Interest bearing cash
|
29
|
|
—
|
|
—
|
|
29
|
|
|||||||
|
Other
7
|
5
|
|
125
|
|
—
|
|
130
|
|
|||||||
|
Total
|
$
|
555
|
|
$
|
1,499
|
|
$
|
105
|
|
$
|
2,159
|
|
|||
|
Receivables and payables, net
|
|
|
|
|
|
|
(73
|
)
|
|||||||
|
Combined net plan assets available for benefits
|
|
|
|
|
|
|
$
|
2,086
|
|
||||||
85
The following table sets forth the VEBA Trust assets for SCE that were accounted for at fair value as of
December 31, 2013
by asset class and level within the fair value hierarchy:
|
(in millions)
|
Level 1
|
Level 2
|
Level 3
|
Total
|
|||||||||||
|
Common/collective funds
1
|
$
|
—
|
|
$
|
863
|
|
$
|
—
|
|
$
|
863
|
|
|||
|
Corporate stocks
2
|
451
|
|
—
|
|
—
|
|
451
|
|
|||||||
|
Corporate notes and bonds
3
|
—
|
|
250
|
|
—
|
|
250
|
|
|||||||
|
Partnerships
4
|
—
|
|
20
|
|
164
|
|
184
|
|
|||||||
|
U.S. government and agency securities
5
|
118
|
|
36
|
|
—
|
|
154
|
|
|||||||
|
Registered investment companies
6
|
52
|
|
5
|
|
—
|
|
57
|
|
|||||||
|
Interest bearing cash
|
19
|
|
—
|
|
—
|
|
19
|
|
|||||||
|
Other
7
|
7
|
|
78
|
|
—
|
|
85
|
|
|||||||
|
Total
|
$
|
647
|
|
$
|
1,252
|
|
$
|
164
|
|
$
|
2,063
|
|
|||
|
Receivables and payables, net
|
|
|
|
|
|
|
2
|
|
|||||||
|
Combined net plan assets available for benefits
|
|
|
|
|
|
|
$
|
2,065
|
|
||||||
|
1
|
At
December 31, 2014
and
2013
, respectively,
38%
and
60%
of the common/collective assets are invested in a large cap index fund which seeks to track performance of the Russell 1000 index.
41%
and
23%
of the assets in this category are in index funds which seek to track performance in the MSCI Europe, Australasia and Far East (EAFE) Index.
4%
and
6%
of this category are invested in a privately managed bond fund and
17%
and
7%
in a fund which invests in equity securities the fund manager believes are undervalued.
|
|
2
|
Corporate stock performance is primarily benchmarked against the Russell Indexes (
47%
and
50%
) and the MSCI All Country World (ACWI) index (
53%
and
50%
) for
2014
and
2013
, respectively.
|
|
3
|
Corporate notes and bonds are diversified and include approximately
$31 million
and
$29 million
for commercial collateralized mortgage obligations and other asset backed securities at
December 31, 2014
and
2013
, respectively.
|
|
4
|
At
December 31, 2014
and
2013
, respectively,
50%
and
78%
of the Level 3 partnerships category is invested in (1) asset backed securities including distressed mortgages, (2) distressed companies and (3) commercial and residential loans and debt and equity of banks.
|
|
5
|
Level 1 U.S. government and agency securities are U.S. treasury bonds and notes. Level 2 primarily relates to the Federal Home Loan Mortgage Corporation and the Federal National Mortgage Association.
|
|
6
|
Level 1 registered investment companies consist of an investment grade corporate bond mutual fund and a money market fund.
|
|
7
|
Other includes
$111 million
and
$76 million
of municipal securities at
December 31, 2014
and
2013
, respectively.
|
At
December 31, 2014
and
2013
, approximately
71%
and
65%
, respectively, of the publicly traded equity investments, including equities in the common/collective funds, were located in the United States.
The following table sets forth a summary of changes in the fair value of PBOP Level 3 investments:
|
(in millions)
|
2014
|
2013
|
|||||
|
Fair value, net at beginning of period
|
$
|
164
|
|
$
|
166
|
|
|
|
Actual return on plan assets
|
|
|
|||||
|
Relating to assets still held at end of period
|
18
|
|
24
|
|
|||
|
Relating to assets sold during the period
|
(1
|
)
|
5
|
|
|||
|
Purchases
|
9
|
|
23
|
|
|||
|
Dispositions
|
(85
|
)
|
(54
|
)
|
|||
|
Transfers in and/or out of Level 3
|
—
|
|
—
|
|
|||
|
Fair value, net at end of period
|
$
|
105
|
|
$
|
164
|
|
|
86
Stock-Based Compensation
Edison International maintains a shareholder approved incentive plan (the 2007 Performance Incentive Plan) that includes stock-based compensation. The maximum number of shares of Edison International's common stock authorized to be issued or transferred pursuant to awards under the 2007 Performance Incentive Plan, as amended, is
49.5 million
shares, plus the number of any shares subject to awards issued under Edison International's prior plans and outstanding as of April 26, 2007, which expire, cancel or terminate without being exercised or shares being issued ("carry-over shares"). As of
December 31, 2014
, Edison International had approximately
20 million
shares remaining for future issuance under its stock-based compensation plans.
The following table summarizes total expense and tax benefits (expense) associated with stock based compensation:
|
Edison International
|
SCE
|
||||||||||||||||||||||
|
|
Years ended December 31,
|
||||||||||||||||||||||
|
(in millions)
|
2014
|
2013
|
2012
|
2014
|
2013
|
2012
|
|||||||||||||||||
|
Stock-based compensation expense
1
:
|
|
|
|
||||||||||||||||||||
|
Stock options
|
$
|
16
|
|
$
|
15
|
|
$
|
18
|
|
$
|
8
|
|
$
|
11
|
|
$
|
10
|
|
|||||
|
Performance shares
|
16
|
|
4
|
|
7
|
|
8
|
|
2
|
|
4
|
|
|||||||||||
|
Restricted stock units
|
7
|
|
7
|
|
9
|
|
4
|
|
4
|
|
5
|
|
|||||||||||
|
Other
|
1
|
|
1
|
|
1
|
|
—
|
|
—
|
|
—
|
|
|||||||||||
|
Total stock-based compensation expense
|
$
|
40
|
|
$
|
27
|
|
$
|
35
|
|
$
|
20
|
|
$
|
17
|
|
$
|
19
|
|
|||||
|
Income tax benefits related to stock compensation expense
|
$
|
16
|
|
$
|
11
|
|
$
|
14
|
|
$
|
8
|
|
$
|
7
|
|
$
|
8
|
|
|||||
|
Excess tax benefits (expense)
2
|
15
|
|
5
|
|
(6
|
)
|
20
|
|
2
|
|
(13
|
)
|
|||||||||||
|
1
|
Reflected in "Operation and maintenance" on Edison International's and SCE's consolidated statements of income.
|
|
2
|
Reflected in "Settlements of stock-based compensation, net" in the financing section of Edison International's and SCE's consolidated statements of cash flows and in "Common stock" in Edison International's consolidated balance sheets and "Additional paid-in capital" in SCE's consolidated balance sheets.
|
Stock Options
Under various plans, Edison International has granted stock options at exercise prices equal to the average of the high and low price and, beginning in 2007, at the closing price at the grant date. Edison International may grant stock options and other awards related to or with a value derived from its common stock to directors and certain employees. Options generally expire
10
years after the grant date and vest over a period of
four
years of continuous service, with expense recognized evenly over the requisite service period, except for awards granted to retirement-eligible participants, as discussed in "Stock-Based Compensation" in Note 1. Additionally, Edison International will substitute cash awards to the extent necessary to pay tax withholding or any government levies.
The fair value for each option granted was determined as of the grant date using the Black-Scholes option-pricing model. The Black-Scholes option-pricing model requires various assumptions noted in the following table:
|
Years ended December 31,
|
|||||
|
|
2014
|
2013
|
2012
|
||
|
Expected terms (in years)
|
6.0
|
6.2
|
6.9
|
||
|
Risk-free interest rate
|
1.8% – 2.1%
|
1.0% – 2.1%
|
1.1% – 1.7%
|
||
|
Expected dividend yield
|
2.4% – 2.7%
|
2.7% – 3.1%
|
2.8% – 3.1%
|
||
|
Weighted-average expected dividend yield
|
2.7%
|
2.8%
|
3.0%
|
||
|
Expected volatility
|
17.8% – 19.1%
|
17.7% – 18.6%
|
17.4% – 18.3%
|
||
|
Weighted-average volatility
|
18.9%
|
17.7%
|
18.3%
|
||
87
The expected term represents the period of time for which the options are expected to be outstanding and is primarily based on historical exercise and post-vesting cancellation experience and stock price history. The risk-free interest rate for periods within the contractual life of the option is based on a zero coupon U.S. Treasury STRIPS (separate trading of registered interest and principal of securities) whose maturity equals the option's expected term on the measurement date. Expected volatility is based on the historical volatility of Edison International's common stock for the length of the option's expected term for
2014
. The volatility period used was
72 months
,
74 months
and
83 months
at
December 31, 2014
,
2013
and
2012
, respectively.
The following is a summary of the status of Edison International's stock options:
|
|
|
Weighted-Average
|
|
|||||||||
|
|
Stock options
|
Exercise
Price
|
Remaining
Contractual
Term (Years)
|
Aggregate
Intrinsic Value
(in millions)
|
||||||||
|
Edison International:
|
||||||||||||
|
Outstanding at December 31, 2013
|
17,226,845
|
|
$
|
40.22
|
|
|
|
|
||||
|
Granted
|
2,070,819
|
|
52.67
|
|
|
|
|
|||||
|
Expired
|
(20,841
|
)
|
49.95
|
|
|
|
|
|||||
|
Forfeited
|
(278,134
|
)
|
46.20
|
|
|
|
|
|||||
|
Exercised
|
(5,379,954
|
)
|
38.03
|
|
|
|
|
|||||
|
Outstanding at December 31, 2014
|
13,618,735
|
|
42.84
|
|
5.81
|
|
|
|||||
|
Vested and expected to vest at December 31, 2014
|
13,216,820
|
|
42.68
|
|
5.75
|
$
|
301
|
|
||||
|
Exercisable at December 31, 2014
|
7,989,189
|
|
39.43
|
|
4.32
|
$
|
208
|
|
||||
|
SCE:
|
||||||||||||
|
Outstanding at December 31, 2013
|
9,045,998
|
|
$
|
40.28
|
|
|
|
|
||||
|
Granted
|
1,194,281
|
|
53.21
|
|
|
|
|
|||||
|
Expired
|
(20,841
|
)
|
49.95
|
|
|
|
|
|||||
|
Forfeited
|
(205,286
|
)
|
47.27
|
|
|
|
|
|||||
|
Exercised
|
(3,210,425
|
)
|
38.54
|
|
|
|
|
|||||
|
Transfers, net
|
(801,567
|
)
|
37.95
|
|
||||||||
|
Outstanding at December 31, 2014
|
6,002,160
|
|
43.82
|
|
6.29
|
|
|
|||||
|
Vested and expected to vest at December 31, 2014
|
5,762,299
|
|
43.63
|
|
6.22
|
$
|
126
|
|
||||
|
Exercisable at December 31, 2014
|
2,997,941
|
|
39.61
|
|
4.63
|
$
|
78
|
|
||||
At
December 31, 2014
, total unrecognized compensation cost related to stock options and the weighted-average period the cost is expected to be recognized are as follows:
|
(in millions)
|
Edison International
|
SCE
|
|||||
|
Unrecognized compensation cost, net of expected forfeitures
|
$
|
13
|
|
$
|
9
|
|
|
|
Weighted-average period (in years)
|
2.3
|
|
2.4
|
|
|||
88
Supplemental Data on Stock Options
|
Edison International
|
SCE
|
||||||||||||||||||||||
|
Years ended December 31,
|
|||||||||||||||||||||||
|
(in millions, except per award amounts)
|
2014
|
2013
|
2012
|
2014
|
2013
|
2012
|
|||||||||||||||||
|
Stock options:
|
|
|
|
|
|||||||||||||||||||
|
Weighted average grant date fair value per option granted
|
$
|
7.26
|
|
$
|
5.40
|
|
$
|
5.22
|
|
$
|
7.34
|
|
$
|
5.38
|
|
$
|
5.22
|
|
|||||
|
Fair value of options vested
|
17
|
|
17
|
|
17
|
|
9
|
|
10
|
|
10
|
|
|||||||||||
|
Cash used to purchase shares to settle options
|
300
|
|
199
|
|
169
|
|
181
|
|
130
|
|
96
|
|
|||||||||||
|
Cash from participants to exercise stock options
|
205
|
|
140
|
|
101
|
|
125
|
|
92
|
|
59
|
|
|||||||||||
|
Value of options exercised
|
95
|
|
59
|
|
68
|
|
56
|
|
38
|
|
37
|
|
|||||||||||
|
Tax benefits from options exercised
|
39
|
|
24
|
|
27
|
|
23
|
|
15
|
|
15
|
|
|||||||||||
Performance Shares
A target number of contingent performance shares were awarded to executives in
March 2014
,
2013
and
2012
and vest at the end of a
three
year period for each grant. The vesting of the grants is dependent upon market and financial performance conditions and service conditions as defined in the grants for each of the years. The number of performance shares earned from each year's grants could range from zero to twice the target number (plus additional units credited as dividend equivalents). Performance shares earned are settled half in cash and half in common stock; however, Edison International has discretion under certain of the awards to pay the half subject to cash settlement in common stock. The portion of performance shares that can be settled in cash is classified as a share-based liability award. The fair value of these shares is remeasured at each reporting period and the related compensation expense is adjusted. The portion of performance shares payable in common stock is classified as a share-based equity award. Compensation expense related to these shares is based on the grant-date fair value, which for each share is determined as the closing price of Edison International common stock on the grant date; however, with respect to the portion of the performance shares payable in common stock that is subject to the financial performance condition defined in the grants, the number of performance shares expected to be earned is subject to revision and updated at each reporting period, with a related adjustment of compensation expense. Performance shares expense is recognized ratably over the requisite service period based on the fair values determined (subject to the adjustments discussed above), except for awards granted to retirement-eligible participants.
The fair value of market condition performance shares is determined using a Monte Carlo simulation valuation model.
89
The following is a summary of the status of Edison International's nonvested performance shares:
|
|
Equity Awards
|
Liability Awards
|
|||||||||||
|
|
Shares
|
Weighted-Average
Grant Date
Fair Value
|
Shares
|
Weighted-Average
Fair Value
|
|||||||||
|
Edison International:
|
|||||||||||||
|
Nonvested at December 31, 2013
|
156,697
|
|
$
|
51.17
|
|
156,304
|
|
$
|
51.72
|
|
|||
|
Granted
|
61,599
|
|
61.10
|
|
61,448
|
|
|
|
|||||
|
Forfeited
|
(4,672
|
)
|
54.32
|
|
(4,664
|
)
|
|||||||
|
Vested
1
|
(85,324
|
)
|
51.42
|
|
(85,113
|
)
|
|
|
|||||
|
Nonvested at December 31, 2014
|
128,300
|
|
55.66
|
|
127,975
|
|
92.92
|
|
|||||
|
SCE:
|
|||||||||||||
|
Nonvested at December 31, 2013
|
90,661
|
|
$
|
51.19
|
|
90,357
|
|
$
|
51.22
|
|
|||
|
Granted
|
35,516
|
|
61.85
|
|
35,390
|
|
|
|
|||||
|
Forfeited
|
(4,668
|
)
|
54.37
|
|
(4,664
|
)
|
|||||||
|
Vested
1
|
(44,293
|
)
|
51.47
|
|
(44,150
|
)
|
|
|
|||||
|
Affiliate transfers, net
|
(5,419
|
)
|
51.44
|
|
(5,413
|
)
|
|||||||
|
Nonvested at December 31, 2014
|
71,797
|
|
56.06
|
|
71,520
|
|
92.33
|
|
|||||
|
1
|
Relates to performance shares that will be paid in 2015 as performance targets were met at
December 31, 2014
.
|
Restricted Stock Units
Restricted stock units were awarded to Edison International's and SCE's executives in
March 2014
,
2013
and
2012
and vest and become payable in
January 2017
,
2016
and
2015
, respectively. Each restricted stock unit awarded includes a dividend equivalent feature and is a contractual right to receive one share of Edison International common stock, if vesting requirements are satisfied. The vesting of Edison International's restricted stock units is dependent upon continuous service through the end of the
three
-calendar-year-plus-
two
-days vesting period.
The following is a summary of the status of Edison International's nonvested restricted stock units:
|
Edison International
|
SCE
|
||||||||||||
|
Restricted
Stock Units
|
Weighted-Average
Grant Date
Fair Value
|
Restricted
Stock Units
|
Weighted-Average
Grant Date
Fair Value
|
||||||||||
|
Nonvested at December 31, 2013
|
539,689
|
|
$
|
42.70
|
|
292,839
|
|
$
|
42.98
|
|
|||
|
Granted
|
142,704
|
|
52.67
|
|
82,114
|
|
53.17
|
|
|||||
|
Forfeited
|
(10,513
|
)
|
48.21
|
|
(10,509
|
)
|
48.23
|
|
|||||
|
Vested
|
(238,561
|
)
|
38.83
|
|
(115,772
|
)
|
38.98
|
|
|||||
|
Affiliate transfers, net
|
—
|
|
—
|
|
(17,308
|
)
|
44.23
|
|
|||||
|
Nonvested at December 31, 2014
|
433,319
|
|
47.89
|
|
231,364
|
|
48.26
|
|
|||||
The fair value for each restricted stock unit awarded is determined as the closing price of Edison International common stock on the grant date.
90
Workforce Reductions
In 2012, SCE commenced a broad-based effort to reduce its costs and to improve its operational and service excellence. As part of this effort, SCE made a series of workforce reductions. In addition, in June 2013, SCE announced plans to permanently retire San Onofre, which resulted in additional workforce reductions. During 2014, SCE increased the estimated impact for workforce reductions related to transferring certain information technology activities to third parties and revised its estimate of remaining educational benefits expected to be incurred under the severance program. Through
December 31, 2014
, SCE's share of estimated cash severance for all of these workforce reductions totaled
$215 million
. The following table provides a summary of changes in the accrued severance liability associated with these reductions:
|
(in millions)
|
||||
|
Balance at January 1, 2014
|
$
|
54
|
|
|
|
Additions
|
3
|
|
||
|
Payments
|
(22
|
)
|
||
|
Balance at December 31, 2014
|
$
|
35
|
|
|
The liability presented in the table above is reflected in "Other current liabilities" on the consolidated balance sheets. The severance costs are included in "Operation and maintenance" on the consolidated income statements.
Nuclear Decommissioning Trusts
Future decommissioning costs of removal of SCE's nuclear assets are expected to be funded from independent decommissioning trusts, which received
$5 million
in
2014
and
$22 million
in 2013 through SCE customer rates. Contributions to the decommissioning trusts are reviewed every
three
years by the CPUC.
The following table sets forth amortized cost and fair value of the trust investments:
|
Longest
Maturity Date
|
Amortized Cost
|
Fair Value
|
|||||||||||||||
|
December 31,
|
|||||||||||||||||
|
(in millions)
|
2014
|
2013
|
2014
|
2013
|
|||||||||||||
|
Stocks
|
—
|
$
|
524
|
|
$
|
656
|
|
$
|
2,031
|
|
$
|
2,208
|
|
||||
|
Municipal bonds
|
2054
|
681
|
|
675
|
|
822
|
|
756
|
|
||||||||
|
U.S. government and agency securities
|
2045
|
777
|
|
902
|
|
836
|
|
947
|
|
||||||||
|
Corporate bonds
|
2057
|
346
|
|
208
|
|
395
|
|
241
|
|
||||||||
|
Short-term investments and receivables/payables
|
One-year
|
692
|
|
329
|
|
715
|
|
342
|
|
||||||||
|
Total
|
|
$
|
3,020
|
|
$
|
2,770
|
|
$
|
4,799
|
|
$
|
4,494
|
|
||||
Trust fund earnings (based on specific identification) increase the trust fund balance and the ARO regulatory liability. Proceeds from sales of securities (which are reinvested) were
$10.1 billion
,
$5.6 billion
, and
$2.1 billion
for the years ended
December 31, 2014
,
2013
and
2012
, respectively. Unrealized holding gains, net of losses, were
$1.8 billion
and
$1.7 billion
at
December 31, 2014
and
2013
, respectively.
91
The following table sets forth a summary of changes in the fair value of the trusts:
|
Years ended December 31,
|
|||||||||||
|
(in millions)
|
2014
|
2013
|
2012
|
||||||||
|
Balance at beginning of period
|
$
|
4,494
|
|
$
|
4,048
|
|
$
|
3,592
|
|
||
|
Gross realized gains
|
197
|
|
300
|
|
73
|
|
|||||
|
Gross realized losses
|
(5
|
)
|
(32
|
)
|
(5
|
)
|
|||||
|
Unrealized gains, net
|
75
|
|
160
|
|
276
|
|
|||||
|
Other-than-temporary impairments
|
(14
|
)
|
(47
|
)
|
(36
|
)
|
|||||
|
Interest, dividends and other
|
118
|
|
113
|
|
113
|
|
|||||
|
Contributions
|
5
|
|
22
|
|
23
|
|
|||||
|
Income taxes
|
(62
|
)
|
(66
|
)
|
17
|
|
|||||
|
Decommissioning costs
|
(4
|
)
|
—
|
|
—
|
|
|||||
|
Administrative expenses and other
|
(5
|
)
|
(4
|
)
|
(5
|
)
|
|||||
|
Balance at end of period
|
$
|
4,799
|
|
$
|
4,494
|
|
$
|
4,048
|
|
||
Trust assets are used to pay income taxes as the Trust files separate income taxes returns from SCE. Deferred income taxes related to unrealized gains at
December 31, 2014
were
$441 million
. Accordingly, the fair value of Trust assets available to pay future decommissioning costs, net of deferred income taxes, totaled
$4.4 billion
at
December 31, 2014
. Due to regulatory mechanisms, changes in assets of the trusts from income items have no impact on operating revenue or earnings.
Included in SCE's regulatory assets and liabilities are regulatory balancing accounts. CPUC authorized balancing account mechanisms require SCE to refund or recover any differences between forecasted and actual costs. The CPUC has authorized balancing accounts for specified costs or programs such as fuel, purchased-power, demand-side management programs, nuclear decommissioning and public purpose programs. Certain of these balancing accounts include a return on rate base of
7.90%
in
2014
and
2013
. The CPUC also authorizes the use of a balancing account to recover from or refund to customers differences in revenue resulting from actual and forecasted electricity sales.
Amounts included in regulatory assets and liabilities are generally recorded with corresponding offsets to the applicable income statement accounts.
92
Regulatory Assets
SCE's regulatory assets included on the consolidated balance sheets are:
|
December 31,
|
|||||||
|
(in millions)
|
2014
|
2013
|
|||||
|
Current:
|
|
|
|||||
|
Regulatory balancing accounts
|
$
|
1,088
|
|
$
|
484
|
|
|
|
Energy derivatives
|
159
|
|
54
|
|
|||
|
Other
|
7
|
|
—
|
|
|||
|
Total current
|
1,254
|
|
538
|
|
|||
|
Long-term:
|
|
||||||
|
Deferred income taxes, net
|
3,405
|
|
2,957
|
|
|||
|
Pensions and other postretirement benefits
|
1,218
|
|
369
|
|
|||
|
Energy derivatives
|
850
|
|
816
|
|
|||
|
Unamortized investments, net
|
255
|
|
332
|
|
|||
|
San Onofre
|
1,288
|
|
1,325
|
|
|||
|
Unamortized loss on reacquired debt
|
201
|
|
222
|
|
|||
|
Regulatory balancing accounts
|
44
|
|
818
|
|
|||
|
Other
|
351
|
|
402
|
|
|||
|
Total long-term
|
7,612
|
|
7,241
|
|
|||
|
Total regulatory assets
|
$
|
8,866
|
|
|
$
|
7,779
|
|
SCE's regulatory assets related to energy derivatives are primarily an offset to unrealized losses on derivatives. The regulatory asset changes based on fluctuations in the fair market value of the contracts, which expire in
1
to
45
years.
SCE's regulatory assets related to deferred income taxes represent tax benefits passed through to customers. The CPUC requires SCE to pass through certain deferred income tax benefits to customers by reducing electricity rates, thereby deferring recovery of such amounts to future periods. Based on current regulatory ratemaking and income tax laws, SCE expects to recover its regulatory assets related to deferred income taxes over the life of the assets that give rise to the accumulated deferred income taxes, approximately from
1
to
50
years.
SCE's regulatory assets related to pensions and other post-retirement plans represent the unfunded net loss and prior service costs of the plans (see "Pension Plans and Postretirement Benefits Other than Pensions" discussion in Note 8). This amount is being recovered through rates charged to customers as the plans are funded.
SCE's unamortized investments primarily include nuclear assets related to Palo Verde and legacy meters retired as part of the Edison SmartConnect
®
program. Nuclear assets related to Palo Verde are expected to be recovered by
2047
and earned a return of
7.90%
in 2014 and 2013. SCE's unamortized investments related to legacy meters are expected to be recovered by
2017
and earned a rate of return of
6.46%
in 2014 and 2013.
In accordance with the San Onofre OII Settlement Agreement, SCE is authorized to recover in rates its San Onofre regulatory asset, generally over a
ten
-year period commencing February 1, 2012. Under the San Onofre OII Settlement Agreement (see Note 11), SCE was allowed to earn a rate of return of
2.62%
for the period 2013
–
2014 and is authorized to continue to earn this rate as adjusted during the amortization period thereafter with changes in SCE's authorized return on debt and preferred equity. SCE's regulatory assets related to San Onofre nuclear fuel will earn a return equal to commercial paper rate that the CPUC uses to calculate interest on balancing accounts.
SCE's net regulatory asset related to its unamortized loss on reacquired debt will be recovered over the remaining original amortization period of the reacquired debt over periods ranging from
1
to
35
years.
93
Regulatory Liabilities
SCE's regulatory liabilities included on the consolidated balance sheets are:
|
December 31,
|
|||||||
|
(in millions)
|
2014
|
2013
|
|||||
|
Current:
|
|
|
|||||
|
Regulatory balancing accounts
|
$
|
380
|
|
$
|
724
|
|
|
|
Other
|
21
|
|
43
|
|
|||
|
Total current
|
401
|
|
767
|
|
|||
|
Long-term:
|
|||||||
|
Costs of removal
|
2,826
|
|
2,780
|
|
|||
|
Recoveries in excess of ARO liabilities
1
|
1,956
|
|
1,071
|
|
|||
|
Regulatory balancing accounts
|
1,083
|
|
1,132
|
|
|||
|
Other
|
24
|
|
12
|
|
|||
|
Total long-term
|
5,889
|
|
4,995
|
|
|||
|
Total regulatory liabilities
|
$
|
6,290
|
|
$
|
5,762
|
|
|
1
Represents the cumulative differences between ARO expenses and amounts collected in rates primarily for the decommissioning of the SCE's nuclear generation facilities. Decommissioning costs recovered through rates are primarily placed in nuclear decommissioning trusts. This regulatory liability also represents the deferral of realized and unrealized gains and losses on the nuclear decommissioning trust investments (see Note 9).
SCE's regulatory liabilities related to costs of removal represent differences between asset removal costs recorded and amounts collected in rates for those costs.
SCE's regulatory liability equal to nuclear decommissioning trust assets in excess of the related asset retirement obligations which represent future refunds to customers if such assets are not used to decommission the related nuclear facilities. The increase in this regulatory liability resulted from a revision to the asset retirement obligations of San Onofre and Palo Verde. For further information, see Note 1.
Regulatory Balancing Accounts
Balancing account over and under collections represent differences between cash collected in current rates for specified forecasted costs and such costs that are actually incurred. Undercollections are recorded as regulatory balancing account assets. Over-collections are recorded as regulatory balancing account liabilities. With some exceptions, SCE seeks to adjust rates on an annual basis or at other designated times to recover or refund the balances recorded in its balancing accounts. Regulatory balancing accounts that SCE does not expect to collect or refund in the next
12
months are reflected in the long-term section of the consolidated balance sheets. Regulatory balancing accounts do not have the right of offset and are presented gross in the consolidated balance sheets. Under and over collections accrue interest based on a three-month commercial paper rate published by the Federal Reserve.
94
The following table summarizes the significant components of regulatory balancing accounts included in the above tables of regulatory assets and liabilities:
|
December 31,
|
|||||||
|
(in millions)
|
2014
|
2013
|
|||||
|
Asset (liability)
|
|||||||
|
Energy resource recovery account
|
$
|
1,028
|
|
$
|
1,005
|
|
|
|
Four Corners memorandum account
|
—
|
|
145
|
|
|||
|
New system generation balancing account
|
35
|
|
132
|
|
|||
|
Public purpose programs and energy efficiency programs
|
(874
|
)
|
(1,152
|
)
|
|||
|
Base rate recovery balancing account
|
(5
|
)
|
(247
|
)
|
|||
|
Greenhouse gas auction revenue
|
(182
|
)
|
(385
|
)
|
|||
|
FERC balancing accounts
|
(32
|
)
|
(59
|
)
|
|||
|
Generator settlements
|
(197
|
)
|
7
|
|
|||
|
Other
|
(104
|
)
|
—
|
|
|||
|
Liability
|
$
|
(331
|
)
|
$
|
(554
|
)
|
|
In 2014, the CPUC issued a proposed decision on SCE's 2015 ERRA forecast application adopting an annual revenue requirement of
$5.59 billion
, an increase of approximately
$437 million
over the 2014 revenue requirement. SCE expects to implement this requirement in rates in the first half of 2015. The ERRA undercollection is expected to decrease with implementation of these revised rates.
SCE had participated in proceedings seeking recovery of refunds from certain sellers of electricity and natural gas during the energy crisis in California in 2000
–
2001. SCE is authorized to refund to customers any refunds actually realized by SCE, net of litigation costs and amounts retained by SCE as a shareholder incentive pursuant to an established sharing arrangement. During 2014, the FERC approved generator settlement agreements which resulted in total refunds to customers of
$219 million
of which
$15 million
is subject to a shareholder incentive.
Third-Party Power Purchase Agreements
SCE enters into various agreements, which were approved by the CPUC and met critical contract provisions (including completion of major milestones for construction), to purchase power and electric capacity, including:
|
•
|
Renewable Energy Contracts
– California law requires retail sellers of electricity to comply with an RPS by delivering renewable energy, primarily through power purchase contracts. Renewable energy contract payments generally consist of payments based on a fixed price per megawatt hour. As of
December 31, 2014
, SCE had
168
renewable energy contracts which expire at various dates through
2038
.
|
|
•
|
Qualifying Facility Power Purchase Agreements
– Under the Public Utility Regulatory Policies Act of 1978 ("PURPA"), electric utilities are required, with exceptions, to purchase energy and capacity from independent power producers that are qualifying co-generation facilities and qualifying small power production facilities ("QFs"). As of
December 31, 2014
, SCE had
130
QF contracts.
|
|
•
|
Other Power Purchase Agreements
– SCE has entered into capacity agreements with third parties, including
11
combined heat and power contracts,
11
tolling arrangements,
11
transmission and fuel contracts and
13
resource adequacy contracts. SCE's obligations under a portion of these agreements are limited to payments for the availability of such resources.
|
95
At
December 31, 2014
, the undiscounted future minimum expected payments for the SCE power purchase agreements that have been approved by the CPUC and have completed major milestones for construction were as follows:
|
(in millions)
|
Renewable
Energy
Contracts
|
QF Power
Purchase
Agreements
|
Other Purchase
Agreements
|
||||||||
|
2015
|
$
|
1,009
|
|
$
|
254
|
|
$
|
830
|
|
||
|
2016
|
1,115
|
|
217
|
|
724
|
|
|||||
|
2017
|
1,162
|
|
191
|
|
729
|
|
|||||
|
2018
|
1,159
|
|
150
|
|
592
|
|
|||||
|
2019
|
1,214
|
|
88
|
|
496
|
|
|||||
|
Thereafter
|
17,740
|
|
69
|
|
1,504
|
|
|||||
|
Total future commitments
|
$
|
23,399
|
|
$
|
969
|
|
$
|
4,875
|
|
||
In
February 2015
, SCE had power procurement contracts that met the critical contract provisions. The additional commitments (not included in the table above) are estimated to be approximately
$680 million
for the thereafter periods.
Many of the power purchase agreements that SCE entered into with independent power producers are treated as operating and capital leases. The following table shows the future minimum lease payments due under the contracts that are treated as operating and capital leases (these amounts are also included in the table above). Due to the inherent uncertainty associated with the reliability of the fuel source, expected purchases from most renewable energy contracts do not meet the definition of a minimum lease payment and have been excluded from the operating and capital lease table below but remain in the table above. The future minimum lease payments for capital leases are discounted to their present value in the table below using SCE's incremental borrowing rate at the inception of the leases. The amount of this discount is shown in the table below as the amount representing interest.
|
(in millions)
|
Operating
Leases
|
Capital
Leases
|
|||||
|
2015
|
$
|
473
|
|
$
|
33
|
|
|
|
2016
|
373
|
|
33
|
|
|||
|
2017
|
361
|
|
33
|
|
|||
|
2018
|
258
|
|
33
|
|
|||
|
2019
|
194
|
|
33
|
|
|||
|
Thereafter
|
1,921
|
|
323
|
|
|||
|
Total future commitments
|
$
|
3,580
|
|
$
|
488
|
|
|
|
Amount representing executory costs
|
|
|
(111
|
)
|
|||
|
Amount representing interest
|
|
|
(174
|
)
|
|||
|
Net commitments
|
|
|
$
|
203
|
|
||
Operating lease expense for power purchase agreements was
$1.7 billion
in
2014
,
$1.5 billion
in
2013
and
$1.3 billion
in
2012
(including contingent rents of
$944 million
in
2014
,
$843 million
in
2013
and
$609 million
in
2012
). The timing of SCE's recognition of the lease expense conforms to ratemaking treatment for SCE's recovery of the cost of electricity and is included in purchased power.
At
December 31, 2014
and
2013
, SCE's net capital leases reflected in utility plant on the consolidated balance sheets were
$203 million
and
$209 million
, including accumulated amortization of
$46 million
and
$39 million
, respectively. SCE had
$7 million
and
$6 million
included in "Other current liabilities" and
$196 million
and
$203 million
included in "Other deferred credits and other liabilities" at
December 31, 2014
and
2013
, respectively, representing the present value of the minimum lease payments due under these contracts recorded on the consolidated balance sheets.
96
Other Lease Commitments
The following summarizes the estimated minimum future commitments for SCE's noncancelable other operating leases (excluding SCE's power purchase agreements discussed above):
|
(in millions)
|
Operating
Leases –
Other
|
||
|
2015
|
$
|
102
|
|
|
2016
|
116
|
|
|
|
2017
|
90
|
|
|
|
2018
|
81
|
|
|
|
2019
|
33
|
|
|
|
Thereafter
|
201
|
|
|
|
Total future commitments
|
$
|
623
|
|
Operating lease expense for other leases (primarily related to vehicles, office space, nuclear fuel storage space and other equipment) were
$96 million
in
2014
,
$78 million
in
2013
and
$75 million
in
2012
.
Other Commitments
The following summarizes the estimated minimum future commitments for SCE's other commitments:
|
(in millions)
|
2015
|
2016
|
2017
|
2018
|
2019
|
Thereafter
|
Total
|
||||||||||||||||||||
|
Other contractual obligations
|
$
|
86
|
|
$
|
120
|
|
$
|
101
|
|
$
|
73
|
|
$
|
58
|
|
$
|
572
|
|
$
|
1,010
|
|
||||||
Costs incurred for other commitments were
$90 million
in
2014
,
$153 million
in
2013
and
$249 million
in
2012
. SCE has fuel supply contracts for Palo Verde which require payment only if the fuel is made available for purchase. SCE also has commitments related to maintaining reliability and expanding SCE's transmission and distribution system.
As a result of the decision to permanently retire San Onofre Units 2 and 3, SCE has submitted fuel contract delivery cancellation notices for the nuclear fuel contractual arrangements. As of
December 31, 2014
, SCE had accrued a liability of
$28 million
related to estimated costs associated with the cancellation and management of future deliveries of nuclear fuel and recorded a regulatory asset for recovery of costs in the future which is not included in the table above.
Indemnities
Edison International and SCE have various financial and performance guarantees and indemnity agreements which are issued in the normal course of business.
Edison International and SCE have provided indemnifications through contracts entered into in the normal course of business. These are primarily indemnifications against adverse litigation outcomes in connection with underwriting agreements, and indemnities for specified environmental liabilities and income taxes with respect to assets sold. Edison International's and SCE's obligations under these agreements may or may not be limited in terms of time and/or amount, and in some instances Edison International and SCE may have recourse against third parties. Edison International and SCE have not recorded a liability related to these indemnities. The overall maximum amount of the obligations under these indemnifications cannot be reasonably estimated.
SCE has indemnified the City of Redlands, California in connection with Mountainview's California Energy Commission permit for cleanup or associated actions related to groundwater contaminated by perchlorate due to the disposal of filter cake at the City's solid waste landfill. The obligations under this agreement are not limited to a specific time period or subject to a maximum liability. SCE has not recorded a liability related to this indemnity.
Contingencies
In addition to the matters disclosed in these Notes, Edison International and SCE are involved in other legal, tax and regulatory proceedings before various courts and governmental agencies regarding matters arising in the ordinary course of business. Edison International and SCE believe the outcome of these other proceedings will not, individually or in the aggregate, materially affect its results of operations or liquidity.
97
San Onofre Related Matters
Replacement steam generators were installed at San Onofre in 2010 and 2011. On January 31, 2012, a leak suddenly occurred in one of the heat transfer tubes in San Onofre's Unit 3 steam generators. The Unit was safely taken off-line and subsequent inspections revealed excessive tube wear. Unit 2 was off-line for a planned outage when areas of unexpected tube wear were also discovered. On June 6, 2013, SCE decided to permanently retire Units 2 and 3.
Settlement of San Onofre CPUC Proceedings
In October 2012, the CPUC issued an Order Instituting Investigation ("OII") that consolidated all San Onofre issues in related CPUC regulatory proceedings to consider appropriate cost recovery for all San Onofre costs, including among other costs, the cost of the steam generator replacement project, substitute market power costs, capital expenditures, and operation and maintenance costs.
On November 20, 2014, the CPUC approved the Amended and Restated Settlement Agreement (the "San Onofre OII Settlement Agreement") that SCE had entered into with TURN, the ORA, SDG&E, the Coalition of California Utility Employees, and Friends of the Earth (together, the "Settling Parties"). The San Onofre OII Settlement Agreement resolved the CPUC's OII and related proceedings regarding the Steam Generator Replacement Project at San Onofre and the related outage and subsequent shutdown of San Onofre. The San Onofre OII Settlement Agreement does not affect proceedings before the NRC or proceedings related to recoveries from third parties described below, but does describe how shareholders and customers will share any potential recoveries. A lawsuit challenging the CPUC's authority to permit rate recovery of San Onofre costs and an application for rehearing of the CPUC’s decision approving the San Onofre OII Settlement Agreement were filed in November and December 2014, respectively. On February 9, 2015, SCE filed in the OII proceeding a Late-Filed Notice of
Ex Parte
Communication regarding a meeting in March 2013 between an SCE senior executive and the president of the CPUC, both of whom have since retired from their respective positions. In response, the Alliance for Nuclear Responsibility, one of the intervenors in the OII, filed an application requesting that the CPUC institute an investigation into whether sanctions should be imposed on SCE in connection with the
ex parte
communication. The application requests that the CPUC order SCE to produce all
ex parte
communications between SCE and the CPUC or its staff since January 31, 2012 and all internal SCE unprivileged communications that discuss such
ex parte
communications.
As set out in the San Onofre OII Settlement Agreement, SCE will not be allowed to recover in rates its capitalized costs for the Steam Generator Replacement Project as of February 1, 2012 or a return on such investment after such date. Additionally, SCE will not be allowed to recover in rates approximately
$99 million
of incremental inspection and repair costs incurred for the replacement steam generators ("RSGs") in 2012 that exceeded CPUC-authorized operations and maintenance expense. These costs, net of invoices paid by the supplier of the RSGs, were previously expensed in SCE's 2012 financial results, although they remain subject to recovery from the RSG's supplier. Neither will SCE be allowed to recover in rates provisionally authorized operations and maintenance expense in 2013 that exceeds amounts in recorded operations and maintenance expense (including severance and incremental repair and inspection costs); such excess had not been recognized in 2013 earnings. Subject to the foregoing, SCE will be authorized to recover in rates its remaining investment in San Onofre, including base plant, materials and supplies, nuclear fuel inventory and contracts and construction work in progress ("CWIP"), generally over a
ten
-year period commencing February 1, 2012. Additionally, SCE will be authorized to recover in rates its provisionally authorized operations and maintenance expenses for 2012, recorded costs for the 2012 refueling outage of Unit 2, recorded operations and maintenance expenses for 2013, and recorded operations and maintenance expenses for 2014 subject to customary prudency review. Finally, SCE will also be authorized to recover in rates through its fuel and purchased power balancing account ("ERRA") all costs incurred to purchase electric power in the market related to the outage and shutdown of San Onofre, and to recover by December 31, 2015 any San Onofre-related ERRA undercollections. See Note 1 for more information on the impairment of long-lived assets.
A
5%
incentive is provided for SCE to realize savings for customers by selling materials and supplies and nuclear fuel, as well minimizing costs under fuel contracts. This incentive allows SCE to retain
5%
of sales proceeds, with the balance credited to customers. In addition, SCE recovers
5%
of the difference between SCE's purchase obligations under fuel contracts and the fuel cancellation costs, with the remaining avoided fuel contract costs inuring to the benefit of customers.
Under the San Onofre OII Settlement Agreement, the unamortized portion of SCE's investment other than nuclear fuel may, at SCE's option, be excluded from SCE's capital structure for purposes of determining regulatory capital requirements and to allow SCE to finance those assets solely with debt. The terms of the San Onofre OII Settlement Agreement provide that if SCE selects the debt financing option and finances these regulatory assets at a cost lower than the return authorized by the San Onofre OII Settlement Agreement, the savings will be shared equally between customers and SCE. In January 2015, SCE issued amortizing first and refunding mortgage bonds that have been designated as a financing of the San Onofre regulatory asset.
98
The San Onofre OII Settlement Agreement includes a requirement for SCE to make a contribution of
$4 million
per year, for a
five
-year period, to a University of California research, development and demonstration program to reduce greenhouse gases. SCE recorded this obligation in 2014.
NRC Proceedings
As part of the NRC's review of the San Onofre outage and proceedings related to the possible restart of Unit 2, the NRC appointed an Augmented Inspection Team to review SCE's performance. In December 2013, the NRC finalized an Inspection Report in connection with the Augmented Inspection Team's review and SCE's response to an earlier NRC Confirmatory Action Letter. The NRC's report identified a "white" finding (low to moderate safety significance) for failing to ensure that MHI's modeling and analysis were adequate. In November 2014, the NRC closed the "white" finding, confirming that there were no additional issues identified that could impact SCE's ability to safely decommission San Onofre. The NRC also issued an Inspection Report to MHI containing a Notice of Nonconformance for its flawed computer modeling in the design of San Onofre's steam generators. On October 2, 2014, the NRC's Office of Inspector General ("OIG") published a report on the NRC's oversight of SCE's evaluation process for the RSGs, which was used to determine whether changes in the design of a component would require an amendment to the operating license of a nuclear power plant. The OIG determined that the NRC "missed opportunities" in connection with its 2009 inspection of SCE's evaluation process, and concluded that without further review of information concerning SCE's evaluation conclusions, there is no assurance that the NRC reached the correct conclusion in its 2009 inspection that San Onofre did not need a license amendment for its steam generator replacement. The OIG Report also indicated that additional ongoing review of SCE's compliance with the license amendment regulatory process by an NRC Staff Petition Review Board had been further deferred to February 2015. Certain anti-nuclear groups and individual members of Congress have alleged that SCE knew of deficiencies in the steam generators when they were installed or otherwise did not correctly follow NRC requirements for the design and installation of the replacement steam generators, something which SCE has vigorously denied, and have called for investigations, including by the Department of Justice. SCE cannot predict when or whether ongoing proceedings by the NRC will be completed or whether inquiries by other government agencies will be initiated.
NEIL Insurance Claims
San Onofre carries accidental property damage and carried accidental outage insurance issued by Nuclear Electric Insurance Limited ("NEIL") and has placed NEIL on notice of claims under both policies. The NEIL policies have a number of exclusions and limitations that NEIL may assert reduce or eliminate coverage, and SCE may choose to challenge NEIL's application of any such exclusions and limitations. The estimated total claims under the accidental outage insurance through August 30, 2014 are approximately
$433 million
(SCE's share of which is approximately
$339 million
). Accidental outage policy benefits may be subject to reduction by up to
90%
for the periods following announcement of the permanent retirement of the Units. The accidental outage insurance at San Onofre has been canceled prospectively as a result of the permanent retirement. SCE has not submitted a proof of loss under the accidental property damage insurance but reserves the right to do so. No coverage determination was made by the NEIL Board of Directors in 2014. The parties are continuing discussions but it is unlikely that a coverage determination will be made in the first quarter of 2015. SCE may challenge any reduction or denial of coverage. No amounts have been recognized in SCE's financial statements, pending NEIL's response.
Under the San Onofre OII Settlement Agreement, recoveries from NEIL, if any, will first be applied to reimburse costs incurred in pursuing such recoveries, including litigation costs. To the extent SCE's share of recoveries from NEIL exceeds such costs, recoveries under the accidental outage insurance will be allocated
95%
to customers and
5%
to SCE and all other NEIL recoveries will be allocated
82.5%
to customers and
17.5%
to SCE. SCE customers' portion of amounts recovered from NEIL would be distributed to SCE customers via a credit to SCE's ERRA account.
MHI Claims
SCE is also pursuing claims against Mitsubishi Heavy Industries, Ltd. and related companies ("MHI"), which designed and supplied the RSGs. MHI warranted the RSGs for an initial period of
20
years from acceptance and is contractually obligated to repair or replace defective items with dispatch and to pay specified damages for certain repairs. MHI's stated liability under the purchase agreement is limited to
$138 million
and excludes consequential damages, defined to include "the cost of replacement power;" however, limitations in the contract are subject to applicable exceptions both in the contract and under law. SCE has advised MHI that it believes one or more of such exceptions apply and that MHI's liability is not limited to
$138 million
. MHI has advised SCE that it disagrees. In October 2013 SCE sent MHI a formal request for binding arbitration under the auspices of the International Chamber of Commerce in accordance with the purchase contract seeking damages for all losses. In the request for arbitration, SCE alleges contract and tort claims and seeks at least
$4 billion
in damages on behalf of itself and its customers and in its capacity as Operating Agent for San Onofre. MHI has denied any liability and has asserted counterclaims for
$41 million
, for which SCE has denied any liability. Each of the other co-owners sued MHI,
99
alleging claims arising from MHI's supplying the faulty steam generators, which have been stayed pending the arbitration. The other co-owners (SDG&E and Riverside) have been added as additional claimants in the arbitration, with party status.
SCE, on behalf of itself and the other San Onofre co-owners, has submitted
seven
invoices to MHI totaling
$149 million
for steam generator repair costs incurred through April 30, 2013. MHI paid the first invoice of
$45 million
, while reserving its right to challenge it and subsequently rejected a portion of the first invoice and has not paid further invoices, claiming further documentation is required, which SCE disputes. SCE recorded its share of the invoice paid (approximately
$35 million
) as a reduction of repair and inspection costs in 2012.
Under the San Onofre OII Settlement Agreement, recoveries from MHI (including amounts paid by MHI under the first invoice), if any, will first be applied to reimburse costs incurred in pursuing such recoveries, including litigation costs. To the extent SCE's share of recoveries from MHI exceed such costs, they will be allocated
50%
to customers and
50%
to SCE.
The first
$282 million
of SCE's customers' portion of such recoveries from MHI will be distributed to customers via a credit to a sub-account of SCE's Base Revenue Requirement Balancing Account ("BRRBA"), reducing revenue requirements from customers. Amounts in excess of the first
$282 million
distributable to SCE customers will reduce SCE's regulatory asset represented by the unamortized balance of investment in San Onofre base plant, reducing the revenue requirement needed to amortize such investment. The amortization period, however, will be unaffected. Any additional amounts received after the regulatory asset is recovered will be applied to the BRRBA.
The San Onofre OII Settlement Agreement provides the utilities with the discretion to resolve the NEIL and MHI disputes without CPUC approval or review, but the utilities are obligated to use their best efforts to inform the CPUC of any settlement or other resolution of these disputes to the extent this is possible without compromising any aspect of the resolution. SCE and SDG&E have also agreed to allow the CPUC to review the documentation of any final resolution of the NEIL and MHI disputes and the litigation costs incurred in pursuing claims against NEIL and MHI to ensure they are not exorbitant in relation to the recovery obtained. There is no assurance that there will be any recoveries from NEIL or MHI or that if there are recoveries, that they will exceed the costs incurred to pursue them. Were there to be recoveries, SCE cannot speculate when they would be received.
Four Corners Environmental Matters
In
October 2011
,
four
private environmental organizations filed a CAA citizen lawsuit against the co-owners of Four Corners. The complaint alleges that certain work performed at the Four Corners generating units 4 and 5, over the approximate periods of
1985
–
1986
and
2007
–
2010
, constituted plant "major modifications" and the plant's failure to obtain permits and install best available control technology ("BACT") violated the Prevention of Significant Deterioration requirements and the New Source Performance Standards of the CAA. The complaint also alleges subsequent and continuing violations of BACT air emissions limits. The lawsuit seeks injunctive and declaratory relief, civil penalties, including a mitigation project and litigation costs. In November 2012, the parties requested a stay of the litigation to allow for settlement discussion, and the matter is currently stayed. In December 2013, SCE sold its ownership interest in generating units 4 and 5 to APS. Under the sale agreement SCE remains responsible for its pro-rata share of certain environmental liabilities, including penalties in the event they arise from environmental violations prior to the sale. In addition, under the terms of the sale agreement, SCE retains the liability for its proportionate share of expenses occurring as a result of new environmental regulations applicable to the coal ash and combustion residuals deposited at the landfill at Four Corners during the period that SCE held its ownership interest in Four Corners once such new regulations become effective. SCE is unable to estimate a possible loss or range of loss associated with these matters.
Environmental Remediation
Edison International records its environmental remediation liabilities when site assessments and/or remedial actions are probable and a range of reasonably likely cleanup costs can be estimated. Edison International reviews its sites and measures the liability quarterly, by assessing a range of reasonably likely costs for each identified site using currently available information, including existing technology, presently enacted laws and regulations, experience gained at similar sites, and the probable level of involvement and financial condition of other potentially responsible parties. These estimates include costs for site investigations, remediation, operation and maintenance, monitoring and site closure. Unless there is a single probable amount, Edison International records the lower end of this reasonably likely range of costs (reflected in "Other long-term liabilities") at undiscounted amounts as timing of cash flows is uncertain.
At December 31, 2014, Edison International's recorded estimated minimum liability to remediate its
20
identified sites in which the upper end of the range of the costs is at least
$1 million
at SCE was
$108 million
, including
$70 million
related to San Onofre. In addition to these sites, SCE also has
38
immaterial sites for which the total minimum recorded liability was
$3 million
. Of the
$111 million
total environmental remediation liability for SCE,
$107 million
has been recorded as a
100
regulatory asset. SCE expects to recover
$36 million
through an incentive mechanism that allows SCE to recover
90%
of its environmental remediation costs at certain sites (SCE may request to include additional sites) and
$71 million
through a mechanism that allows SCE to recover
100%
of the costs incurred at certain sites through customer rates. Edison International's identified sites include several sites for which there is a lack of currently available information, including the nature and magnitude of contamination, and the extent, if any, that Edison International may be held responsible for contributing to any costs incurred for remediating these sites. Thus, no reasonable estimate of cleanup costs can be made for these sites.
The ultimate costs to clean up Edison International's identified sites may vary from its recorded liability due to numerous uncertainties inherent in the estimation process, such as: the extent and nature of contamination; the scarcity of reliable data for identified sites; the varying costs of alternative cleanup methods; developments resulting from investigatory studies; the possibility of identifying additional sites; and the time periods over which site remediation is expected to occur. Edison International believes that, due to these uncertainties, it is reasonably possible that cleanup costs at the identified material sites and immaterial sites could exceed its recorded liability by up to
$161 million
and
$7 million
, respectively, all of which is related to SCE. The upper limit of this range of costs was estimated using assumptions least favorable to Edison International among a range of reasonably possible outcomes.
SCE expects to clean up and mitigate its identified sites over a period of up to
30 years
. Remediation costs for each of the next
five
years are expected to range from
$3 million
to
$23 million
. Costs incurred for years ended December 31, 2014, 2013 and 2012 were
$4 million
,
$8 million
and
$10 million
, respectively.
Based upon the CPUC's regulatory treatment of environmental remediation costs incurred at SCE, Edison International believes that costs ultimately recorded will not materially affect its results of operations, financial position or cash flows. There can be no assurance, however, that future developments, including additional information about existing sites or the identification of new sites, will not require material revisions to estimates.
Nuclear Insurance
Federal law limits public offsite liability claims for bodily injury and property damage from a nuclear incident to the amount of available financial protection, which is currently approximately
$13.6 billion
. SCE and other owners of San Onofre and Palo Verde have purchased the maximum private primary insurance available (
$375 million
) through a Facility Form issued by American Nuclear Insurers ("ANI"). The balance is covered by a loss sharing program among nuclear reactor licensees. If a nuclear incident at any licensed reactor in the United States results in claims and/or costs which exceed the primary insurance at that plant site, all nuclear reactor licensees could be required to contribute their share of the liability in the form of a deferred premium.
The ANI Facility Form coverage includes broad liability protection for bodily injury or offsite property damage caused by nuclear material at San Onofre, or while in transit to or from San Onofre. The Facility Form, however, includes several exclusions. First, it excludes onsite property damage to the nuclear facility itself and onsite cleanup costs, but as discussed below SCE maintains separate NEIL property damage coverage for such events. Second, tort claims of onsite workers are excluded, but SCE also maintains separate
$375 million
ANI Facility Workers Form coverage for non-licensee workers. Third, offsite environmental costs arising out of government orders or directives, including those issued under the Comprehensive Environmental Response, Compensation and Liability Act, also known as CERCLA, are excluded, with minor exceptions from clearly identifiable accidents.
Based on its ownership interests, SCE could be required to pay a maximum of approximately
$255 million
per nuclear incident. However, it would have to pay no more than approximately
$38 million
per incident in any one year. If the public liability limit above is insufficient, federal law contemplates that additional funds may be appropriated by Congress. This could include an additional assessment on all licensed reactor operators as a measure for raising further federal revenue.
NEIL, a mutual insurance company owned by entities with nuclear facilities, issues nuclear property damage and accidental outage insurance policies. The amount of nuclear property insurance purchased for San Onofre and Palo Verde exceeds the minimum federal requirement of approximately
$1.06 billion
. These policies include coverage for decontamination liability. Property damage insurance also covers damages caused by acts of terrorism up to specified limits. Additional outage insurance covers part of replacement power expenses during an accident-related nuclear unit outage. The accidental outage insurance at San Onofre has been canceled as a result of the permanent retirement, but that insurance continues to be in effect at Palo Verde.
If losses at any nuclear facility covered by the arrangement were to exceed the accumulated funds for these insurance programs, SCE could be assessed retrospective premium adjustments of up to approximately
$52 million
per year. Insurance premiums are charged to operating expense.
101
Wildfire Insurance
Severe wildfires in California have given rise to large damage claims against California utilities for fire-related losses alleged to be the result of the failure of electric and other utility equipment. Invoking a California Court of Appeal decision, plaintiffs pursuing these claims have relied on the doctrine of inverse condemnation, which can impose strict liability (including liability for a claimant's attorneys' fees) for property damage. Prolonged drought conditions in California have also increased the risk of severe wildfire events. On June 1, 2014, Edison International renewed its liability insurance coverage, which included coverage for SCE's wildfire liabilities up to a
$547.5 million
limit (with a self-insured retention of
$10 million
per wildfire occurrence). Various coverage limitations within the policies that make up this insurance coverage could result in additional self-insured costs in the event of multiple wildfire occurrences during the policy period (June 1, 2014 to May 31, 2015). SCE also has additional coverage for certain wildfire liabilities of
$450 million
, which applies when total covered wildfire claims exceed
$550 million
, through June 14, 2015. SCE may experience coverage reductions and/or increased insurance costs in future years. No assurance can be given that future losses will not exceed the limits of SCE's insurance coverage.
Spent Nuclear Fuel
Under federal law, the Department of Energy ("DOE") is responsible for the selection and construction of a facility for the permanent disposal of spent nuclear fuel and high-level radioactive waste. The DOE did not meet its contractual obligation to begin acceptance of spent nuclear fuel by
January 31, 1998
. Extended delays by the DOE have led to the construction of costly alternatives and associated siting and environmental issues. Currently, both San Onofre and Palo Verde have interim storage for spent nuclear fuel on site sufficient for their current license periods.
In
June 2010
, the United States Court of Federal Claims issued a decision granting SCE and the San Onofre co-owners damages of approximately
$142 million
(SCE share
$112 million
) to recover costs incurred through December 31, 2005 for the DOE's failure to meet its obligation to begin accepting spent nuclear fuel from San Onofre. SCE received payment from the federal government in the amount of the damage award in November 2011. SCE has returned to the San Onofre co-owners their respective shares of the damage award paid. In December 2013, the CPUC approved SCE's proposal to return the SCE share of the award to customers based on the amount that customers actually contributed for fuel storage costs, resulting in approximately
$94 million
of the SCE share being returned to customers and the remaining
$18 million
being returned to shareholders. SCE, as operating agent, filed a lawsuit on behalf of the San Onofre owners against the DOE in the Court of Federal Claims in December 2011 seeking damages of approximately
$98 million
for the DOE's failure to meet its obligation to begin accepting spent nuclear fuel for the period from January 1, 2006 to December 31, 2010. In September 2014, SCE added damages incurred for the period from January 1, 2011 to December 31, 2013 in the approximate amount of
$84 million
to its December 2011 lawsuit. Additional legal action would be necessary to recover damages incurred after December 31, 2013. All damages recovered by SCE are subject to CPUC review as to how these amounts would be distributed among customers, shareholders, or to offset fuel decommissioning or storage costs.
SCE's authorized shares are:
$100
cumulative preferred –
12 million
shares,
$25
cumulative preferred –
24 million
shares and preference with
no par value
–
50 million
shares. SCE's outstanding shares are not subject to mandatory redemption. There are no dividends in arrears for the preferred or preference shares. Shares of SCE's preferred stock have liquidation and dividend preferences over shares of SCE's common stock and preference stock. All cumulative preferred shares are redeemable. When preferred shares are redeemed, the premiums paid, if any, are charged to common equity. No preferred shares were issued or redeemed in the years ended
December 31, 2014
,
2013
and
2012
. There is no sinking fund requirement for redemptions or repurchases of preferred shares.
Shares of SCE's preference stock rank junior to all of the preferred stock and senior to all common stock. Shares of SCE's preference stock are not convertible into shares of any other class or series of SCE's capital stock or any other security. There is no sinking fund requirement for redemptions or repurchases of preference shares.
102
Preferred stock and preference stock is:
|
Shares
Outstanding
|
Redemption
Price
|
December 31,
|
||||||||||||
|
(in millions, except shares and per-share amounts)
|
2014
|
2013
|
||||||||||||
|
Cumulative preferred stock
|
|
|
|
|
||||||||||
|
$25 par value:
|
|
|
|
|
||||||||||
|
4.08% Series
|
650,000
|
|
$
|
25.50
|
|
$
|
16
|
|
$
|
16
|
|
|||
|
4.24% Series
|
1,200,000
|
|
25.80
|
|
30
|
|
30
|
|
||||||
|
4.32% Series
|
1,653,429
|
|
28.75
|
|
41
|
|
41
|
|
||||||
|
4.78% Series
|
1,296,769
|
|
25.80
|
|
33
|
|
33
|
|
||||||
|
Preference stock
|
|
|
|
|||||||||||
|
No par value:
|
|
|
|
|
||||||||||
|
4.51% Series A (variable and noncumulative)
|
3,250,000
|
|
100.00
|
|
325
|
|
325
|
|
||||||
|
6.50% Series D (cumulative)
|
1,250,000
|
|
100.00
|
|
125
|
|
125
|
|
||||||
|
6.25% Series E (cumulative)
|
350,000
|
|
1,000.00
|
|
350
|
|
350
|
|
||||||
|
5.625% Series F (cumulative)
|
190,004
|
|
2,500.00
|
|
475
|
|
475
|
|
||||||
|
5.10% Series G (cumulative)
|
160,004
|
|
2,500.00
|
|
400
|
|
400
|
|
||||||
|
5.75% Series H (cumulative)
|
110,004
|
|
2,500.00
|
|
275
|
|
—
|
|
||||||
|
SCE's preferred and preference stock
|
2,070
|
|
1,795
|
|
||||||||||
|
Less issuance costs
|
(48
|
)
|
(42
|
)
|
||||||||||
|
Edison International's preferred and preference stock of utility
|
|
|
|
|
$
|
2,022
|
|
$
|
1,753
|
|
||||
Shares of Series A preference stock, issued in
2005
, may be redeemed in whole or in part. Shares of Series D preference stock, issued in
2011
, may not be redeemed prior to March 1, 2016. After March 1, 2016, SCE may redeem the shares at par, in whole or in part. Shares of Series E preference stock, issued in
2012
, may be redeemed at par, in whole or in part, after February 1, 2022. Shares of Series F, G and H preference stock, issued in
2012
,
2013
and
2014
, respectively, may be redeemed at par, in whole, but not in part, at any time prior to June 15, 2017, March 15, 2018 and March 15, 2024, respectively, if certain changes in tax or investment company laws occur. After June 15, 2017, March 15, 2018 and March 15, 2024, SCE may redeem the Series F, G and H shares, respectively, at par, in whole or in part. For shares of Series H preference stock, distributions will accrue and be payable at a floating rate from and including March 15, 2024. Shares of Series F, G and H preference stock were issued to SCE Trust I, SCE Trust II and SCE Trust III, respectively, special purpose entities formed to issue trust securities as discussed in Note 3. Preference shares are not subject to mandatory redemption.
At
December 31, 2014
, declared dividends related to SCE's preferred and preference stock were
$18 million
.
The changes in accumulated other comprehensive loss, net of tax, consist of:
|
Edison International
|
SCE
|
||||||||||||||
|
Years ended December 31,
|
|||||||||||||||
|
(in millions)
|
2014
|
2013
|
2014
|
2013
|
|||||||||||
|
Beginning balance
|
$
|
(13
|
)
|
$
|
(87
|
)
|
$
|
(11
|
)
|
$
|
(29
|
)
|
|||
|
Pension and PBOP – net gain (loss):
|
|||||||||||||||
|
Other comprehensive income (loss) before reclassifications
|
(58
|
)
|
63
|
|
(21
|
)
|
13
|
|
|||||||
|
Reclassified from accumulated other comprehensive loss
1
|
11
|
|
9
|
|
2
|
|
3
|
|
|||||||
|
Other
|
2
|
|
2
|
|
2
|
|
2
|
|
|||||||
|
Change
|
(45
|
)
|
|
74
|
|
(17
|
)
|
18
|
|
||||||
|
Ending balance
|
$
|
(58
|
)
|
$
|
(13
|
)
|
$
|
(28
|
)
|
$
|
(11
|
)
|
|||
|
1
|
These items are included in the computation of net periodic pension and PBOP expense. See Note 8 for additional information.
|
103
Interest and other income and other expenses are as follows:
|
|
Years ended December 31,
|
|||||||||||
|
(in millions)
|
2014
|
2013
|
2012
|
|||||||||
|
SCE interest and other income:
|
|
|||||||||||
|
Equity allowance for funds used during construction
|
$
|
65
|
|
$
|
72
|
|
$
|
96
|
|
|||
|
Increase in cash surrender value of life insurance policies and life insurance benefits
|
36
|
|
30
|
|
27
|
|
||||||
|
Interest income
|
5
|
|
10
|
|
7
|
|
||||||
|
Other
|
16
|
|
10
|
|
14
|
|
||||||
|
Total SCE interest and other income
|
122
|
|
122
|
|
144
|
|
||||||
|
Edison International Parent and Other income
|
25
|
|
2
|
|
5
|
|
||||||
|
Total Edison International interest and other income
|
$
|
147
|
|
$
|
124
|
|
$
|
149
|
|
|||
|
SCE other expenses:
|
|
|||||||||||
|
Civic, political and related activities and donations
|
$
|
35
|
|
$
|
37
|
|
$
|
32
|
|
|||
|
Penalties
|
16
|
|
20
|
|
—
|
|
||||||
|
Other
|
28
|
|
17
|
|
18
|
|
||||||
|
Total SCE other expenses
|
79
|
|
74
|
|
50
|
|
||||||
|
Edison International Parent and Other other expenses
|
1
|
|
—
|
|
2
|
|
||||||
|
Total Edison International other expenses
|
$
|
80
|
|
$
|
74
|
|
$
|
52
|
|
|||
In August 2014, the CPUC approved
two
settlement agreements between SCE and the SED related to 2011 events in San Bernardino and San Gabriel, California. The settlement agreements resulted in SCE paying a
$15 million
penalty to the State General Fund. In 2013, SCE and the Safety and Enforcement Division of the CPUC agreed to terms of a settlement related to the 2007 wildfire in Malibu, California. The settlement agreement resulted in SCE paying a
$20 million
penalty to the State General Fund.
EME Chapter 11 Bankruptcy
In December 2012, EME and certain of its wholly-owned subsidiaries filed voluntary petitions for relief under Chapter 11 of the Bankruptcy Code in the Bankruptcy Court. Effective December 17, 2012, Edison International did not consolidate the earnings and losses of EME or its subsidiaries, except for income tax purposes, and reflected its ownership interest in EME utilizing the cost method of accounting. During the fourth quarter of 2012, Edison International recorded a full impairment of the investment in EME as a result of the deconsolidation of EME, recognition of losses previously deferred in accumulated other comprehensive income, a provision for losses from the EME bankruptcy and estimated tax impacts related to the expected future tax deconsolidation and separation of EME from Edison International. The aggregate impact of these matters resulted in an after tax charge of
$1.3 billion
. Edison International considered EME to be an abandoned asset under GAAP, and, as a result, the operations of EME prior to December 17, 2012 and for all prior years are reflected as discontinued operations in the consolidated financial statements.
In February 2014, Edison International, EME and the Consenting Noteholders entered into a settlement agreement (the "EME Settlement Agreement") pursuant to which EME amended its Plan of Reorganization to incorporate the terms of the EME Settlement Agreement, including extinguishing all existing claims between EME and Edison International. The Amended Plan of Reorganization, including the EME Settlement Agreement, was completed on April 1, 2014 with the sale of substantially all of EME's assets to NRG Energy, Inc. and the transactions called for in the EME Settlement Agreement, including an initial cash payment to the Reorganization Trust (as defined below) of
$225 million
in April 2014.
Under the Amended Plan of Reorganization, EME emerged from bankruptcy free of liabilities but remained an indirect wholly-owned subsidiary of Edison International, which was consolidated from April 1, 2014 and will continue to be consolidated with Edison International for income tax purposes. On April 1, 2014, all of the assets and liabilities of EME that were not otherwise discharged in the bankruptcy or transferred to NRG Energy were transferred to a newly formed trust
104
under the control of EME's existing creditors (the "Reorganization Trust"), except for (a) EME's income tax attributes, which are retained by the Edison International consolidated income tax group; (b) certain tax and pension related liabilities in the approximate amount of
$342 million
, which have been assumed by Edison International and for substantially all of which Edison International had joint and several responsibility; and (c) EME's indirect interest in Capistrano Wind Partners (the indirect investment in Capistrano Wind project is accounted for at fair value) and a small hydroelectric project.
In August 2014, Edison International entered into an amendment of the Settlement Agreement that finalized the remaining matters related to the EME Settlement including setting the amount of the
two
installment payments at
$204 million
due on September 30, 2015 and
$214 million
due on September 30, 2016.
The following table summarizes the results of discontinued operations for the periods presented:
|
Years ended December 31,
|
351 days ended December 16, 2012
|
||||||||||
|
(in millions)
|
2014
|
2013
|
|||||||||
|
Operating revenue
|
$
|
—
|
|
$
|
—
|
|
$
|
1,626
|
|
||
|
Loss before income taxes
|
(525
|
)
|
—
|
|
(2,235
|
)
|
|||||
Income (loss) from discontinued operations, net of tax, was
$185 million
,
$36 million
and
$(1.69) billion
for the years ended
December 31, 2014
,
2013
and
2012
, respectively. For the year ended December 31, 2014, Edison International recorded a pre-tax loss of
$525 million
primarily related to the
$225 million
initial cash payment to the Reorganization Trust, the
two
installment payments discussed above and the other assumed liabilities. Discontinued operations also includes after-tax income of
$168 million
related to changes in estimates of the net impact of retaining income tax attributes less the above payment obligations and assumed liabilities. Edison International also had income tax benefits of
$39 million
from resolution of uncertain tax positions from settlement of 2003 – 2006 tax years with the IRS and other impacts related to EME and an income tax loss of
$22 million
in 2014 (compared to a benefit of
$36 million
in 2013) from revised estimates of the tax impact of a tax deconsolidation of EME from Edison International. See Note 7 for more information.
The 2012 loss from discontinued operations reflects an earnings charge of
$1.3 billion
due to the full impairment of the investment in EME during the fourth quarter of 2012 as a result of the deconsolidation of EME, recognition of losses previously deferred in accumulated other comprehensive income, a provision for losses from the EME bankruptcy and estimated tax impacts related to the tax deconsolidation and separation of EME from Edison International. The 2012 loss also reflects a
$53 million
earnings charge associated with the divestiture by Homer City of substantially all of its remaining assets and certain specified liabilities.
Supplemental cash flows information is:
|
Edison International
|
SCE
|
||||||||||||||||||||||
|
|
Years ended December 31,
|
||||||||||||||||||||||
|
(in millions)
|
2014
|
2013
|
2012
|
2014
|
2013
|
2012
|
|||||||||||||||||
|
Cash payments (receipts) for interest and taxes:
|
|||||||||||||||||||||||
|
Interest, net of amounts capitalized
|
$
|
504
|
|
$
|
477
|
|
$
|
452
|
|
$
|
487
|
|
$
|
462
|
|
$
|
437
|
|
|||||
|
Tax payments (refunds), net
|
32
|
|
28
|
|
(165
|
)
|
(88
|
)
|
28
|
|
(279
|
)
|
|||||||||||
|
Non-cash financing and investing activities:
|
|||||||||||||||||||||||
|
Dividends declared but not paid:
|
|||||||||||||||||||||||
|
Common stock
|
$
|
136
|
|
$
|
116
|
|
$
|
110
|
|
$
|
147
|
|
$
|
—
|
|
$
|
—
|
|
|||||
|
Preferred and preference stock
|
18
|
|
30
|
|
24
|
|
18
|
|
30
|
|
24
|
|
|||||||||||
|
Notes issued under EME Settlement Agreement
|
$
|
418
|
|
$
|
—
|
|
$
|
—
|
|
$
|
—
|
|
$
|
—
|
|
$
|
—
|
|
|||||
SCE's accrued capital expenditures at
December 31, 2014
,
2013
and
2012
were
$837 million
,
$661 million
and
$671 million
, respectively. Accrued capital expenditures will be included as an investing activity in the consolidated statements of cash flow in the period paid.
105
Edison International and SCE provide and receive various services to and from its subsidiaries and affiliates. Services provided to Edison International by SCE are priced at fully loaded cost (i.e., direct cost of good or service and allocation of overhead cost). Specified administrative services such as payroll, employee benefit programs, all performed by Edison International or SCE employees, are shared among all affiliates of Edison International. Costs are allocated based on one of the following formulas: percentage of time worked, equity in investment and advances, number of employees, or multi-factor (operating revenues, operating expenses, total assets and number of employees). Edison International allocates various corporate administrative and general costs to SCE and other subsidiaries using established allocation factors. Management believes that the methods used to allocate expenses are reasonable and meet the reporting and accounting requirements of its regulatory agencies. Edison International has recorded liabilities at
December 31, 2014
of
$184 million
related to Capistrano Wind Holdings and Capistrano Wind for future payments due under the tax allocation agreements assuming net operating losses and credits generated by these entities are monetized.
Edison International's quarterly financial data is as follows:
|
2014
|
|||||||||||||||||||
|
(in millions, except per-share amounts)
|
Total
|
Fourth
|
Third
|
Second
|
First
|
||||||||||||||
|
Operating revenue
|
$
|
13,413
|
|
$
|
3,114
|
|
$
|
4,356
|
|
$
|
3,016
|
|
$
|
2,926
|
|
||||
|
Operating income
|
2,472
|
|
693
|
|
874
|
|
575
|
|
331
|
|
|||||||||
|
Income from continuing operations
1
|
1,536
|
|
406
|
|
524
|
|
382
|
|
224
|
|
|||||||||
|
Income (loss) from discontinued operations, net
|
185
|
|
39
|
|
(16
|
)
|
184
|
|
(22
|
)
|
|||||||||
|
Net income attributable to common shareholders
|
1,612
|
|
420
|
|
480
|
|
536
|
|
176
|
|
|||||||||
|
Basic earnings (loss) per share:
|
|||||||||||||||||||
|
Continuing operations
|
4.38
|
|
1.17
|
|
1.52
|
|
1.08
|
|
0.61
|
|
|||||||||
|
Discontinued operations
|
0.57
|
|
0.12
|
|
(0.05
|
)
|
0.56
|
|
(0.07
|
)
|
|||||||||
|
Total
|
4.95
|
|
1.29
|
|
1.47
|
|
1.64
|
|
0.54
|
|
|||||||||
|
Diluted earnings (loss) per share:
|
|||||||||||||||||||
|
Continuing operations
|
4.33
|
|
1.15
|
|
1.51
|
|
1.07
|
|
0.61
|
|
|||||||||
|
Discontinued operations
|
0.56
|
|
0.12
|
|
(0.05
|
)
|
0.56
|
|
(0.07
|
)
|
|||||||||
|
Total
|
4.89
|
|
1.27
|
|
1.46
|
|
1.63
|
|
0.54
|
|
|||||||||
|
Dividends declared per share
|
1.4825
|
|
0.4175
|
|
0.3550
|
|
0.3550
|
|
0.3550
|
|
|||||||||
|
Common stock prices:
|
|
|
|
|
|
||||||||||||||
|
High
|
68.74
|
|
68.74
|
|
59.54
|
|
58.24
|
|
56.61
|
|
|||||||||
|
Low
|
44.74
|
|
55.88
|
|
54.12
|
|
53.63
|
|
44.74
|
|
|||||||||
|
Close
|
65.48
|
|
65.48
|
|
55.92
|
|
58.11
|
|
56.61
|
|
|||||||||
|
1
|
In the first quarter of 2014, SCE recorded an impairment charge of
$231 million
(
$96 million
after-tax) in 2014. During the fourth quarter of 2014, SCE reduced its estimated impact of the San Onofre OII Settlement by
$68 million
(
$24 million
after-tax) consistent with the advice filing for reimbursement of recorded costs.
|
106
|
2013
|
|||||||||||||||||||
|
(in millions, except per-share amounts)
|
Total
|
Fourth
|
Third
|
Second
|
First
|
||||||||||||||
|
Operating revenue
|
$
|
12,581
|
|
$
|
2,943
|
|
$
|
3,960
|
|
$
|
3,046
|
|
$
|
2,632
|
|
||||
|
Operating income (loss)
|
1,715
|
|
505
|
|
789
|
|
(71
|
)
|
492
|
|
|||||||||
|
Income (loss) from continuing operations
1
|
979
|
|
289
|
|
488
|
|
(82
|
)
|
286
|
|
|||||||||
|
Income (loss) from discontinued operations, net
|
36
|
|
37
|
|
(25
|
)
|
12
|
|
12
|
|
|||||||||
|
Net income (loss) attributable to common shareholders
|
915
|
|
301
|
|
438
|
|
(94
|
)
|
271
|
|
|||||||||
|
Basic earnings (loss) per share:
|
|||||||||||||||||||
|
Continuing operations
|
2.70
|
|
0.81
|
|
1.42
|
|
(0.33
|
)
|
0.79
|
|
|||||||||
|
Discontinued operations
|
0.11
|
|
0.11
|
|
(0.08
|
)
|
0.04
|
|
0.04
|
|
|||||||||
|
Total
|
2.81
|
|
0.92
|
|
1.34
|
|
(0.29
|
)
|
0.83
|
|
|||||||||
|
Diluted earnings (loss) per share:
|
|||||||||||||||||||
|
Continuing operations
|
2.67
|
|
0.81
|
|
1.41
|
|
(0.33
|
)
|
0.78
|
|
|||||||||
|
Discontinued operations
|
0.11
|
|
0.11
|
|
(0.07
|
)
|
0.04
|
|
0.04
|
|
|||||||||
|
Total
|
2.78
|
|
0.92
|
|
1.34
|
|
(0.29
|
)
|
0.82
|
|
|||||||||
|
Dividends declared per share
|
1.3675
|
|
0.3550
|
|
0.3375
|
|
0.3375
|
|
0.3375
|
|
|||||||||
|
Common stock prices:
|
|
|
|
|
|
||||||||||||||
|
High
|
54.19
|
|
49.95
|
|
50.34
|
|
54.19
|
|
51.24
|
|
|||||||||
|
Low
|
44.26
|
|
44.97
|
|
44.26
|
|
44.86
|
|
44.92
|
|
|||||||||
|
Close
|
46.30
|
|
46.30
|
|
46.06
|
|
48.16
|
|
50.32
|
|
|||||||||
|
1
|
During the second quarter of 2013, SCE recorded an impairment charge of
$575 million
(
$365 million
after-tax) related to the permanent retirement of San Onofre Units 2 and 3.
|
SCE's quarterly financial data is as follows:
|
2014
|
|||||||||||||||||||
|
(in millions)
|
Total
|
Fourth
|
Third
|
Second
|
First
|
||||||||||||||
|
Operating revenue
|
$
|
13,380
|
|
$
|
3,104
|
|
$
|
4,338
|
|
$
|
3,014
|
|
$
|
2,924
|
|
||||
|
Operating income
|
2,529
|
|
715
|
|
881
|
|
593
|
|
342
|
|
|||||||||
|
Net income
1
|
1,565
|
|
408
|
|
531
|
|
392
|
|
234
|
|
|||||||||
|
Net income available for common stock
|
1,453
|
|
380
|
|
503
|
|
362
|
|
208
|
|
|||||||||
|
Common dividends declared
|
525
|
|
147
|
|
126
|
|
126
|
|
126
|
|
|||||||||
|
1
|
In the first quarter of 2014, SCE recorded an impairment charge of
$231 million
(
$96 million
after-tax) in 2014. During the fourth quarter of 2014, SCE reduced its estimated impact of the San Onofre OII Settlement by
$68 million
(
$24 million
after-tax) consistent with the advice filing for reimbursement of recorded costs.
|
|
2013
|
|||||||||||||||||||
|
(in millions)
|
Total
|
Fourth
|
Third
|
Second
|
First
|
||||||||||||||
|
Operating revenue
|
$
|
12,562
|
|
$
|
2,931
|
|
$
|
3,957
|
|
$
|
3,045
|
|
$
|
2,629
|
|
||||
|
Operating income (loss)
|
1,751
|
|
505
|
|
804
|
|
(55
|
)
|
498
|
|
|||||||||
|
Net income (loss)
1
|
1,000
|
|
283
|
|
502
|
|
(67
|
)
|
283
|
|
|||||||||
|
Net income (loss) available for common stock
|
900
|
|
258
|
|
477
|
|
(91
|
)
|
256
|
|
|||||||||
|
Common dividends declared
|
486
|
|
126
|
|
120
|
|
120
|
|
120
|
|
|||||||||
|
1
|
During the second quarter of 2013, SCE recorded an impairment charge of
$575 million
(
$365 million
after-tax) related to the permanent retirement of San Onofre Units 2 and 3.
|
Due to the seasonal nature of Edison International and SCE's business, a significant amount of revenue and earnings are recorded in the third quarter of each year. As a result of rounding, the total of the four quarters does not always equal the amount for the year.
107
SELECTED FINANCIAL DATA
Selected Financial Data:
2010
–
2014
|
(in millions, except per-share amounts)
|
2014
|
2013
|
2012
|
2011
|
2010
|
||||||||||||||
|
Edison International
|
|
|
|
|
|
||||||||||||||
|
Operating revenue
|
$
|
13,413
|
|
$
|
12,581
|
|
$
|
11,862
|
|
$
|
10,588
|
|
$
|
9,996
|
|
||||
|
Operating expenses
|
10,941
|
|
10,866
|
|
9,577
|
|
8,527
|
|
8,177
|
|
|||||||||
|
Income from continuing operations
|
1,536
|
|
979
|
|
1,594
|
|
1,100
|
|
1,144
|
|
|||||||||
|
Income (loss) from discontinued operations, net of tax
|
185
|
|
36
|
|
(1,686
|
)
|
(1,078
|
)
|
164
|
|
|||||||||
|
Net income (loss)
|
1,721
|
|
1,015
|
|
(92
|
)
|
22
|
|
1,308
|
|
|||||||||
|
Net income (loss) attributable to common shareholders
|
1,612
|
|
915
|
|
(183
|
)
|
(37
|
)
|
1,256
|
|
|||||||||
|
Weighted-average shares of common stock outstanding (in millions)
|
326
|
|
326
|
|
326
|
|
326
|
|
326
|
|
|||||||||
|
Basic earnings (loss) per share:
|
|
|
|
|
|
||||||||||||||
|
Continuing operations
|
$
|
4.38
|
|
$
|
2.70
|
|
$
|
4.61
|
|
$
|
3.20
|
|
$
|
3.34
|
|
||||
|
Discontinued operations
|
0.57
|
|
0.11
|
|
(5.17
|
)
|
(3.31
|
)
|
0.50
|
|
|||||||||
|
Total
|
$
|
4.95
|
|
$
|
2.81
|
|
$
|
(0.56
|
)
|
$
|
(0.11
|
)
|
$
|
3.84
|
|
||||
|
Diluted earnings (loss) per share:
|
|||||||||||||||||||
|
Continuing operations
|
$
|
4.33
|
|
$
|
2.67
|
|
$
|
4.55
|
|
$
|
3.17
|
|
$
|
3.32
|
|
||||
|
Discontinued operations
|
0.56
|
|
0.11
|
|
(5.11
|
)
|
(3.28
|
)
|
0.50
|
|
|||||||||
|
Total
|
$
|
4.89
|
|
$
|
2.78
|
|
$
|
(0.56
|
)
|
$
|
(0.11
|
)
|
$
|
3.82
|
|
||||
|
Dividends declared per share
|
1.4825
|
|
1.3675
|
|
1.3125
|
|
1.285
|
|
1.265
|
|
|||||||||
|
Total assets
1
|
$
|
50,186
|
|
$
|
46,646
|
|
$
|
44,394
|
|
$
|
48,039
|
|
$
|
45,530
|
|
||||
|
Long-term debt excluding current portion
|
10,234
|
|
9,825
|
|
9,231
|
|
8,834
|
|
8,029
|
|
|||||||||
|
Capital lease obligations excluding current portion
|
196
|
|
203
|
|
210
|
|
216
|
|
221
|
|
|||||||||
|
Preferred and preference stock of utility
|
2,022
|
|
1,753
|
|
1,759
|
|
1,029
|
|
907
|
|
|||||||||
|
Common shareholders' equity
|
10,960
|
|
9,938
|
|
9,432
|
|
10,055
|
|
10,583
|
|
|||||||||
|
Southern California Edison Company
|
|||||||||||||||||||
|
Operating revenue
|
$
|
13,380
|
|
$
|
12,562
|
|
$
|
11,851
|
|
$
|
10,577
|
|
$
|
9,983
|
|
||||
|
Operating expenses
|
10,851
|
|
10,811
|
|
9,572
|
|
8,454
|
|
8,119
|
|
|||||||||
|
Net income
|
1,565
|
|
1,000
|
|
1,660
|
|
1,144
|
|
1,092
|
|
|||||||||
|
Net income available for common stock
|
1,453
|
|
900
|
|
1,569
|
|
1,085
|
|
1,040
|
|
|||||||||
|
Total assets
|
$
|
49,456
|
|
$
|
46,050
|
|
$
|
44,034
|
|
$
|
40,315
|
|
$
|
35,906
|
|
||||
|
Long-term debt excluding current portion
|
9,624
|
|
9,422
|
|
8,828
|
|
8,431
|
|
7,627
|
|
|||||||||
|
Capital lease obligations excluding current portion
|
196
|
|
203
|
|
210
|
|
216
|
|
221
|
|
|||||||||
|
Preferred and preference stock
|
2,070
|
|
1,795
|
|
1,795
|
|
1,045
|
|
920
|
|
|||||||||
|
Common shareholder's equity
|
11,212
|
|
10,343
|
|
9,948
|
|
8,913
|
|
8,287
|
|
|||||||||
|
Capital structure:
|
|
|
|
|
|
|
|||||||||||||
|
Common shareholder's equity
|
49.0
|
%
|
48.0
|
%
|
48.4
|
%
|
48.5
|
%
|
49.2
|
%
|
|||||||||
|
Preferred and preference stock
|
9.0
|
%
|
8.3
|
%
|
8.7
|
%
|
5.7
|
%
|
5.5
|
%
|
|||||||||
|
Long-term debt
|
42.0
|
%
|
43.7
|
%
|
42.9
|
%
|
45.8
|
%
|
45.3
|
%
|
|||||||||
|
1
|
Total assets includes assets from continuing and discontinued operations.
|
The selected financial data was derived from Edison International's and SCE's audited financial statements and is qualified in its entirety by the more detailed information and financial statements, including notes to these financial statements, included in this annual report. References to Edison International refer to the consolidated group of Edison International and its subsidiaries.
108
CONTROLS AND PROCEDURES
Disclosure Controls and Procedures
Based on an evaluation of Edison International's and SCE's disclosure controls and procedures, as defined in Rules 13a-15(e) and 15d-15(e) of the Securities Exchange Act of 1934, as amended (the "Exchange Act"), as of December 31, 2014, Edison International's and SCE's respective principal executive officers and principal financial officers have concluded that such controls and procedures are effective to ensure that information required to be disclosed by Edison International and SCE in reports that the companies file or submit under the Exchange Act is recorded, processed, summarized, and reported within the time periods specified in the SEC rules and forms. In addition, Edison International's and SCE's respective principal executive officers and principal financial officers have concluded that such controls and procedures were effective in ensuring that information required to be disclosed by Edison International and SCE in the reports that Edison International and SCE file or submit under the Exchange Act is accumulated and communicated to Edison International's and SCE's management, including Edison International's and SCE's respective principal executive officers and principal financial officers, or persons performing similar functions, as appropriate to allow timely decisions regarding required disclosure.
Management's Report on Internal Control Over Financial Reporting
Edison International's and SCE's respective management are responsible for establishing and maintaining adequate internal control over financial reporting, as such term is defined in Exchange Act Rules 13a-15(f) and 15d-15(f), for Edison International and its subsidiaries and SCE, respectively. Under the supervision and with the participation of their respective principal executive officer and principal financial officer, Edison International's and SCE's management conducted an evaluation of the effectiveness of their respective internal controls over financial reporting based on the framework set forth in
Internal Control—Integrated Framework
(2013) issued by the Committee of Sponsoring Organizations of the Treadway Commission (COSO). Based on their evaluations under the COSO framework, Edison International's and SCE's respective management concluded that Edison International's and SCE's respective internal controls over financial reporting were effective as of December 31, 2014. Edison International's internal control over financial reporting as of December 31, 2014 has been audited by PricewaterhouseCoopers LLP, an independent registered public accounting firm, as stated in their report on the financial statements included in this report, which is incorporated herein by this reference. This annual report does not include an attestation report of SCE's independent registered public accounting firm regarding internal control over financial reporting. Management's report for SCE is not subject to attestation by the independent registered public accounting firm.
Changes in Internal Control Over Financial Reporting
There were no changes in Edison International's or SCE's internal control over financial reporting during the fourth quarter of 2014 that have materially affected, or are reasonably likely to materially affect, Edison International's or SCE's internal control over financial reporting.
Jointly Owned Utility Plant
Edison International's and SCE's respective scope of evaluation of internal control over financial reporting includes their Jointly Owned Utility Projects.
OTHER INFORMATION
None.
CHANGES IN AND DISAGREEMENTS WITH ACCOUNTANTS ON ACCOUNTING AND FINANCIAL DISCLOSURE
None.
BUSINESS
CORPORATE STRUCTURE, INDUSTRY AND OTHER INFORMATION
Edison International was incorporated in 1987 as the parent holding company of SCE, a California public utility. Edison International also owns and holds interests in companies that are Competitive Businesses.
The principal executive offices of Edison International and SCE are located at 2244 Walnut Grove Avenue, P.O. Box 976, Rosemead, California 91770, and the telephone numbers are (626) 302-2222 for Edison International and (626) 302-1212 for SCE.
109
This is a combined Annual Report on Form 10-K for Edison International and SCE. Edison International and SCE make available at www.edisoninvestor.com: Annual Reports on Form 10-K, Quarterly Reports on Form 10-Q, Current Reports on Form 8-K, Proxy Statements and amendments to those reports filed or furnished pursuant to Section 13(a) or 15(d) of the Securities Exchange Act, as soon as reasonably practicable after Edison International and SCE electronically file such material with, or furnishes it to, the SEC. Such reports are also available on the SEC's internet website at www.sec.gov. The information contained on, or connected to, the Edison investor website is not incorporated by reference into this report.
Subsidiaries of Edison International
SCE – Public Utility
SCE is an investor-owned public utility primarily engaged in the business of supplying and delivering electricity through SCE's electrical infrastructure to an approximately 50,000 square-mile area of southern California. The SCE service area contains a population of nearly 14 million people and SCE serves the population through approximately 5 million customer accounts. In 2014, SCE's total operating revenue of $13.4 billion was derived as follows: 42.4% commercial customers, 36.1% residential customers, 5.7% agricultural and other, 5.6% industrial customers, 5.1% public authorities and 5.1% other operating revenue.
Edison Energy – New Competitive Businesses
Edison International is investing in Competitive Businesses as it continues to see merit in the ownership and operation of Competitive Businesses as a matter of corporate strategy. The current efforts include competitive transmission and meeting the electricity needs of commercial and industrial customers. The competitive transmission focus is on solicitations for transmission projects outside the SCE service territory. The commercial and industrial customer service efforts are pursuing business ventures in a number of areas related to the provision of electric power and infrastructure, including distributed generation, storage, and power management services to the commercial and industrial sector. Distributed generation is offered through a subsidiary of Edison Energy, SoCore Energy LLC, which as of December 31, 2014, has constructed 26 MW of rooftop solar systems in nine states selling power back to commercial customers under power purchase agreements.
To date, these investments are not material for financial reporting purposes.
Regulation of Edison International as a Holding Company
As a public utility holding company, Edison International is subject to the Public Utility Holding Company Act. The Public Utility Holding Company Act primarily obligates Edison International and its utility subsidiaries to provide access to their books and records to the FERC and the CPUC for ratemaking purposes.
Edison International is not a public utility and its capital structure is not regulated by the CPUC. The 1988 CPUC decision authorizing SCE to reorganize into a holding company structure, however, imposed certain obligations on Edison International and its affiliates. These obligations include a requirement that SCE's dividend policy shall continue to be established by SCE's Board of Directors as though SCE were a stand-alone utility company, and that the capital requirements of SCE, as deemed to be necessary to meet SCE's service obligations, shall receive first priority from the Boards of Directors of Edison International and SCE. The CPUC has also promulgated Affiliate Transaction Rules, which, among other requirements, prohibit holding companies from (1) being used as a conduit to provide non-public information to a utility's affiliate and (2) causing or abetting a utility's violation of the rules, including providing preferential treatment to affiliates.
Employees and Labor Relations
At December 31, 2014, Edison International and its consolidated subsidiaries had an aggregate of 13,690 full-time employees, 13,600 of which were full-time employees at SCE.
Approximately 3,900 of SCE's full-time employees are covered by collective bargaining agreements with the IBEW. The IBEW collective bargaining agreements expired on December 31, 2014 and are currently under negotiation. The parties have agreed to allow the expired agreements to remain in force during ongoing negotiations, subject to either party’s right to terminate the agreements on 120 days written notice.
Insurance
Edison International maintains a property and casualty insurance program for itself and its subsidiaries and excess liability insurance covering liabilities to third parties for bodily injury or property damage resulting from operations. These policies are subject to specific retentions, sub-limits and deductibles, which are comparable to those carried by other utility companies
110
of similar size. SCE also has separate insurance programs for nuclear property and liability, workers compensation and solar rooftop construction. For further information on nuclear and wildfire insurance, see "Notes to Consolidated Financial Statements—Note 11. Commitments and Contingencies—Contingencies."
SOUTHERN CALIFORNIA EDISON COMPANY
Regulation
CPUC
The CPUC has the authority to regulate, among other things, retail rates, energy purchases on behalf of retail customers, SCE capital structure, rate of return, issuance of securities, disposition of utility assets and facilities, oversight of nuclear decommissioning funding and costs, and aspects of the transmission system planning, site identification and construction, including safety.
FERC
The FERC has the authority to regulate wholesale rates as well as other matters, including unbundled transmission service pricing, rate of return, accounting practices, and licensing of hydroelectric projects. The FERC also has jurisdiction over a portion of the retail rates and associated rate design.
NERC
The FERC assigned administrative responsibility to the NERC to establish and enforce reliability standards and critical infrastructure protection standards, which protect the bulk power system against potential disruptions from cyber and physical security breaches. The critical infrastructure protection standards focus on controlling access to critical physical and cyber security assets, including supervisory control and data acquisition systems for the electric grid. Compliance with these standards is mandatory. The maximum penalty that may be levied for violating a NERC reliability or critical infrastructure protection standard is $1 million per violation, per day.
SCE has a formal cyber security program that covers SCE's information technology systems as well as customer data. Program staff is engaged with industry groups as well as public-private initiatives to reduce risk and to strengthen the security and reliability of SCE's systems and infrastructure. The program is also engaged in the protection of SCE's customer information.
Nuclear Power Plant Regulation
The NRC has jurisdiction with respect to the safety of the San Onofre and Palo Verde Nuclear Generating Stations. The NRC regulates commercial nuclear power plants through licensing, oversight and inspection, performance assessment, and enforcement of its requirements. In June 2013, SCE decided to permanently retire and decommission San Onofre. For further information, see "Management Overview—Permanent Retirement of San Onofre and San Onofre OII Settlement" in the MD&A.
Other Regulatory Agencies
The construction, planning and project site identification of SCE's transmission lines and substation facilities require the approval of many governmental agencies and compliance with various laws in addition to the CPUC and FERC. These include various state regulatory agencies depending on the project location; the CAISO, and other environmental, land management and resource agencies such as the Bureau of Land Management, the U.S. Forest Service, the California Department of Fish and Game, and the California Coastal Commission; and regional water quality control boards. In addition, to the extent that SCE transmission line projects pass through lands owned or controlled by Native American tribes, consent and approval from the affected tribes and the Bureau of Indian Affairs are also necessary for the project to proceed.
Overview of Ratemaking Process
CPUC
Revenue authorized by the CPUC through triennial GRC proceedings is intended to provide SCE a reasonable opportunity to recover its costs and earn a return on its net investments in generation and distribution assets and general plant (also referred to as "rate base") on a forecast basis. The CPUC sets an annual revenue requirement for the base year which is made up of the operation and maintenance costs, depreciation, taxes and a return consistent with the authorized cost of capital (discussed below). In the GRC proceedings, the CPUC also generally approves the level of capital spending on a forecast basis. Following the base year, the revenue requirements for the remaining two years are set by a methodology established in the
111
GRC proceeding, which generally, among other items, includes annual allowances for escalation in operation and maintenance costs and additional changes in capital-related investments. In December 2014, the CPUC adopted new risk assessment processes to be incorporated into GRC proceedings, including a triennial safety model assessment proceeding ("S-MAP") to assess the utility models used to prioritize safety risks, an examination to assess utilities' assessment of their key risks and their proposed mitigation programs, and annual reporting of risk spending and mitigation results. SCE's initial S-MAP application is due in May 2015.
SCE's 2012 GRC authorized revenue requirements for 2012, 2013, and 2014 of $5.7 billion, $5.8 billion, and $6.2 billion, respectively. In November 2013, SCE filed its 2015 GRC application, which was subsequently revised to a 2015 base rate revenue requirement request of $5.7 billion. For further discussion of the 2015 GRC, see "Management Overview—Regulatory Matters—2015 General Rate Case" in the MD&A.
The CPUC regulates SCE's cost of capital, including its capital structure and authorized rates of return. SCE's authorized capital structure is 43% long-term debt, 9% preferred equity and 48% common equity. SCE's currently authorized cost of capital consists of: cost of long-term debt of 5.49%, cost of preferred equity of 5.79% and return on common equity of 10.45%. In December 2014, the CPUC granted a request made by SCE and the other Investor-owned utilities to postpone the filing of new cost of capital applications from April 2015 to April 2016, thus extending the current cost of capital mechanism through 2016. The mechanism provides for an automatic adjustment to SCE's authorized cost of capital if the utility bond index changes beyond certain thresholds on an annual basis. The index changes did not exceed the threshold in September 2014 so the return on common equity will remain at 10.45% in 2015.
SCE's return on investment is established by multiplying an authorized rate of return, determined in separate cost of capital proceedings, by SCE's authorized CPUC rate base.
CPUC rates decouple authorized revenue from the volume of electricity sales so that SCE receives revenue equal to amounts authorized. Differences between amounts collected and authorized levels are either collected from or refunded to customers, and, therefore, such differences do not impact operating revenue. Accordingly, SCE is neither benefited nor burdened by the volumetric risk related to retail electricity sales.
Balancing accounts (also referred to as cost-recovery mechanisms) are typically used to track and recover SCE's decoupled costs of fuel and purchased-power, as well as certain operation and maintenance expenses, including energy efficiency and demand-side management program costs. SCE earns no return on these activities and although differences between forecasted and actual costs do not impact earnings, such differences do impact cash flows and can change rapidly.
SCE's balancing account for fuel and power procurement-related costs is referred to as the ERRA balancing account. SCE sets rates based on an annual forecast of the costs that it expects to incur during the subsequent year. In addition, the CPUC has established a "trigger" mechanism for the ERRA balancing account that allows for a rate adjustment if the balancing account over- or under-collection exceeds 5% of SCE's prior year's revenue that is classified as generation for retail rates. For 2015, the trigger amount is approximately $337 million. At December 31, 2014, SCE's undercollection in the ERRA balancing account was approximately $1.03 billion. For further information on the status of the ERRA undercollection, see "Management Overview—Permanent Retirement of San Onofre and San Onofre OII Settlement'' in the MD&A.
The majority of procurement-related costs eligible for recovery through cost-recovery rates are pre-approved by the CPUC through specific decisions and a procurement plan with predefined standards that establish the eligibility for cost recovery. If such costs are subsequently found to be non-compliant with this procurement plan, then this could negatively impact SCE's earnings and cash flows. In addition, the CPUC retrospectively reviews outages associated with utility-owned generation and SCE's power procurement contract administration activities through the annual ERRA review proceeding. If SCE is found to be unreasonable or imprudent with respect to its utility-owned generation outages and contract administration activities, then this could negatively impact SCE's earnings and cash flows.
FERC
Revenue authorized by the FERC is intended to provide SCE with recovery of its prudently-incurred transmission costs, including a return on its net investment in transmission assets (also referred to as "rate base"). In November 2013, the FERC approved SCE's settlement to implement a formula rate effective January 1, 2012 to determine SCE's FERC transmission revenue requirement, including its construction work in progress ("CWIP") revenue requirement that was previously recovered through a separate mechanism. Under operation of the formula rate, transmission revenue will be updated to actual cost of service annually. The transmission revenue requirement and rates are updated each December, to reflect a forecast of costs for the upcoming rate period, as well as a true up of the transmission revenue to actual costs incurred by SCE in the prior calendar year on its formula rate. The FERC weighted average ROE, including project and other incentives, was 10.45% in 2014 and can vary based on the mix of project costs that have different incentives. The FERC ROE will remain in
112
effect until at least June 30, 2015, when the moratorium, provided for in the settlement, on modifications to the formula rate tariff ends. For further information on the current FERC formula rates, related transmission revenue requirements and rate changes, see "Liquidity and Capital Resources—SCE—Regulatory Proceedings—FERC Formula Rates" in the MD&A.
Retail Rates Structure and Residential Rate Design
To develop retail rates, the authorized revenue requirements are allocated among all customer classes (residential, commercial, industrial, agricultural and street lighting) on a functional basis (i.e., generation, distribution, transmission, etc.). Specific rate components are designed to recover the authorized revenue allocated to each customer class.
SCE has a four-tier residential rate structure. Each tier represents a certain electricity usage level and within each increasing usage level, the electricity is priced at a higher rate per kilowatt hour. Although, for more than a decade, statutory restrictions on increasing Tier 1 and 2 rates resulted in shifting much of the cost of residential rate increases to the higher tier/usage customers, the California legislature passed a law ("AB 327") in October 2013 that lifts the restrictions on Tier 1 and 2 rates. The CPUC approved substantial increases to Tier 1 and 2 rates that went into effect in July 2014. The CPUC is still considering additional, longer-term residential rate change proposals in an ongoing proceeding that is expected to conclude in the first half of 2015. The decision in that proceeding may result in a phased-in increase to SCE's nominal customer charge, which will permit SCE to recover a portion of its fixed costs of serving residential customers through fixed charges rather than through energy charges that vary with usage. In addition to proposing a substantial increase in its customer charge, SCE has proposed that by 2018, the number of usage tiers be reduced from four tiers to two, with a price differential of 20%.
Energy Efficiency Incentive Mechanism
In December 2012, the CPUC adopted an energy efficiency incentive mechanism for the 2010 – 2012 energy efficiency program performance period. The mechanism uses an incentive calculation that is based on actual energy efficiency expenditures. The December 2012 CPUC decision provided shareholder earnings for the 2010 program performance period and allows SCE the opportunity to claim future shareholder earnings in both 2013 and 2014 associated with SCE's 2011 and 2012 program performance periods using this incentive calculation. In September 2013, the CPUC adopted a new energy efficiency incentive mechanism called the Energy Savings and Performance Incentive Mechanism ("ESPI"). The ESPI will apply starting with the 2013 – 2014 energy efficiency program cycle and continue for subsequent cycles, until further notice. The ESPI is comprised of performance/savings rewards and management fees based on actual energy efficiency expenditures and does not contain any provisions for penalties. The proposed ESPI schedule for earning claims anticipates payments of the incentive rewards occurring between one and two years after the relevant program year. For further discussion of SCE's energy efficiency incentive awards, see "Liquidity and Capital Resources—SCE—Regulatory Proceedings—Energy Efficiency Incentive Mechanism" in the MD&A.
Purchased Power and Fuel Supply
SCE obtains power needed to serve its customers primarily from purchases from qualifying facilities, independent power producers, the CAISO, and other utilities as well as from its generating facilities.
Natural Gas Supply
SCE requires natural gas to meet contractual obligations for power tolling agreements (power contracts in which SCE has agreed to provide or pay for the natural gas burned to generate electricity). SCE also requires natural gas to fuel its Mountainview and peaker plants, which are generation units that are designed to operate in response to changes in demand for power. The physical natural gas purchased by SCE is subject to competitive bidding.
CAISO Wholesale Energy Market
The CAISO operates a wholesale energy market primarily in California through which competing electricity generators offer their electricity output to market participants, including electricity retailers. The CAISO schedules power in hourly increments with hourly prices through a day-ahead market in California and schedules power in fifteen-minute and five-minute increments with fifteen-minute and five-minute prices through two real-time markets that cover California and portions of six neighboring states through the Energy Imbalance Market. Both markets optimize energy procurement, ancillary service procurement, unit commitment and congestion management. SCE participates in the day-ahead and real-time markets for the sale of its generation and purchases for its load requirements.
113
The CAISO uses a nodal locational pricing model, which sets wholesale electricity prices at system points ("nodes") that reflect local generation and delivery costs. Generally, SCE bids the electric generation resources that it owns or controls into the day-ahead and real-time markets based on the economics of that resource. SCE also separately bids its expected load into these same markets. To the extent SCE's generation bids are selected, SCE's customers receive market revenues for those resources based on the market price that corresponds to the nodes for those resources at the time the award was made. For SCE's load, SCE's customers pay a price that reflects the aggregate price of generation for the nodes that are located in SCE's service territory.
Congestion may occur when available energy cannot be delivered due to transmission constraints, which results in transmission congestion charges and differences in prices at various nodes. The CAISO also offers congestion revenue rights or CRRs, a commodity that entitles the holder to receive (or pay) the value of transmission congestion between specific nodes, acting as a potential economic hedge against transmission congestion charges in the day-ahead market. Currently, no such instrument exists for the real-time markets.
Competition
SCE faces retail competition in the sale of electricity to the extent that federal and California laws permit other entities to provide electricity and related services to customers within SCE's service area. While California law provides only limited opportunities for customers in SCE's service area to choose to purchase power directly from an energy service provider other than SCE, a limited, phased-in expansion of customer choice (direct access) for nonresidential customers was permitted beginning in 2009. SCE also faces competition from cities and municipal districts that create municipal utilities or community choice aggregators. Competition between SCE and other electricity providers is conducted mainly on the basis of price.
SCE also faces increased competition from customer-owned power generation alternatives, such as roof-top solar facilities, becoming available to its customers as a result of technological developments, federal and state subsidies, and declining costs of such alternatives.
Customer-owned power generation's competitiveness has been fostered by legislation passed in 1995, when these generation systems were first introduced to the marketplace. The legislation was meant to encourage private investment in renewable energy resources by both residential and non-residential customers and required SCE to offer a net energy metering ("NEM") billing option to customers who install eligible power generation systems to supply all or part of their energy needs. SCE is required to offer the NEM option until the total generating capacity used by NEM customers exceeds 10% of SCE's aggregate customer peak demand (the "NEM Cap").
NEM customers are interconnected to SCE's grid and credited for the net difference between the electricity SCE supplied to them through the grid and the electricity the customer exported to SCE over a twelve month period. SCE is required to credit the NEM customer for most of the power they sell back to SCE at the full retail rate. Through the credit they receive, NEM customers effectively avoid paying costs for the grid, which include all of the fixed costs of the poles, wires, meters, advanced technologies, and other infrastructure that makes the grid safe, reliable, and able to accommodate solar panels or other customer-owned generation systems. In addition, NEM customers are exempted from standby and departing load charges and interconnection-related costs.
AB 327 directs the CPUC to address this subsidization through: rate reform, which includes the imposition of fixed charges on both NEM and non-NEM customers; the development of a new standard billing contract for customers who install generation systems after July 2017 or the attainment of the NEM Cap; and a transition period over which customers who received NEM billing prior to new standard billing contract period will transition to the new contract. In March 2014, the CPUC established a 20-year transition period for customers who apply to use SCE's NEM tariff by July 1, 2017 or when SCE reaches its NEM Cap, whichever is first. AB 327 requires, among other things, that the CPUC ensure that the new standard billing contract will be based on the actual costs and benefits of customer-owned power generation. The proceeding to develop the new standard contract or tariff is in its early stages.
The effect of these types of competition on SCE generally is to reduce the amount of electricity purchased by customers. However customers, except for NEM customers, who use alternative electricity providers, typically continue to utilize and pay for SCE's transmission and distribution services. See "Risk Factors—Risks Relating to Southern California Edison Company—Regulatory Risks."
In the area of transmission infrastructure, SCE may experience increased competition from independent transmission providers. The FERC has made changes to its transmission planning requirements with the goal of opening transmission development to competition from independent developers. The FERC adopted rules, effective in 2011, that removed the incumbent public utility transmission owners' federally-based right of first refusal to construct certain new transmission
114
facilities and mandated regional and interregional transmission planning. In compliance with these rules, regional entities, such as ISOs, have created new processes for regional and interregional transmission planning and the competitive solicitation and selection of developers (including incumbent utilities) to build and own certain types of new transmission projects. In December 2014, the FERC issued orders approving the CAISO's process for regional planning and competitive solicitations and the CAISO's interregional planning process. The CAISO has begun holding competitive solicitations pursuant to the new rules.
Properties
SCE supplies electricity to its customers through extensive transmission and distribution networks. Its transmission facilities, which include sub-transmission facilities and are located primarily in California but also in Nevada and Arizona, deliver power from generating sources to the distribution network and consist of lines ranging from 33 kV to 500 kV and substations. SCE's distribution system, which takes power from substations to customers, includes over 53,000 line miles of overhead lines, 38,000 line miles of underground lines and approximately 800 distribution substations, all of which are located in California. SCE owns the generating facilities listed in the following table:
|
Generating Facility
|
Location
(in CA, unless
otherwise noted)
|
Fuel Type
|
Operator
|
SCE's
Ownership
Interest (%)
|
Net Physical
Capacity
(in MW)
|
SCE's Capacity
pro rata share
(in MW)
|
||||||||||
|
Hydroelectric Plants (33)
|
Various
|
Hydroelectric
|
SCE
|
100
|
%
|
1,153
|
|
1,153
|
|
|||||||
|
Pebbly Beach Generating Station
|
Catalina Island
|
Diesel
|
SCE
|
100
|
%
|
9
|
|
9
|
|
|||||||
|
Mountainview Units 3 and 4
|
Redlands
|
Natural Gas
|
SCE
|
100
|
%
|
1,050
|
|
1,050
|
|
|||||||
|
Peaker Plants (5)
|
Various
|
Natural Gas
|
SCE
|
100
|
%
|
245
|
|
245
|
|
|||||||
|
Palo Verde Nuclear Generating Station
|
Phoenix, AZ
|
Nuclear
|
APS
|
15.8
|
%
|
3,739
|
|
591
|
|
|||||||
|
Solar PV Plants (25)
|
Various
|
Photovoltaic
|
SCE
|
100
|
%
|
91
|
|
91
|
|
|||||||
|
Total
|
|
|
|
|
6,287
|
|
3,139
|
|
||||||||
Certain of SCE's substations, and portions of its transmission, distribution and communication systems are located on lands owned by the federal, state or local governments under licenses, permits, easements or leases, or on public streets or highways pursuant to franchises. Certain of the documents evidencing such rights obligate SCE, under specified circumstances and at its expense, to relocate such transmission, distribution, and communication facilities located on lands owned or controlled by federal, state, or local governments.
The majority of SCE's hydroelectric plants and related reservoirs are located in whole or in part on U.S.-owned lands and are subject to FERC licenses. Slightly over half of these plants have FERC licenses that expire at various times between 2021 and 2046. SCE continuously monitors and maintains these licenses. FERC licenses impose numerous restrictions and obligations on SCE, including the right of the United States to acquire projects upon payment of specified compensation. When existing licenses expire, the FERC has the authority to issue new licenses to third parties that have filed competing license applications, but only if their license application is superior to SCE's and then only upon payment of specified compensation to SCE. New licenses issued to SCE are expected to contain more restrictions and obligations than the expired licenses because laws enacted since the existing licenses were issued require the FERC to give environmental objectives greater consideration in the licensing process. Substantially all of SCE's properties are subject to the lien of a trust indenture securing first and refunding mortgage bonds. See "Notes to Consolidated Financial Statements—Note 5. Debt and Credit Agreements."
Seasonality
Due to warm weather during the summer months and SCE's rate design, operating revenue during the third quarter of each year is generally higher than the other quarters.
ENVIRONMENTAL REGULATION OF EDISON INTERNATIONAL AND SUBSIDIARIES
Legislative and regulatory activities by federal, state, and local authorities in the United States relating to energy and the environment impose numerous restrictions on the operation of existing facilities and affect the timing, cost, location, design, construction, and operation of new facilities by Edison International's subsidiaries, as well as the cost of mitigating the environmental impacts of past operations. The environmental regulations and other developments discussed below may impact SCE's fossil-fuel fired power plants and fossil-fuel power plants owned by others that SCE purchases power from, and
115
accordingly, the discussion in this section focuses mainly on regulations applicable to California. For more information on environmental risks, see "Risk Factors—Risks Relating to Southern California Edison Company—Environmental Risks."
Edison International and SCE continue to monitor legislative and regulatory developments and to evaluate possible strategies for compliance with environmental regulations. Additional information about environmental matters affecting Edison International and its subsidiaries, including projected environmental capital expenditures, is included in the MD&A under the heading "Liquidity and Capital Resources—SCE—Capital Investment Plan" and in "Notes to Consolidated Financial Statements—Note 11. Commitments and Contingencies—Contingencies—Environmental Remediation."
Air Quality
The CAA, which regulates air pollutants from mobile and stationary sources, has a significant impact on the operation of fossil fuel plants. The CAA requires the US EPA to establish concentration levels in the ambient air for six criteria pollutants to protect public health and welfare. These concentration levels are known as NAAQS. The six criteria pollutants are carbon monoxide, lead, nitrogen dioxide, ozone, particulate matter, and SO
2
.
Federal environmental regulations of these criteria pollutants require states to adopt state implementation plans, known as SIPs, for certain pollutants, which detail how the state will attain the standards that are mandated by the relevant law or regulation. The SIPs must be equal to or more stringent than the federal requirements and must be submitted to the US EPA for approval. Each state identifies the areas within its boundaries that meet the NAAQS (attainment areas) and those that do not (non-attainment areas), and must develop a SIP both to bring non-attainment areas into compliance with the NAAQS and to maintain good air quality in attainment areas. Much of southern California is in a non-attainment area for several criteria pollutants.
National Ambient Air Quality Standards
The US EPA has proposed primary and secondary NAAQS for 8-hour ozone. Areas in SCE's service area were classified in various degrees of nonattainment with these standards. California has developed air quality management plans and updated its SIP to outline how compliance with the NAAQS will be achieved, but these plans remain subject to US EPA approval and challenges from environmental groups in federal court. The implementation plans and proposed revisions call for more stringent restrictions on air emissions, which could further increase the difficulty of siting new natural gas fired generation in Southern California.
Water Quality
Clean Water Act
Regulations under the federal Clean Water Act dictate permitting and mitigation requirements for many of SCE's construction projects, and govern critical parameters at generating facilities, such as the temperature of effluent discharges and the location, design, and construction of cooling water intake structures at generating facilities. Federal standards intended to protect aquatic organisms by reducing capture in the screens attached to cooling water intake structures (impingement) at generating facilities and the water volume brought into the facilities (entrainment) have been finalized. However, due to the decision to permanently retire San Onofre Units 2 and 3, SCE sought relief from the federal standards in order to avoid material capital expenditures at San Onofre.
California Restriction on the Use of Ocean-Based Once-Through Cooling
California has a US EPA-approved program to issue individual or group permits for the regulation of Clean Water Act discharges. California also regulates certain discharges not regulated by the US EPA. In 2010, the California State Water Resources Control Board ("SWRCB") issued a final policy, which established significant restrictions on the use of ocean water by existing once-through cooled power plants along the California coast. The final policy required an independent engineering study to be completed prior to the fourth quarter of 2013 regarding the feasibility of compliance by California's two coastal nuclear power plants. SCE received a suspension of the requirement to perform the study pending the submittal of additional information to the SWRCB regarding the continued use of ocean water at San Onofre during decommissioning. In January 2015, the SWRCB notified SCE that due to the reduced intake flow of water, SCE would not be required to complete the independent engineering study. The SWRCB also informed SCE that for as long as any intake of ocean water continues at San Onofre, a large organism exclusion device would have to be installed on the offshore intakes no later than December 31, 2016 to prevent the inadvertent taking of large marine mammals.
The policy's implementation schedule requires once-through cooled, gas-fired coastal generation facilities that provide power to SCE to phase out the use of once-through cooling by 2020. SCE is engaged in procuring new sources of electricity to replace suppliers that shut down due to these requirements.
116
Greenhouse Gas Regulation
There have been a number of federal and state legislative and regulatory initiatives to reduce GHG emissions. Any climate change regulation or other legal obligation that would require substantial reductions in GHG emissions or that would impose additional costs or charges for the emission of GHGs could significantly increase the cost of generating electricity from fossil fuels, as well as the cost of purchased power.
Federal Legislative/Regulatory Developments
In 2010, the US EPA issued the Prevention of Significant Deterioration ("PSD") and Title V Greenhouse Gas Tailoring Rule, known as the "GHG tailoring rule." This regulation generally subjects newly constructed sources of GHG emissions and newly modified existing major sources to the PSD air permitting program beginning in January 2011 (and later, to the Title V permitting program under the CAA); however, the GHG tailoring rule significantly increases the emissions thresholds that apply before facilities are subjected to these programs. In September 2013, the US EPA announced proposed carbon dioxide emissions limits for new power plants. In June 2014, the US EPA announced proposed carbon dioxide emissions limits for existing power plants. Regulation of GHG emissions pursuant to the PSD program could affect efforts to modify SCE's facilities in the future, and could subject new capital projects to additional permitting or emissions control requirements that could delay such projects.
Since 2010, the US EPA's Final Mandatory GHG Reporting Rule has required all sources within specified categories, including electric generation facilities, to monitor emissions, and to submit annual reports to the US EPA by March 31 of each year. SCE's 2014 GHG emissions from utility-owned generation were approximately 2.5 million metric tons.
Regional Initiatives and State Legislation
Regional initiatives and state legislation also require reductions of GHG emissions and it is not yet clear whether or to what extent any federal legislation would preempt them. If state and/or regional initiatives remain in effect after federal legislation is enacted, utilities and generators could be required to satisfy them in addition to the federal standards.
SCE's operations in California are subject to two laws governing GHG emissions. The first law, the California Global Warming Solutions Act of 2006 (also referred to as AB 32), establishes a comprehensive program to reduce GHG emissions. AB 32 required the California Air Resources Board ("CARB") to develop regulations, which became effective in 2012, that would reduce California's GHG emissions to 1990 levels by 2020. In December 2011, the CARB regulation was officially published establishing a California cap-and-trade program. In the California cap-and-trade program, all covered GHG emitters, including SCE, are subject to a "cap" on their emissions designed to encourage entities to reduce emissions from their operations. Covered entities must remit a compliance instrument for each ton of carbon dioxide equivalent gas emitted and can do so buying state-issued emission allowances at auction or purchasing them in the secondary allowance market. GHG emitters can also meet up to 8% of their AB 32 cap-and-trade obligations by participating in verified offset programs, such as reforestation, that have recognized effects on reducing atmospheric GHGs.
CARB regulations implementing a cap-and-trade program and the cap-and-trade program itself, continue to be the subject of litigation. In 2012, environmental groups filed a case against CARB challenging the cap-and-trade program's offset provisions. SCE intervened as part of a broad business coalition to support the provisions on offset programs. The Superior Court upheld the offset provisions but the case is on appeal. The California Chamber of Commerce and a private company filed suits alleging that the auction itself violated AB 32 and the California Constitution. The Superior Court consolidated the two suits and ruled in CARB's favor in November 2013. Plaintiffs filed an appeal in March 2014.
The second law, SB 1368, required the CPUC and the California Energy Commission to adopt GHG emission performance standards that apply to California investor-owned and publicly owned utilities' long-term arrangements for the purchase of electricity. The standards that have been adopted prohibit these entities, including SCE, from entering into long-term financial commitments with generators that emit more than 1,100 pounds of CO
2
per MWh, which is the performance of a combined-cycle gas turbine generator.
In 2011, California enacted a law to require California retail sellers of electricity to procure 33% of their customers' electricity requirements from renewable resources, as defined in the statute. The CPUC set procurement quantity requirements applicable to SCE that incrementally increase to 33% over several periods between January 2011 and December 2020. The requirement remains at 33% of retail sales for each year thereafter. In October 2013, AB 327 was enacted to permit the CPUC to require the procurement of eligible renewable energy resources in excess of 33%; but the CPUC has not yet changed this requirement. SCE's delivery of eligible renewable resources to customers was 22% of its total energy portfolio for 2013 and is estimated to be approximately 23% of its total energy portfolio for 2014.
117
Litigation Developments
Litigation alleging that GHGs have caused damages for which plaintiffs seek recovery may affect SCE, whether or not it is named as a defendant. The legal developments in this area have focused on whether lawsuits seeking recovery for such alleged damages present questions capable of judicial resolution or political questions that should be resolved by the legislative or executive branches.
In 2011, the U.S. Supreme Court dismissed public nuisance claims against five power companies related to GHG emissions. In the dismissal, the Supreme Court ruled that the CAA, and the US EPA actions it authorizes, displace federal common law nuisance claims that might arise from the emission of GHGs. The Supreme Court also affirmed that at least some of the plaintiffs had standing to bring the case, but did not determine whether the CAA also preempts state law claims that might arise from the same circumstances.
Other suits alleging causes of action that include negligence, public and private nuisance, trespass, and violation of the public trust have been dismissed on threshold grounds, including justiciability and standing, by several courts. However, various groups of plaintiffs continue to explore and assert legal theories under which they seek to obtain recovery for past alleged harm, or have courts issue rulings that will control levels of current and future GHG emissions. Thus, the defendants in the dismissed actions, including SCE and other Edison International subsidiaries, together with other industrial companies associated with GHG emissions, may be required to defend such actions in both state and federal courts for the foreseeable future.
UNRESOLVED STAFF COMMENTS
None.
PROPERTIES
As a holding company, Edison International does not directly own any significant properties other than the stock of its subsidiaries. The principal properties of SCE are described above under "Business—Southern California Edison Company—Properties."
LEGAL PROCEEDINGS
Shaver Lake Dam Liner Permit Violation Proceeding
In 2011, SCE installed a PVC plastic geomembrane liner on the Shaver Lake Dam to prevent water seepage. Before starting the project, SCE received the required regulatory permits and approvals. SCE and the California Department of Fish and Wildlife executed a Streambed Alteration Agreement in November 2011 that governed SCE’s activities in Shaver Lake as required by state and federal law. SCE also obtained the required federal Clean Water Act Certification in November 2011 for the project’s completion.
In February 2012, the California Department of Fish and Wildlife and the Central Valley Regional Water Quality control Board issued letters alleging that SCE had violated provisions of the Streambed Alteration Agreement and certain conditions of the federal Clean Water Act Certification, respectively. Both letters alleged that during the draining of Shaver Lake, SCE failed to prevent the discharge of sediment into an adjoining creek, causing the deaths of fish in the lake and creek. In October 2014, SCE received a pre-issuance draft of an Administrative Civil Liability Complaint from the Central Valley Regional Water Quality Control Board alleging violations of certain permit conditions relating to the Shaver Lake Dam Project. The Regional Water Quality Control Board is seeking $25 million in civil penalties for the violations. SCE disputes the allegations.
Dominguez Channel Oil Spill Complaint
SCE has been named as a defendant in a criminal misdemeanor complaint filed by the L.A. City Attorney's office arising from a 2013 oil spill associated with the failure of an underground primary cable and ground rod located in close proximity to a pipeline controlled by a private pipeline management company. The City's complaint alleges that 840 gallons of oil leaked from the pipeline into the City's storm drain which connected to the Dominguez channel. The private pipeline management company is also named as a defendant in the complaint. The City alleges violations of the California Fish and Game code as well as other state statutes and city ordinances.
118
EXECUTIVE OFFICERS OF EDISON INTERNATIONAL
|
Executive Officer
|
Age at
December 31, 2014 |
Company Position
|
||
|
Theodore F. Craver, Jr.
|
63
|
Chairman of the Board, President and Chief Executive Officer
|
||
|
Adam S. Umanoff
|
55
|
Executive Vice President and General Counsel
|
||
|
W. James Scilacci
|
59
|
Executive Vice President and Chief Financial Officer
|
||
|
Janet T. Clayton
|
60
|
Senior Vice President, Corporate Communications
|
||
|
Gaddi H. Vasquez
|
59
|
Senior Vice President, Government Affairs
|
||
|
Pedro J. Pizarro
|
49
|
President, SCE
|
||
|
Ronald L. Litzinger
|
55
|
Executive Vice President
|
||
As set forth in Article IV of Edison International's and the relevant subsidiary's Bylaws, the elected officers of Edison International and its subsidiaries are chosen annually by, and serve at the pleasure of, Edison International and the relevant subsidiary's Board of Directors and hold their respective offices until their resignation, removal, other disqualification from service, or until their respective successors are elected. All of the officers of Edison International and its subsidiaries have been actively engaged in the business of Edison International and its subsidiaries for more than five years, except for Mr. Umanoff and Ms. Clayton, and have served in their present positions for the periods stated below. Additionally, those officers who have had other or additional principal positions in the past five years had the following business experience during that period:
|
Executive Officers
|
Company Position
|
Effective Dates
|
||
|
Theodore F. Craver, Jr.
|
Chairman of the Board, President and Chief
Executive Officer, Edison International
|
August 2008 to present
|
||
|
Adam S. Umanoff
|
Executive Vice President and General Counsel
Edison International
Partner, Akin Gump Strauss Hauer & Feld
1
Partner, Chadbourne & Parke, LLP
2
|
January 2015 to present
May 2011 to December 2014
January 2010 to May 2011
|
||
|
W. James Scilacci
|
Executive Vice President, Chief Financial Officer
Executive Vice President, Chief Financial Officer and
Treasurer, Edison International
|
September 2014 to present
August 2008 to September 2014
|
||
|
Janet T. Clayton
|
Senior Vice President, Corporate Communications,
Edison International
Senior Vice President, Corporate Communications, SCE
President, Think Cure
3
|
April 2011 to present
April 2013 to present
Jan 2008 to April 2011
|
||
|
Gaddi H. Vasquez
|
Senior Vice President, Government Affairs, Edison International and SCE
Senior Vice President, Public Affairs, SCE
|
May 2013 to present
July 2009 to May 2013
|
||
|
Pedro J. Pizarro
|
President, SCE
President, EME
Executive Vice President, Power Operations, SCE
|
October 2014 to present
January 2011 to March 2014
April 2008 to December 2010
|
||
|
Ronald L. Litzinger
|
President, Edison Energy, Inc. and
Executive Vice President, Edison International
President, SCE
Chairman of the Board, President and Chief
Executive Officer, EME
4
|
October 2014 to present
January 2011 to September 2014
April 2008 to December 2010
|
||
|
1
|
Akin Gump Strauss Hauer & Feld is a global law firm and is not a parent, affiliate or subsidiary of Edison International.
|
|
2
|
Chadbourne & Parke, LLP is a global law firm and is not a parent, affiliate or subsidiary of Edison International.
|
|
3
|
Think Cure is a community-based nonprofit organization that raises funds to accelerate collaborative research to cure cancer and is not a parent, affiliate or subsidiary of Edison International.
|
|
4
|
EMG is the holding company for EME, a wholly-owned subsidiary of Edison International and an affiliate of SCE. EME filed for bankruptcy on December 17, 2012.
|
119
EXECUTIVE OFFICERS OF SOUTHERN CALIFORNIA EDISON COMPANY
|
Executive Officer
|
Age at
December 31, 2014
|
Company Position
|
||
|
Pedro J. Pizarro
|
49
|
President
|
||
|
Peter T. Dietrich
|
50
|
Senior Vice President, Transmission and Distribution
|
||
|
Stuart R. Hemphill
|
51
|
Senior Vice President, Power Supply and Operational Services
|
||
|
Kevin M. Payne
|
54
|
Senior Vice President, Customer Service
|
||
|
Maria Rigatti
|
51
|
Senior Vice President and Chief Financial Officer
|
||
|
Russell C. Swartz
|
63
|
Senior Vice President and General Counsel
|
||
As set forth in Article IV of SCE's Bylaws, the elected officers of SCE are chosen annually by, and serve at the pleasure of, SCE's Board of Directors and hold their respective offices until their resignation, removal, other disqualification from service, or until their respective successors are elected. All of the above officers have been actively engaged in the business of SCE, its parent company Edison International, and/or one of SCE's subsidiaries or other affiliates for more than five years, except for Mr. Dietrich, and have served in their present positions for the periods stated below. Additionally, those officers who have had other or additional principal positions in the past five years had the following business experience during that period:
|
Executive Officer
|
Company Position
|
Effective Dates
|
||
|
Pedro Pizarro
|
President, SCE
President, EME
Executive Vice President, Power Operations, SCE
|
October 2014 to present
January 2011 to March 2014
April 2008 to December 2010
|
||
|
Peter T. Dietrich
|
Senior Vice President, Transmission & Distribution, SCE
Chief Nuclear Officer, SCE
Site Vice President, Entergy Nuclear Operations, Inc.,
James A. Fitzpatrick Nuclear Plant 1 |
November 2010 to present
December 2010 to December 2013
April 2006 to November 2010
|
||
|
Stuart R. Hemphill
|
Senior Vice President, Power Supply & Operational Services, SCE
Senior Vice President, Power Supply, SCE
Senior Vice President, Power Procurement, SCE
Vice President, Renewable and Alternative Power, SCE
|
July 2014 to present
January 2011 to July 2014
July 2009 to December 2010
March 2008 to June 2009
|
||
|
Kevin M. Payne
|
Senior Vice President, Customer Service, SCE
Vice President, Engineering & Technical Services, SCE
Vice President, Client Service Planning and Controls, SCE
|
March 2014 to present
September 2011 to March 2014
October 2010 to August 2011
|
||
|
Maria Rigatti
|
Senior Vice President and Chief Financial Officer, SCE
President, Edison Mission Reorganization Trust (EME Reorg Trust)
Senior Vice President, Chief Financial Officer, EME
Vice President, Chief Financial Officer and Treasurer, EME
Vice President and Treasurer, EME
|
July 2014 to present
April 2014 to June 2014
March 2011 to March 2014
December 2010 to February 2011
September 2008 to December 2010
|
||
|
Russell C. Swartz
|
Senior Vice President and General Counsel, SCE
Vice President and Associate General Counsel, SCE
Associate General Counsel, SCE
|
February 2011 to present
February 2010 to February 2011
March 2007 to February 2010
|
||
|
1
|
Entergy Nuclear Operations, Inc. is a subsidiary of Entergy Corporation, an integrated energy company and is not a parent, affiliate or subsidiary of SCE.
|
DIRECTORS, EXECUTIVE OFFICERS AND CORPORATE GOVERNANCE
Information concerning executive officers of Edison International is set forth above under "Executive Officers of Edison International." Other information responding to this section will appear in Edison International's and SCE's definitive Proxy Statement (the "Joint Proxy Statement") to be filed with the SEC in connection with Edison International's and SCE's Annual Shareholders' Meeting to be held on April 23, 2015, under the headings "Item 1: Election of Directors," and "Board Committees" and is incorporated herein by this reference.
The Edison International Employee Ethics and Compliance Code is applicable to all officers and employees of Edison International and its subsidiaries. The Code is available on Edison International's Internet website at www.edisoninvestor.com at "Corporate Governance." Any amendments or waivers of Code provisions for the Company's principal executive officer, principal financial officer, principal accounting officer or controller, or persons performing similar functions, will be posted on Edison International's Internet website at www.edisoninvestor.com.
120
EXECUTIVE COMPENSATION
Information responding to this section will appear in the Joint Proxy Statement under the headings "Compensation Discussion and Analysis," "Compensation Committee Interlocks and Insider Participation," "Executive Compensation" and "Director Compensation" and is incorporated herein by this reference, and under the heading "Compensation Committee Report," which is incorporated by reference
SECURITY OWNERSHIP OF CERTAIN BENEFICIAL OWNERS AND MANAGEMENT AND RELATED STOCKHOLDER MATTERS
Information responding to this section will appear in the Joint Proxy Statement under the heading "Information About Our Stock Ownership," and is incorporated herein by this reference.
Equity Compensation Plans
The following Table sets forth, for each of Edison International's Equity compensation plans, the number of shares of Edison International Common Stock subject to outstanding options, warrant and rights to acquire such stock, the weighted-average exercise price of those outstanding options, warrants and rights, and the number of shares remaining available for future award grants as of December 31, 2014.
|
Plan Category
|
Number of securities to be issued upon exercise of outstanding options, warrants and rights
(a)
|
Weighted-average exercise price of outstanding options, warrants and rights
(b)
|
Number of securities remaining for future issuance under equity compensation plans (excluding securities reflected in column (a)(c)
|
||||
|
Equity compensation plans approved by security holders
|
14,539,339
|
|
1
|
$42.84
|
20,474,563
|
|
2
|
|
Equity compensation plans not approved by security holders
3
|
4,462
|
|
$40.75
|
—
|
|
||
|
Total
|
14,543,801
|
|
$42.84
|
20,474,563
|
|
||
|
1
|
This amount includes 13,614,273 shares covered by outstanding stock options, 256,275 shares that could be delivered for outstanding performance share awards, 433,319 shares covered by outstanding restricted stock unit awards, and 235,472 shares covered by outstanding deferred stock unit awards. The weighted-average exercise price of awards outstanding under equity compensation plan approved by security holders reflected in column (b) above is calculated based on the outstanding stock options under these plans as the other forms of wards outstanding have no exercise price.
|
|
2
|
This amount is the aggregate number of shares available for new awards under the Edison International 2007 Performance Incentive Plan as of December 31, 2014, and includes shares that have become available from the Edison International Equity Compensation Plan and the Edison International 2000 Equity Plan (together, the "Prior Plans"). However, no additional awards have been granted under the Prior Plans since April 26, 2007, and all awards granted since that date have been made under the Edison International 2007 Performance Incentive Plan. The maximum number of shares or Edison International Common Stock that may be issued or transferred pursuant to awards under the Edison International 2007 Performance Incentive Plan is 49,500,000 shares, plus the number of any shares subject to awards issued under the Prior Plans and outstanding as of April 26, 2007 that expire, cancel or terminate without being exercised or shares being issued. Shares available under the Edison International 2007 Performance Incentive Plan may generally, subject to certain limits set forth in the plan, be used for any type of award authorized under that plan, including stock options, restricted stock, performance shares, restricted or deferred units, and stock bonuses.
|
|
3
|
The Edison International 2000 Equity Plan is a broad-based stock option plan that did not require shareholder approval. It was adopted in May 2000 by Edison International with an original authorization of 10,000,000 shares. The Edison International Compensation and Executive Personnel Committee is the plan administrator. Edison International nonqualified stock options were granted to employees of the Edison International companies under this plan, but the granting authority expired on April 26, 2007. Any outstanding shares as of that date that expire, cancel or terminate without being exercised or shares being issued increase the maximum shares that may be delivered under the Edison International 2007 Performance Incentive Plan as described in footnote (2) above. The exercise price was not less than the fair market value of a share of Edison International Common Stock on the date of grant and the stock options cannot be exercised more than 10 years after the date of grant.
|
CERTAIN RELATIONSHIPS AND RELATED TRANSACTIONS, AND DIRECTOR INDEPENDENCE
Information responding to this section will appear in the Joint Proxy Statement under the headings "Certain Relationships and Related Transactions," and "Information About Our Corporate Governance—Q: Is SCE subject to the same corporate governance stock exchange rules as EIX?", "—Q: How does the Board determine which directors are considered independent?", "—Q: Which directors has the Board determined are independent to serve on the Board?" and "Where can I find the Company's corporate governance documents?" and is incorporated herein by this reference.
121
PRINCIPAL ACCOUNTANT FEES AND SERVICES
Information responding to this section will appear in the Joint Proxy Statement under the heading "Independent Registered Public Accounting Firm Fees," and is incorporated herein by this reference.
MARKET FOR REGISTRANT'S COMMON EQUITY, RELATED STOCKHOLDER MATTERS AND ISSUER PURCHASES OF EQUITY SECURITIES.
Edison International Common Stock is traded on the New York Stock Exchange under the symbol "EIX."
Market information responding to this section is included in "Notes to Consolidated Financial Statements—Note 18. Quarterly Financial Data (Unaudited)." There are restrictions on the ability of Edison International's subsidiaries to transfer funds to Edison International that materially limit the ability of Edison International to pay cash dividends. Such restrictions are discussed in the MD&A under the heading "Liquidity and Capital Resources—Edison International Parent and Other," and in "Notes to Consolidated Financial Statements—Note 1. Summary of Significant Accounting Policies—SCE Dividend Restrictions" and "—Note 5. Debt and Credit Agreements." The number of common stockholders of record of Edison International was 41,000 on February 21, 2014. Additional information concerning the market for Edison International's Common Stock is set forth on the cover page of this report. Required information about Edison International's equity compensation plans is incorporated by reference to "Security Ownership of Certain Beneficial Owners and Management and Related Stockholder Matters" of this report.
Purchases of Equity Securities by Edison International and Affiliated Purchasers
The following table contains information about all purchases of Edison International Common Stock made by or on behalf of Edison International in the fourth quarter of 2014.
|
Period
|
(a) Total
Number of Shares
(or Units)
Purchased
1
|
(b) Average
Price Paid per Share (or Unit)
1
|
(c) Total
Number of Shares
(or Units)
Purchased
as Part of
Publicly
Announced
Plans or
Programs
|
(d) Maximum
Number (or
Approximate
Dollar Value)
of Shares
(or Units) that May
Yet Be Purchased
Under the Plans or
Programs
|
||||||||
|
October 1, 2014 to October 31, 2014
|
430,555
|
|
$
|
60.17
|
|
—
|
—
|
|||||
|
November 1, 2014 to November 30, 2014
|
305,807
|
|
62.70
|
|
—
|
—
|
||||||
|
December 1, 2014 to December 31, 2014
|
621,358
|
|
65.35
|
|
—
|
—
|
||||||
|
Total
|
1,357,720
|
|
63.11
|
|
—
|
—
|
||||||
|
1
|
The shares were purchased by agents acting on Edison International's behalf for delivery to plan participants to fulfill requirements in connection with Edison International's: (i) 401(k) Savings Plan; (ii) Dividend Reinvestment and Direct Stock Purchase Plan; and (iii) long-term incentive compensation plans. The shares were purchased in open-market transactions pursuant to plan terms or participant elections. The shares were never registered in Edison International's name and none of the shares purchased were retired as a result of the transactions.
|
Purchases of Equity Securities by Southern California Edison and Affiliated Purchasers
Information with respect to frequency and amount of cash dividends is included in "Notes to the Consolidated Financial Statements—Note 18. Quarterly Financial Data (Unaudited)." As a result of the formation of a holding company described under the heading "Business" above, all of the issued and outstanding common stock of SCE is owned by Edison International and there is no market for such stock.
Information on securities authorized for issuance under equity compensation plans, is not applicable because SCE has no compensation plans under which equity securities of SCE are authorized for issuance.
122
Comparison of Five-Year Cumulative Total Return
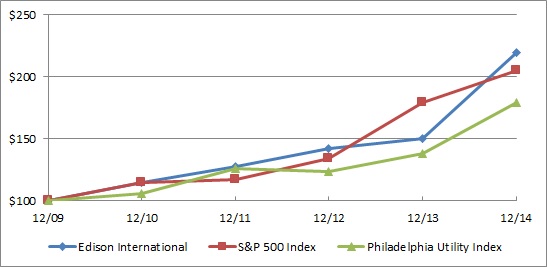
|
At December 31,
|
|||||||||||||||||||||||
|
2009
|
|
2010
|
|
2011
|
|
2012
|
|
2013
|
|
2014
|
|
||||||||||||
|
Edison International
|
$
|
100
|
|
$
|
115
|
|
$
|
128
|
|
$
|
142
|
|
$
|
150
|
|
$
|
219
|
|
|||||
|
S & P 500 Index
|
100
|
|
115
|
|
117
|
|
134
|
|
180
|
|
205
|
|
|||||||||||
|
Philadelphia Utility Index
|
100
|
|
106
|
|
126
|
|
124
|
|
138
|
|
179
|
|
|||||||||||
Note: Assumes $100 invested on December 31, 2009 in stock or index including reinvestment of dividends. Performance of the Philadelphia Utility Index is regularly reviewed by management and the Board of Directors in understanding Edison International's relative performance and is used in conjunction with elements of Edison International's compensation program.
EXHIBITS AND FINANCIAL STATEMENT SCHEDULES
(a)(1) Financial Statements
See Consolidated Financial Statements listed in the Table of Contents of this report.
(a)(2) Report of Independent Registered Public Accounting Firm and Schedules Supplementing Financial Statements
The following documents may be found in this report at the indicated page numbers under the heading "Exhibits and Financial Statement Schedules" in the Table of Contents of this report.
|
Reports of Independent Registered Public Accounting Firm
|
|
Schedule I – Condensed Financial Information of
Edison International Parent
|
|
Schedule II – Valuation and Qualifying Accounts
of Edison International and SCE
|
Schedules I for SCE and Schedules III through V, inclusive, for both Edison International and SCE are omitted as not required or not applicable.
(a)(3) Exhibits
See "Exhibit Index" in this report.
Edison International and SCE will furnish a copy of any exhibit listed in the accompanying Exhibit Index upon written request and upon payment to Edison International or SCE of their reasonable expenses of furnishing such exhibit, which shall be limited to photocopying charges and, if mailed to the requesting party, the cost of first-class postage.
123
EDISON INTERNATIONAL
SCHEDULE I – CONDENSED FINANCIAL INFORMATION OF PARENT
CONDENSED BALANCE SHEETS
|
December 31,
|
|||||||
|
(in millions)
|
2014
|
2013
|
|||||
|
Assets:
|
|
|
|||||
|
Cash and cash equivalents
|
$
|
8
|
|
$
|
13
|
|
|
|
Other current assets
|
531
|
|
166
|
|
|||
|
Total current assets
|
539
|
|
179
|
|
|||
|
Investments in subsidiaries
|
12,416
|
|
10,328
|
|
|||
|
Deferred income taxes
|
547
|
|
559
|
|
|||
|
Other long-term assets
|
172
|
|
615
|
|
|||
|
Total assets
|
$
|
13,674
|
|
$
|
11,681
|
|
|
|
Liabilities and equity:
|
|
|
|||||
|
Short-term debt
|
$
|
619
|
|
$
|
34
|
|
|
|
Current portion of long-term debt
|
204
|
|
—
|
|
|||
|
Other current liabilities
|
377
|
|
598
|
|
|||
|
Total current liabilities
|
1,200
|
|
632
|
|
|||
|
Long-term debt
|
610
|
|
400
|
|
|||
|
Other long-term liabilities
|
904
|
|
721
|
|
|||
|
Total equity
|
10,960
|
|
9,928
|
|
|||
|
Total liabilities and equity
|
$
|
13,674
|
|
$
|
11,681
|
|
|
124
EDISON INTERNATIONAL
SCHEDULE I – CONDENSED FINANCIAL INFORMATION OF PARENT
CONDENSED STATEMENTS OF INCOME
For the Years Ended December 31,
2014
,
2013
and
2012
|
(in millions)
|
2014
|
2013
|
2012
|
||||||||
|
Operating revenue and other income
|
$
|
3
|
|
$
|
—
|
|
$
|
—
|
|
||
|
Operating expenses and interest expense
|
94
|
|
72
|
|
80
|
|
|||||
|
Loss before equity in earnings of subsidiaries
|
(91
|
)
|
(72
|
)
|
(80
|
)
|
|||||
|
Equity in earnings of subsidiaries
|
1,482
|
|
922
|
|
1,590
|
|
|||||
|
Income before income taxes
|
1,391
|
|
850
|
|
1,510
|
|
|||||
|
Income tax expense (benefit)
|
(36
|
)
|
(29
|
)
|
7
|
|
|||||
|
Income from continuing operations
|
1,427
|
|
879
|
|
1,503
|
|
|||||
|
Income (loss) from discontinued operations, net of tax
|
185
|
|
36
|
|
(1,686
|
)
|
|||||
|
Net income (loss)
|
$
|
1,612
|
|
$
|
915
|
|
$
|
(183
|
)
|
||
CONDENSED STATEMENTS OF COMPREHENSIVE INCOME
For the Years Ended December 31,
2014
,
2013
and
2012
|
(in millions)
|
2014
|
2013
|
2012
|
||||||||
|
Net income (loss)
|
$
|
1,612
|
|
$
|
915
|
|
$
|
(183
|
)
|
||
|
Other comprehensive income (loss), net of tax
|
(45
|
)
|
74
|
|
52
|
|
|||||
|
Comprehensive income (loss)
|
$
|
1,567
|
|
$
|
989
|
|
$
|
(131
|
)
|
||
125
EDISON INTERNATIONAL
SCHEDULE I – CONDENSED FINANCIAL INFORMATION OF PARENT
CONDENSED STATEMENTS OF CASH FLOWS
For the Years Ended December 31,
2014
,
2013
and
2012
|
(in millions)
|
2014
|
2013
|
2012
|
||||||||
|
Net cash provided (used) by operating activities
|
$
|
(73
|
)
|
$
|
387
|
|
$
|
355
|
|
||
|
Cash flows from financing activities:
|
|
|
|
||||||||
|
Payable due to affiliate
|
66
|
|
10
|
|
130
|
|
|||||
|
Short-term debt financing, net
|
584
|
|
33
|
|
(15
|
)
|
|||||
|
Settlements of stock-based compensation, net
|
(24
|
)
|
(6
|
)
|
(10
|
)
|
|||||
|
Dividends paid
|
(463
|
)
|
(440
|
)
|
(424
|
)
|
|||||
|
Net cash provided (used) by financing activities
|
163
|
|
(403
|
)
|
(319
|
)
|
|||||
|
Net cash used by investing activities
|
(95
|
)
|
(35
|
)
|
—
|
|
|||||
|
Net increase (decrease) in cash and cash equivalents
|
(5
|
)
|
(51
|
)
|
36
|
|
|||||
|
Cash and cash equivalents, beginning of year
|
13
|
|
64
|
|
28
|
|
|||||
|
Cash and cash equivalents, end of year
|
$
|
8
|
|
$
|
13
|
|
$
|
64
|
|
||
The accompanying condensed financial statements of Edison International Parent should be read in conjunction with the consolidated financial statements and notes thereto of Edison International and subsidiaries ("Registrant") included in this Form 10-K. Edison International's Parent significant accounting policies are consistent with those of the Registrant, SCE and other wholly owned and controlled subsidiaries.
Dividends Received
Edison International Parent received cash dividends from SCE of
$378 million
,
$486 million
and
$469 million
in
2014
,
2013
and
2012
, respectively.
Dividend Restrictions
The CPUC regulates SCE's capital structure which limits the dividends it may pay Edison International. SCE may make distributions to Edison International as long as the common equity component of SCE's capital structure remains at or above the
48%
on a
13
-month weighted average basis. At
December 31, 2014
, SCE's
13
-month weighted-average common equity component of total capitalization was
48.4%
and the maximum additional dividend that SCE could pay to Edison International under this limitation was approximately
$87 million
, resulting in a restriction on SCE's net assets of
$13.2 billion
.
Long-Term Debt
At
December 31, 2014
and
2013
, Edison International Parent had
3.75%
senior notes outstanding of $
400 million
, which matures in
2017
. In connection with a settlement agreement between Edison International, EME and the Consenting Noteholders, in September 2014, Edison International Parent issued non-interest bearing promissory notes of
$204 million
due in September
2015
and
$214 million
due in September
2016
.
Credit Agreements and Short-Term Debt
In 2014, Edison International Parent amended its
$1.25 billion
credit facility to extend the maturity date to July 2019. At
December 31, 2014
, the outstanding commercial paper was
$619 million
at a weighted-average interest rate of
0.45%
. This short-term debt was supported by the
$1.25 billion
multi-year revolving credit facility. At
December 31, 2013
, the outstanding commercial paper was
$34 million
at a weighted-average interest rate of
0.55%
.
126
The following table summarizes the status of the credit facility at
December 31, 2014
:
|
(in millions)
|
|||
|
Commitment
|
$
|
1,250
|
|
|
Outstanding borrowings
|
(619
|
)
|
|
|
Amount available
|
$
|
631
|
|
The debt covenant in Edison International's credit facility requires a consolidated debt to total capitalization ratio of less than or equal to
0.65
to
1
. The ratio is defined in the credit agreement and generally excluded the consolidated debt and total capital of EME during the periods it was consolidated for financial reporting purposes. At
December 31, 2014
, Edison International's consolidated debt to total capitalization ratio was
0.48
to
1
.
Edison International's Parent expenses from services provided by SCE were
$3 million
,
$3 million
and
$4 million
for the years ended
December 31, 2014
,
2013
and
2012
, respectively. Edison International Parent had current related-party receivables of
$267 million
and
$34 million
and current related-party payables of
$213 million
and
$69 million
at
December 31, 2014
and
2013
, respectively. Edison International Parent had long-term related-party receivables of
$125 million
and
$486 million
at
December 31, 2014
and
2013
, respectively, and long-term related-party payables of
$179 million
and
$135 million
at
December 31, 2014
and
2013
, respectively.
In December 2012, EME and certain of its wholly-owned subsidiaries filed voluntary petitions for relief under Chapter 11 of the Bankruptcy Code in the Bankruptcy Court. See "Notes to Consolidated Financial Statements—Note 15. Discontinued Operations" for further information.
For a discussion of material contingencies see "Notes to Consolidated Financial Statements—Note 7. Income Taxes," "—Note 11. Commitments and Contingencies" and "—Note 15. Discontinued Operations."
127
EDISON INTERNATIONAL
SCHEDULE II – VALUATION AND QUALIFYING ACCOUNTS
|
|
|
Additions
|
|
|
|
|
|||||||||||||
|
(in millions)
|
Balance at
Beginning of
Period
|
Charged to
Costs and
Expenses
|
Charged to
Other
Accounts
|
|
Deductions
|
|
Balance at
End of
Period
|
||||||||||||
|
For the Year ended December 31, 2014
|
|||||||||||||||||||
|
Allowance for uncollectible accounts
|
|||||||||||||||||||
|
Customers
|
$
|
52.2
|
|
$
|
24.1
|
|
$
|
—
|
|
$
|
27.4
|
|
$
|
48.9
|
|
||||
|
All others
|
17.8
|
|
19.7
|
|
—
|
|
14.2
|
|
23.3
|
|
|||||||||
|
Total allowance for uncollectible amounts
|
$
|
70.0
|
|
$
|
43.8
|
|
$
|
—
|
|
$
|
41.6
|
|
a
|
$
|
72.2
|
|
|||
|
Tax valuation allowance
|
$
|
1,380.0
|
|
b
|
$
|
—
|
|
$
|
—
|
|
$
|
1,351.0
|
|
c
|
$
|
29.0
|
|
||
|
|
|||||||||||||||||||
|
For the Year ended December 31, 2013
|
|
|
|
|
|
||||||||||||||
|
Allowance for uncollectible accounts
|
|
|
|
|
|
||||||||||||||
|
Customers
|
$
|
46.6
|
|
$
|
36.0
|
|
$
|
—
|
|
$
|
30.4
|
|
$
|
52.2
|
|
||||
|
All others
|
79.5
|
|
19.3
|
|
—
|
|
81.0
|
|
17.8
|
|
|||||||||
|
Total allowance for uncollectible amounts
|
$
|
126.1
|
|
$
|
55.3
|
|
$
|
—
|
|
$
|
111.4
|
|
a
|
$
|
70.0
|
|
|||
|
Tax valuation allowance
|
$
|
1,016.5
|
|
b
|
$
|
363.5
|
|
b
|
$
|
—
|
|
$
|
—
|
|
$
|
1,380.0
|
|
||
|
|
|||||||||||||||||||
|
For the Year ended December 31, 2012
|
|
|
|
|
|
||||||||||||||
|
Allowance for uncollectible accounts
|
|
|
|
|
|
||||||||||||||
|
Customers
|
$
|
42.0
|
|
$
|
34.6
|
|
$
|
—
|
|
$
|
30.0
|
|
$
|
46.6
|
|
||||
|
All others
|
37.6
|
|
58.6
|
|
—
|
|
16.7
|
|
79.5
|
|
|||||||||
|
Total allowance for uncollectible amounts
|
$
|
79.6
|
|
$
|
93.2
|
|
$
|
—
|
|
$
|
46.7
|
|
a
|
$
|
126.1
|
|
|||
|
Tax valuation allowance
|
$
|
—
|
|
$
|
1,016.5
|
|
b
|
$
|
—
|
|
$
|
—
|
|
$
|
1,016.5
|
|
|||
|
a
|
Accounts written off, net.
|
|
b
|
Edison International recorded deferred tax assets of
$2.2 billion
related to net operating losses and tax carryforwards that pertain to Edison International's consolidated or combined federal and state tax returns, including approximately
$1.6 billion
related to EME. Edison International continues to consolidate EME for federal and certain combined state tax returns. EME's Plan of Reorganization, filed in December 2013 ("December Plan of Reorganization"), provides for the transfer of EIX's ownership interest to the creditors, which would result in a tax deconsolidation of EME. Under federal and state tax regulations, the tax deconsolidation of EME would reduce the amounts of net operating loss and tax credits carryforwards that Edison International would be eligible to use in future periods. As a result of the EME's December Plan of Reorganization, which would result in a tax deconsolidation of EME, Edison International has recorded a
$1.380 billion
valuation allowance based on the estimated amount of such benefits as calculated under the applicable federal and state tax regulations as of December 31, 2013. The deferred income tax benefits recognized by Edison International less the valuation allowance for amounts that would no longer be available upon tax deconsolidation of EME was approximately
$220 million
.
|
|
c
|
On April 1, 2014, under the Amended Plan of Reorganization, EME emerged from bankruptcy free of liabilities but remained an indirect wholly-owned subsidiary of Edison International, which will continue to be consolidated with Edison International for income tax purposes. Edison International anticipates realization of the federal and California tax benefits before they expire. Therefore, the valuation allowance on federal and California tax benefits that Edison International recorded in 2013 was released in 2014. The remaining valuation allowance is related to non California state tax benefits.
|
128
SOUTHERN CALIFORNIA EDISON COMPANY
SCHEDULE II – VALUATION AND QUALIFYING ACCOUNTS
|
|
|
Additions
|
|
|
|
|
|||||||||||||
|
(in millions)
|
Balance at
Beginning of
Period
|
Charged to
Costs and
Expenses
|
Charged to
Other
Accounts
|
|
Deductions
|
|
Balance at
End of
Period
|
||||||||||||
|
For the Year ended December 31, 2014
|
|||||||||||||||||||
|
Allowance for uncollectible accounts
|
|||||||||||||||||||
|
Customers
|
$
|
52.2
|
|
$
|
24.1
|
|
$
|
—
|
|
$
|
27.4
|
|
$
|
48.9
|
|
||||
|
All others
|
13.3
|
|
19.6
|
|
—
|
|
14.2
|
|
18.7
|
|
|||||||||
|
Total allowance for uncollectible accounts
|
$
|
65.5
|
|
$
|
43.7
|
|
$
|
—
|
|
$
|
41.6
|
|
a
|
$
|
67.6
|
|
|||
|
For the Year ended December 31, 2013
|
|
|
|
|
|
||||||||||||||
|
Allowance for uncollectible accounts
|
|
|
|
|
|
||||||||||||||
|
Customers
|
$
|
46.6
|
|
$
|
36.0
|
|
$
|
—
|
|
$
|
30.4
|
|
$
|
52.2
|
|
||||
|
All others
|
28.3
|
|
19.3
|
|
—
|
|
34.3
|
|
13.3
|
|
|||||||||
|
Total allowance for uncollectible accounts
|
$
|
74.9
|
|
$
|
55.3
|
|
$
|
—
|
|
$
|
64.7
|
|
a
|
$
|
65.5
|
|
|||
|
For the Year ended December 31, 2012
|
|
|
|
|
|
||||||||||||||
|
Allowance for uncollectible accounts
|
|
|
|
|
|
||||||||||||||
|
Customers
|
$
|
42.0
|
|
$
|
34.6
|
|
$
|
—
|
|
$
|
30.0
|
|
$
|
46.6
|
|
||||
|
All others
|
33.0
|
|
12.0
|
|
—
|
|
16.7
|
|
28.3
|
|
|||||||||
|
Total allowance for uncollectible accounts
|
$
|
75.0
|
|
$
|
46.6
|
|
$
|
—
|
|
$
|
46.7
|
|
a
|
$
|
74.9
|
|
|||
|
a
|
Accounts written off, net.
|
129
SIGNATURES
Pursuant to the requirements of Section 13 or 15(d) of the Securities Exchange Act of 1934, the registrants have duly caused this report to be signed on their behalf by the undersigned, thereunto duly authorized.
|
EDISON INTERNATIONAL
|
SOUTHERN CALIFORNIA EDISON COMPANY
|
|||
|
By:
|
/s/ Mark C. Clarke
|
By:
|
/s/ Connie J. Erickson
|
|
|
Mark C. Clarke
Vice President and Controller
(Duly Authorized Officer and
Principal Accounting Officer)
|
Connie J. Erickson
Vice President and Controller
(Duly Authorized Officer and
Principal Accounting Officer)
|
|||
|
Date:
|
February 24, 2015
|
Date:
|
February 24, 2015
|
|
130
Pursuant to the requirements of the Securities Exchange Act of 1934, this report has been signed below by the following persons on behalf of the registrants and in the capacities and on the date indicated.
|
Signature
|
Title
|
|
|
A. Principal Executive Officers
|
||
|
Theodore F. Craver, Jr.*
|
Chairman of the Board, President,
Chief Executive Officer and Director
(Edison International)
|
|
|
Pedro J. Pizarro*
|
President and Director
(Southern California Edison Company)
|
|
|
B. Principal Financial Officers
|
||
|
W. James Scilacci*
|
Executive Vice President and Chief Financial Officer
(Edison International)
|
|
|
Maria Rigatti*
|
Senior Vice President and Chief Financial Officer
(Southern California Edison Company)
|
|
|
C. Principal Accounting Officers
|
||
|
Mark C. Clarke
|
Vice President and Controller
(Edison International)
|
|
|
Connie J. Erickson
|
Vice President and Controller
(Southern California Edison Company)
|
|
|
D. Directors (Edison International and Southern California Edison Company, unless otherwise noted)
|
||
|
Jagjeet S. Bindra*
|
Director
|
|
|
Vanessa C.L. Chang*
|
Director
|
|
|
Theodore F. Craver, Jr.*
|
Director
|
|
|
Bradford M. Freeman*
|
Director
|
|
|
Pedro J. Pizarro (SCE only)*
|
Director
|
|
|
Richard T. Schlosberg, III*
|
Director
|
|
|
Linda G. Stuntz*
|
Director
|
|
|
Thomas C. Sutton*
|
Director
|
|
|
Ellen O. Tauscher*
|
Director
|
|
|
Peter J. Taylor*
|
Director
|
|
|
Brett White*
|
Director
|
|
|
*By:
|
/s/ Mark C. Clarke
|
*By:
|
/s/ Connie J. Erickson
|
|
Mark C. Clarke
Vice President and Controller
(Attorney-in-fact for EIX Directors and Officers)
|
Connie J. Erickson
Vice President and Controller
(Attorney-in-fact for SCE Directors and Officers)
|
||
|
Date:
|
February 24, 2015
|
Date:
|
February 24, 2015
|
131
EXHIBIT INDEX
|
Exhibit
Number
|
|
Description
|
|
Edison International
|
||
|
3.1
|
Certificate of Restated Articles of Incorporation of Edison International, effective December 19, 2006 (File No. 1-9936, filed as Exhibit 3.1 to Edison International's Form 10-K for the year ended December 31, 2006)*
|
|
|
3.2
|
Bylaws of Edison International, as amended June 21, 2012 (File No. 1-9936, filed as Exhibit 3.1 to Edison International's Form 8-K dated June 21, 2012 and filed June 22, 2012)*
|
|
|
Southern California Edison Company
|
||
|
3.3
|
Restated Articles of Incorporation of Southern California Edison Company, effective March 2, 2006, together with all Certificates of Determination of Preference Stock issued since March 2, 2006 (File No. 1-2313 filed as Exhibit 3.1 to Southern California Edison Company's Form 10-Q for the quarter ended June 30, 2014)*
|
|
|
3.4
|
Bylaws of Southern California Edison Company, as amended June 21, 2012 (File No. 1-2313, filed as Exhibit 3.1 to Southern California Edison Company's Form 8-K dated June 21, 2012 and filed June 22, 2012)*
|
|
|
Edison International
|
||
|
4.1
|
Senior Indenture, dated September 10, 2010 (File No. 1-9936, filed as Exhibit 4.1 to Edison International's Form 10-Q for the quarter ended September 30, 2010)*
|
|
|
Southern California Edison Company
|
||
|
4.2
|
Southern California Edison Company First Mortgage Bond Trust Indenture, dated as of October 1, 1923 (File No. 1-2313, filed as Exhibit 4.2 to Southern California Edison Company's Form 10-K for the year ended December 31, 2010)*
|
|
|
4.3
|
Southern California Edison Company Indenture, dated as of January 15, 1993 (File No. 1-2313, Form 8-K dated January 28, 1993)*
|
|
|
Edison International
|
||
|
10.1**
|
Edison International Director Deferred Compensation Plan as amended effective June 19, 2014 (File No. 1-9936, filed as Exhibit 10.3 for the quarter ended June 30, 2014)*
|
|
|
10.2**
|
Edison International 2008 Director Deferred Compensation Plan, as amended and restated effective June 19, 2014 (File No. 1-9936, filed as Exhibit No. 10.2 for the quarter ended June 30, 2014)*
|
|
|
10.3**
|
Director Grantor Trust Agreement, dated August 1995 (File No. 1-9936, filed as Exhibit 10.10 to Edison International's Form 10-K for the year ended December 31, 1995)*
|
|
|
10.3.1**
|
Director Grantor Trust Agreement Amendment 2002-1, effective May 14, 2002 (File No. 1-9936, filed as Exhibit 10.4 to Edison International's Form 10-Q for the quarter ended June 30, 2002)*
|
|
|
10.3.2**
|
Executive and Director Grantor Trust Agreements Amendment 2008-1 (File No. 1-9936, filed as Exhibit No. 10.6.2 to Edison International's Form 10-K for the year ended December 31, 2008)*
|
|
|
10.4**
|
Edison International Executive Deferred Compensation Plan, as amended and restated effective June 19, 2014 (File No. 1-9936, filed as Exhibit 10.4 for the quarter ended June 30, 2014)*
|
|
|
10.5**
|
Edison International 2008 Executive Deferred Compensation Plan, as amended and restated effective June 19, 2014 (File No. 1-9936, filed as Exhibit No. 10.5 for the quarter ended June 30, 2014)*
|
|
|
10.6**
|
Executive Grantor Trust Agreement, dated August 1995 (File No. 1-9936, filed as Exhibit 10.12 to Edison International's Form 10-K for the year ended December 31, 1995)*
|
|
|
10.6.1**
|
Executive Grantor Trust Agreement Amendment 2002-1, effective May 14, 2002 (File No. 1-9936, filed as Exhibit 10.3 to Edison International's Form 10-Q for the quarter ended June 30, 2002)*
|
|
|
10.7**
|
Southern California Edison Company Executive Supplemental Benefit Program, as amended effective June 19, 2014 (File No. 1-9936, filed as Exhibit No. 10.8 for the quarter ended June 30, 2014)*
|
|
|
10.8**
|
Southern California Edison Company Executive Retirement Plan, as amended effective June 19, 2014 (File No. 1-9936, filed as Exhibit 10.7 for the quarter ended June 30, 2014)*
|
|
|
10.8.1**
|
Edison International 2008 Executive Retirement Plan, as amended and restated effective June 19, 2014 (File No. 1-9936, filed as Exhibit No. 10.6 to Edison International's Form 10-Q for the quarter ended June 30, 2014)*
|
|
132
|
Exhibit
Number
|
|
Description
|
|
10.9**
|
Edison International Executive Incentive Compensation Plan, as amended and restated effective February 26, 2014 (File No. 1-9936, filed as Exhibit No. 10.4 to Edison International's Form 10-Q for the quarter ended March 31, 2014)*
|
|
|
10.10**
|
Edison International 2008 Executive Disability Plan, as amended and restated effective June 19, 2014 (File No. 1-9936, filed as Exhibit No. 10.9 to Edison International's Form 10-Q for the quarter ended June 30, 2014)*
|
|
|
10.11**
|
Edison International 2008 Executive Survivor Benefit Plan, as amended and restated effective June 19, 2014 (File No. 1-9936, filed as Exhibit No. 10.10 to Edison International's Form 10-Q for the quarter ended June 30, 2014)*
|
|
|
10.12**
|
Retirement Plan for Directors, as amended and restated effective December 31, 2008 (File No. 1-9936 filed as Exhibit No. 10.17 to Edison International's Form 10-K for the year ended December 31, 2008)*
|
|
|
10.13**
|
Equity Compensation Plan as restated effective January 1, 1998 (File No. 1-9936, filed as Exhibit 10.1 to Edison International's Form 10-Q for the quarter ended June 30, 1998)*
|
|
|
10.13.1**
|
Equity Compensation Plan Amendment No. 1, effective May 18, 2000 (File No. 1-9936, filed as Exhibit 10.4 to Edison International's Form 10-Q for the quarter ended June 30, 2000)*
|
|
|
10.13.2**
|
Amendment of Equity Compensation Plans, adopted October 25, 2006 (File No. 1-9936, filed as Exhibit 10.52 to Edison International's Form 10-K for the year ended December 31, 2006)*
|
|
|
10.14**
|
2000 Equity Plan, effective May 18, 2000 (File No. 1-9936, filed as Exhibit 10.1 to Edison International's Form 10-Q for the quarter ended June 30, 2000)*
|
|
|
10.15**
|
Edison International 2007 Performance Incentive Plan as amended and restated in February 2011 (File No. 1-9936, filed as Exhibit 10.2 to the Edison International Form 10-Q for the quarter ended June 30, 2011)*
|
|
|
10.15.1**
|
Edison International 2008 Long-Term Incentives Terms and Conditions (File No. 1-9936, filed as Exhibit 10.2 to Edison International's Form 10-Q for the quarter ended March 31, 2008)*
|
|
|
10.15.2**
|
Edison International 2009 Long-Term Incentives Terms and Conditions (File No. 1-9936, filed as Exhibit 10.2 to Edison International's Form 10-Q for the quarter ended March 31, 2009)*
|
|
|
10.15.3**
|
Edison International 2010 Long-Term Incentives Terms and Conditions (File No. 1-9936, filed as Exhibit 10.2 to Edison International's Form 10-Q for the quarter ended March 31, 2010)*
|
|
|
10.15.4**
|
Edison International 2011 Long-Term Incentives Terms and Conditions (File No. 1-9936, filed as Exhibit 10.2 to Edison International's Form 10-Q for the quarter ended March 31, 2011)*
|
|
|
10.15.5**
|
Edison International 2012 Long-Term Incentives Terms and Conditions (File No. 1-9936, filed as Exhibit 10.2 to Edison International's Form 10-Q for the quarter ended March 31, 2012)*
|
|
|
10.15.6**
|
Edison International 2013 Long-Term Incentives Terms and Conditions (File No. 1-9936, filed as Exhibit 10.2 to Edison International's Form 10-Q for the quarter ended March 31, 2013)*
|
|
|
10.15.7**
|
Edison International 2014 Long-Term Incentives Terms and Conditions (File, No. 1-9936, filed as Exhibit 10.3 to Edison International's Form 10-Q for the quarter ended March 31, 2014)*
|
|
|
10.16.1**
|
Terms and conditions for 2004 long-term compensation awards under the Equity Compensation Plan and 2000 Equity Plan (File No. 1-9936, filed as Exhibit 10.1 to Edison International's Form 10-Q for the quarter ended March 31, 2004)*
|
|
|
10.16.2**
|
Terms and conditions for 2005 long-term compensation award under the Equity Compensation Plan and 2000 Equity Plan (File No. 1-9936, filed as Exhibit 99.2 to Edison International's Form 8-K dated December 16, 2004 and filed on December 22, 2004)*
|
|
|
10.16.3**
|
Terms and conditions for 2006 long-term compensation awards under the Equity Compensation Plan and 2000 Equity Plan (File No. 1-9936, filed as Exhibit 10.29 to Edison International's Form 10-K for the year ended December 31, 2005)*
|
|
|
10.16.4**
|
Terms and conditions for 2007 long-term compensation awards under the Equity Compensation Plan and the 2007 Performance Incentive Plan (File No. 1-9936, filed as Exhibit 10.1 to Edison International's Form 10-Q for the quarter ended March 31, 2007)*
|
|
|
10.17.1**
|
Director 2004 Nonqualified Stock Option Terms and Conditions under the Equity Compensation Plan (File No. 1-9936, filed as Exhibit 10.1 to Edison International's Form 10-Q for the quarter ended June 30, 2004)*
|
|
|
10.17.2**
|
Director Nonqualified Stock Option Terms and Conditions under the 2007 Performance Incentive Plan (File 1-9936, filed as Exhibit 10.2 to Edison International's Form 10-Q for the quarter ended March 31, 2007)*
|
|
133
|
Exhibit
Number
|
|
Description
|
|
10.18**
|
Edison International and Edison Mission Energy Affiliate Option Exchange Offer Summary of Deferred Compensation Alternatives, dated July 3, 2000 (File No. 1-13434, filed as Exhibit 10.94 to the Edison Mission Energy's Form 10-K for the year ended December 31, 2001)*
|
|
|
10.18.1**
|
Edison International and Edison Mission Energy Affiliate Option Exchange Offer Circular, dated July 3, 2000 (File No. 1-13434, filed as Exhibit 10.93 to the Edison Mission Energy's Form 10-K for the year ended December 31, 2001)*
|
|
|
10.19**
|
Edison International 2008 Executive Severance Plan, as amended and restated effective June 19, 2014 (File No. 1-9936, filed as Exhibit 10.11 for the quarter ended June 30, 2014)*
|
|
|
10.20**
|
Edison International and Southern California Edison Company Director Compensation Schedule, as adopted June 19, 2014 (File No. 1-9936, filed as Exhibit 10.1 to Edison International's Form 10-Q for the quarter ended June 30, 2014)*
|
|
|
10.21**
|
Edison International Director Matching Gifts Program, as adopted June 24, 2010 (File No. 1-9936, filed as Exhibit 10.1 to Edison International's Form 10-Q for the quarter ended June 30, 2010*
|
|
|
10.22**
|
Edison International Director Nonqualified Stock Options 2005 Terms and Conditions (File No. 1-9936, filed as Exhibit 99.3 to Edison International's Form 8-K dated May 19, 2005, and filed on May 25, 2005)*
|
|
|
10.23
|
Amended and Restated Agreement for the Allocation of Income Tax Liabilities and Benefits among Edison International, Southern California Edison Company and The Mission Group dated September 10, 1996 (File No. 1-9936, filed as Exhibit 10.3 to Edison International's Form 10-Q for the quarter ended September 30, 2002)*
|
|
|
10.23.1
|
Amended and Restated Tax-Allocation Agreement among The Mission Group and its first-tier subsidiaries dated September 10, 1996 (File No. 1-9936, filed as Exhibit 10.3.1 to Edison International's Form 10-Q for the quarter ended September 30, 2002)*
|
|
|
10.23.2
|
Amended and Restated Tax-Allocation Agreement between Edison Capital and Edison Funding Company (formerly Mission First Financial and Mission Funding Company) dated May 1, 1995 (File No. 1-9936, filed as Exhibit 10.3.2 to Edison International's Form 10-Q for the quarter ended September 30, 2002)*
|
|
|
10.23.3
|
Amended and Restated Tax-Allocation Agreement between Mission Energy Holding Company and Edison Mission Energy dated February 13, 2012 (File No. 333-68630, filed as Exhibit 10.11 to Edison Mission Energy's Form 10-K for the year ended December 31, 2011)*
|
|
|
10.23.4
|
Modification No. 1 to the Amended and Restated Tax-Allocation Agreement between Mission Energy Holding Company and Edison Mission Energy dated February 13, 2012 (File No. 333-68630, filed as Exhibit 10.1 to Edison Mission Energy's Form 8-K dated November 15, 2012 and filed November 21, 2012)*
|
|
|
10.23.5
|
Amended and Restated Administrative Agreement Re Tax Allocation Payments, dated February 13, 2012, among Edison International and subsidiary parties. (File No. 333-68630, filed as Exhibit 10.12 to Edison Mission Energy's Form 10-K for the year ended December 31, 2011)*
|
|
|
10.24**
|
Form of Indemnity Agreement between Edison International and its Directors and any officer, employee or other agent designated by the Board of Directors (File No. 1-9936, filed as Exhibit 10.5 to Edison International's Form 10-Q for the period ended June 30, 2005, and filed on August 9, 2005)*
|
|
|
10.25**
|
Edison International 2014 Executive Annual Incentive Program (File No. 1-9936, filed as Exhibit 10.2 to Edison International's Form 10-Q for the quarter ended March 31, 2014)*
|
|
|
10.25.1**
|
Amendment of Edison International Executive Incentive Compensation Plan and 2014 Executive Annual Incentive Program adopted on December 10, 2014
|
|
|
10.26**
|
Section 409A and Other Conforming Amendments to Terms and Conditions (File No. 1-9936, filed as Exhibit No. 10.37 to Edison International's Form 10-K for the year ended December 31, 2008)*
|
|
|
10.26.1**
|
Section 409A Amendments to Director Terms and Conditions (File No. 1-9936, filed as Exhibit No. 10.37.1 to Edison International's Form 10-K for the year ended December 31, 2008)*
|
|
|
10.27
|
Credit Agreement dated as of May 18, 2012 among Edison International and the Lenders named therein (File 1-9936, filed as Exhibit 10 to Edison International's Form 8-K dated May 18, 2012 and filed May 24, 2012)*
|
|
|
10.27.1
|
First Amendment to Credit Agreement dated as of July 18, 2013 among Edison International and the Lenders named therein (File 1-9936, filed as Exhibit 10.1 to Edison International's Form 8-K dated July 18, 2013 and filed July 19, 2013)*
|
|
134
|
Exhibit
Number
|
|
Description
|
|
10.28
|
Credit Agreement dated as of May 18, 2012 among Southern California Edison Company and the Lenders named therein (File 1-2313, filed as Exhibit 10 to Southern California Edison Company's Form 8-K dated May 18, 2012 and filed May 24, 2012)*
|
|
|
10.28.1
|
First Amendment to Credit Agreement dated as of July 18, 2013 among Southern California Edison Company and the Lenders named therein (File 1-2313, filed as Exhibit 10.2 to Southern California Edison Company's Form 8-K dated July 18, 2013 and filed July 19, 2013)*
|
|
|
10.29
|
Amended and Restated Settlement Agreement between Southern California Edison Company, San Diego Gas & Electric Company, the Office of Ratepayer Advocates, The Utility Reform Network, Friends of the Earth, and the Coalition of California Utility Employees, dated September 23, 2014 (File No. 1-9936, filed as Exhibit 10.1 to Edison International's Form 10-Q for the quarter ended September 30, 2014)*
|
|
|
21
|
Subsidiaries of the Registrants
|
|
|
23.1
|
Consent of Independent Registered Public Accounting Firm (Edison International)
|
|
|
23.2
|
Consent of Independent Registered Public Accounting Firm (Southern California Edison Company)
|
|
|
24.1
|
Powers of Attorney of Edison International and Southern California Edison Company
|
|
|
24.2
|
Certified copies of Resolutions of Boards of Edison International and Southern California Edison Company Directors Authorizing Execution of SEC Reports
|
|
|
31.1
|
Certifications of the Chief Executive Officer and Chief Financial Officer of Edison International pursuant to Section 302 of the Sarbanes-Oxley Act
|
|
|
31.2
|
Certifications of the Chief Executive Officer and Chief Financial Officer of Southern California Edison Company pursuant to Section 302 of the Sarbanes-Oxley Act
|
|
|
32.1
|
Certifications of the Chief Executive Officer and the Chief Financial Officer of Edison International required by Section 906 of the Sarbanes-Oxley Act
|
|
|
32.2
|
Certifications of the Chief Executive Officer and the Chief Financial Officer of Southern California Edison Company required by Section 906 of the Sarbanes-Oxley Act
|
|
|
101.1
|
Financial statements from the annual report on Form 10-K of Edison International for the year ended December 31, 2014, filed on February 24, 2015, formatted in XBRL: (i) the Consolidated Statements of Income; (ii) the Consolidated Statements of Comprehensive Income; (iii) the Consolidated Balance Sheets; (iv) the Consolidated Statements of Cash Flows; (v) Consolidated Statements of Changes in Equity and (vi) the Notes to Consolidated Financial Statements
|
|
|
101.2
|
Financial statements from the annual report on Form 10-K of Southern California Edison Company for the year ended December 31, 2014, filed on February 24, 2015, formatted in XBRL: (i) the Consolidated Statements of Income; (ii) the Consolidated Statements of Comprehensive Income; (iii) the Consolidated Balance Sheets; (iv) the Consolidated Statements of Cash Flows; (v) Consolidated Statements of Changes in Equity and (vi) the Notes to Consolidated Financial Statements
|
|
________________________________________
|
*
|
Incorporated by reference pursuant to Rule 12b-32.
|
|
**
|
Indicates a management contract or compensatory plan or arrangement, as required by Item 15(a)(3).
|
135
TABLE OF CONTENTS
Note 4. Fair Value Measurements."Note 1. Summary Of Significant Accounting PoliciesNote 2. Property, Plant and EquipmentNote 3. Variable Interest EntitiesNote 4. Fair Value MeasurementsNote 5. Debt and Credit AgreementsNote 6. Derivative InstrumentsNote 7. Income TaxesNote 8. Compensation and Benefit PlansNote 9. Other InvestmentsNote 10. Regulatory Assets and LiabilitiesNote 11. Commitments and ContingenciesNote 12. Preferred and Preference Stock Of UtilityNote 13. Accumulated Other Comprehensive LossNote 14. Interest and Other Income and Other ExpensesNote 15. Discontinued OperationsNote 16. Supplemental Cash Flows InformationNote 17. Related Party TransactionsNote 18. Quarterly Financial Data (unaudited)Note 1. Basis Of PresentationNote 2. Debt and Credit AgreementsNote 3. Related-party TransactionsNote 4. Discontinued OperationsNote 5. Contingencies