SECURITIES AND EXCHANGE COMMISSION
Washington, D.C. 20549
Form 10-K
ANNUAL REPORT UNDER SECTION 13 or 15(d) OF THE
SECURITIES EXCHANGE ACT OF 1934
For the fiscal year ended
December
31, 2018
Commission file number 001-38661
Elanco Animal Health Incorporated
(Exact name of Registrant as specified in its charter)
|
INDIANA
|
|
82-5497352
|
|
(State or other jurisdiction of
|
|
(I.R.S. Employer
|
|
incorporation or organization)
|
|
Identification No.)
|
2500 INNOVATION WAY, GREENFIELD, INDIANA 46140
(Address of principal executive offices)
Registrant’s telephone number, including area code (877) 352-6261
Securities registered pursuant to Section 12(b) of the Act:
|
Title of each class
|
|
Common Stock, no par value
|
|
Name of each exchange on which registered
|
|
New York Stock Exchange
|
Securities registered pursuant to Section 12(g) of Act:
None.
Indicate by check mark if the registrant is a well-known seasoned issuer, as defined in Rule 405 of the Securities Act.
Yes
o
No
x
Indicate by check mark if the registrant is not required to file reports pursuant to Section 13 or Section 15(d) of the Act.
Yes
o
No
x
Indicate by check mark whether the Registrant (1) has filed all reports required to be filed by Section 13 or 15(d) of the Securities Exchange Act of 1934 during the preceding 12 months (or for such shorter period that the registrant was required to file such reports) and (2) has been subject to such filing requirements for the past 90 days.
Yes
ý
No
o
Indicate by check mark whether the registrant has submitted electronically every Interactive Data File required to be submitted pursuant to Rule 405 of Regulation S-T (§232.405 of this chapter) during the preceding 12 months (or for such shorter period that the registrant was required to submit such files).
Yes
ý
No
o
Indicate by check mark if disclosure of delinquent filers pursuant to Item 405 of Regulation S-K (§229.405 of this chapter) is not contained herein, and will not be contained, to the best of registrant’s knowledge, in definitive proxy or information statements incorporated by reference in Part III of this Form 10-K or any amendment to this Form 10-K.
þ
Indicate by check mark whether the Registrant is a large accelerated filer, an accelerated filer, a non-accelerated filer, a smaller reporting company or an emerging growth company. See the definitions of a “large accelerated filer,” “accelerated filer,” “smaller reporting company” and "emerging growth company" in Rule 12b-2 of the Exchange Act.
|
Large accelerated filer
o
|
Accelerated filer
o
|
|||||
|
Non-accelerated filer
ý
|
Smaller reporting company
o
|
|||||
|
|
Emerging growth company
o
|
|||||
If an emerging growth company, indicate by check mark if the registrant has elected not to use the extended transition period for complying with any new or revised financial accounting standards provided pursuant to Section 13(a) of the Exchange Act.
o
Indicate by check mark whether the registrant is a shell company (as defined in Rule 12b-2 of the Exchange Act).
Yes
o
No
ý
The Registrant was not a public company as of the last business day of its most recently completed second fiscal quarter and, therefore, cannot calculate the aggregate market value of its voting and non-voting common equity held by non-affiliates as of such date.
The number of shares of common stock outstanding as of
February 18, 2019
were
365,643,911
DOCUMENTS INCORPORATED BY REFERENCE
Portions of the registrant's definitive proxy materials for its 2019 Annual Meeting of shareholders are incorporated by reference into Part III hereof.
Elanco Animal Health Incorporated
Form 10-K
For the Year Ended December 31, 2018
Table of Contents
|
Management's Discussion and Analysis of
Financial Condition and Results of Operations
|
||||
|
Part IV
|
||||
3
Forward-Looking Statements
T
his Annual Report on Form 10-K includes forward-looking statements within the meaning of the federal securities laws. This annual report contains forward-looking statements, including, without limitation, statements concerning our industry and our operations, performance and financial condition, including in particular, statements relating to our business, growth strategies, product development efforts and future expenses.
Forward-looking statements are based on our current expectations and assumptions regarding our business, the economy and other future conditions. Because forward-looking statements relate to the future, by their nature, they are subject to inherent uncertainties, risks and changes in circumstances that are difficult to predict. As a result, our actual results may differ materially from those contemplated by the forward-looking statements. Important factors that could cause actual results to differ materially from those in the forward-looking statements include regional, national, or global political, economic, business, competitive, market, and regulatory conditions, including but not limited to the following:
|
•
|
heightened competition, including from new innovation or generics;
|
|
•
|
the impact of disruptive innovations and advances in veterinary medical practices, animal health technologies and alternatives to animal-derived protein;
|
|
•
|
changes in regulatory restrictions on the use of antibiotics in food animals, as well as changing market demand regarding the use of antibiotics and productivity products;
|
|
•
|
impact of generic products;
|
|
•
|
our ability to implement our business strategies or achieve targeted cost efficiencies and gross margin improvements;
|
|
•
|
consolidation of our customers and distributors;
|
|
•
|
an outbreak of infectious disease carried by food animals;
|
|
•
|
the success of our R&D, acquisition and licensing efforts;
|
|
•
|
misuse or off-label use of our products;
|
|
•
|
unanticipated safety, quality or efficacy concerns associated with our products;
|
|
•
|
the impact of weather conditions and the availability of natural resources;
|
|
•
|
risks related to our presence in emerging markets;
|
|
•
|
changes in U.S. foreign trade policy, imposition of tariffs or trade disputes;
|
|
•
|
the impact of global macroeconomic conditions; and
|
|
•
|
the effect on our business of the transactions involving the separation of our business from that of Eli Lilly & Co. (Lilly) and distribution of Lilly's interest in us to its shareholders through an exchange offer or otherwise, if consummated.
|
See "Risk Factors" in Part I, Item 1A of this Annual Report on Form 10-K for a further description of these and other factors. Although we have attempted to identify important risk factors, there may be other risk factors not presently known to us or that we presently believe are not material that could cause actual results and developments to differ materially from those made in or suggested by the forward-looking statements contained in this annual report. If any of these risks materialize, or if any of the above assumptions underlying forward-looking statements prove incorrect, actual results and developments may differ materially from those made in or suggested by the forward-looking statements contained in this annual report. For the reasons described above, we caution you against relying on any forward-looking statements, which should also be read in conjunction with the other cautionary statements that are included elsewhere in this annual report. Any forward-looking statement made by us in this annual report speaks only as of the date hereof. Factors or events that could cause our actual results to differ may emerge from time to time, and it is not possible for us to predict all of them. We undertake no obligation to publicly update or to revise any forward-looking statement, whether as a result of new information, future developments or otherwise, except as may be required by law. Comparisons of results for current and any prior periods are not intended to express any future trends or indications of future performance, unless specifically expressed as such, and should be viewed as historical data.
4
Part I
Item 1. Business
Overview
Founded in 1954 as part of Lilly, Elanco is a premier animal health company that innovates, develops, manufactures and markets products for companion and food animals. Headquartered in Greenfield, Indiana, we are the fourth largest animal health company in the world, with revenue of
$3.1 billion
for the year ended December 31, 2018. Globally, we are #1 in medicinal feed additives, #2 in poultry and #3 in cattle, measured by 2017 revenue, according to Vetnosis. We also have one of the broadest portfolios of pet parasiticides in the companion animal sector. We offer a diverse portfolio of more than 125 brands that make us a trusted partner to veterinarians and food animal producers in more than 90 countries.
On September 24, 2018, we completed our initial public offering (IPO), pursuant to which we issued and sold 19.8% of our total outstanding shares. As of the date of this report, Lilly owns 80.2% of the outstanding shares of our common stock. On September 20, 2018, our common stock began trading on the New York Stock Exchange (NYSE) under the symbol “ELAN.” On September 24, 2018, immediately preceding the completion of the IPO, Lilly transferred to us substantially all of its animal health businesses in exchange for (i) all of the net proceeds (approximately $1,659.7 million) we received from the sale of our common stock in the IPO, including the net proceeds we received as a result of the exercise in full of the underwriters’ option to purchase additional shares, (ii) all of the net proceeds (approximately $2,000 million) we received from the issuance of our senior notes and (iii) all of the net proceeds ($498.6 million) we received from the entry into our term loan facility. In addition, immediately prior to the completion of the IPO, we entered into certain agreements with Lilly that provide a framework for our ongoing relationship with them. For more information, see "Note 19: Related Party Agreements and Transactions" to our consolidated and combined financial statements.
On February 8, 2019, we filed a Registration Statement on Form S-4 with the SEC in connection with Lilly's proposed exchange offer, whereby Lilly Shareholders can exchange shares of Lilly common stock for shares of our common stock owned by Lilly.
Our vision is to enrich the lives of people through food, making protein more accessible and affordable, and through pet companionship, helping pets live longer, healthier lives. We advance our vision by offering products in four primary categories:
Companion Animal Disease Prevention (CA Disease Prevention)
. We have one of the broadest parasiticide portfolios in the companion animal sector based on indications, species and formulations, with products that protect pets from worms, fleas and ticks. Combining our parasiticide portfolio with our vaccines presence, we are a leader in the U.S. in the disease prevention category based on share of revenue.
Companion Animal Therapeutics (CA Therapeutics)
. We have a broad pain and osteoarthritis portfolio across species, modes of action, indications and disease stages. Pet owners are increasingly treating osteoarthritis in their pets, and our
Galliprant
product is one of the fastest growing osteoarthritis treatments in the U.S. We also have treatments for otitis (ear infections), as well as cardiovascular and dermatology indications.
Food Animal Future Protein & Health (FA Future Protein & Health)
. Our portfolio in this category, which includes vaccines, nutritional enzymes and animal‑only antibiotics, serves the growing demand for protein and includes innovative products in poultry and aquaculture production, where demand for animal health products is outpacing overall industry growth. We are focused on developing functional nutritional health products that promote food animal health, including enzymes, probiotics and prebiotics. We are a leader in providing vaccines as alternatives to antibiotics to promote animal health based on share of revenue.
Food Animal Ruminants & Swine (FA Ruminants & Swine)
. We have developed a range of food animal products used extensively in ruminant (e.g., cattle, sheep and goats) and swine production.
We have a top four presence in all four key industry geographic regions: North America (NA); Europe, the Middle East and Africa (EMEA); Latin America (LATAM); and Asia-Pacific (APAC), as measured by 2017 revenue,
5
according to Vetnosis. The following graphs demonstrate our revenue for the year ended December 31, 2018 by product category and geography:
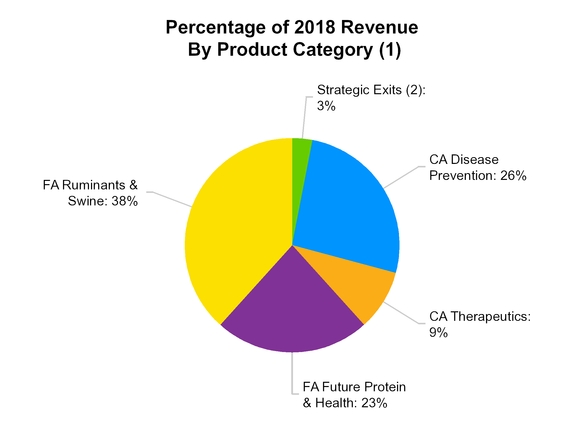
(1) Percentages may not add to 100% due to rounding
|
(2)
|
Strategic Exits include revenue from third-party manufacturing, distribution and other contractual arrangements, as well as an equine product not core to our business and transitional contract manufacturing activity associated with the supply of human growth hormone to Lilly, which we made the decision to exit
.
|
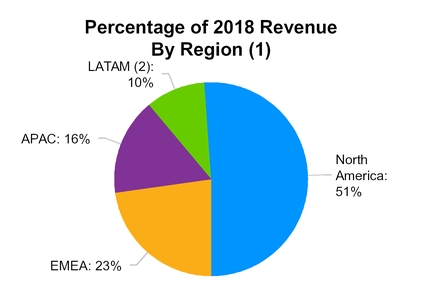
(1) Percentages may not add to 100% due to rounding
(2) LATAM includes aquaculture in all regions
6
Through our global sales force of approximately 1,475 sales representatives, our veterinary consultants and our key distributors, we seek to build strong customer relationships and fulfill demand for our food animal products primarily with food animal producers, veterinarians and nutritionists, and for our companion animal products primarily with veterinarians and, in some markets, pet owners. We are also expanding into retail channels in order to meet pet owners where they want to purchase.
Our inclusive approach to sourcing innovation helps us identify, attract, fund and develop new ideas that enhance our pipeline and reduce risk as compared to an in‑house only approach. Through this process, we launched eleven products from 2015 to 2018 that delivered $143.8 million of revenue in 2017 and $274.2 million of revenue in 2018.
We believe we have an experienced leadership team that fosters an adaptive, purpose‑driven culture among approximately 5,780 employees worldwide as of December 31, 2018 and that our employees share a deep conviction for achieving our vision of food and companionship, enriching life.
For the year ended December 31, 2018, our revenue was
$3.1 billion
and for both of the years ended December 31, 2017 and 2016 our revenue was
$2.9 billion
. For the years ended December 31, 2018, 2017 and 2016, our net income (loss) was
$86.5 million
,
$(310.7) million
and
$(47.9) million
, respectively.
Products
We have a diverse portfolio of products marketed under more than 125 brands, including products for both food animals and companion animals.
Our food animal products are designed to enable producers to keep animals healthy and deliver more food while using fewer resources. Our antibacterials, anticoccidials, vaccines and parasiticides aim to make food safer by preventing and controlling disease. We offer products and support to enhance the integrity of the food supply, while our productivity enhancers help make food more affordable and abundant by increasing the amount of meat, milk or eggs an animal can supply. Furthermore, our expertise and data analytics help our customers improve production efficiency and business performance. Food animal products represented approximately 61% of our revenue for the year ended December 31, 2018.
Our companion animal products help veterinarians better care for pets. We partner with pet owners and veterinarians for the purpose of providing a consistent flow of innovative and effective products and support. Our R&D focuses on products that prevent and treat disease, improve and extend quality of life and improve the type of care received by pets. We also partner closely with veterinarians to provide technical support and case management for our products. Companion animal products represented approximately 35% of our revenue for the year ended December 31, 2018.
We group our products into four principal categories:
CA Disease Prevention
: includes parasiticides and vaccine products for canines and felines.
CA Therapeutics
: includes products for the treatment of pain, osteoarthritis, otitis, cardiovascular and dermatology indications in canines and felines.
FA Future Protein & Health
: includes vaccines, antibiotics, parasiticides and other products used in poultry and aquaculture production, as well as functional nutritional health products, including enzymes, probiotics and prebiotics.
FA Ruminants & Swine
: includes vaccines, antibiotics, implants, parasiticides and other products used in ruminants and swine production, as well as certain other food animal products.
We pursue the development of new chemical and biological molecules through our innovation strategy. Since 2015, we have launched the following eleven products:
In CA Disease Prevention,
Credelio
and
Interceptor Plus
.
In CA Therapeutics,
Galliprant
and
Osurnia.
In FA Future Protein & Health,
Inteprity
,
Imvixa
,
Clynav and Correlink
.
7
In FA Ruminants & Swine,
Imrestor,
Kavault and Prevacent
.
In the second quarter of 2018, we suspended commercialization of
Imrestor
and plans to pursue additional indications.
In 2016, we announced the creation of our Nutritional Health organization, which focuses on functional nutrition products, including enzymes, probiotics and prebiotics, which impact animal microbiomes and other dietary factors to reduce disease incidence, improve gut health and enhance feed digestibility. We first focused on nutritional health in 2012, with the acquisition of ChemGen and the
Hemicell
brand. In 2016, we entered into an agreement with Agro Biosciences, Inc. to commercialize
Correlink
- a novel direct‑fed microbial (probiotic) product outside the U.S. In early 2018, we announced a new global, exclusive in‑licensing agreement with Ab E Discovery to further develop and bring to the market an in feed antibody product focused on reducing and controlling coccidiosis.
Rumensin
, our top selling product, contributed approximately 11% of our revenue in 2018 and 10% of our revenue in 2017, 2016 and 2015. No other product contributed 10% or more of our revenue. Our top five selling products,
Rumensin
,
Trifexis
,
Maxiban
,
Denagard
and
Interceptor Plus
, collectively contributed approximately 31% of our 2018 revenue. Our top 10 products collectively contributed 42% of our 2018 revenue.
Set forth below is information regarding our principal products.
8
CA Disease Prevention Products
|
Primary
|
||
|
Product
|
Description
|
Species
|
|
Bronchi Shield III
and
Bronchi Shield Oral
(vaccines)
|
Bronchi Shield III - To protect against adenovirus, parainfluenza and Bordetella bronchiseptica (Bb) in dogs.
Bronchi Shield Oral - To protect against Bb in dogs.
|
Dogs
|
|
Comfortis
(spinosad)
|
To kill fleas and prevent and treat flea infestations (
Ctenocephalides felis
) in cats 14 weeks of age or older and weighing at least 4.1 lbs. and dogs 14 weeks of age or older and weighing at least 5.0 lbs.
|
Cats, Dogs
|
|
Credelio
(lotilaner)
|
To kill adult fleas and to treat flea infestations (
Ctenocephalides felis
) and treat and control tick infestations (
Amblyomma americanum
(lone star tick),
Dermacentor variabilis
(American dog tick),
Ixodes scapularis
(black‑legged tick) and
Rhipicephalus sanguineus
(brown dog tick)) for one month in dogs and puppies 8 weeks of age or older and weighing at least 4.4 lbs.
|
Dogs
|
|
Duramune
(vaccines)
|
Includes multiple products that collectively protect against distemper, adenovirus, parvovirus, corona, parainfluenza, leptospira canicola, and other diseases in dogs.
|
Dogs
|
|
Rabvac
(vaccines)
|
To protect against rabies, includes a 1‑year and 3‑year shot.
|
Cats, Dogs
|
|
Fel‑O‑Vax
(vaccines)
|
Includes multiple products that collectively protect against leukemia, rhinovirus, calicivirus, panleukopenia, and chlamydia in cats.
|
Cats
|
|
Fel‑O‑Guard
(vaccines)
|
Includes multiple products that collectively protect against leukemia, rhinovirus, calicivirus, panleukopenia, and chlamydia in cats.
|
Cats
|
|
Interceptor Plus
(milbemycin oxime/praziquantel)
|
To prevent heartworm disease caused by
Dirofilaria immitis
and for the treatment and control of adult roundworm (
Toxocara canis
and
Toxascaris leonina
), adult hookworm (
Ancylostoma caninum
), adult whipworm (
Trichuris vulpis
), and adult tapeworm (
Taenia pisiformis
,
Echinococcus multilocularis
, and
Echinococcus granulosus
) infections in dogs and puppies weighing at least 2 lbs. and 6 weeks of age or older.
Interceptor Plus
is a relaunch of a previously approved formula.
|
Dogs
|
|
Milbemax
(milbemycin
oxime +
praziquantel)
|
To treat and control parasitic infections due to adult hookworm, adult roundworm and adult tapeworm and to prevent heartworm disease caused by
Dirofilaria immitis
in cats and dogs.
|
Cats, Dogs
|
|
Trifexis
(spinosad +
milbemycin
oxime)
|
To prevent heartworm disease (
Dirofilaria immitis
) and to kill fleas.
Trifexis
is indicated for the prevention and treatment of flea infestations (
Ctenocephalides felis
), and the treatment and control of adult hookworm
(Ancylostoma caninum)
, adult roundworm (
Toxocara canis
and
Toxascaris leonina
) and adult whipworm (
Trichuris vulpis
) infections in dogs and puppies 8 weeks of age or older and weighing at least 5 lbs.
|
Dogs
|
9
CA Therapeutics Products
|
Primary
|
||
|
Product
|
Description
|
Species
|
|
Atopica
(cyclosporine A)
|
To control atopic dermatitis in dogs weighing at least 4 lbs.
|
Dogs
|
|
Fortekor Plus
(benazepril +
pimobendan)
|
To treat congestive heart failure due to atrioventricular valve insufficiency or dilated cardiomyopathy in dogs.
|
Dogs
|
|
Galliprant
(grapiprant)
|
To control pain and inflammation associated with osteoarthritis in dogs.
|
Dogs
|
|
Onsior
(robenacoxib)
|
To control postoperative pain and inflammation associated with soft tissue surgery in dogs weighing at least 5.5 lbs. and 4 months of age or older and control postoperative pain and inflammation associated with orthopedic surgery, ovariohysterectomy and castration in cats weighing at least 5.5 lbs. and 6 months of age or older; for up to a maximum of 3 days.
|
Cats, Dogs
|
|
Osurnia
(terbinafine +
florfenicol +
betamethasone
acetate)
|
To treat otitis externa in dogs associated with susceptible strains of bacteria (
Staphylococcus pseudintermedius
) and yeast (
Malassezia pachydermatis
).
|
Dogs
|
10
FA Future Protein & Health
|
Primary
|
||
|
Product
|
Description
|
Species
|
|
AviPro
(vaccines)
|
Includes multiple products that collectively protect against Newcastle disease, infectious bronchitis, fowl cholera, paramyxovirus Type 3, Bursal Disease, other diseases and foodborne pathogens like Salmonella in poultry.
|
Poultry
|
|
Clynav
(plasmid deoxyribonucleic acid vaccine)
|
To immunize Atlantic salmon to reduce impaired daily weight gain, and reduce mortality, and cardiac, pancreatic and skeletal muscle lesions caused by pancreas disease following infection with salmonid alphavirus subtype 3 (SAV3).
|
Fish (Salmon)
|
|
Coban
/
Elancoban
(monensin)
|
To aid in the prevention of coccidiosis in broiler and replacement chickens (caused by
Eimeria necatrix, E. tenella, E. acervulina, E. brunetti, E. mivati
, and
E. maxima
), in turkeys (caused by
Eimeria adenoeides, E. meleagrimitis
and
E. gallopavonis
) and in growing Bobwhite quail (caused by
Eimeria dispersa
and
E. lettyae
). Coban/Elancoban is an animal‑only antibiotic and an ionophore.
|
Poultry
|
|
Hemicell
(endo‑1, 4‑â‑mannanase)
|
Enzyme supplement for poultry and swine feeds that contain a source of â‑mannanase, which hydrolyses the â‑mannans present in soybean and corn meal.
|
Poultry, Swine
|
|
Imvixa
(lufenuron)
|
To prevent and control infestation caused by sea lice,
Caligus reogercresseyi,
in farmed salmon.
|
Fish (Salmon)
|
|
Maxiban
(narasin +
nicarbazin)
|
To prevent coccidiosis in broiler chickens caused by
Eimeria necatrix, E. tenella, E. acervulina, E. brunetti, E. mivati
and
E. maxima. Maxiban
is an animal‑only antibiotic and an ionophore.
|
Poultry
|
|
Monteban
(narasin)
|
To prevent coccidiosis in broiler chickens caused by
Eimeria necatrix, E. tenella, E. acervulina, E. brunetti, E. mivati
and
E. maxima. Monteban
is an animal‑only antibiotic and an ionophore.
|
Poultry
|
|
Surmax / Maxus / Inteprity
(avilamycin)
|
To prevent mortality caused by necrotic enteritis associated with
Clostridium perfringens
in broiler chickens.
Surmax, Maxis
and
Inteprity
are animal‑only antibiotics.
|
Poultry
|
11
FA Ruminants & Swine
|
Primary
|
||
|
Product
|
Description
|
Species
|
|
Denagard
(tiamulin)
|
To treat Swine Dysentery associated with
Serpulina
hyodysenteriae
susceptible to tiamulin and for treatment of swine bacterial enteritis caused by
Escherichia coli
and
Salmonella choleraesuis
sensitive to chlortetracycline and treatment of bacterial pneumonia caused by Pasteurella multocida sensitive to chlortetracycline.
Denagard
is a shared‑class antibiotic.
|
Swine
|
|
Optaflexx / Paylean
(ractopamine hydrochloride)
|
To increase rate of weight gain, improve feed efficiency and increase carcass leanness, and used as a top dress feed to increase rate of weight gain and improve feed efficiency in cattle fed in confinement for slaughter during the last 28 to 42 days on feed. Ractopamine, the active ingredient in
Paylean and Optaflexx,
is a beta adrenoreceptor agonist.
|
Cattle, Swine
|
|
Pulmotil
(tilmicosin)
|
For swine: To control swine respiratory disease associated with
Actinobacillus pleuropneumoniae
and
Pasteurella multocida.
For cattle: To control bovine respiratory disease (BRD) associated with
Mannheimia haemolytica, Pasteurella multocida
and
Histophilus somni
in groups of beef and non‑lactating dairy cattle, where active BRD has been diagnosed in at least 10% of the animals in the group.
Pulmotil
is a shared‑class antibiotic.
|
Cattle, Swine
|
|
Rumensin
(monensin)
|
For cattle fed in confinement for slaughter: To improve feed efficiency and prevent and control coccidiosis due to
Eimeria bovis
and
Eimeria zuernii
.
For dairy cows: To increase milk production efficiency (production of marketable solids‑corrected milk per unit of feed intake).
|
Cattle
|
|
For growing cattle on pasture or in dry lot (stocker and feeder and dairy and beef replacement heifers): To increase rate of weight gain and to prevent and control coccidiosis due to
Eimeria bovis
and
Eimeria zuernii
.
For mature reproducing beef cows: To improve feed efficiency when receiving supplemental feed and to prevent and control coccidiosis due to
Eimeria bovis
and
Eimeria zuernii
.
For goats: To prevent coccidiosis due to
Eimeria crandallis, Eimeria christenseni
and
Eimeria ninakohlyakimovae
in goats maintained in confinement.
For calves (excluding veal calves): To prevent and control coccidiosis due to
Eimeria bovis
and
Eimeria zuernii.
Rumensin
is an animal‑only antibiotic and an ionophore.
|
||
|
Tylan Premix
(tylosin phosphate)
|
To control porcine proliferative enteropathies associated with
Lawsonia intracellularis
and to control porcine proliferative enteropathies associated with
Lawsonia intracellularis
immediately after medicating with
Tylan Soluble
(tylosin tartrate) in drinking water.
Tylan Premix
is a shared‑class antibiotic.
|
Swine, Cattle, Poultry
|
|
Vira Shield
(vaccines)
|
Includes multiple products that protect against infection, bovine rhinotracheitis, bovine viral diarrhea, bovine respiratory syncytial virus, bovine respiratory disease, leptospira canicola and other diseases in cattle.
|
Cattle
|
12
Antibiotics
Antimicrobial resistance in humans, or the risk that human pathogens evolve or otherwise emerge that are resistant to antibiotics or other antimicrobials, is a significant health concern, and animal agriculture can play a role in mitigating this risk. As a company dedicated to the health and well‑being of animals, we seek to help veterinarians and farmers responsibly use antibiotics when treating animals. In our efforts to address antibiotic resistance while protecting animal health, we introduced a global antibiotic stewardship plan focused on increasing responsible antibiotic use; reducing the need for shared‑class antibiotics; and replacing antibiotics with alternatives to help livestock producers treat and prevent animal disease. Antibiotics, used responsibly, along with good animal care practices, help enhance food safety and animal well‑being.
There are two classes of antibiotics used in animal health:
Animal‑only antibiotics and ionophores
: Not all pathogens that cause disease in animals are infectious in humans, and accordingly animal‑only antibiotics are not used in human medicine (i.e., not medically important). Ionophores are a special class of animal‑only antimicrobials uniquely developed only for use in animals. In Europe and certain other jurisdictions, ionophores are not currently classified as antibiotics. Because of their animal‑only designation, mode of action, and spectrum of activity, their use is not considered to create the same risk of resistance in human pathogens.
Shared‑class antibiotics
: These are used in both humans and animals. Some antibiotics are used to treat infectious disease caused by pathogens that occur in both humans and animals. Of the 18 major antibiotic resistance threats that the Centers for Disease Control and Prevention tracks, two are associated with infectious disease in animals. As part of our global antibiotic stewardship plan and in compliance with the U.S. Food & Drug Administration (FDA) guidance, shared‑class antibiotics are labeled only for the treatment of an established need in animals and only with veterinarian oversight.
We have intentionally shifted away from shared‑class antibiotics, and are focusing on animal‑only antibiotics, as well as antibiotic‑free solutions. In 2018, 12% of our revenue was from products classified as shared‑class antibiotics, of which 4% of our revenue was in the U.S. and 8% was outside the U.S., whereas 25% of our revenue was from animal‑only antibiotics and ionophores, of which ionophores constituted 21% of our revenue. Through our policies and efforts in this area, we seek to protect the benefits of antibiotics in human medicine, while responsibly protecting the health of food animals and the safety of our food supply.
Sales and Marketing
Our sales organization includes sales representatives, veterinary consultants and other value added specialists. In markets where we do not have a direct commercial presence, we generally contract with distributors that provide logistics and sales and marketing support for our products.
Our sales representatives visit our customers, including consultants, veterinarians, food animal producers, and resellers, to inform, promote and sell our products and to support customers. Our veterinary consultants provide scientific consulting focused on disease management and herd management, training and education on diverse topics, including responsible product use, and generally have advanced degrees in veterinary medicine, veterinary nutrition or other agriculture‑related fields. These direct relationships with customers allow us to understand their needs. Additionally, our sales representatives and veterinary consultants focus on collaborating with our customers to educate and support them on topics such as local disease awareness and to help them adopt new and more sophisticated animal health solutions, including through the use of our products. As a result of these relationships, our sales and consulting visits provide us with access to customer decision makers. In addition, our sales and marketing organization provides enhanced value by providing support to food animal producers to help maximize their yields and reduce costs. Our analytics help customers analyze large amounts of health and production data. As of December 31, 2018, we had approximately 1,475 sales representatives.
Customers
We primarily sell our food animal products to third‑party distributors and directly to a diverse set of food animal producers, including beef and dairy farmers as well as pork, poultry and aquaculture operations. We primarily sell our companion animal products to third‑party distributors, as well as directly to veterinarians that typically then sell our products to pet owners. We are also expanding into retail channels in order to meet pet owners where they want to purchase. Our largest customer, an affiliate of AmerisourceBergen Corp., is a third‑party veterinary distributor and represented approximately 12% of our revenue for the year ended December 31, 2018. Our next largest customer represented approximately 7% of our revenue for the year ended December 31, 2018 and no other customer represented more than 5% of our revenue for the same period.
13
Research and Development
Our R&D organization is comprised of internal research, global development, global regulatory and external innovation collaborations and venture investing. As of December 31, 2018, we employed approximately 690 employees in our global R&D and Regulatory Affairs organizations. Our R&D headquarters is located in Greenfield, Indiana. We have R&D facilities in Basel, Switzerland; Prince Edward Island, Canada; and Yarrandoo, Australia and R&D facilities co-located with manufacturing sites in Fort Dodge, Iowa; and Cuxhaven, Germany. Additional R&D operations are located in Sao Paulo, Brazil; Shanghai, China; and Bangalore, India. We incurred R&D expenses of
$246.6 million
in 2018,
$251.7 million
in 2017 and
$265.8 million
in 2016.
New product innovation is a core part of our business strategy. Our R&D investment is focused on projects that target novel product introductions, as well as new indications, presentations, combinations and species expansion. Our approach is a build, buy, or ally strategy to develop compelling targets and concepts that originate from our scientists and innovators, academia, agribusiness, or human pharmaceutical and biotechnology at all stages of R&D. The ability to source our concepts from different areas allows us to create a pipeline that can be competitive in the categories in which we have chosen to compete, while reducing our risk by not owning and funding all aspects of our R&D projects.
We seek to concentrate our resources in areas where we believe the science and our capabilities best match the opportunities in the animal health market. Specifically, our R&D focuses on six areas across companion animals and food animals. For companion animals, we have R&D activities in therapeutics, vaccines and parasiticides, while in food animals we are pursuing pharmaceuticals, vaccines and nutritional health.
Our R&D efforts consist of more than 100 active programs balanced across species and technology platforms. For both food animals and companion animals, we apply both large and small molecule approaches. In vaccines, our efforts encompass a full range of modified live, inactivated and nucleic acid strategies. In nutritional health, we focus on products based on enzymes, probiotics, prebiotics and other approaches that modulate biological activity in the animal digestive tract. Additionally, we employ various delivery strategies for products including in‑feed, injectable, oral and topical formulations developed in conjunction with our manufacturing team to assure production that maximizes the capabilities within our internal and external manufacturing network.
We engage in licensing and business development to acquire assets for our pipeline and new R&D platforms and to establish strategic R&D collaborations. We make and maintain capital investments in venture capital vehicles that focus on agribusiness and animal health, and we engage in risk sharing collaborations to expand our external capital sources to augment internal investments. To support collaborations with innovation sources focused on human health we have developed capabilities to conduct translational comparative medical research trials in animals with naturally occurring conditions that mimic a human disease or disorder. This type of collaboration de‑risks unproven or less well‑validated human hypotheses while potentially defining a clinically validated new approach in veterinary medicine.
Our R&D and commercial leadership allocate R&D investment annually with the goal of aligning near‑ and long‑term strategic opportunities and objectives. Portfolio investment decisions are made based on the probability of technical success and regulatory approval, timing of approval/launch and earlier milestones, feasibility and cost of development and manufacturing, intellectual property protection and market attractiveness/commercial forecast. R&D projects are supported by pharmaceutical project management approaches and we aim for all of our supporting R&D functional capabilities and capacities to be managed and matched to the evolving demands of the pipeline. We believe this overall R&D management system has enabled us to consistently gain product approvals while maintaining clear visibility to pipeline breadth and depth to support sustained launches into the future.
Manufacturing and Supply Chain
Prior to the separation, our products were manufactured at both sites operated by us and sites operated by third-party contract manufacturing organizations (CMOs).
We own and operate 12 internal manufacturing sites, four of which focus on vaccines, six of which focus on other animal health products and two of which are regional sites that focus on packaging:
14
|
Site
|
Location
|
Site
|
Location
|
|||
|
Clinton
|
Indiana, U.S.
|
Prince Edward Island
|
Canada
|
|||
|
Speke
|
Liverpool, U.K.
|
Winslow
|
Maine, U.S.
|
|||
|
Kansas City
|
Kansas, U.S.
|
Fort Dodge
|
Iowa, U.S.
|
|||
|
Huningue
|
France
|
Cuxhaven
|
Germany
|
|||
|
Wusi
|
China
|
Chungli
|
Taiwan
|
|||
|
Terre Haute
|
Indiana, U.S.
|
Barueri
|
Brazil
|
|||
We will continue to manufacture one product, human growth hormone, for Lilly at one of these sites for a period of two years following the date of the separation. Lilly has the option to extend the arrangement for three additional years.
Our global manufacturing and supply chain is also supported by a network of CMOs. As of December 31, 2018, this network was comprised of approximately 100 CMOs. Our External Manufacturing Network centrally governs our global CMO relationships and provides oversight to these CMOs through four hubs.
We select CMOs based on several factors: (i) their ability to reliably supply products or materials that meet our quality standards at an optimized cost; (ii) their access to specialty products and technologies; (iii) capacity; and (iv) financial analyses. Our External Manufacturing Network seeks to ensure that all of the CMOs we use adhere to our standards of manufacturing quality.
We purchase certain raw materials necessary for the commercial production of our products from a variety of third‑party suppliers. We utilize logistics service providers as a part of our global supply chain, primarily for shipping and logistics support.
We intend to continue our efficiency improvement programs in our manufacturing and supply chain organization. We have strong globally managed and coordinated quality control and quality assurance programs in place at all internal manufacturing sites and external manufacturing hubs, and we regularly inspect and audit our internal sites and CMO locations. We recently conducted a review of our global manufacturing and supply network to improve efficiency. As a result of this review and our operational efficiency program, we exited ownership of our manufacturing sites in Vacaville, California; Dundee, Scotland; Sligo, Ireland; Larchwood, Iowa; and Cali, Colombia, reduced headcount from approximately 3,500 to approximately 2,300 employees and eliminated over 2,800 stock keeping units (SKUs). We currently supply approximately 4,500 SKUs.
Our manufacturing sites experienced approximately 200 external regulatory inspections globally from 2015 to 2018, for which such regulators made no material critical findings.
Competition
We face intense competition in the sectors and regions on which we focus. Principal methods of competition vary depending on the particular region, species, product category, or individual product. Some of these methods include new product development, quality, price, service and promotion.
Our primary competitors include animal health medicines and vaccines companies such as Zoetis Inc.; Boehringer Ingelheim Vetmedica, Inc., the animal health division of Boehringer Ingelheim GmbH; Merck Animal Health, the animal health division of Merck & Co., Inc.; and Bayer Animal Health, the animal health division of Bayer AG. We also face competition globally from manufacturers of generic drugs, as well as from producers of nutritional health products, such as DSM Nutritional Products AG and Danisco Animal Nutrition, the animal health division of E.I. du Pont de Nemours and Company, a subsidiary of DowDuPont, Inc. There are also several new start‑up companies working in the animal health area. In addition, we compete with numerous other producers of animal health products throughout the world.
15
Intellectual Property
Our technology, brands and other intellectual property are important elements of our business. We rely on patent, trademark, copyright and trade secret laws, as well as regulatory exclusivity periods and non‑disclosure agreements to protect our intellectual property rights. Our policy is to vigorously protect, enforce and defend our rights to our intellectual property, as appropriate.
Our product portfolio and certain product candidates enjoy the protection of approximately 3,000 patents and applications, filed in over 50 countries, with concentration in our major market countries as well as other countries with strong patent systems, such as Australia, Brazil, Canada, Europe, Japan and the U.S. Many of the patents and patent applications in our portfolio are the result of our own work, while other patents and patent applications in our portfolio were at least partially developed, and licensed to us, by third parties. A subset of our current products or product candidates are covered by patents and patent applications in our portfolio.
Patents for individual products expire at different times based on the date of the patent filing (or sometimes the date of patent grant) and the legal term of patents in the countries where such patents are obtained. For example,
Galliprant’s
active ingredient, grapiprant, is encompassed by both compound and physical form patents in the U.S., Europe, Canada and other key markets, with terms that expire between October 2021 and March 2026. Various formulation and method of use patents encompass the spinosad pesticide products,
Comfortis
and
Trifexis
. The
Comfortis
formulation patent extends through August 2020 in the U.S., Canada and Australia, and, upon grant of applicable supplementing protection certificate (SPC), through August 2025 in Europe. The
Trifexis
formulation and method of use patents extends through September 2021 in the U.S., Canada and Australia, and, upon grant of applicable SPC, through September 2026 in Europe. We typically maintain all of our patents and assert our patent rights against third parties as appropriate.
Additionally, many of our vaccine products, including the
Duramune
family of vaccines, are based on proprietary or patented master seeds and formulations. We actively seek to protect our proprietary information, including our trade secrets and proprietary know‑how, through a variety of means including by seeking to require our employees, consultants, advisors and partners to enter into confidentiality agreements and other arrangements upon the commencement of their employment or engagement.
In order to facilitate the separation and allow Lilly's and our operations to continue with minimal interruption, Lilly licensed to us the right to use certain intellectual property rights in the animal health field. In addition, Lilly has granted us a transitional license to use certain of Lilly’s trademarks for a period of time following the IPO. See “Agreements Between Lilly and us and Other Related Party Transactions-Relationship between us and Lilly
-
Transitional Trademark License Agreement.”
We seek to file and maintain trademarks around the world based on commercial activities in most regions where we have, or desire to have, a business presence for a particular product. We currently maintain more than 9,000 trademark applications and registrations in major regions, primarily identifying products dedicated to the care of livestock and companion animals.
Regulatory
The sale of animal health products is governed by the laws and regulations specific to each country in which we sell our products. To maintain compliance with these regulatory requirements, we have established processes, systems and dedicated resources with end‑to‑end involvement from product concept to launch and maintenance in the market. Our regulatory function actively seeks to engage in dialogue with various global agencies regarding their policies that relate to animal health products. In the majority of our markets, the relevant health authority is separate from those governing human medicinal products.
United States
U.S. Food and Drug Administration.
The regulatory body that is responsible for the regulation of animal health pharmaceuticals in the U.S. is the Center for Veterinary Medicine (CVM), a division of the FDA. All manufacturers of animal health pharmaceuticals must demonstrate their products to be safe, effective and produced by a consistent method of manufacture as defined under the Federal Food, Drug and Cosmetic Act (the FFDCA). The FDA’s basis for approving a new animal drug application is documented in a Freedom of Information Summary. Post‑approval monitoring of products is required by law, with reports being provided to the CVM’s Office of Surveillance and
16
Compliance. Reports of product quality defects, adverse events or unexpected results are maintained and submitted in accordance with the law. Additionally, as part of the drug experience report, we are required to submit all new information pertaining to the safety or effectiveness of a product, regardless of the source.
U.S. Department of Agriculture.
The regulatory body in the U.S. for veterinary biologicals is the U.S. Department of Agriculture (the USDA). The Center for Veterinary Biologics within the Animal and Plant Health Inspection Service in the USDA is responsible for the regulation of animal health biologicals, which includes but is not limited to vaccines, bacterins, allergens, antibodies, antitoxins, toxoids, immunostimulants, certain cytokines, antigenic or immunizing components of live microorganisms, and diagnostic components of natural or synthetic origin, or that are derived from synthesizing or altering various substances or components of substances such as microorganisms, genes or genetic sequences, carbohydrates, proteins, antigens, allergens or antibodies. All manufacturers of animal health biologicals must show their products to be pure, safe, effective and produced by a consistent method of manufacture as defined under the Virus Serum Toxin Act. Post‑approval monitoring of products is required. Reports of product quality defects, adverse events or unexpected results are maintained and submitted in accordance with the agency requirements.
Environmental Protection Agency.
The main regulatory body in the U.S. for veterinary pesticides is the Environmental Protection Agency (the EPA). The EPA’s Office of Pesticide Programs is responsible for the regulation of most pesticide products applied to animals in accordance with a memorandum of understanding between the FDA and EPA for products that are subject to regulation under both the FFDCA and the Federal Insecticide, Fungicide and Rodenticide Act. All manufacturers of animal health pesticides must show their products will not cause unreasonable adverse effects to man or the environment as stated in the act. Within the U.S., individual state pesticide authorities must, before distribution in that state, also approve pesticide products that are approved by the EPA. Post‑approval monitoring of products is required, with reports provided to the EPA and some state regulatory agencies.
Food Safety Inspection Service.
The FDA is authorized to determine the safety of substances (including “generally recognized as safe” substances, food additives and color additives), as well as prescribe their safe conditions of use. However, although the FDA has the responsibility for determining the safety of substances, the Food Safety and Inspection Service, the public health agency in the USDA, still retains, under the tenets of the Federal Meat Inspection Act and the Poultry Products Inspection Act and their implementing regulations, the authority to determine that new substances and new uses of previously approved substances are suitable for use in meat and poultry products.
Foreign Corrupt Practices Act (FCPA) prohibits U.S. corporations and their representatives from offering, promising, authorizing or making payments to any foreign government official, government staff member, political party or political candidate in an attempt to obtain or retain business abroad. The scope of the FCPA includes interactions with certain healthcare professionals in many countries. Other countries have enacted similar anti‑corruption laws and/or regulations. In some countries in which we operate, the pharmaceutical and life sciences industries are exposed to a high risk of corruption associated with sales to healthcare professionals and institutions. Notwithstanding our reasonable efforts to conduct our operations in material compliance with the FCPA, our international business could expose us to potential liability under the FCPA, which may result in us incurring significant criminal and civil penalties, and to potential liability under the anti‑corruption laws and regulations of other jurisdictions in which we operate. In addition, the costs we may incur in defending against an FCPA investigation could be significant.
Outside of the United States
European Union (EU). We are governed by the following EU regulatory bodies:
The European Medicines Agency (EMA) is a centralized agency of the EU responsible for the scientific evaluation of Veterinary Medicinal Products (VMP) developed by pharmaceutical companies for use in the EU. The agency has a veterinary review section distinct from the medical review section for human products. The Committee for Veterinary Medicinal Products (CVMP) is responsible for scientific review of the submissions for VMP and Immunological Veterinary Medicinal Products. If the CVMP concludes that all requirements for quality, safety and efficacy are met, it issues a positive opinion that is forwarded to the European Commission, who takes the final decision following the European comitology procedure. The centralized marketing authorization (commission decision) of the European Commission is valid in all of the EU. All countries that are not part of the EU but belong to the European Economic Area (EEA), i.e., Norway,
17
Iceland and Liechtenstein, have been part of the scientific assessment done by the CVMP. These countries issue a national marketing approval in accordance with the Commission decision. A series of regulations, directives, guidelines, EU Pharmacopeia Monographs and other legislation provide the requirements for approval in the EU. In general, these requirements are similar to those in the U.S., requiring demonstrated evidence of purity, safety, efficacy and consistency of manufacturing processes.
If approval is sought for products that either cannot or do not need to follow the centralized procedure, approval can also be achieved by national approval in an EEA country agency. This national authorization can be mutually recognized by other EEA countries/EU member states (Mutual Recognition Procedure). In addition, national and mutual recognition can be done in a combined procedure (Decentralized Procedure).
The European Food Safety Authority (EFSA) is the agency of the EU that provides scientific advice and communicates with respect to existing and emerging risks associated with the food chain. Based on EFSA’s mandate, the agency evaluates applications for feed additives, including enzymes and several nutritionals for animals.
The European Chemical Agency (ECHA) is the agency of the EU for the safe use of chemicals. Based on ECHA’s mandate, the agency conducts the evaluation of biocides for the EU.
In regard to Brexit, the EU and the UK are continuing to work on plans for dealing with the withdrawal of the UK from the EU, currently scheduled for March 29, 2019. Post‑separation, the UK has indicated it will look to continue working closely with the EMA, and that existing agreements between the EMA and other countries such as Switzerland, the U.S. and Canada provide a precedent on which the UK could build.
Brazil.
The Ministry of Agriculture, Livestock Production and Supply (MAPA) is the regulatory body in Brazil that is responsible for the regulation and control of pharmaceuticals, biologicals and medicinal feed additives for animal use. MAPA’s regulatory activities are conducted through the Secretary of Agricultural Defense and its Livestock Products Inspection Department. In addition, regulatory activities are conducted at a local level through the Federal Agriculture Superintendence. These activities include the inspection and licensing of both manufacturing and commercial establishments for veterinary products, as well as the submission, review and approval of pharmaceuticals, biologicals and medicinal feed additives. MAPA is one of the most active regulatory agencies in Latin America, having permanent seats at several international animal health forums, such as Codex Alimentarius, World Organization for Animal Health and Committee of Veterinary Medicines for the Americas. MAPA was also recently invited to be a Latin American representative at International Cooperation on Harmonisation of Technical Requirements for Registration of Veterinary Medicinal Products (VICH) meetings. Several normative instructions issued by MAPA have set regulatory trends in Latin America.
Japan.
The Ministry of Agriculture, Forestry and Fishery (MAFF) is the regulatory body in Japan that is responsible for the regulation and control of pharmaceuticals (including biologicals and pesticide/disinfectant) and feed additive/feed for animal use. MAFF’s regulatory activities are conducted through the Livestock & Aquaculture Product Safety Control Division under Consumer Safety Bureau. The animal drug reviews and approvals, reexamination reviews, GxP compliance checks, GxP site inspections and product assay checks (including vaccine national assays) are done by National Veterinary Assay Laboratory (NVAL). MAFF coordinates with other agencies such as Ministry of Health, Labor and Welfare (MHLW) and Food Safety Commission (FSC) to perform various license compliance checks (e.g. marketing authorization holder, manufacturer and oversea site accreditation) and ensure good promotional activities. Routine inspections, antimicrobial feed additive national assays and manufacturing inspections are done by the Food & Agriculture Material Inspection Center. For food animal products, animal drug review is done by NVAL but the human food safety review is done by FSC (ADI establishment and antimicrobial risk assessment) and MHLW (MRL establishment). These three agencies (NVAL, FSC and MHLW) work together to approve food animal products. In addition to those central government agencies, various licenses are delegated to the local municipal government, such as animal drug wholesaler and retailer licenses and feed additive distributor licenses.
China.
The Ministry of Agriculture (MOA) is the regulatory body that is responsible for the regulation and control of pharmaceuticals, biologicals, disinfectants, medicinal feed additives, pesticide and feed/feed additives for animal use. There are three organizations under the MOA that regulate animal health:
The Institute of Veterinary Drug Control is responsible for the evaluation of new applications, renewals, variations, manufacturers, quality methods and tissue residue methods for pharmaceuticals, biologicals, disinfectants and medicinal feed additives.
The feed/feed additive office is responsible for the registration and renewal of feed and feed additives.
18
The pesticide bureau is responsible for the registration and renewal of pesticide products.
Australia.
The Australian Pesticides and Veterinary Medicines Authority (APVMA) is an Australian government statutory authority established in 1993 to centralize the registration of all agricultural and veterinary products into the Australian marketplace. Previously, each state and territory government had its own system of registration. The APVMA assesses applications from companies and individuals seeking registration so they can supply their product to the marketplace. Applications undergo rigorous assessment using the expertise of the APVMA’s scientific staff and drawing on the technical knowledge of other relevant scientific organizations, Commonwealth government departments and state agriculture departments. If the product works as intended and the scientific data confirms that when used as directed on the product label it will have no harmful or unintended effects on people, animals, the environment or international trade, the APVMA will register the product. As well as registering new agricultural and veterinary products, the APVMA reviews older products that have been on the market for a substantial period of time to ensure they still do the job users expect and are safe to use. The APVMA also reviews registered products when particular concerns are raised about their safety and effectiveness. The review of a product may result in confirmation of its registration or it may see registration continue with some changes to the way the product can be used. In some cases, the review may result in the registration of a product being cancelled and the product taken off the market.
Rest of world.
Country‑specific regulatory laws typically have provisions that include requirements for certain labeling, safety, efficacy and manufacturers’ quality control procedures (to assure the consistency of the products), as well as company records and reports. Other countries’ regulatory agencies typically either refer to the FDA, USDA, EU and other international animal health entities, including the World Organization for Animal Health, Codex Alimentarius or VICH (see below), in establishing standards and regulations for veterinary pharmaceuticals and vaccines, or review the quality, safety and effectiveness of the products themselves according to their own national requirements.
Global policy and guidance
Joint FAO/WHO Expert Committee on Food Additives.
The Joint FAO/WHO Expert Committee on Food Additives is an international expert scientific committee that is administered jointly by the Food and Agriculture Organization of the United Nations (FAO) and the World Health Organization (WHO). They provide a risk assessment/safety evaluation of residues of veterinary drugs in animal products, exposure and residue definition and maximum residue limit proposals for veterinary drugs. Similarly, the Joint FAO/WHO Meeting on Pesticide Residues (JMPR) is an international expert scientific group administered jointly by the FAO and WHO. JMPR reviews residues and analytical aspects of the pesticides, estimate the maximum residue levels, review toxicological data and estimate acceptable daily intakes for humans of the pesticides under consideration. Elanco works with these committees to establish acceptable safe levels of residual product in food‑producing animals after treatment with veterinary drugs or pesticides. This in turn enables the calculation of appropriate withdrawal times for our products prior to an animal entering the food chain.
Advertising and promotion review.
Promotion of ethical animal health products is controlled by regulations in many countries. These rules generally restrict advertising and promotion to those claims and uses that have been reviewed and endorsed by the applicable agency. We conduct a review of promotion material for compliance with the local and regional requirements in the markets where we sell animal health products.
Import and Export of Products.
The importation and exportation of animal health products is controlled by regulations in many countries. In some jurisdictions this may include obtaining separate permits or licenses by product or by company or filing notices with applicable regulatory agencies prior to import or export of product. We ensure compliance with local and global regulations in the markets where we import/export our animal health products.
International Cooperation on Harmonization of Technical Requirements for Registration of Veterinary Medicinal Products.
VICH is a trilateral (EU‑Japan‑USA) program launched in 1996 aimed at harmonizing technical requirements for veterinary product registration. Several other countries have obtained observer status, for example, Canada, New Zealand, Australia and South Africa, or are linked to VICH on basis of the VICH Outreach Forum, a VICH initiative with the main objective of providing a basis for wider international harmonization of technical requirements. In addition, the World Organization for Animal Health is an associate member of VICH.
The objectives of the VICH are as follows:
19
Establish and implement harmonized technical requirements for the registration of veterinary medicinal products in the VICH regions, which meet high quality, safety and efficacy standards and minimize the use of test animals and costs of product development.
Provide a basis for wider international harmonization of registration requirements through the VICH Outreach Forum.
Monitor and maintain existing VICH guidelines, taking particular note of the ICH work program and, where necessary, update these VICH guidelines.
Ensure efficient processes for maintaining and monitoring consistent interpretation of data requirements following the implementation of VICH guidelines.
By means of a constructive dialogue between regulatory authorities and industry, provide technical guidance enabling response to significant emerging global issues and science that impact regulatory requirements within the VICH regions.
Employees
As of December 31, 2018, we employed approximately 5,590 full time employees. In addition, we employed approximately 190 fixed‑duration employees, which are individuals hired for a pre‑defined length of time (one to four years). Together, they total approximately 5,780 worldwide. Of the 5,780 employees globally, approximately 2,440 are U.S.‑based and approximately 3,340 are employed in other jurisdictions. Some of these employees are members of unions, works councils, trade associations or are otherwise subject to collective bargaining agreements, including approximately 150 union employees in the U.S. located at our Fort Dodge, Iowa manufacturing/R&D facility. Approximately 40% of our global population is in customer‑facing roles, including but not limited to, traditional sales roles, technical consultants, account managers and commercial and general managers.
Property
We have R&D operations co-located with certain of our manufacturing sites in the U.S. to facilitate the efficient transfer of production processes from our laboratories to manufacturing sites. In addition, we maintain R&D operations at non-manufacturing locations in the U.S., Switzerland, Australia, Brazil and China. As part of the separation, Lilly transferred to us its interest in each of these R&D facilities. Our largest R&D facility is our U.S. R&D site located in Fort Dodge, Iowa, which has approximately 0.3 million square feet.
The address of Elanco’s principal executive offices is currently c/o Elanco, 2500 Innovation Way, Greenfield IN, 46140.
Our global manufacturing network is comprised of 12 manufacturing sites. The largest manufacturing site in our global manufacturing network is our manufacturing site located in Clinton, Indiana, which has approximately 0.7 million square feet. In addition, our global manufacturing network will continue to be supplemented by approximately 100 CMOs. See “Manufacturing and Supply Chain.”
We own or lease various additional properties for other business purposes including office space, warehouses and logistics centers. In addition, under the transitional services agreement, Lilly provides us with continued access to certain of Lilly’s premises currently occupied by our employees for up to two years from the date of the separation.
We believe that our existing properties, as supplemented by CMOs and access to Lilly facilities that are provided under the transitional services agreement, are adequate for our current requirements and for our operations in the near future.
Environmental, Health and Safety
We are subject to various federal, state, local and foreign environmental, health and safety (EHS) laws and regulations. These laws and regulations govern matters such as the emission and discharge of hazardous materials into the ground, air or water; the generation, use, storage, handling, treatment, packaging, transportation, exposure to, and disposal of hazardous and biological materials, including recordkeeping, reporting and registration requirements; and the health and safety of our employees. Due to our operations, these laws and regulations also require it to obtain, and comply with, permits, registrations or other authorizations issued by governmental
20
authorities. These authorities can modify or revoke our permits, registrations or other authorizations and can enforce compliance through fines and injunctions.
Certain environmental laws impose joint and several liabilities, without regard to fault, for cleanup costs on persons who have disposed of or released hazardous substances into the environment, including at third‑party sites or offsite disposal locations, or that currently own or operate (or formerly owned or operated) sites where such a release occurred. We could be subject to liability for the investigation and remediation of legacy environmental contamination caused by historical industrial activity at sites that we own or on which it operates. In addition to clean‑up actions brought by federal, state, local and foreign governmental entities, private parties could raise personal injury or other claims against us due to the presence of, or exposure to, hazardous materials on, from or otherwise relating to such a property.
We have made, and intend to continue to make, necessary expenditures for compliance with applicable EHS laws and regulations. We are also monitoring and investigating environmental contamination from past industrial activity at certain sites. While we cannot predict with certainty our future capital expenditures or operating costs for environmental compliance or the investigation and remediation of contaminated sites, we anticipate having capital and operational expenditures for each of the years ending December 31, 2019 and 2020 for environmental compliance purposes and for the monitoring, investigation or clean‑up of certain past industrial activities as follows:
environmental‑related capital expenditures - $0.7 million; and
other environmental‑related expenditures - $0.7 million.
In connection with past acquisitions and divestitures, we have undertaken certain indemnification obligations that may require us in the future, to conduct or finance environmental cleanups at sites that we no longer own or operate. We have also entered into indemnification agreements pursuant which we are or may be indemnified for various environmental cleanups; however, such indemnities are limited in both time and scope and may be further limited in the presence of new information, or may not be available at all.
Legal Proceedings
We are from time to time subject to claims and litigation arising in the ordinary course of business. These claims and litigation may include, among other things, allegations of violation of U.S. and foreign competition law, labor laws, consumer protection laws and environmental laws and regulations, as well as claims or litigation relating to product liability, intellectual property, securities, breach of contract and tort. We operate in multiple jurisdictions and, as a result, a claim in one jurisdiction may lead to claims or regulatory penalties in other jurisdictions. We intend to vigorously defend against any pending or future claims and litigation, as appropriate.
At this time, in the opinion of our management, the likelihood is remote that the impact of such proceedings, either individually or in the aggregate, would have a material adverse effect on our consolidated results of operations, financial condition or cash flows. However, one or more unfavorable outcomes in any claim or litigation against us could have a material adverse effect for the period in which they are resolved. In addition, regardless of their merits or their ultimate outcomes, such matters are costly, divert management’s attention and may materially adversely affect our reputation, even if resolved in our favor.
Available Information
Our website address is www.elanco.com. On our website, we make available, free of charge, our annual, quarterly and current reports, including amendments to such reports, as soon as reasonably practicable after we electronically file such material with, or furnish such material to, the SEC.
Information relating to corporate governance at Elanco, including our Corporate Governance Guidelines, Code of Conduct, Financial Code of Ethics, Articles of Incorporation, Bylaws, Committee Charters; information concerning our executive officers and members of our board of directors; and ways to communicate are available on our website. We will provide any of the foregoing information without charge upon written request to Elanco’s Corporate Secretary, Elanco, 2500 Innovation Way, Greenfield, Indiana 46140. Information relating to shareholder services is also available on our website.
Information contained on our website is not part of, or incorporated by reference, in this Annual Report on Form 10-K.
21
22
Item 1A. Risk Factors
Investing in our common stock involves a high degree of risk. You should consider carefully the following risks, together with all the other information in this report, including our consolidated and combined financial statements and notes thereto, before you invest in our common stock. If any of the following risks actually materializes, our business, financial condition and results of operations could be materially adversely affected. As a result, the trading price of our common stock could decline and you could lose part or all of your investment.
Risks Related to Elanco
The animal health industry is highly competitive.
The animal health industry is highly competitive. Our competitors include standalone animal health businesses, the animal health businesses of large pharmaceutical companies, specialty animal health businesses and companies that mainly produce generic products. We believe many of our competitors are conducting R&D activities in areas served by our products and in areas in which we are developing products. Several new start
‑
up companies also compete in the animal health industry. We also face competition from manufacturers of drugs globally, as well as producers of nutritional health products. These competitors may have access to greater financial, marketing, technical and other resources. As a result, they may be able to devote more resources to developing, manufacturing, marketing and selling their products, initiating or withstanding substantial price competition or more readily taking advantage of acquisitions or other opportunities. Further, consolidation in the animal health industry could result in existing competitors realizing additional efficiencies or improving portfolio bundling opportunities, thereby potentially increasing their market share and pricing power, which could lead to a decrease in our revenue and profitability and an increase in competition. For example, many of our competitors have relationships with key distributors and, because of their size, the ability to offer attractive pricing incentives, which may negatively impact or hinder our relationships with these distributors. In addition to competition from established market participants, new entrants to the animal health medicines and vaccines industry could substantially reduce our market share, render our products obsolete or disrupt our business model.
To the extent that any of our competitors are more successful with respect to any key competitive factor, or we are forced to reduce, or are unable to raise, the price of any of our products in order to remain competitive, our business, financial condition and results of operations could be materially adversely affected. Competitive pressure could arise from, among other things, more favorable safety and efficacy product profiles, limited demand growth or a significant number of additional competitive products being introduced into a particular market, price reductions by competitors, the ability of competitors to capitalize on their economies of scale, the ability of competitors to produce or otherwise procure animal health products at lower costs than us and the ability of competitors to access more or newer technology than us.
Disruptive innovation and advances in veterinary medical practices, animal health technologies and alternatives to animal
‑
derived protein, could negatively affect the market for our products.
The markets for our products are regularly impacted by the introduction and/or broad market acceptance of newly‑developed or alternative products that address the diseases and conditions for which we sell products, including “green” or “holistic” health products, specially bred disease‑resistant animals or replacements for meat, milk, eggs or fish from alternative natural or synthetic sources. For example, the market for our companion animal therapeutics has been particularly affected by innovation in new molecules and delivery formulations in recent years. Technological breakthroughs by others may render obsolete our products and reduce or eliminate the market for our products. Introduction or acceptance of competing animal health products and innovation or disruptive protein alternatives could materially adversely affect our business, financial condition and results of operations.
Regulatory restrictions and bans on the use of antibiotics and productivity products in food animals, as well as changing market demand, may continue to negatively affect demand for certain of our food animal products.
Over the past few years, our operational results have been, and will continue to be, affected by regulations and changing market demand. In certain markets, including the U.S., sales of certain of our food animal products have been negatively affected by an increase in consumer sentiment for proteins and dairy products produced without the use of antibiotics or other products intended to increase animal production.
23
There are two classes of antibiotics used in animal health: shared
‑
class, or medically important, antibiotics, which are used to treat infectious disease caused by pathogens that occur in both humans and animals; and animal
‑
only antibiotics, which are used to treat infectious disease caused by pathogens that occur in animals only. See “Business of Elanco - Products - Antibiotics.” Concerns that the use of antibiotics in food animal production may lead to increased antibiotic resistance of human pathogens have resulted in increased regulation and changing market demand. In December 2013, the FDA announced final guidance establishing procedures for the voluntary phase
‑
out in the U.S. over a three
‑
year period of the use of shared
‑
class antibiotics in animal feed or water for growth promotion in food animal production. The guidance allows for continued use of shared
‑
class antibiotics in food
‑
producing animals under the supervision of a veterinarian for treatment, control and, under certain circumstances, for prevention of disease. The FDA indicated that it took this action to help preserve the efficacy of shared
‑
class antibiotics to treat infections in humans. As part of those efforts, stricter guidelines governing the administration of shared
‑
class antibiotics have recently come into effect. As of January 1, 2017, under the FDA’s guidance and the related rule known as the Veterinary Feed Directive, the use of shared
‑
class antibiotics in the water or feed of food
‑
producing animals requires written authorization by a licensed veterinarian. In addition, other countries in which we sell or plan to sell our products, such as France and Vietnam, have passed restrictions or bans on antibiotic use. Other countries have placed restrictions or bans on the use of specific antibiotics in certain food
‑
producing animals, regardless of the route of administration (in feed or injectable).
From 2015 to 2018, our revenue from shared
‑
class antibiotics declined at a CAGR of 6%, excluding the impact of foreign exchange rates. This was driven primarily by changing regulations in many markets, including the Veterinary Feed Directive, as well as changing market demand and our tiered approach to antibiotic stewardship, which included removing growth promotion from labels and requiring veterinary oversight in the U.S. and other markets. Globally, during 2018, our revenue from shared
‑
class antibiotics declined 2%, excluding the impact of foreign exchange rates, and represented 12% (4% from sales in the U.S. and 8% from sales outside the U.S.) of total revenue, down from 16% in 2015. From 2015 to 2018, our revenue from animal
‑
only antibiotics grew at a CAGR of 5%, excluding the impact of foreign exchange rates, driven by sales outside the U.S., which offset a slight decline in the U.S. Globally, during 2018, our revenue from animal
‑
only antibiotics grew 8%, excluding the impact of foreign exchange rates, and represented 25% of total revenue, up from 23% in 2015. In 2018, 87% of our revenue from animal
‑
only antibiotics resulted from the sale of ionophores. Ionophores are a special class of animal
‑
only antimicrobials, and because of their animal
‑
only designation, mode of action and spectrum of activity, their use has not to date been impacted by regulations or changing market demand in many markets outside of the U.S.
The impact of changes in regulations and market preferences regarding the use of antibiotics in food animals could have a material adverse effect on our business, financial condition and results of operations. If there is an increased public perception that consumption of food derived from animals that utilize our products poses a risk to human health, there may be a further decline in the production of those food products and, in turn, demand for our products. In addition, antibiotic resistance concerns will likely result in additional restrictions or bans, expanded regulations or public pressure to further reduce the use of antibiotics in food animals, increased demand for antibiotic
‑
free protein, or changes in the market acceptance or regulatory treatment of ionophores, any of which could materially adversely affect our business, financial condition and results of operations.
In addition, our revenue has been impacted by regulatory changes in China and other markets restricting the use of productivity products, such as those containing ractopamine, in food animals. This has resulted in many U.S. food producers who access such markets eliminating their use of ractopamine. Our FA Ruminants & Swine products
Optaflexx
and
Paylean
contain ractopamine. If more producers decide to access such markets or additional markets restrict the use of ractopamine or other productivity products, our business, financial condition and results of operations could be materially adversely affected.
Generic products may be viewed as more cost
‑
effective than our products.
We face competition from products produced by other companies, including generic alternatives to our products. We depend on patents and regulatory data exclusivity periods to provide us with exclusive marketing rights for some of our products. Patents for individual products expire at different times based on the date of the patent filing (or sometimes the date of patent grant) and the legal term of patents in the jurisdictions where such patents are obtained. The extent of protection afforded by our patents varies from jurisdiction to jurisdiction and is limited by the scope of the claimed subject matter of our patents, the term of the patent and the availability and enforcement of legal remedies in the applicable jurisdiction. In 2018, approximately 72% of our revenue was from products that did not have patent protection, including revenue from some of our top products such as
Rumensin
,
Maxiban
,
Denagard
and
Tylan Premix
. Other products are protected by patents that expire over the next several years. For
24
example, certain patents related to
Trifexis
expire as early as 2020 in the U.S., 2021 in Japan and 2025 in European territories. As the patents for a brand name product expire, competitors may begin to introduce generic or other alternatives, and as a result, we may face competition from lower
‑
priced alternatives to many of our products. For example, we have experienced significant competitive headwinds from generic ractopamine in the U.S. In the third quarter of 2013, a large established animal health company received U.S. approval for generic ractopamine. U.S. revenue from
Optaflexx
, our ractopamine beef product, has declined at a CAGR of 24% from 2015 to 2018 as a result of generic competition and international regulatory restrictions. We may face similar competition in the future for existing products that do not benefit from exclusivity, including
Rumensin
, which has not benefitted from patent protection in the U.S. for over 20 years, or for existing products with material patents expiring in the future. See “Business of Elanco - Intellectual Property.”
Generic competitors are becoming more aggressive in terms of launching products before patent rights expire, and, because of attractive pricing, sales of generic products are an increasing percentage of overall animal health sales in certain regions. Although the impact of generic competition in the animal health industry to date has not typically mirrored that seen in human health, product pricing and the impact of generic competition in the future may more closely mirror human health as a result of changes in industry dynamics, such as channel expansion, consolidation, an increase in the availability and use of pet insurance and the potential for generic competition by established animal health businesses. If animal health customers increase their use of new or existing generic products, our business, financial condition and results of operations could be materially adversely affected.
We may not successfully implement our business strategies or achieve targeted cost efficiencies and gross margin improvements.
We are pursuing strategic initiatives that management considers critical to our long
‑
term success, including, but not limited to: improving manufacturing processes, reducing our manufacturing footprint, achieving lean initiatives, consolidating our CMO network, strategically insourcing projects, pursuing cost savings opportunities with respect to raw materials through a new procurement process and improving the productivity of our sales force. We may pursue additional strategic initiatives in the future to improve gross margins and achieve our targeted cost efficiencies. We also have acquired or partnered with a number of smaller animal health businesses, and we intend to continue to do so in the future. There are significant risks involved with the execution of these initiatives, including significant business, economic and competitive uncertainties, many of which are outside of our control. Accordingly, we may not succeed in implementing these strategic initiatives. Realizing the anticipated benefits from these initiatives, if any benefits are achieved at all, may take several years. We may be unable to achieve our targeted cost efficiencies and gross margin improvements. Additionally, we may have insufficient access to capital to fund investments in strategic initiatives, or our business strategy may change from time to time, which could delay our ability to implement initiatives that we believe are important to our business.
Consolidation of our customers and distributors could negatively affect the pricing of our products.
Third
‑
party distributors, veterinarians and food animal producers are our primary customers. In recent years, there has been a trend towards the concentration of veterinarians in large clinics and hospitals. In addition, food animal producers, particularly swine and poultry producers, and our distributors have seen recent consolidation in their industries. Furthermore, we have seen the expansion of larger cross
‑
border corporate customers and an increase in the consolidation of buying groups (cooperatives of veterinary practices that leverage volume to pursue discounts from manufacturers). The pace of consolidation and structure of markets varies greatly across geographies. If these trends towards consolidation continue, our customers could attempt to improve their profitability by leveraging their buying power to obtain favorable pricing. The resulting decrease in our prices could have a material adverse effect on our business, financial condition and results of operations.
An outbreak of infectious disease carried by food animals could negatively affect the demand for, and sale and production of, our food animal products.
Sales of our food animal products could be materially adversely affected by the outbreak of disease carried by food animals, which could lead to the widespread death or precautionary destruction of food animals as well as the reduced consumption and demand for animal protein. In addition, outbreaks of disease carried by food animals may reduce regional or global sales of particular animal
‑
derived food products or result in reduced exports of such products, either due to heightened export restrictions or import prohibitions, which may reduce demand for our food animal products due to reduced herd or flock sizes.
In recent years, outbreaks of various diseases, including avian influenza, foot
‑
and
‑
mouth disease, bovine spongiform encephalopathy (otherwise known as BSE or “mad cow” disease) and porcine epidemic diarrhea virus (otherwise known as PEDV), have negatively impacted sales of our animal health products. The discovery of additional cases of any of these, or new, diseases may result in additional restrictions on animal protein, reduced
25
herd or flock sizes, or reduced demand for animal protein, any of which may have a material adverse effect on our business, financial condition and results of operations. In addition, the outbreak of any highly contagious disease near our main production sites could require us to immediately halt production of our products at such sites or force us to incur substantial expenses in procuring raw materials or products elsewhere.
Our R&D, acquisition and licensing efforts may fail to generate new products or expand the use of our existing products.
Our future success depends on both our existing product portfolio and our pipeline of new products, including new products that we may develop through joint ventures and products that we are able to obtain through license or acquisition. We commit substantial effort, funds and other resources to R&D, both through our own dedicated resources and through collaborations with third parties.
We may be unable to determine with accuracy when or whether any of our products now under development will be approved or launched, or we may be unable to develop, license or otherwise acquire product candidates or products. In addition, we cannot predict whether any products, once launched, will be commercially successful or will achieve sales and revenue that are consistent with our expectations. The animal health industry is subject to regional and local trends and regulations and, as a result, products that are successful in some markets may not achieve similar success when introduced into other markets. Furthermore, the timing and cost of our R&D may increase, and our R&D may become less predictable as, among other things, regulations applicable to our industry may make it more time
‑
consuming and/or costly to research, develop and register products. If we are unable to generate new products or expand the use of our existing products, our business, financial condition and results of operations will be materially adversely affected. For example, between 2015 and 2017, prior to our February 2018 launch of
Credelio
in the U.S., we experienced an innovation lag in the companion animal parasiticide space. In the absence of a competitive combined oral flea and tick product, our U.S. companion animal parasiticide portfolio revenue declined 15% in 2017, excluding the impact on revenue resulting from a reduction in inventory levels within our distribution channel.
In addition, some of our growth has occurred through Lilly’s acquisitions, including Novartis Animal Health, Lohmann Animal Health, Janssen Animal Health and the BI Vetmedica U.S. vaccines portfolio. However, following the separation, we no longer benefit from Lilly’s scale, capital base and financial strength.
We had losses in recent periods.
In recent periods, we have incurred net losses, as reported on a combined basis, including a net loss for the years ended December 31, 2017 and 2016 of $310.7 million, and $47.9 million, respectively. See “Management’s Discussion and Analysis of Financial Condition and Results of Operations.” We could continue to incur asset impairment, restructuring and other special charges and could report losses in the future. We also expect to continue to incur substantial expenditures to develop, manufacture and market our products and implement our business strategies. We may encounter unforeseen expenses, difficulties, complications, delays, adverse events and other unknown factors that may materially adversely affect our business.
The misuse or off
‑
label use of our products may harm our reputation or result in financial or other damages.
Our products have been approved for use under specific circumstances for the treatment of certain diseases and conditions in specific species. There may be increased risk of product liability claims if veterinarians, food animal producers, pet owners or others attempt to use our products off
‑
label, including the use of our products in species (including humans) for which they have not been approved. Furthermore, the use of our products for indications other than those for which our products have been approved may not be effective, which could harm our reputation and lead to an increased risk of litigation. If we are deemed by a governmental or regulatory agency to have engaged in the promotion of any of our products for off
‑
label use, such agency could request that we modify our training or promotional materials and practices, and we could be subject to significant fines and penalties, and the imposition of these sanctions could also affect our reputation and position within the industry. Any of these events could materially adversely affect our business, financial condition and results of operations.
Animal health products are subject to unanticipated safety, quality or efficacy concerns, which may harm our reputation.
Unanticipated safety, quality or efficacy concerns arise from time to time with respect to animal health products, whether or not scientifically or clinically supported, leading to product recalls, withdrawals or suspended or declining sales, as well as product liability and other claims.
26
Regulatory actions based on these types of safety, quality or efficacy concerns could impact all, or a significant portion, of a product’s sales and could, depending on the circumstances, materially adversely affect our results of operations.
In addition, since we depend on positive perceptions of the safety, quality and efficacy of our products, and animal health products generally, by food producers, veterinarians and pet owners, any concern as to the safety, quality or efficacy of our products, whether actual or perceived, may harm our reputation. These concerns and the related harm to our reputation could materially adversely affect our business, financial condition and results of operations, regardless of whether such reports are accurate.
Our business may be negatively affected by weather conditions and the availability of natural resources.
The animal health industry and demand for many of our products in a particular region are affected by weather conditions, varying weather patterns and weather
‑
related pressures from pests, such as ticks. As a result, we may experience regional and seasonal fluctuations in our results of operations.
Food animal producers depend on the availability of natural resources, including large supplies of fresh water. Their animals’ health and their ability to operate could be adversely affected if they experience a shortage of fresh water due to human population growth or floods, droughts or other weather conditions. In the event of adverse weather conditions or a shortage of fresh water, veterinarians or food animal producers may purchase less of our products.
Further, heat waves may cause stress in animals and lead to increased vulnerability to disease, reduced fertility rates and reduced milk production. Droughts may threaten pasture and feed supplies by reducing the quality and amount of forage available to grazing livestock, while climate change may increase the prevalence of parasites and diseases that affect food animals. Adverse weather conditions may also have a material impact on the aquaculture business. Changes in water temperatures could affect the timing of reproduction and growth of various fish species, as well as trigger the outbreak of certain water borne diseases.
In addition, veterinary hospitals and practitioners depend on visits from, and access to, the animals under their care. Veterinarians’ patient volume and ability to operate could be adversely affected if they experience prolonged snow, ice or other severe weather conditions, particularly in regions not accustomed to sustained inclement weather.
We may not be able to realize the expected benefits of our investments in emerging markets and are subject to certain risks due to our presence in emerging markets, including political or economic instability and failure to adequately comply with legal and regulatory requirements.
We have taken steps to increase our presence in select emerging markets, including by expanding our sales organization and product offerings in these markets. Failure to continue to maintain and expand our business in emerging markets could materially adversely affect our business, financial condition and results of operations.
In addition, certain emerging markets have legal systems that are less developed. Other jurisdictions in which we conduct business may have legal and regulatory regimes that differ materially from U.S. laws and regulations, are continuously evolving or do not include sufficient judicial or administrative guidance to interpret such laws and regulations. Compliance with diverse legal requirements is costly and time
‑
consuming and requires significant resources. Violations or possible violations of applicable laws or regulations by our employees may result in investigation costs, potential penalties and other related costs, which in turn could negatively affect our reputation and our results of operations.
Some countries within emerging markets may be especially vulnerable to periods of local, regional or global economic, political or social instability or crisis. For example, our sales in certain emerging markets have suffered from extended periods of disruption due to natural disasters. Furthermore, we have also experienced lower than expected sales in certain emerging markets due to local, regional and global restrictions on banking and commercial activities in those countries. In addition, certain emerging markets have currencies that fluctuate substantially, which may impact our financial performance. For these reasons, among others, doing business within emerging markets carries significant risks.
27
Modification of foreign trade policy may harm our food animal product customers.
Changes in laws, agreements and policies governing foreign trade in the territories and countries where our customers do business could negatively impact such customers’ businesses and adversely affect our results of operations. A number of our customers, particularly U.S.
‑
based food animal producers, benefit from free trade agreements, such as the North American Free Trade Agreement (NAFTA). In November 2018, the U.S. negotiated a new trade deal with Canada and Mexico known as the United States-Mexico-Canada-Agreement (USMCA), aimed at re
‑
negotiating and updating the terms of NAFTA. The USMCA still requires ratification by legislative bodies in all three countries before it can take effect. If the USMCA is not ratified and the U.S. were to withdraw from or materially modify NAFTA or other international trade agreements to which it is a party or if the U.S. were to engage in trade disputes or the imposition of tariffs, our customers could be harmed, and as a result, our business, financial condition and results of operations could be materially adversely affected.
Our business is subject to risk based on global economic conditions.
Macroeconomic business and financial disruptions could have a material adverse effect on our business, financial condition and results of operations. Certain of our customers and suppliers could be affected directly by an economic downturn and could face constraints on the availability of credit or decreased cash flow that could give rise to payment delays, increased credit risk, bankruptcies and other financial hardships that could decrease the demand for our products or hinder our ability to collect amounts due from our customers. If one or more of our large customers, including distributors, discontinues or modifies their relationship with us as a result of economic conditions or otherwise, our business, financial condition and results of operations may be materially adversely affected. In addition, economic concerns may cause some pet owners to forgo or defer visits to veterinary practices or could reduce their willingness to treat pet health conditions or to continue to own a pet. Furthermore, our exposure to credit and collectability risk is higher in certain international markets and our ability to mitigate such risks may be limited. Our procedures intended to monitor and limit our exposure to credit and collectability risk may not effectively limit such risk and avoid losses.
Our results of operations are dependent upon the success of our top products.
If any of our top products experience issues, such as disruptive innovations or the introduction of more effective competitive products, negative publicity, changes to veterinarian or customer preferences, loss of patent protection, material product liability litigation, new or unexpected side effects, manufacturing disruptions and/or regulatory proceedings, our revenue could be negatively impacted, perhaps significantly. Our top five products,
Rumensin
,
Trifexis
,
Maxiban
,
Denagard
and
Interceptor Plus
, contributed approximately 31% of our revenue in 2018. Any issues with these top products, particularly
Rumensin
, which contributed approximately 11% of our revenue in 2018, could have a material adverse effect on our business, financial condition and results of operations.
Our business is subject to risk based on customer exposure to rising costs and reduced customer income.
Feed, fuel, transportation and other key costs for food animal producers may increase or animal protein prices or sales may decrease. Either of these trends could cause deterioration in the financial condition of our food animal product customers, potentially inhibiting their ability to purchase our products or pay us for products delivered. Our food animal product customers may offset rising costs by reducing spending on our food animal products, including by switching to lower
‑
cost alternatives to our products. In addition, concerns about the financial resources of pet owners could cause veterinarians to alter their treatment recommendations in favor of lower
‑
cost alternatives to our products, which could result in a decrease in sales of our companion animal products, especially in developed countries where there is a higher rate of pet ownership. Rising costs or reduced income for our customers could have a material adverse effect on our business, financial condition and results of operations.
For our companion animal products, increased use of alternative distribution channels, or changes within existing distribution channels, could negatively impact our market share, margins and distribution of our products.
In most markets, pet owners typically purchase their animal health products directly from veterinarians. However, pet owners increasingly have the option to purchase animal health products from sources other than veterinarians, such as online retailers, “big
‑
box” retail stores or other over
‑
the
‑
counter distribution channels. This trend has been demonstrated by the significant shift away from the veterinarian distribution channel in the sale of flea and tick products in recent years. Pet owners also could decrease their reliance on, and visits to, veterinarians as they rely
28
more on internet
‑
based animal health information. Because we market our companion animal prescription products primarily through the veterinarian distribution channel, any decrease in visits to veterinarians by pet owners could reduce our market share for such products and materially adversely affect our business, financial condition and results of operations. In addition, pet owners may substitute human health products for animal health products if human health products are deemed to be lower
‑
cost alternatives.
Legislation has also been proposed in the U.S., and may be proposed in the U.S. or abroad in the future, that could impact the distribution channels for our companion animal products. For example, such legislation may require veterinarians to provide pet owners with written prescriptions and disclosure that the pet owner may fill prescriptions through a third party, which may further reduce the number of pet owners who purchase their animal health products directly from veterinarians. Such requirements may lead to increased use of generic alternatives to our products or the increased substitution of our companion animal products with other animal health products or human health products if such other products are deemed to be lower
‑
cost alternatives. Many states already have regulations requiring veterinarians to provide prescriptions to pet owners upon request and the American Veterinary Medical Association has long
‑
standing policies in place to encourage this practice.
Over time, these and other competitive conditions may increase our use of online retailers, “big
‑
box” retail stores or other over
‑
the
‑
counter distribution channels to sell our companion animal products. We may not be adequately prepared or able to distribute our companion animal products if an increased portion of our sales occur through these channels. Also, we may realize lower margins on sales through these distribution channels than we do on sales through veterinarians. Any of these events could materially adversely affect our business, financial condition and results of operations.
In addition, if one or more of our companion animal distributors discontinues or modifies their relationship with us, our business, financial condition and results of operations may be materially adversely affected. For example, in 2017, a change in our U.S. inventory management practices resulted in a revenue lag as existing inventory was sold down, which management estimates decreased our revenue by approximately $35 million.
Loss of our executive officers or other key personnel could disrupt our operations.
We depend on the efforts of our executive officers and other key personnel. Our executive officers and other key personnel are not currently, and are not expected to be, subject to non
‑
compete provisions. In addition, we have not entered into employment agreements with our executive officers or other key personnel. Any unplanned turnover or our failure to develop an adequate succession plan for one or more of our executive officers or other key personnel positions could deplete our institutional knowledge base and erode our competitive advantage. The loss or limited availability of the services of one or more of our executive officers or other key personnel, or our inability to recruit and retain qualified executive officers or other key personnel in the future, could, at least temporarily, have a material adverse effect on our business, financial condition and results of operations.
We may be required to write down goodwill or identifiable intangible assets.
Under U.S. GAAP, if we determine goodwill or identifiable intangible assets are impaired, we will be required to write down these assets and record a non
‑
cash impairment charge. As of December 31, 2018, we had recorded on our balance sheet goodwill of $3.0 billion and identifiable intangible assets of $2.5 billion. Identifiable intangible assets consist primarily of marketed products acquired or licensed from third parties, licensed platform technologies that have alternative future uses in R&D, manufacturing technologies, and customer relationships from business combinations. We also have indefinite
‑
lived intangible assets, which consist of acquired in
‑
process R&D projects from business combinations that are subject to impairment and non
‑
cash impairment charges.
Determining whether an impairment exists and the amount of the potential impairment involves quantitative data and qualitative criteria that are based on estimates and assumptions requiring significant management judgment. Future events or new information may change management’s valuation of an intangible asset in a short amount of time. The timing and amount of impairment charges recorded in our consolidated and combined statements of operations and write
‑
downs recorded in our consolidated and combined balance sheets could vary if our management’s conclusions change. Any impairment of goodwill or identifiable intangible assets could have a material adverse effect on our business, financial condition and results of operations.
29
As a standalone public company, we may expend additional time and resources to comply with rules and regulations that did not previously apply to us, and failure to comply with such rules may lead investors to lose confidence in our financial data.
As a standalone public company, we are subject to the reporting requirements of the Exchange Act, the Sarbanes
‑
Oxley Act, the Dodd
‑
Frank Wall Street Reform and Consumer Protection Act and regulations of the NYSE. We have established all of the procedures and practices required as a subsidiary of Lilly, but we must continue to implement others as a separate, standalone public company. Continuing to establish and expand such procedures and practices will increase our legal, accounting and financial compliance costs, will make some activities more difficult, time
‑
consuming and costly and could be burdensome on our personnel, systems and resources. We are devoting and will continue to devote significant resources to address these public company requirements, including compliance programs and investor relations, as well as our financial reporting obligations. As a result, we have and will continue to incur significant legal, accounting and other expenses that we did not previously incur to comply with these rules and regulations. Furthermore, the need to establish the corporate infrastructure necessary for a standalone public company may divert some of our management’s attention from operating our business and implementing our strategy. However, the measures we take may not be sufficient to satisfy our obligations as a public company. In addition, we cannot predict or estimate the amount of additional costs we may incur in order to comply with these requirements.
We have made, and will continue to make, changes to our internal controls and procedures for financial reporting and accounting systems to meet our reporting obligations. In particular, as a public company, our management is required to conduct an annual evaluation of our internal controls over financial reporting and include a report of management on our internal controls in our annual reports on Form 10
‑
K. Under current rules, we will be subject to these requirements beginning with our annual report on Form 10
‑
K for the year ending December 31, 2019. In addition, we will be required to have our independent registered public accounting firm attest to the effectiveness of our internal controls over financial reporting pursuant to Auditing Standard No. 5 beginning with our annual report on Form 10
‑
K for the year ending December 31, 2019. If we are unable to conclude that we have effective internal controls over financial reporting, or if our registered public accounting firm is unable to provide us with an attestation and an unqualified report as to the effectiveness of our internal controls over financial reporting, investors could lose confidence in the reliability of our financial statements, which could result in a decrease in the value of our common stock.
Our R&D relies on evaluations of animals, which may become subject to bans, additional restrictive regulations or increased attention from activism movements.
As an animal health medicines and vaccines business, we are required to evaluate the effect of our existing and new products in animals in order to register such products. Animal testing in certain industries has been the subject of controversy and adverse publicity. Some organizations and individuals have attempted to ban animal testing or encourage the adoption of new regulations applicable to animal testing. To the extent that the activities of such organizations and individuals are successful, our R&D, and by extension our business, financial condition and results of operations, could be materially adversely affected. In addition, negative publicity about us or our industry could harm our reputation.
Manufacturing problems and capacity imbalances may cause product launch delays, inventory shortages, recalls or unanticipated costs.
In order to sell our products, we must be able to produce and ship sufficient quantities to our customers. We own and operate 12 internal manufacturing sites located in nine countries. We also employ a network of approximately 100 third
‑
party CMOs. Many of our products involve complex manufacturing processes and are sole
‑
sourced from certain manufacturing sites.
Minor deviations in our manufacturing or logistical processes, such as temperature excursions or improper package sealing, could result, and have in the past resulted in, delays, inventory shortages, unanticipated costs, product recalls, product liability and/or regulatory action. In addition, a number of factors could cause production interruptions, including:
|
•
|
the failure of us or any of our vendors or suppliers, including logistical service providers, to comply with applicable regulations and quality assurance guidelines;
|
30
|
•
|
mislabeling;
|
|
•
|
construction delays;
|
|
•
|
equipment malfunctions;
|
|
•
|
shortages of materials;
|
|
•
|
labor problems;
|
|
•
|
natural disasters;
|
|
•
|
power outages;
|
|
•
|
criminal and terrorist activities;
|
|
•
|
changes in manufacturing production sites and limits to manufacturing capacity due to regulatory requirements, changes in types of products produced, shipping distributions or physical limitations; and
|
|
•
|
the outbreak of any highly contagious diseases near our production sites.
|
These interruptions could result in launch delays, inventory shortages, recalls, unanticipated costs or issues with our agreements under which we supply third parties, which may materially adversely affect our business, financial condition and results of operations.
Our manufacturing network may be unable to meet the demand for our products or we may have excess capacity if demand for our products changes. The unpredictability of a product’s regulatory or commercial success or failure, the lead time necessary to construct highly technical and complex manufacturing sites and shifting customer demand (including as a result of market conditions or entry of branded or generic competition) increase the potential for capacity imbalances. In addition, construction of sites is expensive, and our ability to recover costs will depend on the market acceptance and success of the products produced at the new sites, which is uncertain.
We rely on third parties to provide us with materials and services and are subject to increased labor and material costs and potential disruptions in supply.
The materials used to manufacture our products may be subject to availability constraints and price volatility caused by changes in demand, weather conditions, supply conditions, government regulations, economic climate and other factors. In addition, labor costs may be subject to volatility caused by the supply of labor, governmental regulations, economic climate and other factors. Increases in the demand for, availability or the price of, materials used to manufacture our products and increases in labor costs could increase the costs to manufacture our products, result in product delivery delays or shortages, and impact our ability to launch new products on a timely basis or at all. We may not be able to pass all or a material portion of any higher material or labor costs on to our customers, which could materially adversely affect our business, financial condition and results of operations.
We may be unable to meet demand for certain of our products if any of our third
‑
party suppliers cease or interrupt operations, fail to renew contracts with us or otherwise fail to meet their obligations to us.
We may incur substantial costs and receive adverse outcomes in litigation and other legal matters.
Our business, financial condition and results of operations could be materially adversely affected by unfavorable results in pending or future litigation matters. These matters may include, among other things, allegations of violation of U.S. and foreign competition law, labor laws, consumer protection laws and environmental laws and regulations, as well as claims or litigation relating to product liability, intellectual property, securities, breach of contract and tort. In addition, changes in the interpretations of laws and regulations to which we are subject, or in legal standards in one or more of the jurisdictions in which we operate, could increase our exposure to liability. For example, in the U.S., attempts have been made to allow damages for emotional distress and pain and suffering in connection with the loss of, or injury to, a companion animal. If such attempts were successful, our exposure with respect to product liability claims could increase materially.
Litigation matters, regardless of their merits or their ultimate outcomes, are costly, divert management’s attention and may materially adversely affect our reputation and demand for our products. We cannot predict with certainty the eventual outcome of pending or future litigation matters. An adverse outcome of litigation or legal matters could result in us being responsible for significant damages. Any of these negative effects resulting from litigation matters could materially adversely affect our business, financial condition and results of operations.
31
Our business is subject to substantial regulation.
As a global company, we are subject to various state, federal and international laws and regulations, including regulations relating to the development, quality assurance, manufacturing, importation, distribution, marketing and sale of our products. Changes in applicable federal, state, local and foreign laws and regulations could have a material adverse effect on our business, financial condition and results of operations. In addition, our manufacturing facilities, including the manufacturing facilities operated by our CMOs, are subject to periodic inspections by regulatory agencies. An inspection may report conditions or practices that indicate possible violations of regulatory requirements. Our failure, or the failure of third parties we rely on, including CMOs, to comply with these regulatory requirements, allegations of such non
‑
compliance or the discovery of previously unknown problems with a product or manufacturer could result in, among other things, inspection observation notices, warning letters or similar regulatory correspondence, fines, a partial or total shutdown of production in one or more of our facilities while an alleged violation is remediated, withdrawals or suspensions of current products from the market, and civil or criminal prosecution, as well as decreased sales as a result of negative publicity and product liability claims. Any one of these consequences could materially adversely affect our business, financial condition and results of operations.
In addition, we will not be able to market new products unless and until we have obtained all required regulatory approvals in each jurisdiction where we propose to market those products. Even after a product reaches market, we may be subject to re
‑
review and may lose our approvals. Our failure to obtain approvals, delays in the approval process, or our failure to maintain approvals in any jurisdiction, may prevent us from selling products in that jurisdiction until approval or re
‑
approval is obtained, if ever.
The illegal distribution and sale by third parties of counterfeit or illegally compounded versions of our products or of stolen, diverted or relabeled products could have a negative impact on our reputation and business.
Third parties may illegally distribute and sell counterfeit or illegally compounded versions of our products that do not meet the exacting standards of our development, manufacturing and distribution processes. Counterfeit or illegally compounded medicines pose a significant risk to animal health and safety because of the conditions under which they are manufactured and the lack of regulation of their contents. Counterfeit or illegally compounded products are frequently unsafe or ineffective and can be potentially life
‑
threatening to animals. Our reputation and business could suffer harm as a result of counterfeit or illegally compounded products which are alleged to be equivalent and/or which are sold under our brand name. In addition, products stolen or unlawfully diverted from inventory, warehouses, plants or while in transit, which are not properly stored or which have an expired shelf life and which have been repackaged or relabeled and which are sold through unauthorized channels, could adversely impact animal health and safety, our reputation and our business. Public loss of confidence in the integrity of vaccines and/or pharmaceutical products as a result of counterfeiting, illegal compounding or theft could have a material adverse effect on our business, financial condition and results of operations.
We are subject to complex environmental, health and safety laws and regulations.
We are subject to various federal, state, local and foreign environmental, health and safety laws and regulations. These laws and regulations govern matters such as the emission and discharge of hazardous materials into the ground, air or water; the generation, use, storage, handling, treatment, packaging, transportation, exposure to and disposal of hazardous and biological materials, including recordkeeping, reporting and registration requirements; and the health and safety of our employees. Due to our operations, these laws and regulations also require us to obtain, and comply with, permits, registrations or other authorizations issued by governmental authorities. These authorities can modify or revoke our permits, registrations or other authorizations and can enforce compliance through fines and injunctions.
Given the nature of our business, we have incurred, are currently incurring and may in the future incur liabilities for the investigation and remediation of contaminated land under the U.S. Comprehensive Environmental Response, Compensation and Liability Act of 1980, as amended, or under other federal, state, local and foreign environmental cleanup laws, with respect to our current or former sites, adjacent or nearby third
‑
party sites, or offsite disposal locations. We could be subject to liability for the investigation and remediation of legacy environmental contamination caused by historical industrial activity as sites that we own or on which we operate. The costs associated with future cleanup activities that we may be required to conduct or finance could be material. Additionally, we may become liable to third parties for damages, including personal injury, property damage and
32
natural resource damages, resulting from the disposal or release of hazardous materials into the environment. Such liability could materially adversely affect our business, financial condition and results of operations.
Furthermore, regulatory agencies are showing increasing concern over the impact of animal health products and food animal operations on the environment. This increased regulatory scrutiny has in the past and may in the future necessitate that additional time and resources be spent to address these concerns in both new and existing products.
Our failure to comply with the environmental, health and safety laws and regulations to which we are subject, including any permits issued thereunder, may result in environmental remediation costs, loss of permits, fines, penalties or other adverse governmental or private actions, including regulatory or judicial orders enjoining or curtailing operations or requiring corrective measures, installation of pollution control equipment or remedial measures. We could also be held liable for any and all consequences arising out of human exposure to hazardous materials, environmental damage or significant environmental, health and safety issues that might arise at a manufacturing or R&D facility. Environmental laws and regulations are complex, change frequently, have tended to become more stringent and stringently enforced over time and may be subject to new interpretation. It is possible that our costs of complying with current and future environmental, health and safety laws, and our liabilities arising from past or future releases of, or exposure to, hazardous materials could materially adversely affect our business, financial condition and results of operations.
The actual or purported intellectual property rights of third parties may negatively affect our business.
A third party may sue us, or our distributors or licensors, including Lilly, or otherwise make a claim, alleging infringement or other violation of such third
‑
party’s patents, trademarks, trade dress, copyrights, trade secrets, domain names or other intellectual property rights. If our distributors, licensors or we do not prevail in this type of litigation, we may be required to:
|
•
|
pay monetary damages;
|
|
•
|
obtain a license in order to continue manufacturing or marketing the affected products, which may not be available on commercially reasonable terms, or at all; or
|
|
•
|
stop activities, including any commercial activities, relating to the affected products, which could include a recall of the affected products and/or a cessation of sales in the future.
|
The costs of defending an intellectual property claim could be substantial and could materially adversely affect our business, financial condition and results of operations, even if we successfully defend such claim. Moreover, even if we believe that we do not infringe a validly existing third
‑
party patent, we may choose to license such patent, which would result in associated costs and obligations. We may also incur costs in connection with an obligation to indemnify a distributor, licensor or other third party.
The intellectual property positions of animal health medicines and vaccines businesses frequently involve complex legal and factual questions, and an issued patent does not guarantee us the right to practice the patented technology or develop, manufacture or commercialize the patented product. For example, while we generally enter into proprietary information agreements with our employees and third parties, which assign intellectual property rights to us, these agreements may not be honored or may not effectively assign intellectual property rights to us under the local laws of some countries or jurisdictions. We cannot be certain that a competitor or other third party does not have or will not obtain rights to intellectual property that may prevent us from manufacturing, developing or marketing certain of our products, regardless of whether we believe such intellectual property rights are valid and enforceable or we believe we would otherwise be able to develop a more commercially successful product, which may materially adversely affect our business, financial condition and results of operations.
If our intellectual property rights are challenged or circumvented, competitors may be able to take advantage of our research and development efforts or harm the value of our brands.
Our long
‑
term success depends on our ability to market innovative, competitive products. We rely and expect to continue to rely on a combination of intellectual property, including patent, trademark, trade dress, copyright, trade secret and domain name protection, as well as confidentiality and license agreements with our employees and others, to protect our intellectual property and proprietary rights. If we fail to obtain and maintain adequate
33
intellectual property protection, we may not be able to prevent third parties from using our proprietary technologies or from marketing products that are very similar or identical to ours.
Our currently pending or future patent applications may not result in issued patents, or be approved on a timely basis, if at all. Similarly, any term extensions that we seek may not be approved on a timely basis, if at all. In addition, our issued patents, or any patents that may issue in the future, may not contain claims sufficiently broad to protect us against third parties with similar technologies or products or provide us with any competitive advantage, including exclusivity in a particular product area.
The validity and scope of our patent claims also may vary between countries, as individual countries have their own patent laws. For example, some countries only permit the issuance of patents covering a novel chemical compound itself, and its first use, and thus further methods of use for the same compound may not be patentable. The validity, enforceability, scope and effective term of patents can be highly uncertain and often involve complex legal and factual questions and proceedings that vary based on the local law of the relevant jurisdiction. Our ability to enforce our patents also depends on the laws of individual countries and each country’s practice with respect to enforcement of intellectual property rights. Patent protection must be obtained on a jurisdiction
‑
by
‑
jurisdiction basis, and we only pursue patent protection in countries where we think it makes commercial sense for the given product. In addition, if we are unable to maintain our existing license agreements or other agreements pursuant to which third parties grant us rights to intellectual property, including because such agreements terminate, our financial condition and results of operations could be materially adversely affected.
Patent law reform in the U.S. and other countries may also weaken our ability to enforce our patent rights, or make such enforcement financially unattractive. For instance, in September 2011, the U.S. enacted the America Invents Act, which permits enhanced third
‑
party actions for challenging patents and implements a first
‑
to
‑
invent system. These reforms could result in increased costs to protect our intellectual property or limit our ability to obtain and maintain patent protection for our products in these jurisdictions. Additionally, certain foreign governments have indicated that compulsory licenses to patents may be granted in the case of national emergencies, which could diminish or eliminate sales and profits from those regions and materially adversely affect our financial condition and results of operations.
Our trademarks and brands may provide us with a competitive advantage in the market as they may be known or trusted by consumers. In order to maintain the value of such brands, we must be able to enforce and defend our trademarks. We have pursued and will pursue the registration of trademarks and service marks in the U.S. and internationally; however, enforcing rights against those who knowingly or unknowingly dilute or infringe our brands can be difficult. Effective trademark, service mark, trade dress or related protections may not be available in every country in which our products and services are available. Enforcement is especially difficult in first
‑
to
‑
file countries where “trademark squatters” can prevent us from obtaining adequate protections for our brands. There can be no assurance that the steps we have taken and will take to protect our proprietary rights in our brands and trademarks will be adequate or that third parties will not infringe, dilute or misappropriate our brands, trademarks, trade dress or other similar proprietary rights.
Many of our products are based on or incorporate proprietary information. We actively seek to protect our proprietary information, including our trade secrets and proprietary know
‑
how, by generally requiring our employees, consultants, other advisors and other third parties to execute proprietary information and confidentiality agreements upon the commencement of their employment, engagement or other relationship. Despite these efforts and precautions, we may be unable to prevent a third party from copying or otherwise obtaining and using our trade secrets or our other intellectual property without authorization and legal remedies may not adequately compensate us for the damages caused by such unauthorized use. Further, others may independently and lawfully develop substantially similar or identical products that circumvent our intellectual property by means of alternative designs or processes or otherwise.
We could be subject to changes in our tax rates, the adoption of new U.S. or foreign tax legislation or exposure to additional tax liabilities.
We are subject to income taxes in the U.S. and numerous foreign jurisdictions. Changes in the relevant tax laws, regulations, administrative practices, principles and interpretations could adversely affect our future effective tax rates. The U.S. recently enacted tax reform legislation significantly revising U.S. tax law, and a number of other
countries are actively considering or enacting tax changes. Other organizations, such as the Organization for Economic Cooperation and Development and the European Commission, are also active concerning tax related
34
matters, which could influence international tax policy in countries in which we operate. While outcomes of these initiatives continue to develop and remain uncertain, modifications to key elements of the U.S. or international tax framework could have a material adverse effect on our consolidated results of operations and cash flows.
In December 2017, the President of the United States signed into law the Tax Cuts and Jobs Act (the ‘‘2017 Tax Act’’). The 2017 Tax Act included significant changes to the U.S. corporate income tax system, such as the reduction in the corporate income tax rate, transition to a modified territorial tax system, changes to business related exclusions, deductions and credits, and modifications to international tax provisions. The U.S. Treasury Department and the IRS began to issue major proposed regulations related to the 2017 Tax Act during the second half of 2018 and are expected to continue issuing such regulations through spring of 2019. The proposed regulations are generally subject to comment before being finalized; however, once finalized, these regulations may require Elanco to make adjustments, in particular, as a result of certain complex international provisions contained in the 2017 Tax Act. Such adjustments might materially impact Elanco’s provision for income taxes and effective tax rate in the period in which the adjustments are made and could also impact Elanco’s net income, earnings per share, consolidated cash flows and liquidity.
In addition, our effective tax rate is subject to potential risks that various taxing authorities may challenge the pricing of our cross border arrangements and subject us to additional tax, adversely impacting our effective tax rate and tax liability. We are also subject to the examination of our tax returns and other tax matters by the Internal Revenue Service (IRS) and other tax authorities and governmental bodies. We regularly assess the likelihood of an adverse outcome resulting from these examinations to determine the adequacy of our provision for taxes. There can be no assurance as to the outcome of these examinations. If our effective tax rates were to increase, particularly in the U.S. or other material foreign jurisdictions, or if the ultimate determination of our taxes owed is for an amount in excess of amounts previously accrued, our business, financial condition and results of operations could be materially adversely affected.
Significant portions of our operations are conducted in foreign jurisdictions, including jurisdictions presenting a high risk of bribery and corruption, and are subject to the economic, political, legal and business environments of the countries in which we do business.
Our international operations could be limited or disrupted by any of the following:
|
•
|
volatility in the international financial markets;
|
|
•
|
compliance with governmental controls;
|
|
•
|
difficulties enforcing contractual and intellectual property rights;
|
|
•
|
parallel trade in our products (importation of our products from EU countries where our products are sold at lower prices into EU countries where the products are sold at higher prices);
|
|
•
|
compliance with a wide variety of laws and regulations, such as the U.S. Foreign Corrupt Practices Act (the FCPA) and similar non
‑
U.S. laws and regulations;
|
|
•
|
compliance with foreign labor laws;
|
|
•
|
burdens to comply with multiple and potentially conflicting foreign laws and regulations, including those relating to environmental, health and safety requirements;
|
|
•
|
changes in laws, regulations, government controls or enforcement practices with respect to our business and the businesses of our customers, including the imposition of limits on our profitability;
|
|
•
|
political and social instability, including crime, civil disturbance, terrorist activities and armed conflicts;
|
|
•
|
trade restrictions and restrictions on direct investments by foreign entities, including restrictions administered by the Office of Foreign Assets Control of the U.S. Department of the Treasury and the EU, in relation to our products or the products of farmers and other customers;
|
|
•
|
government limitations on foreign ownership;
|
|
•
|
government takeover or nationalization of business;
|
|
•
|
changes in tax laws and tariffs;
|
|
•
|
imposition of anti
‑
dumping and countervailing duties or other trade
‑
related sanctions;
|
35
|
•
|
costs and difficulties and compliance risks in staffing, managing and monitoring international operations, including in the use of overseas third
‑
party goods and service providers;
|
|
•
|
corruption risk inherent in business arrangements and regulatory contacts with foreign government entities;
|
|
•
|
longer payment cycles and increased exposure to counterparty risk; and
|
|
•
|
additional limitations on transferring personal information between countries or other restrictions on the processing of personal information.
|
In addition, international transactions may involve increased financial and legal risks due to differing legal systems and customs. Compliance with these requirements may prohibit the import or export of certain products and technologies or may require us to obtain a license before importing or exporting certain products or technologies. A failure to comply with any of these laws, regulations or requirements could result in civil or criminal legal proceedings, monetary or non
‑
monetary penalties, or both, disruptions to our business, limitations on our ability to import and export products, and damage to our reputation. In addition, variations in the pricing of our products between jurisdictions may result in the unauthorized importation or unauthorized re
‑
importation of our products between jurisdictions and may also result in the imposition of anti
‑
dumping and countervailing duties or other trade
‑
related sanctions. While the impact of these factors is difficult to predict, any of them could materially adversely affect our business, financial condition and results of operations.
Further, changes in any of these laws, regulations or requirements, or the political environment in a particular country, may affect our ability to engage in business transactions in certain markets, including investment, procurement and repatriation of earnings.
Significant portions of our operations are conducted in Europe and could be impacted by the withdrawal of the United Kingdom (UK) from the EU, commonly referred to as “Brexit.”
In June 2016, voters in the UK approved an advisory referendum to withdraw from the EU, commonly referred to as Brexit. On March 29, 2017, the UK Prime Minister formally notified the European Council of the UK’s intention to withdraw from the EU under Article 50 of the Treaty of Lisbon. The notice began a two-year negotiation period to establish the withdrawal terms. The referendum and notice created political, regulatory and economic uncertainty, particularly in the UK and the EU, and this uncertainty may persist for years if the withdrawal becomes effective in March 2019 without clarification as to whether the UK will continue to be party to the EU Free Trade Agreements (FTA) at the end of the negotiation period.
Our business is subject to substantial regulation. If the UK withdraws from the EU without an agreement and mutual recognition of the EU FTAs, we may not be able to market certain products that entered the EU market following marketing authorization by UK authorities in all the nations that are parties to FTAs with the EU unless and until we have obtained all required regulatory approvals in each jurisdiction where we propose to market those products.
In addition, the uncertainty related to Brexit has caused foreign exchange rate fluctuations in the past, including the strengthening of the U.S. dollar relative to the euro and British pound immediately following the announcement of Brexit. The implementation of, or further developments with respect to, Brexit could further impact foreign exchange rates, which could materially adversely affect our business, financial condition and results of operations.
A withdrawal with no deal in place could significantly disrupt the free movement of goods, services, and people between the UK and the EU, and result in increased legal and regulatory complexities, as well as potential higher costs of conducting business in Europe and declining gross domestic product in many European markets. The UK’s vote to exit the EU could also result in similar referendums or votes in other European countries in which we do business.
If no agreement is reached at the end of the two-year negotiation period on March 29, 2019 and the UK’s separation becomes effective, unless the remaining EU members unanimously agree to an extension, the uncertainty surrounding the terms of the UK’s withdrawal and its consequences could adversely impact consumer and investor confidence, and could affect sales or regulation of our products. Any of these effects, among others, could materially adversely affect our business, financial condition and results of operations.
36
Foreign exchange rate fluctuations and potential currency controls affect our results of operations, as reported in our financial statements.
We conduct operations in many areas of the world, involving transactions denominated in a variety of currencies. In 2018, we generated approximately 52% of our revenue in currencies other than the U.S. dollar, principally the euro, British pound, Brazilian real, Australian dollar, Japanese yen, Canadian dollar and Chinese yuan. We are subject to currency exchange rate risk to the extent that our costs are denominated in currencies other than those in which we earn revenue. In addition, because our financial statements are reported in U.S. dollars, changes in currency exchange rates between the U.S. dollar and other currencies have had, and will continue to have, an impact on our results of operations.
We also face risks arising from currency devaluations and the imposition of cash repatriation restrictions and exchange controls. Currency devaluations result in a diminished value of funds denominated in the currency of the country instituting the devaluation. Cash repatriation restrictions and exchange controls may limit our ability to convert foreign currencies into U.S. dollars or to remit dividends and other payments by our foreign subsidiaries or businesses located in or conducted within a country imposing restrictions or controls. While we currently have no need and do not intend to repatriate or convert cash held in countries that have significant restrictions or controls in place, should we need to do so to fund our operations, we may be unable to repatriate or convert such cash, or may be unable to do so without incurring substantial costs.
We also bear foreign exchange risk associated with the future cash settlement of an existing net investment hedge. In October 2018, we entered into a fixed interest rate, 5-year, 750 million Swiss franc net investment hedge (NIH) against Swiss franc assets. The NIH is expected to generate approximately $25 million in cash and contra interest expense per year; however, there is potential for significant 2023 settlement exposure on the 750 million Swiss franc notional if the U.S. dollar devalues versus the Swiss franc.
We depend on sophisticated information technology and infrastructure.
We rely on various information systems to manage our operations, and we increasingly depend on third parties to operate and support our information technology systems, including by way of virtual and cloud
‑
based operations. These third parties include large established vendors as well as small, privately owned companies. Failure by any provider to adequately service our operations, or a change in control or insolvency of one or more providers, may materially adversely affect our business, financial condition and results of operations. Prior to the separation, we relied on Lilly to negotiate and manage many of our relationships and contracts with these third parties.
In connection with the IPO and the separation, we have substantially changed, and will continue to develop, a number of our business processes, including our financial reporting and supply chain processes and with respect to where and from whom we obtain information technology systems. In order to support the new business processes under the terms of our transitional services agreement with Lilly, we will make significant configuration, process and data changes within many of the information technology systems we use. If our information technology systems and processes are not sufficient to support our business and financial reporting functions, or if we fail to properly implement our new business processes, our financial reporting may be delayed or inaccurate and, as a result, our business, financial condition and results of operations may be materially adversely affected. Even if we are able to successfully configure and change our systems, all technology systems, even with implementation of security measures, are vulnerable to disability, failures or unauthorized access. If our information technology systems were to fail or be breached, this could materially adversely affect our reputation and our ability to perform critical business functions, and sensitive and confidential data could be compromised.
Breaches of our information technology systems or improper disclosure of confidential company or personal data could have a material adverse effect on our reputation and operations, or we may fail to comply with privacy laws, regulations and our contractual obligations.
We rely on information technology systems to process, transmit and store electronic information in our day
‑
to
‑
day operations, including customer, employee and company data. The secure processing, maintenance and transmission of this information is critical to our operations and the legal environment surrounding information security, storage, use, processing, disclosure and privacy is demanding with the frequent imposition of new and changing requirements. We also store certain information with third parties. Our information systems and those of our third
‑
party vendors are subjected to computer viruses or other malicious codes, unauthorized access attempts, and cyber
‑
or phishing
‑
attacks and also are vulnerable to an increasing threat of continually evolving cybersecurity risks and external hazards, as well as improper or inadvertent staff behavior, all of which could expose confidential
37
company and personal data systems and information to security breaches. Any such breach could compromise our networks, and the information stored therein could be accessed, publicly disclosed, lost or stolen. Such attacks could result in our intellectual property and other confidential information being lost or stolen, disruption of our operations, and other negative consequences, such as increased costs for security measures or remediation costs, and diversion of management attention. Any actual or perceived access, disclosure or other loss of information or any significant breakdown, intrusion, interruption, cyber
‑
attack or corruption of customer, employee or company data or our failure to comply with federal, state, local and foreign privacy laws or contractual obligations with customers, vendors, payment processors and other third parties, could result in legal claims or proceedings, liability under laws or contracts that protect the privacy of personal information, regulatory penalties, disruption of our operations, and damage to our reputation, all of which could materially adversely affect our business, revenue and competitive position. While we will continue to implement additional protective measures to reduce the risk of and detect cyber
‑
incidents, cyber
‑
attacks are becoming more sophisticated and frequent, and the techniques used in such attacks change rapidly. Our protective measures may not protect us against attacks and such attacks could have a significant impact on our business and reputation. In addition, prior to the separation, we relied on Lilly for certain privacy and compliance functions and personnel and may experience difficulties maintaining and implementing all policies and practices following completion of the separation.
Increased regulation or decreased governmental financial support relating to the raising, processing or consumption of food animals could reduce demand for our food animal products.
Companies in the food animal sector are subject to extensive and increasingly stringent regulations. See “Business of Elanco - Regulatory.” If food animal producers are adversely affected by new regulations or changes to existing regulations, they may reduce herd or flock sizes or become less profitable and, as a result, they may reduce their use of our products, which may materially adversely affect our business, financial condition and results of operations. Also, many food animal producers benefit from governmental subsidies, and if such subsidies were to be reduced or eliminated, these companies may become less profitable and, as a result, may reduce their use of our food animal products. More stringent regulation of the food animal sector, including regarding the use of food animal products, could have a material adverse effect on our business, financial condition and results of operations.
Our business could be materially adversely affected by labor disputes, strikes or work stoppages.
Some of our employees are members of unions, works councils, trade associations or are otherwise subject to collective bargaining agreements in certain jurisdictions, including the U.S. As a result, we are subject to the risk of labor disputes, strikes, work stoppages and other labor
‑
relations matters. We may be unable to negotiate new collective bargaining agreements on similar or more favorable terms and may experience work stoppages, higher ongoing labor costs or other labor problems in the future at our sites. We may also experience difficulty or delays in implementing changes to our workforce in certain markets. These risks may be increased by the separation because we will no longer be able to benefit from Lilly’s prior relationships and negotiations relating to such agreements.
Further, labor
‑
related issues, including at our suppliers or CMOs, could cause a disruption of our operations, which could have a material adverse effect on our business, financial condition and results of operations, potentially resulting in cancelled orders by customers, unanticipated inventory accumulation or shortages and reduced revenue and net income.
The anticipated benefits of the separation and the exchange offer may not be achieved.
We may not be able to achieve the full strategic and financial benefits expected to result from the separation and the exchange offer. Further, such benefits, if ultimately achieved, may be delayed. These benefits include the following:
|
•
|
improving strategic and operational flexibility and streamlining decision
‑
making by providing the flexibility to implement our strategic plan and to respond more effectively to different customer needs and the changing economic and industry environment;
|
|
•
|
allowing us to adopt the investment policy and dividend policy best suited to our financial profile and business needs, and allowing us to raise capital as an independent business;
|
|
•
|
creating an independent equity structure that makes possible future acquisitions utilizing our common stock as well as compensation arrangements; and
|
38
|
•
|
facilitating incentive compensation arrangements for employees more directly tied to the performance of our business, and enhancing employee hiring and retention by, among other things, improving the alignment of management and employee incentives with performance and growth objectives of our business.
|
We may not achieve the anticipated benefits of the separation and the exchange offer for a variety of reasons, which could materially adversely affect our business, financial condition and results of operations.
We have underfunded pension plan liabilities. We will require current and future operating cash flow to fund these shortfalls reducing the cash available for other uses.
We have certain defined benefit pension plans, predominantly outside of the U.S., that our employees participate in that are either dedicated to our employees or where the plan assets and liabilities that relate to our employees were legally required to transfer to us at the time of the separation. The funded status and net periodic pension cost for these plans is materially affected by the discount rate used to measure pension obligations, the longevity and actuarial profile of our workforce, the level of plan assets available to fund those obligations and the actual and expected long
‑
term rate of return on plan assets. Significant changes in investment performance or a change in the portfolio mix of invested assets can result in corresponding increases and decreases in the valuation of plan assets or in a change in the expected rate of return on plan assets. As of December 31, 2018, for pension plans with projected benefit obligations in excess of plan assets, the projected benefit obligation was $229.2 million with plan assets of $124.1 million. Any changes in the discount rate could result in a significant increase or decrease in the valuation of pension obligations, affecting the reported funded status of our pension plans as well as the net periodic pension cost in the following years. Similarly, changes in the expected return on plan assets can result in significant changes in the net periodic pension cost in the following years. The need to make additional cash contributions will divert resources from our operations and may have a material adverse effect on our business, financial condition and results of operations.
Risks Related to our Indebtedness
We have substantial indebtedness.
We have a significant amount of indebtedness, which could materially adversely affect our business, financial condition and results of operations. As of December 31, 2018, we have incurred approximately $2.5 billion aggregate principal amount of senior indebtedness, consisting of the Senior Notes and the Term Facility. We have an additional $750 million of borrowing capacity ($1,000 million if certain conditions are met) under the Revolving Facility. See Note 9: Debt to our consolidated and combined financial statements.
We may incur substantial additional debt from time to time to finance working capital, capital expenditures, investments, acquisitions or for other purposes. If we do so, the risks related to our high level of debt could intensify. Specifically, our high level of debt could have important consequences, including:
|
•
|
making it more difficult for us to satisfy our obligations with respect to our debt;
|
|
•
|
limiting our ability to obtain additional financing to fund future working capital, capital expenditures, business development or other general corporate requirements, including dividends;
|
|
•
|
increasing our vulnerability to general adverse economic and industry conditions;
|
|
•
|
exposing us to the risk of increased interest rates as certain of our borrowings are and may in the future be at variable rates of interest;
|
|
•
|
limiting our flexibility in planning for and reacting to changes in the animal health industry;
|
|
•
|
impacting our effective tax rate; and
|
|
•
|
increasing our cost of borrowing.
|
We may not be able to generate sufficient cash to service all of our indebtedness and may be forced to take other actions to satisfy our obligations under our indebtedness, which may not be successful.
Our ability to make scheduled payments on or refinance our debt obligations depends on our financial condition and operating performance, which are subject to prevailing economic and competitive conditions and to certain financial, business, legislative, regulatory and other factors beyond our control. We may be unable to maintain a
39
level of cash flows from operating activities sufficient to permit us to pay the principal and interest on our indebtedness.
If our cash flows and capital resources are insufficient to fund our debt service obligations, we could face substantial liquidity problems and could be forced to reduce or delay investments and capital expenditures, or to dispose of material assets or operations, alter our dividend policy, seek additional debt or equity capital or restructure or refinance our indebtedness. We may not be able to effect any such alternative measures on commercially reasonable terms or at all and, even if successful, those alternative actions may not allow us to meet our scheduled debt service obligations. The instruments that will govern our indebtedness may restrict our ability to dispose of assets and may restrict the use of proceeds from those dispositions and may also restrict our ability to raise debt or equity capital to be used to repay other indebtedness when it becomes due. We may not be able to consummate those dispositions or to obtain proceeds in an amount sufficient to meet any debt service obligations when due.
In addition, we conduct our operations through our subsidiaries. Accordingly, repayment of our indebtedness will depend on the generation of cash flow by our subsidiaries, including certain international subsidiaries, and their ability to make such cash available to us, by dividend, debt repayment or otherwise. Our subsidiaries may not have any obligation to pay amounts due on our indebtedness or to make funds available for that purpose. Our subsidiaries may not be able to, or may not be permitted to, make adequate distributions to enable us to make payments in respect of our indebtedness. Each subsidiary is a distinct legal entity and, under certain circumstances, legal, tax and contractual restrictions may limit our ability to obtain cash from our subsidiaries. In the event that we do not receive distributions from our subsidiaries, we may be unable to make required principal and interest payments on our indebtedness.
Our inability to generate sufficient cash flows to satisfy our debt obligations, or to refinance our indebtedness on commercially reasonable terms or at all, may materially adversely affect our business, financial condition and results of operations and our ability to satisfy our obligations under our indebtedness or pay dividends on our common stock.
Risks Related to our Relationship with Lilly
As a result of the separation, we will lose Lilly’s brand, reputation, capital base and other resources.
We believe our association with Lilly has contributed to our building relationships with our customers due to Lilly’s globally recognized brand and perceived high
‑
quality products. The separation could adversely affect our ability to attract and retain customers, which could result in reduced sales of our products.
The loss of Lilly’s scale, capital base and financial strength may also prompt suppliers to reprice, modify or terminate their relationships with us. In addition, Lilly’s reduction of its ownership of our company could potentially cause some of our existing agreements and licenses to be terminated. We cannot predict with certainty the effect that the separation will have on our business, our clients, vendors or other persons, or whether our brand will be accepted in the marketplace.
Further, because we have not operated as a standalone company in the past, we may have difficulty doing so. We may need to acquire assets and resources in addition to those provided by Lilly, and in connection with the separation, may also face difficulty in separating our assets from Lilly’s assets and integrating newly acquired assets into our business. Our business, financial condition and results of operations could be materially adversely affected if we have difficulty operating as a standalone company, fail to acquire assets that prove to be important to our operations or incur unexpected costs in separating our assets from Lilly’s assets or integrating newly
‑
acquired assets.
Lilly may compete with us.
Lilly is not restricted from competing with us in the animal health business. Although Lilly has informed us it has no current intention to compete with us in the animal health business, if Lilly in the future decides to engage in the type of business we conduct, it may have a competitive advantage over us, which may cause our business, financial condition and results of operations to be materially adversely affected.
40
Certain of our directors may have actual or potential conflicts of interest because of their positions with Lilly.
A majority of our directors are employees of Lilly. Following the completion of the exchange offer, it is expected that each of these directors will resign from our board of directors and additional independent directors will be appointed. However, it is possible that our board of directors may determine that one or more of Lilly’s officers or employees should continue to serve on the board of directors for a period of time following the completion of the exchange offer. In addition, new or continuing directors may own Lilly common stock or equity awards. For certain of these individuals, their holdings of Lilly common stock or equity awards may be significant compared to their total assets. Their position at Lilly and the ownership of any Lilly equity or equity awards create, or may create the appearance of, conflicts of interest when these directors are faced with decisions that could have different implications for Lilly than for us. For example, these potential conflicts could arise, particularly if Lilly continues to own a substantial portion of our common stock following the exchange offer, over matters such as the desirability of changes in our business and operations, funding and capital matters, regulatory matters, matters arising with respect to the master separation agreement and other agreements with Lilly relating to the separation or otherwise, employee retention or recruiting, or our dividend policy.
Provisions relating to certain relationships and transactions in Elanco's amended and restated articles of incorporation address certain potential conflicts of interest between Elanco, on the one hand, and Lilly and its officers who are directors of Elanco, on the other hand. By becoming an Elanco shareholder, you will be deemed to have notice of and have consented to these provisions of Elanco's amended and restated articles of incorporation. Although these provisions are designed to resolve certain conflicts between Elanco and Lilly fairly, Elanco cannot assure you that any conflicts will be so resolved.
To preserve the tax
‑
free treatment to Lilly and its shareholders of the exchange offer and certain related transactions, we may not be able to engage in certain transactions.
To preserve the tax
‑
free treatment to Lilly and its shareholders of the exchange offer and certain related transactions, under the tax matters agreement, we are restricted from taking any action that prevents such transactions from being tax
‑
free for U.S. federal income tax purposes. These restrictions may limit our ability to pursue certain strategic transactions or engage in other transactions, including using our common stock to make acquisitions and in connection with equity capital market transactions that might increase the value of our business.
Lilly’s rights as licensor under the intellectual property and technology license agreement could limit our ability to develop and commercialize certain products.
Prior to the separation, we had the ability to leverage certain of Lilly’s intellectual property. As part of the separation, we entered into an intellectual property and technology license agreement. Pursuant to the intellectual property and technology license agreement, Lilly licenses to us certain of its intellectual property (excluding trademarks) related to the animal health business and also grants a license for us to use Lilly’s proprietary compound library for a period of two years plus up to three additional one
‑
year periods, each such period to be granted under Lilly’s sole discretion. If we fail to comply with our obligations under this agreement and Lilly exercises its right to terminate it, our ability to continue to research, develop and commercialize products incorporating that intellectual property will be limited. In addition, this agreement includes limitations that affect our ability to develop and commercialize certain products, including in circumstances where Lilly has an interest in the licensed intellectual property in connection with its human health development programs. These limitations and termination rights may make it more difficult, time consuming or expensive for us to develop and commercialize certain new products, or may result in our products being later to market than those of our competitors. For a summary description of the terms of the intellectual property and technology license agreement, see Note 19 in the consolidated and combined financial statements.
Our historical consolidated and combined financial data is not necessarily representative of the results we would have achieved as a standalone company and may not be a reliable indicator of our future results.
Our historical consolidated and combined financial data included in this report does not reflect the financial condition, results of operations or cash flows we would have achieved as a standalone company during the periods presented or those we will achieve in the future. This is primarily the result of the following factors:
|
•
|
our historical consolidated and combined financial data does not reflect the separation;
|
41
|
•
|
our historical consolidated and combined financial data reflects expense allocations for certain support functions that are provided on a centralized basis within Lilly, such as expenses for executive oversight, treasury, legal, finance, human resources, tax, internal audit, financial reporting, information technology and investor relations that may be higher or lower than the comparable expenses we would have actually incurred, or will incur in the future, as a standalone company;
|
|
•
|
our cost of debt and our capital structure is different from that reflected in our historical consolidated and combined financial statements;
|
|
•
|
significant increases may occur in our costs as a result of us being a standalone public company, including costs related to public company reporting, investor relations and compliance with the Sarbanes
‑
Oxley Act; and
|
|
•
|
loss of economies of scale as a result of no longer being a part of Lilly.
|
Our financial condition and future results of operations, after giving effect to the separation, will be materially different from amounts reflected in our historical consolidated and combined financial statements included in this report. As a result of the separation, it may be difficult for investors to compare our future results to historical results or to evaluate our relative performance or trends in our business.
We have incurred and will continue to incur significant charges in connection with the separation and incremental costs as a standalone public company.
We will need to replicate or replace certain functions, systems and infrastructure to which we no longer have the same access after the separation. We may also need to make investments or hire additional employees to operate without the same access to Lilly’s existing operational and administrative infrastructure. These initiatives may be costly to implement. Due to the scope and complexity of the underlying projects relative to these efforts, the amount of total costs could be materially higher than our estimate, and the timing of the incurrence of these costs is subject to change.
Prior to the separation, Lilly performed or supported many important corporate functions for us. Our consolidated and combined financial statements reflect charges for these services on an allocated basis. Following the separation, many of these services are governed by our transitional services agreement with Lilly. Under the transitional services agreement we are able to use these Lilly services for a fixed term established on a service
‑
by
‑
service basis. Partial reduction in the provision of any service or termination of a service prior to the expiration of the applicable fixed term requires Lilly’s consent. In addition, either party is able to terminate the agreement due to a material breach of the other party, upon prior written notice, subject to limited cure periods or if the other party undergoes a change of control.
We pay Lilly mutually agreed
‑
upon fees for these services, which are based on Lilly’s costs (including third
‑
party costs) of providing the services through March 31, 2021 and subject to a mark
‑
up of 7% thereafter, with additional inflation
‑
based escalation beginning January 1, 2022. However, since our transitional services agreement was negotiated in the context of a parent
‑
subsidiary relationship, the terms of the agreement, including the fees charged for the services, may be higher or lower than those that would be agreed to by parties bargaining at arm’s length for similar services and may be higher or lower than the costs reflected in the allocations in our historical consolidated and combined financial statements. In addition, while these services are being provided to us by Lilly, our operational flexibility to modify or implement changes with respect to such services or the amounts we pay for them will be limited.
We may not be able to replace these services or enter into appropriate third
‑
party agreements on terms and conditions, including cost, comparable to those that we received from Lilly under the transitional services agreement. Additionally, after the transitional services agreement terminates, we may be unable to sustain the services at the same levels or obtain the same benefits as when we were receiving such services and benefits from Lilly. When we begin to operate these functions separately, if we do not have our own adequate systems and business functions in place, or are unable to obtain them from other providers, we may not be able to operate our business effectively or at comparable costs, and our profitability may decline. In addition, we have historically received informal support from Lilly, which may not be addressed in the transitional services agreement. The level of this informal support may diminish or be eliminated in the future.
In addition, our historical consolidated and combined financial statements include the attribution of certain assets and liabilities that historically have been held at the Lilly corporate level but which are specifically identifiable or
42
attributable to the businesses that were transferred to us in connection with the separation. The value of the assets and liabilities we assumed in connection with the separation could ultimately be materially different than such attributions, which could have a material adverse effect on our financial condition.
Risks Related to Elanco Common Stock
The price of our common stock may fluctuate substantially during and after the exchange offer period, and you could lose all or part of your investment in our common stock as a result.
Our common stock has a limited trading history and there may be wide fluctuations in the market value of our common stock during and after the exchange offer period as a result of many factors. From our IPO through February 18, 2019, the sales price of our common stock as reported by the NYSE has ranged from a low sales price of $28.00 on February 6, 2019 to a high sales price of $37.61 on September 27, 2018. Some factors that may cause the market price of our common stock to fluctuate, in addition to the other risks mentioned in this report, are:
|
•
|
our announcements or our competitors’ announcements regarding new products, enhancements, significant contracts, acquisitions or strategic investments;
|
|
•
|
changes in earnings estimates or recommendations by securities analysts, if any, who cover our common stock;
|
|
•
|
failures to meet external expectations or management guidance;
|
|
•
|
fluctuations in our quarterly financial results or the quarterly financial results of companies perceived to be similar to us;
|
|
•
|
changes in our capital structure or dividend policy, including as a result of the exchange offer, future issuances of securities, sales of large blocks of common stock by our shareholders, including Lilly, or our incurrence of additional debt;
|
|
•
|
reputational issues arising from, among other things, negative publicity about us, our industry or personnel, including as a result of changing public attitudes regarding our products;
|
|
•
|
changes in general economic and market conditions in any of the regions in which we conduct our business;
|
|
•
|
changes in industry conditions or perceptions;
|
|
•
|
changes in applicable laws, rules or regulations and other dynamics; and
|
|
•
|
announcements or actions taken by Lilly, if Lilly were to retain a significant portion of our common stock following the exchange offer.
|
In addition, if the market for stocks in our industry or related industries, or the stock market in general, experiences a loss of investor confidence, the trading price of our common stock could decline for reasons unrelated to our business, financial condition and results of operations. If any of the foregoing occurs, it could cause our stock price to fall and may expose it to lawsuits that, even if unsuccessful, could be costly to defend and a distraction to management.
While we currently intend to pay a quarterly cash dividend to our common shareholders, we may change our dividend policy at any time.
Although we currently intend to pay a quarterly cash dividend to our common shareholders, we have no obligation to do so, and our dividend policy may change at any time without notice to our shareholders. We currently intend to pay a quarterly cash dividend on our common stock of approximately $0.06 per share commencing following the quarter during which Lilly no longer owns shares of our common stock, subject to the discretion of our board of directors. Returns on your investment will primarily depend on the appreciation, if any, in the price of our common stock. We anticipate that we will retain most of our future earnings, if any, for use in the development and expansion of our business, repayment of indebtedness and for general corporate purposes. The declaration and payment of dividends to holders of our common stock will be at the discretion of our board of directors in accordance with applicable law after taking into account various factors, including our financial condition, results of operations,
43
current and anticipated cash needs, cash flows available in the U.S., impact on our effective tax rate, indebtedness, legal requirements and other factors that our board of directors deems relevant.
The distributions we pay on our common stock may not qualify as dividends for U.S. federal income tax purposes, which could adversely affect the U.S. federal income tax consequences to you of owning our common stock.
Generally, any distributions that we make to a shareholder with respect to our shares of our common stock will constitute a dividend for U.S. federal income tax purposes to the extent of our current or accumulated earnings and profits as determined for U.S. federal income tax purposes. Our ability to generate earnings and profits, as determined for U.S. federal income tax purposes, in any future year is subject to a number of variables that are uncertain and difficult to predict.
Generally, any distribution not constituting a dividend under the rules described above will be treated as first reducing your adjusted basis in your shares of our common stock and, to the extent that the distribution exceeds your adjusted basis in your shares of our common stock, as gain from the sale or exchange of such shares, and if you are a domestic corporation, you will not be entitled to claim, with respect to such non
‑
dividend distribution, a “dividends
‑
received” deduction, which generally applies to dividends received from other domestic corporations.
Applicable laws and regulations, provisions of our amended and restated articles of incorporation and our amended and restated bylaws and certain contractual rights granted to Lilly may discourage takeover attempts and business combinations that shareholders might consider in their best interests.
Applicable laws, provisions of our amended and restated articles of incorporation and our amended and restated bylaws and, depending on the number of shares validly tendered and whether Lilly retains a significant portion of our common stock, certain contractual rights granted to Lilly under the master separation agreement may delay, deter, prevent or render more difficult a takeover attempt that our shareholders might consider in their best interests. For example, they may prevent our shareholders from receiving the benefit from any premium to the market price of our common stock offered by a bidder in a takeover context. Even in the absence of a takeover attempt, the existence of these provisions may adversely affect the prevailing market price of our common stock if they are viewed as discouraging takeover attempts in the future.
Our amended and restated articles of incorporation and our amended and restated bylaws contain provisions that are intended to encourage prospective acquirers to negotiate with our board of directors rather than to attempt a hostile takeover, which could deter coercive takeover practices and inadequate takeover bids. These provisions provide for:
|
•
|
a board of directors divided into three classes with staggered terms;
|
|
•
|
advance notice requirements regarding how our shareholders may present proposals or nominate directors for election at shareholder meetings (except for, depending on the number of shares validly tendered and whether Lilly retains a significant portion of our common stock, Lilly’s designation of persons for nomination by the board of directors);
|
|
•
|
the right of our board of directors to issue one or more series of preferred stock with such powers, rights and preferences as the board of directors shall determine;
|
|
•
|
only the board of directors being able to fill newly
‑
created directorships or vacancies on Our board of directors;
|
|
•
|
limitations on the ability of shareholders to call special meetings of shareholders and the requirement that all shareholder action be taken at a meeting rather than by written consent;
|
|
•
|
a two
‑
thirds shareholder vote requirement to amend our amended and restated articles of incorporation;
|
|
•
|
the exclusive right of our board of directors to amend our amended and restated bylaws; and
|
|
•
|
the requirement that a 66
2
/
3
% vote is necessary to remove directors. These limitations may adversely affect the prevailing market price and market for our common stock if they are viewed as limiting the liquidity of our stock or discouraging takeover attempts in the future.
|
44
Risks Related to the Exchange Offer
The exchange offer and related transactions will result in a substantial amount of our common stock entering the market, which may adversely affect the market price of our common stock.
Immediately before the commencement of the exchange offer, Lilly owned 293,290,000 shares of our common stock, representing 80.2% of our outstanding common stock. Assuming the completion of the exchange offer and that it is fully subscribed, Lilly will distribute 293,290,000 shares of our common stock and all shares of our common stock not held by our affiliates will be freely tradable. If the exchange offer is not fully subscribed, Lilly intends, from time to time, to complete subsequent exchange offers and/or a pro rata spin-off of its remaining interest in Elanco. The distribution of such a large number of shares of our common stock in the exchange offer and any subsequent exchange offers or a distribution of our common stock on a pro rata basis to Lilly shareholders could adversely affect the market price of our common stock.
Following the completion of the exchange offer, the market price of shares of Lilly common stock and Elanco common stock will fluctuate and the final per-share values used in determining the exchange ratio may not be indicative of future trading prices.
The common stock price history for our shares may not provide investors with a meaningful basis for evaluating an investment in our common stock. Elanco has been a publicly traded company only since September 20, 2018. The prior performance of our common stock may not be indicative of the performance of our common stock after the exchange offer. In addition, the indicative and final per-share values used in determining the exchange ratio in the exchange offer may not be indicative of the prices at which our common stock will trade after the exchange offer is completed.
If the exchange offer is not fully subscribed, Lilly may continue to control us, which could prevent our shareholders from influencing significant decisions.
Depending on the number of shares validly tendered, Lilly may be able to influence the outcome of certain corporate actions requiring the approval of our shareholders so long as it owns a significant portion of our common stock and may retain certain rights pursuant to the master separation agreement. See "Agreements Between Lilly and Elanco and Other Related Party Transactions - Relationship between Elanco and Lilly - Master Separation Agreement." In addition, if the exchange offer is not fully subscribed, and Lilly were to waive the minimum amount and continue to hold more than 50% of our outstanding common stock, then we would
continue to be considered a "controlled company" under NYSE rules. In such case, the typical independence requirements under the NYSE rules would not apply to us.
The exchange offer could result in significant tax liability.
The completion of the exchange offer is conditioned upon, among other things, the receipt by Lilly of the opinion of Skadden, Arps, Slate, Meagher & Flom LLP (Skadden Arps), to the effect that the exchange offer will qualify as a tax-free transaction under Sections 355 and 368(a)(1)(D) of the Internal Revenue Code and that, for U.S. federal income tax purposes, except with respect to the receipt of cash in lieu of fractional shares, holders of Lilly common stock will recognize no gain or loss upon the receipt of shares of our common stock in the exchange offer. A holder of Lilly common stock will generally recognize capital gain or loss with respect to cash received in lieu of a fractional share of our common stock.
The opinion of Skadden Arps will be based on the law in effect as of the time of the exchange offer and will rely upon certain assumptions, as well as statements, representations and certain undertakings made by our officers and those of Lilly. These assumptions, statements, representations and undertakings are expected to relate to, among other things, Lilly's business reasons for engaging in the exchange offer, the conduct of certain business activities by Lilly and Elanco, and the plans and intentions of Lilly and Elanco to continue conducting those business activities and not to materially modify their ownership or capital structure following the exchange offer. If any of those statements, representations or assumptions is incorrect or untrue in any material respect or any of those undertakings is not complied with, or if the facts upon which the opinion of Skadden Arps is based are materially different from the facts that exist at the time of the exchange offer, the conclusions reached in such opinion could be adversely affected.
Lilly does not intend to seek a ruling from the IRS as to the U.S. federal income tax treatment of the exchange offer. The legal authorities upon which the opinion of Skadden Arps will be based are subject to change or differing
45
interpretations at any time, possibly with retroactive effect. The opinion will not be binding on the IRS or a court, and there can be no assurance that the IRS will not challenge the conclusions reached in the opinion or that a court would not sustain such a challenge.
If the exchange offer were determined not to qualify as a tax-free transaction under Sections 355 and 368(a)(1)(D) of the Code, each Lilly shareholder who receives shares of our common stock in the exchange offer would generally be treated as recognizing taxable gain or loss equal to the difference between the fair market value of the shares of our common stock received by the shareholder and its tax basis in the shares of Lilly common stock exchanged therefor, or, in certain circumstances, as receiving a taxable distribution equal to the fair market value of the shares of our common stock received by the shareholder.
In addition, Lilly would generally recognize gain with respect to the transfer of our common stock in the exchange offer, as well as with respect to the receipt of certain cash proceeds from us in connection with the IPO.
The exchange offer could be taxable to Lilly, but not its shareholders, if we or our shareholders were to engage in certain transactions after the exchange offer is completed. In such cases, we would be required to indemnify Lilly for any resulting taxes and related expenses, which amount could be material.
If there is a later determination that the exchange offer is taxable for U.S. federal income tax purposes because the facts, assumptions, representations or undertakings underlying the tax opinion are incorrect or for any other reason, then we could incur significant liabilities.
The completion of the exchange offer is conditioned upon, among other things, the receipt by Lilly of the opinion of Skadden Arps, to the effect that the exchange offer will qualify as tax-free to Lilly and its shareholders for U.S. federal income tax purposes under Sections 355 and 368(a)(1)(D) of the Code, except with respect to the receipt of cash in lieu of a fractional share. The tax opinion will rely on certain facts, assumptions, representations and undertakings from Lilly and Elanco regarding the past and future conduct of the companies' respective businesses and other matters. If any of these facts, assumptions, representations or undertakings is incorrect or not otherwise satisfied, the conclusions reached in the opinion could be adversely affected and Lilly and its shareholders could be subject to significant tax liabilities. Furthermore, an opinion of counsel is not binding on the IRS or courts, and the IRS could determine on audit that the exchange offer is taxable if it disagrees with the conclusions in the opinion, or for other reasons, including as a result of certain significant changes in the stock ownership of Lilly or Elanco after the exchange offer. Accordingly, no assurance can be given that the IRS will not challenge the conclusions set forth in the opinion or that a court would not sustain such a challenge. If the exchange offer is determined to be taxable for U.S. federal income tax purposes, Lilly and/or its shareholders could incur significant U.S. federal income tax liabilities, and Elanco could incur significant liabilities under applicable law or under the tax matters agreement.
Item 1B. Unresolved Staff Comments
None.
Item 2. Properties
Properties
We have R&D operations co-located with certain of our manufacturing sites in the U.S. to facilitate the efficient transfer of production processes from our laboratories to manufacturing sites. In addition, we maintain R&D operations at non-manufacturing locations in the U.S., Switzerland, Australia, Brazil and China. As part of the Separation, Lilly will transfer to us its interest in each of these R&D facilities. Our largest R&D facility is our U.S. R&D site located in Fort Dodge, Iowa, which has approximately 0.3 million square feet.
The address of our principal executive offices is currently c/o Elanco, 2500 Innovation Way, Greenfield IN, 46140, and we expect that our principal executive offices will remain at this address following the completion of this offering.
Following the separation, our global manufacturing network will be comprised of 12 manufacturing sites. The largest manufacturing site in our global manufacturing network is our manufacturing site located in Clinton, Indiana, which has approximately 0.7 million square feet. In addition, our global manufacturing network will continue to be supplemented by approximately 100 CMOs. See "Item 1. Business — Manufacturing and Supply Chain."
We own or lease various additional properties for other business purposes including office space, warehouses and logistics centers. In addition, under the transitional services agreement, Lilly will provide us with continued access to certain of its premises currently occupied by our employees for up to two years.
46
We believe that our existing properties, as supplemented by CMOs and access to Lilly facilities that will be provided under the transitional services agreement, are adequate for our current requirements and for our operations in the near future.
Item 3. Legal Proceedings
We are from time to time subject to claims and litigation arising in the ordinary course of business. These claims and litigation may include, among other things, allegations of violation of U.S. and foreign competition law, labor laws, consumer protection laws and environmental laws and regulations, as well as claims or litigation relating to product liability, intellectual property, securities, breach of contract and tort. We operate in multiple jurisdictions and, as a result, a claim in one jurisdiction may lead to claims or regulatory penalties in other jurisdictions. We intend to vigorously defend against any pending or future claims and litigation, as appropriate.
At this time, in the opinion of our management, the likelihood is remote that the impact of such proceedings, either individually or in the aggregate, would have a material adverse effect on our consolidated and combined results of operations, financial condition or cash flows. However, one or more unfavorable outcomes in any claim or litigation against us could have a material adverse effect for the period in which they are resolved. In addition, regardless of their merits or their ultimate outcomes, such matters are costly, divert management’s attention and may materially adversely affect our reputation, even if resolved in our favor.
Item 4. Mine Safety Disclosures
Not applicable.
47
Part II
Item 5. Market for the Registrant’s Common Equity, Related Stockholder Matters and Issuer Purchases of Equity Securities
MARKET INFORMATION
On September 20, 2018, our common stock began trading on the New York Stock Exchange under the symbol “ELAN.”
USE OF PROCEEDS
On September 24, 2018, we completed our IPO resulting in the issuance of 72.3 million shares of our common stock at a price to the public of $24.00 per share, which number of shares included the underwriters’ exercise in full of their option to purchase up to an additional 9.4 million shares of common stock at the IPO price, less underwriting discounts. The 72.3 million shares of our common stock sold in the IPO represent approximately 19.8% of our outstanding shares, while Lilly continues to own approximately 80.2% of our outstanding shares. The shares sold in the offering were registered under the Securities Act pursuant to a registration statement on Form S-1 (File No. 333-226536), which was declared effective by the SEC as of September 20, 2018. The aggregate offering price of our common stock registered and sold under the registration statement was approximately $1,736.0 million (including the shares issued pursuant to the underwriters’ option to purchase additional shares). Our proceeds from the IPO were approximately $1,659.7 million, after deducting underwriting discounts and commissions of approximately $76.4 million. Goldman, Sachs & Co. LLC, J.P. Morgan Securities LLC and Morgan Stanley & Co. LLC served as joint book-running managers and as representatives of the underwriters for the IPO. The offering commenced on September 20, 2018 and did not terminate before all of the securities registered in the registration statement were sold.
We have paid, or will pay, to Lilly approximately $4.2 billion in connection with the Separation, which includes the net proceeds from the IPO. A portion of the aggregate payment to Lilly is currently retained by us and is reflected on our balance sheet as restricted cash.
HOLDERS
There were 232 holders of record of our common stock as of
February 18, 2019
. This does not include the number of stockholders who hold shares of our common stock through banks, brokers or other financial institutions.
DIVIDEND POLICY
We currently intend to pay a quarterly cash dividend to holders of our common stock of approximately $0.06 per share commencing following the completion of the quarter during which Lilly no longer owns shares of our common stock, subject to the discretion of our board of directors.
Our ability to pay dividends is subject to certain limitations, and we may change our dividend policy at any time.
PERFORMANCE GRAPH
This graph compares the return on Elanco's common stock with that of the S&P 500 Stock Index and the S&P 500 Pharmaceuticals Index from September 20, 2018 (the first day our common stock was traded in conjunction with our IPO) through December 31, 2018. The graph assumes that, on September 20, 2018, a person invested $100 each in Elanco common stock, the S&P 500 Index, and the S&P 500 Pharmaceuticals Index. The graph measures total shareholder return, which takes into account both stock price and dividends. It assumes that dividends paid by a company are reinvested in that company’s stock.
48
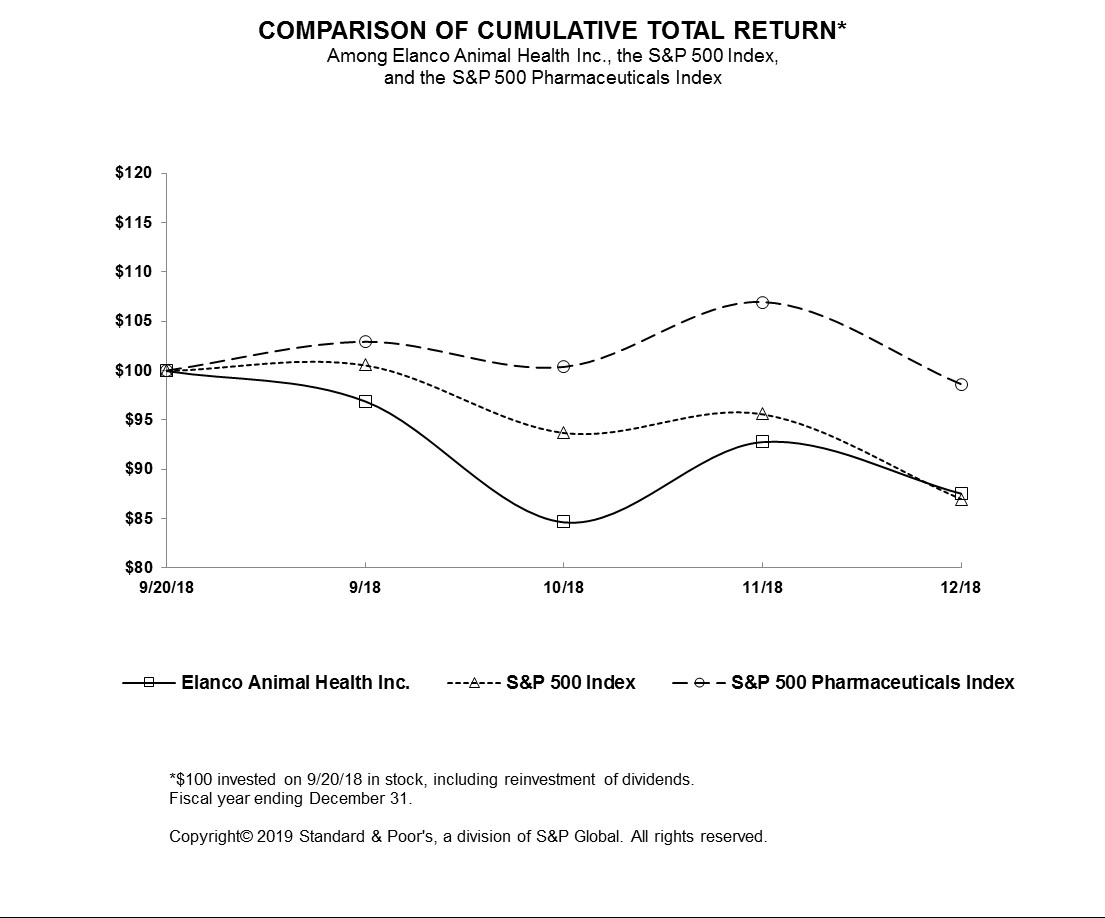
|
9/20/18
|
9/30/18
|
10/31/18
|
11/30/18
|
12/31/18
|
||
|
Elanco Animal Health Inc.
|
100.00
|
96.92
|
84.67
|
92.81
|
87.58
|
|
|
S&P 500 Index
|
100.00
|
100.57
|
93.70
|
95.60
|
86.97
|
|
|
S&P 500 Pharmaceuticals Index
|
100.00
|
102.91
|
100.36
|
106.93
|
98.62
|
|
Item 6. Selected Financial Data
The following tables set forth our selected historical consolidated and combined financial data for the periods indicated below.
Our consolidated and combined financial statements include the attribution of certain assets and liabilities that have historically been held at the Lilly corporate level but which are specifically identifiable or attributable to us. Through the completion of the IPO, our consolidated and combined financial statements also include expense allocations related to certain Lilly corporate functions, including executive oversight, treasury, legal, finance, human resources, tax, internal audit, financial reporting, information technology and investor relations. These expenses have been allocated to us based on direct usage or benefit where specifically identifiable, with the remainder allocated primarily on a pro rata basis of revenue, headcount or other measures. We believe that this expense methodology, and the results thereof, is reasonable for all periods presented. However, the allocations may not be indicative of the actual expense that would have been incurred if we would have operated as an independent, publicly traded company for the periods presented. It is impractical to estimate what our standalone costs would
49
have been for the historical periods presented. After the IPO, a Transitional Services Agreement (TSA) between Lilly and Elanco went into effect. Under the terms of the TSA, we will be able to use certain services and resources related to corporate functions historically provided to us by Lilly, such as executive oversight, treasury, legal, finance, human resources, tax, internal audit, financial reporting, information technology and investor relations (Lilly Services)
9
for a fixed term, established on a service-by-service basis. We are paying Lilly mutually agreed upon fees for the Lilly Services provided under the TSA. Our consolidated and combined financial statements reflect the charges for Lilly Services after the IPO.
The financial statements presented may not be indicative of our future performance and do not necessarily reflect what our financial position and results of operations would have been had we operated as an independent, publicly traded company for the periods presented prior to IPO.
|
ELANCO ANIMAL HEALTH INCORPORATED
(Dollars in millions, except per-share data)
|
2018
|
2017
|
2016
|
2015
|
2014
|
|||||||||||||||
|
Operations
|
||||||||||||||||||||
|
Revenue
|
$
|
3,066.8
|
|
$
|
2,889.0
|
|
$
|
2,913.5
|
|
$
|
2,909.1
|
|
$
|
2,066.0
|
|
|||||
|
Cost of sales
|
1,573.8
|
|
1,493.9
|
|
1,409.0
|
|
1,533.7
|
|
932.6
|
|
||||||||||
|
Research and development
|
246.6
|
|
251.7
|
|
265.8
|
|
291.0
|
|
208.5
|
|
||||||||||
|
Marketing, selling and administrative
|
735.2
|
|
779.8
|
|
784.8
|
|
916.0
|
|
561.2
|
|
||||||||||
|
Amortization of intangible assets
|
197.4
|
|
221.2
|
|
170.7
|
|
163.0
|
|
57.6
|
|
||||||||||
|
Asset impairment, restructuring and other special charges
|
128.8
|
|
375.1
|
|
308.4
|
|
263.3
|
|
38.8
|
|
||||||||||
|
Interest expense, net of capitalized interest
|
29.6
|
|
—
|
|
—
|
|
—
|
|
—
|
|
||||||||||
|
Other (income) expense, net
|
41.3
|
|
(0.1
|
)
|
(2.8
|
)
|
1.6
|
|
1.4
|
|
||||||||||
|
Income (loss) before income tax expense
|
114.1
|
|
(232.6
|
)
|
(22.4
|
)
|
(259.5
|
)
|
265.9
|
|
||||||||||
|
Income tax expense (benefit)
|
27.6
|
|
78.1
|
|
25.5
|
|
(48.7
|
)
|
101.0
|
|
||||||||||
|
Net income (loss)
|
$
|
86.5
|
|
$
|
(310.7
|
)
|
$
|
(47.9
|
)
|
$
|
(210.8
|
)
|
$
|
164.9
|
|
|||||
|
Net income (loss) as a percent of revenue
|
3
|
%
|
(11
|
)%
|
(2
|
)%
|
(7
|
)%
|
8
|
%
|
||||||||||
|
Net income (loss) per share - basic and diluted
|
$
|
0.28
|
|
$
|
(1.06
|
)
|
$
|
(0.16
|
)
|
$
|
(0.72
|
)
|
$
|
0.56
|
|
|||||
|
Weighted-average number of shares outstanding-diluted
|
313.7
|
|
293.3
|
|
293.3
|
|
293.3
|
|
293.3
|
|
||||||||||
|
Financial Position
|
||||||||||||||||||||
|
Total assets
|
$
|
8,956.7
|
|
$
|
8,940.3
|
|
$
|
8,099.7
|
|
$
|
8,433.6
|
|
$
|
2,980.6
|
|
|||||
|
Long term debt
|
$
|
2,443.3
|
|
$
|
—
|
|
$
|
—
|
|
$
|
—
|
|
$
|
—
|
|
|||||
|
Total liabilities
|
$
|
3,759.2
|
|
$
|
1,160.0
|
|
$
|
1,082.3
|
|
$
|
1,004.1
|
|
$
|
551.5
|
|
|||||
|
Total equity
|
$
|
5,197.5
|
|
$
|
7,780.3
|
|
$
|
7,017.4
|
|
$
|
7,429.5
|
|
$
|
2,429.1
|
|
|||||
50
Item 7. Management’s Discussion and Analysis of Results of Financial Condition and Results of Operations
Management’s discussion and analysis of financial condition and results of operations, is intended to assist the reader in understanding and assessing significant changes and trends related to the results of operations and financial position of our consolidated company. This discussion and analysis should be read in conjunction with the consolidated and combined financial statements and accompanying footnotes in Item 8 of Part II of this Annual Report on Form 10-K. Certain statements in this Item 7 of Part II of this Annual Report on Form 10-K constitute forward-looking statements. Various risks and uncertainties, including those discussed in "Forward-Looking Statements" and Item 1A, “Risk Factors,” may cause our actual results and cash generated from operations to differ materially from these forward-looking statements.
Overview
Founded in 1954 as part of Eli Lilly and Company, Elanco is a premier animal health company that innovates, develops, manufactures and markets products for companion and food animals. Headquartered in Greenfield, Indiana, we are the fourth largest animal health company in the world, with revenue of $3,066.8 million for the year ended December 31, 2018. Globally, we are #1 in medicinal feed additives, #2 in poultry and #3 in cattle, measured by 2017 revenue, according to Vetnosis.
We have one of the broadest portfolios of pet parasiticides in the companion animal sector. We offer a diverse portfolio of more than 125 brands that make us a trusted partner to veterinarians and food animal producers in more than 90 countries.
We operate our business in a single segment directed at fulfilling our vision of enriching the lives of people through food, making protein more accessible and affordable and through pet companionship, helping pets live longer, healthier lives. We advance our vision by offering products in four primary categories:
Companion Animal Disease Prevention (CA Disease Prevention)
: We have one of the broadest parasiticide portfolios in the companion animal sector based on indications, species and formulations, with products that protect pets from worms, fleas and ticks. Combining our parasiticide portfolio with our vaccines presence, we are a leader in the United States (U.S.) in the disease prevention category based on share of revenue.
Companion Animal Therapeutics (CA Therapeutics)
: We have a broad pain and osteoarthritis portfolio across species, modes of action, indications and disease stages. Pet owners are increasingly treating osteoarthritis in their pets, and our
Galliprant
product is one of the fastest growing osteoarthritis treatments in the U.S. We also have treatments for otitis (ear infections), as well as cardiovascular and dermatology indications.
Food Animal Future Protein & Health (FA Future Protein & Health)
: Our portfolio in this category, which includes vaccines, nutritional enzymes and animal only antibiotics, serves the growing demand for protein and includes innovative products in poultry and aquaculture production, where demand for animal health products is outpacing overall industry growth. We are focused on developing functional nutritional health products that promote food animal health, including enzymes, probiotics and prebiotics. We are a leader in providing vaccines as alternatives to antibiotics to promote animal health based on share of revenue.
Food Animal Ruminants & Swine (FA Ruminants & Swine)
: We have developed a range of food animal products used extensively in ruminant (e.g., cattle, sheep and goats) and swine production.
For the years ended December 31, 2018, 2017 and 2016, our revenue was
$3,066.8 million
,
$2,889.0 million
and
$2,913.5 million
, respectively. For the years ended December 31, 2018, 2017 and 2016, our net income (loss) was
$86.5 million
,
$(310.7) million
and
$(47.9) million
, respectively.
Key Trends and Conditions Affecting Our Results of Operations
Industry Trends
The animal health industry, which focuses on both food animals and companion animals, is a growing industry that benefits billions of people worldwide.
As demand for animal protein grows, food animal health is becoming increasingly important. Factors influencing growth in demand for food animal medicines and vaccines include:
51
• one in three people need improved nutrition;
• increased global demand for protein, particularly poultry and aquaculture;
• natural resource constraints, such as scarcity of arable land, fresh water and increased competition for cultivated land, driving the need for more efficient food production;
• loss of productivity due to food animal disease and death;
• increased focus on food safety and food security; and
• human population growth, increased standards of living, particularly in many emerging markets, and increased urbanization.
Growth in food animal nutritional health products (enzymes, probiotics and prebiotics) is influenced, among other factors, by demand for antibiotic alternatives that can promote animal health and increase productivity.
Factors influencing growth in demand for companion animal medicines and vaccines include:
• increased pet ownership globally;
• pets living longer; and
• increased pet spending as pets are viewed as members of the family by owners.
Product Development and New Product Launches
A key element of our targeted value creation strategy is to drive growth through portfolio development and product innovation, primarily in our three targeted growth categories. Our eleven product launches between 2015 and December 31, 2018, have had a significant positive impact on our revenue over those periods, and we expect new products and innovation will continue to have a positive impact on revenue in the future. Revenue from these product launches contributed $274.2 million to revenue for the year ended December 31, 2018. We continue to pursue the development of new chemical and biological molecules through our approach to innovation. Our future growth and success depends on both our pipeline of new products, including new products that we may develop through joint ventures and products that we are able to obtain through license or acquisition, and the expansion of the use of our existing products. We believe we are an industry leader in animal health R&D with a track record of product innovation, business development and commercialization.
Impact of Changing Market Demand for Antibiotics
In recent years, our operational results have been, and will continue to be, affected by regulations and changing market demand relating to the use of antibiotics and other products intended to increase food animal production.
There are two classes of antibiotics used in animal health, shared-class, or medically important, antibiotics and animal-only antibiotics. Shared-class antibiotics are used to treat infectious disease caused by pathogens that occur in both humans and animals. As part of our antibiotic stewardship plan and in compliance with FDA guidance, shared-class antibiotics are labeled only for the treatment of an established need in animals and only with veterinarian oversight. However, not all pathogens that cause disease in animals are infectious in humans, and accordingly animal-only antibiotics are not used in human medicine (i.e., not medically important). From 2015 to 2018, our revenue from shared-class antibiotics declined at a CAGR of 6%, excluding the impact of foreign exchange. This was driven primarily by changing regulations in many markets, including the Veterinary Feed Directive, as well as changing market demand and Elanco’s tiered-approach to antibiotic stewardship, which included removing growth promotion from labels and requiring veterinary oversight in the U.S. and other markets.
Globally, during 2018, our revenue from shared-class antibiotics declined 2%, excluding the impact of foreign exchange, and represented 12% (4% from sales in the U.S. and 8% from sales outside of the U.S.) of our total revenue, down from 16% in 2015. From 2015 to 2018, our revenue from animal-only antibiotics grew at a CAGR of 5%, excluding the impact of foreign exchange, driven by sales outside the U.S., which offset a slight decline in the U.S. Globally, during 2018, our revenue from animal-only antibiotics grew 8%, excluding the impact of foreign exchange, and represented 25% of our total revenue, up from 23% in 2015. During 2018, 87% of our revenue from animal-only antibiotics resulted from the sale of ionophores. Ionophores are a special class of animal-only antimicrobials, and because of their animal-only designation, mode of action and spectrum of activity, their use, to date have not been impacted by regulations or changing market demand in many markets outside the U.S.
We have intentionally shifted away from shared-class antibiotics, and are focusing on animal-only antibiotics, as well as antibiotic-free solutions. When an animal-only antibiotic exists, we believe it should be the first, preferred antibiotic treatment. Antibiotic resistance concerns, or other health concerns regarding food animal products, may result in additional restrictions, expanded regulations or changes in market demand to further reduce the use of
52
antibiotics in food animals. We believe it is important to protect the benefits of antibiotics in human medicine, while responsibly protecting the health of food animals and the safety of our food supply.
Impact of Competition
The animal health industry is competitive. Established animal health companies who consistently deliver high quality products enjoy brand loyalty from their customers, which often continues after the loss of patent-based or regulatory exclusivity. In 2018, approximately 72% of our revenue was from products that did not have patent protection. In animal health, while potentially significant, erosion from generic competition is often not as steep as in human health, with the originator often retaining a significant market share. While our largest product, Rumensin, has been subject to generic competition from monensin outside the U.S. for more than 10 years, our revenue from Rumensin sales outside the U.S. grew at a CAGR of 5% from 2015 to 2018. However, generic competition can nevertheless significantly affect our results. We have experienced significant competitive headwinds from generic ractopamine in the U.S. In the third quarter of 2013, a large, established animal health company received U.S. approval for generic ractopamine. U.S. revenue for Optaflexx, our ractopamine beef product, has declined at a CAGR of 24% from 2015 to 2018 as a result of generic competition and the impact of international regulatory restrictions. In 2018, we had an estimated 70% market share of all U.S. ractopamine-treated beef cattle based on management estimates.
Although we believe brand loyalty is an important contributor to a product's ongoing success, the animal health industry is also impacted by innovation. We experienced an innovation lag in the companion animal parasiticide space from 2015 to 2017. In the absence of a competitive combined oral flea and tick product, our U.S. companion animal parasiticide portfolio revenue declined 15% in 2017, excluding the impact on revenue resulting from a reduction in inventory levels within our distribution channel. In February 2018, we launched Credelio in the U.S. for the treatment of fleas and ticks. Since the launch of Credelio, our sales of parasiticides in the U.S. have begun to grow again.
Productivity
Our results during the periods presented have benefited from operational and productivity initiatives implemented following recent acquisitions and in response to changing market demand for antibiotics and other headwinds.
Our acquisitions of Lohmann Animal Health in 2014, Novartis Animal Health in 2015 and the BI Vetmedica U.S. vaccines portfolio in 2017, added in the aggregate $1.4 billion in revenue, 4,500 full-time employees, 12 manufacturing and eight R&D sites. In addition, from 2015 to 2018, changing market demand for antibiotics and other headwinds, such as competition with generics and innovation, affected some of our highest gross margin products, resulting in a change to our product mix and driving operating margin lower. In response, we implemented a number of initiatives across manufacturing, R&D and SG&A. Our manufacturing cost savings strategies included improving manufacturing processes and headcount through lean manufacturing (minimizing waste while maintaining productivity), closing of three manufacturing sites, consolidating our CMO network, strategically insourcing certain projects, and pursuing cost savings opportunities with respect to raw materials via a new procurement process. Additional cost savings resulted from reducing the number of R&D sites from 16 to nine, SG&A savings from sales force consolidation, and reducing discretionary and other G&A operating expense.
Foreign Exchange Rates
Significant portions of our revenue and costs are exposed to changes in foreign exchange rates. Our products are sold in more than 90 countries and, as a result, our revenue is influenced by changes in foreign exchange rates. For the years ended December 31, 2018 and 2017, approximately 52% and 50%, respectively, of our revenue was denominated in foreign currencies. We seek to manage foreign exchange risk, in part, through operational means, including managing same‑currency revenue in relation to same‑currency costs, and same‑currency assets in relation to same‑currency liabilities. As we operate in multiple foreign currencies, including the euro, British pound, Brazilian real, Australian dollar, Japanese yen, Canadian dollar, Chinese yuan, and other currencies, changes in those currencies relative to the U.S. dollar will impact our revenue, cost of goods and expenses, and consequently, net income. Exchange rate fluctuations in emerging markets may also have an impact beyond our reported financial results and directly impact operations. These fluctuations may also affect the ability to buy and sell our products between markets impacted by significant exchange rate variances. Foreign exchange rates had a negligible effect on revenue from 2016 to 2018.
General Economic Conditions
In addition to industry-specific factors, we, like other businesses, face challenges related to global economic conditions. Growth in both the food animal and companion animal sectors is driven in part by overall economic development and related growth, particularly in many emerging markets. In recent years, certain of our customers and suppliers have been affected directly by economic downturns, which decreased the demand for our products.
53
The cost of our products to food animal producers is small relative to their other production costs, including feed, and the use of our products is intended to improve economic outcomes for food animal producers. Similarly, industry sources have reported that pet owners indicated a preference for reducing spending on other aspects of their lifestyle, including entertainment, clothing and household goods, before reducing spending on pet care. While these factors have mitigated the impact of recent downturns in the global economy, further economic challenges could increase cost sensitivity among our customers, which may result in reduced demand for our products and could have a material adverse effect on our financial condition and results of operations.
Weather Conditions and the Availability of Natural Resources
The animal health industry and demand for many of our animal health products in a particular region are affected by weather conditions, varying weather patterns and weather-related pressures from pests, such as fleas and ticks. As a result, we may experience regional and seasonal fluctuations in our results of operations.
Food animal producers depend on the availability of natural resources, including large supplies of fresh water. Their animals' health and their ability to operate could be adversely affected if they experience a shortage of fresh water due to human population growth or floods, droughts or other weather conditions.
Drought conditions could negatively impact, among other things, the supply of corn and the availability of grazing pastures. A decrease in harvested corn results in higher corn prices, which could negatively impact the profitability of food animal producers of ruminants, pork and poultry. Higher corn prices and reduced availability of grazing pastures contribute to reductions in herd or flock sizes that in turn result in less spending on animal health products. As such, a prolonged drought could have a material adverse effect on our financial condition and results of operations. Factors influencing the magnitude and timing of effects of a drought on our performance include, but may not be limited to, weather patterns and herd management decisions.
In addition, veterinary hospitals and practitioners depend on visits from and access to the animals under their care. Veterinarians' patient volume and ability to operate could be adversely affected if they experience prolonged snow, ice or other severe weather conditions, particularly in regions not accustomed to sustained inclement weather. Adverse weather conditions or a shortage of fresh water may cause veterinarians and food animal producers to purchase less of our products.
Disease Outbreaks
Sales of our food animal products could be adversely affected by the outbreak of disease carried by animals. Outbreaks of disease may reduce regional or global sales of particular animal-derived food products or result in reduced exports of such products, either due to heightened export restrictions or import prohibitions, which may reduce demand for our products. Also, the outbreak of any highly contagious disease near our main production sites could require us to immediately halt production of our products at such sites or force us to incur substantial expenses in procuring raw materials or products elsewhere. Alternatively, sales of products that treat specific disease outbreaks may increase.
Manufacturing and Supply
In order to sell our products, we must be able to reliably produce and ship our products in sufficient quantities. Many of our products involve complex manufacturing processes and are sole-sourced from certain manufacturing sites.
Minor deviations in our manufacturing or logistical processes, unpredictability of a product's regulatory or commercial success or failure, the lead time necessary to construct highly technical and complex manufacturing sites, and shifting customer demand increase the potential for capacity imbalances.
Components of Revenue and Costs and Expenses
Revenue
Our revenue is primarily derived from sales of our products to third-party distributors, and directly to food producers and veterinarians. For additional information regarding our products, including descriptions of our products, see "Item 1. Business — Products."
We aggregate our products into five categories to understand revenue growth:
|
•
|
CA Disease Prevention includes parasiticides and vaccine products for dogs and cats;
|
|
•
|
CA Therapeutics includes products for the treatment of pain, osteoarthritis, otitis, cardiovascular and dermatology indications in dogs and cats;
|
54
|
•
|
FA Future Protein & Health includes vaccines, antibiotics, parasiticides and other products used in poultry and aquaculture production, as well as functional nutritional health products, including enzymes, probiotics and prebiotics;
|
|
•
|
FA Ruminants & Swine includes vaccines, antibiotics, implants, parasiticides, and other products used in ruminants and swine production, as well as certain other food animal products; and
|
|
•
|
Strategic Exits includes business activities that we have either exited or made the strategic decision to exit, including the transitional contract manufacturing activity that we acquired in connection with our acquisition of the BI Vetmedica U.S. vaccines portfolio, two terminated legacy U.S. distribution agreements, a terminated distribution agreement outside the U.S.; an equine product not core to our business and a transitional contract manufacturing activity associated with the supply to Lilly of human growth hormone.
|
Costs, Expenses and Other
Cost of sales
consists primarily of cost of materials, facilities and other infrastructure used to manufacture our products, shipping and handling, inventory losses and expired products.
Marketing, selling and administrative expenses
consist of, among other things, the costs of marketing, promotion and advertising and the costs of administration (business technology, facilities, legal, finance, human resources, business development, external affairs and procurement).
Amortization of intangible assets
consist of the amortization expense for intangible assets that have been acquired through business combinations.
R&D expenses
consist of project costs specific to new product R&D and product lifecycle management, overhead costs associated with R&D operations, regulatory, product registrations and investments that support local market clinical trials for approved indications. We manage overall R&D based on our strategic opportunities and do not disaggregate our R&D expenses incurred by nature or by product as we do not use or maintain such information in managing our business.
Asset impairment, restructuring and other special charges
consists primarily of impairment of long-term assets, restructuring charges, costs associated with acquiring and integrating businesses, and certain non-recurring expenses, including costs related to the build out of processes and systems to support finance and global supply and logistics, among others, as we become an independent company.
Other (income) expense, net
consists of net interest (income)/expense, realized or unrealized foreign exchange losses and loss or impairment on other investments.
Comparability of Historical Results
Our historical results of operations for the periods presented may not be comparable with prior periods or with our results of operations in the future, due to many factors, included but not limited to the factors identified in "Key Trends and Conditions Affecting Our Results of Operations."
Our Relationship with Lilly and Additional Standalone Costs
Prior to IPO, our business operated solely as part of a division of Lilly. Our consolidated and combined financial statements have been derived from Lilly’s consolidated financial statements and accounting records for the periods prior to the IPO. Our consolidated and combined financial statements reflect our financial position, results of operations and cash flows of the business that were transferred at the time of the separation and do not purport to reflect what the results of operations, comprehensive income/(loss), financial position, equity or cash flows would have been had we operated as an independent, publicly traded company during the periods presented prior to the IPO.
Our historical and current results reflect an allocation of costs for certain Lilly corporate costs for the periods prior to the IPO, including, among others, executive oversight, treasury, legal, finance, human resources, tax, internal audit, financial reporting, information technology and investor relations. These allocations are not necessarily indicative of the expenses we may incur as a standalone public company. Although we entered into certain agreements with Lilly in connection with the IPO and the separation, the amount and composition of our expenses may vary from historical levels since the fees charged for the services under the agreement may be higher or lower than the costs reflected in the historical allocations. The total allocations included in our results for the years ended December 31, 2018, 2017 and 2016 were $105.2 million,
$151.7 million
, and
$145.3 million
, respectively. See Note 19: Related Party Agreements and Transactions to our consolidated and combined financial statements.
We are currently investing in expanding our own administrative functions, including, but not limited to, information technology, facilities management, distribution, human resources, finance and manufacturing, to replace services
55
previously provided by Lilly. Because of initial stand‑up costs and overlaps with services previously provided by Lilly, we have incurred and expect to continue to incur certain temporary, duplicative expenses in connection with the separation. We also incurred and expects to continue to incur costs related to the build out of processes and systems to support finance and global supply and logistics, among others. We currently estimate these costs in aggregate to be in a range from $240 million to $290 million, of which a portion will be capitalized and the remainder will be expensed.
Lilly utilizes a centralized treasury management system, of which we were part of until our IPO. For periods prior to the IPO, our consolidated and combined financial statements reflect cash held only in bank accounts in our legal name and no allocation of combined cash positions. Our consolidated and combined financial statements do not reflect an allocation of Lilly’s debt or any associated interest expense. In connection with the IPO, we incurred $2.5 billion of long-term borrowings. Our historical results reflect $29.6 million of interest expense during the year ended December 31, 2018 due to the timing of the borrowings, in comparison to our estimated interest expense of approximately $110.0 million on an annual basis.
For the periods prior to the IPO, our consolidated and combined financial statements reflect income tax expense (benefit) computed on a separate company basis, as if operating as a standalone entity or a separate consolidated group in each material jurisdiction in which we operate. Our consolidated and combined financial statements for the periods prior to the IPO also reflect certain deferred tax assets and liabilities and income taxes payable based on this approach that did not transfer to us upon the separation, as the underlying tax attributes were used by Lilly or retained by Lilly. As a result of potential changes to our business model and the fact that certain deferred tax assets and liabilities and income taxes payable did not transfer to us, income tax expense (benefit) included in the consolidated and combined financial statements may not be indicative of our future expected tax rate.
Our historical results also do not reflect the impact of costs we have incurred and expect to continue to incur as a consequence of becoming a standalone company, including incremental costs associated with being a publicly traded company.
We are seeking to institute competitive compensation policies and programs as a standalone public company, the expense for which may differ from the compensation expense allocated by Lilly in our consolidated and combined financial statements.
As a result of the IPO, we became subject to the reporting requirements of the Exchange Act and the Sarbanes‑Oxley Act. We have additional procedures and practices to establish or expand as a standalone public company. As a result, we will continue to incur additional costs as a standalone public company, including internal audit, external audit, investor relations, stock administration, stock exchange fees and regulatory compliance costs.
Recent Significant Acquisitions
Our financial results have been impacted by acquisitions and integrations. For the periods presented, these include primarily the acquisitions and integrations of Novartis Animal Health, which closed on January 1, 2015, certain rights to develop, manufacture, market and commercialize Galliprant outside the U.S. and co-promote it in the U.S. acquired from Aratana Therapeutics, Inc., which closed on April 22, 2016, and Boehringer Ingelheim Vetmedica, Inc.'s U.S. feline, canine and rabies vaccine portfolio and other related assets (BIVIVP), which closed on January 3, 2017. For more information, see Note 6: Acquisitions to our consolidated and combined financial statements.
Asset Impairment, Restructuring and Other Special Charges
During the years ended December 31, 2018, 2017 and 2016 including in connection with the productivity initiatives described above under "Key Trends and Conditions Affecting Our Results of Operations - Productivity," we incurred charges related to asset impairment, restructuring and other special charges, including integration of acquired businesses. These charges include severance costs resulting from actions taken to reduce our costs, asset impairment charges primarily related to competitive pressures for certain companion animal products, product rationalizations, site closures and integration costs related to acquired businesses, primarily Novartis Animal Health and costs related to the build out of processes and systems to support finance and global supply and logistics, among others, as we become an independent company.
For more information on these charges, see Note 7: Asset Impairment, Restructuring and Other Special Charges to our consolidated and combined financial statements.
56
Results of Operations
The following discussion and analysis of our consolidated and combined statements of operations should be read along with our consolidated and combined financial statements and the notes thereto included elsewhere in this report, which reflect the results of operations of the business transferred to Elanco from Lilly. For more information see Note 2: Basis of Presentation to our consolidated and combined financial statements.
57
|
|
Year Ended December 31,
|
% Change
|
|||||||||||||
|
|
2018
|
2017
|
2016
|
18/17
|
17/16
|
||||||||||
|
Revenue
|
$
|
3,066.8
|
|
$
|
2,889.0
|
|
$
|
2,913.5
|
|
6%
|
(1)%
|
||||
|
Costs, expenses and other:
|
|||||||||||||||
|
Cost of sales
|
1,573.8
|
|
1,493.9
|
|
1,409.0
|
|
5%
|
6%
|
|||||||
|
% of revenue
|
51
|
%
|
52
|
%
|
48
|
%
|
|||||||||
|
Research and development
|
246.6
|
|
251.7
|
|
265.8
|
|
(2)%
|
(5)%
|
|||||||
|
% of revenue
|
8
|
%
|
9
|
%
|
9
|
%
|
|||||||||
|
Marketing, selling and administrative
|
735.2
|
|
779.8
|
|
784.8
|
|
(6)%
|
(1)%
|
|||||||
|
% of revenue
|
24
|
%
|
27
|
%
|
27
|
%
|
|||||||||
|
Amortization of intangible assets
|
197.4
|
|
221.2
|
|
170.7
|
|
(11)%
|
30%
|
|||||||
|
% of revenue
|
6
|
%
|
8
|
%
|
6
|
%
|
|||||||||
|
Asset impairment, restructuring and other special charges
|
128.8
|
|
375.1
|
|
308.4
|
|
(66)%
|
22%
|
|||||||
|
Interest expense, net of capitalized interest
|
29.6
|
|
—
|
|
—
|
|
NM
|
NM
|
|||||||
|
Other (income) expense, net
|
41.3
|
|
(0.1
|
)
|
(2.8
|
)
|
NM
|
NM
|
|||||||
|
Income (loss) before taxes
|
114.1
|
|
(232.6
|
)
|
(22.4
|
)
|
NM
|
NM
|
|||||||
|
% of revenue
|
4
|
%
|
(8
|
)%
|
(1
|
)%
|
NM
|
NM
|
|||||||
|
Income tax expense
|
27.6
|
|
78.1
|
|
25.5
|
|
NM
|
NM
|
|||||||
|
Net income (loss)
|
$
|
86.5
|
|
$
|
(310.7
|
)
|
$
|
(47.9
|
)
|
NM
|
NM
|
||||
Certain amounts and percentages may reflect rounding adjustments.
Revenue
On a global basis, our revenue within our product categories was as follows:
|
Year Ended December 31,
|
% Change
|
||||||||||||||
|
2018
|
2017
|
2016
|
18/17
|
17/16
|
|||||||||||
|
CA Disease Prevention
|
$
|
804.6
|
|
$
|
660.2
|
|
$
|
628.4
|
|
22%
|
5%
|
||||
|
CA Therapeutics
(1)
|
283.1
|
|
260.8
|
|
255.6
|
|
9%
|
2%
|
|||||||
|
FA Future Protein & Health
|
711.2
|
|
649.2
|
|
630.8
|
|
10%
|
3%
|
|||||||
|
FA Ruminants & Swine
|
1,174.0
|
|
1,175.0
|
|
1,309.2
|
|
(0)%
|
(10)%
|
|||||||
|
Subtotal
|
2,972.9
|
|
2,745.2
|
|
2,824.0
|
|
8%
|
(3)%
|
|||||||
|
Strategic Exits
(1)
|
93.9
|
|
143.8
|
|
89.5
|
|
(35)%
|
61%
|
|||||||
|
Total
|
$
|
3,066.8
|
|
$
|
2,889.0
|
|
$
|
2,913.5
|
|
6%
|
(1)%
|
||||
|
(1)
|
Represents revenue from business activities we have either exited or made a strategic decision to exit. On June 30, 2018, Elanco made the decision to exit an equine product not core to its business. Revenue from this product is reflected in Strategic Exits for the year ended December 31, 2018 and in CA Therapeutics for the years ended December 31, 2017 and 2016. Revenue from this product was $1.6 million, $3.4 million and $3.7 million, for the years ended December 31, 2018, 2017 and 2016, respectively.
|
On a global basis, the effect of price, foreign exchange rates and volumes on revenue was as follows:
58
|
Full year 2018
|
Revenue
|
Price
|
FX Rate
|
Volume
|
Total
|
CER*
|
||||||
|
CA Disease Prevention
|
$804.6
|
8%
|
0%
|
14%
|
22%
|
22%
|
||||||
|
CA Therapeutics
|
283.1
|
7%
|
1%
|
0%
|
9%
|
7%
|
||||||
|
FA Future Protein & Health
|
711.2
|
4%
|
(0)%
|
6%
|
10%
|
10%
|
||||||
|
FA Ruminants & Swine
|
1,174.0
|
(1)%
|
(0)%
|
1%
|
(0)%
|
(0)%
|
||||||
|
Core Revenue
|
$2,972.9
|
3%
|
0%
|
5%
|
8%
|
8%
|
||||||
|
Strategic Exits
|
93.9
|
(0)%
|
0%
|
(34)%
|
(35)%
|
(35)%
|
||||||
|
Total Elanco
|
$3,066.8
|
3%
|
0%
|
3%
|
6%
|
6%
|
||||||
Note: Numbers may not add due to rounding
*CER = Constant exchange rate
Revenue
Total revenue
2018 vs. 2017
Total revenue increased 177.8 million or 6% in 2018 as compared to 2017, reflecting a 3% increase due to higher realized prices and a 3% increase due to higher volumes.
In summary, the total revenue increase was due primarily to:
|
•
|
an increase in revenue of $142.1 million or 22% from CA Disease Prevention products, excluding the impact of foreign exchange rates;
|
|
•
|
an increase in revenue of $18.4 million or 7% from CA Therapeutics products, excluding the impact of foreign exchange rates;
|
|
•
|
an increase in revenue of $63.8 million or 10% from FA Future Protein & Health products, excluding the impact of foreign exchange rates and
|
partially offset by:
|
•
|
a decrease in revenue of $0.8 million or 0% from FA Ruminants & Swine, excluding the impact of foreign exchange rates and
|
|
•
|
a decrease in revenue of $49.9 million or 35% from Strategic Exits, excluding the impact of foreign exchange rates.
|
The detailed change in revenue by product category was as follows:
|
•
|
CA Disease Prevention revenue increased by $144.4 million or 22% due primarily to a reduction in channel inventory in 2017 providing a favorable year-on-year comparison, continued uptake of Credelio and Interceptor Plus, as well as realized price increases primarily impacting Trifexis, Capstar (a flea treatment) and Comfortis, partially offset by volume declines in certain parasiticides, primarily Trifexis and Comfortis volumes.
|
|
•
|
CA Therapeutics revenue increased by $22.3 million or 9% due primarily to the continued uptake of Galliprant and Osurnia, as well as increased demand for Onsior, partially offset by a temporary supply shortage of Percorten V used for the treatment of canine Addison’s Disease.
|
|
•
|
FA Future Protein & Health revenue increased by $62.0 million or 10% due primarily to the launch of Imvixa and the growth in poultry animal-only antibiotics and poultry vaccines.
|
|
•
|
FA Ruminants & Swine revenue decreased by $1.0 million due primarily to competitive headwinds for ractopamine based products, offset by growth in animal-only antibiotics, primarily in cattle.
|
|
•
|
Strategic Exits revenue decreased by $49.9 million or 35% due primarily to the termination of a legacy U.S. distribution agreement in the third quarter of 2017, partially offset by revenue from the contract manufacturing agreement to supply human growth hormone to Lilly.
|
2017 vs. 2016
59
Total revenue decreased $24.5 million or 1% in 2017 as compared to 2016 due to lower volumes.
In summary, the total revenue decrease was due primarily to:
• a decline in revenue of $133.6 million or 10% from FA Ruminants & Swine products, excluding the impact of foreign exchanges rates; and
• a decline in revenue of $113.6 million or 18% from CA Disease Prevention products, excluding the impact of acquisition and foreign exchange rates;
partially offset by:
• the acquisition of the BIVIVP which contributed $216.7 million in 2017; and
• an increase in revenue of $18.7 million or 3% from FA Future Protein & Health products, excluding the impact of foreign exchange rates.
The detailed change in revenue by product category was as follows:
• CA Disease Prevention revenue increased by $31.8 million or 5%. Excluding product revenue from the acquisition of the BIVIVP and the impact of foreign exchange rates, revenue declined $113.6 million or 18% due primarily to competition in certain parasiticides, primarily impacting Trifexis and Comfortis, and a reduction in inventory levels within our U.S. companion animal distribution channel partially offset by the growth of Interceptor Plus.
• CA Therapeutics revenue increased by $5.2 million or 2% due primarily to the launch of Galliprant, partially offset by volume declines from competition in our dermatology portfolio.
• FA Future Protein & Health revenue increased by $18.4 million or 3% due primarily to growth in poultry products, including animal-only antibiotics, enzymes and vaccines, and to lesser extent aquaculture products.
• FA Ruminants & Swine revenue decreased by $134.2 million or 10% due primarily to competition from generic ractopamine-based products, as well as declines in shared-class antibiotics and a reduction in inventory levels within our China distribution channel, partially offset by growth in animal-only antibiotics.
• Strategic Exits revenue increased by $54.3 million or 61% due primarily to the acquisition of a transitional contract manufacturing arrangement at Fort Dodge as part of the BIVIVP acquisition, partially offset by the termination in the third quarter of 2017 of a legacy U.S. distribution agreement acquired as part of our Novartis Animal Health acquisition.
Costs, Expenses and Other
Cost of sales
2018 vs. 2017
Cost of sales increased
$79.9 million
in 2018 as compared to 2017 primarily due to increased volume of products sold and the write-off of inventory related to the suspension of activities for Imrestor in 2018, partially offset by non-recurring costs incurred in 2017 associated with fair value adjustments to inventory acquired in the BIVIVP acquisition and subsequently sold.
2017 vs. 2016
Cost of sales increased $84.9 million in 2017 as compared to 2016 due primarily to:
• the addition of approximately $134.1 million of costs in 2017 related to the acquisition of the BIVIVP, including $54.0 million associated with Strategic Exits contract manufacturing obligations and approximately $42.7 million in non-recurring costs associated with the incremental purchase accounting charges related to the fair value adjustments to inventory acquired that was subsequently sold;
• an unfavorable product mix as a result of disproportional revenue decreases of higher margin products primarily resulting from changing market demand for antibiotics and competition headwinds; and
• contractual increases in third-party manufacturing agreements; partially offset by:
• operational efficiencies and cost savings associated with manufacturing footprint consolidation and overall cost reductions.
Research and development
2018 vs. 2017
60
R&D expenses decreased
$5.1 million
for 2018 as compared to 2017 due primarily to cost control measures and timing of projects leading to lower spend in 2018.
2017 vs. 2016
R&D expenses decreased $14.1 million in 2017 as compared to 2016 due primarily to savings realized from the consolidation of acquired R&D sites and operations, as well as the termination of certain R&D projects. This decrease was partially offset by expenses incurred in connection with the acquisition of the BIVIVP in 2017.
Marketing, selling and administrative
2018 vs. 2017
Marketing, selling and administrative expenses decreased
$44.6 million
for 2018 as compared to 2017 due primarily to productivity initiatives in sales and administrative functions and reduced direct to consumer programs combined with new product launches in 2017.
2017 vs. 2016
Marketing, selling and administrative expenses decreased $5.0 million in 2017 as compared to 2016 due primarily to savings from productivity initiatives related to salesforce, marketing and administrative functions, more than offsetting the increase from the acquisition of the BIVIVP.
Amortization of intangible assets
2018 vs. 2017
Amortization of intangible assets decreased
$23.8 million
for 2018 as compared to 2017 due primarily to the acceleration of amortization related to certain product exits in 2017.
2017 vs. 2016
Amortization of intangible assets increased $50.5 million in 2017 as compared to 2016 due primarily to the impact of the acquisition of the BIVIVP and, to a lesser extent, the acceleration of amortization related to certain product exits.
Asset impairment, restructuring and other special charges
For additional information regarding our asset impairment, restructuring and other special charges, see Note 7: Asset Impairment, Restructuring and Other Special Charges to our consolidated and combined financial statements.
2018 vs. 2017
Asset impairment, restructuring and other special charges decreased $246.3 million for the year ended December 31, 2018 as compared to the year ended December 31, 2017 primarily due to a decrease in severance related to the U.S. voluntary early retirement program offered in 2017 as well as a decrease in integration costs related to the BIVIVP acquisition in 2017, partially offset by a gain on disposal of a site that was previously closed as part of the acquisition and integration of Novartis Animal Health in 2017.
2017 vs. 2016
Asset impairment, restructuring and other special charges increased $66.7 million in 2017 as compared to 2016 due primarily to higher severance costs recognized in 2017 due to the U.S. voluntary early retirement program offered to our employees, partially offset by lower integration costs relating to our acquired businesses.
Interest expense, net of capitalized interest
2018 vs 2017
Interest expense was
$29.6 million
for the year ended December 31, 2018 due our issuance of debt in Q3 of 2018. There was no interest expense in 2017 and prior years.
Other (income) expense, net
2018 vs 2017
Other (income) expense, net was expense of
$41.3 million
in 2018 compared to income of
$0.1 million
in 2017. The increase in expense is primarily due to the increase in the Aratana contingent consideration liability of
$37.6 million
associated with the Galliprant acquisition.
2017 vs 2016
61
Other (income) expense, net was flat when comparing 2017 to 2016 with income of
$0.1 million
in 2017 compared to income of
$2.8 million
in 2016, a decrease of $2.7 million.
Income tax expense
Elanco’s historical income tax expense may not be indicative of its future expected tax rate. See “- Comparability of Historical Results - Our Relationship with Lilly and Additional Standalone Costs.”
2018 vs. 2017
Income tax expense decreased
$50.5 million
for the year ended December 31, 2018 as compared to the year ended December 31, 2017 primarily due to a decrease in the U.S. valuation allowance which was recorded in 2017 based upon the pre-IPO separate return methodology (see Note 2: Basis of Presentation and Note 14: Income Taxes to the consolidated financial statements).
2017 vs. 2016
Income tax expense, increased $52.6 million due primarily to an increase in unrecognized deferred tax assets in 2017 due to a valuation allowance and the tax effect of asset impairment, restructuring and other special charges, partially offset by an income tax benefit related to U.S. tax reform.
Liquidity and Capital Resources
We historically participated in Lilly’s centralized treasury management system, including centralized cash pooling and overall financing arrangements. We have generated and expect to continue to generate positive cash flows from operations. In connection with the IPO, we entered into various long-term debt agreements as described below.
Our primary sources of liquidity are cash on hand, cash flows from operations and funds available under our Credit Facilities. As a significant portion of our business is conducted outside the U.S., we hold a significant portion of cash outside of the U.S. We monitor and adjust the amount of foreign cash based on projected cash flow requirements. Our ability to use foreign cash to fund cash flow requirements in the U.S. may be impacted by local regulations and, to a lesser extent, following U.S. tax reforms, the income taxes associated with transferring cash to the U.S. See “Item 1. Business." We currently intend to indefinitely reinvest foreign earnings for continued use in our foreign operations. As our structure evolves as a standalone company, we may change that strategy, particularly to the extent we identify tax efficient reinvestment alternatives for our foreign earnings or change our cash management strategy.
Our principal liquidity needs going forward include funding existing marketed and pipeline products, capital expenditures, business development in our targeted areas, interest expense and an anticipated dividend. We believe our cash and cash equivalents on hand, our operating cash flows and our existing financing arrangements will be sufficient to support our cash needs for the foreseeable future, including for at least the next 12 months.
Our ability to meet future funding requirements may be impacted by macroeconomic, business and financial volatility. As markets change, we will continue to monitor our liquidity position. However, a challenging economic environment or an economic downturn may impact our liquidity or ability to obtain future financing. See "Item 1A. Risk Factors - We may not be able to generate sufficient cash to service all of our indebtedness and may be forced to take other actions to satisfy our obligations under our indebtedness, which may not be successful.
As of December 31, 2018, cash and cash equivalents was
$474.8 million
, an increase of
$151.4 million
, compared to $323.4 million at December 31, 2017. We also held $202.7 million of restricted cash at December 31, 2018, which is available solely to pay the remainder of the purchase for our businesses to Lilly. We have a corresponding liability recorded on our balance sheet and included in Payable to Lilly. Refer to the Consolidated and Combined Statements of Cash Flows for additional details on the significant sources and uses of cash for the years ended December 31, 2018 and December 31, 2017.
Revolving and Term Credit Facilities
On September 5, 2018, we entered into a revolving credit agreement with a syndicate of banks providing for a five-year $750.0 million senior unsecured revolving credit facility (Revolving Facility). The Revolving Facility bears interest at a variable rate plus specified margin as defined in the agreement and is payable quarterly. There were no borrowings outstanding under the Revolving Facility at December 31, 2018. The Revolving Facility is payable in full at the end of the term.
On September 5, 2018 we also entered into a $500.0 million three-year term loan under a term credit facility with a syndicate of banks (the Term Facility and collectively with the Revolving Facility, the Credit Facilities.) The Term Facility bears interest at a variable rate plus margin as defined in Term Facility (
3.77%
at December 31, 2018) and is payable
62
quarterly. The Term Facility also requires a quarterly principal payment equal to 1.5% of the aggregate initial principal less any prepayment. The Term Facility is payable in full at the end of the term.
The Credit Facilities are subject to various financial and other covenants including restrictions on the level of borrowings based on a consolidated leverage ratio and a consolidated interest coverage ratio. We were in compliance with all such covenants as of December 31, 2018. See Note 9 - Debt to our consolidated and combined financial statements.
Senior Notes
On August 28, 2018, we issued $2.0 billion of senior notes (Senior Notes) in a private placement. The Senior Notes comprised of $500.0 million of 3.912% Senior Notes due August 27, 2021, $750.0 million of 4.272% Senior Notes due August 28, 2023, and $750.0 million of 4.900% Senior Notes due August 28, 2028. We were in compliance with all covenants under the indenture governing the Senior Notes as of December 31, 2018. Long-term debt as of December 31, 2017 was not material. See Note 9 - Debt to our consolidated and combined financial statements.
Capital Expenditures
Capital expenditures were $134.5 million during 2018, an increase of $35.9 million compared to 2017. We expect 2019 capital expenditures to be approximately $179.0 million.
Cash Flows
The following table provides a summary of cash flows from operating, investing and financing activities for the periods presented:
|
(Dollars in millions)
|
Year Ended December 31,
|
% Change
|
|||||||||||||||
|
Net cash provided by (used in):
|
2018
|
2017
|
2016
|
18/17
|
17/16
|
||||||||||||
|
Operating activities
|
$
|
487.3
|
|
$
|
173.8
|
|
$
|
155.9
|
|
180
|
%
|
11
|
%
|
||||
|
Investing activities
|
(127.0
|
)
|
(964.6
|
)
|
(182.1
|
)
|
(87
|
)%
|
430
|
%
|
|||||||
|
Financing activities
|
(35.2
|
)
|
847.5
|
|
(149.6
|
)
|
(104
|
)%
|
(667
|
)%
|
|||||||
|
Effect of exchange-rate changes on cash and cash equivalents
|
29.0
|
|
7.9
|
|
(26.0
|
)
|
267
|
%
|
(130
|
)%
|
|||||||
|
Net increase in cash, cash equivalents and restricted cash
|
$
|
354.1
|
|
$
|
64.6
|
|
$
|
(201.8
|
)
|
448
|
%
|
(132
|
)%
|
||||
Operating activities
2018 vs. 2017
Our cash flow from operating activities increased by $
313.5 million
from $173.8 million for the year ended December 31, 2017 to
$487.3 million
for the year ended December 31, 2018. The increase is a result of an increase in net income, which was partially offset by cash used to finance working capital, primarily focused on accounts receivable and inventory.
2017 vs. 2016
Our net cash provided by operating activities was $173.8 million in 2017 as compared to cash provided by operating activities of $155.9 million in 2016. This increase in operating cash flows was primarily attributable to:
|
•
|
a decrease in receivables in 2017 as compared to an increase in 2016 due to a one-time impact of standardizing payment terms across our acquired businesses as well as payment receipt timing due to integration of acquired assets;
|
|
•
|
a decrease in other assets in 2017 as compared to an increase in 2016 primarily due to the timing of tax payments; and
|
• a smaller increase in inventory levels in 2017 as compared to 2016;
partially offset by:
|
•
|
increased net losses.
|
Investing activities
63
2018 vs. 2017
Our cash flow used in investing activities decreased from $964.6 million for the year ended December 31, 2017 to $127.0 million for the year ended December 31, 2018. Our cash used in investing activities for the year ended December 31, 2017 included $882.1 million related to the acquisition of BIVIVP. This decrease was offset by a net increase of $35.9 million in capital expenditures from 2017 to 2018.
2017 vs. 2016
Our net cash used in investing activities was $964.6 million in 2017 as compared to cash used in investing activities of $182.1 million in 2016. This increase in net cash flows used in investing activities was primarily attributable to the acquisition of the BI Vetmedica U.S. vaccines portfolio in 2017.
Financing activities
2018 vs. 2017
Our cash from financing activities was a use of cash of
$35.2 million
in 2018 compared to cash provided by financing activities of $847.5 million in 2017, a change of
$882.7 million
The cash flows in 2017 relate to net cash provided by transactions with Lilly of
$848.3 million
compared to cash used in transactions with Lilly of
$154.4 million
in 2018, a reduction in financing of cash flows between periods of $1.0 billion. This, in addition to the consideration paid to Lilly in connection with the Separation, was partially offset by net cash provided from financing transactions related to the Separation including the proceeds from long-term debt and our IPO. The remainder of the proceeds from the financing related to the Separation will be paid to Lilly in future periods and is reflected as restricted cash in our consolidated balance sheet.
2017 vs. 2016
Our net cash provided by financing activities was $847.5 million in 2017 as compared to cash used in financing activities of $149.6 million in 2016. This increase in net cash provided was primarily attributable to financing provided by Lilly for the acquisition of the BI Vetmedica U.S. vaccines portfolio in 2017.
Contractual Obligations
Payments due under contractual obligations as of December 31, 2018, are set forth below:
|
Years
|
||||||||||||||||||||
|
(Dollars in millions)
|
Total
(2)
|
Less Than 1 Year
|
1 - 3 Years
|
4 - 5 Years
|
More Than 5 Years
|
|||||||||||||||
|
Long-term debt obligations
|
$
|
2,958.4
|
|
$
|
79.9
|
|
$
|
1,137.9
|
|
$
|
829.7
|
|
$
|
910.9
|
|
|||||
|
Operating leases
|
95.6
|
|
25.2
|
|
33.6
|
|
18.3
|
|
18.5
|
|
||||||||||
|
Purchase obligations
(1)
|
1,207.9
|
|
1,108.9
|
|
42.8
|
|
39.8
|
|
16.4
|
|
||||||||||
|
Other long-term liabilities
|
12.3
|
|
0.5
|
|
10.8
|
|
0.1
|
|
0.9
|
|
||||||||||
|
Total
|
$
|
4,274.2
|
|
$
|
1,214.5
|
|
$
|
1,225.1
|
|
$
|
887.9
|
|
$
|
946.7
|
|
|||||
(1) Represents open purchase orders as of December 31, 2018 and contractual payment obligations with each of our significant vendors which are noncancelable and are not contingent.
(2) We excluded deferred taxes because we cannot reasonably estimate the timing of future cash outflows associated with those liabilities.
Off-Balance Sheet Arrangements
We have no off-balance sheet arrangements that have a material current effect or that are reasonably likely to have a material future effect on our financial condition, changes in financial condition, revenue or expenses, results of operations, liquidity, capital expenditures or capital resources.
Critical Accounting Policies
The preparation of financial statements in accordance with U.S. GAAP requires us to make estimates and judgments that affect the reported amounts of assets, liabilities, revenues and expenses. Certain of our accounting policies are considered critical because these policies are the most important to the depiction of our financial statements and require significant, difficult or complex judgments by us, often requiring the use of estimates about the effects of matters that are inherently uncertain. Actual results that differ from our estimates could have an unfavorable effect on our financial position and results of operations. We apply estimation methodologies consistently from year to year. The following is a summary of accounting policies that we consider critical to the combined financial statements.
64
Revenue Recognition
Our gross product revenue is subject to deductions that are generally estimated and recorded in the same period that the revenue is recognized and primarily represents revenue incentives (rebates and discounts) and sales returns. For example:
• for revenue incentives, we use our historical experience with similar incentives programs and current sales data to estimate the impact of such programs on revenue and continually monitor the impact of this experience and adjust as necessary; and
• for sales returns, we consider items such as: local returns policies and practices; returns as a percentage of revenue; an understanding of the reasons for past returns; estimated shelf life by product; and estimate of the amount of time between shipment and return to estimate the impact of sales returns.
If any of our ratios, factors, assessments, experiences or judgments are not indicative or accurate predictors of our future experience, our results could be materially affected.
Although the amounts recorded for these revenue deductions are dependent on estimates and assumptions, historically our adjustments to actual results have not been material. The sensitivity of our estimates can vary by program, type of customer and geographic location. Amounts recorded for revenue deductions can result from a complex series of judgments about future events and uncertainties and can rely on estimates and assumptions.
Acquisitions and Fair Value
We account for the assets acquired and liabilities assumed in an acquisition based on the fair values as of the acquisition date. The excess of the purchase price over the fair value of the acquired net assets, where applicable, is recorded as goodwill.
The judgments made in determining estimated fair values assigned to assets acquired and liabilities assumed in a business combination, as well as estimated asset lives, can materially affect our consolidated results of operations. The fair values of intangible assets are re-determined using information available near the acquisition date based on expectations and assumptions that are deemed reasonable by management. Depending on the facts and circumstances, we may deem it necessary to engage an independent valuation expert to assist in valuing significant assets and liabilities.
The fair value of any contingent consideration liability that results from a business combination is determined using a market approach based on quoted market values, significant other observable inputs for identical or comparable assets or liabilities, or a discounted cash flow analysis. Estimating the fair value of contingent consideration requires the use of significant estimates and judgments, including, but not limited to, revenue and the discount rate and will be remeasured every reporting period.
Impairment of Indefinite-Lived and Long-Lived Assets
We review the carrying value of long-lived assets (both intangible and tangible) for potential impairment on a periodic basis and whenever events or changes in circumstances indicate the carrying value of an asset (or asset group) may not be recoverable. We identify impairment by comparing the projected undiscounted cash flows to be generated by the asset (or asset group) to its carrying value. If an impairment is identified, a loss is recorded equal to the excess of the asset's net book value over its fair value utilizing a discounted cash flow analysis, and the cost basis is adjusted.
Goodwill and indefinite-lived intangible assets are reviewed for impairment at least annually and when certain impairment indicators are present. When required, a comparison of fair value to the carrying amount of assets is performed to determine the amount of any impairment.
The estimated cash flows and fair values used in our impairment reviews require significant judgment with respect to future volume; use of working capital; foreign currency exchange rates; the selection of appropriate discount rates; product mix; income tax rates and other assumptions and estimates. Such estimates and assumptions are determined based upon our business plans and when applicable, market participants' views of us and other similar companies. We make these judgments based on our historical experience, relevant market size, historical pricing of similar products and expected industry trends. These assumptions are subject to change in future periods because of, among other things, additional information, financial information based on further historical experience, changes in competition, our investment decisions, volatility in foreign currency exchange rates, and results of research and development. A change in these assumptions or the use of alternative estimates and assumptions could have a significant impact on the estimated fair values of the assets, and may result in an impairment of the existing assets in a future period.
65
During the years ended December 31, 2018, 2017 and 2016, we recorded asset impairments of $
81.9 million
, $110.6 million and $98.3 million, respectively, due to changes in estimates or judgments related to the use of the assets. For more information related to our impairment charges, see Note 7: Asset Impairment, Restructuring and Other Special Charges to our consolidated and combined financial statements.
Deferred Tax Asset Valuation Allowances
We maintain valuation allowances unless it is more likely than not that all or a portion of the deferred tax asset will be realized. Changes in valuation allowances are included in our tax provision in the period of change. In determining whether a valuation allowance is warranted, we evaluate factors such as prior earnings history, expected future earnings, carryback and carryforward periods, and tax strategies that could potentially enhance the likelihood of realization of a deferred tax asset. The realizability assessments made at a given balance sheet date are subject to change in the future, particularly if earnings of a subsidiary are significantly higher or lower than expected, or if we take operational or tax planning actions that could impact the future taxable earnings of a subsidiary. A change in these assumptions may result in an increase or decrease in the realizability of our existing deferred tax assets, and therefore a change in the valuation allowance, in future periods. As of December 31, 2018 and 2017, we had valuation allowances of
$21.4 million
and $127.7 million, respectively.
Quantitative and Qualitative Disclosures About Market Risk
Foreign Exchange Risk
We operate on a global basis and are exposed to the risk that our earnings, cash flows and equity could be adversely impacted by fluctuations in foreign exchange rates. We are primarily exposed to foreign exchange risk with respect to net assets denominated in the Euro, British pound, Canadian dollar, Australian dollar and Brazilian real. Lilly maintains a foreign currency risk management program through a central shared entity, which enters into derivative contracts to hedge foreign currency risk associated with forecasted transactions for the entire company, including historically for our operations. Gains and losses on derivative contracts entered into by Lilly have been allocated to our results to the extent they were to cover exposure related to our business and offset gains and losses on underlying foreign currency exposures. Following the Separation, we started implementation our own foreign currency risk management program.
We also face currency exposure that arises from translating the results of our global operations to the U.S. dollar at exchange rates that have fluctuated from the beginning of the period. We may enter into foreign currency forward or option derivative contracts to reduce the effect of fluctuating currency exchange rates in future periods, but our historical results do not reflect the impact of any such derivatives related to our exposure to foreign currency impacts on translation.
We estimate that a hypothetical 10% adverse movement in all foreign currency exchange rates related to the translation of the results of our foreign operations would decrease our net income by approximately $11.2 million for the year ended December 31, 2018.
We also bear foreign exchange risk associated with the future cash settlement of an existing NIH. In October 2018, we entered into a fixed interest rate, 5-year, 750 million Swiss franc NIH against Swiss franc assets. The NIH is expected to generate approximately $25 million in cash and contra interest expense per year; however, there is potential for significant 2023 settlement exposure on the 750 million Swiss franc notional if the U.S. dollar devalues versus the Swiss franc
.
Interest Risk
We are exposed to interest rate risk on the long-term debt we incurred in connection with our IPO. Prior to our IPO, we did not have any interest rate exposure. We have cash flow risk associated with our $500.0 million of borrowings that pay interest based on variable rates. We actively monitor our exposure and may enter into financial instruments for the purpose of limiting our exposure based on our assessment of risk
.
Recently Issued Accounting Pronouncements
For discussion of our new accounting standards, see Note 4: Summary of Significant Accounting Policies - Implementation of New Financial Accounting Pronouncements to our consolidated and combined financial statements.
Item 7A. Quantitative and Qualitative Disclosures About Market Risk
You can find quantitative and qualitative disclosures about market risk (e.g., interest rate risk) at Item 7, “Management’s Discussion and Analysis of Financial Condition and Results of Operations - Liquidity and Capital Resources - Quantitative and Qualitative Disclosures About Market Risk.” That information is incorporated in this Item 7A by reference.
66
Item 8. Financial Statements and Supplementary Data
Report of Independent Registered Public Accounting Firm
To the Shareholders and the Board of Directors of Elanco Animal Health Incorporated
Opinion on the Financial Statements
We have audited the accompanying consolidated and combined balance sheets of Elanco Animal Health Incorporated (the Company) as of December 31, 2018 and 2017, the related consolidated and combined statements of operations, comprehensive income (loss), equity, and cash flows for each of the three years in the period ended December 31, 2018, and the related notes (collectively referred to as the “consolidated and combined financial statements”). In our opinion, the consolidated and combined financial statements present fairly, in all material respects, the financial position of the Company at December 31, 2018 and 2017, and the results of its operations and its cash flows for each of the three years in the period ended December 31, 2018, in conformity with U.S. generally accepted accounting principles.
Basis for Opinion
These financial statements are the responsibility of the Company's management. Our responsibility is to express an opinion on the Company’s financial statements based on our audits. We are a public accounting firm registered with the Public Company Accounting Oversight Board (United States) (PCAOB) and are required to be independent with respect to the Company in accordance with the U.S. federal securities laws and the applicable rules and regulations of the Securities and Exchange Commission and the PCAOB.
We conducted our audits in accordance with the standards of the PCAOB. Those standards require that we plan and perform the audit to obtain reasonable assurance about whether the financial statements are free of material misstatement, whether due to error or fraud. The Company is not required to have, nor were we engaged to perform, an audit of its internal control over financial reporting. As part of our audits we are required to obtain an understanding of internal control over financial reporting but not for the purpose of expressing an opinion on the effectiveness of the Company’s internal control over financial reporting. Accordingly, we express no such opinion.
Our audits included performing procedures to assess the risks of material misstatement of the financial statements, whether due to error or fraud, and performing procedures that respond to those risks. Such procedures included examining, on a test basis, evidence regarding the amounts and disclosures in the financial statements. Our audits also included evaluating the accounting principles used and significant estimates made by management, as well as evaluating the overall presentation of the financial statements. We believe that our audits provide a reasonable basis for our opinion.
/s/ Ernst & Young LLP
We have served as the Company’s auditor since 2017.
Indianapolis, Indiana
February 20, 2019
67
Elanco Animal Health Incorporated
Consolidated and Combined Statements of Operations
(in millions, except per-share data)
|
|
Year Ended December 31,
|
||||||||||
|
|
2018
|
2017
|
2016
|
||||||||
|
Revenue
|
$
|
3,066.8
|
|
$
|
2,889.0
|
|
$
|
2,913.5
|
|
||
|
Costs, expenses and other:
|
|||||||||||
|
Cost of sales
|
1,573.8
|
|
1,493.9
|
|
1,409.0
|
|
|||||
|
Research and development
|
246.6
|
|
251.7
|
|
265.8
|
|
|||||
|
Marketing, selling and administrative
|
735.2
|
|
779.8
|
|
784.8
|
|
|||||
|
Amortization of intangible assets
|
197.4
|
|
221.2
|
|
170.7
|
|
|||||
|
Asset impairments, restructuring and other special charges (Note 7)
|
128.8
|
|
375.1
|
|
308.4
|
|
|||||
|
Interest expense, net of capitalized interest
|
29.6
|
|
—
|
|
—
|
|
|||||
|
Other (income) expense, net
|
41.3
|
|
(0.1
|
)
|
(2.8
|
)
|
|||||
|
2,952.7
|
|
3,121.6
|
|
2,935.9
|
|
||||||
|
Income (loss) before income taxes
|
114.1
|
|
(232.6
|
)
|
(22.4
|
)
|
|||||
|
Income tax expense
|
27.6
|
|
78.1
|
|
25.5
|
|
|||||
|
Net income (loss)
|
$
|
86.5
|
|
$
|
(310.7
|
)
|
$
|
(47.9
|
)
|
||
|
Earnings (loss) per share:
|
|||||||||||
|
Basic and diluted
|
$
|
0.28
|
|
$
|
(1.06
|
)
|
$
|
(0.16
|
)
|
||
|
Weighted average shares outstanding:
|
|||||||||||
|
Basic and diluted
|
313.7
|
|
293.3
|
|
293.3
|
|
|||||
See notes to consolidated and combined financial statements.
68
Elanco Animal Health Incorporated
Consolidated and Combined Statements of Comprehensive Income (Loss)
(in millions)
|
Year Ended December 31,
|
|||||||||||
|
2018
|
2017
|
2016
|
|||||||||
|
Net income (loss)
|
$
|
86.5
|
|
$
|
(310.7
|
)
|
$
|
(47.9
|
)
|
||
|
Other comprehensive income (loss):
|
|||||||||||
|
Change in foreign currency translation gains (losses)
|
(47.1
|
)
|
210.1
|
|
(230.7
|
)
|
|||||
|
Change in defined benefit pension and retiree health benefit plans, net of taxes
|
25.4
|
|
(9.8
|
)
|
(4.3
|
)
|
|||||
|
Other comprehensive income (loss), net of taxes
|
(21.7
|
)
|
200.3
|
|
(235.0
|
)
|
|||||
|
Comprehensive income (loss)
|
$
|
64.8
|
|
$
|
(110.4
|
)
|
$
|
(282.9
|
)
|
||
See notes to consolidated and combined financial statements.
69
Elanco Animal Health Incorporated
Consolidated and Combined Balance Sheets
(in millions)
|
December 31, 2018
|
December 31, 2017
|
||||||
|
Assets
|
|
||||||
|
Current Assets
|
|||||||
|
Cash and cash equivalents
|
$
|
474.8
|
|
$
|
323.4
|
|
|
|
Accounts receivable, net of allowances of $8.4 (2018) and $9.8 (2017)
|
651.8
|
|
567.4
|
|
|||
|
Other receivables
|
57.6
|
|
34.5
|
|
|||
|
Inventories (Note 8)
|
1,004.1
|
|
1,062.3
|
|
|||
|
Prepaid expenses and other
|
113.9
|
|
136.1
|
|
|||
|
Restricted cash (Note 19)
|
202.7
|
|
—
|
|
|||
|
Total current assets
|
2,504.9
|
|
2,123.7
|
|
|||
|
Noncurrent Assets
|
|||||||
|
Investments (Note 10)
|
15.3
|
|
12.3
|
|
|||
|
Goodwill (Note 11)
|
2,958.0
|
|
2,969.2
|
|
|||
|
Other intangibles, net (Note 11)
|
2,453.0
|
|
2,672.8
|
|
|||
|
Other noncurrent assets
|
103.1
|
|
242.0
|
|
|||
|
Property and equipment, net (Note 12)
|
922.4
|
|
920.3
|
|
|||
|
Total assets
|
$
|
8,956.7
|
|
$
|
8,940.3
|
|
|
|
Liabilities and Equity
|
|||||||
|
Current Liabilities
|
|||||||
|
Accounts payable
|
$
|
205.2
|
|
$
|
203.8
|
|
|
|
Employee compensation
|
98.9
|
|
89.3
|
|
|||
|
Sales rebates and discounts
|
169.9
|
|
165.5
|
|
|||
|
Current portion of long term debt
|
29.0
|
|
—
|
|
|||
|
Other current liabilities
|
199.0
|
|
184.5
|
|
|||
|
Payable to Lilly (Note 19)
|
268.7
|
|
—
|
|
|||
|
Total current liabilities
|
970.7
|
|
643.1
|
|
|||
|
Noncurrent Liabilities
|
|||||||
|
Long-term debt (Note 9)
|
2,443.3
|
|
—
|
|
|||
|
Accrued retirement benefits (Note 17)
|
109.1
|
|
139.0
|
|
|||
|
Deferred taxes (Note 14)
|
114.6
|
|
251.9
|
|
|||
|
Other noncurrent liabilities
|
121.5
|
|
126.0
|
|
|||
|
Total liabilities
|
3,759.2
|
|
1,160.0
|
|
|||
|
Commitments and Contingencies (Note 15)
|
|
|
|||||
|
Equity
|
|||||||
|
Net parent company investment
|
—
|
|
8,036.9
|
|
|||
|
Common stock, no par value, 5,000,000,000 shares authorized 365,643,911 shares issued and outstanding as of December 31, 2018
|
—
|
|
—
|
|
|||
|
Additional paid-in capital
|
5,403.3
|
|
—
|
|
|||
|
Retained earnings
|
16.4
|
|
—
|
|
|||
|
Accumulated other comprehensive loss
|
(222.2
|
)
|
(256.6
|
)
|
|||
|
Total equity
|
5,197.5
|
|
7,780.3
|
|
|||
|
Total liabilities and equity
|
$
|
8,956.7
|
|
$
|
8,940.3
|
|
|
See notes to consolidated and combined financial statements.
70
Elanco Animal Health Incorporated
Consolidated and Combined Statements of Equity
(in millions)
|
Common Stock
|
Accumulated Other Comprehensive Income (Loss)
|
|||||||||||||||||||||||||||||||||
|
Shares
|
Amount
|
Additional Paid-in Capital
|
Net Parent Company Investment
|
Retained Earnings
|
Foreign Currency Translation
|
|
Defined Benefit Pension and Retiree Health Benefit Plans
|
Total
|
Total Equity
|
|||||||||||||||||||||||||
|
January 1, 2016
|
293.3
|
|
$
|
—
|
|
$
|
—
|
|
$
|
7,651.4
|
|
$
|
—
|
|
$
|
(206.6
|
)
|
$
|
(15.3
|
)
|
$
|
(221.9
|
)
|
$
|
7,429.5
|
|
||||||||
|
Net loss
|
—
|
|
—
|
|
—
|
|
(47.9
|
)
|
—
|
|
—
|
|
—
|
|
—
|
|
(47.9
|
)
|
||||||||||||||||
|
Other comprehensive income, net of tax
|
—
|
|
—
|
|
—
|
|
—
|
|
—
|
|
(230.7
|
)
|
(4.3
|
)
|
(235.0
|
)
|
(235.0
|
)
|
||||||||||||||||
|
Transfers (to)/from Lilly, net
|
—
|
|
—
|
|
—
|
|
(129.2
|
)
|
—
|
|
—
|
|
—
|
|
—
|
|
(129.2
|
)
|
||||||||||||||||
|
December 31, 2016
|
293.3
|
|
—
|
|
—
|
|
7,474.3
|
|
—
|
|
(437.3
|
)
|
(19.6
|
)
|
(456.9
|
)
|
7,017.4
|
|
||||||||||||||||
|
Net (loss)
|
—
|
|
—
|
|
—
|
|
(310.7
|
)
|
—
|
|
—
|
|
—
|
|
—
|
|
(310.7
|
)
|
||||||||||||||||
|
Other comprehensive income (loss), net of tax
|
—
|
|
—
|
|
—
|
|
—
|
|
—
|
|
210.1
|
|
(9.8
|
)
|
200.3
|
|
200.3
|
|
||||||||||||||||
|
Transfers (to)/from Lilly, net
|
—
|
|
—
|
|
—
|
|
873.3
|
|
—
|
|
—
|
|
—
|
|
—
|
|
873.3
|
|
||||||||||||||||
|
December 31, 2017
|
293.3
|
|
—
|
|
—
|
|
8,036.9
|
|
—
|
|
(227.2
|
)
|
(29.4
|
)
|
(256.6
|
)
|
7,780.3
|
|
||||||||||||||||
|
Adoption of Accounting Standards Update 2016-16
|
—
|
|
—
|
|
—
|
|
(0.3
|
)
|
—
|
|
—
|
|
—
|
|
—
|
|
(0.3
|
)
|
||||||||||||||||
|
Net income
|
—
|
|
—
|
|
—
|
|
70.1
|
|
16.4
|
|
|
—
|
|
—
|
|
86.5
|
|
|||||||||||||||||
|
Other comprehensive income (loss), net of tax
|
—
|
|
—
|
|
—
|
|
—
|
|
—
|
|
(47.1
|
)
|
25.4
|
|
(21.7
|
)
|
(21.7
|
)
|
||||||||||||||||
|
Transfers (to)/from Lilly, net
|
—
|
|
—
|
|
—
|
|
(226.3
|
)
|
—
|
|
—
|
|
—
|
|
—
|
|
(226.3
|
)
|
||||||||||||||||
|
Separation adjustments
|
—
|
|
—
|
|
—
|
|
43.5
|
|
—
|
|
56.1
|
|
—
|
|
56.1
|
|
99.6
|
|
||||||||||||||||
|
Issuance of common stock
|
72.3
|
|
—
|
|
1,659.7
|
|
—
|
|
—
|
|
—
|
|
—
|
|
—
|
|
1,659.7
|
|
||||||||||||||||
|
Consideration to Lilly in connection with the Separation
|
—
|
|
—
|
|
(4,194.9
|
)
|
—
|
|
—
|
|
—
|
|
—
|
|
—
|
|
(4,194.9
|
)
|
||||||||||||||||
|
Reclassification of net parent company investment
|
—
|
|
—
|
|
7,923.9
|
|
(7,923.9
|
)
|
—
|
|
—
|
|
—
|
|
—
|
|
—
|
|
||||||||||||||||
|
Shared base compensation
|
—
|
|
—
|
|
1.8
|
|
—
|
|
—
|
|
—
|
|
—
|
|
—
|
|
|
1.8
|
|
|||||||||||||||
|
Capital contribution from Lilly
|
—
|
|
—
|
|
12.8
|
|
—
|
|
—
|
|
—
|
|
—
|
|
—
|
|
|
12.8
|
|
|||||||||||||||
|
December 31, 2018
|
365.6
|
|
$
|
—
|
|
$
|
5,403.3
|
|
$
|
—
|
|
$
|
16.4
|
|
$
|
(218.2
|
)
|
$
|
(4.0
|
)
|
$
|
(222.2
|
)
|
$
|
5,197.5
|
|
||||||||
See notes to consolidated and combined financial statements.
71
Elanco Animal Health Incorporated
Consolidated and Combined Statement of Cash Flows
(in millions)
|
Year Ended December 31,
|
||||||||||
|
2018
|
2017
|
2016
|
||||||||
|
Cash Flows from Operating Activities
|
||||||||||
|
Net income (loss)
|
$
|
86.5
|
|
|
$
|
(310.7
|
)
|
$
|
(47.9
|
)
|
|
Adjustments to reconcile net income (loss) to cash flows from operating activities:
|
|
|
|
|||||||
|
Depreciation and amortization
|
296.0
|
|
|
318.4
|
|
254.4
|
|
|||
|
Change in deferred income taxes
|
(60.7
|
)
|
|
(13.4
|
)
|
(5.9
|
)
|
|||
|
Stock-based compensation expense
|
26.0
|
|
|
25.0
|
|
20.4
|
|
|||
|
Asset impairment charges
|
120.5
|
|
|
110.6
|
|
98.3
|
|
|||
|
Gain on sale of assets
|
(0.8
|
)
|
|
(19.6
|
)
|
—
|
|
|||
|
Other non-cash operating activities, net
|
49.0
|
|
10.0
|
|
6.0
|
|
||||
|
Other changes in operating assets and liabilities, net of acquisitions and divestitures:
|
|
|||||||||
|
Receivables
|
(122.0
|
)
|
48.4
|
|
(80.7
|
)
|
||||
|
Inventories
|
(20.1
|
)
|
(39.0
|
)
|
(89.1
|
)
|
||||
|
Other assets
|
(3.2
|
)
|
52.5
|
|
(36.7
|
)
|
||||
|
Accounts payable and other liabilities
|
116.1
|
|
(8.4
|
)
|
37.1
|
|
||||
|
Net Cash Provided by Operating Activities
|
487.3
|
|
173.8
|
|
155.9
|
|
||||
|
Cash Flows from Investing Activities
|
||||||||||
|
Purchases of property and equipment
|
(134.5
|
)
|
(98.6
|
)
|
(110.3
|
)
|
||||
|
Disposals of property and equipment
|
9.4
|
|
37.6
|
|
7.4
|
|
||||
|
Cash paid for acquisitions, net of cash acquired
|
—
|
|
|
(882.1
|
)
|
(45.0
|
)
|
|||
|
Other investing activities, net
|
(1.9
|
)
|
|
(21.5
|
)
|
(34.2
|
)
|
|||
|
Net Cash Used for Investing Activities
|
(127.0
|
)
|
(964.6
|
)
|
(182.1
|
)
|
||||
|
Cash Flows from Financing Activities
|
||||||||||
|
Proceeds from issuance of long-term debt (Note 9)
|
2,500.0
|
|
—
|
|
—
|
|
||||
|
Repayments of borrowings
|
(7.5
|
)
|
—
|
|
—
|
|
||||
|
Proceeds from issuance of common stock (Note 1)
|
1,659.7
|
|
—
|
|
—
|
|
||||
|
Debt issuance costs
|
(24.5
|
)
|
—
|
|
—
|
|
||||
|
Consideration paid to Lilly in connection with the Separation (Note 1)
|
(3,991.3
|
)
|
|
—
|
|
—
|
|
|||
|
Other financing activities, net
|
(17.2
|
)
|
|
(0.8
|
)
|
—
|
|
|||
|
Other net transactions with Lilly
|
(154.4
|
)
|
|
848.3
|
|
(149.6
|
)
|
|||
|
Net Cash Provided by (Used for) Financing Activities
|
(35.2
|
)
|
847.5
|
|
(149.6
|
)
|
||||
|
Effect of exchange rate changes on cash and cash equivalents
|
29.0
|
|
|
7.9
|
|
(26.0
|
)
|
|||
|
Net increase in cash, cash equivalents and restricted cash
|
354.1
|
|
64.6
|
|
(201.8
|
)
|
||||
|
Cash, cash equivalents and restricted cash at January 1
|
323.4
|
|
258.8
|
|
460.6
|
|
||||
|
Cash, cash equivalents and restricted cash at December 31
|
$
|
677.5
|
|
$
|
323.4
|
|
$
|
258.8
|
|
|
72
|
December 31,
|
|||||||
|
2018
|
2017
|
||||||
|
Cash and cash equivalents
|
$
|
474.8
|
|
|
$
|
323.4
|
|
|
Restricted cash (Note 19)
|
202.7
|
|
|
—
|
|
||
|
Cash, cash equivalents and restricted cash at December 31
|
$
|
677.5
|
|
|
$
|
323.4
|
|
See notes to consolidated and combined financial statements.
73
Elanco Animal Health Incorporated
Notes to Consolidated and Combined Financial Statements
(Tables present dollars in millions, except per-share data)
Note 1. Nature of Business and Organization
Nature of Business
Elanco Animal Health Incorporated (Elanco Parent) and its subsidiaries (collectively, Elanco, the Company, we, us or our) was formed as a wholly-owned subsidiary of Eli Lilly and Company (Lilly). Elanco is a global animal health company that innovates, develops, manufactures and markets products for companion and food animals. We offer a diverse portfolio of more than
125
brands to veterinarians and food animal producers in more than
90
countries.
Organization
Elanco Parent was formed in 2018, as a wholly-owned subsidiary of Lilly, to serve as the ultimate parent company of substantially all of the animal health businesses of Lilly.
On September 24, 2018, Elanco Parent completed an initial public offering resulting in the issuance of
72.3
million shares of its common stock (including shares issued pursuant to the underwriters’ option to purchase additional shares), which represents
19.8%
of the outstanding shares, at
$24
per share (IPO) for a total net proceeds, after underwriting discounts and commissions, of
$1.7 billion
. In connection with the completion of the IPO, through a series of equity and other transactions, Lilly transferred to Elanco Parent the animal health businesses that form its business going forward. In exchange Elanco Parent has paid, or will pay, to Lilly approximately
$4.2 billion
, which includes the net proceeds from the IPO, the net proceeds from the debt offering completed by Elanco Parent in August 2018 and the term loan facility entered into by Elanco Parent in September 2018 (see Note 9). As of December 31, 2018, Elanco Parent has paid Lilly
$4.0 billion
with the remaining purchase price reflected in Payable to Lilly on the balance sheet. These transactions are collectively referred to herein as the Separation.
Note 2. Basis of Presentation
The accompanying consolidated and combined financial statements have been prepared in accordance with accounting principles generally accepted in the United States (GAAP). The accounts of all wholly-owned and majority-owned subsidiaries are included in the consolidated financial statements. All intercompany balances and transactions have been eliminated.
The preparation of financial statements in conformity with GAAP requires management to make estimates and assumptions that affect the reported amounts of assets, liabilities, revenues, expenses, and related disclosures at the date of the financial statements and during the reporting period. Actual results could differ from those estimates. We issued our financial statements by filing with the Securities and Exchange Commission and have evaluated subsequent events up to the time of the filing.
During the period ended December 31, 2018, certain combined balance sheet amounts related to the prior year have been revised to correct the sales rebates and discounts liability, which did not correctly reflect an accrual for rebates related to product held in the wholesalers' pipeline. In accordance with Securities and Exchange Commission Staff Accounting Bulletin No. 99,
Materiality
, and Accounting Standards Codification (ASC) 250,
Presentation of Financial Statements
, we assessed the materiality of this correction and concluded that the accrual for the rebate related to product held in the wholesalers' pipeline was not material to prior periods, and therefore, amendments of previously filed reports are not required.
As such, in accordance with ASC 250, we revised the previously reported combined balance sheet and combined statements of equity. The adjustment, which originates in periods prior to those presented, resulted in a
$10.5 million
increase as of December 31, 2017 in the accrual for sales rebates and discounts of
$155.0 million
, total current liabilities of
$632.6 million
and total liabilities of
$1,149.5 million
. In addition, previously reported amounts at December 31, 2017 and December 31, 2016 of net parent company investment of
$8,047.4 million
and
$7,484.8 million
, respectively, and total equity of
$7,790.8 million
and
$7,027.9 million
, respectively, have been reduced by
$10.5 million
to reflect the correction above.
For the periods after separation, the financial statements are prepared on a consolidated basis and reflect the results of operations, comprehensive income, financial position, equity and cash flows resulting from our operations as an independent company. For periods prior to the Separation, our financial statements are combined, have been prepared on a standalone basis, and are derived from Lilly's consolidated financial statements and accounting records. The consolidated and combined financial statements reflect the financial position, results of operations and cash flows
74
related to the animal health businesses that were transferred to Elanco Parent and are prepared in conformity with GAAP.
The combined financial statements include the attribution of certain assets and liabilities that historically have been held at the Lilly corporate level but which are specifically identifiable or attributable to the businesses that have been transferred to Elanco Parent. All intercompany transactions and accounts within Elanco have been eliminated. All transactions between us and Lilly are considered to be effectively settled in the combined financial statements at the time the intercompany transaction is recorded. The total net effect of the settlement of these intercompany transactions is reflected in the combined statements of cash flows as a financing activity and in the combined balance sheets as net parent company investment.
Prior to the separation, these combined financial statements include an allocation of expenses related to certain Lilly corporate functions, including executive oversight, treasury, legal, finance, human resources, tax, internal audit, financial reporting, information technology and investor relations, prior to IPO. These expenses have been allocated to us based on direct usage or benefit where specifically identifiable, with the remainder allocated primarily on a pro rata basis of revenue, headcount and other measures. We consider the expenses methodology and results to be reasonable for all periods presented. However, the allocations may not be indicative of the actual expense that would have been incurred had we operated as an independent, publicly traded company for the periods presented. It is impractical to estimate what the standalone costs of Elanco would have been in the historical periods. After the separation, a TSA between Lilly and Elanco went into effect. Under the terms of the TSA, we will be able to use Lilly Services for a fixed term established on a service-by-service basis. We are paying Lilly mutually agreed upon fees for the Lilly Services provided under the TSA. Our consolidated and combined financial statements reflect the charges for Lilly Services after the IPO. See Note 19 for additional details.
The income tax amounts in the combined financial statements have been calculated based on a separate return methodology and presented as if our operations were separate taxpayers in the respective jurisdictions. We file income tax returns in the United States (U.S.) federal jurisdiction and various state, local and non-U.S. jurisdictions. Certain of these income tax returns are filed on a consolidated or combined basis with Eli Lilly and Company and/or its subsidiaries.
Lilly maintains various benefit and combined stock-based compensation plans at a corporate level and other benefit plans at a country level. Our employees participate in such programs and the portion of the cost of those plans related to our employees is included in our financial statements. However, the consolidated and combined balance sheets do not include any equity issued related to stock-based compensation plans or any net benefit plan obligations unless the benefit plan covers only our dedicated employees or where the legal obligation associated with the benefit plan will transfer to Elanco.
Prior to Separation, the equity balance in the combined financial statements represents the excess of total assets over liabilities, including intercompany balances between us and Lilly (net parent company investment) and accumulated other comprehensive loss. Net parent company investment is primarily impacted by contributions from Lilly which are the result of treasury activities and net funding provided by or distributed to Lilly. See Note 19 for further information.
Note 3. Impact of Separation
In connection with the Separation, we issued
$2.0 billion
aggregate principal amount of senior notes in a private placement, and we also entered into a
$750.0 million
senior unsecured revolving credit facility and
$500.0 million
senior unsecured term credit facility. See Note 9 for further information.
In connection with the Separation, we entered into various agreements with Lilly, including a master separation agreement. In connection with the terms of the Separation, there were certain assets and liabilities included in the pre-Separation balance sheet that were retained by Lilly and there were certain assets not included in the pre-Separation balance sheet that were transferred to us. The cumulative adjustment to the historical balance sheet increased net assets and total equity by approximately
$99.6 million
. The impact on net assets primarily represent the elimination of certain income tax assets and liabilities and the contribution of additional assets.
On February 8, 2019, we filed a Registration Statement on Form S-4 with the SEC in connection with Lilly’s proposed exchange offer, whereby Lilly shareholders can exchange shares of Lilly common stock for shares of our common stock owned by Lilly (exchange offer). Immediately before the commencement of the exchange offer, Lilly owned
293,290,000
shares of our common stock, representing
80.2%
of our outstanding common stock. If the exchange offer is not fully subscribed, Lilly intends, from time to time, to complete subsequent exchange offers and/or a pro rata spin-off of its remaining interest in Elanco Parent.
Note 4. Summary of Significant Accounting Policies
75
Revenue recognition
We recognize revenue from sales of products at the time title of goods passes to the buyer and the buyer assumes the risks and rewards of ownership. Provisions for returns, discounts and rebates are established in the same period the related sales are recognized. For arrangements with contract manufacturing organizations (CMO), we recognize revenue over time or at a point in time depending on its evaluation of when the customer obtains control of the promised goods or service. Revenue is recognized over time when we are creating or enhancing an asset that the customer controls as the asset is created or enhanced or our performance does not create an asset with an alternative use and we have an enforceable right to payment for performance completed.
Research and development expenses and acquired in-process research and development
Research and development expenses include the following:
•
Research and development costs, which are expensed as incurred.
|
•
|
Milestone payment obligations incurred prior to regulatory approval of the product, which are accrued when the event requiring payment of the milestone occurs.
|
|
•
|
Acquired in-process research and development (IPR&D) expense, which includes the initial costs of IPR&D projects, acquired directly in a transaction other than a business combination that do not have an alternative future use.
|
Foreign Currency Translation
Operations in our subsidiaries outside the United States (U.S.) are recorded in the functional currency of each subsidiary which is determined by a review of the environment where each subsidiary primarily generates and expends cash. The results of operations for our subsidiaries outside the U.S. are translated from functional currencies into U.S. dollars using the weighted average currency rate for the period. Assets and liabilities are translated using the period end exchange rates. The U.S. dollar effects that arise from translating the net assets of these subsidiaries are recorded in other comprehensive income (loss).
Other significant accounting policies
Our other significant accounting policies are described in the remaining appropriate notes to the combined financial statements.
Implementation of New Financial Accounting Pronouncements
The following table provides a brief description of accounting standards that were effective January 1, 2018 and were adopted on that date:
|
Standard
|
Description
|
Effect on the financial statements or other significant matters
|
||
|
Accounting Standards Update 2014-09 and various other related updates,
Revenue from Contracts with Customers
|
This standard replaced existing revenue recognition standards and requires entities to recognize revenue to depict the transfer of promised goods or services to customers in an amount that reflects the consideration to which the entity expects to be entitled in exchange for those goods or services. An entity can apply the new revenue standard retrospectively to each prior reporting period presented or with the cumulative effect of initially applying the standard recognized at the date of initial application in retained earnings. We applied the latter approach.
|
Application of the new standard to applicable contracts had no impact to net parent company investment as of January 1, 2018. Disclosures required by the new standard are included in Note 5.
|
||
76
|
Accounting Standards Update 2016-16,
Income Taxes: Intra-Entity Transfers of Assets Other Than Inventory
|
This standard requires entities to recognize the income tax consequences of intra-entity transfers of assets other than inventory at the time of transfer. This standard requires a modified retrospective approach to adoption.
|
Upon adoption, the cumulative effect of applying the standard resulted in a decrease to net parent company investment of approximately $0.3 million. Adoption of this standard did not result in a material change in net income for the twelve months ended December 31, 2018.
|
||
|
Accounting Standards Update 2017-07,
Compensation-Retirement Benefits: Improving the Presentation of Net Periodic Pension Cost and Net Periodic Postretirement Benefit Cost
|
This standard was issued to improve the transparency and comparability among organizations by requiring entities to separate their net periodic pension cost and net periodic postretirement benefit cost into a service cost component and other components. Previously, the costs of the other components along with the service cost component were classified based upon the function of the employee. This standard requires entities to classify the service cost component in the same financial statement line item or items as other compensation costs arising from services rendered by pertinent employees. The other components of net benefit cost are now presented separately from the line items that include the service cost component. When applicable, the service cost component is now the only component eligible for capitalization. An entity should apply the new standard retrospectively for the classification of the service cost and other components and prospectively for the capitalization of the service cost component.
|
Upon adoption of this standard, pension and postretirement benefit cost components other than service costs are presented in other (income) expense, net. Retrospective application was not material to the combined statement of operations for the twelve months ended December 31, 2017. We do not expect application of the new standard to have a material impact on an ongoing basis.
|
||
|
Accounting Standards Update 2017-12,
Derivatives and Hedging
|
This standard amends the hedge accounting recognition and presentation requirements and is intended to better align hedge accounting with companies' risk management strategies. This standard eliminates the requirements to separately measure and report hedge ineffectiveness and generally requires that the entire change in fair value of a hedging instrument be presented in the same income statement line item as the respective hedged item. The standard also modifies certain disclosure requirements.
|
We elected to early adopt this guidance as of January 1, 2018. There were no hedging contracts in effect as of the date of adoption. We do not expect application of the new standard to have a material impact on an ongoing basis.
|
||
77
The following table provides a brief description of the accounting standard that has not yet been adopted and could have a material effect on the consolidated financial statements:
|
Standard
|
Description
|
Effective Date
|
Effect on the financial statements or other significant matters
|
|||
|
Accounting Standards Update 2016-02,
Leases
|
This standard was issued to increase transparency and comparability among organizations by recognizing lease assets and lease liabilities, including leases classified as operating leases under current GAAP, on the balance sheet and requiring additional disclosures about leasing arrangements. An entity can apply the new leases standard retrospectively to each prior reporting period presented or with the cumulative effect of initially applying the standard recognized at the date of initial application in retained earnings. We plan to use the latter approach.
|
This standard is effective January 1, 2019, with early adoption permitted. We intend to adopt this standard on that date.
|
We expect to record a right-of-use asset and lease liability for operating leases of approximately $75-95 million on our consolidated balance sheet on January 1, 2019. Our accounting for capital leases will remain substantially unchanged. This standard will not have a material impact on our consolidated statement of operations.
|
|||
Note 5. Revenue
Effective January 1, 2018, we adopted Accounting Standards Update 2014-09,
Revenue from Contracts with Customers
(ASU 2014-09) and other related updates. The new standard has been applied to contracts for which performance had not been completed as of the date of adoption. Revenue presented for periods prior to 2018 were accounted for under previous standards and has not been adjusted. Revenue and net income for the year ended December 31, 2018 does not differ materially from amounts that would have resulted from application of the previous standards.
Product Sales
We recognize revenue primarily from product sales to customers. Revenue from sales of products is recognized at the point where the customer obtains control of the goods and we satisfy our performance obligation, which generally is at the time we ship the product to the customer.
Payment terms differ by jurisdiction and customer, but payment terms in most of our major jurisdictions typically range from 30 to 100 days from date of shipment.
Revenue for our product sales has not been adjusted for the effects of a financing component as we expect, at contract inception, that the period between when we transfer control of the product and when we receive payment will be one year or less. Any exceptions are either not material or we collect interest for payments made after the due date. Provisions for rebates and discounts, and returns are established in the same period the related sales are recognized. We generally, ship product shortly after orders are received; therefore, we generally only have a few days of orders received but not yet shipped at the end of any reporting period. Shipping and handling activities are considered to be fulfillment activities and are not considered to be a separate performance obligation. We exclude from the measurement of the transaction price all taxes assessed by a governmental authority that are imposed on our sales of product and collected from a customer.
Significant judgments must be made in determining the transaction price for sales of products related to anticipated rebates and discounts, and returns. The following describe the most significant of these judgments:
Sales Rebates and Discounts - Background and Uncertainties
|
•
|
Most of our products are sold to wholesale distributors. We initially invoice our customers contractual list prices. Contracts with direct and indirect customers may provide for various rebates and discounts that may differ in each contract. As a consequence, to determine the appropriate transaction price for our product sales at the time we recognize a sale to a direct customer, we must estimate any rebates or discounts that ultimately will be due to the direct customer and other customers in the distribution chain under the terms of our contracts. Significant judgments are required in making these estimates.
|
|
•
|
The rebate and discount amounts are recorded as a deduction to arrive at our net product sales. We estimate these accruals using an expected value approach.
|
78
|
•
|
In determining the appropriate accrual amount, we consider our historical experience with similar incentives programs and current sales data to estimate the impact of such programs on revenue and continually monitor the impact of this experience and adjust as necessary. Although we accrue a liability for rebates related to these programs at the time the sale is recorded, the rebate related to that sale is typically paid up to
six months
after rebate or incentive period expires. Because of this time lag, in any particular period rebate adjustments may incorporate revisions of accruals for several periods.
|
Our sales rebates and discounts are based on specific agreements and the majority relate to sales in the U.S. As of December 31, 2018 and 2017, liability for sales rebates and discounts in the U.S. represents approximately
70%
and
69%
, respectively, of our total liability with the next largest country representing approximately
8%
of our total liability for 2018 and 2017.
The following table summarizes the activity in the sales rebates and discounts liability in the U.S.:
|
Year Ended December 31,
|
||||||||
|
|
2018
|
2017
|
||||||
|
Beginning balance
|
$
|
114.8
|
|
$
|
116.1
|
|
||
|
Reduction of revenue
|
221.0
|
|
236.1
|
|
||||
|
Payments
|
(217.3
|
)
|
(237.4
|
)
|
||||
|
Ending balance
|
$
|
118.5
|
|
$
|
114.8
|
|
||
Adjustments to revenue recognized as a result of changes in estimates for the judgments described above during the year ended December 31, 2018 for product shipped in previous periods were not material.
Sales Returns - Background and Uncertainties
|
•
|
We estimate a reserve for future product returns related to product sales using an expected value approach. This estimate is based on several factors, including: local returns policies and practices; returns as a percentage of revenue; an understanding of the reasons for past returns; estimated shelf life by product; and estimate of the amount of time between shipment and return. Adjustments to the returns reserve have been and may in the future be required based on revised estimates to our assumptions, which would have an impact on our consolidated results of operations. We record the return amounts as a deduction to arrive at our net product sales.
|
|
•
|
Actual product returns have been approximately
1%
of net revenue for the year ended December 31, 2018 and 2017 and have not fluctuated significantly as a percentage of revenue.
|
Disaggregation of Revenue
The following table summarizes our revenue disaggregated by product category for the years ended December 31:
|
2018
|
2017
|
2016
|
||||||||||
|
Companion Animal Disease Prevention
|
$
|
804.6
|
|
$
|
660.2
|
|
$
|
628.4
|
|
|||
|
Companion Animal Therapeutics
|
283.1
|
|
260.8
|
|
255.6
|
|
||||||
|
Food Animal Future Protein & Health
|
711.2
|
|
649.2
|
|
630.8
|
|
||||||
|
Food Animal Ruminants Swine
|
1,174.0
|
|
1,175.0
|
|
1,309.2
|
|
||||||
|
Other
|
93.9
|
|
143.8
|
|
89.5
|
|
||||||
|
Total Revenue
|
$
|
3,066.8
|
|
$
|
2,889.0
|
|
$
|
2,913.5
|
|
|||
Note 6. Acquisitions
During 2017 and 2016, we completed the acquisitions of BIVIVP and certain rights to Aratana Therapeutics, Inc.'s (Aratana) Galliprant®, respectively. These transactions were accounted for as business combinations under the acquisition method of accounting. Under this method, the assets acquired and liabilities assumed were recorded at their respective fair values as of the acquisition date in our combined financial statements. The determination of estimated fair value required management to make significant estimates and assumptions. The excess of the purchase price over the fair value of the acquired net assets, where applicable, has been recorded as goodwill. The results of operations of these acquisitions are included in our consolidated and combined financial statements from the dates of acquisition.
79
Boehringer Ingelheim Vetmedica, Inc. Vaccine Portfolio Acquisition
On January 3, 2017, we acquired BIVIVP in a cash transaction for
$882.1 million
. Under the terms of the agreement, we acquired a manufacturing and research and development site, a U.S. vaccine portfolio including vaccines used for the treatment of bordetella, Lyme disease, rabies and parvovirus, among others.
The following table summarizes the amounts recognized for assets acquired and liabilities assumed as of the acquisition date:
|
Estimated Fair Value at January 3, 2017
|
||||
|
Inventories
(1)
|
$
|
108.6
|
|
|
|
Marketed products
(2)
|
297.0
|
|
||
|
Property and equipment
|
148.2
|
|
||
|
Other assets and liabilities — net
|
8.2
|
|
||
|
Total identifiable net assets
|
562.0
|
|
||
|
Goodwill
(3)
|
320.1
|
|
||
|
Total consideration transferred — net of cash acquired
|
$
|
882.1
|
|
|
(1) The fair value for inventories include a purchase accounting adjustment to write up the inventory value, which resulted in incremental cost of sales of
$42.7 million
in 2017. The fair value was determined by estimating the expected sales price of the inventories, reduced for all costs expected to the incurred and a profit on those costs.
(2) These intangible assets, which are being amortized on a straight-line basis over their estimated useful lives, were expected to have a weighted average useful life of
10 years
.
(3) The goodwill recognized from this acquisition is attributable primarily to expected synergies from combining the operations of BIVIVP with our legacy business, future unidentified projects and products, and the assembled workforce of BIVIVP. The goodwill associated with this acquisition is deductible for tax purposes.
Our combined statement of operations for the year ended December 31, 2017 included BIVIVP revenues of
$216.7 million
. We are unable to provide the results of operations attributable to BIVIVP as those operations were substantially integrated into our legacy business.
Had BIVIVP been acquired on January 1, 2016, the unaudited pro forma combined revenues of Elanco and BIVIVP would have been
$2.89 billion
and
$3.14 billion
for the years ended December 31, 2017 and 2016, respectively. It is impractical to determine the pro forma impact on loss before tax attributable to BIVIVP for 2017 and 2016.
Galliprant Acquisition
On April 22, 2016, we acquired from Aratana, certain rights to Galliprant, a canine pain treatment for osteoarthritis for a total purchase price of
$88.6 million
, which consisted of an upfront payment of
$45.0 million
and contingent consideration of
$43.6 million
. The contingent consideration represented the fair value of potential future payments to Aratana based on the probability of achieving contingent milestones and royalties. At the time of the acquisition, Galliprant was approved in the U.S. and was still under development outside the U.S.
Under the terms of the agreement, we were granted co-promotion rights in the U.S. through December 31, 2018, at which time we will control commercialization in the U.S. We received full commercialization rights outside the U.S. The agreement requires payments by us to Aratana associated with certain development, success-based regulatory and sales-based milestones and royalties. As of
December 31, 2018
, Aratana is eligible to receive up to
$8.0 million
of potential development and success-based regulatory milestones. Aratana is also eligible to receive up to
$60.0 million
of potential sales-based milestones. Aratana is eligible to receive royalties based on a percentage of net sales of Galliprant, dependent on the timing and geography of the net sales. There is no cap on the amount of royalties that may be paid pursuant to this arrangement. As of December 31, 2018, we paid Aratana
$15 million
related to a sales-based milestone.
The following table summarizes the amounts recognized for assets acquired and liabilities assumed as of the acquisition date:
80
|
Estimated Fair Value at April 22, 2016
|
||||
|
Deferred tax assets
|
$
|
15.3
|
|
|
|
Acquired in-process research and development
|
31.6
|
|
||
|
Marketed products(1)
|
57.0
|
|
||
|
Deferred tax liabilities
|
(15.3
|
)
|
||
|
Total consideration
|
88.6
|
|
||
|
Less: Contingent consideration
|
(43.6
|
)
|
||
|
Total cash paid
|
$
|
45.0
|
|
|
(1) These intangible assets, which are being amortized on a straight-line basis over their estimated useful lives, were expected to have a weighted average useful life of
20 years
.
Note 7. Asset Impairment, Restructuring and Other Special Charges
The Company's total charges related to asset impairment, restructuring and other special charges, including integration of acquired businesses, in our consolidated and combined statements of operations consisted of the following for the years ended December 31:
|
2018
|
2017
|
2016
|
|||||||||
|
Cash expense:
|
|||||||||||
|
Severance and other
|
$
|
15.5
|
|
$
|
162.0
|
|
$
|
42.1
|
|
||
|
Integration
|
26.5
|
|
90.3
|
|
154.8
|
|
|||||
|
Facility exit costs
|
5.7
|
|
31.8
|
|
13.2
|
|
|||||
|
Total cash expense
|
47.7
|
|
284.1
|
|
210.1
|
|
|||||
|
Non-cash expense:
|
|||||||||||
|
Asset impairment
|
81.9
|
|
110.6
|
|
98.3
|
|
|||||
|
Total non-cash expense
|
81.9
|
|
110.6
|
|
98.3
|
|
|||||
|
Gain on sale of fixed assets
|
(0.8
|
)
|
(19.6
|
)
|
—
|
|
|||||
|
Total expense
|
$
|
128.8
|
|
$
|
375.1
|
|
$
|
308.4
|
|
||
Restructuring
We historically participated in Lilly’s cost-reduction initiatives, which resulted in restructuring charges in the period prior to our IPO. The restructuring charges include severance and other costs associated with the reduction of our workforce, including special termination benefits recognized in 2017 associated with the U.S. voluntary early retirement program offered by Lilly, related to our employees and pension curtailment costs and facility exit costs. We also recorded certain impairment charges related to the activities as described below.
During December 2018, we initiated a restructuring program to streamline our international operations, including shifting focus and resources to priority areas. Among other actions, the restructuring reflects a change from having a physical location to a distribution model in certain countries in connection with our separation from Lilly and resulted in the recognition of severance costs. In addition, as part of our ongoing activities to separate fully from Lilly, we wrote off certain assets that we have determined will not be utilized in the business on an ongoing basis. We expect to substantially complete the restructuring activities by December 2019
.
Integration costs
Integration costs recognized during the years ended December 31, 2018, 2017 and 2016 were related to our integration efforts as a result of our acquired businesses and costs to stand our organization up to be an independent company.
Asset impairment
Asset impairment recognized during the year ended December 31, 2018 includes
$22.5 million
of intangible asset impairments and
$59.4 million
of other asset impairments. The intangible asset impairments primarily related to revised projections of fair value due to product rationalization. The fixed asset impairments were primarily due to the decision to dispose of a manufacturing facility in the U.S., the suspension of commercial activities for Imrestor® and the write-off of certain idle assets in a U.S. manufacturing facility. See Note 11 for further detail relating to intangible asset impairments.
81
Asset impairment recognized during the year ended December 31, 2017 resulted primarily from intangible asset impairments related to revised projections of fair value due to product rationalization and to a lesser extent competitive pressures.
Asset impairment recognized during the year ended December 31, 2016 resulted from intangible asset impairments due to product rationalization and to charges related to site closures resulting from our acquisition and integration of Novartis AH, including the closure of a manufacturing facility in Ireland in 2016.
Gain on sale
The gain on sale of fixed assets for the year ended December 31, 2017 represents a gain on the disposal of a site that was previously closed as part of the acquisition and integration of Novartis Animal Health beginning on January 1, 2015.
The following table summarizes the activity in our reserves established in connection with these restructuring activities:
|
Exit costs
|
Severance
|
Total
|
|||||||||
|
Balance at December 31, 2016
|
$
|
11.5
|
|
$
|
26.6
|
|
$
|
38.1
|
|
||
|
Charges
|
31.8
|
|
162.0
|
|
193.8
|
|
|||||
|
Reserve adjustment
|
1.4
|
|
(3.9
|
)
|
(2.5
|
)
|
|||||
|
Cash paid
|
(9.8
|
)
|
(141.6
|
)
|
(151.4
|
)
|
|||||
|
Balance at December 31, 2017
|
34.9
|
|
43.1
|
|
78.0
|
|
|||||
|
Charges
|
11.7
|
|
15.5
|
|
27.2
|
|
|||||
|
Separation adjustment
|
(5.9
|
)
|
—
|
|
(5.9
|
)
|
|||||
|
Reserve adjustment
|
(6.0
|
)
|
|
—
|
|
|
(6.0
|
)
|
|||
|
Cash paid
|
(25.4
|
)
|
(23.5
|
)
|
(48.9
|
)
|
|||||
|
Balance at December 31, 2018
|
$
|
9.3
|
|
$
|
35.1
|
|
$
|
44.4
|
|
||
Substantially all of the reserves are expected to be paid in the next twelve months. We believe that the reserves are adequate.
Note 8. Inventories
We state all inventories at the lower of cost or market. We use the last-in, first-out (LIFO) method for a portion of our inventories located in the continental U.S. Other inventories are valued by the first-in, first-out (FIFO) method. FIFO cost approximates current replacement cost.
Inventories at December 31 consisted of the following:
|
2018
|
2017
|
||||||
|
Finished products
|
$
|
400.7
|
|
$
|
452.0
|
|
|
|
Work in process
|
570.4
|
|
580.0
|
|
|||
|
Raw materials and supplies
|
80.4
|
|
70.4
|
|
|||
|
Total (approximates replacement cost)
|
1,051.5
|
|
1,102.4
|
|
|||
|
Decrease to LIFO cost
|
(47.4
|
)
|
(40.1
|
)
|
|||
|
Inventories
|
$
|
1,004.1
|
|
$
|
1,062.3
|
|
|
Inventories valued under the LIFO method comprised
$194.8 million
and
$231.4 million
of total inventories at December 31, 2018 and 2017, respectively.
During the year ended December 31, 2018, we recognized
$38.6 million
of inventory write-offs in cost of sales primarily related to the suspension of commercial activities for Imrestor.
Note 9. Debt
Long-term debt as of December 31, 2018 consisted of the following:
82
|
December 31, 2018
|
|||
|
Term credit facility
|
$
|
492.5
|
|
|
3.912% Senior Notes due 2021
|
500.0
|
|
|
|
4.272% Senior Notes due 2023
|
750.0
|
|
|
|
4.900% Senior Notes due 2028
|
750.0
|
|
|
|
Other obligations
|
0.5
|
|
|
|
Unamortized debt issuance costs
|
(20.7
|
)
|
|
|
2,472.3
|
|
||
|
Less current portion of long-term debt
|
(29.0
|
)
|
|
|
Total long-term debt
|
$
|
2,443.3
|
|
Long-term debt as of December 31, 2017 was not material.
Revolving and Term Credit Facilities
On September 5, 2018, we entered into a revolving credit agreement with a syndicate of banks providing for a
five
-year
$750.0 million
senior unsecured revolving credit facility (Revolving Facility). The Revolving Facility bears interest at a variable rate plus specified margin as defined in the agreement and is payable quarterly. There were
no
borrowings outstanding under the Revolving Facility at December 31, 2018. The Revolving Facility is payable in full at the end of the term.
On September 5, 2018 we also entered into a
$500.0 million
three
-year term loan under a term credit facility with a syndicate of banks (the Term Facility and collectively with the Revolving Facility, the Credit Facilities.) The Term Facility bears interest at a variable rate plus margin as defined in Term Facility (
3.77%
at December 31, 2018) and is payable quarterly. The Term Facility also requires a quarterly principal payment equal to
1.5%
of the aggregate initial principal less any prepayment. The Term Facility is payable in full at the end of the term.
The Credit Facilities are subject to various financial and other covenants including restrictions on the level of borrowings based on a consolidated leverage ratio and a consolidated interest coverage ratio. We were in compliance with all such covenants as of December 31, 2018.
Senior Notes
On
August 28, 2018
, we issued
$2.0 billion
of senior notes (Senior Notes) in a private placement. The Senior Notes comprised of
$500.0 million
of
3.912%
Senior Notes due
August 27, 2021
,
$750.0 million
of
4.272%
Senior Notes due
August 28, 2023
, and
$750.0 million
of
4.900%
Senior Notes due
August 28, 2028
. The interest rate payable on each series of Senior Notes is subject to adjustment if Moody's Investor Services, Inc. or Standard & Poor's Financial Services LLC downgrades, or subsequently upgrades, its ratings on the respective series of Senior Notes.
The indenture that governs the Senior Notes contains covenants, including limitations on our ability, and certain of our subsidiaries, to incur liens or engage in sale-leaseback transactions. The indenture also contains restrictions on our ability to consolidate, merge or sell substantially all of our assets, in addition to other customary terms. We were in compliance with all such covenants under the indenture governing the Senior Notes as of December 31, 2018.
We have entered into an agreement that requires us to use commercially reasonable efforts to cause a registration statement to become effective with the SEC by August 28, 2019, relating to an offer to exchange the Senior Notes for registered Senior Notes having substantially identical terms, or, in certain cases, to register the Senior Notes for resale. If we do not register or exchange the Senior Notes pursuant to the terms of the registration rights agreement, we will be required to pay additional interest to the holders of the Senior Notes under certain circumstances.
Note 10. Financial Instruments and Fair Value
Financial instruments that are potentially subject to credit risk consist principally of trade receivables. Collateral is generally not required. The risk associated with this concentration is mitigated by our ongoing credit-review procedures and insurance.
A large portion of our cash is held by a few major financial institutions. We monitor the exposure with these institutions and do not expect any of these institutions to fail to meet their obligations. All highly liquid investments with a maturity of three months or less from the date of purchase are considered to be cash equivalents. The cost of these investments approximates fair value. We also consider the carrying value of restricted cash balances to be representative of its fair value.
83
As of December 31, 2018 and 2017, we had
$15.3 million
and
$12.3 million
, respectively, primarily related to equity method investments.
The following table summarizes the fair value information at December 31, 2018 and 2017 for contingent consideration liabilities and net investment hedge liability measured at fair value on a recurring basis in the respective balance sheet line items:
|
|
|
Fair Value Measurements Using
|
|
||||||||||||||||
|
Financial statement line item
|
Carrying Amount
|
Quoted Prices in Active Markets for Identical Assets (Level 1)
|
Significant Other Observable Inputs (Level 2)
|
Significant Unobservable Inputs (Level 3)
|
Fair Value
|
||||||||||||||
|
December 31, 2018
|
|||||||||||||||||||
|
Other current liabilities- contingent consideration
|
$
|
5.1
|
|
$
|
—
|
|
$
|
—
|
|
$
|
5.1
|
|
$
|
5.1
|
|
||||
|
Other noncurrent liabilities- contingent consideration
|
69.0
|
|
—
|
|
—
|
|
69.0
|
|
69.0
|
|
|||||||||
|
Other noncurrent liabilities- cross currency interest rate contracts designated as net investment hedges
|
7.4
|
|
|
—
|
|
|
7.4
|
|
|
—
|
|
|
7.4
|
|
|||||
|
December 31, 2017
|
|||||||||||||||||||
|
Other current liabilities- contingent consideration
|
1.3
|
|
—
|
|
—
|
|
1.3
|
|
1.3
|
|
|||||||||
|
Other noncurrent liabilities- contingent consideration
|
45.2
|
|
—
|
|
—
|
|
45.2
|
|
45.2
|
|
|||||||||
We determine our Level 1 and Level 2 fair value measurements based on a market approach using quoted market values, significant other observable inputs for identical or comparable assets or liabilities, or discounted cash flow analysis. Level 3 fair value measurements for other investment securities are determined using unobservable inputs, including the investments' cost adjusted for impairments and price changes from orderly transactions. The fair values of cost and equity method investments are not readily available.
Contingent consideration liabilities relate to
Galliprant
for which the fair value was estimated using a discounted cash flow analysis and Level 3 inputs, including projections representative of a market participant view for the probability of achieving potential future payments to Aratana Therapeutics, Inc. and an estimated discount rate. The amount to be paid is dependent upon certain development, success-based regulatory, and sales-based milestones. In addition, the amount of royalties to be paid is calculated as a percentage of net sales dependent upon the timing and geography and will, therefore, vary directly with increases and decreases in net sales of
Galliprant
. There is no cap on the amount that may be paid pursuant to this arrangement. During 2018, as a result of an increase in the projected cash flows related to
Galliprant,
we increased the fair value of the contingent consideration liabilities by
$37.6 million
, offset by a
$15.0 million
sales-based milestone payment. The additional expense was recognized in other (income) expense, net.
We have long term debt of
$2.5 billion
that is recorded at amortized cost in our consolidated and combined balance sheet as of December 31, 2018. We consider the carrying value of the long term debt to be representative of its fair value as of December 31, 2018. The fair value of this long term debt is estimated based on quoted market prices of similar liabilities and is classified as Level 2. As of December 31, 2017, long term debt was not material.
In October 2018, we entered into a cross-currency fixed interest rate swap,
5
-year,
750 million
Swiss Franc (CHF), which is designated as a NIH against CHF denominated assets for which the fair value was estimated based on quoted market values of similar hedges and is classified as Level 2. The NIH is expected to generate approximately
$25 million
in cash and an offset to interest expense on an annual basis. During the year ended December 31, 2018, our interest expense was offset by
$5.6 million
as a result of the NIH. Over the life of the derivative, gains or losses due to spot rate fluctuations are recorded in cumulative translation adjustment. During the year ended December 31, 2018, we recorded a
$5.9 million
loss, net of tax, on the NIH, which is included in the change in the cumulative translation adjustment in other comprehensive income. There is a potential for significant 2023 settlement exposure as the U.S. dollar fluctuates against the Swiss Franc. The risk management objective is to manage foreign currency risk relating to net investments in certain CHF denominated assets. Changes in fair value of the derivative instruments are
84
recognized in a component of Accumulated Other Comprehensive Loss to offset the changes in the values of the net investments being hedged.
Note 11. Goodwill and Intangibles
Goodwill
Goodwill was
$3.0 billion
as of December 31, 2018 and 2017. Goodwill results from excess consideration in a business combination over the fair value of identifiable net assets acquired. Goodwill is not amortized but is reviewed for impairment at least annually and when impairment indicators are present. Goodwill may be impaired if the carrying amount of a reporting unit exceeds the fair value of that reporting unit, calculated as based on discounted cash flows. The implied fair value of goodwill is then determined by subtracting the fair value of all identifiable net assets other than goodwill from the fair value of the reporting unit. An impairment charge would be recorded for the excess, if any, of carrying amount of goodwill over the implied fair value. The estimated fair value is based on a number of assumptions, including current market capitalization as corroboration of fair value. See Note 6 for further discussion of goodwill resulting from recent business combinations. The remaining change in goodwill is primarily the result of foreign exchange translation adjustments.
No
impairments occurred with respect to the carrying value of goodwill for the years ended December 31, 2018, 2017 and 2016.
Other Intangibles
The components of intangible assets other than goodwill at December 31 were as follows:
|
2018
|
2017
|
|||||||||||||||||||||||
|
Description
|
Carrying Amount, Gross
|
Accumulated Amortization
|
Carrying Amount, Net
|
Carrying Amount, Gross
|
Accumulated Amortization
|
Carrying Amount, Net
|
||||||||||||||||||
|
Finite-lived intangible assets:
|
||||||||||||||||||||||||
|
Marketed products
|
$
|
3,193.5
|
|
$
|
(779.2
|
)
|
$
|
2,414.3
|
|
$
|
3,151.2
|
|
$
|
(599.8
|
)
|
$
|
2,551.4
|
|
||||||
|
Other
|
53.1
|
|
(34.0
|
)
|
19.1
|
|
54.1
|
|
(29.9
|
)
|
24.2
|
|
||||||||||||
|
Total finite-lived intangible assets
|
3,246.6
|
|
(813.2
|
)
|
2,433.4
|
|
3,205.3
|
|
(629.7
|
)
|
2,575.6
|
|
||||||||||||
|
Indefinite-lived intangible assets:
|
||||||||||||||||||||||||
|
Acquired in-process research and development
|
19.6
|
|
—
|
|
19.6
|
|
97.2
|
|
—
|
|
97.2
|
|
||||||||||||
|
Other intangibles
|
$
|
3,266.2
|
|
$
|
(813.2
|
)
|
$
|
2,453.0
|
|
$
|
3,302.5
|
|
$
|
(629.7
|
)
|
$
|
2,672.8
|
|
||||||
Marketed products consist of the amortized cost of the rights to assets acquired in business combinations and approved for marketing in a significant global jurisdiction. For transactions other than a business combination, we capitalize milestone payments incurred at or after the product has obtained regulatory approval for marketing.
Other finite-lived intangibles consist primarily of the amortized cost of licensed platform technologies that have alternative future uses in research and development, manufacturing technologies and customer relationships from business combinations. Acquired IPR&D consists of the related costs capitalized, adjusted for subsequent impairments, if any. The costs of acquired IPR&D projects acquired directly in a transaction other than a business combination are capitalized if the projects have an alternative future use; otherwise, they are expensed immediately. The fair values of acquired IPR&D projects acquired in business combinations are capitalized as other intangible assets.
Several methods may be used to determine the estimated fair value of other intangibles acquired in a business combination. We utilize the "income method" for other intangibles. This method is a Level 3 fair value measurement and applies a probability weighting that considers the risk of development and commercialization to the estimated future net cash flows that are derived from projected revenues and estimated costs. These projections are based on factors such as relevant market size, patent protection, historical pricing of similar products and expected industry trends. The estimated future net cash flows are then discounted to the present value using an appropriate discount rate. This analysis is performed for each group of assets independently. The acquired IPR&D assets are treated as indefinite-lived intangible assets until completion or abandonment of the projects, at which time the assets are tested for impairment and amortized over the remaining useful life or written off, as appropriate.
85
See Note 6 for further discussion of intangible assets acquired in recent business combinations.
Other indefinite-lived intangible assets are reviewed for impairment at least annually and when impairment indicators are present. The fair value of the indefinite lived intangible assets (acquired IPR&D) is estimated using the same assumptions as used for goodwill and by applying a probability weighting that reflects the risk of development and commercialization to the estimated future net cash flows that are derived from projected revenues and estimated costs. Finite-lived intangible assets are reviewed for impairment when an indicator of impairment is present. We compare the carrying amounts of the assets with the estimated undiscounted future cash flows. In the event the carrying amount exceeds the undiscounted cash flows, an impairment charge is recorded for the amount by which the carrying amount of the asset exceeds the estimated fair value, which is determined based on discounted future cash flows.
During 2018, we recorded impairment charges of
$22.5 million
(comprised of
$9.5 million
impairment of finite-lived intangible assets and
$13.0 million
impairment of indefinite-lived intangible assets) which are included in asset impairment, restructuring and other special charges on the combined statements of operations. The impairment of finite-lived intangible assets primarily related to competitive pressures for a certain marketed product resulting in a reduction of projected cash flows. The impairment of indefinite-lived intangible assets primarily related to revised projections of fair value due to competitive pressures and to a lesser extent product rationalization. The increase in the carrying amount of finite intangibles is primarily due to the receipt of full commercialization rights outside the U.S. for Galliprant. During 2017, we had impairment charges of
$94.5 million
(comprised of
$56.5 million
impairment of finite-lived intangible assets and
$38.0 million
impairment of indefinite-lived intangible assets) which are included in asset impairment, restructuring and other special charges on the combined statements of operations. The impairment of finite-lived intangible assets primarily related to competitive pressures for a certain marketed product resulting in a reduction of projected cash flows. The impairment of indefinite-lived intangible assets primarily related to revised projections of fair value due to competitive pressures and to a lesser extent product rationalization. During 2016, we recorded impairment charges of
$14.0 million
primarily related to indefinite-lived intangible assets charged to asset impairment, restructuring and other special charges on the combined statements of operations. The impairments in 2016 were related to product rationalization.
Intangible assets with finite lives are capitalized and are amortized over their estimated useful lives, ranging from
3
to
20 years
. As of December 31, 2018, the remaining weighted-average amortization period for finite-lived intangible assets is approximately
14 years
.
The estimated amortization expense for each of the next five years associated with our finite-lived intangible assets as of December 31, 2018 is as follows:
|
2019
|
2020
|
2021
|
2022
|
2023
|
||||||||||||||||
|
Estimated amortization expense
|
$
|
197.9
|
|
$
|
198.3
|
|
$
|
198.0
|
|
$
|
196.0
|
|
$
|
195.8
|
|
|||||
Note 12. Property and Equipment
Property and equipment is stated on the basis of cost. Provisions for depreciation of buildings and equipment are computed generally by the straight-line method at rates based on their estimated useful lives (
12
to
50 years
for buildings and
3
to
25 years
for equipment). We review the carrying value of long-lived assets for potential impairment on a periodic basis and whenever events or changes in circumstances indicate the carrying value of an asset may not be recoverable. Impairment is determined by comparing projected undiscounted cash flows to be generated by the asset to its carrying value. If an impairment is identified, a loss is recorded equal to the excess of the asset's net book value over its fair value utilizing a discounted cash flow analysis, and the cost basis is adjusted.
At December 31, property and equipment consisted of the following:
|
2018
|
2017
|
|||||||
|
Land
|
$
|
27.6
|
|
$
|
25.1
|
|
||
|
Buildings
|
567.2
|
|
557.7
|
|
||||
|
Equipment
|
1,025.1
|
|
994.5
|
|
||||
|
Construction in progress
|
181.1
|
|
177.1
|
|
||||
|
1,801
|
|
1,754.4
|
|
|||||
|
Less accumulated depreciation
|
(878.6
|
)
|
(834.1
|
)
|
||||
|
Property and equipment, net
|
$
|
922.4
|
|
$
|
920.3
|
|
||
86
Depreciation expense related to property and equipment and rental expense for all leases was as follows:
|
2018
|
2017
|
2016
|
||||||||||
|
Depreciation expense
|
$
|
81.3
|
|
$
|
79.8
|
|
$
|
75.7
|
|
|||
|
Rental expense
|
47.5
|
|
47.1
|
|
41.8
|
|
||||||
The future minimum rental commitments under non-cancelable operating leases are as follows:
|
2019
|
2020
|
2021
|
2022
|
2023
|
After 2023
|
|||||||||||||||||||
|
Lease commitments
|
$
|
25.2
|
|
$
|
20.1
|
|
$
|
13.5
|
|
$
|
10.0
|
|
$
|
8.3
|
|
$
|
18.5
|
|
||||||
Note 13. Stock-Based Compensation
Lilly Stock Compensation Plans
For periods prior to IPO, we benefited from Lilly's stock-based compensation program. Lilly maintains various stock-based compensation programs for the benefit of its officers, directors and certain employees including employees of the Company. As we receive the employee services in consideration for the participation of the Company's employees in these plans, stock-based compensation expense for the awards granted to our employees has been reflected in the consolidated and combined statements of operations.
Lilly's stock-based compensation granted to our employees consists of performance awards (PAs), shareholder value awards (SVAs) and RSUs. The stock-based compensation expense has been derived from the equity awards granted by Lilly to our employees. The compensation expense is based on the fair value of stock-based awards which is recognized as compensation expense over the requisite service period of the individual grantees, which generally equals the vesting period. The awards are settled by Lilly.
For the periods prior to IPO, as the stock-based compensation plans were Lilly's plans and the awards were settled by Lilly, the offset to the expense was recognized through net parent company investment on the combined balance sheet.
Stock-based compensation expense related to our employees for years ended December 31, 2018, 2017 and 2016 was
$26.0 million
,
$25.0 million
and
$20.4 million
, respectively.
Following IPO and until the completion of the exchange offer, the equity awards previously granted to our employees by Lilly will continue to vest, and service with Elanco counts toward the Lilly award’s vesting provisions. Upon completion of the exchange offer, we expect that our employees’ unvested Lilly RSUs, PAs, and SVAs will be forfeited and replaced with Elanco RSUs valued at the exchange rate with the same service vesting period as the forfeited Lilly awards.
Performance Award Program
PAs have been granted to certain of our officers and management and are settled in shares of Lilly's common stock. The number of PA shares actually issued, if any, varies depending on the achievement of certain pre-established earnings-per-share targets over a
two
-year period. PA shares are accounted for at fair value based upon the closing stock price on the date of grant and fully vest at the end of the measurement period. The fair values of PAs granted for the years ended December 31, 2018, 2017 and 2016 were
$71.63
,
$73.54
, and
$72.00
, respectively. The number of PA shares that will vest for the PA program is dependent upon Lilly's earnings achieved during the vesting period. Pursuant to this program, approximately
39,771
shares,
69,144
shares and
20,329
shares were issued by Lilly to our employees during the years ended December 31, 2018, 2017 and 2016, respectively. As of December 31, 2018, the total remaining unrecognized compensation cost related to nonvested PAs was
$5.8 million
, which will be amortized over the weighted-average remaining requisite service period of
12 months
.
Shareholder Value Award Program
SVAs have been granted to certain of our officers and management and are settled in shares of Lilly's common stock. The number of shares actually issued, if any, varies depending on Lilly's stock price at the end of the
three
-year vesting period compared to pre-established target stock prices. We measure the fair value of the SVA unit on the grant date using a Monte Carlo simulation model. The model utilizes multiple input variables that determine the probability of satisfying the market condition stipulated in the award grant and calculates the fair value of the award. Expected volatilities utilized in the model are based on implied volatilities from traded options on Lilly's stock, historical volatility of Lilly's stock price and other factors. Similarly, the dividend yield is based on historical experience and Lilly's estimate of future dividend yields. The risk-free interest rate is derived from the U.S. Treasury yield curve in effect at the time of grant. The weighted-average fair values of the SVA units granted during the years
87
ended December 31, 2018, 2017 and 2016 were
$49.38
,
$66.25
and
$48.68
, respectively, determined using the following assumptions:
|
(Percents)
|
2018
|
2017
|
2016
|
||||||
|
Expected dividend yield
|
2.50
|
%
|
2.50
|
%
|
2.00
|
%
|
|||
|
Risk-free interest rate
|
2.31
|
|
1.38
|
|
0.92
|
|
|||
|
Volatility
|
22.26
|
|
22.91
|
|
21.68
|
|
|||
Pursuant to this program, Lilly issued approximately
30,195
shares,
35,063
shares and
36,071
shares to our employees during the years ended December 31, 2018, 2017 and 2016, respectively. As of December 31, 2018, the total remaining unrecognized compensation cost related to nonvested SVAs was
$3.5 million
, which will be amortized over the weighted-average remaining requisite service period of
20 months
.
Restricted Stock Units
RSUs have been granted to certain of our employees and are payable in shares of Lilly's common stock. RSU shares are accounted for at fair value based upon Lilly's closing stock price on the date of grant. The corresponding expense is amortized over the vesting period, typically
three years
. The fair values of RSU awards granted during the years ended December 31, 2018, 2017 and 2016 were
$70.95
,
$72.47
and
$71.46
, respectively. The number of shares ultimately issued by Lilly for the RSU program remains constant with the exception of forfeitures. Pursuant to this program,
82,025
shares,
57,224
shares and
26,468
shares were settled by Lilly with its RSUs to our employees during the years ended December 31, 2018, 2017 and 2016, respectively. As of December 31, 2018, the total remaining unrecognized compensation cost related to nonvested RSUs was
$12.5 million
which will be amortized over the weighted-average remaining requisite service period of
20 months
.
Elanco Stock Compensation Plans
In connection with IPO, we adopted our own stock based compensation plans, including RSUs and stock options. Our stock-based compensation expense and the related tax under these plans for the year ended December 31, 2018 was
$1.8 million
and
$0.4 million
.
Restricted Stock Units
RSUs are granted to certain employees and are settled in shares of our common stock. RSU shares are accounted for at fair value based upon the closing stock price on the date of the grant. The corresponding expense is amortized over the vesting period, typically
three years
. The fair value of the RSU awards granted during the year ended December 31, 2018 was
$31.09
. The number of shares ultimately issued for the RSU program remains constant with the exception of forfeitures. Pursuant to this program,
158,007
shares were granted and
18,991
shares were issued during the year ended December 31, 2018. As of December 31, 2018, the total remaining unrecognized compensation cost related to nonvested RSUs was
$3.9 million
, which will amortize over the weighted-average remaining requisite service period of
33 months
.
Stock Option Program
Stock options represent the right to purchase shares of our common stock within a specified period of time at a specified price. The exercise price for a stock option will be not less than
100%
of the fair market value of the common stock on the date of the grant.
Stock options are accounted for using a fair-value based method at the date of the grant in the consolidated statement of operations. The values determined through this fair-value-based method generally are amortized on a straight-line basis over the vesting term.
Stock options were granted in 2018 to our officers, management and board members at exercise prices equal to the fair market value of our stock at the date of the grant. Options fully vest
3 years
from the grant date and have a term of
10 years
.
The fair-value-based method for valuing each Elanco stock option grant on the grant date uses the Black-Scholes-Merton option-pricing model, which incorporates a number of valuation assumptions noted in the following table, shown at their weighted-average values for the year ended December 31:
88
|
2018
|
|||
|
Expected dividend yield
(1)
|
0.70
|
%
|
|
|
Risk-free interest rate
(2)
|
3.07
|
%
|
|
|
Expected stock price volatility
(3)
|
28.25
|
%
|
|
|
Expected term
(4)
(years)
|
6.5
|
|
|
(1)
Determined using the expected quarterly dividend divided by the available three-month average stock price as of the valuation date, annualized and continuously compounded.
(2)
Determined using the term-matched, zero-coupon risk-free rate from the Treasury Constant Maturity yield curve, continuously compounded
(3)
Determined using a leverage-adjusted historical volatility of peer companies
(4)
Determined using SEC safe harbor approach, based on a
3
-year cliff vesting schedule and
10
-year contractual term.
Stock option activity during the year ended December 31, 2018 is summarized below:
|
Shares of Common Stock Attributable to Options
|
Weighted-Average Exercise Price of Options
|
||||||
|
Outstanding at January 1, 2018
|
—
|
|
$
|
—
|
|
||
|
Granted
|
421,297
|
|
31.61
|
|
|||
|
Exercised
|
—
|
|
—
|
|
|||
|
Forfeited or expired
|
—
|
|
—
|
|
|||
|
Outstanding at December 31, 2018
|
421,297
|
|
31.61
|
|
|||
|
Exercisable at December 31, 2018
|
58,766
|
|
31.61
|
|
|||
As of December 31, 2018, the weighted-average remaining contractual term of the exercisable options was
9.8
years and the aggregate intrinsic value was
$0.08
.
Note 14. Income Taxes
During the periods presented in the consolidated and combined financial statements, Elanco was generally included in the tax grouping of other Lilly entities within the respective entity's tax jurisdiction; however, in certain jurisdictions, Elanco filed separate tax returns. The income tax (benefit)/expense included in these consolidated and combined financial statements has been calculated using the separate return basis, as if Elanco filed separate tax returns.
2017 Tax Act
In December 2017, the President of the U.S. signed into law the Tax Cuts and Jobs Act (2017 Tax Act). The 2017 Tax Act includes significant changes to the U.S. corporate income tax system, such as the reduction in the corporate income tax rate from 35 percent to 21 percent, transition to a territorial tax system, changes to business related exclusions, deductions and credits, and modifications to international tax provisions, including a one-time repatriation transition tax (also known as the ‘Toll Tax’) on unremitted foreign earnings.
GAAP requires that the income tax accounting effects from a change in tax laws or tax rates be recognized in continuing operations in the reporting period that includes the enactment date of the change. These effects include, among other things, re-measuring deferred tax assets and liabilities, evaluating deferred tax assets for valuation allowances and assessing the impact of the Toll Tax and certain other provisions of the 2017 Tax Act. Our accounting for the tax effects of the enactment of the 2017 Tax Act was not complete as of December 31, 2017; however, in certain cases, we made a reasonable estimate. In other cases, we were unable to make a reasonable estimate and continued to account for those items based on our existing accounting model under ASC 740, Income Taxes and the provisions of the tax laws that were in effect immediately prior to enactment. For the items for which we were able to make a reasonable estimate, we recorded a provisional tax benefit of
$33.1 million
in 2017 related to the impacts of the 2017 Tax Act.
We finalized our accounting for the tax effects of the 2017 Tax Act during 2018. No material adjustments to income tax expense (benefit) were recorded. We expect that further guidance will continue to be issued in 2019 which may impact our interpretations of the 2017 Tax Act and could materially affect the estimates used. The 2017 Tax Act also includes a new U.S. minimum tax, global intangible low-taxed income (GILTI), on the earnings
89
of our foreign subsidiaries. We have elected to account for the tax related to GILTI as a period cost in the year the tax is incurred.
Deferred taxes are recognized for the future tax effects of temporary differences between financial and income tax reporting based on enacted tax laws and rates. We recognize the tax benefit from an uncertain tax position only if it is more likely than not that the tax position will be sustained on examination by the taxing authorities, based on the technical merits of the position. The tax benefits recognized in the financial statements from such a position are measured based on the largest benefit that has a greater than 50 percent likelihood of being realized upon ultimate resolution.
Following is the composition of income (loss) before income tax expense (benefit):
|
2018
|
2017
|
2016
|
|||||||||
|
Federal
|
$
|
12.2
|
|
$
|
(133.2
|
)
|
$
|
(12.5
|
)
|
||
|
Foreign
|
101.9
|
|
(99.4
|
)
|
(9.9
|
)
|
|||||
|
Income (loss) before income taxes
|
$
|
114.1
|
|
$
|
(232.6
|
)
|
$
|
(22.4
|
)
|
||
Following is the composition of income tax expense (benefit):
|
2018
|
2017
|
2016
|
|||||||||
|
Current:
|
|||||||||||
|
Federal
|
$
|
45.1
|
|
|
$
|
—
|
|
|
$
|
—
|
|
|
Foreign
|
45.5
|
|
91.6
|
|
31.1
|
|
|||||
|
State
|
(2.3
|
)
|
(0.1
|
)
|
0.3
|
|
|||||
|
Total current tax expense
|
88.3
|
|
91.5
|
|
31.4
|
|
|||||
|
Deferred:
|
|||||||||||
|
Federal
|
(56.8
|
)
|
42.6
|
|
18.4
|
|
|||||
|
Foreign
|
(5.6
|
)
|
(16.6
|
)
|
(26.8
|
)
|
|||||
|
State
|
1.7
|
|
(6.3
|
)
|
2.5
|
|
|||||
|
2017 Tax Act
|
—
|
|
(33.1
|
)
|
—
|
|
|||||
|
Total deferred tax benefit
|
(60.7
|
)
|
(13.4
|
)
|
(5.9
|
)
|
|||||
|
Income taxes
|
$
|
27.6
|
|
$
|
78.1
|
|
$
|
25.5
|
|
||
Significant components of our deferred tax assets and liabilities as of December 31 are as follows:
|
2018
|
2017
|
||||||
|
Deferred tax assets:
|
|||||||
|
Compensation and benefits
|
$
|
32.2
|
|
$
|
34.8
|
|
|
|
Accruals and reserves
|
47.8
|
|
12.0
|
|
|||
|
Tax credit carryovers
|
1.9
|
|
19.2
|
|
|||
|
Tax loss carryovers
|
21.7
|
|
144.9
|
|
|||
|
Other
|
23.5
|
|
26.6
|
|
|||
|
Total gross deferred tax assets
|
127.1
|
|
237.5
|
|
|||
|
Valuation allowances
|
(21.4
|
)
|
(127.7
|
)
|
|||
|
Total deferred tax assets
|
105.7
|
|
109.8
|
|
|||
|
Deferred tax liabilities:
|
|||||||
|
Intangibles
|
(130.8
|
)
|
(165.2
|
)
|
|||
|
Property and equipment
|
(50.8
|
)
|
(43.1
|
)
|
|||
|
Other
|
(2.7
|
)
|
(7.4
|
)
|
|||
|
Total deferred tax liabilities
|
(184.3
|
)
|
(215.7
|
)
|
|||
|
Deferred tax liabilities - net
|
$
|
(78.6
|
)
|
$
|
(105.9
|
)
|
|
90
Deferred tax assets and liabilities reflect the impact of re-measurement resulting from the 2017 Tax Act.
The deferred tax assets and related valuation allowance amounts for U.S. federal and state net operating losses and tax credits shown above have been reduced for differences between financial reporting and tax return filings.
At December 31, 2018, we have tax credit carryovers of
$6.5 million
available to reduce future income taxes. The amount is comprised of foreign and state credits. Foreign credits total
$4.1 million
and if unused, will expire beginning in 2032. State tax credits of
$2.4 million
are fully reserved.
At December 31, 2018, we had net operating loss carryovers and other carryovers for international and U.S. state income tax purposes of
$156.2 million
:
$84.6 million
will expire by 2023;
$65.0 million
will expire by 2025; and
$1.6 million
of the carryovers will never expire. Net operating losses and other carryovers for international and U.S. state income tax purposes are partially reserved. Deferred tax assets related to state net operating losses of
$4.9 million
are fully reserved.
The movements in the valuation allowance are as follows:
|
2018
|
2017
|
||||||
|
January 1
|
$
|
(127.7
|
)
|
$
|
(39.1
|
)
|
|
|
Adjustment related to Separation
|
110.4
|
|
|
—
|
|
||
|
January 1
|
(17.3
|
)
|
|
(39.1
|
)
|
||
|
Increase
|
(5.8
|
)
|
(97.4
|
)
|
|||
|
Release
|
1.7
|
|
8.8
|
|
|||
|
December 31
|
$
|
(21.4
|
)
|
|
$
|
(127.7
|
)
|
Prior to the IPO, we prepared the income tax amounts and balances based upon a separate return methodology, as if we were separate taxpayers from Lilly. As a result, certain tax credit and net operating loss carryovers are not available for use in future periods as they were used in Lilly consolidated or combined tax return filings. Accordingly, as a result of the Separation, the tax credit and net operating loss carryovers and related valuation allowance have been adjusted to reflect the balance after Separation. These adjustments had no impact on income tax expense in the consolidated and combined financial statements. The separation entries related to the valuation allowance were offset by
$133.7 million
, prior to tax effect, of separation entries related to the removal of the net operating losses.
The 2017 Tax Act introduced international tax provisions that significantly change the U.S. taxation of foreign earnings. At December 31, 2018,
no
U.S. taxes or foreign withholding taxes have been accrued with respect to the
$464.5 million
in unremitted earnings of our foreign subsidiaries as they are considered indefinitely reinvested for continued use in our foreign operations. It is not practicable to determine the unrecognized deferred tax liability related to these earnings.
Cash payments of income taxes were as follows:
|
2018
|
2017
|
2016
|
|||||||||
|
Cash payments of income taxes
|
$
|
26.9
|
|
$
|
35.7
|
|
$
|
53.6
|
|
||
The following is a reconciliation of the income tax expense (benefit) applying the U.S. federal statutory rate to income before income taxes to reported income tax expense:
91
|
2018
|
2017
|
2016
|
|||||||||
|
Income tax at the U.S. federal statutory tax rate
|
$
|
24.0
|
|
$
|
(81.4
|
)
|
$
|
(7.8
|
)
|
||
|
Add (deduct):
|
|||||||||||
|
International operations and change in foreign tax rates
|
11.5
|
|
55.6
|
|
8.4
|
|
|||||
|
State taxes
|
4.4
|
|
5.4
|
|
2.8
|
|
|||||
|
Income tax credits
|
(17.3
|
)
|
(1.8
|
)
|
(1.7
|
)
|
|||||
|
Foreign inclusion items
|
9.0
|
|
4.2
|
|
2.4
|
|
|||||
|
IPO and separation costs
|
2.3
|
|
|
—
|
|
|
—
|
|
|||
|
Other permanent adjustments
|
0.9
|
|
|
1.6
|
|
|
0.2
|
|
|||
|
Change in uncertain tax positions
|
(1.7
|
)
|
6.2
|
|
5.2
|
|
|||||
|
Change in valuation allowance
|
(1.7
|
)
|
122.2
|
|
18.1
|
|
|||||
|
2017 Tax Act
|
—
|
|
(33.1
|
)
|
—
|
|
|||||
|
Other
|
(3.8
|
)
|
(0.8
|
)
|
(2.1
|
)
|
|||||
|
Income taxes
|
$
|
27.6
|
|
$
|
78.1
|
|
$
|
25.5
|
|
||
A reconciliation of the beginning and ending amount of gross unrecognized tax benefits is as follows:
|
2018
|
2017
|
2016
|
|||||||||
|
Beginning balance at January 1
|
$
|
29.6
|
|
$
|
25.7
|
|
$
|
25.5
|
|
||
|
Adjustments related to Separation
|
(17.6
|
)
|
|
—
|
|
|
—
|
|
|||
|
Beginning balance at January 1
|
12.0
|
|
|
25.7
|
|
|
25.5
|
|
|||
|
Additions based on tax positions related to the current year
|
2.2
|
|
7.9
|
|
7.4
|
|
|||||
|
Additions for tax positions of prior years
|
4.0
|
|
—
|
|
—
|
|
|||||
|
Settlements
|
(3.0
|
)
|
(4.0
|
)
|
(7.1
|
)
|
|||||
|
Changes related to the impact of foreign currency translation
|
(0.5
|
)
|
—
|
|
(0.1
|
)
|
|||||
|
Ending balance at December 31
|
$
|
14.7
|
|
$
|
29.6
|
|
$
|
25.7
|
|
||
The total amount of unrecognized tax benefits that, if recognized, would affect tax expense by
$12.8 million
and
$29.6 million
at December 31, 2018
and 2017, respectively. There are
$1.9 million
of 2018 unrecognized tax benefits which related to temporary differences which would not, if recognized, impact the effective tax rate. Adjustments related to the Separation represent unrecognized tax benefits assumed by Lilly in the Separation and have no impact on income tax expense in the consolidated and combined financial statements.
We file income tax returns in the U.S. federal jurisdiction and various state, local and non-U.S. jurisdictions. Certain of these income tax returns are filed on a consolidated or combined basis with Eli Lilly and Company and/or its subsidiaries.
We are included in Lilly's U.S. tax examinations by the Internal Revenue Service. Pursuant to the Tax Matters Agreement we executed with Lilly in connection with the IPO, the liabilities or potential refunds attributable to pre-IPO periods in which Elanco was included in a Lilly consolidated or combined tax return remain with Lilly. Consequently, although a U.S. examination of tax years 2013-2015 is currently in progress, the resulting adjustments, if any, will not require any cash tax payments by Elanco. We are not otherwise subject to U.S. federal, state and local, or non-U.S. income tax examinations in most major taxing jurisdictions for years before 2013.
We recognize both accrued interest and penalties related to unrecognized tax benefits in income tax expense (benefit). We recognized income tax expense (benefit) related to interest and penalties as follows:
|
2018
|
2017
|
2016
|
|||||||||
|
Income tax expense (benefit)
|
$
|
(2.5
|
)
|
$
|
2.5
|
|
$
|
5.5
|
|
||
At December 31, 2018 and 2017, our accruals for the payment of interest and penalties totaled
$13.3 million
and
$15.7 million
, respectively.
Note 15. Contingencies
92
We are party to various legal actions in the normal course of business. In determining whether a pending matter is significant for financial reporting and disclosure purposes, we consider both quantitative and qualitative factors in order to assess materiality. We accrue for certain liability claims to the extent we can formulate a reasonable estimate of their costs and there is a reasonable probability of incurring significant costs or expenses. At December 31, 2018 and December 31, 2017, we had
no
liabilities established related to litigation as there were no significant claims which were probable and estimable. We have not historically had any significant litigation expense and are not currently subject to a significant claim.
Note 16. Geographic Information
We operate as a single operating segment engaged in the development, manufacturing, marketing and sales of animal health products worldwide for both food animals and companion animals. Consistent with our operational structure, our President and Chief Executive Officer (CEO), as the chief operating decision maker, makes resource allocation and business process decisions globally across our consolidated business. Strategic decisions are managed globally with global functional leaders responsible for determining significant costs/investments and with regional leaders responsible for overseeing the execution of the global strategy. Our global research and development organization is responsible for development of new products. Our manufacturing organization is responsible for the manufacturing and supply of products and for the optimization of our supply chain. Regional leaders are responsible for the distribution and sale of our products and for local direct costs. The business is also supported by global corporate staff functions. Managing and allocating resources at the global corporate level enables our CEO to assess the overall level of resources available and how to best deploy these resources across functions, product types, regional commercial organizations and research and development projects in line with our overarching long-term corporate-wide strategic goals, rather than on a product or geographic basis. Consistent with this decision-making process, our CEO uses consolidated, single-segment financial information for purposes of evaluating performance, allocating resources, setting incentive compensation targets, as well as forecasting future period financial results.
Our products include Rumensin®, Optaflexx®, Denagard®, Tylan®, Maxiban® and other products for livestock and poultry, as well as Trifexis®, Interceptor®, Comfortis® and other products for companion animals. Our results for the year ended December 31, 2017 includes the results of operations from BIVIVP, which was acquired on January 3, 2017 (Note 6).
We have a single customer that accounted for
11.9%
,
12.9%
and
11.7%
of revenue for the years ended December 31, 2018, 2017 and 2016, respectively, and that represented accounts receivable of
$96.4 million
and
$88.0 million
as of December 31, 2018 and 2017, respectively.
We are exposed to the risk of changes in social, political and economic conditions inherent in foreign operations and our results of operations and the value of our foreign assets are affected by fluctuations in foreign currency exchange rates.
Selected geographic area information was as follows:
|
2018
|
2017
|
2016
|
||||||||||
|
Geographic Information
|
||||||||||||
|
Revenue — to unaffiliated customers
(1)
:
|
||||||||||||
|
United States
|
$
|
1,483.2
|
|
$
|
1,373.0
|
|
$
|
1,361.6
|
|
|||
|
International
|
1,583.6
|
|
1,516.0
|
|
1,551.9
|
|
||||||
|
Revenue
|
$
|
3,066.8
|
|
$
|
2,889.0
|
|
$
|
2,913.5
|
|
|||
|
Long-lived assets
(2)
:
|
||||||||||||
|
United States
|
$
|
602.6
|
|
$
|
604.7
|
|
$
|
463.8
|
|
|||
|
United Kingdom
|
187.5
|
|
204.4
|
|
190.6
|
|
||||||
|
Other foreign countries
|
195.8
|
|
190.2
|
|
173.0
|
|
||||||
|
Long-lived assets
|
$
|
985.9
|
|
$
|
999.3
|
|
$
|
827.4
|
|
|||
(1) Revenue is attributed to the countries based on the location of the customer.
(2) Long-lived assets consist of property and equipment, net, and certain noncurrent assets.
Note 17. Retirement Benefits
93
Shared Lilly Plans
Our employees participated in defined benefit pension and other postretirement plans sponsored by Lilly, which include participants of Lilly's other business. Such plans are accounted for as multiemployer plans in these combined financial statements and as a result, no asset or liability was recorded by the Company to recognize the funded status of these plans.
We recorded expense of
$4.0 million
,
$73.7 million
and
$11.3 million
for the years ended December 31, 2018, 2017 and 2016, respectively, relating to our employees’ participation in Lilly sponsored plans. The expense included
$67.0 million
related to a curtailment loss and special termination benefits for early retirement incentives offered by Lilly to our employees as part of a voluntary early retirement program for the U.S. plan and which has been recorded in asset impairment, restructuring and other special charges.
No
contributions have been recognized in the combined financial statements as we are not required to make contributions to these plans.
Pension Plans
There are also certain defined benefit pension plans that our employees participate in that are either dedicated to our employees or where the plan assets and liabilities that relate to our employees were legally required to transfer to Elanco at the time of our separation from Lilly. The plans in Switzerland represent approximately
84 percent
of our global benefit obligation.
We use a measurement date of December 31 to develop the change in benefit obligation, change in plan assets, funded status and amounts recognized in the combined balance sheets at December 31 for our defined benefit pension plans, which were as follows:
94
|
|
2018
|
2017
|
|||||
|
Change in benefit obligation:
|
|||||||
|
Benefit obligation at beginning of year
|
$
|
258.6
|
|
$
|
225.0
|
|
|
|
Service cost
|
11.3
|
|
10.5
|
|
|||
|
Interest cost
|
2.5
|
|
1.8
|
|
|||
|
Actuarial (gain) loss
|
(44.7
|
)
|
24.4
|
|
|||
|
Benefits paid
|
(2.7
|
)
|
(18.5
|
)
|
|||
|
Foreign currency exchange rate changes and other adjustments
|
9.8
|
|
15.4
|
|
|||
|
Benefit obligation at end of year
|
234.8
|
|
258.6
|
|
|||
|
Change in plan assets:
|
|||||
|
Fair value of plan assets at beginning of year
|
131.5
|
|
123.7
|
|
|
|
Actual return on plan assets
|
(10.2
|
)
|
13.3
|
|
|
|
Employer contribution
|
5.7
|
|
3.9
|
|
|
|
Benefits paid
|
(2.7
|
)
|
(18.5
|
)
|
|
|
Foreign currency exchange rate changes and other adjustments
|
7.3
|
|
9.1
|
|
|
|
Fair value of plan assets at end of year
|
131.6
|
|
131.5
|
|
|
|
Funded status
|
(103.2
|
)
|
(127.1
|
)
|
|||
|
Unrecognized net actuarial loss
|
0.5
|
|
29.1
|
|
|||
|
Unrecognized prior service cost
|
0.8
|
|
0.7
|
|
|||
|
Net amount recognized
|
$
|
(101.9
|
)
|
$
|
(97.3
|
)
|
|
|
Amounts recognized in the combined balance sheet consisted of:
|
|||||||
|
Noncurrent assets
|
$
|
2.3
|
|
$
|
2.4
|
|
|
|
Other current liabilities
|
(0.3
|
)
|
(0.3
|
)
|
|||
|
Accrued retirement benefits
|
(105.2
|
)
|
(129.2
|
)
|
|||
|
Accumulated other comprehensive loss before income taxes
|
1.3
|
|
29.8
|
|
|||
|
Net amount recognized
|
$
|
(101.9
|
)
|
$
|
(97.3
|
)
|
|
The unrecognized net actuarial loss and unrecognized prior service cost for these pension plans have not yet been recognized in net periodic pension costs and are included in accumulated other comprehensive loss at December 31, 2018.
During 2019, we expect the following components of accumulated other comprehensive loss to be recognized as components of net periodic benefit cost:
|
Unrecognized net actuarial loss
|
$
|
0.5
|
|
|
Unrecognized prior service cost
|
0.8
|
|
|
|
Total
|
$
|
1.3
|
|
We do not expect any plan assets to be returned to us in 2019.
The following represents our weighted-average assumptions related to these pension plans as of December 31:
|
(Percents)
|
2018
|
2017
|
2016
|
|||
|
Discount rate for benefit obligation
|
1.5%
|
1.1%
|
1.0%
|
|||
|
Discount rate for net benefit costs
|
1.1
|
1.0
|
1.0
|
|||
|
Rate of compensation increase for benefit obligation
|
2.2
|
2.1
|
3.1
|
|||
|
Rate of compensation increase for net benefit costs
|
2.1
|
3.1
|
3.0
|
|||
|
Expected return on plan assets for net benefit costs
|
4.0
|
4.4
|
4.9
|
|||
95
We annually evaluate the expected return on the plan assets in these pension plans. In evaluating the expected rate of return, we consider many factors, with a primary analysis of current and projected market conditions; asset returns and asset allocations; and the views of leading financial advisers and economists. We may also review our historical assumptions compared with actual results, as well as the assumptions and trend rates utilized by similar plans, where applicable.
The following benefit payments, which reflect expected future service, as appropriate, are expected to be paid as follows:
|
2019
|
2020
|
2021
|
2022
|
2023
|
2024-2028
|
||||||||||||||||||
|
Benefit payments
|
$
|
5.8
|
|
$
|
6.4
|
|
$
|
7.1
|
|
$
|
6.1
|
|
$
|
6.3
|
|
$
|
35.9
|
|
|||||
Amounts relating to these pension plans with projected benefit obligations in excess of plan assets were as follows at December 31:
|
|
2018
|
2017
|
|||||
|
Projected benefit obligation
|
$
|
229.2
|
|
$
|
251.6
|
|
|
|
Fair value of plan assets
|
124.1
|
|
121.8
|
|
|||
Amounts relating to these defined benefit pension plans with accumulated benefit obligations in excess of plan assets were as follows at December 31:
|
|
2018
|
2017
|
|||||
|
Accumulated benefit obligation
|
$
|
194.3
|
|
$
|
223.1
|
|
|
|
Fair value of plan assets
|
124.1
|
|
121.8
|
|
|||
The total accumulated benefit obligation for these defined benefit pension plans was
$199.9 million
and
$230.3 million
at December 31, 2018 and 2017, respectively.
Net pension expense related to these plans included the following components:
|
|
2018
|
2017
|
2016
|
||||||||
|
Service cost
|
$
|
11.3
|
|
$
|
10.5
|
|
$
|
9.3
|
|
||
|
Interest cost
|
2.5
|
|
1.8
|
|
1.8
|
|
|||||
|
Expected return on plan assets
|
(6.2
|
)
|
(2.4
|
)
|
(3.4
|
)
|
|||||
|
Amortization of prior service cost
|
0.2
|
|
0.1
|
|
0.1
|
|
|||||
|
Amortization of net actuarial loss
|
1.9
|
|
1.4
|
|
1.0
|
|
|||||
|
Other
|
0.5
|
|
—
|
|
—
|
|
|||||
|
Net pension expense
|
$
|
10.2
|
|
$
|
11.4
|
|
$
|
8.8
|
|
||
The following represents the amounts recognized for these plans in other comprehensive loss:
|
2018
|
2017
|
2016
|
|||||||||
|
Actuarial gain (loss) arising during period
|
$
|
28.3
|
|
$
|
(17.0
|
)
|
$
|
(6.1
|
)
|
||
|
Amortization of prior service cost included in net loss
|
0.2
|
|
0.1
|
|
0.1
|
|
|||||
|
Amortization of net actuarial loss included in net loss
|
1.9
|
|
1.4
|
|
1.0
|
|
|||||
|
Foreign currency exchange rate changes and other
|
(1.9
|
)
|
3.5
|
|
3.0
|
|
|||||
|
Total other comprehensive income (loss) during period
|
$
|
28.5
|
|
$
|
(12.0
|
)
|
$
|
(2.0
|
)
|
||
Benefit Plan Investments
Our benefit plan investment policies are set with specific consideration of return and risk requirements in relationship to the respective liabilities. Our plan assets in our Switzerland pension plans represent approximately
87 percent
of our plan assets for these pension plans. Given the long-term nature of our liabilities, these plans have the flexibility to manage an above-average degree of risk in the asset portfolios. At the investment-policy level, there are no specifically prohibited investments. However, within individual investment manager mandates, restrictions and limitations are contractually set to align with our investment objectives, ensure risk control and limit concentrations.
96
We manage our portfolio to minimize concentration of risk by allocating funds within asset categories. In addition, within a category we use different managers with various management objectives to eliminate any significant concentration of risk.
The investment strategy is to diversify in four major categories with a designated percentage invested in each including
24%
fixed income securities,
48%
equity securities, a share of
11%
in Real Estate Switzerland and
17%
in other alternative investments (senior loans, hedge funds and insurance-linked securities). Each category is diversified and comprised of the following:
|
•
|
Fixed-income securities - Swiss Bonds, Global Aggregates, Global Aggregate Corporates and Emerging Markets Local Currencies.
|
|
•
|
Equity investments - Swiss Equities, World Equities MSCI, Low Volatility Equities (to reduce risk), Emerging Markets Equities and real estate investment trusts.
|
|
•
|
Real Estate in Switzerland - investment foundations and funds
|
|
•
|
Other investments - represents primarily private equity like investments, hedge funds, insurance-linked securities, cash and mark-to-market derivatives.
|
We determine the fair value of the investments based on a market approach using quoted market values, significant other observable inputs for identical or comparable assets or liabilities, or discounted cash flow analysis for all investments except hedge funds, private equity-like investments and real estate.
We determine the fair value of investments using the value reported by the partnership, adjusted for known cash flows and significant events through our reporting date. Values provided by the partnerships are primarily based on analysis of and judgments about the underlying investments. Inputs to these valuations include underlying NAVs, discounted cash flow valuations, comparable market valuations, and may also include adjustments for currency, credit, liquidity and other risks as applicable. The vast majority of these private partnerships provide us with annual financial statements including their compliance with fair valuation procedures consistent with applicable accounting standards.
We determine the fair value of real estate investments based on the NAV provided by the fund manager. These NAVs are developed with inputs including discounted cash flow, independent appraisal and market comparable analyses.
The fair values of these pension plan assets as of December 31, 2018 by asset category are as follows:
|
|
|
|
Fair Value Measurements Using
|
|||||||||||||||||
|
Asset Class
|
Total
|
Quoted Prices in Active Markets for Identical Assets (Level 1)
|
Significant Observable Inputs (Level 2)
|
Significant Unobservable Inputs (Level 3)
|
Investments Valued at Net Asset Value
(1)
|
|||||||||||||||
|
Public equity securities
|
$
|
2.2
|
|
$
|
1.0
|
|
$
|
—
|
|
$
|
—
|
|
$
|
1.2
|
|
|||||
|
Fixed income:
|
||||||||||||||||||||
|
Developed markets
|
29.9
|
|
7.8
|
|
0.1
|
|
—
|
|
22.0
|
|
||||||||||
|
Emerging markets
|
6.4
|
|
0.7
|
|
0.4
|
|
—
|
|
5.3
|
|
||||||||||
|
Private alternative investments:
|
—
|
|
||||||||||||||||||
|
Hedge funds
|
6.6
|
|
—
|
|
—
|
|
—
|
|
6.6
|
|
||||||||||
|
Equity-like funds
|
49.0
|
|
—
|
|
—
|
|
—
|
|
49.0
|
|
||||||||||
|
Real estate
|
20.1
|
|
0.1
|
|
—
|
|
—
|
|
20.0
|
|
||||||||||
|
Other
|
17.4
|
|
0.3
|
|
2.3
|
|
—
|
|
14.8
|
|
||||||||||
|
Total
|
$
|
131.6
|
|
$
|
9.9
|
|
$
|
2.8
|
|
$
|
—
|
|
$
|
118.9
|
|
|||||
|
(1)
|
Certain investments that are measured at fair value using the NAV per share (or its equivalent) as a practical expedient have not been classified in the fair value hierarchy.
|
No material transfers between Level 1, Level 2, or Level 3 occurred during the year ended December 31, 2018. The activity in the Level 3 investments during the year ended December 31, 2018 was not material.
97
The fair values of these pension plan assets as of December 31, 2017 by asset category are as follows:
|
|
|
Fair Value Measurements Using
|
||||||||||||||||||
|
Asset Class
|
Total
|
Quoted Prices in Active Markets for Identical Assets (Level 1)
|
Significant Observable Inputs (Level 2)
|
Significant Unobservable Inputs (Level 3)
|
Investments Valued at Net Asset Value
(1)
|
|||||||||||||||
|
Public equity securities
|
$
|
0.8
|
|
$
|
0.6
|
|
$
|
—
|
|
$
|
—
|
|
$
|
0.2
|
|
|||||
|
Fixed income:
|
||||||||||||||||||||
|
Developed markets
|
29.9
|
|
8.2
|
|
0.1
|
|
—
|
|
21.6
|
|
||||||||||
|
Emerging markets
|
7.2
|
|
0.6
|
|
0.3
|
|
—
|
|
6.3
|
|
||||||||||
|
Private alternative investments:
|
|
|||||||||||||||||||
|
Hedge funds
|
6.8
|
|
—
|
|
—
|
|
—
|
|
6.8
|
|
||||||||||
|
Equity-like funds
|
52.7
|
|
—
|
|
—
|
|
—
|
|
52.7
|
|
||||||||||
|
Real estate
|
20.2
|
|
—
|
|
—
|
|
—
|
|
20.2
|
|
||||||||||
|
Other
|
13.9
|
|
0.1
|
|
0.1
|
|
13.7
|
|
||||||||||||
|
Total
|
$
|
131.5
|
|
$
|
9.5
|
|
$
|
0.5
|
|
$
|
—
|
|
$
|
121.5
|
|
|||||
|
(1)
|
Certain investments that are measured at fair value using the NAV per share (or its equivalent) as a practical expedient have not been classified in the fair value hierarchy.
|
No material transfers between Level 1, Level 2, or Level 3 occurred during the year ended December 31, 2017. The activity in the Level 3 investments during the year ended December 31, 2017 was not material.
No
contributions to these pension plans are expected in 2019.
Retiree Health Benefit Plan
There are
two
retiree health benefit plan where the plan liabilities that relate to our employees were legally required to transfer to Elanco at the time of separation from Lilly. The accrued retirement benefits for these plans were
$3.9 million
and
$9.8 million
as of December 31, 2018 and 2017, respectively.
Defined Contribution Plans
Lilly has defined contribution savings plans that include certain of our employees worldwide. The purpose of these plans is generally to provide additional financial security during retirement by providing employees with an incentive to save. Our contributions to the plans are based on our employee contributions and the level of our match. Expenses related to our employees under the plans totaled
$20.9 million
,
$22.1 million
and
$19.6 million
for the years ended December 31, 2018, 2017, and 2016, respectively.
98
Note 18. Earnings Per Share
As discussed in Note 1, Elanco Parent was formed for the purpose of facilitating the IPO. Lilly held all shares of Elanco Parent from the time of formation until the IPO.
Prior to IPO, there were an aggregate of
293,290,000
shares of our common stock held by Lilly (which represents the
100
shares held by Lilly prior to giving effect to the
2,932,900
-for-1 stock split that occurred on September 19, 2018). In connection with the completion of the IPO, an additional
72,335,000
shares of our common stock were issued.
Earnings per share was calculated based on the weighted average shares outstanding during each period based on the assumption that the shares held by Lilly were outstanding for all periods prior to IPO.
Note 19. Related Party Agreements and Transactions
Transactions with Lilly Subsequent to Separation and Related to the Separation
As described in Note 1, in connection with the Separation, Lilly transferred to us substantially all of its animal health businesses in exchange for approximately
$4.2 billion
. This is reflected as consideration to Lilly in our consolidated and combined statement of equity. The terms of our separation are covered by a master services agreement entered with Lilly (MSA). Under the terms of the MSA, through a series of transactions, Lilly transferred to us the businesses that will continue as part of Elanco.
For a certain portion of our operations, the legal transfer of our net assets did not occur prior to the Separation due to certain regulatory requirements in each of these countries. Under the MSA entered into with Lilly, we are responsible for the business activities conducted by Lilly on our behalf and are subject to the risks and entitled to the benefits generated by these operations and assets. As a result, the related assets and liabilities and results of operations have been reported in our consolidated and combined financial statements. The total net assets associated with these jurisdictions are
$95.6 million
and the annual profits are insignificant. As of December 31, 2018, we have
$202.7 million
of restricted cash on our consolidated and combined balance sheet along with an offsetting Payable to Lilly, which reflects the cash that will be used to fund the purchase of the local country assets from Lilly.
At the time of the IPO, we entered into a number of agreements related to ongoing activities between Elanco and Lilly including the following:
|
•
|
Transitional Services Agreement. Historically, Lilly has provided us significant shared services and resources related to corporate functions such as executive oversight, treasury, legal, finance, human resources, tax, internal audit, financial reporting, information technology and investor relations, which we refer to collectively as the "Lilly Services." Under the terms of the TSA, we will be able to use Lilly Services for a fixed term established on a service-by-service basis. We will pay Lilly mutually agreed-upon fees for the Lilly Services provided under the TSA, which will be based on Lilly's cost (including third-party costs) of providing the Lilly Services through
March 31, 2021
, and subject to a mark-up of
7%
thereafter, with additional inflation-based escalation beginning
January 1, 2020
. The fees under the TSA become payable for all periods beginning after
October 1, 2018
.
|
|
•
|
Intellectual Property and Technology License Agreement. We entered into an intellectual property and technology license agreement with Lilly immediately prior to the completion of the IPO. Under the intellectual property and technology license agreement, Lilly granted Elanco an exclusive, perpetual license to exploit products in the animal health field that utilize or use certain of Lilly's intellectual property (excluding trademarks). In addition, Lilly granted Elanco non-exclusive, non-sublicensable license to screen certain compounds in Lilly's compound libraries to exploit products in the animal use certain of Lilly's intellectual property. This screening license has an initial term of
two years
, subject to
three
one
-year extensions, each of which requires Lilly's consent.
|
We also entered into a tax matters agreement (TMA), an employee matters agreement, a toll manufacturing and supply agreement and a registration rights agreement with Lilly in connection with the Separation.
Our consolidated and combined financial statement of operations includes revenue of
$7.0 million
related to a toll manufacturing arrangement and
$28 million
related to TSA charges.
At December 31, 2018, we have a payable to Lilly of
$66.0 million
reflected in Payable to Lilly on our consolidated and combined balance sheet related to ongoing transactions with Lilly including those transactions described above and the reimbursement of certain costs Lilly incurred on our behalf during the period.
Transactions with Lilly Prior to Separation
99
Prior to IPO, we did not operate as a standalone business and had various relationships with Lilly whereby Lilly provided services to us. The impact on our historical combined financial statements includes the following:
Transfers to/from Lilly, net
As discussed in the basis of presentation, net parent company investment is primarily impacted by contributions from Lilly, which are the result of treasury activity and net funding provided by or distributed to Lilly. For the years ended
December 31, 2018
,
2017
and 2016, the net transfers (to)/from Lilly were
$(226.3) million
,
$873.3 million
and
($129.2) million
, respectively. The most significant activity impacting the 2017 transfer was the financing by Lilly of our acquisition in the amount of
$882.1 million
for Boehringer Ingelheim Vetmedica, Inc.'s United States feline, canine, and rabies vaccine portfolio and other related assets in 2017. Other activities that impacted the net transfers (to)/from Lilly include corporate overhead and other allocations, income taxes, retirement benefits, and centralized cash management.
Corporate Overhead and Other Allocations
Lilly provides us certain services, including executive oversight, treasury, legal, finance, human resources, tax, internal audit, financial reporting, information technology and investor relations. We provide Lilly certain services related to manufacturing support. Our financial statements reflect an allocation of these costs prior to IPO. When specific identification is not practicable, the remainder have been allocated primarily on a proportional cost method on a basis of revenue or headcount.
The allocations of services from Lilly, prior to IPO, to us were reflected as follows in the combined statements of operations:
|
2018
(1)
|
2017
|
2016
|
|||||||||
|
Cost of sales
|
$
|
21.8
|
|
$
|
31.8
|
|
$
|
32.5
|
|
||
|
Research and development
|
2.2
|
|
2.8
|
|
2.3
|
|
|||||
|
Marketing, selling and administrative
|
81.2
|
|
117.1
|
|
110.5
|
|
|||||
|
Total
|
$
|
105.2
|
|
$
|
151.7
|
|
$
|
145.3
|
|
||
(1) Through September 30, 2018
We provide Lilly certain services related to manufacturing support. Allocations of manufacturing support from us to Lilly
$3.7 million
,
$6.2 million
and
$5.5 million
for the for the years ended
December 31, 2018
,
2017
and 2016, respectively, reduced the cost of sales in the consolidated and combined statements of operations.
The financial information herein may not necessarily reflect our consolidated financial position, results of operations and cash flows in the future or what they would have been if we had been a separate, standalone entity during the periods presented. Management believes that the methods used to allocate expenses are reasonable.
Stock-based Compensation
As discussed in Note 13, our employees participate in Lilly stock-based compensation plans, the costs of which have been allocated to us and recorded in cost of sales, research and development, and marketing, selling and administrative expenses in the consolidated and combined statements of operations. The costs of such plans related to our employees were
$26.0 million
,
$25.0 million
and
$20.4 million
for the year ended
December 31, 2018
,
2017
and 2016, respectively.
Retirement Benefits
As discussed in Note 17, our employees participate in defined benefit pension and other post retirement plans sponsored by Lilly, the costs and benefits of which have been recorded in the consolidated and combined statement of operations in cost of sales, research and development, and marketing, selling and administrative expenses. the costs/(benefits) of such plans related to the Company's employees were
$(6.3) million
, $
73.7 million
and
$11.3 million
for the years ended December 31, 2018, 2017 and 2016, respectively.
Centralized Cash Management
Lilly uses a centralized approach to cash management and financing of operations. Until Separation, the majority of our business was party to Lilly’s cash pooling arrangements to maximize Lilly's availability of cash for general operating and investing purposes. Under these cash pooling arrangements, cash balances were swept regularly from our accounts prior to IPO. Cash transfers to and from Lilly’s cash concentration accounts and the resulting balances at the end of each reporting period were reflected in net parent company investment in the combined balance sheets.
Debt
100
Prior to IPO, Lilly’s third-party debt and the related interest expense were not allocated to us for any of the periods presented in the combined statement of operations and balance sheets as we were not the legal obligor of the debt and Lilly borrowings were not directly attributable to our business.
Other Related Party Transactions
We sell certain products to and receive certain goods and services from a customer/vendor, whose chairman and Chief Executive Officer is a member of Lilly's Board of Directors. These product sales resulted in revenue of
$23.5 million
,
$24.8 million
and
$14.3 million
for the years ended
December 31, 2018
,
2017
and 2016, respectively. The product sales resulted in accounts receivable of
$2.5 million
and
$2.0 million
at
December 31, 2018
and 2017, respectively. The purchase of goods and services resulted in cost of sales and operating expenses of
$3.9 million
,
$5.9 million
and
$7.1 million
for the years ended
December 31, 2018
,
2017
and 2016, respectively. The purchase of goods and services resulted in accounts payable of
$0.7 million
and
$0.4 million
at
December 31, 2018
and 2017, respectively.
101
Note 20. Selected Quarterly Data (unaudited)
|
2018
|
Fourth
|
Third
|
Second
|
First
|
||||||||||||
|
Revenue
|
$
|
799.3
|
|
$
|
761.1
|
|
$
|
770.2
|
|
$
|
736.2
|
|
||||
|
Cost of sales
|
412.5
|
|
369.8
|
|
431.5
|
|
360.0
|
|
||||||||
|
Operating expenses
(1)
|
246.2
|
|
237.9
|
|
252.5
|
|
245.2
|
|
||||||||
|
Asset Impairment, restructuring, and other special charges
|
46.0
|
|
12.4
|
|
68.0
|
|
2.4
|
|
||||||||
|
Interest expense, net of capitalized interest
|
21.0
|
|
|
8.6
|
|
|
—
|
|
|
—
|
|
|||||
|
Income (loss) before income taxes
|
(2.2
|
)
|
78.8
|
|
(40.0
|
)
|
77.5
|
|
||||||||
|
Income taxes
|
(18.6
|
)
|
18.6
|
|
22.8
|
|
4.8
|
|
||||||||
|
Net income (loss)
|
16.4
|
|
60.2
|
|
(62.8
|
)
|
72.7
|
|
||||||||
|
Earnings (loss) per share—basic and diluted
|
0.04
|
|
0.20
|
|
(0.21
|
)
|
0.25
|
|
||||||||
|
|
|
|
||||||||||||||
|
2017
|
Fourth
|
Third
|
Second
|
First
|
||||||||||||
|
Revenue
|
$
|
754.3
|
|
$
|
697.1
|
|
$
|
732.8
|
|
$
|
704.8
|
|
||||
|
Cost of sales
|
405.0
|
|
376.2
|
|
374.0
|
|
338.6
|
|
||||||||
|
Operating expenses
(1)
|
258.8
|
|
256.6
|
|
257.8
|
|
258.3
|
|
||||||||
|
Asset Impairment, restructuring, and other special charges
|
185.8
|
|
23.7
|
|
58.8
|
|
106.8
|
|
||||||||
|
Interest expense, net of capitalized interest
|
—
|
|
|
—
|
|
|
—
|
|
|
—
|
|
|||||
|
Income (loss) before income taxes
|
(155.4
|
)
|
(9.1
|
)
|
(15.2
|
)
|
(52.9
|
)
|
||||||||
|
Income taxes
|
6.1
|
|
11.6
|
|
15.0
|
|
45.4
|
|
||||||||
|
Net income (loss)
|
(161.5
|
)
|
(20.7
|
)
|
(30.2
|
)
|
(98.3
|
)
|
||||||||
|
Earnings (loss) per share—basic and diluted
|
(0.55
|
)
|
(0.07
|
)
|
(0.10
|
)
|
(0.34
|
)
|
||||||||
(1)
Includes research and development and marketing, selling, and administrative expenses.
Item 9. Changes in and Disagreements with Accountants on Accounting and Financial Disclosure
None
Item 9A. Controls and Procedures
Disclosure Controls and Procedures
Under applicable SEC regulations, management of a reporting company, with the participation of the principal executive officer and principal financial officer, must periodically evaluate the company’s “disclosure controls and procedures,” which are defined generally as controls and other procedures of a reporting company designed to ensure that information required to be disclosed by the reporting company in its periodic reports filed with the SEC (such as this Form 10-K) is recorded, processed, summarized, and reported on a timely basis.
Our management, with the participation of Jeff Simmons, president and chief executive officer, and Todd Young, executive vice president and chief financial officer, evaluated our disclosure controls and procedures as of December 31, 2018. Based on this evaluation, the chief executive officer and the chief financial officer concluded that the disclosure controls and procedures are effective.
Internal Control over Financial Reporting
This 2018 annual report does not include a report of management's assessment regarding internal control over financial reporting or an attestation report of the company's registered public accounting firm due to a transition period established by rules of the Securities and Exchange Commission for newly public companies.
Changes in Internal Control
102
During the fourth quarter of 2018, there were no changes in our internal control over financial reporting that materially affected, or are reasonably likely to materially affect, our internal control over financial reporting.
Item 9B. Other Information
Not applicable.
Part III
Item 10. Directors, Executive Officers, and Corporate Governance
Information on Directors, Executive Officers and Corporate Governance can be found in the Proxy Statement under "Governance." That information is incorporated in this report by reference.
Item 11. Executive Compensation
Information on director compensation, executive compensation, and compensation committee matters can be found in the Proxy Statement under “Director Compensation,” "Committees of the Board of Directors - Compensation Committee," "Compensation Discussion and Analysis," and “Executive Compensation Tables.” That information is incorporated in this report by reference.
Item 12. Security Ownership of Certain Beneficial Owners and Management and Related Stockholder Matters
Security Ownership of Certain Beneficial Owners and Management
Information relating to ownership of the company’s common stock by management and by persons known by the company to be the beneficial owners of more than five percent of the outstanding shares of common stock is found in the Proxy Statement under “Ownership of Company Stock.” That information is incorporated in this report by reference.
Securities Authorized for Issuance Under Equity Compensation Plans
Information about our compensation plans under which shares of our common stock have been authorized for issuance as of December 31, 2018 can be found in the Proxy Statement under “Securities Authorized for Issuance Under Equity Compensation Plans” and is incorporated in this report by reference.
Item 13. Certain Relationships and Related Transactions, and Director Independence
Related Person Transactions
Information relating to related person transactions and the board’s policies and procedures for approval of related person transactions can be found in the Proxy Statement under “Transactions with Related Persons.” That information is incorporated in this report by reference.
Director Independence
Information relating to director independence can be found in the Proxy Statement under “Director Independence” and is incorporated in this report by reference.
Item 14. Principal Accountant Fees and Services
Information related to the fees and services of our principal independent accountants, Ernst & Young LLP, can be found in the Proxy Statement under “Item 2. Proposal to Ratify the Appointment of Principal
Independent Auditor
-
Audit Committee Report - Services Performed by the Independent Auditor” and “Independent Auditor Fees.” That information is incorporated in this report by reference.
PART IV
Item 15. Exhibits and Financial Statement Schedules
103
1. Financial Statements
The following consolidated combined financial statements of the company and its subsidiaries are found at Item 8:
|
•
|
Consolidated and Combined Statements of Operations—Years Ended December 31, 2018, 2017, and 2016
|
|
•
|
Consolidated and Combined Statements of Comprehensive Income—Years Ended December 31, 2018, 2017, and 2016
|
|
•
|
Consolidated and Combined Balance Sheets—December 31, 2018 and 2017
|
|
•
|
Consolidated and Combined Statements of Shareholders' Equity—Years Ended December 31, 2018, 2017, and 2016
|
|
•
|
Consolidated and Combined Statements of Cash Flows—Years Ended December 31, 2018, 2017, and 2016
|
|
•
|
Notes to Consolidated and Combined Financial Statements
|
2. Financial Statement Schedules
The consolidated and combined financial statement schedules of the company and its subsidiaries have been omitted because they are not required, are inapplicable, or are adequately explained in the financial statements.
Financial statements of interests of 50 percent or less, which are accounted for by the equity method, have been omitted because they do not, considered in the aggregate as a single subsidiary, constitute a significant subsidiary.
3. Exhibits
The following exhibits are either filed or furnished herewith (as applicable) or, if so indicated, incorporated by reference to the documents indicated in parentheses, which have previously been filed or furnished with the Securities and Exchange Commission.
|
Exhibit Number
|
|
Description
|
|
|
|
|
Amended and Restated Articles of Incorporation of Elanco Animal Health Incorporated, effective September 18, 2018 (incorporated by reference to Exhibit 3.1 of the Current Report on Form 8-K filed with the SEC on September 26, 2018).
|
|
|
|
|
Amended and Restated Bylaws of Elanco Animal Health Incorporated, effective September 19, 2018 (incorporated by reference to Exhibit 3.2 of the Current Report on Form 8-K filed with the SEC on September 26, 2018).
|
|
|
|
|
Form of Certificate of Common Stock (incorporated by reference to Exhibit 4.1 of Amendment No. 1 to Registration Statement on Form S-1 (Registration No. 333-226536) filed with the SEC on August 28, 2018).
|
|
|
|
|
Indenture, dated August 28, 2018, between Elanco Animal Health Incorporated and Deutsche Bank Trust Company Americas, as trustee (incorporated by reference to Exhibit 4.2 of Amendment No. 1 to Registration Statement on Form S-1 (Registration No. 333-226536) filed with the SEC on August 28, 2018).
|
|
|
|
|
First Supplemental Indenture, dated August 28, 2018, between Elanco Animal Health Incorporated and Deutsche Bank Trust Company Americas, as trustee (incorporated by reference to Exhibit 4.3 of Amendment No. 1 to Registration Statement on Form S-1 (Registration No. 333-226536) filed with the SEC on August 28, 2018).
|
|
|
|
|
Exchange and Registration Rights Agreement, dated August 28, 2018, between Elanco Animal Health Incorporated and Goldman Sachs & Co. LLC, J.P. Morgan Securities LLC and Morgan Stanley & Co. LLC, as representatives of the several initial purchasers (incorporated by reference to Exhibit 4.4 of Amendment No. 1 to Registration Statement on Form S-1 (Registration No. 333-226536) filed with the SEC on August 28, 2018).
|
|
|
|
|
Master Separation Agreement, dated September 24, 2018, between Eli Lilly and Company and Elanco Animal Health Incorporated (incorporated by reference to Exhibit 10.1 of the Current Report on Form 8-K filed with the SEC on September 26, 2018).
|
|
104
|
|
|
Transitional Services Agreement, dated September 24, 2018, between Eli Lilly and Company and Elanco Animal Health Incorporated (incorporated by reference to Exhibit 10.2 of the Current Report on Form 8-K filed with the SEC on September 26, 2018).
|
|
|
|
|
Tax Matters Agreement, dated September 24, 2018, between Eli Lilly and Company and Elanco Animal Health Incorporated (incorporated by reference to Exhibit 10.3 of the Current Report on Form 8-K filed with the SEC on September 26, 2018).
|
|
|
|
|
Employee Matters Agreement, dated September 24, 2018, between Eli Lilly and Company and Elanco Animal Health Incorporated (incorporated by reference to Exhibit 10.4 of the Current Report on Form 8-K filed with the SEC on September 26, 2018).
|
|
|
|
|
Toll Manufacturing and Supply Agreement, dated September 24, 2018, between Eli Lilly Export S.A. and Elanco UK AH Limited (incorporated by reference to Exhibit 10.5 of the Current Report on Form 8-K filed with the SEC on September 26, 2018).
|
|
|
|
|
Registration Rights Agreement, dated September 24, 2018, between Eli Lilly and Company and Elanco Animal Health Incorporated (incorporated by reference to Exhibit 10.6 of the Current Report on Form 8-K filed with the SEC on September 26, 2018).
|
|
|
|
Transitional Trademark License Agreement, dated September 24, 2018, among Eli Lilly and Company, Elanco Animal Health Incorporated and Elanco US Inc. (incorporated by reference to Exhibit 10.7 of the Current Report on Form 8-K filed with the SEC on September 26, 2018).
|
||
|
|
Intellectual Property and Technology License Agreement, dated September 24, 2018, among Eli Lilly and Company, Elanco Animal Health Incorporated and Elanco US Inc. (incorporated by reference to Exhibit 10.8 of the Current Report on Form 8-K filed with the SEC on September 26, 2018).
|
||
|
|
Revolving Loan Credit Agreement, dated as of September 5, 2018, among Elanco Animal Health Incorporated, as borrower, JPMorgan Chase Bank, N.A., as administrative agent and the other Lenders party thereto (incorporated by reference to Exhibit 10.24 of Amendment No. 2 to Registration Statement on Form S-1 (Registration No. 333-226536) filed with the SEC on September 6, 2018).
|
||
|
|
Term Loan Credit Agreement, dated as of September 5, 2018, among Elanco Animal Health Incorporated, as borrower, JPMorgan Chase Bank, N.A., as administrative agent and the other Lenders party thereto (incorporated by reference to Exhibit 10.25 of Amendment No. 2 to Registration Statement on Form S-1 (Registration No. 333-226536) filed with the SEC on September 6, 2018).
|
||
|
|
2018 Elanco Stock Plan (incorporated by reference to Exhibit 4.3 of Registration Statement on Form S-8 (Registration No. 333-227447) filed with the SEC on September 20, 2018).*
|
||
|
|
Elanco Animal Health Incorporated Directors’ Deferral Plan (incorporated by reference to Exhibit 4.4 of Registration Statement on Form S-8 (Registration No. 333-227447) filed with the SEC on September 20, 2018)*
|
||
|
|
Director Letter Agreement between Emu Holdings Company and R. David Hoover, dated as of May 25, 2018 (incorporated by reference to Exhibit 10.19 of Elanco Animal Health Incorporated's registration statement on Form S-1 (File No. 333-226536) filed with the SEC on August 2, 2018)*
|
||
|
|
Form of 2018 Change in Control Severance Pay Plan for Select Employees (incorporated by reference to Exhibit 10.20 of Amendment No. 1 to Elanco Animal Health Incorporated's registration statement on Form S-1 (File No. 333-226536) filed with the SEC on August 28, 2018)
.
*
|
||
|
|
Form of Elanco Animal Health Incorporated Restricted Stock Unit Awards Agreement (incorporated by reference to Exhibit 10.21 of Amendment No. 1 to Elanco Animal Health Incorporated's registration statement on Form S-1 (File No. 333-226536) filed with the SEC on August 28, 2018).*
|
||
105
|
|
Form of Elanco Animal Health Incorporated Nonqualified Stock Option Award Agreement (incorporated by reference to Exhibit 10.22 of Amendment No. 1 to Elanco Animal Health Incorporated's registration statement on Form S-1 (File No. 333-226536) filed with the SEC on August 28, 2018).*
|
||
|
|
Retention Bonus Agreement, dated October 18, 2018, by and between Elanco US Inc. and Todd S. Young (incorporated by reference to Exhibit 10.2 to Elanco Animal Health Incorporated's Report on Form 8-K filed with the SEC on October 30, 2018).*
|
||
|
|
Employment Offer Letter with Mr. Todd S. Young, dated October 15, 2018, by and between Elanco US Inc. and Todd S. Young (incorporated by reference to Exhibit 10.1 to Elanco Animal Health Incorporated's Report on Form 8-K filed with the SEC on October 30, 2018).*
|
||
|
|
Form of Performance Award Agreement (Incorporated by reference to Exhibit 10.1 to Form 8-K filed with the SEC on February 19, 2019)*
|
||
|
|
Form of Restricted Stock Unit Award Agreement (Incorporated by reference to Exhibit 10.2 to Form 8-K filed with the SEC on February 19, 2019)*
|
||
|
|
Form of Restricted Stock Unit Award Agreement (filed herewith)*
|
||
|
|
Form of Replacement Performance Award Agreement for Certain Named Executive Officers (filed herewith)*
|
||
|
|
Form of Replacement Performance Award Agreement for Jeffery N. Simmons (filed herewith)*
|
||
|
|
Form of Replacement Restricted Stock Unit Award Agreement for Certain Named Executive Officers (filed herewith)*
|
||
|
|
2002 Lilly Stock Plan, as amended (incorporated by reference to Appendix C to Eli Lilly and Company's proxy statement on Schedule 14A filed on March 19, 2018)* |
||
|
|
The Eli Lilly and Company Bonus Plan, as amended (incorporated by reference to Exhibit 10.7 to Eli Lilly and Company's Report on Form 10-K for the year ended December 31, 2013)*
|
||
|
|
Form of Performance Award under the 2002 Lilly Stock Plan (incorporated by reference to Exhibit 10.2 to Eli Lilly and Company's Report on Form 10-K for the year ended December 31, 2017)*
|
||
|
|
Form of Shareholder Value Award under the 2002 Lilly Stock Plan (incorporated by reference to Exhibit 10.3 to Eli Lilly and Company's Report on Form 10-K for the year ended December 31, 2017)*
|
||
|
|
The Lilly Deferred Compensation Plan, as amended (incorporated by reference to Exhibit 10.5 to Eli Lilly and Company's Report on Form 10-K for the year ended December 31, 2013)*
|
||
|
|
The Eli Lilly and Company Executive Offer Incentive Plan (incorporated by reference to Appendix B to Eli Lily and Company's proxy statement on Schedule 14A filed on March 7, 2011 (SEC File No. 001-06351, Film No. 11666753))*
|
||
|
|
2007 Change in Control Severance Pay Plan (incorporated by reference to Exhibit 10 to Eli Lilly and Company's Report on Form 10-Q for the quarter ended September 30, 2010 (SEC File No. 001-06351, Film No. 101149876))*
|
||
|
|
The Elanco Corporate Bonus Plan (incorporated by reference to Exhibit 10.16 of Elanco Animal Health Incorporated's registration statement on Form S-1 (File No. 333-226536))*
|
||
|
|
The Lilly Severance Pay Plan (incorporated by reference to Exhibit 10.23 of Elanco Animal Health Incorporated's registration statement on Form S-1 (File No. 333-226536))*
|
||
|
|
Subsidiaries of Elanco Animal Health Incorporated (filed herewith)
|
||
106
|
|
Consent of Ernst & Young LLP (filed herewith)
|
||
|
|
Section 302 Certification of the Chief Executive Officer pursuant to Rule 13a-14(a) of the Securities Exchange Act of 1934, as adopted pursuant to Section 302 of the Sarbanes-Oxley Act of 2002 (filed herewith).
|
||
|
|
Section 302 Certification of the Chief Financial Officer pursuant to Rule 13a-14(a) of the Securities Exchange Act of 1934, as adopted pursuant to Section 302 of the Sarbanes-Oxley Act of 2002 (filed herewith).
|
||
|
|
Certification of the Chief Executive Officer and the Chief Financial Officer pursuant to 18 U.S.C. Section 1350, as adopted pursuant to Section 906 of the Sarbanes-Oxley Act of 2002 (filed herewith).
|
||
|
101
|
|
Interactive Data Files.
|
|
*Management contracts or compensatory plans or arrangements
Item 16. Form 10-K Summary
Not applicable.
107
Signatures
Pursuant to the requirements of the Securities Exchange Act of 1934, the Registrant has duly caused this Report to be signed on its behalf by the undersigned thereunto duly authorized.
|
ELANCO ANIMAL HEALTH INCORPORATED
|
||
|
(Registrant)
|
||
|
Date:
|
February 20, 2019
|
/s/ Jeffrey N. Simmons
|
|
Jeffrey N. Simmons
|
||
|
President and Chief Executive Officer
|
||
108
Pursuant to the requirements of the Securities Exchange Act of 1934, this report has been signed below by the following persons on behalf of the Registrant and in the capacities and on the dates indicated.
|
/s/ Jeffrey N. Simmons
|
Date:
|
February 20, 2019
|
|
Jeffrey N. Simmons
|
||
|
President and Chief Executive Officer (principal executive officer) and Director
|
||
|
/s/ Todd S. Young
|
Date:
|
February 20, 2019
|
|
Todd S. Young
|
||
|
Executive Vice President, Chief Financial Officer (principal financial officer)
|
||
|
/s/ James M. Meer
|
Date:
|
February 20, 2019
|
|
James M. Meer
|
||
|
Chief Accounting Officer (principal accounting officer)
|
||
|
/s/ R. David Hoover
|
Date:
|
February 20, 2019
|
|
R. David Hoover
|
||
|
Chairman of the Board
|
||
|
/s/ Kapila Kapur Anand
|
Date:
|
February 20, 2019
|
|
Kapila Kapur Anand
|
||
|
Director
|
||
|
/s/ Michael J. Harrington
|
Date:
|
February 20, 2019
|
|
Michael J. Harrington
|
||
|
Director
|
||
|
/s/ Lawrence E. Kurzius
|
Date:
|
February 20, 2019
|
|
Lawrence E. Kurzius
|
||
|
Director
|
||
|
/s/ Carl L. McMillian Ph.D.
|
Date:
|
February 20, 2019
|
|
Carl L. McMillian
|
||
|
Director
|
||
|
/s/ David A. Ricks
|
Date:
|
February 20, 2019
|
|
David A. Ricks
|
||
|
Director
|
||
|
/s/ Aarti S. Shah Ph.D.
|
Date:
|
February 20, 2019
|
|
Aarti S. Shah
|
||
|
Director
|
||
|
/s/ Joshua L. Smiley
|
Date:
|
February 20, 2019
|
|
Joshua L. Smiley
|
||
|
Director
|
||
109
TABLE OF CONTENTS
Part IItem 1. BusinessItem 1A. Risk FactorsItem 1B. Unresolved Staff CommentsItem 2. PropertiesItem 3. Legal ProceedingsItem 4. Mine Safety DisclosuresPart IIItem 5. Market For The Registrant S Common Equity, Related Stockholder Matters and Issuer Purchases Of Equity SecuritiesItem 6. Selected Financial DataItem 7. Management S Discussion and Analysis Of Results Of Financial Condition and Results Of OperationsItem 7A. Quantitative and Qualitative Disclosures About Market RiskItem 8. Financial Statements and Supplementary DataNote 1. Nature Of Business and OrganizationNote 2. Basis Of PresentationNote 3. Impact Of SeparationNote 4. Summary Of Significant Accounting PoliciesNote 5. RevenueNote 6. AcquisitionsNote 7. Asset Impairment, Restructuring and Other Special ChargesNote 8. InventoriesNote 9. DebtNote 10. Financial Instruments and Fair ValueNote 11. Goodwill and IntangiblesNote 12. Property and EquipmentNote 13. Stock-based CompensationNote 14. Income TaxesNote 15. ContingenciesNote 16. Geographic InformationNote 17. Retirement BenefitsNote 18. Earnings Per ShareNote 19. Related Party Agreements and TransactionsNote 20. Selected Quarterly Data (unaudited)Item 9. Changes in and Disagreements with Accountants on Accounting and Financial DisclosureItem 9A. Controls and ProceduresItem 9B. Other InformationPart IIIItem 10. Directors, Executive Officers, and Corporate GovernanceItem 11. Executive CompensationItem 12. Security Ownership Of Certain Beneficial Owners and Management and Related Stockholder MattersItem 13. Certain Relationships and Related Transactions, and Director IndependenceItem 14. Principal Accountant Fees and ServicesPart IVItem 15. Exhibits and Financial Statement SchedulesItem 16. Form 10-k Summary