E.L.F. BEAUTY, INC.
10-Ks and 10-Qs
|
|
|
|
|
|
|
|
|
|
|
|
|
|
|
|
|
|
|
|
|
|
|
|
|
|
|
|
|
|
|
|
|
|
|
|
|
|
|
|
|
|
|
|
|
|
|
|
|
|
|
|
|
|
|
|
|
|
|
|
|
|
|
|
|
|
|
|
|
|
|
|
|
|
|
|
|
|
|
|
|
|
|
|
|
|
|
|
|
|
|
|
|
|
|
|
|
|
|
|
|
|
|
|
|
|
|
|
|
|
|
|
|
|
|
|
|
|
|
|
|
|
|
|
|
|
|
|
|
|
|
|
|
|
|
|
|
|
|
|
|
|
|
|
|
|
|
|
UNITED STATES
SECURITIES AND EXCHANGE COMMISSION
Washington, D.C. 20549
___________________________________________________
FORM 10-K
___________________________________________________
|
☒
|
ANNUAL REPORT PURSUANT TO SECTION 13 OR 15(d) OF THE SECURITIES EXCHANGE ACT OF 1934
|
For the fiscal year ended
March 31, 2020
OR
|
☐
|
TRANSITION REPORT PURSUANT TO SECTION 13 OR 15(d) OF THE SECURITIES EXCHANGE ACT OF 1934
|
For the transition period from
to
Commission File Number 001-37873
___________________________________________________
e.l.f. Beauty, Inc.
(Exact name of registrant as specified in its charter)
___________________________________________________
|
Delaware
|
46-4464131
|
|
(State or other jurisdiction of
incorporation or organization)
|
(I.R.S. Employer
Identification No.)
|
570 10
th
Street
Oakland, CA 94607
(510) 778-7787
(Address of registrant’s principal executive offices, including zip code,
and telephone number, including area code)
___________________________________________________
Securities registered pursuant to Section 12(b) of the Act:
|
Title of each class
|
Trading Symbol(s)
|
Name of each exchange on which registered
|
||
|
Common Stock, $0.01 par value
|
ELF
|
New York Stock Exchange
|
||
Securities registered pursuant to Section 12(g) of the Act:
None
___________________________________________________
Indicate by check mark if the registrant is a well-known seasoned issuer, as defined in Rule 405 of the Securities Act. YES
¨
NO
x
Indicate by check mark if the registrant is not required to file reports pursuant to Section 13 or 15(d) of the Act. YES
¨
NO
x
Indicate by check mark whether the registrant: (1) has filed all reports required to be filed by Section 13 or 15(d) of the Securities Exchange Act of 1934 during the preceding 12 months (or for such shorter period that the registrant was required to file such reports), and (2) has been subject to such filing requirements for the past 90 days. YES
x
NO
¨
Indicate by check mark whether the registrant has submitted electronically every Interactive Data File required to be submitted pursuant to Rule 405 of Regulation S-T (§232.405 of this chapter) during the preceding 12 months (or for such shorter period that the registrant was required to submit such files). YES
x
NO
¨
Indicate by check mark whether the registrant is a large accelerated filer, an accelerated filer, a non-accelerated filer, a smaller reporting company, or an emerging growth company. See the definitions of “large accelerated filer,” “accelerated filer,” “smaller reporting company,” and “emerging growth company” in Rule 12b-2 of the Exchange Act.
|
Large accelerated filer
|
¨
|
|
Accelerated filer
|
x
|
|
Non-accelerated filer
|
¨
|
Smaller reporting company
|
¨
|
|
|
Emerging growth company
|
x
|
|||
If an emerging growth company, indicate by check mark if the registrant has elected not to use the extended transition period for complying with any new or revised financial accounting standards provided pursuant to Section 13(a) of the Exchange Act.
x
Indicate by check mark whether the registrant has filed a report on and attestation to its management’s assessment of the effectiveness of its internal control over financial reporting under Section 404(b) of the Sarbanes-Oxley Act (15 U.S.C. 7262(b)) by the registered public accounting firm that prepared or issued its audit report.
¨
Indicate by check mark whether the registrant is a shell company (as defined in Rule 12b-2 of the Exchange Act). YES
¨
NO
x
As of September 30, 2019, the last business day of the registrant’s most recently completed second fiscal quarter, the aggregate market value of the voting and non-voting stock held by non-affiliates of the registrant was
$635.0 million
.
The number of shares of registrant’s common stock outstanding as of
May 15, 2020
was
50,009,051
.
DOCUMENTS INCORPORATED BY REFERENCE
Portions of the registrant’s Definitive Proxy Statement relating to the registrant’s 2020 annual meeting of stockholders are incorporated by reference into Part III of this Annual Report on Form 10-K. Such Definitive Proxy Statement will be filed with the Securities and Exchange Commission within 120 days of the registrant's fiscal year ended
March 31, 2020
.
e.l.f. Beauty, Inc.
Table of Contents
|
|
|
Page
|
|
|
|
|
|
|
|
|
|
|
|
|
|
|
|
|
|
|
|
|
|
|
|
|
|
|
|
|
|
|
||
CAUTIONARY NOTE ABOUT FORWARD-LOOKING STATEMENTS
This Annual Report on Form 10-K (“Annual Report”) contains forward-looking statements within the meaning of the federal securities laws concerning our business, operations and financial performance and condition, as well as our plans, objectives and expectations for our business operations and financial performance and condition. Any statements contained herein that are not statements of historical facts may be deemed to be forward-looking statements. In some cases, you can identify forward-looking statements by terminology such as “aim,” “anticipate,” “assume,” ”believe,” “contemplate,” “continue,” "could,” “due,” “estimate,” “expect,” “goal,” “intend,” “may,” “objective,” “plan,” “predict,” “potential,” “positioned,” “seek,” “should,” “target,” “will,” “would” and other similar expressions that are predictions of or indicate future events and future trends, or the negative of these terms or other comparable terminology. These forward-looking statements are based on management's current expectations, estimates, forecasts and projections about our business and the industry in which we operate and management’s beliefs and assumptions and are not guarantees of future performance or development and involve known and unknown risks, uncertainties, and other factors that are in some cases beyond our control. Although we believe that the expectations reflected in the forward-looking statements contained herein are reasonable, our actual results and the timing of selected events may differ materially. Factors that may cause actual results to differ materially from current expectations include, among other things, those listed under Item 1A. “Risk Factors” and elsewhere in this Annual Report. Potential investors are urged to consider these factors carefully in evaluating the forward-looking statements. These forward-looking statements speak only as of the date of this Annual Report. Except as required by law, we assume no obligation to update or revise these forward-looking statements for any reason, even if new information becomes available in the future.
PART I
Item 1. Business.
Overview
e.l.f. Beauty, Inc. (“e.l.f. Beauty” and together with its subsidiaries, the “Company,” or “we”) is organized as a holding company and operates through its principal subsidiaries, e.l.f. Cosmetics, Inc., which conducts business under the name "e.l.f. Cosmetics" or "e.l.f.", and W3LL People, Inc., which conducts business under the name “W3LL PEOPLE”. e.l.f. Cosmetics makes the best of beauty accessible to every eye, lip and face by offering high-quality cosmetics and skin care products at an extraordinary value, all formulated 100% vegan and cruelty-free. W3LL PEOPLE is a pioneer in clean beauty that offers accessible clean beauty products that work.
We believe our unique ability to combine cost, quality and speed differentiates us in the beauty industry. This combination, along with our innovation capabilities, enables us to deliver prestige quality products at extraordinary prices across color cosmetics and adjacent categories like skin care. In response to a rapidly changing landscape in beauty, we are investing in our digital engagement model to reach consumers through multiple channels, including elfcosmetics.com, our national retail partners online sites and social media. In concert with our digital efforts, we have strong relationships with our retail partners such as Walmart, Target, Ulta Beauty and other leading retailers that have enabled us to expand distribution both within existing retailers and with new retailers, domestically and internationally.
Our Brands
e.l.f. Cosmetics.
e.l.f. Cosmetics makes the best of beauty accessible to every eye, lip and face by offering high-quality cosmetics and skin care products at an extraordinary value, all formulated 100% vegan and cruelty-free. The e.l.f. Cosmetics portfolio spans the eyes, lips, face, kits, tools and skin care categories. e.l.f. Cosmetics products are not tested on animals nor do they contain or use ingredients that are tested on animals. e.l.f. Cosmetics has been designated as a “cruelty-free” company by People for the Ethical Treatment of Animals (PETA). e.l.f. Cosmetics products are also free from parabens and phthalates.
e.l.f. Cosmetics consumers recognize our ability to provide a broad assortment of high-quality, prestige-inspired products at an extraordinary value. We do not define e.l.f. Cosmetics as strictly mass or prestige or limit product availability to select channels. The average unit retail on e.l.f. Cosmetics products’ is under $5, providing a low-risk way for consumers to try new products. From formulation to package design, e.l.f. Cosmetics products deliver quality and innovation at a fraction of prestige prices, encouraging frequent consumer purchasing and experimentation without the guilt of overspending.
W3LL PEOPLE.
W3LL PEOPLE is a pioneer in clean beauty that offers accessible clean beauty products that work. The W3LL PEOPLE portfolio spans the eyes, lips, face, kits, tools and skin care categories. W3LL PEOPLE’s plant-based product-
line contains no fillers, propylene glycol, petrochemicals or petroleum byproducts, and includes forty EWG VERIFIED™ products.
Marketing & Digital
The Company has deployed a low-cost, consumer-centric marketing model. Total expenses for marketing and digital in the year ended
March 31, 2020
were
$37.8 million
, approximately
13%
of our net sales.
Our consumers have been our best advocates, growing the e.l.f. brand virally through strong word of mouth. Many are very active in social media, write reviews of our products online and generate content on Instagram, Facebook, Twitter, TikTok, YouTube and other social media outlets. We had over 33 million visits to our e-commerce websites and/or followings on social media in fiscal 2020. Our e-commerce websites reflect our passionate consumer base with approximately 210,000 ratings. Our digital content inspires our fans with looks and products they love.
When compared to the overall US population, the e.l.f. Cosmetics brand over-indexes with Millennials, Gen Z and Hispanic consumers, some of the heaviest users in the category. This attractive and loyal consumer base supports high sales per linear foot and high category sales for e.l.f. Cosmetics’ retail customers.
W3LL PEOPLE is a pioneer in clean beauty, combining innovative product technology and social responsibility into clean products that work, at accessible price-points. To highlight W3LL PEOPLE’s unique value proposition, we deploy a marketing strategy designed to maximize consumer engagement and encourage education.
Innovation
We believe innovation is key to our success and that we are a leader in the industry in speed and first to mass introductions. We leverage multiple sources of inspiration to develop our new product ideas, including global trend assessments, supplier and industry research, strategic customer input and consumer feedback and insights. Our innovation strategy is underpinned by three key pillars:
|
•
|
First-to-mass
. “First-to-mass” products are inspired by trends in prestige beauty that we bring to the mass market. As consumers are increasingly savvy and knowledgeable about trends in the prestige market, they look for how they can get the best of beauty at an accessible price. Examples include the e.l.f. Mineral Infused Face Primer at $6 versus a prestige primer at $36, e.l.f. Poreless Putty Primer at $8 versus a prestige primer at $52, the e.l.f. Beauty Shield Magnetic Mask at $24 versus a similar type of mask at $75, and the e.l.f. 16HR Camo Concealer at $6 versus a similar type of concealer at $27.
|
|
•
|
Core expansion
. Core expansion products are those trend-inspired products across eyes, lips, face and tools that augment our assortment and deliver extraordinary value across price points. We consistently evaluate our core offerings and develop new products based on category trends, consumer feedback, and other market intelligence.
|
|
•
|
Adjacencies
. We believe that we can reapply our model to launch products into adjacent categories. For example, we entered the skin care category in 2015 with a high-quality skin care product assortment.
|
We leverage insights gained from each channel to drive performance across the business. Our direct channel enables us to analyze sales results, reviews, and feedback through social media to provide preliminary indications of a product’s performance. We can leverage this data to introduce validated, best-selling products to retail, which drives leading performance relative to others in the category.
Unlike many beauty companies that launch products in concert with the timing of when retailers rearrange or restock products, we leverage our multi-channel model to launch products throughout the year and test in our direct channel.
Our innovation approach at W3LL PEOPLE is to create premium, quality, hybrid cosmetics without using potentially harmful chemicals. Our main focus is on toxicity with a commitment to clean. W3LL PEOPLE's state-of-the-art, plant-based, non-toxic, cruelty-free formulas are designed to deliver flawless coverage and soothing protection that support long-term skin health. EWG verification is a key proof point of W3LL PEOPLE's authenticity and transparency. EWG VERIFIED
TM
sets the bar for ingredient transparency, as the only domestic third party, non-profit, standards based non-toxic certifying authority. We are proud to have forty of W3LL PEOPLE's products EWG VERIFIED
TM
.
5
Markets and Competition
The color cosmetics category primarily consists of face makeup, eye makeup, lip products, nail products and cosmetics sets/kits, along with beauty tools and accessories such as brushes and applicators. Cosmetics are broadly sold through food, drug and mass channels, as well as through department stores and direct and specialty channels. The cosmetics industry is relatively concentrated, with a significant portion of cosmetics retail sales in the United States generated by brands owned by a few large multinational companies, such as L’Oreal, Estee Lauder, Revlon, Coty and Shiseido. These large multinational companies typically own many brands across mass and prestige cosmetics. In addition to the traditional brands against which we compete, small independent companies continue to enter the market with new brands and customized product offerings.
Distribution
We employ an o
mni-channel distribution strategy and sell our products domestically as well as internationally. Our main channels of distribution are described below.
National retailers
. We sell our products in the United States in the mass, drug store, food and specialty retail channels.
e
-commerce
. Our e-commerce platforms are an important component of our engagement and innovation model. We have nurtured a loyal, highly active online community for over a decade. Our roots as an e-commerce company and our digital engagement model drive conversion on elfcosmetics.com and w3IIpeople.com, where we sell our full product offerings.
International.
Our products are also sold in a number of international markets, including the United Kingdom, Canada, Mexico, China, Germany, Australia and Canada.
Customers
Walmart and Target accounted for
31%
and
22%
, respectively, of our net sales in fiscal
2020
. No other individual customer accounted for 10% or more of the Company's net sales in fiscal
2020
. The Company expects that Walmart and Target and a small number of other customers will, in the aggregate, continue to account for a large portion of the Company's net sales in the future.
As is customary in the industry, none of the Company’s customers is under an obligation to continue purchasing products from the Company in the future.
For more information regarding customer concentration, see Part II, Item 7 “Management’s discussion and analysis of financial condition and results of operations” of this report under the heading “Overview.”
Operations
We have developed a scalable, asset-light supply chain centered on speed to market and high-quality at low cost. Our China-based sourcing, quality and innovation teams work with their U.S. based counterparts to deliver ongoing product quality, innovation and cost savings.
Manufacturing process
Our manufacturing process centers on close collaboration with a network of third-party manufacturers in China and, more recently, the United States. We believe what differentiates us is our ability to drive the combination of cost, quality, and speed. We leverage high annual unit volumes with our suppliers to have them quickly produce small quantities of a new product so that we can launch online in as few as 13 weeks from concept and 20 weeks on average. These early sales provide us with validation data to determine which products to introduce at our national retail customers. Based on what we decide to scale up, we believe we can provide higher, more reliable, longer-term volumes to our manufacturers.
We have ample manufacturing capacity as well as redundant capabilities in the event that one or more suppliers cannot meet our needs. We have invested in a U.S.-based liquid fill manufacturing facility to an already robust supply chain solution. Our broad supply base gives us the ability to fulfill our product requirements and remain cost competitive.
6
Ingredients and packaging
We work closely with our suppliers on new product innovation and quality. Our innovation team creates our formulas and our suppliers produce to our specifications. We are not overly dependent on any single formula raw material. These raw materials are broadly available and have regular quality testing for ingredient integrity.
Our team members create our component and secondary packaging specifications and source their production. We have multiple component and packaging suppliers in place with ample back-up capacity. Our co-packers purchase from our packaging suppliers at our pre-negotiated specifications and rates. This allows us to efficiently manage our packaging quality, capacity and cost.
Quality control
We have a comprehensive quality assurance program that gives us visibility into the quality of our products during the sourcing and production cycle. Our innovation team approves product samples and our quality team is on-site for initial production runs of new products. Our quality team provides oversight through on-site inspections and audits of our third-party manufacturers as well as component and packaging suppliers. We periodically conduct comprehensive audits of all our suppliers and have an on-site scheduled presence at our primary suppliers, where we inspect and monitor finished and semi-finished product, raw materials, batch records and testing records. We also validate our manufacturers’ finished product testing results with third-party laboratory testing. In the spirit of continual improvement, we have frequent dialogue with our suppliers on quality assurance enhancements.
Warehousing, distribution and logistics
We operate two main distribution centers: one in Ontario, California, which mainly serves our national retail customers, and one in Columbus, Ohio, which mainly services our e-commerce consumers. We have invested capital in picking, packaging, scanning, and conveying technology to more fully automate our processes. Our Ontario and Columbus distribution centers are both operated by a leading third-party logistics provider.
For our international operations, we utilize third-party logistics providers in Canada and the United Kingdom to distribute to certain international customers and distributors.
Seasonality
Our results of operations are subject to seasonal fluctuations, with net sales in the third and fourth fiscal quarters typically being higher than in the first and second fiscal quarters. The higher net sales in our third and fourth fiscal quarters are largely attributable to the increased levels of purchasing by retailers for the holiday season and customer shelf reset activity, respectively. Lower holiday purchases or shifts in customer shelf reset activity could have a disproportionate effect on our results of operations for the entire fiscal year. To support anticipated higher sales during the third and fourth fiscal quarters, we make investments in working capital to ensure inventory levels can support demand. Fluctuations throughout the year are also driven by the timing of product restocking or rearrangement by our major retail customers as well as expansion into new retail customers. Because a limited number of our retail customers account for a large percentage of our net sales, a change in the order pattern of one or more of our large retail customers could cause a significant fluctuation of our quarterly results or impact our liquidity.
Trademarks and other intellectual property
We believe that our intellectual property has substantial value and has contributed significantly to the success of our business. Our primary trademarks include “e.l.f.,” “e.l.f. eyes lips face” and “W3LL PEOPLE,” all of which are registered in the United States with the U.S. Patent and Trademark Office for our goods and services of primary interest. These trademarks are also registered or have registrations pending in many other countries or registries. We also have other trademark registrations and pending applications for product names and tag lines. Our trademarks are valuable assets that reinforce the distinctiveness of our brand and our consumers’ favorable perception of our products. In addition to trademark protection, we own U.S. Design Patents covering packaging, make-up tools and brush handle shapes and we own numerous domain names, including our e-commerce websites. We also rely on and use reasonable business activities to protect unpatented proprietary expertise and product formulations, continuing innovation and other know-how to develop and maintain our competitive position.
Employees
7
As of
March 31, 2020
, we had
209
full-time employees (
140
in the United States and
69
in China) and
8
part-time and seasonal employees. None of our employees are currently covered by a collective bargaining agreement, and we have experienced no work stoppages. We consider our relationship with our employees to be good.
Government regulation
We and our products are subject to various federal, state and international laws and regulations, including regulation in the U.S. by the Food and Drug Administration (the “FDA”), the Consumer Product Safety Commission (the “CPSC”), the Federal Trade Commission (the “FTC”), and regulations outside of the U.S. by Health Canada and the European Commission, among others. These laws and regulations principally relate to the ingredients, proper labeling, advertising, packaging, marketing, manufacture, safety, shipment and disposal of our products. Further, as the vast majority of our products are imported from overseas manufacturers, we are subject to Customs Border Patrol clearance regulations prior to goods being released into the U.S. market.
We are also subject to a number of federal, state and international laws and regulations that affect companies conducting business on the Internet, including regulations related to consumer protection, the promotion and sale of merchandise, privacy, use and protection of consumer and employee personal information and data (including the collection of data from minors), behavioral tracking, and advertising and marketing activities (including sweepstakes, contests and giveaways).
Additional laws in all these areas are likely to be passed in the future, which could result in significant limitations on or changes to the ways in which we operate and may significantly increase our compliance costs. For information regarding the risks related to the laws and regulations to which we are subject, see Item 1A “Risk Factors”.
Expenditures for environmental compliance
We are subject to numerous foreign, federal, provincial, state, municipal and local environmental, health and safety laws and regulations relating to, among other matters, safe working conditions, product stewardship and environmental protection, including those relating to emissions to the air, discharges to land and surface waters, generation, handling, storage, transportation, treatment and disposal of hazardous substances and waste materials, and the registration and evaluation of chemicals. We maintain policies and procedures to monitor and control environmental, health and safety risks, and to monitor compliance with applicable environmental, health and safety requirements. Compliance with such laws and regulations pertaining to the discharge of materials into the environment, or otherwise relating to the protection of the environment, has not had a material effect upon our capital expenditures, earnings or competitive position.
Segments
We operate our business as a single operating and reportable segment. For more information regarding segment reporting, see Note 2 to our consolidated financial statements in Item 15 “Exhibits, financial statement schedules” under the heading “Segment reporting.”
Geographic information
For information regarding the geographic source of our net sales and the location of our long-lived assets, see Note 2 to our consolidated financial statements in Item 15 “Exhibits, financial statement schedules” under the heading “Segment reporting.” For information regarding the risks related to our non-U.S. operations, see Item 1A “Risk factors.”
Corporate information
e.l.f. Beauty was formed as a Delaware corporation on December 20, 2013 under the name J.A. Cosmetics Holdings, Inc. and we changed our name to e.l.f. Beauty, Inc. in April 2016. We completed the initial public offering of our common stock in September 2016. Our common stock is currently listed on the New York Stock Exchange (“NYSE”) under the symbol “ELF.” Effective after December 2018, we changed our fiscal year-end from December 31
st
to March 31
st
. We are an “emerging growth company” under the Jumpstart Our Business Startups Act of 2012 (the “JOBS Act”), and therefore are subject to reduced public company reporting requirements. Our principal executive offices are located at 570 10th Street, Oakland, California 94607. Our telephone number is (510) 778-7787 and the investor relations portion of our website can be found at http://investor.elfcosmetics.com.
Available information
We make available on or through our website certain reports and amendments to those reports that we file with, or furnish to, the U.S. Securities and Exchange Commission (the “SEC”) in accordance with the Securities Exchange Act of
8
1934, as amended (the “Exchange Act”). These include our Annual Reports on Form 10-K, our Quarterly Reports on Form 10-Q and our Current Reports on Form 8-K, and amendments to those reports filed or furnished pursuant to Section 13(a) or 15(d) of the Exchange Act. We make this information available on or through our website free of charge as soon as reasonably practicable after we electronically file the information with, or furnish it to, the SEC. The information on, or that can be accessed through, our website is not incorporated by reference into this Annual Report or any other filings we make with the SEC.
Item 1A. Risk factors.
Certain risks may have a material adverse effect on our business, financial condition and results of operations. These risks include those described below and may include additional risks and uncertainties not presently known to us or that we currently deem immaterial. These risks should be read in conjunction with the other information in this Annual Report, including our consolidated financial statements and related notes thereto and Item 7 “Management’s discussion and analysis of financial condition and results of operations”.
The beauty industry is highly competitive, and if we are unable to compete effectively our results will suffer.
We face vigorous competition from companies throughout the world, including large multinational consumer products companies that have many beauty brands under ownership and standalone beauty brands, including those that may target the latest trends or specific distribution channels. Competition in the beauty industry is based on the introduction of new products, pricing of products, quality of products and packaging, brand awareness, perceived value and quality, innovation, in-store presence and visibility, promotional activities, advertising, editorials, e-commerce and mobile-commerce initiatives and other activities. We must compete with a high volume of new product introductions and existing products by diverse companies across several different distribution channels.
Many multinational consumer companies have greater financial, technical or marketing resources, longer operating histories, greater brand recognition or larger customer bases than we do and may be able to respond more effectively to changing business and economic conditions than we can. Many of these competitors’ products are sold in a wider selection or greater number of retail stores and possess a larger presence in these stores, typically having significantly more inline shelf space than we do. Given the finite space allocated to beauty products by retail stores, our ability to grow the number of retail stores in which our products are sold and expand our space allocation once in these retail stores may require the removal or reduction of the shelf space of these competitors. We may be unsuccessful in our growth strategy in the event retailers do not reallocate shelf space from our competitors to us. Increasing shelf space allocated to our products may be especially challenging in instances when a retailer has their own brand. In addition, our competitors may attempt to gain market share by offering products at prices at or below the prices at which our products are typically offered, including through the use of large percentage discounts and “buy one and get one free” offers. Competitive pricing may require us to reduce our prices, which would decrease our profitability or result in lost sales. Our competitors, many of whom have greater resources than we do, may be better able to withstand these price reductions and lost sales.
It is difficult for us to predict the timing and scale of our competitors’ activities in these areas or whether new competitors will emerge in the beauty industry. In recent years, numerous online, “indie” and influencer-backed beauty companies have emerged and garnered significant followings. In addition, further technological breakthroughs, including new and enhanced technologies which increase competition in the online retail market, new product offerings by competitors and the strength and success of our competitors’ marketing programs may impede our growth and the implementation of our business strategy.
Our ability to compete also depends on the continued strength of our brand and products, the success of our marketing, innovation and execution strategies, the continued diversity of our product offerings, the successful management of new product introductions and innovations, strong operational execution, including in order fulfillment, and our success in entering new markets and expanding our business in existing geographies. If we are unable to continue to compete effectively, it could have a material adverse effect on our business, results of operations and financial condition.
Our new product introductions may not be as successful as we anticipate.
The beauty industry is driven in part by fashion and beauty trends, which may shift quickly. Our continued success depends on our ability to anticipate, gauge and react in a timely and cost-effective manner to changes in consumer preferences for beauty products, consumer attitudes toward our industry and brand and where and how consumers shop for those products. We must continually work to develop, produce and market new products, maintain and enhance the recognition of our brand, maintain a favorable mix of products and develop our approach as to how and where we market and sell our products.
9
We have an established process for the development, evaluation and validation of our new product concepts. Nonetheless, each new product launch involves risks, as well as the possibility of unexpected consequences. For example, the acceptance of new product launches and sales to our retail customers may not be as high as we anticipate, due to lack of acceptance of the products themselves or their price, or limited effectiveness of our marketing strategies. In addition, our ability to launch new products may be limited by delays or difficulties affecting the ability of our suppliers or manufacturers to timely manufacture, distribute and ship new products or displays for new products. Sales of new products may be affected by inventory management by our retail customers, and we may experience product shortages or limitations in retail display space by our retail customers. We may also experience a decrease in sales of certain existing products as a result of newly-launched products, the impact of which could be exacerbated by shelf space limitations or any shelf space loss. Any of these occurrences could delay or impede our ability to achieve our sales objectives, which could have a material adverse effect on our business, financial condition and results of operations.
As part of our ongoing business strategy, we expect we will need to continue to introduce new products in the eyes, lips, face, kits, tools and skin care categories, while also expanding our product launches into adjacent categories in which we may have little to no operating experience. The success of product launches in adjacent product categories could be hampered by our relative inexperience operating in such categories, the strength of our competitors or any of the other risks referred to above. Furthermore, any expansion into new product categories may prove to be an operational and financial constraint which inhibits our ability to successfully accomplish such expansion. Our inability to introduce successful products in our traditional categories or in adjacent categories could limit our future growth and have a material adverse effect on our business, financial condition and results of operations.
We depend on a limited number of retailers for a large portion of our net sales, and the loss of one or more of these retailers, or business challenges at one or more of these retailers, could adversely affect our results of operations.
A limited number of our retail customers account for a large percentage of our net sales. Walmart and Target accounted for
31%
and
22%
, respectively, of our net sales in fiscal
2020
. We expect a small number of retailers will, in the aggregate, continue to account for the majority of our net sales for foreseeable future periods. Any changes in the policies or our ability to meet the demands of our retail customers relating to service levels, inventory de-stocking, pricing and promotional strategies or limitations on access to display space could have a material adverse effect on our business, financial condition and results of operations.
As is typical in our industry, our business with retailers is based primarily upon discrete sales orders, and we do not have contracts requiring retailers to make firm purchases from us. Accordingly, retailers could reduce their purchasing levels or cease buying products from us at any time and for any reason. If we lose a significant retail customer or if sales of our products to a significant retailer materially decrease, it could have a material adverse effect on our business, financial condition and results of operations.
Because a high percentage of our sales are made through our retail customers, our results are subject to risks relating to the general business performance of our key retail customers. Factors that adversely affect our retail customers’ businesses may also have a material adverse effect on our business, financial condition and results of operations. These factors may include:
|
•
|
any reduction in consumer traffic and demand at our retail customers as a result of economic downturns, pandemics or other health crises, changes in consumer preferences or reputational damage as a result of, among other developments, data privacy breaches, regulatory investigations or employee misconduct;
|
|
•
|
any credit risks associated with the financial condition of our retail customers;
|
|
•
|
the effect of consolidation or weakness in the retail industry or at certain retail customers, including store closures and the resulting uncertainty; and
|
|
•
|
inventory reduction initiatives and other factors affecting retail customer buying patterns, including any reduction in retail space committed to beauty products and retailer practices used to control inventory shrinkage.
|
Our success depends, in part, on the quality, performance and safety of our products.
Any loss of confidence on the part of consumers in the ingredients used in our products, whether related to product contamination or product safety or quality failures, actual or perceived, or inclusion of prohibited ingredients, could
10
tarnish the image of our brand and could cause consumers to choose other products. Allegations of contamination or other adverse effects on product safety or suitability for use by a particular consumer, even if untrue, may require us to expend significant time and resources responding to such allegations and could, from time to time, result in a recall of a product from any or all of the markets in which the affected product was distributed. Any such issues or recalls could negatively affect our profitability and brand image.
If our products are found to be, or perceived to be, defective or unsafe, or if they otherwise fail to meet our consumers’ expectations, our relationships with consumers could suffer, the appeal of our brand could be diminished, we may need to recall some of our products and/or become subject to regulatory action, and we could lose sales or market share or become subject to boycotts or liability claims. In addition, safety or other defects in our competitors’ products could reduce consumer demand for our own products if consumers view them to be similar. Any of these outcomes could result in a material adverse effect on our business, financial condition and results of operations.
We may not be able to successfully implement our growth strategy.
Our future growth, profitability and cash flows depend upon our ability to successfully implement our business strategy, which, in turn, is dependent upon a number of key initiatives, including our ability to:
|
•
|
drive demand in the brand;
|
|
•
|
invest in digital capabilities;
|
|
•
|
improve productivity in our national retailers;
|
|
•
|
focus on first-to-mass by providing prestige quality products at an extraordinary value;
|
|
•
|
implement the necessary cost savings to help fund our marketing and digital investments; and
|
|
•
|
pursue strategic extensions that can leverage our strengths and bring new capabilities.
|
There can be no assurance that we can successfully achieve any or all of the above initiatives in the manner or time period that we expect. Further, achieving these objectives will require investments which may result in short-term cost increases with net sales materializing on a longer-term horizon and therefore may be dilutive to our earnings. We cannot provide any assurance that we will realize, in full or in part, the anticipated benefits we expect our strategy will achieve. The failure to realize those benefits could have a material adverse effect on our business, financial condition and results of operations.
Our growth and profitability are dependent on a number of factors, and our historical growth may not be indicative of our future growth.
Our historical growth should not be considered as indicative of our future performance. We may not be successful in executing our growth strategy, and even if we achieve our strategic plan, we may not be able to sustain profitability. In future periods, our revenue could decline, or grow more slowly than we expect. We also may incur significant losses in the future for a number of reasons, including the following risks and the other risks described in this Annual Report, and we may encounter unforeseen expenses, difficulties, complications, delays and other unknown factors:
|
•
|
we may lose one or more significant retail customers, or sales of our products through these retail customers may decrease;
|
|
•
|
the ability of our third-party suppliers and manufacturers to produce our products and of our distributors to distribute our products could be disrupted;
|
|
•
|
because substantially all of our products are sourced and manufactured in China, our operations are susceptible to risks inherent in doing business there;
|
|
•
|
our products may be the subject of regulatory actions, including but not limited to actions by the FDA, the FTC and the CPSC in the United States;
|
|
•
|
we may be unable to introduce new products that appeal to consumers or otherwise successfully compete with our competitors in the beauty industry;
|
|
•
|
we may be unsuccessful in enhancing the recognition and reputation of our brand, and our brand may be damaged as a result of, among other reasons, our failure, or alleged failure, to comply with applicable ethical, social, product, labor or environmental standards;
|
11
|
•
|
we may experience service interruptions, data corruption, cyber-based attacks or network security breaches which result in the disruption of our operating systems or the loss of confidential information of our consumers;
|
|
•
|
we may be unable to retain key members of our senior management team or attract and retain other qualified personnel; and
|
|
•
|
we may be affected by any adverse economic conditions in the United States or internationally.
|
We may be unable to grow our business effectively or efficiently, which would harm our business, financial condition and results of operations.
Growing our business will place a strain on our management team, financial and information systems, supply chain and distribution capacity and other resources. To manage growth effectively, we must continue to enhance our operational, financial and management systems, including our warehouse management and inventory control; maintain and improve our internal controls and disclosure controls and procedures; maintain and improve our information technology systems and procedures; and expand, train and manage our employee base.
We may not be able to effectively manage this expansion in any one or more of these areas, and any failure to do so could significantly harm our business, financial condition and results of operations. Growing our business may make it difficult for us to adequately predict the expenditures we will need to make in the future. If we do not make the necessary overhead expenditures to accommodate our future growth, we may not be successful in executing our growth strategy, and our results of operations would suffer.
Any damage to our reputation or brands may materially and adversely affect our business, financial condition and results of operations.
We believe that developing and maintaining our brands is critical and that our financial success is directly dependent on consumer perception of our brands. Furthermore, the importance of brand recognition may become even greater as competitors offer more products similar to ours.
We have relatively low brand awareness among consumers when compared to other beauty brands and maintaining and enhancing the recognition and reputation of our brands is critical to our business and future growth. Many factors, some of which are beyond our control, are important to maintaining our reputation and brands. These factors include our ability to comply with ethical, social, product, labor and environmental standards. Any actual or perceived failure in compliance with such standards could damage our reputation and brands.
The growth of our brands depends largely on our ability to provide a high-quality consumer experience, which in turn depends on our ability to bring innovative products to the market at competitive prices that respond to consumer demands and preferences. Additional factors affecting our consumer experience include our ability to provide appealing store sets in retail stores, the maintenance and stocking of those sets by our retail customers, the overall shopping experience provided by our retail customers, a reliable and user-friendly website interface and mobile applications for our consumers to browse and purchase products on our e-commerce websites. If we are unable to preserve our reputation, enhance our brand recognition or increase positive awareness of our products and in-store and Internet platforms, it may be difficult for us to maintain and grow our consumer base, and our business, financial condition and results of operations may be materially and adversely affected.
The success of our brands may also suffer if our marketing plans or product initiatives do not have the desired impact on our brand’s image or its ability to attract consumers. Further, our brand value could diminish significantly due to a number of factors, including consumer perception that we have acted in an irresponsible manner, adverse publicity about our products, our failure to maintain the quality of our products, product contamination, the failure of our products to deliver consistently positive consumer experiences, or the products becoming unavailable to consumers.
12
A disruption in our operations could materially and adversely affect our business.
As a company engaged in distribution on a global scale, our operations, including those of our third-party manufacturers, suppliers, brokers and delivery service providers, are subject to the risks inherent in such activities, including industrial accidents, environmental events, strikes and other labor disputes, disruptions in information systems, product quality control, safety, licensing requirements and other regulatory issues, as well as natural disasters, pandemics (such as the coronavirus pandemic), border disputes, acts of terrorism and other external factors over which we and our third-party manufacturers, suppliers, brokers and delivery service providers have no control. The loss of, or damage to, the manufacturing facilities or distribution centers of our third-party manufacturers, suppliers, brokers and delivery service providers could materially and adversely affect our business, financial condition and results of operations.
We depend heavily on ocean container delivery to receive shipments of our products from our third-party manufacturers located in China and contracted third-party delivery service providers to deliver our products to our distribution facilities and logistics providers, and from there to our retail customers. Further, we rely on postal and parcel carriers for the delivery of products sold directly to consumers through our e-commerce websites. Interruptions to or failures in these delivery services could prevent the timely or successful delivery of our products. These interruptions or failures may be due to unforeseen events that are beyond our control or the control of our third-party delivery service providers, such as inclement weather, natural disasters or labor unrest. If our products are not delivered on time or are delivered in a damaged state, retail customers and consumers may refuse to accept our products and have less confidence in our services. Furthermore, the delivery personnel of contracted third-party delivery service providers act on our behalf and interact with our consumers personally. Any failure to provide high-quality delivery services to our consumers may negatively affect the shopping experience of our consumers, damage our reputation and cause us to lose consumers.
Our ability to meet the needs of our consumers and retail customers depends on the proper operation of our distribution facilities, where most of our inventory that is not in transit is housed. Although we currently insure our inventory, our insurance coverage may not be sufficient to cover the full extent of any loss or damage to our inventory or distribution facilities, and any loss, damage or disruption of the facilities, or loss or damage of the inventory stored there, could materially and adversely affect our business, financial condition and results of operations.
Acquisitions or investments could disrupt our business and harm our financial condition.
We frequently review acquisition and strategic investment opportunities that would expand our current product offerings, our distribution channels, increase the size and geographic scope of our operations or otherwise offer growth and operating efficiency opportunities. There can be no assurance that we will be able to identify suitable candidates or consummate these transactions on favorable terms. The process of integrating an acquired business, product or technology can create unforeseen operating difficulties, expenditures and other challenges such as:
|
•
|
potentially increased regulatory and compliance requirements;
|
|
•
|
implementation or remediation of controls, procedures and policies at the acquired company;
|
|
•
|
diversion of management time and focus from operation of our then-existing business to acquisition integration challenges;
|
|
•
|
coordination of product, sales, marketing and program and systems management functions;
|
|
•
|
transition of the acquired company’s users and customers onto our systems;
|
|
•
|
retention of employees from the acquired company;
|
|
•
|
integration of employees from the acquired company into our organization;
|
|
•
|
integration of the acquired company’s accounting, information management, human resources and other administrative systems and operations into our systems and operations;
|
|
•
|
liability for activities of the acquired company prior to the acquisition, including violations of law, commercial disputes and tax and other known and unknown liabilities; and
|
|
•
|
litigation or other claims in connection with the acquired company, including claims brought by terminated employees, customers, former stockholders or other third parties.
|
13
If we are unable to address these difficulties and challenges or other problems encountered in connection with any acquisition or investment, we might not realize the anticipated benefits of that acquisition or investment and we might incur unanticipated liabilities or otherwise suffer harm to our business generally.
To the extent that we pay the consideration for any acquisitions or investments in cash, it would reduce the amount of cash available to us for other purposes. Acquisitions or investments could also result in dilutive issuances of our equity securities or the incurrence of debt, contingent liabilities, amortization expenses, increased interest expenses or impairment charges against goodwill on our consolidated balance sheet, any of which could have a material adverse effect on our business, results of operations and financial condition.
The recent outbreak of the COVID-19 global pandemic and related government, private sector and individual consumer responsive actions have adversely affected, and will continue adversely affect, our business, financial condition and results of operations.
The outbreak of COVID-19 has been declared a pandemic by the World Health Organization and continues to spread in the United States and around the world. Related government and private sector responsive actions, as well as changes in consumer shopping behaviors have adversely affected, and will continue adversely affect our business, financial condition and results of operations. It is impossible to predict the effect and ultimate impact of the COVID-19 pandemic, as the situation is rapidly evolving.
In response to the spread of COVID-19, international, federal, state and local governments have ordered the shutdown of non-essential businesses and have recommended precautions to mitigate the spread of the COVID-19 virus, including warning against congregating in heavily populated areas, such as malls, shopping centers, and other retailers. There is significant uncertainty around the breadth and duration of business disruptions related to COVID-19, as well as its impact on the U.S. and global economy and our consumers’ shopping habits.
While our suppliers and distribution centers currently remain open, there is risk that any of these facilities (i) may become less productive or encounter disruptions due to employees at the facilities becoming infected with the COVID-19 virus and/or (ii) are no longer allowed to operate based on directives from public health officials or government authorities.
As a result of the COVID-19 pandemic, almost all of our personnel are working remotely and it is possible that this could have a negative impact on the execution of our business plans and operations. If a natural disaster, power outage, connectivity issue, or other event occurs that impacts our employees’ ability to work remotely, it may be difficult or, in certain cases, impossible, for us to continue our business for a substantial period of time. The increase in remote working may also result in consumer privacy, IT security and fraud concerns as well as increase our exposure to potential wage and hour issues.
The uncertainty around the duration of business disruptions and the extent of the spread of COVID-19 in the United States and to other areas of the world will likely continue to adversely impact the national or global economy and negatively impact consumer spending and shopping behaviors. Any of these outcomes could have an adverse impact on our business, financial condition and results of operations. The extent to which the COVID-19 pandemic impacts our results will depend on future developments, which are highly uncertain and cannot be predicted, including new information that may emerge concerning the severity of COVID-19 and the actions taken to contain it or treat its impact.
We rely on third-party suppliers, manufacturers, distributors and other vendors, and they may not continue to produce products or provide services that are consistent with our standards or applicable regulatory requirements, which could harm our brand, cause consumer dissatisfaction, and require us to find alternative suppliers of our products or services.
We use multiple third-party suppliers and manufacturers based in China and the United States to source and manufacture substantially all of our products. We engage our third-party suppliers and manufacturers on a purchase order basis and are not party to long-term contracts with any of them. The ability of these third parties to supply and manufacture our products may be affected by competing orders placed by other persons and the demands of those persons. If we experience significant increases in demand or need to replace a significant number of existing suppliers or manufacturers, there can be no assurance that additional supply and manufacturing capacity will be available when required on terms that are acceptable to us, or at all, or that any supplier or manufacturer will allocate sufficient capacity to us in order to meet our requirements.
In addition, quality control problems, such as the use of ingredients and delivery of products that do not meet our quality control standards and specifications or comply with applicable laws or regulations, could harm our business. These
14
quality control problems could result in regulatory action, such as restrictions on importation, products of inferior quality or product stock outages or shortages, harming our sales and creating inventory write-downs for unusable products.
We have also outsourced significant portions of our distribution process, as well as certain technology-related functions, to third-party service providers. Specifically, we rely on third-party distributors to sell our products in a number of foreign countries, our warehouses and distribution facilities are managed and staffed by third-party service providers, we are dependent on a single third-party vendor for credit card processing and we utilize a third-party hosting and networking provider to host our e-commerce websites. The failure of one or more of these entities to provide the expected services on a timely basis, or at all, or at the prices we expect, or the costs and disruption incurred in changing these outsourced functions to being performed under our management and direct control or that of a third-party, may have a material adverse effect on our business, financial condition and results of operations. We are not party to long-term contracts with some of our distributors, and upon expiration of these existing agreements, we may not be able to renegotiate the terms on a commercially reasonable basis, or at all.
Further, our third-party manufacturers, suppliers and distributors may:
|
•
|
have economic or business interests or goals that are inconsistent with ours;
|
|
•
|
take actions contrary to our instructions, requests, policies or objectives;
|
|
•
|
be unable or unwilling to fulfill their obligations under relevant purchase orders, including obligations to meet our production deadlines, quality standards, pricing guidelines and product specifications, or to comply with applicable regulations, including those regarding the safety and quality of products and ingredients and good manufacturing practices;
|
|
•
|
have financial difficulties;
|
|
•
|
encounter raw material or labor shortages;
|
|
•
|
encounter increases in raw material or labor costs which may affect our procurement costs;
|
|
•
|
disclose our confidential information or intellectual property to competitors or third parties;
|
|
•
|
engage in activities or employ practices that may harm our reputation; and
|
|
•
|
work with, be acquired by, or come under control of, our competitors.
|
The occurrence of any of these events, alone or together, could have a material adverse effect on our business, financial condition and results of operations. In addition, such problems may require us to find new third-party suppliers, manufacturers or distributors, and there can be no assurance that we would be successful in finding third-party suppliers, manufacturers or distributors meeting our standards of innovation and quality.
The management and oversight of the engagement and activities of our third-party suppliers, manufacturers and distributors requires substantial time, effort and expense of our employees, and we may be unable to successfully manage and oversee the activities of our third-party manufacturers, suppliers and distributors. If we experience any supply chain disruptions caused by our manufacturing process or by our inability to locate suitable third-party manufacturers or suppliers, or if our manufacturers or raw material suppliers experience problems with product quality or disruptions or delays in the manufacturing process or delivery of the finished products or the raw materials or components used to make such products, our business, financial condition and results of operations could be materially and adversely affected.
If we fail to manage our inventory effectively, our results of operations, financial condition and liquidity may be materially and adversely affected.
Our business requires us to manage a large volume of inventory effectively. We depend on our forecasts of demand for, and popularity of, various products to make purchase decisions and to manage our inventory of stock-keeping units. Demand for products, however, can change significantly between the time inventory or components are ordered and the date of sale. Demand may be affected by seasonality, new product launches, rapid changes in product cycles and pricing, product defects, promotions, changes in consumer spending patterns, changes in consumer tastes with respect to our products and other factors, and our consumers may not purchase products in the quantities that we expect. It may be difficult to accurately forecast demand and determine appropriate levels of product or componentry. We generally do not have the right to return unsold products to our suppliers. If we fail to manage our inventory effectively or negotiate favorable credit terms with third-party suppliers, we may be subject to a heightened risk of inventory obsolescence, a decline in inventory
15
values, and significant inventory write-downs or write-offs. In addition, if we are required to lower sale prices in order to reduce inventory level or to pay higher prices to our suppliers, our profit margins might be negatively affected. Any of the above may materially and adversely affect our business, financial condition and results of operations. See also “—Our quarterly results of operations fluctuate due to seasonality, order patterns from key retail customers and other factors, and we may not have sufficient liquidity to meet our seasonal working capital requirements.”
Our substantial indebtedness may have a material adverse effect on our business, financial condition and results of operations.
As of
March 31, 2020
, we had a total of
$138.9 million
of indebtedness, consisting of amounts outstanding under our credit facilities and capital lease obligations, and a total availability of
$49.8 million
under our Revolving Credit Facility (as defined in Item 7 “Management’s discussion and analysis of financial condition and results of operations” under the heading “Description of indebtedness”). Our indebtedness could have significant consequences, including:
|
•
|
requiring a substantial portion of our cash flows to be dedicated to debt service payments instead of funding growth, working capital, capital expenditures, investments or other cash requirements;
|
|
•
|
reducing our flexibility to adjust to changing business conditions or obtain additional financing;
|
|
•
|
exposing us to the risk of increased interest rates as our borrowings are at variable rates;
|
|
•
|
making it more difficult for us to make payments on our indebtedness;
|
|
•
|
subjecting us to restrictive covenants that may limit our flexibility in operating our business, including our ability to take certain actions with respect to indebtedness, liens, sales of assets, consolidations and mergers, affiliate transactions, dividends and other distributions and changes of control;
|
|
•
|
subjecting us to maintenance covenants which require us to maintain specific financial ratios; and
|
|
•
|
limiting our ability to obtain additional financing for working capital, capital expenditures, debt service requirements and general corporate or other purposes.
|
Our quarterly results of operations fluctuate due to seasonality, order patterns from key retail customers and other factors, and we may not have sufficient liquidity to meet our seasonal working capital requirements.
Our results of operations are subject to seasonal fluctuations, with net sales in the third and fourth fiscal quarters typically being higher than in the first and second fiscal quarters. The higher net sales in our third and fourth fiscal quarters are largely attributable to the increased levels of purchasing by retailers for the holiday season, and customer shelf reset activity, respectively. Adverse events that occur during either the third or fourth fiscal quarter could have a disproportionate effect on our results of operations for the entire fiscal year. To support anticipated higher sales during the third and fourth fiscal quarters, we make investments in working capital to ensure inventory levels can support demand. Fluctuations throughout the year are also driven by the timing of product restocking or rearrangement by our major customers as well as our expansion into new customers. Because a limited number of our retail customers account for a large percentage of our net sales, a change in the order pattern of one or more of our large retail customers could cause a significant fluctuation of our quarterly results or reduce our liquidity.
Furthermore, product orders from our large retail customers may vary over time due to changes in their inventory or out-of-stock policies. If we were to experience a significant shortfall in sales or profitability, we may not have sufficient liquidity to fund our business. As a result of quarterly fluctuations caused by these and other factors, comparisons of our operating results across different fiscal quarters may not be accurate indicators of our future performance. Any quarterly fluctuations that we report in the future may differ from the expectations of market analysts and investors, which could cause the price of our common stock to fluctuate significantly.
We are increasingly dependent on information technology, and if we are unable to protect against service interruptions, data corruption, cyber-based attacks or network security breaches, our operations could be disrupted.
We rely on information technology networks and systems to market and sell our products, to process electronic and financial information, to manage a variety of business processes and activities and to comply with regulatory, legal and tax requirements. We are increasingly dependent on a variety of information systems to effectively process retail customer orders and fulfill consumer orders from our e-commerce business. We depend on our information technology infrastructure for digital marketing activities and for electronic communications among our personnel, retail customers, consumers,
16
manufacturers and suppliers around the world. These information technology systems, some of which are managed by third parties, may be susceptible to damage, disruptions or shutdowns due to failures during the process of upgrading or replacing software, databases or components, power outages, hardware failures, computer viruses, attacks by computer hackers, telecommunication failures, user errors or catastrophic events. Any material disruption of our systems, or the systems of our third-party service providers, could disrupt our ability to track, record and analyze the products that we sell and could negatively impact our operations, shipment of goods, ability to process financial information and transactions, and our ability to receive and process retail customer and e-commerce orders or engage in normal business activities. If our information technology systems suffer damage, disruption or shutdown, we may incur substantial cost in repairing or replacing these systems, and if we do not effectively resolve the issues in a timely manner, our business, financial condition and results of operations may be materially and adversely affected, and we could experience delays in reporting our financial results.
Our e-commerce operations are important to our business. Our e-commerce websites serve as an effective extension of our marketing strategies by introducing potential new consumers to our brand, product offerings and enhanced content. Due to the importance of our e-commerce operations, we are vulnerable to website downtime and other technical failures. Our failure to successfully respond to these risks in a timely manner could reduce e-commerce sales and damage our brand’s reputation.
We must successfully maintain and upgrade our information technology systems, and our failure to do so could have a material adverse effect on our business, financial condition and results of operations.
We have identified the need to significantly expand and improve our information technology systems and personnel to support historical and expected future growth. As such, we are in process of implementing, and will continue to invest in and implement, significant modifications and upgrades to our information technology systems and procedures, including replacing legacy systems with successor systems, making changes to legacy systems or acquiring new systems with new functionality, hiring employees with information technology expertise and building new policies, procedures, training programs and monitoring tools. These types of activities subject us to inherent costs and risks associated with replacing and changing these systems, including impairment of our ability to leverage our e-commerce channels, fulfill customer orders, potential disruption of our internal control structure, substantial capital expenditures, additional administration and operating expenses, acquisition and retention of sufficiently skilled personnel to implement and operate the new systems, demands on management time and other risks and costs of delays or difficulties in transitioning to or integrating new systems into our current systems. These implementations, modifications and upgrades may not result in productivity improvements at a level that outweighs the costs of implementation, or at all. In addition, difficulties with implementing new technology systems, delays in our timeline for planned improvements, significant system failures, or our inability to successfully modify our information systems to respond to changes in our business needs may cause disruptions in our business operations and have a material adverse effect on our business, financial condition and results of operations.
If we fail to adopt new technologies or adapt our e-commerce websites and systems to changing consumer requirements or emerging industry standards, our business may be materially and adversely affected.
To remain competitive, we must continue to enhance and improve the responsiveness, functionality and features of our information technology, including our e-commerce websites and mobile applications. Our competitors are continually innovating and introducing new products to increase their consumer base and enhance user experience. As a result, in order to attract and retain consumers and compete against our competitors, we must continue to invest resources to enhance our information technology and improve our existing products and services for our consumers. The Internet and the online retail industry are characterized by rapid technological evolution, changes in consumer requirements and preferences, frequent introductions of new products and services embodying new technologies and the emergence of new industry standards and practices, any of which could render our existing technologies and systems obsolete. Our success will depend, in part, on our ability to identify, develop, acquire or license leading technologies useful in our business, and respond to technological advances and emerging industry standards and practices in a cost-effective and timely way. The development of our e-commerce websites and other proprietary technology entails significant technical and business risks. There can be no assurance that we will be able to properly implement or use new technologies effectively or adapt our e-commerce websites and systems to meet consumer requirements or emerging industry standards. If we are unable to adapt in a cost-effective and timely manner in response to changing market conditions or consumer requirements, whether for technical, legal, financial or other reasons, our business, financial condition and results of operations may be materially and adversely affected.
Failure to protect sensitive information of our consumers and information technology systems against security breaches could damage our reputation and brand and substantially harm our business, financial condition and results of operations.
17
We collect, maintain, transmit and store data about our consumers, suppliers and others, including personal data, financial information, including consumer payment information, as well as other confidential and proprietary information important to our business. We also employ third-party service providers that collect, store, process and transmit personal data, and confidential, proprietary and financial information on our behalf.
We have in place technical and organizational measures to maintain the security and safety of critical proprietary, personal, employee, customer and financial data which we continue to maintain and upgrade to industry standards. However, advances in technology, the pernicious ingenuity of criminals, new exposures via cryptography, acts or omissions by our employees, contractors or service providers or other events or developments could result in a compromise or breach in the security of confidential or personal data. We and our service providers may not be able to prevent third parties, including criminals, competitors or others, from breaking into or altering our systems, disrupting business operations or communications infrastructure through denial-of-service attacks, attempting to gain access to our systems, information or monetary funds through phishing or social engineering campaigns, installing viruses or malicious software on our e-commerce websites or devices used by our employees or contractors, or carrying out other activity intended to disrupt our systems or gain access to confidential or sensitive information in our or our service providers’ systems. We are not aware of any breach or compromise of the personal data of consumers, but we have been subject to attacks (e.g. phishing, denial of service, etc.) and cannot guarantee that our security measures will be sufficient to prevent a material breach or compromise in the future.
Furthermore, such third parties may engage in various other illegal activities using such information, including credit card fraud or identity theft, which may cause additional harm to us, our consumers and our brand. We also may be vulnerable to error or malfeasance by our own employees or other insiders. Third parties may attempt to fraudulently induce our or our service providers’ employees to misdirect funds or to disclose information in order to gain access to personal data we maintain about our consumers or website users. In addition, we have limited control or influence over the security policies or measures adopted by third-party providers of online payment services through which some of our consumers may elect to make payment for purchases at our e-commerce websites. Contracted third-party delivery service providers may also violate their confidentiality or data processing obligations and disclose or use information about our consumers inadvertently or illegally.
If a material security breach were to occur, our reputation and brand could be damaged, and we could be required to expend significant capital and other resources to alleviate problems caused by such breaches including exposure of litigation or regulatory action and a risk of loss and possible liability. Actual or anticipated attacks may cause us to incur increasing costs, including costs to deploy additional personnel and protection technologies, train employees and engage third-party experts and consultants. In addition, any party who is able to illicitly obtain a subscriber’s password could access the subscriber’s financial, transaction or personal information. Any compromise or breach of our security measures, or those of our third-party service providers, may violate applicable privacy, data security, financial, cyber and other laws and cause significant legal and financial exposure, adverse publicity, and a loss of confidence in our security measures, all of which could have a material adverse effect on our business, financial condition and results of operations. We may be subject to post-breach review of the adequacy of our privacy and security controls by regulators and other third parties, which could result in post-breach regulatory investigation, fines and consumer litigation as well as regulatory oversight, at significant expense and risking reputational harm.
Furthermore, we are subject to diverse laws and regulations in the United States, the European Union, and other international jurisdictions that require notification to affected individuals in the event of a breach involving personal information. These required notifications can be time-consuming and costly. Furthermore, failure to comply with these laws and regulations could subject us to regulatory scrutiny and additional liability. Although we maintain relevant insurance, we cannot be certain that our insurance coverage will be adequate for all breach related liabilities or that insurance will continue to be available to us on economically reasonable terms, or at all. We may need to devote significant resources to protect against security breaches or to address problems caused by breaches, diverting resources from the growth and expansion of our business.
Payment methods used on our e-commerce websites subject us to third-party payment processing-related risks.
We accept payments from our consumers using a variety of methods, including online payments with credit cards and debit cards issued by major banks, payments made with gift cards processed by third-party providers and payment through third-party online payment platforms such as PayPal, Afterpay, and Apple Pay. We also rely on third parties to provide payment processing services. For certain payment methods, including credit and debit cards, we pay interchange and other fees, which may increase over time and raise our operating costs and lower our profit margins. We may also be subject to fraud and other illegal activities in connection with the various payment methods we offer, including online payment options
18
and gift cards. Transactions on our e-commerce websites are card-not-present transactions, so they present a greater risk of fraud. Criminals are using increasingly sophisticated methods to engage in illegal activities such as unauthorized use of credit or debit cards and bank account information. Requirements relating to consumer authentication and fraud detection with respect to online sales are complex. We may ultimately be held liable for the unauthorized use of a cardholder’s card number in an illegal activity and be required by card issuers to pay charge-back fees. Charge-backs result not only in our loss of fees earned with respect to the payment, but also leave us liable for the underlying money transfer amount. If our charge-back rate becomes excessive, card associations also may require us to pay fines or refuse to process our transactions. In addition, we may be subject to additional fraud risk if third-party service providers or our employees fraudulently use consumer information for their own gain or facilitate the fraudulent use of such information. Overall, we may have little recourse if we process a criminally fraudulent transaction.
We are subject to payment card association operating rules, certification requirements and various rules, regulations and requirements governing electronic funds transfers, which could change or be reinterpreted to make it difficult or impossible for us to comply. As our business changes, we may also be subject to different rules under existing standards, which may require new assessments that involve costs above what we currently pay for compliance. If we fail to comply with the rules or requirements of any provider of a payment method we accept, or if the volume of fraud in our transactions limits or terminates our rights to use payment methods we currently accept, or if a data breach occurs relating to our payment systems, among other things, we may be subject to fines and higher transaction fees and lose our ability to accept credit and debit card payments from our consumers, process electronic funds transfers or facilitate other types of online payments, and our reputation and our business, financial condition and results of operations could be materially and adversely affected.
We have significant operations in China, which exposes us to risks inherent in doing business in that country.
We currently source and manufacture substantially all of our products from third-party suppliers and manufacturers in China. As of
March 31, 2020
, we had a team of
69
employees in China to manage our supply chain. With the rapid development of the Chinese economy, the cost of labor has increased and may continue to increase in the future. Our results of operations will be materially and adversely affected if our labor costs, or the labor costs of our suppliers and manufacturers, increase significantly. In addition, we and our manufacturers and suppliers may not be able to find a sufficient number of qualified workers due to the intensely competitive and fluid market for skilled labor in China. Furthermore, pursuant to Chinese labor laws, employers in China are subject to various requirements when signing labor contracts, paying remuneration, determining the term of employees’ probation and unilaterally terminating labor contracts. These labor laws and related regulations impose liabilities on employers and may significantly increase the costs of workforce reductions. If we decide to change or reduce our workforce, these labor laws could limit or restrict our ability to make such changes in a timely, favorable and effective manner. Any of these events may materially and adversely affect our business, financial condition and results of operations.
Operating in China exposes us to political, legal and economic risks. In particular, the political, legal and economic climate in China, both nationally and regionally, is fluid and unpredictable. Our ability to operate in China may be adversely affected by changes in U.S. and Chinese laws and regulations such as those related to, among other things, taxation, import and export tariffs, environmental regulations, land use rights, intellectual property, currency controls, network security, employee benefits, hygiene supervision and other matters. In addition, we may not obtain or retain the requisite legal permits to continue to operate in China, and costs or operational limitations may be imposed in connection with obtaining and complying with such permits. In addition, Chinese trade regulations are in a state of flux, and we may become subject to other forms of taxation, tariffs and duties in China. Furthermore, the third parties we rely on in China may disclose our confidential information or intellectual property to competitors or third parties, which could result in the illegal distribution and sale of counterfeit versions of our products. If any of these events occur, our business, financial condition and results of operations could be materially and adversely affected. See also “Recent and potential additional tariffs imposed by the United States government or a global trade war could increase the cost of our products, which could materially and adversely affect our business, financial condition and results of operations.”
Recent and potential additional tariffs imposed by the United States government or a global trade war could increase the cost of our products, which could materially and adversely affect our business, financial condition and results of operations.
The U.S. government has imposed increased tariffs on certain imports from China, some of which cover products that we import from that country. We currently source and manufacture substantially all of our products from third-party suppliers and manufacturers in China, and as such, current tariffs may increase our cost of goods, which may result in lower gross margin on certain of our products. Despite the signing of a Phase One trade agreement between the United States and China, the majority of our products remain impacted by increased tariffs. In July 2019, we selectively increased prices on
19
certain of our products, which could reduce the competitiveness of those products and consumer purchases thereof, as well as reduce consumer purchases of other non-affected products as well. Furthermore, similar effects may occur if we raise prices on other products to account for any increase in costs of goods. In any case, increased tariffs on imports from China could materially and adversely affect our business, financial condition and results of operations. In retaliation for the current U.S. tariffs, China has implemented tariffs on a wide range of American products. There is also a concern that the imposition of additional tariffs by the United States could result in the adoption of tariffs by other countries as well, leading to a global trade war. Trade restrictions implemented by the United States or other countries in connection with a global trade war could materially and adversely affect our business, financial condition and results of operations.
Changes in tax law, in our tax rates, or in exposure to additional income tax liabilities or assessments could materially and adversely affect our business, financial condition and results of operations.
Changes in law and policy relating to taxes could materially and adversely affect our business, financial condition and results of operations. For example, the Tax Cuts and Jobs Act ("2017 Tax Act") and the Coronavirus Aid, Relief, and Economic Security Act (“CARES Act”) remain unclear in many respects and could be subject to potential amendments and technical corrections and will be subject to interpretation and implementing regulations by the Treasury and U.S. Internal Revenue Service, any of which could mitigate or increase certain adverse tax effects of the 2017 Tax Act or the CARES Act. In addition, some aspects remain unclear regarding how these U.S. federal income tax changes will affect state and local taxation.
In addition, as we continue to expand our business internationally, the application and implementation of existing, new or future international laws regarding indirect taxes (such as a Value Added Tax) could materially and adversely affect our business, financial condition and results of operations.
If our cash from operations is not sufficient to meet our current or future operating needs, expenditures and debt service obligations, our business, financial condition and results of operations may be materially and adversely affected.
We may require additional cash resources due to changed business conditions or other future developments, including any marketing initiatives, investments or acquisitions we may decide to pursue. To the extent we are unable to generate sufficient cash flow, we may be forced to cancel, reduce or delay these activities. Alternatively, if our sources of funding are insufficient to satisfy our cash requirements, we may seek to obtain an additional credit facility or sell equity or debt securities. The sale of equity securities would result in dilution of our existing stockholders. The incurrence of additional indebtedness would result in increased debt service obligations and operating and financing covenants that could restrict our operations.
Our ability to generate cash to meet our operating needs, expenditures and debt service obligations will depend on our future performance and financial condition, which will be affected by financial, business, economic, legislative, regulatory and other factors, including potential changes in costs, pricing, the success of product innovation and marketing, competitive pressure and consumer preferences. If our cash flows and capital resources are insufficient to fund our debt service obligations and other cash needs, we could face substantial liquidity problems and could be forced to reduce or delay investments and capital expenditures or to dispose of material assets or operations, seek additional debt or equity capital or restructure or refinance our indebtedness. Our credit facilities may restrict our ability to take these actions, and we may not be able to affect any such alternative measures on commercially reasonable terms, or at all. If we cannot make scheduled payments on our debt, the lenders under our Credit Agreement (as defined in Item 7 “Management’s discussion and analysis of financial condition and results of operations” under the heading “Description of indebtedness”) can terminate their commitments to loan money under our Revolving Credit Facility, and our lenders under our Credit Agreement can declare all outstanding principal and interest to be due and payable and foreclose against the assets securing their borrowings, and we could be forced into bankruptcy or liquidation.
Furthermore, it is uncertain whether financing will be available in amounts or on terms acceptable to us, if at all, which could materially and adversely affect our business, financial condition and results of operations.
Our success depends, in part, on our retention of key members of our senior management team and ability to attract and retain qualified personnel.
Our success depends, in part, on our ability to retain our key employees, including our executive officers, senior management team and development, operations, finance, sales and marketing personnel. We are a small company that relies on a few key employees, any one of whom would be difficult to replace, and because we are a small company, we believe that the loss of key employees may be more disruptive to us than it would be to a larger company. Our success also depends, in
20
part, on our continuing ability to identify, hire, train and retain other highly qualified personnel. In addition, we may be unable to effectively plan for the succession of senior management, including our chief executive officer. The loss of key personnel or the failure to attract and retain qualified personnel may have a material adverse effect on our business, financial condition and results of operations.
Adverse economic conditions in the United States, Europe or China or any of the other countries in which we may conduct business could negatively affect our business, financial condition and results of operations.
Consumer spending on beauty products is influenced by general economic conditions and the availability of discretionary income. Adverse economic conditions in the United States, Europe, China or any of the other countries in which we do significant business, or periods of inflation or high energy prices may contribute to higher unemployment levels, decreased consumer spending, reduced credit availability and declining consumer confidence and demand, each of which poses a risk to our business. A decrease in consumer spending or in retailer and consumer confidence and demand for our products could have a significant negative impact on our net sales and profitability, including our operating margins and return on invested capital. These economic conditions could cause some of our retail customers or suppliers to experience cash flow or credit problems and impair their financial condition, which could disrupt our business and adversely affect product orders, payment patterns and default rates and increase our bad debt expense.
Legal, political, and economic uncertainty surrounding the planned exit of the United Kingdom from the European Union are a source of instability and uncertainty.
On January 31, 2020, the United Kingdom formally withdrew from the European Union, governed by transitional terms that will expire on December 31, 2020. During this transition phase, the United Kingdom and the European Union will seek to negotiate and finalize a new, more permanent trade deal. It is not possible to anticipate whether the United Kingdom and the European Union will be able to agree on and implement a new trade agreement or what the nature of such trade arrangement will be and this uncertainty could result in increased costs or otherwise adversely impact our operations in the European Union and the United Kingdom. We distribute our products to our European Union based retailers and distributors from the United Kingdom. Depending on tariffs and trade regulation negotiations, we may be forced to acquire duplicate arrangements in the European Union either temporarily or permanently, which may increase our costs in the European Union and the United Kingdom.
Further, since the United Kingdom will no longer be part of the European Union, its data protection regulatory regime will be independent of the European Union. It is expected that the United Kingdom will have its own data protection laws and regulations, mirroring that of the General Data Protection Regulation (the “GDPR”), including similar fines for non-compliance. Thus if a regulatory issue arose in both the European Union and the United Kingdom, for example, a breach that affected both the European Union and the United Kingdom residents, then the Company would be subject to receiving fines for any material non-compliance from both the European Union and the United Kingdom.
In addition, the process for the United Kingdom to withdraw from the European Union, and the longer term economic, legal, political, regulatory and social framework to be put in place between the United Kingdom and the European Union remain unclear and have had and may continue to have a material and adverse effect on global economic conditions and the stability of global financial markets and may significantly reduce global market liquidity and restrict the ability of key market participants to operate in certain financial markets. Any of these factors could depress economic activity and restrict our access to capital, which could materially and adversely affect our business, financial condition and results of operations.
We are subject to international business uncertainties.
We sell our products to customers located outside the United States. In addition, substantially all of our third-party suppliers and manufacturers are located in China. We intend to continue to sell to customers outside the United States and maintain our relationships in China. Further, we may establish additional relationships in other countries to grow our operations. The substantial up-front investment required, the lack of consumer awareness of our products in jurisdictions outside of the United States, differences in consumer preferences and trends between the United States and other jurisdictions, the risk of inadequate intellectual property protections and differences in packaging, labeling and related laws, rules and regulations are all substantial matters that need to be evaluated prior to doing business in new territories. We cannot be assured that our international efforts will be successful. International sales and increased international operations may be subject to risks such as:
|
•
|
difficulties in staffing and managing foreign operations;
|
21
|
•
|
burdens of complying with a wide variety of laws and regulations, including more stringent regulations relating to data privacy and security, particularly in the European Union;
|
|
•
|
adverse tax effects and foreign exchange controls making it difficult to repatriate earnings and cash;
|
|
•
|
political and economic instability;
|
|
•
|
terrorist activities and natural disasters;
|
|
•
|
trade restrictions;
|
|
•
|
differing employment practices and laws and labor disruptions;
|
|
•
|
the imposition of government controls;
|
|
•
|
an inability to use or to obtain adequate intellectual property protection for our key brands and products;
|
|
•
|
tariffs and customs duties and the classifications of our goods by applicable governmental bodies;
|
|
•
|
a legal system subject to undue influence or corruption;
|
|
•
|
a business culture in which illegal sales practices may be prevalent;
|
|
•
|
logistics and sourcing;
|
|
•
|
military conflicts; and
|
|
•
|
acts of terrorism.
|
The occurrence of any of these risks could negatively affect our international business and consequently our overall business, financial condition and results of operations.
New laws, regulations, enforcement trends or changes in existing regulations governing the introduction, marketing and sale of our products to consumers could harm our business.
There has been an increase in regulatory activity and activism in the United States and abroad, and the regulatory landscape is becoming more complex with increasingly strict requirements. If this trend continues, we may find it necessary to alter some of the ways we have traditionally manufactured and marketed our products in order to stay in compliance with a changing regulatory landscape, and this could add to the costs of our operations and have an adverse impact on our business. To the extent federal, state, local or foreign regulatory changes regarding consumer protection, or the ingredients, claims or safety of our products occur in the future, they could require us to reformulate or discontinue certain of our products, revise the product packaging or labeling, or adjust operations and systems, any of which could result in, among other things, increased costs, delays in product launches, product returns or recalls and lower net sales, and therefore could have a material adverse effect on our business, financial condition and results of operations. Noncompliance with applicable regulations could result in enforcement action by the FDA or other regulatory authorities within or outside the United States, including but not limited to product seizures, injunctions, product recalls, and criminal or civil monetary penalties, all of which could have a material adverse effect on our business, financial condition and results of operations.
In the United States, the FDA does not currently require pre-market approval for products intended to be sold as cosmetics. However, the FDA may in the future require pre-market approval, clearance or registration/notification of cosmetic products, establishments or manufacturing facilities. Moreover, such products could also be regulated as both drugs and cosmetics simultaneously, as the categories are not mutually exclusive. The statutory and regulatory requirements applicable to drugs are extensive and require significant resources and time to ensure compliance. For example, if any of our products intended to be sold as cosmetics were to be regulated as drugs, we might be required to conduct, among other things, clinical trials to demonstrate the safety and efficacy of these products. We may not have sufficient resources to conduct any required clinical trials or to ensure compliance with the manufacturing requirements applicable to drugs. If the FDA determines that any of our products intended to be sold as cosmetics should be classified and regulated as drug products and we are unable to comply with applicable drug requirements, we may be unable to continue to market those products. Any inquiry into the regulatory status of our cosmetics and any related interruption in the marketing and sale of these products could damage our reputation and image in the marketplace.
In recent years, the FDA has issued warning letters to several cosmetic companies alleging improper claims regarding their cosmetic products. If the FDA determines that we have disseminated inappropriate drug claims for our
22
products intended to be sold as cosmetics, we could receive a warning or untitled letter, be required to modify our product claims or take other actions to satisfy the FDA. In addition, plaintiffs’ lawyers have filed class action lawsuits against cosmetic companies after receipt of these types of FDA warning letters. There can be no assurance that we will not be subject to state and federal government actions or class action lawsuits, which could harm our business, financial condition and results of operations.
Additional state and federal requirements may be imposed on consumer products as well as cosmetics, cosmetic ingredients, or the labeling and packaging of products intended for use as cosmetics. For example, several lawmakers are currently focused on giving the FDA additional authority to regulate cosmetics and their ingredients. This increased authority could require the FDA to impose increased testing and manufacturing requirements on cosmetic manufacturers or cosmetics or their ingredients before they may be marketed. We are unable to ascertain what, if any, impact any increased statutory or regulatory requirements may have on our business.
We sell a number of products as over-the-counter (“OTC”) drug products, which are subject to the FDA OTC drug regulatory requirements because they are intended to be used as sunscreen or to treat acne. The FDA regulates the formulation, manufacturing, packaging and labeling of OTC drug products. Our sunscreen and acne drug products are regulated pursuant to FDA OTC drug monographs that specify acceptable active drug ingredients and acceptable product claims that are generally recognized as safe and effective for particular uses. If any of these products that are marketed as OTC drugs are not in compliance with the applicable FDA monograph, we may be required to reformulate the product, stop making claims relating to such product or stop selling the product until we are able to obtain costly and time-consuming FDA approvals. We are also required to submit adverse event reports to the FDA for our OTC drug products, and failure to comply with this requirement may subject us to FDA regulatory action.
We also sell a number of consumer products, which are subject to regulation by the CPSC in the United States under the provisions of the Consumer Product Safety Act, as amended by the Consumer Product Safety Improvement Act of 2008. These statutes and the related regulations ban from the market consumer products that fail to comply with applicable product safety laws, regulations, and standards. The CPSC has the authority to require the recall, repair, replacement or refund of any such banned products or products that otherwise create a substantial risk of injury and may seek penalties for regulatory noncompliance under certain circumstances. The CPSC also requires manufacturers of consumer products to report certain types of information to the CPSC regarding products that fail to comply with applicable regulations. Certain state laws also address the safety of consumer products, and mandate reporting requirements, and noncompliance may result in penalties or other regulatory action.
Our products are also subject to state laws and regulations, such as the California Safe Drinking Water and Toxic Enforcement Act, also known as “Prop 65,” and failure to comply with such laws may also result in lawsuits and regulatory enforcement that could have a material adverse effect on our business, financial condition and results of operations.
Our facilities and those of our third-party manufacturers are subject to regulation under the Federal Food, Drug and Cosmetic Act (the “FDCA”) and FDA implementing regulations.
Our facilities and those of our third-party manufacturers are subject to regulation under the FDCA and FDA implementing regulations. The FDA may inspect all of our facilities and those of our third-party manufacturers periodically to determine if we and our third-party manufacturers are complying with provisions of the FDCA and FDA regulations. In addition, third-party manufacturer’s facilities for manufacturing OTC drug products must comply with the FDA’s current drug good manufacturing practices (“GMP”) requirements that require us and our manufacturers to maintain, among other things, good manufacturing processes, including stringent vendor qualifications, ingredient identification, manufacturing controls and record keeping.
Our operations could be harmed if regulatory authorities make determinations that we, or our vendors, are not in compliance with these regulations. If the FDA finds a violation of GMPs, it may enjoin our manufacturer’s operations, seize product, restrict importation of goods, and impose administrative, civil or criminal penalties. If we or our third-party manufacturers fail to comply with applicable regulatory requirements, we could be required to take costly corrective actions, including suspending manufacturing operations, changing product formulations, suspending sales, or initiating product recalls. In addition, compliance with these regulations has increased and may further increase the cost of manufacturing certain of our products as we work with our vendors to assure they are qualified and in compliance. Any of these outcomes could have a material adverse effect on our business, financial condition and results of operations.
23
Government regulations and private party actions relating to the marketing and advertising of our products and services may restrict, inhibit or delay our ability to sell our products and harm our business, financial condition and results of operations.
Government authorities regulate advertising and product claims regarding the performance and benefits of our products. These regulatory authorities typically require a reasonable basis to support any marketing claims. What constitutes a reasonable basis for substantiation can vary widely from market to market, and there is no assurance that the efforts that we undertake to support our claims will be deemed adequate for any particular product or claim. A significant area of risk for such activities relates to improper or unsubstantiated claims about our products and their use or safety. If we are unable to show adequate substantiation for our product claims, or our promotional materials make claims that exceed the scope of allowed claims for the classification of the specific product, whether cosmetics, OTC drug products or other consumer products that we offer, the FDA, the FTC or other regulatory authorities could take enforcement action or impose penalties, such as monetary consumer redress, requiring us to revise our marketing materials, amend our claims or stop selling certain products, all of which could harm our business, financial condition and results of operations. Any regulatory action or penalty could lead to private party actions, or private parties could seek to challenge our claims even in the absence of formal regulatory actions which could harm our business, financial condition and results of operations.
Our business is subject to complex and evolving U.S. and foreign laws and regulations regarding privacy and data protection. Many of these laws and regulations are subject to change and uncertain interpretation, and could result in claims, changes to our business practices, monetary penalties, increased costs of operations or otherwise harm our business, financial condition and results of operations.
We are subject to a variety of laws and regulations in the United States and abroad regarding privacy and data protection, some of which can be enforced by private parties or government entities and some of which provide for significant penalties for non-compliance. For example, the GDPR allows for a private right of action, imposes stringent data protection requirements on companies established in the European Union or companies that offer goods or services to, or monitor the behavior of, individuals in the European Union. The GDPR establishes a robust framework of data subjects’ rights and imposes onerous accountability obligations on companies, with penalties for noncompliance of up to the greater of 20 million euros or four percent of annual global revenue. Furthermore, the California Consumer Privacy Act (the “CCPA”) requires new disclosures to California consumers, imposes new rules for collecting or using information about minors, affords California consumers new abilities to opt out of certain disclosures of personal information and also establishes significant penalties for noncompliance. In response to the GDPR and CCPA, we have reviewed and amended our information practices involving European resident consumers and California resident-consumers, as well as our use of service providers or interactions with other parties to whom we disclose personal information. We cannot yet predict the full impact of the CCPA and its respective implementing regulations on our business or operations, but these laws may require us to further modify our information practices and policies, and to incur substantial costs and expenses in an effort to comply. It also remains unclear what, if any, further modifications will be made to the CCPA and its implementing regulations, or how the statute or rules will be interpreted.
Data privacy continues to remain a matter of interest to lawmakers and regulators. A number of proposals are pending before federal, state and foreign legislative and regulatory bodies and additional laws and regulations have been passed but are not yet effective, all of which could significantly affect our business. For example, some U.S. states are considering enacting stricter data privacy laws, some modeled on the GDPR, some modeled on the CCPA, and others potentially imposing completely distinct requirements. The U.S. is considering comprehensive federal privacy legislation, such as the Consumer Online Privacy Rights Act, which would significantly expand elements of the data protection rights and obligations existing within the GDPR and the CCPA to all U.S. consumers. In addition, the European Union's institutions are debating the ePrivacy Regulation, which would repeal and replace the current ePrivacy Directive that regulates electronic marketing and use of cookies and tracking technologies. The new guidance and the ePrivacy Regulation would together require extensive disclosure and consent, regulate web beacons and similar technology affecting our ability to use a users’ location and other data for personalized advertising, and alter the ability of retail advertisers to place ads across social media and the web. The current European Union member states’ local guidance in line with GDPR has significantly increased the risk of penalties for breach of the GDPR and law implementing the ePrivacy Directive. Increased regulation of privacy and data protection may lead to broader restrictions on the way we market our products on a global basis, and increase our risk of regulatory oversight our ability to reach our consumers, and our capability to provide our consumers with personalized services and experiences.
Several countries in Europe have also recently issued guidance on the use of cookies and similar tracking technologies which require an additional layer of consent from, and disclosure to, website users for third party advertising,
24
social media advertising and analytics. Regulation of cookies and similar technologies may lead to broader restrictions on our marketing and personalization activities and may negatively impact our efforts to understand users’ Internet usage online shopping and other relevant online behaviors, as well as the effectiveness of our marketing and our business generally. Such regulations, including uncertainties about how well the advertising technology ecosystem can adapt to legal changes around the use of tracking technologies, may have a negative effect on businesses, including ours, that collect and use online usage information for consumer acquisition and marketing. The decline of cookies or other online tracking technologies as a means to identify and target potential purchasers, may increase the cost of operating our business and lead to a decline in revenues. In addition, legal uncertainties about the legality of cookies and other tracking technologies may increase regulatory scrutiny and increase potential civil liability under data protection or consumer protection laws.
Compliance with existing, not yet effective, and proposed privacy and data protection laws and regulations can be costly and can delay or impede our ability to market and sell our products, impede our ability to conduct business through websites we and our partners may operate, change and limit the way we use consumer information in operating our business, cause us to have difficulty maintaining a single operating model, result in negative publicity, increase our operating costs, require significant management time and attention, or subject us to inquiries or investigations, claims or other remedies, including significant fines and penalties or demands that we modify or cease existing business practices. In addition, if our privacy or data security measures fail to comply with applicable current or future laws and regulations, we may be subject to litigation, regulatory investigations, enforcement notices requiring us to change the way we use personal data or our marketing practices, fines or other liabilities, as well as negative publicity and a potential loss of business.
Failure to comply with the U.S. Foreign Corrupt Practices Act, other applicable anti-corruption and anti-bribery laws, and applicable trade control laws could subject us to penalties and other adverse consequences.
We currently source and manufacture substantially all of our products from third-party suppliers and manufacturers in China, and we have an office in China from which we manage our supply chain. We sell our products in several countries outside of the United States, primarily through distributors. Our operations are subject to the U.S. Foreign Corrupt Practices Act (the “FCPA”), as well as the anti-corruption and anti-bribery laws in the countries where we do business. The FCPA prohibits covered parties from offering, promising, authorizing or giving anything of value, directly or indirectly, to a “foreign government official” with the intent of improperly influencing the official’s act or decision, inducing the official to act or refrain from acting in violation of lawful duty, or obtaining or retaining an improper business advantage. The FCPA also requires publicly traded companies to maintain records that accurately and fairly represent their transactions, and to have an adequate system of internal accounting controls. In addition, other applicable anti-corruption laws prohibit bribery of domestic government officials, and some laws that may apply to our operations prohibit commercial bribery, including giving or receiving improper payments to or from non-government parties, as well as so-called “facilitation” payments. In addition, we are subject to U.S. and other applicable trade control regulations that restrict with whom we may transact business, including the trade sanctions enforced by the U.S. Treasury, Office of Foreign Assets Control (OFAC).
While we have implemented policies, internal controls and other measures reasonably designed to promote compliance with applicable anti-corruption and anti-bribery laws and regulations, and certain safeguards designed to ensure compliance with U.S. trade control laws, our employees or agents may engage in improper conduct for which we might be held responsible. Any violations of these anti-corruption or trade controls laws, or even allegations of such violations, can lead to an investigation and/or enforcement action, which could disrupt our operations, involve significant management distraction, and lead to significant costs and expenses, including legal fees. If we, or our employees or agents acting on our behalf, are found to have engaged in practices that violate these laws and regulations, we could suffer severe fines and penalties, profit disgorgement, injunctions on future conduct, securities litigation, bans on transacting government business, delisting from securities exchanges and other consequences that may have a material adverse effect on our business, financial condition and results of operations. In addition, our brand and reputation, our sales activities or our stock price could be adversely affected if we become the subject of any negative publicity related to actual or potential violations of anti-corruption, anti-bribery or trade control laws and regulations.
Government regulation of the Internet and e-commerce is evolving, and unfavorable changes or failure by us to comply with these regulations could substantially harm our business, financial condition and results of operations.
We are subject to general business regulations and laws as well as regulations and laws specifically governing the Internet and e-commerce. Existing and future regulations and laws could impede the growth of the Internet, e-commerce or mobile commerce. These regulations and laws may involve taxes, tariffs, privacy and data security, anti-spam, content protection, electronic contracts and communications, consumer protection, social media marketing, third-party cookies, web beacons and similar technology for online behavioral advertising and gift cards. It is not clear how existing laws governing
25
issues such as property ownership, sales and other taxes and consumer privacy apply to the Internet as the vast majority of these laws were adopted prior to the advent of the Internet and do not contemplate or address the unique issues raised by the Internet or e-commerce. It is possible that general business regulations and laws, or those specifically governing the Internet or e-commerce, may be interpreted and applied in a manner that is inconsistent from one jurisdiction to another and may conflict with other rules or our practices. We cannot be sure that our practices have complied, comply or will comply fully with all such laws and regulations. Any failure, or perceived failure, by us to comply with any of these laws or regulations could result in damage to our reputation, a loss in business and proceedings or actions against us by governmental entities or others. Any such proceeding or action could hurt our reputation, force us to spend significant amounts in defense of these proceedings, distract our management, increase our costs of doing business and decrease the use of our sites by consumers and suppliers and may result in the imposition of monetary liability. We may also be contractually liable to indemnify and hold harmless third parties from the costs or consequences of non-compliance with any such laws or regulations. In addition, it is possible that governments of one or more countries may seek to censor content available on our sites or may even attempt to completely block access to our sites. Adverse legal or regulatory developments could substantially harm our business. In particular, in the event that we are restricted, in whole or in part, from operating in one or more countries, our ability to retain or increase our consumer base may be adversely affected, and we may not be able to maintain or grow our net sales and expand our business as anticipated.
We are involved, and may become involved in the future, in disputes and other legal or regulatory proceedings that, if adversely decided or settled, could materially and adversely affect our business, financial condition and results of operations.
We are, and may in the future become, party to litigation, regulatory proceedings or other disputes. In general, claims made by or against us in disputes and other legal or regulatory proceedings can be expensive and time consuming to bring or defend against, requiring us to expend significant resources and divert the efforts and attention of our management and other personnel from our business operations. These potential claims include, but are not limited to, personal injury claims, class action lawsuits, intellectual property claims, employment litigation and regulatory investigations and causes of action relating to the advertising and promotional claims about our products. Any adverse determination against us in these proceedings, or even the allegations contained in the claims, regardless of whether they are ultimately found to be without merit, may also result in settlements, injunctions or damages that could have a material adverse effect on our business, financial condition and results of operations.
We may be required to recall products and may face product liability claims, either of which could result in unexpected costs and damage our reputation.
We sell products for human use. Our products intended for use as cosmetics or skin care are not generally subject to pre-market approval or registration processes, so we cannot rely upon a government safety panel to qualify or approve our products for use. A product may be safe for the general population when used as directed but could cause an adverse reaction for a person who has a health condition or allergies, or who is taking a prescription medication. While we include what we believe are adequate instructions and warnings and we have historically had low numbers of reported adverse reactions, previously unknown adverse reactions could occur. If we discover that any of our products are causing adverse reactions, we could suffer adverse publicity or regulatory/government sanctions.
Potential product liability risks may arise from the testing, manufacture and sale of our products, including that the products fail to meet quality or manufacturing specifications, contain contaminants, include inadequate instructions as to their proper use, include inadequate warnings concerning side effects and interactions with other substances or for persons with health conditions or allergies, or cause adverse reactions or side effects. Product liability claims could increase our costs, and adversely affect our business, financial condition and results of operations. As we continue to offer an increasing number of new products, our product liability risk may increase. It may be necessary for us to recall products that do not meet approved specifications or because of the side effects resulting from the use of our products, which would result in adverse publicity, potentially significant costs in connection with the recall and could have a material adverse effect on our business, financial condition and results of operations.
In addition, plaintiffs in the past have received substantial damage awards from other cosmetic and drug companies based upon claims for injuries allegedly caused by the use of their products. Although we currently maintain general liability insurance, any claims brought against us may exceed our existing or future insurance policy coverage or limits. Any judgment against us that is in excess of our policy coverage or limits would have to be paid from our cash reserves, which would reduce our capital resources. In addition, we may be required to pay higher premiums and accept higher deductibles in order to secure adequate insurance coverage in the future. Further, we may not have sufficient capital resources to pay a
26
judgment, in which case our creditors could levy against our assets. Any product liability claim or series of claims brought against us could harm our business significantly, particularly if a claim were to result in adverse publicity or damage awards outside or in excess of our insurance policy limits.
Our business could be negatively impacted by corporate citizenship and sustainability matters.
There is an increased focus from certain investors, customers, consumers, employees, and other stakeholders concerning corporate citizenship and sustainability matters. From time to time, we may announce certain initiatives, including goals, regarding our focus areas, which include environmental matters, packaging, responsible sourcing and social investments. We could fail, or be perceived to fail, in our achievement of such initiatives or goals, or we could fail in accurately reporting our progress on such initiatives and goals. In addition, we could be criticized for the scope of such initiatives or goals or perceived as not acting responsibly in connection with these matters. Any such matters, or related corporate citizenship and sustainability matters, could have a material adverse effect on our business.
If we are unable to protect our intellectual property the value of our brand and other intangible assets may be diminished, and our business may be adversely affected.
We rely on trademark, copyright, trade secret, patent and other laws protecting proprietary rights, nondisclosure and confidentiality agreements and other practices, to protect our brand and proprietary information, technologies and processes. Our principal intellectual property assets include the registered trademarks “e.l.f.,” “e.l.f. eyes lips face,” and “W3LL PEOPLE.” Our trademarks are valuable assets that support our brand and consumers’ perception of our products. Although we have existing and pending trademark registrations for our brand in the United States and in many of the foreign countries in which we operate, we may not be successful in asserting trademark or trade name protection in all jurisdictions. We also have not applied for trademark protection in all relevant foreign jurisdictions and cannot assure you that our pending trademark applications will be approved. Third parties may also attempt to register our trademarks abroad in jurisdictions where we have not yet applied for trademark protection, oppose our trademark applications domestically or abroad, or otherwise challenge our use of the trademarks. In the event that our trademarks are successfully challenged, we could be forced to rebrand our products in some parts of the world, which could result in the loss of brand recognition and could require us to devote resources to advertising and marketing new brands.
We have limited patent protection, which limits our ability to protect our products from competition. We primarily rely on know-how to protect our products. It is possible that others will independently develop the same or similar know-how, which may allow them to sell products similar to ours. If others obtain access to our know-how, our confidentiality agreements may not effectively prevent disclosure of our proprietary information, technologies and processes and may not provide an adequate remedy in the event of unauthorized use of such information, which could harm our competitive position.
The efforts we have taken to protect our proprietary rights may not be sufficient or effective. In addition, effective trademark, copyright, patent and trade secret protection may be unavailable or limited for certain of our intellectual property in some foreign countries. Other parties may infringe our intellectual property rights and may dilute our brand in the marketplace. We may need to engage in litigation or other activities to enforce our intellectual property rights, to protect our trade secrets or to determine the validity and scope of proprietary rights of others. Any such activities could require us to expend significant resources and divert the efforts and attention of our management and other personnel from our business operations. If we fail to protect our intellectual property or other proprietary rights, our business, financial condition and results of operations may be materially and adversely affected.
Our success depends on our ability to operate our business without infringing, misappropriating or otherwise violating the trademarks, patents, copyrights and other proprietary rights of third parties.
Our commercial success depends in part on our ability to operate without infringing, misappropriating or otherwise violating the trademarks, patents, copyrights, trade secrets and other proprietary rights of others. We cannot be certain that the conduct of our business does not and will not infringe, misappropriate or otherwise violate such rights. From time to time we receive allegations of trademark or patent infringement and third parties have filed claims against us with allegations of intellectual property infringement. In addition, third parties may involve us in intellectual property disputes as part of a business model or strategy to gain competitive advantage.
To the extent we gain greater visibility and market exposure as a public company or otherwise, we may also face a greater risk of being the subject of such claims and litigation. For these and other reasons, third parties may allege that our
27
products or activities infringe, misappropriate, dilute or otherwise violate their trademark, patent, copyright or other proprietary rights. Defending against allegations and litigation could be expensive, occupy significant amounts of time, divert management’s attention from other business concerns and have an adverse impact on our ability to bring products to market. In addition, if we are found to infringe, misappropriate, dilute or otherwise violate third-party trademark, patent, copyright or other proprietary rights, our ability to use brands to the fullest extent we plan may be limited, we may need to obtain a license, which may not be available on commercially reasonable terms, or at all, or we may need to redesign or rebrand our marketing strategies or products, which may not be possible.
We may also be required to pay substantial damages or be subject to an order prohibiting us and our retail customers from importing or selling certain products or engaging in certain activities. Our inability to operate our business without infringing, misappropriating or otherwise violating the trademarks, patents, copyrights and proprietary rights of others could have a material adverse effect on our business, financial condition and results of operations.
Use of social media may materially and adversely affect our reputation or subject us to fines or other penalties.
We rely to a large extent on our online presence to reach consumers, and we offer consumers the opportunity to rate and comment on our products on our e-commerce websites. Negative commentary or false statements regarding us or our products may be posted on our e-commerce websites or social media platforms and may be adverse to our reputation or business. Our target consumers often value readily available information and often act on such information without further investigation and without regard to its accuracy. The harm may be immediate without affording us an opportunity for redress or correction. In addition, we may face claims relating to information that is published or made available through the interactive features of our e-commerce websites. For example, we may receive third-party complaints that the comments or other content posted by users on our platforms infringe third-party intellectual property rights or otherwise infringe the legal rights of others. While the Communications Decency Act (CDA) and Digital Millennium Copyright Act (DMCA) generally protect online service providers from claims of copyright infringement or other legal liability for the self-directed activities of its users, if it were determined that we did not meet the relevant safe harbor requirements under either law, we could be exposed to claims related to advertising practices, defamation, intellectual property rights, rights of publicity and privacy, and personal injury torts. We could incur significant costs investigating and defending such claims and, if we are found liable, significant damages. If any of these events occur, our business, financial condition and results of operations could be materially and adversely affected.
We also use third-party social media platforms as marketing tools. For example, we maintain Snapchat, Facebook, TikTok, Twitter, Pinterest, Instagram and YouTube accounts. As e-commerce and social media platforms continue to rapidly evolve, we must continue to maintain a presence on these platforms and establish presences on new or emerging popular social media platforms. If we are unable to cost-effectively use social media platforms as marketing tools, our ability to acquire new consumers and our financial condition may suffer. Furthermore, as laws and regulations rapidly evolve to govern the use of these platforms and devices, the failure by us, our employees or third parties acting at our direction to abide by applicable laws and regulations in the use of these platforms and devices could subject us to regulatory investigations, class action lawsuits, liability, fines or other penalties and have a material adverse effect on our business, financial condition and result of operations.
In addition, an increase in the use of social media for product promotion and marketing may cause an increase in the burden on us to monitor compliance of such materials and increase the risk that such materials could contain problematic product or marketing claims in violation of applicable regulations.
Our business relies heavily on email and other messaging services, and any restrictions on the sending of emails or messages or an inability to timely deliver such communications could materially adversely affect our net revenue and business.
Our business is highly dependent upon email and other messaging services for promoting our brand, products and e-commerce platforms. We provide emails and “push” communications to inform consumers of new products, shipping specials and other promotions. We believe these messages are an important part of our consumer experience. If we are unable to successfully deliver emails or other messages to our subscribers, or if subscribers decline to open or read our messages, our business, financial condition and results of operations may be materially adversely affected. Changes in how web and mail services block, organize and prioritize email may reduce the number of subscribers who receive or open our emails. For example, Google’s Gmail service has a feature that organizes incoming emails into categories (for example, primary, social and promotions). Such categorization or similar inbox organizational features may result in our emails being delivered in a less prominent location in a subscriber’s inbox or viewed as “spam” by our subscribers and may reduce the
28
likelihood of that subscriber reading our emails. Actions by third parties to block, impose restrictions on or charge for the delivery of emails or other messages could also adversely impact our business. From time to time, Internet service providers or other third parties may block bulk email transmissions or otherwise experience technical difficulties that result in our inability to successfully deliver emails or other messages to consumers.
Changes in the laws or regulations that limit our ability to send such communications or impose additional requirements upon us in connection with sending such communications would also materially adversely impact our business. For example, electronic marketing and privacy requirements in the European Union are highly restrictive and differ greatly from those in the U.S. which could cause fewer of individuals in the European Union to subscribe to our marketing messages and drive up our costs and risk of regulatory oversight and fines if we are found to be non-compliant.
Our use of email and other messaging services to send communications to consumers may also result in legal claims against us, which may cause us increased expenses, and if successful might result in fines and orders with costly reporting and compliance obligations or might limit or prohibit our ability to send emails or other messages. We also rely on social networking messaging services to send communications and to encourage consumers to send communications. Changes to the terms of these social networking services to limit promotional communications, any restrictions that would limit our ability or our consumers’ ability to send communications through their services, disruptions or downtime experienced by these social networking services or decline in the use of or engagement with social networking services by consumers could materially and adversely affect our business, financial condition and operating results.
Actions of activist stockholders could be costly and time-consuming, divert management’s attention and resources, and have an adverse effect on our business.
Marathon Partners Equity Management, LLC and its affiliates (“Marathon”) disclosed in its most recent Schedule 13D, filed on May 4, 2020, that it beneficially owned approximately 5.2% of our common stock as of that date. Marathon has communicated its opinions regarding opportunities and actions that it believes would increase value to our stockholders. While we value open dialogue and input from our stockholders, Marathon (or other activist stockholders) could take actions that could be costly and time-consuming to us, disrupt our operations, and divert the attention of our board of directors, management, and employees, such as public proposals and requests for potential nominations of candidates for election to our board of directors, requests to pursue a strategic combination or other transaction, or other special requests. As a result, we have retained, and may in the future retain additional services of various professionals to advise us in these matters, including legal, financial, and communications advisers, the costs of which may negatively impact our future financial results. In addition, perceived uncertainties as to our future direction, strategy, or leadership created as a consequence of activist stockholder initiatives may result in the loss of potential business opportunities, harm our ability to attract new or retain existing investors, customers, directors, employees, or other partners, and cause our stock price to experience periods of volatility or stagnation.
Volatility in the financial markets could have a material adverse effect on our business.
While we currently generate cash flows from our ongoing operations and have had access to credit markets through our various financing activities, credit markets may experience significant disruptions. Deterioration in global financial markets could make future financing difficult or more expensive. If any financial institution party to our credit facilities or other financing arrangements were to declare bankruptcy or become insolvent, they may be unable to perform under their agreements with us. This could leave us with reduced borrowing capacity, which could have a material adverse effect on our business, financial condition and results of operations.
Fluctuations in currency exchange rates may negatively affect our financial condition and results of operations.
Exchange rate fluctuations may affect the costs that we incur in our operations. The main currencies to which we are exposed are the Chinese renminbi ("RMB"), the British pound and the Canadian dollar. The exchange rates between these currencies and the U.S. dollar in recent years have fluctuated significantly and may continue to do so in the future. A depreciation of these currencies against the U.S. dollar will decrease the U.S. dollar equivalent of the amounts derived from foreign operations reported in our consolidated financial statements, and an appreciation of these currencies will result in a corresponding increase in such amounts. The cost of certain items, such as raw materials, manufacturing, employee salaries and transportation and freight, required by our operations may be affected by changes in the value of the relevant currencies. To the extent that we are required to pay for goods or services in foreign currencies, the appreciation of such currencies against the U.S. dollar will tend to negatively affect our business. There can be no assurance that foreign currency fluctuations will not have a material adverse effect on our business, financial condition and results of operations.
29
An active trading market for our common stock may not be sustained, and the market price of shares of our common stock may be volatile, which could cause the value of your investment to decline.
Although our common stock is listed on the NYSE, there can be no assurances that an active trading market for our common stock will be sustained. In the absence of an active trading market for our common stock, stockholders may not be able to sell their common stock at the time or price they would like to sell.
Even if an active trading market is sustained, the market price of our common stock may be highly volatile and could be subject to wide fluctuations. Securities markets often experience significant price and volume fluctuations. This market volatility, as well as general economic, market or political conditions, could reduce the market price of shares of our common stock in spite of our operating performance. In addition, our results of operations could be below the expectations of public market analysts and investors due to a number of potential factors, including variations in our quarterly results of operations, additions or departures of key management personnel, changes in consumer preferences or beauty trends, announcements of new products or significant price reductions by our competitors, failure to meet analysts’ earnings estimates, publication of research reports about our industry, litigation and government investigations, changes or proposed changes in laws or regulations or differing interpretations or enforcement thereof affecting our business, adverse market reaction to any indebtedness we may incur or securities we may issue in the future, changes in market valuations of similar companies or speculation in the press or investment community, announcements by our competitors of significant contracts, acquisitions, dispositions, strategic partnerships, joint ventures or capital commitments, adverse publicity about our industry, the level of success of releases of new products and the number of stores we open, close or convert in any period, and in response the market price of shares of our common stock could decrease significantly.
In addition, in May 2019, we announced that our board of directors authorized a share repurchase program allowing us to repurchase up to $25 million of our outstanding shares of common stock (“Share Repurchase Program”). Purchases under the Share Repurchase Program may be made from time to time in the open market, in privately negotiated transactions or otherwise. The timing and amount of any repurchases pursuant to the Share Repurchase Program will be determined based on market conditions, share price and other factors. The Share Repurchase Program may be suspended or discontinued at any time and there is no guarantee that any shares will be purchased under the Share Repurchase Program.
In the past, following periods of volatility in the overall market and the market price of a company’s securities, securities class action litigation has often been instituted against these companies. This litigation, if instituted against us, could result in substantial costs and a diversion of our management’s attention and resources.
Because we have no current plans to pay cash dividends on our common stock, stockholders may not receive any return on investment unless they sell our common stock for a price greater than that which they paid for it.
We have no current plans to pay cash dividends on our common stock. The declaration, amount and payment of any future dividends will be at the sole discretion of our board of directors. Our board of directors may take into account general and economic conditions, our financial condition and results of operations, our available cash and current and anticipated cash needs, capital requirements, contractual, legal, tax and regulatory restrictions and implications on the payment of dividends by us to our stockholders or by our subsidiaries to us, including restrictions under the Credit Agreement and other indebtedness we may incur, and such other factors as our board of directors may deem relevant.
Stockholders may be diluted by the future issuance of additional common stock in connection with our incentive plans, acquisitions or otherwise.
We had approximately 200.0 million shares of common stock authorized but unissued and
50,009,051
shares of common stock outstanding as of
May 15, 2020
. Our amended and restated certificate of incorporation authorizes us to issue these shares of common stock and stock options exercisable for common stock (and other equity awards) for the consideration and on the terms and conditions established by our board of directors in its sole discretion, whether in connection with acquisitions or otherwise. Any common stock that we issue, including under our existing equity incentive plans or any additional equity incentive plans that we may adopt in the future, would dilute the percentage ownership held by existing investors.
Future sales, or the perception of future sales, by us or our stockholders in the public market could cause the market price for our common stock to decline.
The sale of substantial amounts of shares of our common stock in the public market, or the perception that such sales could occur could harm the prevailing market price of shares of our common stock. These sales, or the possibility that
30
these sales may occur, also might make it more difficult for us to sell equity securities in the future at a time and at a price that we deem appropriate.
The holders of up to 13,103,905 shares of our common stock, or approximately 26% of our outstanding common stock based on shares outstanding as of
May 15, 2020
, are entitled to rights with respect to registration of such shares under the Securities Act pursuant to a registration rights agreement. In addition, each of TPG Growth II Advisors, Inc., J.A. Cosmetics Corp. (an affiliate of our founders) and certain family trusts of our Chairman and Chief Executive Officer, Tarang Amin, have the right, subject to certain conditions, to require us to file registration statements covering its or their shares or to include its or their shares in registration statements that we may file.
In addition, all the shares of common stock subject to stock options and restricted stock units and shares of restricted stock awards outstanding and reserved under our 2014 Equity Incentive Plan, our 2016 Equity Incentive Award Plan and our 2016 Employee Stock Purchase Plan have been registered on Form S-8 under the Securities Act and such shares, once the underlying equity award vests, will be eligible for sale in the public markets, subject to Rule 144 limitations applicable to affiliates. We intend to file one or more registration statements on Form S-8 to cover additional shares of our common stock or securities convertible into or exchangeable for shares of our common stock pursuant to automatic increases in the number of shares reserved under our 2016 Equity Incentive Award Plan and our 2016 Employee Stock Purchase Plan. Accordingly, shares registered under these registration statements on Form S-8 will be available for sale in the open market.
As restrictions on resale end, the market price of shares of our common stock could drop significantly if the holders of these restricted shares sell them or are perceived by the market as intending to sell them. These factors could also make it more difficult for us to raise additional funds through future offerings of shares of our common stock or other securities.
If securities analysts do not publish research or publish inaccurate or unfavorable research about our business, our stock price and trading volume could decline.
The trading market for our common stock depends in part on the research and reports that securities or industry analysts publish about us or our business. If one or more of the analysts who cover us downgrade our stock or publish inaccurate or unfavorable research about our business, our stock price would likely decline. If one or more of these analysts cease coverage of our company or fail to publish reports on us regularly, demand for our stock could decrease, which might cause our stock price and trading volume to decline.
Anti-takeover provisions in our organizational documents and Delaware law might discourage or delay acquisition attempts for us that stockholders might consider favorable.
Our amended and restated certificate of incorporation and amended and restated bylaws contain provisions that may make the acquisition of our company more difficult without the approval of our board of directors. Among other things:
|
•
|
although we do not have a stockholder rights plan, these provisions allow us to authorize the issuance of undesignated preferred stock in connection with a stockholder rights plan or otherwise, the terms of which may be established and the shares of which may be issued without stockholder approval, and which may include super voting, special approval, dividend or other rights or preferences superior to the rights of the holders of common stock;
|
|
•
|
these provisions provide for a classified board of directors with staggered three-year terms;
|
|
•
|
these provisions require advance notice for nominations of directors by stockholders and for stockholders to include matters to be considered at our annual meetings;
|
|
•
|
these provisions prohibit stockholder action by written consent;
|
|
•
|
these provisions provide for the removal of directors only for cause and only upon affirmative vote of holders of at least 75% of the shares of common stock entitled to vote generally in the election of directors; and
|
|
•
|
these provisions require the amendment of certain provisions only by the affirmative vote of at least 75% of the shares of common stock entitled to vote generally in the election of directors.
|
Further, as a Delaware corporation, we are also subject to provisions of Delaware law, which may impair a takeover attempt that our stockholders may find beneficial. These anti-takeover provisions and other provisions under
31
Delaware law could discourage, delay or prevent a transaction involving a change in control of our company, including actions that our stockholders may deem advantageous, or negatively affect the trading price of our common stock. These provisions could also discourage proxy contests and make it more difficult for other stockholders to elect directors of their choosing and to cause us to take other corporate actions they may desire.
We are an emerging growth company, and we cannot be certain if the reduced disclosure requirements applicable to emerging growth companies will make our common stock less attractive to investors.
We qualify as an emerging growth company as defined in the JOBS Act. As a result, we are permitted to, and do, rely on exemptions from certain disclosure requirements that are applicable to other companies that are not emerging growth companies. Accordingly, for so long as we are an emerging growth company, we will not be required to:
|
•
|
engage an independent registered public accounting firm to report on our internal controls over financial reporting pursuant to Section 404(b) of the Sarbanes-Oxley Act of 2002 (the “Sarbanes-Oxley Act”);
|
|
•
|
comply with any requirement that may be adopted by the PCAOB, regarding mandatory audit firm rotation or a supplement to the independent registered public accounting firm’s report providing additional information about the audit and the financial statements (i.e., an auditor discussion and analysis);
|
|
•
|
submit certain executive compensation matters to stockholder advisory votes, such as “say-on-pay,” “say-on-frequency” and “say-on-golden parachutes;” or
|
|
•
|
disclose certain executive compensation related items such as the correlation between executive compensation and performance and comparisons of the chief executive officer’s compensation to median employee compensation.
|
We have opted out of the extended transition period to us available under Section 102(b)(1) of the JOBS Act with respect to new or revised accounting standards and, as a result, we comply with any such new or revised accounting standards on the relevant dates on which adoption of such standards is required for non-emerging growth companies.
We will remain an emerging growth company until March 31, 2022 (the fiscal year-end following the fifth anniversary of the completion of our initial public offering), though we may cease to be an emerging growth company earlier under certain circumstances, including (i) if we become a large accelerated filer, (ii) if our gross annual revenue exceeds $1.07 billion in any fiscal year or (iii) if we issue more than $1 billion in non-convertible notes in any three-year period.
We cannot provide any assurances that we will be able to take advantage of all of the benefits of the JOBS Act. In addition, investors may find our common stock less attractive if we rely on the exemptions and relief granted by the JOBS Act. If some investors find our common stock less attractive as a result, there may be a less active trading market for our common stock and our stock price may decline and/or become more volatile.
We may incur increased costs and may become subject to additional regulations and requirements, and our management may be required to devote substantial time to new compliance matters when we cease to qualify as an emerging growth company.
As noted above, we qualify as an emerging growth company as defined in the JOBS Act. When we cease to be an emerging growth company, we will be unable to continue to take advantage of cost savings associated with the JOBS Act and will be subject to additional regulations and requirements. If these requirements divert the attention of our management and personnel from other business concerns, they could have a material adverse effect on our business, financial condition and results of operations. The increased costs will decrease our net income or increase our net loss and may require us to reduce costs in other areas of our business or increase the prices of our products or services. We cannot predict or estimate the amount or timing of additional costs we may incur to respond to these requirements. Furthermore, if we are unable to satisfy our obligations as a non-emerging growth company, we could be subject to delisting of our common stock, fines, sanctions and other regulatory action and potentially civil litigation.
Our board of directors is authorized to issue and designate shares of our preferred stock in additional series without stockholder approval.
Our amended and restated certificate of incorporation authorizes our board of directors, without the approval of our stockholders, to issue up to 30 million shares of our preferred stock, subject to limitations prescribed by applicable law,
32
rules and regulations and the provisions of our amended and restated certificate of incorporation, as shares of preferred stock in series, to establish from time to time the number of shares to be included in each such series and to fix the designation, powers, preferences and rights of the shares of each such series and the qualifications, limitations or restrictions thereof. The powers, preferences and rights of these additional series of preferred stock may be senior to or on parity with our common stock, which may reduce its value.
Our amended and restated certificate of incorporation and amended and restated bylaws provide that the Court of Chancery of the State of Delaware will be the exclusive forum for substantially all disputes between us and our stockholders, which could limit our stockholders’ ability to obtain a favorable judicial forum for disputes with us or our directors, officers or employees.
Our amended and restated certificate of incorporation and amended and restated bylaws provide that the Court of Chancery of the State of Delaware is the exclusive forum for any derivative action or proceeding brought on our behalf, any action asserting a breach of fiduciary duty, any action asserting a claim against us arising pursuant to the Delaware General Corporation Law, our amended and restated certificate of incorporation or our amended and restated bylaws, or any action asserting a claim against us that is governed by the internal affairs doctrine. This provision may limit a stockholder’s ability to bring a claim in a judicial forum that it finds favorable for disputes with us or our directors, officers or other employees, which may discourage such lawsuits against us and our directors, officers and other employees. Alternatively, if a court were to find this provision in our amended and restated certificate of incorporation and amended and restated bylaws to be inapplicable or unenforceable in an action, we may incur additional costs associated with resolving such action in other jurisdictions, which could adversely affect our business, financial condition and results of operations.
Item 1B. Unresolved staff comments.
None.
Item 2. Properties.
Our principal executive offices are located in Oakland, California. We also occupy offices, manufacturing facilities, distribution centers and retail store in the United States and abroad.
|
Location/Facility
|
Leased/Owned
|
Use
|
|
Oakland, California
|
Leased
|
Corporate headquarters
|
|
New York, New York
|
Leased
|
Corporate offices
|
|
Los Angeles, California
|
Leased
|
Corporate offices
|
|
Fairfield, New Jersey
|
Leased
|
Corporate offices
|
|
Shanghai, China
|
Leased
|
Corporate offices
|
|
Santa Fe, New Mexico
|
Leased
|
Corporate offices/distribution
|
|
Ontario, California
|
Leased
|
Distribution
|
|
Rancho Cucamonga, California
|
Leased
|
Manufacturing
|
|
Austin, Texas
|
Leased
|
Retail
|
We also use a distribution center located in Columbus, Ohio that is operated by a third-party.
Our properties total an aggregate of approximately
48,384
square feet of commercial space, approximately
25,350
square feet for manufacturing and approximately
212,668
square feet of commercial space for our distribution center.
All of our properties are leased. The leases expire at various times through
2030
, subject to renewal options. We consider our properties to be generally in good condition and believe that our existing facilities are adequate to support our existing operations.
Item 3. Legal proceedings.
33
We are from time to time subject to, and are presently involved in, litigation and other proceedings. We believe that there are no pending lawsuits or claims that, individually or in the aggregate, may have a material adverse effect on our business, financial condition or results of operations.
Item 4. Mine safety disclosures.
None.
34
PART II
Item 5. Market for registrant’s common equity, related stockholder matters and issuer purchases of equity securities.
Market information for common stock
Our common stock began trading on the NYSE under the symbol “ELF” on September 22, 2016. Prior to that date, there was no public trading market for our common stock. On
May 15, 2020
, the closing price for our common stock as reported by the NYSE was
$13.78
.
Holders of record
As of
May 15, 2020
, the approximate number of common stockholders of record was 17. This number does not include beneficial owners whose shares are held by nominees in street name.
Dividends
There were no dividends declared or paid during the year ended March 31, 2020. Since our initial public offering on
September 21, 2016
, we had never declared or paid cash dividends on our capital stock. We intend to retain all available funds and future earnings, if any, to fund the development and expansion of our business and we do not anticipate paying any additional cash dividends in the foreseeable future. In addition, our Credit Agreement limits our ability to pay dividends to our stockholders.
Any future determination related to dividend policy will be made at the discretion of our board of directors and will depend on a number of factors, including future earnings, capital requirements, financial conditions, future prospects, contractual restrictions and covenants and other factors that our board of directors may deem relevant.
Stock performance graph
The following performance graph and related information shall not be deemed “soliciting material” or to be “filed” with the SEC, nor shall such information be incorporated by reference into any future filing under the Securities Act of 1933 or the Exchange Act, each as amended, whether made before or after the date hereof and irrespective of any general incorporation language in any such filing, or otherwise subject to the liabilities under the Securities Act of 1933 or Exchange Act, each as amended, except to the extent that we specifically incorporate it by reference into such filing.
Set forth below is a graph comparing the total cumulative stockholder return on our common stock with the S&P 500 Stock Index and the S&P Consumer Discretionary Index for the period covering September 22, 2016, the first day of trading on the NYSE for our common stock, through the end of our fiscal year ended
March 31, 2020
. The graph assumes an investment of $100 made at the closing of trading on September 22, 2016 in (i) the Company's common stock, (ii) the stocks comprising the S&P 500 Index and (iii) stocks comprising the S&P 500 Consumer Discretionary Index. All values assume reinvestment of the full amount of all dividends. The performance shown on the graph below is not intended to forecast or be indicative of possible future performance of our common stock.
35
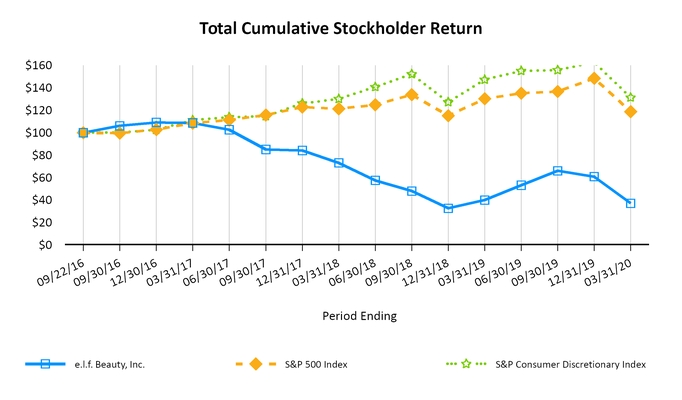
|
$100 investment in stock or index
|
9/22/16
|
9/30/16
|
12/31/16
|
3/31/17
|
6/30/17
|
9/30/17
|
12/31/17
|
3/31/18
|
6/30/18
|
9/30/18
|
12/31/18
|
3/31/19
|
6/30/19
|
9/30/19
|
12/31/19
|
3/31/20
|
||||||||||||||||||||||||||||||||
|
e.l.f. Beauty, Inc. (ELF)
|
$
|
100.00
|
|
$
|
106.11
|
|
$
|
109.21
|
|
$
|
108.68
|
|
$
|
102.68
|
|
$
|
85.09
|
|
$
|
84.19
|
|
$
|
73.09
|
|
$
|
57.51
|
|
$
|
48.04
|
|
$
|
32.68
|
|
$
|
40.00
|
|
$
|
53.21
|
|
$
|
66.08
|
|
$
|
60.87
|
|
$
|
37.13
|
|
|
S&P 500 Index (GSPC)
|
$
|
100.00
|
|
$
|
99.59
|
|
$
|
102.83
|
|
$
|
108.52
|
|
$
|
111.31
|
|
$
|
115.72
|
|
$
|
122.80
|
|
$
|
121.30
|
|
$
|
124.86
|
|
$
|
133.84
|
|
$
|
115.14
|
|
$
|
130.19
|
|
$
|
135.12
|
|
$
|
136.72
|
|
$
|
148.39
|
|
$
|
118.71
|
|
|
S&P 500 Consumer Discretionary Index (S5COND)
|
$
|
100.00
|
|
$
|
100.23
|
|
$
|
102.54
|
|
$
|
111.21
|
|
$
|
113.82
|
|
$
|
114.78
|
|
$
|
126.10
|
|
$
|
130.01
|
|
$
|
140.63
|
|
$
|
152.13
|
|
$
|
127.15
|
|
$
|
147.15
|
|
$
|
154.92
|
|
$
|
155.71
|
|
$
|
162.68
|
|
$
|
131.30
|
|
Recent sales of unregistered securities
None
Purchases of equity securities by the issuer and affiliated purchasers
The following table presents share repurchase activity by the Company during the
three
months ended
March 31, 2020
. These purchases were made pursuant to a trading plan meeting the requirements of Rule 10b5-1 under the Exchange Act
.
|
Period
|
Total number of shares purchased
(1)
|
Average price paid per share
|
Total number of shares purchased as part of publicly announced programs
(1)
|
Maximum approximate dollar value of shares that may yet be purchased under the plans or programs
(1)
|
||||||||||
|
January 1 - 31, 2020
|
21,342
|
|
$
|
15.39
|
|
21,342
|
|
$
|
21,120,707
|
|
||||
|
February 1 - 29, 2020
|
4,462
|
|
17.52
|
|
4,462
|
|
21,042,525
|
|
||||||
|
March 1 - 31, 2020
|
299,901
|
|
13.22
|
|
299,901
|
|
$
|
17,079,052
|
|
|||||
|
325,705
|
|
$
|
13.42
|
|
325,705
|
|
|
|||||||
_________________
|
(1)
|
On May 8, 2019, we announced that our board of directors authorized the Share Repurchase Program, which authorizes us to repurchase up to $25 million of our outstanding shares of common stock. The Share Repurchase Plan remains in effect through the earlier of (i) the date that $25 million of our outstanding common stock has been purchased under the Share Repurchase Plan or (ii) the date that our board of directors cancels the Share Repurchase Plan.
|
|
36
Item 6. Selected financial data.
The following table presents our selected consolidated financial data for the periods and as of the dates indicated. The following financial information should be read in conjunction with Item 7 “Management’s discussion and analysis of financial condition and results of operations” and our audited consolidated financial statements and the related notes thereto included elsewhere in this Annual Report.
|
(dollars in thousands, except share
and per share amounts)
|
Year ended March 31, 2020
|
Three months ended March 31, 2019
(transition period)
|
Year ended
December 31, 2018
|
Year ended
December 31, 2017
|
Year ended
December 31, 2016
|
Year ended
December 31, 2015
|
|||||||||||||||||
|
Statement of operations data:
|
|
|
|||||||||||||||||||||
|
Net sales
|
$
|
282,851
|
|
$
|
66,141
|
|
$
|
267,435
|
|
$
|
269,888
|
|
$
|
229,567
|
|
$
|
191,413
|
|
|||||
|
Gross profit
|
181,123
|
|
40,491
|
|
162,741
|
|
164,725
|
|
132,235
|
|
100,329
|
|
|||||||||||
|
Operating income (loss)
|
29,950
|
|
(19,009
|
)
|
26,162
|
|
33,279
|
|
23,079
|
|
25,571
|
|
|||||||||||
|
Other income (expense), net
|
426
|
|
(315
|
)
|
(390
|
)
|
(2,035
|
)
|
3,016
|
|
(4,172
|
)
|
|||||||||||
|
Interest expense, net
|
(6,307
|
)
|
(1,849
|
)
|
(7,816
|
)
|
(8,775
|
)
|
(16,283
|
)
|
(12,721
|
)
|
|||||||||||
|
Income (loss) before provision for income taxes
|
24,069
|
|
(21,173
|
)
|
17,956
|
|
22,469
|
|
9,812
|
|
8,678
|
|
|||||||||||
|
Income tax (provision) benefit
|
(6,185
|
)
|
3,259
|
|
(2,431
|
)
|
11,006
|
|
(4,499
|
)
|
(4,321
|
)
|
|||||||||||
|
Net income (loss)
|
$
|
17,884
|
|
$
|
(17,914
|
)
|
$
|
15,525
|
|
$
|
33,475
|
|
$
|
5,313
|
|
$
|
4,357
|
|
|||||
|
Net income (loss) per share - basic
|
$
|
0.37
|
|
$
|
(0.37
|
)
|
$
|
0.33
|
|
$
|
0.74
|
|
$
|
(39.47
|
)
|
$
|
(1,559.81
|
)
|
|||||
|
Net income (loss) per share - diluted
|
$
|
0.35
|
|
$
|
(0.37
|
)
|
$
|
0.32
|
|
$
|
0.68
|
|
$
|
(39.47
|
)
|
$
|
(1,559.81
|
)
|
|||||
|
Other data:
|
|
|
|||||||||||||||||||||
|
Depreciation and amortization
|
$
|
20,222
|
|
$
|
10,520
|
|
$
|
17,861
|
|
$
|
14,521
|
|
$
|
13,152
|
|
$
|
10,289
|
|
|||||
|
Capital expenditures
|
9,422
|
|
3,762
|
|
8,872
|
|
7,544
|
|
9,223
|
|
10,242
|
|
|||||||||||
|
(dollars in thousands)
|
March 31, 2020
|
March 31, 2019
|
December 31, 2018
|
December 31, 2017
|
December 31, 2016
|
December 31, 2015
|
|||||||||||||||||
|
Balance sheet data:
|
|
|
|||||||||||||||||||||
|
Cash and cash equivalents
|
$
|
46,167
|
|
$
|
53,874
|
|
$
|
51,205
|
|
$
|
10,059
|
|
$
|
15,295
|
|
$
|
14,004
|
|
|||||
|
Net working capital
(1)
|
35,070
|
|
38,265
|
|
47,523
|
|
62,224
|
|
29,339
|
|
10,860
|
|
|||||||||||
|
Property and equipment, net
|
17,171
|
|
16,006
|
|
21,804
|
|
18,037
|
|
17,151
|
|
9,854
|
|
|||||||||||
|
Total assets
|
453,104
|
|
431,688
|
|
435,856
|
|
417,244
|
|
414,729
|
|
361,072
|
|
|||||||||||
|
Finance leases
|
3,012
|
|
3,783
|
|
3,982
|
|
2,374
|
|
2,766
|
|
—
|
|
|||||||||||
|
Debt, including current maturities
(2)
|
135,644
|
|
144,501
|
|
146,402
|
|
153,974
|
|
162,061
|
|
144,919
|
|
|||||||||||
|
Total liabilities
|
210,933
|
|
216,473
|
|
206,525
|
|
223,381
|
|
273,867
|
|
224,175
|
|
|||||||||||
|
Convertible preferred stock
|
—
|
|
—
|
|
—
|
|
—
|
|
—
|
|
197,295
|
|
|||||||||||
|
Total stockholders' equity (deficit)
|
242,171
|
|
215,215
|
|
229,331
|
|
193,863
|
|
140,862
|
|
(60,398
|
)
|
|||||||||||
|
(1)
|
Net working capital is defined as current assets, excluding cash and cash equivalents, minus current liabilities.
|
|
(2)
|
Total bank debt, including current maturities, is net of
$0.2 million
,
$0.3 million
, $0.3 million, $0.4 million, $0.6 million, and $3.2 million of debt issuance costs as of
March 31, 2020
, March 31, 2019, December 31,
2018
,
2017
,
2016
, and
2015
, respectively.
|
37
Item 7. Management’s discussion and analysis of financial condition and results of operations.
You should read the following discussion and analysis of our financial condition and results of operations together with “Selected financial data” and our consolidated financial statements and related notes thereto included elsewhere in this Annual Report.
Overview
We sell cosmetics, skin care and related beauty tools under the e.l.f. Cosmetics and W3LL PEOPLE brands. e.l.f. Cosmetics makes the best of beauty accessible to every eye, lip and face by offering high-quality cosmetics and skin care products at an extraordinary value, all formulated 100% vegan and cruelty-free. W3LL PEOPLE is a pioneer in clean beauty that offers accessible clean beauty products that work. Our portfolio spans the eyes, lips, face, kits, tools and skin care categories. We sell our products in national and international retailers and direct-to-consumer through our e-commerce channel. We believe the combination of our affordable price points and on-trend, innovative product assortment encourages trial, offers a strong value proposition and appeals to a broad base of consumers.
Our largest customers, Walmart and Target, accounted for
31%
and
22%
, respectively, of our net sales in fiscal
2020
. No other individual customer accounted for
10%
or more of the Company's net sales in fiscal
2020
. National and international retailers comprised
92%
of our net sales in fiscal
2020
. The remaining
8%
came from our direct-to-consumer e-commerce channels. We estimate our total digital sales, including retailer.coms, Amazon.com and other digital channels represented approximately
11%
of our total net sales in fiscal 2020.
The primary market for our products is the United States, which accounted for
90%
of our net sales in fiscal
2020
. The remaining
10%
was attributable to international markets, primarily Canada and the United Kingdom.
For additional information regarding our business, see Item 1, “Business.”
Components of our results of operations and trends affecting our business
Net sales
We develop, market and sell beauty products under the e.l.f. Cosmetics and W3LL PEOPLE brands. Our net sales are derived from sales of beauty products, net of provisions for sales discounts and allowances, product returns, markdowns and price adjustments.
Year over year changes in net sales is driven by a number of factors, including mass beauty category performance, levels of consumer spending, and our ability to drive awareness of and demand for our products. Within our existing retailer accounts, we are able to drive growth by expanding space and door penetration and increasing sales per linear foot, supported by our continued innovation, including our ability to introduce new first-to-mass products in our existing categories and new products in adjacent categories. While we have distribution with a number of key retail accounts, we expect to continue to grow through improved sales per linear foot in our existing space, expanded space allocation with our current retail accounts, as well as adding new retail customers.
Our results of operations and business face challenges and uncertainties, including our ability to introduce new products that will appeal to a broad consumer base, our ability to service demand, the ability of our major retail customers to drive traffic and keep products in stock, our ability to continue to grow our customer base and competitive threats from other beauty companies.
Gross profit
Gross profit is our net sales less cost of sales. Cost of sales includes the aggregate costs to procure our products, including the amounts invoiced by our third-party contract manufacturers for finished goods as well as costs related to transportation to our distribution center, customs and duties. Cost of sales also includes the effect of changes in the balance of reserves for excess and obsolete inventory. Gross margin measures our gross profit as a percentage of net sales.
We have an extensive network of third-party manufacturers in China where we purchase substantially all of our finished goods. We have worked to evolve our supply chain to increase capacity and technical capabilities while maintaining or reducing overall costs as a percentage of sales.
38
Historically, we have improved our gross margin largely through changes in our product mix, pricing, purchasing efficiencies and cost reductions in our supply chain, and expect to continue leveraging our innovation and sourcing capabilities in future periods. Other drivers of changes in gross margin include fluctuations in exchange rates, changes in customer mix, and changes in the balance of reserves for excess and obsolete inventory, among other things, which may offset the benefit of changes in pricing, product mix and cost reductions.
Selling, general and administrative
Our selling, general and administrative (“SG&A”) expenses primarily consist of personnel-related expenses, including salaries, bonuses, fringe benefits and stock-based compensation, marketing and digital expenses, warehousing and distribution costs, costs related to merchandising, depreciation of property and equipment, amortization of retail product displays and amortization of intangible assets. See “Critical Accounting Policies and Estimates-Stock-based Compensation” below for more detail regarding stock-based compensation.
In the near term, we expect to continue to invest in our growth initiatives, including investments in both the e.l.f. and W3LL PEOPLE brands and infrastructures. Over time, we expect our SG&A expenses to grow at a slower rate than our net sales as we leverage our past investments.
Interest expense, net
Interest expense primarily consists of cash interest and fees on our outstanding indebtedness. See “Financial condition, liquidity and capital resources” below and a description of our indebtedness in Note 10 to the Notes to consolidated financial statements in Item 15 “Exhibits, financial statement schedules”.
Other income (expense), net
Our purchases are largely in RMB, and, as such, we are exposed to periodic fluctuations in that currency. Other income (expense), net is primarily related to foreign exchange rate movements.
Income tax (provision) benefit
The provision for income taxes represents federal, foreign, state and local income taxes. The effective rate differs from statutory rates due to the effect of state and local income taxes and certain permanent tax adjustments. Our effective tax rate will change from quarter to quarter based on recurring and nonrecurring factors including, but not limited to, the geographical mix of earnings, enacted tax legislation, state and local income taxes, tax audit settlements, the interaction of various tax strategies and the impact of permanent tax adjustments, such as those related to stock based compensation.
On December 22, 2017, the 2017 Tax Act was signed into law making significant changes to the Internal Revenue Code of 1986, as amended. Changes included, but were not limited to, a reduction of the U.S. corporate tax rate from 35% to 21% effective January 1, 2018. The 2017 Tax Act also imposed a one-time transition tax on previously deferred foreign earnings. As of December 31, 2017, we completed our accounting for the tax effects of the 2017 Tax Act.
On March 27, 2020, the CARES Act was signed into law making several changes to the Internal Revenue Code. The changes include, but are not limited to, increasing the limitation on the amount of deductible interest expense, allowing companies to carryback certain net operating losses and increasing the amount of net operating loss carryforwards that corporations can use to offset taxable income. The tax law changes in the CARES Act did not have a material impact on the Company's income tax provision.
Net income (loss)
Our net income (loss) for future periods will be affected by the various factors described above.
39
Seasonality
Our results of operations are subject to seasonal fluctuations, with net sales in the third and fourth fiscal quarters typically being higher than in the first and second fiscal quarters. The higher net sales in our third and fourth fiscal quarters are largely attributable to the increased levels of purchasing by retailers for the holiday season, and customer shelf reset activities respectively. Lower holiday purchases or shifts in customer shelf reset activity could have a disproportionate effect on our results of operations for the entire fiscal year. To support anticipated higher sales during the third and fourth fiscal quarters, we make investments in working capital to ensure inventory levels can support demand. Fluctuations throughout the year are also driven by the timing of product restocking or rearrangement by our major retail customers as well as expansion into new retail customers. Because a limited number of our retail customers account for a large percentage of our net sales, a change in the order pattern of one or more of our large retail customers could cause a significant fluctuation of our quarterly results or impact our liquidity.
Business trends
Tariffs
Tariffs have impacted the majority of products that we import from China. Despite the signing of a Phase One trade agreement between the United States and China, the majority of our products remain impacted by increased tariffs. To mitigate the financial impact of these tariffs on our results of operations, we selectively increased prices on certain of our products in July 2019. We also implemented various other tariff mitigation initiatives including, but not limited to, negotiating lower prices with our suppliers in China and exploring potential new suppliers outside of China. In addition, favorable movements in foreign exchange rates and shifting product mix toward margin accretive innovation has also partially offset to the impact of the tariffs on our gross margin. We cannot provide any assurances that these mitigation initiatives will continue to be successful.
e.l.f store closing
In February 2019, we exited our stand-alone e.l.f. retail stores business (the “Restructuring Plan”). As part of the Restructuring Plan, we closed all 22 e.l.f. retail stores and implemented a workforce reduction of employees that managed and operated the e.l.f. retail stores. Refer to Note 15 to our consolidated financial statements in this Annual Report under the heading “Restructuring and other related costs” for further discussion of the Restructuring Plan.
Net sales associated with e.l.f. stores were
$1.9 million
,
$13.5 million
and
$13.2 million
during the transition period for the three months ended
March 31, 2019
, the years ended December 31,
2018
and
2017
, respectively.
COVID-19
On March 11, 2020, the World Health Organization declared COVID-19 a pandemic. The outbreak has spread globally and has led governments and other authorities around the world, including federal, state and local authorities in the United States, to impose measures intended to reduce its spread, including restrictions on freedom of movement and business operations such as travel bans, border closings, business limitations and closures (subject to exceptions for essential operations and businesses), quarantines and shelter-in-place orders.
As a result, we have seen a significant decline in retail sales due to the impact of the COVID-19 pandemic on consumer behavior. We anticipate our sales results to be negatively impacted until consumers return to normal shopping patterns. We have focused on the following areas as we assess and address the impact of the COVID-19 pandemic on our business:
Health and Safety of our People and Community
Our first priority is the safety and well-being of our employees. We have adopted for U.S. employees many of the protocols our team in China leveraged to address the pandemic, including sending safety kits to all employees and assisting with other needs. We have an extremely talented team and plan to protect as many jobs as possible during this time.
We are also caring for our consumer community. We have supported our community through donations to foodbanks, mental health organizations and healthcare workers. We also manufactured hand sanitizer, which has been shared with our employees and partners, and is being included with every order on elfcosmetics.com for a limited time.
Supply Chain and Distribution
40
Although our supply chain is largely based in China, during the COVID-19 outbreak in that country, our operations were minimally disrupted. As of today, our Chinese-based suppliers and employees are fully operational, and our supply chain is back to normal run rates. Our U.S. distribution centers are also fully operational, fulfilling national retailer and e-commerce orders. Moving forward, we will continue to work with our suppliers to closely manage inventory levels as we monitor the impact of COVID-19 on demand.
Cost Savings and Liquidity
We have taken a number of cost-saving measures to mitigate impact from COVID-19, including reducing expenses and scaling back marketing and digital investments in proportion to net sales. We also plan to reduce costs in the areas of merchandising, operations as well as capital expenditures, and are tightly managing receivables and inventory.
On April 8, 2020, we amended our Credit Agreement to provide greater flexibility with our quarterly maintenance covenants. We believe our liquidity is adequate. Between our cash balance and revolving credit facility, we have access to approximately $95 million in cash.
Results of operations
The following table sets forth our consolidated statements of operations data in dollars and as a percentage of net sales for the periods presented. Results for the twelve months ended March 31, 2019 were derived from our quarterly consolidated statements of operations as previously reported.
|
Year ended
March 31,
|
Twelve months ended March 31,
|
Year ended December 31,
|
|||||||||||||
|
2020
|
2019
|
2018
|
|
2017
|
|||||||||||
|
Net sales
|
$
|
282,851
|
|
$
|
267,656
|
|
$
|
267,435
|
|
$
|
269,888
|
|
|||
|
Cost of sales
|
101,728
|
|
104,632
|
|
104,694
|
|
105,163
|
|
|||||||
|
Gross profit
|
181,123
|
|
163,024
|
|
162,741
|
|
164,725
|
|
|||||||
|
Selling, general, and administrative expenses
|
157,155
|
|
137,669
|
|
136,579
|
|
131,446
|
|
|||||||
|
Restructuring (income) expense
|
(5,982
|
)
|
22,176
|
|
—
|
|
—
|
|
|||||||
|
Operating income (loss)
|
29,950
|
|
3,179
|
|
26,162
|
|
33,279
|
|
|||||||
|
Other income (expense), net
|
426
|
|
183
|
|
(390
|
)
|
(2,035
|
)
|
|||||||
|
Interest expense, net
|
(6,307
|
)
|
(7,702
|
)
|
(7,816
|
)
|
(8,775
|
)
|
|||||||
|
Income (loss) before provision for income taxes
|
24,069
|
|
(4,340
|
)
|
17,956
|
|
22,469
|
|
|||||||
|
Income tax (provision) benefit
|
(6,185
|
)
|
1,261
|
|
(2,431
|
)
|
11,006
|
|
|||||||
|
Net income (loss)
|
$
|
17,884
|
|
$
|
(3,079
|
)
|
$
|
15,525
|
|
$
|
33,475
|
|
|||
|
Comprehensive income (loss)
|
$
|
17,884
|
|
$
|
(3,079
|
)
|
$
|
15,525
|
|
$
|
33,475
|
|
|||
|
|
Year ended
March 31,
|
Twelve months ended March 31,
|
Year ended December 31,
|
||||||||
|
(percentage of net sales)
|
2020
|
2019
|
2018
|
2017
|
|||||||
|
Net sales
|
100
|
%
|
100
|
%
|
100
|
%
|
100
|
%
|
|||
|
Cost of sales
|
36
|
%
|
39
|
%
|
39
|
%
|
39
|
%
|
|||
|
Gross profit
|
64
|
%
|
61
|
%
|
61
|
%
|
61
|
%
|
|||
|
Selling, general, and administrative expenses
|
56
|
%
|
51
|
%
|
51
|
%
|
49
|
%
|
|||
|
Restructuring (income) expense
|
(2
|
)%
|
8
|
%
|
—
|
%
|
—
|
%
|
|||
|
Operating income
|
11
|
%
|
1
|
%
|
10
|
%
|
12
|
%
|
|||
|
Other expense, net
|
—
|
%
|
—
|
%
|
—
|
%
|
(1
|
)%
|
|||
|
Interest expense, net
|
(2
|
)%
|
(3
|
)%
|
(3
|
)%
|
(3
|
)%
|
|||
|
Income (loss) before provision for income taxes
|
9
|
%
|
(2
|
)%
|
7
|
%
|
8
|
%
|
|||
|
Income tax (provision) benefit
|
(2
|
)%
|
—
|
%
|
(1
|
)%
|
4
|
%
|
|||
|
Net income (loss)
|
6
|
%
|
(1
|
)%
|
6
|
%
|
12
|
%
|
|||
|
Comprehensive income (loss)
|
6
|
%
|
(1
|
)%
|
6
|
%
|
12
|
%
|
|||
41
Comparison of the year ended
March 31, 2020
to the twelve months ended
March 31, 2019
Net sales
Net sales
increased
$15.2 million
, or
6%
, to
$282.9 million
in the year ended
March 31, 2020
, from
$267.7 million
in the twelve months ended
March 31, 2019
. The
increase
was primarily driven by increased productivity across our retail and e-commerce channels, partially offset by the closing of all 22 e.l.f. retail stores in February 2019.
Gross profit
Gross profit
increased
$18.1 million
, or
11%
, to
$181.1 million
in the year ended
March 31, 2020
, compared to
$163.0 million
in the twelve months ended
March 31, 2019
. Gross margin increased to
64%
from
61%
, when compared to the twelve months ended
March 31, 2019
, with benefits primarily from margin accretive innovation, cost savings, price increases, favorable movements in foreign exchange rates and an increase in inventory reserves in the prior year, partially offset by higher sales adjustments and the impact of tariffs on goods imported from China.
Selling, general and administrative expenses
SG&A expenses were
$157.2 million
in the year ended
March 31, 2020
, an
increase
of
$19.5 million
, or
14%
, from
$137.7 million
in the twelve months ended
March 31, 2019
. SG&A expenses as a percentage of net sales
increased
to
56%
for the year ended
March 31, 2020
from
51%
in the twelve months ended
March 31, 2019
. The
increase
was primarily due to investments in marketing and digital expenses, bonus expense, investment in merchandising programs, and increased depreciation expenses driven by customer fixture programs. These increases were partially offset by the closure of e.l.f retail stores.
Restructuring income
Activities related to the exit of our stand-alone e.l.f. retail stores business in February 2019 generated income of
$6.0 million
for the year ended
March 31, 2020
and included a
$7.7 million
gain related to operating leases that were settled for less than their aggregate lease liabilities. The remainder of restructuring expense consisted of
$1.8 million
in other costs, which were primarily legal fees related to these extinguishments. As of
March 31, 2020
, we have settled all outstanding lease liabilities related to our e.l.f. retail store closures and we do not expect to incur additional material costs associated with our e.l.f retail store closures.
Other income (expense), net
Other income (expense), net was
$0.4 million
in the year ended
March 31, 2020
, an increase of
$0.2 million
versus the twelve months ended
March 31, 2019
. The change was primarily related to foreign exchange rate movements.
Interest expense, net
Interest expense
decreased
$1.4 million
, or
18%
, to
$6.3 million
in the year ended
March 31, 2020
, as compared to
$7.7 million
in the twelve months ended
March 31, 2019
. This
decrease
was primarily due to an increase in interest income generated on our cash and cash equivalents, in addition to a reduction in our long-term debt.
Income tax benefit (provision)
The provision for income taxes
increased
from a benefit of
$1.3 million
, or an effective tax rate of
29%
, for the twelve months ended
March 31, 2019
to expense of
$6.2 million
, or an effective tax rate of
26%
, for the year ended
March 31, 2020
. The change in the provision for income taxes was primarily driven by an increase in income before taxes of
$28.4 million
and a decrease in one-time tax benefits of
$1.0 million
, primarily related to the Company's provision-to-return adjustment for the period ending December 31, 2017, which was recorded during fiscal 2019.
Comparison of the year ended
March 31, 2020
to the year ended December 31, 2018
Net sales
Net sales
increased
$15.4 million, or 6%, to
$282.9 million
in the year ended
March 31, 2020
, from
$267.4 million
in the year ended December 31, 2018. The
increase
was primarily driven by increased productivity across our retail and e-commerce channels, partially offset by the closing of all 22 e.l.f. retail stores in February 2019.
Gross profit
42
Gross profit
increased
$18.4 million, or 11%, to
$181.1 million
in the year ended
March 31, 2020
, compared to
$162.7 million
in the year ended December 31, 2018. Gross margin increased to
64%
from
61%
, when compared to the year ended December 31, 2018, with benefits primarily from margin accretive innovation, cost savings, price increases and favorable movements in foreign exchange rate, partially offset by the impact of tariffs on goods imported from China.
Selling, general and administrative expenses
SG&A expenses were
$157.2 million
in the year ended
March 31, 2020
, an
increase
of $20.6 million, or 15%, from
$136.6 million
in the year ended December 31, 2018. SG&A expenses as a percentage of net sales
increased
to
56%
for the year ended
March 31, 2020
from
51%
in the year ended December 31, 2018. The
increase
was primarily due to investments in marketing and digital expenses, bonus expense, and increased depreciation expenses driven by customer fixture programs. These increases were partially offset by the closure of e.l.f retail stores.
Other income (expense), net
Other income (expense), net was
$0.4 million
in the year ended
March 31, 2020
, an increase of $0.8 million versus the year ended December 31, 2018. The change was primarily related to foreign exchange rate movements.
Interest expense, net
Interest expense
decreased
$1.5 million, or 19%, to
$6.3 million
in the year ended
March 31, 2020
, as compared to $7.8 million in the year ended December 31, 2018. This
decrease
was primarily due to an increase in interest income generated on our cash and cash equivalents, in addition to a reduction in our long-term debt.
Income tax benefit (provision)
The provision for income taxes increased from $2.4 million, or an effective tax rate of 14%, for the year ended December 31, 2018 to expense of
$6.2 million
, or an effective tax rate of 26%, for the year ended March 31, 2020. The change in the provision for income taxes was primarily driven by an increase in income before taxes of $6.1 million and a decrease in one-time tax benefits of $2.3 million. The decrease in one-time tax benefits primarily relates to larger tax benefits associated with the vesting of restricted stock or exercise of stock options in the year ended December 31, 2018, as well as the Company’s provision-to-return adjustment for the period ending December 31, 2017, which was recorded during the year ended December 31, 2018.
Comparison of the three months ended March 31, 2019 to the three months ended March 31, 2018
A comparison of the three months ended March 31, 2019 to the three months ended March 31, 2018 may be found in Part I, Item 2, of the Company's Quarterly Report on Form
10-QT
for the three months ended March 31, 2019.
Comparison of the year ended December 31, 2018 to the year ended December 31, 2017
A comparison of the year ended December 31, 2018 to the year ended December 31, 2017 may be found in Part II, Item 7, of the Company's Annual Report on Form
10-K
for the year ended December 31, 2018.
Financial condition, liquidity and capital resources
Overview
As of
March 31, 2020
, we held
$46.2 million
of cash and cash equivalents. In addition, as of
March 31, 2020
, we had borrowing capacity of
$49.8 million
under our Revolving Credit Facility. In April 2020, we borrowed
$20.0 million
against the available capacity under our Revolving Credit Facility in order to increase our cash position given the volatility driven by the COVID-19 pandemic. We do not expect that we will need to utilize the borrowed funds to meet our existing obligations.
Our primary cash needs are for capital expenditures, retail product displays and working capital. Capital expenditures typically vary depending on strategic initiatives selected for the fiscal year, including investments in infrastructure, digital capabilities, and expansion within or to additional retailer store locations. We expect to fund ongoing capital expenditures from existing cash on hand, cash generated from operations and, if necessary, draws on our Revolving Credit Facility.
Our primary working capital requirements are for product and product-related costs, payroll, rent, distribution costs and advertising and marketing. Fluctuations in working capital are primarily driven by the timing of when a retailer rearranges or restocks its products, expansion of space within our existing retailer base and the general seasonality of our
43
business. As of
March 31, 2020
, we had working capital, excluding cash, of
$35.1 million
, compared to
$38.3 million
as of
March 31, 2019
. Working capital, excluding cash and debt, was
$47.6 million
and
$48.5 million
as of
March 31, 2020
and
March 31, 2019
, respectively.
We believe that our operating cash flow, cash on hand and available financing under our Revolving Credit Facility will be adequate to meet our operating, investing and financing needs for the next twelve months. If necessary, we can borrow funds under our Revolving Credit Facility to finance our liquidity requirements, subject to customary borrowing conditions. To the extent additional funds are necessary to meet our long-term liquidity needs as we continue to execute our business strategy, we anticipate that they will be obtained through the incurrence of additional indebtedness, additional equity financings or a combination of these potential sources of funds; however, such financing may not be available on favorable terms, or at all. Our ability to meet our operating, investing and financing needs depends to a significant extent on our future financial performance, which will be subject in part to general economic, competitive, financial, regulatory and other factors that are beyond our control, including those described elsewhere in Item 1A “Risk Factors”. In addition to these general economic and industry factors, the principal factors in determining whether our cash flows will be sufficient to meet our liquidity requirements will be our ability to provide innovative products to our customers and manage production and our supply chain.
Cash flows
|
Year ended
March 31, |
Three months ended March 31,
(transition period)
|
Year ended
December 31,
|
|||||||||||||
|
(in thousands)
|
2020
|
2019
|
2018
|
2017
|
|||||||||||
|
Net cash provided by (used in):
|
|
|
|||||||||||||
|
Operating activities
|
$
|
44,313
|
|
$
|
8,216
|
|
$
|
55,582
|
|
$
|
12,378
|
|
|||
|
Investing activities
|
(35,345
|
)
|
(3,400
|
)
|
(8,872
|
)
|
(10,419
|
)
|
|||||||
|
Financing activities
|
(16,675
|
)
|
(2,147
|
)
|
(5,564
|
)
|
(7,195
|
)
|
|||||||
|
Net (decrease) increase in cash:
|
$
|
(7,707
|
)
|
$
|
2,669
|
|
$
|
41,146
|
|
$
|
(5,236
|
)
|
|||
Cash provided by operating activities
For the year ended
March 31, 2020
, net cash provided by operating activities was
$44.3 million
. This included net income, before deducting depreciation, amortization and other non-cash items, of
$54.3 million
and an increase in net working capital of
$10.0 million
. The increase in net working capital was driven by an
$11.5 million
decrease in other liabilities primarily related to termination payments on store leases, partially offset by the timing of cash payments related to accounts payable and accrued expenses.
For the three months ended March 31, 2019, net cash provided by operating activities was $8.2 million. This included a net loss, before adding depreciation, amortization and other non-cash items of $12.5 million and increases in net working capital of $4.3 million. The increase in net working capital was driven by a $3.3 million decrease in other liabilities, primarily related to store closures, partially offset by a $4.2 million decrease in accounts receivable.
A comparison of the cash provided by operating activities for the year ended December 31, 2018 to the year ended December 31, 2017 may be found in Part II, Item 7, of the Company's Annual Report on Form 10-K for the year ended December 31, 2018.
Cash used in investing activities
For the year ended
March 31, 2020
, net cash used in investing activities was
$35.3 million
.
This includes
$25.9 million
paid for the acquisition of W3LL people, Inc. and capital expenditures of
$9.4 million
.
For the three months ended March 31, 2019, net cash used in investing activities was $3.4 million, which was primarily driven by capital expenditures related to new customer fixture programs.
44
A comparison of the cash used in investing activities for the year ended December 31, 2018 to the year ended December 31, 2017 may be found in Part II, Item 7, of the Company's Annual Report on Form 10-K for the year ended December 31, 2018.
Cash used in financing activities
For the year ended
March 31, 2020
, net cash used in financing activities was
$16.7 million
, driven by
$9.5 million
in mandatory principal payments under our Term Loan Facility (as defined under the heading “Description of indebtedness”) and repurchase of common stock of
$7.9 million
. This was partially offset by
$1.5 million
of proceeds from the exercise of options to purchase common stock.
For the three months ended March 31, 2019, net cash used in financing activities was $2.1 million and was primarily related to mandatory principal payments under our Term Loan Facility.
A comparison of the cash used in financing activities for the year ended December 31, 2018 to the year ended December 31, 2017 may be found in Part II, Item 7, of the Company's Annual Report on Form 10-K for the year ended December 31, 2018.
Description of indebtedness
Senior secured credit agreement, as amended
On December 23, 2016, we entered into a five-year, $200.0 million Senior Secured Credit Agreement (as amended, the "Credit Agreement") with a syndicate consisting of several large financial institutions. The Credit Agreement was first amended on August 25, 2017, increasing the aggregate commitments to $215.0 million. The Credit Agreement, as amended, consists of a $50.0 million revolving line of credit (the “Revolving Credit Facility”) and a $165.0 million term loan (the “Term Loan Facility”). The Credit Agreement was amended again on December 7, 2018 to reflect the change in our fiscal year-end from December 31 to March 31. The Credit Agreement was further amended on April 8, 2020 to (i) increase the maximum permitted total net leverage ratio for the fiscal quarters
ending June 30, 2020, September 30, 2020, December 31, 2020, March 31, 2021 and June 30, 2021, (ii) reduce the minimum fixed charge coverage ratio for the fiscal quarters ending December 31, 2020 and March 31, 2021, (iii) add additional interest rates to correspond to the increased maximum permitted total net leverage ratios, (iv) increase the amount of cash netted in the calculation of the consolidated total net leverage ratio, and (v) amend the language around the level of add backs to the adjusted consolidated EBITDA definition.
All amounts under the Revolving Credit Facility are available for draw until the maturity date on August 25, 2022. The Revolving Credit Facility is collateralized by substantially all of our assets and requires payment of an unused fee ranging from 0.35% to 0.25% (based on our consolidated total net leverage ratio) times the average daily amount of unutilized commitments under the Revolving Credit Facility. The Revolving Credit Facility also provides for sub-facilities in the form of a $7.0 million letter of credit and a $5.0 million swing line loan; however, all amounts under the Revolving Credit Facility cannot exceed $50.0 million. The unused balance of the Revolving Credit Facility as of
March 31, 2020
was
$49.8 million
.
The Term Loan Facility maturity date is also August 25, 2022 and is collateralized by substantially all of our assets. Amortization installment payments on the Term Loan Facility are required to be made in quarterly installments of (i) $2,062,500 for fiscal quarters ending September 30, 2017 through June 30, 2019, (ii) $2,475,000 for fiscal quarters ending September 30, 2019 through June 30, 2020, (iii) $3,093,750 for fiscal quarters ending September 30, 2020 through June 30, 2021 and (iv) $4,125,000 for fiscal quarters ending September 30, 2021 through June 30, 2022. The remaining Term Loan Facility balance is due upon the maturity date. The Term Loan Facility can be prepaid at any time without penalty and is subject to mandatory prepayments when there is (i) excess cash flow, which is defined as EBITDA less certain customary deductions, (ii) non-ordinary course asset dispositions that result in net proceeds in excess of $2.5 million during a year, unless reinvested within twelve months, or (iii) issuance of additional debt.
Both the Revolving Credit Facility and the Term Loan Facility bear interest, at our option, at either a rate per annum equal to (i) a rate per annum equal to an adjusted LIBOR rate determined by reference to the cost of funds for U.S. dollar deposits for the applicable interest period (subject to a minimum floor of 0%) plus an applicable margin ranging from 1.50% to 3.25% based on our consolidated total net leverage ratio or (ii) a floating base rate plus an applicable margin ranging from 0.50% to 2.25% based on our consolidated total net leverage ratio. The interest rate as of
March 31, 2020
for the Term Loan was approximately
3.2%
.
45
The Credit Agreement contains a number of covenants that, among other things, restrict our ability to (subject to certain exceptions) pay dividends and distributions or repurchase our capital stock, incur additional indebtedness, create liens on assets, engage in mergers or consolidations and sell or otherwise dispose of assets. The Credit Agreement also includes reporting, financial and maintenance covenants that require us to, among other things, comply with certain consolidated total net leverage ratios and consolidated fixed charge coverage ratios. As of
March 31, 2020
,
March 31, 2019
and December 31,
2018
, we were in compliance with all financial covenants.
Contractual obligations and commitments
The following table summarizes our contractual obligations as of
March 31, 2020
(in thousands):
|
|
Payments Due by Period
|
||||||||||||||||||
|
|
Total
|
Less than 1 Year
|
1-3 Years
|
3-5 Years
|
More than 5 Years
|
||||||||||||||
|
Bank debt
(1)
|
$
|
136,950
|
|
$
|
11,756
|
|
$
|
125,194
|
|
$
|
—
|
|
$
|
—
|
|
||||
|
Interest on bank debt
(2)
|
9,608
|
|
4,308
|
|
5,300
|
|
—
|
|
—
|
|
|||||||||
|
Operating lease obligations
|
16,071
|
|
3,540
|
|
4,274
|
|
3,509
|
|
4,748
|
|
|||||||||
|
Finance lease obligations
(3)
|
3,300
|
|
950
|
|
2,115
|
|
235
|
|
—
|
|
|||||||||
|
Total contractual obligations
(4)
|
$
|
165,929
|
|
$
|
20,554
|
|
$
|
136,883
|
|
$
|
3,744
|
|
$
|
4,748
|
|
||||
|
(1)
|
Long-term debt payments include scheduled principal payments only.
|
|
(2)
|
Assumes an annual interest rate of
3.2%
on the Credit Agreement over the term of the loan.
|
|
(3)
|
Includes a
$0.3 million
residual value guarantee.
|
|
(4)
|
We have excluded our liability for uncertain tax positions from the table above because we are unable to make a reasonably reliable estimate of the timing of payments.
|
Off-balance sheet arrangements
We are not party to any off-balance sheet arrangements.
Critical accounting policies and estimates
Our consolidated financial statements included elsewhere in this Annual Report have been prepared in accordance with U.S. generally accepted accounting principles. The preparation of our financial statements requires us to make estimates and judgments that affect the reported amounts of assets, liabilities, revenues and expenses. We base our estimates on historical experience and on various other assumptions that we believe are reasonable under the circumstances. Actual results may differ from these estimates under different assumptions or conditions. While our significant accounting policies are more fully described in the Note 2 to consolidated financial statements in Item 15 “Exhibits, financial statement schedules”, we believe that the following accounting policies and estimates are critical to our business operations and understanding of our financial results.
Revenue recognition
We recognize revenue when control of promised goods or services is transferred to a customer in an amount that reflects the consideration that we expect to receive in exchange for those goods or services. Control of the substantial majority of the products that we sell will be transferred at a point in time. Factors that determine the specific point in time a customer obtains control and a performance obligation is satisfied are when we have a present right to payment for the goods, whether the customer has physical possession and title to the goods, and whether significant risks and rewards of ownership have transferred. Delivery is typically considered to have occurred at the time the title and risk of loss passes to the customer.
In the normal course of business, we offer various incentives to customers such as sales discounts, markdown support and other incentives and allowances, which give rise to variable consideration. The amount of variable consideration is estimated at the time of sale based on either the expected value method or the most likely amount, depending on the nature of the variability. We regularly review and revise, when deemed necessary, our estimates of variable consideration based on both customer-specific expectations as well as historical rates of realization. A provision for unclaimed customer incentives and allowances is included on the consolidated balance sheet, net against accounts receivable.
46
Business Combinations
We allocate the purchase price of a business acquisition to the assets acquired and liabilities assumed based upon their estimated fair values at the business combination date. The excess of purchase price over the fair value of assets acquired and liabilities assumed is recorded as goodwill. Determining fair value of identifiable assets, particularly intangibles, and liabilities acquired also requires us to make estimates, which are based on all available information and in some cases assumptions with respect to the timing and amount of future revenues and expenses associated with an asset. Unanticipated events or circumstances may occur that could affect the accuracy of our fair value estimates, and under different assumptions, the resulting valuations could be materially different, which could impact the operating results we report.
Impairment of long-lived assets, including goodwill and intangible assets
We assess potential impairments to our long-lived assets, which include property and equipment, retail product displays, and amortizable intangible assets, whenever events or circumstances indicate that the carrying amount of an asset may not be recoverable. Recoverability of an asset is measured by a comparison of the carrying amount of an asset group to the estimated undiscounted future cash flows expected to be generated by the asset. If the carrying amount of the asset group exceeds its estimated undiscounted future cash flows, an impairment charge is recognized as the amount by which the carrying amount of the asset exceeds the fair value of the asset. We recorded an impairment charge of
$0.2 million
in the year ended December 31, 2017 related to specific assets that were disposed. There were no impairment charges recorded on long-lived assets during the years ended
March 31, 2020
and
2018
and the transition period for the three months ended
March 31, 2019
.
We evaluate our indefinite-lived intangible asset to determine whether current events and circumstances continue to support an indefinite useful life. In addition, our indefinite-lived intangible asset is tested for impairment annually. The indefinite-lived intangible asset impairment test consists of a comparison of the fair value of each asset with its carrying value, with any excess of carrying value over fair value being recognized as an impairment loss. We are also permitted to make a qualitative assessment of whether it is more likely than not that an indefinite-lived intangible asset’s fair value is less than its carrying value prior to applying the quantitative assessment. If based on our qualitative assessment it is more likely than not that the carrying value of the asset is less than its fair value, then a quantitative assessment may be required.
The goodwill impairment test consists of a comparison of each reporting unit’s fair value to its carrying value. The fair value of a reporting unit is an estimate of the amount for which the unit as a whole could be sold in a current transaction between willing parties. If the carrying value of a reporting unit exceeds its fair value, goodwill is written down to its implied fair value. We are also permitted to make a qualitative assessment of whether it is more likely than not that the fair value of a reporting unit is less than its carrying value prior to applying the quantitative assessment. If based on our qualitative assessment it is more likely than not that the carrying value of the reporting unit is less than its fair value, then a quantitative assessment may be required. We have identified a single reporting unit for purposes of impairment testing.
We have selected October 1 as the date on which to perform our annual impairment tests. We also test for impairment whenever events or circumstances indicate that the fair value of goodwill or indefinite-lived intangible assets has been impaired. No impairment of goodwill or our indefinite-lived intangible asset was recorded during the years ended
March 31, 2020
or December 31,
2018
.
Stock-based compensation
Stock-based compensation cost is measured at grant date, based on the fair value of the award, and is recognized on a straight-line basis over the requisite service period for all awards that vest. We estimate the fair value of employee stock-based payment awards subject to only a service condition on the date of grant using the Black-Scholes valuation model. The Black-Scholes model requires the use of highly subjective and complex assumptions, including the option’s expected term and the price volatility of the underlying stock. We estimate the fair value of employee stock-based payment awards subject to market conditions on the date of grant using a Monte Carlo simulation model.
We recognize compensation expense for awards with only a service condition on a straight-line basis over the requisite service period, which is generally the award’s vesting period. Compensation expense for employee stock-based awards whose vesting is subject to the fulfillment of both a market condition and the occurrence of a performance condition is recognized on a graded-vesting basis at the time the achievement of the performance condition becomes probable. We account for forfeitures as they occur.
47
The expected stock price volatility for common stock was estimated by taking the average historic price volatility for industry peers based on daily price observations over a period equivalent to the expected term of the stock option grants. Industry peers consist of several public companies in our industry which are of similar size, complexity and stage of development. The risk-free interest rate for the expected term of the option is based on the U.S. Treasury implied yield at the date of grant. The weighted-average expected term is determined with reference to historical exercise and post-vesting cancellation experience and the vesting period and contractual term of the awards.
Prior to our initial public offering, the fair value of shares of common stock underlying the stock options was determined by our board of directors, with input from management. Because there was no public market for our common stock, the board of directors determined the fair value of common stock at the time of grant by considering a number of objective and subjective factors including independent third-party valuations of our common stock, operating and financial performance, the lack of liquidity of our capital stock and general and industry specific economic outlook, among other factors. For awards granted after our initial public offering, the fair value of our common stock is based on the closing price of our common stock as reported on the date of grant.
We have no current plans to pay a regular dividend.
New accounting pronouncements
See Note 2 to the Notes to consolidated financial statements in Item 15, “Exhibits, Financial Statement Schedules” for information regarding new accounting pronouncements.
We have opted out of the extended transition period available to us under Section 102(b)(1) of the JOBS Act with respect to new or revised accounting standards and, as a result, we comply with any such new or revised accounting standards on the relevant dates on which adoption of such standards is required for non-emerging growth companies.
Item 7A. Quantitative and qualitative disclosures about market risk.
We are exposed to certain market risks arising from transactions in the normal course of our business. Such risk is principally associated with interest rates and foreign exchange.
Interest rate risk
We had cash, cash equivalents of
$46.2 million
,
$53.9 million
and
$51.2 million
as of
March 31, 2020
,
March 31, 2019
and December 31,
2018
, respectively. Our cash and cash equivalents consist of cash and money market funds, which are highly liquid and, as such, are not sensitive to interest rate risk.
We are exposed to changes in interest rates because the indebtedness incurred under our Credit Agreement is variable rate debt. Interest rate changes generally do not affect the market value of our Senior Secured Credit Facility; however, they do affect the amount of our interest payments and, therefore, our future earnings and cash flows. As of
March 31, 2020
, we had variable rate debt of
$135.9 million
under our Credit Agreement. A hypothetical 1% increase or decrease of interest rates would result in a decrease or increase, respectively, in interest expense on an annualized basis of approximately
$1.4 million
as of
March 31, 2020
.
Foreign exchange risk
We are exposed to foreign exchange risk as we have contracts with suppliers in China for future purchases of inventories denominated in RMB. We do not have an active hedging program, and all of our legacy exchange rate forward contracts matured in 2016. We neither used these foreign currency forward contracts for trading purposes nor did we follow hedge accounting, and therefore the periodic impact of these legacy hedging activities was calculated on a mark-to-market basis. Accordingly, the foreign currency forward contracts were carried at their fair value either as an asset or liability on the consolidated balance sheet with changes in fair value being recorded in other income (expense), net in our consolidated statements of operations.
Foreign currency translation exposure from a 10% movement of currency exchange rates would have a material impact on our reported cost of sales and net income. Based on a hypothetical 10% adverse movement in RMB as compared to the US dollar, our cost of sales and net income would be adversely affected by approximately
$10.8 million
for the year ended
March 31, 2020
.
48
Item 8. Financial statements and supplementary data.
The following consolidated financial statements are incorporated by reference herein:
|
e.l.f. Beauty, Inc. and subsidiaries
|
|
|
Index to consolidated financial statements
|
|
|
|
Page
|
Item 9. Changes in and disagreements with accountants on accounting and financial disclosure.
None.
Item 9A. Controls and procedures.
Evaluation of disclosure controls and procedures
As of
March 31, 2020
, our management conducted an evaluation, under the supervision and with the participation of our Chief Executive Officer and Chief Financial Officer, of the effectiveness of the design and operation of our disclosure controls and procedures, as defined in Rules 13a-15(e) and 15d-15(e) under the Exchange Act. Based upon that evaluation, our Chief Executive Officer and Chief Financial Officer concluded that, as of
March 31, 2020
, our disclosure controls and procedures were effective to provide reasonable assurance that the information required to be disclosed by the Company in the reports that it files or submits under the Exchange Act is recorded, processed, summarized and reported within the time periods specified in SEC rules and forms and that such information is accumulated and communicated to the officers who certify our financial reports and to the members of the Company’s senior management and board of directors as appropriate to allow timely decisions regarding required disclosure.
Management’s annual report on internal control over financial reporting
Our management is responsible for establishing and maintaining adequate internal control over financial reporting, as such term is defined in the Exchange Act. Internal control over financial reporting is designed to provide reasonable assurance regarding the reliability of financial reporting and the preparation of financial statements prepared for external purposes in accordance with generally accepted accounting principles. Because of its inherent limitations, internal control over financial reporting may not prevent or detect misstatements.
Under the supervision and with the participation of our Chief Executive Officer and Chief Financial Officer, our management conducted an evaluation of the effectiveness of our internal control over financial reporting based upon the framework in “Internal Control - Integrated Framework (2013)” issued by the Committee of Sponsoring Organizations of the Treadway Commission. Based on that evaluation, management concluded that our internal control over financial reporting was effective as of
March 31, 2020
.
In addition, because we are an “emerging growth company” as defined under the terms of the JOBS Act of 2012, our independent registered public accounting firm is not required to issue an attestation report on our internal control over financial reporting.
Changes in internal control over financial reporting
There were no changes to our internal control over financial reporting that occurred during the quarter ended
March 31, 2020
that have materially affected, or are reasonably likely to materially affect, our internal control over financial reporting. We have not experienced any material impact to our internal controls over financial reporting despite the fact that most of our employees are working remotely due to the COVID-19 pandemic. We are continually monitoring and assessing the impact of COVID-19 pandemic on our internal controls to minimize the impact on their design and operating effectiveness.
49
Item 9B. Other information.
None
50
PART III
Item 10. Directors, executive officers and corporate governance.
The information required by this Item 10 is incorporated by reference to the sections entitled “Our Board of Directors”, “Our Executive Officers”, “Section 16(a) Beneficial Ownership Reporting Compliance”, and “Corporate Governance Materials Available on our Website” (or similar titles) that will be contained in our Definitive Proxy Statement for our
2020
annual meeting of stockholders (the “Proxy Statement”). Our Proxy Statement will be filed with the SEC within 120 days of
March 31, 2020
.
Item 11. Executive compensation.
The information required by this Item 11 is incorporated by reference to the sections entitled “Our Board of Directors” and “Executive Compensation” (or similar titles) that will be contained in the Proxy Statement.
Item 12. Security ownership of certain beneficial owners and management and related stockholder matters.
The information required by this Item 12 is incorporated by reference to the sections entitled “Equity Compensation Plan Information” and “Beneficial Ownership of Common Stock” (or similar titles) that will be contained in the Proxy Statement.
Item 13. Certain relationships and related transactions, and director independence.
The information required by this Item 13 is incorporated by reference to the sections entitled “Certain Relationships and Related Party Transactions” and “Director Independence” (or similar titles) that will be contained in the Proxy Statement.
Item 14. Principal accounting fees and services.
The information required by this Item 14 is incorporated by reference to the section entitled “Audit Matters” (or a similar title) that will be contained in the Proxy Statement.
51
PART IV
Item 15. Exhibits, financial statement schedules.
(a) The following documents are filed as part of this Annual Report:
1.
Consolidated financial statements:
Reference is made to the Index to Consolidated Financial Statements on page
63
hereof, which is incorporated by reference herein.
2.
Financial statement schedules:
All schedules are omitted because the required information is either not present, not present in material amounts or presented within our consolidated financial statements and notes thereto beginning on page
63
hereof and are incorporated herein by reference.
3.
Exhibits
|
|
|
|
Incorporated by Reference
|
|||
|
Exhibit Number
|
Exhibit Description
|
Provided
Herewith
|
Form
|
Exhibit
Number
|
File Number
|
Filing Date
|
|
3.1
|
|
8-K
|
3.1
|
001-37873
|
9/27/2016
|
|
|
3.2
|
|
8-K
|
3.2
|
001-37873
|
9/27/2016
|
|
|
4.1
|
Reference is made to Exhibits 3.1 and 3.2.
|
|
|
|
|
|
|
4.2
|
|
S-1
|
4.2
|
333-213333
|
8/26/2016
|
|
|
4.3
|
|
S-1/A
|
4.4
|
333-213333
|
9/12/2016
|
|
|
10.1
|
|
S-1
|
10.1
|
333-213333
|
8/26/2016
|
|
|
10.2
|
|
S-1
|
10.2
|
333-213333
|
8/26/2016
|
|
|
10.3
|
|
S-1
|
10.3
|
333-213333
|
8/26/2016
|
|
|
10.4
|
|
S-1
|
10.4
|
333-213333
|
8/26/2016
|
|
|
10.5
|
10-Q
|
10.1
|
001-37873
|
8/8/2019
|
||
|
10.6
|
|
S-1
|
10.5
|
333-213333
|
8/26/2016
|
|
52
|
|
|
|
Incorporated by Reference
|
|||
|
Exhibit Number
|
Exhibit Description
|
Provided
Herewith
|
Form
|
Exhibit
Number
|
File Number
|
Filing Date
|
|
10.7
|
|
8-K
|
10.1
|
001-37873
|
12/28/2016
|
|
|
10.8(a)
|
8-K
|
10.1
|
001-37873
|
8/28/2017
|
||
|
10.8(b)
|
|
X
|
||||
|
10.8(c)
|
|
8-K
|
10.1
|
001-37873
|
4/9/2020
|
|
|
10.9(a)#
|
|
S-1
|
10.12
|
333-213333
|
8/26/2016
|
|
|
10.9(b)#
|
10-K
|
10.7(b)
|
001-37873
|
3/15/2017
|
||
|
10.9(c)#
|
|
S-1
|
10.13
|
333-213333
|
8/26/2016
|
|
|
10.10(a)#
|
|
S-1/A
|
10.16
|
333-213333
|
9/12/2016
|
|
|
10.10(b)#
|
|
S-1/A
|
10.17
|
333-213333
|
9/12/2016
|
|
|
10.10(c)#
|
|
S-1/A
|
10.27
|
333-213333
|
9/12/2016
|
|
|
10.10(d)#
|
10-K
|
10.12(d)
|
001-37873
|
3/15/2017
|
||
|
10.10(e)#
|
10-K
|
10.12(e)
|
001-37873
|
3/15/2017
|
||
|
10.11#
|
|
S-1/A
|
10.18
|
333-213333
|
9/12/2016
|
|
53
|
|
|
|
Incorporated by Reference
|
|||
|
Exhibit Number
|
Exhibit Description
|
Provided
Herewith
|
Form
|
Exhibit
Number
|
File Number
|
Filing Date
|
|
10.12#
|
10-K
|
10.16
|
001-37873
|
2/28/2019
|
||
|
10.13#
|
10-K
|
10.17
|
001-37873
|
2/28/2019
|
||
|
10.14#
|
10-K
|
10.18
|
001-37873
|
2/28/2019
|
||
|
10.15#
|
10-K
|
10.19
|
001-37873
|
2/28/2019
|
||
|
10.16#
|
|
10-Q
|
10.1
|
001-37873
|
5/9/2019
|
|
|
10.17#
|
|
8-K
|
10.1
|
001-37873
|
3/21/2019
|
|
|
10.18#
|
|
10-Q
|
10.1
|
001-37873
|
2/6/2020
|
|
|
10.19#
|
|
S-1
|
10.25
|
333-213333
|
8/26/2016
|
|
|
10.20#
|
|
10-Q
|
10.1
|
001-37873
|
11/7/2019
|
|
|
21.1
|
X
|
|
|
|
|
|
|
23.1
|
X
|
|
|
|
|
|
|
24.1
|
X
|
|
|
|
|
|
|
31.1
|
X
|
|
|
|
|
|
|
31.2
|
X
|
|
|
|
|
|
|
32.1*
|
X
|
|
|
|
|
|
|
101.INS
101.SCH
101.CAL
101.LAB
101.PRE
101.DEF
|
XBRL Instance.
XBRL Taxonomy Extension Schema.
XBRL Taxonomy Extension Calculation Linkbase.
XBRL Taxonomy Extension Label Linkbase.
XBRL Taxonomy Extension Presentation Linkbase.
XBRL Taxonomy Extension Definition Linkbase.
|
X
X
X
X
X
X
|
|
|
|
|
|
#
|
Indicates management contract or compensatory plan
|
54
|
*
|
This certification is deemed furnished, and not filed, with the Securities and Exchange Commission and is not to be incorporated by reference into any filing of e.l.f. Beauty, Inc. under the Securities Act of 1933, as amended, or the Securities Exchange Act of 1934, as amended, whether made before or after the date of this Annual Report on Form 10-K, irrespective of any general incorporation language contained in such filing.
|
Item 16. Form 10-K Summary.
None.
55
SIGNATURES
Pursuant to the requirements of Section 13 or 15(d) of the Securities Exchange Act of 1934, as amended, the Registrant has duly caused this Report to be signed on its behalf by the undersigned, thereunto duly authorized.
|
|
|
e.l.f. Beauty, Inc.
|
|
|
|
|
|
|
|
May 28, 2020
|
|
By:
|
/s/ Tarang P. Amin
|
|
Date
|
|
|
Tarang P. Amin
Chief Executive Officer
(Principal Executive Officer)
|
|
|
|
|
|
|
May 28, 2020
|
|
By:
|
/s/ Mandy Fields
|
|
Date
|
|
|
Mandy Fields
Chief Financial Officer
(Principal Financial Officer and Principal Accounting Officer )
|
56
POWER OF ATTORNEY
KNOW ALL PERSONS BY THESE PRESENTS, that each person whose signature appears below hereby constitutes and appoints Tarang P. Amin, Mandy Fields and Scott K. Milsten, and each of them acting individually, as his or her true and lawful attorneys-in-fact and agents, each with full power of substitution, for him or her in any and all capacities, to sign any and all amendments to this Annual Report on Form 10-K, and to file the same, with all exhibits thereto and other documents in connection therewith, with the Securities and Exchange Commission, granting unto said attorneys-in-fact and agents, with full power of each to act alone, full power and authority to do and perform each and every act and thing requisite and necessary to be done in connection therewith, as fully for all intents and purposes as he might or could do in person, hereby ratifying and confirming all that said attorneys-in-fact and agents, or his or their substitute or substitutes, may lawfully do or cause to be done by virtue hereof.
IN WITNESS WHEREOF, each of the undersigned has executed this Power of Attorney as of the date indicated opposite his or her name.
Pursuant to the requirements of the Securities Exchange Act of 1934, as amended, this Annual Report on Form 10-K has been signed below by the following persons in the capacities and on the dates indicated.
|
Name
|
|
Title
|
|
Date
|
|
|
|
|
|
|
|
/s/ Tarang P. Amin
|
|
Chairman, Chief Executive Officer and Director
(Principal Executive Officer)
|
|
May 28, 2020
|
|
Tarang P. Amin
|
|
|
|
|
|
|
|
|
|
|
|
/s/ Mandy Fields
|
|
Senior Vice President and Chief Financial Officer
(Principal Financial and Accounting Officer)
|
|
May 28, 2020
|
|
Mandy Fields
|
|
|
|
|
|
|
|
|
|
|
|
/s/ Lauren Cooks Levitan
|
|
Director
|
|
May 28, 2020
|
|
Lauren Cooks Levitan
|
|
|
|
|
|
|
|
|
|
|
|
/s/ Richelle P. Parham
|
Director
|
May 28, 2020
|
||
|
Richelle P. Parham
|
||||
|
/s/ Kirk L. Perry
|
|
Director
|
|
May 28, 2020
|
|
Kirk L. Perry
|
|
|
|
|
|
/s/ Beth M. Pritchard
|
|
Director
|
|
May 28, 2020
|
|
Beth M. Pritchard
|
|
|
|
|
|
|
|
|
|
|
|
/s/ Sabrina L. Simmons
|
|
Director
|
|
May 28, 2020
|
|
Sabrina L. Simmons
|
|
|
|
|
|
|
|
|
|
|
|
/s/ Maureen C. Watson
|
|
Director
|
|
May 28, 2020
|
|
Maureen C. Watson
|
|
|
|
|
|
|
|
|
|
|
|
/s/ Richard G. Wolford
|
|
Director
|
|
May 28, 2020
|
|
Richard G. Wolford
|
|
|
|
|
57
INDEX TO CONSOLIDATED FINANCIAL STATEMENTS
|
|
|
|
|
|
|
|
|
|
|
|
|
|
|
58
REPORT OF INDEPENDENT REGISTERED PUBLIC ACCOUNTING FIRM
To the stockholders and the Board of Directors of e.l.f. Beauty, Inc.
Opinion on the Financial Statements
We have audited the accompanying consolidated balance sheets of e.l.f. Beauty, Inc. and subsidiaries (the "Company") as of March 31, 2020, March 31, 2019, and December 31, 2018, the related consolidated statements of operations and comprehensive income, stockholders’ equity, and cash flows, for the year ended March 31, 2020, for the three months ended March 31, 2019, and for the years ended December 31, 2018 and December 31, 2017 and the related notes (collectively referred to as the "financial statements"). In our opinion, the financial statements present fairly, in all material respects, the financial position of the Company as of March 31, 2020, March 31, 2019, and December 31, 2018, and the results of its operations and its cash flows for the year ended March 31, 2020, for the three months ended March 31, 2019, and for the years ended December 31, 2018 and December 31, 2017, in conformity with accounting principles generally accepted in the United States of America.
Change in Accounting Principle
As discussed in Note 2 to the financial statements, the Company has changed its method of accounting for Leases effective January 1, 2019 due to the adoption of FASB ASC Topic 842,
Leases
(“ASC 842”), using the modified retrospective approach.
Basis for Opinion
These financial statements are the responsibility of the Company's management. Our responsibility is to express an opinion on the Company's financial statements based on our audits. We are a public accounting firm registered with the Public Company Accounting Oversight Board (United States) (PCAOB) and are required to be independent with respect to the Company in accordance with the U.S. federal securities laws and the applicable rules and regulations of the Securities and Exchange Commission and the PCAOB.
We conducted our audits in accordance with the standards of the PCAOB. Those standards require that we plan and perform the audit to obtain reasonable assurance about whether the financial statements are free of material misstatement, whether due to error or fraud. The Company is not required to have, nor were we engaged to perform, an audit of its internal control over financial reporting. As part of our audits, we are required to obtain an understanding of internal control over financial reporting but not for the purpose of expressing an opinion on the effectiveness of the Company’s internal control over financial reporting. Accordingly, we express no such opinion.
Our audits included performing procedures to assess the risks of material misstatement of the financial statements, whether due to error or fraud, and performing procedures that respond to those risks. Such procedures included examining, on a test basis, evidence regarding the amounts and disclosures in the financial statements. Our audits also included evaluating the accounting principles used and significant estimates made by management, as well as evaluating the overall presentation of the financial statements. We believe that our audits provide a reasonable basis for our opinion.
San Francisco, California
May 28, 2020
We have served as the Company's auditor since 2014.
59
e.l.f. Beauty, Inc. and subsidiaries
Consolidated balance sheets
(in thousands, except share and per share data
)
|
|
March 31, 2020
|
March 31, 2019
|
December 31, 2018
|
||||||||
|
Assets
|
|
|
|
|
|||||||
|
Current assets:
|
|
|
|
|
|||||||
|
Cash and cash equivalents
|
$
|
46,167
|
|
$
|
53,874
|
|
$
|
51,205
|
|
||
|
Accounts receivable, net
|
29,721
|
|
32,275
|
|
36,724
|
|
|||||
|
Inventory, net
|
46,209
|
|
43,779
|
|
46,341
|
|
|||||
|
Prepaid expenses and other current assets
|
10,263
|
|
7,340
|
|
7,473
|
|
|||||
|
Total current assets
|
132,360
|
|
137,268
|
|
141,743
|
|
|||||
|
Property and equipment, net
|
17,171
|
|
16,006
|
|
21,804
|
|
|||||
|
Intangible assets, net
|
102,410
|
|
97,053
|
|
98,773
|
|
|||||
|
Goodwill
|
171,321
|
|
157,264
|
|
157,264
|
|
|||||
|
Investments
|
2,875
|
|
2,875
|
|
2,875
|
|
|||||
|
Other assets
|
26,967
|
|
21,222
|
|
13,397
|
|
|||||
|
Total assets
|
$
|
453,104
|
|
$
|
431,688
|
|
$
|
435,856
|
|
||
|
Liabilities and stockholders' equity
|
|
|
|
|
|||||||
|
Current liabilities:
|
|
|
|
|
|||||||
|
Current portion of long-term debt and finance lease obligations
|
$
|
12,568
|
|
$
|
10,259
|
|
$
|
9,861
|
|
||
|
Accounts payable
|
12,390
|
|
16,280
|
|
20,483
|
|
|||||
|
Accrued expenses and other current liabilities
|
26,165
|
|
18,590
|
|
12,671
|
|
|||||
|
Total current liabilities
|
51,123
|
|
45,129
|
|
43,015
|
|
|||||
|
Long-term debt and finance lease obligations
|
126,088
|
|
138,025
|
|
140,523
|
|
|||||
|
Deferred tax liabilities
|
21,892
|
|
16,753
|
|
20,217
|
|
|||||
|
Long-term operating lease obligations
|
11,239
|
|
15,898
|
|
—
|
|
|||||
|
Other long-term liabilities
|
591
|
|
668
|
|
2,770
|
|
|||||
|
Total liabilities
|
210,933
|
|
216,473
|
|
206,525
|
|
|||||
|
Commitments and contingencies (Note 11)
|
|
|
|
|
|||||||
|
Stockholders' equity:
|
|
|
|
|
|||||||
|
Common stock, par value of $0.01 per share;
250,000,000 shares authorized as of March 31, 2020, March 31, 2019 and December 31, 2018; 50,003,531, 49,645,450 and 48,715,276
shares issued and outstanding as of March 31, 2020, March 31, 2019 and December 31, 2018, respectively
|
489
|
|
483
|
|
478
|
|
|||||
|
Additional paid-in capital
|
753,213
|
|
744,147
|
|
740,354
|
|
|||||
|
Accumulated deficit
|
(511,531
|
)
|
(529,415
|
)
|
(511,501
|
)
|
|||||
|
Total stockholders' equity
|
242,171
|
|
215,215
|
|
229,331
|
|
|||||
|
Total liabilities and stockholders' equity
|
$
|
453,104
|
|
$
|
431,688
|
|
$
|
435,856
|
|
||
60
e.l.f. Beauty, Inc. and subsidiaries
Consolidated statements of operations and comprehensive income
(in thousands, except share and per share data)
|
|
Year ended
March 31, |
Three months ended March 31,
(transition period) |
Year ended
December 31, |
||||||||||||
|
|
2020
|
2019
|
2018
|
2017
|
|||||||||||
|
Net sales
|
$
|
282,851
|
|
$
|
66,141
|
|
$
|
267,435
|
|
$
|
269,888
|
|
|||
|
Cost of sales
|
101,728
|
|
25,650
|
|
104,694
|
|
105,163
|
|
|||||||
|
Gross profit
|
181,123
|
|
40,491
|
|
162,741
|
|
164,725
|
|
|||||||
|
Selling, general, and administrative expenses
|
157,155
|
|
37,324
|
|
136,579
|
|
131,446
|
|
|||||||
|
Restructuring (income) expense
|
(5,982
|
)
|
22,176
|
|
—
|
|
—
|
|
|||||||
|
Operating income (loss)
|
29,950
|
|
(19,009
|
)
|
26,162
|
|
33,279
|
|
|||||||
|
Other income (expense), net
|
426
|
|
(315
|
)
|
(390
|
)
|
(2,035
|
)
|
|||||||
|
Interest expense, net
|
(6,307
|
)
|
(1,849
|
)
|
(7,816
|
)
|
(8,775
|
)
|
|||||||
|
Income (loss) before provision for income taxes
|
24,069
|
|
(21,173
|
)
|
17,956
|
|
22,469
|
|
|||||||
|
Income tax (provision) benefit
|
(6,185
|
)
|
3,259
|
|
(2,431
|
)
|
11,006
|
|
|||||||
|
Net income (loss)
|
$
|
17,884
|
|
$
|
(17,914
|
)
|
$
|
15,525
|
|
$
|
33,475
|
|
|||
|
Comprehensive income (loss)
|
$
|
17,884
|
|
$
|
(17,914
|
)
|
$
|
15,525
|
|
$
|
33,475
|
|
|||
|
Net income (loss) per share:
|
|||||||||||||||
|
Basic
|
$
|
0.37
|
|
$
|
(0.37
|
)
|
$
|
0.33
|
|
$
|
0.74
|
|
|||
|
Diluted
|
$
|
0.35
|
|
$
|
(0.37
|
)
|
$
|
0.32
|
|
$
|
0.68
|
|
|||
|
Weighted average shares outstanding:
|
|||||||||||||||
|
Basic
|
48,498,813
|
|
48,022,926
|
|
46,828,798
|
|
45,358,452
|
|
|||||||
|
Diluted
|
50,817,143
|
|
48,022,926
|
|
49,268,616
|
|
49,374,758
|
|
|||||||
The accompanying notes are an integral part of these consolidated financial statements.
61
e.l.f. Beauty, Inc. and subsidiaries
Consolidated statements of stockholders’ equity
(in thousands, except share data)
|
|
Common stock
|
Additional
paid-in
capital
|
Accumulated deficit
|
Total
stockholders'
equity
|
|||||||||||||||
|
|
Shares
|
Amount
|
|||||||||||||||||
|
Balance as of December 31, 2016
|
43,753,311
|
|
$
|
438
|
|
$
|
700,871
|
|
$
|
(560,447
|
)
|
$
|
140,862
|
|
|||||
|
Net income
|
—
|
|
—
|
|
—
|
|
33,475
|
|
33,475
|
|
|||||||||
|
Stock-based compensation
|
—
|
|
—
|
|
13,474
|
|
—
|
|
13,474
|
|
|||||||||
|
Vesting of early exercised stock options
|
1,522,826
|
|
15
|
|
4,059
|
|
—
|
|
4,074
|
|
|||||||||
|
Exercise of stock options (and vesting of restricted stock)
|
1,039,493
|
|
10
|
|
1,968
|
|
—
|
|
1,978
|
|
|||||||||
|
Balance as of December 31, 2017
|
46,315,630
|
|
463
|
|
720,372
|
|
(526,972
|
)
|
193,863
|
|
|||||||||
|
Net income
|
—
|
|
—
|
|
—
|
|
15,525
|
|
15,525
|
|
|||||||||
|
Stock-based compensation
|
—
|
|
—
|
|
16,821
|
|
—
|
|
16,821
|
|
|||||||||
|
Exercise of stock options (and vesting of restricted stock)
|
1,514,126
|
|
15
|
|
3,161
|
|
—
|
|
3,176
|
|
|||||||||
|
Adoption of new accounting standard
|
—
|
|
—
|
|
—
|
|
(54
|
)
|
(54
|
)
|
|||||||||
|
Balance as of December 31, 2018
|
47,829,756
|
|
478
|
|
740,354
|
|
(511,501
|
)
|
229,331
|
|
|||||||||
|
Net loss
|
—
|
|
—
|
|
—
|
|
(17,914
|
)
|
(17,914
|
)
|
|||||||||
|
Stock-based compensation
|
—
|
|
—
|
|
3,683
|
|
—
|
|
3,683
|
|
|||||||||
|
Exercise of stock options (and vesting of restricted stock)
|
458,964
|
|
5
|
|
110
|
|
—
|
|
115
|
|
|||||||||
|
Balance as of March 31, 2019
|
48,288,720
|
|
483
|
|
744,147
|
|
(529,415
|
)
|
215,215
|
|
|||||||||
|
Net income
|
—
|
|
—
|
|
—
|
|
17,884
|
|
17,884
|
|
|||||||||
|
Stock-based compensation
|
—
|
|
—
|
|
15,488
|
|
—
|
|
15,488
|
|
|||||||||
|
Exercise of stock options (and vesting of restricted stock)
|
1,150,490
|
|
12
|
|
1,476
|
|
—
|
|
1,488
|
|
|||||||||
|
Repurchase of common stock
|
(564,468
|
)
|
(6
|
)
|
(7,898
|
)
|
—
|
|
(7,904
|
)
|
|||||||||
|
Balance as of March 31, 2020
|
48,874,742
|
|
$
|
489
|
|
$
|
753,213
|
|
$
|
(511,531
|
)
|
$
|
242,171
|
|
|||||
The accompanying notes are an integral part of these consolidated financial statements.
62
e.l.f. Beauty, Inc. and subsidiaries
Consolidated statements of cash flows
(in thousands)
|
|
Year ended
March 31, |
Three months ended March 31,
(transition period)
|
Year ended
December 31,
|
|||||||||||
|
|
2020
|
2019
|
2018
|
2017
|
||||||||||
|
Cash flows from operating activities:
|
|
|
||||||||||||
|
Net income (loss)
|
$
|
17,884
|
|
(17,914
|
)
|
15,525
|
|
33,475
|
|
|||||
|
Adjustments to reconcile net income to net cash provided by operating activities:
|
||||||||||||||
|
Depreciation and amortization
|
22,843
|
|
7,544
|
|
17,861
|
|
14,521
|
|
||||||
|
Restructuring (income) loss
|
(5,982
|
)
|
22,176
|
|
—
|
|
—
|
|
||||||
|
Stock-based compensation expense
|
15,488
|
|
3,683
|
|
16,821
|
|
13,474
|
|
||||||
|
Amortization of debt issuance costs and discount on debt
|
747
|
|
190
|
|
792
|
|
810
|
|
||||||
|
Deferred income taxes
|
2,443
|
|
(3,433
|
)
|
(939
|
)
|
(13,434
|
)
|
||||||
|
Other, net
|
873
|
|
242
|
|
476
|
|
1,728
|
|
||||||
|
Changes in operating assets and liabilities:
|
||||||||||||||
|
Accounts receivable
|
2,504
|
|
4,215
|
|
7,649
|
|
(8,001
|
)
|
||||||
|
Inventories
|
(435
|
)
|
2,561
|
|
16,338
|
|
6,718
|
|
||||||
|
Prepaid expenses and other assets
|
(6,500
|
)
|
(1,732
|
)
|
(8,484
|
)
|
(11,200
|
)
|
||||||
|
Accounts payable and accrued expenses
|
5,962
|
|
(6,021
|
)
|
(10,251
|
)
|
(25,483
|
)
|
||||||
|
Other liabilities
|
(11,514
|
)
|
(3,295
|
)
|
(206
|
)
|
(230
|
)
|
||||||
|
Net cash provided by operating activities
|
44,313
|
|
8,216
|
|
55,582
|
|
12,378
|
|
||||||
|
Cash flows from investing activities:
|
|
|
||||||||||||
|
Acquisition, net of cash acquired
|
(25,923
|
)
|
—
|
|
—
|
|
—
|
|
||||||
|
Purchase of property and equipment
|
(9,422
|
)
|
(3,400
|
)
|
(8,872
|
)
|
(7,544
|
)
|
||||||
|
Investment in equity securities
|
—
|
|
—
|
|
—
|
|
(2,875
|
)
|
||||||
|
Net cash used in investing activities
|
(35,345
|
)
|
(3,400
|
)
|
(8,872
|
)
|
(10,419
|
)
|
||||||
|
Cash flows from financing activities:
|
||||||||||||||
|
Proceeds from revolving line of credit
|
—
|
|
—
|
|
2,000
|
|
25,900
|
|
||||||
|
Repayment of revolving line of credit
|
—
|
|
—
|
|
(2,000
|
)
|
(25,900
|
)
|
||||||
|
Repayment of long-term debt
|
(9,488
|
)
|
(2,063
|
)
|
(8,250
|
)
|
(8,250
|
)
|
||||||
|
Debt issuance costs paid
|
—
|
|
—
|
|
—
|
|
(519
|
)
|
||||||
|
Repurchase of common stock
|
(7,904
|
)
|
—
|
|
—
|
|
—
|
|
||||||
|
Cash received from issuance of common stock
|
1,488
|
|
115
|
|
3,176
|
|
1,978
|
|
||||||
|
Other, net
|
(771
|
)
|
(199
|
)
|
(490
|
)
|
(404
|
)
|
||||||
|
Net cash used in financing activities
|
(16,675
|
)
|
(2,147
|
)
|
(5,564
|
)
|
(7,195
|
)
|
||||||
|
Net (decrease) increase in cash and cash equivalents
|
(7,707
|
)
|
2,669
|
|
41,146
|
|
(5,236
|
)
|
||||||
|
Cash and cash equivalents - beginning of period
|
53,874
|
|
51,205
|
|
10,059
|
|
15,295
|
|
||||||
|
Cash and cash equivalents - end of period
|
$
|
46,167
|
|
53,874
|
|
$
|
51,205
|
|
$
|
10,059
|
|
|||
63
|
|
Year ended
March 31, |
Three months ended March 31,
(transition period)
|
Year ended
December 31,
|
||||||||||||
|
|
2020
|
2019
|
2018
|
2017
|
|||||||||||
|
Supplemental disclosure of cash flow information:
|
|
|
|
|
|
|
|||||||||
|
Cash paid for interest
|
$
|
6,302
|
|
$
|
1,783
|
|
$
|
7,124
|
|
$
|
8,162
|
|
|||
|
Cash paid for income taxes, net of refunds
|
5,604
|
|
6
|
|
4,085
|
|
5,673
|
|
|||||||
|
Cash paid for interest on finance leases
|
179
|
|
50
|
|
—
|
|
—
|
|
|||||||
|
Supplemental disclosure of noncash investing and financing activities:
|
|||||||||||||||
|
Property and equipment acquired under finance leases
|
—
|
|
—
|
|
2,098
|
|
10
|
|
|||||||
|
Property and equipment purchases included in accounts payable and accrued expenses
|
1,132
|
|
3,080
|
|
1,838
|
|
1,143
|
|
|||||||
|
Vesting of shares related to early exercise of common stock options
|
—
|
|
—
|
|
—
|
|
4,074
|
|
|||||||
The accompanying notes are an integral part of these consolidated financial statements.
64
e.l.f. Beauty, Inc. and subsidiaries
Notes to consolidated financial statements
Note 1—Nature of operations
e.l.f. Beauty, Inc. (“e.l.f. Beauty” and together with its subsidiaries, the “Company” or “we”) was formed as a Delaware corporation on December 20, 2013. e.l.f. Beauty is organized as a holding company and operates through its subsidiaries, e.l.f. Cosmetics, Inc., which conducts business under the name “e.l.f. Cosmetics” or “e.l.f.” and W3LL People, Inc., which conducts business under the name “W3LL PEOPLE”.
Note 2—Summary of significant accounting policies
Basis of presentation and fiscal year end change
During December 2018, the board of directors approved a change in fiscal year end from December 31st to March 31st. Accordingly, this document reflects the Company's annual fiscal year ending
March 31, 2020
, covering the period April 1, 2019 through
March 31, 2020
. Accordingly, all references to the period ended March 2019 relate to the three-month transition period ended
March 31, 2019
.
All references to the periods ended
March 31, 2020
, December 31,
2018
and December 31,
2017
relate to the years ended
March 31, 2020
, December 31,
2018
and December 31,
2017
, respectively.
The consolidated financial statements have been prepared in accordance with U.S. generally accepted accounting principles (“U.S. GAAP”) and all intercompany balances and transactions have been eliminated in consolidation. Certain prior year amounts in the consolidated financial statements have been reclassified to conform to the current year presentation.
Use of estimates
The preparation of financial statements in conformity with U.S. GAAP requires management make estimates and assumptions that affect the reported amounts of assets and liabilities at the date of the financial statements and reported amounts of revenues and expenses during the reporting period. Actual results could differ from these estimates.
Cash and cash equivalents
Cash and cash equivalents include all cash balances and highly liquid investments purchased with maturities of three months or less.
Accounts receivable
Trade receivables consist of uncollateralized, non-interest bearing customer obligations from transactions with retail customers, reduced by an allowance for doubtful accounts for estimated losses resulting from the inability of customers to make payments. The allowance is based on the evaluation and aging of past due balances, specific exposures, historical trends and economic conditions. The Company writes off accounts receivable against the allowance when a balance is determined to be uncollectible. Recoveries of receivables previously written off are recorded when received. The Company recorded an allowance for doubtful accounts of
$1.0 million
,
$0.3 million
and
$0.3 million
as of
March 31, 2020
,
March 31, 2019
and December 31,
2018
, respectively. The Company recorded a reserve for sales adjustments of
$7.6 million
,
$6.5 million
and
$7.8 million
as of
March 31, 2020
,
March 31, 2019
, and December 31,
2018
, respectively, which is also presented as a reduction to accounts receivable. The Company grants credit terms in the normal course of business to its customers. Trade credit is extended based upon an evaluation of each customer’s ability to perform its payment obligations.
Concentrations of credit risk
Financial instruments, which potentially subject the Company to concentrations of credit risk, consist principally of cash and cash equivalents including money market funds. Although the Company deposits its cash with creditworthy financial institutions, its deposits, at times, may exceed federally insured limits. To date, the Company has not experienced any losses on its cash deposits. The Company performs credit evaluations of its customers, and the risk with respect to trade receivables is further mitigated by the short duration of customer payment terms and the pedigree of the customer base.
65
e.l.f. Beauty, Inc. and subsidiaries
Notes to consolidated financial statements
During the years ended
March 31, 2020
, December 31,
2018
and
2017
, and the three month transition period ended
March 31, 2019
, two customers individually accounted for greater than
10%
of the Company’s net sales as disclosed below:
|
Year ended
March 31,
|
Three months ended March 31,
(transition period)
|
Year ended
December 31,
|
|||||||||
|
2020
|
2019
|
2018
|
2017
|
||||||||
|
Walmart
|
31
|
%
|
36
|
%
|
30
|
%
|
29
|
%
|
|||
|
Target
|
22
|
%
|
17
|
%
|
21
|
%
|
25
|
%
|
|||
Customers that individually accounted for greater than 10% of the Company’s accounts receivable at the end of the periods are as presented
:
|
March 31, 2020
|
March 31, 2019
|
December 31, 2018
|
||||||
|
Target
|
22
|
%
|
19
|
%
|
27
|
%
|
||
|
Walmart
|
20
|
%
|
27
|
%
|
20
|
%
|
||
Inventory
Inventory, consisting principally of finished goods, is stated at the lower of cost or market. Cost is principally determined by the first-in, first-out method. The Company also records a reserve for excess and obsolete inventory, which represents the excess of the cost of the inventory over its estimated market value. This reserve is based upon an assessment of historical trends, current market conditions and forecasted product demand. The Company recorded an adjustment for excess and obsolete inventory, which is presented as a reduction to inventory of
$1.4 million
,
$1.7 million
, and
$2.3 million
as of
March 31, 2020
,
March 31, 2019
and December 31,
2018
, respectively.
Property and equipment and other assets
Property and equipment is stated at cost and is depreciated on a straight-line basis over the estimated useful lives of the assets. Leasehold improvements are amortized on a straight-line basis over the shorter of the lease term or the useful lives of the assets. Repairs and maintenance expenditures are expensed as incurred.
Useful lives by major asset class are as follows:
|
|
|
Estimated
useful lives
|
|
Machinery, equipment and software
|
|
3-5 years
|
|
Leasehold improvements
|
|
5 years
|
|
Furniture and fixtures
|
|
2-5 years
|
|
Store fixtures
|
|
2-3 years
|
As of
March 31, 2020
,
March 31, 2019
and December 31,
2018
, included in other assets are retail product displays, net, of
$10.1 million
,
$12.1 million
and
$10.9 million
, respectively, that are generally amortized over a period of
three
years. Amortization expense for retail product displays was
$6.0 million
,
$3.1 million
,
$0.6 million
and
$1.5 million
for the years ended
March 31, 2020
, December 31,
2018
and
2017
, and the transition period for the three months ended
March 31, 2019
, respectively.
The Company evaluates events and changes in circumstances that could indicate carrying amounts of long-lived assets, including property and equipment, may not be recoverable. When such events or changes in circumstances occur, the Company assesses the recoverability of long-lived assets by determining whether or not the carrying value of such assets will be recovered through undiscounted future cash flows derived from their use and eventual disposition. For purposes of this assessment, long-lived assets are grouped with other assets and liabilities at the lowest level for which identifiable cash flows
66
e.l.f. Beauty, Inc. and subsidiaries
Notes to consolidated financial statements
are largely independent of the cash flows of other assets and liabilities. The Company’s long-lived assets are grouped on an entity-wide basis. This is due, in part, to the integrated nature of the Company’s various distribution channels and the extent of shared costs across those channels. If the sum of the undiscounted future cash flows is less than the carrying amount of an asset, the Company records an impairment loss for the amount by which the carrying amount of the assets exceeds its fair value. The Company recorded an impairment charge of
$0.2 million
in the year ended December 31, 2017 related to specific assets that were disposed. There were no impairment charges recorded on long-lived assets during the transition period for the three months ended
March 31, 2019
, the years ended
March 31, 2020
or December 31,
2018
.
Goodwill and intangible assets
Goodwill represents the excess of the purchase price for an acquisition over the fair value of the net assets acquired. In addition, the Company has acquired finite-lived intangible assets and an indefinite-lived intangible asset.
Goodwill is not amortized but rather is reviewed annually for impairment, at the reporting unit level, or when there is evidence that events or changes in circumstances indicate that the Company’s carrying amount may not be recovered. When testing goodwill for impairment, the Company first performs an assessment of qualitative factors. If qualitative factors indicate that it is more likely than not that the fair value of the relevant reporting unit is less than its carrying amount, the Company tests goodwill for impairment at the reporting unit level using a two-step approach. In step one, the Company determines if the fair value of the reporting unit exceeds the unit’s carrying value. If step one indicates that the fair value of the reporting unit is less than its carrying value, the Company performs step two, determining the fair value of goodwill and, if the carrying value of goodwill exceeds its implied fair value, an impairment charge is recorded. The Company has identified a single reporting unit for purposes of impairment testing due, in part, to the integrated nature of the Company’s various distribution channels and the extent of shared costs across those channels.
Indefinite-lived intangible assets are not amortized but rather are tested for impairment annually, and impairment is recognized if the carrying amount exceeds the fair value of the intangible asset. The Company evaluates its indefinite-lived intangible asset to determine whether current events and circumstances continue to support an indefinite useful life. Amortization of intangible assets with finite useful lives is computed on a straight-line basis over periods of
3
years to
10
years. The determination of the estimated period of benefit is dependent upon the use and underlying characteristics of the intangible asset. The Company evaluates the recoverability of its intangible assets subject to amortization when facts and circumstances indicate that the carrying value of the asset may not be recoverable. If the carrying value of an intangible asset is not recoverable, impairment loss is measured as the amount by which the carrying value exceeds its estimated fair value.
Business Combinations
The purchase price of a business acquisition is allocated to the assets acquired and liabilities assumed based upon their estimated fair values at the business combination date. The excess of purchase price over the fair value of assets acquired and liabilities assumed is recorded as goodwill. Determining fair value of identifiable assets, particularly intangibles, and liabilities acquired also requires the Company to make estimates, which are based on all available information and in some cases assumptions with respect to the timing and amount of future revenues and expenses associated with an asset. Unanticipated events or circumstances may occur that could affect the accuracy of our fair value estimates, and under different assumptions, the resulting valuations could be materially different.
Costs that are incurred to complete the business combination such as legal and other professional fees are not considered as a part of consideration transferred, and are charged to selling, general and administrative expense as they are incurred.
Debt issuance costs
Debt issuance costs and lender fees were incurred for arranging the credit facilities from various financial institutions. For credit facilities consisting of both term and revolving debt, such costs are allocated to each sub-facility based upon the total borrowing capacity. For term debt, issuance costs are presented within the related long-term debt liability on the consolidated balance sheet and lender fees are presented as a direct deduction from the carrying amount. Both debt issuance costs and lender fees are amortized over the term of the related debt using the effective interest rate method. For revolving debt, issuance costs and lender fees are presented as a noncurrent asset and amortized over the term of the related debt on a straight-line basis.
67
e.l.f. Beauty, Inc. and subsidiaries
Notes to consolidated financial statements
Fair value of financial instruments
The carrying amounts of cash and cash equivalents, accounts receivable, and accounts payable and accrued expenses approximate their fair values due to the short-term nature of these items. The carrying amounts of bank debt approximate their fair values as the stated interest rates approximate market rates currently available to the Company for loans with similar terms. See Note 9—Fair value of financial instruments.
Segment reporting
Operating segments are components of an enterprise for which separate financial information is available that is evaluated by the chief operating decision maker in deciding how to allocate resources and in assessing performance. Utilizing these criteria, the Company manages its business on the basis of
one
operating segment and
one
reportable segment. It is impracticable for the Company to provide revenue by product line.
During the years ended
March 31, 2020
, December 31,
2018
and
2017
, and the transition period for the three months ended
March 31, 2019
, net sales in the United States and outside of the United States were as follows (in thousands):
|
Year ended
March 31, |
Three months ended March 31,
(transition period) |
Year ended
December 31, |
|||||||||||||
|
2020
|
2019
|
2018
|
2017
|
||||||||||||
|
U.S.
|
$
|
255,284
|
|
$
|
59,797
|
|
$
|
241,159
|
|
$
|
243,299
|
|
|||
|
International
|
27,567
|
|
6,344
|
|
26,276
|
|
26,589
|
|
|||||||
|
Total net sales
|
$
|
282,851
|
|
$
|
66,141
|
|
$
|
267,435
|
|
$
|
269,888
|
|
|||
As of
March 31, 2020
,
March 31, 2019
, and December 31,
2018
, the Company had property and equipment in the United States and outside of the United States as follows (in thousands)
:
|
March 31, 2020
|
March 31, 2019
|
December 31, 2018
|
|||||||||
|
U.S.
|
$
|
16,845
|
|
$
|
15,491
|
|
$
|
21,236
|
|
||
|
International
|
326
|
|
515
|
|
568
|
|
|||||
|
Total property and equipment, net
|
$
|
17,171
|
|
$
|
16,006
|
|
$
|
21,804
|
|
||
Revenue recognition
The Company adopted Accounting Standards Codification (“ASC”) Topic 606, Revenue from Contracts with Customers (“ASC 606”), on January 1, 2018 on a modified retrospective basis and recognized a net reduction of
$0.1 million
to the opening balance of retained earnings, net of tax, for the cumulative effect of applying the new standard. The results for periods beginning after January 1, 2018 are presented under ASC 606, while comparative information has not been restated and continues to be reported under the accounting standards in effect for those periods. The adoption of the new standard impacted net sales and accounts receivable. Net sales would have been
$0.3 million
higher under the previous standard in the year ended December 31, 2018. Accounts receivable would have been
$0.4 million
higher under the previous standard as of December 31, 2018.
Revenue is recognized when control of promised goods or services is transferred to a customer in an amount that reflects the consideration that the Company expects to receive in exchange for those goods or services.
For the Company's retail customer transactions, a contract exists when a written purchase order is received, and control transfers at the time of shipment or the time of delivery, depending upon the specific terms of the customer arrangement. For the Company's direct-to-consumer transactions, a contract exists when an order is placed online, and control transfers at the time of delivery of merchandise to the customer. Nearly all of the Company’s transactions with its customers include a single performance obligation delivered at a point in time.
The transaction price can include both fixed and variable consideration. In most cases, it is entirely comprised of variable consideration with the variability driven by expected sales discounts, markdown support, and other incentives and allowances offered to customers. These incentives may be explicit or implied by the Company's historical business practices.
68
e.l.f. Beauty, Inc. and subsidiaries
Notes to consolidated financial statements
Generally, these commitments represent cash consideration paid to a customer and do not constitute a promised good or service.
The amount of variable consideration is estimated at the time of sale based on either the expected amount or the most likely amount, depending on the nature of the variability. The Company regularly reviews and revises, when deemed necessary, its estimates of variable consideration, based on both customer-specific expectations as well as historical rates of realization. A provision for customer incentives and allowances is included on the consolidated balance sheet, net against accounts receivable.
Disaggregated revenue
The Company distributes product both through national and international retailers as well as direct-to-consumers through its e-commerce and e.l.f. stores channels (prior to February 2019). The marketing and consumer engagement benefits that the direct channels provide are integral to the Company’s brand and product development strategy and drive sales across channels. As such, the Company views its
two
primary distribution channels as components of one integrated business, as opposed to discrete revenue streams.
The Company sells a variety of beauty products but does not consider them to be meaningfully different revenue streams given similarities in the nature of the products, the target consumer, and the innovation and distribution processes. See
Segment Reporting
section above for the table providing disaggregated revenue from contracts with customers by geographical market, as the nature, amount, timing and uncertainty of revenue and cash flows can differ between domestic and international customers.
Contract assets and liabilities
The Company extends credit to retail customers based upon an evaluation of their credit quality. The majority of retail customers obtain payment terms between 30-60 days, and a contract asset is recognized for the related accounts receivable. Additionally, shipping terms can vary, giving rise to contract liabilities for contracts where payment has been received in advance of delivery. The contract liability balance can vary significantly depending on the timing of when an order is placed and when shipment or delivery occurs.
As of
March 31, 2020
, other than accounts receivable, the Company had no material contract assets, contract liabilities or deferred contract costs recorded on its consolidated balance sheet.
Practical expedients
The Company elected to record revenue net of taxes collected from customers and exclude the amounts from the transaction price. The Company includes in revenue any taxes assessed on the Company's total gross receipts for which it has the primary responsibility to pay the tax.
The Company elected not to disclose revenues related to remaining performance obligations for partially completed or unfulfilled contracts that are expected to be fulfilled within one year as such amounts were insignificant.
69
e.l.f. Beauty, Inc. and subsidiaries
Notes to consolidated financial statements
A reconciliation of the beginning and ending amounts of the reserve for sales adjustments for the years ended
March 31, 2020
, December 31,
2018
and
2017
, and the transition period for the three months ended
March 31, 2019
is as follows (in thousands):
|
Balance as of December 31, 2016
|
11,927
|
|
|
|
Charges
|
25,680
|
|
|
|
Deductions
|
(29,149
|
)
|
|
|
Balance as of December 31, 2017
|
$
|
8,458
|
|
|
Charges
|
26,971
|
|
|
|
Deductions
|
(27,655
|
)
|
|
|
Balance as of December 31, 2018
|
7,774
|
|
|
|
Charges
|
6,787
|
|
|
|
Deductions
|
(8,016
|
)
|
|
|
Balance as of March 31, 2019
|
6,545
|
|
|
|
Charges
|
29,576
|
|
|
|
Deductions
|
(28,508
|
)
|
|
|
Balance as of March 31, 2020
|
$
|
7,613
|
|
In the years ended
March 31, 2020
, December 31,
2018
and
2017
, and the transition period for the three months ended
March 31, 2019
, the Company recorded
$0.7 million
,
$0.5 million
,
$0.7 million
and
$0.2 million
, respectively, of reimbursed shipping expenses from customers within revenues. The shipping and handling costs associated with product distribution were
$19.8 million
,
$20.9 million
,
$21.2 million
and
$4.9 million
, in the years ended
March 31, 2020
, December 31,
2018
and
2017
, and the transition period for the three months ended
March 31, 2019
, respectively, and are included in selling, general and administrative expenses in the consolidated statements of operations.
Income taxes
Income taxes are accounted for under the asset and liability method. Deferred tax assets and liabilities are recognized for the future tax consequences attributable to differences between the financial statement carrying amounts of existing assets and liabilities and their respective tax bases and operating loss and tax credit carryforwards. Deferred tax assets and liabilities are measured using enacted tax rates expected to apply to taxable income in the years in which those temporary differences are expected to be recovered or settled. The effect on deferred tax assets and liabilities of a change in tax rates is recognized in income in the period that includes the enactment date. Valuation allowances are recorded to reduce deferred tax assets when it is more likely than not that a tax benefit will not be realized.
Future income tax benefits are recognized to the extent that realization of such benefits is more likely than not. The Company recognizes interest and penalties, if any, related to unrecognized tax benefits in its income tax provision.
Leases
The Company has entered into operating lease agreements for office space, warehouse and a retail store location, equipment and software. Lease assets and liabilities are recognized at the present value of the minimum rental payments (excluding executory costs) and expected payment under any residual value guarantee at the lease commencement date. The Company uses its incremental borrowing rate to determine the present value of lease payments.
Non-lease components primarily include payments for maintenance and utilities. The Company accounts for the non-lease components in a contract (e.g., common area maintenance) as part of the lease component by electing practical expedient for all leases of commercial office and warehouse space, as the non-lease components are not a significant portion of the total consideration in those agreements. The Company's lease terms include periods under options to extend or terminate the lease when it is reasonably certain that the Company will exercise that option.
Operating lease assets and liabilities are included on the Company's Consolidated Balance Sheet beginning January 1, 2019. The current portion of the Company's operating lease liabilities is included in accrued expenses and other current liabilities, and the long-term portion is included in long-term operating lease liabilities. Finance lease assets are included in other
70
e.l.f. Beauty, Inc. and subsidiaries
Notes to consolidated financial statements
assets. Finance lease liabilities are included in long-term debt and finance lease obligations. Operating lease expense is recognized on a straight-line basis over the lease term.
Foreign currency
The functional currency of the Company’s foreign subsidiaries is the U.S. dollar. Transactions denominated in currencies other than the functional currency are recorded at exchange rates in effect on the date of the transaction. At the end of each reporting period, monetary assets and liabilities are remeasured to the functional currency using exchange rates in effect at the balance sheet date. Non-monetary assets and liabilities are remeasured at historical exchange rates. Transaction gains or losses that arise from exchange rate fluctuations on transactions denominated in a currency other than the functional currency are included in other income (expense), net in the consolidated statements of operations.
Stock-based compensation
Stock-based compensation cost is measured at the grant date, based on the fair value of the award, and is recognized on a straight-line basis over the requisite service period, which is generally the award’s vesting period. The Company estimates the fair value of employee stock-based payment awards subject to only a service condition on the date of grant using the Black-Scholes valuation model. The Black-Scholes model requires the use of highly subjective and complex assumptions, including the option’s expected term and the price volatility of the underlying stock.
The Company estimates the fair value of employee stock-based payment awards subject to market conditions using a Monte Carlo simulation model. Compensation expense for employee stock-based awards whose vesting is subject to the fulfillment of both a market condition and the occurrence of a performance condition is recognized on a graded-vesting basis at the time the achievement of the performance condition becomes probable.
Forfeitures are recognized and accounted for as they occur.
Advertising costs
Advertising costs, including promotions and print, are expensed as incurred or distributed. Advertising costs are included in selling, general, and administrative expenses in the accompanying consolidated statements of operations and amounted to approximately
$26.0 million
,
$10.2 million
,
$8.1 million
and
$2.6 million
in the years ended
March 31, 2020
, December 31,
2018
and
2017
, and the transition period for the three months ended
March 31, 2019
, respectively.
Net income (loss) per share
Basic net income (loss) per share is computed using net income (loss) available to common stockholders divided by the weighted-average number of common shares outstanding during the period. Diluted net income (loss) per share reflects the dilutive effects of stock options and restricted stock outstanding during the period, to the extent such securities would not be anti-dilutive and is determined using the treasury stock method.
71
e.l.f. Beauty, Inc. and subsidiaries
Notes to consolidated financial statements
Recent accounting pronouncements
The following table provides a brief description of recent accounting pronouncements that could have a material effect on the Company’s financial statements:
|
Recently adopted accounting standards
|
|||
|
Standard
|
Description
|
Date of expected adoption/adoption
|
Effect on the financial statements or other significant matters
|
|
ASU 2018-07,
Nonemployee share-based payment accounting improvements
|
The standard modifies the accounting for share-based payment awards issued to nonemployees to largely align it with the accounting for share-based payment awards issued to employees. ASU 2018-07 is effective for annual periods beginning after December 15, 2018.
|
January 1, 2019
|
The Company adopted ASU 2018-07 on January 1, 2019. The adoption did not have a material impact to the Company's consolidated financial statements.
|
|
ASU 2016-02, Leases
(Topic 842)
|
The standard requires lessees to recognize a right-of-use asset and a lease liability for virtually all of their leases (other than leases that meet the definition of a short-term lease). The liability is equal to the present value of lease payments. The asset is based on the liability, subject to adjustment, such as for initial direct costs. Lessor accounting is similar to the current model, but updated to align with certain changes to the lessee model (e.g., certain definitions, such as initial direct costs, have been updated) and the new revenue recognition standard. It requires a modified retrospective approach for all leases existing at, or entered into after, the date of initial application.
|
January 1, 2019
|
The Company adopted ASC 842 on a modified retrospective basis on January 1, 2019. The results for periods beginning after January 1, 2019 are presented under ASC 842, while comparative information has not been restated and continues to be reported under the accounting standards in effect for those periods. The adoption of the new standard resulted in the recognition of the right of use (“ROU”) assets and lease liabilities for operating leases of approximately $21.2 million and $23.5 million, respectively, as of January 1, 2019, with corresponding adjustments to prepaid and deferred rent. As discussed in Note 15, “Restructuring and other related costs,” these assets and liabilities were subsequently adjusted as a result of the closure of all 22 e.l.f. retail stores in February 2019. The adoption of the standard did not impact the Company's beginning retained earnings, its consolidated statements of operations or cash flows.
|
72
e.l.f. Beauty, Inc. and subsidiaries
Notes to consolidated financial statements
|
Standards that are not yet adopted
|
|||
|
Standard
|
Description
|
Date of expected adoption/adoption
|
Effect on the financial statements or other significant matters
|
|
ASU 2018-15, Intangibles-Goodwill and Other- Internal-Use Software
(Subtopic 350-40)
|
The standard will require customers in a cloud computing arrangement that is a service contract to follow the internal-use software guidance in ASC 350-40 to determine which implementation costs to capitalize as assets or expense as incurred. Certain implementation costs incurred during the application development stage would be deferred and capitalized (e.g., costs of integration with on-premises software, coding, configuration, customization). Other costs incurred during the preliminary project and post-implementation stages would be expensed (e.g., planning the project, training, maintenance after implementation, data conversion). The amendments in the ASU can be applied either retrospectively or prospectively to all implementation costs incurred after the date of adoption.
|
April 1, 2020
|
The Company plans to adopt ASU 2018-15 prospectively, and the adoption of the standard is not expected to have a material impact on the Company’s consolidated financial statements.
|
73
e.l.f. Beauty, Inc. and subsidiaries
Notes to consolidated financial statements
Note 3—Transition Period
The Company is presenting its consolidated financial statements for the three month period ended March 31, 2019. The following tables provide certain unaudited comparative financial information for the same period of the prior year.
Consolidated Statements of Income
(in thousands, except share and per share data)
|
|
Three months ended March 31,
|
||||||
|
(unaudited)
|
|||||||
|
|
2019
|
2018
|
|||||
|
Net sales
|
$
|
66,141
|
|
$
|
65,920
|
|
|
|
Cost of sales
|
25,650
|
|
25,712
|
|
|||
|
Gross profit
|
40,491
|
|
40,208
|
|
|||
|
Selling, general and administrative expenses
|
37,324
|
|
36,234
|
|
|||
|
Restructuring expenses
|
22,176
|
|
—
|
|
|||
|
Operating income (loss)
|
(19,009
|
)
|
3,974
|
|
|||
|
Other expense, net
|
(315
|
)
|
(888
|
)
|
|||
|
Interest expense, net
|
(1,849
|
)
|
(1,963
|
)
|
|||
|
Income (loss) before provision for income taxes
|
(21,173
|
)
|
1,123
|
|
|||
|
Income tax benefit (provision)
|
3,259
|
|
(433
|
)
|
|||
|
Net income (loss)
|
$
|
(17,914
|
)
|
$
|
690
|
|
|
|
Comprehensive income (loss)
|
$
|
(17,914
|
)
|
$
|
690
|
|
|
|
Net income (loss) per share:
|
|||||||
|
Basic
|
$
|
(0.37
|
)
|
$
|
0.01
|
|
|
|
Diluted
|
$
|
(0.37
|
)
|
$
|
0.01
|
|
|
|
Weighted average shares outstanding:
|
|||||||
|
Basic
|
48,022,926
|
|
46,435,560
|
|
|||
|
Diluted
|
48,022,926
|
|
49,302,771
|
|
|||
74
e.l.f. Beauty, Inc. and subsidiaries
Notes to consolidated financial statements
Consolidated Statements of Cash Flows
(in thousands)
|
|
Three months ended March 31,
|
||||||
|
(unaudited)
|
|||||||
|
|
2019
|
2018
|
|||||
|
Cash flows from operating activities:
|
|
|
|||||
|
Net income (loss)
|
$
|
(17,914
|
)
|
$
|
690
|
|
|
|
Adjustments to reconcile net income (loss) to net cash provided by
operating activities:
|
|
|
|||||
|
Depreciation and amortization
|
7,544
|
|
4,288
|
|
|||
|
Restructuring loss
|
22,176
|
|
—
|
|
|||
|
Stock-based compensation expense
|
3,683
|
|
3,640
|
|
|||
|
Amortization of debt issuance costs and discount on debt
|
190
|
|
199
|
|
|||
|
Deferred income taxes
|
(3,433
|
)
|
735
|
|
|||
|
Other, net
|
242
|
|
142
|
|
|||
|
Changes in operating assets and liabilities:
|
|
|
|
|
|||
|
Accounts receivable
|
4,215
|
|
12,771
|
|
|||
|
Inventories
|
2,561
|
|
951
|
|
|||
|
Prepaid expenses and other assets
|
(1,732
|
)
|
(1,498
|
)
|
|||
|
Accounts payable and accrued expenses
|
(6,021
|
)
|
(16,891
|
)
|
|||
|
Other liabilities
|
(3,295
|
)
|
3
|
|
|||
|
Net cash provided by operating activities
|
8,216
|
|
5,030
|
|
|||
|
Cash flows from investing activities:
|
|
|
|
|
|||
|
Purchase of property and equipment
|
(3,400
|
)
|
(2,667
|
)
|
|||
|
Net cash used in investing activities
|
(3,400
|
)
|
(2,667
|
)
|
|||
|
Cash flows from financing activities:
|
|
|
|
|
|||
|
Proceeds from revolving line of credit
|
—
|
|
2,000
|
|
|||
|
Repayment of revolving line of credit
|
—
|
|
(2,000
|
)
|
|||
|
Repayment of long-term debt
|
(2,063
|
)
|
(2,063
|
)
|
|||
|
Cash received from issuance of common stock
|
115
|
|
212
|
|
|||
|
Other, net
|
(199
|
)
|
(97
|
)
|
|||
|
Net cash used in financing activities
|
(2,147
|
)
|
(1,948
|
)
|
|||
|
Net increase in cash and cash equivalents
|
2,669
|
|
415
|
|
|||
|
Cash and cash equivalents - beginning of period
|
51,205
|
|
10,059
|
|
|||
|
Cash and cash equivalents - end of period
|
$
|
53,874
|
|
$
|
10,474
|
|
|
Note 4 —Acquisitions
On February 24, 2020, the Company, through its wholly owned subsidiary, e.l.f. Cosmetics, Inc., completed its acquisition of W3LL People, a Santa Fe, New Mexico-based privately held, clean beauty company with a mission to create premium quality cosmetics without using the potentially harmful artificial chemicals found in most conventional makeup. The purchase price of
$25.9 million
was in all cash and the total consideration in connection with the acquisition is subject to
75
e.l.f. Beauty, Inc. and subsidiaries
Notes to consolidated financial statements
adjustment based on (i) purchase price adjustment provisions and (ii) indemnification obligations of W3LL People’s stockholders after the closing of the acquisition.
The acquisition has been accounted for as a business combination under the acquisition method and, accordingly, the total purchase price is allocated to the tangible and intangible assets acquired and the liabilities assumed based on their respective fair values on the acquisition date. The final purchase price allocation is pending the finalization of deferred tax calculations and residual goodwill. W3LL People's results of operations have been included in the Company's consolidated financial statements from the date of acquisition.
The following table presents the purchase price allocation recorded in the Company's consolidated balance sheets on the acquisition date (in thousands):
|
March 31, 2020
|
||||
|
Net tangible assets
|
$
|
2,239
|
|
|
|
Goodwill
(1)
|
14,057
|
|
||
|
Intangible assets
|
12,340
|
|
||
|
Net deferred tax liability
|
(2,713
|
)
|
||
|
Total purchase price consideration
|
$
|
25,923
|
|
|
|
(1)
|
The goodwill represents the excess value over both tangible and intangible assets acquired and liabilities assumed. The goodwill recognized in this transaction is primarily attributable to expected operational synergies. None of the goodwill is expected to be deductible for tax purposes.
|
Intangible Assets
|
Fair Value
|
Estimated Useful Life
|
|||||
|
(in thousands)
|
(in years)
|
|||||
|
Customer relationships - retailers
|
$
|
8,800
|
|
10
|
||
|
Customer relationships - e-commerce
|
40
|
|
3
|
|||
|
Trademarks
|
3,500
|
|
10
|
|||
|
Total identified intangible assets
|
$
|
12,340
|
|
|||
Note 5—Investment in equity securities
On
April 14, 2017,
the Company invested
$2.9 million
in a social media analytics company, which is included in investments on its consolidated balance sheets. The Company has elected the measurement alternative for equity investments that do not have readily determinable fair values. The Company did not record an impairment charge on its investment during the years ended
March 31, 2020
, December 31,
2018
or
2017
, or the transition period for the three months ended
March 31, 2019
, as any identified events or changes in circumstances did not result in an indicator for impairment. Further, there were no observable price changes in orderly transactions for the identical or a similar investment of the same issuer during the years ended
March 31, 2020
, December 31,
2018
or
2017
, or the transition period for the three months ended
March 31, 2019
.
76
e.l.f. Beauty, Inc. and subsidiaries
Notes to consolidated financial statements
Note 6—Goodwill and other intangible assets
Information regarding the Company’s goodwill and intangible assets as of
March 31, 2020
is as follows (in thousands):
|
|
Estimated useful life
|
Gross carrying amount
|
Accumulated amortization
|
Net carrying amount
|
|||||||||
|
Customer relationships – retailers
|
10 years
|
$
|
77,600
|
|
$
|
(42,500
|
)
|
$
|
35,100
|
|
|||
|
Customer relationships – e-commerce
|
3 years
|
3,940
|
|
(3,901
|
)
|
39
|
|
||||||
|
Trademarks
|
10 years
|
3,500
|
|
(29
|
)
|
3,471
|
|
||||||
|
Total finite-lived intangibles
|
85,040
|
|
(46,430
|
)
|
38,610
|
|
|||||||
|
Trademarks
|
Indefinite
|
63,800
|
|
—
|
|
63,800
|
|
||||||
|
Goodwill
|
171,321
|
|
—
|
|
171,321
|
|
|||||||
|
Total goodwill and other intangibles
|
$
|
320,161
|
|
$
|
(46,430
|
)
|
$
|
273,731
|
|
||||
Information regarding the Company’s goodwill and intangible assets as of
March 31, 2019
is as follows (in thousands):
|
|
Estimated useful life
|
Gross carrying amount
|
Accumulated amortization
|
Net carrying amount
|
|||||||||
|
Customer relationships – retailers
|
10 years
|
$
|
68,800
|
|
$
|
(35,547
|
)
|
$
|
33,253
|
|
|||
|
Customer relationships – e-commerce
|
3 years
|
3,900
|
|
(3,900
|
)
|
—
|
|
||||||
|
Total finite-lived intangibles
|
|
72,700
|
|
(39,447
|
)
|
33,253
|
|
||||||
|
Trademarks
|
Indefinite
|
63,800
|
|
—
|
|
63,800
|
|
||||||
|
Goodwill
|
|
157,264
|
|
—
|
|
157,264
|
|
||||||
|
Total goodwill and other intangibles
|
|
$
|
293,764
|
|
$
|
(39,447
|
)
|
$
|
254,317
|
|
|||
Information regarding the Company’s goodwill and intangible assets as of December 31, 2018 is as follows (in thousands):
|
|
Estimated useful life
|
Gross carrying amount
|
Accumulated amortization
|
Net carrying amount
|
|||||||||
|
Customer relationships – retailers
|
10 years
|
$
|
68,800
|
|
$
|
(33,827
|
)
|
$
|
34,973
|
|
|||
|
Customer relationships – e-commerce
|
3 years
|
3,900
|
|
(3,900
|
)
|
—
|
|
||||||
|
Total finite-lived intangibles
|
72,700
|
|
(37,727
|
)
|
34,973
|
|
|||||||
|
Trademarks
|
Indefinite
|
63,800
|
|
—
|
|
63,800
|
|
||||||
|
Goodwill
|
157,264
|
|
—
|
|
157,264
|
|
|||||||
|
Total goodwill and other intangibles
|
$
|
293,764
|
|
$
|
(37,727
|
)
|
$
|
256,037
|
|
||||
The Company has not recognized any impairment charges on its goodwill or intangible assets, as the anticipated future cash flows generated by each of these assets remain substantially in excess of their carrying values. Amortization expense on the finite-lived intangible assets was
$7.0 million
,
$7.1 million
,
$7.1 million
and
$1.7 million
for the year ended
March 31, 2020
, the years ended December 31,
2018
, and
2017
and the transition period for the three months ended
March 31, 2019
, respectively.
77
e.l.f. Beauty, Inc. and subsidiaries
Notes to consolidated financial statements
The estimated future amortization expense related to the finite-lived intangible assets, assuming
no
impairment as of
March 31, 2020
, is as follows (in thousands):
|
Year ending March 31,
|
|||
|
2021
|
$
|
8,123
|
|
|
2022
|
8,123
|
|
|
|
2023
|
8,122
|
|
|
|
2024
|
6,963
|
|
|
|
2025
|
1,230
|
|
|
|
Thereafter
|
6,049
|
|
|
|
Total
|
$
|
38,610
|
|
Note 7—Property and equipment
Property and equipment as of
March 31, 2020
,
March 31, 2019
and December 31, 2018 consists of the following (in thousands):
|
|
March 31, 2020
|
March 31, 2019
|
December 31, 2018
|
||||||||
|
Machinery, equipment and software
|
$
|
15,327
|
|
$
|
9,407
|
|
$
|
13,007
|
|
||
|
Leasehold improvements
|
3,459
|
|
2,157
|
|
9,549
|
|
|||||
|
Furniture and fixtures
|
708
|
|
684
|
|
3,027
|
|
|||||
|
Store fixtures
|
10,302
|
|
11,879
|
|
13,481
|
|
|||||
|
Property and equipment, gross
|
29,796
|
|
24,127
|
|
39,064
|
|
|||||
|
Less: Accumulated depreciation and amortization
|
(12,625
|
)
|
(8,121
|
)
|
(17,260
|
)
|
|||||
|
Property and equipment, net
|
$
|
17,171
|
|
$
|
16,006
|
|
$
|
21,804
|
|
||
Depreciation and amortization expense on property and equipment was
$6.3 million
,
$7.6 million
, and
$6.8 million
and
$1.7 million
during the years ended
March 31, 2020
, the year ended December 31,
2018
and
2017
and the transition period for the three months ended
March 31, 2019
, respectively.
Note 8—Accrued expenses and other current liabilities
Accrued expenses and other current liabilities as of
March 31, 2020
,
March 31, 2019
and December 31,
2018
consists of the following (in thousands):
|
|
March 31, 2020
|
March 31, 2019
|
December 31, 2018
|
||||||||
|
Accrued expenses
|
$
|
12,518
|
|
$
|
9,594
|
|
$
|
8,783
|
|
||
|
Current portion of operating lease liabilities
|
3,083
|
|
4,172
|
|
—
|
|
|||||
|
Accrued compensation
|
9,542
|
|
3,200
|
|
1,983
|
|
|||||
|
Other current liabilities
|
1,022
|
|
1,624
|
|
1,905
|
|
|||||
|
Accrued expenses and other current liabilities
|
$
|
26,165
|
|
$
|
18,590
|
|
$
|
12,671
|
|
||
Note 9—Fair value of financial instruments
The fair value of financial instruments are categorized based upon the level of judgment associated with the inputs used to measure their fair values. Fair value is measured using inputs from the three levels of the fair value hierarchy, which are described as follows:
Level 1
—Quoted prices in active markets for identical assets or liabilities
78
e.l.f. Beauty, Inc. and subsidiaries
Notes to consolidated financial statements
Level 2
—Quoted prices for similar assets and liabilities in active markets or inputs that are observable
Level 3
—Inputs that are unobservable (for example, cash flow modeling inputs based on management’s assumptions)
The assets’ or liabilities’ fair value measurement level within the fair value hierarchy is based on the lowest level of any input that is significant to the fair value measurement. The following table sets forth the fair value of the Company’s financial liabilities by level within the fair value hierarchy as of
March 31, 2020
(in thousands):
|
|
|
Fair value measurements using
|
|||||||||||||
|
|
Fair value
|
Level 1
|
Level 2
|
Level 3
|
|||||||||||
|
Financial liabilities:
|
|
|
|
|
|||||||||||
|
Long-term debt, including current portion
(1)
|
$
|
138,865
|
|
$
|
—
|
|
$
|
138,865
|
|
$
|
—
|
|
|||
|
Total financial liabilities
|
$
|
138,865
|
|
$
|
—
|
|
$
|
138,865
|
|
$
|
—
|
|
|||
__________________________
(1)
Of this amount,
$12,568
is classified as current. The gross carrying amounts of the Company’s bank debt, before reduction of the debt issuance costs, approximate their fair values as the stated rates approximate market rates for loans with similar terms.
The following table sets forth the fair value of the Company’s financial liabilities by level within the fair value hierarchy as of
March 31, 2019
(in thousands):
|
|
|
Fair value measurements using
|
|||||||||||||
|
|
Fair value
|
Level 1
|
Level 2
|
Level 3
|
|||||||||||
|
Financial liabilities:
|
|
|
|
|
|||||||||||
|
Long-term debt, including current portion
(1)
|
$
|
148,593
|
|
$
|
—
|
|
$
|
148,593
|
|
$
|
—
|
|
|||
|
Total financial liabilities
|
$
|
148,593
|
|
$
|
—
|
|
$
|
148,593
|
|
$
|
—
|
|
|||
__________________________
(1)
Of this amount,
$10,259
is classified as current. The gross carrying amounts of the Company’s bank debt, before reduction of the debt issuance costs, approximate their fair values as the stated rates approximate market rates for loans with similar terms.
The following table sets forth the fair value of the Company’s financial liabilities by level within the fair value hierarchy as of December 31,
2018
(in thousands):
|
|
|
Fair value measurements using
|
|||||||||||||
|
|
Fair value
|
Level 1
|
Level 2
|
Level 3
|
|||||||||||
|
Financial liabilities:
|
|
|
|
|
|||||||||||
|
Long-term debt, including current portion
(1)
|
$
|
150,719
|
|
$
|
—
|
|
$
|
150,719
|
|
$
|
—
|
|
|||
|
Total financial liabilities
|
$
|
150,719
|
|
$
|
—
|
|
$
|
150,719
|
|
$
|
—
|
|
|||
__________________________
(1)
Of this amount,
$9,861
is classified as current. The gross carrying amounts of the Company’s bank debt, before reduction of the debt issuance costs, approximate their fair values as the stated rates approximate market rates for loans with similar terms.
The Company classifies its cash equivalents, primarily, its money market funds within Level 1 based on quoted market prices in active markets for identical assets. The Company did not transfer any assets measured at fair value on a recurring basis to or from Level 1 or Level 2 for any of the periods presented.
79
e.l.f. Beauty, Inc. and subsidiaries
Notes to consolidated financial statements
Note 10—Debt
The following summarizes the recent significant transactions impacting the Company’s indebtedness:
|
•
|
On January 31, 2014, the Company entered into a senior secured credit facility (the “2014 Senior Secured Credit Facility”), which consisted of a
$20.0 million
revolving line of credit and a
$105.0 million
term loan. Also, on January 31, 2014, the Company entered into a
$40.0 million
second lien term loan (the “Second Lien Term Loan”).
|
|
•
|
On June 7, 2016, the Company incurred an incremental
$64.0 million
in term loan borrowings under the 2014 Senior Secured Credit Facility to fund, in part, a
$72.0 million
special dividend to stockholders, and increased the total availability under the revolving credit facility to
$25.0 million
.
|
|
•
|
On September 27, 2016, the Company used a portion of the proceeds from the initial public offering to repay the entire outstanding balance of
$40.0 million
from the Second Lien Term Loan.
|
|
•
|
On December 23, 2016, the Company refinanced its outstanding obligations under the 2014 Senior Secured Credit Facility, entering into a new
5
-year,
$200.0 million
senior secured credit agreement, as further described below.
|
|
•
|
On August 25, 2017, the Company amended its senior secured credit agreement to increase the total availability under the revolving line of credit to $
50.0 million
and to lower the interest rates and extend the maturity date to
August 25, 2022
.
|
|
•
|
On April 8, 2020, the Company amended its senior secured credit agreement to modify the Company’s quarterly maintenance covenants, and to add interest rates with respect to borrowings associated with the added increased maximum permitted total net leverage ratios.
|
The Company’s outstanding debt as of
March 31, 2020
, March 31, 2019 and December 31, 2018 consists of the following (in thousands):
|
|
March 31, 2020
|
March 31, 2019
|
December 31, 2018
|
||||||||
|
Debt:
|
|
||||||||||
|
Term loan
|
$
|
135,853
|
|
$
|
144,810
|
|
$
|
146,737
|
|
||
|
Finance lease obligations
|
3,012
|
|
3,783
|
|
3,982
|
|
|||||
|
Total debt
|
138,865
|
|
148,593
|
|
150,719
|
|
|||||
|
Less: debt issuance costs
|
(209
|
)
|
(309
|
)
|
(335
|
)
|
|||||
|
Total debt, net of issuance costs
|
138,656
|
|
148,284
|
|
150,384
|
|
|||||
|
Less: current portion
|
(12,568
|
)
|
(10,259
|
)
|
(9,861
|
)
|
|||||
|
Long-term portion of debt
|
$
|
126,088
|
|
$
|
138,025
|
|
$
|
140,523
|
|
||
Senior secured credit agreement, as amended
On December 23, 2016, the Company entered into a
five
-year,
$200.0 million
Senior Secured Credit Agreement (as amended, the "Credit Agreement") with a syndicate consisting of several large financial institutions. The Credit Agreement was first amended on August 25, 2017 (the "First Amendment"), increasing the aggregate commitments to $
215.0 million
. The Credit Agreement, as amended, consists of a $
50.0 million
revolving line of credit (the “Revolving Credit Facility”) and a $
165.0 million
term loan (the “Term Loan Facility”). The Credit Agreement was amended again on December 7, 2018 to reflect the change in the Company's fiscal year-end from December 31 to March 31, and amended again on April 8, 2020 (the "Third Amendment") to (i) increase the maximum permitted total net leverage ratio for certain fiscal quarters, (ii) reduce the minimum fixed charge coverage ratio for certain fiscal quarters, (iii) add additional interest rates to correspond to the increased maximum permitted total net leverage ratios, (iv) increase the amount of cash netted in the calculation of the consolidated total net leverage ratio, and (v) amend the language around the level of add backs to the adjusted consolidated EBITDA definition.
All amounts under the Revolving Credit Facility are available for draw until the maturity date on August 25, 2022. The Revolving Credit Facility is collateralized by substantially all of the Company’s assets and requires payment of an unused fee ranging from
0.35%
to
0.25%
(based on the Company’s consolidated total net leverage ratio) times the average daily
80
e.l.f. Beauty, Inc. and subsidiaries
Notes to consolidated financial statements
amount of unutilized commitments under the Revolving Credit Facility. The Revolving Credit Facility also provides for sub-facilities in the form of a
$7.0 million
letter of credit and a
$5.0 million
swing line loan; however, all amounts under the Revolving Credit Facility cannot exceed
$50.0 million
. The unused balance of the Revolving Credit Facility as of
March 31, 2020
was
$49.8 million
.
The Term Loan Facility maturity date is also
August 25, 2022
and is collateralized by substantially all of the Company’s assets. Amortization installment payments on the Term Loan Facility are required to be made in
quarterly
installments of (i)
$2,475,000
for fiscal quarters ending September 30, 2019 through June 30, 2020, (ii)
$3,093,750
for fiscal quarters ending September 30, 2020 through June 30, 2021 and (iii)
$4,125,000
for fiscal quarters ending September 30, 2021 through June 30, 2022. The remaining Term Loan Facility balance is due upon the maturity date. The Term Loan Facility can be prepaid at any time without penalty and is subject to mandatory prepayments when there is (i) excess cash flow, which is defined as EBITDA less certain customary deductions, (ii) non-ordinary course asset dispositions that result in net proceeds in excess of
$2.5 million
during a year, unless reinvested within twelve months, or (iii) issuance of additional debt.
Both the Revolving Credit Facility and the Term Loan Facility bear interest, at the Company’s option, at either a rate per annum equal to either (i) a rate per annum equal to an adjusted LIBOR rate determined by reference to the cost of funds for U.S. dollar deposits for the applicable interest period (subject to a minimum floor of
0%
) plus an applicable margin ranging from
1.50%
to
3.25%
(amended from
1.50%
to
2.75%
as previously set forth in the Credit Agreement) based on the Company’s consolidated total net leverage ratio or (ii) a floating base rate plus an applicable margin ranging from
0.50%
to
2.25%
(amended from
0.50%
to
1.75%
) based on the Company’s consolidated total net leverage ratio. The interest rate for the Term Loan Facility as of
March 31, 2020
was approximately
3.2%
.
The Credit Agreement contains a number of covenants that, among other things, restrict the Company's ability to (subject to certain exceptions) pay dividends and distributions or repurchase the Company's capital stock, incur additional indebtedness, create liens on assets, engage in mergers or consolidations and sell or otherwise dispose of assets. The Credit Agreement also includes reporting, financial and maintenance covenants that require the Company to, among other things, comply with certain consolidated total net leverage ratios and consolidated fixed charge coverage ratios. As of
March 31, 2020
,
March 31, 2019
and December 31,
2018
, the Company was in compliance with all financial covenants.
Aggregate future minimum principal payments are as follows (in thousands):
|
Year ending March 31,
|
Term Loan
|
||
|
2021
|
$
|
11,756
|
|
|
2022
|
15,469
|
|
|
|
2023
|
109,725
|
|
|
|
Total
|
$
|
136,950
|
|
Interest expense
The components of interest expense, net are as follows (in thousands)
:
|
Year ended
March 31,
|
Three months ended March 31,
(transition period)
|
Year ended
December 31,
|
|||||||||||||
|
|
2020
|
2019
|
2018
|
2017
|
|||||||||||
|
Interest on term loan debt
|
$
|
6,096
|
|
$
|
1,774
|
|
$
|
6,774
|
|
$
|
7,271
|
|
|||
|
Amortization of debt issuance costs
|
747
|
|
190
|
|
792
|
|
810
|
|
|||||||
|
Interest on revolving line of credit
|
149
|
|
40
|
|
132
|
|
526
|
|
|||||||
|
Interest on finance leases
|
179
|
|
50
|
|
155
|
|
168
|
|
|||||||
|
Interest income
|
(863
|
)
|
(205
|
)
|
(37
|
)
|
—
|
|
|||||||
|
Interest expense, net
|
$
|
6,308
|
|
$
|
1,849
|
|
$
|
7,816
|
|
$
|
8,775
|
|
|||
Note 11—Contingencies
Legal Contingencies
81
e.l.f. Beauty, Inc. and subsidiaries
Notes to consolidated financial statements
From time to time, the Company is presently involved in legal proceedings, claims, and litigation arising in the ordinary course of business. The Company is not currently a party to any matters that management expects will have a material adverse effect on the Company’s consolidated financial position, results of operations or cash flows.
Note 12—Income taxes
On March 27, 2020, the CARES Act was signed into law making several changes to the Internal Revenue Code. The changes include but are not limited to: increasing the limitation on the amount of deductible interest expense, allowing companies to carryback certain net operating losses and increasing the amount of net operating loss carryforwards that corporations can use to offset taxable income. The tax law changes in the CARES Act did not have a material impact on the Company’s income tax provision.
The components of income (loss) before provision for income taxes are as follows (in thousands):
|
Year ended
March 31, |
Three months ended March 31,
(transition period) |
Year ended
December 31, |
|||||||||||||
|
|
2020
|
2019
|
2018
|
2017
|
|||||||||||
|
Domestic
|
$
|
24,479
|
|
$
|
(21,673
|
)
|
$
|
17,405
|
|
$
|
22,409
|
|
|||
|
Foreign
|
(410
|
)
|
500
|
|
551
|
|
60
|
|
|||||||
|
Total
|
$
|
24,069
|
|
$
|
(21,173
|
)
|
$
|
17,956
|
|
$
|
22,469
|
|
|||
The components of the benefit (provision) for income taxes are as follows (in thousands):
|
Year ended
March 31,
|
Three months ended March 31,
(transition period) |
Year ended
December 31, |
|||||||||||||
|
|
2020
|
2019
|
2018
|
2017
|
|||||||||||
|
Current:
|
|
|
|||||||||||||
|
U.S. federal
|
$
|
(2,681
|
)
|
$
|
(13
|
)
|
$
|
(2,414
|
)
|
$
|
(2,058
|
)
|
|||
|
State
|
(1,066
|
)
|
(139
|
)
|
(948
|
)
|
(369
|
)
|
|||||||
|
Foreign
|
5
|
|
(22
|
)
|
(8
|
)
|
—
|
|
|||||||
|
Total current
|
(3,742
|
)
|
(174
|
)
|
(3,370
|
)
|
(2,427
|
)
|
|||||||
|
Deferred:
|
|
|
|
|
|
|
|
|
|||||||
|
U.S. federal
|
(2,532
|
)
|
3,096
|
|
1,005
|
|
13,246
|
|
|||||||
|
State
|
99
|
|
368
|
|
101
|
|
(21
|
)
|
|||||||
|
Foreign
|
(10
|
)
|
(31
|
)
|
(167
|
)
|
208
|
|
|||||||
|
Total deferred
|
(2,443
|
)
|
3,433
|
|
939
|
|
13,433
|
|
|||||||
|
Total (provision) benefit for income taxes
|
$
|
(6,185
|
)
|
$
|
3,259
|
|
$
|
(2,431
|
)
|
$
|
11,006
|
|
|||
82
e.l.f. Beauty, Inc. and subsidiaries
Notes to consolidated financial statements
Effective January 1, 2018, the federal statutory rate decreased from 35% to 21% as a result of the enactment of the 2017 Tax Act. The following table presents a reconciliation of the federal statutory rate to the Company’s effective tax rate
:
|
Year ended
March 31,
|
Three months ended March 31,
(transition period) |
Year ended
December 31, |
|||||||||
|
2020
|
2019
|
2018
|
2017
|
||||||||
|
Federal statutory rate
|
21.0
|
%
|
21.0
|
%
|
21.0
|
%
|
35.0
|
%
|
|||
|
Federal tax deferred rate change
|
—
|
%
|
—
|
%
|
—
|
%
|
(53.8
|
)%
|
|||
|
State tax, net of federal benefit
|
3.7
|
%
|
1.2
|
%
|
2.6
|
%
|
0.6
|
%
|
|||
|
State tax deferred rate change, net of federal benefit
|
0.1
|
%
|
—
|
%
|
0.9
|
%
|
0.9
|
%
|
|||
|
Nondeductible business expenses
|
0.8
|
%
|
(0.1
|
)%
|
1.4
|
%
|
—
|
%
|
|||
|
Provision-to-return adjustment
|
—
|
%
|
—
|
%
|
(3.9
|
)%
|
—
|
%
|
|||
|
Uncertain tax positions
|
(0.2
|
)%
|
(0.1
|
)%
|
(1.3
|
)%
|
(1.7
|
)%
|
|||
|
Stock based compensation
|
(0.4
|
)%
|
(6.1
|
)%
|
(8.6
|
)%
|
(28.1
|
)%
|
|||
|
Others
|
0.7
|
%
|
(0.5
|
)%
|
1.4
|
%
|
(1.9
|
)%
|
|||
|
Effective tax rate
|
25.7
|
%
|
15.4
|
%
|
13.5
|
%
|
(49.0
|
)%
|
|||
The components of net deferred taxes arising from temporary differences are as follows (in thousands):
|
March 31, 2020
|
March 31, 2019
|
December 31, 2018
|
|||||||||
|
Deferred tax assets:
|
|
|
|||||||||
|
Compensation
|
$
|
760
|
|
$
|
895
|
|
$
|
928
|
|
||
|
Inventories and receivables
|
3,472
|
|
2,915
|
|
3,008
|
|
|||||
|
Accrued expenses
|
1,996
|
|
667
|
|
424
|
|
|||||
|
Stock compensation
|
3,706
|
|
3,627
|
|
5,175
|
|
|||||
|
Net operating losses
|
92
|
|
236
|
|
43
|
|
|||||
|
Right of use liability
|
3,443
|
|
4,643
|
|
—
|
|
|||||
|
Other
|
558
|
|
736
|
|
898
|
|
|||||
|
Deferred tax assets
|
14,027
|
|
13,719
|
|
10,476
|
|
|||||
|
Deferred tax liabilities:
|
|||||||||||
|
Goodwill
|
3,468
|
|
2,857
|
|
2,618
|
|
|||||
|
Fixed assets
|
3,294
|
|
1,734
|
|
2,405
|
|
|||||
|
Intangible assets
|
25,287
|
|
24,077
|
|
24,591
|
|
|||||
|
Right of use asset
|
3,292
|
|
887
|
|
—
|
|
|||||
|
Other
|
563
|
|
892
|
|
1,023
|
|
|||||
|
Deferred tax liabilities
|
35,904
|
|
30,447
|
|
30,637
|
|
|||||
|
Net deferred tax liabilities
|
$
|
21,877
|
|
$
|
16,728
|
|
$
|
20,161
|
|
||
The deferred tax assets and liabilities are reported in the accompanying balance sheets as follows (in thousands)
:
|
March 31, 2020
|
March 31, 2019
|
December 31, 2018
|
|||||||||
|
Deferred tax assets
|
$
|
15
|
|
$
|
25
|
|
$
|
56
|
|
||
|
Deferred tax liabilities
|
21,892
|
|
16,753
|
|
20,217
|
|
|||||
|
Net deferred tax liabilities
|
$
|
21,877
|
|
$
|
16,728
|
|
$
|
20,161
|
|
||
83
e.l.f. Beauty, Inc. and subsidiaries
Notes to consolidated financial statements
At
March 31, 2020
, the Company had gross federal and state net operating loss carryforwards of
$0.4 million
and
$0.3 million
, respectively. The federal net operating loss carryforwards can either be carried forward
20 years
or indefinitely. The state net operating loss carryforwards have a carryforward period of
5
-
20 years
. The net operating loss carryforwards will begin to expire in
2037
.
A reconciliation of the beginning and ending amount of unrecognized tax benefits is as follows (in thousands):
|
Year ended
March 31,
|
Three months ended March 31,
(transition period) |
Year ended
December 31, |
|||||||||||||
|
|
2020
|
2019
|
2018
|
2017
|
|||||||||||
|
Balance at beginning of year
|
$
|
581
|
|
$
|
571
|
|
$
|
764
|
|
$
|
1,208
|
|
|||
|
Increases for prior year tax positions
|
32
|
|
—
|
|
—
|
|
63
|
|
|||||||
|
Increases for current year tax positions
|
90
|
|
10
|
|
173
|
|
68
|
|
|||||||
|
Decreases for prior year tax positions
|
—
|
|
—
|
|
(8
|
)
|
(1
|
)
|
|||||||
|
Decreases due to settlements
|
(29
|
)
|
—
|
|
—
|
|
(32
|
)
|
|||||||
|
Decreases due to statutes lapsing
|
(197
|
)
|
—
|
|
(358
|
)
|
(542
|
)
|
|||||||
|
Balance at end of year
|
$
|
477
|
|
$
|
581
|
|
$
|
571
|
|
$
|
764
|
|
|||
If all of the Company’s unrecognized tax benefits as of
March 31, 2020
,
March 31, 2019
and December 31, 2018 were recognized,
$0.5 million
,
$0.4 million
and
$0.4 million
of unrecognized tax benefits, respectively, would impact the effective tax rate. The Company believes it is reasonably possible that
$0.1 million
of unrecognized tax benefits may reverse in the next twelve months.
The Company recognizes interest and penalties accrued related to unrecognized tax benefits in the provision for income taxes. The Company had
$0.1 million
of accrued gross interest and penalties as of
March 31, 2020
,
March 31, 2019
and December 31, 2018. The Company recognized net interest and penalties expense of
$23,000
,
$(40,000)
and
$17,000
and
$3,000
for the year ended
March 31, 2020
, the year ended December 31,
2018
,
2017
and the transition period for the
three
months ended
March 31, 2019
, respectively.
The Company files income tax returns in the U.S. federal jurisdiction and various state and foreign jurisdictions. As of
March 31, 2020
, with few exceptions, the Company or its subsidiaries are no longer subject to examination prior to tax year ended December 31,
2016
. Certain state returns are currently under audit by the state tax authorities. The Company does not expect the results of these audits to have a material impact on the consolidated financial statements.
Note 13—Preferred stock
The Company has authorized
30,000,000
shares of preferred stock for issuance with a par value of
$0.01
per share. There were
no
shares of preferred stock outstanding as of
March 31, 2020
,
March 31, 2019
or
December 31, 2018
.
Note 14—Stock-based compensation
Stock plans
The Company grants stock-based awards under its 2016 Equity Incentive Award Plan (the “2016 Plan”), which replaced its 2014 Equity Incentive Plan (the “2014 Plan”) and became effective immediately prior to the effectiveness of the Company’s registration statement on Form S-1 in September 2016. No grants have made under the 2014 Plan since the Company’s initial public offering and no further awards will be granted thereunder. Any awards outstanding under the 2014 Plan that are forfeited or lapse unexercised will be added to the shares reserved and available for grant under the 2016 Plan. The 2016 Plan permits the grant of incentive stock options, non-statutory stock options, restricted stock and other stock- or cash-based awards to employees, officers, directors, advisors and consultants. The 2016 Plan allows for option grants of the Company’s common stock based on service, performance and market conditions.
As of
March 31, 2020
, a total of
13,457,391
shares have been authorized for issuance under the 2016 Plan, and
7,643,774
remain available for grant. As of
March 31, 2020
, there were
1,471,032
options and awards outstanding under the 2014 Plan that, if forfeited, would increase the number of shares authorized for grant under the 2016 Plan.
84
e.l.f. Beauty, Inc. and subsidiaries
Notes to consolidated financial statements
Service-based vesting stock options
The following table summarizes the activity for options that vest solely based upon the satisfaction of a service condition as follows:
|
|
Options
outstanding
|
Weighted-average exercise price
|
Weighted-average remaining
contractual life
(in years)
|
Aggregate intrinsic
values
(in thousands)
(1)
|
||||||||
|
Balance as of December 31, 2018
|
2,746,670
|
|
$
|
12.91
|
|
|||||||
|
Granted
|
115,100
|
|
7.95
|
|
||||||||
|
Canceled or forfeited
|
(286,191
|
)
|
16.98
|
|
||||||||
|
Balance as of March 31, 2019
|
2,575,579
|
|
12.24
|
|
6.9
|
$
|
6,958
|
|
||||
|
Granted
|
202,560
|
|
14.18
|
|
|
|
|
|||||
|
Exercised
|
(334,572
|
)
|
4.08
|
|
|
|
|
|||||
|
Canceled or forfeited
|
(444,014
|
)
|
15.07
|
|
|
|
|
|||||
|
Balance as of March 31, 2020
|
1,999,553
|
|
$
|
13.17
|
|
6.8
|
$
|
3,773
|
|
|||
|
Exercisable, March 31, 2020
|
1,291,647
|
|
$
|
12.06
|
|
6.1
|
$
|
3,469
|
|
|||
|
(1)
|
The aggregate intrinsic value is calculated as the difference between the exercise price of the underlying awards and the Company's closing stock price of
$9.84
, as reported on the New York Stock Exchange on
March 31, 2020
.
|
Additional information relating to service-based options is as follows (in thousands, except per share data):
|
Year ended
March 31,
|
Three months ended March 31,
(transition period)
|
Year ended
December 31,
|
|||||||||||||
|
|
2020
|
2019
|
2018
|
2017
|
|||||||||||
|
Stock-based compensation expense
|
$
|
2,308
|
|
$
|
590
|
|
$
|
3,219
|
|
$
|
2,435
|
|
|||
|
Intrinsic value of options exercised
|
3,580
|
|
—
|
|
2,890
|
|
12,841
|
|
|||||||
|
Weighted-average grant date fair value
of options granted (per share)
|
$
|
5.55
|
|
$
|
3.12
|
|
$
|
6.81
|
|
$
|
9.51
|
|
|||
As of
March 31, 2020
, there was
$3.3 million
of total unrecognized compensation cost related to service-based stock options, which is expected to be recognized over the remaining weighted-average vesting period of
2.2 years
.
The fair value of service-based stock options granted were calculated using the following weighted-average assumptions:
|
Year ended
March 31,
|
Three months ended March 31,
(transition period)
|
Year ended
December 31,
|
|||||||||
|
2020
|
2019
|
2018
|
2017
|
||||||||
|
Expected term (in years)
|
6.5
|
|
6.3
|
|
6.3
|
|
6.2
|
|
|||
|
Expected volatility
|
35.57
|
%
|
35.13
|
%
|
32.02
|
%
|
32.42
|
%
|
|||
|
Risk-free interest rate
|
2.07
|
%
|
2.55
|
%
|
2.68
|
%
|
2.14
|
%
|
|||
|
Expected dividend yield
|
—
|
%
|
—
|
%
|
—
|
%
|
—
|
%
|
|||
85
e.l.f. Beauty, Inc. and subsidiaries
Notes to consolidated financial statements
The determination of the fair value of stock options on the date of grant using a Black-Scholes option-pricing model is affected by the fair value of the underlying common stock, as well as assumptions regarding a number of variables that are complex, subjective and generally require significant judgment. The assumptions used in the Black-Scholes option-pricing model to calculate the fair value of stock options were:
Fair value of common stock
Prior to the initial public offering, the fair value of shares of common stock underlying stock options was the responsibility of, and determined by, the Company’s board of directors, with input from management. There was no public market for the Company’s common stock and the board of directors determined the fair value of common stock at the time of grant of the option by considering a number of objective and subjective factors including independent third-party valuations of the Company’s common stock, operating and financial performance, the lack of liquidity of capital stock and general and industry specific economic outlook, among other factors. After the initial public offering, the fair value of shares of common stock underlying stock options is based on the closing stock price as quoted on the NYSE on the date of grant.
Expected term
The expected term of the options represents the period of time that the options are expected to be outstanding. Options granted have a maximum contractual life of
10 years
. Prior to the initial public offering, the Company estimated the expected term of the option based on the estimated timing of potential liquidity events. For grants upon or after the initial public offering, the Company estimated the expected term based upon the simplified method described in Staff Accounting Bulletin No. 107, as the Company does not have sufficient historical exercise data to provide a reasonable basis upon which to estimate expected term due to the limited period of time its equity shares have been publicly traded.
Expected volatility
As the Company does not have sufficient trading history for its common stock, the expected stock price volatility for the common stock was estimated by taking the average historic price volatility for industry peers based on daily price observations over a period equivalent to the expected term of the stock option grants. Industry peers consist of several public companies within the same industry, which are of similar size, complexity and stage of development. The Company intends to continue to consistently apply this process using the same or similar public companies until a sufficient amount of historical information regarding the volatility of its own share price becomes available, or unless circumstances change such that the identified companies are no longer similar to the Company, in which case, more suitable companies whose share prices are publicly available would be used in the calculation.
Risk-free interest rate
The risk-free interest rate was based on the U.S. Treasury rate, with maturities similar to the expected term of the options.
Expected dividend yield
The Company does not anticipate paying any dividends in the foreseeable future. As such, the Company uses an expected dividend yield of
zero
.
86
e.l.f. Beauty, Inc. and subsidiaries
Notes to consolidated financial statements
Performance-based and market-based vesting stock options
The following table summarizes the activity for options that vest based upon the satisfaction of performance or market conditions as follows:
|
Options
outstanding
|
Weighted-average exercise price
|
Weighted-average remaining
contractual life
(in years)
|
Aggregate intrinsic
values
(in thousands)
(1)
|
|||||||||
|
Balance as of December 31, 2018
|
1,482,782
|
|
$
|
8.94
|
|
|||||||
|
Exercised
|
(62,450
|
)
|
1.84
|
|
||||||||
|
Canceled or forfeited
|
(96,900
|
)
|
26.84
|
|
||||||||
|
Balance as of March 31, 2019
|
1,323,432
|
|
7.96
|
|
6.0
|
$
|
8,646
|
|
||||
|
Exercised
|
(53,100
|
)
|
2.40
|
|
|
|
||||||
|
Canceled or forfeited
|
(17,400
|
)
|
26.84
|
|
|
|
||||||
|
Balance as of March 31, 2020
|
1,252,932
|
|
$
|
7.97
|
|
5.0
|
$
|
7,487
|
|
|||
|
Exercisable, March 31, 2020
|
952,932
|
|
$
|
1.98
|
|
4.4
|
$
|
7,487
|
|
|||
(1)
The aggregate intrinsic value is calculated as the difference between the exercise price of the underlying awards and the Company's closing stock price of
$9.84
, as reported on the New York Stock Exchange on
March 31, 2020
.
As of
March 31, 2020
, there was
no
further unrecognized compensation cost related to performance-based and market-based vesting stock options.
Additional information relating to options that vest based upon the satisfaction of performance or market conditions is as follows (in thousands, except per share data):
|
Year ended
March 31,
|
Three months ended March 31,
(transition period)
|
Year ended
December 31,
|
|||||||||||||
|
2020
|
2019
|
2018
|
2017
|
||||||||||||
|
Stock-based compensation expense
|
$
|
—
|
|
$
|
—
|
|
$
|
1,168
|
|
$
|
3,489
|
|
|||
|
Intrinsic value of options exercised
|
609
|
|
419
|
|
8,669
|
|
42,874
|
|
|||||||
|
Weighted-average grant date fair value
of options granted (per share)
|
$
|
—
|
|
$
|
—
|
|
$
|
—
|
|
$
|
10.65
|
|
|||
Prior to the initial public offering, the Company granted options that vested based upon the achievement of both a performance and market condition. The performance condition was based on the occurrence of a liquidity event and was satisfied in connection with the initial public offering in September 2016. The market condition was based upon the achievement of a minimum rate of return from the liquidity event and was satisfied in March 2017. Accordingly, all such outstanding options vested in March 2017.
In February 2017, the Company granted options that vest based upon the achievement of specified stock prices. The fair values and derived service periods were determined using a Monte Carlo simulation model. If the awards vest prior to the end of the derived service period, the remaining unamortized compensation cost will be recognized in the period of vesting.
87
e.l.f. Beauty, Inc. and subsidiaries
Notes to consolidated financial statements
Restricted stock
The following table summarizes the activities for restricted stock awards (“RSAs”) and restricted stock units (“RSUs”) as follows:
|
|
Shares of restricted stock outstanding
|
Weighted-average grant date fair value
|
||||
|
Balance as of December 31, 2018
|
2,036,124
|
|
$
|
20.01
|
|
|
|
Granted
(1)
|
1,464,710
|
|
7.64
|
|
||
|
Vested
|
(396,514
|
)
|
21.79
|
|
||
|
Canceled or forfeited
|
(317,922
|
)
|
20.06
|
|
||
|
Balance as of March 31, 2019
|
2,786,398
|
|
13.26
|
|
||
|
Granted
|
673,461
|
|
14.26
|
|
||
|
Vested
|
(762,818
|
)
|
15.97
|
|
||
|
Canceled or forfeited
|
(385,273
|
)
|
12.66
|
|
||
|
Balance as of March 31, 2020
|
2,311,768
|
|
$
|
12.86
|
|
|
(1)
Includes restricted stock awards granted in the period ending March 31, 2019 that vest based upon the achievement of a specified stock price and satisfaction of a service condition. The fair values and derived service periods were determined using a Monte Carlo simulation model.
As of
March 31, 2020
, there were
1,128,789
unvested shares subject to RSAs outstanding. Additional information relating to RSAs and RSUs is as follows (in thousands):
|
Year ended
March 31,
|
Three months ended March 31,
(transition period)
|
Year ended
December 31,
|
|||||||||||||
|
|
2020
|
2019
|
2018
|
2017
|
|||||||||||
|
Stock-based compensation expense
|
$
|
13,181
|
|
$
|
3,093
|
|
$
|
12,434
|
|
$
|
7,550
|
|
|||
|
Intrinsic value of RSUs released
|
$
|
12,448
|
|
$
|
3,387
|
|
$
|
6,280
|
|
$
|
3,398
|
|
|||
As of
March 31, 2020
, there was
$25.0 million
of total unrecognized compensation cost related to unvested RSAs and RSUs, which is expected to be recognized over the remaining weighted-average vesting period of
2.4 years
.
Note 15—Restructuring and other related costs
In
February 2019
, during the transition period for the three months ended March 31, 2020, a Restructuring Plan was approved to close all
22
e.l.f. retail stores and implement a workforce reduction of employees that operated and managed the e.l.f. retail stores. The Restructuring Plan resulted in the termination of the employment of
170
retail store employees and
5
corporate employees who managed and operated the e.l.f. retail stores. The purpose of the Restructuring Plan was to enable a reallocation of investment against the e.l.f. brand and prioritization of the Company's national retailer and digital channels.
88
e.l.f. Beauty, Inc. and subsidiaries
Notes to consolidated financial statements
In connection with the Restructuring Plan, the following table presents the restructuring (income) expense incurred in the transition period for the three months ended March 31, 2019 and the fiscal year ended
March 31, 2020
, respectively (in thousands):
|
|
March 31, 2020
|
Three months ended March 31, 2019
(transition period)
|
|||||
|
2020
|
|||||||
|
Acceleration of rent expense
|
$
|
—
|
|
$
|
16,106
|
|
|
|
Acceleration of depreciation expense
|
—
|
|
5,377
|
|
|||
|
Gain from extinguishment of lease liabilities
|
(7,733
|
)
|
(1,866
|
)
|
|||
|
Employee severance and related expenses
|
—
|
|
600
|
|
|||
|
Other costs, including other asset write-offs
|
1,751
|
|
1,959
|
|
|||
|
Total
|
$
|
(5,982
|
)
|
$
|
22,176
|
|
|
The acceleration of rent expense is net of a
$1.9 million
gain related to operating lease liabilities that were extinguished as of March 31, 2019. This gain represents the difference between the aggregate operating lease liability established upon adoption of ASC 842 and the aggregate cash charge incurred to extinguish the aggregate liability. The gross accelerated rent expense of
$16.1 million
is included in depreciation and amortization in the statement of cash flows for the transition period for the three months ended March 31, 2019. The majority of the other costs incurred during transition period for the three months ended March 31, 2019 and the year ended
March 31, 2020
are legal fees related to this extinguishment. As of
March 31, 2020
, the Company has settled all outstanding lease liabilities related to its e.l.f. retail store closures and does not expect to incur additional costs associated with the Restructuring Plan.
Liabilities related to the Restructuring Plan are reported within accrued expenses and other current liabilities in the accompanying consolidated balance sheets. The following table presents a roll-forward of the Company's restructuring liability for the transition period for the three months ended March 31, 2019 and the year ended
March 31, 2020
, respectively (in thousands):
|
Employee severance and related expenses
|
Other costs
|
Total
|
||||||||||
|
December 31, 2018
|
$
|
—
|
|
$
|
—
|
|
$
|
—
|
|
|||
|
Costs incurred
|
600
|
|
1,118
|
|
1,718
|
|
||||||
|
Cash disbursements
|
(504
|
)
|
(443
|
)
|
(947
|
)
|
||||||
|
March 31, 2019
|
$
|
96
|
|
$
|
675
|
|
$
|
771
|
|
|||
|
Costs incurred and other adjustments
|
(22
|
)
|
1,634
|
|
1,612
|
|
||||||
|
Cash disbursements
|
(74
|
)
|
(2,309
|
)
|
(2,383
|
)
|
||||||
|
March 31, 2020
|
$
|
—
|
|
$
|
—
|
|
$
|
—
|
|
|||
Outstanding lease liabilities are not included in the table above, as those liabilities were established upon adoption of ASC 842, not in connection with the Restructuring Plan.
Note 16—Repurchase of common stock
On
May 8, 2019
, the Company's board of directors authorized a share repurchase program to acquire up to
$25.0 million
of the Company’s common stock (the “Share Repurchase Program”). Purchases under the Share Repurchase Program may be made from time to time through a variety of methods, which may include open market purchases, privately negotiated transactions, block trades, accelerated share repurchase transactions, or by any combination of such methods. The timing and amount of any repurchases pursuant to the Share Repurchase Program will be determined based on market conditions, share price and other factors. The Share Repurchase Program does not require the Company to repurchase any specific number of shares of its common stock, and may be modified, suspended or terminated at any time without notice. There is no guarantee that any shares will be purchased under the Share Repurchase Program and such shares are intended to be retired after purchase.
89
e.l.f. Beauty, Inc. and subsidiaries
Notes to consolidated financial statements
During the year ended
March 31, 2020
, the Company repurchased a total of
564,468
shares for
$7.9 million
at an average price of
$14.03
under the Share Repurchase Program. A total of
$17.1 million
remains available for purchase under the Share Repurchase Program.
Note 17—Employee benefit plan
The Company maintains a defined contribution 401(k) profit-sharing plan (the “401(k) Plan”) for eligible employees. Participants may make voluntary contributions up to the maximum amount allowable by law. The Company may make contributions to the 401(k) Plan on a discretionary basis which vest to the participants
100%
. The Company made matching contributions of
$0.3 million
,
$0.2 million
,
$0.2 million
and
$0.1 million
to the 401(k) Plan during the years ended
March 31, 2020
, December 31,
2018
,
2017
, and the transition period for the
three
months ended
March 31,
2019
, respectively.
Note 18—Net income (loss) per share
The following is a reconciliation of the numerator and denominator in the basic and diluted net income (loss) per common share computations (in thousands, except share and per share data):
|
Year ended
March 31, |
Three months ended March 31,
(transition period) |
Year ended
December 31,
|
|||||||||||||
|
|
2020
|
2019
|
2018
|
2017
|
|||||||||||
|
Numerator:
|
|
|
|||||||||||||
|
Net income (loss)
|
$
|
17,884
|
|
$
|
(17,914
|
)
|
$
|
15,525
|
|
$
|
33,475
|
|
|||
|
Denominator:
|
|||||||||||||||
|
Weighted average common shares outstanding - basic
|
48,498,813
|
|
48,022,926
|
|
46,828,798
|
|
45,358,452
|
|
|||||||
|
Dilutive common equivalent shares from equity awards
|
2,318,330
|
|
—
|
|
2,439,818
|
|
4,016,306
|
|
|||||||
|
Weighted average common shares outstanding - diluted
|
50,817,143
|
|
48,022,926
|
|
49,268,616
|
|
49,374,758
|
|
|||||||
|
Net income (loss) per share:
|
|||||||||||||||
|
Basic
|
$
|
0.37
|
|
$
|
(0.37
|
)
|
$
|
0.33
|
|
$
|
0.74
|
|
|||
|
Diluted
|
$
|
0.35
|
|
$
|
(0.37
|
)
|
$
|
0.32
|
|
$
|
0.68
|
|
|||
|
Weighted average anti-dilutive shares from outstanding equity awards excluded from diluted earnings per share
|
2,143,672
|
|
6,588,523
|
|
3,373,529
|
|
1,176,787
|
|
|||||||
Note 19—Leases
The Company leases warehouses, distribution centers, office space, retail space and equipment. Prior to the Restructuring Plan, the Company also leased retail store locations. The majority of the Company's leases include one or more options to renew, with renewal terms that can extend the lease term for up to
five years
. The exercise of lease renewal options is at the Company's sole discretion and such renewal options are included in the lease term if they are reasonably certain to be exercised. Certain leases also include options to purchase the leased asset. The Company's lease agreements do not contain any material residual value guarantees or material restrictive covenants. Most of the Company's equipment leases are finance leases of assets used to operate its distribution centers in Ontario, California and Columbus, Ohio.
Significant judgment is required to determine whether commercial contracts contain a lease for purposes of ASC 842. The discount rate used in measuring lease liabilities is generally based on the interest rate on the Company’s revolving line of credit, assuming sufficient unused capacity exists at the time the lease liability is measured.
90
e.l.f. Beauty, Inc. and subsidiaries
Notes to consolidated financial statements
A reconciliation of the balance sheet line items that were impacted or created as a result of the Company’s adoption of ASC 842 as of March 31, 2020 and March 31, 2019 is as follows (in thousands):
|
|
Classification
|
March 31, 2020
|
March 31, 2019
|
|||||||||||
|
Assets
|
||||||||||||||
|
Operating lease assets
(a)
|
Other assets
|
$
|
13,668
|
|
$
|
4,445
|
|
|||||||
|
Finance lease assets
(b)
|
Other assets
|
2,094
|
|
3,089
|
|
|||||||||
|
Total leased assets
|
$
|
15,762
|
|
$
|
7,534
|
|
||||||||
|
Liabilities
|
||||||||||||||
|
Current
|
||||||||||||||
|
Operating
(a)
|
Accrued expenses and other current liabilities
|
$
|
3,083
|
|
$
|
4,172
|
|
|||||||
|
Finance
|
Current portion of long-term debt and finance lease obligations
|
812
|
|
771
|
|
|||||||||
|
Noncurrent
|
||||||||||||||
|
Operating
(a)
|
Long-term operating lease obligations
|
11,239
|
|
15,898
|
|
|||||||||
|
Finance
|
Long-term debt and finance lease obligations
|
2,200
|
|
3,012
|
|
|||||||||
|
Total lease liabilities
|
$
|
17,334
|
|
$
|
23,853
|
|
||||||||
___________________
(a)
In accordance with ASC 842,
$15.7 million
of ROU assets related to operating leases were derecognized in the transition period for the three months ended
March 31, 2019
in connection with the Restructuring Plan. Pursuant to ASC 842, each related lease liability is derecognized only after the Company is released from that liability. The Company recognized a gain of $1.9 million in restructuring expenses related to the derecognition of lease liabilities in connection with the Restructuring Plan in the transition period for the three months ended March 31, 2019. See Note 15, “Restructuring and other related costs” for further details on the Restructuring Plan and the gain recorded on lease liabilities derecognized in the year ended
March 31, 2020
and the transition period for the three months ended March 31, 2019, respectively.
(b)
Finance leases are recorded net of accumulated amortization of
$2.9 million
and
$1.9 million
as of
March 31, 2020
and March 31, 2019, respectively.
For the year ended March 31, 2020 and the transition period for the three months ended March 31, 2019, the components of operating and finance lease costs were as follows (in thousands):
|
|
Classification
|
Twelve months ended March 31, 2020
|
Three months ended March 31, 2019
(transition period)
|
||||||||||
|
Operating lease cost
|
Selling, general and administrative (“SG&A”) expenses
|
$
|
2,950
|
|
$
|
1,195
|
|
||||||
|
Gain from extinguishment of lease liabilities
|
Restructuring expense (income)
|
(7,733
|
)
|
(1,866
|
)
|
||||||||
|
Acceleration of rent expense
|
Restructuring expenses
|
—
|
|
16,106
|
|
||||||||
|
Finance lease cost
|
|||||||||||||
|
Amortization of leased assets
|
SG&A expenses
|
996
|
|
254
|
|
||||||||
|
Interest on lease liabilities
|
Interest expense, net
|
179
|
|
50
|
|
||||||||
|
Total lease (gain) cost
|
$
|
(3,608
|
)
|
$
|
15,739
|
|
|||||||
91
e.l.f. Beauty, Inc. and subsidiaries
Notes to consolidated financial statements
As of
March 31, 2020
, the aggregate future minimum lease payments under non-cancellable leases presented in accordance with ASC 842 are as follows (in thousands):
|
Operating
leases
|
Finance
leases
|
Total
|
|||||||||
|
2021
|
3,540
|
|
950
|
|
4,490
|
|
|||||
|
2022
|
2,350
|
|
907
|
|
3,257
|
|
|||||
|
2023
|
1,924
|
|
1,208
|
|
3,132
|
|
|||||
|
2024
|
1,962
|
|
235
|
|
2,197
|
|
|||||
|
2025
|
1,547
|
|
—
|
|
1,547
|
|
|||||
|
Thereafter
|
4,748
|
|
—
|
|
4,748
|
|
|||||
|
Total lease payments
|
16,071
|
|
3,300
|
|
19,371
|
|
|||||
|
Less: Interest
|
1,749
|
|
288
|
|
|||||||
|
Present value of lease liabilities
|
$
|
14,322
|
|
$
|
3,012
|
|
|||||
As of December 31, 2018 the aggregate future minimum lease payments under non-cancellable leases presented in accordance with ASC 840 were as follows (in thousands):
|
Year ending December 31,
|
|
|
||
|
2019
|
$
|
5,375
|
|
|
|
2020
|
5,210
|
|
||
|
2021
|
3,876
|
|
||
|
2022
|
2,832
|
|
||
|
2023
|
2,858
|
|
||
|
2024 and thereafter
|
7,167
|
|
||
|
Total
|
$
|
27,318
|
|
|
For leases commencing prior to
January 1, 2019
, minimum lease payments exclude payments to landlords for real estate taxes and common area maintenance. These payments can be either fixed or variable, depending on the lease.
As of March 31, 2020 and March 31, 2019, the weighted average remaining lease term (in years) and discount rate were as follows:
|
|
March 31, 2020
|
March 31, 2019
|
||||
|
Weighted-average remaining lease term
|
||||||
|
Operating leases
|
6.8 years
|
|
5.9 years
|
|
||
|
Finance leases
|
3.3 years
|
|
4.3 years
|
|
||
|
Weighted-average discount rate
|
||||||
|
Operating leases
|
3.7
|
%
|
4.8
|
%
|
||
|
Finance leases
|
5.2
|
%
|
5.2
|
%
|
||
Operating cash outflows from operating leases for the year ended
March 31, 2020
and the transition period for the three months ended March 31, 2019 were
$10.4 million
and
$1.8 million
, respectively.
92
e.l.f. Beauty, Inc. and subsidiaries
Notes to consolidated financial statements
Note 20—Quarterly financial summary
Unaudited quarterly results for the years ended
March 31, 2020
, December 31,
2018
, and the transition period for the three months ended March 31,
2019
were as follows (in thousands, except per share data):
|
|
March 31, 2018
|
June 30, 2018
|
September 30, 2018
|
December 31, 2018
|
March 31, 2019
(transition period)
|
June 30, 2019
|
September 30, 2019
|
December 31, 2019
|
March 31, 2020
|
||||||||||||||||||||||||||
|
(unaudited)
|
(unaudited)
|
||||||||||||||||||||||||||||||||||
|
Net sales
|
$
|
65,920
|
|
$
|
59,055
|
|
$
|
63,889
|
|
$
|
78,571
|
|
$
|
66,141
|
|
$
|
59,764
|
|
$
|
67,615
|
|
$
|
80,760
|
|
$
|
74,712
|
|
||||||||
|
Gross profit
|
$
|
40,208
|
|
$
|
36,645
|
|
$
|
38,969
|
|
$
|
46,919
|
|
$
|
40,491
|
|
$
|
37,191
|
|
$
|
43,348
|
|
$
|
52,520
|
|
$
|
48,064
|
|
||||||||
|
Net income (loss)
|
$
|
690
|
|
$
|
1,248
|
|
$
|
3,915
|
|
$
|
9,672
|
|
$
|
(17,914
|
)
|
$
|
3,706
|
|
$
|
6,517
|
|
$
|
8,002
|
|
$
|
(341
|
)
|
||||||||
|
Net income (loss) per share:
|
|
|
|
|
|
||||||||||||||||||||||||||||||
|
Basic
|
$
|
0.01
|
|
$
|
0.03
|
|
$
|
0.08
|
|
$
|
0.20
|
|
$
|
(0.37
|
)
|
$
|
0.08
|
|
$
|
0.13
|
|
$
|
0.16
|
|
$
|
(0.01
|
)
|
||||||||
|
Diluted
|
$
|
0.01
|
|
$
|
0.03
|
|
$
|
0.08
|
|
$
|
0.20
|
|
$
|
(0.37
|
)
|
$
|
0.07
|
|
$
|
0.13
|
|
$
|
0.16
|
|
$
|
(0.01
|
)
|
||||||||
Note 21—Subsequent events
On April 8, 2020, the Company amended its senior secured credit agreement to modify the Company’s quarterly maintenance covenants, and to add interest rates with respect to borrowings associated with the added increased maximum permitted total net leverage ratios. Refer to Note 10 Debt for additional information.
93
TABLE OF CONTENTS
Part IItem 1. BusinessItem 1A. Risk FactorsItem 1B. Unresolved Staff CommentsItem 2. PropertiesItem 3. Legal ProceedingsItem 4. Mine Safety DisclosuresPart IIItem 5. Market For Registrant S Common Equity, Related Stockholder Matters and Issuer Purchases Of Equity SecuritiesItem 6. Selected Financial DataItem 7. Management S Discussion and Analysis Of Financial Condition and Results Of OperationsItem 7A. Quantitative and Qualitative Disclosures About Market RiskItem 8. Financial Statements and Supplementary DataItem 9. Changes in and Disagreements with Accountants on Accounting and Financial DisclosureItem 9A. Controls and ProceduresItem 9B. Other InformationPart IIIItem 10. Directors, Executive Officers and Corporate GovernanceItem 11. Executive CompensationItem 12. Security Ownership Of Certain Beneficial Owners and Management and Related Stockholder MattersItem 13. Certain Relationships and Related Transactions, and Director IndependenceItem 14. Principal Accounting Fees and ServicesPart IVItem 15. Exhibits, Financial Statement SchedulesItem 16. Form 10-k SummaryNote 1 Nature Of OperationsNote 2 Summary Of Significant Accounting PoliciesNote 3 Transition PeriodNote 4 AcquisitionsNote 5 Investment in Equity SecuritiesNote 6 Goodwill and Other Intangible AssetsNote 7 Property and EquipmentNote 8 Accrued Expenses and Other Current LiabilitiesNote 9 Fair Value Of Financial InstrumentsNote 10 DebtNote 11 ContingenciesNote 12 Income TaxesNote 13 Preferred StockNote 14 Stock-based CompensationNote 15 Restructuring and Other Related CostsNote 16 Repurchase Of Common StockNote 17 Employee Benefit PlanNote 18 Net Income (loss) Per ShareNote 19 LeasesNote 20 Quarterly Financial SummaryNote 21 Subsequent Events