EQUITY LIFESTYLE PROPERTIES INC
10-Ks and 10-Qs
|
|
|
|
|
|
|
|
|
|
|
|
|
|
|
|
|
|
|
|
|
|
|
|
|
|
|
|
|
|
|
|
|
|
|
|
|
|
|
|
|
|
|
|
|
|
|
|
|
|
|
|
|
|
|
|
|
|
|
UNITED STATES
SECURITIES AND EXCHANGE COMMISSION
Washington, D.C. 20549
FORM 10-K
|
x
|
ANNUAL REPORT PURSUANT TO SECTION 13 OR 15(d) OF THE SECURITIES EXCHANGE ACT OF 1934
|
For the Fiscal Year Ended
December 31, 2013
or
|
o
|
TRANSITION REPORT PURSUANT TO SECTION 13 OR 15(d) OF THE SECURITIES EXCHANGE ACT OF 1934
|
For the transition period from to
Commission File Number: 1-11718
EQUITY LIFESTYLE PROPERTIES, INC.
(Exact name of registrant as specified in its charter)
|
Maryland
|
|
36-3857664
|
|
(State or Other Jurisdiction of
Incorporation or Organization)
|
|
(I.R.S. Employer
Identification No.)
|
|
Two North Riverside Plaza,
Suite 800, Chicago, Illinois
|
|
60606
|
|
(Address of Principal
Executive Offices)
|
|
(Zip Code)
|
(312) 279-1400
(Registrant’s Telephone Number, Including Area Code)
Securities registered pursuant to Section 12(b) of the Act:
|
Common Stock, $0.01 Par Value
|
|
New York Stock Exchange
|
|
(Title of Class)
|
|
(Name of exchange on which registered)
|
|
6.75% Series C Cumulative Redeemable
Perpetual Preferred Stock, $0.01 Par Value
|
|
New York Stock Exchange
|
|
(Title of Class)
|
|
(Name of exchange on which registered)
|
Securities registered pursuant to Section 12(g) of the Act:
None
Indicate by check mark if the Registrant is a well-known seasoned issuer, as defined in Rule 405 of the Securities Act. Yes
x
No
o
Indicate by check mark if the Registrant is not required to file reports pursuant to Section 13 or Section 15(d) of the Act. Yes
o
No
x
Indicate by check mark whether the Registrant (1) has filed all reports required to be filed by Section 13 or 15(d) of the Securities Exchange Act of 1934 during the preceding 12 months (or for such shorter period that the Registrant was required to file such reports), and (2) has been subject to such filing requirements for the past 90 days. Yes
x
No
o
Indicate by check mark whether the Registrant has submitted electronically and posted on its corporate Website, if any, every Interactive Data File required to be submitted and posted pursuant to Rule 405 of Regulation S-T (§232.405 of this chapter) during the preceding 12 months (or for such shorter period that the registrant was required to submit and post such files). Yes
x
No
o
Indicate by check mark if disclosure of delinquent filers pursuant to Item 405 of Regulation S-K (§229.405 of this chapter) is not contained herein, and will not be contained, to the best of the Registrant’s knowledge, in definitive proxy or information statements incorporated by reference in Part III of this Form 10-K or any amendment to this Form 10-K.
o
Indicate by check mark whether the Registrant is a large accelerated filer, an accelerated filer, a non-accelerated filer or a smaller reporting company. See definitions of “large accelerated filer,” “accelerated filer” and “smaller reporting company” in Rule 12b-2 of the Exchange Act. (Check one):
|
Large accelerated filer
|
x
|
Accelerated filer
|
o
|
|
Non-accelerated filer
|
o
(Do not check if a smaller reporting company)
|
Smaller reporting company
|
o
|
Indicate by check mark whether the Registrant is a shell company (as defined in Rule 12b-2 of the Exchange Act). Yes
o
No
x
The aggregate market value of voting stock held by non-affiliates was approximately
$3,050.7 million
as of
June 28, 2013
based upon the closing price of
$39.30
on such date using beneficial ownership of stock rules adopted pursuant to Section 13 of the Securities Exchange Act of 1934 to exclude voting stock owned by Directors and Officers, some of whom may not be held to be affiliates upon judicial determination.
At
February 21, 2014
,
83,324,062
shares of the Registrant’s common stock were outstanding.
DOCUMENTS INCORPORATED BY REFERENCE:
Part III incorporates by reference portions of the Registrant’s Proxy Statement relating to the Annual Meeting of Stockholders to be held on
May 13, 2014
.
Equity LifeStyle Properties, Inc.
TABLE OF CONTENTS
|
|
|
Page
|
|
|
PART I.
|
|||
|
Item 1.
|
Business
|
||
|
Item 1A.
|
Risk Factors
|
||
|
Item 1B.
|
Unresolved Staff Comments
|
||
|
Item 2.
|
Properties
|
||
|
Item 3.
|
Legal Proceedings
|
||
|
Item 4.
|
Mine Safety Disclosure
|
||
|
PART II.
|
|||
|
Item 5.
|
Market for the Registrant’s Common Equity, Related Stockholder Matters and Issuer Purchases of Equity Securities
|
||
|
Item 6.
|
Selected Financial Data
|
||
|
Item 7.
|
Management’s Discussion and Analysis of Financial Condition and Results of Operations
|
||
|
Item 7A.
|
Quantitative and Qualitative Disclosures About Market Risk
|
||
|
Forward-Looking Statements
|
|||
|
Item 8.
|
Financial Statements and Supplementary Data
|
||
|
Item 9.
|
Changes in and Disagreements with Accountants on Accounting and Financial Disclosure
|
||
|
Item 9A.
|
Controls and Procedures
|
||
|
Item 9B.
|
Other Information
|
||
|
PART III.
|
|||
|
Item 10.
|
Directors, Executive Officers and Corporate Governance
|
||
|
Item 11.
|
Executive Compensation
|
||
|
Item 12.
|
Security Ownership of Certain Beneficial Owners and Management and Related Stockholder Matters
|
||
|
Item 13.
|
Certain Relationships and Related Transactions and Director Independence
|
||
|
Item 14.
|
Principal Accountant Fees and Services
|
||
|
PART IV.
|
|||
|
Item 15.
|
Exhibits and Financial Statement Schedules
|
||
-i-
Equity LifeStyle Properties, Inc.
General
Equity LifeStyle Properties, Inc. (“ELS”), a Maryland corporation, together with MHC Operating Limited Partnership (the “Operating Partnership”) and its other consolidated subsidiaries (the “Subsidiaries”), are referred to herein as “we,” “us,” and “our.” We elected to be taxed as a real estate investment trust (“REIT”), for U.S. federal income tax purposes commencing with our taxable year ended December 31, 1993.
We are a fully integrated owner and operator of lifestyle-oriented properties (“Properties”). We lease individual developed areas (“Sites”) with access to utilities for placement of factory built homes, cottages, cabins or recreational vehicles (“RVs”). Customers may lease individual Sites or enter right-to-use contracts providing the customer access to specific Properties for limited stays. We were formed in December 1992 to continue the property operations, business objectives and acquisition strategies of an entity that had owned and operated Properties since 1969. As of
December 31, 2013
, we owned or had an ownership interest in a portfolio of
377
Properties located throughout the United States and Canada, consisting of
139,126
residential Sites. These Properties are located in
32
states and British Columbia (with the number of Properties in each state or province shown parenthetically) as follows: Florida (
120
), California (
49
), Arizona (
41
), Texas (
17
), Pennsylvania (
15
), Washington (
14
), Colorado (
10
), Oregon (
9
), North Carolina (
8
), Wisconsin (
8
), Delaware (
7
), Indiana (
7
), Nevada (
7
), New York (
7
), Virginia (
7
), Illinois (
5
), Maine (
5
), Massachusetts (
5
), Idaho (
4
), Michigan (
4
), Minnesota (
4
), New Jersey (
4
), South Carolina (
3
), Utah (
3
), Maryland (
2
), New Hampshire (
2
), North Dakota (
2
), Ohio (
2
), Tennessee (
2
), Alabama (
1
), Connecticut (
1
), Kentucky (
1
), and British Columbia (
1
).
Properties are designed and improved for several home options of various sizes and designs that are produced off-site, installed and set on designated Sites (“Site Set”) within the Properties. These homes can range from 400 to over 2,000 square feet. The smallest of these homes are referred to as “Resort Cottages.” Properties may also have Sites that can accommodate a variety of RVs. Properties generally contain centralized entrances, internal road systems and designated Sites. In addition, Properties often provide a clubhouse for social activities and recreation and other amenities, which may include restaurants, swimming pools, golf courses, lawn bowling, shuffleboard courts, pickleball, tennis courts, laundry facilities and cable television service. In some cases, utilities are provided or arranged for by us; otherwise, the customer contracts for the utility directly. Some Properties provide water and sewer service through municipal or regulated utilities, while others provide these services to customers from on-site facilities. Properties generally are designed to attract retirees, empty-nesters, vacationers and second home owners; however, certain of our Properties focus on affordable housing for families. We focus on owning properties in or near large metropolitan markets and retirement and vacation destinations.
Employees and Organizational Structure
We have an annual average of approximately
3,700
full-time, part-time and seasonal employees dedicated to carrying out our operating philosophy and strategies of stockholder value enhancement and service to our customers. The operations of each Property are coordinated by an on-site team of employees that typically includes a manager, clerical staff and maintenance workers, each of whom works to provide maintenance and care to the Properties. The on-site team of employees at each Property also provides customer service and coordinates lifestyle-oriented activities for customers. Direct supervision of on-site management is the responsibility of our regional vice presidents and regional and district managers who have substantial experience addressing the needs of customers and finding or creating innovative approaches to maximize value and increase cash flow from property operations. Complementing this field management staff are approximately
200
full-time corporate employees who assist on-site and regional management in all property functions.
Our Formation
Our operations are conducted primarily through the Operating Partnership. We contributed the proceeds from our initial public offering in 1993 and subsequent offerings to the Operating Partnership for a general partnership interest. In 2004, the general partnership interest was contributed to MHC Trust, a private REIT subsidiary owned by us. As of December 31, 2013, MHC Trust was merged into ELS, resulting in the general partnership interest of the Operating Partnership being directly held by ELS. The financial results of the Operating Partnership and the Subsidiaries are consolidated in our consolidated financial statements, which can be found beginning on page F-1 of this Form 10-K. In addition, since certain activities, if performed by us, may not be qualifying REIT activities under the Internal Revenue Code of 1986, as amended (the “Code”), we have formed taxable REIT Subsidiaries, as defined in the Code, to engage in such activities.
1
We intend to treat the merger of MHC Trust into ELS for U.S. federal income tax purposes as a tax-deferred liquidation of MHC Trust under Section 332 of the Code.
Realty Systems, Inc. (“RSI”) is a wholly owned taxable REIT subsidiary of ours that is engaged in the business of purchasing and selling or leasing Site Set homes that are located in Properties owned and managed by us. RSI also provides brokerage services to residents at such Properties who move from a Property but do not relocate their homes. RSI may provide brokerage services, in competition with other local brokers, by seeking buyers for the Site Set homes. Subsidiaries of RSI also operate ancillary activities at certain Properties, such as golf courses, pro shops, stores and restaurants. Several Properties are also wholly owned by our taxable REIT Subsidiaries.
Business Objectives and Operating Strategies
Our primary business objective is to maximize both current income and long-term growth in income. Our operating strategy is to own and operate the highest quality Properties in sought-after locations near urban areas and retirement and vacation destinations across the United States.
We focus on Properties that have strong cash flow and plan to hold such Properties for long-term investment and capital appreciation. In determining cash flow potential, we evaluate our ability to attract to our Properties and retain high quality customers who take pride in the Property and in their homes. Our investment, operating and financing strategies include:
|
•
|
Providing consistently high levels of services and amenities in attractive surroundings to foster a strong sense of community and pride of home ownership;
|
|
•
|
Efficiently managing the Properties to increase operating margins by controlling expenses, increasing occupancy and maintaining competitive market rents;
|
|
•
|
Increasing income and property values by strategic expansion and, where appropriate, renovation of the Properties;
|
|
•
|
Utilizing technology to evaluate potential acquisitions, identify and track competing properties and monitor customer satisfaction;
|
|
•
|
Selectively acquiring properties that have potential for long-term cash flow growth and creating property concentrations in and around major metropolitan areas and retirement or vacation destinations to capitalize on operating synergies and incremental efficiencies; and
|
|
•
|
Managing our debt balances such that we maintain financial flexibility, have minimal exposure to interest rate fluctuations and maintain an appropriate degree of leverage to maximize return on capital.
|
We focus on creating an attractive residential environment by providing a well-maintained, comfortable Property with a variety of recreational and social activities and superior amenities, as well as offering a multitude of lifestyle housing choices. In addition, we regularly conduct evaluations of the cost of housing in the marketplaces in which our Properties are located and survey rental rates of competing properties. We also conduct satisfaction surveys of our customers to determine the factors they consider most important in choosing a property. We seek to improve Site utilization and efficiency by tracking types of customers and usage patterns and marketing to those specific customer groups.
These business objectives and their implementation are consistent with business strategies determined by our Board of Directors and may be changed at any time.
Acquisitions and Dispositions
Over the last decade our portfolio of Properties (including owned or partly owned Properties) has grown significantly, from
142
Properties with over
51,000
Sites to
377
Properties with over 139,000 Sites. During the year ended
December 31, 2013
, we acquired
five
Properties with over
1,800
Sites. We continually review the Properties in our portfolio to ensure that they fit our business objectives. Over the last five years, we sold
17
Properties, and redeployed capital to properties in markets we believe have greater long-term potential. In that same time period, we acquired
86
Properties primarily located in retirement and vacation destinations.
We believe that opportunities for property acquisitions are still available. Increasing acceptability of and demand for a lifestyle that includes Site Set homes and RVs, as well as continued constraints on development of new properties, adds to the attractiveness of our Properties as investments. We believe we have a competitive advantage in the acquisition of additional properties due to our experienced management, significant presence in major real estate markets and substantial capital resources. We are actively seeking to acquire additional properties and are engaged in various stages of negotiations relating to the possible acquisition of properties. At any time these negotiations are at varying stages, which may include contracts outstanding to acquire certain properties, which are subject to the satisfactory completion of our due diligence review.
2
We anticipate that new acquisitions will generally be located in the United States, although we may consider other geographic locations provided they meet certain acquisition criteria. We utilize market information systems to identify and evaluate acquisition opportunities, including the use of a market database to review the primary economic indicators of the various locations in which we expect to expand our operations.
Acquisitions will be financed from the most appropriate sources of capital, which may include undistributed funds from operations, issuance of additional equity securities, sales of investments, collateralized and uncollateralized borrowings and issuance of debt securities. In addition, we may acquire properties in transactions that include the issuance of limited partnership interests in the Operating Partnership (“OP Units”) as consideration for the acquired properties. We believe that an ownership structure that includes the Operating Partnership will permit us to acquire additional properties in transactions that may defer all or a portion of the sellers’ tax consequences.
When evaluating potential acquisitions, we consider such factors as:
|
•
|
The replacement cost of the property, including land values, entitlements and zoning;
|
|
•
|
The geographic area and the type of property;
|
|
•
|
The location, construction quality, condition and design of the property;
|
|
•
|
The current and projected cash flow of the property and the ability to increase cash flow;
|
|
•
|
The potential for capital appreciation of the property;
|
|
•
|
The terms of tenant leases or usage rights, including the potential for rent increases;
|
|
•
|
The potential for economic growth and the tax and regulatory environment of the community in which the property is located;
|
|
•
|
The potential for expansion of the physical layout of the property and the number of Sites;
|
|
•
|
The occupancy and demand by customers for properties of a similar type in the vicinity and the customers’ profile;
|
|
•
|
The prospects for liquidity through sale, financing or refinancing of the property;
|
|
•
|
The competition from existing properties and the potential for the construction of new properties in the area; and
|
|
•
|
Working capital demands.
|
When evaluating potential dispositions, we consider such factors as:
|
•
|
Whether the Property meets our current investment criteria;
|
|
•
|
Our desire to exit certain non-core markets and recycle the capital into core markets; and
|
|
•
|
Our ability to sell the Property at a price that we believe will provide an appropriate return for our stockholders.
|
When investing capital, we consider all potential uses of the capital, including returning capital to our stockholders. Our Board of Directors continues to review the conditions under which we may repurchase our stock. These conditions include, but are not limited to, market price, balance sheet flexibility, other opportunities and capital requirements.
Property Expansions
Several of our Properties have available land for expanding the number of Sites available to be utilized by our customers. Development of these Sites (“Expansion Sites”) is evaluated based on the following: local market conditions; ability to subdivide; accessibility through the Property or externally; infrastructure needs including utility needs and access as well as additional common area amenities; zoning and entitlement; costs and uses of working capital; topography; and ability to market new Sites. When justified, development of Expansion Sites allows us to leverage existing facilities and amenities to increase the income generated from the Properties. Where appropriate, facilities and amenities may be upgraded or added to certain Properties to make those Properties more attractive in their markets. Our acquisition philosophy includes owning Properties with potential Expansion Site development. Approximately
78
of our Properties have expansion potential, with up to approximately
5,200
acres available for expansion.
Leases or Usage Rights
At our Properties, a typical lease entered into between the owner or renter of a home and us for the rental of a Site is for a month-to-month or year-to-year term, renewable upon the consent of both parties or, in some instances, as provided by statute. These leases are cancelable, depending on applicable law, for non-payment of rent, violation of Property rules and regulations or other specified defaults. Long-term leases that are non-cancelable by the tenant are in effect at certain Sites in
17
of the Properties. Some of these leases are subject to rental rate increases based on the Consumer Price Index (“CPI”), in some instances taking into consideration market conditions, certain floors and ceilings and allowing for pass-throughs of certain items such as real estate taxes, utility expenses and capital expenditures. Generally, adjustments to our market rates, if appropriate, are made on an annual basis. At Properties zoned for RV use, we have long-term relationships with many of our customers who typically enter into short-term rental agreements. Many resort customers also leave deposits to reserve a Site for the following year. Generally, these customers cannot live full time on the Property. At resort Properties designated for use by customers who have entered a right-to-
3
use or membership contract, the contract generally grants the customer access to designated Properties on a continuous basis of up to 14 days. The customer may make a nonrefundable upfront payment, and annual dues payments are required to renew the contract. Most of the contracts provide for an annual dues increase, usually based on increases in the CPI. Approximately
35%
of current customers are not subject to annual dues increases in accordance with the terms of their contracts, generally because the customers are over 61 years old or meet certain other specified criteria.
Regulations and Insurance
General
. Our Properties are subject to a variety of laws, ordinances and regulations, including regulations relating to recreational facilities such as swimming pools, clubhouses and other common areas, regulations relating to providing utility services, such as electricity, and regulations relating to operating water and wastewater treatment facilities at certain of our Properties. We believe that each Property has all material permits and approvals necessary to operate. We work closely with government agencies to renew these permits and approvals in the ordinary course of business.
At certain of our Properties primarily used as membership campgrounds, state statutes limit our ability to close a Property unless a reasonable substitute Property is made available for members’ use. Many states also have consumer protection laws regulating right-to-use or campground membership sales and the financing of such sales. Some states have laws requiring us to register with a state agency and obtain a permit to market (see Item 1A. “Risk Factors”).
Rent Control Legislation
. At certain of our Properties, principally in California, state and local rent control laws limit our ability to increase rents and to recover increases in operating expenses and the costs of capital improvements. Enactment of such laws has been considered from time to time in other jurisdictions. We presently expect to continue to maintain Properties, and may purchase additional properties, in markets that are either subject to rent control or in which rent-limiting legislation exists or may be enacted. For example, Florida law requires that rental increases be reasonable, and Delaware has enacted a law requiring rental increases greater than the consumer price index to be justified. Also, certain jurisdictions in California in which we own Properties limit rent increases to changes in the CPI or some percentage of it. As part of our effort to realize the value of Properties subject to restrictive regulation, we have initiated lawsuits against several municipalities imposing such regulations in an attempt to balance the interests of our stockholders with the interests of our customers (see Item 3. “Legal Proceedings”).
Insurance
. The Properties are insured against risks causing property damage and business interruption including events such as fire, flood, earthquake, or windstorm. The relevant insurance policies contain various deductible requirements, such as coverage limits and particular exclusions. Our current property and casualty insurance policies, which we plan to renew, expire on April 1, 2014. We have a $100 million loss limit with respect to our all-risk property insurance program including named windstorms, which include, for example, hurricanes. This loss limit is subject to additional sub-limits as set forth in the policy form, including, among others, a $25 million loss limit for an earthquake in California. Policy deductibles primarily range from a $125,000 minimum to 5% per unit of insurance for most catastrophic events. A deductible indicates our maximum exposure, subject to policy limits and sub-limits, in the event of a loss.
Industry
We believe that modern properties similar to our Properties provide an opportunity for increased cash flows and appreciation in value. These may be achieved through increases in occupancy rates and rents, as well as expense controls, expansion of existing Properties and opportunistic acquisitions, for the following reasons:
|
•
|
Barriers to Entry:
We believe that the supply of new properties in locations we target will be constrained by barriers to entry. The most significant barrier has been the difficulty of securing zoning permits from local authorities. This has been the result of (i) the public’s historically poor perception of manufactured housing, and (ii) the fact that manufactured housing and RV properties generate less tax revenue than conventional housing properties because the homes are treated as personal property (a benefit to the homeowner) rather than real property. Another factor that creates substantial barriers to entry is the length of time between investment in a property’s development and the attainment of stabilized occupancy and the generation of revenues. The initial development of the infrastructure may take up to two or three years. Once a property is ready for occupancy, it may be difficult to attract customers to an empty property. Substantial occupancy levels may take several years to achieve.
|
|
•
|
Industry Consolidation
: According to various industry reports, there are approximately 50,000 manufactured home properties and approximately 8,750 RV properties (excluding government owned properties) in North America. Most of these properties are not operated by large owner/operators, and of the RV properties approximately 1,300 contain 200 Sites or more. We believe that this relatively high degree of fragmentation provides us, as a national organization with experienced management and substantial financial resources, the opportunity to purchase additional properties as evidenced by the acquisitions during the year ended December 31, 2013.
|
4
|
•
|
Customer Base
: We believe that properties tend to achieve and maintain a stable rate of occupancy due to the following factors: (i) customers typically own their own homes, (ii) properties tend to foster a sense of community as a result of amenities such as clubhouses and recreational and social activities, (iii) customers often sell their homes in-place (similar to site-built residential housing) with no interruption of rental payments to us, and (iv) moving a Site Set home from one property to another involves substantial cost and effort.
|
|
•
|
Lifestyle Choice
: According to the Recreational Vehicle Industry Association (“RVIA”), nearly one in nine U.S. vehicle-owning households owns an RV and there are currently 8.9 million RV owners. The 77 million people born from 1946 to 1964 or “baby boomers” make up the fastest growing segment of this market. According to 2010 U.S. Census figures, every day 12,500 Americans turn 50. We believe that this population segment, seeking an active lifestyle, will provide opportunities for our future cash flow growth. As RV owners age and move beyond the more active RV lifestyle, they will often seek more permanent retirement or vacation establishments. Site Set housing has become an increasingly popular housing alternative for retirement, second-home, and “empty-nest” living. According to 2010 U.S. Census figures, the baby-boom generation will constitute almost 19% of the U.S. population within the next 20 years. Among those individuals who are nearing retirement (age 46 to 64), approximately 59% plan on moving upon retirement.
|
We believe that the housing choices in our Properties are especially attractive to such individuals throughout this lifestyle cycle. Our Properties offer an appealing amenity package, close proximity to local services, social activities, low maintenance and a secure environment. In fact, many of our Properties allow for this cycle to occur within a single Property.
|
•
|
Construction Quality:
Since 1976, the requirements to meet state, local and federal standards have become more stringent for all factory built housing, resulting in significant increases in quality. The Department of Housing and Urban Development’s (“HUD”) standards for Site Set housing construction quality are the only federal standards governing housing quality of any type in the United States. Site Set homes produced since 1976 have received a “red and silver” government seal certifying that they were built in compliance with the federal code. The code regulates Site Set home design and construction, strength and durability, fire resistance and energy efficiency, and the installation and performance of heating, plumbing, air conditioning, thermal and electrical systems. In newer homes, top grade lumber and dry wall materials are common. Also, manufacturers are required to follow the same fire codes as builders of site-built structures. In addition, although Resort Cottages do not come under the same regulations, many of the manufacturers of Site Set homes also produce Resort Cottages with many of the same quality standards.
|
|
•
|
Comparability to Site-Built Homes:
The Site Set housing industry has experienced a trend toward multi-section homes. Many modern Site Set homes are longer (up to 80 feet, compared to 50 feet in the 1960’s) and wider than earlier models. Many such homes have nine-foot ceilings or vaulted ceilings, fireplaces and as many as four bedrooms, and closely resemble single-family ranch-style site-built homes. At our Properties, there is an active resale or rental market for these larger homes.
|
|
•
|
Second Home Demographics
: According to 2013 National Association of Realtors (“NAR”) reports, sales of second homes in 2012 accounted for 35% of residential transactions, or 1.76 million second-home sales in 2012. There were approximately 7.9 million vacation homes in 2012. The typical vacation-home buyer is 47 years old and earned $92,100 in 2012. According to 2012 NAR reports, approximately 45% of vacation homes were purchased in the south; 25% were purchased in the west; 17% were purchased in the northeast; and 12% were purchased in the Midwest. In looking ahead, NAR believes that baby boomers are still in their peak earning years, and the leading edge of their generation is approaching retirement. As they continue to have the financial means to purchase a second home as a vacation property, investment opportunity, or perhaps as a retirement retreat, those baby boomers will continue to drive the market for second homes. We believe it is likely that over the next decade we will continue to see high levels of second-home sales, and resort homes and cottages in our Properties will continue to provide a viable second-home alternative to site-built homes.
|
Notwithstanding our belief that the industry information highlighted above provides us with significant long-term growth opportunities, our short-term growth opportunities could be disrupted by the following:
|
•
|
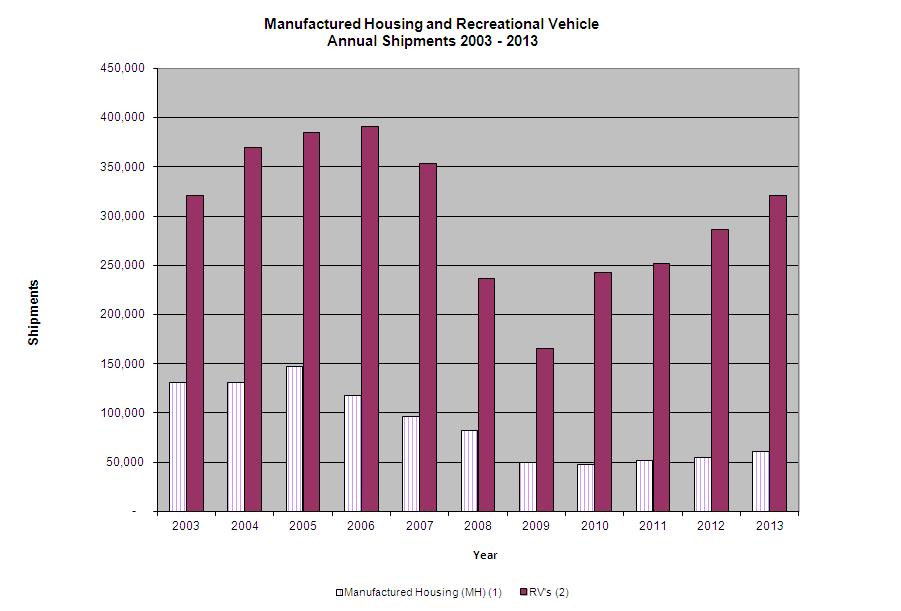
Shipments
—According to statistics compiled by the U.S. Census Bureau, shipments of new manufactured homes declined from 2005 through 2009. Since then, manufactured home shipments have increased each year and are on pace for a fifth straight year of growth. Although new manufactured home shipments continue to be below historical levels, shipments in
2013
increased over
9.8%
to
60,300
units as compared to shipments in
2012
of
54,900
units. According to the RVIA, wholesale shipments of RVs increased
12%
in
2013
to approximately
321,100
units as compared to
2012
, which continued a positive trend in RV shipments that started in late 2009. Certain industry experts have predicted that
2014
RV shipments will increase 3% to 4% as compared to 2013.
|
5
 ——————————————————————————————————————————————
|
1.
|
Source: Institute for Building Technology and Safety
|
|
2.
|
Source: RVIA
|
|
•
|
Sales:
Retail sales of RVs increased almost
18%
to
244,800
in
2013
as compared to
208,300
in
2012
. A total of
208,200
RVs were sold during the year ended
December 31, 2012
, representing an increase of over
8%
over the prior year. We believe that consumers remain concerned about the current economy, and by prospects that the economy might remain sluggish in the years ahead. However, the enduring appeal of the RV lifestyle has translated into continued strength in RV sales despite the economic turmoil. According to RVIA, RV ownership has reached record levels: 8.9 million American households now own an RV, the highest level ever recorded, which constitutes an increase of 12.7% since 2005. RV sales could continue to benefit as aging baby-boomers continue to enter the age range in which RV ownership is highest.
|
|
•
|
Availability of financing:
Since 2008 few sources of financing have been available for manufactured home and RV manufacturers. In addition, the economic and legislative environment has made it difficult for purchasers of manufactured homes and RVs to obtain financing. Legislation enacted in 2010 known as the SAFE Act (Safe Mortgage Licensing Act) requires community owners interested in providing financing for customer purchases of manufactured homes to register as a mortgage loan originator in states where they engage in such financing. In comparison to financing available to purchasers of site-built homes, the few third party financing sources available to purchasers of manufactured homes offer financing with higher down payments and shorter maturities and loan approval is subject to more stringent underwriting criteria. Certain government stimulus packages have also provided government guarantees for site-built single family home loans, thereby increasing the supply of financing for that market. We have contracted with a third party mortgage loan originator to finance customer purchases and we have a small network of lending relationships to provide financing options for our customers. Also, during 2013 we entered into an agreement with an unaffiliated third party home manufacturer to create a new joint venture, ECHO Financing, LLC, to buy and sell homes and provide financing. As the consumer credit environment slowly improves, we have seen an increase in availability of financing for the purchase of RVs.
|
Please see our risk factors, financial statements and related notes beginning on page F-1 of this Form 10-K for more detailed information.
6
Available Information
We file reports electronically with the Securities and Exchange Commission (“SEC”). The public may read and copy any materials we file with the SEC at the SEC’s Public Reference Room at 100 F Street, NE, Washington, DC 20549. The public may obtain information on the operation of the Public Reference Room by calling the SEC at 1-800-SEC-0330. The SEC maintains an Internet site that contains reports, proxy information and statements and other information regarding issuers that file electronically with the SEC at
http://www.sec.gov
.
We maintain an Internet site with information about us and hyperlinks to our filings with the SEC at
http://www.equitylifestyle.com
,
free of charge. Requests for copies of our filings with the SEC and other investor inquiries should be directed to:
Investor Relations Department
Equity LifeStyle Properties, Inc.
Two North Riverside Plaza
Chicago, Illinois 60606
Phone: 1-800-247-5279
e-mail: investor_relations@equitylifestyle.com
Our Performance and Common Stock Value Are Subject to Risks Associated With the Real Estate Industry.
Adverse Economic Conditions and Other Factors Could Adversely Affect the Value of our Properties and our Cash Flow
. Several factors may adversely affect the economic performance and value of our Properties. These factors include:
|
•
|
changes in the national, regional and local economic climate;
|
|
•
|
local conditions such as an oversupply of lifestyle-oriented properties or a reduction in demand for lifestyle-oriented properties in the area, the attractiveness of our Properties to customers, competition from manufactured home communities and other lifestyle-oriented properties and alternative forms of housing (such as apartment buildings and site-built single family homes);
|
|
•
|
the ability of manufactured home and RV manufacturers to adapt to changes in the economic climate and the availability of units from these manufacturers;
|
|
•
|
the ability of our potential customers to sell or lease their existing site-built residences in order to purchase resort homes or cottages at our Properties, and heightened price sensitivity for seasonal and second homebuyers;
|
|
•
|
the possible reduced ability of our potential customers to obtain financing on the purchase of resort homes, resort cottages or RVs;
|
|
•
|
performance of chattel loans purchased in connection with the 2011 Acquisition (see Note 5 in the Notes to the Consolidated Financial Statements contained in this Form 10-K for further discussion of the 2011 Acquisition);
|
|
•
|
government stimulus intended to primarily benefit purchasers of site-built housing;
|
|
•
|
fluctuations in the availability and price of gasoline, especially for our transient customers;
|
|
•
|
our ability to collect rent, annual payments and principal and interest from customers and pay or control maintenance, insurance and other operating costs (including real estate taxes), which could increase over time;
|
|
•
|
the failure of our assets to generate income sufficient to pay our expenses, service our debt and maintain our Properties, which may adversely affect our ability to make expected distributions to our stockholders;
|
|
•
|
our inability to meet mortgage payments on any Property that is mortgaged, in which case the lender could foreclose on the mortgage and take the Property;
|
|
•
|
interest rate levels and the availability of financing, which may adversely affect our financial condition;
|
|
•
|
changes in laws and governmental regulations (including rent control laws and regulations governing usage, zoning and taxes), which may adversely affect our financial condition;
|
|
•
|
changes in laws and governmental regulations related to proposed minimum wage increases may adversely affect our financial condition;
|
|
•
|
poor weather, especially on holiday weekends in the summer, which could reduce the economic performance of our Northern resort Properties; and
|
|
•
|
our ability to attract customers to enter new or upgraded right-to-use contracts and to retain customers who have previously entered right-to-use contracts.
|
New Acquisitions May Fail to Perform as Expected and Competition for Acquisitions May Result in Increased Prices for Properties
. We intend to continue to acquire Properties. Newly acquired Properties may fail to perform as expected. We may underestimate the costs necessary to bring an acquired Property up to standards established for our intended market position. Difficulties in integrating acquisitions may prove costly or time-consuming and could divert management attention. Additionally, we expect that other real estate investors with significant capital will compete with us for attractive investment opportunities. These competitors may include publicly traded REITs, private REITs and other types of investors. Such competition increases prices for Properties.
7
We expect to acquire Properties with cash from sources included but not limited to secured or unsecured financings, proceeds from offerings of equity or debt, offerings of OP Units, undistributed funds from operations and sales of investments. We may not be in a position or have the opportunity in the future to make suitable Property acquisitions on favorable terms.
The Intended Benefits of Our Acquisitions May Not Be Realized, Which Could Have a Negative Impact on the Market Price of Our Common Stock.
Acquisitions pose risks for our ongoing operations, including that:
|
•
|
senior management’s attention may be diverted from the management of daily operations to the integration of an acquisition;
|
|
•
|
costs and expenses associated with any undisclosed or potential liabilities;
|
|
•
|
an acquisition may not perform as well as we anticipate; and
|
|
•
|
unforeseen difficulties may arise in integrating an acquisition into our portfolio.
|
As a result of the foregoing, we cannot assure you that any acquisitions that we make will be accretive to us in the near term or at all. Furthermore, if we fail to realize the intended benefits of an acquisition, the market price of our common stock could decline to the extent that the market price reflects those benefits.
Because Real Estate Investments Are Illiquid, We May Not be Able to Sell Properties When Appropriate
. Real estate investments generally cannot be sold quickly. We may not be able to vary our portfolio promptly in response to economic or other conditions, forcing us to accept lower than market value. This inability to respond promptly to changes in the performance of our investments could adversely affect our financial condition and ability to service debt and make distributions to our stockholders.
The Current Volume of Home Sales Has Resulted In An Increased Use of Our Rental Program to Maintain Occupancy.
Beginning in 2008, our ability to sell new and used homes was significantly impacted by the disruption in the single family housing market. To maintain occupancy, we increased our manufactured home rental operations by purchasing new homes for rental and also renting used homes acquired from customers through purchase, lien sale or abandonment. While our long-term goal is to sell these rental units to homeowners, there is no assurance that we will be successful and we may not be able to liquidate our investment in these homes. In addition, our home rental operations compete with other types of rentals (e.g., apartments), and there is no assurance we will be able to maintain tenants in our investment of rental units.
Some Potential Losses Are Not Covered by Insurance.
We carry comprehensive insurance coverage for losses resulting from property damage, environmental, liability claims and business interruption on all of our Properties. In addition we carry liability coverage for other activities not specifically related to property operations. These coverages include, but are not limited to, Directors & Officers liability, Employer Practices liability and Fiduciary liability. We believe that the policy specifications and coverage limits of these policies should be adequate and appropriate. There are, however, certain types of losses, such as lease and other contract claims that generally are not insured. Should an uninsured loss or a loss in excess of coverage limits occur, we could lose all or a portion of the capital we have invested in a Property or the anticipated future revenue from a Property. In such an event, we might nevertheless remain obligated for any mortgage debt or other financial obligations related to the Property.
Our current property and casualty insurance policies, which we plan to renew, expire on April 1, 2014. We have a $100 million loss limit with respect to our all-risk property insurance program including named windstorms, which include, for example, hurricanes. This loss limit is subject to additional sub-limits as set forth in the policy form, including, among others, a $25 million loss limit for an earthquake in California. Policy deductibles primarily range from a $125,000 minimum to 5% per unit of insurance for most catastrophic events. A deductible indicates our maximum exposure, subject to policy limits and sub-limits, in the event of a loss.
Our Depositary Shares, Which Represent Our 6.75% Series C Cumulative Redeemable Perpetual Preferred Stock, Have Not Been Rated and are Subordinated to Our Debt.
We have not obtained and do not intend to obtain a rating for our depositary shares (the “Depositary Shares”) which represent our 6.75% Series C Cumulative Redeemable Perpetual Preferred Stock (the “Series C Preferred Stock”). No assurance can be given, however, that one or more rating agencies might not independently determine to issue such a rating or that such a rating, if issued, would not adversely affect the market price of the Depositary Shares.
In addition, the Depositary Shares are subordinate to all of our existing and future debt. As described below, our existing debt may restrict, and our future debt may include restrictions on, our ability to pay distributions to preferred stockholders or to make an optional redemption payment to preferred stockholders. The issuance of additional shares of preferred stock on parity with or senior to our Series C Preferred Stock represented by the Depositary Shares would dilute the interests of the holders of our Depositary Shares, and any issuance of preferred stock senior to our Series C Preferred Stock (and, therefore, the Depositary Shares) or of additional indebtedness could affect our ability to pay distributions on, redeem or pay the liquidation preference on our Depositary Shares. Other than the conversion rights afforded to holders of our preferred shares that may occur in connection with a change of control triggering event, none of the provisions relating to our preferred shares contain any provision affording the holders of our preferred shares protection in the event of a highly leveraged or other transaction, including a merger or the sale, lease or conveyance of all
8
or substantially all our assets or business, that might materially and adversely affect the holders of our preferred shares, so long as the rights of the holders of our preferred shares are not materially and adversely affected.
Adverse Changes In General Economic Conditions May Adversely Affect Our Business.
Our success is dependent upon economic conditions in the U.S. generally and in the geographic areas in which a substantial number of our Properties are located. Adverse changes in national economic conditions and in the economic conditions of the regions in which we conduct substantial business may have an adverse effect on the real estate values of our Properties, our financial performance and the market price of our common stock.
In a recession or under other adverse economic conditions, non-earning assets and write-downs are likely to increase as debtors fail to meet their payment obligations. Although we maintain reserves for credit losses and an allowance for doubtful accounts in amounts that we believe should be sufficient to provide adequate protection against potential write-downs in our portfolio, these amounts could prove to be insufficient.
Laws and Regulations Relating to Campground Membership Sales and Properties Could Adversely Affect the Value of Certain Properties and Our Cash Flow.
Many of the states in which we do business have laws regulating right-to-use or campground membership sales. These laws generally require comprehensive disclosure to prospective purchasers, and usually give purchasers the right to rescind their purchase between three to five days after the date of sale. Some states have laws requiring us to register with a state agency and obtain a permit to market. We are subject to changes, from time to time, in the application or interpretation of such laws that can affect our business or the rights of our members.
In some states, including California, Oregon and Washington, laws place limitations on the ability of the owner of a campground property to close the property unless the customers at the property receive access to a comparable property. The impact of the rights of customers under these laws is uncertain and could adversely affect the availability or timing of sale opportunities or our ability to realize recoveries from Property sales.
The government authorities regulating our activities have broad discretionary power to enforce and interpret the statutes and regulations that they administer, including the power to enjoin or suspend sales activities, require or restrict construction of additional facilities and revoke licenses and permits relating to business activities. We monitor our sales and marketing programs and debt collection activities to control practices that might violate consumer protection laws and regulations or give rise to consumer complaints.
Certain consumer rights and defenses that vary from jurisdiction to jurisdiction may affect our portfolio of contracts receivable. Examples of such laws include state and federal consumer credit and truth-in-lending laws requiring the disclosure of finance charges, and usury and retail installment sales laws regulating permissible finance charges.
In certain states, as a result of government regulations and provisions in certain of the right-to-use or campground membership agreements, we are prohibited from selling more than ten memberships per site. At the present time, these restrictions do not preclude us from selling memberships in any state. However, these restrictions may limit our ability to utilize Properties for public usage and/or our ability to convert Sites to more profitable or predictable uses, such as annual rentals.
Debt Financing, Financial Covenants and Degree of Leverage Could Adversely Affect Our Economic Performance.
Scheduled Debt Payments Could Adversely Affect Our Financial Condition
. Our business is subject to risks normally associated with debt financing. The total principal amount of our outstanding indebtedness was approximately
$2.2 billion
as of
December 31, 2013
, of which approximately
$513.7 million
, or
23.4%
, matures in 2015 and 2016. Our substantial indebtedness and the cash flow associated with serving our indebtedness could have important consequences, including the risks that:
|
•
|
our cash flow could be insufficient to pay distributions at expected levels and meet required payments of principal and interest;
|
|
•
|
we might be required to use a substantial portion of our cash flow from operations to pay our indebtedness, thereby reducing the availability of our cash flow to fund the implementation of our business strategy, acquisitions, capital expenditures and other general corporate purposes;
|
|
•
|
our debt service obligations could limit our flexibility in planning for, or reacting to, changes in our business and the industry in which we operate;
|
|
•
|
we may not be able to refinance existing indebtedness (which in virtually all cases requires substantial principal payments at maturity) and, if we can, the terms of such refinancing might not be as favorable as the terms of existing indebtedness;
|
|
•
|
if principal payments due at maturity cannot be refinanced, extended or paid with proceeds of other capital transactions, such as new equity capital, our cash flow will not be sufficient in all years to repay all maturing debt; and
|
9
|
•
|
if prevailing interest rates or other factors at the time of refinancing (such as the possible reluctance of lenders to make commercial real estate loans) result in higher interest rates, increased interest expense would adversely affect cash flow and our ability to service debt and make distributions to stockholders.
|
Ability To Obtain Mortgage Financing Or To Refinance Maturing Mortgages May Adversely Affect Our Financial Condition
. Lenders' demands on borrowers as to the quality of the collateral and related cash flows may make it challenging to secure financing on attractive terms or at all. If terms are no longer attractive or if financing proceeds are no longer available for any reason, these factors may adversely affect cash flow and our ability to service debt and make distributions to stockholders.
Financial Covenants Could Adversely Affect Our Financial Condition
. If a Property is mortgaged to secure payment of indebtedness, and we are unable to meet mortgage payments, the mortgagee could foreclose on the Property, resulting in loss of income and asset value. The mortgages on our Properties contain customary negative covenants, which among other things limit our ability, without the prior consent of the lender, to further mortgage the Property and to discontinue insurance coverage. In addition, our unsecured credit facilities contain certain customary restrictions, requirements and other limitations on our ability to incur indebtedness, including total debt-to-assets ratios, debt service coverage ratios and minimum ratios of unencumbered assets to unsecured debt. Foreclosure on mortgaged Properties or an inability to refinance existing indebtedness would likely have a negative impact on our financial condition and results of operations.
Our Degree of Leverage Could Limit Our Ability to Obtain Additional Financing
. Our debt-to-market-capitalization ratio (total debt as a percentage of total debt plus the market value of the outstanding common stock and Units held by parties other than us) was approximately
40%
as of
December 31, 2013
. The degree of leverage could have important consequences to stockholders, including an adverse effect on our ability to obtain additional financing in the future for working capital, capital expenditures, acquisitions, development or other general corporate purposes, and makes us more vulnerable to a downturn in business or the economy generally.
We May Be Able To Incur Substantially More Debt, Which Would Increase The Risks Associated With Our Substantial Leverage.
Despite our current indebtedness levels, we may still be able to incur substantially more debt in the future. If new debt is added to our current debt levels, an even greater portion of our cash flow will be needed to satisfy our debt service obligations. As a result, the related risks that we now face could intensify and increase the risk of a default on our indebtedness.
We Depend on Our Subsidiaries’ Dividends and Distributions.
Substantially all of our assets are owned indirectly by the Operating Partnership. As a result, we have no source of cash flow other than distributions from the Operating Partnership. For us to pay dividends to holders of our common stock and preferred stock, the Operating Partnership must first distribute cash to us. Before it can distribute the cash, the Operating Partnership must first satisfy its obligations to its creditors.
Stockholders’ Ability to Effect Changes of Our Control is Limited.
Provisions of Our Charter and Bylaws Could Inhibit Changes of Control
. Certain provisions of our charter and bylaws may delay or prevent a change of our control or other transactions that could provide our stockholders with a premium over the then-prevailing market price of their common stock or Series C Preferred Stock or which might otherwise be in the best interest of our stockholders. These include the Ownership Limit described below. Also, any future series of preferred stock may have certain voting provisions that could delay or prevent a change of control or other transaction that might involve a premium price or otherwise be beneficial to our stockholders.
Maryland Law Imposes Certain Limitations on Changes of Control
. Certain provisions of Maryland law prohibit “business combinations” (including certain issuances of equity securities) with any person who beneficially owns 10% or more of the voting power of outstanding common stock, or with an affiliate of ours, who, at any time within the two-year period prior to the date in question, was the owner of 10% or more of the voting power of the outstanding voting stock (an “Interested Stockholder”), or with an affiliate of an Interested Stockholder. These prohibitions last for five years after the most recent date on which the Interested Stockholder became an Interested Stockholder. After the five-year period, a business combination with an Interested Stockholder must be approved by two super-majority stockholder votes unless, among other conditions, our common stockholders receive a minimum price for their shares and the consideration is received in cash or in the same form as previously paid by the Interested Stockholder for our shares of common stock. The Board of Directors has exempted from these provisions under the Maryland law any business combination with Samuel Zell, who is our Chairman of the Board, certain holders of Units who received them at the time of our initial public offering, the General Motors Hourly Rate Employees Pension Trust and the General Motors Salaried Employees Pension Trust, and our officers who acquired common stock at the time we were formed and each and every affiliate of theirs.
10
We Have a Stock Ownership Limit for REIT Tax Purposes
. To remain qualified as a REIT for U.S. federal income tax purposes, not more than 50% in value of our outstanding shares of capital stock may be owned, directly or indirectly, by five or fewer individuals (as defined in the federal income tax laws applicable to REITs) at any time during the last half of any taxable year. To facilitate maintenance of our REIT qualification, our charter, subject to certain exceptions, prohibits Beneficial Ownership (as defined in our charter) by any single stockholder of more than 5% (in value or number of shares, whichever is more restrictive) of our outstanding capital stock. We refer to this as the “Ownership Limit.” Within certain limits, our charter permits the Board of Directors to increase the Ownership Limit with respect to any class or series of stock. The Board of Directors, upon receipt of a ruling from the IRS, opinion of counsel, or other evidence satisfactory to the Board of Directors and upon 15 days prior written notice of a proposed transfer which, if consummated, would result in the transferee owning shares in excess of the Ownership Limit, and upon such other conditions as the Board of Directors may direct, may exempt a stockholder from the Ownership Limit. Absent any such exemption, capital stock acquired or held in violation of the Ownership Limit will be transferred by operation of law to us as trustee for the benefit of the person to whom such capital stock is ultimately transferred, and the stockholder’s rights to distributions and to vote would terminate. Such stockholder would be entitled to receive, from the proceeds of any subsequent sale of the capital stock we transferred as trustee, the lesser of (i) the price paid for the capital stock or, if the owner did not pay for the capital stock (for example, in the case of a gift, devise on other such transaction), the market price of the capital stock on the date of the event causing the capital stock to be transferred to us as trustee or (ii) the amount realized from such sale. A transfer of capital stock may be void if it causes a person to violate the Ownership Limit. The Ownership Limit could delay or prevent a change in control of us and, therefore, could adversely affect our stockholders’ ability to realize a premium over the then-prevailing market price for their common stock or adversely affect the best interest of our stockholders.
Conflicts of Interest Could Influence Our Decisions.
Certain Stockholders Could Exercise Influence in a Manner Inconsistent With the Stockholders’ Best Interests
. As of
December 31, 2013
, Mr. Samuel Zell and certain affiliated holders beneficially owned approximately
8.8%
of our outstanding common stock (in each case including common stock issuable upon the exercise of stock options and the exchange of Units). Mr. Zell is the chairman of our Board of Directors. Accordingly, Mr. Zell has significant influence on our management and operation. Such influence could be exercised in a manner that is inconsistent with the interests of other stockholders.
Mr. Zell and His Affiliates Continue to be Involved in Other Investment Activities
. Mr. Zell and his affiliates have a broad and varied range of investment interests, including interests in other real estate investment companies involved in other forms of housing, including multifamily housing. Mr. Zell and his affiliates may acquire interests in other companies. Mr. Zell may not be able to control whether any such company competes with us. Consequently, Mr. Zell’s continued involvement in other investment activities could result in competition to us as well as management decisions that might not reflect the interests of our stockholders.
Risk of Tenant Litigation.
We own Properties in certain areas of the country where the rental rates in our Properties have not increased as fast as the real estate values either because of locally imposed rent control or long term leases. In such areas, certain local government entities have at times investigated the possibility of seeking to take our Properties by eminent domain at values below the value of the underlying land. While no such eminent domain proceeding has been commenced, and we would exercise all of our rights in connection with any such proceeding, successful condemnation proceedings by municipalities could adversely affect our financial condition. Moreover, certain of our Properties located in California are subject to rent control ordinances, some of which not only severely restrict ongoing rent increases but also prohibit us from increasing rents upon turnover. Such regulations allow customers to sell their homes for a premium representing the value of the future rent discounts resulting from rent-controlled rents. Tenant groups have filed lawsuits against us seeking not only to limit rent increases, but to be awarded large damage awards due to alleged failure to properly maintain certain Properties.
Environmental and Utility-Related Problems Are Possible and Can be Costly.
Federal, state and local laws and regulations relating to the protection of the environment may require a current or previous owner or operator of real property to investigate and clean up hazardous or toxic substances or petroleum product releases at such property. The owner or operator may have to pay a governmental entity or third parties for property damage and for investigation and clean-up costs incurred by such parties in connection with the contamination. Such laws typically impose clean-up responsibility and liability without regard to whether the owner or operator knew of or caused the presence of the contaminants. Even if more than one person may have been responsible for the contamination, each person covered by the environmental laws may be held responsible for all of the clean-up costs incurred. In addition, third parties may sue the owner or operator of a site for damages and costs resulting from environmental contamination emanating from that site.
Environmental laws also govern the presence, maintenance and removal of asbestos. Such laws require that owners or operators of property containing asbestos properly manage and maintain the asbestos, that they notify and train those who may come into contact with asbestos and that they undertake special precautions, including removal or other abatement, if asbestos would be
11
disturbed during renovation or demolition of a building. Such laws may impose fines and penalties on real property owners or operators who fail to comply with these requirements and may allow third parties to seek recovery from owners or operators for personal injury associated with exposure to asbestos fibers.
Utility-related laws and regulations also govern the provision of utility services and operations of water and wastewater treatment facilities. Such laws regulate, for example, how and to what extent owners or operators of property can charge renters for provision of, for example, electricity, and whether and to what extent such utility services can be charged separately from the base rent. Such laws also regulate the operations and performance of water treatment facilities and wastewater treatment facilities. Such laws may impose fines and penalties on real property owners or operators who fail to comply with these requirements.
We have a Significant Concentration of Properties in Florida and California, and Natural Disasters or Other Catastrophic Events in These or Other States Could Adversely Affect the Value of Our Properties and Our Cash Flow.
As of
December 31, 2013
, we owned or had an ownership interest in
377
Properties located in
32
states and British Columbia, including
120
Properties located in Florida and
49
Properties located in California. The occurrence of a natural disaster or other catastrophic event in any of these areas may cause a sudden decrease in the value of our Properties. While we have obtained insurance policies providing certain coverage against damage from fire, flood, property damage, earthquake, wind storm and business interruption, these insurance policies contain coverage limits, limits on covered property and various deductible amounts that we must pay before insurance proceeds are available. Such insurance may therefore be insufficient to restore our economic position with respect to damage or destruction to our Properties caused by such occurrences. Moreover, each of these coverages must be renewed every year and there is the possibility that all or some of the coverages may not be available at a reasonable cost. In addition, in the event of such a natural disaster or other catastrophic event, the process of obtaining reimbursement for covered losses, including the lag between expenditures we incurred and reimbursements received from the insurance providers, could adversely affect our economic performance.
Market Interest Rates May Have an Effect on the Value of Our Common Stock.
One of the factors that investors consider important in deciding whether to buy or sell shares of a REIT is the distribution rates with respect to such shares (as a percentage of the price of such shares) relative to market interest rates. If market interest rates go up, prospective purchasers of REIT shares may expect a higher distribution rate. Higher interest rates would not, however, result in more of our funds to distribute and, in fact, would likely increase our borrowing costs and potentially decrease funds available for distribution. Thus, higher market interest rates could cause the market price of our publicly traded securities to go down.
We Are Dependent on External Sources of Capital.
To qualify as a REIT, we must distribute to our stockholders each year at least 90% of our REIT taxable income (determined without regard to the deduction for dividends paid and excluding any net capital gain). In addition, we intend to distribute all or substantially all of our net income so that we will generally not be subject to U.S. federal income tax on our earnings. Because of these distribution requirements, it is not likely that we will be able to fund all future capital needs, including for acquisitions, from income from operations. We therefore will have to rely on third-party sources of debt and equity capital financing, which may or may not be available on favorable terms or at all. Our access to third-party sources of capital depends on a number of things, including conditions in the capital markets generally and the market’s perception of our growth potential and our current and potential future earnings. It may be difficult for us to meet one or more of the requirements for qualification as a REIT, including but not limited to our distribution requirement. Moreover, additional equity offerings may result in substantial dilution of stockholders’ interests, and additional debt financing may substantially increase our leverage.
We Face Possible Risks Associated with the Physical Effects of Climate Change.
We cannot predict with certainty whether climate change is occurring and, if so, at what rate. However, the physical effects of climate change could have a material adverse effect on our Properties, operations and business. For example, many of our properties are located in the southeast and southwest regions of the United States, particularly in Florida, California and Arizona. To the extent climate change causes changes in weather patterns, our markets could experience increases in storm intensity and rising sea-levels. Over time, these conditions could result in declining demand for space in our Properties or our inability to operate them. Climate change may also have indirect effects on our business by increasing the cost of (or making unavailable) property insurance on terms we find acceptable, increasing the cost of energy and increasing the cost of snow removal or related costs at our Properties. Proposed legislation to address climate change could increase utility and other costs of operating our Properties which, if not offset by rising rental income, would reduce our net income. There can be no assurance that climate change will not have a material adverse effect on our Properties, operations or business.
12
Americans with Disabilities Act Compliance Could be Costly.
Under the Americans with Disabilities Act of 1990 (“ADA”), all public accommodations and commercial facilities must meet certain federal requirements related to access and use by disabled persons. Compliance with the ADA requirements could involve removal of structural barriers to access or use by disabled persons. Other federal, state and local laws may require modifications to or restrict further renovations of our Properties with respect to such accesses. Although we believe that our Properties are substantially in compliance with present requirements, noncompliance with the ADA or related laws or regulations could result in the United States government imposing fines or private litigants being awarded damages against us. Such costs may adversely affect our ability to make distributions or payments to our investors.
Affordable Care Act Compliance Could be Costly.
President Obama signed the Patient Protection and Affordable Care Act into law in 2010, which was amended by the Health Care and Education Reconciliation Act of 2010 (collectively, the “Affordable Care Act”). The Affordable Care Act is designed to expand access to affordable health insurance, among other objectives. Many aspects of the Affordable Care Act are being implemented through new regulations and regulatory guidance, which are continuing to be issued. While we cannot accurately predict at this time the full effect of the Affordable Care Act on our business, compliance may adversely impact our labor costs, our ability to negotiate favorable terms under our benefits plans for our employees, our ability to attract or retain employees or our operations to the extent that compliance may affect the composition of our workforce, any or all of which could be costly. Such costs may adversely affect our ability to make distributions or payments to our investors.
We Face Risks Relating to Cybersecurity Attacks That Could Cause Loss of Confidential Information and Other Business Disruptions.
We rely extensively on internally and externally hosted computer systems to process transactions and manage our business, and our business is at risk from and may be impacted by cybersecurity attacks. These could include attempts to gain unauthorized access to our data and computer systems. Attacks can be both individual and/or highly organized attempts organized by very sophisticated hacking organizations. We employ a number of measures to prevent, detect and mitigate these threats, which include password protection, frequent password change events, firewall detection systems, frequent backups, a redundant data system for core applications and annual penetration testing; however, there is no guarantee such efforts will be successful in preventing a cyber attack. A cybersecurity attack could compromise the confidential information of our employees, customers and vendors to the extent such information exists on our systems. A successful attack could disrupt and affect our business operations.
Our Qualification as a REIT is Dependent on Compliance With U.S. Federal Income Tax Requirements.
We believe we have been organized and operated in a manner so as to qualify for taxation as a REIT, and we intend to continue to operate so as to qualify as a REIT for U.S. federal income tax purposes. Qualification as a REIT for U.S. federal income tax purposes, however, is governed by highly technical and complex provisions of the Code for which there are only limited judicial or administrative interpretations. In connection with certain transactions, we have received, and relied upon, advice of counsel as to the impact of such transactions on our qualification as a REIT. Our qualification as a REIT requires analysis of various facts and circumstances that may not be entirely within our control, and we cannot provide any assurance that the Internal Revenue Service (the “IRS”) will agree with our analysis or the analysis of our tax counsel. In particular, the proper federal income tax treatment of right-to-use membership contracts is uncertain and there is no assurance that the IRS will agree with our treatment of such contracts. If the IRS were to disagree with our analysis or our tax counsel’s analysis of various facts and circumstances, our ability to qualify as a REIT could be adversely affected. In addition, legislation, new regulations, administrative interpretations or court decisions might significantly change the tax laws with respect to the requirements for qualification as a REIT or the U.S. federal income tax consequences of qualification as a REIT.
If, with respect to any taxable year, we failed to maintain our qualification as a REIT (and if specified relief provisions under the Code were not applicable to such disqualification), we could not deduct distributions to stockholders in computing our net taxable income and we would be subject to U.S. federal income tax on our net taxable income at regular corporate rates. Any U.S. federal income tax payable could include applicable alternative minimum tax. If we had to pay U.S. federal income tax, the amount of money available to distribute to stockholders and pay indebtedness would be reduced for the year or years involved, and we would no longer be required to distribute money to stockholders. In addition, we would also be disqualified from treatment as a REIT for the four taxable years following the year during which qualification was lost, unless we were entitled to relief under the relevant statutory provisions. Although we currently intend to operate in a manner designed to allow us to qualify as a REIT, future economic, market, legal, tax or other considerations may cause us to revoke the REIT election.
13
Interpretation of and Changes to Accounting Policies and Standards Could Adversely Affect Our Reported Financial Results.
Our Accounting Policies and Methods Are the Basis on Which We Report Our Financial Condition and Results of Operations, and They May Require Management to Make Estimates About Matters that Are Inherently Uncertain.
Our accounting policies and methods are fundamental to the manner in which we record and report our financial condition and results of operations. Management must exercise judgment in selecting and applying many of these accounting policies and methods in order to ensure that they comply with generally accepted accounting principles and reflect management’s judgment as to the most appropriate manner in which to record and report our financial condition and results of operations. In some cases, management must select the accounting policy or method to apply from two or more alternatives, any of which might be reasonable under the circumstances yet might result in reporting materially different amounts than would have been reported under a different alternative.
Changes in Accounting Standards Could Adversely Affect Our Reported Financial Results.
The bodies that set accounting standards for public companies, including the Financial Accounting Standards Board (“FASB”), the SEC and others, periodically change or revise existing interpretations of the accounting and reporting standards that govern the way that we report our financial condition, results of operations, and cash flows. These changes can be difficult to predict and can materially impact our reported financial results. In some cases, we could be required to apply a new or revised accounting standard, or a revised interpretation of an accounting standard, retroactively, which could have a negative impact on reported results or result in the restatement of our financial statements for prior periods.
Our Accounting Policies for Entering Right-To-Use Contracts Will Result in a Substantial Deferral of Revenue in Our Financial Results.
In 2008, we began entering right-to-use contracts. Customers who enter upgraded right-to-use contracts are generally required to make an upfront nonrefundable payment to us. We incur significant selling and marketing expenses to originate the right-to-use contract upgrades, and the majority of expenses must be expensed in the period incurred, while the related revenues and commissions are generally deferred and recognized over the expected life of the contract, which is estimated based upon historical attrition rates. The expected life of a right-to-use contract is currently estimated to be between one and 31 years. As a result, we may incur a loss from entering right-to-use contract upgrades, build up a substantial deferred revenue liability balance, and recognize substantial non-cash revenue in the years subsequent to originally entering the contract upgrades. This accounting may make it difficult for investors to interpret the financial results from the entry of right-to-use contract upgrades. At the time we began entering right-to-use contracts, we adopted a revenue recognition policy for the right-to-use contracts in accordance with the Codification Topic “Revenue Recognition” (“FASB ASC 605”) after we corresponded with the Office of the Chief Accountant at the SEC.
None.
14
General
Our Properties provide attractive amenities and common facilities that create a comfortable and attractive home for our customers, with most offering a clubhouse, a swimming pool, laundry facilities and cable television service. Many also offer additional amenities such as sauna/whirlpool spas, golf courses, tennis, shuffleboard and basketball courts, exercise rooms and various social activities such as concerts. Since most of our customers generally live in our communities for a long time, it is their responsibility to maintain their homes and the surrounding area. It is our role to ensure that customers comply with our Property policies and to provide maintenance of the common areas, facilities and amenities. We hold periodic meetings with our Property management personnel for training and implementation of our strategies. The Properties historically have had, and we believe they will continue to have, low turnover and high occupancy rates.
Property Portfolio
As of
December 31, 2013
, we owned or had an ownership interest in a portfolio of
377
Properties located throughout the United States and British Columbia containing
139,126
residential Sites. A total of 147 of the Properties are encumbered by debt as of December 31, 2013 (see Note 8 of the Notes to Consolidated Financial Statements contained in this Form 10-K for a description of this debt). The distribution of our Properties throughout the United States reflects our belief that geographic diversification helps to insulate the portfolio from regional economic influences. We intend to target new acquisitions in or near markets where our Properties are located and will also consider acquisitions of Properties outside such markets. (Refer to Note 2(c) of the Notes to Consolidated Financial Statements contained in this Form 10-K.)
Our two largest Properties as determined by property operating revenues are Colony Cove, located in Ellenton, Florida, and Bay Indies, located in Venice, Florida. Each accounted for approximately 2.0% of our total property operating revenues, including deferrals, for the year ended
December 31, 2013
.
The following table sets forth certain information relating to the Properties we owned as of December 31, 2013, categorized according to major markets and excluding Properties owned through joint ventures. The RV communities Sites occupied by annual customers are presented as 100% occupied. The annual rent for each year presented is the annualized December monthly Site rent per occupant. Subtotals by markets and grand totals for all markets are presented on a weighted average basis.
|
|
||||||||||||||||||||||||
|
Property
|
City
|
State
|
MH/RV
|
Acres
(c)
|
Developable
Acres (d) |
Expansion
Sites (e) |
Total Number of Sites as of 12/31/13
|
Total Number of Annual Sites as of 12/31/13
|
Annual Site Occupancy as of 12/31/13
|
Annual Rent as of 12/31/13
|
||||||||||||||
|
Florida
|
||||||||||||||||||||||||
|
East Coast:
|
||||||||||||||||||||||||
|
Sunshine Key
|
Big Pine Key
|
FL
|
RV
|
54
|
|
|
409
|
70
|
100.0
|
%
|
$
|
10,117
|
|
|||||||||||
|
Cheron Village
|
Davie
|
FL
|
MH
|
30
|
|
|
202
|
202
|
96.5
|
%
|
$
|
8,273
|
|
|||||||||||
|
Carriage Cove
|
Daytona Beach
|
FL
|
MH
|
59
|
|
|
418
|
418
|
90.2
|
%
|
$
|
6,040
|
|
|||||||||||
|
Coquina Crossing
|
Elkton
|
FL
|
MH
|
316
|
26
|
145
|
568
|
566
|
94.5
|
%
|
$
|
6,660
|
|
|||||||||||
|
Bulow Plantation
|
Flagler Beach
|
FL
|
MH
|
323
|
181
|
722
|
276
|
276
|
98.6
|
%
|
$
|
6,529
|
|
|||||||||||
|
Bulow RV
|
Flagler Beach
|
FL
|
RV
|
(f)
|
|
|
352
|
76
|
100.0
|
%
|
$
|
5,998
|
|
|||||||||||
|
Carefree Cove
|
Ft. Lauderdale
|
FL
|
MH
|
20
|
|
|
164
|
164
|
93.9
|
%
|
$
|
6,850
|
|
|||||||||||
|
Park City West
|
Ft. Lauderdale
|
FL
|
MH
|
60
|
|
|
363
|
363
|
97.5
|
%
|
$
|
6,859
|
|
|||||||||||
|
Sunshine Holiday MH
|
Ft. Lauderdale
|
FL
|
MH
|
32
|
|
|
270
|
270
|
89.6
|
%
|
$
|
7,164
|
|
|||||||||||
|
Sunshine Holiday RV
|
Ft. Lauderdale
|
FL
|
RV
|
(f)
|
|
|
130
|
32
|
100.0
|
%
|
$
|
6,257
|
|
|||||||||||
|
Lake Worth Village
|
Lake Worth
|
FL
|
MH
|
117
|
|
|
823
|
823
|
78.4
|
%
|
$
|
7,142
|
|
|||||||||||
|
Maralago Cay
|
Lantana
|
FL
|
MH
|
102
|
5
|
|
603
|
603
|
97.7
|
%
|
$
|
8,010
|
|
|||||||||||
|
Coral Cay
|
Margate
|
FL
|
MH
|
121
|
|
|
819
|
818
|
97.8
|
%
|
$
|
7,001
|
|
|||||||||||
15
|
|
||||||||||||||||||||||||
|
Property
|
City
|
State
|
MH/RV
|
Acres
(c)
|
Developable
Acres (d) |
Expansion
Sites (e) |
Total Number of Sites as of 12/31/13
|
Total Number of Annual Sites as of 12/31/13
|
Annual Site Occupancy as of 12/31/13
|
Annual Rent as of 12/31/13
|
||||||||||||||
|
Lakewood Village
|
Melbourne
|
FL
|
MH
|
68
|
|
|
349
|
349
|
88.5
|
%
|
$
|
5,166
|
|
|||||||||||
|
Holiday Village
|
Ormond Beach
|
FL
|
MH
|
43
|
|
|
301
|
301
|
88.0
|
%
|
$
|
5,238
|
|
|||||||||||
|
Sunshine Holiday
|
Ormond Beach
|
FL
|
RV
|
69
|
|
|
349
|
131
|
100.0
|
%
|
$
|
5,419
|
|
|||||||||||
|
The Meadows, FL
|
Palm Beach Gardens
|
FL
|
MH
|
55
|
|
|
379
|
379
|
82.8
|
%
|
$
|
7,371
|
|
|||||||||||
|
Breezy Hill RV
|
Pompano Beach
|
FL
|
RV
|
52
|
|
|
762
|
379
|
100.0
|
%
|
$
|
6,674
|
|
|||||||||||
|
Highland Wood RV
|
Pompano Beach
|
FL
|
RV
|
15
|
|
|
148
|
20
|
100.0
|
%
|
$
|
5,624
|
|
|||||||||||
|
Lighthouse Pointe
|
Port Orange
|
FL
|
MH
|
64
|
|
|
433
|
433
|
84.8
|
%
|
$
|
5,380
|
|
|||||||||||
|
Pickwick
|
Port Orange
|
FL
|
MH
|
84
|
4
|
|
432
|
432
|
99.8
|
%
|
$
|
5,931
|
|
|||||||||||
|
Indian Oaks
|
Rockledge
|
FL
|
MH
|
38
|
|
|
208
|
208
|
100.0
|
%
|
$
|
4,864
|
|
|||||||||||
|
Countryside at Vero Beach
|
Vero Beach
|
FL
|
MH
|
125
|
|
|
644
|
644
|
87.9
|
%
|
$
|
6,151
|
|
|||||||||||
|
Heritage Plantation
|
Vero Beach
|
FL
|
MH
|
64
|
|
|
437
|
437
|
82.2
|
%
|
$
|
5,949
|
|
|||||||||||
|
Holiday Village, FL
|
Vero Beach
|
FL
|
MH
|
20
|
|
|
128
|
128
|
—
|
%
|
$
|
—
|
|
|||||||||||
|
Sunshine Travel
|
Vero Beach
|
FL
|
RV
|
30
|
6
|
48
|
300
|
125
|
100.0
|
%
|
$
|
5,277
|
|
|||||||||||
|
Heron Cay
|
Vero Beach
|
FL
|
MH
|
130
|
|
|
589
|
589
|
85.4
|
%
|
$
|
6,230
|
|
|||||||||||
|
Vero Palm
|
Vero Beach
|
FL
|
MH
|
64
|
|
|
285
|
285
|
79.6
|
%
|
$
|
5,695
|
|
|||||||||||
|
Village Green
|
Vero Beach
|
FL
|
MH
|
174
|
|
|
781
|
781
|
86.0
|
%
|
$
|
6,739
|
|
|||||||||||
|
Palm Beach Colony
|
West Palm Beach
|
FL
|
MH
|
48
|
|
|
284
|
284
|
91.9
|
%
|
$
|
5,662
|
|
|||||||||||
|
Central:
|
|
|
|
|
|
|
|
|
|
|
|
|||||||||||||
|
Clover Leaf Farms
|
Brooksville
|
FL
|
MH
|
227
|
|
100
|
779
|
779
|
95.8
|
%
|
$
|
5,428
|
|
|||||||||||
|
Clover Leaf Forest
|
Brooksville
|
FL
|
RV
|
30
|
|
|
277
|
139
|
100.0
|
%
|
$
|
2,965
|
|
|||||||||||
|
Clerbrook
|
Clermont
|
FL
|
RV
|
288
|
|
|
1,255
|
683
|
100.0
|
%
|
$
|
3,072
|
|
|||||||||||
|
Lake Magic
|
Clermont
|
FL
|
RV
|
69
|
|
|
471
|
117
|
100.0
|
%
|
$
|
4,947
|
|
|||||||||||
|
Orange Lake
|
Clermont
|
FL
|
MH
|
38
|
|
|
242
|
242
|
94.6
|
%
|
$
|
4,802
|
|
|||||||||||
|
Orlando
|
Clermont
|
FL
|
RV
|
270
|
30
|
136
|
850
|
142
|
100.0
|
%
|
$
|
3,358
|
|
|||||||||||
|
Haselton Village
|
Eustis
|
FL
|
MH
|
52
|
|
|
291
|
291
|
97.6
|
%
|
$
|
3,719
|
|
|||||||||||
|
Southern Palms
|
Eustis
|
FL
|
RV
|
120
|
|
|
950
|
351
|
100.0
|
%
|
$
|
4,581
|
|
|||||||||||
|
Lakeside Terrace
|
Fruitland Park
|
FL
|
MH
|
39
|
|
|
241
|
241
|
98.8
|
%
|
$
|
3,881
|
|
|||||||||||
|
Grand Island
|
Grand Island
|
FL
|
MH
|
35
|
|
|
362
|
362
|
64.4
|
%
|
$
|
5,394
|
|
|||||||||||
|
Sherwood Forest
|
Kissimmee
|
FL
|
MH
|
124
|
|
|
769
|
769
|
94.4
|
%
|
$
|
5,710
|
|
|||||||||||
|
Sherwood Forest RV
|
Kissimmee
|
FL
|
RV
|
107
|
43
|
149
|
513
|
117
|
100.0
|
%
|
$
|
5,723
|
|
|||||||||||
|
Tropical Palms(g)(h)
|
Kissimmee
|
FL
|
RV
|
59
|
|
|
541
|
—
|
—
|
%
|
$
|
—
|
|
|||||||||||
|
Beacon Hill Colony
|
Lakeland
|
FL
|
MH
|
31
|
|
|
201
|
201
|
97.5
|
%
|
$
|
4,617
|
|
|||||||||||
|
Beacon Terrace
|
Lakeland
|
FL
|
MH
|
55
|
|
|
297
|
297
|
99.3
|
%
|
$
|
4,807
|
|
|||||||||||
|
Kings & Queens
|
Lakeland
|
FL
|
MH
|
18
|
|
|
107
|
107
|
93.5
|
%
|
$
|
5,066
|
|
|||||||||||
|
Lakeland Harbor
|
Lakeland
|
FL
|
MH
|
65
|
|
|
504
|
504
|
99.4
|
%
|
$
|
4,514
|
|
|||||||||||
|
Lakeland Junction
|
Lakeland
|
FL
|
MH
|
23
|
|
|
193
|
193
|
98.4
|
%
|
$
|
3,901
|
|
|||||||||||
|
Coachwood Colony
|
Leesburg
|
FL
|
MH
|
29
|
|
|
202
|
202
|
90.6
|
%
|
$
|
4,157
|
|
|||||||||||
|
Mid-Florida Lakes
|
Leesburg
|
FL
|
MH
|
290
|
|
|
1,225
|
1,225
|
83.4
|
%
|
$
|
5,783
|
|
|||||||||||
16
|
|
||||||||||||||||||||||||
|
Property
|
City
|
State
|
MH/RV
|
Acres
(c)
|
Developable
Acres (d) |
Expansion
Sites (e) |
Total Number of Sites as of 12/31/13
|
Total Number of Annual Sites as of 12/31/13
|
Annual Site Occupancy as of 12/31/13
|
Annual Rent as of 12/31/13
|
||||||||||||||
|
Southernaire
|
Mt. Dora
|
FL
|
MH
|
14
|
|
|
114
|
114
|
82.5
|
%
|
$
|
3,982
|
|
|||||||||||
|
Foxwood
|
Ocala
|
FL
|
MH
|
56
|
|
|
375
|
375
|
78.9
|
%
|
$
|
4,820
|
|
|||||||||||
|
Oak Bend
|
Ocala
|
FL
|
MH
|
62
|
3
|
|
262
|
262
|
86.3
|
%
|
$
|
5,121
|
|
|||||||||||
|
Villas at Spanish Oaks
|
Ocala
|
FL
|
MH
|
69
|
|
|
459
|
459
|
86.7
|
%
|
$
|
5,067
|
|
|||||||||||
|
Audubon
|
Orlando
|
FL
|
MH
|
40
|
|
|
280
|
280
|
94.3
|
%
|
$
|
4,797
|
|
|||||||||||
|
Hidden Valley
|
Orlando
|
FL
|
MH
|
50
|
|
|
303
|
303
|
99.0
|
%
|
$
|
6,405
|
|
|||||||||||
|
Starlight Ranch
|
Orlando
|
FL
|
MH
|
130
|
|
|
783
|
783
|
85.1
|
%
|
$
|
5,864
|
|
|||||||||||
|
Covington Estates
|
Saint Cloud
|
FL
|
MH
|
59
|
|
|
241
|
241
|
96.3
|
%
|
$
|
4,547
|
|
|||||||||||
|
Parkwood Communities
|
Wildwood
|
FL
|
MH
|
121
|
|
|
694
|
694
|
97.1
|
%
|
$
|
3,259
|
|
|||||||||||
|
Three Flags RV Resort
|
Wildwood
|
FL
|
RV
|
23
|
|
|
221
|
25
|
100.0
|
%
|
$
|
2,264
|
|
|||||||||||
|
Winter Garden
|
Winter Garden
|
FL
|
RV
|
27
|
|
|
350
|
116
|
100.0
|
%
|
$
|
4,866
|
|
|||||||||||
|
Gulf Coast (Tampa/Naples):
|
||||||||||||||||||||||||
|
Toby’s RV
|
Arcadia
|
FL
|
RV
|
44
|
|
|
379
|
248
|
100.0
|
%
|
$
|
2,915
|
|
|||||||||||
|
Winter Quarters Manatee
|
Bradenton
|
FL
|
RV
|
42
|
|
|
415
|
220
|
100.0
|
%
|
$
|
5,227
|
|
|||||||||||
|
Windmill Manor
|
Bradenton
|
FL
|
MH
|
49
|
|
|
292
|
292
|
94.9
|
%
|
$
|
6,483
|
|
|||||||||||
|
Glen Ellen
|
Clearwater
|
FL
|
MH
|
12
|
|
|
106
|
106
|
93.4
|
%
|
$
|
3,828
|
|
|||||||||||
|
Hillcrest
|
Clearwater
|
FL
|
MH
|
25
|
|
|
278
|
278
|
95.7
|
%
|
$
|
5,323
|
|
|||||||||||
|
Holiday Ranch
|
Clearwater
|
FL
|
MH
|
12
|
|
|
150
|
150
|
91.3
|
%
|
$
|
5,029
|
|
|||||||||||
|
Silk Oak
|
Clearwater
|
FL
|
MH
|
19
|
|
|
181
|
181
|
95.0
|
%
|
$
|
5,265
|
|
|||||||||||
|
Shady Oaks
|
Clearwater
|
FL
|
MH
|
31
|
|
|
250
|
250
|
95.2
|
%
|
$
|
6,018
|
|
|||||||||||
|
Shady Village
|
Clearwater
|
FL
|
MH
|
19
|
|
|
156
|
156
|
94.9
|
%
|
$
|
5,900
|
|
|||||||||||
|
Crystal Isles
|
Crystal River
|
FL
|
RV
|
38
|
|
|
260
|
49
|
100.0
|
%
|
$
|
5,549
|
|
|||||||||||
|
Lake Haven
|
Dunedin
|
FL
|
MH
|
48
|
|
|
379
|
379
|
94.5
|
%
|
$
|
5,952
|
|
|||||||||||
|
Colony Cove
|
Ellenton
|
FL
|
MH
|
538
|
|
|
2,207
|
2,207
|
90.4
|
%
|
$
|
6,470
|
|
|||||||||||
|
Ridgewood Estates
|
Ellenton
|
FL
|
MH
|
77
|
|
|
380
|
380
|
98.9
|
%
|
$
|
4,710
|
|
|||||||||||
|
Fiesta Key
(a)
|
Long Key
|
FL
|
RV
|
28
|
|
|
324
|
15
|
100.0
|
%
|
$
|
8,307
|
|
|||||||||||
|
Fort Myers Beach Resort
|
Fort Myers
|
FL
|
RV
|
31
|
|
|
306
|
99
|
100.0
|
%
|
$
|
6,285
|
|
|||||||||||
|
Gulf Air Resort
|
Fort Myers
|
FL
|
RV
|
25
|
|
|
246
|
149
|
100.0
|
%
|
$
|
5,569
|
|
|||||||||||
|
Barrington Hills
|
Hudson
|
FL
|
RV
|
28
|
|
|
392
|
243
|
100.0
|
%
|
$
|
3,465
|
|
|||||||||||
|
Down Yonder
|
Largo
|
FL
|
MH
|
50
|
|
|
361
|
361
|
99.7
|
%
|
$
|
6,416
|
|
|||||||||||
|
East Bay Oaks
|
Largo
|
FL
|
MH
|
40
|
|
|
328
|
328
|
100.0
|
%
|
$
|
5,383
|
|
|||||||||||
|
Eldorado Village
|
Largo
|
FL
|
MH
|
25
|
|
|
227
|
227
|
98.2
|
%
|
$
|
5,413
|
|
|||||||||||
|
Shangri La
|
Largo
|
FL
|
MH
|
14
|
|
|
160
|
160
|
90.0
|
%
|
$
|
5,104
|
|
|||||||||||
|
Vacation Village
|
Largo
|
FL
|
RV
|
29
|
|
|
293
|
155
|
100.0
|
%
|
$
|
4,687
|
|
|||||||||||
|
Whispering Pines - Largo
|
Largo
|
FL
|
MH
|
55
|
|
|
392
|
392
|
87.5
|
%
|
$
|
6,277
|
|
|||||||||||
|
Winter Quarters Pasco
|
Lutz
|
FL
|
RV
|
27
|
|
|
255
|
192
|
100.0
|
%
|
$
|
3,769
|
|
|||||||||||
|
Buccaneer
|
N. Ft. Myers
|
FL
|
MH
|
223
|
39
|
162
|
971
|
971
|
98.5
|
%
|
$
|
6,654
|
|
|||||||||||
|
Island Vista MHC
|
N. Ft. Myers
|
FL
|
MH
|
121
|
|
|
616
|
616
|
72.7
|
%
|
$
|
4,735
|
|
|||||||||||
17
|
|
||||||||||||||||||||||||
|
Property
|
City
|
State
|
MH/RV
|
Acres
(c)
|
Developable
Acres (d) |
Expansion
Sites (e) |
Total Number of Sites as of 12/31/13
|
Total Number of Annual Sites as of 12/31/13
|
Annual Site Occupancy as of 12/31/13
|
Annual Rent as of 12/31/13
|
||||||||||||||
|
Lake Fairways
|
N. Ft. Myers
|
FL
|
MH
|
259
|
|
|
896
|
896
|
99.0
|
%
|
$
|
6,374
|
|
|||||||||||
|
Pine Lakes
|
N. Ft. Myers
|
FL
|
MH
|
314
|
|
|
584
|
584
|
99.8
|
%
|
$
|
7,912
|
|
|||||||||||
|
Pioneer Village
|
N. Ft. Myers
|
FL
|
RV
|
90
|
|
|
733
|
368
|
100.0
|
%
|
$
|
4,800
|
|
|||||||||||
|
The Heritage
|
N. Ft. Myers
|
FL
|
MH
|
214
|
22
|
132
|
453
|
453
|
98.5
|
%
|
$
|
6,031
|
|
|||||||||||
|
Windmill Village
|
N. Ft. Myers
|
FL
|
MH
|
69
|
|
|
491
|
491
|
91.4
|
%
|
$
|
5,200
|
|
|||||||||||
|
Country Place
|
New Port Richey
|
FL
|
MH
|
82
|
|
|
515
|
515
|
100.0
|
%
|
$
|
5,800
|
|
|||||||||||
|
Hacienda Village
|
New Port Richey
|
FL
|
MH
|
66
|
|
|
505
|
505
|
98.4
|
%
|
$
|
5,529
|
|
|||||||||||
|
Harbor View
|
New Port Richey
|
FL
|
MH
|
69
|
|
|
471
|
471
|
96.4
|
%
|
$
|
4,662
|
|
|||||||||||
|
Bay Lake Estates
|
Nokomis
|
FL
|
MH
|
34
|
|
|
228
|
228
|
94.3
|
%
|
$
|
6,870
|
|
|||||||||||
|
Lake Village
|
Nokomis
|
FL
|
MH
|
65
|
|
|
391
|
391
|
99.7
|
%
|
$
|
6,786
|
|
|||||||||||
|
Royal Coachman
|
Nokomis
|
FL
|
RV
|
111
|
|
|
546
|
434
|
100.0
|
%
|
$
|
6,906
|
|
|||||||||||
|
Silver Dollar
|
Odessa
|
FL
|
RV
|
412
|
|
|
459
|
393
|
100.0
|
%
|
$
|
6,523
|
|
|||||||||||
|
Terra Ceia
|
Palmetto
|
FL
|
RV
|
18
|
|
|
203
|
147
|
100.0
|
%
|
$
|
3,992
|
|
|||||||||||
|
Lakes at Countrywood
|
Plant City
|
FL
|
MH
|
122
|
|
|
424
|
424
|
91.3
|
%
|
$
|
4,866
|
|
|||||||||||
|
Meadows at Countrywood
|
Plant City
|
FL
|
MH
|
140
|
13
|
110
|
799
|
799
|
95.6
|
%
|
$
|
5,639
|
|
|||||||||||
|
Oaks at Countrywood
|
Plant City
|
FL
|
MH
|
44
|
|
|
168
|
168
|
76.8
|
%
|
$
|
4,752
|
|
|||||||||||
|
Harbor Lakes
|
Port Charlotte
|
FL
|
RV
|
80
|
|
|
528
|
300
|
100.0
|
%
|
$
|
5,192
|
|
|||||||||||
|
Emerald Lake
|
Punta Gorda
|
FL
|
MH
|
28
|
|
|
200
|
200
|
92.0
|
%
|
$
|
4,692
|
|
|||||||||||
|
Gulf View
|
Punta Gorda
|
FL
|
RV
|
78
|
|
|
206
|
57
|
100.0
|
%
|
$
|
4,865
|
|
|||||||||||
|
Tropical Palms
|
Punta Gorda
|
FL
|
MH
|
50
|
|
|
294
|
294
|
88.1
|
%
|
$
|
4,017
|
|
|||||||||||
|
Winds of St. Armands No.
|
Sarasota
|
FL
|
MH
|
74
|
|
|
471
|
471
|
96.8
|
%
|
$
|
6,974
|
|
|||||||||||
|
Winds of St. Armands So.
|
Sarasota
|
FL
|
MH
|
61
|
|
|
306
|
306
|
99.0
|
%
|
$
|
7,079
|
|
|||||||||||
|
Peace River
|
South Wauchula
|
FL
|
RV
|
72
|
38
|
|
454
|
41
|
100.0
|
%
|
$
|
2,363
|
|
|||||||||||
|
Topics
|
Spring Hill
|
FL
|
RV
|
35
|
|
|
230
|
193
|
100.0
|
%
|
$
|
3,149
|
|
|||||||||||
|
Pine Island
|
St. James City
|
FL
|
RV
|
31
|
|
|
363
|
88
|
100.0
|
%
|
$
|
5,695
|
|
|||||||||||
|
Carefree Village
|
Tampa
|
FL
|
MH
|
58
|
|
|
401
|
401
|
96.8
|
%
|
$
|
4,959
|
|
|||||||||||
|
Tarpon Glen
|
Tarpon Springs
|
FL
|
MH
|
24
|
|
|
169
|
169
|
88.2
|
%
|
$
|
5,530
|
|
|||||||||||
|
Featherock
|
Valrico
|
FL
|
MH
|
84
|
|
|
521
|
521
|
98.5
|
%
|
$
|
4,988
|
|
|||||||||||
|
Bay Indies
|
Venice
|
FL
|
MH
|
210
|
|
|
1,309
|
1,309
|
97.0
|
%
|
$
|
8,203
|
|
|||||||||||
|
Ramblers Rest
|
Venice
|
FL
|
RV
|
117
|
|
|
647
|
397
|
100.0
|
%
|
$
|
5,880
|
|
|||||||||||
|
Crystal Lakes-Zephyrhills
|
Zephyrhills
|
FL
|
MH
|
146
|
|
140
|
318
|
318
|
95.6
|
%
|
$
|
3,622
|
|
|||||||||||
|
Sixth Avenue
|
Zephyrhills
|
FL
|
MH
|
14
|
|
|
140
|
140
|
78.6
|
%
|
$
|
2,696
|
|
|||||||||||
|
Total Florida Market
|
|
|
|
9,918
|
410
|
1,844
|
51,285
|
42,476
|
93.2
|
%
|
$
|
5,740
|
|
|||||||||||
|
California
|
|
|
|
|
|
|
|
|
|
|
|
|
||||||||||||
|
Northern California:
|
|
|
|
|
|
|
|
|
|
|
|
|
||||||||||||
|
Monte del Lago
|
Castroville
|
CA
|
MH
|
54
|
|
|
310
|
310
|
97.7
|
%
|
$
|
13,061
|
|
|||||||||||
|
Colony Park
|
Ceres
|
CA
|
MH
|
20
|
|
|
186
|
186
|
90.9
|
%
|
$
|
6,578
|
|
|||||||||||
18
|
|
||||||||||||||||||||||||
|
Property
|
City
|
State
|
MH/RV
|
Acres
(c)
|
Developable
Acres (d) |
Expansion
Sites (e) |
Total Number of Sites as of 12/31/13
|
Total Number of Annual Sites as of 12/31/13
|
Annual Site Occupancy as of 12/31/13
|
Annual Rent as of 12/31/13
|
||||||||||||||
|
Russian River
|
Cloverdale
|
CA
|
RV
|
41
|
|
|
135
|
3
|
100.0
|
%
|
$
|
2,752
|
|
|||||||||||
|
Snowflower (h)
|
Emigrant Gap
|
CA
|
RV
|
612
|
200
|
|
268
|
—
|
—
|
%
|
$
|
—
|
|
|||||||||||
|
Four Seasons
|
Fresno
|
CA
|
MH
|
40
|
|
|
242
|
242
|
93.4
|
%
|
$
|
4,530
|
|
|||||||||||
|
Yosemite Lakes
|
Groveland
|
CA
|
RV
|
403
|
30
|
111
|
299
|
3
|
100.0
|
%
|
$
|
676
|
|
|||||||||||
|
Tahoe Valley (b) (h)
|
Lake Tahoe
|
CA
|
RV
|
86
|
20
|
200
|
413
|
—
|
—
|
%
|
$
|
—
|
|
|||||||||||
|
Sea Oaks
|
Los Osos
|
CA
|
MH
|
18
|
|
|
125
|
125
|
100.0
|
%
|
$
|
6,294
|
|
|||||||||||
|
Ponderosa
|
Lotus
|
CA
|
RV
|
22
|
|
|
170
|
23
|
100.0
|
%
|
$
|
3,269
|
|
|||||||||||
|
Turtle Beach
|
Manteca
|
CA
|
RV
|
39
|
|
|
79
|
23
|
100.0
|
%
|
$
|
3,604
|
|
|||||||||||
|
Coralwood (b)
|
Modesto
|
CA
|
MH
|
22
|
|
|
194
|
194
|
68.0
|
%
|
$
|
8,370
|
|
|||||||||||
|
Lake Minden
|
Nicolaus
|
CA
|
RV
|
165
|
82
|
540
|
323
|
5
|
100.0
|
%
|
$
|
2,548
|
|
|||||||||||
|
Lake of the Springs
|
Oregon House
|
CA
|
RV
|
954
|
507
|
1,014
|
541
|
64
|
100.0
|
%
|
$
|
2,719
|
|
|||||||||||
|
Concord Cascade
|
Pacheco
|
CA
|
MH
|
31
|
|
|
283
|
283
|
100.0
|
%
|
$
|
8,570
|
|
|||||||||||
|
San Francisco RV (h)
|
Pacifica
|
CA
|
RV
|
12
|
|
|
131
|
—
|
—
|
%
|
$
|
—
|
|
|||||||||||
|
Quail Meadows
|
Riverbank
|
CA
|
MH
|
20
|
|
|
146
|
146
|
91.8
|
%
|
$
|
8,605
|
|
|||||||||||
|
California Hawaiian
|
San Jose
|
CA
|
MH
|
50
|
|
|
418
|
418
|
100.0
|
%
|
$
|
11,524
|
|
|||||||||||
|
Sunshadow (b)
|
San Jose
|
CA
|
MH
|
30
|
|
|
121
|
121
|
100.0
|
%
|
$
|
11,361
|
|
|||||||||||
|
Village of the Four Seasons
|
San Jose
|
CA
|
MH
|
30
|
|
|
271
|
271
|
100.0
|
%
|
$
|
10,704
|
|
|||||||||||
|
Westwinds (4 Properties) (b)
|
San Jose
|
CA
|
MH
|
88
|
|
|
723
|
723
|
100.0
|
%
|
$
|
12,399
|
|
|||||||||||
|
Laguna Lake
|
San Luis Obispo
|
CA
|
MH
|
100
|
|
|
300
|
300
|
99.0
|
%
|
$
|
6,342
|
|
|||||||||||
|
Contempo Marin
|
San Rafael
|
CA
|
MH
|
63
|
|
|
396
|
396
|
100.0
|
%
|
$
|
11,557
|
|
|||||||||||
|
DeAnza Santa Cruz
|
Santa Cruz
|
CA
|
MH
|
30
|
|
|
198
|
198
|
96.5
|
%
|
$
|
15,291
|
|
|||||||||||
|
Santa Cruz Ranch RV Resort (h)
|
Scotts Valley
|
CA
|
RV
|
7
|
|
|
106
|
—
|
—
|
%
|
$
|
—
|
|
|||||||||||
|
Royal Oaks
|
Visalia
|
CA
|
MH
|
20
|
|
|
149
|
149
|
81.9
|
%
|
$
|
6,546
|
|
|||||||||||
|
Southern California:
|
|
|
|
|
|
|
|
|
|
|
|
|
||||||||||||
|
Soledad Canyon
|
Acton
|
CA
|
RV
|
273
|
|
|
1,251
|
161
|
100.0
|
%
|
$
|
2,771
|
|
|||||||||||
|
Los Ranchos
|
Apple Valley
|
CA
|
MH
|
30
|
|
|
389
|
389
|
95.4
|
%
|
$
|
6,432
|
|
|||||||||||
|
Date Palm Country Club (b)
|
Cathedral City
|
CA
|
MH
|
232
|
3
|
24
|
538
|
538
|
96.7
|
%
|
$
|
11,703
|
|
|||||||||||
|
Date Palm RV
|
Cathedral City
|
CA
|
RV
|
(f)
|
|
|
140
|
20
|
100.0
|
%
|
$
|
4,785
|
|
|||||||||||
|
Oakzanita
|
Descanso
|
CA
|
RV
|
145
|
5
|
|
146
|
15
|
100.0
|
%
|
$
|
3,122
|
|
|||||||||||
|
Rancho Mesa
|
El Cajon
|
CA
|
MH
|
20
|
|
|
158
|
158
|
98.7
|
%
|
$
|
11,863
|
|
|||||||||||
|
Rancho Valley
|
El Cajon
|
CA
|
MH
|
19
|
|
|
140
|
140
|
98.6
|
%
|
$
|
12,488
|
|
|||||||||||
|
Royal Holiday
|
Hemet
|
CA
|
MH
|
22
|
|
|
196
|
196
|
63.8
|
%
|
$
|
5,454
|
|
|||||||||||
|
Idyllwild
|
Idyllwild
|
CA
|
RV
|
191
|
|
|
287
|
41
|
100.0
|
%
|
$
|
2,332
|
|
|||||||||||
|
Pio Pico
|
Jamul
|
CA
|
RV
|
176
|
10
|
|
512
|
103
|
100.0
|
%
|
$
|
3,717
|
|
|||||||||||
|
Wilderness Lakes
|
Menifee
|
CA
|
RV
|
73
|
|
|
529
|
45
|
100.0
|
%
|
$
|
3,611
|
|
|||||||||||
|
Morgan Hill
|
Morgan Hill
|
CA
|
RV
|
62
|
|
|
339
|
31
|
100.0
|
%
|
$
|
3,185
|
|
|||||||||||
|
Pacific Dunes Ranch(h)
|
Oceana
|
CA
|
RV
|
48
|
|
|
215
|
—
|
—
|
%
|
$
|
—
|
|
|||||||||||
|
San Benito
|
Paicines
|
CA
|
RV
|
199
|
23
|
|
523
|
52
|
100.0
|
%
|
$
|
2,491
|
|
|||||||||||
19
|
|
||||||||||||||||||||||||
|
Property
|
City
|
State
|
MH/RV
|
Acres
(c)
|
Developable
Acres (d) |
Expansion
Sites (e) |
Total Number of Sites as of 12/31/13
|
Total Number of Annual Sites as of 12/31/13
|
Annual Site Occupancy as of 12/31/13
|
Annual Rent as of 12/31/13
|
||||||||||||||
|
Palm Springs
|
Palm Desert
|
CA
|
RV
|
35
|
|
|
401
|
36
|
100.0
|
%
|
$
|
3,681
|
|
|||||||||||
|
Las Palmas
|
Rialto
|
CA
|
MH
|
18
|
|
|
136
|
136
|
99.3
|
%
|
$
|
6,812
|
|
|||||||||||
|
Parque La Quinta
|
Rialto
|
CA
|
MH
|
19
|
|
|
166
|
166
|
98.2
|
%
|
$
|
6,508
|
|
|||||||||||
|
Rancho Oso
|
Santa Barbara
|
CA
|
RV
|
310
|
40
|
|
187
|
18
|
100.0
|
%
|
$
|
3,447
|
|
|||||||||||
|
Meadowbrook
|
Santee
|
CA
|
MH
|
43
|
|
|
338
|
338
|
99.7
|
%
|
$
|
9,113
|
|
|||||||||||
|
Lamplighter
|
Spring Valley
|
CA
|
MH
|
32
|
|
|
270
|
270
|
98.1
|
%
|
$
|
12,418
|
|
|||||||||||
|
Santiago Estates
|
Sylmar
|
CA
|
MH
|
113
|
9
|
|
300
|
300
|
100.0
|
%
|
$
|
12,643
|
|
|||||||||||
|
Total California Market
|
|
|
|
5,017
|
929
|
1,889
|
13,688
|
7,336
|
96.3
|
%
|
$
|
9,438
|
|
|||||||||||
|
Arizona
|
|
|
|
|
|
|
|
|
|
|
|
|
||||||||||||
|
Countryside RV
|
Apache Junction
|
AZ
|
RV
|
53
|
|
|
560
|
263
|
100.0
|
%
|
$
|
3,349
|
|
|||||||||||
|
Golden Sun RV
|
Apache Junction
|
AZ
|
RV
|
33
|
|
|
329
|
200
|
100.0
|
%
|
$
|
3,337
|
|
|||||||||||
|
Apache East
|
Apache Junction
|
AZ
|
MH
|
17
|
|
|
123
|
123
|
97.6
|
%
|
$
|
4,996
|
|
|||||||||||
|
Denali Park
|
Apache Junction
|
AZ
|
MH
|
33
|
|
|
164
|
163
|
99.4
|
%
|
$
|
4,129
|
|
|||||||||||
|
Valley Vista (h)
|
Benson
|
AZ
|
RV
|
6
|
|
|
145
|
—
|
—
|
%
|
$
|
—
|
|
|||||||||||
|
Casita Verde RV
|
Casa Grande
|
AZ
|
RV
|
14
|
|
|
192
|
94
|
100.0
|
%
|
$
|
2,551
|
|
|||||||||||
|
Fiesta Grande RV
|
Casa Grande
|
AZ
|
RV
|
77
|
|
|
767
|
518
|
100.0
|
%
|
$
|
3,020
|
|
|||||||||||
|
Foothills West RV
|
Casa Grande
|
AZ
|
RV
|
16
|
|
|
188
|
121
|
100.0
|
%
|
$
|
2,432
|
|
|||||||||||
|
Sunshine Valley
|
Chandler
|
AZ
|
MH
|
55
|
|
|
381
|
381
|
91.3
|
%
|
$
|
5,439
|
|
|||||||||||
|
Verde Valley
|
Cottonwood
|
AZ
|
RV
|
273
|
129
|
515
|
352
|
55
|
100.0
|
%
|
$
|
3,192
|
|
|||||||||||
|
Casa del Sol East II
|
Glendale
|
AZ
|
MH
|
29
|
|
|
239
|
239
|
94.6
|
%
|
$
|
6,497
|
|
|||||||||||
|
Casa del Sol East III
|
Glendale
|
AZ
|
MH
|
28
|
|
|
235
|
236
|
88.9
|
%
|
$
|
6,295
|
|
|||||||||||
|
Palm Shadows
|
Glendale
|
AZ
|
MH
|
33
|
|
|
294
|
294
|
94.6
|
%
|
$
|
5,275
|
|
|||||||||||
|
Monte Vista
|
Mesa
|
AZ
|
RV
|
142
|
56
|
515
|
832
|
747
|
100.0
|
%
|
$
|
5,883
|
|
|||||||||||
|
Viewpoint
|
Mesa
|
AZ
|
RV
|
332
|
55
|
467
|
1,954
|
1,574
|
100.0
|
%
|
$
|
5,695
|
|
|||||||||||
|
Hacienda de Valencia
|
Mesa
|
AZ
|
MH
|
51
|
|
|
364
|
364
|
98.6
|
%
|
$
|
6,449
|
|
|||||||||||
|
The Highlands at Brentwood
|
Mesa
|
AZ
|
MH
|
45
|
|
|
268
|
268
|
100.0
|
%
|
$
|
7,078
|
|
|||||||||||
|
Seyenna Vistas (The Mark)
|
Mesa
|
AZ
|
MH
|
60
|
4
|
|
410
|
410
|
99.3
|
%
|
$
|
4,042
|
|
|||||||||||
|
Apollo Village
|
Peoria
|
AZ
|
MH
|
29
|
3
|
|
238
|
238
|
99.2
|
%
|
$
|
5,622
|
|
|||||||||||
|
Casa del Sol West I
|
Peoria
|
AZ
|
MH
|
31
|
|
|
245
|
245
|
98.8
|
%
|
$
|
6,170
|
|
|||||||||||
|
Carefree Manor
|
Phoenix
|
AZ
|
MH
|
16
|
|
|
130
|
130
|
100.0
|
%
|
$
|
5,119
|
|
|||||||||||
|
Central Park
|
Phoenix
|
AZ
|
MH
|
37
|
|
|
293
|
293
|
100.0
|
%
|
$
|
6,505
|
|
|||||||||||
|
Desert Skies
|
Phoenix
|
AZ
|
MH
|
24
|
|
|
165
|
166
|
100.0
|
%
|
$
|
5,923
|
|
|||||||||||
|
Sunrise Heights
|
Phoenix
|
AZ
|
MH
|
28
|
|
|
199
|
199
|
100.0
|
%
|
$
|
6,179
|
|
|||||||||||
|
Whispering Palms
|
Phoenix
|
AZ
|
MH
|
15
|
|
|
116
|
116
|
98.3
|
%
|
$
|
5,003
|
|
|||||||||||
|
Desert Vista
|
Salome
|
AZ
|
RV
|
10
|
|
|
125
|
1
|
100.0
|
%
|
$
|
1,637
|
|
|||||||||||
|
Sedona Shadows
|
Sedona
|
AZ
|
MH
|
48
|
6
|
10
|
198
|
198
|
99.5
|
%
|
$
|
8,669
|
|
|||||||||||
|
Venture In
|
Show Low
|
AZ
|
RV
|
26
|
|
|
389
|
278
|
100.0
|
%
|
$
|
3,100
|
|
|||||||||||
|
Paradise
|
Sun City
|
AZ
|
RV
|
80
|
|
|
950
|
794
|
100.0
|
%
|
$
|
4,519
|
|
|||||||||||
20
|
|
||||||||||||||||||||||||
|
Property
|
City
|
State
|
MH/RV
|
Acres
(c)
|
Developable
Acres (d) |
Expansion
Sites (e) |
Total Number of Sites as of 12/31/13
|
Total Number of Annual Sites as of 12/31/13
|
Annual Site Occupancy as of 12/31/13
|
Annual Rent as of 12/31/13
|
||||||||||||||
|
The Meadows
|
Tempe
|
AZ
|
MH
|
60
|
|
|
390
|
391
|
99.7
|
%
|
$
|
6,859
|
|
|||||||||||
|
Fairview Manor
|
Tucson
|
AZ
|
MH
|
28
|
|
|
237
|
237
|
91.6
|
%
|
$
|
4,526
|
|
|||||||||||
|
Westpark
|
Wickenburg
|
AZ
|
MH
|
48
|
|
|
188
|
188
|
100.0
|
%
|
$
|
6,019
|
|
|||||||||||
|
Araby
|
Yuma
|
AZ
|
RV
|
25
|
|
|
337
|
304
|
100.0
|
%
|
$
|
3,495
|
|
|||||||||||
|
Cactus Gardens
|
Yuma
|
AZ
|
RV
|
43
|
|
|
430
|
284
|
100.0
|
%
|
$
|
2,371
|
|
|||||||||||
|
Capri RV
|
Yuma
|
AZ
|
RV
|
20
|
|
|
303
|
257
|
100.0
|
%
|
$
|
3,097
|
|
|||||||||||
|
Desert Paradise
|
Yuma
|
AZ
|
RV
|
26
|
|
|
260
|
131
|
100.0
|
%
|
$
|
2,421
|
|
|||||||||||
|
Foothill
|
Yuma
|
AZ
|
RV
|
18
|
|
|
180
|
73
|
100.0
|
%
|
$
|
2,381
|
|
|||||||||||
|
Mesa Verde
|
Yuma
|
AZ
|
RV
|
28
|
|
|
345
|
304
|
100.0
|
%
|
$
|
3,010
|
|
|||||||||||
|
Suni Sands
|
Yuma
|
AZ
|
RV
|
34
|
|
|
336
|
211
|
100.0
|
%
|
$
|
2,871
|
|
|||||||||||
|
Total Arizona Market
|
|
|
|
1,971
|
253
|
1,507
|
13,851
|
11,088
|
99.1
|
%
|
$
|
4,941
|
|
|||||||||||
|
Colorado
|
|
|
|
|
|
|
|
|
|
|
|
|
||||||||||||
|
Hillcrest Village
|
Aurora
|
CO
|
MH
|
72
|
|
|
601
|
601
|
92.7
|
%
|
$
|
7,087
|
|
|||||||||||
|
Cimarron
|
Broomfield
|
CO
|
MH
|
50
|
|
|
327
|
327
|
89.9
|
%
|
$
|
7,134
|
|
|||||||||||
|
Holiday Village
|
Co. Springs
|
CO
|
MH
|
38
|
|
|
240
|
240
|
80.0
|
%
|
$
|
6,848
|
|
|||||||||||
|
Bear Creek
|
Denver
|
CO
|
MH
|
12
|
|
|
124
|
124
|
83.9
|
%
|
$
|
7,163
|
|
|||||||||||
|
Holiday Hills
|
Denver
|
CO
|
MH
|
99
|
|
|
736
|
736
|
77.0
|
%
|
$
|
7,251
|
|
|||||||||||
|
Golden Terrace
|
Golden
|
CO
|
MH
|
32
|
|
|
265
|
265
|
91.7
|
%
|
$
|
7,683
|
|
|||||||||||
|
Golden Terrace South
|
Golden
|
CO
|
MH
|
15
|
|
|
80
|
80
|
67.5
|
%
|
$
|
7,735
|
|
|||||||||||
|
Golden Terrace South RV (h)
|
Golden
|
CO
|
RV
|
(f)
|
|
|
80
|
—
|
—
|
%
|
$
|
—
|
|
|||||||||||
|
Golden Terrace West
|
Golden
|
CO
|
MH
|
39
|
7
|
|
316
|
316
|
76.6
|
%
|
$
|
7,480
|
|
|||||||||||
|
Pueblo Grande
|
Pueblo
|
CO
|
MH
|
33
|
|
|
251
|
251
|
62.9
|
%
|
$
|
4,272
|
|
|||||||||||
|
Woodland Hills
|
Thorton
|
CO
|
MH
|
55
|
|
|
434
|
434
|
74.2
|
%
|
$
|
7,045
|
|
|||||||||||
|
Total Colorado Market
|
|
|
|
445
|
7
|
—
|
3,454
|
3,374
|
81.0
|
%
|
$
|
7,045
|
|
|||||||||||
|
Northeast
|
|
|
|
|
|
|
|
|
|
|
|
|
||||||||||||
|
Stonegate Manor
|
North Windham
|
CT
|
MH
|
114
|
|
|
372
|
372
|
96.0
|
%
|
$
|
5,225
|
|
|||||||||||
|
Waterford
|
Bear
|
DE
|
MH
|
159
|
|
|
731
|
731
|
95.9
|
%
|
$
|
7,147
|
|
|||||||||||
|
Whispering Pines
|
Lewes
|
DE
|
MH
|
67
|
2
|
|
393
|
393
|
87.0
|
%
|
$
|
5,567
|
|
|||||||||||
|
Mariners Cove
|
Millsboro
|
DE
|
MH
|
101
|
|
|
375
|
375
|
96.3
|
%
|
$
|
7,621
|
|
|||||||||||
|
Aspen Meadows
|
Rehoboth
|
DE
|
MH
|
46
|
|
|
200
|
200
|
100.0
|
%
|
$
|
6,213
|
|
|||||||||||
|
Camelot Meadows
|
Rehoboth
|
DE
|
MH
|
61
|
|
|
301
|
301
|
99.0
|
%
|
$
|
5,831
|
|
|||||||||||
|
McNicol
|
Rehoboth
|
DE
|
MH
|
25
|
|
|
93
|
93
|
98.9
|
%
|
$
|
5,501
|
|
|||||||||||
|
Sweetbriar
|
Rehoboth
|
DE
|
MH
|
38
|
|
|
146
|
146
|
96.6
|
%
|
$
|
5,252
|
|
|||||||||||
|
The Glen
|
Norwell
|
MA
|
MH
|
24
|
|
|
36
|
36
|
100.0
|
%
|
$
|
7,170
|
|
|||||||||||
|
Gateway to Cape Cod
|
Rochester
|
MA
|
RV
|
80
|
|
|
194
|
56
|
100.0
|
%
|
$
|
2,318
|
|
|||||||||||
|
Hillcrest
|
Rockland
|
MA
|
MH
|
19
|
|
|
82
|
82
|
93.9
|
%
|
$
|
6,484
|
|
|||||||||||
|
Old Chatham RV
|
South Dennis
|
MA
|
RV
|
47
|
11
|
|
312
|
270
|
100.0
|
%
|
$
|
4,202
|
|
|||||||||||
|
Sturbridge
|
Sturbridge
|
MA
|
RV
|
223
|
|
|
155
|
68
|
100.0
|
%
|
$
|
2,094
|
|
|||||||||||
21
|
|
||||||||||||||||||||||||
|
Property
|
City
|
State
|
MH/RV
|
Acres
(c)
|
Developable
Acres (d) |
Expansion
Sites (e) |
Total Number of Sites as of 12/31/13
|
Total Number of Annual Sites as of 12/31/13
|
Annual Site Occupancy as of 12/31/13
|
Annual Rent as of 12/31/13
|
||||||||||||||
|
Fernwood
|
Capitol Heights
|
MD
|
MH
|
40
|
|
|
329
|
329
|
94.5
|
%
|
$
|
5,988
|
|
|||||||||||
|
Williams Estates and Peppermint Woods
|
Baltimore
|
MD
|
MH
|
121
|
|
|
804
|
804
|
98.3
|
%
|
$
|
6,760
|
|
|||||||||||
|
Mount Desert Narrows
|
Bar Harbor
|
ME
|
RV
|
90
|
12
|
|
206
|
6
|
100.0
|
%
|
$
|
2,005
|
|
|||||||||||
|
Patten Pond
|
Ellsworth
|
ME
|
RV
|
43
|
60
|
|
137
|
14
|
100.0
|
%
|
$
|
2,238
|
|
|||||||||||
|
Moody Beach
|
Moody
|
ME
|
RV
|
48
|
|
|
203
|
84
|
100.0
|
%
|
$
|
2,849
|
|
|||||||||||
|
Pinehurst RV Park
|
Old Orchard Beach
|
ME
|
RV
|
58
|
|
|
550
|
489
|
100.0
|
%
|
$
|
3,443
|
|
|||||||||||
|
Narrows Too
|
Trenton
|
ME
|
RV
|
42
|
|
|
207
|
15
|
100.0
|
%
|
$
|
2,240
|
|
|||||||||||
|
Forest Lake
|
Advance
|
NC
|
RV
|
306
|
81
|
|
305
|
75
|
100.0
|
%
|
$
|
2,503
|
|
|||||||||||
|
Scenic
|
Asheville
|
NC
|
MH
|
28
|
|
|
205
|
205
|
80.5
|
%
|
$
|
4,235
|
|
|||||||||||
|
Waterway RV
|
Cedar Point
|
NC
|
RV
|
27
|
|
|
336
|
364
|
100.0
|
%
|
$
|
3,419
|
|
|||||||||||
|
Twin Lakes
|
Chocowinity
|
NC
|
RV
|
132
|
|
|
419
|
329
|
100.0
|
%
|
$
|
3,062
|
|
|||||||||||
|
Green Mountain Park
|
Lenoir
|
NC
|
RV
|
1,077
|
400
|
360
|
447
|
178
|
100.0
|
%
|
$
|
1,529
|
|
|||||||||||
|
Lake Gaston
|
Littleton
|
NC
|
RV
|
69
|
|
|
235
|
159
|
100.0
|
%
|
$
|
2,371
|
|
|||||||||||
|
Lake Myers RV
|
Mocksville
|
NC
|
RV
|
74
|
|
|
425
|
294
|
100.0
|
%
|
$
|
2,261
|
|
|||||||||||
|
Goose Creek
|
Newport
|
NC
|
RV
|
92
|
6
|
51
|
735
|
685
|
100.0
|
%
|
$
|
3,780
|
|
|||||||||||
|
Sandy Beach RV
|
Contoocook
|
NH
|
RV
|
40
|
|
|
190
|
97
|
100.0
|
%
|
$
|
3,285
|
|
|||||||||||
|
Tuxbury Resort
|
South Hampton
|
NH
|
RV
|
193
|
100
|
|
305
|
169
|
100.0
|
%
|
$
|
3,253
|
|
|||||||||||
|
Lake & Shore
|
Ocean View
|
NJ
|
RV
|
162
|
|
|
401
|
259
|
100.0
|
%
|
$
|
4,493
|
|
|||||||||||
|
Chestnut Lake
|
Port Republic
|
NJ
|
RV
|
32
|
|
|
185
|
32
|
100.0
|
%
|
$
|
2,186
|
|
|||||||||||
|
Sea Pines
|
Swainton
|
NJ
|
RV
|
75
|
|
|
549
|
256
|
100.0
|
%
|
$
|
3,296
|
|
|||||||||||
|
Pine Ridge at Crestwood
|
Whiting
|
NJ
|
MH
|
188
|
|
|
1,035
|
1,035
|
89.7
|
%
|
$
|
5,316
|
|
|||||||||||
|
Rondout Valley Resort
|
Accord
|
NY
|
RV
|
184
|
94
|
|
398
|
83
|
100.0
|
%
|
$
|
2,976
|
|
|||||||||||
|
Alpine Lake
|
Corinth
|
NY
|
RV
|
200
|
54
|
|
500
|
331
|
100.0
|
%
|
$
|
3,036
|
|
|||||||||||
|
Lake George Escape
|
Lake George
|
NY
|
RV
|
178
|
30
|
|
576
|
41
|
100.0
|
%
|
$
|
3,816
|
|
|||||||||||
|
The Woodlands
|
Lockport
|
NY
|
MH
|
225
|
|
|
1,182
|
1,182
|
88.0
|
%
|
$
|
5,142
|
|
|||||||||||
|
Greenwood Village
|
Manorville
|
NY
|
MH
|
79
|
14
|
7
|
512
|
512
|
99.4
|
%
|
$
|
8,465
|
|
|||||||||||
|
Brennan Beach
|
Pulaski
|
NY
|
RV
|
201
|
|
|
1,377
|
1,188
|
100.0
|
%
|
$
|
2,335
|
|
|||||||||||
|
Lake George Schroon Valley
|
Warrensburg
|
NY
|
RV
|
151
|
|
|
151
|
70
|
100.0
|
%
|
$
|
2,124
|
|
|||||||||||
|
Greenbriar Village
|
Bath
|
PA
|
MH
|
63
|
|
|
319
|
319
|
97.2
|
%
|
$
|
6,644
|
|
|||||||||||
|
Sun Valley
|
Bowmansville
|
PA
|
RV
|
86
|
|
|
265
|
204
|
100.0
|
%
|
$
|
2,793
|
|
|||||||||||
|
Green Acres
|
Breinigsville
|
PA
|
MH
|
149
|
|
|
595
|
595
|
93.9
|
%
|
$
|
7,646
|
|
|||||||||||
|
Gettysburg Farm
|
Dover
|
PA
|
RV
|
124
|
|
|
265
|
72
|
100.0
|
%
|
$
|
2,038
|
|
|||||||||||
|
Timothy Lake South
|
East Stroudsburg
|
PA
|
RV
|
65
|
|
|
327
|
64
|
100.0
|
%
|
$
|
2,040
|
|
|||||||||||
|
Timothy Lake North
|
East Stroudsburg
|
PA
|
RV
|
93
|
|
|
323
|
138
|
100.0
|
%
|
$
|
2,026
|
|
|||||||||||
|
Circle M
|
Lancaster
|
PA
|
RV
|
103
|
|
|
380
|
71
|
100.0
|
%
|
$
|
2,107
|
|
|||||||||||
|
Hershey Preserve
|
Lebanon
|
PA
|
RV
|
196
|
20
|
|
297
|
52
|
100.0
|
%
|
$
|
2,866
|
|
|||||||||||
|
Robin Hill
|
Lenhartsville
|
PA
|
RV
|
44
|
|
|
270
|
143
|
100.0
|
%
|
$
|
2,617
|
|
|||||||||||
|
PA Dutch County
|
Manheim
|
PA
|
RV
|
102
|
|
|
269
|
76
|
100.0
|
%
|
$
|
1,924
|
|
|||||||||||
22
|
|
||||||||||||||||||||||||
|
Property
|
City
|
State
|
MH/RV
|
Acres
(c)
|
Developable
Acres (d) |
Expansion
Sites (e) |
Total Number of Sites as of 12/31/13
|
Total Number of Annual Sites as of 12/31/13
|
Annual Site Occupancy as of 12/31/13
|
Annual Rent as of 12/31/13
|
||||||||||||||
|
Spring Gulch
|
New Holland
|
PA
|
RV
|
114
|
|
|
420
|
132
|
100.0
|
%
|
$
|
3,941
|
|
|||||||||||
|
Lil Wolf
|
Orefield
|
PA
|
MH
|
56
|
|
|
271
|
271
|
96.3
|
%
|
$
|
6,962
|
|
|||||||||||
|
Scotrun
|
Scotrun
|
PA
|
RV
|
63
|
|
|
178
|
111
|
100.0
|
%
|
$
|
1,851
|
|
|||||||||||
|
Appalachian
|
Shartlesville
|
PA
|
RV
|
86
|
30
|
200
|
358
|
189
|
100.0
|
%
|
$
|
2,709
|
|
|||||||||||
|
Mountain View - PA
|
Walnutport
|
PA
|
MH
|
45
|
|
|
188
|
188
|
92.6
|
%
|
$
|
5,258
|
|
|||||||||||
|
Carolina Landing
|
Fair Play
|
SC
|
RV
|
73
|
|
|
192
|
55
|
100.0
|
%
|
$
|
1,593
|
|
|||||||||||
|
Inlet Oaks
|
Murrells Inlet
|
SC
|
MH
|
35
|
|
|
172
|
172
|
97.1
|
%
|
$
|
4,129
|
|
|||||||||||
|
The Oaks at Point South (h)
|
Yemassee
|
SC
|
RV
|
10
|
|
|
93
|
—
|
—
|
%
|
$
|
—
|
|
|||||||||||
|
Meadows of Chantilly
|
Chantilly
|
VA
|
MH
|
82
|
|
|
500
|
500
|
99.6
|
%
|
$
|
11,307
|
|
|||||||||||
|
Harbor View (h)
|
Colonial Beach
|
VA
|
RV
|
69
|
|
|
146
|
—
|
—
|
%
|
$
|
—
|
|
|||||||||||
|
Lynchburg
|
Gladys
|
VA
|
RV
|
170
|
59
|
|
222
|
19
|
100.0
|
%
|
$
|
1,208
|
|
|||||||||||
|
Chesapeake Bay
|
Gloucester
|
VA
|
RV
|
282
|
80
|
|
392
|
126
|
100.0
|
%
|
$
|
2,991
|
|
|||||||||||
|
Virginia Landing
|
Quinby
|
VA
|
RV
|
863
|
178
|
|
233
|
6
|
100.0
|
%
|
$
|
861
|
|
|||||||||||
|
Regency Lakes
|
Winchester
|
VA
|
MH
|
165
|
|
|
523
|
523
|
90.8
|
%
|
$
|
5,525
|
|
|||||||||||
|
Williamsburg
|
Williamsburg
|
VA
|
RV
|
65
|
|
|
211
|
75
|
100.0
|
%
|
$
|
2,103
|
|
|||||||||||
|
Total Northeast Market
|
|
|
|
8,362
|
1,231
|
618
|
23,703
|
16,509
|
94.4
|
%
|
$
|
4,879
|
|
|||||||||||
|
Midwest
|
|
|
|
|
|
|
|
|
|
|
|
|
||||||||||||
|
Hidden Cove
|
Arley
|
AL
|
RV
|
99
|
60
|
200
|
79
|
49
|
100.0
|
%
|
$
|
2,268
|
|
|||||||||||
|
Coach Royale
|
Boise
|
ID
|
MH
|
12
|
|
|
91
|
91
|
74.7
|
%
|
$
|
4,757
|
|
|||||||||||
|
Maple Grove
|
Boise
|
ID
|
MH
|
38
|
|
|
271
|
271
|
80.1
|
%
|
$
|
4,741
|
|
|||||||||||
|
Shenandoah Estates
|
Boise
|
ID
|
MH
|
24
|
|
|
154
|
154
|
99.4
|
%
|
$
|
5,492
|
|
|||||||||||
|
West Meadow Estates
|
Boise
|
ID
|
MH
|
29
|
|
|
178
|
178
|
100.0
|
%
|
$
|
5,351
|
|
|||||||||||
|
O'Connell's
|
Amboy
|
IL
|
RV
|
286
|
100
|
600
|
668
|
359
|
100.0
|
%
|
$
|
2,952
|
|
|||||||||||
|
Pheasant Lake Estates (a)
|
Beecher
|
IL
|
MH
|
160
|
|
|
613
|
613
|
100.0
|
%
|
$
|
6,807
|
|
|||||||||||
|
Pine Country
|
Belvidere
|
IL
|
RV
|
131
|
|
|
126
|
133
|
100.0
|
%
|
$
|
1,696
|
|
|||||||||||
|
Willow Lake Estates
|
Elgin
|
IL
|
MH
|
111
|
|
|
617
|
617
|
83.0
|
%
|
$
|
8,177
|
|
|||||||||||
|
Golf Vista Estates
|
Monee
|
IL
|
MH
|
144
|
4
|
|
408
|
408
|
92.2
|
%
|
$
|
7,278
|
|
|||||||||||
|
Indian Lakes
|
Batesville
|
IN
|
RV
|
545
|
159
|
318
|
1,000
|
390
|
100.0
|
%
|
$
|
1,646
|
|
|||||||||||
|
Horseshoe Lakes
|
Clinton
|
IN
|
RV
|
289
|
96
|
96
|
123
|
55
|
100.0
|
%
|
$
|
1,121
|
|
|||||||||||
|
Twin Mills RV
|
Howe
|
IN
|
RV
|
137
|
5
|
50
|
501
|
187
|
100.0
|
%
|
$
|
2,054
|
|
|||||||||||
|
Hoosier Estates
|
Lebanon
|
IN
|
MH
|
60
|
|
|
288
|
288
|
91.7
|
%
|
$
|
3,562
|
|
|||||||||||
|
Lakeside
|
New Carlisle
|
IN
|
RV
|
13
|
|
|
89
|
78
|
100.0
|
%
|
$
|
4,753
|
|
|||||||||||
|
Oak Tree Village
|
Portage
|
IN
|
MH
|
76
|
|
|
361
|
361
|
67.0
|
%
|
$
|
5,336
|
|
|||||||||||
|
North Glen Village
|
Westfield
|
IN
|
MH
|
88
|
|
|
289
|
289
|
79.9
|
%
|
$
|
4,568
|
|
|||||||||||
|
Diamond Caverns Resort
|
Park City
|
KY
|
RV
|
714
|
350
|
469
|
220
|
2
|
100.0
|
%
|
$
|
1,475
|
|
|||||||||||
|
Lake in the Hills
|
Auburn Hills
|
MI
|
MH
|
51
|
|
|
237
|
237
|
89.5
|
%
|
$
|
5,630
|
|
|||||||||||
|
Bear Cave Resort
|
Buchanan
|
MI
|
RV
|
25
|
10
|
|
136
|
10
|
100.0
|
%
|
$
|
1,742
|
|
|||||||||||
|
Saint Claire
|
Saint Claire
|
MI
|
RV
|
210
|
100
|
|
229
|
43
|
100.0
|
%
|
$
|
1,500
|
|
|||||||||||
23
|
|
||||||||||||||||||||||||
|
Property
|
City
|
State
|
MH/RV
|
Acres
(c)
|
Developable
Acres (d) |
Expansion
Sites (e) |
Total Number of Sites as of 12/31/13
|
Total Number of Annual Sites as of 12/31/13
|
Annual Site Occupancy as of 12/31/13
|
Annual Rent as of 12/31/13
|
||||||||||||||
|
Swan Creek
|
Ypsilanti
|
MI
|
MH
|
59
|
|
|
294
|
294
|
96.3
|
%
|
$
|
5,532
|
|
|||||||||||
|
Cedar Knolls
|
Apple Valley
|
MN
|
MH
|
93
|
|
|
457
|
457
|
81.6
|
%
|
$
|
6,809
|
|
|||||||||||
|
Cimarron Park
|
Lake Elmo
|
MN
|
MH
|
230
|
|
|
505
|
505
|
83.0
|
%
|
$
|
6,942
|
|
|||||||||||
|
Rockford Riverview Estates
|
Rockford
|
MN
|
MH
|
88
|
|
|
429
|
429
|
81.6
|
%
|
$
|
4,351
|
|
|||||||||||
|
Rosemount Woods
|
Rosemount
|
MN
|
MH
|
50
|
|
|
182
|
182
|
93.4
|
%
|
$
|
6,603
|
|
|||||||||||
|
Buena Vista
|
Fargo
|
ND
|
MH
|
76
|
|
|
398
|
398
|
89.2
|
%
|
$
|
4,514
|
|
|||||||||||
|
Meadow Park
|
Fargo
|
ND
|
MH
|
17
|
|
|
116
|
116
|
87.9
|
%
|
$
|
3,541
|
|
|||||||||||
|
Kenisee Lake
|
Jefferson
|
OH
|
RV
|
143
|
50
|
|
119
|
65
|
100.0
|
%
|
$
|
1,117
|
|
|||||||||||
|
Wilmington
|
Wilmington
|
OH
|
RV
|
109
|
41
|
|
169
|
83
|
100.0
|
%
|
$
|
1,702
|
|
|||||||||||
|
Natchez Trace
|
Hohenwald
|
TN
|
RV
|
672
|
140
|
|
531
|
132
|
100.0
|
%
|
$
|
1,245
|
|
|||||||||||
|
Cherokee Landing
|
Middleton
|
TN
|
RV
|
254
|
124
|
|
339
|
1
|
—
|
%
|
$
|
—
|
|
|||||||||||
|
Rainbow Lake Manor (a)
|
Bristol
|
WI
|
MH
|
99
|
|
|
270
|
270
|
95.6
|
%
|
$
|
6,673
|
|
|||||||||||
|
Fremont
|
Fremont
|
WI
|
RV
|
98
|
5
|
|
325
|
107
|
100.0
|
%
|
$
|
2,721
|
|
|||||||||||
|
Yukon Trails
|
Lyndon Station
|
WI
|
RV
|
150
|
30
|
|
214
|
114
|
100.0
|
%
|
$
|
1,720
|
|
|||||||||||
|
Westwood Estates (a)
|
Pleasant Prairie
|
WI
|
MH
|
95
|
|
|
324
|
324
|
91.4
|
%
|
$
|
7,046
|
|
|||||||||||
|
Plymouth Rock
|
Plymouth
|
WI
|
RV
|
133
|
|
|
610
|
423
|
100.0
|
%
|
$
|
2,246
|
|
|||||||||||
|
Tranquil Timbers
|
Sturgeon Bay
|
WI
|
RV
|
125
|
|
|
270
|
182
|
100.0
|
%
|
$
|
1,959
|
|
|||||||||||
|
Neshonoc Lakeside (a)
|
West Salem
|
WI
|
RV
|
|
|
|
284
|
|
|
|
|
|
||||||||||||
|
Arrowhead
|
Wisconsin Dells
|
WI
|
RV
|
166
|
40
|
200
|
377
|
181
|
100.0
|
%
|
$
|
1,860
|
|
|||||||||||
|
Total Midwest Market
|
|
|
|
5,899
|
1,314
|
1,933
|
12,891
|
9,076
|
91.1
|
%
|
$
|
4,791
|
|
|||||||||||
|
Nevada and Utah
|
|
|
|
|
|
|
|
|
|
|
|
|
||||||||||||
|
Mountain View - NV
|
Henderson
|
NV
|
MH
|
72
|
|
|
354
|
354
|
100.0
|
%
|
$
|
8,441
|
|
|||||||||||
|
Las Vegas
|
Las Vegas
|
NV
|
RV
|
11
|
|
|
217
|
5
|
100.0
|
%
|
$
|
3,183
|
|
|||||||||||
|
Bonanza
|
Las Vegas
|
NV
|
MH
|
43
|
|
|
353
|
353
|
60.9
|
%
|
$
|
5,848
|
|
|||||||||||
|
Boulder Cascade
|
Las Vegas
|
NV
|
MH
|
39
|
|
|
299
|
299
|
76.6
|
%
|
$
|
6,656
|
|
|||||||||||
|
Cabana
|
Las Vegas
|
NV
|
MH
|
37
|
|
|
263
|
263
|
98.1
|
%
|
$
|
7,003
|
|
|||||||||||
|
Flamingo West
|
Las Vegas
|
NV
|
MH
|
37
|
|
|
258
|
258
|
100.0
|
%
|
$
|
7,657
|
|
|||||||||||
|
Villa Borega
|
Las Vegas
|
NV
|
MH
|
40
|
|
|
293
|
293
|
77.5
|
%
|
$
|
7,030
|
|
|||||||||||
|
Westwood Village
|
Farr West
|
UT
|
MH
|
46
|
|
|
314
|
314
|
100.0
|
%
|
$
|
4,967
|
|
|||||||||||
|
All Seasons
|
Salt Lake City
|
UT
|
MH
|
19
|
|
|
121
|
121
|
100.0
|
%
|
$
|
5,796
|
|
|||||||||||
|
St. George
|
Hurricane
|
UT
|
RV
|
26
|
|
|
123
|
9
|
100.0
|
%
|
$
|
1,714
|
|
|||||||||||
|
Total Nevada and Utah Market
|
|
|
|
370
|
—
|
—
|
2,595
|
2,269
|
87.7
|
%
|
$
|
6,754
|
|
|||||||||||
|
Northwest
|
|
|
|
|
|
|
|
|
|
|
|
|
||||||||||||
|
Cultus Lake (Canada)
|
Lindell Beach
|
BC
|
RV
|
15
|
|
|
178
|
43
|
100.0
|
%
|
$
|
2,923
|
|
|||||||||||
|
Thousand Trails Bend
|
Bend
|
OR
|
RV
|
289
|
100
|
145
|
351
|
23
|
100.0
|
%
|
$
|
2,483
|
|
|||||||||||
|
Pacific City
|
Cloverdale
|
OR
|
RV
|
105
|
|
|
307
|
32
|
100.0
|
%
|
$
|
3,508
|
|
|||||||||||
|
South Jetty
|
Florence
|
OR
|
RV
|
57
|
|
|
204
|
3
|
100.0
|
%
|
$
|
2,455
|
|
|||||||||||
|
Seaside Resort
|
Seaside
|
OR
|
RV
|
80
|
|
|
251
|
34
|
100.0
|
%
|
$
|
2,895
|
|
|||||||||||
24
|
|
||||||||||||||||||||||||
|
Property
|
City
|
State
|
MH/RV
|
Acres
(c)
|
Developable
Acres (d) |
Expansion
Sites (e) |
Total Number of Sites as of 12/31/13
|
Total Number of Annual Sites as of 12/31/13
|
Annual Site Occupancy as of 12/31/13
|
Annual Rent as of 12/31/13
|
||||||||||||||
|
Whaler's Rest Resort
|
South Beach
|
OR
|
RV
|
39
|
|
|
170
|
16
|
100.0
|
%
|
$
|
3,360
|
|
|||||||||||
|
Mt. Hood
|
Welches
|
OR
|
RV
|
115
|
30
|
202
|
436
|
76
|
100.0
|
%
|
$
|
5,822
|
|
|||||||||||
|
Shadowbrook
|
Clackamas
|
OR
|
MH
|
21
|
|
|
156
|
156
|
99.4
|
%
|
$
|
7,966
|
|
|||||||||||
|
Falcon Wood Village
|
Eugene
|
OR
|
MH
|
23
|
|
|
183
|
183
|
97.8
|
%
|
$
|
6,469
|
|
|||||||||||
|
Quail Hollow (b)
|
Fairview
|
OR
|
MH
|
21
|
|
|
137
|
137
|
92.7
|
%
|
$
|
7,884
|
|
|||||||||||
|
Birch Bay
|
Blaine
|
WA
|
RV
|
31
|
|
|
246
|
20
|
100.0
|
%
|
$
|
2,835
|
|
|||||||||||
|
Mt. Vernon
|
Bow
|
WA
|
RV
|
311
|
|
|
251
|
30
|
100.0
|
%
|
$
|
3,123
|
|
|||||||||||
|
Chehalis
|
Chehalis
|
WA
|
RV
|
309
|
85
|
|
360
|
31
|
100.0
|
%
|
$
|
2,449
|
|
|||||||||||
|
Grandy Creek
|
Concrete
|
WA
|
RV
|
63
|
|
|
179
|
2
|
100.0
|
%
|
$
|
1,988
|
|
|||||||||||
|
Tall Chief
|
Fall City
|
WA
|
RV
|
71
|
|
|
180
|
31
|
100.0
|
%
|
$
|
4,134
|
|
|||||||||||
|
La Conner (b)
|
La Conner
|
WA
|
RV
|
106
|
5
|
|
319
|
31
|
100.0
|
%
|
$
|
3,695
|
|
|||||||||||
|
Leavenworth
|
Leavenworth
|
WA
|
RV
|
255
|
50
|
|
266
|
15
|
100.0
|
%
|
$
|
1,960
|
|
|||||||||||
|
Thunderbird Resort
|
Monroe
|
WA
|
RV
|
45
|
2
|
|
136
|
16
|
100.0
|
%
|
$
|
2,721
|
|
|||||||||||
|
Little Diamond
|
Newport
|
WA
|
RV
|
360
|
119
|
|
520
|
5
|
100.0
|
%
|
$
|
1,733
|
|
|||||||||||
|
Oceana Resort
|
Oceana City
|
WA
|
RV
|
16
|
|
|
84
|
1
|
100.0
|
%
|
$
|
2,033
|
|
|||||||||||
|
Crescent Bar Resort
|
Quincy
|
WA
|
RV
|
14
|
|
|
115
|
22
|
100.0
|
%
|
$
|
2,656
|
|
|||||||||||
|
Long Beach
|
Seaview
|
WA
|
RV
|
17
|
|
|
144
|
10
|
100.0
|
%
|
$
|
1,950
|
|
|||||||||||
|
Paradise Resort
|
Silver Creek
|
WA
|
RV
|
60
|
|
|
214
|
8
|
100.0
|
%
|
$
|
2,071
|
|
|||||||||||
|
Kloshe Illahee
|
Federal Way
|
WA
|
MH
|
50
|
|
|
258
|
258
|
99.6
|
%
|
$
|
9,471
|
|
|||||||||||
|
Total Northwest Market
|
2,473
|
391
|
347
|
5,645
|
1,183
|
98.6
|
%
|
$
|
6,321
|
|
||||||||||||||
|
Texas
|
||||||||||||||||||||||||
|
Alamo Palms
|
Alamo
|
TX
|
RV
|
58
|
|
|
643
|
368
|
100.0
|
%
|
$
|
3,978
|
|
|||||||||||
|
Bay Landing
|
Bridgeport
|
TX
|
RV
|
443
|
235
|
|
293
|
50
|
100.0
|
%
|
$
|
2,194
|
|
|||||||||||
|
Colorado River
|
Columbus
|
TX
|
RV
|
218
|
51
|
|
132
|
16
|
100.0
|
%
|
$
|
3,309
|
|
|||||||||||
|
Victoria Palms
|
Donna
|
TX
|
RV
|
117
|
|
|
1,122
|
520
|
100.0
|
%
|
$
|
4,909
|
|
|||||||||||
|
Lake Texoma
|
Gordonville
|
TX
|
RV
|
201
|
|
|
301
|
143
|
100.0
|
%
|
$
|
2,149
|
|
|||||||||||
|
Lakewood
|
Harlingen
|
TX
|
RV
|
30
|
|
|
301
|
113
|
100.0
|
%
|
$
|
2,146
|
|
|||||||||||
|
Paradise Park RV
|
Harlingen
|
TX
|
RV
|
60
|
|
|
563
|
286
|
100.0
|
%
|
$
|
3,253
|
|
|||||||||||
|
Sunshine RV
|
Harlingen
|
TX
|
RV
|
84
|
|
|
1,027
|
408
|
100.0
|
%
|
$
|
2,592
|
|
|||||||||||
|
Tropic Winds
|
Harlingen
|
TX
|
RV
|
112
|
74
|
|
531
|
121
|
100.0
|
%
|
$
|
3,018
|
|
|||||||||||
|
Medina Lake
|
Lakehills
|
TX
|
RV
|
208
|
50
|
|
387
|
31
|
100.0
|
%
|
$
|
2,161
|
|
|||||||||||
|
Paradise South
|
Mercedes
|
TX
|
RV
|
49
|
|
|
493
|
208
|
100.0
|
%
|
$
|
2,199
|
|
|||||||||||
|
Lake Tawakoni (b)
|
Point
|
TX
|
RV
|
324
|
11
|
|
293
|
81
|
100.0
|
%
|
$
|
1,967
|
|
|||||||||||
|
Fun n Sun RV
|
San Benito
|
TX
|
RV
|
135
|
40
|
|
1,435
|
619
|
100.0
|
%
|
$
|
3,342
|
|
|||||||||||
|
Southern Comfort
|
Weslaco
|
TX
|
RV
|
40
|
|
|
403
|
327
|
100.0
|
%
|
$
|
2,954
|
|
|||||||||||
|
Country Sunshine
|
Weslaco
|
TX
|
RV
|
37
|
|
|
390
|
182
|
100.0
|
%
|
$
|
2,896
|
|
|||||||||||
|
Lake Whitney
|
Whitney
|
TX
|
RV
|
403
|
158
|
|
261
|
37
|
100.0
|
%
|
$
|
2,610
|
|
|||||||||||
25
|
|
||||||||||||||||||||||||
|
Property
|
City
|
State
|
MH/RV
|
Acres
(c)
|
Developable
Acres (d) |
Expansion
Sites (e) |
Total Number of Sites as of 12/31/13
|
Total Number of Annual Sites as of 12/31/13
|
Annual Site Occupancy as of 12/31/13
|
Annual Rent as of 12/31/13
|
||||||||||||||
|
Lake Conroe
|
Willis
|
TX
|
RV
|
129
|
30
|
300
|
363
|
128
|
100.0
|
%
|
$
|
3,628
|
|
|||||||||||
|
Total Texas Market
|
|
|
|
2,648
|
649
|
300
|
8,938
|
3,638
|
100.0
|
%
|
$
|
3,268
|
|
|||||||||||
|
|
|
|
|
|
|
|
|
|
|
|
|
|||||||||||||
|
Grand Total All Markets
|
|
|
|
37,103
|
5,184
|
8,438
|
136,050
|
96,949
|
93.9
|
%
|
$
|
5,908
|
|
|||||||||||
_____________________
|
(a)
|
Property acquired in 2013.
|
|
(b)
|
Land is leased by us under a non-cancelable operating lease. (See Note 12 in the Notes to Consolidated Financial Statements contained in this Form 10-K.)
|
|
(c)
|
Acres are approximate. Acreage for some Properties were estimated based upon 10 Sites per acre.
|
|
(d)
|
Acres are approximate. There can be no assurance that developable acres will be developed. Development is contingent on many factors including, but not limited to, cost, ability to subdivide, accessibility, infrastructure needs, zoning, entitlement and topography.
|
|
(e)
|
Expansion Sites are approximate and only represent Sites that could be developed and is further dependent upon necessary approvals. Certain Properties with Expansion Sites noted may have vacancies and therefore, Expansion Sites may not be added.
|
|
(f)
|
Acres for this RV park are included in the acres for the adjacent manufactured home community listed directly above this Property.
|
|
(g)
|
Property not operated by us during all of 2013, as the Property is leased to a third party operator.
|
|
(h)
|
Property does not contain annual Sites.
|
26
The legal proceedings disclosure is incorporated herein by reference from Note 18 in the Notes to Consolidated Financial Statements in this Form 10-K.
None.
27
Our common stock is traded on the New York Stock Exchange (“NYSE”) under the symbol ELS. On
February 21, 2014
, the reported closing price per share of ELS
common stock on the NYSE was
$39.90
and there were approximately
282
holders of record. The high and low sales prices and closing sales prices on the NYSE and distributions for our common stock during
2013
and
2012
are set forth in the table below (prior period adjusted for stock split):
|
Close
|
High
|
Low
|
Distributions
Declared
|
||||||||||||
|
2013
|
|||||||||||||||
|
1st Quarter
|
$
|
38.40
|
|
$
|
38.41
|
|
$
|
33.84
|
|
$
|
0.2500
|
|
|||
|
2nd Quarter
|
39.30
|
|
42.78
|
|
36.60
|
|
0.2500
|
|
|||||||
|
3rd Quarter
|
34.17
|
|
41.68
|
|
33.84
|
|
0.2500
|
|
|||||||
|
4th Quarter
|
36.23
|
|
38.68
|
|
33.47
|
|
0.2500
|
|
|||||||
|
|
Close
|
High
|
Low
|
Distributions
Declared
|
|||||||||||
|
2012
|
|||||||||||||||
|
1st Quarter
|
$
|
34.87
|
|
$
|
35.43
|
|
$
|
32.83
|
|
$
|
0.2188
|
|
|||
|
2nd Quarter
|
34.49
|
|
35.49
|
|
32.24
|
|
0.2188
|
|
|||||||
|
3rd Quarter
|
34.06
|
|
36.58
|
|
33.90
|
|
0.2188
|
|
|||||||
|
4th Quarter
|
33.65
|
|
34.75
|
|
31.61
|
|
0.2188
|
|
|||||||
Issuer Purchases of Equity Securities
|
Period
|
Total Number of Shares
Purchased
(a)
|
Average Price Paid per Share
(a)
|
Total Number of Shares Purchased as Part of Publicly Announced Plans or Programs
|
Maximum Number of Shares that May Yet be Purchased Under the Plans or Programs
|
||||||
|
10/1/13-10/31/13
|
—
|
|
$
|
—
|
|
None
|
None
|
|||
|
11/1/13-11/30/13
|
686
|
|
37.27
|
|
None
|
None
|
||||
|
12/1/13-12/31/13
|
30,053
|
|
36.46
|
|
None
|
None
|
||||
____________________
|
(a)
|
Of the common stock repurchased from October 1,
2013
through
December 31, 2013
,
30,739
shares were repurchased at the open market price and represent common stock surrendered to us to satisfy income tax withholding obligations due as a result of the vesting of Restricted Share Grants. Certain of our executive officers may from time to time adopt non-discretionary, written trading plans that comply with Commission Rule 10b5-1, or otherwise monetize their equity-based compensation. Commission Rule 10b5-1 provides executives with a method to monetize their equity-based compensation in an automatic and non-discretionary manner over time.
|
28
Issuance of Certain Securities
Since March 23, 2011, when our 1992 Amended and Restated Stock Option and Stock Award Plan (the "Plan") expired, we granted to certain directors, executive officers and a consultant a total of
383,330
shares of restricted stock net of the number of shares that were subsequently forfeited before vesting (the "Restricted Stock Grants") in private placements exempt from registration. The Restricted Stock Grants were approved by our Board of Directors at the recommendation of the Compensation, Nominating, and Corporate Governance Committee of our Board of Directors (the "Compensation Committee"). The Restricted Stock Grants were subject to conditions and restrictions, including vesting schedule and term, determined by the Compensation Committee. The amount and vesting terms of the Restricted Stock Grants were disclosed in the appropriate periods in our periodic reports on Form 10-Q and Form 10-K, and in our annual proxy statements and in each recipient's Section 16 filings, as applicable. Under Maryland law, the Restricted Stock Grants were duly authorized and validly issued, and pursuant to Section 4(a)(2) of the Securities Act of 1933, as amended, were validly issued private placements exempt from registration. The expiration of the Plan did not materially impact the accounting for these awards. At our 2014 Annual Meeting of Stockholders, we intend to ask our stockholders to ratify the Restricted Stock Grants. The number of shares shown in this section has been adjusted for our
two
-for-one stock split that was effected by and in the form of a stock dividend in July 2013.
|
Grant Date
|
Number Of Shares
|
Fair Market Value of Shares (in millions)
(c)
|
|||||||
|
May 8, 2013
|
40,000
|
|
$
|
1.7
|
|
||||
|
April 10, 2013
|
2,000
|
|
0.1
|
|
|||||
|
March 13, 2013
|
(a)
|
666
|
|
—
|
|
||||
|
February 1, 2013
|
68,666
|
|
2.5
|
|
|||||
|
January 31, 2013
|
62,000
|
|
2.2
|
|
|||||
|
May 8, 2012
|
32,000
|
|
1.1
|
|
|||||
|
January 31, 2012
|
62,000
|
|
2.2
|
|
|||||
|
January 31, 2012
|
(b)
|
83,998
|
|
2.9
|
|
||||
|
May 11, 2011
|
32,000
|
|
0.9
|
|
|||||
|
Total
|
383,330
|
|
$
|
13.6
|
|
||||
____________________
(a) Shares have a fair market value of $24,800.
(b) Net of 36,666 shares with a fair market value of $1.3 million relinquished by senior management.
(c) Fair market value as of the date of the award.
29
The following table sets forth selected financial and operating information on a historical basis. The historical operating data has been derived from our historical financial statements. The following information should be read in conjunction with all of the financial statements and notes thereto included elsewhere in this Form 10-K.
Equity LifeStyle Properties, Inc.
Consolidated Historical Financial Information
(Amounts in thousands, except for per share and property data (prior periods adjusted for stock split))
|
Years Ended December 31,
|
|||||||||||||||||||
|
2013
|
2012
(1)
|
2011
(1)
|
2010
(1)
|
2009
(1)
|
|||||||||||||||
|
Income Statement Data:
|
|||||||||||||||||||
|
Total Revenues
|
$
|
728,375
|
|
$
|
683,706
|
|
$
|
577,009
|
|
$
|
517,299
|
|
$
|
508,310
|
|
||||
|
Total Expenses
|
(653,167
|
)
|
(621,858
|
)
|
(537,000
|
)
|
(458,698
|
)
|
(459,811
|
)
|
|||||||||
|
Equity in income from unconsolidated joint ventures
|
2,039
|
|
1,899
|
|
1,948
|
|
2,027
|
|
2,896
|
|
|||||||||
|
Income from discontinued operations
|
7,133
|
|
6,116
|
|
547
|
|
—
|
|
—
|
|
|||||||||
|
Gain (loss) on sale of property, net of taxes
|
41,525
|
|
4,596
|
|
—
|
|
(231
|
)
|
4,866
|
|
|||||||||
|
Consolidated net income
|
$
|
125,905
|
|
$
|
74,459
|
|
$
|
42,504
|
|
$
|
60,397
|
|
$
|
56,261
|
|
||||
|
Net income available for Common Shares
|
$
|
106,919
|
|
$
|
54,779
|
|
$
|
22,775
|
|
$
|
38,354
|
|
$
|
34,005
|
|
||||
|
Comprehensive income attributable to Common Shares
|
$
|
108,443
|
|
$
|
54,742
|
|
$
|
20,467
|
|
$
|
38,354
|
|
$
|
34,005
|
|
||||
|
Earnings per Common Share - Basic:
|
|||||||||||||||||||
|
Net income available for Common Shares
|
$
|
1.29
|
|
$
|
0.67
|
|
$
|
0.32
|
|
$
|
0.63
|
|
$
|
0.62
|
|
||||
|
Earnings per Common Share - Fully Diluted:
|
|||||||||||||||||||
|
Net income available for Common Shares
|
$
|
1.28
|
|
$
|
0.66
|
|
$
|
0.32
|
|
$
|
0.62
|
|
$
|
0.61
|
|
||||
|
Distributions declared per Common Share outstanding
|
$
|
1.00
|
|
$
|
0.88
|
|
$
|
0.75
|
|
$
|
0.60
|
|
$
|
0.55
|
|
||||
|
Weighted average Common Shares outstanding - basic
|
83,018
|
|
82,348
|
|
71,182
|
|
61,034
|
|
55,164
|
|
|||||||||
|
Weighted average Common Shares outstanding - fully diluted
|
91,196
|
|
90,862
|
|
80,660
|
|
71,036
|
|
65,888
|
|
|||||||||
|
Balance Sheet Data:
|
|||||||||||||||||||
|
Real estate, before accumulated depreciation
|
$
|
4,228,106
|
|
$
|
4,044,650
|
|
$
|
3,960,692
|
|
$
|
2,584,987
|
|
$
|
2,538,215
|
|
||||
|
Total assets
|
3,391,639
|
|
3,398,226
|
|
3,496,101
|
|
2,048,395
|
|
2,166,319
|
|
|||||||||
|
Total mortgage notes and term loan
|
2,192,368
|
|
2,261,610
|
|
2,276,250
|
|
1,012,919
|
|
1,547,901
|
|
|||||||||
|
Non-controlling interest preferred OP Units
|
—
|
|
—
|
|
—
|
|
200,000
|
|
200,000
|
|
|||||||||
|
Series A Preferred Stock
(2)
|
—
|
|
—
|
|
200,000
|
|
—
|
|
—
|
|
|||||||||
|
Series C Preferred Stock
(2)
|
136,144
|
|
136,144
|
|
—
|
|
—
|
|
—
|
|
|||||||||
|
Total Common Equity
(3)
|
827,061
|
|
788,158
|
|
799,280
|
|
260,158
|
|
254,427
|
|
|||||||||
|
Other Data:
|
|||||||||||||||||||
|
Funds from operations
(4)
|
$
|
191,049
|
|
$
|
209,993
|
|
$
|
147,457
|
|
$
|
125,989
|
|
$
|
120,443
|
|
||||
|
Normalized funds from operations
(4)
|
$
|
232,298
|
|
$
|
209,688
|
|
$
|
165,950
|
|
$
|
130,001
|
|
$
|
121,137
|
|
||||
|
Total Properties (at end of period)
(5)
|
377
|
|
383
|
|
382
|
|
307
|
|
304
|
|
|||||||||
|
Total Sites (at end of period)
(5)
|
139,126
|
|
142,679
|
|
141,132
|
|
111,002
|
|
110,575
|
|
|||||||||
________________________________
|
1.
|
Certain prior year amounts have been reclassified to conform to the 2013 presentation. These reclassifications had no material effect on the consolidated financial statements.
|
|
2.
|
In 2011, we, on
behalf of selling stockholders, closed on a public offering of Series A Cumulative Redeemable Perpetual Preferred Stock (“Series A Preferred Stock”). The selling stockholders received the Series A Preferred Stock in exchange for $200 million of previously issued series D and series F Perpetual Preferred OP Units. In 2012, we issued 54,458 shares of Series C Preferred Stock which are represented by Depositary Shares. We also exchanged 5,445,765 shares of our Series A Preferred Stock for 5,445,765 Depositary Shares, each representing 1/100
th
of a share of Series C Preferred Stock. Also in 2012, we redeemed the remaining 2,554,235 of Series A Preferred Stock.
|
|
3.
|
In 2011, we issued 12,075,000 shares of common stock in an equity offering for proceeds of approximately $344.0 million, net of offering costs. During the year ended December 31, 2011, we issued 3,416,552 shares of Common Stock and 1,740,000 shares of Series B Subordinated Non-Voting Cumulative Preferred Stock (the “Series B Preferred Stock”) with an aggregate value of $224.2 million, net of offering costs, to partially fund the purchase of the 2011 Acquisition Properties. All of the Series B Preferred Stock was redeemed for Common Stock. In 2009, we issued 9.2 million shares of common stock in an equity offering for proceeds of approximately $146.4 million, net of offering costs.
|
|
4.
|
Refer to Item 7 contained in this Form 10-K for information regarding why we present funds from operations and normalized funds from operations and for a reconciliation of these non-GAAP financial measures to net income.
|
|
5.
|
In 2011, we closed on the acquisition of the 2011 Acquisition Properties which consisted of 74 manufactured home communities and one RV resort containing 30,129 Sites on approximately 6,400 acres located in 16 states.
|
30
The following discussion should be read in conjunction with “Selected Financial Data” and the historical Consolidated Financial Statements and Notes thereto appearing elsewhere in this Form 10-K.
2013
Accomplishments
|
•
|
Core occupancy increased by 312 Sites to a total of 91.8% at year end.
|
|
•
|
Closed on the acquisition of two RV resorts and three manufactured homes communities for a total purchase price of approximately $134 million.
|
|
•
|
Closed on the disposition of 11 non-core Michigan Properties and recognized a gain on sale of real estate of approximately $41 million.
|
|
•
|
We entered into an agreement with an unaffiliated third party to create a joint venture named ECHO Financing, LLC, to buy and sell homes, as well as to offer another financing option to purchasers of homes at our Properties.
|
|
•
|
Effected a two-for-one split of our common stock, by and in the form of a stock dividend.
|
|
•
|
Amended our charter to increase from 100,000,000 to 200,000,000 the number of shares of our common stock we are authorized to issue.
|
|
•
|
Raised the annual dividend to $1.00 per share in 2013, an increase of more than 14% compared to $0.875 per share in 2012.
|
|
•
|
We closed on approximately $375.5 million of refinancing proceeds on 22 Properties. In addition, we defeased approximately $312.2 million of debt secured by 29 manufactured home communities and paid off 16 maturing mortgages totaling approximately $99.8 million.
|
Overview and Outlook
Occupancy in our Properties as well as our ability to increase rental rates directly affects revenues. Our revenue streams are predominantly derived from customers renting our Sites on a long-term basis.
The following table shows the breakdown of our Sites by type. Our community Sites and annual resort Sites are leased on an annual basis. Seasonal Sites are leased to customers generally for three to six months. Transient Sites are leased to customers on a short-term basis. The revenue from seasonal and transient Sites is generally higher during the first and third quarters. We expect to service over 100,000 customers at our transient Sites in 2014 and we consider this revenue stream to be our most volatile as it is subject to weather conditions and other factors affecting the marginal RV customer’s vacation and travel preferences. Sites designated as right-to-use Sites are primarily utilized to service the approximately 98,300 customers who have entered into right-to-use contracts. We also have interests in joint venture Properties for which revenue is classified as Equity in income from unconsolidated joint ventures in the Consolidated Statements of Income and Comprehensive Income.
|
Total Sites as of
|
||
|
|
December 31, 2013
|
|
|
Community Sites
|
69,900
|
|
|
Resort Sites:
|
||
|
Annual
|
23,400
|
|
|
Seasonal
|
9,100
|
|
|
Transient
|
9,500
|
|
|
Right-to-use
(1)
|
24,100
|
|
|
Joint Ventures
(2)
|
3,100
|
|
|
139,100
|
|
|
_____________________
|
(1)
|
Includes approximately
4,800
Sites rented on an annual basis.
|
|
(2)
|
Joint ventures have approximately 2,200 annual Sites, approximately 400 seasonal Sites and approximately 500 transient Sites.
|
The following comparisons exclude the results from the 11 Properties that have been reclassified to “Discontinued operations” on the Consolidated Statements of Income and Comprehensive Income (see Note 5 in the Notes to the Consolidated Financial Statements contained in this Form 10-K).
A significant portion of our rental agreements on community Sites tie rent increases directly or indirectly to published Consumer Price Index (“CPI”) statistics that are issued from June through September of the year prior to the increase effective date. We currently expect our 2014 Core community base rental income to increase approximately 2.3% compared to 2013. The expected increase consists of a 2.0% rate increase, net of a 0.5% reduction related to unbundling of utilities and other charges, and occupancy gains of approximately 0.3%.
31
Nineteen of our 49 California Properties, our seven Delaware Properties and one of our five Massachusetts Properties are affected by state and local rent control regulations. The impact of the rent control regulations is to limit our ability to implement rent increases based on prevailing market conditions. The regulations generally provide the ability to increase rates by a percentage of the increase in the CPI. The limit on rent increases may range from 60% to 100% of CPI with certain maximum limits depending on the jurisdiction.
We believe the disruption in the site-built housing market has impacted our home sales business. Customers’ inability to sell their existing site-built homes and relocate to their retirement destination has significantly reduced new home sales volumes since 2007. While we believe available affordable chattel financing is improving, we still believe it is impacting customer purchase decisions in the current economic environment. We entered into a new joint venture named ECHO Financing, LLC to buy and sell homes, as well as to offer another financing option to purchasers of homes at our Properties. Chattel financing options available today include community owner funded programs or third party lender programs which provide subsidized financing to customers and require the community owner to guarantee customer defaults. Third party lender programs have stringent underwriting criteria, sizable down payment requirements, short loan amortization and high interest rates.
In this environment, we believe that customer demand for rentals, which do not require a down payment, is high. We are responding to this by renting our vacant new and used homes. This may represent an attractive source of occupancy as we transition from renters to new home buyers in the future. We are also focusing on sales of homes within our manufactured home Properties. Our Core Portfolio (as defined below) used home sales in our manufactured home communities during the year ended December 31, 2013 increased 29% over the same period of the prior year.
As of
December 31, 2013
, we had 5,471 occupied manufactured home rentals. For the year ended
December 31, 2013
and
2012
, rental program net operating income was approximately $39.0 million and $32.4 million, respectively, net of rental asset depreciation expense of approximately $6.5 million and $5.6 million, respectively. Approximately $38.7 million and $32.7 million of rental operations revenue was included in community base rental income for the year ended
December 31, 2013
and
2012
, respectively. We believe that, unlike the new home sales business, at this time we compete effectively with other types of rentals (i.e., apartments). We continue to evaluate home rental operations and may continue to invest in additional units.
In our resort Properties, we are focused on engaging with our existing customers and providing them the lifestyle they seek as well as attracting additional customers interested in our Properties. We continue to see growth in our annual revenues. 2013 Core annual revenues were 3.9% higher than 2012. Our customer base is loyal and engaged in the lifestyle we offer at our Properties. We have annual customers who have stayed ten years with us and our member base includes members who have camped with us for more than twenty years. Our social media presence has increased within this member base.
In the spring of 2010, we introduced low-cost membership products that focus on the installed base of approximately nine million RV owners. Such products include right-to-use contracts that entitle the customer to use certain Properties. We are offering a Zone Park Pass (“ZPP”), which can be purchased for one to five zones of the United States and requires annual payments. Beginning on February 1, 2013, the required annual payments increased from $499 to $525. The ZPP replaces high cost products that were typically entered into at Properties after tours and lengthy sales presentations. Prior to 2010, we incurred significant costs to generate leads, conduct tours and make sales presentations. A single zone ZPP requires no additional upfront payment while additional zones may be purchased for modest additional upfront payments. Since inception we have entered into approximately
37,700
ZPPs. For the year ended
December 31, 2013
, we entered into approximately
15,500
ZPPs, or a
53.5%
increase from approximately
10,100
ZPPs for the year
ended
December 31, 2012
. Of the 15,500 ZPP's activated during the year ended December 31, 2013, 8,800 were sold to dues paying members.
In 2012, we initiated a program with RV dealers to feature our ZPP as part of the dealers’ sales and marketing efforts. In return, we provide the dealer with a ZPP membership to give to their customers in connection with the purchase of an RV. Since the inception of the ZPP program with the RV dealers, we have activated
7,607
ZPPs. While certain RV dealers make up-front cash payments in exchange for the ZPP they bundle with an RV sale, no cash is received from the members during the first year of membership for memberships activated through the RV dealer program. Through the year ended
December 31, 2013
, memberships activated through the RV dealer program have contributed approximately
$2.2 million
of non-cash revenue which was offset by non-cash expense related to the sales and marketing activity. Going forward, we will no longer recognize non-cash revenue or expenses related to these memberships.
32
Existing customers are eligible to upgrade their right-to-use contract from time-to-time. An upgrade is currently distinguishable from a new right-to-use contract that a customer would enter into by, depending on the type of upgrade, offering (1) increased length of consecutive stay by 50% (i.e., up to 21 days); (2) ability to make earlier advance reservations; (3) discounts on rental units; (4) access to additional Properties, which may include use of Sites at non-membership RV Properties and (5) membership in discount travel programs. Each upgrade contract requires a nonrefundable upfront payment. We may finance the nonrefundable upfront payment.
We actively seek to acquire additional Properties and currently are engaged in negotiations relating to the possible acquisition of a number of Properties. At any time these negotiations are at varying stages, which may include contracts outstanding to acquire certain Properties, which are subject to satisfactory completion of our due diligence review.
Property Acquisitions, Joint Ventures and Dispositions
The following chart lists the Properties or portfolios acquired, invested in, or sold since January 1,
2012
through December 31, 2013.
|
Property
|
Transaction Date
|
Sites
|
||
|
Total Sites as of January 1, 2012
|
141,132
|
|
||
|
Property or Portfolio (# of Properties in parentheses):
|
||||
|
Acquisitions:
|
||||
|
Victoria Palms (1)
|
December 28, 2012
|
1,122
|
|
|
|
Alamo Palms Resort (1)
|
December 28, 2012
|
643
|
|
|
|
Pheasant Lake (1)
|
August 1, 2013
|
613
|
|
|
|
Rainbow Lake (1)
|
August 1, 2013
|
270
|
|
|
|
Westwood Estates (1)
|
August 1, 2013
|
324
|
|
|
|
Fiesta Key (1)
|
September 16, 2013
|
324
|
|
|
|
Neshonoc (1)
|
December 17, 2013
|
284
|
|
|
|
Expansion Site Development and other:
|
||||
|
Sites added (reconfigured) in 2012
|
(55
|
)
|
||
|
Sites added (reconfigured) in 2013
|
(24
|
)
|
||
|
Dispositions:
|
||||
|
Cascade (1)
|
December 7, 2012
|
(163
|
)
|
|
|
Avon on the Lake (1)
|
July 23, 2013
|
(616
|
)
|
|
|
Cranberry Lake (1)
|
July 23, 2013
|
(328
|
)
|
|
|
Fairchild Lake (1)
|
July 23, 2013
|
(344
|
)
|
|
|
Grand Blanc Crossing (1)
|
July 23, 2013
|
(478
|
)
|
|
|
Holly Hills (1)
|
July 23, 2013
|
(241
|
)
|
|
|
Oakland Glens (1)
|
July 23, 2013
|
(724
|
)
|
|
|
Old Orchard (1)
|
July 23, 2013
|
(200
|
)
|
|
|
Royal Estates (1)
|
July 23, 2013
|
(183
|
)
|
|
|
Westbrook (1)
|
July 23, 2013
|
(387
|
)
|
|
|
Westbridge Manor (1)
|
July 23, 2013
|
(1,424
|
)
|
|
|
Ferrand Estates (1)
|
September 25, 2013
|
(419
|
)
|
|
|
Total Sites as of December 31, 2013
|
139,126
|
|
||
The gross investment in real estate has increased approximately
$183 million
to
$4,228 million
as of
December 31, 2013
from
$4,045 million
as of
December 31, 2012
primarily due to the aforementioned acquisitions of Properties during the period.
33
Markets
The following table identifies our largest markets by number of Sites and provides information regarding our Properties (excluding
five
Properties owned through Joint Ventures).
|
Major Market
|
Total Sites
|
Number of
Properties
|
Percent of
Total Sites
|
Percent of Total
Property Operating
Revenues
(1)
|
|||||||
|
Florida
|
51,285
|
|
118
|
|
37.7
|
%
|
40.7
|
%
|
|||
|
Northeast
|
23,704
|
|
66
|
|
17.4
|
%
|
15.0
|
%
|
|||
|
Arizona
|
13,851
|
|
39
|
|
10.2
|
%
|
9.8
|
%
|
|||
|
California
|
13,688
|
|
48
|
|
10.1
|
%
|
15.7
|
%
|
|||
|
Midwest
|
12,891
|
|
40
|
|
9.5
|
%
|
6.7
|
%
|
|||
|
Texas
|
8,938
|
|
17
|
|
6.6
|
%
|
3.1
|
%
|
|||
|
Northwest
|
5,645
|
|
24
|
|
4.1
|
%
|
3.1
|
%
|
|||
|
Colorado
|
3,454
|
|
10
|
|
2.5
|
%
|
3.3
|
%
|
|||
|
Other
|
2,595
|
|
10
|
|
1.9
|
%
|
2.6
|
%
|
|||
|
Total
|
136,051
|
|
372
|
|
100.0
|
%
|
100.0
|
%
|
|||
_____________________
|
(1)
|
Property operating revenues for this calculation excludes approximately
$13.7 million
of property operating revenue not allocated to Properties, which consists primarily of upfront payments from right-to-use contracts.
|
Qualification as a REIT
We believe that we have qualified for taxation as a real estate investment trust (“REIT”) for U.S. federal income tax purposes since our taxable year ended December 31, 1993. We plan to continue to meet the requirements for taxation as a REIT. Many of these requirements, however, are highly technical and complex. For example, to qualify as a REIT, at least
95%
of our gross income must come from sources that are itemized in the REIT tax laws. We are also required to distribute to stockholders at least
90%
of our REIT taxable income computed without regard to our deduction for dividends paid and our net capital gain.The fact that we hold our assets through the Operating Partnership and our Subsidiaries further complicates the application of the REIT requirements.
If we fail to qualify as a REIT, we would be subject to U.S. federal income tax at regular corporate rates. Also, unless the IRS granted us relief under certain statutory provisions, we would remain disqualified as a REIT for four years following the year we first failed to qualify. Even if we qualify for taxation as a REIT, we are subject to certain foreign, state and local taxes on our income and property and U.S. federal income and excise taxes on our undistributed income.
Results of Operations
Comparison of Year Ended
December 31, 2013
to Year Ended
December 31, 2012
The following tables for the comparison of the year ended
December 31, 2013
to the year ended
December 31, 2012
exclude the results from the 11 Properties that have been reclassified to “Discontinued operations” on the Consolidated Statements of Income and Comprehensive Income.
34
Income from Property Operations
The following table summarizes certain financial and statistical data for the Property Operations for all Properties owned and operated for the same period in both years (“Core Portfolio”) and the total portfolio for the years ended
December 31, 2013
and
2012
(amounts in thousands). The Core Portfolio may change from time-to-time depending on acquisitions, dispositions and significant transactions or unique situations. The Core Portfolio in this comparison of the year ended
December 31, 2013
to
December 31, 2012
includes all Properties acquired on or prior to
December 31, 2011
and which we have owned and operated continuously since January 1, 2012. Core Portfolio growth percentages exclude the impact of GAAP deferrals of upfront payments from right-to-use contracts and related commissions.
|
|
Core Portfolio
|
Total Portfolio
|
|||||||||||||||||||||||||||
|
2013
|
2012
|
Variance
|
%
Change
|
2013
|
2012
|
Variance
|
%
Change
|
||||||||||||||||||||||
|
Community base rental income
|
$
|
406,579
|
|
$
|
394,592
|
|
$
|
11,987
|
|
3.0
|
%
|
$
|
409,801
|
|
$
|
394,606
|
|
$
|
15,195
|
|
3.9
|
%
|
|||||||
|
Rental home income
|
14,236
|
|
11,649
|
|
2,587
|
|
22.2
|
%
|
14,267
|
|
11,649
|
|
2,618
|
|
22.5
|
%
|
|||||||||||||
|
Resort base rental income
|
141,261
|
|
134,273
|
|
6,988
|
|
5.2
|
%
|
147,234
|
|
134,327
|
|
12,907
|
|
9.6
|
%
|
|||||||||||||
|
Right-to-use annual payments
|
47,967
|
|
47,662
|
|
305
|
|
0.6
|
%
|
47,967
|
|
47,662
|
|
305
|
|
0.6
|
%
|
|||||||||||||
|
Right-to-use contracts current period, gross
|
13,142
|
|
13,433
|
|
(291
|
)
|
(2.2
|
)%
|
13,142
|
|
13,433
|
|
(291
|
)
|
(2.2
|
)%
|
|||||||||||||
|
Utility and other income
|
63,119
|
|
62,461
|
|
658
|
|
1.1
|
%
|
63,800
|
|
62,470
|
|
1,330
|
|
2.1
|
%
|
|||||||||||||
|
Property operating revenues, excluding deferrals
|
686,304
|
|
664,070
|
|
22,234
|
|
3.3
|
%
|
696,211
|
|
664,147
|
|
32,064
|
|
4.8
|
%
|
|||||||||||||
|
Property operating and maintenance
|
225,653
|
|
220,295
|
|
5,358
|
|
2.4
|
%
|
229,897
|
|
220,415
|
|
9,482
|
|
4.3
|
%
|
|||||||||||||
|
Rental home operating and maintenance
|
7,443
|
|
6,369
|
|
1,074
|
|
16.9
|
%
|
7,474
|
|
6,369
|
|
1,105
|
|
17.3
|
%
|
|||||||||||||
|
Real estate taxes
|
47,479
|
|
45,563
|
|
1,916
|
|
4.2
|
%
|
48,279
|
|
45,590
|
|
2,689
|
|
5.9
|
%
|
|||||||||||||
|
Sales and marketing, gross
|
12,835
|
|
10,845
|
|
1,990
|
|
18.3
|
%
|
12,836
|
|
10,845
|
|
1,991
|
|
18.4
|
%
|
|||||||||||||
|
Property operating expenses, excluding deferrals and Property management
|
293,410
|
|
283,072
|
|
10,338
|
|
3.7
|
%
|
298,486
|
|
283,219
|
|
15,267
|
|
5.4
|
%
|
|||||||||||||
|
Income from property operations, excluding deferrals and Property management
|
392,894
|
|
380,998
|
|
11,896
|
|
3.1
|
%
|
397,725
|
|
380,928
|
|
16,797
|
|
4.4
|
%
|
|||||||||||||
|
Property management
|
40,193
|
|
37,999
|
|
2,194
|
|
5.8
|
%
|
40,193
|
|
37,999
|
|
2,194
|
|
5.8
|
%
|
|||||||||||||
|
Income from property operations, excluding deferrals
|
$
|
352,701
|
|
$
|
342,999
|
|
$
|
9,702
|
|
2.8
|
%
|
$
|
357,532
|
|
$
|
342,929
|
|
$
|
14,603
|
|
4.3
|
%
|
|||||||
The
3.0%
increase in Core Portfolio community base rental income primarily reflects a 2.4% increase in rates and a 0.6% increase in occupancy. The average monthly base rent per site increased to $538 in 2013 from $525 in 2012. The average occupancy increased to 91.8% in 2013 from 91.2% in 2012. The increase in property operating and maintenance expenses was primarily driven by repair and maintenance which includes non-recurring, storm related expenses, utility expenses due to higher electric and water expenses, and insurance.
Resort base rental income is comprised of the following (amounts in thousands):
|
|
Core Portfolio
|
Total Portfolio
|
|||||||||||||||||||||||||||
|
|
2013
|
2012
|
Variance
|
% Change
|
2013
|
2012
|
Variance
|
% Change
|
|||||||||||||||||||||
|
Annual
|
$
|
90,575
|
|
$
|
87,168
|
|
$
|
3,407
|
|
3.9
|
%
|
$
|
94,668
|
|
$
|
87,222
|
|
$
|
7,446
|
|
8.5
|
%
|
|||||||
|
Seasonal
|
22,196
|
|
21,077
|
|
1,119
|
|
5.3
|
%
|
22,898
|
|
21,077
|
|
1,821
|
|
8.6
|
%
|
|||||||||||||
|
Transient
|
28,490
|
|
26,028
|
|
2,462
|
|
9.5
|
%
|
29,668
|
|
26,028
|
|
3,640
|
|
14.0
|
%
|
|||||||||||||
|
Resort base rental income
|
$
|
141,261
|
|
$
|
134,273
|
|
$
|
6,988
|
|
5.2
|
%
|
$
|
147,234
|
|
$
|
134,327
|
|
$
|
12,907
|
|
9.6
|
%
|
|||||||
The increase in rental home income and rental home operating and maintenance are discussed in further detail in the Rental Operations table below.
The
0.6%
increase in right-to-use annual payments is primarily due to an increase in member count. During the year ending
December 31, 2013
, our member count increased by 1,590 members compared to the same period in
2012
. Right-to-use contracts current period, gross, net of sales and marketing, gross, decreased primarily due to an increase in sales and marketing expenses.
35
The following growth rate percentages exclude property management expense (amounts in thousands):
|
|
Core Portfolio
|
Total Portfolio
|
|||||||||||||||||||||||||||
|
|
2013
|
2012
|
Variance
|
%
Change
|
2013
|
2012
|
Variance
|
%
Change
|
|||||||||||||||||||||
|
Property operating revenues, excluding Right-to-use contracts current period, gross
|
$
|
673,162
|
|
$
|
650,637
|
|
$
|
22,525
|
|
3.5
|
%
|
$
|
683,069
|
|
$
|
650,714
|
|
$
|
32,355
|
|
5.0
|
%
|
|||||||
|
Property operating expenses, excluding Sales and marketing, gross
|
280,575
|
|
272,227
|
|
8,348
|
|
3.1
|
%
|
285,650
|
|
272,374
|
|
13,276
|
|
4.9
|
%
|
|||||||||||||
|
Income from property operations, excluding Right-to-use contracts current period, gross and Sales and marketing, gross
|
$
|
392,587
|
|
$
|
378,410
|
|
$
|
14,177
|
|
3.7
|
%
|
$
|
397,419
|
|
$
|
378,340
|
|
$
|
19,079
|
|
5.0
|
%
|
|||||||
The increase in total portfolio income from property operations is primarily due an increase in rates and occupancy in community base rental income and resort base rental income due to increases in annual, seasonal, and transient revenues partially offset by the property operating and maintenance increases described above.
Home Sales Operations
The following table summarizes certain financial and statistical data for the Home Sales Operations for the years ended
December 31, 2013
and
2012
(amounts in thousands, except home sales volumes).
|
2013
|
2012
|
Variance
|
% Change
|
|||||||||||
|
Gross revenues from new home sales
|
$
|
4,836
|
|
$
|
1,698
|
|
$
|
3,138
|
|
184.8
|
%
|
|||
|
Cost of new home sales
|
(4,315
|
)
|
(1,440
|
)
|
(2,875
|
)
|
(199.7
|
)%
|
||||||
|
Gross profit from new home sales
|
521
|
|
258
|
|
263
|
|
101.9
|
%
|
||||||
|
Gross revenues from used home sales
|
13,035
|
|
6,532
|
|
6,503
|
|
99.6
|
%
|
||||||
|
Cost of used home sales
|
(12,981
|
)
|
(7,578
|
)
|
(5,403
|
)
|
(71.3
|
)%
|
||||||
|
Gross profit (loss) from used home sales
|
54
|
|
(1,046
|
)
|
1,100
|
|
(105.2
|
)%
|
||||||
|
Brokered resale revenues and ancillary services revenues, net
|
4,212
|
|
3,093
|
|
1,119
|
|
36.2
|
%
|
||||||
|
Home selling expenses
|
(2,085
|
)
|
(1,391
|
)
|
(694
|
)
|
(49.9
|
)%
|
||||||
|
Income from home sales operations and other
|
$
|
2,702
|
|
$
|
914
|
|
$
|
1,788
|
|
195.6
|
%
|
|||
|
Home sales volumes:
|
||||||||||||||
|
New home sales
(1)
|
109
|
|
35
|
|
74
|
|
211.4
|
%
|
||||||
|
Used home sales
|
1,588
|
|
1,306
|
|
282
|
|
21.6
|
%
|
||||||
|
Brokered home resale
|
835
|
|
906
|
|
(71
|
)
|
(7.8
|
)%
|
||||||
_____________________
|
(1)
|
Includes 26 home sales through our Echo joint venture and one third-party dealer sale for the year ended
December 31, 2013
. Includes one third-party home sale for the year ended December 31, 2012.
|
The increase in income from home sales operations and other is primarily due to an increase in home sales volume at generally higher prices resulting in higher gross profits on used home sales as well as ancillary operations throughout our portfolio.
36
Rental Operations
The following table summarizes certain financial and statistical data for manufactured home Rental Operations for the years ended
December 31, 2013
and
2012
(amounts in thousands, except rental unit volumes).
|
2013
|
2012
|
Variance
|
% Change
|
|||||||||||
|
Manufactured homes:
|
||||||||||||||
|
New Home
|
$
|
22,278
|
|
$
|
17,932
|
|
$
|
4,346
|
|
24.2
|
%
|
|||
|
Used Home
|
30,715
|
|
26,417
|
|
4,298
|
|
16.3
|
%
|
||||||
|
Rental operations revenue
(1)
|
52,993
|
|
44,349
|
|
8,644
|
|
19.5
|
%
|
||||||
|
Rental home operating and maintenance
|
(7,474
|
)
|
(6,369
|
)
|
(1,105
|
)
|
(17.3
|
)%
|
||||||
|
Income from rental operations
|
45,519
|
|
37,980
|
|
7,539
|
|
19.8
|
%
|
||||||
|
Depreciation on rental homes
(2)
|
(6,535
|
)
|
(5,553
|
)
|
(982
|
)
|
(17.7
|
)%
|
||||||
|
Income from rental operations, net of depreciation
|
$
|
38,984
|
|
$
|
32,427
|
|
$
|
6,557
|
|
20.2
|
%
|
|||
|
Gross investment in new manufactured home rental units
|
$
|
114,136
|
|
$
|
105,733
|
|
$
|
8,403
|
|
7.9
|
%
|
|||
|
Gross investment in used manufactured home rental units
|
$
|
63,736
|
|
$
|
59,809
|
|
$
|
3,927
|
|
6.6
|
%
|
|||
|
Net investment in new manufactured home rental units
|
$
|
101,073
|
|
$
|
96,194
|
|
$
|
4,879
|
|
5.1
|
%
|
|||
|
Net investment in used manufactured home rental units
|
$
|
54,871
|
|
$
|
53,959
|
|
$
|
912
|
|
1.7
|
%
|
|||
|
Number of occupied rentals—new, end of period
|
2,140
|
|
1,834
|
|
306
|
|
16.7
|
%
|
||||||
|
Number of occupied rentals—used, end of period
|
3,331
|
|
3,230
|
|
101
|
|
3.1
|
%
|
||||||
_____________________
|
(1)
|
Approximately
$38.7 million
and
$32.7 million
as of
December 31, 2013
and
2012
, respectively, of site rental income are included in Community base rental income in the Income from Property Operations table. The remainder of home rental income is included in rental home income in the Income from Property Operations table.
|
|
(2)
|
Included in depreciation on real estate and other costs in the Consolidated Statements of Income and Comprehensive Income.
|
The increase in income from rental operations is primarily due to the increase in the number of occupied rental units. In the ordinary course of business, we acquire used homes from customers through purchase, lien, sale or abandonment. In a vibrant new home sale market older homes may be removed from Sites and replaced with new homes. In the current environment, however, used homes may be rented either in the condition received or after warranted rehabilitation. We continue to evaluate rental units and, depending on market conditions, may invest in new homes.
Other Income and Expenses
The following table summarizes other income and expenses for the years ended
December 31, 2013
and
2012
(amounts in thousands).
|
2013
|
2012
|
Variance
|
% Change
|
|||||||||||
|
Depreciation on real estate and rental homes
|
$
|
(108,229
|
)
|
$
|
(102,083
|
)
|
$
|
(6,146
|
)
|
(6.0
|
)%
|
|||
|
Amortization of in-place leases
|
(1,940
|
)
|
(39,467
|
)
|
37,527
|
|
95.1
|
%
|
||||||
|
Interest income
|
8,260
|
|
8,135
|
|
125
|
|
1.5
|
%
|
||||||
|
Income from other investments, net
|
7,515
|
|
6,795
|
|
720
|
|
10.6
|
%
|
||||||
|
General and administrative (excluding transaction costs)
|
(26,248
|
)
|
(26,231
|
)
|
(17
|
)
|
(0.1
|
)%
|
||||||
|
Transaction costs
|
(1,963
|
)
|
(157
|
)
|
(1,806
|
)
|
(1,150.3
|
)%
|
||||||
|
Early debt retirement
|
(37,844
|
)
|
—
|
|
(37,844
|
)
|
(100.0
|
)%
|
||||||
|
Rent control initiatives and other
|
(2,771
|
)
|
(1,456
|
)
|
(1,315
|
)
|
(90.3
|
)%
|
||||||
|
Interest and related amortization
|
(118,522
|
)
|
(123,992
|
)
|
5,470
|
|
4.4
|
%
|
||||||
|
Total other expenses, net
|
$
|
(281,742
|
)
|
$
|
(278,456
|
)
|
$
|
(3,286
|
)
|
(1.2
|
)%
|
|||
During the year ended
December 31, 2013
, we recorded an additional $3.5 million in depreciation expense to correct amounts recorded in prior periods related to certain assets. In addition, there is an increase in rental home depreciation driven by a higher number of rental homes.
Amortization of in-place leases decreased primarily due to the expected term of in-place leases. In-place lease amortization in 2013 includes the amortization of in-place leases at five Properties and in 2012 included the amortization at 75 Properties.
Income from other investments, net increased primarily due to net insurance proceeds of $1.6 million related to the settlement of the hurricane litigation and miscellaneous corporate income of $0.5 million offset by the $1.4 million expense of the contingent
37
asset related to our Colony Cove property (see Note 5 in the Notes to Consolidated Financial Statements contained in this Form 10-K).
Early debt retirement expenses increased primarily due to defeasance costs associated with the early retirement of 29 mortgages (see Note 8 in the Notes to Consolidated Financial Statements in this Form 10-K). This also contributed to the decrease in interest and related amortization. Transaction costs increased due to litigation settlement costs of $0.9 million and acquisition costs of $1.0 million. Rent control initiatives and other increased primarily due to a payment of approximately $1.4 million related to an award of attorney’s fees and costs to the City of San Rafael in the rent control litigation (see Note 18 in the Notes to Consolidated Financial Statements contained in this Form 10-K).
Comparison of Year Ended
December 31, 2012
to Year Ended
December 31, 2011
The following tables for the comparison of the year ended
December 31, 2012
to the year ended
December 31, 2011
exclude the results from the 11 Properties that have been reclassified to “Discontinued operations” on the Consolidated Statements of Income and Comprehensive Income.
Income from Property Operations
The following table summarizes certain financial and statistical data for the Property Operations for all Properties owned and operated for the same period in both years (“Core Portfolio”) and the total portfolio for the years ended
December 31, 2012
and
2011
(amounts in thousands). The Core Portfolio may change from time-to-time depending on acquisitions, dispositions and significant transactions or unique situations. The Core Portfolio in this comparison of the year ended
December 31, 2012
to
December 31, 2011
includes all Properties acquired on or prior to December 31,
2010
and which we have owned and operated continuously since January 1, 2011. Core Portfolio growth percentages exclude the impact of GAAP deferrals of upfront payments from right-to-use contracts entered and related commissions.
|
|
Core Portfolio
|
Total Portfolio
|
|||||||||||||||||||||||||||
|
|
2012
|
2011
|
Variance
|
%
Change
|
2012
|
2011
|
Variance
|
%
Change
|
|||||||||||||||||||||
|
Community base rental income
|
$
|
274,362
|
|
$
|
266,584
|
|
$
|
7,778
|
|
2.9
|
%
|
$
|
394,606
|
|
$
|
309,230
|
|
$
|
85,376
|
|
27.6
|
%
|
|||||||
|
Rental home income
|
8,125
|
|
6,340
|
|
1,785
|
|
28.2
|
%
|
11,649
|
|
7,245
|
|
4,404
|
|
60.8
|
%
|
|||||||||||||
|
Resort base rental income
|
133,749
|
|
130,432
|
|
3,317
|
|
2.5
|
%
|
134,327
|
|
130,489
|
|
3,838
|
|
2.9
|
%
|
|||||||||||||
|
Right-to-use annual payments
|
47,662
|
|
49,122
|
|
(1,460
|
)
|
(3.0
|
)%
|
47,662
|
|
49,122
|
|
(1,460
|
)
|
(3.0
|
)%
|
|||||||||||||
|
Right-to-use contracts current period, gross
|
13,433
|
|
17,856
|
|
(4,423
|
)
|
(24.8
|
)%
|
13,433
|
|
17,856
|
|
(4,423
|
)
|
(24.8
|
)%
|
|||||||||||||
|
Utility and other income
|
51,657
|
|
49,552
|
|
2,105
|
|
4.2
|
%
|
62,470
|
|
53,116
|
|
9,354
|
|
17.6
|
%
|
|||||||||||||
|
Property operating revenues, excluding deferrals
|
528,988
|
|
519,886
|
|
9,102
|
|
1.8
|
%
|
664,147
|
|
567,058
|
|
97,089
|
|
17.1
|
%
|
|||||||||||||
|
Property operating and maintenance
|
188,542
|
|
186,947
|
|
1,595
|
|
0.9
|
%
|
220,415
|
|
197,781
|
|
22,634
|
|
11.4
|
%
|
|||||||||||||
|
Rental home operating and maintenance
|
4,662
|
|
3,896
|
|
766
|
|
19.7
|
%
|
6,369
|
|
4,493
|
|
1,876
|
|
41.8
|
%
|
|||||||||||||
|
Real estate taxes
|
32,719
|
|
32,111
|
|
608
|
|
1.9
|
%
|
45,590
|
|
36,528
|
|
9,062
|
|
24.8
|
%
|
|||||||||||||
|
Sales and marketing, gross
|
10,841
|
|
11,218
|
|
(377
|
)
|
(3.4
|
)%
|
10,845
|
|
11,218
|
|
(373
|
)
|
(3.3
|
)%
|
|||||||||||||
|
Property operating expenses, excluding deferrals and Property management
|
236,764
|
|
234,172
|
|
2,592
|
|
1.1
|
%
|
283,219
|
|
250,020
|
|
33,199
|
|
13.3
|
%
|
|||||||||||||
|
Income from property operations, excluding deferrals and Property management
|
292,224
|
|
285,714
|
|
6,510
|
|
2.3
|
%
|
380,928
|
|
317,038
|
|
63,890
|
|
20.2
|
%
|
|||||||||||||
|
Property management
|
33,087
|
|
33,158
|
|
(71
|
)
|
(0.2
|
)%
|
37,999
|
|
34,846
|
|
3,153
|
|
9.0
|
%
|
|||||||||||||
|
Income from property operations, excluding deferrals
|
$
|
259,137
|
|
$
|
252,556
|
|
$
|
6,581
|
|
2.6
|
%
|
$
|
342,929
|
|
$
|
282,192
|
|
$
|
60,737
|
|
21.5
|
%
|
|||||||
The
2.9%
increase in Core Portfolio community base rental income primarily reflects a 2.3% increase in rates and a 0.6% increase in occupancy. The average monthly base rent per site increased to $567 in 2012 from $554 in 2011. The average occupancy increased to 91.5% in 2012 from 90.9% in 2011.
38
Resort base rental income is comprised of the following (amounts in thousands):
|
|
Core Portfolio
|
Total Portfolio
|
|||||||||||||||||||||||||||
|
|
2012
|
2011
|
Variance
|
% Change
|
2012
|
2011
|
Variance
|
% Change
|
|||||||||||||||||||||
|
Annual
|
$
|
86,753
|
|
$
|
83,324
|
|
$
|
3,429
|
|
4.1
|
%
|
$
|
87,222
|
|
$
|
83,328
|
|
$
|
3,894
|
|
4.7
|
%
|
|||||||
|
Seasonal
|
20,982
|
|
20,670
|
|
312
|
|
1.5
|
%
|
21,077
|
|
20,718
|
|
359
|
|
1.7
|
%
|
|||||||||||||
|
Transient
|
26,014
|
|
26,438
|
|
(424
|
)
|
(1.6
|
)%
|
26,028
|
|
26,443
|
|
(415
|
)
|
(1.6
|
)%
|
|||||||||||||
|
Resort base rental income
|
$
|
133,749
|
|
$
|
130,432
|
|
$
|
3,317
|
|
2.5
|
%
|
$
|
134,327
|
|
$
|
130,489
|
|
$
|
3,838
|
|
2.9
|
%
|
|||||||
The increase in rental home income and rental home operating and maintenance are discussed in further detail in the Rental Operations table below.
During the year ended December 31, 2012, utility and other income includes the accelerated recognition of $2.1 million of revenue related to the early termination of a multi-year cable service agreement.
The Core Portfolio and Total Portfolio property operating revenues for the year ended
December 31, 2012
were negatively impacted by the temporary cessation of the entry of right-to-use contracts (membership upgrades) in connection with third party sales force training and the roll out of new membership upgrade products during the year ended December 31, 2012. As a result, membership upgrade sales, which are included in right-to-use contracts current period, gross, were down
$4.4 million
compared to the year ended December 31, 2011. The decrease in right-to-use contracts for the year ended December 31, 2012 was offset by a
$0.4 million
decrease in sales and marketing expenses, resulting in a net decline of $4.0 million from these activities compared to the year ended December 31, 2011.
The following growth rate percentages exclude property management expense (amounts in thousands):
|
|
Core Portfolio
|
Total Portfolio
|
|||||||||||||||||||||||||||
|
|
2012
|
2011
|
Variance
|
%
Change
|
2012
|
2011
|
Variance
|
%
Change
|
|||||||||||||||||||||
|
Property operating revenues, excluding Right-to-use contracts current period, gross
|
$
|
515,555
|
|
$
|
502,030
|
|
$
|
13,525
|
|
2.7
|
%
|
$
|
650,714
|
|
$
|
549,202
|
|
$
|
101,512
|
|
18.5
|
%
|
|||||||
|
Property operating expenses, excluding Sales and marketing, gross
|
225,923
|
|
222,954
|
|
2,969
|
|
1.3
|
%
|
272,374
|
|
238,802
|
|
33,572
|
|
14.1
|
%
|
|||||||||||||
|
Income from property operations, excluding Right-to-use contracts current period, gross and Sales and marketing, gross
|
$
|
289,632
|
|
$
|
279,076
|
|
$
|
10,556
|
|
3.8
|
%
|
$
|
378,340
|
|
$
|
310,400
|
|
$
|
67,940
|
|
21.9
|
%
|
|||||||
The increase in Total Portfolio income from property operations is primarily due to the acquisition of the 2011 Acquisition Properties on various dates during the six months ended December 31, 2011.
39
Home Sales Operations
The following table summarizes certain financial and statistical data for the Home Sales Operations for the years ended
December 31, 2012
and
2011
(amounts in thousands, except home sales volumes).
|
2012
|
2011
|
Variance
|
% Change
|
|||||||||||
|
Gross revenues from new home sales
|
$
|
1,698
|
|
$
|
2,278
|
|
$
|
(580
|
)
|
(25.5
|
)%
|
|||
|
Cost of new home sales
|
(1,440
|
)
|
(2,133
|
)
|
693
|
|
32.5
|
%
|
||||||
|
Gross profit (loss) from new home sales
|
258
|
|
145
|
|
113
|
|
77.9
|
%
|
||||||
|
Gross revenues from used home sales
|
6,532
|
|
3,750
|
|
2,782
|
|
74.2
|
%
|
||||||
|
Cost of used home sales
|
(7,578
|
)
|
(3,482
|
)
|
(4,096
|
)
|
(117.6
|
)%
|
||||||
|
Gross profit from used home sales
|
(1,046
|
)
|
268
|
|
(1,314
|
)
|
(490.3
|
)%
|
||||||
|
Brokered resale revenues and ancillary services revenues, net
|
3,093
|
|
3,483
|
|
(390
|
)
|
(11.2
|
)%
|
||||||
|
Home selling expenses
|
(1,391
|
)
|
(1,591
|
)
|
200
|
|
12.6
|
%
|
||||||
|
Income from home sales operations and other
|
$
|
914
|
|
$
|
2,305
|
|
$
|
(1,391
|
)
|
(60.3
|
)%
|
|||
|
Home sales volumes:
|
||||||||||||||
|
New home sales
(1)
|
35
|
|
51
|
|
(16
|
)
|
(31.4
|
)%
|
||||||
|
Used home sales
(2)
|
1,306
|
|
888
|
|
418
|
|
47.1
|
%
|
||||||
|
Brokered home resale
|
906
|
|
708
|
|
198
|
|
28.0
|
%
|
||||||
_____________________
|
(1)
|
Includes three third-party dealer sales for the year ended
December 31, 2011
.
|
|
(2)
|
Includes one third-party dealer sale for the year ended
December 31, 2011
.
|
Income from home sales operations decreased primarily as a result of decreased profit on used home sales and a decrease in ancillary revenues.
Rental Operations
The following table summarizes certain financial and statistical data for manufactured home Rental Operations for the years ended
December 31, 2012
and
2011
(amounts in thousands, except rental unit volumes).
|
2012
|
2011
|
Variance
|
% Change
|
|||||||||||
|
Manufactured homes:
|
||||||||||||||
|
New Home
|
$
|
17,932
|
|
$
|
12,398
|
|
$
|
5,534
|
|
44.6
|
%
|
|||
|
Used Home
|
26,417
|
|
17,701
|
|
8,716
|
|
49.2
|
%
|
||||||
|
Rental operations revenue
(1)
|
44,349
|
|
30,099
|
|
14,250
|
|
47.3
|
%
|
||||||
|
Rental home operating and maintenance
|
(6,369
|
)
|
(4,493
|
)
|
(1,876
|
)
|
(41.8
|
)%
|
||||||
|
Income from rental operations
|
37,980
|
|
25,606
|
|
12,374
|
|
48.3
|
%
|
||||||
|
Depreciation on rental homes
(2)
|
(5,553
|
)
|
(4,116
|
)
|
(1,437
|
)
|
(34.9
|
)%
|
||||||
|
Income from rental operations, net of depreciation
|
$
|
32,427
|
|
$
|
21,490
|
|
$
|
10,937
|
|
50.9
|
%
|
|||
|
Gross investment in new manufactured home rental units
|
$
|
105,733
|
|
$
|
83,214
|
|
$
|
22,519
|
|
27.1
|
%
|
|||
|
Gross investment in used manufactured home rental units
|
$
|
59,809
|
|
$
|
48,943
|
|
$
|
10,866
|
|
22.2
|
%
|
|||
|
Net investment in new manufactured home rental units
|
$
|
96,194
|
|
$
|
76,695
|
|
$
|
19,499
|
|
25.4
|
%
|
|||
|
Net investment in used manufactured home rental units
|
$
|
53,959
|
|
$
|
45,292
|
|
$
|
8,667
|
|
19.1
|
%
|
|||
|
Number of occupied rentals—new, end of period
|
1,834
|
|
1,340
|
|
494
|
|
36.9
|
%
|
||||||
|
Number of occupied rentals—used, end of period
|
3,230
|
|
2,663
|
|
567
|
|
21.3
|
%
|
||||||
_____________________
|
(1)
|
Approximately $32.7 million and $22.9 million as of
December 31, 2012
and
2011
, respectively, of site rental income are included in Community base rental income in the Income from Property Operations table. The remainder of home rental income is included in Rental home income in the Income from Property Operations table.
|
|
(2)
|
Included in depreciation on real estate and other costs in the Consolidated Statements of Income and Comprehensive Income.
|
40
The increase in income from rental operations and depreciation expense is primarily due to the increase in the number of occupied rental units resulting from the purchase of additional rental units during 2012 and the acquisition of the 2011 Acquisition Properties on various dates during the six months ended December 31, 2011.
In the ordinary course of business, we acquire used homes from customers through purchase, lien, sale or abandonment. In a vibrant new home sale market older homes may be removed from Sites and replaced with new homes. In the current environment, however, used homes may be rented either in the condition received or after warranted rehabilitation. We continue to evaluate rental units and based on improved market conditions may invest in new homes.
Other Income and Expenses
The following table summarizes other income and expenses for the years ended
December 31, 2012
and
2011
(amounts in thousands).
|
2012
|
2011
|
Variance
|
% Change
|
|||||||||||
|
Depreciation on real estate and rental homes
|
$
|
(102,083
|
)
|
$
|
(83,013
|
)
|
$
|
(19,070
|
)
|
(23.0
|
)%
|
|||
|
Amortization of in-place leases
|
(39,467
|
)
|
(23,126
|
)
|
(16,341
|
)
|
(70.7
|
)%
|
||||||
|
Interest income
|
8,135
|
|
5,924
|
|
2,211
|
|
37.3
|
%
|
||||||
|
Income from other investments, net
|
6,795
|
|
6,452
|
|
343
|
|
5.3
|
%
|
||||||
|
General and administrative
|
(26,231
|
)
|
(23,553
|
)
|
(2,678
|
)
|
(11.4
|
)%
|
||||||
|
Transaction costs
|
(157
|
)
|
(18,493
|
)
|
18,336
|
|
99.2
|
%
|
||||||
|
Rent control initiatives and other
|
(1,456
|
)
|
(2,043
|
)
|
587
|
|
28.7
|
%
|
||||||
|
Interest and related amortization
|
(123,992
|
)
|
(99,489
|
)
|
(24,503
|
)
|
(24.6
|
)%
|
||||||
|
Total other expenses, net
|
$
|
(278,456
|
)
|
$
|
(237,341
|
)
|
$
|
(41,115
|
)
|
(17.3
|
)%
|
|||
Depreciation on real estate and rental homes, amortization of in-place leases and interest income increased primarily due to the purchase of the 2011 Acquisition Properties on various dates during the six months ended December 31, 2011. General and administrative decreased primarily due to the purchase of the 2011 Acquisition Properties in 2011. Rent control initiatives and other are lower due to decreased activity in the San Rafael legal appeal (see Note 18 in the Notes to Consolidated Financial Statements contained in this Form 10-K). Interest and related amortization increased primarily due to the assumption of approximately $548.0 million of mortgage debt secured by 35 of the 2011 Acquisition Properties, the $200.0 million Term Loan originated July 1, 2011, and the $200.0 million of new secured debt originated during the six months ended December 31, 2011.
Income from other investments, net increased primarily due to the $0.5 million increase in the fair value of the contingent consideration of the net asset associated with the 2011 Acquisition Properties. We own both a fee interest and a leasehold interest in a 2,200 site 2011 Acquisition Property. The ground lease contains a purchase option on behalf of the lessee and a put option on behalf of the lessor. The options may be exercised by either party upon the death of the fee holder. We are the beneficiary of an escrow funded by the seller with approximately 114,000 shares of our common stock. The escrow provides for distributions of the escrowed stock on a quarterly basis to protect us from future scheduled ground lease payments as well as scheduled increases in the option purchase price over time. In connection with the purchase price allocation associated with the 2011 Acquisition Properties, we recorded contingent consideration of approximately $6.7 million related to this escrow (see Note 5 in the Notes to Consolidated Financial Statements contained in this Form 10-K).
Liquidity and Capital Resources
Liquidity
Our primary demands for liquidity include payment of operating expenses, debt service, including principal and interest, capital improvements on Properties, purchasing both new and pre-owned homes, acquisitions of new Properties, and distributions. We expect these similar demands for liquidity to continue for the short-term and long-term. Our commitment to capital improvements on existing assets is anticipated to be consistent with last year. Our primary sources of cash include operating cash flows, proceeds from financings, borrowings under our unsecured Line of Credit (“LOC”) and proceeds from issuance of equity and debt securities. We have entered into equity distribution agreements with sales agents, pursuant to which we may sell, from time-to-time, shares of our common stock, par value $0.01 per share, having an aggregate offering price of up to $125.0 million. We have not sold any common stock to date under the equity distribution agreements. In addition, we have available liquidity in the form of authorized and unissued preferred stock of approximately 9.9 million shares and authorized common stock in an unallocated shelf registration statement which was automatically effective when filed with the SEC.
41
On November 25, 2013, our stockholders approved an amendment to our charter to increase from 100,000,000 to 200,000,000 the number of shares of common stock we are authorized to issue. This amendment was previously approved by our Board of Directors and was described in detail in our definitive proxy materials previously filed with the Securities and Exchange Commission on October 17, 2013.
One of our stated objectives is to maintain financial flexibility. Achieving this objective allows us to take advantage of strategic opportunities that may arise. We believe effective management of our balance sheet, including maintaining various access points to raise capital, manage future debt maturities and borrow at competitive rates enables us to meet this objective. We believe we currently have sufficient liquidity, in the form of
$58.4 million
in available cash at year end 2013 and full availability on our $380.0 million unsecured LOC, to satisfy our near term obligations.
During the year ended December 31, 2013, we closed on $375.5 million in loans secured by manufactured home communities with a weighted average interest rate of 4.4% per annum. The loan proceeds and available cash were used to defease approximately $312.2 million of debt with a weighted average interest rate of 5.6% per annum, which was secured by 29 manufactured home communities. We paid approximately $37.8 million in defeasance costs associated with the early retirement of the mortgages.
During the year ended December 31, 2013, we paid off 16 mortgages totaling approximately $99.8 million, with a weighted average interest rate of 6.0% per annum.
We expect to meet our short-term liquidity requirements, including all distributions, generally through net cash provided by operating activities and availability under our existing LOC. We consider these resources to be adequate to meet our operating requirements for capital improvements, amortizing debt and payment of dividends and distributions.
We expect to meet certain long-term liquidity requirements such as scheduled debt maturities, property acquisitions and capital improvements by use of our current cash balance, long-term collateralized and uncollateralized borrowings including borrowings under the existing LOC and the issuance of debt securities or additional equity securities, in addition to net cash provided by operating activities. We have approximately
$87.0 million
of scheduled debt maturities in
2014
(excluding scheduled principal payments on debt maturing in
2014
and beyond). We have a loan commitment for a $54.3 million loan, at 4.5%, for approximately 22 years, with closing scheduled on April 1, 2014. We expect to satisfy our
2014
maturities with the existing cash and projected operating cash. On January 2, 2014, we repaid approximately $16.6 million of debt maturing in 2014, which had a weighted average interest rate of 5.7% per annum. On February 1, 2014, we also repaid one mortgage scheduled to mature in 2014 of approximately $4.0 million with a stated interest rate of 5.4% per annum.
The table below summarizes cash flow activity for the years ended
December 31, 2013
,
2012
, and
2011
(amounts in thousands).
|
|
For the years ended
December 31,
|
|||||||||||
|
|
2013
|
2012
|
2011
|
|||||||||
|
Net cash provided by operating activities
|
$
|
255,349
|
|
$
|
236,445
|
|
$
|
175,641
|
|
|||
|
Net cash used in investing activities
|
(37,854
|
)
|
(86,565
|
)
|
(701,848
|
)
|
||||||
|
Net cash (used in) provided by financing activities
|
(196,194
|
)
|
(183,214
|
)
|
584,008
|
|
||||||
|
Net increase (decrease) in cash and cash equivalents
|
$
|
21,301
|
|
$
|
(33,334
|
)
|
$
|
57,801
|
|
|||
Operating Activities
Net cash provided by operating activities increased
$18.9 million
to
$255.3 million
for the year ended
December 31, 2013
from
$236.4 million
for the year ended
December 31, 2012
. The increase in cash provided by operating activities is primarily due to an increase in net income, increase in depreciation expense, an increase in early debt retirement costs offset by gain on sale in 2013 and a decrease in amortization of in-place leases. Net cash provided by operating activities increased
$60.8 million
to
$236.4 million
for the year ended
December 31, 2012
from
$175.6 million
for the year ended
December 31, 2011
. The increase in
2012
was primarily due to an increase in net income from operations from the 2011 Acquisition Properties acquired on various dates during the last six months of 2011.
42
Investing Activities
Net cash used in investing activities was
$37.9 million
for the year ended
December 31, 2013
compared to
$86.6 million
for the year ended
December 31, 2012
. Significant components of net cash used in investing activities include:
|
•
|
Approximately $64.7 million paid in 2013 for capital improvements, including approximately $24.9 million of recurring capital expenditures and approximately $39.8 million of development, new and used home investment and corporate improvements (see Capital Improvements table below).
|
|
•
|
Approximately $92.0 million paid in 2013 to acquire three manufactured home communities located in the Chicago metropolitan area (see Note 5 in the Notes to Consolidated Financial Statements contained in this Form 10-K for a description of our recent acquisitions).
|
|
•
|
Approximately $24.4 million paid in 2013 to acquire an RV community located in the Florida Keys (see Note 5 in the Notes to Consolidated Financial Statements contained in this Form 10-K for a description of our recent acquisitions).
|
|
•
|
Approximately $1.3 million paid in 2013 to acquire an RV community located in Wisconsin (see Note 5 in the Notes to Consolidated Financial Statements contained in this Form 10-K for a description of our recent acquisitions).
|
|
•
|
Approximately $12.0 million paid in 2013 as a net tax deferred exchange deposit.
|
|
•
|
Approximately $2.6 million investment paid in 2013 for ECHO joint venture (see Note 6 in the Notes to Consolidated Financial Statements contained in this Form 10-K for a description of our joint ventures).
|
|
•
|
Approximately $158.0 million received in 2013 from the disposition of the Michigan Properties (see Note 5 in the Notes to Consolidated Financial Statements contained in this Form 10-K for further discussion of the sale).
|
|
•
|
Approximately $1.2 million of net repayments received in 2013 on notes receivable (see Note 7 in the Notes to Consolidated Financial Statements contained in this Form 10-K for further discussion).
|
|
•
|
Approximately $75.3 million paid in 2012 for capital improvements, including approximately $29.3 million of recurring capital expenditures and approximately $46.0 million of development, new and used home investment and corporate improvements (see Capital Improvements table below).
|
|
•
|
Approximately $24.2 million paid in 2012 for the acquisition of two Properties (see Note 5 in the Notes to Consolidated Financial Statements contained in this Form 10-K for a description of our recent acquisitions).
|
|
•
|
Approximately $7.6 million received in 2012 from the disposition of a rental property (see Note 5 in the Notes to Consolidated Financial Statements contained in this Form 10-K for further discussion of the sale).
|
|
•
|
Approximately $5.3 million of net repayments received in 2012 on notes receivable (see Note 7 in the Notes to Consolidated Financial Statements contained in this Form 10-K for further discussion).
|
Capital improvements
The table below summarizes capital improvements activity for the years ended
December 31, 2013
,
2012
, and
2011
(amounts in thousands).
|
|
For the years ended December 31,
(1)
|
|||||||||||
|
|
2013
|
2012
|
2011
|
|||||||||
|
Recurring Capital Expenditures
(2)
|
$
|
24,881
|
|
$
|
29,287
|
|
$
|
23,315
|
|
|||
|
Development
(3)
|
591
|
|
920
|
|
2,467
|
|
||||||
|
New home investments
|
23,553
|
|
29,218
|
|
28,542
|
|
||||||
|
Used home investments
|
14,731
|
|
15,179
|
|
7,266
|
|
||||||
|
Total Property
|
63,756
|
|
74,604
|
|
61,590
|
|
||||||
|
Corporate
|
958
|
|
656
|
|
442
|
|
||||||
|
Total Capital improvements
|
$
|
64,714
|
|
$
|
75,260
|
|
$
|
62,032
|
|
|||
__________________________________________________
|
(1)
|
Excludes noncash activity of approximately
$0.8 million
for new homes purchased with dealer financing for the year ended
December 31, 2011
and approximately
$2.6 million
,
$5.3 million
and
$2.7 million
of repossessions for the years ended
December 31, 2013
,
2012
and
2011
, respectively.
|
|
(2)
|
Recurring capital expenditures (“Recurring CapEx”) are primarily comprised of common area improvements, furniture, and mechanical improvements.
|
|
(3)
|
Development primarily represents costs to improve and upgrade Property infrastructure or amenities.
|
43
Financing Activities
Net cash used in financing activities was
$196.2 million
for the year ended
December 31, 2013
compared to net cash used in financing activities of
$183.2 million
for the year ended
December 31, 2012
. Significant components of net cash used in financing activities include:
|
•
|
We received
$375.5 million
in financing proceeds in
2013
(see Note 8 in the Notes to Consolidated Financial Statements contained in this Form 10-K for a description of our borrowing arrangements).
|
|
•
|
We paid approximately
$350.7 million
of amortizing principal debt, approximately
$99.8 million
of maturing mortgages and paid approximately
$43.0 million
in debt issuance and early debt retirement costs in
2013
(see Note 8 in the Notes to Consolidated Financial Statements contained in this Form 10-K for a description of our borrowing arrangements).
|
|
•
|
We received approximately
$20.0 million
in LOC proceeds and made repayments in the same amount in 2013.
|
|
•
|
We paid approximately
$77.5 million
of distributions in
2013
to common stockholders, common OP unitholders and preferred stockholders and paid approximately $0.5 million in equity issuance costs in 2013 (see Note 4 in the Notes to Consolidated Financial Statements contained in this Form 10-K for a description of our equity transactions).
|
|
•
|
Approximately $159.5 million of financing proceeds received in 2012 were offset by pay downs of approximately $137.7 million of maturing mortgages, payments of approximately $29.9 million of amortizing principal debt, and payments of approximately $3.1 million of debt issuance costs (see Note 8 in the Notes to Consolidated Financial Statements contained in this Form 10-K for a description of our borrowing arrangements).
|
|
•
|
Approximately $110.8 million of distributions paid in 2012 to common stockholders, common OP unitholders and preferred stockholders and approximately $63.9 million for the redemption of preferred stock and paid $1.3 million in equity issuance costs offset by proceeds received of approximately $4.9 million from the exercise of stock options and the sale of shares through the employee stock purchase plan (see Note 4 in the Notes to Consolidated Financial Statements contained in this Form 10-K for a description of our equity transactions).
|
Contractual Obligations
As of
December 31, 2013
, we were subject to certain contractual payment obligations as described in the table below (amounts in thousands):
|
Total
|
2014
|
2015
|
2016
|
2017
|
2018
|
Thereafter
|
|||||||||||||||||||||||
|
Long Term Borrowings
(1)
|
$
|
2,174,604
|
|
$
|
119,452
|
|
$
|
311,208
|
|
$
|
246,054
|
|
$
|
310,725
|
|
$
|
207,592
|
|
$
|
979,573
|
|
||||||||
|
Interest Expense
(2)
|
604,939
|
|
109,998
|
|
102,388
|
|
81,183
|
|
70,007
|
|
56,972
|
|
184,391
|
|
|||||||||||||||
|
Operating Lease
|
15,675
|
|
1,875
|
|
1,922
|
|
1,954
|
|
1,987
|
|
2,032
|
|
5,905
|
|
|||||||||||||||
|
LOC Maintenance Fee
(3)
|
3,092
|
|
1,140
|
|
1,140
|
|
812
|
|
—
|
|
—
|
|
—
|
|
|||||||||||||||
|
Total Contractual Obligations
|
$
|
2,798,310
|
|
$
|
232,465
|
|
|
$
|
416,658
|
|
$
|
330,003
|
|
$
|
382,719
|
|
$
|
266,596
|
|
$
|
1,169,869
|
|
|||||||
|
Weighted average interest rates
|
4.99
|
%
|
—
|
|
5.20
|
%
|
5.17
|
%
|
5.07
|
%
|
5.15
|
%
|
5.28
|
%
|
4.61
|
%
|
|||||||||||||
_____________________
|
(1)
|
Balance excludes net premiums and discounts of
$17.8 million
, primarily due to the fair market value adjustment of the assumption of $506.5 million of secured debt from the remaining Properties acquired in 2011. Balances include debt maturing and scheduled periodic principal payments.
|
|
(2)
|
Amounts include interest expected to be incurred on our secured debt based on obligations outstanding as of
December 31, 2013
.
|
|
(3)
|
Assumes we will exercise our one year extension option on September 15, 2016 and assumes we will maintain our current leverage ratios as defined by the LOC.
|
We do not include insurance, property taxes and cancelable contracts in the contractual obligations table above.
We also lease land under non-cancelable operating leases at certain of the Properties expiring in various years from 2014 to 2054. The majority of the lease terms require twelve equal payments per year plus additional rents calculated as a percentage of gross revenues. Minimum future rental payments under the ground leases are approximately $1.9 million in each of 2014, 2015, and 2016, $2.0 million in 2017 and 2018 and approximately $11.6 million thereafter. Future minimum rental payments exclude payments related to the Colony Cove Property lease as we have provided the required notification of our intent to exercise the purchase option for the land which is expected to close in early 2014.
With respect to maturing debt, we have staggered the maturities of our long-term mortgage debt over an average of approximately seven years, with approximately
$311.2 million
(which is due in 2015) in principal payments coming due in any
44
single year. We believe that we will be able to refinance our maturing debt obligations on a secured or unsecured basis; however, to the extent we are unable to refinance our debt as it matures, we believe that we will be able to repay such maturing debt from operating cash flow, asset sales and/or the proceeds from equity issuances. With respect to any refinancing of maturing debt, our future cash flow requirements could be impacted by significant changes in interest rates or other debt terms, including required amortization payments.
Critical Accounting Policies and Estimates
Our consolidated financial statements have been prepared in accordance with U.S. GAAP, which requires us to make estimates and judgments that affect the reported amounts of assets, liabilities, revenues and expenses, and the related disclosures. We believe that the following critical accounting policies, among others, affect our more significant judgments and estimates used in the preparation of our consolidated financial statements.
Long-Lived Assets
Expenditures for ordinary maintenance and repairs are expensed to operations as incurred and significant renovations and improvements that improve the asset and extend the useful life of the asset are capitalized over their estimated useful life.
In accordance with the Codification Sub-Topic “Impairment or Disposal of Long Lived Assets” (“FASB ASC 360-10-35”), we periodically evaluate our long-lived assets to be held and used, including our investments in real estate, for impairment indicators. Our judgments regarding the existence of impairment indicators are based on factors such as operational performance, market conditions and legal factors. Future events could occur which would cause us to conclude that impairment indicators exist and an impairment loss is warranted.
Real estate investments are subject to varying degrees of risk. Several factors may adversely affect the economic performance and value of our real estate investments. These factors include:
•
the general economic climate;
•
competition from other housing options;
•
local conditions, such as an increase in unemployment;
•
changes in governmental regulations and the related cost of compliance; and
•
changes in market rental rates.
Any adverse changes in these factors could cause an impairment in our assets, including real estate and investments in unconsolidated joint venture partnerships.
For long-lived assets to be held and used, if an impairment indicator exists, we compare the expected future undiscounted cash flows against the carrying amount of that asset. If the sum of the estimated undiscounted cash flows is less than the carrying amount of the asset, we record an impairment loss for the carrying amount in excess of the estimated fair value, if any, of the asset. For the periods presented, no impairment losses were recorded.
For Properties to be disposed of, an impairment loss is recognized when the fair value of the Property, less the estimated cost to sell, is less than the carrying amount of the Property measured at the time we have made the decision to dispose of the Property, have a commitment to sell the Property and/or are actively marketing the Property for sale. A Property to be disposed of is reported at the lower of its carrying amount or its estimated fair value, less costs to sell. Subsequent to the date that a Property is held for disposition, depreciation expense is not recorded. We account for our Properties held for disposition in accordance with FASB ASC 360-10-35. Accordingly, the results of operations for all assets sold or held for sale are classified as discontinued operations in all periods presented, as applicable.
Revenue Recognition
We account for leases with our customers as operating leases. Rental income is recognized over the term of the respective lease or the length of a customer’s stay, the majority of which are for a term of not greater than
one year
. We evaluate all amounts receivable from customers and an allowance is established for amounts greater than 30 days past due. Our allowance for uncollectible rents receivable was approximately
$4.9 million
and
$4.7 million
as of
December 31, 2013
and
2012
, respectively. We will continue to monitor and assess these receivables and changes in required allowances may occur in the future due to changes in the market environment.
In conjunction with the acquisition of the Thousand Trails business, we decided to account for the entry of right-to-use contracts in accordance with the Codification Topic “Revenue Recognition” (“FASB ASC 605”) based on correspondence with the Office of the Chief Accountant at the SEC. A right-to-use contract gives the customer the right to a set schedule of usage at a specified group of Properties. Customers may choose to upgrade their contracts to increase their usage and the number of Properties
45
they may access. A contract requires the customer to make annual payments during the term of the contract and may require an upfront nonrefundable payment. The stated term of a right-to-use contract is at least
one
year and the customer may renew his contract by continuing to make the annual payments. We will recognize the upfront nonrefundable payments over the estimated customer life which, based on historical attrition rates, we have estimated to be from
one
to
31 years
. For example, we have currently estimated that
7.9%
of customers who enter a new right-to-use contract will terminate their contract after
five years
. Therefore, the upfront nonrefundable payments from
7.9%
of the contracts entered in any particular period are amortized on a straight-line basis over a period of
five years
as
five years
is the estimated customer life for
7.9%
of our customers who enter a contract. The historical attrition rates for upgrade contracts are lower than for new contracts, and therefore, the nonrefundable upfront payments for upgrade contracts are amortized at a different rate than for new contracts.
We continue to monitor customer lives based on historical attrition rates and changes in revenue recognized may occur in the future due to changes in customer behavior.
Right-to-use annual payments by customers under the terms of the right-to-use contracts are deferred and recognized ratably over the
one year
period in which access to Sites at certain Properties are provided.
Notes and Contracts Receivable
Notes receivable generally are stated at their outstanding unpaid principal balances net of any deferred fees or costs on originated loans, unamortized discounts or premiums, and an allowance. Interest income is accrued on the unpaid principal balance. Discounts or premiums are amortized to income using the interest method. In certain cases we finance the sales of homes to our customers (referred to as “Chattel Loans”) which loans are secured by the homes. The valuation of an allowance for doubtful accounts for the Chattel Loans is calculated based on delinquency trends, average annual default rates, loss rates, and the current estimated market value of the underlying manufactured home collateral.
We also provide financing for nonrefundable up-front payments on sales of new or upgrades of right-to-use contracts (“Contracts Receivable”). Based upon historical collection rates and current economic trends, when an up-front payment is financed, a reserve is established for a portion of the Contracts Receivable balance estimated to be uncollectible. The reserve and the rate at which we provide for losses on our Contracts Receivable could be increased or decreased in the future based on our actual collection experience. (See Note 7 in the Notes to Consolidated Financial Statements contained in this Form 10-K.)
Certain of our Contracts Receivable were recorded at fair value at the time of acquisition under the FASB ASC 310-30. The fair value of these Contracts Receivable included an estimate of losses that were expected to be incurred over the estimated life of the Contracts Receivable, and therefore no allowance for losses was recorded for these Contracts Receivable as of the transaction date. Through
December 31, 2013
, the credit performance of these Contracts Receivable has been better than the assumptions used in determining its initial fair value, and we regularly update our expectations regarding the amounts and timing of future cash flows.
Financial instruments that potentially could subject us to significant concentrations of credit risk consist principally of notes receivable. Concentrations of credit risk with respect to notes receivable are limited due to the size of the receivable and geographic diversity of the underlying Properties.
Off Balance Sheet Arrangements
We do not have any off balance sheet arrangements with any unconsolidated investments or joint ventures that we believe have or are reasonably likely to have a material effect on our financial condition, results of operations, liquidity or capital resources.
Inflation
Substantially all of the leases at the Properties allow for monthly or annual rent increases which provide us with the opportunity to achieve increases, where justified by the market, as each lease matures. Such types of leases generally minimize our risks of inflation. In addition, our resort Properties are not generally subject to leases and rents are established for these Sites on an annual basis. Our right-to-use contracts generally provide for an annual dues increase, but dues may be frozen under the terms of certain contracts if the customer is over 61 years old.
46
Funds From Operations
Funds from Operations (“FFO”)
is a non-GAAP financial measure. We believe FFO, as defined by the Board of Governors of the National Association of Real Estate Investment Trusts (“NAREIT”), is generally an appropriate measure of performance for an equity REIT. While FFO is a relevant and widely used measure of operating performance for equity REITs, it does not represent cash flow from operations or net income as defined by GAAP, and it should not be considered as an alternative to these indicators in evaluating liquidity or operating performance.
We define FFO as net income, computed in accordance with GAAP, excluding gains and actual or estimated losses from sales of Properties, plus real estate related depreciation and amortization, impairments, if any, and after adjustments for unconsolidated partnerships and joint ventures. Adjustments for unconsolidated partnerships and joint ventures are calculated to reflect FFO on the same basis. We receive up-front nonrefundable payments from the entry of right-to-use contracts. In accordance with GAAP, the upfront nonrefundable payments and related commissions are deferred and amortized over the estimated customer life. Although the NAREIT definition of FFO does not address the treatment of nonrefundable right-to-use payments, we believe that it is appropriate to adjust for the impact of the deferral activity in our calculation of FFO.
Normalized Funds from Operations (“Normalized FFO”) is a non-GAAP measure. We define Normalized FFO as FFO excluding the following non-operating income and expense items: a) the financial impact of contingent consideration; b) gains and losses from early debt extinguishment, including prepayment penalties and defeasance costs; c) property acquisition and other transaction costs related to mergers and acquisitions; and d) other miscellaneous non-comparable items.
We believe that FFO and Normalized FFO are helpful to investors as supplemental measures of the performance of an equity REIT. We believe that by excluding the effect of depreciation, amortization and actual or estimated gains or losses from sales of real estate, all of which are based on historical costs and which may be of limited relevance in evaluating current performance, FFO can facilitate comparisons of operating performance between periods and among other equity REITs. We further believe that Normalized FFO provides useful information to investors, analysts and our management because it allows them to compare our operating performance to the operating performance of other real estate companies and between periods on a consistent basis without having to account for differences not related to our operations. For example, we believe that excluding the early extinguishment of debt, property acquisition and other transaction costs related to mergers and acquisitions and the change in fair value of our contingent consideration asset from Normalized FFO allows investors, analysts and our management to assess the sustainability of operating performance in future periods because these costs do not affect the future operations of the Properties. In some cases, we provide information about identified non-cash components of FFO and Normalized FFO because it allows investors, analysts and our management to assess the impact of those items.
Investors should review FFO and Normalized FFO along with GAAP net income and cash flow from operating activities, investing activities and financing activities, when evaluating an equity REIT’s operating performance. We compute FFO in accordance with our interpretation of standards established by NAREIT, which may not be comparable to FFO reported by other REITs that do not define the term in accordance with the current NAREIT definition or that interpret the current NAREIT definition differently than we do. Normalized FFO presented herein is not necessarily comparable to normalized FFO presented by other real estate companies due to the fact that not all real estate companies use the same methodology for computing this amount. FFO and Normalized FFO do not represent cash generated from operating activities in accordance with GAAP, nor do they represent cash available to pay distributions and should not be considered as an alternative to net income, determined in accordance with GAAP, as an indication of our financial performance, or to cash flow from operating activities, determined in accordance with GAAP, as a measure of our liquidity, nor is it indicative of funds available to fund our cash needs, including our ability to make cash distributions.
47
The following table presents a calculation of FFO and Normalized FFO for the years ended
December 31, 2013
,
2012
and
2011
(amounts in thousands):
|
2013
|
2012
|
2011
|
|||||||||
|
Computation of funds from operations:
|
|||||||||||
|
Net income available for common shares
|
$
|
106,919
|
|
$
|
54,779
|
|
$
|
22,775
|
|
||
|
Income allocated to common OP Units
|
9,706
|
|
5,067
|
|
3,105
|
|
|||||
|
Series B Redeemable Preferred Stock Dividends
|
—
|
|
—
|
|
466
|
|
|||||
|
Right-to-use contract upfront payments, deferred, net
|
5,694
|
|
6,694
|
|
11,936
|
|
|||||
|
Right-to-use contract commissions, deferred, net
|
(2,410
|
)
|
(3,155
|
)
|
(4,789
|
)
|
|||||
|
Depreciation on real estate assets
|
101,694
|
|
96,530
|
|
78,897
|
|
|||||
|
Depreciation on real estate assets, discontinued operations
|
1,536
|
|
2,832
|
|
1,250
|
|
|||||
|
Depreciation on rental homes
|
6,535
|
|
5,553
|
|
4,116
|
|
|||||
|
Amortization of in-place leases
|
1,940
|
|
39,467
|
|
23,126
|
|
|||||
|
Amortization of in-place leases, discontinued operations
|
—
|
|
5,656
|
|
5,347
|
|
|||||
|
Depreciation on unconsolidated joint ventures
|
960
|
|
1,166
|
|
1,228
|
|
|||||
|
Gain on sale of property, net of tax
|
(41,525
|
)
|
(4,596
|
)
|
—
|
|
|||||
|
FFO available for common shares
|
$
|
191,049
|
|
$
|
209,993
|
|
$
|
147,457
|
|
||
|
Change in fair value of contingent consideration asset
|
1,442
|
|
(462
|
)
|
—
|
|
|||||
|
Transaction costs
|
1,963
|
|
157
|
|
18,493
|
|
|||||
|
Early debt retirement
|
37,844
|
|
—
|
|
—
|
|
|||||
|
Normalized FFO available for common shares
|
$
|
232,298
|
|
$
|
209,688
|
|
$
|
165,950
|
|
||
|
Weighted average common shares outstanding—fully diluted
|
91,196
|
|
90,862
|
|
80,660
|
|
|||||
48
Market risk is the risk of loss from adverse changes in market prices and interest rates. Our earnings, cash flows and fair values relevant to financial instruments are dependent on prevailing market interest rates. The primary market risk we face is long-term indebtedness, which bears interest at fixed and variable rates. The fair value of our long-term debt obligations is affected by changes in market interest rates with scheduled maturities from 2014 to 2038. At
December 31, 2013
, approximately 100% or approximately
$2.0 billion
of our outstanding secured debt had fixed interest rates with scheduled maturities from
2014
to
2038
, which minimizes the market risk until the debt matures. For each increase in interest rates of 1% (or 100 basis points), the fair value of the total outstanding debt would decrease by approximately
$135.3 million
. For each decrease in interest rates of 1% (or 100 basis points), the fair value of the total outstanding debt would increase by approximately
$145.3 million
. If interest rates were to increase or decrease by 1%, there would be no effect on interest expense or cash flows as our outstanding secured debt has fixed interest rates.
As of
December 31, 2013
, none of our outstanding secured debt was short-term. Our
$200.0 million
Term Loan has variable rates based on LIBOR plus
1.85%
to
2.80%
per annum, which we fixed the underlying LIBOR rate at 1.11% per annum for the first three years.
FORWARD-LOOKING STATEMENTS
This report includes certain “forward-looking statements” within the meaning of the Private Securities Litigation Reform Act of 1995. When used, words such as “anticipate,” “expect,” “believe,” “project,” “intend,” “may be” and “will be” and similar words or phrases, or the negative thereof, unless the context requires otherwise, are intended to identify forward-looking statements and may include without limitation, information regarding our expectations, goals or intentions regarding the future, and the expected effect of recent acquisitions on us. These forward-looking statements are subject to numerous assumptions, risks and uncertainties, including, but not limited to:
|
•
|
our ability to control costs, real estate market conditions, the actual rate of decline in customers, the actual use of Sites by customers and our success in acquiring new customers at our Properties (including those that we may acquire);
|
|
•
|
our ability to maintain historical or increase future rental rates and occupancy with respect to Properties currently owned or that we may acquire;
|
|
•
|
our ability to retain and attract customers renewing, upgrading and entering right-to-use contracts;
|
|
•
|
our assumptions about rental and home sales markets;
|
|
•
|
our ability to manage counterparty risk;
|
|
•
|
in the age-qualified Properties, home sales results could be impacted by the ability of potential home buyers to sell their existing residences as well as by financial, credit and capital markets volatility;
|
|
•
|
results from home sales and occupancy will continue to be impacted by local economic conditions, lack of affordable manufactured home financing and competition from alternative housing options including site-built single-family housing;
|
|
•
|
impact of government intervention to stabilize site-built single family housing and not manufactured housing;
|
|
•
|
effective integration of recent acquisitions and our estimates regarding the future performance of recent acquisitions;
|
|
•
|
the completion of transactions in their entirety and future transactions, if any, and timing and effective integration with respect thereto;
|
|
•
|
unanticipated costs or unforeseen liabilities associated with recent acquisitions;
|
|
•
|
ability to obtain financing or refinance existing debt on favorable terms or at all;
|
|
•
|
the effect of interest rates;
|
|
•
|
the dilutive effects of issuing additional securities;
|
|
•
|
the effect of accounting for the entry of contracts with customers representing a right-to-use the Properties under the Codification Topic “
Revenue Recognition;
” and
|
|
•
|
other risks indicated from time to time in our filings with the Securities and Exchange Commission.
|
These forward-looking statements are based on management’s present expectations and beliefs about future events. As with any projection or forecast, these statements are inherently susceptible to uncertainty and changes in circumstances. We are under no obligation to, and expressly disclaim any obligation to, update or alter our forward-looking statements whether as a result of such changes, new information, subsequent events or otherwise.
Item 8.
Financial Statements and Supplementary Data
See Index to Consolidated Financial Statements on page F-1 of this Form 10-K.
None.
49
Evaluation of Disclosure Controls and Procedures
Our management, with the participation of our Chief Executive Officer (principal executive officer) and Chief Financial Officer (principal financial officer), maintain a system of disclosure controls and procedures, designed to provide reasonable assurance that information we are required to disclose in the reports that we file under the Securities Exchange Act of 1934, as amended, is recorded, processed, summarized and reported within the time periods specified in the Securities and Exchange Commission rules and forms. Notwithstanding the foregoing, a control system, no matter how well designed and operated, can provide only reasonable, not absolute, assurance that we will detect or uncover failures to disclose material information otherwise required to be set forth in our periodic reports.
Our management, with the participation of the Chief Executive Officer and the Chief Financial Officer, has evaluated the effectiveness of our disclosure controls and procedures as of
December 31, 2013
. Based on that evaluation as of the end of the period covered by this annual report, our Chief Executive Officer and Chief Financial Officer concluded that our disclosure controls and procedures were effective to give reasonable assurances to the timely collection, evaluation and our disclosure of information that would potentially be subject to disclosure under the Securities Exchange Act of 1934, as amended, and the rules and regulations promulgated thereunder as of
December 31, 2013
.
Changes in Internal Control Over Financial Reporting
There were no material changes in our internal control over financial reporting during the year ended
December 31, 2013
.
Report of Management on Internal Control Over Financial Reporting
Our management is responsible for establishing and maintaining adequate internal control over financial reporting as defined in Rules 13a-15(f) and 15d-15(f) under the Securities Exchange Act of 1934. Our internal control over financial reporting is designed to provide reasonable assurance regarding the reliability of financial reporting and the preparation of financial statements for external purposes in accordance with GAAP.
Because of its inherent limitations, internal control over financial reporting may not prevent or detect misstatements. Also, projections of any evaluation of effectiveness to future periods are subject to the risk that controls may become inadequate because of changes in conditions, or that the degree of compliance with the policies or procedures may deteriorate.
Based on management’s assessment, we maintained, in all material respects, effective internal control over financial reporting as of
December 31, 2013
, using the criteria set forth by the Committee of Sponsoring Organizations of the Treadway Commission in 1992 (COSO) in
"Internal Control-Integrated Framework.”
The effectiveness of our internal control over financial reporting as of
December 31, 2013
has been audited by our independent registered public accounting firm, as stated in their report on Page F-2 of the Consolidated Financial Statements.
None.
50
Items 10 and 11 Directors, Executive Officers and Corporate Governance, and Executive Compensation
The information required by Items 10 and 11 will be contained in the Proxy Statement on Schedule 14A for the
2014
Annual Meeting and is therefore incorporated by reference, and thus Items 10 and 11 have been omitted in accordance with General Instruction G.(3) to Form 10-K.
The information regarding securities authorized for issuance under equity compensation plans required by Item 12 follows:
|
Plan Category
|
Number of securities to
be Issued upon Exercise
of Outstanding Options,
Warrants and Rights
(a)
|
Weighted-average Exercise Price of Outstanding Options, Warrants and Rights
|
Number of Securities Remaining Available for Future Issuance under Equity Compensation Plans (excluding securities reflected in column (a))
|
|||||
|
Equity compensation plans approved by security holders
(1)
|
1,085,600
|
|
21.95
|
|
—
|
|
||
|
Equity compensation plans not approved by security holders
(2)
|
N/A
|
|
N/A
|
|
530,867
|
|
||
|
Total
|
1,085,600
|
|
21.95
|
|
530,867
|
|
||
_________________________________
|
(1)
|
Represents shares of common stock pursuant our Stock Option and Award Plan adopted in December 1992 prior to its expiration.
|
|
(2)
|
Represents shares of common stock under our Employee Stock Purchase Plan, which was adopted by the Board of Directors in July 1997, as amended in May 2006. Under the Employee Stock Purchase Plan, eligible employees make monthly contributions which are used to purchase shares of common stock at a purchase price equal to 85% of the lesser of the closing price of a share of common stock on the first or last trading day of the purchase period. Purchases of common stock under the Employee Stock Purchase Plan are made on the first business day of the next month after the close of the purchase period. Under New York Stock Exchange rules then in effect, stockholder approval was not required for the Employee Stock Purchase Plan because it is a broad-based plan available generally to all employees.
|
The information required by Item 403 of Regulation S-K “Security Ownership of Certain Beneficial Owners and Management” required by Item 12 will be contained in the Proxy Statement on Schedule 14A for the 2013 Annual Meeting and is therefore incorporated by reference, and thus has been omitted in accordance with General Instruction G.(3) to Form 10-K.
Items 13 and 14 Certain Relationships and Related Transactions, and Director Independence, and Principal Accounting Fees and Services
The information required by Item 13 and Item 14 will be contained in the Proxy Statement on Schedule 14A for the
2014
Annual Meeting and is therefore incorporated by reference, and thus Item 13 and 14 has been omitted in accordance with General Instruction G.(3) to Form 10-K.
51
|
1.
|
Financial Statements
|
See Index to Financial Statements and Schedule on page F-1 of this Form 10-K.
|
2.
|
Financial Statement Schedule
|
See Index to Financial Statements and Schedule on page F-1 of this Form 10-K.
|
3.
|
Exhibits:
|
In reviewing the agreements included as exhibits to this Annual Report on Form 10-K, please remember they are included to provide you with information regarding their terms and are not intended to provide any other factual or our disclosure information or the other parties to the agreements. The agreements contain representations and warranties by each of the parties to the applicable agreement. These representations and warranties have been made solely for the benefit of the other parties to the applicable agreement and:
|
•
|
should not in all instances be treated as categorical statements of fact, but rather as a way of allocating the risk to one of the parties if those statements prove to be inaccurate;
|
|
•
|
have been qualified by disclosures that were made to the other party in connection with the negotiation of the applicable agreement, which disclosures are not necessarily reflected in the agreement;
|
|
•
|
may apply standards of materiality in a way that is different from what may be viewed as material to you or other investors; and
|
|
•
|
were made only as of the date of the applicable agreement or such other date or dates as may be specified in the agreement and are subject to more recent developments.
|
Accordingly, these representations and warranties may not describe the actual state of affairs as of the date they were made or at any other time. Additional information about us may be found elsewhere in this Annual Report on Form 10-K and our other public filings, which are available without charge through the SEC’s website at
http://www.sec.gov
.
|
2.1
(k)
|
Purchase and Sale Agreement, dated May 31, 2011, by and among, MHC Operating Limited Partnership, a subsidiary of Equity LifeStyle Properties, Inc., and the entities listed as “Sellers” on the signature page thereto
|
|
2.2
(k)
|
Purchase and Sale Agreement, dated May 31, 2011, by and among MH Financial Services, L.L.C., Hometown America Management, L.L.C., Hometown America Management, L.P., and Hometown America Management Corp., as sellers, and Realty Systems, Inc. and MHC Operating Limited Partnership, collectively, as purchaser
|
|
3.1
(f)
|
Amended and Restated Articles of Incorporation of Equity Lifestyle Properties, Inc. effective May 15, 2007
|
|
3.4
(g)
|
Second Amended and Restated Bylaws effective August 8, 2007
|
|
3.7
(q)
|
Articles Supplementary designating our 6.75% Series C Cumulative Redeemable Perpetual Preferred Stock, liquidation preference $2,500.00 per share, par value $0.01 per share
|
|
3.8
(r)
|
Articles of Amendment of Equity Lifestyle Properties, Inc, effective November 26, 2013
|
|
3.9
(s)
|
Articles Supplementary reclassifying shares of authorized but unissued preferred stock
|
|
3.10
(s)
|
Articles Supplementary for the 6% Series D Cumulative Non-Qualified Preferred Stock of Equity LifeStyle Properties, Inc
|
|
3.11
(s)
|
Articles Supplementary for the 18.75% Series E Cumulative Non-Voting Preferred Stock of Equity LifeStyle Properties, Inc
|
|
3.12
(s)
|
Articles Supplementary for the 6.75% Series F Cumulative Non-Voting Preferred Stock of Equity LifeStyle Properties, Inc
|
|
4.3
(i)
|
Form of Specimen Stock Certificate Evidencing the Common Stock of Equity LifeStyle Properties, Inc., par value $0.01 per share
|
|
4.5
(l)
|
Registration Rights Agreement, entered into by and between Equity LifeStyle Properties, Inc. and Hometown America, L.L.C. dated July 1, 2011
|
52
|
4.6
(o)
|
Form of Depositary Agreement, among us, American Stock Transfer & Trust Company, LLC, as Depositary, and the holders from time to time of the Depositary Shares
|
|
4.7
(q)
|
Specimen Stock Certificate Evidencing our 6.75% Series C Cumulative Redeemable Perpetual Preferred Stock, liquidation preference $2,500.00 per share, par value $0.01 per share
|
|
4.8
(q)
|
Specimen Receipt Evidencing the Depositary Shares
|
|
10.4
(a)
|
Second Amended and Restated MHC Operating Limited Partnership Agreement of Limited Partnership, dated March 15, 1996
|
|
10.5
(d)
|
Amendment to Second Amended and Restated Agreement of Limited Partnership for MHC Operating Limited Partnership, dated February 27, 2004
|
|
10.6
(s)
|
Second Amendment to the Second Amended and Restated Agreement of Limited Partnership for MHC Operating Limited Partnership effective as of December 31, 2013
|
|
10.10
(b)
|
Form of Manufactured Home Communities, Inc. 1997 Non-Qualified Employee Stock Purchase Plan
|
|
10.11
(c)
|
Amended and Restated Manufactured Home Communities, Inc. 1992 Stock Option and Stock Award Plan effective March 23, 2001
|
|
10.33
(e)
|
Amendment of Non-Qualified Employee Stock Purchase Plan dated May 3, 2006
|
|
10.34
(e)
|
Form of Indemnification Agreement
|
|
10.43
(h)
|
Form of Trust Agreement Establishing Howard Walker Deferred Compensation Trust, dated December 8, 2000
|
|
10.46
(j)
|
Amended and Restated Credit Agreement ($380 million Unsecured Revolving Facility) dated May 19, 2011
|
|
10.49
(j)
|
Amended and Restated Guaranty dated May 19, 2011
|
|
10.50
(m)
|
Term Loan Agreement, dated July 1, 2011, by and among us, the Operating Partnership, Wells Fargo Securities, LLC, Bank of America, N.A., Wells Fargo Bank, National Association and each of the financial institutions initially a signatory thereto together with their successors and assignees
|
|
10.51
(m)
|
Guaranty, dated July 1, 2011, by and among us, MHC Trust, MHC T1000 Trust and Wells Fargo Bank, National Association
|
|
10.53
(n)
|
Third Amendment to the Amended and Restated Credit Agreement, dated July 20, 2012, by and among us, MHC Operating Limited Partnership, Wells Fargo Bank, N.A. and each of the Lenders set forth therein
|
|
10.54
(n)
|
Guarantor Acknowledgment, dated July 20, 2012, by and among us, MHC Trust, MHC T1000 Trust, Wells Fargo Bank, N.A. and each of the Lenders set forth therein
|
|
10.55
(p)
|
Equity Distribution Agreement, dated September 6, 2012, by and among us, the Operating Partnership and RBC Capital Markets, LLC
|
|
10.56
(p)
|
Equity Distribution Agreement, dated September 6, 2012, by and among us, the Operating Partnership and RBS Securities Inc.
|
|
10.57
(p)
|
Equity Distribution Agreement, dated September 6, 2012, by and among us, the Operating Partnership and Wells Fargo Securities, LLC
|
|
10.58
(p)
|
Equity Distribution Agreement, dated September 6, 2012, by and among us, the Operating Partnership and Merrill Lynch, Pierce, Fenner & Smith Incorporated
|
|
12
(t)
|
Computation of Ratio of Earnings to Fixed Charges
|
|
14
(e)
|
Equity LifeStyle Properties, Inc. Business Ethics and Conduct Policy, dated July 2006
|
|
21
(t)
|
Subsidiaries of the registrant
|
|
23
(t)
|
Consent of Independent Registered Public Accounting Firm
|
|
24.1
(t)
|
Power of Attorney for Philip C. Calian dated February 19, 2013
|
|
24.2
(t)
|
Power of Attorney for David J. Contis dated February 20, 2013
|
|
24.3
(t)
|
Power of Attorney for Thomas E. Dobrowski dated February 18, 2013
|
|
24.4
(t)
|
Power of Attorney for Thomas P. Heneghan dated February 20, 2013
|
53
|
24.5
(t)
|
Power of Attorney for Sheli Z. Rosenberg dated February 20, 2013
|
|
24.6
(t)
|
Power of Attorney for Howard Walker dated February 20, 2013
|
|
24.7
(t)
|
Power of Attorney for Gary Waterman dated February 18, 2013
|
|
24.8
(t)
|
Power of Attorney for William Young dated February 24, 2013
|
|
24.9
(t)
|
Power of Attorney for Samuel Zell dated February 20, 2013
|
|
31.1
(t)
|
Certification of Chief Financial Officer Pursuant To Section 302 of the Sarbanes-Oxley Act Of 2002
|
|
31.2
(t)
|
Certification of Chief Executive Officer Pursuant To Section 302 of the Sarbanes-Oxley Act Of 2002
|
|
32.1
(t)
|
Certification of Chief Financial Officer Pursuant to 18 U.S.C. Section 1350
|
|
32.2
(t)
|
Certification of Chief Executive Officer Pursuant to 18 U.S.C. Section 1350
|
|
101
|
The following materials from Equity LifeStyle Properties, Inc.’s Annual Report on Form 10-K for the year ended December 31, 2013, formatted in XBRL (Extensible Business Reporting Language): (i) the Consolidated Balance Sheets, (ii) the Consolidated Statements of Income and Comprehensive Income, (iii) the Consolidated Statements of Changes in Equity, (iv) the Consolidated Statements of Cash Flow, and (iv) the Notes to Consolidated Financial Statements.
|
The following documents are incorporated herein by reference.
|
(a)
|
Included as an exhibit to our Report on Form 10-Q for the quarter ended June 30, 1996
|
|
(b)
|
Included as Exhibit A to our definitive Proxy Statement dated March 28, 1997, relating to Annual Meeting of Stockholders held on May 13, 1997
|
|
(c)
|
Included as Appendix A to our Definitive Proxy Statement dated March 30, 2001
|
|
(d)
|
Included as an exhibit to our Report on Form 10-K dated December 31, 2005
|
|
(e)
|
Included as an exhibit to our Report on Form 10-K dated December 31, 2006
|
|
(f)
|
Included as an exhibit to our Report on Form 8-K dated May 18, 2007
|
|
(g)
|
Included as an exhibit to our Report on Form 8-K dated August 8, 2007
|
|
(h)
|
Included as an exhibit to our Report on Form 8-K dated December 8, 2000, filed on September 25, 2008
|
|
(i)
|
Included as an exhibit to our Report on Form S-3 ASR dated May 6, 2009
|
|
(j)
|
Included as an exhibit to our Report on Form 8-K dated May 19, 2011
|
|
(k)
|
Included as an exhibit to our Report on Form 8-K dated May 31, 2011
|
|
(l)
|
Included as an exhibit to our Report on Form 10-Q dated June 30, 2011
|
|
(m)
|
Included as an exhibit to our Report on Form 8-K dated July 1, 2011
|
|
(n)
|
Included as an exhibit to our Report on Form 8-K dated July 20, 2012
|
|
(o)
|
Included as an exhibit to our Schedule TO/13E-3 dated August 23, 2012
|
|
(p)
|
Included as an exhibit to our Report on Form 8-K dated September 6, 2012
|
|
(q)
|
Included as an exhibit to our Form 8-A dated September 14, 2012
|
|
(r)
|
Included as an exhibit to our Report on Form 8-K dated November 25, 2013
|
|
(s)
|
Included as an exhibit to our Report on Form 8-K dated January 2, 2014
|
|
(t)
|
Filed herewith
|
54
SIGNATURES
Pursuant to the requirements of Section 13 or 15(d) of the Securities Exchange Act of 1934, as amended, the Registrant has duly caused this report to be signed on its behalf by the undersigned, thereunto duly authorized.
|
EQUITY LIFESTYLE PROPERTIES, INC.,
a Maryland corporation
|
||||
|
Date:
|
February 24, 2014
|
By:
|
/s/ M
ARGUERITE
N
ADER
|
|
|
Marguerite Nader
|
||||
|
President and Chief Executive Officer
(Principal Executive Officer)
|
||||
|
Date:
|
February 24, 2014
|
By:
|
/s/ P
AUL
S
EAVEY
|
|
|
Paul Seavey
|
||||
|
Executive Vice President, Chief Financial
Officer and Treasurer
|
||||
|
(Principal Financial Officer)
|
||||
|
Date:
|
February 24, 2014
|
By:
|
/s/ J
OHN
L
OS
|
|
|
John Los
|
||||
|
Senior Vice President and
Chief Accounting Officer
|
||||
|
(Principal Accounting Officer)
|
||||
55
Equity LifeStyle Properties, Inc.—Signatures
Pursuant to the requirements of the Securities Exchange Act of 1934, as amended, this report has been signed below by the following persons on behalf of the Registrant and in the capacities and on the dates indicated.
|
Name
|
|
Title
|
|
Date
|
|
/s/ M
ARGUERITE
N
ADER
|
|
President and Chief Executive Officer (Principal Executive Officer) *Attorney in Fact
|
|
February 24, 2014
|
|
Marguerite Nader
|
||||
|
/s/ P
AUL
S
EAVEY
|
|
Executive Vice President, Chief Financial Officer and Treasurer (Principal Financial Officer) *Attorney in Fact
|
|
February 24, 2014
|
|
Paul Seavey
|
||||
|
/s/ J
OHN
L
OS
|
Senior Vice President and Chief Accounting Officer (Principal Accounting Officer)
|
February 24, 2014
|
||
|
John Los
|
||||
|
*S
AMUEL
Z
ELL
|
|
Chairman of the Board
|
|
February 24, 2014
|
|
Samuel Zell
|
||||
|
*H
OWARD
W
ALKER
|
|
Co-Vice-Chairman of the Board
|
|
February 24, 2014
|
|
Howard Walker
|
||||
|
*T
HOMAS
P. H
ENEGHAN
|
|
Co-Vice-Chairman of the Board
|
|
February 24, 2014
|
|
Thomas P. Heneghan
|
||||
|
*P
HILIP
C. C
ALIAN
|
|
Director
|
|
February 24, 2014
|
|
Philip C. Calian
|
||||
|
*D
AVID
J. C
ONTIS
|
|
Director
|
|
February 24, 2014
|
|
David J. Contis
|
||||
|
*T
HOMAS
E. D
OBROWSKI
|
Director
|
February 24, 2014
|
||
|
Thomas E. Dobrowski
|
||||
|
* S
HELI
Z. R
OSENBERG
|
|
Director
|
|
February 24, 2014
|
|
Sheli Z. Rosenberg
|
||||
|
*G
ARY
W
ATERMAN
|
|
Director
|
|
February 24, 2014
|
|
Gary Waterman
|
||||
|
*W
ILLIAM
Y
OUNG
|
|
Director
|
|
February 24, 2014
|
|
William Young
|
||||
56
INDEX TO FINANCIAL STATEMENTS
EQUITY LIFESTYLE PROPERTIES, INC.
|
Page
|
||
|
Report of Independent Registered Public Accounting Firm
|
||
|
Report of Independent Registered Public Accounting Firm
|
||
|
Consolidated Balance Sheets as of December 31, 2013 and 2012
|
||
|
Consolidated Statements of Income and Comprehensive Income for the years ended December 31, 2013, 2012 and 2011
|
||
|
Consolidated Statements of Changes in Equity for the years ended December 31, 2013, 2012 and 2011
|
||
|
Consolidated Statements of Cash Flows for the years ended December 31, 2013, 2012 and 2011
|
||
|
Notes to Consolidated Financial Statements
|
||
|
Schedule III—Real Estate and Accumulated Depreciation
|
||
Note that certain schedules have been omitted, as they are not applicable to us.
F-1
Report of Independent Registered Public Accounting Firm
The Board of Directors and Stockholders of Equity Lifestyle Properties, Inc.
We have audited Equity Lifestyle Properties, Inc.’s (Equity Lifestyle Properties or the Company) internal control over financial reporting as of
December 31, 2013
, based on criteria established in Internal Control—Integrated Framework issued by the Committee of Sponsoring Organizations of the Treadway Commission (1992 framework) (the COSO criteria). Equity Lifestyle Properties’ management is responsible for maintaining effective internal control over financial reporting and for its assessment of the effectiveness of internal control over financial reporting included in the accompanying Item 9A. Our responsibility is to express an opinion on the Company’s internal control over financial reporting based on our audit.
We conducted our audit in accordance with the standards of the Public Company Accounting Oversight Board (United States). Those standards require that we plan and perform the audit to obtain reasonable assurance about whether effective internal control over financial reporting was maintained in all material respects. Our audit included obtaining an understanding of internal control over financial reporting, assessing the risk that a material weakness exists, testing and evaluating the design and operating effectiveness of internal control based on the assessed risk, and performing such other procedures as we considered necessary in the circumstances. We believe that our audit provides a reasonable basis for our opinion.
A company’s internal control over financial reporting is a process designed to provide reasonable assurance regarding the reliability of financial reporting and the preparation of financial statements for external purposes in accordance with generally accepted accounting principles. A company’s internal control over financial reporting includes those policies and procedures that (1) pertain to the maintenance of records that, in reasonable detail, accurately and fairly reflect the transactions and dispositions of the assets of the company; (2) provide reasonable assurance that transactions are recorded as necessary to permit preparation of financial statements in accordance with generally accepted accounting principles, and that receipts and expenditures of the company are being made only in accordance with authorizations of management and directors of the company; and (3) provide reasonable assurance regarding prevention or timely detection of unauthorized acquisition, use, or disposition of the company’s assets that could have a material effect on the financial statements.
Because of its inherent limitations, internal control over financial reporting may not prevent or detect misstatements. Also, projections of any evaluation of effectiveness to future periods are subject to the risk that controls may become inadequate because of changes in conditions, or that the degree of compliance with the policies or procedures may deteriorate.
In our opinion, Equity Lifestyle Properties, Inc., maintained, in all material respects, effective internal control over financial reporting as of
December 31, 2013
, based on the COSO criteria.
We also have audited, in accordance with the standards of the Public Company Accounting Oversight Board (United States), the consolidated balance sheets as of
December 31, 2013
and
2012
, and the related consolidated statements of income and comprehensive income, changes in equity, and cash flows for each of the three years in the period ended
December 31, 2013
, and the financial statement schedule listed in the Index to the financial statements, of Equity Lifestyle Properties, Inc., and our report dated
February 24, 2014
, expressed an unqualified opinion thereon.
/s/ ERNST & YOUNG LLP
ERNST & YOUNG LLP
Chicago, Illinois
February 24, 2014
F-2
Report of Independent Registered Public Accounting Firm
The Board of Directors and Stockholders of Equity Lifestyle Properties, Inc.
We have audited the accompanying consolidated balance sheets of Equity Lifestyle Properties, Inc. (Equity Lifestyle Properties or the Company), as of
December 31, 2013
and
2012
, and the related consolidated statements of income and comprehensive income, changes in equity and cash flows for each of the three years in the period ended
December 31, 2013
. Our audits also included the financial statement schedule listed in the Index to the financial statements. These financial statements and schedule are the responsibility of the Company’s management. Our responsibility is to express an opinion on these financial statements and schedule based on our audits.
We conducted our audits in accordance with the standards of the Public Company Accounting Oversight Board (United States). Those standards require that we plan and perform the audit to obtain reasonable assurance about whether the financial statements are free of material misstatement. An audit includes examining, on a test basis, evidence supporting the amounts and disclosures in the financial statements. An audit also includes assessing the accounting principles used and significant estimates made by management, as well as evaluating the overall financial statement presentation. We believe that our audits provide a reasonable basis for our opinion.
In our opinion, the financial statements referred to above present fairly, in all material respects, the consolidated financial position of Equity Lifestyle Properties at
December 31, 2013
and
2012
, and the consolidated results of its operations and its cash flows for each of the three years in the period ended
December 31, 2013
, in conformity with U.S. generally accepted accounting principles. Also, in our opinion, the related financial statement schedule, when considered in relation to the basic financial statements taken as a whole, presents fairly in all material respects the information set forth therein.
We also have audited, in accordance with the standards of the Public Company Accounting Oversight Board (United States), Equity Lifestyle Properties’ internal control over financial reporting as of
December 31, 2013
, based on criteria established in Internal Control—Integrated Framework issued by the Committee of Sponsoring Organizations of the Treadway Commission (1992 framework) and our report dated
February 24, 2014
expressed an unqualified opinion thereon.
/s/ ERNST & YOUNG LLP
ERNST & YOUNG LLP
Chicago, Illinois
February 24, 2014
F-3
Equity LifeStyle Properties, Inc.
As of
December 31, 2013
and
2012
(amounts in thousands, except for share and per share data (prior period adjusted for stock split))
|
December 31,
2013 |
December 31,
2012 |
||||||
|
Assets
|
|||||||
|
Investment in real estate:
|
|||||||
|
Land
|
$
|
1,025,246
|
|
$
|
984,224
|
|
|
|
Land improvements
|
2,667,213
|
|
2,565,299
|
|
|||
|
Buildings and other depreciable property
|
535,647
|
|
495,127
|
|
|||
|
4,228,106
|
|
4,044,650
|
|
||||
|
Accumulated depreciation
|
(1,058,540
|
)
|
(948,581
|
)
|
|||
|
Net investment in real estate
|
3,169,566
|
|
3,096,069
|
|
|||
|
Cash
|
58,427
|
|
37,126
|
|
|||
|
Notes receivable, net
|
42,990
|
|
45,469
|
|
|||
|
Investment in joint ventures
|
11,583
|
|
8,420
|
|
|||
|
Deferred financing costs, net
|
19,873
|
|
20,620
|
|
|||
|
Deferred commission expense
|
25,251
|
|
22,841
|
|
|||
|
Escrow deposits, goodwill and other assets, net
|
63,949
|
|
47,829
|
|
|||
|
Assets held for disposition
|
—
|
|
119,852
|
|
|||
|
Total Assets
|
$
|
3,391,639
|
|
$
|
3,398,226
|
|
|
|
Liabilities and Equity
|
|||||||
|
Liabilities:
|
|||||||
|
Mortgage notes payable
|
$
|
1,992,368
|
|
$
|
2,061,610
|
|
|
|
Term loan
|
200,000
|
|
200,000
|
|
|||
|
Unsecured lines of credit
|
—
|
|
—
|
|
|||
|
Accrued payroll and other operating expenses
|
65,157
|
|
63,672
|
|
|||
|
Deferred revenue—upfront payments from right-to-use contracts
|
68,673
|
|
62,979
|
|
|||
|
Deferred revenue—right-to-use annual payments
|
11,136
|
|
11,088
|
|
|||
|
Accrued interest payable
|
9,416
|
|
10,500
|
|
|||
|
Rents and other customer payments received in advance and security deposits
|
58,931
|
|
54,017
|
|
|||
|
Distributions payable
|
22,753
|
|
—
|
|
|||
|
Liabilities held for disposition
|
—
|
|
10,058
|
|
|||
|
Total Liabilities
|
2,428,434
|
|
2,473,924
|
|
|||
|
Equity:
|
|||||||
|
Stockholders’ Equity:
|
|||||||
|
Preferred stock, $0.01 par value 9,945,539 shares authorized as of December 31, 2013 and December 31, 2012; none issued and outstanding as of December 31, 2012. As of December 31, 2013, includes 125 shares 6% Series D Cumulative Preferred stock and 250 shares 18.75% Series E Cumulative Preferred stock; both issued and outstanding.
|
—
|
|
—
|
|
|||
|
6.75% Series C Cumulative Redeemable Perpetual Preferred Stock, $0.01 par value, 54,461 shares authorized and 54,458 issued and outstanding as of December 31, 2013 and December 31, 2012 at liquidation value
|
136,144
|
|
136,144
|
|
|||
|
Common stock, $0.01 par value 200,000,000 and 100,000,000 shares authorized as of December 31, 2013 and December 31, 2012, respectively; 83,313,677 and 83,193,310 shares issued and outstanding as of December 31, 2013 and December 31, 2012, respectively
|
834
|
|
832
|
|
|||
|
Paid-in capital
|
1,021,365
|
|
1,012,514
|
|
|||
|
Distributions in excess of accumulated earnings
|
(264,083
|
)
|
(287,652
|
)
|
|||
|
Accumulated other comprehensive loss
|
(927
|
)
|
(2,590
|
)
|
|||
|
Total Stockholders’ Equity
|
893,333
|
|
859,248
|
|
|||
|
Non-controlling interests – Common OP Units
|
69,872
|
|
65,054
|
|
|||
|
Total Equity
|
963,205
|
|
924,302
|
|
|||
|
Total Liabilities and Equity
|
$
|
3,391,639
|
|
$
|
3,398,226
|
|
|
The accompanying notes are an integral part of the financial statements.
F-4
Equity LifeStyle Properties, Inc.
For the Years Ended
December 31, 2013
,
2012
, and
2011
(amounts in thousands, except for share and per share data (prior periods adjusted for stock split))
|
2013
|
2012
|
2011
|
|||||||||
|
Revenues:
|
|||||||||||
|
Community base rental income
|
$
|
409,801
|
|
$
|
394,606
|
|
$
|
309,230
|
|
||
|
Rental home income
|
14,267
|
|
11,649
|
|
7,245
|
|
|||||
|
Resort base rental income
|
147,234
|
|
134,327
|
|
130,489
|
|
|||||
|
Right-to-use annual payments
|
47,967
|
|
47,662
|
|
49,122
|
|
|||||
|
Right-to-use contracts current period, gross
|
13,142
|
|
13,433
|
|
17,856
|
|
|||||
|
Right-to-use contracts, deferred, net of prior period amortization
|
(5,694
|
)
|
(6,694
|
)
|
(11,936
|
)
|
|||||
|
Utility and other income
|
63,800
|
|
62,470
|
|
53,116
|
|
|||||
|
Gross revenues from home sales
|
17,871
|
|
8,230
|
|
6,028
|
|
|||||
|
Brokered resale revenues and ancillary services revenues, net
|
4,212
|
|
3,093
|
|
3,483
|
|
|||||
|
Interest income
|
8,260
|
|
8,135
|
|
5,924
|
|
|||||
|
Income from other investments, net
|
7,515
|
|
6,795
|
|
6,452
|
|
|||||
|
Total revenues
|
728,375
|
|
683,706
|
|
577,009
|
|
|||||
|
Expenses:
|
|||||||||||
|
Property operating and maintenance
|
229,897
|
|
220,415
|
|
197,781
|
|
|||||
|
Rental home operating and maintenance
|
7,474
|
|
6,369
|
|
4,493
|
|
|||||
|
Real estate taxes
|
48,279
|
|
45,590
|
|
36,528
|
|
|||||
|
Sales and marketing, gross
|
12,836
|
|
10,845
|
|
11,218
|
|
|||||
|
Sales and marketing, deferred commissions, net
|
(2,410
|
)
|
(3,155
|
)
|
(4,789
|
)
|
|||||
|
Property management
|
40,193
|
|
37,999
|
|
34,846
|
|
|||||
|
Depreciation on real estate assets and rental homes
|
108,229
|
|
102,083
|
|
83,013
|
|
|||||
|
Amortization of in-place leases
|
1,940
|
|
39,467
|
|
23,126
|
|
|||||
|
Cost of home sales
|
17,296
|
|
9,018
|
|
5,615
|
|
|||||
|
Home selling expenses
|
2,085
|
|
1,391
|
|
1,591
|
|
|||||
|
General and administrative
|
28,211
|
|
26,388
|
|
42,046
|
|
|||||
|
Early debt retirement
|
37,844
|
|
—
|
|
—
|
|
|||||
|
Rent control initiatives and other
|
2,771
|
|
1,456
|
|
2,043
|
|
|||||
|
Interest and related amortization
|
118,522
|
|
123,992
|
|
99,489
|
|
|||||
|
Total expenses
|
653,167
|
|
621,858
|
|
537,000
|
|
|||||
|
Income from continuing operations before equity in income of unconsolidated joint ventures
|
75,208
|
|
61,848
|
|
40,009
|
|
|||||
|
Equity in income of unconsolidated joint ventures
|
2,039
|
|
1,899
|
|
1,948
|
|
|||||
|
Consolidated income from continuing operations
|
77,247
|
|
63,747
|
|
41,957
|
|
|||||
|
Discontinued Operations:
|
|||||||||||
|
Income from discontinued operations before gain on sale of property
|
7,133
|
|
6,116
|
|
547
|
|
|||||
|
Gain on sale of property, net of tax
|
41,525
|
|
4,596
|
|
—
|
|
|||||
|
Consolidated income from discontinued operations
|
48,658
|
|
10,712
|
|
547
|
|
|||||
|
Consolidated net income
|
125,905
|
|
74,459
|
|
42,504
|
|
|||||
|
Income allocated to non-controlling interests – Common OP Units
|
(9,706
|
)
|
(5,067
|
)
|
(3,105
|
)
|
|||||
|
Income allocated to non-controlling interests – Perpetual Preferred OP Units
|
—
|
|
—
|
|
(2,801
|
)
|
|||||
|
Series A Redeemable Perpetual Preferred Stock Dividends
|
—
|
|
(11,704
|
)
|
(13,357
|
)
|
|||||
|
Series B Redeemable Preferred Stock Dividends
|
—
|
|
—
|
|
(466
|
)
|
|||||
|
Series C Redeemable Perpetual Preferred Stock Dividends
|
(9,280
|
)
|
(2,909
|
)
|
—
|
|
|||||
|
Net income available for Common Shares
|
$
|
106,919
|
|
$
|
54,779
|
|
$
|
22,775
|
|
||
|
Consolidated net income
|
$
|
125,905
|
|
$
|
74,459
|
|
$
|
42,504
|
|
||
|
Other comprehensive income (loss) (“OCI”):
|
|||||||||||
|
Adjustment for fair market value of swap
|
1,663
|
|
(43
|
)
|
(2,547
|
)
|
|||||
|
Consolidated comprehensive income
|
127,568
|
|
74,416
|
|
39,957
|
|
|||||
|
Comprehensive income allocated to non-controlling interests – Common OP Units
|
(9,845
|
)
|
(5,061
|
)
|
(2,866
|
)
|
|||||
|
Comprehensive income allocated to non-controlling interests – Perpetual Preferred OP Units
|
—
|
|
—
|
|
(2,801
|
)
|
|||||
|
Series A Redeemable Perpetual Preferred Stock Dividends
|
—
|
|
(11,704
|
)
|
(13,357
|
)
|
|||||
|
Series B Redeemable Preferred Stock Dividends
|
—
|
|
—
|
|
(466
|
)
|
|||||
|
Series C Redeemable Perpetual Preferred Stock Dividends
|
(9,280
|
)
|
(2,909
|
)
|
—
|
|
|||||
|
Comprehensive income attributable to Common Stockholders
|
$
|
108,443
|
|
$
|
54,742
|
|
$
|
20,467
|
|
||
The accompanying notes are an integral part of the financial statements.
F-5
Equity LifeStyle Properties, Inc.
Consolidated Statements of Income and Comprehensive Income
For the Years Ended
December 31, 2013
,
2012
, and
2011
(amounts in thousands, except for share and per share data (prior periods adjusted for stock split))
|
2013
|
2012
|
2011
|
|||||||||
|
Earnings per Common Share – Basic:
|
|||||||||||
|
Income from continuing operations
|
$
|
0.75
|
|
$
|
0.55
|
|
$
|
0.31
|
|
||
|
Income from discontinued operations
|
$
|
0.54
|
|
$
|
0.12
|
|
$
|
0.01
|
|
||
|
Net income available for Common Shares
|
$
|
1.29
|
|
$
|
0.67
|
|
$
|
0.32
|
|
||
|
Earnings per Common Share – Fully Diluted:
|
|||||||||||
|
Income from continuing operations
|
$
|
0.75
|
|
$
|
0.54
|
|
$
|
0.31
|
|
||
|
Income from discontinued operations
|
$
|
0.53
|
|
$
|
0.12
|
|
$
|
0.01
|
|
||
|
Net income available for Common Shares
|
$
|
1.28
|
|
$
|
0.66
|
|
$
|
0.32
|
|
||
|
Weighted average Common Shares outstanding – basic
|
83,018
|
|
82,348
|
|
71,182
|
|
|||||
|
Weighted average Common Shares outstanding – fully diluted
|
91,196
|
|
90,862
|
|
80,660
|
|
|||||
The accompanying notes are an integral part of the financial statements.
F-6
Equity LifeStyle Properties, Inc.
Consolidated Statements of Changes In Equity
For the Years Ended
December 31, 2013
,
2012
, and
2011
(amounts in thousands (prior periods adjusted for stock split))
|
Common
Stock
|
Paid-in
Capital
|
8.034% Series A
Cumulative
Redeemable
Perpetual
Preferred Stock
|
Series B Preferred Stock
|
6.75% Series C Cumulative
Redeemable
Perpetual
Preferred Stock
|
Distributions
in Excess of
Accumulated
Earnings
|
Non-
controlling
interests –
Common OP
Units
|
Accumulated
Other
Comprehensive
Loss
|
Total
Equity
|
|||||||||||||||||||||||||||
|
Balance, December 31, 2010
|
$
|
726
|
|
$
|
463,306
|
|
$
|
—
|
|
$
|
—
|
|
$
|
—
|
|
$
|
(237,002
|
)
|
$
|
33,128
|
|
$
|
—
|
|
$
|
260,158
|
|
||||||||
|
Conversion of OP Units to common stock
|
4
|
|
4,063
|
|
—
|
|
—
|
|
—
|
|
—
|
|
(4,067
|
)
|
—
|
|
—
|
|
|||||||||||||||||
|
Issuance of common stock through exercise of options
|
4
|
|
4,567
|
|
—
|
|
—
|
|
—
|
|
—
|
|
—
|
|
—
|
|
4,571
|
|
|||||||||||||||||
|
Issuance of common stock through employee stock purchase plan
|
—
|
|
913
|
|
—
|
|
—
|
|
—
|
|
—
|
|
—
|
|
—
|
|
913
|
|
|||||||||||||||||
|
Compensation expenses related to stock options and restricted stock
|
—
|
|
5,762
|
|
—
|
|
—
|
|
—
|
|
—
|
|
—
|
|
—
|
|
5,762
|
|
|||||||||||||||||
|
Repurchase of common stock or Common OP Units
|
—
|
|
(1,682
|
)
|
—
|
|
—
|
|
—
|
|
—
|
|
—
|
|
—
|
|
(1,682
|
)
|
|||||||||||||||||
|
Adjustment for Common OP Unitholders in the Operating Partnership
|
—
|
|
(47,100
|
)
|
—
|
|
—
|
|
—
|
|
—
|
|
47,100
|
|
—
|
|
—
|
|
|||||||||||||||||
|
Common stock offering
|
60
|
|
343,989
|
|
—
|
|
—
|
|
—
|
|
—
|
|
—
|
|
—
|
|
344,049
|
|
|||||||||||||||||
|
Stock issued for Acquisition
|
17
|
|
110,478
|
|
—
|
|
113,788
|
|
—
|
|
—
|
|
—
|
|
—
|
|
224,283
|
|
|||||||||||||||||
|
Adjustment for fair market value of swap
|
—
|
|
—
|
|
—
|
|
—
|
|
—
|
|
—
|
|
—
|
|
(2,547
|
)
|
(2,547
|
)
|
|||||||||||||||||
|
Redemption of Series B Preferred Stock for Common stock
|
17
|
|
113,771
|
|
—
|
|
(113,788
|
)
|
—
|
|
—
|
|
—
|
|
—
|
|
—
|
|
|||||||||||||||||
|
Net income available for Common Shares
|
—
|
|
—
|
|
—
|
|
466
|
|
—
|
|
22,775
|
|
3,105
|
|
—
|
|
26,346
|
|
|||||||||||||||||
|
Distributions
|
—
|
|
—
|
|
—
|
|
(466
|
)
|
—
|
|
(55,794
|
)
|
(6,313
|
)
|
—
|
|
(62,573
|
)
|
|||||||||||||||||
|
Balance, December 31, 2011
|
828
|
|
998,067
|
|
—
|
|
—
|
|
—
|
|
(270,021
|
)
|
72,953
|
|
(2,547
|
)
|
799,280
|
|
|||||||||||||||||
|
Conversion of OP Units to common stock
|
3
|
|
6,717
|
|
—
|
|
—
|
|
—
|
|
—
|
|
(6,720
|
)
|
—
|
|
—
|
|
|||||||||||||||||
|
Issuance of common stock through exercise of options
|
1
|
|
3,855
|
|
—
|
|
—
|
|
—
|
|
—
|
|
—
|
|
—
|
|
3,856
|
|
|||||||||||||||||
|
Issuance of common stock through employee stock purchase plan
|
—
|
|
1,076
|
|
—
|
|
—
|
|
—
|
|
—
|
|
—
|
|
—
|
|
1,076
|
|
|||||||||||||||||
|
Compensation expenses related to stock options and restricted stock
|
—
|
|
5,797
|
|
—
|
|
—
|
|
—
|
|
—
|
|
—
|
|
—
|
|
5,797
|
|
|||||||||||||||||
|
Repurchase of common stock or Common OP Units
|
—
|
|
(1,287
|
)
|
—
|
|
—
|
|
—
|
|
—
|
|
—
|
|
—
|
|
(1,287
|
)
|
|||||||||||||||||
|
Adjustment for Common OP Unitholders in the Operating Partnership
|
—
|
|
(450
|
)
|
—
|
|
—
|
|
—
|
|
—
|
|
450
|
|
—
|
|
—
|
|
|||||||||||||||||
|
Shelf registration costs
|
—
|
|
(504
|
)
|
—
|
|
—
|
|
—
|
|
—
|
|
—
|
|
—
|
|
(504
|
)
|
|||||||||||||||||
|
Adjustment for fair market value of swap
|
—
|
|
—
|
|
—
|
|
—
|
|
—
|
|
—
|
|
—
|
|
(43
|
)
|
(43
|
)
|
|||||||||||||||||
|
Preferred Stock Offering Costs
|
—
|
|
(757
|
)
|
—
|
|
—
|
|
—
|
|
—
|
|
—
|
|
—
|
|
(757
|
)
|
|||||||||||||||||
|
Reclassification of Series A Preferred Stock
|
—
|
|
—
|
|
200,000
|
|
—
|
|
—
|
|
—
|
|
—
|
|
—
|
|
200,000
|
|
|||||||||||||||||
|
Net income available for Common Shares
|
—
|
|
—
|
|
—
|
|
—
|
|
—
|
|
54,779
|
|
5,067
|
|
—
|
|
59,846
|
|
|||||||||||||||||
|
Distributions
|
—
|
|
—
|
|
—
|
|
—
|
|
—
|
|
(72,410
|
)
|
(6,696
|
)
|
—
|
|
(79,106
|
)
|
|||||||||||||||||
|
Exchange of Preferred Stock
|
—
|
|
—
|
|
(136,144
|
)
|
—
|
|
136,144
|
|
—
|
|
—
|
|
—
|
|
—
|
|
|||||||||||||||||
|
Redemption of Preferred Stock
|
—
|
|
—
|
|
(63,856
|
)
|
—
|
|
—
|
|
—
|
|
—
|
|
—
|
|
(63,856
|
)
|
|||||||||||||||||
|
Balance, December 31, 2012
|
832
|
|
1,012,514
|
|
—
|
|
—
|
|
136,144
|
|
(287,652
|
)
|
65,054
|
|
(2,590
|
)
|
924,302
|
|
|||||||||||||||||
The accompanying notes are an integral part of the financial statements.
F-7
Equity LifeStyle Properties, Inc.
Consolidated Statements of Changes In Equity
For the Years Ended
December 31, 2013
,
2012
, and
2011
(amounts in thousands (prior periods adjusted for stock split))
|
Common
Stock
|
Paid-in
Capital
|
8.034% Series A
Cumulative
Redeemable
Perpetual
Preferred Stock
|
Series B Preferred Stock
|
6.75% Series C Cumulative
Redeemable
Perpetual
Preferred Stock
|
Distributions
in Excess of
Accumulated
Earnings
|
Non-
controlling
interests –
Common OP
Units
|
Accumulated
Other
Comprehensive
Loss
|
Total
Equity
|
|||||||||||||||||||||||||||
|
Balance, December 31, 2012
|
832
|
|
1,012,514
|
|
—
|
|
—
|
|
136,144
|
|
(287,652
|
)
|
65,054
|
|
(2,590
|
)
|
924,302
|
|
|||||||||||||||||
|
Conversion of OP Units to common stock
|
—
|
|
280
|
|
—
|
|
—
|
|
—
|
|
—
|
|
(280
|
)
|
—
|
|
—
|
|
|||||||||||||||||
|
Issuance of common stock through exercise of options
|
1
|
|
247
|
|
—
|
|
—
|
|
—
|
|
—
|
|
—
|
|
—
|
|
248
|
|
|||||||||||||||||
|
Issuance of common stock through employee stock purchase plan
|
1
|
|
719
|
|
—
|
|
—
|
|
—
|
|
—
|
|
—
|
|
—
|
|
720
|
|
|||||||||||||||||
|
Compensation expenses related to stock options and restricted stock
|
—
|
|
5,952
|
|
—
|
|
—
|
|
—
|
|
—
|
|
—
|
|
—
|
|
5,952
|
|
|||||||||||||||||
|
Repurchase of common stock or Common OP Units
|
—
|
|
(1,121
|
)
|
—
|
|
—
|
|
—
|
|
—
|
|
—
|
|
—
|
|
(1,121
|
)
|
|||||||||||||||||
|
Adjustment for Common OP Unitholders in the Operating Partnership
|
—
|
|
6,730
|
|
—
|
|
—
|
|
—
|
|
—
|
|
(6,730
|
)
|
—
|
|
—
|
|
|||||||||||||||||
|
Adjustment for fair market value of swap
|
—
|
|
—
|
|
—
|
|
—
|
|
—
|
|
—
|
|
—
|
|
1,663
|
|
1,663
|
|
|||||||||||||||||
|
Release of common shares from escrow
|
—
|
|
(3,412
|
)
|
—
|
|
—
|
|
—
|
|
—
|
|
—
|
|
—
|
|
(3,412
|
)
|
|||||||||||||||||
|
Net income
|
—
|
|
—
|
|
—
|
|
—
|
|
9,280
|
|
106,919
|
|
9,706
|
|
—
|
|
125,905
|
|
|||||||||||||||||
|
Distributions
|
—
|
|
—
|
|
—
|
|
—
|
|
(9,280
|
)
|
(83,350
|
)
|
(7,564
|
)
|
—
|
|
(100,194
|
)
|
|||||||||||||||||
|
Issuance of OP units
|
—
|
|
—
|
|
—
|
|
—
|
|
—
|
|
—
|
|
9,686
|
|
—
|
|
9,686
|
|
|||||||||||||||||
|
Other
|
—
|
|
(544
|
)
|
—
|
|
—
|
|
—
|
|
—
|
|
—
|
|
—
|
|
(544
|
)
|
|||||||||||||||||
|
Balance, December 31, 2013
|
$
|
834
|
|
$
|
1,021,365
|
|
$
|
—
|
|
$
|
—
|
|
$
|
136,144
|
|
$
|
(264,083
|
)
|
$
|
69,872
|
|
$
|
(927
|
)
|
$
|
963,205
|
|
||||||||
The accompanying notes are an integral part of the financial statements.
F-8
Equity LifeStyle Properties, Inc.
For the Years Ended
December 31, 2013
,
2012
, and
2011
(amounts in thousands)
|
2013
|
2012
|
2011
|
|||||||||
|
Cash Flows From Operating Activities:
|
|||||||||||
|
Consolidated net income
|
$
|
125,905
|
|
$
|
74,459
|
|
$
|
42,504
|
|
||
|
Adjustments to reconcile consolidated net income to net cash provided by operating activities:
|
|||||||||||
|
Gain on sale of property, net of tax
|
(41,525
|
)
|
(4,596
|
)
|
—
|
|
|||||
|
Early debt retirement
|
37,844
|
|
—
|
|
—
|
|
|||||
|
Depreciation expense
|
110,505
|
|
105,578
|
|
85,235
|
|
|||||
|
Amortization of in-place leases
|
1,940
|
|
45,122
|
|
28,479
|
|
|||||
|
Amortization of loan costs
|
5,304
|
|
5,754
|
|
5,305
|
|
|||||
|
Debt premium amortization
|
(6,842
|
)
|
(6,764
|
)
|
(1,817
|
)
|
|||||
|
Equity in income of unconsolidated joint ventures
|
(2,039
|
)
|
(1,899
|
)
|
(1,948
|
)
|
|||||
|
Distributions from unconsolidated joint ventures
|
1,311
|
|
1,839
|
|
1,841
|
|
|||||
|
Amortization of stock-related compensation
|
5,952
|
|
5,797
|
|
5,762
|
|
|||||
|
Revenue recognized from right-to-use contract upfront payments
|
(7,448
|
)
|
(6,739
|
)
|
(5,920
|
)
|
|||||
|
Commission expense recognized related to right-to-use contracts
|
2,601
|
|
2,310
|
|
1,946
|
|
|||||
|
Long term incentive plan compensation
|
1,907
|
|
782
|
|
1,813
|
|
|||||
|
Provision for uncollectible rents receivable
|
230
|
|
3,243
|
|
3,569
|
|
|||||
|
Changes in assets and liabilities:
|
|||||||||||
|
Notes receivable activity, net
|
(123
|
)
|
409
|
|
477
|
|
|||||
|
Deferred commission expense
|
(5,011
|
)
|
(5,465
|
)
|
(6,735
|
)
|
|||||
|
Escrow deposits, goodwill and other assets
|
7,454
|
|
5,979
|
|
(10,393
|
)
|
|||||
|
Accrued payroll and other operating expenses
|
83
|
|
(3,041
|
)
|
6,736
|
|
|||||
|
Deferred revenue – upfront payments from right-to-use contracts
|
13,142
|
|
13,433
|
|
17,856
|
|
|||||
|
Deferred revenue – right-to-use annual payments
|
48
|
|
(789
|
)
|
(765
|
)
|
|||||
|
Rents received in advance and security deposits
|
4,111
|
|
1,033
|
|
1,696
|
|
|||||
|
Net cash provided by operating activities
|
255,349
|
|
236,445
|
|
175,641
|
|
|||||
|
Cash Flows From Investing Activities:
|
|||||||||||
|
Real estate acquisition
|
(117,707
|
)
|
(24,213
|
)
|
(651,089
|
)
|
|||||
|
Notes receivable acquisition
|
—
|
|
—
|
|
(40,362
|
)
|
|||||
|
Proceeds from disposition of rental properties and other
|
157,975
|
|
7,564
|
|
252
|
|
|||||
|
Net tax-deferred exchange deposit
|
(11,976
|
)
|
—
|
|
—
|
|
|||||
|
Investment in joint ventures
|
(2,641
|
)
|
—
|
|
—
|
|
|||||
|
Proceeds from short-term investments
|
—
|
|
—
|
|
52,266
|
|
|||||
|
Repayments of notes receivable
|
11,552
|
|
11,071
|
|
5,004
|
|
|||||
|
Issuance of notes receivable
|
(10,343
|
)
|
(5,727
|
)
|
(5,887
|
)
|
|||||
|
Capital improvements
|
(64,714
|
)
|
(75,260
|
)
|
(62,032
|
)
|
|||||
|
Net cash used in investing activities
|
(37,854
|
)
|
(86,565
|
)
|
(701,848
|
)
|
|||||
|
Cash Flows From Financing Activities:
|
|||||||||||
|
Net proceeds from stock options and employee stock purchase plan
|
968
|
|
4,932
|
|
5,484
|
|
|||||
|
Net proceeds from issuance of Common Stock
|
—
|
|
—
|
|
344,049
|
|
|||||
|
Distributions:
|
|||||||||||
|
Common Stockholders
|
(62,547
|
)
|
(89,489
|
)
|
(49,483
|
)
|
|||||
|
Common OP Unitholders
|
(5,647
|
)
|
(6,696
|
)
|
(6,313
|
)
|
|||||
|
Perpetual Preferred OP Unitholders
|
—
|
|
—
|
|
(2,801
|
)
|
|||||
|
Preferred Stockholders
|
(9,280
|
)
|
(14,613
|
)
|
(13,823
|
)
|
|||||
|
Stock repurchase and Unit redemption
|
(1,121
|
)
|
(1,287
|
)
|
(1,682
|
)
|
|||||
|
Lines of credit proceeds
|
20,000
|
|
—
|
|
50,000
|
|
|||||
|
Lines of credit repayments
|
(20,000
|
)
|
—
|
|
(50,000
|
)
|
|||||
|
Principal payments and mortgage debt payoff
|
(450,492
|
)
|
(167,552
|
)
|
(75,658
|
)
|
|||||
|
New mortgage notes payable financing proceeds
|
375,500
|
|
159,500
|
|
200,000
|
|
|||||
|
Term loan financing proceeds
|
—
|
|
—
|
|
200,000
|
|
|||||
|
Non-controlling interest proceeds
|
—
|
|
170
|
|
—
|
|
|||||
|
Redemption of preferred stock
|
—
|
|
(63,856
|
)
|
—
|
|
|||||
|
Equity issuance costs
|
(544
|
)
|
(1,261
|
)
|
—
|
|
|||||
|
Debt issuance costs
|
(43,031
|
)
|
(3,062
|
)
|
(15,765
|
)
|
|||||
|
Net cash (used in) provided by financing activities
|
(196,194
|
)
|
(183,214
|
)
|
584,008
|
|
|||||
|
Net increase (decrease) in cash and cash equivalents
|
21,301
|
|
(33,334
|
)
|
57,801
|
|
|||||
|
Cash, beginning of period
|
37,126
|
|
70,460
|
|
12,659
|
|
|||||
|
Cash, end of period
|
$
|
58,427
|
|
$
|
37,126
|
|
$
|
70,460
|
|
||
The accompanying notes are an integral part of the financial statements.
F-9
Equity LifeStyle Properties, Inc.
Consolidated Statements of Cash Flows
For the Years Ended
December 31, 2013
,
2012
, and
2011
(amounts in thousands)
|
2013
|
2012
|
2011
|
|||||||||
|
Supplemental Information:
|
|||||||||||
|
Cash paid during the period for interest
|
$
|
120,497
|
|
$
|
125,121
|
|
$
|
96,261
|
|
||
|
Non-cash activities (increase/(decrease)):
|
|||||||||||
|
Manufactured homes acquired with dealer financing
|
$
|
—
|
|
$
|
—
|
|
$
|
830
|
|
||
|
Dealer financing
|
$
|
—
|
|
$
|
—
|
|
$
|
830
|
|
||
|
Capital improvements – used homes acquired by repossessions
|
$
|
2,591
|
|
$
|
5,313
|
|
$
|
2,685
|
|
||
|
Net repayments of notes receivable – used homes acquired by repossessions
|
$
|
(2,591
|
)
|
$
|
(5,313
|
)
|
$
|
(2,685
|
)
|
||
|
Building and other depreciable property – reclassification of rental homes
|
$
|
14,401
|
|
$
|
4,127
|
|
$
|
2,371
|
|
||
|
Escrow deposits and other assets – reclassification of rental homes
|
$
|
(14,401
|
)
|
$
|
(4,127
|
)
|
$
|
(2,371
|
)
|
||
|
Series A Cumulative Redeemable Perpetual Preferred Stock
|
$
|
—
|
|
$
|
—
|
|
$
|
200,000
|
|
||
|
Perpetual Preferred OP Units conversion
|
$
|
—
|
|
$
|
—
|
|
$
|
(200,000
|
)
|
||
|
Series A Cumulative Redeemable Perpetual Preferred Stock Exchange
|
$
|
—
|
|
$
|
(136,144
|
)
|
$
|
—
|
|
||
|
Series C Cumulative Redeemable Perpetual Preferred Stock Exchange
|
$
|
—
|
|
$
|
136,144
|
|
$
|
—
|
|
||
|
Acquisitions:
|
|||||||||||
|
Investment in real estate
|
$
|
133,344
|
|
$
|
18,738
|
|
$
|
1,431,339
|
|
||
|
Deferred financing costs, net
|
$
|
(59
|
)
|
$
|
—
|
|
$
|
—
|
|
||
|
Common Stock issued
|
$
|
—
|
|
$
|
—
|
|
$
|
110,495
|
|
||
|
Series B Subordinated Non-Voting Cumulative Redeemable Preferred Stock Issued
|
$
|
—
|
|
$
|
—
|
|
$
|
113,788
|
|
||
|
Accrued interest payable
|
$
|
—
|
|
$
|
—
|
|
$
|
114
|
|
||
|
Rents and other customer receivables
|
$
|
—
|
|
$
|
29
|
|
$
|
—
|
|
||
|
Rents and other customer payments received in advance and security deposits
|
$
|
1,017
|
|
$
|
440
|
|
$
|
4,800
|
|
||
|
Accrued payroll and other operating expenses
|
$
|
712
|
|
$
|
376
|
|
$
|
2,643
|
|
||
|
Escrow deposits and other assets
|
$
|
(1,100
|
)
|
$
|
6,774
|
|
$
|
—
|
|
||
|
Debt assumed and financed on acquisition
|
$
|
5,382
|
|
$
|
—
|
|
$
|
548,410
|
|
||
|
Non-controlling interest - Common OP Units
|
$
|
9,686
|
|
$
|
—
|
|
$
|
—
|
|
||
|
Dispositions:
|
|||||||||||
|
Other, net
|
$
|
(2,166
|
)
|
$
|
—
|
|
$
|
252
|
|
||
|
Notes receivable, net
|
$
|
6,507
|
|
$
|
—
|
|
$
|
—
|
|
||
|
Investment in real estate
|
$
|
153,636
|
|
$
|
(2,968
|
)
|
$
|
—
|
|
||
The accompanying notes are an integral part of the financial statements.
F-10
Equity LifeStyle Properties, Inc.
Notes to Consolidated Financial Statements
Equity LifeStyle Properties, Inc. (“ELS”), a Maryland corporation, together with MHC Operating Limited Partnership (the “Operating Partnership”) and other consolidated subsidiaries (the “Subsidiaries”), is referred to herein as “we,” “us,” and “our.” We are a fully integrated owner and operator of lifestyle-oriented properties (“Properties”). We lease individual developed areas (“Sites”) with access to utilities for placement of factory built homes, cottages, cabins or recreational vehicles (“RVs”). Properties are designed and improved for several home options of various sizes and designs that are produced off-site, installed and set on designated Sites (“Site Set”) within the Properties. At certain Properties, we provide access to our Sites through right-to-use or membership contracts. We believe that we have qualified for taxation as a real estate investment trust (“REIT”) for U.S. federal income tax purposes since our taxable year ended December 31, 1993. We plan to continue to meet the requirements for taxation as a REIT. Many of these requirements, however, are highly technical and complex. For example, to qualify as a REIT, at least
95%
of our gross income must come from sources that are itemized in the REIT tax laws. We must meet a number of organizational requirements, including a requirement to distribute to stockholders at least
90%
of our REIT taxable income computed without regard to our deduction for dividends paid and our net capital gain.
If we fail to qualify as a REIT, we would be subject to U.S. federal income tax at regular corporate rates. Also, unless the IRS granted us relief under certain statutory provisions, we would remain disqualified as a REIT for four years following the year we first failed to qualify. Even if we qualify for taxation as a REIT, we are subject to certain foreign, state and local taxes on our income and property and U.S. federal income and excise taxes on our undistributed income.
Our operations are conducted primarily through the Operating Partnership. We contributed the proceeds from our initial public offering and subsequent offerings to the Operating Partnership for a general partnership interest. In 2004, the general partnership interest was contributed to MHC Trust, a private REIT subsidiary we own. As of December 31, 2013, MHC Trust was merged into ELS resulting in the general partnership interest of the Operating Partnership being directly held by ELS. In connection with the merger, we issued
125
of
6%
Series D Cumulative Non-Qualified Preferred Stock (the “Series D Preferred Stock”) and
250
shares of
18.75%
Series E Cumulative Non-Voting Preferred Stock (the “Series E Preferred Stock”) in exchange for similar preferred stock held by stockholders of MHC Trust. The financial results of the Operating Partnership and the Subsidiaries are consolidated in our consolidated financial statements. In addition, since certain activities, if performed by us, may cause us to earn income which is not qualifying for the REIT gross income tests, we have formed taxable REIT Subsidiaries, as defined in the Internal Revenue Code of 1986, as amended (the “Code”), to engage in such activities.
We intend to treat the merger of MHC Trust into ELS for U.S. federal income tax purposes as a tax-deferred liquidation of MHC Trust under Section 332 of the Code.
Several Properties are wholly owned by Realty Systems, Inc. (“RSI”), one of our taxable REIT Subsidiaries. In addition, RSI is engaged in the business of purchasing and selling or leasing Site Set homes that are located in Properties we own and manage. RSI also provides brokerage services to residents at such Properties for those residents who move from a Property but do not relocate their homes. RSI may provide brokerage services, in competition with other local brokers, by seeking buyers for the Site Set homes. Subsidiaries of RSI also operate ancillary activities at certain Properties consisting of operations such as golf courses, pro shops, stores and restaurants.
The limited partners of the Operating Partnership (the “Common OP Unitholders”) receive an allocation of net income that is based on their respective ownership percentage of the Operating Partnership that is shown on the Consolidated Financial Statements as Non-controlling interests—Common OP Units. As of
December 31, 2013
, the Non-Controlling Interests—Common OP Units represented
7,667,723
units of limited partnership interest (“OP Units”) which are convertible into an equivalent number of shares of our common stock. The issuance of additional shares of common stock or Common OP Units changes the respective ownership of the Operating Partnership for the Non-controlling interests—Common OP Units.
On July 15, 2013, we effected a two-for-one stock split of our common stock (see Note 3 in the Notes to Consolidated Financial Statements contained in this Form 10-K). All common stock and Common Operating Partnership Unit share and per share data in the accompanying Consolidated Financial Statements and notes have been adjusted retroactively to reflect the stock split.
F-11
Equity LifeStyle Properties, Inc.
Notes to Consolidated Financial Statements
We follow accounting standards set by the Financial Accounting Standards Board, commonly referred to as the “FASB.” The FASB sets Generally Accepted Accounting Principles (“GAAP”), which we follow to ensure that we consistently report our financial condition, results of operations and cash flows. References to GAAP in the United States issued by the FASB in these footnotes are to the FASB Accounting Standards Codification (the “Codification”).
|
(a)
|
Basis of Consolidation
|
We consolidate our majority-owned Subsidiaries in which we have the ability to control the operations of our Subsidiaries and all variable interest entities with respect to which we are the primary beneficiary. We also consolidate entities in which we have a controlling direct or indirect voting interest. All inter-company transactions have been eliminated in consolidation. For business combinations, the purchase price of Properties is accounted for in accordance with the Codification Topic “Business Combinations” (“FASB ASC 805”).
We have applied the Codification Sub-Topic “Variable Interest Entities” (“FASB ASC 810-10-15”). The objective of FASB ASC 810-10-15 is to provide guidance on how to identify a variable interest entity (“VIE”) and determine when the assets, liabilities, non-controlling interests, and results of operations of a VIE need to be included in a company’s consolidated financial statements. We have also applied the Codification Sub-Topic “Control of Partnerships and Similar Entities” (“FASB ASC 810-20”), which determines whether a general partner or the general partners as a group controls a limited partnership or similar entity and therefore should consolidate the entity. The Codification Sub-Topic FASB ASC 810-10-15 adopted amendments to the variable interest consolidation model described above. The requirement to consolidate a VIE as revised in this amendment is based on the qualitative analysis considerations for primary beneficiary determination which requires a company consolidate an entity determined to be a VIE if it has both of the following characteristics: (1) the power to direct the principal activities of the entity and (2) the obligation to absorb the expected losses or the right to receive the residual returns that could be significant to the entity. We apply FASB ASC 810-10-15 and FASB ASC 810-20 to all types of entity ownership (general and limited partnerships and corporate interests).
We apply the equity method of accounting to entities in which we do not have a controlling direct or indirect voting interest or for variable interest entities where we are not considered the primary beneficiary, but can exercise influence over the entity with respect to our operations and major decisions. The cost method is applied when (i) the investment is minimal (typically less than
5%
) and (ii) our investment is passive.
|
(b)
|
Use of Estimates
|
The preparation of financial statements in conformity with accounting principles generally accepted in the United States requires management to make estimates and assumptions that affect the reported amounts of assets and liabilities and disclosure of contingent assets and liabilities at the date of the financial statements and the reported amounts of revenues and expenses during the reporting period. Actual results could differ from these estimates. All property, Site counts and acreage amounts are unaudited.
|
(c)
|
Markets
|
We have
two
reportable segments which are: (i) Property Operations and (ii) Home Sales and Rental Operations segments. The Property Operations segment owns and operates land lease Properties and the Home Sales and Rental Operations segment purchases, sells and leases homes at the Properties. The distribution of the Properties throughout the United States reflects our belief that geographic diversification helps insulate the portfolio from regional economic influences. We intend to target new acquisitions in or near markets where the Properties are located and will also consider acquisitions of Properties outside such markets.
|
(d)
|
Real Estate
|
Real estate is recorded at cost less accumulated depreciation. Depreciation is computed on the straight-line basis over the estimated useful lives of the assets. We generally use a
30
-year estimated life for buildings and structural and land improvements acquired (including Site development), a
ten
-year estimated life for building upgrades, a
five
-year estimated life for furniture, fixtures and equipment and over the average life of acquired in-place leases. New rental units are generally depreciated using a
20
-year estimated life from each model year down to a salvage value of
40%
of the original costs. Used rental units are generally depreciated based on the estimated life of the unit with no estimated salvage value.
Expenditures for ordinary maintenance and repairs are expensed to operations as incurred and significant renovations and improvements that improve the asset and extend the useful life of the asset are capitalized and depreciated over their estimated useful lives.
F-12
Equity LifeStyle Properties, Inc.
Notes to Consolidated Financial Statements
Note 2—Summary of Significant Accounting Policies (continued)
Land improvements consist primarily of improvements such as grading, landscaping and infrastructure items such as streets, sidewalks or water mains. Buildings and other depreciable property consist of permanent buildings in the Properties such as clubhouses, laundry facilities, maintenance storage facilities, rental units and furniture, fixtures, equipment, and in-place leases.
The values of above and below-market leases are amortized and recorded as either an increase (in the case of below-market leases) or a decrease (in the case of above-market leases) to rental income over the remaining term of the applicable lease. The value associated with in-place leases is amortized over the expected term, which includes an estimated probability of lease renewal.
In accordance with the Codification Sub-Topic “Impairment or Disposal of Long Lived Assets” (“FASB ASC 360-10-35”), we periodically evaluate our long-lived assets to be held and used, including our investments in real estate, for impairment indicators. Our judgments regarding the existence of impairment indicators are based on factors such as operational performance, market conditions and legal factors. Future events could occur which would cause us to conclude that impairment indicators exist and an impairment loss is warranted.
For long-lived assets to be held and used, if an impairment indicator exists, we compare the expected future undiscounted cash flows against the carrying amount of that asset. If the sum of the estimated undiscounted cash flows is less than the carrying amount of the asset, we would record an impairment loss for the carrying amount in excess of the estimated fair value, if any, of the asset. For the periods presented, no impairment losses were recorded.
For Properties to be disposed of, an impairment loss is recognized when the fair value of the Property, less the estimated cost to sell, is less than the carrying amount of the Property measured at the time we have made the decision to dispose of the Property, have an agreement to sell the Property within a year period and due diligence has been completed. A Property to be disposed of is reported at the lower of its carrying amount or its estimated fair value, less costs to sell. Subsequent to the date that a Property is held for disposition, depreciation expense is not recorded. We account for our Properties held for disposition in accordance with FASB ASC 360-10-35. Accordingly, the results of operations for all assets sold or held for sale are classified as discontinued operations in all periods presented, as applicable.
|
(e)
|
Acquisitions
|
In accordance with FASB ASC 805, we recognize all the assets acquired and all the liabilities assumed in a transaction at the acquisition-date fair value. We also expense transaction costs as they are incurred. The results of operations of acquired assets are included in the Consolidated Statements of Income and Comprehensive Income from the dates of acquisition. Certain purchase price adjustments may be made within
one year
following any acquisition and applied retroactively to the date of acquisition.
In making estimates of fair values for purposes of allocating purchase price, we utilize a number of sources, including independent appraisals or valuations that may be available in connection with the acquisition or financing of the respective Property and other market data. We also consider information obtained about each Property as a result of our due diligence, marketing and leasing activities in estimating the fair value of the tangible and intangible assets acquired and liabilities assumed.
The following methods and assumptions are used to estimate the fair value of each class of asset acquired and liability assumed:
Land – Market approach based on similar, but not identical, transactions in the market. Adjustments to comparable sales based on both the quantitative and qualitative data.
Depreciable property – Cost approach based on market comparable data to replace adjusted for local variations, inflation and other factors.
Manufactured homes – Sales comparison approach based on market prices for similar homes adjusted for differences in age or size. Manufactured homes are included on our Consolidated Balance Sheets in buildings and other depreciable property.
In-place leases – Lease in place was determined via a combination of estimates of market rental rates and expense reimbursement levels as well as an estimate of the length of time required to replace each lease.
Notes receivable – Income approach based on discounted cash flows discounting contractual cash flows at a market rate adjusted based on particular notes’ or note holders’ down payment, credit score and delinquency status.
Below-market ground leases – Value of asset (below-market lease) based on contract rent and option price against market rent and land value. Market rent determined applying a reasonable rate of return to the value of the land as if owned. Land value
F-13
Equity LifeStyle Properties, Inc.
Notes to Consolidated Financial Statements
Note 2—Summary of Significant Accounting Policies (continued)
is estimated and then inflated until it is anticipated that the option will be exercised. Below-market ground leases are included on our Consolidated Balance Sheets in escrow deposits, goodwill and other assets, net.
Mortgage notes payable – Income approach based on discounted cash flows comparing contractual cash flows to cash flows of similar debt discounted based on market rates.
|
(f)
|
Identified Intangibles and Goodwill
|
We record acquired intangible assets at their estimated fair value separate and apart from goodwill. We amortize identified intangible assets and liabilities that are determined to have finite lives over the period the assets and liabilities are expected to contribute directly or indirectly to the future cash flows of the property or business acquired. In accordance with the Codification Sub-Topic “Impairment or Disposal of Long Lived Assets” (“FASB ASC 360-10-35”), intangible assets subject to amortization are reviewed for impairment whenever events or changes in circumstances indicate that their carrying amount may not be recoverable. An impairment loss is recognized if the carrying amount of an intangible asset is not recoverable and its carrying amount exceeds its estimated fair value.
The excess of the cost of an acquired entity over the net of the amounts assigned to assets acquired (including identified intangible assets) and liabilities assumed is recorded as goodwill. In accordance with Codification Topic “Goodwill and Other Intangible Assets” (“FASB ASC 350”), goodwill is not amortized but is tested for impairment at a level of reporting referred to as a reporting unit on an annual basis, or more frequently if events or changes in circumstances indicate that the asset might be impaired.
As of
December 31, 2013
and
2012
, the gross carrying amounts of identified intangible assets and goodwill, a component of Escrow deposits, goodwill and other assets, net on our consolidated balance sheets, were approximately
$12.1 million
. As of
December 31, 2013
and
2012
, this amount was comprised of approximately
$4.3 million
of identified intangible assets and approximately
$7.8 million
of goodwill. Accumulated amortization of identified intangibles assets was approximately
$1.9 million
and
$1.5 million
as of
December 31, 2013
and
2012
, respectively. For the years ended
December 31, 2013
and
2012
, amortization expense for the identified intangible assets was approximately
$0.3 million
.
Estimated amortization of identified intangible assets for each of the next
five years
are as follows (amounts in thousands):
|
Year ending December 31,
|
Amount
|
||
|
2014
|
$
|
349
|
|
|
2015
|
349
|
|
|
|
2016
|
251
|
|
|
|
2017
|
87
|
|
|
|
2018
|
87
|
|
|
|
(g)
|
Restricted Cash
|
Cash as of
December 31, 2013
and
2012
included approximately
$5.2 million
and
$4.9 million
, respectively, of restricted cash for the payment of capital improvements, insurance or real estate taxes.
|
(h)
|
Notes and Contracts Receivable
|
Notes receivable generally are stated at their outstanding unpaid principal balances net of any deferred fees or costs on originated loans, unamortized discounts or premiums, and an allowance. Interest income is accrued on the unpaid principal balance. Discounts or premiums are amortized to income using the interest method. In certain cases we finance the sales of homes to our customers (referred to as “Chattel Loans”) with loans secured by the homes.
During the year ended
December 31, 2011
, we purchased Chattel Loans that were recorded at fair value at the time of acquisition under the Codification Topic “Loans and Debt Securities Acquired with Deteriorated Credit Quality” (“FASB ASC 310-30”). (See Note 5 in the Notes to Consolidated Financial Statements contained in this Form 10-K for a detailed description of our 2011 Acquisition.) The fair value of these Chattel Loans included an estimate of losses that are expected to be incurred over the estimated remaining lives of the receivables, and therefore no allowance for losses was recorded for these Chattel Loans. The fair value is estimated based on a number of factors including customer delinquency status, credit scores, the original down payment amount and below-market stated interest rates. Through
December 31, 2013
, the short-term historical performance of these loans has indicated a default rate of
16%
and a recovery rate of
25%
, which are slightly higher than originally estimated and resulted in
F-14
Equity LifeStyle Properties, Inc.
Notes to Consolidated Financial Statements
Note 2—Summary of Significant Accounting Policies (continued)
a higher yield for the portfolio. Management regularly reviews these assumptions and may adjust its estimates as needed as more information becomes available. A probable decrease in management’s expectation of future cash collections related to these Chattel Loans could result in the need to record an allowance for credit losses in the future. Due to the size of the Chattel Loan pool and maturity dates ranging up to
28 years
, future credit losses or changes to interest income could be significant.
Financial instruments that potentially could subject us to significant concentrations of credit risk consist principally of notes receivable. Concentrations of credit risk with respect to notes receivable are limited due to the size of the receivable and geographic diversity of the underlying Properties.
|
(i)
|
Allowance for Doubtful Accounts
|
Our allowance for doubtful accounts is comprised of our reserves for Chattel Loans, Contracts Receivables and amounts receivable from tenants. The valuation of an allowance for doubtful accounts for the Chattel Loans is calculated based on delinquency trends, average annual default rates, loss rates, and the current estimated market value of the underlying manufactured home collateral. An allowance is established for a portion of the Contracts Receivable when an up-front payment is financed. The Contracts Receivable allowance is based upon historical collection rates and current economic trends. The allowance and the rate at which we provide for losses on our Contracts Receivable could be increased or decreased in the future based on our actual collection experience. We evaluate all amounts receivable from residents and an allowance is established for amounts greater than 30 days past due. Our allowance for uncollectible rents receivable was approximately
$4.9 million
and
$4.7 million
as of
December 31, 2013
and
2012
, respectively.
During the years ended
December 31, 2013
,
2012
and
2011
, our allowance for doubtful accounts was as follows (amounts in thousands):
|
2013
|
2012
|
2011
|
||||||||||
|
Balance, beginning of period
|
$
|
6,987
|
|
$
|
7,700
|
|
$
|
6,580
|
|
|||
|
Provision for losses
|
5,152
|
|
4,860
|
|
4,156
|
|
||||||
|
Write-offs
|
(4,212
|
)
|
(5,573
|
)
|
(3,036
|
)
|
||||||
|
Balance, end of period
|
$
|
7,927
|
|
$
|
6,987
|
|
$
|
7,700
|
|
|||
|
(j)
|
Investments in Joint Ventures
|
Investments in joint ventures in which we do not have a controlling direct or indirect voting interest, but can exercise significant influence over the entity with respect to our operations and major decisions, are accounted for using the equity method of accounting whereby the cost of an investment is adjusted for our share of the equity in net income or loss from the date of acquisition and reduced by distributions received. The income or loss of each entity is allocated in accordance with the provisions of the applicable operating agreements. The allocation provisions in these agreements may differ from the ownership interests held by each investor. (See Note 6 in the Notes to Consolidated Financial Statements contained in this Form 10-K.)
|
(k)
|
Insurance Claims
|
The Properties are covered against losses caused by various events including fire, flood, property damage, earthquake, windstorm and business interruption by insurance policies containing various deductible requirements and coverage limits. Recoverable costs are classified in other assets as incurred. Insurance proceeds are applied against the asset when received. Recoverable costs relating to capital items are treated in accordance with our capitalization policy. The book value of the original capital item is written off when the loss is incurred. Insurance proceeds relating to the capital costs are recorded as income in the period they are received. (For a detailed discussion on hurricane claims, see Note 18 in the Notes to Consolidated Financial Statements contained in this Form 10-K).
|
(l)
|
Derivative Instruments and Hedging Activities
|
Codification Topic “Derivatives and Hedging” (“FASB ASC 815”) provides the disclosure requirements for derivatives and hedging activities with the intent to provide users of financial statements an enhanced understanding of: (a) how and why an entity uses derivative instruments, (b) how the entity accounts for derivative instruments and related hedged items, and (c) how derivative instruments and related hedged items affect an entity’s financial position, financial performance and cash flows. Further, qualitative disclosures are required that explain our objectives and strategies for using derivatives, as well as quantitative disclosures about the fair value of and gains and losses on derivative instruments, and disclosures about credit-risk-related contingent features in derivative instruments.
F-15
Equity LifeStyle Properties, Inc.
Notes to Consolidated Financial Statements
Note 2—Summary of Significant Accounting Policies (continued)
As required by FASB ASC 815, we record all derivatives on the balance sheet at fair value. Our objective in utilizing interest rate derivatives is to add stability to our interest expense and to manage our exposure to interest rate movements. To accomplish this objective, we primarily use interest rate swaps as part of our interest rate risk management strategy. Interest rate swaps designated as cash flow hedges involve the receipt of variable amounts from a counterparty in our exchange for making fixed-rate payments over the life of the agreements without exchange of the underlying notional amount.
The effective portion of changes in the fair value of the designated derivative designated and that qualifies as a cash flow hedge is recorded on the Consolidated Balance Sheets in accumulated other comprehensive income (loss) and is subsequently reclassified into earnings on the Consolidated Statements of Income and Comprehensive Income in the period that the hedged forecasted transaction affects earnings. Any ineffective portion of the change in fair value of the derivative will be recognized directly in earnings. (See Note 9 in the Notes to Consolidated Financial Statements contained in this Form 10-K.)
|
(m)
|
Fair Value of Financial Instruments
|
Our financial instruments include notes receivable, accounts receivable, accounts payable, other accrued expenses, interest rate swaps and mortgage notes payable. We disclose the estimated fair value of our financial instruments according to a fair value hierarchy (Level 1, 2 and 3).
Codification Topic “Fair Value Measurements and Disclosures” (“FASB ASC 820”) establishes a three-level valuation hierarchy for disclosure of fair value measurements. The valuation hierarchy is based upon the transparency of inputs to the valuation of an asset or liability as of the measurement date. A financial instrument’s categorization within the valuation hierarchy is based upon the lowest level of input that is significant to the fair value measurement. The three levels are defined as follows:
Level 1-Inputs to the valuation methodology are quoted prices (unadjusted) for identical assets or liabilities in active markets.
Level 2-Inputs to the valuation methodology include quoted prices for similar assets and liabilities in active markets, and inputs that are observable for the asset or liability, either directly or indirectly, for substantially the full term of the financial instrument.
Level 3-Inputs to the valuation methodology are unobservable and significant to the fair value measurement.
Our mortgage notes payable and term loan had a fair value and carrying value of approximately
$2.2 billion
as of
December 31, 2013
and
2012
, respectively, measured using quoted prices and observable inputs from similar liabilities (Level 2). At
December 31, 2013
and
2012
, our cash flow hedge of interest rate risk included in accrued payroll and other operating expenses was measured using quoted prices and observable inputs from similar assets and liabilities (Level 2). We consider our own credit risk as well as the credit risk of our counterparties when evaluating the fair value of our derivative. The fair values of our notes receivable approximate their carrying or contract values.
|
(n)
|
Deferred Financing Costs, net
|
Deferred financing costs, net include fees and costs incurred to obtain long-term financing. The costs are being amortized over the terms of the respective loans on a basis that approximates level yield. Unamortized deferred financing fees are written-off when debt is retired before the maturity date. Upon amendment of the line of credit or refinancing of mortgage debt, unamortized deferred financing fees are accounted for in accordance with Codification Sub-Topic “Modifications and Extinguishments” (“FASB ASC 470-50-40”). Accumulated amortization for such costs was
$25.4 million
and
$20.5 million
at
December 31, 2013
and
2012
, respectively.
|
(o)
|
Revenue Recognition
|
We account for leases with our customers as operating leases. Rental income is recognized over the term of the respective lease or the length of a customer’s stay, the majority of which are for a term of not greater than
one year
. For the years ended
December 31, 2013
,
2012
, and
2011
, approximately
40.7%
,
39.4%
, and
38.5%
, respectively, of our revenue was generated by Properties located in Florida, approximately
9.8%
,
9.4%
, and
10.8%
, respectively, by Properties located in Arizona and approximately
15.7%
,
15.2%
, and
17.8%
, respectively, by Properties located in California.
In conjunction with the acquisition of the Thousand Trails business, we adopted a revenue recognition policy for the right-to-use contracts in accordance with the Codification Topic “Revenue Recognition” (“FASB ASC 605”) after we corresponded with the Office of the Chief Accountant at the SEC. A right-to-use contract gives the customer the right to a set schedule of usage at a specified group of Properties. Customers may choose to upgrade their contracts to increase their usage and the number of Properties they may access. A contract requires the customer to make annual payments during the term of the contract and may
F-16
Equity LifeStyle Properties, Inc.
Notes to Consolidated Financial Statements
Note 2—Summary of Significant Accounting Policies (continued)
require an upfront nonrefundable payment. The stated term of a right-to-use contract is at least
one
year and the customer may renew his contract by continuing to make the annual payments. We will recognize the upfront non-refundable payments over the estimated customer life which, based on historical attrition rates, we have estimated to be from
one
to
31 years
.
Right-to-use annual payments by customers under the terms of the right-to-use contracts are deferred and recognized ratably over the
one year
period in which access to Sites at certain Properties are provided.
Income from home sales is recognized when the earnings process is complete. The earnings process is complete when the home has been delivered, the purchaser has accepted the home and title has transferred.
|
(p)
|
Non-Controlling Interests
|
A non-controlling interest is the portion of equity (net assets) in a subsidiary not attributable, directly or indirectly, to a parent. The ownership interests in the subsidiary that are held by owners other than the parent are non-controlling interests. Under Codification Topic “Consolidation” (“FASB ASC 810”), such non-controlling interests are reported on the consolidated balance sheets within equity, separately from our equity. However, securities that are redeemable for cash or other assets at the option of the holder, not solely within the control of the issuer, must be classified outside of permanent equity. This would result in certain outside ownership interests being included as redeemable non-controlling interests outside of permanent equity in the consolidated balance sheets. We make this determination based on terms in applicable agreements, specifically in relation to redemption provisions. Additionally, with respect to non-controlling interests for which we have a choice to settle the contract by delivery of our own shares, we considered the guidance in the Codification Topic “Derivatives and Hedging—Contracts in Entity’s Own Equity” (“FASB ASC 815-40”) to evaluate whether we control the actions or events necessary to issue the maximum number of shares that could be required to be delivered under share settlement of the contract.
Net income is allocated to Common OP Unitholders based on their respective ownership percentage of the Operating Partnership. Such ownership percentage is calculated by dividing the number of Common OP Units held by the Common OP Unitholders by the total OP Units held by the Common OP Unitholders and us. Issuance of additional shares of common stock or Common OP Units changes the percentage ownership of both the Non-controlling interests – Common OP Units and the Company.
Due in part to the exchange rights (which provide for the conversion of Common OP Units into shares of common stock on a one-for-one basis), such transactions and the proceeds therefrom are treated as capital transactions and result in an allocation between stockholders’ equity and Non-controlling Interests to account for the change in the respective percentage ownership of the underlying equity of the Operating Partnership.
In accordance with FASB ASC 810, we present the non-controlling interest for Common OP Units in the Equity section of the consolidated balance sheets. The caption Common OP Units on the consolidated balance sheets also includes
$0.7 million
of private REIT Subsidiaries preferred stock.
|
(q)
|
Preferred Stock
|
We account for the Preferred Stock in accordance with the Codification Topic “Distinguishing Liabilities from Equity—SEC Materials” (“FASB ASC 480-10-S99”). Holders of the
6.75%
Series C Cumulative Redeemable Perpetual Preferred Stock (the “Series C Preferred Stock”) have certain preference rights with respect to the common stock and the Series C Preferred Stock is classified as redeemable interests inside of permanent equity on our Consolidated Balance Sheet due to the ability to issue shares upon conversion.
|
(r)
|
Income and Other Taxes
|
Due to our structure as a REIT, the results of operations contain no provision for U.S. federal income taxes for the REIT, but we are still subject to certain foreign, state and local income, excise or franchise taxes. In addition, we have several taxable REIT Subsidiaries (“TRSs”) which are subject to federal and state income taxes at regular corporate tax rates. Overall, the TRSs have federal net operating loss carryforwards. No net tax benefits have been recorded by the TRSs since it is considered more likely than not that the deferred tax asset related to the TRSs net operating loss carryforwards will be utilized. In addition, as of
December 31, 2013
, the REIT had a net operating loss carryforward of approximately
$88 million
. The REIT will be entitled to utilize the net operating loss carryforward only to the extent that the REIT taxable income exceeds our deduction for dividends paid. Due to the uncertainty regarding the use of the REIT net operating loss carryforward, we have not recorded any net tax benefit to the REIT net operating loss carryforward.
F-17
Equity LifeStyle Properties, Inc.
Notes to Consolidated Financial Statements
We or one of our Subsidiaries file income tax returns in the U.S. federal jurisdiction, various U.S. state jurisdictions and Canada. With few exceptions, we are no longer subject to U.S. federal, state and local, or non-U.S. income tax examinations by tax authorities for years before 2010.
As of
December 31, 2013
, net investment in real estate and notes receivable had a U.S. federal tax basis of approximately
$2.7 billion
(unaudited) and
$47.7 million
(unaudited), respectively.
During the years ended
December 31, 2013
,
2012
and
2011
, our tax treatment of common stock distributions were as follows (unaudited, adjusted for stock split):
|
2013
|
2012
|
2011
|
|||||||||
|
Tax status of Common Shares distributions deemed paid during the year:
|
|||||||||||
|
Ordinary income
|
$
|
0.680
|
|
$
|
0.810
|
|
$
|
0.563
|
|
||
|
Long-term capital gain
|
0.211
|
|
0.069
|
|
—
|
|
|||||
|
Nondividend distributions
|
—
|
|
0.186
|
|
—
|
|
|||||
|
Unrecaptured section 1250 gain
|
0.067
|
|
—
|
|
—
|
|
|||||
|
Distributions declared per Common Share outstanding
|
$
|
0.958
|
|
$
|
1.065
|
|
$
|
0.563
|
|
||
The quarterly distribution paid on
January 10, 2014
of
$0.25
per common share will be considered a split-year distribution with
$0.2087
(unaudited) considered a distribution made in 2013 for U.S. federal income tax purposes and
$0.0413
(unaudited) allocable to 2014 for federal tax purposes.
(s)
Stock-Based C
ompensation
We follow Codification Topic “Stock Compensation” (“FASB ASC 718”) in accounting for our share-based payments. This guidance requires measurement of the cost of employee services received in exchange for stock compensation based on the grant-date fair value of the employee stock awards. This cost is recognized as compensation expense ratably over the employee’s requisite service period. Incremental compensation costs arising from subsequent modifications of awards after the grant date must be recognized when incurred. We use the Black-Scholes-Merton formula to estimate the value of stock options granted to employees, consultants and directors. (See Note 14 in the Notes to Consolidated Financial Statements contained in this Form 10-K.) No stock options were issued in 2013, 2012 and 2011.
|
(t)
|
Reclassifications
|
Certain 2012 and 2011 amounts have been reclassified to conform to the 2013 presentation. Balance sheet amounts as of December 31, 2012 for Properties held for disposition, have been reclassified on the Consolidated Balance Sheets to “Assets held for disposition” and “Liabilities held for disposition.” Income statement amounts for disposed Properties have been reclassified to “Discontinued operations” on the Consolidated Statements of Income and Comprehensive Income for all periods presented. In addition, certain prior period disclosures in the accompanying footnotes have been revised to exclude amounts which have been reclassified to discontinued operations. These reclassifications had no material effect on the Consolidated Statements of Income and Comprehensive Income.
Earnings per common share are based on the weighted average number of common shares outstanding during each year. Codification Topic “Earnings Per Share” (“FASB ASC 260”) defines the calculation of basic and fully diluted earnings per share. Basic and fully diluted earnings per share are based on the weighted average shares outstanding during each year and basic earnings per share exclude any dilutive effects of options, unvested restricted shares and convertible securities. The conversion of OP Units has been excluded from the basic earnings per share calculation. The conversion of an OP Unit for a share of common stock has no material effect on earnings per common share on a fully diluted basis.
On June 25, 2013, management announced a
two
-for-one split, to be effected by and in the form of a stock dividend, to take effect on July 15, 2013. On July 15, 2013, each common shareholder of record on July 5, 2013, received one additional share of common stock for each share held. The incremental par value was recorded as an increase to the common stock account on our balance sheet to reflect the newly issued shares and such amount was offset by a reduction in the paid-in capital account on our balance sheet. Pursuant to the anti-dilution provision in the Operating Partnership’s Agreement of Limited Partnership, the stock split also affected the common OP units.
F-18
Equity LifeStyle Properties, Inc.
Notes to Consolidated Financial Statements
The following table sets forth the computation of basic and diluted earnings per common share for the years ended
December 31, 2013
,
2012
and
2011
(amounts in thousands, except per share data, prior periods adjusted for stock split):
|
|
Years Ended December 31,
|
||||||||||
|
|
2013
|
2012
|
2011
|
||||||||
|
Numerators:
|
|||||||||||
|
Income from Continuing Operations:
|
|||||||||||
|
Income from continuing operations
|
$
|
77,247
|
|
$
|
63,747
|
|
$
|
41,957
|
|
||
|
Amounts allocated to dilutive securities
|
(5,617
|
)
|
(4,173
|
)
|
(5,856
|
)
|
|||||
|
Preferred Stock distributions
|
(9,280
|
)
|
(14,613
|
)
|
(13,823
|
)
|
|||||
|
Income from continuing operations available to Common Shares – basic
|
62,350
|
|
44,961
|
|
22,278
|
|
|||||
|
Amounts allocated to dilutive securities
|
5,617
|
|
4,173
|
|
3,105
|
|
|||||
|
Income from continuing operations available to Common Shares – fully diluted
|
$
|
67,967
|
|
$
|
49,134
|
|
$
|
25,383
|
|
||
|
Income from Discontinued Operations:
|
|||||||||||
|
Income from discontinued operations, net of amounts allocated to dilutive securities
|
$
|
44,569
|
|
$
|
9,818
|
|
$
|
497
|
|
||
|
Net Income Available for Common Shares:
|
|||||||||||
|
Net income available for Common Shares—basic
|
$
|
106,919
|
|
$
|
54,779
|
|
$
|
22,775
|
|
||
|
Amounts allocated to dilutive securities
|
9,706
|
|
5,067
|
|
5,906
|
|
|||||
|
Net income available for Common Shares—fully diluted
|
$
|
116,625
|
|
$
|
59,846
|
|
$
|
28,681
|
|
||
|
Denominator:
|
|||||||||||
|
Weighted average Common Shares outstanding—basic
|
83,018
|
|
82,348
|
|
71,182
|
|
|||||
|
Effect of dilutive securities:
|
|||||||||||
|
Redemption of Common OP Units for Common Shares
|
7,549
|
|
7,877
|
|
8,520
|
|
|||||
|
Redemption of Series B Preferred Stock
|
—
|
|
—
|
|
306
|
|
|||||
|
Stock options and restricted shares
|
629
|
|
637
|
|
652
|
|
|||||
|
Weighted average Common Shares outstanding—fully diluted
|
91,196
|
|
90,862
|
|
80,660
|
|
|||||
|
Earnings per Common Share—Basic:
|
|||||||||||
|
Income from continuing operations
|
$
|
0.75
|
|
$
|
0.55
|
|
$
|
0.31
|
|
||
|
Income from discontinued operations
|
0.54
|
|
0.12
|
|
0.01
|
|
|||||
|
Net income available for Common Shares
|
$
|
1.29
|
|
$
|
0.67
|
|
$
|
0.32
|
|
||
|
Earnings per Common Share—Fully Diluted:
|
|||||||||||
|
Income from continuing operations
|
$
|
0.75
|
|
$
|
0.54
|
|
$
|
0.31
|
|
||
|
Income from discontinued operations
|
0.53
|
|
0.12
|
|
0.01
|
|
|||||
|
Net income available for Common Shares
|
$
|
1.28
|
|
$
|
0.66
|
|
$
|
0.32
|
|
||
We adopted the 1997 Non-Qualified Employee Stock Purchase Plan (“ESPP”) in July 1997. Pursuant to the ESPP, as amended on
May 3, 2006
, certain of our employees and directors may each annually acquire up to
$250,000
of our common stock. The aggregate number of shares of common stock available under the ESPP shall not exceed
2,000,000
, subject to adjustment by our Board of Directors. The common stock may be purchased monthly at a price equal to 85% of the lesser of: (a) the closing price for a share of common stock on the last day of the offering period; and (b) the closing price for a share of common stock on the first day of the offering period. Shares of common stock issued through the ESPP for the years ended
December 31, 2013
,
2012
and
2011
were
18,411
,
30,154
and
29,176
, respectively.
On November 25, 2013, we amended our charter to increase from
100,000,000
to
200,000,000
the number of shares of common stock, par value
$0.01
per share, we are authorized to issue.
F-19
Equity LifeStyle Properties, Inc.
Notes to Consolidated Financial Statements
Note 4—Common Stock and Other Equity Related Transactions (continued)
The following table presents the changes in our outstanding common stock for the years ended
December 31, 2013
,
2012
and
2011
(excluding OP Units of
7,667,723
,
7,456,320
, and
8,206,134
outstanding at
December 31, 2013
,
2012
and
2011
, respectively):
|
2013
|
2012
|
2011
|
||||||
|
Shares outstanding at January 1,
|
83,193,310
|
|
82,156,400
|
|
61,944,706
|
|
||
|
Common stock issued through conversion of OP Units
|
29,566
|
|
749,814
|
|
656,706
|
|
||
|
Common stock issued through exercise of options
|
20,000
|
|
160,000
|
|
344,768
|
|
||
|
Common stock issued through stock grants
|
173,333
|
|
177,998
|
|
216,664
|
|
||
|
Common stock issued through ESPP and Dividend Reinvestment Plan
|
19,012
|
|
31,108
|
|
30,304
|
|
||
|
Common stock repurchased and retired
|
(121,544
|
)
|
(82,010
|
)
|
(8,300
|
)
|
||
|
Common stock issued through stock offering
|
—
|
|
—
|
|
12,075,000
|
|
||
|
Common stock issued for Acquisition
|
—
|
|
—
|
|
3,416,552
|
|
||
|
Redemption of Series B Preferred Stock for Common Stock
|
—
|
|
—
|
|
3,480,000
|
|
||
|
Shares outstanding at December 31,
|
83,313,677
|
|
83,193,310
|
|
82,156,400
|
|
||
During the year ended December 31, 2013, 2012 and 2011, we repurchased shares of common stock representing common stock we surrendered to satisfy income tax withholding obligations due as a result of the vesting of restricted stock grants at a weighted average price of
$36.48
,
$33.31
and
$31.39
per share, respectively.
As of
December 31, 2013
and
2012
, our percentage ownership of the Operating Partnership was approximately
91.6%
and
91.8%
, respectively. The remaining approximately
8.4%
and
8.2%
, respectively, was owned by the Common OP Unitholders.
The following regular quarterly distributions have been declared and paid to common stockholders and common OP Unit non-controlling interests since January 1,
2011
:
|
Distribution
Amount Per
Share
|
|
For the Quarter Ending
|
|
Stockholder Record
Date
|
|
Payment Date
|
|
$0.1875
|
|
March 31, 2011
|
|
March 25, 2011
|
|
April 8, 2011
|
|
$0.1875
|
|
June 30, 2011
|
|
June 24, 2011
|
|
July 8, 2011
|
|
$0.1875
|
|
September 30, 2011
|
|
September 30, 2011
|
|
October 14, 2011
|
|
$0.1875
|
|
December 31, 2011
|
|
December 30, 2011
|
|
January 13, 2012
|
|
$0.2188
|
|
March 31, 2012
|
|
March 30, 2012
|
|
April 13, 2012
|
|
$0.2188
|
|
June 30, 2012
|
|
June 29, 2012
|
|
July 13, 2012
|
|
$0.2188
|
|
September 30, 2012
|
|
September 28, 2012
|
|
October 12, 2012
|
|
$0.2188
|
|
December 31, 2012
|
|
December 14, 2012
|
|
December 28, 2012
|
|
$0.2500
|
|
March 31, 2013
|
|
March 28, 2013
|
|
April 12, 2013
|
|
$0.2500
|
|
June 30, 2013
|
|
June 28, 2013
|
|
July 12, 2013
|
|
$0.2500
|
|
September 30, 2013
|
|
September 27, 2013
|
|
October 11, 2013
|
|
$0.2500
|
|
December 31, 2013
|
|
December 27, 2013
|
|
January 10, 2014
|
On July 15, 2013, we effected a
two
-for-one stock split of our common stock, by and in the form of a stock dividend and was paid to stockholders of record on July 5, 2013.
On September 6, 2012, we entered into equity distribution agreements with sales agents, pursuant to which we may sell, from time to time, shares of our common stock, par value
$0.01
per share, having an aggregate offering price of up to
$125.0 million
. We have not sold any common stock to date under the equity distribution agreements.
On
May 8, 2012
, the ability to issue shares upon conversion of the Series A Preferred Stock was approved by our common stockholders. As a result, the Series A Preferred Stock has been classified as redeemable interests within permanent equity on our Consolidated Balance Sheet.
On August 9, 2012, we announced an offer to acquire all of the
8,000,000
outstanding Series A Preferred Stock. For each share of Series A Preferred Stock, we intended to exchange for one newly issued depositary share plus cash equal to the amount of all unpaid distributions accrued on such tendered Series A Preferred Stock. On September 14, 2012, we issued
54,458
shares of our Series C Preferred Stock with a liquidation value of
$2,500.00
per share, which are represented by depositary shares as
F-20
Equity LifeStyle Properties, Inc.
Notes to Consolidated Financial Statements
described below. Also on September 14, 2012, we exchanged
5,445,765
shares of our Series A Preferred Stock for
5,445,765
depositary shares, each representing 1/100
th
of a share of our Series C Preferred Stock with a liquidation value of
$25.00
per depositary share, plus accrued and unpaid dividends of
$0.3849625
per share of Series A Preferred Stock.
On October 18, 2012, we redeemed the remaining
2,554,235
shares of Series A Preferred Stock at the
$25.00
per share liquidation value plus accrued and unpaid dividends of
$0.0948460
per share on such redeemed shares for approximately
$64.1 million
.
The following table summarizes the carrying amounts of our investment in real estate held for disposition (at cost) as of December 31, 2013 and 2012 (amounts in thousands):
Properties Held for Disposition
|
December 31,
2013 |
December 31,
2012 |
||||||
|
Investment in real estate:
|
|||||||
|
Land
|
$
|
—
|
|
$
|
28,611
|
|
|
|
Land improvements
|
—
|
|
65,664
|
|
|||
|
Buildings and other depreciable property
|
—
|
|
32,591
|
|
|||
|
—
|
|
126,866
|
|
||||
|
Accumulated depreciation
|
—
|
|
(15,077
|
)
|
|||
|
Net investment in real estate
|
$
|
—
|
|
$
|
111,789
|
|
|
During the year ended
December 31, 2013
, we recorded an additional
$3.5 million
in depreciation expense and accumulated depreciation to correct immaterial amounts recorded in prior periods related to land improvements.
Acquisitions
All acquisitions have been accounted for utilizing the acquisition method of accounting in accordance with FASB ASC 805 and, accordingly, the results of operations of acquired assets are included in the statements of operations from the dates of acquisition. Certain purchase price adjustments may be made within
one year
following the acquisition and applied retroactively to the date of acquisition.
During the years ended
December 31, 2013
,
2012
and
2011
we acquired all of the following Properties from unaffiliated third parties (dollars in millions):
1) During the year ended December 31, 2013, we acquired the following Properties:
(a) On December 17, 2013, we closed on the acquisition of Neshonoc Resort, a
284
-Site property for a purchase price of approximately
$7.3 million
funded with available cash and the assumption of mortgage debt of approximately
$5.4 million
. On January 7, 2014 we closed on the acquisition of Blackhawk Resort, a
490
-Site property for a purchase price of
$7.6 million
funded with available cash and the assumption of mortgage debt of approximately
$4.9 million
. On January 24, 2014, we closed on the acquisition of Lakeland Resort, a
682
-Site property for a purchase price of
$16.6 million
funded with available cash and the assumption of mortgage debt of approximately
$8.4 million
.
(b) On
September 16, 2013
, we acquired Fiesta Key, a
resort Property with
324
Sites for a purchase price of approximately
$24.6 million
funded with available cash.
(c)
On
August 1, 2013
, we acquired from certain affiliates of Riverside Communities
three
manufactured home communities (the “Riverside Acquisition”) located in the Chicago metropolitan area collectively containing approximately
1,207
Sites for a stated purchase price of
$102.0 million
. The purchase price was funded with approximately
$9.7 million
of limited partnership interests in our Operating Partnership, equivalent to
240,969
OP units, and the remainder was funded with available cash.
2) During the year ended December 31, 2012, we acquired
two
resort Properties with
1,765
Sites for a purchase price of
$25.0 million
.
F-21
Equity LifeStyle Properties, Inc.
Notes to Consolidated Financial Statements
Note 5—Investment in Real Estate (continued)
3) During the year ended December 31, 2011, we acquired
75
manufactured homes communities and one RV (the “2011 Acquisition Properties”) resort containing
30,129
Sites for a purchase price of approximately
$1.5 billion
(the “2011 Acquisition”). We funded the purchase price of this closing with (i) the issuance of
3,416,552
shares of our common stock, to the seller with an aggregate value of approximately
$111 million
, (ii) the issuance of
3,480,000
shares of Series B Preferred Stock to the seller with an aggregate value of approximately
$113 million
, (iii) the assumption of mortgage debt secured by
35
of the 2011 Acquisition Properties with an aggregate value of approximately
$548 million
, (iv) the net proceeds of approximately
$344 million
, net of offering costs, from a common stock offering of
12,075,000
shares, (v) approximately
$200 million
of cash from the Term Loan we closed on
July 1, 2011
, and (vi) approximately
$200 million
of cash from new secured financings originated during the third quarter of 2011. The assumed mortgage debt had stated interest rates ranging from
4.65%
to
8.87%
per annum and maturities from dates ranging from
2012
to
2023
. The number of shares shown in this section has been adjusted for our
two
-for-one stock split that was effected by and in the form of a stock dividend in July 2013.
We engaged a third-party to assist with our purchase price allocation for the acquisitions. The allocation of the fair values of the assets acquired and liabilities assumed is subject to further adjustment due primarily to information not readily available at the acquisition date and final purchase price settlement with the sellers in accordance with the terms of the purchase agreement. The following table summarizes the estimated fair value of the assets acquired and liabilities assumed in the acquisitions for the year ended
December 31, 2013
, which we determined using level two and level three inputs (amounts in thousands):
|
2013
|
2012
|
2011
|
||||||||||
|
Assets acquired
|
||||||||||||
|
Land
|
$
|
41,022
|
|
$
|
4,410
|
|
$
|
471,500
|
|
|||
|
Depreciable property
|
87,306
|
|
18,491
|
|
855,200
|
|
||||||
|
Manufactured homes
|
1,155
|
|
—
|
|
24,000
|
|
||||||
|
In-place leases
|
3,910
|
|
2,099
|
|
74,000
|
|
||||||
|
Net investment in real estate
|
$
|
133,393
|
|
$
|
25,000
|
|
$
|
1,424,700
|
|
|||
|
Notes receivable
|
—
|
|
—
|
|
—
|
|
40,000
|
|
||||
|
Other assets
|
1,025
|
|
29
|
|
18,300
|
|
||||||
|
Total Assets acquired
|
$
|
134,418
|
|
$
|
25,029
|
|
$
|
1,483,000
|
|
|||
|
Liabilities assumed
|
||||||||||||
|
Mortgage notes payable
|
$
|
5,382
|
|
$
|
—
|
|
$
|
548,000
|
|
|||
|
Other liabilities
|
1,777
|
|
816
|
|
8,000
|
|
||||||
|
Total liabilities assumed
|
$
|
7,159
|
|
$
|
816
|
|
$
|
556,000
|
|
|||
|
Net consideration paid
|
$
|
127,259
|
|
$
|
24,213
|
|
$
|
927,000
|
|
|||
Ground lease escrow
We are the beneficiary of an escrow, funded by the seller, related to our Colony Cove Property which was acquired as part of our 2011 Acquisition. The lease terms included an option to purchase the underlying fee interest upon the death of the lessor as well as scheduled increases of the monthly payments and the option purchase price. During 2013, we received distributions of
90,805
shares of our common stock. During the fourth quarter, we learned of the death of the lessor and we have provided the required notification of our intent to exercise the purchase option which is expected to close in early 2014. The December 31, 2013 contingent consideration asset balance of
$1.9 million
represents the
$1.1 million
fair value estimate of shares distributed to us on January 1, 2014 and the
$0.8 million
fair value estimate of shares distributed to us on February 12, 2014.
Dispositions
During the three years ended
December 31, 2013
, we disposed of the following Properties:
1) On
May 8, 2013
, we entered into a purchase and sale agreement to sell
11
manufactured home communities located in
Michigan
(the “Michigan Properties”) collectively containing approximately
5,344
Sites for a net sale price of approximately
$165.0 million
. We closed on the sale of ten of the Michigan Properties on
July 23, 2013
, and closed on the sale of the eleventh Michigan Property on September 25, 2013. In accordance with FASB Codification Sub-Topic “Property, Plant and Equipment - Real Estate Sales - Derecognition” (“FASB ASC 360-20-40-5”), we recognized a gain on sale of real estate assets of approximately
$40.6 million
.
2) On December 7, 2012, we sold Cascade, a
163
-Site resort Property located in
Snoqualmie, Washington
. In accordance with FASB ASC 360-20-40-5, we recognized a gain on disposition of approximately
$4.6 million
, net of tax for the year ended
F-22
Equity LifeStyle Properties, Inc.
Notes to Consolidated Financial Statements
December 31, 2012. Cash proceeds from the disposition, net of closing costs, were approximately
$7.6 million
. During the year ended
December 31, 2013
, we recognized approximately
$1.0 million
of gain on the sale as a result of a new U.S. Federal tax law that eliminated a previously accrued built-in-gain tax liability related to the disposition.
The following table summarizes the combined results of operations of Properties held for disposition for the respective periods that we owned such assets during the years ended
December 31, 2013
,
2012
and
2011
(amounts in thousands):
|
Years Ended
|
|||||||||||
|
December 31,
|
|||||||||||
|
2013
|
2012
|
2011
|
|||||||||
|
Community base rental home income
|
$
|
11,565
|
|
$
|
19,564
|
|
$
|
9,621
|
|
||
|
Rental income
|
1,948
|
|
2,416
|
|
725
|
|
|||||
|
Utility and other income
|
1,384
|
|
1,961
|
|
727
|
|
|||||
|
Discontinued property operating revenues
|
14,897
|
|
23,941
|
|
11,073
|
|
|||||
|
Property operating expenses
|
6,126
|
|
9,561
|
|
4,290
|
|
|||||
|
Income from discontinued property operations
|
8,771
|
|
14,380
|
|
6,783
|
|
|||||
|
Loss from home sales operations
|
(78
|
)
|
(110
|
)
|
(26
|
)
|
|||||
|
Other income and expenses
|
332
|
|
868
|
|
566
|
|
|||||
|
Interest and amortization
|
(355
|
)
|
(534
|
)
|
(179
|
)
|
|||||
|
Depreciation and in place lease amortization
|
(1,537
|
)
|
(8,488
|
)
|
(6,597
|
)
|
|||||
|
Discontinued operations, net
|
$
|
7,133
|
|
$
|
6,116
|
|
$
|
547
|
|
||
As of
December 31, 2013
, we have no Properties designated as held for disposition pursuant to FASB ASC 360-10-35.
We received approximately
$1.3 million
in distributions from joint ventures for the year ended
December 31, 2013
and approximately
$1.8 million
for each of the years ended
December 31, 2012
and
2011
from joint ventures, which were classified as a return on capital and included in operating activities on the Consolidated Statements of Cash Flows.
On April 19, 2013, we entered into an agreement with an unaffiliated third party to create a new joint venture named ECHO Financing, LLC (the “ECHO JV”). We entered into the ECHO JV to buy and sell homes, as well as to offer another financing option to purchasers of homes at our Properties. Each party to the venture made an initial contribution of
$1.0 million
in exchange for a pro rata ownership interest in the joint venture, which resulted in us owning
50%
of the ECHO JV. We account for our investment in the ECHO JV using the equity method of accounting, since we do not have a controlling direct or indirect voting interest, but we can exercise significant influence with respect to our operations and major decisions.
The following table summarizes our investment in unconsolidated joint ventures (investment amounts in thousands with the number of Properties shown parenthetically for the years ended
December 31, 2013
and
2012
, respectively):
|
|
|
|
|
|
Investment as of
|
Income for
Years Ended (c) |
|||||||||||||||||||||||
|
Investment
|
Location
|
Number
of Sites |
Economic Interest
(a)
|
|
December 31,
2013 |
December 31,
2012 |
December 31,
2013 |
December 31,
2012 |
December 31,
2011 |
||||||||||||||||||||
|
Meadows
|
Various (2,2)
|
1,027
|
|
50
|
%
|
$
|
1,679
|
|
$
|
916
|
|
$
|
1,138
|
|
$
|
1,012
|
|
$
|
981
|
|
|||||||||
|
Lakeshore
|
Florida (2,2)
|
342
|
|
65
|
%
|
145
|
|
121
|
|
271
|
|
250
|
|
240
|
|
||||||||||||||
|
Voyager
|
Arizona (1,1)
|
1,706
|
|
50
|
%
|
(b)
|
7,074
|
|
7,195
|
|
760
|
|
652
|
|
727
|
|
|||||||||||||
|
Other
|
Various (0,0)
|
—
|
|
20
|
%
|
—
|
|
188
|
|
(188
|
)
|
(15
|
)
|
—
|
|
||||||||||||||
|
Echo JV
|
Various (0,0)
|
—
|
|
50
|
%
|
2,685
|
|
—
|
|
58
|
|
—
|
|
—
|
|
||||||||||||||
|
3,075
|
|
$
|
11,583
|
|
$
|
8,420
|
|
$
|
2,039
|
|
$
|
1,899
|
|
$
|
1,948
|
|
|||||||||||||
_________________________
|
(a)
|
The percentages shown approximate our economic interest as of
December 31, 2013
. Our legal ownership interest may differ.
|
|
(b)
|
Voyager joint venture primarily consists of a
50%
interest in Voyager RV Resort and
25%
interest in the utility plant servicing the Property.
|
|
(c)
|
Net of approximately
$1.0 million
of depreciation expense for the year ended
December 31, 2013
and approximately
$1.2 million
for each of the years ended
December 31, 2012
and
2011
.
|
F-23
Equity LifeStyle Properties, Inc.
Notes to Consolidated Financial Statements
Occasionally, we make loans to finance the sale of homes to our customers or purchase loans made by others to finance the sale of homes to our customers (“Chattel Loans”). The Chattel Loans receivable require monthly principal and interest payments and are collateralized by homes at certain of the Properties. As of
December 31, 2013
and
2012
, we had approximately
$21.9 million
and
$25.0 million
, respectively, of these Chattel Loans included in notes receivable. In addition, as of
December 31, 2012
, we had approximately
$7.7 million
of these Chattel Loans included in notes receivable for assets held for disposition. As of
December 31, 2013
, the Chattel Loans receivable, including the Michigan Properties through the date of sale, had a stated per annum average rate of approximately
7.8%
, with a yield of
20.0%
, and had an average term remaining of approximately
12 years
. These Chattel Loans are recorded net of allowances of approximately
$0.4 million
as of
December 31, 2013
and
2012
. During the years ended
December 31, 2013
and
2012
, approximately
$4.3 million
and
$5.5 million
, respectively, were repaid, and we issued an additional
$2.8 million
and
$0.7 million
of loans, respectively. In addition, during the years ended
December 31, 2013
and
2012
, approximately
$2.6 million
and
$5.3 million
, respectively, of homes serving as collateral for Chattel Loans were repossessed and sold or converted to rental units. Chattel Loans receivable as of
December 31, 2013
includes
$13.7 million
of Chattel Loans related to the Properties acquired in 2011. During 2013, we disposed of
$6.5 million
of Chattel Loans due to the disposition of the Michigan Properties. During 2013, management reviewed the default and asset recovery performance of these loans related to the Properties acquired in 2011 and determined that the yield of this portfolio increased from
21.0%
to
27.0%
due to the disposition of Chattel Loans at the Michigan Properties and accelerated timing of cash collections and asset recoveries being experienced in the portfolio. Increases in default rates or declines in recovery rates in the future could, if significant, result in an impairment of the loans. Changes in default rates or recovery rates in the future could, if significant, result in future changes to the yield.
We also provide financing for nonrefundable sales of new or upgrades to existing right to use contracts (“Contracts Receivable”). As of
December 31, 2013
and
2012
, we had approximately
$17.2 million
and
$16.1 million
, respectively, of Contracts Receivable, net of allowances of approximately
$0.6 million
and
$0.7 million
, respectively. These Contracts Receivable represent loans to customers who have entered into right-to-use contracts. The Contracts Receivable yield interest at a stated per annum average rate of
16.0%
, have a weighted average term remaining of approximately
four years
and require monthly payments of principal and interest. During the years ended
December 31, 2013
and
2012
, approximately
$7.1 million
were repaid in each year and an additional
$7.5 million
and
$6.6 million
, respectively, were lent to customers.
2013 Activity
As of
December 31, 2013
and
December 31, 2012
, we had outstanding mortgage indebtedness on Properties of approximately
$1,992 million
and
$2,062 million
, respectively, excluding
$8.3 million
as of December 31, 2012, on liabilities held for disposition (including
$0.4 million
of debt premium adjustment). The weighted average interest rate including the impact of premium/discount amortization on this mortgage indebtedness for the year ended
December 31, 2013
was approximately
5.0%
per annum. The debt bears interest at stated rates of
3.9%
to
8.9%
per annum and matures on various dates ranging from
2014
to
2038
. The debt encumbered a total of
147
and
170
of our Properties as of
December 31, 2013
and
December 31, 2012
, respectively, and the carrying value of such Properties was approximately
$2,378 million
and
$2,485 million
, respectively, as of such dates.
During the year ended
December 31, 2013
, we closed on
22
loans with total proceeds of
$375.5 million
which were secured by manufactured home communities and carried a weighted average interest rate of
4.4%
per annum. The loan proceeds and available cash were used to defease approximately
$312.2 million
of debt with a weighted average interest rate of
5.6%
per annum, secured by
29
manufactured home communities which were set to mature in
2014
and
2015
. During the year ended
December 31, 2013
, we paid approximately
$37.8 million
in defeasance costs associated with the early retirement of the mortgages. We also paid off
16
maturing mortgages totaling approximately
$99.8 million
, with a weighted average interest rate of
6.0%
per annum.
We also assumed approximately
$5.4 million
of mortgage debt secured by the Neshonoc property (see Note 5 in the Notes to Consolidated Financial Statements in this Form 10-K) with a stated interest rate of
6.0%
per annum set to mature in
2022
.
On July 18, 2013, in connection with the disposition of our Michigan Properties (see Note 5 in the Notes to Consolidated Financial Statements in this Form 10-K), we paid off the mortgage on
one
manufactured home community, which was scheduled to mature in
2020
, for approximately
$7.8 million
with a stated interest rate of
7.2%
per annum.
F-24
Equity LifeStyle Properties, Inc.
Notes to Consolidated Financial Statements
Note 8—Borrowing Arrangements (continued)
On January 2, 2014, we repaid approximately
$16.6 million
of debt maturing in
2014
, which had a weighted average interest rate of
5.7%
per annum. On February 1, 2014, we also repaid one mortgage scheduled to mature in
2014
of approximately
$4.0 million
with a stated interest rate of
5.4%
per annum.
On January 7, 2014, we assumed approximately
$4.9 million
of mortgage debt secured by Blackhawk Resort (see Note 5 in the Notes to Consolidated Financial Statements in this Form 10-K) with a stated interest rate of
6.0%
per annum set to mature in
2017
.
On January 24, 2014, we assumed approximately
$8.4 million
of mortgage debt secured by Lakeland Resort (see Note 5 in the Notes to Consolidated Financial Statements in this Form 10-K) with a stated interest rate of
6.8%
per annum set to mature in
2018
.
20
12 Activity
During the year ended
December 31, 2012
, we received approximately
$74.0 million
of financing proceeds on
one
manufactured home community with a stated interest rate of
3.90%
per annum, maturing in
2022
. The proceeds were used to pay off the mortgage on the property, which was set to mature on
May 1, 2013
, totaling approximately
$35.1 million
, with a stated interest rate of
5.69%
per annum. We also closed on approximately
$85.5 million
of financing proceeds on
two
RV resorts with a weighted average interest rate of
5.10%
per annum, maturing in
2022
. We used the proceeds to pay off the mortgages on these
two
Properties, which were set to mature on
June 1, 2014
, totaling approximately
$63.3 million
, with a weighted average interest rate of
5.41%
per annum. We also paid off
three
maturing mortgages totaling approximately
$39.3 million
, with a weighted average interest rate of
5.79%
per annum.
Unsecured Term Loan
Our
$200.0 million
unsecured Term Loan matures on
June 30, 2017
, has an interest rate of LIBOR plus
1.85%
to
2.80%
per annum and, subject to certain conditions, may be prepaid at any time without premium or penalty after
July 1, 2014
. Prior to
July 1, 2014
, a prepayment penalty of
2%
of the amount prepaid would be owed. The spread over LIBOR is variable based on leverage measured quarterly throughout the loan term. The Term Loan contains customary representations, warranties and negative and affirmative covenants, and provides for acceleration of principal and payment of all other amounts payable thereunder upon the occurrence of certain events of default. In connection with the Term Loan, we also entered into a
three
year,
$200.0 million
LIBOR notional Swap Agreement (the “Swap”) allowing us to trade our variable interest rate for a fixed interest rate on the Term Loan. (See Note 9 in the Notes to Consolidated Financial Statements contained in this Form 10-K for further information on the accounting for the Swap.) The proceeds were used to partially fund the 2011 Acquisition discussed in detail in Note 5 in the Notes to the Consolidated Financial Statements contained in this Form 10K.
Unsecured Line of Credit
As of
December 31, 2013
and
2012
, our unsecured Line of Credit (“LOC”) had an availability of
$380 million
with no amounts outstanding. During the year ended
December 31, 2013
, we had proceeds of
$20.0 million
from the LOC and repayments of
$20.0 million
on the LOC. Our amended LOC bears a LIBOR rate plus a maximum of
1.40%
to
2.00%
, contains a
0.25%
to
0.40%
facility rate and has a maturity date of
September 15, 2016
. We have a
one year
extension option under our LOC. We incurred commitment and arrangement fees of approximately
$1.3 million
to enter into the amended LOC in 2012, subject to payment of certain administrative fees and the satisfaction of certain other enumerated conditions.
As of
December 31, 2013
, we are in compliance in all material aspects with the covenants in our borrowing arrangements.
F-25
Equity LifeStyle Properties, Inc.
Notes to Consolidated Financial Statements
Future Maturities of Debt
Aggregate payments of principal on long-term borrowings for each of the next five years and thereafter are as follows (amounts in thousands):
|
Year
|
Amount
|
||
|
2014
|
$
|
119,452
|
|
|
2015
|
311,208
|
|
|
|
2016
|
246,054
|
|
|
|
2017
|
310,725
|
|
|
|
2018
|
207,592
|
|
|
|
Thereafter
|
979,572
|
|
|
|
Net unamortized premiums
|
17,765
|
|
|
|
Total
|
$
|
2,192,368
|
|
Cash Flow Hedges of Interest Rate Risk
In connection with the Term Loan, we entered into a Swap (See Note 8 in the Notes to the Consolidated Financial Statements contained in this Form 10-K for information about the Term Loan related to the Swap) that fixes the underlying LIBOR rate on the Term Loan at
1.11%
per annum for the first
three years
and matures on
July 1, 2014
. Based on actual leverage as of
December 31, 2013
, our spread over LIBOR was
1.95%
resulting in an actual all-in interest rate of
3.06%
per annum. We have designated the Swap as a cash flow hedge. No gain or loss was recognized in the Consolidated Statements of Income and Comprehensive Income related to hedge ineffectiveness or to amounts excluded from effectiveness testing on our cash flow hedge during the years ended
December 31, 2013
and
2012
.
Amounts reported in accumulated other comprehensive loss on the Consolidated Balance Sheet related to derivatives will be reclassified to interest expense as interest payments are made on our variable-rate debt. Through the remaining term of the swap,
July 1, 2014
, we estimate that an additional
$1.1 million
will be reclassified as an increase to interest expense.
Derivative Instruments and Hedging Activities
The table below presents the fair value of our derivative financial instrument as well as our classification on our Consolidated Balance Sheets as of
December 31, 2013
and
2012
(amounts in thousands).
|
Balance Sheet Location
|
December 31,
2013 |
December 31,
2012 |
|||||||
|
Interest Rate Swap
|
Accrued payroll and other operating expenses
|
$
|
928
|
|
$
|
2,591
|
|
||
Tabular Disclosure of the Effect of Derivative Instruments on the Income Statement
The table below present the effect of our derivative financial instrument on the Consolidated Statements of Income and Comprehensive Income for the years ended
December 31, 2013
,
2012
and
2011
(amounts in thousands).
|
Derivatives in Cash Flow Hedging Relationship
|
Amount of loss recognized
in OCI on derivative
(effective portion)
|
Location of loss
reclassified from
accumulated OCI into income
(effective portion) |
Amount of loss reclassified from
accumulated OCI into income (effective
portion)
|
||||||||||||||||||||||
|
December 31,
2013 |
December 31,
2012 |
December 31,
2011 |
December 31,
2013 |
December 31,
2012 |
December 31,
2011 |
||||||||||||||||||||
|
Interest Rate Swap
|
$
|
188
|
|
$
|
1,797
|
|
$
|
3,445
|
|
Interest Expense
|
$
|
1,851
|
|
$
|
1,754
|
|
$
|
898
|
|
||||||
We determined that no adjustment was necessary for nonperformance risk on our derivative obligation. As of
December 31, 2013
, we have not posted any collateral related to this agreement.
F-26
Equity LifeStyle Properties, Inc.
Notes to Consolidated Financial Statements
Up-front payments received upon the entry of right-to-use contracts are recognized in accordance with FASB ASC 605. We recognize the up-front non-refundable payments over the estimated customer life, which, based on historical attrition rates, we have estimated to be between
one
to
31 years
. The commissions paid on the entry of right-to-use contracts will be deferred and amortized over the same period as the related sales revenue.
Components of the change in deferred revenue-entry of right-to-use contracts and deferred commission expense are as follows (amounts in thousands):
|
|
2013
|
2012
|
||||||
|
Deferred revenue—entry of right-to-use contracts, as of January 1,
|
$
|
62,979
|
|
$
|
56,285
|
|
||
|
Deferral of new right-to-use contracts
|
13,142
|
|
13,433
|
|
||||
|
Deferred revenue recognized
|
(7,448
|
)
|
(6,739
|
)
|
||||
|
Net increase in deferred revenue
|
5,694
|
|
6,694
|
|
||||
|
Deferred revenue—entry of right-to-use contracts, as of December 31,
|
$
|
68,673
|
|
$
|
62,979
|
|
||
|
Deferred commission expense, as of January 1,
|
$
|
22,841
|
|
$
|
19,686
|
|
||
|
Costs deferred
|
5,011
|
|
5,465
|
|
||||
|
Commission expense recognized
|
(2,601
|
)
|
(2,310
|
)
|
||||
|
Net increase in deferred commission expense
|
2,410
|
|
3,155
|
|
||||
|
Deferred commission expense, as of December 31,
|
$
|
25,251
|
|
$
|
22,841
|
|
||
The leases entered into between the customer and us for the rental of a Site are generally month-to-month or for a period of
one
to
ten years
, renewable upon the consent of the parties or, in some instances, as provided by statute. Long-term leases that are non-cancelable by the tenant are in effect at certain Sites for
17
of the Properties. Rental rate increases at these Properties are primarily a function of increases in the Consumer Price Index, taking into consideration certain conditions. Additionally, periodic market rate adjustments are made as deemed appropriate. Future minimum rents are scheduled to be received under non-cancelable tenant leases at
December 31, 2013
are as follows (amounts in thousands):
|
Year
|
Amount
|
||
|
2014
|
$
|
34,844
|
|
|
2015
|
34,001
|
|
|
|
2016
|
23,741
|
|
|
|
2017
|
17,087
|
|
|
|
2018
|
16,082
|
|
|
|
Thereafter
|
43,980
|
|
|
|
Total
|
$
|
169,735
|
|
We lease land under non-cancelable operating leases at certain of the Properties expiring in various years from
2015
to
2054
. The majority of the lease terms require twelve equal payments per year plus additional rents calculated as a percentage of gross revenues. Future minimum rental payments exclude payments related to the Colony Cove Property lease as we have provided required notification of our intent to exercise the purchase option for the land which is expected to close in early 2014. For the year ended
December 31, 2013
,
2012
, and
2011
ground lease rent was approximately
$3.4 million
,
$3.3 million
, and
$2.5 million
, respectively. Minimum future rental payments under the ground leases as of
December 31, 2013
are as follows (amounts in thousands):
|
Year
|
Amount
|
||
|
2014
|
$
|
1,935
|
|
|
2015
|
1,941
|
|
|
|
2016
|
1,948
|
|
|
|
2017
|
1,955
|
|
|
|
2018
|
1,955
|
|
|
|
Thereafter
|
11,573
|
|
|
|
Total
|
$
|
21,307
|
|
F-27
Equity LifeStyle Properties, Inc.
Notes to Consolidated Financial Statements
Riverside Portfolio acquisition
On August 1, 2013, we closed on the Riverside Acquisition (See Note 5 in the Notes to Consolidated Financial Statements contained in this Form 10-K). Patrick Waite, our Executive Vice President of Operations, was formerly employed by an affiliate of Riverside Communities, as a result of which he had financial interests in the sale that resulted in him receiving his share in cash upon the closing of the acquisition. Mr. Waite did not participate in our management’s analysis, decision-making or recommendation to the Board of Directors with respect to the acquisition. In addition, David Helfand, the founder and CEO of Riverside Communities, served in various positions with us before 2005, including at various times as our Chief Financial Officer, Chief Executive Officer, and as a member of our Board of Directors. Mr. Helfand is currently Co-President of Equity Group Investments, L.L.C., an entity affiliated with Sam Zell, Chairman of our Board of Directors.
Corporate Headquarters
We lease office space from Two North Riverside Plaza Joint Venture Limited Partnership, an entity affiliated with Mr. Zell, Chairman of our Board of Directors. Payments made in accordance with the lease agreement to this entity amounted to approximately
$1.4 million
,
$0.9 million
, and
$1.0 million
for the years ended
December 31, 2013
,
2012
and
2011
, respectively.
Other
On October 18, 2012, our Chief Executive Officer, Thomas Heneghan, accepted an offer to become Chief Executive Officer of Equity International Management, LLC (“Equity International”), effective in February 2013, and he resigned as our Chief Executive Officer effective February 1, 2013. During the period from October 18, 2012 through February 1, 2013, Mr. Heneghan continued to serve as our Chief Executive Officer, but he also performed certain services for Equity International, an entity affiliated with Mr. Zell, Chairman of our Board of Directors. We paid Mr. Heneghan his regular compensation through February 1, 2013. However, in our consideration for allowing Mr. Heneghan to perform certain services for Equity International during this period, we and Equity International agreed that Equity International would reimburse us for a portion of Mr. Heneghan’s compensation in the amount of
$0.3 million
.
Our Stock Option and Stock Award Plan (the “Plan”) was adopted in December 1992 and was amended and restated from time to time, most recently effective March 23, 2001 for a ten year term. Since January 1, 2011 through the expiration of the Plan we granted to certain directors and executive officers a total of
207,330
shares of restricted stock. After March 23, 2011, when the Plan expired, we granted to certain directors, executive officers and a consultant a total of
383,330
shares of restricted stock net of the number of shares that were subsequently forfeited before vesting in private placements exempt from registration.
All the restricted stock shares (the “Restricted Stock Grants”) issued were approved by our Board of Directors at the recommendation of the Compensation, Nominating, and Corporate Governance Committee of our Board of Directors (the “Compensation Committee”). The Restricted Stock Grants were subject to conditions and restrictions, including vesting schedule and term, determined by the Compensation Committee. The amount and vesting terms of the Restricted Stock Grants were disclosed in the appropriate periods in our previously filed reports. Under Maryland law, the Restricted Stock Grants were duly authorized and validly issued, and pursuant to Section 4(a)(2) of the Securities Act of 1933, as amended, were validly issued private placements exempt from registration. The expiration of the Plan did not materially impact the accounting for these awards. At our 2014 Annual Meeting of Stockholders, we intend to ask our stockholders to ratify the Restricted Stock Grants. Shares that did not vest were forfeited. Dividends are paid on restricted stock and are not returnable, even if the underlying stock does not entirely vest. Stock Options are awarded at the New York Stock Exchange closing price of our common stock on the grant date.
Grants Issued
On
May 8, 2013
, we awarded Restricted Stock Grants for
40,000
shares of common stock at a fair market value of approximately
$1.7 million
to the members of the Board of Directors.
One-third
of the shares of restricted common stock covered by these awards vest on each of
November 8, 2013
,
May 8, 2014
, and
May 8, 2015
.
On
April 10, 2013
, we awarded Restricted Stock Grants for
2,000
shares of common stock at a fair market value of
$80,200
to a member of our senior management. These Restricted Stock Grants will vest on
December 31, 2013
.
F-28
Equity LifeStyle Properties, Inc.
Notes to Consolidated Financial Statements
Note 14—Stock Option Plan and Stock Grants (continued)
On
March 13, 2013
, we awarded Restricted Stock Grants for
666
shares of common stock at a fair market value of approximately
$24,800
to a member of the Board of Directors.
One-third
of the shares of restricted common stock covered by these awards vests on each of
September 13, 2013
,
March 13, 2014
, and
March 13, 2015
.
On
February 1, 2013
, we awarded Restricted Stock Grants for
68,666
shares of common stock at a fair market value of
$2.5 million
to certain members of our senior management. These Restricted Stock Grants will vest on
December 31, 2013
.
On
January 31, 2013
, we awarded Restricted Stock Grants for
62,000
shares of common stock at a fair market value of approximately
$2.2 million
to certain members of the Board of Directors for services rendered in 2012.
One-third
of the shares of restricted common stock covered by these awards vest on each of
December 31, 2013
,
December 31, 2014
, and
December 31, 2015
. The fair market value of our restricted stock grants is recorded as compensation expense and paid in capital over the vesting period.
On
May 8, 2012
, we awarded Restricted Stock Grants for
32,000
shares of common stock at a fair market value of approximately
$1.1 million
to the Board of Directors.
One-third
of the shares of restricted common stock covered by these awards vests on each of
November 8, 2012
,
May 8, 2013
, and
May 8, 2014
.
On
January 31, 2012
, we awarded Restricted Stock Grants for
62,000
shares of common stock at a fair market value of approximately
$2.2 million
to certain members of the Board of Directors for services rendered in 2011.
One-third
of the shares of restricted common stock covered by these awards vests on each of
December 31, 2012
,
December 31, 2013
, and
December 31, 2014
.
On
January 31, 2012
, we awarded Restricted Stock Grants for
120,664
shares of common stock to certain members of our senior management. These Restricted Stock Grants vested on
December 31, 2012
. The fair market value of these Restricted Stock Grants was approximately
$4.2 million
as of the date of grant and is recorded as a compensation expense and paid in capital over the vesting period. During 2012,
36,666
shares of this restricted stock grant valued at issuance date of approximately
$1.3 million
were relinquished by certain members of senior management.
On
May 11, 2011
, we awarded Restricted Stock Grants for
32,000
shares of common stock at a fair market value of approximately
$0.9 million
to the Board of Directors.
One-third
of the shares of restricted common stock covered by these awards vests on each of
November 11, 2011
,
May 11, 2012
, and
May 11, 2013
.
On
February 1, 2011
, we awarded Restricted Stock Grants for
145,330
shares of common stock to certain members of our senior management. These Restricted Stock Grants vested
December 31, 2011
. The fair market value of these Restricted Stock Grants was approximately
$4.2 million
as of the date of grant and is recorded as a compensation expense and paid in capital over the vesting period.
On
January 31, 2011
, we awarded Restricted Stock Grants for
62,000
shares of common stock at a fair market value of approximately
$1.8 million
to certain members of the Board of Directors.
One-third
of the shares of restricted common stock covered by these awards vests on each of
December 31, 2011
,
December 31, 2012
, and
December 31, 2013
.
We recognized compensation expense of approximately
$6.0 million
,
$5.8 million
and
$5.8 million
primarily related to Restricted Stock Grants in
2013
,
2012
and
2011
, respectively.
F-29
Equity LifeStyle Properties, Inc.
Notes to Consolidated Financial Statements
A summary of our restricted stock activity, and related information for the years ended
December 31, 2013
,
2012
, and
2011
follows:
|
Number of Shares
|
Weighted Average Grant Date Fair Value
|
||||
|
Balance at December 31, 2010
|
104,686
|
|
$
|
18.61
|
|
|
Shares granted
|
239,330
|
|
28.75
|
||
|
Shares canceled/forfeited
|
(22,666
|
)
|
28.70
|
||
|
Shares vested
|
(227,330
|
)
|
24.50
|
||
|
Balance at December 31, 2011
|
94,020
|
|
27.75
|
||
|
Shares granted
|
214,664
|
|
35.06
|
||
|
Shares canceled/forfeited
|
(36,666
|
)
|
35.07
|
||
|
Shares vested
|
(177,998
|
)
|
32.30
|
||
|
Balance at December 31, 2012
|
94,020
|
|
32.97
|
||
|
Shares granted
|
173,332
|
|
37.32
|
||
|
Shares vested
|
(167,564
|
)
|
34.97
|
||
|
Balance at December 31, 2013
|
99,788
|
|
37.17
|
||
Compensation expense to be recognized subsequent to
December 31, 2013
for Restricted Stock Grants issued prior to 2014 that has not yet vested was approximately
$3.3 million
, which is expected to be recognized over a weighted average term of
1.4 years
.
Stock Options
The fair value of each grant is estimated on the grant date using the Black-Scholes-Merton model. No options were issued, forfeited or expired during the years ended
December 31, 2013
,
2012
, and
2011
.
A summary of our stock option activity, and related information for the years ended
December 31, 2013
,
2012
, and
2011
follows:
|
Shares Subject To
Options
|
Weighted Average
Exercise Price Per Share
|
Weighted Average
Outstanding
Contractual Life
(in years)
|
|||||||
|
Balance at December 31, 2010
|
1,610,368
|
|
$
|
20.16
|
|
4.9
|
|||
|
Options canceled
|
(344,768
|
)
|
13.14
|
|
|||||
|
Balance at December 31, 2011
|
1,265,600
|
|
22.07
|
|
4.9
|
||||
|
Options exercised
|
(160,000
|
)
|
24.10
|
|
|||||
|
Balance at December 31, 2012
|
1,105,600
|
|
21.78
|
|
4.0
|
||||
|
Options exercised
|
(20,000
|
)
|
12.34
|
|
|||||
|
Balance at December 31, 2013
|
1,085,600
|
|
21.95
|
|
3.1
|
||||
|
Exercisable at December 31, 2013
|
1,085,600
|
|
21.95
|
|
3.1
|
||||
The intrinsic value of outstanding and exercisable stock options represents the excess of the closing stock price as of the end of the year, over the exercise price multiplied by the applicable number of shares that may be acquired upon exercise of stock options. For the years ending
December 31, 2013
,
2012
and
2011
, the intrinsic value of exercised options was
$0.5 million
,
$1.7 million
and
$6.1 million
, respectively. For the years ending
December 31, 2013
,
2012
and
2011
, the intrinsic value of outstanding and exercisable options was
$15.5 million
,
$13.1 million
and
$14.3 million
, respectively.
F-30
Equity LifeStyle Properties, Inc.
Notes to Consolidated Financial Statements
Our Board of Directors is authorized under our charter, without further stockholder approval, to issue, from time to time, in one or more series,
10,000,000
shares of
$0.01
par value preferred stock (the “Preferred Stock”), with specific rights, preferences and other attributes as the Board may determine, which may include preferences, powers and rights that are senior to the rights of holders of our common stock. However, under certain circumstances, the issuance of preferred stock may require stockholder approval pursuant to the rules and regulations of The New York Stock Exchange.
On December 30, 2013, in connection with the MHC Trust merger, we authorized and issued:
125
shares of our Series D Preferred Stock with a liquidation value of
$1,000.00
per share, having substantially the same terms and same rights as shares of MHC Trust’s
6%
Series A Cumulative Non-Qualified Preferred Stock, and
250
shares of our Series E Preferred Stock with a liquidation value of
$1,000.00
per share, having substantially the same terms and same rights as shares of MHC Trust’s
18.75%
Series B Cumulative Non-Voting Preferred Stock.
On
May 8, 2012
, the ability to issue shares upon conversion of the Series A Preferred Stock was approved by our common stockholders. As a result, at September 30, 2012 the Series A Preferred Stock were classified as redeemable interests within of permanent equity on our Consolidated Balance Sheet. On September 14, 2012, we issued
54,458
shares of our Series C Preferred Stock with a liquidation value of
$2,500.00
per share, which is represented by depositary shares as described below. Also on September 14, 2012, we exchanged
5,445,765
shares of our Series A Preferred Stock for
5,445,765
depositary shares, each representing 1/100
th
of a share of our Series C Preferred Stock with a liquidation value of
$25.00
per depositary share, plus accrued and unpaid dividends of
$0.3849625
per share of Series A Preferred Stock. On October 18, 2012, we redeemed the remaining
2,554,235
shares of Series A Preferred Stock at the
$25.00
per share liquidation value plus accrued and unpaid dividends of
$0.0948460
per share on such redeemed shares for approximately
$64.1 million
. Therefore, as of December 31, 2012, we did not have any Series A Preferred Stock outstanding.
On January 24, 2013, our Compensation, Nominating and Corporate Governance Committee (the “Committee”) approved a Long-Term Cash Incentive Plan Award (the “2013 LTIP”) to provide a long-term cash bonus opportunity to certain members of our management. The 2013 LTIP was approved by the Committee pursuant to the authority set forth in the Long Term Cash Incentive Plan approved by the Board of Directors on May 15, 2007. The total cumulative payment for all participants (the “Eligible Payment”) is based upon certain performance conditions being met over a three year period ending December 31, 2015.
The Committee has responsibility for administering the 2013 LTIP and may use its reasonable discretion to adjust the performance criteria or Eligible Payments to take into account the impact of any major or unforeseen transaction or event. Our executive officers are not participants in the 2013 LTIP. The Eligible Payment will be paid in cash upon completion of our annual audit for the 2015 fiscal year and upon satisfaction of the vesting conditions as outlined in the 2013 LTIP and, including employer costs, is currently estimated to be approximately
$5.8 million
. For the year ended
December 31, 2013
, we had accrued compensation expense of approximately
$1.9 million
.
The amount accrued for the 2013 LTIP reflects our estimate of the 2013 LTIP payout based on forecasts and other available information and is subject to performance in line with forecasts and final evaluation and determination by the Committee. There can be no assurances that our estimates of the probable outcome will be representative of the actual outcome.
On May 11, 2010, our Board of Directors approved a Long-Term Cash Incentive Plan (the “2010 LTIP”) to provide a long-term cash bonus opportunity to certain members of our management. Such Board approval was upon recommendation of the Committee. One participant in the 2010 LTIP was promoted to Chief Financial Officer in 2012. No other executive officers were participants in the 2010 LTIP. As of
December 31, 2012
, we had accrued compensation expense and payroll benefits of approximately
$2.6 million
, for the 2010 LTIP including approximately
$0.8 million
in the year ended
December 31, 2012
. On January 24, 2013, the Committee approved payments under the 2010 LTIP of approximately
$2.3 million
to the participants.
We have a qualified retirement plan, with a salary deferral feature designed to qualify under Section 401 of the Code (the “401(k) Plan”), to cover our employees and those of our Subsidiaries, if any. The 401(k) Plan permits our eligible employees and those of any Subsidiary to defer up to
60%
of their eligible compensation on a pre-tax basis subject to certain maximum amounts. In addition, we will match
100%
of the participant’s contribution up to the first 3% and then
50%
of the next 2% for a maximum potential match of
4%
.
F-31
Equity LifeStyle Properties, Inc.
Notes to Consolidated Financial Statements
In addition, amounts we contributed will vest, on a prorated basis, according to the participant’s vesting schedule. After five years of employment with us, the participants will be
100%
vested for all amounts we contributed. Additionally, a discretionary profit sharing component of the 401(k) Plan provides for a contribution to be made annually for each participant in an amount, if any, as we determined. All employee contributions are 100% vested. Our contribution to the 401(k) Plan was approximately
$1.3 million
for each of the years ended
December 31, 2013
and
2012
and approximately
$1.1 million
for the year ended
December 31, 2011
.
California Rent Control Litigation
As part of our effort to realize the value of our Properties subject to rent control, we have previously initiated lawsuits against certain localities in California, with the goal of achieving a level of regulatory fairness in California’s rent control jurisdictions, and in particular those jurisdictions that prohibit increasing rents to market upon turnover. Such regulations allow tenants to sell their homes for a price that includes a premium above the intrinsic value of the homes. The premium represents the value of the future discounted rent-controlled rents, which is fully capitalized into the prices of the homes sold. In our view, such regulations result in a transfer to the tenants of the value of our land, which would otherwise be reflected in market rents. We have discovered through the litigation process that certain municipalities considered condemning our Properties at values well below the value of the underlying land. In our view, a failure to articulate market rents for Sites governed by restrictive rent control would put us at risk for condemnation or eminent domain proceedings based on artificially reduced rents. Such a physical taking, should it occur, could represent substantial lost value to stockholders. We are cognizant of the need for affordable housing in the jurisdictions, but assert that restrictive rent regulation does not promote this purpose because tenants pay to their sellers as part of the purchase price of the home all the future rent savings that are expected to result from the rent control regulations, eliminating any supposed improvement in the affordability of housing. In a more well-balanced regulatory environment, we would receive market rents that would eliminate the price premium for homes, which would trade at or near their intrinsic value. Such efforts have included the following matters:
City of San Rafael
We sued the City of San Rafael on October 13, 2000 in the U.S. District Court for the Northern District of California, challenging its rent control ordinance (the “Ordinance”) on constitutional grounds. We believe the litigation was settled by the City’s agreement to amend the ordinance to permit adjustments to market rent upon turnover. The City subsequently rejected the settlement agreement. The Court refused to enforce the settlement agreement, and submitted to a jury the claim that it had been breached. In October 2002, a jury found no breach of the settlement agreement.
Our constitutional claims against the City were tried in a bench trial during April 2007. On April 17, 2009, the Court issued its Order for Entry of Judgment in our favor (the “April 2009 Order”). On June 10, 2009, the Court ordered the City to pay us net fees and costs of approximately
$2.1 million
. On June 30, 2009, as anticipated by the April 2009 Order, the Court entered final judgment that gradually phased out the City’s Site rent regulation scheme that the Court found unconstitutional. Pursuant to the final judgment, existing residents of our Property in San Rafael would be able to continue to pay Site rent as if the Ordinance were to remain in effect for a period of
10 years
, enforcement of the Ordinance was immediately enjoined with respect to new residents of the Property, and the Ordinance would expire entirely ten years from the June 30, 2009 date of judgment.
The City and the residents’ association (which intervened in the case) appealed, and we cross-appealed. On April 17, 2013,
the United States Court of Appeals for the Ninth Circuit issued an opinion in which, among other rulings, it reversed the trial court’s determinations that the Ordinance had unconstitutionally taken our property and that we were entitled to an award of attorneys’ fees and costs, and affirmed the jury verdict that the City had not breached the settlement agreement and affirmed the award to the City of approximately
$1.25 million
of attorneys’ fees and costs on the settlement agreement claims. On May 1, 2013, we filed with the Court of Appeals a petition for panel rehearing and rehearing en banc, which was denied on June 3, 2013. On June 26, 2013, the Court of Appeals’ mandate issued. On September 3, 2013, we filed a petition for review by the U.S. Supreme Court. On September 10, 2013, the City and the residents’ association each waived the right to respond to our petition. On October 7, 2013, the Supreme Court requested that a response be filed, which was filed on December 6, 2013. We filed a reply supporting our petition on December 20, 2013. On January 13, 2014, the Supreme Court issued an order denying our petition for review.
During the year ended December 31, 2013, we paid approximately
$1.4 million
related to the ruling of the Court of Appeals. On July 10, 2013, we paid to the City
$1.27 million
to satisfy, including interest, the attorneys’ fees and costs judgment affirmed by the Court of Appeals. In August 2013, we also paid to the City approximately
$0.08 million
to satisfy its claim for attorney’s fees on appeal.
F-32
Equity LifeStyle Properties, Inc.
Notes to Consolidated Financial Statements
Note 18—Commitments and Contingencies (continued)
City of Santee
On January 31, 2012, we sued the City of Santee in the United States District for the Southern District of California alleging that the City’s rent control ordinance effectuates a regulatory and private taking of our property and is unconstitutional under the Fifth and Fourteenth Amendments to the United States Constitution. On April 2, 2012, the City filed a motion to dismiss the complaint. On December 21, 2012, the Court entered an order in which it: (a) denied the City’s motion to dismiss our private taking and substantive due process claims; (b) granted the City’s motion to dismiss our procedural due process claim as not cognizable because of the availability of a state remedy of a writ of mandamus; and (c) granted the City’s motion to dismiss our regulatory taking claim as being not ripe. In addition, we also filed in the California Superior Court on February 1, 2012 a petition for a writ of administrative mandamus, and on September 28, 2012 a motion for writ of administrative mandamus, seeking orders directing that a rent increase petition we had filed with the City be granted. On April 5, 2013, the Court denied our petition for writ of administrative mandamus. On June 3, 2013, we filed an appeal to the California Court of Appeal from the denial of our petition for writ of administrative mandamus.
On September 26, 2013, we entered a settlement agreement with the City of Santee pursuant to which the City agreed to the entry of a peremptory writ of mandate by the Superior Court directing the City to grant us a special adjustment under the City’s rent control ordinance permitting us, subject to the terms of the agreement, to increase Site rents at the Meadowbrook community through January 1, 2034 as follows: (a) a one-time 2.5% rent increase on all Sites in January 2014; plus (b) annual rent increases of 100% of the consumer price index (CPI) beginning in 2014; and (c) a 10% increase in the rent on a site upon turnover of that site. Absent the settlement, the rent control ordinance limited us to annual rent increases of at most 70% of CPI with no increases on turnover of a site.
Colony Park
On December 1, 2006, a group of tenants at our Colony Park Property in Ceres, California filed a complaint in the California Superior Court for Stanislaus County alleging that we had failed to properly maintain the Property and had improperly reduced the services provided to the tenants, among other allegations. We answered the complaint by denying all material allegations and filed a counterclaim for declaratory relief and damages. The case proceeded in Superior Court because our motion to compel arbitration was denied and the denial was upheld on appeal. Trial of the case began on July 27, 2010. After just over three months of trial in which the plaintiffs asked the jury to award a total of approximately
$6.8 million
in damages, the jury rendered verdicts awarding a total of less than
$44,000
to
six
out of the
72
plaintiffs, and awarding nothing to the other
66
plaintiffs. The plaintiff’s who were awarded nothing filed a motion for a new trial or alternatively for judgment notwithstanding the jury’s verdict, which the Court denied on February 14, 2011. All but
three
of the
66
plaintiffs to whom the jury awarded nothing appealed. Oral argument in the appeal was held on September 19, 2013 and the matter was taken under submission by the California Court of Appeal.
By orders entered on December 14, 2011, the Superior Court awarded us approximately
$2.0 million
in attorneys’ fees and other costs jointly and severally against the plaintiffs to whom the jury awarded nothing, and awarded no attorneys’ fees or costs to either side with respect to the
six
plaintiffs to whom the jury awarded less than
$44,000
. Plaintiffs filed an appeal from the approximately
$2.0 million
award of our attorneys’ fees and other costs. Oral argument in that appeal was also held on September 19, 2013.
On December 3, 2013, the Court of Appeal issued a partially published opinion that rejected all of plaintiffs’ claims on appeal except one, relating to whether the park’s rules prohibited the renting of spaces to recreational vehicles. The Court of Appeal reversed the judgment on the recreational vehicle issue and remanded for further proceedings regarding that issue. Because the judgment was reversed, the award of attorney’s fees and other costs was also reversed. Both sides filed rehearing petitions with the Court of Appeal. On December 31, 2013, the Court of Appeal granted the defendants’ rehearing petition and ordered the parties to submit supplemental briefing. On January 17, 2014, each side submitted their supplemental brief. The parties await the court’s decision on rehearing.
California Hawaiian
On April 30, 2009, a group of tenants at our California Hawaiian Property in San Jose, California filed a complaint in the California Superior Court for Santa Clara County alleging that we have failed to properly maintain the Property and have improperly reduced the services provided to the tenants, among other allegations. We moved to compel arbitration and stay the proceedings, to dismiss the case, and to strike portions of the complaint. By order dated October 8, 2009, the Court granted our motion to compel arbitration and stayed the court proceedings pending the outcome of the arbitration. The plaintiffs filed with the California Court of Appeal a petition for a writ seeking to overturn the trial court’s arbitration and stay orders. On May 10, 2011, the Court of Appeal granted the petition and ordered the trial court to vacate its order compelling arbitration and to restore the matter to its litigation calendar for further proceedings. On May 24, 2011, we filed a petition for rehearing requesting the Court of Appeal to reconsider its May 10, 2011 decision. On June 8, 2011, the Court of Appeal denied the petition for rehearing. On June 16, 2011, we filed with
F-33
Equity LifeStyle Properties, Inc.
Notes to Consolidated Financial Statements
Note 18—Commitments and Contingencies (continued)
the California Supreme Court a petition for review of the Court of Appeal’s decision. On August 17, 2011, the California Supreme Court denied the petition for review. The trial commenced on January 27, 2014. We believe that the allegations in the complaint are without merit, and intend to vigorously defend the litigation.
Membership litigation
On July 29, 2011, we were served with a class action lawsuit in California state court filed by
two
named plaintiffs, who are husband and wife. Among other allegations, the suit alleged that the plaintiffs purchased a membership in our Thousand Trails network of campgrounds and paid annual dues; that they were unable to make a reservation to utilize one of the campgrounds because, they were told, their membership did not permit them to utilize that particular campground; that we failed to comply with the written disclosure requirements of various states’ membership camping statutes; that we misrepresented that we provide a money-back guaranty; and that we misrepresented that the campgrounds or portions of the campgrounds would be limited to use by members. On August 19, 2011, we filed an answer generally denying the allegations of the complaint, and asserting affirmative defenses. On August 23, 2011, we removed the case from the California state court to the federal district court in San Jose. On July 23, 2012, we filed a motion to deny class certification. On March 18, 2013, the Court entered an order denying class certification and denying the plaintiffs’ motion for leave to
amend their class action complaint. The parties agreed to a confidential settlement of the individual claims of the two named plaintiffs.
Litigation Relating to Potential Acquisition of Certain RV Resorts
On November 9, 2012, we entered a letter of intent with Morgan RV Resorts (“Morgan”), which granted us a right of exclusive dealing and a right of first refusal (“ROFR”) with respect to the purchase of
15
of Morgan’s RV resorts. On December 13, 2012, Sun Communities, Inc. announced in an SEC filing that certain of its affiliates (collectively, “Sun”) had entered into a contract with Morgan to purchase
11
of those same properties, as a result of which we subsequently exercised our ROFR. In a suit initiated by Sun on December 26, 2012 against us and Morgan in the Oakland County (Michigan) Circuit Court, the parties litigated the issue of who had the right to the properties. On February 12, 2013, Sun announced in an SEC filing that it had closed its purchase from Morgan on
ten
of the
11
properties at issue. On September 16, 2013, the parties resolved the dispute by entering a confidential settlement agreement as a result of which we acquired the eleventh property, Fiesta Key RV Resort, and certain other assets, and the litigation was dismissed with prejudice.
Hurricane Claim Litigation
On June 22, 2007, we filed suit in the Circuit Court of Cook County, Illinois (Case No. 07CH16548), against our insurance carriers, Hartford Fire Insurance Company, Essex Insurance Company (“Essex”), Lexington Insurance Company and Westchester Surplus Lines Insurance Company (“Westchester”), regarding a coverage dispute arising from losses we suffered as a result of hurricanes that occurred in Florida in 2004 and 2005. We also brought claims against Aon Risk Services, Inc. of Illinois (“Aon”), our former insurance broker, regarding the procurement of our appropriate insurance coverage. We sought declaratory relief establishing the coverage obligations of our carriers, as well as a judgment for breach of contract, breach of the covenant of good faith and fair dealing, unfair settlement practices and, as to Aon, for failure to provide ordinary care in the selling and procuring of insurance. The claims involved in this action were approximately
$11.0 million
.
In response to motions to dismiss, the trial court dismissed: (1) the requests for declaratory relief as being duplicative of the claims for breach of contract and (2) certain of the breach of contract claims as being not ripe until the limits of underlying insurance policies have been exhausted. On or about January 28, 2008, we filed our Second Amended Complaint (“SAC”), which the insurers answered. In response to the court’s dismissal of the SAC’s claims against Aon, we ultimately filed, on February 2, 2009, a new Count VIII against Aon alleging a claim for breach of contract, which Aon answered. In January 2010, the parties engaged in a settlement mediation, which did not result in a settlement. In June 2010, we filed motions for partial summary judgment against the insurance companies seeking a finding that our hurricane debris cleanup costs were within the extra expense coverage of our excess insurance policies. On December 13, 2010, the Court granted the motion. Discovery proceeded with respect to various remaining issues, including the amounts of the debris cleanup costs we were entitled to collect pursuant to the Court’s order granting us partial summary judgment.
On August 6, 2012, we were served with motions by Essex and Westchester seeking leave to amend their pleadings, which the Court subsequently allowed, to add affirmative defenses seeking to bar recovery on the alleged ground that the claim we submitted for hurricane-related losses allegedly intentionally concealed and misrepresented that a portion of that claim was not hurricane-related, and to add a counterclaim seeking on the same alleged ground reimbursement of approximately
$2.4 million
Essex previously paid (the “Additional Affirmative Defenses and Counterclaim”). We believe that the Additional Affirmative Defenses and Counterclaim were without merit, and vigorously contested them. The parties filed motions for partial summary
F-34
Equity LifeStyle Properties, Inc.
Notes to Consolidated Financial Statements
judgment with respect to certain of the claims for coverage that remained in the case, on which the court heard oral argument on April 2, 2013 and took under advisement. On April 22, 2013, Essex and Westchester filed an additional motion for summary judgment, which related to their Additional Affirmative Defenses and Counterclaim, on which the court heard oral arguments on June 27, 2013. On August 12, 2013, the court ruled in our favor on most of the issues presented in the motions for summary judgment, except that it reversed the earlier decision (made by a different judge who subsequently retired) that had granted us partial summary judgment that our hurricane debris cleanup costs were within the extra expense coverage of our excess insurance policies. On September 11, 2013, in response to our request for reconsideration of that reversal, the court ordered full briefing and a hearing on the issue. On December 2, 2013, the remaining parties entered a settlement agreement, pursuant to which the case was dismissed with prejudice.
Since suffering the losses at issue we have entered settlements of our claims with the various insurers and Aon and also received additional payments from certain of the insurers since filing the lawsuit collectively totaling approximately
$9.4 million
. During the year ended December 31, 2013, we received insurance proceeds of approximately
$1.6 million
net of
$0.4 million
of legal expenses (amounts are presented in the Income from Other Investment, net line in our Consolidated Statement of Income).
Other
We are involved in various other legal and regulatory proceedings arising in the ordinary course of business. Such proceedings include, but are not limited to, notices, consent decrees, information requests, and additional permit requirements and other similar enforcement actions by governmental agencies relating to our water and wastewater treatment plants and other waste treatment facilities. Additionally, in the ordinary course of business, our operations are subject to audit by various taxing authorities. Management believes that all proceedings herein described or referred to, taken together, are not expected to have a material adverse impact on us. In addition, to the extent any such proceedings or audits relate to newly acquired Properties, we consider any potential indemnification obligations of sellers in our favor.
Operating segments are defined as components of an entity for which separate financial information is available that is evaluated regularly by the chief operating decision maker. The chief operating decision maker evaluates and assesses performance on a monthly basis. Segment operating performance is measured on Net Operating Income (“NOI”). NOI is defined as total operating revenues less total operating expenses. Segments are assessed before interest income, depreciation and amortization of in-place leases.
We have
two
reportable segments which are: (i) the Property Operations and (ii) Home Sales and Rentals Operations Segments. The Property Operations segment owns and operates land lease Properties and the Home Sales and Rentals Operations segment purchases, sells and leases homes at the Properties.
All revenues are from external customers and there is no customer who contributed 10% or more of our total revenues during the three years ended
December 31, 2013
,
2012
, and
2011
.
F-35
Equity LifeStyle Properties, Inc.
Notes to Consolidated Financial Statements
Note 19—Reportable Segments (continued)
The following tables summarize our segment financial information (amounts in thousands):
Year Ended
December 31, 2013
|
Property
Operations
|
Home Sales
and Rentals
Operations
|
Consolidated
|
|||||||||
|
Operations revenues
|
$
|
679,319
|
|
$
|
33,281
|
|
$
|
712,600
|
|
||
|
Operations expenses
|
(328,795
|
)
|
(26,855
|
)
|
(355,650
|
)
|
|||||
|
Income from segment operations
|
350,524
|
|
6,426
|
|
356,950
|
|
|||||
|
Interest income
|
3,397
|
|
4,373
|
|
7,770
|
|
|||||
|
Depreciation on real estate and rental homes
|
(101,374
|
)
|
(6,855
|
)
|
(108,229
|
)
|
|||||
|
Amortization of in-place leases
|
(1,940
|
)
|
—
|
|
(1,940
|
)
|
|||||
|
Income from operations
|
$
|
250,607
|
|
$
|
3,944
|
|
254,551
|
|
|||
|
Reconciliation to Consolidated net income
|
|||||||||||
|
Corporate interest income
|
490
|
|
|||||||||
|
Other revenues
|
7,515
|
|
|||||||||
|
General and administrative
|
(28,211
|
)
|
|||||||||
|
Early debt retirement
|
(37,844
|
)
|
|||||||||
|
Interest and related amortization
|
(118,522
|
)
|
|||||||||
|
Rent control initiatives and other
|
(2,771
|
)
|
|||||||||
|
Equity in income of unconsolidated joint ventures
|
2,039
|
|
|||||||||
|
Gain on sale of property, net of tax
|
41,525
|
|
|||||||||
|
Discontinued operations
|
7,133
|
|
|||||||||
|
Consolidated net income
|
$
|
125,905
|
|
||||||||
|
Total assets
|
$
|
3,096,156
|
|
$
|
295,483
|
|
$
|
3,391,639
|
|
||
|
Capital improvements
|
$
|
26,430
|
|
$
|
38,284
|
|
$
|
64,714
|
|
||
F-36
Equity LifeStyle Properties, Inc.
Notes to Consolidated Financial Statements
Note 19—Reportable Segments (continued)
Year Ended
December 31, 2012
|
Property
Operations
|
Home Sales
and Rentals
Operations
|
Consolidated
|
|||||||||
|
Operations revenues
|
$
|
647,731
|
|
$
|
21,045
|
|
$
|
668,776
|
|
||
|
Operations expenses
|
(311,694
|
)
|
(16,778
|
)
|
(328,472
|
)
|
|||||
|
Income from segment operations
|
336,037
|
|
4,267
|
|
340,304
|
|
|||||
|
Interest income
|
3,075
|
|
4,614
|
|
7,689
|
|
|||||
|
Depreciation on real estate and rental homes
|
(96,419
|
)
|
(5,664
|
)
|
(102,083
|
)
|
|||||
|
Amortization of in-place leases
|
(38,694
|
)
|
(773
|
)
|
(39,467
|
)
|
|||||
|
Income from operations
|
$
|
203,999
|
|
$
|
2,444
|
|
206,443
|
|
|||
|
Reconciliation to Consolidated net income
|
|||||||||||
|
Corporate interest income
|
446
|
|
|||||||||
|
Other revenues
|
6,795
|
|
|||||||||
|
General and administrative
|
(26,388
|
)
|
|||||||||
|
Interest and related amortization
|
(123,992
|
)
|
|||||||||
|
Rent control initiatives and other
|
(1,456
|
)
|
|||||||||
|
Equity in income of unconsolidated joint ventures
|
1,899
|
|
|||||||||
|
Gain on sale of property, net of tax
|
4,596
|
|
|||||||||
|
Discontinued operations
|
6,116
|
|
|||||||||
|
Consolidated net income
|
$
|
74,459
|
|
||||||||
|
Assets held for use
|
$
|
2,984,766
|
|
$
|
293,608
|
|
$
|
3,278,374
|
|
||
|
Assets held for disposition
|
119,852
|
|
|||||||||
|
Total assets
|
$
|
3,398,226
|
|
||||||||
|
Capital improvements
|
$
|
30,863
|
|
$
|
44,397
|
|
$
|
75,260
|
|
||
Year Ended
December 31, 2011
|
Property
Operations
|
Home Sales
and Rentals
Operations
|
Consolidated
|
|||||||||
|
Operations revenues
|
$
|
550,529
|
|
$
|
14,104
|
|
$
|
564,633
|
|
||
|
Operations expenses
|
(275,584
|
)
|
(11,699
|
)
|
(287,283
|
)
|
|||||
|
Income from segment operations
|
274,945
|
|
2,405
|
|
277,350
|
|
|||||
|
Interest income
|
3,377
|
|
2,264
|
|
5,641
|
|
|||||
|
Depreciation on real estate
|
(78,838
|
)
|
(4,175
|
)
|
(83,013
|
)
|
|||||
|
Amortization of in-place leases
|
(22,683
|
)
|
(443
|
)
|
(23,126
|
)
|
|||||
|
Income from operations
|
$
|
176,801
|
|
$
|
51
|
|
176,852
|
|
|||
|
Reconciliation to Consolidated net income
|
|||||||||||
|
Corporate interest income
|
283
|
|
|||||||||
|
Other revenues
|
6,452
|
|
|||||||||
|
General and administrative
|
(42,046
|
)
|
|||||||||
|
Interest and related amortization
|
(99,489
|
)
|
|||||||||
|
Rent control initiatives and other
|
(2,043
|
)
|
|||||||||
|
Equity in income of unconsolidated joint ventures
|
1,948
|
|
|||||||||
|
Discontinued operations
|
547
|
|
|||||||||
|
Consolidated net income
|
$
|
42,504
|
|
||||||||
|
Assets held for use
|
$
|
3,172,222
|
|
$
|
201,551
|
|
$
|
3,373,773
|
|
||
|
Assets held for disposition
|
122,328
|
|
|||||||||
|
Total assets
|
$
|
3,496,101
|
|
||||||||
|
Capital improvements
|
$
|
26,224
|
|
$
|
35,808
|
|
$
|
62,032
|
|
||
F-37
Equity LifeStyle Properties, Inc.
Notes to Consolidated Financial Statements
The following table summarizes our financial information for the Property Operations segment for the years ended
December 31, 2013
,
2012
, and
2011
(amounts in thousands):
|
December 31,
2013 |
December 31,
2012 |
December 31,
2011 |
||||||||||
|
Revenues:
|
||||||||||||
|
Community base rental income
|
$
|
409,801
|
|
$
|
394,606
|
|
$
|
309,230
|
|
|||
|
Resort base rental income
|
147,234
|
|
134,327
|
|
130,489
|
|
||||||
|
Right-to-use annual payments
|
47,967
|
|
47,662
|
|
49,122
|
|
||||||
|
Right-to-use contracts current period, gross
|
13,142
|
|
13,433
|
|
17,856
|
|
||||||
|
Right-to-use contracts current period, deferred
|
(5,694
|
)
|
(6,694
|
)
|
(11,936
|
)
|
||||||
|
Utility income and other
|
63,800
|
|
62,470
|
|
53,116
|
|
||||||
|
Ancillary services revenues, net
|
3,069
|
|
1,927
|
|
2,652
|
|
||||||
|
Total property operations revenues
|
679,319
|
|
647,731
|
|
550,529
|
|
||||||
|
Expenses:
|
||||||||||||
|
Property operating and maintenance
|
229,897
|
|
220,415
|
|
197,781
|
|
||||||
|
Real estate taxes
|
48,279
|
|
45,590
|
|
36,528
|
|
||||||
|
Sales and marketing, gross
|
12,836
|
|
10,845
|
|
11,218
|
|
||||||
|
Sales and marketing deferred commissions, net
|
(2,410
|
)
|
(3,155
|
)
|
(4,789
|
)
|
||||||
|
Property management
|
40,193
|
|
37,999
|
|
34,846
|
|
||||||
|
Total property operations expenses
|
328,795
|
|
311,694
|
|
275,584
|
|
||||||
|
Income from property operations segment
|
$
|
350,524
|
|
$
|
336,037
|
|
$
|
274,945
|
|
|||
The following table summarizes our financial information for the Home Sales and Rentals Operations segment, specific to continuing operations, for the years ended
December 31, 2013
,
2012
, and
2011
(amounts in thousands):
|
December 31,
2013 |
December 31,
2012 |
December 31,
2011 |
|||||||||
|
Revenues:
|
|||||||||||
|
Gross revenue from home sales
|
$
|
17,871
|
|
$
|
8,230
|
|
$
|
6,028
|
|
||
|
Brokered resale revenues, net
|
1,143
|
|
1,166
|
|
831
|
|
|||||
|
Rental home income
(a)
|
14,267
|
|
11,649
|
|
7,245
|
|
|||||
|
Total revenues
|
33,281
|
|
21,045
|
|
14,104
|
|
|||||
|
Expenses:
|
|||||||||||
|
Cost of home sales
|
17,296
|
|
9,018
|
|
5,615
|
|
|||||
|
Home selling expenses
|
2,085
|
|
1,391
|
|
1,591
|
|
|||||
|
Rental home operating and maintenance
|
7,474
|
|
6,369
|
|
4,493
|
|
|||||
|
Total expenses
|
26,855
|
|
16,778
|
|
11,699
|
|
|||||
|
Income from home sales and rentals operations segment
|
$
|
6,426
|
|
$
|
4,267
|
|
$
|
2,405
|
|
||
|
(a)
|
Segment information does not include Site rental income included in Community base rental income.
|
F-38
Equity LifeStyle Properties, Inc.
Notes to Consolidated Financial Statements
The following is unaudited quarterly data for
2013
and
2012
(amounts in thousands, except for per share amounts):
|
2013
|
First
Quarter 03/31 |
Second
Quarter 6/30 |
Third
Quarter 9/30 |
Fourth
Quarter 12/31 |
||||||||||||
|
Total revenues
|
$
|
183,775
|
|
$
|
176,753
|
|
$
|
187,966
|
|
$
|
179,881
|
|
||||
|
Income from operations
|
$
|
70,332
|
|
$
|
56,597
|
|
$
|
64,779
|
|
$
|
62,843
|
|
||||
|
Consolidated net income
|
$
|
40,470
|
|
$
|
21,786
|
|
$
|
34,936
|
|
$
|
28,713
|
|
||||
|
Net income available for Common Shares
|
$
|
35,027
|
|
$
|
17,860
|
|
$
|
29,872
|
|
$
|
24,160
|
|
||||
|
Weighted average Common Shares outstanding—Basic
|
83,026
|
|
83,021
|
|
83,021
|
|
83,003
|
|
||||||||
|
Weighted average Common Shares outstanding—Diluted
|
91,060
|
|
91,128
|
|
91,259
|
|
91,334
|
|
||||||||
|
Net income per Common Share outstanding—Basic
|
$
|
0.42
|
|
$
|
0.22
|
|
$
|
0.36
|
|
$
|
0.29
|
|
||||
|
Net income per Common Share outstanding—Diluted
|
$
|
0.42
|
|
$
|
0.21
|
|
$
|
0.36
|
|
$
|
0.29
|
|
||||
|
2012
|
First
Quarter 03/31 |
Second
Quarter 6/30 |
Third
Quarter 9/30 |
Fourth
Quarter 12/31 |
||||||||||||
|
Total revenues
(a)
|
$
|
174,947
|
|
$
|
168,383
|
|
$
|
175,064
|
|
$
|
165,312
|
|
||||
|
Income from operations
(a)
|
$
|
52,535
|
|
$
|
41,657
|
|
$
|
53,882
|
|
$
|
58,369
|
|
||||
|
Consolidated net income
(a)
|
$
|
17,654
|
|
$
|
6,298
|
|
$
|
21,492
|
|
$
|
29,015
|
|
||||
|
Net income available for Common Shares
(a)
|
$
|
12,432
|
|
$
|
2,063
|
|
$
|
16,009
|
|
$
|
24,275
|
|
||||
|
Weighted average Common Shares outstanding—Basic
|
82,176
|
|
82,262
|
|
82,380
|
|
82,569
|
|
||||||||
|
Weighted average Common Shares outstanding—Diluted
|
90,738
|
|
90,780
|
|
90,894
|
|
90,944
|
|
||||||||
|
Net income per Common Share outstanding—Basic
|
$
|
0.15
|
|
$
|
0.03
|
|
$
|
0.19
|
|
$
|
0.29
|
|
||||
|
Net income per Common Share outstanding—Diluted
|
$
|
0.15
|
|
$
|
0.02
|
|
$
|
0.19
|
|
$
|
0.29
|
|
||||
______________________________________
|
(a)
|
Certain 2012 amounts have been reclassified to conform to the 2013 presentation. The reclassification had no material effect on the consolidated financial statements.
|
F-39
Schedule III
Equity LifeStyle Properties, Inc.
Real Estate and Accumulated Depreciation
December 31, 2013
(amounts in thousands)
|
|
|
|
|
Initial Cost to
Company
|
Costs Capitalized
Subsequent to
Acquisition
(Improvements)
|
Gross Amount Carried
at Close of
Period 12/31/13
|
|
|
||||||||||||||||||||||||||||||||||
|
Real Estate
(1)
|
Location
|
Encumbrances
|
Land
|
Depreciable
Property
|
Land
|
Depreciable
Property
|
Land
|
Depreciable
Property
|
Total
|
Accumulated
Depreciation
|
Date of
Acquisition
|
|||||||||||||||||||||||||||||||
|
Properties Held for Long Term
|
||||||||||||||||||||||||||||||||||||||||||
|
Hidden Cove
|
Arley
|
AL
|
$
|
—
|
|
$
|
212
|
|
$
|
610
|
|
$
|
—
|
|
$
|
37
|
|
$
|
212
|
|
$
|
647
|
|
$
|
859
|
|
$
|
(178
|
)
|
2006
|
||||||||||||
|
Apache East
|
Apache Junction
|
AZ
|
—
|
|
2,236
|
|
4,181
|
|
—
|
|
16
|
|
2,236
|
|
4,197
|
|
6,433
|
|
(618
|
)
|
2011
|
|||||||||||||||||||||
|
Apollo Village
|
Phoenix
|
AZ
|
—
|
|
932
|
|
3,219
|
|
—
|
|
1,486
|
|
932
|
|
4,705
|
|
5,637
|
|
(2,704
|
)
|
1994
|
|||||||||||||||||||||
|
Araby
|
Yuma
|
AZ
|
(3,020
|
)
|
1,440
|
|
4,345
|
|
—
|
|
752
|
|
1,440
|
|
5,097
|
|
6,537
|
|
(1,642
|
)
|
2003
|
|||||||||||||||||||||
|
Cactus Gardens
|
Yuma
|
AZ
|
(4,113
|
)
|
1,992
|
|
5,984
|
|
—
|
|
332
|
|
1,992
|
|
6,316
|
|
8,308
|
|
(2,004
|
)
|
2004
|
|||||||||||||||||||||
|
Capri RV
|
Yuma
|
AZ
|
(4,606
|
)
|
1,595
|
|
4,774
|
|
—
|
|
237
|
|
1,595
|
|
5,011
|
|
6,606
|
|
(1,305
|
)
|
2006
|
|||||||||||||||||||||
|
Carefree Manor
|
Phoenix
|
AZ
|
—
|
|
706
|
|
3,040
|
|
—
|
|
832
|
|
706
|
|
3,872
|
|
4,578
|
|
(1,965
|
)
|
1998
|
|||||||||||||||||||||
|
Casa del Sol East II
|
Glendale
|
AZ
|
(4,393
|
)
|
2,103
|
|
6,283
|
|
—
|
|
2,781
|
|
2,103
|
|
9,064
|
|
11,167
|
|
(3,708
|
)
|
1996
|
|||||||||||||||||||||
|
Casa del Sol East III
|
Glendale
|
AZ
|
—
|
|
2,450
|
|
7,452
|
|
—
|
|
708
|
|
2,450
|
|
8,160
|
|
10,610
|
|
(4,174
|
)
|
1998
|
|||||||||||||||||||||
|
Casa del Sol West I
|
Peoria
|
AZ
|
(9,301
|
)
|
2,215
|
|
6,467
|
|
—
|
|
2,224
|
|
2,215
|
|
8,691
|
|
10,906
|
|
(3,905
|
)
|
1996
|
|||||||||||||||||||||
|
Casita Verde RV
|
Casa Grande
|
AZ
|
(2,073
|
)
|
719
|
|
2,179
|
|
—
|
|
86
|
|
719
|
|
2,265
|
|
2,984
|
|
(608
|
)
|
2006
|
|||||||||||||||||||||
|
Central Park
|
Phoenix
|
AZ
|
—
|
|
1,612
|
|
3,784
|
|
—
|
|
1,596
|
|
1,612
|
|
5,380
|
|
6,992
|
|
(4,531
|
)
|
1983
|
|||||||||||||||||||||
|
Countryside RV
|
Apache Junction
|
AZ
|
—
|
|
2,056
|
|
6,241
|
|
—
|
|
1,254
|
|
2,056
|
|
7,495
|
|
9,551
|
|
(2,758
|
)
|
2002
|
|||||||||||||||||||||
|
Denali Park
|
Apache Junction
|
AZ
|
—
|
|
2,394
|
|
4,016
|
|
—
|
|
19
|
|
2,394
|
|
4,035
|
|
6,429
|
|
(592
|
)
|
2011
|
|||||||||||||||||||||
|
Desert Paradise
|
Yuma
|
AZ
|
—
|
|
666
|
|
2,011
|
|
—
|
|
201
|
|
666
|
|
2,212
|
|
2,878
|
|
(748
|
)
|
2004
|
|||||||||||||||||||||
|
Desert Skies
|
Phoenix
|
AZ
|
—
|
|
792
|
|
3,126
|
|
—
|
|
691
|
|
792
|
|
3,817
|
|
4,609
|
|
(1,975
|
)
|
1998
|
|||||||||||||||||||||
|
Desert Vista
|
Salome
|
AZ
|
—
|
|
66
|
|
268
|
|
—
|
|
97
|
|
66
|
|
365
|
|
431
|
|
(51
|
)
|
2010
|
|||||||||||||||||||||
|
Fairview Manor
|
Tucson
|
AZ
|
—
|
|
1,674
|
|
4,708
|
|
—
|
|
2,062
|
|
1,674
|
|
6,770
|
|
8,444
|
|
(3,455
|
)
|
1998
|
|||||||||||||||||||||
|
Fiesta Grande RV
|
Casa Grande
|
AZ
|
(8,751
|
)
|
2,869
|
|
8,653
|
|
—
|
|
429
|
|
2,869
|
|
9,082
|
|
11,951
|
|
(2,397
|
)
|
2006
|
|||||||||||||||||||||
|
Foothill
|
Yuma
|
AZ
|
—
|
|
459
|
|
1,402
|
|
—
|
|
213
|
|
459
|
|
1,615
|
|
2,074
|
|
(547
|
)
|
2003
|
|||||||||||||||||||||
|
Foothills West RV
|
Casa Grande
|
AZ
|
(2,142
|
)
|
747
|
|
2,261
|
|
—
|
|
251
|
|
747
|
|
2,512
|
|
3,259
|
|
(665
|
)
|
2006
|
|||||||||||||||||||||
|
Golden Sun RV
|
Apache Junction
|
AZ
|
—
|
|
1,678
|
|
5,049
|
|
—
|
|
301
|
|
1,678
|
|
5,350
|
|
7,028
|
|
(2,048
|
)
|
2002
|
|||||||||||||||||||||
|
Hacienda De Valencia
|
Mesa
|
AZ
|
(13,726
|
)
|
833
|
|
2,701
|
|
—
|
|
4,622
|
|
833
|
|
7,323
|
|
8,156
|
|
(4,877
|
)
|
1984
|
|||||||||||||||||||||
|
Mesa Verde
|
Cottonwood
|
AZ
|
—
|
|
1,387
|
|
4,148
|
|
—
|
|
455
|
|
1,387
|
|
4,603
|
|
5,990
|
|
(1,095
|
)
|
2007
|
|||||||||||||||||||||
|
Monte Vista
|
Mesa
|
AZ
|
(24,764
|
)
|
11,402
|
|
34,355
|
|
—
|
|
3,899
|
|
11,402
|
|
38,254
|
|
49,656
|
|
(12,058
|
)
|
2004
|
|||||||||||||||||||||
|
Palm Shadows
|
Glendale
|
AZ
|
(5,974
|
)
|
1,400
|
|
4,218
|
|
—
|
|
1,133
|
|
1,400
|
|
5,351
|
|
6,751
|
|
(3,470
|
)
|
1993
|
|||||||||||||||||||||
|
Paradise
|
Sun City
|
AZ
|
(14,379
|
)
|
6,414
|
|
19,263
|
|
11
|
|
2,107
|
|
6,425
|
|
21,370
|
|
27,795
|
|
(7,410
|
)
|
2004
|
|||||||||||||||||||||
|
Sedona Shadows
|
Sedona
|
AZ
|
(10,530
|
)
|
1,096
|
|
3,431
|
|
—
|
|
1,351
|
|
1,096
|
|
4,782
|
|
5,878
|
|
(2,421
|
)
|
1997
|
|||||||||||||||||||||
|
Seyenna Vistas
|
Mesa
|
AZ
|
—
|
|
1,360
|
|
4,660
|
|
—
|
|
2,682
|
|
1,360
|
|
7,342
|
|
8,702
|
|
(4,309
|
)
|
1994
|
|||||||||||||||||||||
|
Suni Sands
|
Yuma
|
AZ
|
—
|
|
1,249
|
|
3,759
|
|
—
|
|
365
|
|
1,249
|
|
4,124
|
|
5,373
|
|
(1,363
|
)
|
2004
|
|||||||||||||||||||||
S-1
Schedule III
Equity LifeStyle Properties, Inc.
Real Estate and Accumulated Depreciation
December 31, 2013
(amounts in thousands)
|
|
|
|
|
Initial Cost to
Company
|
Costs Capitalized
Subsequent to
Acquisition
(Improvements)
|
Gross Amount Carried
at Close of Period 12/31/13 |
|
|
||||||||||||||||||||||||||||||||||
|
Real Estate
(1)
|
Location
|
Encumbrances
|
Land
|
Depreciable
Property
|
Land
|
Depreciable
Property
|
Land
|
Depreciable
Property
|
Total
|
Accumulated
Depreciation
|
Date of
Acquisition
|
|||||||||||||||||||||||||||||||
|
Sunrise Heights
|
Phoenix
|
AZ
|
$
|
—
|
|
$
|
1,000
|
|
$
|
3,016
|
|
$
|
—
|
|
$
|
1,499
|
|
$
|
1,000
|
|
$
|
4,515
|
|
$
|
5,515
|
|
$
|
(2,533
|
)
|
1994
|
||||||||||||
|
Sunshine Valley
|
Chandler
|
AZ
|
—
|
|
9,139
|
|
12,912
|
|
—
|
|
44
|
|
9,139
|
|
12,956
|
|
22,095
|
|
(1,866
|
)
|
2011
|
|||||||||||||||||||||
|
The Highlands at Brentwood
|
Mesa
|
AZ
|
(13,504
|
)
|
1,997
|
|
6,024
|
|
—
|
|
2,010
|
|
1,997
|
|
8,034
|
|
10,031
|
|
(5,001
|
)
|
1993
|
|||||||||||||||||||||
|
The Meadows
|
Tempe
|
AZ
|
—
|
|
2,613
|
|
7,887
|
|
—
|
|
3,799
|
|
2,613
|
|
11,686
|
|
14,299
|
|
(6,814
|
)
|
1994
|
|||||||||||||||||||||
|
Valley Vista
|
Benson
|
AZ
|
—
|
|
115
|
|
429
|
|
—
|
|
38
|
|
115
|
|
467
|
|
582
|
|
(67
|
)
|
2010
|
|||||||||||||||||||||
|
Venture In
|
Show Low
|
AZ
|
(6,173
|
)
|
2,050
|
|
6,188
|
|
—
|
|
361
|
|
2,050
|
|
6,549
|
|
8,599
|
|
(1,774
|
)
|
2006
|
|||||||||||||||||||||
|
Verde Valley
|
Cottonwood
|
AZ
|
—
|
|
1,437
|
|
3,390
|
|
19
|
|
1,117
|
|
1,456
|
|
4,507
|
|
5,963
|
|
(1,328
|
)
|
2004
|
|||||||||||||||||||||
|
Viewpoint
|
Mesa
|
AZ
|
(58,253
|
)
|
24,890
|
|
56,340
|
|
15
|
|
6,709
|
|
24,905
|
|
63,049
|
|
87,954
|
|
(20,461
|
)
|
2004
|
|||||||||||||||||||||
|
Westpark
|
Wickenburg
|
AZ
|
(9,607
|
)
|
4,495
|
|
10,517
|
|
—
|
|
89
|
|
4,495
|
|
10,606
|
|
15,101
|
|
(1,438
|
)
|
2011
|
|||||||||||||||||||||
|
Whispering Palms
|
Phoenix
|
AZ
|
—
|
|
670
|
|
2,141
|
|
—
|
|
328
|
|
670
|
|
2,469
|
|
3,139
|
|
(1,342
|
)
|
1998
|
|||||||||||||||||||||
|
Cultus Lake
|
Lindell Beach
|
BC
|
—
|
|
410
|
|
968
|
|
5
|
|
207
|
|
415
|
|
1,175
|
|
1,590
|
|
(352
|
)
|
2004
|
|||||||||||||||||||||
|
California Hawaiian
|
San Jose
|
CA
|
(31,145
|
)
|
5,825
|
|
17,755
|
|
—
|
|
3,353
|
|
5,825
|
|
21,108
|
|
26,933
|
|
(11,206
|
)
|
1997
|
|||||||||||||||||||||
|
Colony Park
|
Ceres
|
CA
|
—
|
|
890
|
|
2,837
|
|
—
|
|
791
|
|
890
|
|
3,628
|
|
4,518
|
|
(1,983
|
)
|
1998
|
|||||||||||||||||||||
|
Concord Cascade
|
Pacheco
|
CA
|
(11,508
|
)
|
985
|
|
3,016
|
|
—
|
|
1,989
|
|
985
|
|
5,005
|
|
5,990
|
|
(4,023
|
)
|
1983
|
|||||||||||||||||||||
|
Contempo Marin
|
San Rafael
|
CA
|
—
|
|
4,787
|
|
16,379
|
|
—
|
|
3,264
|
|
4,787
|
|
19,643
|
|
24,430
|
|
(12,602
|
)
|
1994
|
|||||||||||||||||||||
|
Coralwood
|
Modesto
|
CA
|
(5,629
|
)
|
—
|
|
5,047
|
|
—
|
|
533
|
|
—
|
|
5,580
|
|
5,580
|
|
(3,097
|
)
|
1997
|
|||||||||||||||||||||
|
Date Palm Country Club
|
Cathedral City
|
CA
|
—
|
|
—
|
|
18,179
|
|
—
|
|
4,831
|
|
—
|
|
23,010
|
|
23,010
|
|
(14,796
|
)
|
1994
|
|||||||||||||||||||||
|
Date Palm RV
|
Cathedral City
|
CA
|
—
|
|
—
|
|
216
|
|
—
|
|
330
|
|
—
|
|
546
|
|
546
|
|
(355
|
)
|
1994
|
|||||||||||||||||||||
|
DeAnza Santa Cruz
|
Santa Cruz
|
CA
|
(12,842
|
)
|
2,103
|
|
7,201
|
|
—
|
|
2,740
|
|
2,103
|
|
9,941
|
|
12,044
|
|
(5,846
|
)
|
1994
|
|||||||||||||||||||||
|
Four Seasons
|
Fresno
|
CA
|
—
|
|
756
|
|
2,348
|
|
—
|
|
495
|
|
756
|
|
2,843
|
|
3,599
|
|
(1,530
|
)
|
1997
|
|||||||||||||||||||||
|
Idyllwild
|
Pine Cove
|
CA
|
—
|
|
313
|
|
737
|
|
4
|
|
910
|
|
317
|
|
1,647
|
|
1,964
|
|
(455
|
)
|
2004
|
|||||||||||||||||||||
|
Laguna Lake
|
San Luis Obispo
|
CA
|
—
|
|
2,845
|
|
6,520
|
|
—
|
|
598
|
|
2,845
|
|
7,118
|
|
9,963
|
|
(3,862
|
)
|
1998
|
|||||||||||||||||||||
|
Lake Minden
|
Nicolaus
|
CA
|
—
|
|
961
|
|
2,267
|
|
13
|
|
780
|
|
974
|
|
3,047
|
|
4,021
|
|
(898
|
)
|
2004
|
|||||||||||||||||||||
|
Lake of the Springs
|
Oregon House
|
CA
|
—
|
|
1,062
|
|
2,504
|
|
14
|
|
1,006
|
|
1,076
|
|
3,510
|
|
4,586
|
|
(977
|
)
|
2004
|
|||||||||||||||||||||
|
Lamplighter
|
Spring Valley
|
CA
|
(22,474
|
)
|
633
|
|
2,201
|
|
—
|
|
1,321
|
|
633
|
|
3,522
|
|
4,155
|
|
(2,942
|
)
|
1983
|
|||||||||||||||||||||
|
Las Palmas
|
Rialto
|
CA
|
(3,256
|
)
|
1,295
|
|
3,866
|
|
—
|
|
574
|
|
1,295
|
|
4,440
|
|
5,735
|
|
(1,411
|
)
|
2004
|
|||||||||||||||||||||
|
Los Ranchos
|
Apple Valley
|
CA
|
(13,095
|
)
|
8,336
|
|
15,774
|
|
—
|
|
97
|
|
8,336
|
|
15,871
|
|
24,207
|
|
(2,285
|
)
|
2011
|
|||||||||||||||||||||
|
Meadowbrook
|
Santee
|
CA
|
—
|
|
4,345
|
|
12,528
|
|
—
|
|
2,019
|
|
4,345
|
|
14,547
|
|
18,892
|
|
(7,499
|
)
|
1998
|
|||||||||||||||||||||
|
Monte del Lago
|
Castroville
|
CA
|
(20,359
|
)
|
3,150
|
|
9,469
|
|
—
|
|
2,843
|
|
3,150
|
|
12,312
|
|
15,462
|
|
(6,388
|
)
|
1997
|
|||||||||||||||||||||
|
Morgan Hill
|
Morgan Hill
|
CA
|
—
|
|
1,856
|
|
4,378
|
|
25
|
|
753
|
|
1,881
|
|
5,131
|
|
7,012
|
|
(1,477
|
)
|
2004
|
|||||||||||||||||||||
S-2
Schedule III
Equity LifeStyle Properties, Inc.
Real Estate and Accumulated Depreciation
December 31, 2013
(amounts in thousands)
|
|
|
|
Initial Cost to
Company
|
Costs Capitalized
Subsequent to
Acquisition
(Improvements)
|
Gross Amount Carried
at Close of Period 12/31/13 |
|
|
|||||||||||||||||||||||||||||||||||
|
Real Estate
(1)
|
Location
|
Encumbrances
|
Land
|
Depreciable
Property
|
Land
|
Depreciable
Property
|
Land
|
Depreciable
Property
|
Total
|
Accumulated
Depreciation
|
Date of
Acquisition
|
|||||||||||||||||||||||||||||||
|
Nicholson Plaza
|
San Jose
|
CA
|
$
|
—
|
|
$
|
—
|
|
$
|
4,512
|
|
$
|
—
|
|
$
|
286
|
|
$
|
—
|
|
$
|
4,798
|
|
$
|
4,798
|
|
$
|
(2,618
|
)
|
1997
|
||||||||||||
|
Oakzanita Springs
|
Descanso
|
CA
|
—
|
|
396
|
|
934
|
|
5
|
|
1,010
|
|
401
|
|
1,944
|
|
2,345
|
|
(556
|
)
|
2004
|
|||||||||||||||||||||
|
Pacific Dunes Ranch
|
Oceana
|
CA
|
(5,135
|
)
|
1,940
|
|
5,632
|
|
—
|
|
1,127
|
|
1,940
|
|
6,759
|
|
8,699
|
|
(1,852
|
)
|
2004
|
|||||||||||||||||||||
|
Palm Springs
|
Palm Desert
|
CA
|
—
|
|
1,811
|
|
4,271
|
|
24
|
|
662
|
|
1,835
|
|
4,933
|
|
6,768
|
|
(1,491
|
)
|
2004
|
|||||||||||||||||||||
|
Parque La Quinta
|
Rialto
|
CA
|
(4,366
|
)
|
1,799
|
|
5,450
|
|
—
|
|
474
|
|
1,799
|
|
5,924
|
|
7,723
|
|
(1,930
|
)
|
2004
|
|||||||||||||||||||||
|
Pio Pico
|
Jamul
|
CA
|
—
|
|
2,626
|
|
6,194
|
|
35
|
|
2,132
|
|
2,661
|
|
8,326
|
|
10,987
|
|
(2,254
|
)
|
2004
|
|||||||||||||||||||||
|
Ponderosa
|
Lotus
|
CA
|
—
|
|
900
|
|
2,100
|
|
—
|
|
359
|
|
900
|
|
2,459
|
|
3,359
|
|
(640
|
)
|
2006
|
|||||||||||||||||||||
|
Quail Meadows
|
Riverbank
|
CA
|
—
|
|
1,155
|
|
3,469
|
|
—
|
|
472
|
|
1,155
|
|
3,941
|
|
5,096
|
|
(2,056
|
)
|
1998
|
|||||||||||||||||||||
|
Rancho Mesa
|
El Cajon
|
CA
|
(8,716
|
)
|
2,130
|
|
6,389
|
|
—
|
|
809
|
|
2,130
|
|
7,198
|
|
9,328
|
|
(3,687
|
)
|
1998
|
|||||||||||||||||||||
|
Rancho Oso
|
Santa Barbara
|
CA
|
—
|
|
860
|
|
2,029
|
|
11
|
|
842
|
|
871
|
|
2,871
|
|
3,742
|
|
(822
|
)
|
2004
|
|||||||||||||||||||||
|
Rancho Valley
|
El Cajon
|
CA
|
(7,140
|
)
|
685
|
|
1,902
|
|
—
|
|
1,281
|
|
685
|
|
3,183
|
|
3,868
|
|
(2,579
|
)
|
1983
|
|||||||||||||||||||||
|
Royal Holiday
|
Hemet
|
CA
|
—
|
|
778
|
|
2,643
|
|
—
|
|
2,416
|
|
778
|
|
5,059
|
|
5,837
|
|
(2,078
|
)
|
1999
|
|||||||||||||||||||||
|
Royal Oaks
|
Visalia
|
CA
|
—
|
|
602
|
|
1,921
|
|
—
|
|
760
|
|
602
|
|
2,681
|
|
3,283
|
|
(1,369
|
)
|
1997
|
|||||||||||||||||||||
|
Russian River
|
Cloverdale
|
CA
|
—
|
|
368
|
|
868
|
|
5
|
|
155
|
|
373
|
|
1,023
|
|
1,396
|
|
(306
|
)
|
2004
|
|||||||||||||||||||||
|
San Benito
|
Paicines
|
CA
|
—
|
|
1,411
|
|
3,328
|
|
19
|
|
1,151
|
|
1,430
|
|
4,479
|
|
5,909
|
|
(1,279
|
)
|
2004
|
|||||||||||||||||||||
|
San Francisco RV
|
Pacifica
|
CA
|
—
|
|
1,660
|
|
4,973
|
|
—
|
|
721
|
|
1,660
|
|
5,694
|
|
7,354
|
|
(1,596
|
)
|
2005
|
|||||||||||||||||||||
|
Santa Cruz Ranch RV
|
Scotts Valley
|
CA
|
—
|
|
1,595
|
|
3,937
|
|
—
|
|
341
|
|
1,595
|
|
4,278
|
|
5,873
|
|
(899
|
)
|
2007
|
|||||||||||||||||||||
|
Santiago Estates
|
Sylmar
|
CA
|
—
|
|
3,562
|
|
10,767
|
|
—
|
|
1,447
|
|
3,562
|
|
12,214
|
|
15,776
|
|
(6,309
|
)
|
1998
|
|||||||||||||||||||||
|
Sea Oaks
|
Los Osos
|
CA
|
—
|
|
871
|
|
2,703
|
|
—
|
|
521
|
|
871
|
|
3,224
|
|
4,095
|
|
(1,708
|
)
|
1997
|
|||||||||||||||||||||
|
Snowflower
|
Emigrant Gap
|
CA
|
—
|
|
308
|
|
727
|
|
4
|
|
545
|
|
312
|
|
1,272
|
|
1,584
|
|
(337
|
)
|
2004
|
|||||||||||||||||||||
|
Soledad Canyon
|
Acton
|
CA
|
—
|
|
2,933
|
|
6,917
|
|
39
|
|
3,082
|
|
2,972
|
|
9,999
|
|
12,971
|
|
(2,481
|
)
|
2004
|
|||||||||||||||||||||
|
Sunshadow
|
San Jose
|
CA
|
—
|
|
—
|
|
5,707
|
|
—
|
|
332
|
|
—
|
|
6,039
|
|
6,039
|
|
(3,282
|
)
|
1997
|
|||||||||||||||||||||
|
Tahoe Valley
|
Lake Tahoe
|
CA
|
—
|
|
—
|
|
5,428
|
|
—
|
|
374
|
|
—
|
|
5,802
|
|
5,802
|
|
(1,910
|
)
|
2004
|
|||||||||||||||||||||
|
Turtle Beach
|
Manteca
|
CA
|
—
|
|
268
|
|
633
|
|
4
|
|
225
|
|
272
|
|
858
|
|
1,130
|
|
(239
|
)
|
2004
|
|||||||||||||||||||||
|
Village of the Four Seasons
|
San Jose
|
CA
|
(13,112
|
)
|
5,229
|
|
15,714
|
|
—
|
|
679
|
|
5,229
|
|
16,393
|
|
21,622
|
|
(5,225
|
)
|
2004
|
|||||||||||||||||||||
|
Westwinds (4 properties)
|
San Jose
|
CA
|
—
|
|
—
|
|
17,616
|
|
—
|
|
7,338
|
|
—
|
|
24,954
|
|
24,954
|
|
(13,485
|
)
|
1997
|
|||||||||||||||||||||
|
Wilderness Lake
|
Menifee
|
CA
|
—
|
|
2,157
|
|
5,088
|
|
29
|
|
1,217
|
|
2,186
|
|
6,305
|
|
8,491
|
|
(1,850
|
)
|
2004
|
|||||||||||||||||||||
|
Yosemite Lakes
|
Groveland
|
CA
|
—
|
|
2,045
|
|
4,823
|
|
27
|
|
1,697
|
|
2,072
|
|
6,520
|
|
8,592
|
|
(1,825
|
)
|
2004
|
|||||||||||||||||||||
|
Bear Creek
|
Denver
|
CO
|
—
|
|
1,100
|
|
3,359
|
|
—
|
|
473
|
|
1,100
|
|
3,832
|
|
4,932
|
|
(1,985
|
)
|
1998
|
|||||||||||||||||||||
|
Cimarron
|
Broomfield
|
CO
|
(14,547
|
)
|
863
|
|
2,790
|
|
—
|
|
992
|
|
863
|
|
3,782
|
|
4,645
|
|
(3,334
|
)
|
1983
|
|||||||||||||||||||||
S-3
Schedule III
Equity LifeStyle Properties, Inc.
Real Estate and Accumulated Depreciation
December 31, 2013
(amounts in thousands)
|
|
|
|
|
Initial Cost to
Company
|
Costs Capitalized
Subsequent to
Acquisition
(Improvements)
|
Gross Amount Carried
at Close of Period 12/31/13 |
|
|
||||||||||||||||||||||||||||||||||
|
Real Estate
(1)
|
Location
|
Encumbrances
|
Land
|
Depreciable
Property
|
Land
|
Depreciable
Property
|
Land
|
Depreciable
Property
|
Total
|
Accumulated
Depreciation
|
Date of
Acquisition
|
|||||||||||||||||||||||||||||||
|
Golden Terrace
|
Golden
|
CO
|
$
|
—
|
|
$
|
826
|
|
$
|
2,415
|
|
$
|
—
|
|
$
|
1,876
|
|
$
|
826
|
|
$
|
4,291
|
|
$
|
5,117
|
|
$
|
(2,982
|
)
|
1983
|
||||||||||||
|
Golden Terrace South
|
Golden
|
CO
|
—
|
|
750
|
|
2,265
|
|
—
|
|
810
|
|
750
|
|
3,075
|
|
3,825
|
|
(1,650
|
)
|
1997
|
|||||||||||||||||||||
|
Golden Terrace West
|
Golden
|
CO
|
—
|
|
1,694
|
|
5,065
|
|
—
|
|
1,074
|
|
1,694
|
|
6,139
|
|
7,833
|
|
(5,232
|
)
|
1986
|
|||||||||||||||||||||
|
Hillcrest Village
|
Aurora
|
CO
|
—
|
|
1,912
|
|
5,202
|
|
289
|
|
3,323
|
|
2,201
|
|
8,525
|
|
10,726
|
|
(7,225
|
)
|
1983
|
|||||||||||||||||||||
|
Holiday Hills
|
Denver
|
CO
|
(34,190
|
)
|
2,159
|
|
7,780
|
|
—
|
|
5,229
|
|
2,159
|
|
13,009
|
|
15,168
|
|
(10,976
|
)
|
1983
|
|||||||||||||||||||||
|
Holiday Village
|
Co. Springs
|
CO
|
—
|
|
567
|
|
1,759
|
|
—
|
|
1,344
|
|
567
|
|
3,103
|
|
3,670
|
|
(2,568
|
)
|
1983
|
|||||||||||||||||||||
|
Pueblo Grande
|
Pueblo
|
CO
|
(7,095
|
)
|
241
|
|
1,069
|
|
—
|
|
754
|
|
241
|
|
1,823
|
|
2,064
|
|
(1,498
|
)
|
1983
|
|||||||||||||||||||||
|
Woodland Hills
|
Thornton
|
CO
|
—
|
|
1,928
|
|
4,408
|
|
—
|
|
2,820
|
|
1,928
|
|
7,228
|
|
9,156
|
|
(4,644
|
)
|
1994
|
|||||||||||||||||||||
|
Stonegate Manor
|
North Windham
|
CT
|
(7,230
|
)
|
6,011
|
|
12,336
|
|
—
|
|
112
|
|
6,011
|
|
12,448
|
|
18,459
|
|
(1,856
|
)
|
2011
|
|||||||||||||||||||||
|
Aspen Meadows
|
Rehoboth
|
DE
|
—
|
|
1,148
|
|
3,460
|
|
—
|
|
537
|
|
1,148
|
|
3,997
|
|
5,145
|
|
(2,128
|
)
|
1998
|
|||||||||||||||||||||
|
Camelot Meadows
|
Rehoboth
|
DE
|
(11,821
|
)
|
527
|
|
2,058
|
|
1,251
|
|
4,380
|
|
1,778
|
|
6,438
|
|
8,216
|
|
(3,269
|
)
|
1998
|
|||||||||||||||||||||
|
Mariners Cove
|
Millsboro
|
DE
|
(22,374
|
)
|
990
|
|
2,971
|
|
—
|
|
5,800
|
|
990
|
|
8,771
|
|
9,761
|
|
(5,527
|
)
|
1987
|
|||||||||||||||||||||
|
McNicol
|
Rehoboth
|
DE
|
(2,461
|
)
|
562
|
|
1,710
|
|
—
|
|
213
|
|
562
|
|
1,923
|
|
2,485
|
|
(967
|
)
|
1998
|
|||||||||||||||||||||
|
Sweetbriar
|
Rehoboth
|
DE
|
—
|
|
498
|
|
1,527
|
|
—
|
|
463
|
|
498
|
|
1,990
|
|
2,488
|
|
(1,138
|
)
|
1998
|
|||||||||||||||||||||
|
Waterford
|
Bear
|
DE
|
(28,103
|
)
|
5,250
|
|
16,202
|
|
—
|
|
1,608
|
|
5,250
|
|
17,810
|
|
23,060
|
|
(6,446
|
)
|
1996
|
|||||||||||||||||||||
|
Whispering Pines
|
Lewes
|
DE
|
(8,961
|
)
|
1,536
|
|
4,609
|
|
—
|
|
1,581
|
|
1,536
|
|
6,190
|
|
7,726
|
|
(4,649
|
)
|
1988
|
|||||||||||||||||||||
|
Audubon
|
Orlando
|
FL
|
(6,445
|
)
|
4,622
|
|
7,200
|
|
—
|
|
58
|
|
4,622
|
|
7,258
|
|
11,880
|
|
(1,109
|
)
|
2011
|
|||||||||||||||||||||
|
Barrington Hills
|
Hudson
|
FL
|
(4,939
|
)
|
1,145
|
|
3,437
|
|
—
|
|
527
|
|
1,145
|
|
3,964
|
|
5,109
|
|
(1,376
|
)
|
2004
|
|||||||||||||||||||||
|
Bay Indies
|
Venice
|
FL
|
(72,334
|
)
|
10,483
|
|
31,559
|
|
10
|
|
5,849
|
|
10,493
|
|
37,408
|
|
47,901
|
|
(23,325
|
)
|
1994
|
|||||||||||||||||||||
|
Bay Lake Estates
|
Nokomis
|
FL
|
—
|
|
990
|
|
3,390
|
|
—
|
|
1,756
|
|
990
|
|
5,146
|
|
6,136
|
|
(2,989
|
)
|
1994
|
|||||||||||||||||||||
|
Beacon Hill Colony
|
Lakeland
|
FL
|
—
|
|
3,775
|
|
6,405
|
|
—
|
|
34
|
|
3,775
|
|
6,439
|
|
10,214
|
|
(876
|
)
|
2011
|
|||||||||||||||||||||
|
Beacon Terrace
|
Lakeland
|
FL
|
(7,017
|
)
|
5,372
|
|
9,153
|
|
—
|
|
81
|
|
5,372
|
|
9,234
|
|
14,606
|
|
(1,353
|
)
|
2011
|
|||||||||||||||||||||
|
Breezy Hill RV
|
Pompano Beach
|
FL
|
(20,161
|
)
|
5,424
|
|
16,555
|
|
—
|
|
1,618
|
|
5,424
|
|
18,173
|
|
23,597
|
|
(6,757
|
)
|
2002
|
|||||||||||||||||||||
|
Buccaneer
|
N. Ft. Myers
|
FL
|
(35,058
|
)
|
4,207
|
|
14,410
|
|
—
|
|
2,901
|
|
4,207
|
|
17,311
|
|
21,518
|
|
(10,602
|
)
|
1994
|
|||||||||||||||||||||
|
Bulow Plantation
|
Flagler Beach
|
FL
|
—
|
|
3,637
|
|
949
|
|
—
|
|
6,333
|
|
3,637
|
|
7,282
|
|
10,919
|
|
(3,546
|
)
|
1994
|
|||||||||||||||||||||
|
Bulow Village RV
|
Flagler Beach
|
FL
|
—
|
|
—
|
|
228
|
|
—
|
|
979
|
|
—
|
|
1,207
|
|
1,207
|
|
(483
|
)
|
1994
|
|||||||||||||||||||||
|
Carefree Cove
|
Fort Lauderdale
|
FL
|
(4,089
|
)
|
1,741
|
|
5,170
|
|
—
|
|
573
|
|
1,741
|
|
5,743
|
|
7,484
|
|
(1,822
|
)
|
2004
|
|||||||||||||||||||||
|
Carefree Village
|
Tampa
|
FL
|
—
|
|
6,799
|
|
10,421
|
|
—
|
|
120
|
|
6,799
|
|
10,541
|
|
17,340
|
|
(1,674
|
)
|
2011
|
|||||||||||||||||||||
|
Carriage Cove
|
Daytona Beach
|
FL
|
(11,535
|
)
|
2,914
|
|
8,682
|
|
—
|
|
1,267
|
|
2,914
|
|
9,949
|
|
12,863
|
|
(5,308
|
)
|
1998
|
|||||||||||||||||||||
|
Cheron Village
|
Davie
|
FL
|
(5,695
|
)
|
10,393
|
|
6,217
|
|
—
|
|
95
|
|
10,393
|
|
6,312
|
|
16,705
|
|
(1,287
|
)
|
2011
|
|||||||||||||||||||||
|
Clerbrook
|
Clermont
|
FL
|
(10,447
|
)
|
3,883
|
|
11,700
|
|
—
|
|
1,213
|
|
3,883
|
|
12,913
|
|
16,796
|
|
(3,432
|
)
|
2006
|
|||||||||||||||||||||
S-4
Schedule III
Equity LifeStyle Properties, Inc.
Real Estate and Accumulated Depreciation
December 31, 2013
(amounts in thousands)
|
|
|
|
|
Initial Cost to
Company
|
Costs Capitalized
Subsequent to
Acquisition
(Improvements)
|
Gross Amount Carried
at Close of Period 12/31/13 |
|
|
||||||||||||||||||||||||||||||||||
|
Real Estate
(1)
|
Location
|
Encumbrances
|
Land
|
Depreciable
Property
|
Land
|
Depreciable
Property
|
Land
|
Depreciable
Property
|
Total
|
Accumulated
Depreciation
|
Date of
Acquisition
|
|||||||||||||||||||||||||||||||
|
Clover Leaf Farms
|
Brooksville
|
FL
|
$
|
(21,990
|
)
|
$
|
13,684
|
|
$
|
24,106
|
|
$
|
—
|
|
$
|
329
|
|
$
|
13,684
|
|
$
|
24,435
|
|
$
|
38,119
|
|
$
|
(3,504
|
)
|
2011
|
||||||||||||
|
Clover Leaf Forest
|
Brooksville
|
FL
|
—
|
|
1,092
|
|
2,178
|
|
—
|
|
132
|
|
1,092
|
|
2,310
|
|
3,402
|
|
(160
|
)
|
2011
|
|||||||||||||||||||||
|
Coachwood
|
Leesburg
|
FL
|
—
|
|
1,602
|
|
4,822
|
|
—
|
|
347
|
|
1,602
|
|
5,169
|
|
6,771
|
|
(1,715
|
)
|
2004
|
|||||||||||||||||||||
|
Colony Cove
|
Ellenton
|
FL
|
(55,409
|
)
|
28,660
|
|
92,457
|
|
—
|
|
1,118
|
|
28,660
|
|
93,575
|
|
122,235
|
|
(13,302
|
)
|
2011
|
|||||||||||||||||||||
|
Coquina Crossing
|
Elkton
|
FL
|
—
|
|
5,274
|
|
5,545
|
|
—
|
|
17,768
|
|
5,274
|
|
23,313
|
|
28,587
|
|
(8,176
|
)
|
1999
|
|||||||||||||||||||||
|
Coral Cay
|
Margate
|
FL
|
(22,680
|
)
|
5,890
|
|
20,211
|
|
—
|
|
7,704
|
|
5,890
|
|
27,915
|
|
33,805
|
|
(16,514
|
)
|
1994
|
|||||||||||||||||||||
|
Country Place
(2)
|
New Port Richey
|
FL
|
(23,325
|
)
|
663
|
|
—
|
|
18
|
|
7,587
|
|
681
|
|
7,587
|
|
8,268
|
|
(5,101
|
)
|
1986
|
|||||||||||||||||||||
|
Countryside
|
Vero Beach
|
FL
|
—
|
|
3,711
|
|
11,133
|
|
—
|
|
6,842
|
|
3,711
|
|
17,975
|
|
21,686
|
|
(8,723
|
)
|
1998
|
|||||||||||||||||||||
|
Covington Estates
|
Saint Cloud
|
FL
|
—
|
|
3,319
|
|
7,253
|
|
—
|
|
64
|
|
3,319
|
|
7,317
|
|
10,636
|
|
(1,065
|
)
|
2011
|
|||||||||||||||||||||
|
Crystal Isles
|
Crystal River
|
FL
|
(2,423
|
)
|
926
|
|
2,787
|
|
10
|
|
950
|
|
936
|
|
3,737
|
|
4,673
|
|
(1,176
|
)
|
2004
|
|||||||||||||||||||||
|
Crystal Lakes-Zephyrhills
|
Zephyrhills
|
FL
|
—
|
|
3,767
|
|
6,834
|
|
—
|
|
84
|
|
3,767
|
|
6,918
|
|
10,685
|
|
(1,042
|
)
|
2011
|
|||||||||||||||||||||
|
Down Yonder
|
Largo
|
FL
|
(12,663
|
)
|
2,652
|
|
7,981
|
|
—
|
|
818
|
|
2,652
|
|
8,799
|
|
11,451
|
|
(3,237
|
)
|
1998
|
|||||||||||||||||||||
|
East Bay Oaks
|
Largo
|
FL
|
(11,035
|
)
|
1,240
|
|
3,322
|
|
—
|
|
1,205
|
|
1,240
|
|
4,527
|
|
5,767
|
|
(3,890
|
)
|
1983
|
|||||||||||||||||||||
|
Eldorado Village
|
Largo
|
FL
|
—
|
|
778
|
|
2,341
|
|
—
|
|
1,042
|
|
778
|
|
3,383
|
|
4,161
|
|
(2,798
|
)
|
1983
|
|||||||||||||||||||||
|
Emerald Lake
|
Punta Gorda
|
FL
|
—
|
|
3,598
|
|
5,197
|
|
—
|
|
172
|
|
3,598
|
|
5,369
|
|
8,967
|
|
(783
|
)
|
2011
|
|||||||||||||||||||||
|
Featherock
|
Valrico
|
FL
|
(22,155
|
)
|
11,369
|
|
22,770
|
|
—
|
|
245
|
|
11,369
|
|
23,015
|
|
34,384
|
|
(2,851
|
)
|
2011
|
|||||||||||||||||||||
|
Fiesta Key
|
Long Key
|
FL
|
—
|
|
16,611
|
|
7,338
|
|
—
|
|
315
|
|
16,611
|
|
7,653
|
|
24,264
|
|
(62
|
)
|
2013
|
|||||||||||||||||||||
|
Fort Myers Beach Resort
|
Fort Myers Beach
|
FL
|
—
|
|
1,188
|
|
3,548
|
|
—
|
|
283
|
|
1,188
|
|
3,831
|
|
5,019
|
|
(1,372
|
)
|
2004
|
|||||||||||||||||||||
|
Foxwood
|
Ocala
|
FL
|
—
|
|
3,853
|
|
7,967
|
|
—
|
|
133
|
|
3,853
|
|
8,100
|
|
11,953
|
|
(1,346
|
)
|
2011
|
|||||||||||||||||||||
|
Glen Ellen
|
Clearwater
|
FL
|
—
|
|
619
|
|
1,882
|
|
—
|
|
161
|
|
619
|
|
2,043
|
|
2,662
|
|
(761
|
)
|
2002
|
|||||||||||||||||||||
|
Grand Island
|
Grand Island
|
FL
|
—
|
|
1,723
|
|
5,208
|
|
125
|
|
4,090
|
|
1,848
|
|
9,298
|
|
11,146
|
|
(3,662
|
)
|
2001
|
|||||||||||||||||||||
|
Gulf Air Resort
|
Fort Myers Beach
|
FL
|
(6,901
|
)
|
1,609
|
|
4,746
|
|
—
|
|
321
|
|
1,609
|
|
5,067
|
|
6,676
|
|
(1,671
|
)
|
2004
|
|||||||||||||||||||||
|
Gulf View
|
Punta Gorda
|
FL
|
—
|
|
717
|
|
2,158
|
|
—
|
|
1,023
|
|
717
|
|
3,181
|
|
3,898
|
|
(1,107
|
)
|
2004
|
|||||||||||||||||||||
|
Hacienda Village
|
New Port Richey
|
FL
|
(20,490
|
)
|
4,297
|
|
13,088
|
|
—
|
|
2,207
|
|
4,297
|
|
15,295
|
|
19,592
|
|
(5,459
|
)
|
2002
|
|||||||||||||||||||||
|
Harbor Lakes
|
Port Charlotte
|
FL
|
—
|
|
3,384
|
|
10,154
|
|
—
|
|
594
|
|
3,384
|
|
10,748
|
|
14,132
|
|
(3,538
|
)
|
2004
|
|||||||||||||||||||||
|
Harbor View
|
New Port Richey
|
FL
|
—
|
|
4,030
|
|
12,146
|
|
—
|
|
214
|
|
4,030
|
|
12,360
|
|
16,390
|
|
(4,693
|
)
|
2002
|
|||||||||||||||||||||
|
Haselton Village
|
Eustis
|
FL
|
(6,933
|
)
|
3,800
|
|
8,955
|
|
—
|
|
55
|
|
3,800
|
|
9,010
|
|
12,810
|
|
(1,187
|
)
|
2011
|
|||||||||||||||||||||
|
Heritage Plantation
|
Vero Beach
|
FL
|
—
|
|
2,403
|
|
7,259
|
|
—
|
|
2,041
|
|
2,403
|
|
9,300
|
|
11,703
|
|
(5,809
|
)
|
1994
|
|||||||||||||||||||||
|
Heron Cay
|
Vero Beach
|
FL
|
(31,402
|
)
|
14,368
|
|
23,792
|
|
—
|
|
307
|
|
14,368
|
|
24,099
|
|
38,467
|
|
(3,286
|
)
|
2011
|
|||||||||||||||||||||
|
Hidden Valley
|
Orlando
|
FL
|
(9,310
|
)
|
11,398
|
|
12,861
|
|
—
|
|
134
|
|
11,398
|
|
12,995
|
|
24,393
|
|
(1,946
|
)
|
2011
|
|||||||||||||||||||||
S-5
Schedule III
Equity LifeStyle Properties, Inc.
Real Estate and Accumulated Depreciation
December 31, 2013
(amounts in thousands)
|
|
|
|
|
Initial Cost to
Company
|
Costs Capitalized
Subsequent to
Acquisition
(Improvements)
|
Gross Amount Carried
at Close of Period 12/31/13 |
|
|
||||||||||||||||||||||||||||||||||
|
Real Estate
(1)
|
Location
|
Encumbrances
|
Land
|
Depreciable
Property
|
Land
|
Depreciable
Property
|
Land
|
Depreciable
Property
|
Total
|
Accumulated
Depreciation
|
Date of
Acquisition
|
|||||||||||||||||||||||||||||||
|
Highland Wood RV
|
Pompano Beach
|
FL
|
$
|
—
|
|
$
|
1,043
|
|
$
|
3,130
|
|
$
|
42
|
|
$
|
268
|
|
$
|
1,085
|
|
$
|
3,398
|
|
$
|
4,483
|
|
$
|
(1,281
|
)
|
2002
|
||||||||||||
|
Hillcrest
|
Clearwater
|
FL
|
(7,142
|
)
|
1,278
|
|
3,928
|
|
—
|
|
1,186
|
|
1,278
|
|
5,114
|
|
6,392
|
|
(2,757
|
)
|
1998
|
|||||||||||||||||||||
|
Holiday Ranch
|
Clearwater
|
FL
|
(4,488
|
)
|
925
|
|
2,866
|
|
—
|
|
410
|
|
925
|
|
3,276
|
|
4,201
|
|
(1,732
|
)
|
1998
|
|||||||||||||||||||||
|
Holiday Village
|
Ormond Beach
|
FL
|
(9,544
|
)
|
2,610
|
|
7,837
|
|
—
|
|
411
|
|
2,610
|
|
8,248
|
|
10,858
|
|
(3,086
|
)
|
2002
|
|||||||||||||||||||||
|
Holiday Village
|
Vero Beach
|
FL
|
—
|
|
350
|
|
1,374
|
|
—
|
|
220
|
|
350
|
|
1,594
|
|
1,944
|
|
(854
|
)
|
1998
|
|||||||||||||||||||||
|
Indian Oaks
|
Rockledge
|
FL
|
—
|
|
1,089
|
|
3,376
|
|
—
|
|
957
|
|
1,089
|
|
4,333
|
|
5,422
|
|
(2,333
|
)
|
1998
|
|||||||||||||||||||||
|
Island Vista
|
North Ft. Myers
|
FL
|
(14,418
|
)
|
5,004
|
|
15,066
|
|
—
|
|
512
|
|
5,004
|
|
15,578
|
|
20,582
|
|
(3,987
|
)
|
2006
|
|||||||||||||||||||||
|
Kings & Queens
|
Lakeland
|
FL
|
—
|
|
1,696
|
|
3,064
|
|
—
|
|
28
|
|
1,696
|
|
3,092
|
|
4,788
|
|
(471
|
)
|
2011
|
|||||||||||||||||||||
|
Lake Fairways
|
N. Ft. Myers
|
FL
|
(46,651
|
)
|
6,075
|
|
18,134
|
|
35
|
|
2,290
|
|
6,110
|
|
20,424
|
|
26,534
|
|
(12,779
|
)
|
1994
|
|||||||||||||||||||||
|
Lake Haven
|
Dunedin
|
FL
|
(10,451
|
)
|
1,135
|
|
4,047
|
|
—
|
|
3,222
|
|
1,135
|
|
7,269
|
|
8,404
|
|
(5,425
|
)
|
1983
|
|||||||||||||||||||||
|
Lake Magic
|
Clermont
|
FL
|
—
|
|
1,595
|
|
4,793
|
|
—
|
|
521
|
|
1,595
|
|
5,314
|
|
6,909
|
|
(1,729
|
)
|
2004
|
|||||||||||||||||||||
|
Lake Village
|
Nokomis
|
FL
|
(18,742
|
)
|
15,850
|
|
18,099
|
|
—
|
|
176
|
|
15,850
|
|
18,275
|
|
34,125
|
|
(2,524
|
)
|
2011
|
|||||||||||||||||||||
|
Lake Worth Village
|
Lake Worth
|
FL
|
(11,745
|
)
|
14,959
|
|
24,501
|
|
—
|
|
185
|
|
14,959
|
|
24,686
|
|
39,645
|
|
(3,906
|
)
|
2011
|
|||||||||||||||||||||
|
Lakeland Harbor
|
Lakeland
|
FL
|
(16,871
|
)
|
10,446
|
|
17,376
|
|
—
|
|
61
|
|
10,446
|
|
17,437
|
|
27,883
|
|
(2,416
|
)
|
2011
|
|||||||||||||||||||||
|
Lakeland Junction
|
Lakeland
|
FL
|
(4,250
|
)
|
3,018
|
|
4,752
|
|
—
|
|
39
|
|
3,018
|
|
4,791
|
|
7,809
|
|
(703
|
)
|
2011
|
|||||||||||||||||||||
|
Lakes at Countrywood
|
Plant City
|
FL
|
(10,000
|
)
|
2,377
|
|
7,085
|
|
—
|
|
1,744
|
|
2,377
|
|
8,829
|
|
11,206
|
|
(3,688
|
)
|
2001
|
|||||||||||||||||||||
|
Lakeside Terrace
|
Fruitland Park
|
FL
|
—
|
|
3,275
|
|
7,165
|
|
—
|
|
149
|
|
3,275
|
|
7,314
|
|
10,589
|
|
(1,014
|
)
|
2011
|
|||||||||||||||||||||
|
Lakewood Village
|
Melbourne
|
FL
|
—
|
|
1,862
|
|
5,627
|
|
—
|
|
1,611
|
|
1,862
|
|
7,238
|
|
9,100
|
|
(4,522
|
)
|
1994
|
|||||||||||||||||||||
|
Lighthouse Pointe
|
Port Orange
|
FL
|
(13,091
|
)
|
2,446
|
|
7,483
|
|
23
|
|
1,366
|
|
2,469
|
|
8,849
|
|
11,318
|
|
(4,720
|
)
|
1998
|
|||||||||||||||||||||
|
Manatee
|
Bradenton
|
FL
|
—
|
|
2,300
|
|
6,903
|
|
—
|
|
525
|
|
2,300
|
|
7,428
|
|
9,728
|
|
(2,478
|
)
|
2004
|
|||||||||||||||||||||
|
Maralago Cay
|
Lantana
|
FL
|
—
|
|
5,325
|
|
15,420
|
|
—
|
|
5,394
|
|
5,325
|
|
20,814
|
|
26,139
|
|
(10,595
|
)
|
1997
|
|||||||||||||||||||||
|
Meadows at Countrywood
|
Plant City
|
FL
|
(21,993
|
)
|
4,514
|
|
13,175
|
|
—
|
|
4,419
|
|
4,514
|
|
17,594
|
|
22,108
|
|
(8,978
|
)
|
1998
|
|||||||||||||||||||||
|
Mid-Florida Lakes
|
Leesburg
|
FL
|
—
|
|
5,997
|
|
20,635
|
|
—
|
|
9,605
|
|
5,997
|
|
30,240
|
|
36,237
|
|
(17,412
|
)
|
1994
|
|||||||||||||||||||||
|
Oak Bend
|
Ocala
|
FL
|
—
|
|
850
|
|
2,572
|
|
—
|
|
1,213
|
|
850
|
|
3,785
|
|
4,635
|
|
(2,440
|
)
|
1993
|
|||||||||||||||||||||
|
Oaks at Countrywood
|
Plant City
|
FL
|
(4,120
|
)
|
846
|
|
2,513
|
|
—
|
|
5,226
|
|
846
|
|
7,739
|
|
8,585
|
|
(2,976
|
)
|
1998
|
|||||||||||||||||||||
|
Orange Lake
|
Clermont
|
FL
|
(5,348
|
)
|
4,303
|
|
6,815
|
|
—
|
|
181
|
|
4,303
|
|
6,996
|
|
11,299
|
|
(1,074
|
)
|
2011
|
|||||||||||||||||||||
|
Orlando
|
Clermont
|
FL
|
—
|
|
2,975
|
|
7,017
|
|
40
|
|
1,856
|
|
3,015
|
|
8,873
|
|
11,888
|
|
(2,596
|
)
|
2004
|
|||||||||||||||||||||
|
Palm Beach Colony
|
West Palm Beach
|
FL
|
—
|
|
5,930
|
|
10,113
|
|
8
|
|
322
|
|
5,938
|
|
10,435
|
|
16,373
|
|
(1,500
|
)
|
2011
|
|||||||||||||||||||||
|
Park City West
|
Fort Lauderdale
|
FL
|
(14,308
|
)
|
4,184
|
|
12,561
|
|
—
|
|
772
|
|
4,184
|
|
13,333
|
|
17,517
|
|
(4,371
|
)
|
2004
|
|||||||||||||||||||||
|
Parkwood Communities
|
Wildwood
|
FL
|
(9,649
|
)
|
6,990
|
|
15,115
|
|
—
|
|
202
|
|
6,990
|
|
15,317
|
|
22,307
|
|
(2,200
|
)
|
2011
|
|||||||||||||||||||||
S-6
Schedule III
Equity LifeStyle Properties, Inc.
Real Estate and Accumulated Depreciation
December 31, 2013
(amounts in thousands)
|
|
|
|
|
Initial Cost to
Company
|
Costs Capitalized
Subsequent to
Acquisition
(Improvements)
|
Gross Amount Carried
at Close of Period 12/31/13 |
|
|
||||||||||||||||||||||||||||||||||
|
Real Estate
(1)
|
Location
|
Encumbrances
|
Land
|
Depreciable
Property
|
Land
|
Depreciable
Property
|
Land
|
Depreciable
Property
|
Total
|
Accumulated
Depreciation
|
Date of
Acquisition
|
|||||||||||||||||||||||||||||||
|
Pasco
|
Lutz
|
FL
|
$
|
(4,330
|
)
|
$
|
1,494
|
|
$
|
4,484
|
|
$
|
—
|
|
$
|
614
|
|
$
|
1,494
|
|
$
|
5,098
|
|
$
|
6,592
|
|
$
|
(1,627
|
)
|
2004
|
||||||||||||
|
Peace River
|
Wauchula
|
FL
|
—
|
|
900
|
|
2,100
|
|
—
|
|
482
|
|
900
|
|
2,582
|
|
3,482
|
|
(627
|
)
|
2006
|
|||||||||||||||||||||
|
Pickwick
|
Port Orange
|
FL
|
(22,727
|
)
|
2,803
|
|
8,870
|
|
—
|
|
1,253
|
|
2,803
|
|
10,123
|
|
12,926
|
|
(5,275
|
)
|
1998
|
|||||||||||||||||||||
|
Pine Island Resort
|
St. James City
|
FL
|
—
|
|
1,678
|
|
5,044
|
|
—
|
|
429
|
|
1,678
|
|
5,473
|
|
7,151
|
|
(1,156
|
)
|
2007
|
|||||||||||||||||||||
|
Pine Lakes
|
N. Ft. Myers
|
FL
|
(35,682
|
)
|
6,306
|
|
14,579
|
|
21
|
|
7,239
|
|
6,327
|
|
21,818
|
|
28,145
|
|
(13,268
|
)
|
1994
|
|||||||||||||||||||||
|
Pioneer Village
|
N. Ft. Myers
|
FL
|
(15,019
|
)
|
4,116
|
|
12,353
|
|
—
|
|
1,612
|
|
4,116
|
|
13,965
|
|
18,081
|
|
(4,660
|
)
|
2004
|
|||||||||||||||||||||
|
Ramblers Rest
|
Venice
|
FL
|
(14,414
|
)
|
4,646
|
|
14,201
|
|
—
|
|
4,306
|
|
4,646
|
|
18,507
|
|
23,153
|
|
(4,288
|
)
|
2006
|
|||||||||||||||||||||
|
Ridgewood Estates
|
Ellenton
|
FL
|
(10,461
|
)
|
6,769
|
|
8,791
|
|
—
|
|
112
|
|
6,769
|
|
8,903
|
|
15,672
|
|
(1,385
|
)
|
2011
|
|||||||||||||||||||||
|
Royal Coachman
|
Nokomis
|
FL
|
(11,859
|
)
|
5,321
|
|
15,978
|
|
—
|
|
1,279
|
|
5,321
|
|
17,257
|
|
22,578
|
|
(5,710
|
)
|
2004
|
|||||||||||||||||||||
|
Shady Lane Oaks
|
Clearwater
|
FL
|
(5,794
|
)
|
4,984
|
|
8,482
|
|
—
|
|
66
|
|
4,984
|
|
8,548
|
|
13,532
|
|
(1,352
|
)
|
2011
|
|||||||||||||||||||||
|
Shady Lane Village
|
Clearwater
|
FL
|
—
|
|
3,102
|
|
5,480
|
|
—
|
|
18
|
|
3,102
|
|
5,498
|
|
8,600
|
|
(861
|
)
|
2011
|
|||||||||||||||||||||
|
Shangri La
|
Largo
|
FL
|
(3,849
|
)
|
1,722
|
|
5,200
|
|
—
|
|
198
|
|
1,722
|
|
5,398
|
|
7,120
|
|
(1,757
|
)
|
2004
|
|||||||||||||||||||||
|
Sherwood Forest
|
Kissimmee
|
FL
|
(29,171
|
)
|
4,852
|
|
14,596
|
|
—
|
|
6,068
|
|
4,852
|
|
20,664
|
|
25,516
|
|
(10,159
|
)
|
1998
|
|||||||||||||||||||||
|
Sherwood Forest RV
|
Kissimmee
|
FL
|
—
|
|
2,870
|
|
3,621
|
|
568
|
|
2,909
|
|
3,438
|
|
6,530
|
|
9,968
|
|
(3,176
|
)
|
1998
|
|||||||||||||||||||||
|
Silk Oak
|
Clearwater
|
FL
|
—
|
|
1,649
|
|
5,028
|
|
—
|
|
173
|
|
1,649
|
|
5,201
|
|
6,850
|
|
(1,936
|
)
|
2002
|
|||||||||||||||||||||
|
Silver Dollar
|
Odessa
|
FL
|
(13,734
|
)
|
4,107
|
|
12,431
|
|
240
|
|
1,678
|
|
4,347
|
|
14,109
|
|
18,456
|
|
(4,605
|
)
|
2004
|
|||||||||||||||||||||
|
Sixth Ave.
|
Zephryhills
|
FL
|
—
|
|
837
|
|
2,518
|
|
—
|
|
43
|
|
837
|
|
2,561
|
|
3,398
|
|
(865
|
)
|
2004
|
|||||||||||||||||||||
|
Southern Palms
|
Eustis
|
FL
|
—
|
|
2,169
|
|
5,884
|
|
—
|
|
3,249
|
|
2,169
|
|
9,133
|
|
11,302
|
|
(4,539
|
)
|
1998
|
|||||||||||||||||||||
|
Southernaire
|
Mt. Dora
|
FL
|
—
|
|
796
|
|
2,395
|
|
—
|
|
108
|
|
796
|
|
2,503
|
|
3,299
|
|
(827
|
)
|
2004
|
|||||||||||||||||||||
|
Starlight Ranch
|
Orlando
|
FL
|
—
|
|
13,543
|
|
20,388
|
|
—
|
|
337
|
|
13,543
|
|
20,725
|
|
34,268
|
|
(3,389
|
)
|
2011
|
|||||||||||||||||||||
|
Sunshine Holiday MH
|
Ormond Beach
|
FL
|
—
|
|
2,001
|
|
6,004
|
|
—
|
|
718
|
|
2,001
|
|
6,722
|
|
8,723
|
|
(2,239
|
)
|
2004
|
|||||||||||||||||||||
|
Sunshine Holiday RV
|
Fort Lauderdale
|
FL
|
(7,277
|
)
|
3,099
|
|
9,286
|
|
—
|
|
637
|
|
3,099
|
|
9,923
|
|
13,022
|
|
(3,143
|
)
|
2004
|
|||||||||||||||||||||
|
Sunshine Key
|
Big Pine Key
|
FL
|
(14,123
|
)
|
5,273
|
|
15,822
|
|
—
|
|
2,130
|
|
5,273
|
|
17,952
|
|
23,225
|
|
(5,956
|
)
|
2004
|
|||||||||||||||||||||
|
Sunshine Travel
|
Vero Beach
|
FL
|
—
|
|
1,603
|
|
4,813
|
|
—
|
|
301
|
|
1,603
|
|
5,114
|
|
6,717
|
|
(1,666
|
)
|
2004
|
|||||||||||||||||||||
|
Tarpon Glen
|
Tarpon Springs
|
FL
|
—
|
|
2,678
|
|
4,016
|
|
—
|
|
77
|
|
2,678
|
|
4,093
|
|
6,771
|
|
(697
|
)
|
2011
|
|||||||||||||||||||||
|
Terra Ceia
|
Palmetto
|
FL
|
—
|
|
965
|
|
2,905
|
|
—
|
|
230
|
|
965
|
|
3,135
|
|
4,100
|
|
(1,014
|
)
|
2004
|
|||||||||||||||||||||
|
The Heritage
|
N. Ft. Myers
|
FL
|
(11,738
|
)
|
1,438
|
|
4,371
|
|
346
|
|
4,215
|
|
1,784
|
|
8,586
|
|
10,370
|
|
(5,101
|
)
|
1993
|
|||||||||||||||||||||
|
The Meadows
|
Palm Beach Gardens
|
FL
|
(11,127
|
)
|
3,229
|
|
9,870
|
|
—
|
|
5,840
|
|
3,229
|
|
15,710
|
|
18,939
|
|
(6,016
|
)
|
1999
|
|||||||||||||||||||||
|
Three Flags RV Resort
|
Wildwood
|
FL
|
—
|
|
228
|
|
684
|
|
—
|
|
200
|
|
228
|
|
884
|
|
1,112
|
|
(248
|
)
|
2006
|
|||||||||||||||||||||
|
Toby’s
|
Arcadia
|
FL
|
(3,863
|
)
|
1,093
|
|
3,280
|
|
—
|
|
190
|
|
1,093
|
|
3,470
|
|
4,563
|
|
(1,206
|
)
|
2003
|
|||||||||||||||||||||
S-7
Schedule III
Equity LifeStyle Properties, Inc.
Real Estate and Accumulated Depreciation
December 31, 2013
(amounts in thousands)
|
|
|
|
|
Initial Cost to
Company
|
Costs Capitalized
Subsequent to
Acquisition
(Improvements)
|
Gross Amount Carried
at Close of Period 12/31/13 |
|
|
||||||||||||||||||||||||||||||||||
|
Real Estate
(1)
|
Location
|
Encumbrances
|
Land
|
Depreciable
Property
|
Land
|
Depreciable
Property
|
Land
|
Depreciable
Property
|
Total
|
Accumulated
Depreciation
|
Date of
Acquisition
|
|||||||||||||||||||||||||||||||
|
Topics
|
Spring Hill
|
FL
|
$
|
—
|
|
$
|
844
|
|
$
|
2,568
|
|
$
|
—
|
|
$
|
413
|
|
$
|
844
|
|
$
|
2,981
|
|
$
|
3,825
|
|
$
|
(1,009
|
)
|
2004
|
||||||||||||
|
Tropical Palms
|
Kissimmee
|
FL
|
—
|
|
5,677
|
|
17,116
|
|
—
|
|
6,618
|
|
5,677
|
|
23,734
|
|
29,411
|
|
(9,106
|
)
|
2004
|
|||||||||||||||||||||
|
Tropical Palms
|
Punta Gorda
|
FL
|
(6,909
|
)
|
2,365
|
|
7,286
|
|
—
|
|
1,192
|
|
2,365
|
|
8,478
|
|
10,843
|
|
(2,051
|
)
|
2006
|
|||||||||||||||||||||
|
Vacation Village
|
Largo
|
FL
|
(5,074
|
)
|
1,315
|
|
3,946
|
|
—
|
|
415
|
|
1,315
|
|
4,361
|
|
5,676
|
|
(1,372
|
)
|
2004
|
|||||||||||||||||||||
|
Vero Palm
|
Vero Beach
|
FL
|
(12,670
|
)
|
6,697
|
|
9,025
|
|
—
|
|
69
|
|
6,697
|
|
9,094
|
|
15,791
|
|
(1,323
|
)
|
2011
|
|||||||||||||||||||||
|
Village Green
|
Vero Beach
|
FL
|
(24,632
|
)
|
15,901
|
|
25,175
|
|
—
|
|
351
|
|
15,901
|
|
25,526
|
|
41,427
|
|
(4,003
|
)
|
2011
|
|||||||||||||||||||||
|
Villas at Spanish Oaks
|
Ocala
|
FL
|
(11,987
|
)
|
2,250
|
|
6,922
|
|
—
|
|
1,487
|
|
2,250
|
|
8,409
|
|
10,659
|
|
(5,415
|
)
|
1993
|
|||||||||||||||||||||
|
Whispering Pines - Largo
|
Largo
|
FL
|
(12,479
|
)
|
8,218
|
|
14,054
|
|
—
|
|
148
|
|
8,218
|
|
14,202
|
|
22,420
|
|
(2,092
|
)
|
2011
|
|||||||||||||||||||||
|
Windmill Manor
|
Bradenton
|
FL
|
—
|
|
2,153
|
|
6,125
|
|
—
|
|
1,654
|
|
2,153
|
|
7,779
|
|
9,932
|
|
(3,927
|
)
|
1998
|
|||||||||||||||||||||
|
Windmill Village
|
N. Ft. Myers
|
FL
|
(15,591
|
)
|
1,417
|
|
5,440
|
|
—
|
|
2,070
|
|
1,417
|
|
7,510
|
|
8,927
|
|
(6,678
|
)
|
1983
|
|||||||||||||||||||||
|
Winds of St. Armands North
|
Sarasota
|
FL
|
(27,834
|
)
|
1,523
|
|
5,063
|
|
—
|
|
3,173
|
|
1,523
|
|
8,236
|
|
9,759
|
|
(6,599
|
)
|
1983
|
|||||||||||||||||||||
|
Winds of St. Armands South
|
Sarasota
|
FL
|
(18,158
|
)
|
1,106
|
|
3,162
|
|
—
|
|
1,228
|
|
1,106
|
|
4,390
|
|
5,496
|
|
(3,801
|
)
|
1983
|
|||||||||||||||||||||
|
Winter Garden
|
Winter Garden
|
FL
|
—
|
|
2,321
|
|
6,962
|
|
—
|
|
249
|
|
2,321
|
|
7,211
|
|
9,532
|
|
(1,616
|
)
|
2007
|
|||||||||||||||||||||
|
Coach Royale
|
Boise
|
ID
|
—
|
|
465
|
|
1,685
|
|
—
|
|
9
|
|
465
|
|
1,694
|
|
2,159
|
|
(287
|
)
|
2011
|
|||||||||||||||||||||
|
Maple Grove
|
Boise
|
ID
|
—
|
|
1,358
|
|
5,151
|
|
—
|
|
25
|
|
1,358
|
|
5,176
|
|
6,534
|
|
(852
|
)
|
2011
|
|||||||||||||||||||||
|
Shenandoah Estates
|
Boise
|
ID
|
(5,674
|
)
|
1,287
|
|
7,603
|
|
—
|
|
113
|
|
1,287
|
|
7,716
|
|
9,003
|
|
(928
|
)
|
2011
|
|||||||||||||||||||||
|
West Meadow Estates
|
Boise
|
ID
|
—
|
|
1,371
|
|
6,770
|
|
—
|
|
9
|
|
1,371
|
|
6,779
|
|
8,150
|
|
(933
|
)
|
2011
|
|||||||||||||||||||||
|
Golf Vistas Estates
|
Monee
|
IL
|
(11,954
|
)
|
2,842
|
|
4,719
|
|
1
|
|
6,706
|
|
2,843
|
|
11,425
|
|
14,268
|
|
(5,594
|
)
|
1997
|
|||||||||||||||||||||
|
O'Connell's
|
Amboy
|
IL
|
(4,225
|
)
|
1,648
|
|
4,974
|
|
—
|
|
878
|
|
1,648
|
|
5,852
|
|
7,500
|
|
(2,012
|
)
|
2004
|
|||||||||||||||||||||
|
Pheasant Lake Estates
|
Beecher
|
IL
|
—
|
|
12,764
|
|
42,183
|
|
—
|
|
3
|
|
12,764
|
|
42,186
|
|
54,950
|
|
(1,098
|
)
|
2013
|
|||||||||||||||||||||
|
Pine Country
|
Belvidere
|
IL
|
—
|
|
53
|
|
166
|
|
—
|
|
444
|
|
53
|
|
610
|
|
663
|
|
(90
|
)
|
2006
|
|||||||||||||||||||||
|
Willow Lake Estates
|
Elgin
|
IL
|
—
|
|
6,138
|
|
21,033
|
|
—
|
|
6,512
|
|
6,138
|
|
27,545
|
|
33,683
|
|
(16,102
|
)
|
1994
|
|||||||||||||||||||||
|
Hoosier Estates
|
Lebanon
|
IN
|
(6,818
|
)
|
2,293
|
|
7,197
|
|
—
|
|
46
|
|
2,293
|
|
7,243
|
|
9,536
|
|
(929
|
)
|
2011
|
|||||||||||||||||||||
|
Horseshoe Lake
|
Clinton
|
IN
|
—
|
|
155
|
|
365
|
|
2
|
|
399
|
|
157
|
|
764
|
|
921
|
|
(201
|
)
|
2004
|
|||||||||||||||||||||
|
Indian Lakes
|
Batesville
|
IN
|
—
|
|
450
|
|
1,061
|
|
6
|
|
1,158
|
|
456
|
|
2,219
|
|
2,675
|
|
(517
|
)
|
2004
|
|||||||||||||||||||||
|
Lakeside
|
New Carlisle
|
IN
|
—
|
|
426
|
|
1,281
|
|
—
|
|
124
|
|
426
|
|
1,405
|
|
1,831
|
|
(464
|
)
|
2004
|
|||||||||||||||||||||
|
North Glen Village
|
Westfield
|
IN
|
(7,073
|
)
|
2,308
|
|
6,333
|
|
—
|
|
98
|
|
2,308
|
|
6,431
|
|
8,739
|
|
(948
|
)
|
2011
|
|||||||||||||||||||||
|
Oak Tree Village
|
Portage
|
IN
|
—
|
|
569
|
|
—
|
|
—
|
|
3,958
|
|
569
|
|
3,958
|
|
4,527
|
|
(2,924
|
)
|
1987
|
|||||||||||||||||||||
|
Twin Mills RV
|
Howe
|
IN
|
—
|
|
1,399
|
|
4,186
|
|
—
|
|
271
|
|
1,399
|
|
4,457
|
|
5,856
|
|
(1,067
|
)
|
2006
|
|||||||||||||||||||||
S-8
Schedule III
Equity LifeStyle Properties, Inc.
Real Estate and Accumulated Depreciation
December 31, 2013
(amounts in thousands)
|
|
|
|
|
Initial Cost to
Company
|
Costs Capitalized
Subsequent to
Acquisition
(Improvements)
|
Gross Amount Carried
at Close of Period 12/31/13 |
|
|
||||||||||||||||||||||||||||||||||
|
Real Estate
(1)
|
Location
|
Encumbrances
|
Land
|
Depreciable
Property
|
Land
|
Depreciable
Property
|
Land
|
Depreciable
Property
|
Total
|
Accumulated
Depreciation
|
Date of
Acquisition
|
|||||||||||||||||||||||||||||||
|
Diamond Caverns Resort & Golf Club
|
Park City
|
KY
|
$
|
—
|
|
$
|
530
|
|
$
|
1,512
|
|
$
|
—
|
|
$
|
16
|
|
$
|
530
|
|
$
|
1,528
|
|
$
|
2,058
|
|
$
|
(419
|
)
|
2006
|
||||||||||||
|
Gateway to Cape Cod
|
Rochester
|
MA
|
—
|
|
91
|
|
288
|
|
—
|
|
212
|
|
91
|
|
500
|
|
591
|
|
(130
|
)
|
2006
|
|||||||||||||||||||||
|
Hillcrest
|
Rockland
|
MA
|
(1,889
|
)
|
2,034
|
|
3,182
|
|
—
|
|
24
|
|
2,034
|
|
3,206
|
|
5,240
|
|
(491
|
)
|
2011
|
|||||||||||||||||||||
|
Old Chatham RV
|
South Dennis
|
MA
|
—
|
|
1,760
|
|
5,293
|
|
—
|
|
196
|
|
1,760
|
|
5,489
|
|
7,249
|
|
(1,509
|
)
|
2005
|
|||||||||||||||||||||
|
Sturbridge
|
Sturbridge
|
MA
|
—
|
|
110
|
|
347
|
|
—
|
|
353
|
|
110
|
|
700
|
|
810
|
|
(151
|
)
|
2006
|
|||||||||||||||||||||
|
The Glen
|
Norwell
|
MA
|
—
|
|
940
|
|
1,680
|
|
—
|
|
—
|
|
940
|
|
1,680
|
|
2,620
|
|
(259
|
)
|
2011
|
|||||||||||||||||||||
|
Fernwood
|
Capitol Heights
|
MD
|
—
|
|
6,556
|
|
11,674
|
|
—
|
|
137
|
|
6,556
|
|
11,811
|
|
18,367
|
|
(1,706
|
)
|
2011
|
|||||||||||||||||||||
|
Williams Estates and Peppermint Woods
|
Middle River
|
MD
|
(41,343
|
)
|
22,774
|
|
42,575
|
|
—
|
|
318
|
|
22,774
|
|
42,893
|
|
65,667
|
|
(5,847
|
)
|
2011
|
|||||||||||||||||||||
|
Moody Beach
|
Moody
|
ME
|
—
|
|
93
|
|
292
|
|
—
|
|
161
|
|
93
|
|
453
|
|
546
|
|
(113
|
)
|
2006
|
|||||||||||||||||||||
|
Pinehirst RV Park
|
Old Orchard Beach
|
ME
|
(11,569
|
)
|
1,942
|
|
5,827
|
|
—
|
|
610
|
|
1,942
|
|
6,437
|
|
8,379
|
|
(1,804
|
)
|
2005
|
|||||||||||||||||||||
|
Mt. Desert Narrows
|
Bar Harbor
|
ME
|
—
|
|
1,037
|
|
3,127
|
|
—
|
|
125
|
|
1,037
|
|
3,252
|
|
4,289
|
|
(663
|
)
|
2007
|
|||||||||||||||||||||
|
Narrows Too
|
Trenton
|
ME
|
—
|
|
1,451
|
|
4,408
|
|
—
|
|
47
|
|
1,451
|
|
4,455
|
|
5,906
|
|
(909
|
)
|
2007
|
|||||||||||||||||||||
|
Patton Pond
|
Ellsworth
|
ME
|
—
|
|
267
|
|
802
|
|
—
|
|
80
|
|
267
|
|
882
|
|
1,149
|
|
(190
|
)
|
2007
|
|||||||||||||||||||||
|
Bear Cave Resort
|
Buchanan
|
MI
|
—
|
|
176
|
|
516
|
|
—
|
|
69
|
|
176
|
|
585
|
|
761
|
|
(186
|
)
|
2006
|
|||||||||||||||||||||
|
Lake in the Hills
|
Auburn Hills
|
MI
|
(4,209
|
)
|
1,792
|
|
5,599
|
|
—
|
|
68
|
|
1,792
|
|
5,667
|
|
7,459
|
|
(1,011
|
)
|
2011
|
|||||||||||||||||||||
|
St Clair
|
St Clair
|
MI
|
—
|
|
453
|
|
1,068
|
|
6
|
|
274
|
|
459
|
|
1,342
|
|
1,801
|
|
(432
|
)
|
2004
|
|||||||||||||||||||||
|
Swan Creek
|
Ypsilanti
|
MI
|
(5,497
|
)
|
1,844
|
|
7,180
|
|
—
|
|
116
|
|
1,844
|
|
7,296
|
|
9,140
|
|
(1,289
|
)
|
2011
|
|||||||||||||||||||||
|
Cedar Knolls
|
Apple Valley
|
MN
|
(16,472
|
)
|
10,021
|
|
14,357
|
|
—
|
|
40
|
|
10,021
|
|
14,397
|
|
24,418
|
|
(2,437
|
)
|
2011
|
|||||||||||||||||||||
|
Cimarron Park
|
Lake Elmo
|
MN
|
(22,006
|
)
|
11,097
|
|
23,132
|
|
—
|
|
251
|
|
11,097
|
|
23,383
|
|
34,480
|
|
(3,297
|
)
|
2011
|
|||||||||||||||||||||
|
Rockford Riverview Estates
|
Rockford
|
MN
|
—
|
|
2,959
|
|
8,882
|
|
—
|
|
14
|
|
2,959
|
|
8,896
|
|
11,855
|
|
(1,415
|
)
|
2011
|
|||||||||||||||||||||
|
Rosemount Woods
|
Rosemount
|
MN
|
—
|
|
4,314
|
|
8,932
|
|
—
|
|
35
|
|
4,314
|
|
8,967
|
|
13,281
|
|
(1,271
|
)
|
2011
|
|||||||||||||||||||||
|
Forest Lake
|
Advance
|
NC
|
—
|
|
986
|
|
2,325
|
|
13
|
|
551
|
|
999
|
|
2,876
|
|
3,875
|
|
(872
|
)
|
2004
|
|||||||||||||||||||||
|
Goose Creek
|
Newport
|
NC
|
—
|
|
4,612
|
|
13,848
|
|
750
|
|
1,747
|
|
5,362
|
|
15,595
|
|
20,957
|
|
(5,030
|
)
|
2004
|
|||||||||||||||||||||
|
Green Mountain Park
|
Lenoir
|
NC
|
—
|
|
1,037
|
|
3,075
|
|
—
|
|
428
|
|
1,037
|
|
3,503
|
|
4,540
|
|
(838
|
)
|
2006
|
|||||||||||||||||||||
|
Lake Gaston
|
Littleton
|
NC
|
—
|
|
130
|
|
409
|
|
—
|
|
220
|
|
130
|
|
629
|
|
759
|
|
(152
|
)
|
2006
|
|||||||||||||||||||||
|
Lake Myers RV
|
Mocksville
|
NC
|
—
|
|
1,504
|
|
4,587
|
|
—
|
|
210
|
|
1,504
|
|
4,797
|
|
6,301
|
|
(1,192
|
)
|
2006
|
|||||||||||||||||||||
|
Scenic
|
Asheville
|
NC
|
(3,483
|
)
|
1,183
|
|
3,511
|
|
—
|
|
124
|
|
1,183
|
|
3,635
|
|
4,818
|
|
(928
|
)
|
2006
|
|||||||||||||||||||||
|
Twin Lakes
|
Chocowinity
|
NC
|
(3,223
|
)
|
1,709
|
|
3,361
|
|
—
|
|
508
|
|
1,709
|
|
3,869
|
|
5,578
|
|
(1,244
|
)
|
2004
|
|||||||||||||||||||||
|
Waterway RV
|
Cedar Point
|
NC
|
(5,330
|
)
|
2,392
|
|
7,185
|
|
—
|
|
670
|
|
2,392
|
|
7,855
|
|
10,247
|
|
(2,440
|
)
|
2004
|
|||||||||||||||||||||
S-9
Schedule III
Equity LifeStyle Properties, Inc.
Real Estate and Accumulated Depreciation
December 31, 2013
(amounts in thousands)
|
|
|
|
|
Initial Cost to
Company
|
Costs Capitalized
Subsequent to
Acquisition
(Improvements)
|
Gross Amount Carried
at Close of Period 12/31/13 |
|
|
||||||||||||||||||||||||||||||||||
|
Real Estate
(1)
|
Location
|
Encumbrances
|
Land
|
Depreciable
Property
|
Land
|
Depreciable
Property
|
Land
|
Depreciable
Property
|
Total
|
Accumulated
Depreciation
|
Date of
Acquisition
|
|||||||||||||||||||||||||||||||
|
Buena Vista
|
Fargo
|
ND
|
$
|
—
|
|
$
|
4,563
|
|
$
|
14,949
|
|
$
|
—
|
|
$
|
167
|
|
$
|
4,563
|
|
$
|
15,116
|
|
$
|
19,679
|
|
$
|
(2,033
|
)
|
2011
|
||||||||||||
|
Meadow Park
|
Fargo
|
ND
|
(2,184
|
)
|
943
|
|
2,907
|
|
—
|
|
8
|
|
943
|
|
2,915
|
|
3,858
|
|
(397
|
)
|
2011
|
|||||||||||||||||||||
|
Sandy Beach RV
|
Contoocook
|
NH
|
(4,673
|
)
|
1,755
|
|
5,265
|
|
—
|
|
110
|
|
1,755
|
|
5,375
|
|
7,130
|
|
(1,525
|
)
|
2005
|
|||||||||||||||||||||
|
Tuxbury Resort
|
South Hampton
|
NH
|
—
|
|
3,557
|
|
3,910
|
|
—
|
|
451
|
|
3,557
|
|
4,361
|
|
7,918
|
|
(890
|
)
|
2007
|
|||||||||||||||||||||
|
Chestnut Lake
|
Port Republic
|
NJ
|
—
|
|
337
|
|
796
|
|
4
|
|
244
|
|
341
|
|
1,040
|
|
1,381
|
|
(296
|
)
|
2004
|
|||||||||||||||||||||
|
Lake & Shore
|
Ocean View
|
NJ
|
—
|
|
378
|
|
1,192
|
|
—
|
|
821
|
|
378
|
|
2,013
|
|
2,391
|
|
(527
|
)
|
2006
|
|||||||||||||||||||||
|
Pine Ridge at Crestwood
|
Whiting
|
NJ
|
(37,555
|
)
|
17,367
|
|
33,127
|
|
—
|
|
41
|
|
17,367
|
|
33,168
|
|
50,535
|
|
(4,851
|
)
|
2011
|
|||||||||||||||||||||
|
Sea Pines
|
Swainton
|
NJ
|
—
|
|
198
|
|
625
|
|
—
|
|
285
|
|
198
|
|
910
|
|
1,108
|
|
(232
|
)
|
2006
|
|||||||||||||||||||||
|
Bonanza
|
Las Vegas
|
NV
|
(8,359
|
)
|
908
|
|
2,643
|
|
—
|
|
1,816
|
|
908
|
|
4,459
|
|
5,367
|
|
(3,516
|
)
|
1983
|
|||||||||||||||||||||
|
Boulder Cascade
|
Las Vegas
|
NV
|
(8,138
|
)
|
2,995
|
|
9,020
|
|
—
|
|
2,593
|
|
2,995
|
|
11,613
|
|
14,608
|
|
(5,828
|
)
|
1998
|
|||||||||||||||||||||
|
Cabana
|
Las Vegas
|
NV
|
(9,033
|
)
|
2,648
|
|
7,989
|
|
—
|
|
901
|
|
2,648
|
|
8,890
|
|
11,538
|
|
(5,551
|
)
|
1994
|
|||||||||||||||||||||
|
Flamingo West
|
Las Vegas
|
NV
|
(13,449
|
)
|
1,730
|
|
5,266
|
|
—
|
|
1,646
|
|
1,730
|
|
6,912
|
|
8,642
|
|
(4,246
|
)
|
1994
|
|||||||||||||||||||||
|
Las Vegas
|
Las Vegas
|
NV
|
—
|
|
1,049
|
|
2,473
|
|
14
|
|
609
|
|
1,063
|
|
3,082
|
|
4,145
|
|
(841
|
)
|
2004
|
|||||||||||||||||||||
|
Mountain View - NV
|
Henderson
|
NV
|
(21,096
|
)
|
16,665
|
|
25,915
|
|
—
|
|
217
|
|
16,665
|
|
26,132
|
|
42,797
|
|
(3,436
|
)
|
2011
|
|||||||||||||||||||||
|
Villa Borega
|
Las Vegas
|
NV
|
(9,508
|
)
|
2,896
|
|
8,774
|
|
—
|
|
1,181
|
|
2,896
|
|
9,955
|
|
12,851
|
|
(5,314
|
)
|
1997
|
|||||||||||||||||||||
|
Alpine Lake
|
Corinth
|
NY
|
(12,808
|
)
|
4,783
|
|
14,125
|
|
153
|
|
825
|
|
4,936
|
|
14,950
|
|
19,886
|
|
(4,191
|
)
|
2005
|
|||||||||||||||||||||
|
Brennan Beach
|
Pulaski
|
NY
|
(18,933
|
)
|
7,325
|
|
21,141
|
|
—
|
|
5,280
|
|
7,325
|
|
26,421
|
|
33,746
|
|
(6,764
|
)
|
2005
|
|||||||||||||||||||||
|
Greenwood Village
|
Manorville
|
NY
|
(23,998
|
)
|
3,667
|
|
9,414
|
|
484
|
|
5,098
|
|
4,151
|
|
14,512
|
|
18,663
|
|
(6,915
|
)
|
1998
|
|||||||||||||||||||||
|
Lake George Escape
|
Lake George
|
NY
|
—
|
|
3,562
|
|
10,708
|
|
—
|
|
921
|
|
3,562
|
|
11,629
|
|
15,191
|
|
(3,351
|
)
|
2005
|
|||||||||||||||||||||
|
Lake George Schroon Valley
|
Warrensburg
|
NY
|
—
|
|
540
|
|
1,626
|
|
—
|
|
35
|
|
540
|
|
1,661
|
|
2,201
|
|
(327
|
)
|
2008
|
|||||||||||||||||||||
|
Rondout Valley Resort
|
Accord
|
NY
|
—
|
|
1,115
|
|
3,240
|
|
—
|
|
584
|
|
1,115
|
|
3,824
|
|
4,939
|
|
(906
|
)
|
2006
|
|||||||||||||||||||||
|
The Woodlands
|
Lockport
|
NY
|
—
|
|
12,183
|
|
39,687
|
|
—
|
|
177
|
|
12,183
|
|
39,864
|
|
52,047
|
|
(5,561
|
)
|
2011
|
|||||||||||||||||||||
|
Kenisee Lake
|
Jefferson
|
OH
|
—
|
|
295
|
|
696
|
|
4
|
|
152
|
|
299
|
|
848
|
|
1,147
|
|
(245
|
)
|
2004
|
|||||||||||||||||||||
|
Wilmington
|
Wilmington
|
OH
|
—
|
|
235
|
|
555
|
|
3
|
|
130
|
|
238
|
|
685
|
|
923
|
|
(203
|
)
|
2004
|
|||||||||||||||||||||
|
Bend
|
Bend
|
OR
|
—
|
|
733
|
|
1,729
|
|
10
|
|
510
|
|
743
|
|
2,239
|
|
2,982
|
|
(653
|
)
|
2004
|
|||||||||||||||||||||
|
Falcon Wood Village
|
Eugene
|
OR
|
—
|
|
1,112
|
|
3,426
|
|
—
|
|
564
|
|
1,112
|
|
3,990
|
|
5,102
|
|
(2,118
|
)
|
1997
|
|||||||||||||||||||||
|
Mt. Hood
|
Welches
|
OR
|
—
|
|
1,817
|
|
5,733
|
|
—
|
|
252
|
|
1,817
|
|
5,985
|
|
7,802
|
|
(2,444
|
)
|
2002
|
|||||||||||||||||||||
|
Pacific City
|
Cloverdale
|
OR
|
—
|
|
1,076
|
|
2,539
|
|
14
|
|
1,304
|
|
1,090
|
|
3,843
|
|
4,933
|
|
(1,094
|
)
|
2004
|
|||||||||||||||||||||
|
Quail Hollow
|
Fairview
|
OR
|
—
|
|
—
|
|
3,249
|
|
—
|
|
547
|
|
—
|
|
3,796
|
|
3,796
|
|
(2,010
|
)
|
1997
|
|||||||||||||||||||||
S-10
Schedule III
Equity LifeStyle Properties, Inc.
Real Estate and Accumulated Depreciation
December 31, 2013
(amounts in thousands)
|
|
|
|
|
Initial Cost to
Company
|
Costs Capitalized
Subsequent to
Acquisition
(Improvements)
|
Gross Amount Carried
at Close of Period 12/31/13 |
|
|
||||||||||||||||||||||||||||||||||
|
Real Estate
(1)
|
Location
|
Encumbrances
|
Land
|
Depreciable
Property
|
Land
|
Depreciable
Property
|
Land
|
Depreciable
Property
|
Total
|
Accumulated
Depreciation
|
Date of
Acquisition
|
|||||||||||||||||||||||||||||||
|
Seaside
|
Seaside
|
OR
|
$
|
—
|
|
$
|
891
|
|
$
|
2,101
|
|
$
|
12
|
|
$
|
613
|
|
$
|
903
|
|
$
|
2,714
|
|
$
|
3,617
|
|
$
|
(786
|
)
|
2004
|
||||||||||||
|
Shadowbrook
|
Clackamas
|
OR
|
—
|
|
1,197
|
|
3,693
|
|
—
|
|
521
|
|
1,197
|
|
4,214
|
|
5,411
|
|
(2,276
|
)
|
1997
|
|||||||||||||||||||||
|
South Jetty
|
Florence
|
OR
|
—
|
|
678
|
|
1,598
|
|
9
|
|
414
|
|
687
|
|
2,012
|
|
2,699
|
|
(546
|
)
|
2004
|
|||||||||||||||||||||
|
Whalers Rest
|
South Beach
|
OR
|
—
|
|
754
|
|
1,777
|
|
10
|
|
583
|
|
764
|
|
2,360
|
|
3,124
|
|
(666
|
)
|
2004
|
|||||||||||||||||||||
|
Appalachian
|
Shartlesville
|
PA
|
—
|
|
1,666
|
|
5,044
|
|
—
|
|
436
|
|
1,666
|
|
5,480
|
|
7,146
|
|
(1,292
|
)
|
2006
|
|||||||||||||||||||||
|
Circle M
|
Lancaster
|
PA
|
—
|
|
330
|
|
1,041
|
|
—
|
|
374
|
|
330
|
|
1,415
|
|
1,745
|
|
(342
|
)
|
2006
|
|||||||||||||||||||||
|
Dutch County
|
Manheim
|
PA
|
—
|
|
88
|
|
278
|
|
—
|
|
103
|
|
88
|
|
381
|
|
469
|
|
(96
|
)
|
2006
|
|||||||||||||||||||||
|
Gettysburg Farm
|
Dover
|
PA
|
—
|
|
111
|
|
350
|
|
—
|
|
126
|
|
111
|
|
476
|
|
587
|
|
(116
|
)
|
2006
|
|||||||||||||||||||||
|
Green Acres
|
Breinigsville
|
PA
|
(27,823
|
)
|
2,680
|
|
7,479
|
|
—
|
|
4,222
|
|
2,680
|
|
11,701
|
|
14,381
|
|
(8,554
|
)
|
1988
|
|||||||||||||||||||||
|
Greenbriar Village
|
Bath
|
PA
|
(13,870
|
)
|
8,359
|
|
16,941
|
|
—
|
|
10
|
|
8,359
|
|
16,951
|
|
25,310
|
|
(2,244
|
)
|
2011
|
|||||||||||||||||||||
|
Hershey
|
Lebanon
|
PA
|
—
|
|
1,284
|
|
3,028
|
|
17
|
|
1,091
|
|
1,301
|
|
4,119
|
|
5,420
|
|
(1,159
|
)
|
2004
|
|||||||||||||||||||||
|
Lil Wolf
|
Orefield
|
PA
|
—
|
|
5,627
|
|
13,593
|
|
—
|
|
487
|
|
5,627
|
|
14,080
|
|
19,707
|
|
(1,800
|
)
|
2011
|
|||||||||||||||||||||
|
Mountain View - PA
|
Walnutport
|
PA
|
(6,937
|
)
|
3,207
|
|
7,182
|
|
—
|
|
153
|
|
3,207
|
|
7,335
|
|
10,542
|
|
(996
|
)
|
2011
|
|||||||||||||||||||||
|
Robin Hill
|
Lenhartsville
|
PA
|
—
|
|
1,263
|
|
3,786
|
|
—
|
|
138
|
|
1,263
|
|
3,924
|
|
5,187
|
|
(652
|
)
|
2009
|
|||||||||||||||||||||
|
Scotrun
|
Scotrun
|
PA
|
—
|
|
153
|
|
483
|
|
—
|
|
186
|
|
153
|
|
669
|
|
822
|
|
(162
|
)
|
2006
|
|||||||||||||||||||||
|
Spring Gulch
|
New Holland
|
PA
|
(4,037
|
)
|
1,593
|
|
4,795
|
|
—
|
|
337
|
|
1,593
|
|
5,132
|
|
6,725
|
|
(1,705
|
)
|
2004
|
|||||||||||||||||||||
|
Sun Valley
|
Bowmansville
|
PA
|
—
|
|
866
|
|
2,601
|
|
—
|
|
195
|
|
866
|
|
2,796
|
|
3,662
|
|
(460
|
)
|
2009
|
|||||||||||||||||||||
|
Timothy Lake North
|
East Stroudsburg
|
PA
|
—
|
|
296
|
|
933
|
|
—
|
|
376
|
|
296
|
|
1,309
|
|
1,605
|
|
(350
|
)
|
2006
|
|||||||||||||||||||||
|
Timothy Lake South
|
East Stroudsburg
|
PA
|
—
|
|
206
|
|
649
|
|
—
|
|
32
|
|
206
|
|
681
|
|
887
|
|
(168
|
)
|
2006
|
|||||||||||||||||||||
|
Carolina Landing
|
Fair Play
|
SC
|
—
|
|
457
|
|
1,078
|
|
6
|
|
253
|
|
463
|
|
1,331
|
|
1,794
|
|
(381
|
)
|
2004
|
|||||||||||||||||||||
|
Inlet Oaks
|
Murrells Inlet
|
SC
|
(4,491
|
)
|
1,546
|
|
4,642
|
|
—
|
|
191
|
|
1,546
|
|
4,833
|
|
6,379
|
|
(1,235
|
)
|
2006
|
|||||||||||||||||||||
|
The Oaks at Point South
|
Yemassee
|
SC
|
—
|
|
267
|
|
810
|
|
—
|
|
44
|
|
267
|
|
854
|
|
1,121
|
|
(231
|
)
|
2006
|
|||||||||||||||||||||
|
Cherokee Landing
|
Middleton
|
TN
|
—
|
|
118
|
|
279
|
|
2
|
|
44
|
|
120
|
|
323
|
|
443
|
|
(100
|
)
|
2004
|
|||||||||||||||||||||
|
Natchez Trace
|
Hohenwald
|
TN
|
—
|
|
533
|
|
1,257
|
|
7
|
|
352
|
|
540
|
|
1,609
|
|
2,149
|
|
(471
|
)
|
2004
|
|||||||||||||||||||||
|
Alamo Palms Resort
|
Harlingen
|
TX
|
(6,698
|
)
|
1,562
|
|
7,924
|
|
—
|
|
12
|
|
1,562
|
|
7,936
|
|
9,498
|
|
(462
|
)
|
2012
|
|||||||||||||||||||||
|
Bay Landing
|
Bridgeport
|
TX
|
—
|
|
438
|
|
1,033
|
|
6
|
|
487
|
|
444
|
|
1,520
|
|
1,964
|
|
(380
|
)
|
2004
|
|||||||||||||||||||||
|
Colorado River
|
Columbus
|
TX
|
—
|
|
466
|
|
1,099
|
|
6
|
|
137
|
|
472
|
|
1,236
|
|
1,708
|
|
(377
|
)
|
2004
|
|||||||||||||||||||||
|
Country Sunshine
|
Weslaco
|
TX
|
—
|
|
627
|
|
1,881
|
|
—
|
|
866
|
|
627
|
|
2,747
|
|
3,374
|
|
(958
|
)
|
2004
|
|||||||||||||||||||||
|
Fun n Sun RV
|
San Benito
|
TX
|
(6,566
|
)
|
2,533
|
|
5,560
|
|
412
|
|
5,943
|
|
2,945
|
|
11,503
|
|
14,448
|
|
(5,944
|
)
|
1998
|
|||||||||||||||||||||
S-11
Schedule III
Equity LifeStyle Properties, Inc.
Real Estate and Accumulated Depreciation
December 31, 2013
(amounts in thousands)
|
|
|
|
|
Initial Cost to
Company
|
Costs Capitalized
Subsequent to
Acquisition
(Improvements)
|
Gross Amount Carried
at Close of Period 12/31/13 |
|
|
||||||||||||||||||||||||||||||||||
|
Real Estate
(1)
|
Location
|
Encumbrances
|
Land
|
Depreciable
Property
|
Land
|
Depreciable
Property
|
Land
|
Depreciable
Property
|
Total
|
Accumulated
Depreciation
|
Date of
Acquisition
|
|||||||||||||||||||||||||||||||
|
Lake Conroe
|
Willis
|
TX
|
$
|
—
|
|
$
|
1,363
|
|
$
|
3,214
|
|
$
|
18
|
|
$
|
1,739
|
|
$
|
1,381
|
|
$
|
4,953
|
|
$
|
6,334
|
|
$
|
(1,395
|
)
|
2004
|
||||||||||||
|
Lake Tawakoni
|
Point
|
TX
|
—
|
|
35
|
|
2,320
|
|
—
|
|
275
|
|
35
|
|
2,595
|
|
2,630
|
|
(764
|
)
|
2004
|
|||||||||||||||||||||
|
Lake Texoma
|
Gordonville
|
TX
|
—
|
|
488
|
|
1,151
|
|
6
|
|
965
|
|
494
|
|
2,116
|
|
2,610
|
|
(532
|
)
|
2004
|
|||||||||||||||||||||
|
Lake Whitney
|
Whitney
|
TX
|
—
|
|
679
|
|
1,602
|
|
10
|
|
700
|
|
689
|
|
2,302
|
|
2,991
|
|
(617
|
)
|
2004
|
|||||||||||||||||||||
|
Lakewood
|
Harlingen
|
TX
|
—
|
|
325
|
|
979
|
|
—
|
|
177
|
|
325
|
|
1,156
|
|
1,481
|
|
(415
|
)
|
2004
|
|||||||||||||||||||||
|
Medina Lake
|
Lakehills
|
TX
|
—
|
|
936
|
|
2,208
|
|
12
|
|
910
|
|
948
|
|
3,118
|
|
4,066
|
|
(929
|
)
|
2004
|
|||||||||||||||||||||
|
Paradise Park RV
|
Harlingen
|
TX
|
—
|
|
1,568
|
|
4,705
|
|
—
|
|
762
|
|
1,568
|
|
5,467
|
|
7,035
|
|
(1,767
|
)
|
2004
|
|||||||||||||||||||||
|
Paradise South
|
Mercedes
|
TX
|
—
|
|
448
|
|
1,345
|
|
—
|
|
302
|
|
448
|
|
1,647
|
|
2,095
|
|
(532
|
)
|
2004
|
|||||||||||||||||||||
|
Southern Comfort
|
Weslaco
|
TX
|
—
|
|
1,108
|
|
3,323
|
|
—
|
|
332
|
|
1,108
|
|
3,655
|
|
4,763
|
|
(1,235
|
)
|
2004
|
|||||||||||||||||||||
|
Sunshine RV
|
Harlingen
|
TX
|
—
|
|
1,494
|
|
4,484
|
|
—
|
|
1,051
|
|
1,494
|
|
5,535
|
|
7,029
|
|
(1,812
|
)
|
2004
|
|||||||||||||||||||||
|
Tropic Winds
|
Harlingen
|
TX
|
—
|
|
1,221
|
|
3,809
|
|
—
|
|
557
|
|
1,221
|
|
4,366
|
|
5,587
|
|
(1,677
|
)
|
2002
|
|||||||||||||||||||||
|
Victoria Palms Resort
|
Harlingen
|
TX
|
(11,332
|
)
|
2,849
|
|
12,305
|
|
—
|
|
133
|
|
2,849
|
|
12,438
|
|
15,287
|
|
(789
|
)
|
2012
|
|||||||||||||||||||||
|
All Seasons
|
Salt Lake City
|
UT
|
(3,169
|
)
|
510
|
|
1,623
|
|
—
|
|
509
|
|
510
|
|
2,132
|
|
2,642
|
|
(1,125
|
)
|
1997
|
|||||||||||||||||||||
|
St. George
|
Hurricane
|
UT
|
—
|
|
64
|
|
264
|
|
2
|
|
190
|
|
66
|
|
454
|
|
520
|
|
(60
|
)
|
2010
|
|||||||||||||||||||||
|
Westwood Village
|
Farr West
|
UT
|
(10,189
|
)
|
1,346
|
|
4,179
|
|
—
|
|
2,011
|
|
1,346
|
|
6,190
|
|
7,536
|
|
(3,217
|
)
|
1997
|
|||||||||||||||||||||
|
Chesapeake Bay
|
Cloucester
|
VA
|
—
|
|
1,230
|
|
2,900
|
|
16
|
|
1,124
|
|
1,246
|
|
4,024
|
|
5,270
|
|
(1,160
|
)
|
2004
|
|||||||||||||||||||||
|
Harbor View
|
Colonial Beach
|
VA
|
—
|
|
64
|
|
202
|
|
—
|
|
428
|
|
64
|
|
630
|
|
694
|
|
(127
|
)
|
2006
|
|||||||||||||||||||||
|
Lynchburg
|
Gladys
|
VA
|
—
|
|
266
|
|
627
|
|
4
|
|
191
|
|
270
|
|
818
|
|
1,088
|
|
(241
|
)
|
2004
|
|||||||||||||||||||||
|
Meadows of Chantilly
|
Chantilly
|
VA
|
(45,991
|
)
|
5,430
|
|
16,440
|
|
—
|
|
7,054
|
|
5,430
|
|
23,494
|
|
28,924
|
|
(13,597
|
)
|
1994
|
|||||||||||||||||||||
|
Regency Lakes
|
Winchester
|
VA
|
(9,855
|
)
|
9,757
|
|
19,055
|
|
—
|
|
34
|
|
9,757
|
|
19,089
|
|
28,846
|
|
(2,723
|
)
|
2011
|
|||||||||||||||||||||
|
Virginia Landing
|
Quinby
|
VA
|
—
|
|
602
|
|
1,419
|
|
8
|
|
193
|
|
610
|
|
1,612
|
|
2,222
|
|
(503
|
)
|
2004
|
|||||||||||||||||||||
|
Williamsburg
|
Williamsburg
|
VA
|
—
|
|
111
|
|
350
|
|
—
|
|
115
|
|
111
|
|
465
|
|
576
|
|
(106
|
)
|
2006
|
|||||||||||||||||||||
|
Birch Bay
|
Blaine
|
WA
|
—
|
|
502
|
|
1,185
|
|
7
|
|
98
|
|
509
|
|
1,283
|
|
1,792
|
|
(390
|
)
|
2004
|
|||||||||||||||||||||
|
Chehalis
|
Chehalis
|
WA
|
—
|
|
590
|
|
1,392
|
|
8
|
|
752
|
|
598
|
|
2,144
|
|
2,742
|
|
(605
|
)
|
2004
|
|||||||||||||||||||||
|
Crescent Bar
|
Quincy
|
WA
|
—
|
|
314
|
|
741
|
|
4
|
|
227
|
|
318
|
|
968
|
|
1,286
|
|
(288
|
)
|
2004
|
|||||||||||||||||||||
|
Grandy Creek
|
Concrete
|
WA
|
—
|
|
475
|
|
1,425
|
|
—
|
|
176
|
|
475
|
|
1,601
|
|
2,076
|
|
(322
|
)
|
2008
|
|||||||||||||||||||||
|
Kloshe Illahee
|
Federal Way
|
WA
|
(16,439
|
)
|
2,408
|
|
7,286
|
|
—
|
|
657
|
|
2,408
|
|
7,943
|
|
10,351
|
|
(4,291
|
)
|
1997
|
|||||||||||||||||||||
|
La Conner
|
La Conner
|
WA
|
—
|
|
—
|
|
2,016
|
|
—
|
|
793
|
|
—
|
|
2,809
|
|
2,809
|
|
(897
|
)
|
2004
|
|||||||||||||||||||||
|
Leavenworth
|
Leavenworth
|
WA
|
—
|
|
786
|
|
1,853
|
|
10
|
|
522
|
|
796
|
|
2,375
|
|
3,171
|
|
(682
|
)
|
2004
|
|||||||||||||||||||||
|
Little Diamond
|
Newport
|
WA
|
—
|
|
353
|
|
834
|
|
5
|
|
608
|
|
358
|
|
1,442
|
|
1,800
|
|
(342
|
)
|
2004
|
|||||||||||||||||||||
|
Long Beach
|
Seaview
|
WA
|
—
|
|
321
|
|
758
|
|
4
|
|
343
|
|
325
|
|
1,101
|
|
1,426
|
|
(268
|
)
|
2004
|
|||||||||||||||||||||
S-12
Schedule III
Equity LifeStyle Properties, Inc.
Real Estate and Accumulated Depreciation
December 31, 2013
(amounts in thousands)
|
|
|
|
|
Initial Cost to
Company
|
Costs Capitalized
Subsequent to
Acquisition
(Improvements)
|
Gross Amount Carried
at Close of Period 12/31/13 |
|
|
||||||||||||||||||||||||||||||||||
|
Real Estate
(1)
|
Location
|
Encumbrances
|
Land
|
Depreciable
Property
|
Land
|
Depreciable
Property
|
Land
|
Depreciable
Property
|
Total
|
Accumulated
Depreciation
|
Date of
Acquisition
|
|||||||||||||||||||||||||||||||
|
Mount Vernon
|
Bow
|
WA
|
$
|
—
|
|
$
|
621
|
|
$
|
1,464
|
|
$
|
8
|
|
$
|
643
|
|
$
|
629
|
|
$
|
2,107
|
|
$
|
2,736
|
|
$
|
(601
|
)
|
2004
|
||||||||||||
|
Oceana
|
Oceana City
|
WA
|
—
|
|
283
|
|
668
|
|
4
|
|
88
|
|
287
|
|
756
|
|
1,043
|
|
(218
|
)
|
2004
|
|||||||||||||||||||||
|
Paradise
|
Silver Creek
|
WA
|
—
|
|
466
|
|
1,099
|
|
7
|
|
260
|
|
473
|
|
1,359
|
|
1,832
|
|
(399
|
)
|
2004
|
|||||||||||||||||||||
|
Tall Chief
|
Fall City
|
WA
|
—
|
|
314
|
|
946
|
|
—
|
|
254
|
|
314
|
|
1,200
|
|
1,514
|
|
(170
|
)
|
2010
|
|||||||||||||||||||||
|
Thunderbird
|
Monroe
|
WA
|
—
|
|
500
|
|
1,178
|
|
8
|
|
209
|
|
508
|
|
1,387
|
|
1,895
|
|
(411
|
)
|
2004
|
|||||||||||||||||||||
|
Arrowhead
|
Wisconsin Dells
|
WI
|
—
|
|
522
|
|
1,616
|
|
—
|
|
374
|
|
522
|
|
1,990
|
|
2,512
|
|
(482
|
)
|
2006
|
|||||||||||||||||||||
|
Fremont
|
Fremont
|
WI
|
(3,708
|
)
|
1,437
|
|
4,296
|
|
—
|
|
589
|
|
1,437
|
|
4,885
|
|
6,322
|
|
(1,486
|
)
|
2004
|
|||||||||||||||||||||
|
Neshonoc Lakeside
|
LaCrosse County
|
WI
|
(5,381
|
)
|
1,789
|
|
5,369
|
|
—
|
|
—
|
|
1,789
|
|
5,369
|
|
7,158
|
|
—
|
|
2013
|
|||||||||||||||||||||
|
Plymouth Rock
|
Elkhart Lake
|
WI
|
(6,731
|
)
|
2,293
|
|
6,879
|
|
—
|
|
382
|
|
2,293
|
|
7,261
|
|
9,554
|
|
(1,175
|
)
|
2009
|
|||||||||||||||||||||
|
Rainbow Lake Manor
|
Bristol
|
WI
|
—
|
|
4,474
|
|
16,594
|
|
—
|
|
2
|
|
4,474
|
|
16,596
|
|
21,070
|
|
(458
|
)
|
2013
|
|||||||||||||||||||||
|
Tranquil Timbers
|
Sturgeon Bay
|
WI
|
—
|
|
714
|
|
2,152
|
|
—
|
|
400
|
|
714
|
|
2,552
|
|
3,266
|
|
(624
|
)
|
2006
|
|||||||||||||||||||||
|
Westwood Estates
|
Pleasant Prairie
|
WI
|
—
|
|
5,382
|
|
19,732
|
|
—
|
|
—
|
|
5,382
|
|
19,732
|
|
25,114
|
|
(575
|
)
|
2013
|
|||||||||||||||||||||
|
Yukon Trails
|
Lyndon Station
|
WI
|
—
|
|
556
|
|
1,629
|
|
—
|
|
192
|
|
556
|
|
1,821
|
|
2,377
|
|
(561
|
)
|
2004
|
|||||||||||||||||||||
|
Subtotal of Properties Held for Long Term
|
(1,992,333
|
)
|
1,019,820
|
|
2,540,588
|
|
5,426
|
|
438,902
|
|
1,025,246
|
|
2,979,490
|
|
4,004,736
|
|
(1,016,001
|
)
|
||||||||||||||||||||||||
|
Realty Systems, Inc.
|
(35
|
)
|
—
|
|
—
|
|
—
|
|
204,226
|
|
—
|
|
204,226
|
|
204,226
|
|
(27,202
|
)
|
2002
|
|||||||||||||||||||||||
|
Management Business and other
|
—
|
|
—
|
|
436
|
|
—
|
|
18,708
|
|
—
|
|
19,144
|
|
19,144
|
|
(15,337
|
)
|
1990
|
|||||||||||||||||||||||
|
$
|
(1,992,368
|
)
|
$
|
1,019,820
|
|
$
|
2,541,024
|
|
$
|
5,426
|
|
$
|
661,836
|
|
$
|
1,025,246
|
|
$
|
3,202,860
|
|
$
|
4,228,106
|
|
$
|
(1,058,540
|
)
|
||||||||||||||||
_________________________________
|
(1)
|
The schedule excludes Properties in which we have a non-controlling joint venture interest and accounts for using the equity method of accounting.
|
|
(2)
|
All Properties were acquired, except for Country Place Village, which was constructed.
|
S-13
Schedule III
Equity LifeStyle Properties, Inc.
Real Estate and Accumulated Depreciation
December 31, 2013
(amounts in thousands)
The changes in total real estate for the years ended December 31,
2013
,
2012
and
2011
were as follows:
|
2013
|
2012
(a)
|
2011
(a)
|
|||||||||
|
Balance, beginning of year
|
$
|
4,044,650
|
|
$
|
3,960,692
|
|
$
|
2,584,987
|
|
||
|
Acquisitions
|
133,344
|
|
18,738
|
|
1,312,658
|
|
|||||
|
Improvements
|
64,714
|
|
67,850
|
|
61,256
|
|
|||||
|
Dispositions and other
|
(14,602
|
)
|
(2,630
|
)
|
1,791
|
|
|||||
|
Balance, end of year
|
$
|
4,228,106
|
|
$
|
4,044,650
|
|
$
|
3,960,692
|
|
||
_____________________________________
|
(a)
|
Certain prior year amounts have been reclassified to conform to the 2013 presentation. These reclassifications had no material effect on the consolidated financial statements.
|
The changes in accumulated depreciation for the years ended December 31,
2013
,
2012
and
2011
were as follows:
|
2013
|
2012
(a)
|
2011
(a)
|
|||||||||
|
Balance, beginning of year
|
$
|
948,581
|
|
$
|
807,329
|
|
$
|
700,665
|
|
||
|
Depreciation expense
(b)
|
108,229
|
|
102,083
|
|
83,013
|
|
|||||
|
Amortization of in-place leases
|
1,940
|
|
39,467
|
|
23,126
|
|
|||||
|
Dispositions and other
|
(210
|
)
|
(298
|
)
|
525
|
|
|||||
|
Balance, end of year
|
$
|
1,058,540
|
|
$
|
948,581
|
|
$
|
807,329
|
|
||
________________________
|
(a)
|
Certain prior year amounts have been reclassified to conform to the 2013 presentation. These reclassifications had no material effect on the consolidated financial statements.
|
|
(b)
|
Includes approximately $6.5 million, $5.6 million and $4.1 million of depreciation from rental operations for the years ended December 31,
2013
,
2012
and
2011
, respectively.
|
S-14
TABLE OF CONTENTS
Part IItem 1. BusinessItem 1A. Risk FactorsItem 1B. Unresolved Staff CommentsItem 2. PropertiesItem 3. Legal ProceedingsItem 4. Mine Safety DisclosurePart IIItem 5. Market For Registrant S Common Equity, Related Stockholder Matters and Issuer Purchases Of Equity SecuritiesItem 6. Selected Financial DataItem 7. Management S Discussion and Analysis Of Financial Condition and Results Of OperationsItem 7A. Quantitative and Qualitative Disclosures About Market RiskItem 8. Financial Statements and Supplementary DataItem 9. Changes in and Disagreements with Accountants on Accounting and Financial DisclosureItem 9A. Controls and ProceduresItem 9B. Other InformationPart IIIItem 12. Security Ownership Of Certain Beneficial Owners and Management and Related Stockholder MattersPart IVItem 15. Exhibits and Financial Statements SchedulesNote 1 Our Organization and Basis Of PresentationNote 2 Summary Of Significant Accounting PoliciesNote 2 Summary Of Significant Accounting Policies (continued)Note 3 Earnings Per Common ShareNote 3 Earnings Per Common Share (continued)Note 4 Common Stock and Other Equity Related TransactionsNote 4 Common Stock and Other Equity Related Transactions (continued)Note 5 Investment in Real EstateNote 5 Investment in Real Estate (continued)Note 6 Investment in Joint VenturesNote 7 Notes ReceivableNote 8 Borrowing ArrangementsNote 8 Borrowing Arrangements (continued)Note 9 Derivative Instruments and Hedging ActivitiesNote 10 Deferred Revenue-entry Of Right-to-use Contracts and Deferred Commission ExpenseNote 11 Lease AgreementsNote 12 Ground LeasesNote 13 Transactions with Related PartiesNote 14 Stock Option Plan and Stock GrantsNote 14 Stock Option Plan and Stock Grants (continued)Note 15 Preferred StockNote 16 Long-term Cash Incentive PlanNote 17 Savings PlanNote 17 Savings Plan (continued)Note 18 Commitments and ContingenciesNote 18 Commitments and Contingencies (continued)Note 19 Reportable SegmentsNote 19 Reportable Segments (continued)Note 20 Quarterly Financial Data (unaudited)