EQUITY LIFESTYLE PROPERTIES INC
10-Ks and 10-Qs
|
|
|
|
|
|
|
|
|
|
|
|
|
|
|
|
|
|
|
|
|
|
|
|
|
|
|
|
|
|
|
|
|
|
|
|
|
|
|
|
|
|
|
|
|
|
|
|
|
|
|
|
|
|
|
|
|
|
|
UNITED STATES
SECURITIES AND EXCHANGE COMMISSION
Washington, D.C. 20549
FORM
10-K
|
|
ANNUAL REPORT PURSUANT TO SECTION 13 OR 15(d) OF THE SECURITIES EXCHANGE ACT OF 1934 | ||||
For the Fiscal Year Ended
December 31
, 2023
or
|
|
TRANSITION REPORT PURSUANT TO SECTION 13 OR 15(d) OF THE SECURITIES EXCHANGE ACT OF 1934 | ||||
For the transition period from to Commission File Number:
1-11718
(Exact name of registrant as specified in its charter)
|
|
|
||||||||||||||||
| (State or other jurisdiction of incorporation) | (IRS Employer Identification Number) | ||||||||||||||||
|
|
|
|
|
||||||||||||||
| (Address of Principal Executive Offices) | (Zip Code) | ||||||||||||||||
(
312
)
279-1400
Registrant's telephone number, including area code
| Securities registered pursuant to Section 12(b) of the Act: | ||||||||
| Title of each class | Trading Symbol(s) | Name of each exchange on which registered | ||||||
|
|
|
|
||||||
Securities registered pursuant to Section 12(g) of the Act:
None
Indicate by check mark if the Registrant is a well-known seasoned issuer, as defined in Rule 405 of the Securities Act.
Yes
☒
No
☐
Indicate by check mark if the Registrant is not required to file reports pursuant to Section 13 or Section 15(d) of the Act. Yes
☐
No
☒
Indicate by check mark whether the Registrant (1) has filed all reports required to be filed by Section 13 or 15(d) of the Securities Exchange Act of 1934 during the preceding 12 months (or for such shorter period that the Registrant was required to file such reports), and (2) has been subject to such filing requirements for the past 90 days.
Yes
☒
No
☐
Indicate by check mark whether the Registrant has submitted electronically every Interactive Data File required to be submitted pursuant to Rule 405 of Regulation S-T (§232.405 of this chapter) during the preceding 12 months (or for such shorter period that the registrant was required to submit such files).
Yes
☒
No
☐
Indicate by check mark whether the Registrant is a large accelerated filer, an accelerated filer, a non-accelerated filer, a smaller reporting company, or emerging growth company. See definitions of
“
large accelerated filer
”,
“
accelerated filer
”
,
“
smaller reporting company
”
and
“
emerging growth company
”
in Rule 12b-2 of the Exchange Act.
|
|
x | Accelerated filer | ☐ | Smaller reporting company |
|
Emerging Growth Company |
|
||||||||||||||||
| Non-accelerated filer | ☐ | ||||||||||||||||||||||
If an emerging growth company, indicate by check mark if the registrant has elected not to use the extended transition period for complying with any new or revised financial accounting standards provided pursuant to Section 13(a) of the Exchange Act
☐
Indicate by check mark whether the registrant has filed a report on and attestation to its management's assessment of the effectiveness of its internal control over financial reporting under Section 404(b) of the Sarbanes-Oxley Act (15 U.S.C. 7262(b)) by the registered public accounting firm that prepared or issued its audit report.
☒
If securities are registered pursuant to Section 12(b) of the Act, indicate by check mark whether the financial statements of the registrant included in the filing reflect the correction of an error to previously issued financial statements
.
☐
Indicate by check mark whether any of those error corrections are restatements that required a recovery analysis of incentive-based compensation received by any of the registrant’s executive officers during the relevant recovery period pursuant to § 240.10D-1(b). ☐
Indicate by check mark whether the Registrant is a shell company (as defined in Rule 12b-2 of the Exchange Act). Yes
☐
No
☒
The aggregate market value of voting stock held by non-affiliates was approximately $
12,290.1
million as of June 30, 2023 based upon the closing price of $66.89 on such date using beneficial ownership of stock rules adopted pursuant to Section 13 of the Securities Exchange Act of 1934 to exclude voting stock owned by Directors and Officers, some of whom may not be held to be affiliates upon judicial determination.
As of February 16, 2024,
186,492,242
shares of the Registrant's common stock were outstanding.
DOCUMENTS INCORPORATED BY REFERENCE:
Part III incorporates by reference portions of the Registrant's Proxy Statement relating to the Annual Meeting of Stockholders to be held on April 30, 2024.
Equity LifeStyle Properties, Inc.
TABLE OF CONTENTS
| Page | |||||||||||
| PART I. | |||||||||||
| Item 1. | Business | ||||||||||
| Item 1A. | Risk Factors | ||||||||||
| Item 1B. | Unresolved Staff Comments | ||||||||||
| Item 1C. | Cybersecurity | ||||||||||
| Item 2. | Properties | ||||||||||
| Item 3. | Legal Proceedings | ||||||||||
| Item 4. | Mine Safety Disclosures | ||||||||||
| PART II. | |||||||||||
| Item 5. | Market for the Registrant's Common Equity, Related Stockholder Matters and Issuer Purchases of Equity Securities | ||||||||||
| Item 6. | [Reserved] | ||||||||||
| Item 7. | Management's Discussion and Analysis of Financial Condition and Results of Operations | ||||||||||
| Item 7A. | Quantitative and Qualitative Disclosures About Market Risk | ||||||||||
| Forward-Looking Statements | |||||||||||
| Item 8. | Financial Statements and Supplementary Data | ||||||||||
| Item 9. | Changes In and Disagreements with Accountants on Accounting and Financial Disclosure | ||||||||||
| Item 9A. | Controls and Procedures | ||||||||||
| Item 9B. | Other Information | ||||||||||
| Item 9C. | Disclosure Regarding Foreign Jurisdictions that Prevent Inspections | ||||||||||
| PART III. | |||||||||||
| Item 10. | Directors, Executive Officers and Corporate Governance | ||||||||||
| Item 11. | Executive Compensation | ||||||||||
| Item 12. | Security Ownership of Certain Beneficial Owners and Management and Related Stockholder Matters | ||||||||||
| Item 13. | Certain Relationships and Related Transactions, and Director Independence | ||||||||||
| Item 14. | Principal Accounting Fees and Services | ||||||||||
| PART IV. | |||||||||||
| Item 15. | Exhibits, Financial Statement Schedules | ||||||||||
| Item 16. | Form 10-K Summary | ||||||||||
-i-
PART I
Item 1. Business
Equity LifeStyle Properties, Inc.
General
Equity LifeStyle Properties, Inc. (“ELS”), a Maryland corporation, together with MHC Operating Limited Partnership (the “Operating Partnership”) and its other consolidated subsidiaries (the “Subsidiaries”), are referred to herein as “we,” “us,” and “our”. We are a fully integrated owner of lifestyle-oriented properties (“Properties”) consisting of property operations and home sales and rental operations primarily within manufactured home (“MH”) and recreational vehicle (“RV”) communities and marinas. We were formed in December 1992 to continue the property operations, business objectives and acquisition strategies of an entity that had owned and operated Properties since 1969. Commencing with our taxable year ended December 31, 1993, we have elected to be taxed as a real estate investment trust (“REIT”) for U.S. federal income tax purposes.
We have a unique business model where we own the land which we lease to customers who own manufactured homes and cottages, RVs and/or boats either on a long-term or short-term basis. Our customers may lease individual developed areas (“Sites”) or enter into right-to-use contracts, also known as membership subscriptions, which provide them access to specific Properties for limited stays. Compared to other types of real estate companies, our business model is characterized by low maintenance costs and low customer turnover costs. Our portfolio is geographically diversified across highly desirable locations near retirement and vacation destinations and urban areas across the United States. We have more than 110 Properties with lake, river or ocean frontage and more than 120 Properties within 10 miles of the coastal United States. Our Properties generally attract retirees, vacationing families, second homeowners and first-time homebuyers by providing a community experience and a lower-cost home ownership alternative.
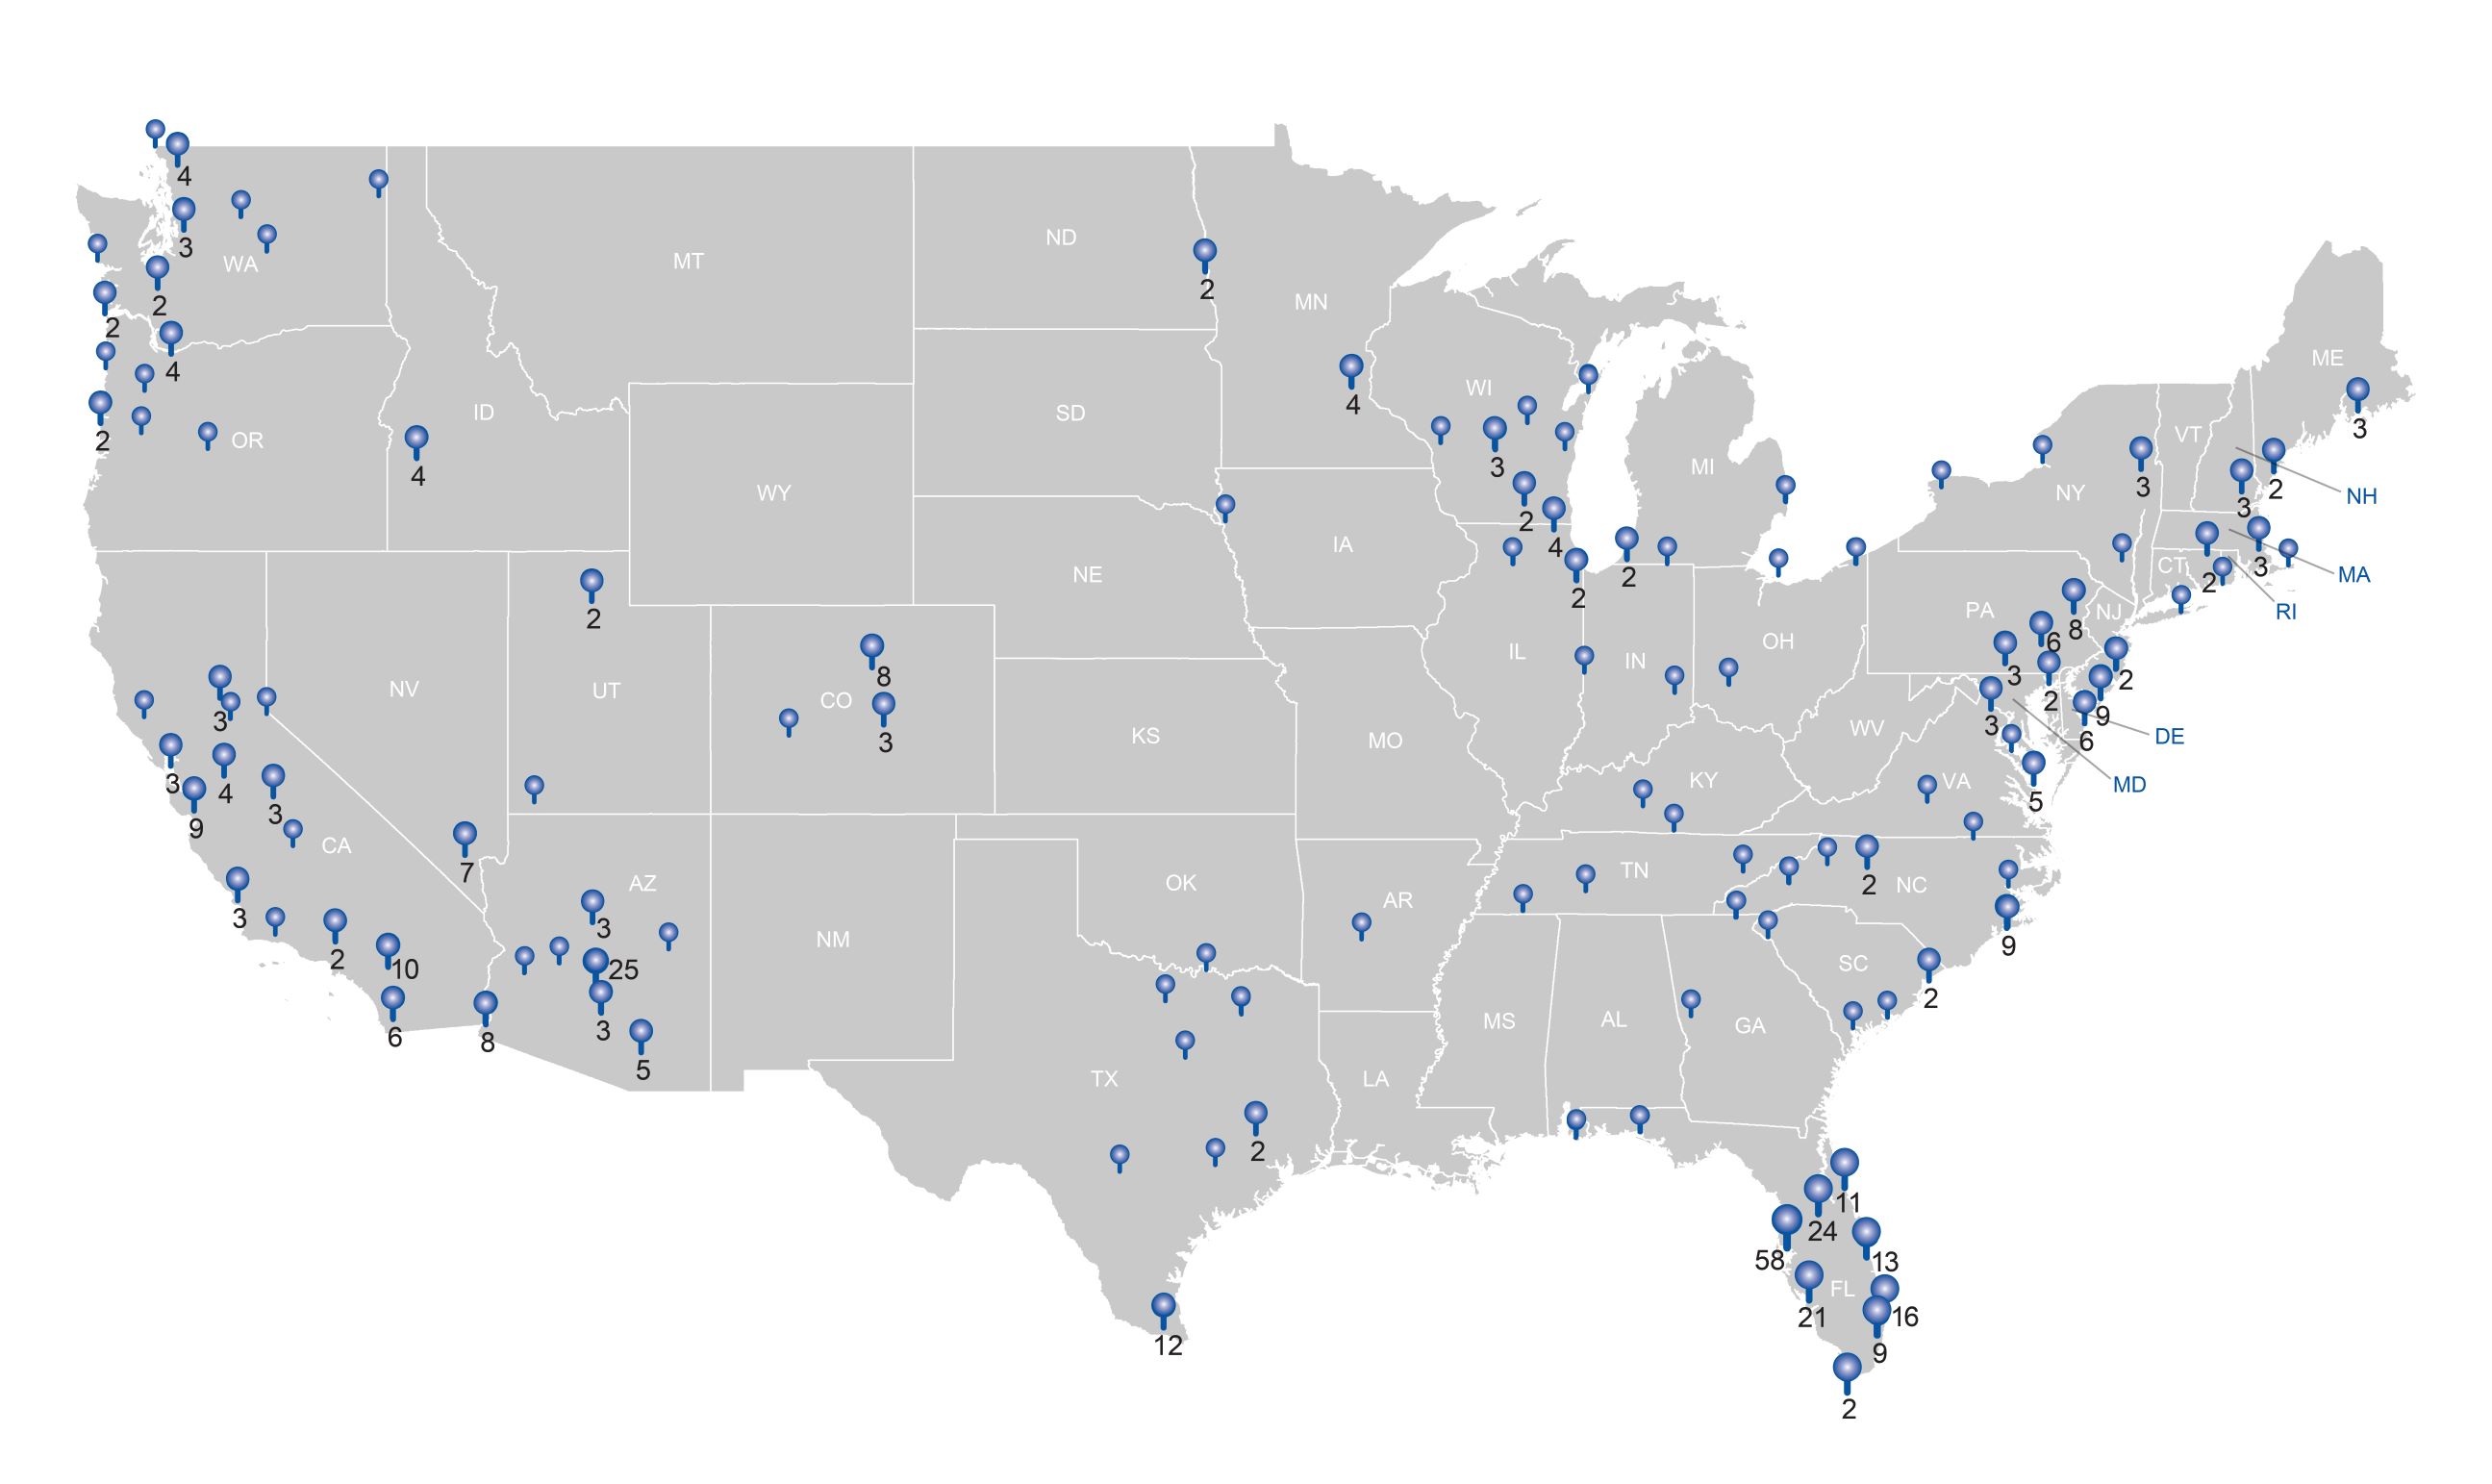
We are one of the nation's largest real estate networks with a portfolio of 451 Properties (including joint venture Properties) consisting of 172,465 Sites located throughout 35 states in the U.S. and British Columbia in Canada as of December 31, 2023.
1
Our Properties are generally designed and improved for housing options of various sizes and layouts that are produced off-site by third-party manufacturers, installed and set on designated Sites within the Properties. Manufactured homes and cottages can range from approximately 400 to over 2,000 square feet. Properties may also have Sites that can accommodate RVs of varying sizes. We also have marinas that offer boat slip and dry storage rentals. In addition to centralized entrances, internal road systems and designated Sites, our Properties generally provide a clubhouse for social activities and recreation and other amenities, which can include swimming pools, shuffleboard courts, tennis courts, pickleball courts, golf courses, lawn bowling, restaurants, laundry facilities, cable television and internet service. Some Properties provide utilities, including water and sewer service, through municipal or regulated utilities, while others provide these services to customers from on-site facilities.
Our Formation
Our Properties are primarily owned by our Operating Partnership and managed internally by affiliates of our Operating Partnership. We are the general partner of the Operating Partnership. We contributed the proceeds from our various equity offerings, including our initial public offering, to the Operating Partnership. In exchange for these contributions, we received units of common interests in the partnership (“OP Units”) equal to the number of shares of common stock that have been issued in such equity offerings.
We have elected to be taxed as a REIT for U.S. federal income tax purposes. Since certain activities, if performed by us, may not be qualifying REIT activities under the Internal Revenue Code of 1986, as amended (the “Code”), we have formed taxable REIT subsidiaries (each, a “TRS”). Our primary TRS is Realty Systems, Inc. (“RSI”) which, along with owning several Properties, is engaged in the business of purchasing, selling and leasing factory-built homes located in Properties owned and managed by us. RSI also offers home sale brokerage services to our residents who may choose to sell their homes rather than relocate them when moving from a Property. Subsidiaries of RSI also operate ancillary activities at certain Properties, such as golf courses, pro shops, stores and restaurants.
The financial results of the Operating Partnership and Subsidiaries are included in our consolidated financial statements, which can be found beginning on page F-1 of this Form 10-K.
Operating Strategies
Our operating strategy is to own and operate the highest quality Properties in sought-after locations near retirement and vacation destinations and urban areas across the United States. Through management of desirable Properties that provide an exceptional customer experience, we create communities valued by residents and guests while delivering value for stockholders.
We focus on Properties that have strong cash flows and plan to hold such Properties for long-term investment and capital appreciation. In determining cash flow potential, we evaluate our ability to attract high quality customers to our Properties and to retain customers who take pride in the Property and in their homes. Our operating, investment and financing initiatives include:
•
Consistently providing high levels of services and amenities in attractive surroundings to foster a strong sense of community and pride of home ownership;
•
Efficiently managing the Properties to add value, grow occupancy, maintain competitive market rents and control expenses;
•
Incorporating environmental, social and governance (“ESG”) considerations into our business and ensuring sustainability is embedded in our business operations;
•
Achieving growth and increasing property values through strategic expansion and, where appropriate, renovation of the Properties;
•
Utilizing technology to evaluate potential acquisitions, identify and track competing properties, attract new customers and monitor existing and prospective customer satisfaction;
•
Selectively acquiring properties that offer opportunities for us to add value and enhance or create property concentrations in and around retirement or vacation destinations and urban areas to capitalize on operating synergies;
•
Selectively acquiring parcels of land adjacent to our Properties that offer opportunities for us to expand our existing communities with additional Sites;
•
Selecting joint venture partners that share business objectives, growth initiatives and risk profiles similar to ours;
•
Managing our capital structure in order to maintain financial flexibility, minimize exposure to interest rate fluctuations and maintain an appropriate degree of leverage to maximize return on capital; and
•
Developing and maintaining relationships with various capital providers.
2
These initiatives and their implementation were determined by our management team and ratified by our Board of Directors and may be subject to change or amendment at any time.
Acquisitions and Dispositions
We invest in properties in sought-after locations near retirement and vacation destinations and urban areas across the United States with a focus on delivering value for residents and guests as well as stockholders. Over the last decade, we have continued to increase the number of Properties in our portfolio (including joint venture Properties), from approximately 377 Properties with over 139,000 Sites to 451 Properties with approximately 172,500 Sites as of December 31, 2023. During the year ended December 31, 2023, we acquired one RV community. We also acquired two land parcels adjacent to certain Properties consisting of approximately two developable acres. We continually review the Properties in our portfolio to ensure we are delivering on our business and customer service objectives. Over the last five years, we redeployed capital to Properties in markets we believe have greater long-term potential and sold five all-age MH communities located in Indiana and Michigan that were not aligned with our long-term goals.
We believe there continues to be opportunities for property acquisitions. Based on industry reports, we estimate there are approximately 50,000 MH properties and approximately 8,700 RV properties (excluding government owned properties) in North America and approximately 4,500 marinas in the U.S. Many of these properties are not operated by large owners/operators and approximately 3,800 of the MH properties, 1,300 of the RV properties and 500 of the marinas contain 200 sites or more. We believe this fragmentation provides us the opportunity to purchase additional properties. We also believe we have a competitive advantage in the acquisition of additional properties due to our experienced management, significant presence in major real estate markets and access to capital resources. We utilize market information systems to identify and evaluate acquisition opportunities, including the use of a market database to review the primary economic indicators of the various locations in which we expect to expand our operations. We are actively seeking to acquire and at any given time are engaged in various stages of negotiations relating to the possible acquisition of additional properties, which may include outstanding contracts to acquire properties that are subject to the satisfactory completion of our due diligence review.
Acquisitions will be financed with the most efficient available sources of capital, which may include undistributed Funds from Operations (“FFO”), issuance of additional equity securities, including under an at-the-market (“ATM”) equity offering program that we expect to put in place shortly, sales of investments and collateralized and uncollateralized borrowings, including our existing line of credit. In addition, we have acquired and expect to acquire properties in transactions that include the issuance of OP Units as consideration for the acquired properties. We believe that an acquisition structure that includes our Operating Partnership has permitted and will permit us to acquire additional properties in transactions that may defer all or a portion of the sellers' tax consequences.
When evaluating potential acquisitions, we consider, among others, the following factors:
•
Current and projected cash flows of the property;
•
Geographic area and the type of property;
•
Replacement cost of the property, including land values, entitlements and zoning;
•
Location, construction quality, condition and design of the property, including vacant land and its location relative to one or more of our existing properties;
•
Potential for capital appreciation of the property;
•
Terms of tenant leases or usage rights;
•
Climate risk;
•
REIT tax compliance;
•
Sellers' reputation;
•
Opportunity to enhance the customer experience and add value through management expertise;
•
Potential for economies of scale through property concentrations;
•
Potential for economic growth and the tax and regulatory environment of the community in which the property is located;
•
Potential for expansion, including increasing the number of Sites;
•
Occupancy and demand by customers for properties of a similar type in the vicinity;
•
Prospects for liquidity through sale, financing or refinancing of the property;
•
Competition from existing properties and the potential for the construction of new properties in the area; and
•
Working capital demands.
When evaluating potential dispositions, we consider, among others, the following factors:
•
Whether the Property meets our current investment criteria;
3
•
Our desire to exit certain non-core markets and reallocate the capital into core markets; and
•
Our ability to sell the Property at a price that we believe will provide an appropriate return for our stockholders.
When investing capital, we consider all potential uses of the capital, including returning capital to our stockholders. Our Board of Directors periodically reviews the conditions under which we may repurchase our stock. These conditions include, but are not limited to, market price, balance sheet flexibility, other opportunities and capital requirements.
Property Expansions
Development - Current Portfolio.
An integral part of our growth and investment strategy is to evaluate each Property for expansion opportunities. Investment evaluation consists of reviewing the following: local market conditions, demographic trends, zoning and entitlements, infrastructure requirements, financial feasibility, projected performance and property operations. When justified, development of land available for expansion (“Expansion Sites”) allows us to leverage existing facilities and amenities. We believe our ability to increase density translates to greater value creation and cash flows through operational efficiencies. Overall, approximately 124 of our Properties have potential Expansion Sites, offering approximately 6,500 available acres. Refer to Item 2. Properties, which includes detail regarding the developable acres available at each property.
Acquisition - Expanding Portfolio.
In selecting acquisition targets, we focus on properties with existing operations in place and contiguous Expansion Sites. Underwriting a project with these features allows us to access the previously untapped potential of such properties. For example, over the past three years, we have acquired 31 Properties and 7 land parcels that contain approximately 1,000 acres for future expansion.
Human Capital Management
We recognize that our success is driven by our employees. We invest in our employees and are committed to developing our employees’ skills and leadership abilities. As a result, we believe our employees are dedicated to building strong, innovative and long-term relationships with each other and with our residents and guests.
We have an annual average of approximately 4,000 full-time, part-time and seasonal employees dedicated to carrying out our operating philosophy while focusing on delivering an exceptional customer experience for our residents and guests. Our property operations are managed internally by affiliates of the Operating Partnership and are coordinated by an on-site team of employees that typically includes a manager, clerical staff and maintenance workers.
The on-site team at each Property is primarily responsible for providing maintenance and care to the property itself as well as customer service and, at times, coordinating lifestyle-oriented activities for our residents and guests. Direct supervision of on-site management is the responsibility of our regional vice presidents and regional and district managers, who have substantial experience addressing customer needs and creating innovative approaches to provide an exceptional experience for residents and guests, which we believe also creates value for our stockholders, through focused and effective property management. Complementing the field management staff are approximately 500 full-time employees in our home and regional offices who assist in all functions related to the management of our Properties.
For more information on our human capital management, please see the section below on our Sustainability Strategy.
Sustainability Strategy
ELS’ commitment to sustainability takes a holistic approach which aims to support our business model, minimize our environmental impact, maintain a safe and healthy workplace and uphold a high standard of business ethics and conduct. We understand the value of continuing to focus on sustainable practices and the highest standard of business ethics and practices, as they are critical to our overall success and building long-term stakeholder value. With a dedicated sustainability team, we are committed to incorporating ESG principles into our business operations in collaboration with department heads.
Our Environmental, Social and Governance Taskforce (“ESG Taskforce”) supports our on-going commitment to environmental, social, governance and other public policy matters relevant to us (collectively “ESG Matters”). Led by the Sustainability team and overseen by our Executive Vice President and Chief Operating Officer, the ESG Taskforce is comprised of a cross-functional team of employees.
The ESG Taskforce reports on ESG Matters to the Compensation, Nominating and Corporate Governance Committee of the Board of Directors and senior management. The Compensation, Nominating and Corporate Governance Committee is responsible for the review of our ESG strategy, initiatives and policies. Additionally, the Audit Committee of the Board of
4
Directors is responsible for the discussion and review of policies with respect to risk assessment and risk management, including, but not limited to, human capital, climate, cyber security and other ESG risks. The Strategic Planning Committee further assists the Board in assessing ESG strategies. Quarterly committee meetings with the Board include educational briefings from management regarding a wide variety of strategic initiatives, including ESG-related matters.
At ELS, sustainability is at the core of Our Nature through Uniting People, Places & Purpose.
Our People: Team Members.
With a culture of recognition and reputation for excellence, our employees are empowered to take ownership in their jobs and make a difference. ELS is a place where talent is recognized and internal growth is promoted, making it an ideal organization in which to develop a long and successful career.
We are committed to attracting and retaining a diverse workforce and to providing a safe and inclusive environment where our team members are encouraged to demonstrate their unique skill sets and bring a personal touch to their work. We are committed to maintaining workplaces free from discrimination or harassment on the basis of color, race, sex, national origin, ethnicity, religion, age, disability, sexual orientation, gender identification or expression or any other status protected by applicable law. We value the many contributions of a diverse workforce and understand that diverse backgrounds bring diverse perspectives, resulting in unique insights. Our Diversity Council is a cross-functional team formed to help guide and support the Company's ongoing commitment to diversity, equity and inclusion practices for employees, candidates and customers.
We provide equal employment opportunities to all persons, in accordance with the principles and requirements of the Equal Employment Opportunities Commission and the principles and requirements of the Americans with Disabilities Act. As of December 31, 2023, more than 50% of our workforce self-identified as female and more than 50% of our management positions are held by individuals self-identifying as female. To attract diverse applicants, we partner with third parties and post openings to a wide variety of job boards. We also have an annual internship program designed to, among other things, create a pipeline of qualified candidates for positions within the Company and to attract diverse candidates. We recognize the importance of experienced leadership and as of December 31, 2023, the average tenure for the executive team was 18 years. The average age of our employees is 51, with ages spanning multiple generations, similar to our residents and guests.
Our employees are fairly compensated, without regard to gender, race and ethnicity and routinely recognized for outstanding performance. Our compensation program is designed to attract and retain talent. All employees are supported with a strong training and development program and a well-rounded benefits plan to help them maintain their health and financial well-being. Employees are offered flexibility to meet personal and family needs. We encourage our employees to take time away from work to focus on their physical and mental well-being and offer a comprehensive benefit package that includes five mental health and well-being days, paid parental and paid family leave programs that exceed minimum regulatory requirements, back up child care services, pet insurance, paw-ternity leave and paid volunteer time off. In addition, we offer a competitive 401(k) plan that provides for an employer match of up to 4% with 100% vesting of all contributions immediately upon eligibility and an Employee Stock Purchase Plan providing a 15% discount for all eligible employees.
Providing a safe and healthy work environment for our team members is a top priority and we empower them to take ownership in this effort. Each employee is assigned a safety-related training curriculum tailored to their job responsibilities. All employees are encouraged to report any conditions in their workplace that raise health or safety concerns without fear of retaliation.
ELS is a place where talent is recognized and internal growth is promoted. In addition to foundational safety and compliance training, team members participate in virtual and in-person learning experiences including formal new employee and manager development programs, a formal mentorship program, a “Knowledge Power Day” program providing office-based employees an opportunity to be fully immersed in the day-to-day operations at our communities, customer experience training focused on varying elements that support our values for property team members and diversity, equity and inclusion programs to support the sense of belonging, awareness and connection at ELS. We conduct annual performance, career development and compensation reviews for all employees to reward our employees based on merit and their contributions.
We continually assess and strive to enhance employee satisfaction and engagement. We solicit employee feedback and measure engagement through a variety of employee surveys. We look forward to inviting employees to participate in additional pulse surveys annually with focus on engagement and the overall employee experience.
Our People: Residents & Guests:
ELS works to create a comfortable and welcoming environment for everyone – residents, guests and employees. With a culture of recognition and reputation for excellence, ELS teammates are empowered to take ownership in their jobs and help our customers create lasting memories. Our dedicated on-site management teams are encouraged to be ambassadors of their communities and are committed to consistently delivering an exceptional experience for our residents and guests. Hearing directly from our customers is critical, and the number of platforms through which our
5
customers can contact us continues to grow. This customer feedback helps us to make informed business decisions focusing on the safety and health of our residents, guests and employees, while ensuring a positive experience for all.
Our People: Giving Back:
ELS believes in supporting the communities we operate as well as the greater communities in which we live, work and play. In order to maximize our efforts at giving back, we leverage a multi-pronged approach to delivering on this commitment, which includes a focus on employee engagement, community giving, strategic sponsorship and nonprofit impact.
All benefits eligible employees can take paid time off annually to volunteer with a charitable organization of their choice. Team members are encouraged to use this time to make a difference in their communities and utilized over 8,500 Community Impact hours during the year ended December 31, 2023. Making a positive impact in the greater communities in which we operate not only helps us make a difference in the lives of others, but also enhances our knowledge of and connection to the people and places we serve. Throughout our Properties across North America, we work to create a comfortable and welcoming environment for everyone – residents, guests and employees. People helping people is the norm, and our Making a Difference in Our Communities program is designed to foster and support these acts of goodwill, generosity and neighborly care. Our strategic sponsorships leverage our communities to give back. Funded through the generosity of our employees and friends of ELS, ConsiderOthers is a 501(c)(3) non-profit charity that provides financial and other assistance to our residents and employees. These acts of kindness enhance the bonds our customers have with each other and to our communities. We are proud to help foster these efforts in our communities.
Our Places.
Our Properties are located where our customers aspire to be – where they want to live, work and grow, where they want to retire or raise their family and where they want to vacation and spend their valued leisure time. We consider it a great responsibility to own and operate lifestyle-oriented properties among diverse landscapes and natural habitats and to ensure our properties remain desirable destinations for future generations. We are committed to maintaining biodiversity across our portfolio and operating assets that are connected to their local and natural environments. As a result, the consideration of environmental factors has always been part of our culture in the daily operation of our business.
Our Journey at ELS encompasses a three-part strategy to manage our impact, while also focusing on how we can provide environmental benefit beyond our own operations. Our focus is on reducing operational impact, enabling customer impact and enhancing positive impact. Underpinning Our Journey is a practice of continual innovation. We aim to reduce emissions from our operations through our investments in resource conservation, efficiency and renewable energy programs. We enable customer conservation and efficiency by providing recycling and composting offerings, promoting water and energy reduction through education and technology and pursuing community-level certifications and procuring ENERGY STAR® certified homes to save our residents money and energy. We are committed to preserving biodiversity within our portfolio and providing outdoor access to our guests and residents. Our natural capital both within our properties and beyond through our collaboration with American Forests has positive climate benefits.
At ELS, we are taking steps to reduce our carbon footprint and our impact on the environment, including energy management, water management and waste management. Our environmental metrics consist primarily of the impact of our customers on our properties as well as ELS operational impacts. We have designed our strategy to reduce ELS’ impact and promote the benefits of our properties, while enabling our customers to share in this journey with us. Lloyd's Register Quality Assurance ("LRQA") was retained to provide independent assurance of our 2022 environmental metrics to a limited level of assurance and materiality.
At ELS, we focus on operating sustainable communities for our guests and residents to enjoy and believe community-level certifications provide the best representation of our sustainable business practices on our properties. Our focus extends beyond efficient buildings to sustainable communities through the National Association of RV Parks & Campgrounds ("ARVC")’s Plan-It Green Friendly Park Program for our RV communities and state-level Clean Marina designations. Both programs provide external validation and recognition of our communities’ implementation of best practices to promote a more sustainable operation.
We are committed to maintaining biodiversity across our portfolio and creating assets that are connected to their natural and local environments. The Manufactured Housing Institute ("MHI") recognized Colony Cove in Ellenton, FL with its 2023 Leadership in Sustainability Award for planting more than 4,000 trees on a 1.5-acre peninsula in the community, creating a beneficial microforest. The annual MHI awards recognize communities that deliver extraordinary resident experiences due to their all-around excellence in operations, professionalism, amenities and community involvement.
Our Purpose.
It is of the utmost importance to us that we maintain the highest level of ethical standards in our processes, customs and policies. Whether we are working with customers or vendors, our actions are guided by a clear set of established principles. We hold ourselves accountable for ethical business practices. All facets of ELS, employees, management and our Board of Directors, are expected to act with honesty, integrity, fairness and respect. To support this culture, all team members
6
receive annual compliance training focused on compliant and ethical interactions with peers, residents, guests, vendors and others in our communities and offices.
Our Board of Directors recognizes that corporate governance is a developing and dynamic area warranting periodic review. Policies are in place and reviewed on an annual basis to support this purpose. All publicly available policies are reviewed and approved by senior management. To help employees report potential misconduct, we have a confidential multi-lingual Alertline for reporting Ethics and Compliance concerns and a confidential hotline for all employees to report workplace health and safety concerns.
We have a stakeholder engagement approach that enables us to understand our stakeholders’ perceptions and concerns, encourages regular dialogue and leverages industry frameworks to communicate our ESG impacts. Our 2022 Sustainability Report references the Global Reporting Initiative ("GRI"), Sustainability Accounting Standards Board ("SASB") and Task Force on Climate-related Financial Disclosures ("TCFD") frameworks. Further information on our sustainability strategy and ESG efforts can be found on our website at https://www.equitylifestyleproperties.com/sustainability. The information on our internet site is not part of, nor incorporated into, this annual report on Form 10-K.
Leases or Usage Rights
At our Properties, a typical lease for the rental of a Site between us and the owner or renter of a home is month-to-month or for a one-year term, renewable upon the consent of both parties or, in some instances, as provided by statute. These leases are cancellable, depending on applicable law, for non-payment of rent, violation of Property rules and regulations or other specified defaults. Long-term leases are in effect at approximately 8,258 Sites in 24 of our MH Properties. Some of these leases are subject to rental rate increases based on the Consumer Price Index (“CPI”), in some instances allowing for pass-throughs of certain items such as real estate taxes, utility expenses and capital expenditures. Generally, adjustments to our rental rates, if appropriate, are made on an annual basis.
In Florida, which represents 38.3% of total sites and 45.3% of total property operating revenues, in connection with offering a Site in a MH community for rent, the MH community owner must deliver to the prospective resident a prospectus required by Florida Statutes Chapter 723.011, which must first be approved by the state's regulatory agency. The prospectus contains certain required disclosures regarding the community, the rights and obligations of the MH community owner and residents and a copy of the lease agreement. A prospectus may describe what factors the MH community owner can use to justify a rental rate increase and may contain limitations on the rights of the MH community to increase rental rates. However, in the absence of such limitations, the MH community owner may increase rental rates to market, subject to certain advance notice requirements and a statutory requirement that the rental increase and rental rates be reasonable. See further discussion below related to rent control legislation.
At Properties zoned for RV use, we have entered into agreements with residents who have usage rights on an annual basis and we have long-term relationships with many of our seasonal and transient residents and guests, who typically enter into short-term rental agreements. Generally, these residents and guests cannot live full time on these Properties for reasons including their seasonal nature. Many of them also leave deposits to reserve a Site for the following year.
Properties operated under the Thousand Trails brand are primarily utilized to serve subscription members. Available Sites within these Properties may also be utilized by non-members. A membership subscription grants the member access to these Properties on a continuous basis of up to 14 days in exchange for an annual payment. In addition, members are eligible to upgrade their subscriptions, which increase usage rights during the membership term. Each membership upgrade requires a non-refundable upfront payment, for which we offer financing options to eligible members. Most of the subscription contracts provide for an annual dues increase, usually based on increases in the CPI.
Regulations and Insurance
General
. Our Properties are subject to a variety of laws, ordinances and regulations, including regulations relating to recreational facilities such as swimming pools, clubhouses and other common areas, regulations relating to providing utility services, such as electricity, and regulations relating to operating water and wastewater treatment facilities at certain Properties. We believe that each Property has all material permits and approvals necessary to operate. We renew these permits and approvals in the ordinary course of business.
Insurance
. Our
Properties are insured against risks that may cause property damage and business interruption, including events such as fire, flood, earthquake, or windstorm. The relevant insurance policies contain deductible requirements, coverage limits and particular exclusions. Our current property and casualty insurance policies with respect to our MH and RV Properties, which we plan to renew, expire on April 1, 2024. We have a $125.0 million per occurrence limit with respect to our
7
MH and RV all-risk property insurance program, which includes approximately $50.0 million of coverage per occurrence for named windstorms, which include, for example, hurricanes. The loss limit is subject to additional sub-limits as set forth in the policy form, including, among others, a $25.0 million aggregate loss limit for earthquake(s) in California. The deductibles for this policy primarily range from a $500,000 minimum to 5.0% per unit of insurance for most catastrophic events. For most catastrophic events, there is an additional one-time aggregate deductible of $10.0 million, which is capped at $5.0 million per occurrence. We have separate insurance policies with respect to our marina Properties. Those casualty policies will expire on November 1, 2024 and the property insurance program, which we plan to renew, expires on April 1, 2024. The marina property insurance program has a $25.0 million per occurrence limit, subject to self-insurance and a minimum deductible of $100,000 plus, for named windstorms, 5.0% per unit of insurance subject to a $500,000 minimum. A deductible indicates our maximum exposure, subject to policy limits and sub-limits, in the event of a loss.
Rent Control Legislation
. At certain Properties, state and local rent control laws dictate the structure of rent increases and in some cases, outline the ability to recover the costs of capital improvements. Enactment of such laws has been considered at various times in other jurisdictions. We presently expect to continue to maintain Properties and may purchase additional properties in markets that are either subject to rent control or in which rent related legislation exists or may be enacted. For example, Florida law requires that rental increases be reasonable and Delaware law requires rental increases greater than the changes in the CPI to be justified. Also, certain jurisdictions in California in which we own Properties limit rent increases to changes in the CPI or some percentage of the CPI. As part of our effort to realize the value of Properties subject to restrictive regulations, we have initiated lawsuits at times against various municipalities imposing such regulations in an attempt to balance the interests of our stockholders with the interests of our residents and guests.
Membership Properties.
Many states also have consumer protection laws regulating right-to-use or campground membership sales and the financing of such sales. Some states have laws requiring us to register with a state agency and obtain a permit to market (see Item 1A. Risk Factors). At certain Properties primarily used as membership campgrounds, state statutes limit our ability to close a Property unless a reasonable substitute Property is made available for members to use.
Industry
We believe that demand for manufactured housing, RV communities and marinas will continue to outpace supply in the near future. We expect much of this demand will continue to come from baby boomers, who may seek an active RV lifestyle or a permanent retirement or vacation establishment. In addition, we expect the exposure to Generation X, Millennials and Gen Z will contribute to the demand, as these groups focus on affordability, prefer housing quality over size and pursue unique experiences. We believe that our Properties and our business model provide an attractive destination for customers as they seek value in their housing and recreational options. Positive trends in categories such as customer demographics, the quality of manufactured housing construction and limited property supply, among others, fuel our belief that our Properties are well positioned for the future:
•
Barriers to Entry:
We believe that the supply of new properties in locations we target will be constrained by barriers to entry. While we have seen a modest increase in ground-up development, primarily of RV properties, the most significant barrier continues to be the difficulty of securing zoning permits from local authorities, particularly in geographic areas we target for investment. This has been the result of (i) the public perception of manufactured housing and (ii) the fact that MH and RV communities generate less tax revenue than conventional housing properties because the homes are treated as personal property (a benefit to the homeowner) rather than real property. Further, the length of time between investment in a property's development and the attainment of stabilized occupancy and the generation of profit is significant. The initial development of the infrastructure may take up to three years and once a property is ready for occupancy, it may be difficult to attract customers to an empty property.
•
Customer Base
: We believe that properties tend to achieve and maintain a stable rate of occupancy due to the following factors: (i) customers typically own their own homes, (ii) properties tend to foster a sense of community as a result of amenities, such as clubhouses and recreational and social activities, (iii) customers often sell their homes in-place (similar to site-built residential housing), resulting in no interruption of rental payments to us and (iv) moving a factory-built home from one property to another involves substantial cost and effort.
•
Lifestyle Choice
: There are currently over 1 million RV camp sites in privately owned RV parks and campgrounds in the United States per the National Association of RV Parks and Campgrounds (“ARVC”). According to the Recreational Vehicle Industry Association (the “RVIA”) in 2021, RV ownership has reached record levels. More than 11.2 million households now own an RV, a 26% increase since 2011 and a 62% increase since 2001. RV ownership is split almost equally between those over and under the age of 55, with significant growth among 18 to 34 year-olds, who now make up 22% of the market. The 73 million people born in the United States from 1946 to 1964, or “baby boomers,” make up one of the largest and fastest growing segments in this market. According to the RVIA, data
8
suggested that RV sales are expected to benefit from an increase in demand from those born in the United States from 1980 to 2003, or millennials and Gen Z, over the coming years. The consumers most likely to purchase RVs, according to a study conducted with Nielsen in 2016 by Go RVing, a coalition of RV industry trade groups, are families searching for adventures, individuals looking for locations with natural beauty and opportunities for outdoor sports and recreation and kid-free adult adventurers enjoying the freedom, convenience and low-cost options of RVs. Ownership is spread widely not only across age levels but also across genders, as well as household income and education. According to “The 2023 North American Camping Report”, the use of RVs as a primary camping accommodation by campers increased 29.3% from 2019 to 2022. In 2022, 15 million households went RVing at some point, including the more than 11.2 million RV owners.
According to the U.S. Census Bureau in 2019, every day 10,000 Americans turn 65 years old and all baby boomers will be at least age 65 by 2030. We believe that this population segment, seeking an active lifestyle, will provide opportunities for our future growth. As RV owners age and move beyond the more active RV lifestyle, they will often seek permanent retirement or vacation establishments. Manufactured homes and cottages have become an increasingly popular housing alternative. According to 2023 U.S. Census Bureau National Population Projections figures, the population of people ages 55 and older is expected to grow 15% within the next 15 years.
We believe that the housing choices in our Properties are especially attractive to such individuals throughout this lifestyle cycle. Our Properties offer an appealing amenity package, close proximity to local services, social activities, low maintenance and a secure environment. In fact, many of our Properties allow for this cycle to occur within a single Property.
The National Marine Manufacturers Association (“NMMA”) released its 2022 U.S. Recreational Boating Statistical Abstract in January 2024. Total recreational marine expenditures during 2022 reached a high of $59.3 billion, a 4.4% and 37.1% increase over 2021 and 2019, respectively. According to NMMA, an estimated 85 million Americans go boating each year.
According to the U.S. Bureau of Economic Analysis (“BEA”), demand for recreational marine purchases has continued in 2022, as boating and fishing represent the second largest outdoor recreation activities in the U.S., with $32.4 billion in current-dollar value added to the economy.
•
Construction Quality:
The Department of Housing and Urban Development's (“HUD”) standards for manufactured housing construction quality are the only federal standards governing housing quality of any type in the United States. Manufactured homes produced since 1976 have received a “red and silver” government seal certifying that they were built in compliance with the federal code. The code regulates manufactured home design and construction, strength and durability, fire resistance and energy efficiency and the installation and performance of heating, plumbing, air conditioning, thermal and electrical systems. In newer homes, top grade lumber and dry wall materials are common. Also, manufacturers are required to follow the same fire codes as builders of site-built structures. In 1994, following the devastation left by Hurricane Andrew, HUD introduced regulations that established different wind zones across the country. As a result, any homes set in place since 1994 must be able to withstand wind speeds of 70 miles per hour in Zone 1, 100 miles per hour in Zone 2 and 110 miles per hour in Zone 3. While most of the United States is designated wind Zone 1, areas most likely to be impacted by hurricanes are either Zone 2 or Zone 3.
Although construction of cottages, which are generally smaller homes, do not come under the same HUD regulations, they are built and certified in accordance with National Fire Protection Association (“NFPA”) 1192-15 and American National Standards Institute (“ANSI”) A119.5 consensus standards for park model recreational vehicles and have many of the same quality features. The RVIA operates a safety standards and inspection program that requires member manufacturers of all recreation vehicles, including park model RVs, to certify that each unit built complies with the requirements of the applicable standards.
•
Comparability to Site-Built Homes:
Since inception, the manufactured housing industry has experienced a trend toward multi-section homes. The average current manufactured homes are approximately 1,471 square feet. Many such homes have nine-foot or vaulted ceilings, fireplaces and as many as four bedrooms and closely resemble single-family ranch-style site-built homes at a fraction of the price. At our Properties, there is an active resale or rental market for these larger homes. According to the 2020 U.S. Census American Community Survey, manufactured homes represent 7.5% of single-family housing units.
•
Second Home and Vacation Home Demographics
: The National Association of Realtors (“NAR”) released their Vacation Home Counties Report in 2021, which indicated that vacation home sales surged throughout the pandemic. In 2020, vacation home sales rose by 16.4%, outpacing the 5.6% growth in total existing-home sales. The share of vacation home sales to total existing-home sales increased to 6.7% in the first four months of 2021, up from a 5% share in 2019.
9
In 2020, the number of recent home buyers who own more than one home was 17%, up from 16% in 2019, according to NAR. NAR reports that owning more than one property was most common for buyers aged 65 years and older at 22%. Additionally, NAR reports that of second homebuyers from October 2015 through September 2020, 39% purchased in resort areas, 16% purchased in small towns and 15% purchased in rural areas. Looking ahead, we expect continued strong demand from baby boomers and Generation X. We believe these individuals will continue to drive the market for second-home sales as vacation properties, investment opportunities, or retirement retreats. We believe it is likely that over the next decade we will continue to see high levels of second-home sales and that manufactured homes and cottages in our Properties will continue to provide a viable second-home alternative to site-built homes.
Notwithstanding our belief that the industry information highlighted above provides us with significant long-term growth opportunities, our short-term growth opportunities could be disrupted by the following:
•
Shipments:
According to statistics compiled by the U.S. Census Bureau, 2023 shipments of manufactured homes to dealers were closer to pre-pandemic levels with 89,200 shipments. 2022 shipments of manufactured homes to dealers appeared to be the highest in over a decade, marking the first time that shipments exceeded over 100,000 for two consecutive years. According to the RVIA, wholesale shipments of RVs for 2023 ended with 313,174 shipments. 2021 and 2022 represented two of the three highest years in terms of RV shipments.
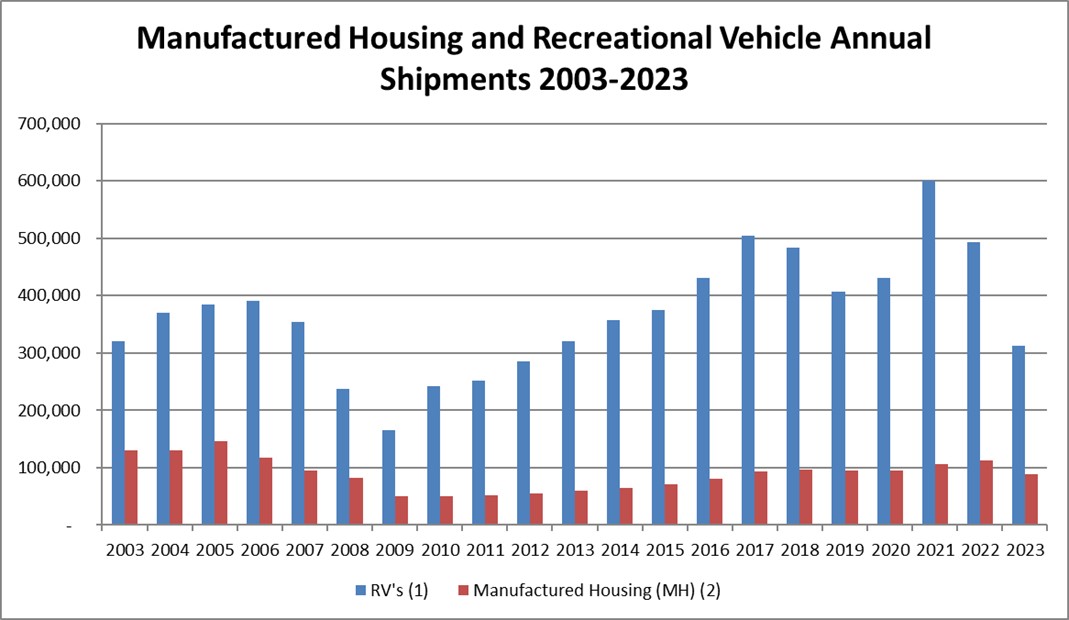
———————————————————————————————————————————
1.
Source: RVIA
2.
U.S. Census: Manufactured Homes Survey
•
Sales:
We believe consumers view RVs as a safe way to enjoy an active outdoor lifestyle, travel and see the country. While 2023 retail sales of RVs were 344,595, down approximately 14.8% from 2022, the enduring appeal of the RV lifestyle has translated into continued strength in RV sales, as 2021 marked the highest sales year for the industry at 516,565. RV sales could continue to benefit from the increased demand from the baby boomers and Millennials. Financing options are also available as RV dealers typically have relationships with third-party lenders, who provide financing for the purchase of a RV.
•
Availability of financing:
Although RV financing is readily available, the economic and legislative environment has generally made it difficult for buyers of both manufactured homes and RVs to obtain financing. Legislation enacted in 2008 and effective in 2010, known as the SAFE Act (Secure and Fair Enforcement for Mortgage Licensing Act) requires community owners interested in providing financing to buyers of manufactured homes to register as mortgage loan originators in states where they engage in such financing. In comparison to financing available to buyers of site-
10
built homes, the few third-party financing sources available to buyers of manufactured homes offer financing with higher down payments, higher rates and shorter maturities and loan approval is subject to more stringent underwriting criteria. See Item 1A. Risk Factors and our consolidated financial statements and related notes beginning on page F-1 of this Form 10-K for more detailed information.
Under the existing administration, the Federal Housing Finance Agency (the “FHFA”), overseer of Fannie Mae, Freddie Mac (the “GSEs”) and the Federal Home Loan Banks, has focused on equitable access to affordable and sustainable housing. In 2017, the FHFA published the Underserved Markets Plans for 2018-2020 (the “GSE Plans”) under the Duty-To-Serve (“DTS”) provisions mandated by the Federal Housing Enterprises Financial Safety and Soundness Act of 1992, as amended by the Housing and Economic Recovery Act of 2008. The GSEs subsequently added a 2021 Plan as a one-year extension and have since published their current 2022-2024 Plans.
The FHFA mandate requires the GSE Plans to address leadership in developing loan products and flexible underwriting guidelines in underserved markets to facilitate a secondary market for mortgages on manufactured homes titled as real property or personal property, blanket loans for certain categories of manufactured housing communities, preserving the affordability of housing for renters and homebuyers, and housing in rural markets.
While the FHFA and the current GSE 2022-24 DTS Plans may have a positive impact on the ability of our customers to obtain chattel financing, the actual impact on us, as well as the industry, cannot be determined at this time.
Available Information
We file reports electronically with the Securities and Exchange Commission (“SEC”). The SEC maintains a website that contains reports, proxy information and statements and other information regarding issuers that file electronically with the SEC at http://www.sec.gov. We also maintain a website with information about us as well as our press releases, investor presentations and filings with the SEC at http://www.equitylifestyleproperties.com, which can be accessed free of charge. We intend to post material on our website from time to time that contains material non-public information. The posting of such information is intended to comply with our disclosure requirements under Regulation Fair Disclosure. Accordingly, in addition to following our SEC filings and public conference calls, we encourage investors, the media and others interested in us to review the business and financial information we post on our website. The information contained on our website, or available by hyperlink from our website, is not incorporated into this Form 10-K or other documents we file with, or furnish to, the SEC. Requests for copies of our filings with the SEC and other investor inquiries should be directed to:
Investor Relations Department
Equity LifeStyle Properties, Inc.
Two North Riverside Plaza
Chicago, Illinois 60606
Phone: 1-800-247-5279
e-mail: investor_relations@equitylifestyle.com
11
Item 1A. Risk Factors
The following risk factors could cause our actual results to differ materially from those expressed or implied in forward-looking statements made in this Form 10-K and presented elsewhere by our management from time to time. These risk factors may have a material adverse effect on our business, financial condition, operating results and cash flows. Additional risks and uncertainties not presently known to us or that are currently not believed to be material may also affect our actual results.
Risks Relating to Our Operations and Real Estate Investments
The Economic Performance and Value of Our Properties Are Subject to Risks Associated with the Real Estate Industry
.
The economic performance and value of our Properties could be adversely affected by various factors, many of which are outside of our control. These factors include but are not limited to the following:
•
changes in the national, regional and/or local economies;
•
the attractiveness of our Properties to customers, competition from other MH and RV communities and lifestyle-oriented properties and marinas and alternative forms of housing (such as apartment buildings and site-built single-family homes);
•
the ability of MH, RV and boat manufacturers to adapt to changes in the economy and the availability of units from these manufacturers;
•
the ability of our potential customers to sell or lease their existing residences in order to purchase homes or cottages at our Properties, and heightened price sensitivity for seasonal and second homebuyers;
•
the ability of our potential customers to obtain financing on the purchase of manufactured homes and cottages, RVs and/or boats;
•
our ability to attract new customers and retain them for our membership subscriptions and upgrade sales business;
•
our ability to collect payments from customers and pay or control operating costs, including real estate taxes and insurance;
•
the ability of our assets to generate income sufficient to pay our expenses, service our debt and maintain our Properties;
•
our ability to diversify, reconfigure our portfolio promptly in response to changing economic or other conditions and sell our Properties timely due to the illiquid nature of real estate investments;
•
unfavorable weather conditions, especially on holiday weekends in the spring and summer months, which are peak business periods for our transient customers;
•
changes in climate and the occurrence of natural disasters or catastrophic events, including acts of war and terrorist attacks;
•
fluctuations in the exchange rate of the U.S. dollar to other currencies, primarily the Canadian dollar due to Canadian customers, who frequently visit our southern Properties;
•
changes in U.S. social, economic and political conditions, laws and governmental regulations, including policies governing rent control, fair and equitable access to housing, property zoning, taxation, minimum wages, chattel financing, health care, foreign trade, regulatory compliance, manufacturing, development and investment;
•
an inflationary environment in which the costs to operate and maintain our communities increase at a rate greater than our ability to increase rents;
•
a recession or economic downturn;
•
supply chain disruptions and tightening labor markets, which have affected and could affect our ability to obtain materials and skilled labor timely without incurring significant costs or delays for any development and expansion activities;
•
fiscal policies, instability or inaction at the U.S. federal government level, which may lead to federal government shutdowns or negative impacts on the U.S. economy;
•
adverse outcomes of litigation;
•
COVID-19, or other highly infectious or contagious diseases, which has had and could continue to have an adverse effect on our business; and
•
the realization of any other risk factors included in this Annual Report on Form 10-K.
Changes in or the occurrence of any of these factors could adversely affect our financial condition, results of operations, market price of our common stock and our ability to make expected distributions to our stockholders or result in claims, including, but not limited to, foreclosure by a lender in the event of our inability to service our debt.
12
Significant Inflation Could Negatively Impact Our Business.
Substantial inflationary pressures can adversely affect us by increasing the costs of materials, labor and other costs needed to operate our business. Higher construction costs could adversely impact our investments in real estate assets and our expected yields on development and value-add projects. In a highly inflationary environment, we may not be able to raise rental rates at or above the rate of inflation, which could reduce our profit margins. If we are unable to increase our rental prices to offset the effects of inflation, our business, results of operations, cash flows and financial condition could be adversely affected. In addition, interest rate increases enacted to combat inflation have caused market disruption and could continue to prevent us from acquiring or disposing of assets on favorable terms.
Inflation may also cause increased volatility in financial markets, which could affect our ability to access the capital markets or impact the cost or timing at which we are able to do so. To the extent our exposure to increases in interest rates on any of our debt is not eliminated through interest rate swaps and interest rate protection agreements, such increases will result in higher debt service costs, which will adversely affect our cash flows.
There is no guarantee that we will be able to mitigate the effects of inflation and related impacts, and the duration and extent of any prolonged periods of inflation, and any related adverse effects on our results of operations and financial condition, remain unknown at this time.
General Economic Conditions and Economic Downturns in Markets with a Large Concentration of Our Properties May Adversely Affect Our Financial Condition, Results of Operations, Cash Flows and Ability to Make Distributions
.
Our success is dependent upon economic conditions in the U.S. generally and in the geographic areas where a substantial number of our Properties are located. Adverse macroeconomic conditions, including slow growth or recession, high unemployment, inflation, tighter credit, higher interest rates, and currency fluctuations, can adversely impact demand for our Properties. In a recession or under other adverse economic conditions, non-earning assets and write-downs are likely to increase as debtors fail to meet their payment obligations. Although we maintain reserves for credit losses in amounts that we believe are sufficient to provide adequate protection against potential write-downs in our portfolio, these amounts could prove to be insufficient. We are also exposed to the risks of downturns in the local economy or other local real estate market conditions. As we have a large concentration of Properties in certain markets, most notably Florida, Northeast, California and Arizona, which comprised 45.3%, 11.3%, 10.6% and 10.4%, respectively, of our total property operating revenue for the year ended December 31, 2023, adverse market and economic conditions in these areas could significantly affect factors, such as occupancy and rental rates and could have a significant impact on our financial condition, results of operations, cash flows and ability to make distributions.
Certain of Our Properties, Primarily Our RV Communities and Marinas, are Subject to Seasonality and Cyclicality.
Some of our RV communities and marinas are used primarily by vacationers and campers. These Properties experience seasonal demand, which generally increases in the spring and summer months and decreases in the fall and winter months. As such, results for a certain quarter may not be indicative of the results of future quarters. In addition, since our RV communities and marinas are primarily used by vacationers and campers, economic cyclicality resulting in a downturn that affects discretionary spending and disposable income for leisure-time activities could adversely affect our cash flows.
Our Properties May Not Be Readily Adaptable to Other Uses.
Properties in our portfolio, including marinas and certain RV communities, are specific-use properties and may contain features or assets that have limited alternative uses. These Properties may also have distinct operational functions that involve specific procedures and training. If the operations of any of those Properties becomes unprofitable due to industry competition, operational execution or otherwise, then it may not be feasible to operate that Property for another use and the value of certain features or assets used at that Property, or the Property itself, may be impaired. Should any of these events occur, our financial condition, results of operations and cash flows could be adversely impacted.
Competition for Acquisitions May Result in Increased Prices for Properties and Associated Costs and Increased Costs of Financing.
Other real estate investors with significant capital may compete with us for attractive investment opportunities. Such competition could increase prices for Properties and result in increased fixed costs, including real estate taxes. To the extent we are unable to effectively compete or acquire properties on favorable terms, our ability to expand our business could be adversely affected.
13
New Acquisitions May Fail to Perform as Expected and the Intended Benefits May Not Be Realized, Which Could Have a Negative Impact on Our Operations and the Market Price of Our Common Stock.
We may continue to acquire Properties. However, newly acquired Properties may fail to perform as expected and could pose risks for our ongoing operations including the following:
•
integration may prove costly or time-consuming and may divert our attention from the management of daily operations;
•
we may be unable to access capital or we may encounter difficulties, such as increases in financing costs;
•
we may incur costs and expenses associated with undisclosed or potential liabilities;
•
we may experience a real estate tax re-assessment imposed by local governmental authorities that may result in higher real estate taxes than anticipated;
•
unforeseen difficulties may arise in integrating an acquisition into our portfolio;
•
expected synergies may not materialize; and
•
we may acquire properties in new markets where we face risks associated with lack of market knowledge, such as understanding of the local economy, the local government and/or local permit procedures.
As a result of the foregoing, we may not accurately estimate or identify all costs necessary to bring an acquired Property up to standards established for our intended market position. As such, we cannot provide assurance that any acquisition we make will be accretive to us in the near term or at all. Furthermore, if we fail to realize the intended benefits of an acquisition, the market price of our common stock could decline to the extent that the market price reflects those anticipated benefits.
Development and Expansion Properties May Fail to Perform as Expected and the Intended Benefits May Not Be Realized, Which Could Have a Negative Impact on Our Operations and the Market Price of Our Common Stock.
We may periodically consider development and expansion activities, which are subject to risks such as construction costs exceeding original estimates and construction and lease-up delays, resulting in increased costs and lower than expected revenues. The construction and building industry, similar to many other industries, is experiencing worldwide supply chain disruptions due to a multitude of factors that are beyond our control. As a result, we may be unable to complete our development or redevelopment projects timely and/or within our budget, which may affect our ability to lease to potential customers and adversely affect our business, financial condition and results of operations. To the extent we engage third-party contractors to complete development or expansion activities, there is no guarantee that they can complete these activities on time and in accordance with our plans and specifications. We may also be unable to obtain necessary entitlements and required governmental permits that could result in increased costs or the delay or abandonment of these activities. Additionally, there can be no assurance that these properties will operate better as a result of development or expansion activities due to various factors, including lower than anticipated occupancy and rental rates causing a property to be unprofitable or less profitable than originally estimated.
We Regularly Expend Capital to Maintain, Repair and Renovate Our Properties, Which Could Negatively Impact Our Financial Condition, Results of Operations and Cash Flows.
We have, and we may be required to, from time to time, make significant capital expenditures to maintain or enhance the competitiveness of our Properties, including infrastructure improvements. In addition, as most of our residents own their homes located in our Properties, the replacement, repairs and refurbishment of these homes may not be within our control. If our Properties are not as attractive to current and prospective customers as compared to the properties owned by our competitors, we could lose customers or suffer lower rental rates. There is no assurance that any capital expenditure would result in higher occupancy or higher rental rates. In addition, the price of commodities and skilled labor for our construction projects may increase unpredictably due to external factors, including supply chain disruptions. It is uncertain whether we would be able to source the essential commodities, supplies, materials, and skilled labor timely or at all without incurring significant costs or delays, particularly during times of economic uncertainty resulting from events outside of our control. To the extent that the expenditures exceed our available cash, we may need to secure new financing.
Our Ability to Renew Ground Leases Could Adversely Affect Our Financial Condition and Results of Operations.
We own the buildings and leasehold improvements at certain Properties that are subject to long-term ground leases. For various reasons, landowners may not want to renew the ground lease agreements with similar terms and conditions, if at all, which could adversely impact our ability to operate these Properties and generate revenues. As of December 31, 2023, we had 10 Properties in our portfolio subject to ground lease agreements for land.
14
Our Ability to Sell or Rent Manufactured Homes Could Be Impaired, Resulting in Reduced Cash Flows.
Selling and renting homes is a primary part of our business.
Our ability to sell or rent manufactured homes could be adversely affected by any of the following factors:
•
disruptions in the single-family housing market;
•
local conditions, such as an oversupply of lifestyle-oriented properties or a reduction in demand for lifestyle-oriented properties;
•
increased costs to acquire homes;
•
our ability to obtain an adequate supply of homes at reasonable costs from MH suppliers;
•
our ability to acquire or develop existing land suitable for home building;
•
the ability of customers to obtain affordable financing; and
•
demographics, such as the retirement of “baby boomers” and their demand for access to our lifestyle-oriented Properties.
Regulation of Chattel Financing May Affect Our Ability to Sell Homes.
Since 2010, the regulatory environment has made it difficult for purchasers of manufactured homes and RVs to obtain financing. The Secure and Fair Enforcement for Mortgage Licensing Act requires community owners interested in providing financing for customer purchases of manufactured homes to register as mortgage loan originators in states where they engage in such financing. In addition, the Dodd-Frank Wall Street Reform and Consumer Protection Act amended the Truth in Lending Act and other consumer protection laws by adding requirements for residential mortgage loans, including limitations on mortgage origination activities, restrictions on high-cost mortgages and new standards for appraisals. The law also requires lenders to make a reasonable investigation into a borrower's ability to repay a loan. These requirements make it more difficult for homeowners to obtain affordable financing to obtain loans to purchase manufactured homes or RVs. Homeowners' ability to obtain affordable financing could affect our ability to sell homes.
Our Investments in Joint Ventures Could Be Adversely Affected by Our Lack of Sole Decision-Making Authority Regarding Major Decisions, Our Reliance on Our Joint Venture Partners' Financial Condition, Any Disputes That May Arise Between Us and Our Joint Venture Partners and Our Exposure to Potential Losses From the Actions of Our Joint Venture Partners.
We currently and may continue to acquire properties through or make investments in joint ventures with other persons or entities. Joint venture investments involve risks not present with respect to our wholly owned Properties, including the following:
•
Our joint venture partners may experience financial distress, become bankrupt or fail to fund their share of required capital contributions, which could delay construction or development of a property, increase our financial commitment to the joint venture or adversely impact the ongoing operations of the joint venture;
•
Our joint venture partners may have business interests or goals with respect to a property that conflict with our business interests and goals, which could increase the likelihood of disputes regarding the ownership, management or disposition of the property; and
•
We may be unable to take actions that are opposed by our joint venture partners under arrangements that require us to share decision-making authority over major decisions affecting the ownership or operation of the joint venture and any property owned by the joint venture, such as the sale or financing of the property or the making of additional capital contributions for the benefit of the venture.
At times we have entered into agreements providing for joint and several liability with our partners. Frequently, we and our partners may each have the right to trigger a buy-sell arrangement, which could cause us to sell our interest, or acquire our partners' interest, at a time when we otherwise would not have initiated such a transaction. Any of these risks could materially and adversely affect our ability to generate and recognize attractive returns on our joint venture investments, which could have a material adverse effect on our results of operations, financial condition and distributions to our stockholders.
There is a Risk of Accidents, Injuries or Outbreaks Occurring at Our Properties Which May Negatively Impact Our Operations.
While we maintain and promote safety at our Properties, there are inherent risks associated with certain features, assets and activities at our communities. An accident, injury or outbreak at any of our communities, particularly an accident, injury or outbreak involving the safety of our residents, guests and employees, may be associated with claims against us involving higher assertions of damages and/or higher public visibility. The occurrence of an accident, injury or outbreak at any of our communities could also cause damage to our brand or reputation, lead to loss of consumer confidence in us, reduce occupancy at our communities and negatively impact our results of operations.
15
Our Success Depends on Our Talented Employees, Management, Directors and Key Personnel.
Our employees, management, directors and other key personnel have a significant role in our success. Our ability to attract, retain and motivate talented employees and directors could significantly impact our future performance. The loss of one or more members of our senior leadership team could materially and adversely affect us. Competition for these individuals is intense, and there is no assurance that we will retain our directors, key officers and employees or that we will be able to attract and retain other highly qualified individuals in the future.
Our Business Operations are Dependent on the Effective Operation of Technology.
We rely on software and computer systems to process and store information required for our business operations. Any disruption to these systems or to third-party vendors that maintain these systems could adversely affect our business operations. While we maintain and require our vendors to maintain appropriate back-up copies of our information, transitioning to a new system or vendor can be time-consuming and disruptive. Additionally, it is important for us to explore and evolve with new developments in technology to stay competitive. For example, our consumers rely on our technology platforms to make reservations; and therefore, these user interfaces must be understandable and easy to use. It may require investment of both time and expense to implement a new system or upgrade our existing technology. Interruptions to any of the above could lead to lost revenues, interruptions in our business operations and damage to our business reputation.
Public health crises, such as the COVID-19 pandemic, could materially and adversely impact or disrupt our business, including our financial condition, results of operations and cash flows.
Pandemics, epidemics, or other public health crises, including the COVID-19 pandemic, have had and could in the future have significant repercussions across regional, national and global economies and financial markets. These events have caused and could in the future cause governmental and societal responses that are highly uncertain, and we cannot predict with confidence the impact a public health crisis would have on macroeconomic conditions, consumer behavior, cross-border travel, labor availability, credit and financing conditions, supply chain management, and local operations in impacted markets, all of which can materially and adversely affect our financial condition, results of operations and cash flows.
Risks Relating to Governmental Regulation and Potential Litigation
Changes to Federal and State Laws and Regulations Could Adversely Affect Our Operations and the Market Price of Our Common Stock.
Our Properties and business operations are subject to certain federal, state and local and foreign laws, regulations and policies. Compliance with laws and regulations that govern our operations may require significant expenditures or modifications of business plans that could have a detrimental effect on our Properties and operations. We do not know whether existing requirements will change or whether future requirements will develop, which may require us to spend additional amounts to comply with the regulations, or may restrict our ability to conduct our business operations in ways that are profitable. Failure to comply with these requirements could subject us to significant liability, including governmental fines or private litigation. There can be no assurance that the application of laws, regulations or policies will not occur in a manner that could have a detrimental effect on our financial condition, results of operations and cash flows.
•
Rent Control Legislation
Certain of our Properties are subject to state and local rent control regulations that dictate rent increases and our ability to recover increases in operating expenses and the costs of capital improvements. In addition, in certain jurisdictions, such regulations allow residents to sell their homes for a price that includes a premium above the intrinsic value of the homes. The premium represents the value of the future discounted rent-controlled rents, which is fully capitalized into the prices of the homes sold. In our view, such regulations result in a transfer to the residents of the value of our land, which would otherwise be reflected in market rents. As part of our effort to realize the value of Properties subject to restrictive regulation, we have initiated lawsuits at various times against various municipalities imposing such regulations in an attempt to balance the interests of our stockholders with the interests of our customers. In addition, we operate certain of our Properties and may acquire additional properties, in high cost markets where the demand for affordable housing may result in the adoption of new rent control legislation that may impact rent increases.
We also own Properties in certain areas of the country where rental rates at our Properties have not increased as fast as real estate values either because of locally imposed rent control or long term leases. In such areas, certain local government entities have at times investigated the possibility of seeking to take our Properties by eminent domain at values below the value of the underlying land. While no such eminent domain proceeding has been commenced and we anticipate exercising all of our
16
rights in connection with any such proceeding, successful condemnation proceedings by municipalities could adversely affect our financial condition.
Resident groups have previously filed lawsuits against us seeking to limit rent increases and/or seeking large damage awards for our alleged failure to properly maintain certain Properties or other resident related matters. An adverse finding against us in any such proceeding could materially and adversely affect our results of operations, financial condition and distributions to our stockholders.
•
Occupational, Safety and Health Act
Our Properties are subject to regulation under the federal Occupational, Safety and Health Act (“OSHA”), which requires employers to provide employees with an environment free from hazards, such as exposure to toxic chemicals, excessive noise levels, mechanical dangers, heat or cold stress and unsanitary conditions. Although we believe that our Properties are in compliance in all material respects with applicable requirements, complying with OSHA and similar laws can be costly and any failure to comply with these regulations could result in penalties or potential litigation.
•
Americans with Disabilities Act
Under the Americans with Disabilities Act (“ADA”), all public accommodations and commercial facilities must meet certain federal requirements related to access and use by disabled persons. Although we believe that our Properties are in compliance in all material respects with applicable requirements, noncompliance with the ADA or related laws or regulations could result in the U.S. government imposing fines or private litigants being awarded damages against us. Such costs may adversely affect our ability to make distributions or payments to our investors. Compliance with the ADA requirements could involve removal of structural barriers to access or use by disabled persons. Other federal, state and local laws may require modifications to or restrict further renovations of our Properties with respect to such access or use.
Additionally, Title III of the ADA has been interpreted by the U.S. courts to include websites as “places of public accommodations”. For our websites to be ADA compliant, they must be accessible. While no laws have been passed related to website accessibility, the recognized de facto standard in the U.S. is the Web Content Accessibility Guideline. We may incur costs to make our websites ADA compliant or face litigation if they are not compliant.
Laws and Regulations Relating to Campground Membership Sales and Properties Could Adversely Affect the Value of Certain Properties and Our Cash Flows.
Many of the states in which we operate have laws regulating campground membership sales and properties. These laws generally require comprehensive disclosure to prospective purchasers and usually give purchasers the right to rescind their purchase between three to five days after the date of sale. Some states have laws requiring us to register with a state agency and obtain a permit to market. We are subject to changes, from time to time, in the application or interpretation of such laws that can affect our business or the rights of our members.
In some states, including California, Oregon and Washington, laws place limitations on the ability of the owner of a campground property to close the property unless the customers at the property receive access to a comparable property. The impact of the rights of customers under these laws is uncertain and could adversely affect the availability or timing of sale opportunities or our ability to realize recoveries from Property sales.
Certain consumer rights and defenses that vary from jurisdiction to jurisdiction may affect our portfolio of contracts receivable. Examples of such laws include state and federal consumer credit and truth-in-lending laws requiring the disclosure of finance charges and usury and retail installment sales laws regulating permissible finance charges.
Litigation Risk Could Materially and Adversely Affect Our Business.
We are involved and may continue to be involved in legal proceedings, claims, class actions, inquiries and investigations relating to our operations, corporate transactions, dispositions and investments and otherwise in the ordinary course of business. These legal proceedings may include, but are not limited to, proceedings related to consumer, shareholder, securities, anticompetitive, antitrust, employment, environmental, development, tort, eviction and commercial legal issues. Litigation can be lengthy and expensive, and it can divert management's and our Directors' attention and resources away from our business. We cannot provide any assurance regarding the outcome of any claims, and an unfavorable outcome in litigation could result in liability material to our financial condition or results of operations. We cannot provide any assurance regarding the outcome of any claims that may arise in the future. We also have agreed to indemnify our present and former Directors and Officers in connection with litigation in which they are named or threatened to be named as a party in their capacity as Directors and
17
Officers. Any judgments, fines or settlements that exceed our insurance coverage and any indemnification costs that we are required to pay could materially and adversely affect us.
Environmental Risks
Natural Disasters Have and Could in the Future Adversely Affect the Value of Our Properties, Our Financial Condition, Results of Operations and Cash Flows.
We are subject to risks associated with natural disasters, including but not limited to hurricanes, storms, fires and earthquakes.
As of December 31, 2023, we owned or had an ownership interest in 451 Properties, including 136 Properties and 19 marinas located in Florida and 49 Properties located in California.
The occurrence of a natural disaster or other catastrophic event in any of these areas may cause a sudden decrease in the value of our Properties and result in an adverse effect to our financial condition, results of operations and cash flows.
Climate Change May Adversely Affect Our Business.
Climate change could increase the frequency and severity of natural disasters and change weather patterns. Our markets could experience increases in storm intensity, frequency and magnitude of hurricanes, wildfires, rising sea levels, drought and changes to precipitation and temperatures. The physical effects of climate change could have a material adverse effect on our properties, operations and business. If there are prolonged disruptions at our properties due to extreme weather or natural disasters, our results of operations and financial condition could be materially adversely affected. Our properties are dependent on state and local utility infrastructure for delivery of energy, water supply and/or other utilities. We do not control investment in that infrastructure and the condition of the infrastructure and supply of the utilities may not be sufficient to handle impact resulting from climate change. Over time, these conditions could result in increased incidents of physical damage to our Properties, declining demand for our Properties and increased difficulties operating them. Climate change, natural disasters and changing weather patterns may also have indirect effects on our business by increasing the cost of (or making unavailable) insurance on terms we find acceptable, increasing the cost of (or making unavailable) energy, water supply and other utilities at our Properties and requiring us to expend funds as we seek to repair and protect our Properties against such risks.
In addition, changes in federal, state and local legislation and regulation may require increased capital expenditures at our Properties. Additionally, these capital expenditures may or may not result in lower on-going expenses or make an impact on the desirability of our Properties and our ability to attract high quality residents and guests. Any such losses, increases in costs or business interruptions could adversely affect our financial condition and operating results.
Environmental and Utility-Related Problems are Possible and Can Be Costly.
Federal, state and local laws and regulations relating to the protection of the environment may require a current or previous owner or operator of real property to pay fines and penalties and investigate and clean up hazardous or toxic substances, including lead or petroleum product releases at such property. The owner or operator may have to pay a governmental entity or third parties for property damage and for investigation and clean-up costs incurred by such parties in connection with the contamination. Properties containing lead may require removal of the material. This can be costly and, if the lead infiltrates the groundwater or other water supply, further remediation may be necessary. Such laws typically impose clean-up responsibility and liability without regard to whether the owner or operator knew of or caused the presence of the contaminants. Even if more than one person may have been responsible for the contamination, each person covered by the applicable laws may be held responsible for all of the clean-up costs incurred. In addition, third parties could sue the owner or operator of a site for damages and costs resulting from environmental contamination emanating from that site.
Environmental laws also govern the presence, maintenance and removal of environmental contamination, including asbestos, wastewater discharge and oil spills. Such laws require that owners or operators of properties containing hazardous or toxic substances to properly manage them, including, but not limited to, requirements to notify and train relevant persons to take special precautions, and to remove or otherwise abate the contaminant. Such laws may impose fines and penalties on real property owners or operators who fail to comply with these requirements and may allow third parties to seek recovery from owners or operators for personal injury associated with exposure to the contaminant. Moreover, certain of our marinas are located on waterways that are subject to federal laws, including the Clean Water Act and the Oil Pollution Act, as well as analogous state laws regulating navigable waters, oil pollution, adverse impacts to fish and wildlife, and other matters. For example, under the Oil Pollution Act, owners and operators of vessels and onshore facilities may be subject to liability for removal costs and damages arising from an oil spill in waters of the United States.
Utility-related laws and regulations also govern the provision of utility services. Such laws regulate, for example, how and to what extent owners or operators of property can charge renters for provision of utilities. Such laws also regulate the
18
operations and performance of utility systems and may impose fines and penalties on real property owners or operators who fail to comply with these requirements. The regulations may also require capital investment to maintain compliance.
Stakeholder Evaluations of ESG Matters May Impact Our Ability to Attract Investors and Could Have a Negative Impact on Our Reputation.
Evaluations of ESG Matters are important to investors and other stakeholders, and there is an increased focus on such matters by various regulatory authorities, including the SEC and the state of California. ESG assessments by certain organizations that provide corporate governance and other corporate risk advisory services to investors provide scores and ratings to evaluate companies based upon publicly available information. In addition, investors, particularly institutional investors, may use ESG or sustainability scores to benchmark companies against their peers. The methodologies by which ESG Matters are assessed may vary among evaluators and regulatory authorities. The activities and expense required to comply with new and varying criteria, laws, regulations or standards may be significant. Some investors focus on disclosures of ESG-related business practices and scores when choosing to allocate their capital and may consider a company's score in making an investment decision. Although we have undertaken and continue to pursue ESG initiatives and disclosures, there can be no assurance that we will score highly on ESG Matters across evaluators in the future. In addition, the criteria by which companies are rated may change, which could cause the Company to score differently or worse than it has in the past and may result in investors deciding to refrain from investing in us and/or result in a negative perception of the Company, all of which could have an adverse impact on the price of our securities.
Risks Relating to Debt and the Financial Markets
Our Substantial Indebtedness Could Adversely Affect Our Financial Condition and Results of Operations
.
Our business is subject to risks normally associated with debt financing. The total principal amount of our outstanding indebtedness was approximately $3,548.1 million as of December 31, 2023, of which $31.0 million, or 0.87%, is related to our line of credit and $90.5 million of secured debt, or 2.55%, matures in 2025 (with no secured or unsecured loans maturing in 2024). Our substantial indebtedness and the cash flows associated with serving our indebtedness could have important consequences, including the risks that:
•
our cash flows could be insufficient to pay distributions at expected levels and meet required payments of principal and interest;
•
we might be required to use a substantial portion of our cash flows from operations to pay our indebtedness, thereby reducing the availability of our cash flows to fund the implementation of our business strategy, acquisitions, capital expenditures and other general corporate purposes;
•
our debt service obligations could limit our flexibility in planning for, or reacting to, changes in our business and the industry in which we operate;
•
terms of refinancing may not be as favorable as the terms of existing indebtedness, resulting in higher interest rates that could adversely affect net income, cash flows and our ability to service debt and make distributions to stockholders;
•
if principal payments due at maturity cannot be refinanced, extended or paid with proceeds of other capital transactions, such as new equity capital, our cash flows may not be sufficient in all years to repay all maturing debt; and
•
to the extent that any Property is cross-collateralized with any other Properties, any default under the mortgage note relating to one Property could result in a default under the financing arrangements relating to other Properties that also provide security for that mortgage note or are cross-collateralized with such mortgage note.
Our Ability to Obtain Mortgage Financing or Refinance Maturing Mortgages May Adversely Affect Our Financial Condition
.
Lenders' demands on borrowers as to the quality of the collateral and related cash flows may make it challenging to secure financing on attractive terms or at all. Market factors including increases in the U.S. federal reserve funds rate may result in increases in market interest rates, which could increase the costs of refinancing existing indebtedness or obtaining new debt.
Additionally, disruptions in capital and credit markets, including potential reforms to Fannie Mae and Freddie Mac, could impact both the capacity and liquidity of lenders, resulting in financing terms that are less attractive to us and/or the unavailability of certain types of debt financing. This could have an adverse effect on our ability to refinance maturing debt, react to changing economic and business conditions or access capital necessary to fund business operations, including the acquisition or expansion of properties.
19
Financial Covenants Could Adversely Affect Our Financial Condition
.
If a Property is mortgaged to secure payment of indebtedness and we are unable to meet mortgage payments, the mortgagee could foreclose on the Property, resulting in loss of income and asset value. The mortgages on our Properties contain customary negative covenants, which among other things limit our ability, without the prior consent of the lender, to further mortgage the Property and to discontinue insurance coverage. In addition, our unsecured credit facilities contain certain customary restrictions, requirements and other limitations on our ability to incur indebtedness, including total debt-to-assets ratios, debt service coverage ratios and minimum ratios of unencumbered assets to unsecured debt. Foreclosure on mortgaged Properties or an inability to refinance existing indebtedness would likely have a negative impact on our financial condition and results of operations.
Our Degree of Leverage Could Limit Our Ability to Obtain Additional Financing
.
Our debt-to-market-capitalization ratio (total debt as a percentage of total debt plus the market value of the outstanding common stock and OP Units held by parties other than us) was approximately 20.5% as of December 31, 2023. The degree of leverage could have important consequences to stockholders, including an adverse effect on our ability to obtain additional financing in the future for working capital, capital expenditures, acquisitions, development or other general corporate purposes and could make us more vulnerable to a downturn in business or the economy generally.
We May Be Able to Incur Substantially More Debt, Which Would Increase the Risks Associated With Our Substantial Leverage.
Despite our current indebtedness levels, we may still be able to incur substantially more debt in the future. If new debt is added to our current debt levels, an even greater portion of our cash flow will be needed to satisfy our debt service obligations. As a result, the related risks that we now face could intensify and increase the risk of a default on our indebtedness.
Risks Related to Our Company Ownership
Provisions of Our Charter and Bylaws Could Inhibit Changes of Control.
Certain provisions of our charter and bylaws may delay or prevent a change of control or other transactions that could provide our stockholders with a premium over the then-prevailing market price of their common stock or future series of preferred stock, if any, which might otherwise be in the best interest of our stockholders. These include the Ownership Limit described below and advance notice requirements for shareholder proposals and nomination of directors. Also, any future series of preferred stock may have certain voting provisions that could delay or prevent a change of control or other transaction that might involve a premium price or otherwise be beneficial to our stockholders.
Maryland Law Imposes Certain Limitations on Changes of Control.
Certain provisions of the Maryland General Corporation Law (“MGCL”) prohibit “business combinations” (including certain issuances of equity securities) with any person who beneficially owns 10% or more of the voting power of our outstanding common stock, or with an affiliate of ours, who, at any time within the two-year period prior to the date in question, was the owner of 10% or more of the voting power of our outstanding voting stock (an “Interested Stockholder”), or with an affiliate of an Interested Stockholder. These prohibitions last for five years after the most recent date on which the Interested Stockholder became an Interested Stockholder. After the five-year period, a business combination with an Interested Stockholder must be approved by two super-majority stockholder votes unless, among other conditions, our common stockholders receive a minimum price for their shares and the consideration is received in cash or in the same form as previously paid by the Interested Stockholder for shares of our common stock. The Board of Directors has exempted from these provisions under Maryland law any business combination with certain holders of OP Units who received them at the time of our initial public offering and our officers who acquired common stock at the time we were formed and each and every affiliate of theirs.
Additionally, Subtitle 8 of Title 3 of the MGCL permits our Board of Directors, without stockholder approval and regardless of what is currently provided in our charter or bylaws, to elect to be subject to certain provisions relating to corporate governance that may have the effect of delaying, deferring or preventing a transaction or a change of control of our company that might involve a premium to the market price of our common stock or otherwise be in our stockholders’ best interests. These provisions include a classified board; two-thirds vote to remove a director; that the number of directors may only be fixed by the Board of Directors; that vacancies on the board as a result of an increase in the size of the board or due to death, resignation or removal can only be filled by the board and the director appointed to fill the vacancy serves for the remainder of the full term of the class of director in which the vacancy occurred and a majority requirement for the calling by stockholders of special meetings. Through provisions in our charter and bylaws unrelated to Subtitle 8, we already (a) require a two-thirds vote
20
for the removal of any director from the board and (b) vest in the board the exclusive power to fix the number of directorships provided that, if there is stock outstanding and so long as there are three or more stockholders, the number is not less than three. In the future, our Board of Directors may elect, without stockholder approval, to make us subject to the provisions of Subtitle 8 to which we are not currently subject.
Our Board of Directors has power to adopt, alter or repeal any provision of our bylaws or make new bylaws, provided, however, that our stockholders may, with certain exceptions, alter or repeal any provision of our bylaws and adopt new bylaws if any such alteration, repeal or adoption is approved by the affirmative vote of a majority of all votes entitled to be cast on the matter.
Changes in Our Investment and Financing Policies May Be Made Without Stockholder Approval.
Our investment and financing policies and our policies with respect to certain other activities, including our growth, debt, capitalization, distributions, REIT status and operating policies, are determined by our Board of Directors. Although our Board of Directors has no present intention to do so, these policies may be amended or revised from time to time at the discretion of our Board of Directors without notice to or a vote of our stockholders. Accordingly, stockholders may not have control over changes in our policies and changes in our policies may not fully serve the interests of all stockholders.
Our Business Ethics and Conduct Policy May Not Adequately Address All Actual or Perceived Conflicts of Interest That May Arise With Respect to Our Activities.
In order to avoid any actual or perceived conflicts of interest involving any of our Board of Directors, our officers or our employees, we have a business ethics and conduct policy to specifically manage and address some of the potential conflicts relating to our activities. Although under this policy, specified transactions, agreements and relationships involving members of our Board of Directors, officers or employees must be approved pursuant to the terms of the policy, there is no assurance that this policy will be adequate to address all of the conflicts that may arise or will address such conflicts in a manner that is favorable to us. It is possible that actual, potential or perceived conflicts could give rise to investor dissatisfaction or litigation or regulatory enforcement actions. If we fail, or appear to fail, to identify, disclose and appropriately address potential conflicts of interest, there could be an adverse effect on our business or reputation regardless of whether any such claims have merit.
Risks Relating to Our Common Stock
We Depend on Our Subsidiaries' Dividends and Distributions.
Substantially all of our assets are owned indirectly by the Operating Partnership. As a result, we have no source of cash flows other than distributions from our Operating Partnership. For us to pay dividends to holders of our common stock, the Operating Partnership must first distribute cash to us. Before it can distribute the cash, our Operating Partnership must first satisfy its obligations to its creditors.
Market Interest Rates May Have an Effect on the Value of Our Common Stock.
One of the factors that investors consider important in deciding whether to buy or sell shares of a REIT is the distribution rates with respect to such shares (as a percentage of the price of such shares) relative to market interest rates. If market interest rates increase, prospective purchasers of REIT shares may expect a higher distribution rate. Higher interest rates would not, however, result in more of our funds to distribute and, in fact, would likely increase our borrowing costs and potentially decrease funds available for distribution. Thus, higher market interest rates could cause the market price of our publicly traded securities to go down.
Issuances or Sales of Our Common Stock May Be Dilutive.
The issuance or sale of substantial amounts of our common stock could have a dilutive effect on our actual and expected earnings per share, FFO per share and Normalized Funds from Operations (“Normalized FFO”) per share. We have in the past and may in the future sell shares of our common stock under an ATM equity offering program from time-to-time. The actual amount of dilution cannot be determined at this time and would be dependent upon numerous factors which are not currently known to us.
Our Share Price Could Be Volatile and Could Decline, Resulting in A Substantial or Complete Loss on Our Stockholders’ Investment.
We list our common stock on the New York Stock Exchange (the “NYSE”) and our common stock could experience significant price and volume fluctuations. Investors in our common stock may experience a decrease in the value of their shares,
21
including decreases unrelated to our operating performance or prospects. The price of our common stock could be subject to wide fluctuations in response to a number of factors, including:
•
issuances of other equity securities in the future, including new series or classes of preferred stock;
•
our operating performance and the performance of other similar companies;
•
our ability to maintain compliance with covenants contained in our debt facilities;
•
actual or anticipated variations in our operating results, funds from operations, cash flows or liquidity;
•
changes in expectations of future financial performance or changes in our earnings estimates or those of analysts;
•
changes in our distribution policy;
•
publication of research reports about us or the real estate industry generally;
•
increases in market interest rates that lead purchasers of our common stock to demand a higher dividend yield;
•
changes in market valuations of similar companies;
•
adverse market reaction to the amount of our debt outstanding at any time, the amount of our debt maturing in the near-term and medium-term and our ability to refinance our debt, or our plans to incur additional debt in the future;
•
additions or departures of key employees, management, directors and other key personnel;
•
speculation in the press or investment community;
•
equity issuances by us, or share resales by our stockholders or the perception that such issuances or resales may occur;
•
addition to, or removal from, market indexes used by investors to make investment decisions;
•
actions by institutional stockholders; and
•
general market and economic conditions.
Many of the factors listed above are beyond our control. Those factors may cause the market price of our common stock to decline significantly, regardless of our financial condition, results of operations and prospects. It is impossible to provide any assurance that the market price of our common stock will not fall in the future, and it may be difficult for holders to resell shares of our common stock at prices they find attractive, or at all. In the past, securities class action litigation has often been instituted against companies following periods of volatility in their stock price. This type of litigation could result in substantial costs and divert our management’s attention and resources.
Risks Relating to REITs and Income Taxes
We are Dependent on External Sources of Capital.
To qualify as a REIT, we must distribute to our stockholders each year at least 90% of our REIT taxable income (determined without regard to the deduction for dividends paid and excluding any net capital gain). In addition, we intend to distribute all or substantially all of our net income so that we will generally not be subject to U.S. federal income tax on our earnings. Because of these distribution requirements, it is not likely that we will be able to fund all future capital needs, including acquisitions, from income from operations. We therefore will have to rely on third-party sources of debt and equity capital financing, which may or may not be available on favorable terms or at all. Our access to third-party sources of capital depends on a number of things, including conditions in the capital markets generally and the market's perception of our growth potential and our current and potential future earnings. It may be difficult for us to meet one or more of the requirements for qualification as a REIT, including but not limited to our distribution requirement. Moreover, additional equity offerings may result in substantial dilution of stockholders' interests and additional debt financing may substantially increase our leverage.
We Have a Stock Ownership Limit for REIT Tax Purposes.
To remain qualified as a REIT for U.S. federal income tax purposes, not more than 50% in value of our outstanding shares of capital stock may be owned, directly or indirectly, by five or fewer individuals (as defined in the federal income tax laws applicable to REITs) at any time during the last half of any taxable year. To facilitate maintenance of our REIT qualification, our charter, subject to certain exceptions, prohibits Beneficial Ownership (as defined in our charter) by any single stockholder of more than 5% (in value or number of shares, whichever is more restrictive) of our outstanding capital stock. We refer to this as the “Ownership Limit”. Within certain limits, our charter permits the Board of Directors to increase the Ownership Limit with respect to any class or series of stock. The Board of Directors, upon receipt of a ruling from the IRS, opinion of counsel, or other evidence satisfactory to the Board of Directors and upon 15 days prior written notice of a proposed transfer which, if consummated, would result in the transferee owning shares in excess of the Ownership Limit, and upon such other conditions as the Board of Directors may direct, may exempt a stockholder from the Ownership Limit. Absent any such exemption, capital stock acquired or held in violation of the Ownership Limit will be transferred by operation of law to us as trustee for the benefit of the person to whom such capital stock is ultimately transferred and the stockholder's rights to distributions and to vote would terminate. Such stockholder would be entitled to receive, from the proceeds of any subsequent sale of the capital stock we transferred as trustee, the lesser of (i) the price paid for the capital stock or, if the owner did not pay for the capital stock (for example, in the case of a gift, devise or other such transaction), the market price of the capital stock on
22
the date of the event causing the capital stock to be transferred to us as trustee or (ii) the amount realized from such sale. A transfer of capital stock may be void if it causes a person to violate the Ownership Limit. The Ownership Limit could delay or prevent a change in control of us and therefore, could adversely affect our stockholders' ability to realize a premium over the then-prevailing market price for their common stock or adversely affect the best interest of our stockholders.
Our Qualification as a REIT Is Dependent on Compliance with U.S. Federal Income Tax Requirements
.
We believe we have been organized and operated in a manner so as to qualify for taxation as a REIT and we intend to continue to operate so as to qualify as a REIT for U.S. federal income tax purposes. Our current and continuing qualification as a REIT depends on our ability to meet the various requirements imposed by the Code, which relate to organizational structure, distribution levels, diversity of stock ownership and certain restrictions with regard to owned assets and categories of income. If we qualify for taxation as a REIT, we are generally not subject to U.S. federal income tax on our taxable income that is distributed to our stockholders. However, qualification as a REIT for U.S. federal income tax purposes is governed by highly technical and complex provisions of the Code for which there are only limited judicial or administrative interpretations. In connection with certain transactions, we have received, and relied upon, advice of counsel as to the impact of such transactions on our qualification as a REIT. Our qualification as a REIT requires analysis of various facts and circumstances that may not be entirely within our control and we cannot provide any assurance that the Internal Revenue Service (the “IRS”) will agree with our analysis or the analysis of our tax counsel. In particular, the proper U.S. federal income tax treatment of right-to-use membership contracts and rental income from certain short-term stays at RV communities is uncertain and there is no assurance that the IRS will agree with our treatment of such contracts or rental income. If the IRS were to disagree with our analysis or our tax counsel's analysis of various facts and circumstances, our ability to qualify as a REIT could be adversely affected.
In addition, legislation, new regulations, administrative interpretations or court decisions might significantly change the tax laws with respect to the requirements for qualification as a REIT or the U.S. federal income tax consequences of qualification as a REIT.
If, with respect to any taxable year, we failed to maintain our qualification as a REIT (and if specified relief provisions under the Code were not applicable to such disqualification), we would be disqualified from treatment as a REIT for the four taxable years following the year during which qualification was lost. If we lost our REIT status, we could not deduct distributions to stockholders in computing our net taxable income at regular corporate rates and we would be subject to U.S. federal income tax on our net taxable incomes. If we had to pay U.S. federal income tax, the amount of money available to distribute to stockholders and pay indebtedness would be reduced for the year or years involved and we would no longer be required to distribute money to stockholders. Although we currently intend to operate in a manner designed to allow us to qualify as a REIT, future economic, market, legal, tax or other considerations may cause us to revoke the REIT election.
Furthermore, we own a direct interest in a subsidiary REIT and in the past we have owned interests in other subsidiary REITs, each of which elected to be taxed as REITs under Sections 856 through 860 of the Code. Provided that each subsidiary REIT that we own qualifies as a REIT, our interest in such subsidiary REIT will be treated as a qualifying real estate asset for purposes of the REIT asset tests and any dividend income or gains derived by us from such subsidiary REIT will generally be treated as income that qualifies for purposes of the REIT gross income tests. To qualify as a REIT, the subsidiary REIT must independently satisfy all of the REIT qualification requirements. If such subsidiary REIT were to fail to qualify as a REIT and certain relief provisions did not apply, it would be treated as a regular taxable corporation and its income would be subject to U.S. federal income tax. In addition, a failure of the subsidiary REIT to qualify as a REIT could have an adverse effect on our ability to comply with the REIT income and asset tests and thus our ability to qualify as a REIT.
We May Pay Some Taxes, Reducing Cash Available for Stockholders.
Even if we qualify as a REIT for U.S. federal income tax purposes, we may be subject to some U.S. federal, foreign, state and local taxes on our income and property. Since January 1, 2001, certain of our corporate subsidiaries have elected to be treated as “taxable REIT subsidiaries” for U.S. federal income tax purposes and are taxable as regular corporations and subject to certain limitations on intercompany transactions. If tax authorities determine that amounts paid by our taxable REIT subsidiaries to us are greater than what would be paid under similar arrangements among unrelated parties, we could be subject to a 100% penalty tax on the excess payments and ongoing intercompany arrangements could have to change, resulting in higher ongoing tax payments. To the extent we are required to pay U.S. federal, foreign, state or local taxes or U.S. federal penalty taxes due to existing laws or changes to them, we will have less cash available for distribution to our stockholders.
Dividends Payable by REITs Generally Do Not Qualify For the Reduced Tax Rates Available For Some Dividends, Which May Negatively Affect the Value of Our Shares.
23
Income from “qualified dividends” payable to U.S. stockholders that are individuals, trusts and estates are generally subject to tax at preferential rates, currently at a maximum federal rate of 20%. Dividends payable by REITs, however, generally are not eligible for the preferential tax rates applicable to qualified dividend income. Under the Tax Cuts and Jobs Act, or the TCJA, however, U.S. stockholders that are individuals, trusts and estates generally may deduct up to 20% of the ordinary dividends (e.g., dividends not designated as capital gain dividends or qualified dividend income) received from a REIT for taxable years beginning after December 31, 2017 and before January 1, 2026. Although this deduction reduces the effective tax rate applicable to certain dividends paid by REITs (generally to 29.6% assuming the shareholder is subject to the 37% maximum rate), such tax rate is still higher than the tax rate applicable to corporate dividends that constitute qualified dividend income. Accordingly, investors who are individuals, trusts and estates may perceive investments in REITs to be relatively less attractive than investments in the stocks of non-REIT corporations that pay dividends, which could materially and adversely affect the value of the shares of REITs, including the per share trading price of our common stock.
Partnership Tax Audit Rules Could Have a Material Adverse Effect on Us.
The Bipartisan Budget Act of 2015 changed the rules applicable to U.S. federal income tax audits of partnerships. Under the rules, effective for taxable years beginning in 2018, among other changes and subject to certain exceptions, any audit adjustment to items of income, gain, loss, deduction, or credit of a partnership (and a partner's allocable share thereof) is determined and taxes, interest and penalties attributable thereto are assessed and collected, at the partnership level. Unless the partnership makes an election permitted under the new law or takes certain steps to require the partners to pay their tax on their allocable shares of the adjustment, it is possible that partnerships in which we directly or indirectly invest, including the Operating Partnership, would be required to pay additional taxes, interest and penalties as a result of an audit adjustment. We, as a direct or indirect partner of the Operating Partnership and other partnerships, could be required to bear the economic burden of those taxes, interest and penalties even though` the Company, as a REIT, may not otherwise have been required to pay additional corporate-level tax. The changes created by these rules are significant for collecting tax in partnership audits and accordingly, there can be no assurance that these rules will not have a material adverse effect on us.
We May be Subject to Adverse Legislative or Regulatory Tax Changes That Could Reduce the Market Price of Our Outstanding Common or Preferred Shares.
The IRS, the United States Treasury Department and Congress frequently review U.S. federal income tax legislation, regulations and other guidance. We cannot predict whether, when or to what extent new U.S. federal tax laws, regulations, interpretations or rulings will be adopted. Any legislative action may prospectively or retroactively modify our tax treatment and therefore, may adversely affect our taxation or our Company's shareholders. We urge you to consult with your tax advisor with respect to the status of legislative, regulatory or administrative developments and proposals and their potential effect on an investment in our stock. Although REITs generally receive certain tax advantages compared to entities taxed as “C” corporations, it is possible that future legislation would result in a REIT having fewer tax advantages and it could become more advantageous for a company that invests in real estate to elect to be treated for U.S. federal income tax purposes as a “C” corporation.
Other Risk Factors Affecting Our Business
We May Identify Material Weaknesses in the Future or Otherwise Fail to Establish and Maintain Effective Internal Control Over Financial Reporting, Which Could Have a Material Adverse Effect on Our Business and Stock Price.
We are subject to Section 404 of the Sarbanes-Oxley Act of 2002, as amended (the “Sarbanes-Oxley Act”), which requires us to maintain internal control over financial reporting and to report any material weaknesses in such internal control. In addition, our independent registered public accounting firm is required to express an opinion on our internal control over financial reporting based on their audit.
We can give no assurance that additional material weaknesses or restatements of financial results will not arise in the future due to a failure to implement and maintain adequate internal control over financial reporting or circumvention of these controls. In the future, our internal controls may not be adequate to prevent or identify irregularities or errors or to facilitate the fair presentation of our consolidated financial statements, and there is risk that a material misstatement of our annual or quarterly financial statements may not be prevented or detected. A control system, no matter how well designed and operated, can provide only reasonable, not absolute, assurance that the control system’s objectives will be met.
Any failure to maintain effective internal control over financial reporting could adversely impact our ability to report our financial position and results of operations on a timely and accurate basis. If our financial statements are inaccurate, investors may not have a complete understanding of our operations. Likewise, if our financial statements are not filed on a timely basis,
24
we could be subject to sanctions or investigations by the NYSE, the SEC or other regulatory authorities. In either case, there could be an adverse affect on our business, financial condition and results of operations. Ineffective internal control over financial reporting could also cause investors to lose confidence in our reported financial information, which could have a negative effect on the trading price of our stock.
We May Face Litigation and Other Risks as a Result of the Classification Error and Related Material Weakness in Our Internal Control Over Financial Reporting.
As a result of the classification error and related material weakness described in Part II, Item 9A. Controls and Procedures, we face the potential for litigation or other disputes which may include, among others, claims invoking the federal and state securities laws, and contractual or other claims arising from the restatement, material weakness, and the preparation of our financial statements. As of the date of this Annual Report on Form 10-K, we have no knowledge of any such litigation or dispute arising due to the restatement or material weakness. However, we can provide no assurance that any litigation or dispute will not arise in the future. Any litigation or dispute, whether successful or not, could have a material adverse effect on our business, results of operations and financial condition.
Some Potential Losses Are Not Covered by Insurance.
We carry comprehensive insurance coverage for losses resulting from property damage and environmental liability and business interruption claims on all of our Properties. In addition, we carry liability coverage for other activities not specifically related to property operations. These coverages include, but are not limited to, Directors & Officers liability, Employment Practices liability, Fiduciary liability and Cyber liability. We believe that the policy specifications and coverage limits of these policies should be adequate and appropriate given the relative risk of loss, the cost of insurance and industry practice. There are, however, certain types of losses, such as punitive damages, lease and other contract claims that generally are not insured. Should an uninsured loss or a loss in excess of coverage limits occur, we could lose all or a portion of the capital we have invested in a Property or the anticipated future revenue from a Property. In such an event, we might nevertheless remain obligated for any mortgage debt or other financial obligations related to the Property.
Our current property and casualty insurance policies with respect to our MH and RV Properties, which we plan to renew, expire on April 1, 2024. We have a $125.0 million per occurrence limit with respect to our MH and RV all-risk property insurance program, which includes approximately $50.0 million of coverage per occurrence for named windstorms, which include, for example, hurricanes. The loss limit is subject to additional sub-limits as set forth in the policy form, including, among others, a $25.0 million aggregate loss limit for earthquake(s) in California. The deductibles for this policy primarily range from $500,000 minimum to 5% per unit of insurance for most catastrophic events. For most catastrophic events, there is an additional one-time aggregate deductible of $10.0 million, which is capped at $5.0 million per occurrence. We have separate insurance policies with respect to our marina Properties. Those casualty policies will expire on November 1, 2024, and the property insurance program, which we plan to renew, expires on April 1, 2024. The marina property insurance program has a $25.0 million per occurrence limit, subject to self-insurance and a minimum deductible of $100,000 plus, for named windstorms, 5% per unit of insurance subject to a $500,000 minimum. A deductible indicates our maximum exposure, subject to policy limits and sub-limits, in the event of a loss.
We Face Risks Relating to Cybersecurity Incidents and Privacy Laws.
We rely extensively on internally and externally hosted computer systems to process transactions, manage the privacy and security of data, including customer data, and operate our business. Critical components of our systems are dependent upon third-party providers and a significant portion of our business operations are conducted over the internet. These systems, as well as our other information technology systems and our networks are subject to system security risks, cybersecurity breaches, outages, disruptions, including disruptions that result in our and our customers' loss of access to our information systems, and other risks. These could include malware, ransomware, and cybersecurity attacks, attempts to gain unauthorized access to our data and computer systems or steal confidential information, including credit card information from our customers, or they could include breaches due to error, malfeasance or other disruptions of employees, independent contractors or consultants. Even if we are not targeted directly, cybersecurity attacks on other entities and institutions, including our customers, vendors, or other third parties with whom we do business, may occur and such events could impact our systems and networks, and disrupt our normal business operations. Attacks can be both individual or highly organized attempts by very sophisticated hacking organizations. We employ a number of measures to prevent, detect and mitigate these threats, but these measures may not be sufficient to mitigate all related risks. While we continue to improve our cybersecurity and take measures to protect our business, it may not always be possible to anticipate, detect, or recognize threats to our systems, to implement effective preventive measures, nor to ensure that our financial results will not be negatively impacted by such an incident. The extent of a particular cybersecurity attack and the steps that we may need to take to investigate the attack also may not be immediately clear. A cybersecurity incident could compromise the confidential information of our employees, customers and vendors to the
25
extent such information exists on our systems or on the systems of third-party providers. Information and data maintained in digital form are subject to the risks of unauthorized access, modification, exfiltration, destruction or denial of access. Any compromise of our security could result in a violation of applicable privacy, information security, and other laws, which continue to evolve and may be inconsistent from one jurisdiction to another, and could result in potential liability, damage our reputation, disrupt and affect our business operations and result in lawsuits against us. Furthermore, we may not be able to recover these expenses from our service providers, responsible parties, or insurance carriers, the amount of which could be significant. In addition, cybersecurity is an issue that is becoming increasingly regulated. As regulations take effect or evolve it is possible we may encounter issues being fully compliant with these legal standards which could result in material adverse effects on our business.
Social Media Platforms Could Cause Us to Suffer Brand Damage or Information Leakage.
Negative information about us, or our officers, employees, directors or Properties, even if untrue, could damage our reputation. In particular, information shared on social media platforms could cause us to suffer brand damage because social media platforms have increased the rapidity of the dissemination and greatly expanded the potential scope and scale of the impact of negative publicity. Furthermore, current or former employees, customers or others might make negative comments regarding us, publicly share material that reflects negatively on our reputation or disclose non-public sensitive information relating to our business. While we have customary internal policies related to posting Company information on public platforms, including social media sites, the continuing evolution of social media will present us with new challenges and risks.
Item 1B. Unresolved Staff Comments
None.
Item 1C. Cybersecurity
Cybersecurity represents an important component of the Company’s overall approach to risk management. The Company’s cybersecurity policies, standards and practices are fully integrated into the Company’s enterprise risk management (“ERM”) approach, and cybersecurity risks are subject to oversight by the Company’s Board of Directors. The Company generally approaches cybersecurity threats through a cross-functional, multilayered approach, with the goals of: (i) identifying, preventing and mitigating cybersecurity threats to the Company; (ii) preserving the confidentiality, security and availability of the information that we collect and store to use in our business; (iii) protecting the Company’s intellectual property; and (iv) maintaining the confidence of our customers, clients and business partners.
Risk Management and Strategy
Consistent with overall ERM policies and practices, the Company’s cybersecurity program focuses on the following areas:
•
Vigilance:
The Company maintains a primarily domestic presence, with our cybersecurity threat operations designed with the specific goal of identifying, preventing and mitigating cybersecurity threats and responding to cybersecurity incidents in accordance with our established incident response and recovery plans.
•
Systems Safeguards:
The Company deploys systems safeguards that are designed to protect the Company’s information systems from cybersecurity threats, including firewalls, intrusion prevention and detection systems, software updates and patches, anti-malware functionality and access controls, which are evaluated and improved through ongoing vulnerability assessments and cybersecurity threat intelligence.
•
Collaboration:
The Company utilizes collaboration mechanisms established with public and private entities, including intelligence and enforcement agencies, industry groups and third-party service providers, to identify, assess and respond to cybersecurity risks.
•
Third-Party Risk Management:
The Company maintains a comprehensive, risk-based approach to identifying and overseeing cybersecurity risks presented by third parties, including vendors, service providers and other external users of the Company’s systems, as well as the systems of third parties that could adversely impact our business in the event of a cybersecurity incident affecting those third-party systems.
•
Training:
The Company provides periodic mandatory training for personnel regarding cybersecurity threats, which reinforces the Company’s information security policies, standards and practices, and such training is scaled to reflect the roles, responsibilities and information systems access of such personnel.
26
•
Incident Response and Recovery Planning:
The Company has established and maintains incident response and recovery plans that address the Company’s response to a cybersecurity incident and the recovery from a cybersecurity incident, and such plans are tested and evaluated periodically.
•
Communication and Coordination:
The Company utilizes a cross-functional approach to address the risk from cybersecurity threats, involving management personnel from the Company’s technology, operations, legal, risk management, internal audit and other key business functions, as well as the members of the Board of Directors and the Audit Committee in an ongoing dialogue regarding cybersecurity threats and incidents.
A key part of the Company’s strategy for managing risks from cybersecurity threats is the ongoing assessment and testing of the Company’s processes and practices through auditing, assessments, tabletop exercises, threat modeling, vulnerability testing and other exercises focused on evaluating the effectiveness of our cybersecurity measures. The Company regularly engages third parties to perform assessments on our cybersecurity measures, including information security maturity assessments, audits and independent reviews of our information security control environment and operating effectiveness. The results of such assessments, audits and reviews are reported to the Audit Committee and the Board of Directors, and the Company considers adjustments to its cybersecurity policies, standards, processes and practices as necessary based on the information provided by the assessments, audits and reviews.
The Company is not aware of any cybersecurity incidents in the last three years that have materially affected or are reasonably likely to materially affect the business strategy, results of operations, or financial condition of the Company. For more information regarding how cybersecurity threats could materially affect the Company, see "
We Face Risks Relating to Cybersecurity Incidents and Privacy Laws."
in Item 1A. Risk Factors.
Governance
The Board of Directors, in coordination with the Audit Committee, oversees the management of risks from cybersecurity threats, including the policies, standards, processes and practices that the Company’s management implements to address risks from cybersecurity threats. The Board of Directors and the Audit Committee each receive regular presentations and reports on cybersecurity risks, which address a wide range of topics including, for example, recent developments, evolving standards, vulnerability assessments, third-party and independent reviews, the threat environment, technological trends and information security considerations arising with respect to the Company’s peers and third parties. The Board of Directors and the Audit Committee receive prompt and timely information regarding any cybersecurity incident that meets established reporting guidelines. Decisions regarding the disclosure and reporting of such incidents are made by management in a timely manner. The Board of Directors and Audit Committee receive ongoing updates regarding any such incidents until they have been addressed. The Audit Committee regularly interacts with the Company's ERM function, the Company's Vice President of Information Technology, other members of management and relevant management committees, including the Company's Security Advisory Board and Cybersecurity Incident Response Team. On a quarterly basis each year, the Audit Committee discusses the Company’s approach to cybersecurity risk management with the Company’s Vice President of Information Technology.
The Company’s Vice President of Information Technology is the member of the Company’s management that is principally responsible for overseeing the Company’s cybersecurity risk management program, in partnership with other business leaders across the Company. The Vice President of Information Technology works in coordination with the other members of the Security Advisory Board, which includes our President and Chief Executive Officer, Executive Vice President and Chief Financial Officer and Executive Vice President and Chief Legal Officer. The Company’s Vice President of Information Technology has over 25 years in Information Technology leadership including 15 years overseeing security and compliance operations. The Director of Information Security has over 15 years in various security roles in private and public sectors and has attained the professional certification of Certified Information Systems Security Professional (CISSP).
The Company’s Vice President of Information Technology and Director of Information Security, in coordination with the Security Advisory Board and Cybersecurity Incident Response Team, work collaboratively across the Company to implement a program designed to protect the Company’s information systems from cybersecurity threats and to promptly respond to any cybersecurity incidents. To facilitate the success of this program, multidisciplinary teams throughout the Company are deployed to address cybersecurity threats and to respond to cybersecurity incidents in accordance with the Company’s incident response and recovery plans. Through the ongoing communications from these teams, the Vice President of Information Technology and Director of Information Security, in coordination with the Security Advisory Board and Cybersecurity Incident Response Team monitor the prevention, detection, mitigation and remediation of cybersecurity incidents in real time, and report such incidents to the Audit Committee when appropriate.
27
Item 2. Properties
General
Our Properties provide common area facilities and attractive amenities that create an inviting community for our residents and guests. These common area facilities generally include a clubhouse, a swimming pool, laundry facilities, cable television and internet service. Many Properties also offer additional amenities such as golf courses, tennis, pickleball, shuffleboard and basketball courts, sauna/whirlpool spas, exercise rooms and various social activities. It is our responsibility to provide maintenance of the common area facilities and amenities and to ensure that our residents and guests comply with our community policies, including maintaining their homes and the surrounding area. Most of our residents own their homes; and therefore, also have a vested interest to care for their homes. We hold regular meetings with management personnel at our Properties to understand and address the needs of our residents and guests and to provide necessary trainings. Our Properties historically have had, and we believe they will continue to have, low turnover and high occupancy rates.
Property Portfolio
As of December 31, 2023, we owned or had an ownership interest in a portfolio of 451 Properties located predominantly in the United States containing 172,465 Sites. A total of 120 of the Properties were encumbered by debt (see Item 8. Financial Statements and Supplementary Data—Note 9. Borrowing Arrangements). The distribution of our Properties reflects our belief that geographic diversification helps to insulate the total portfolio from regional economic influences. We intend to target new acquisitions in or near markets where our Properties are located and will also consider acquisitions of properties outside such markets.
Our two largest Properties as determined by property operating revenues were Colony Cove, located in Ellenton, Florida and ViewPoint RV & Golf Resort, located in Mesa, Arizona. Each accounted for approximately 2.0% of our total property operating revenues for the year ended December 31, 2023.
The following table sets forth certain information relating to our 437 wholly-owned Properties containing 168,901 Sites as of December 31, 2023, not including Properties owned through joint ventures. These Properties are categorized by major market. For RV and marina Properties, the total number of annual Sites represents Sites occupied by annual residents and are presented as 100% occupied. Annual Site occupancy percentage subtotals by market and grand total are presented on a weighted average basis.
| Property | City | State | Property Type |
Acres
(a)
|
Developable
Acres
(b)
|
Total Number of Sites as of 12/31/23 | Total Number of Annual Sites as of 12/31/23 | Annual Site Occupancy as of 12/31/23 | |||||||||||||||||||||||||||||||||||||||||||||
| Florida | |||||||||||||||||||||||||||||||||||||||||||||||||||||
| East Coast: | |||||||||||||||||||||||||||||||||||||||||||||||||||||
| Aventura Marina | Aventura | FL | Marina | 15 | — | 6 | 6 | 100.0% | |||||||||||||||||||||||||||||||||||||||||||||
| Hi-Lift Marina | Aventura | FL | Marina | 3 | — | 211 | 209 | 100.0% | |||||||||||||||||||||||||||||||||||||||||||||
| Cheron Village | Davie | FL | MH | 30 | — | 202 | 202 | 99.0% | |||||||||||||||||||||||||||||||||||||||||||||
| Carriage Cove | Daytona Beach | FL | MH | 59 | — | 418 | 418 | 84.2% | |||||||||||||||||||||||||||||||||||||||||||||
| Daytona Beach Marina | Daytona Beach | FL | Marina | 5 | — | 179 | 151 | 100.0% | |||||||||||||||||||||||||||||||||||||||||||||
| Coquina Crossing | Elkton | FL | MH | 316 | 26 | 596 | 596 | 97.8% | |||||||||||||||||||||||||||||||||||||||||||||
| Bulow Plantation | Flagler Beach | FL | MH | 323 | 90 | 276 | 276 | 98.9% | |||||||||||||||||||||||||||||||||||||||||||||
| Bulow RV | Flagler Beach | FL | RV | (g) | 91 | 352 | 123 | 100.0% | |||||||||||||||||||||||||||||||||||||||||||||
| Carefree Cove | Fort Lauderdale | FL | MH | 20 | — | 164 | 164 | 93.3% | |||||||||||||||||||||||||||||||||||||||||||||
| Everglades Lakes | Fort Lauderdale | FL | MH | 103 | — | 611 | 611 | 94.1% | |||||||||||||||||||||||||||||||||||||||||||||
| Park City West | Fort Lauderdale | FL | MH | 60 | — | 363 | 363 | 97.5% | |||||||||||||||||||||||||||||||||||||||||||||
| Sunshine Holiday MH | Fort Lauderdale | FL | MH | 32 | — | 245 | 245 | 97.1% | |||||||||||||||||||||||||||||||||||||||||||||
| Sunshine Holiday RV | Fort Lauderdale | FL | RV | (g) | — | 130 | 47 | 100.0% | |||||||||||||||||||||||||||||||||||||||||||||
| Hollywood Marina | Hollywood | FL | Marina | 9 | — | 190 | 140 | 100.0% | |||||||||||||||||||||||||||||||||||||||||||||
28
| Property | City | State | Property Type |
Acres
(a)
|
Developable
Acres
(b)
|
Total Number of Sites as of 12/31/23 | Total Number of Annual Sites as of 12/31/23 | Annual Site Occupancy as of 12/31/23 | |||||||||||||||||||||||||||||||||||||||||||||
| Jupiter Marina | Jupiter | FL | Marina | 5 | — | 231 | 201 | 100.0% | |||||||||||||||||||||||||||||||||||||||||||||
| Lake Worth Village | Lake Worth | FL | MH | 117 | — | 823 | 823 | 95.9% | |||||||||||||||||||||||||||||||||||||||||||||
| Lantana Marina | Lantana | FL | Marina | 5 | — | 394 | 278 | 100.0% | |||||||||||||||||||||||||||||||||||||||||||||
| Maralago Cay | Lantana | FL | MH | 102 | — | 602 | 602 | 96.8% | |||||||||||||||||||||||||||||||||||||||||||||
| South Lantana Marina | Lantana | FL | Marina | 1 | — | 73 | 55 | 100.0% | |||||||||||||||||||||||||||||||||||||||||||||
| Coral Cay Plantation | Margate | FL | MH | 121 | — | 818 | 818 | 97.1% | |||||||||||||||||||||||||||||||||||||||||||||
| Lakewood Village | Melbourne | FL | MH | 68 | — | 349 | 349 | 88.8% | |||||||||||||||||||||||||||||||||||||||||||||
| Miami Everglades | Miami | FL | RV | 34 | 9 | 303 | 45 | 100.0% | |||||||||||||||||||||||||||||||||||||||||||||
| South Miami Marina | Miami | FL | Marina | 41 | — | 254 | 221 | 100.0% | |||||||||||||||||||||||||||||||||||||||||||||
| Okeechobee RV Resort | Okeechobee | FL | RV | 110 | — | 740 | 285 | 100.0% | |||||||||||||||||||||||||||||||||||||||||||||
| Holiday Village, Ormond Beach | Ormond Beach | FL | MH | 43 | — | 301 | 301 | 88.7% | |||||||||||||||||||||||||||||||||||||||||||||
| Sunshine Holiday-Daytona North | Ormond Beach | FL | RV | 69 | 3 | 349 | 149 | 100.0% | |||||||||||||||||||||||||||||||||||||||||||||
| Palm Beach Gardens Marina | Palm Beach Gardens | FL | Marina | 12 | — | 133 | 113 | 100.0% | |||||||||||||||||||||||||||||||||||||||||||||
| The Meadows, FL | Palm Beach Gardens | FL | MH | 55 | — | 378 | 378 | 96.8% | |||||||||||||||||||||||||||||||||||||||||||||
| Breezy Hill | Pompano Beach | FL | RV | 52 | — | 762 | 322 | 100.0% | |||||||||||||||||||||||||||||||||||||||||||||
| Hidden Harbour Marina | Pompano Beach | FL | Marina | 4 | — | 357 | 250 | 100.0% | |||||||||||||||||||||||||||||||||||||||||||||
| Highland Woods Travel Park | Pompano Beach | FL | RV | 15 | — | 148 | 15 | 100.0% | |||||||||||||||||||||||||||||||||||||||||||||
| Inlet Harbor Marina | Ponce Inlet | FL | Marina | 10 | — | 295 | 221 | 100.0% | |||||||||||||||||||||||||||||||||||||||||||||
| Lighthouse Pointe at Daytona Beach | Port Orange | FL | MH | 64 | — | 435 | 435 | 84.1% | |||||||||||||||||||||||||||||||||||||||||||||
| Pickwick Village | Port Orange | FL | MH | 84 | — | 441 | 441 | 95.5% | |||||||||||||||||||||||||||||||||||||||||||||
| Rose Bay | Port Orange | FL | RV | 21 | 2 | 303 | 201 | 100.0% | |||||||||||||||||||||||||||||||||||||||||||||
| Palm Lake | Riviera Beach | FL | MH | 154 | — | 916 | 916 | 71.4% | |||||||||||||||||||||||||||||||||||||||||||||
| Riviera Beach Marina | Riviera Beach | FL | Marina | 6 | — | 326 | 283 | 100.0% | |||||||||||||||||||||||||||||||||||||||||||||
| Indian Oaks | Rockledge | FL | MH | 38 | — | 208 | 208 | 100.0% | |||||||||||||||||||||||||||||||||||||||||||||
| Space Coast | Rockledge | FL | RV | 24 | — | 270 | 178 | 100.0% | |||||||||||||||||||||||||||||||||||||||||||||
| St. Pete Marina | St. Petersburg | FL | Marina | 15 | — | 438 | 323 | 100.0% | |||||||||||||||||||||||||||||||||||||||||||||
| Riverwatch Marina | Stuart | FL | Marina | 8 | — | 306 | 193 | 100.0% | |||||||||||||||||||||||||||||||||||||||||||||
| Countryside at Vero Beach | Vero Beach | FL | MH | 125 | — | 644 | 644 | 96.4% | |||||||||||||||||||||||||||||||||||||||||||||
| Heritage Plantation | Vero Beach | FL | MH | 64 | — | 437 | 437 | 92.2% | |||||||||||||||||||||||||||||||||||||||||||||
| Heron Cay | Vero Beach | FL | MH | 130 | — | 588 | 588 | 93.5% | |||||||||||||||||||||||||||||||||||||||||||||
| Holiday Village, Florida | Vero Beach | FL | MH | 18 | — | 128 | 128 | —% | |||||||||||||||||||||||||||||||||||||||||||||
| Sunshine Travel-Vero Beach | Vero Beach | FL | RV | 33 | 3 | 323 | 141 | 100.0% | |||||||||||||||||||||||||||||||||||||||||||||
| Vero Beach Marina | Vero Beach | FL | Marina | 26 | — | 160 | 74 | 100.0% | |||||||||||||||||||||||||||||||||||||||||||||
| Vero Palm Estates | Vero Beach | FL | MH | 64 | — | 285 | 285 | 91.2% | |||||||||||||||||||||||||||||||||||||||||||||
| Village Green | Vero Beach | FL | MH | 178 | 16 | 782 | 782 | 91.0% | |||||||||||||||||||||||||||||||||||||||||||||
| Palm Beach Colony | West Palm Beach | FL | MH | 48 | — | 284 | 284 | 99.6% | |||||||||||||||||||||||||||||||||||||||||||||
| Central: | |||||||||||||||||||||||||||||||||||||||||||||||||||||
| Clover Leaf Farms | Brooksville | FL | MH | 227 | 20 | 845 | 845 | 95.4% | |||||||||||||||||||||||||||||||||||||||||||||
| Clover Leaf Forest | Brooksville | FL | RV | 30 | — | 277 | 126 | 100.0% | |||||||||||||||||||||||||||||||||||||||||||||
| Clerbrook Golf & RV Resort | Clermont | FL | RV | 288 | — | 1,255 | 580 | 100.0% | |||||||||||||||||||||||||||||||||||||||||||||
| Lake Magic | Clermont | FL | RV | 69 | — | 471 | 166 | 100.0% | |||||||||||||||||||||||||||||||||||||||||||||
29
| Property | City | State | Property Type |
Acres
(a)
|
Developable
Acres
(b)
|
Total Number of Sites as of 12/31/23 | Total Number of Annual Sites as of 12/31/23 | Annual Site Occupancy as of 12/31/23 | |||||||||||||||||||||||||||||||||||||||||||||
| Orange Lake | Clermont | FL | MH | 38 | — | 242 | 242 | 98.3% | |||||||||||||||||||||||||||||||||||||||||||||
| Orlando | Clermont | FL | RV | 270 | — | 1,107 | 270 | 100.0% | |||||||||||||||||||||||||||||||||||||||||||||
| Haselton Village | Eustis | FL | MH | 52 | — | 291 | 291 | 100.0% | |||||||||||||||||||||||||||||||||||||||||||||
| Southern Palms RV | Eustis | FL | RV | 120 | — | 950 | 366 | 100.0% | |||||||||||||||||||||||||||||||||||||||||||||
| Lakeside Terrace | Fruitland Park | FL | MH | 39 | — | 241 | 241 | 99.2% | |||||||||||||||||||||||||||||||||||||||||||||
| Grand Island Resort | Grand Island | FL | MH | 35 | — | 362 | 362 | 78.5% | |||||||||||||||||||||||||||||||||||||||||||||
| Sherwood Forest - MHP | Kissimmee | FL | MH | 124 | 8 | 769 | 769 | 98.0% | |||||||||||||||||||||||||||||||||||||||||||||
| Sherwood Forest RV | Kissimmee | FL | RV | 107 | 6 | 513 | 168 | 100.0% | |||||||||||||||||||||||||||||||||||||||||||||
| Tropical Palms | Kissimmee | FL | RV | 59 | — | 592 | 179 | 100.0% | |||||||||||||||||||||||||||||||||||||||||||||
| Beacon Hill Colony | Lakeland | FL | MH | 31 | — | 201 | 201 | 99.0% | |||||||||||||||||||||||||||||||||||||||||||||
| Beacon Terrace | Lakeland | FL | MH | 61 | — | 297 | 297 | 100.0% | |||||||||||||||||||||||||||||||||||||||||||||
| Kings & Queens | Lakeland | FL | MH | 18 | — | 107 | 107 | 96.3% | |||||||||||||||||||||||||||||||||||||||||||||
| Lakeland Harbor | Lakeland | FL | MH | 65 | — | 504 | 504 | 99.8% | |||||||||||||||||||||||||||||||||||||||||||||
| Lakeland Junction | Lakeland | FL | MH | 23 | — | 193 | 193 | 99.5% | |||||||||||||||||||||||||||||||||||||||||||||
| Coachwood Colony | Leesburg | FL | MH | 29 | — | 201 | 201 | 89.1% | |||||||||||||||||||||||||||||||||||||||||||||
| Mid-Florida Lakes | Leesburg | FL | MH | 290 | — | 1,225 | 1,225 | 90.4% | |||||||||||||||||||||||||||||||||||||||||||||
| Southernaire | Mt. Dora | FL | MH | 14 | — | 114 | 114 | 91.2% | |||||||||||||||||||||||||||||||||||||||||||||
| Foxwood Farms | Ocala | FL | MH | 56 | — | 365 | 365 | 85.8% | |||||||||||||||||||||||||||||||||||||||||||||
| Oak Bend | Ocala | FL | MH | 62 | — | 342 | 342 | 75.1% | |||||||||||||||||||||||||||||||||||||||||||||
| Villas at Spanish Oaks | Ocala | FL | MH | 69 | — | 454 | 454 | 86.1% | |||||||||||||||||||||||||||||||||||||||||||||
| Audubon Village - Florida | Orlando | FL | MH | 40 | 2 | 280 | 280 | 98.9% | |||||||||||||||||||||||||||||||||||||||||||||
| Hidden Valley | Orlando | FL | MH | 50 | — | 303 | 303 | 99.3% | |||||||||||||||||||||||||||||||||||||||||||||
| Starlight Ranch | Orlando | FL | MH | 130 | — | 783 | 783 | 97.2% | |||||||||||||||||||||||||||||||||||||||||||||
| Covington Estates | Saint Cloud | FL | MH | 59 | — | 241 | 241 | 100.0% | |||||||||||||||||||||||||||||||||||||||||||||
| Parkwood Communities | Wildwood | FL | MH | 121 | — | 694 | 694 | 98.3% | |||||||||||||||||||||||||||||||||||||||||||||
| Three Flags | Wildwood | FL | RV | 23 | — | 221 | 55 | 100.0% | |||||||||||||||||||||||||||||||||||||||||||||
| Winter Garden | Winter Garden | FL | RV | 27 | — | 350 | 173 | 100.0% | |||||||||||||||||||||||||||||||||||||||||||||
| Gulf Coast (Tampa/Naples): | |||||||||||||||||||||||||||||||||||||||||||||||||||||
| Riverside RV Resort | Arcadia | FL | RV | 499 | 208 | 548 | 250 | 100.0% | |||||||||||||||||||||||||||||||||||||||||||||
| Toby's RV Resort | Arcadia | FL | RV | 44 | — | 379 | 335 | 100.0% | |||||||||||||||||||||||||||||||||||||||||||||
| Sunshine Key | Big Pine Key | FL | RV | 54 | — | 409 | 50 | 100.0% | |||||||||||||||||||||||||||||||||||||||||||||
| Windmill Manor | Bradenton | FL | MH | 49 | — | 292 | 292 | 99.3% | |||||||||||||||||||||||||||||||||||||||||||||
| Winter Quarters Manatee | Bradenton | FL | RV | 42 | — | 415 | 244 | 100.0% | |||||||||||||||||||||||||||||||||||||||||||||
| Resort at Tranquility Lake | Cape Coral | FL | RV | 188 | — | 500 | 33 | 100.0% | |||||||||||||||||||||||||||||||||||||||||||||
| Cape Coral Development Land (c) | Cape Coral | FL | RV | 1,110 | 570 | — | — | —% | |||||||||||||||||||||||||||||||||||||||||||||
| Palm Harbour Marina | Cape Haze | FL | Marina | 18 | — | 260 | 162 | 100.0% | |||||||||||||||||||||||||||||||||||||||||||||
| Glen Ellen | Clearwater | FL | MH | 12 | — | 106 | 106 | 98.1% | |||||||||||||||||||||||||||||||||||||||||||||
| Hillcrest FL | Clearwater | FL | MH | 25 | — | 276 | 276 | 96.0% | |||||||||||||||||||||||||||||||||||||||||||||
| Holiday Ranch | Clearwater | FL | MH | 12 | — | 150 | 150 | 94.0% | |||||||||||||||||||||||||||||||||||||||||||||
| Serendipity | Clearwater | FL | MH | 55 | — | 425 | 425 | 99.3% | |||||||||||||||||||||||||||||||||||||||||||||
| Shady Lane Oaks | Clearwater | FL | MH | 31 | — | 249 | 249 | 98.0% | |||||||||||||||||||||||||||||||||||||||||||||
| Shady Lane Village | Clearwater | FL | MH | 19 | — | 156 | 156 | 97.4% | |||||||||||||||||||||||||||||||||||||||||||||
30
| Property | City | State | Property Type |
Acres
(a)
|
Developable
Acres
(b)
|
Total Number of Sites as of 12/31/23 | Total Number of Annual Sites as of 12/31/23 | Annual Site Occupancy as of 12/31/23 | |||||||||||||||||||||||||||||||||||||||||||||
| Silk Oak Lodge | Clearwater | FL | MH | 19 | — | 181 | 181 | 94.5% | |||||||||||||||||||||||||||||||||||||||||||||
| Cortez Village Marina | Cortez | FL | Marina | 4 | — | 353 | 319 | 100.0% | |||||||||||||||||||||||||||||||||||||||||||||
| Crystal Isles | Crystal River | FL | RV | 38 | 1 | 260 | 86 | 100.0% | |||||||||||||||||||||||||||||||||||||||||||||
| Lake Haven | Dunedin | FL | MH | 48 | — | 379 | 379 | 97.6% | |||||||||||||||||||||||||||||||||||||||||||||
| Marker 1 Marina | Dunedin | FL | Marina | 11 | — | 477 | 371 | 100.0% | |||||||||||||||||||||||||||||||||||||||||||||
| Colony Cove | Ellenton | FL | MH | 543 | 5 | 2,405 | 2,405 | 94.1% | |||||||||||||||||||||||||||||||||||||||||||||
| The Oaks at Colony Cove | Ellenton | FL | MH | (g) | — | 93 | 93 | 94.6% | |||||||||||||||||||||||||||||||||||||||||||||
| Ridgewood Estates | Ellenton | FL | MH | 77 | — | 380 | 380 | 99.7% | |||||||||||||||||||||||||||||||||||||||||||||
| Fort Myers Beach | Fort Myers | FL | RV | 37 | 6 | 292 | 165 | 100.0% | |||||||||||||||||||||||||||||||||||||||||||||
| Fish Tale Marina | Fort Myers Beach | FL | Marina | 8 | — | 296 | 241 | 100.0% | |||||||||||||||||||||||||||||||||||||||||||||
| Gulf Air | Fort Myers Beach | FL | RV | 25 | — | 246 | 73 | 100.0% | |||||||||||||||||||||||||||||||||||||||||||||
| Holiday Travel Park | Holiday | FL | RV | 45 | — | 613 | 507 | 100.0% | |||||||||||||||||||||||||||||||||||||||||||||
| Barrington Hills | Hudson | FL | RV | 28 | — | 392 | 271 | 100.0% | |||||||||||||||||||||||||||||||||||||||||||||
| Down Yonder | Largo | FL | MH | 50 | — | 361 | 361 | 100.0% | |||||||||||||||||||||||||||||||||||||||||||||
| East Bay Oaks | Largo | FL | MH | 40 | — | 328 | 328 | 100.0% | |||||||||||||||||||||||||||||||||||||||||||||
| Eldorado Village | Largo | FL | MH | 25 | — | 227 | 227 | 99.1% | |||||||||||||||||||||||||||||||||||||||||||||
| Paradise Park - Largo | Largo | FL | MH | 15 | — | 108 | 108 | 100.0% | |||||||||||||||||||||||||||||||||||||||||||||
| Shangri-La Mobile Home Park | Largo | FL | MH | 14 | — | 160 | 160 | 93.8% | |||||||||||||||||||||||||||||||||||||||||||||
| Vacation Village | Largo | FL | RV | 29 | — | 293 | 172 | 100.0% | |||||||||||||||||||||||||||||||||||||||||||||
| Whispering Pines - Largo | Largo | FL | MH | 55 | — | 393 | 393 | 97.5% | |||||||||||||||||||||||||||||||||||||||||||||
| Fiesta Key | Long Key | FL | RV | 28 | — | 373 | 10 | 100.0% | |||||||||||||||||||||||||||||||||||||||||||||
| Winter Quarters Pasco | Lutz | FL | RV | 27 | — | 255 | 197 | 100.0% | |||||||||||||||||||||||||||||||||||||||||||||
| Country Place | New Port Richey | FL | MH | 82 | — | 515 | 515 | 100.0% | |||||||||||||||||||||||||||||||||||||||||||||
| Hacienda Village | New Port Richey | FL | MH | 66 | — | 505 | 505 | 98.8% | |||||||||||||||||||||||||||||||||||||||||||||
| Harbor View Mobile Manor | New Port Richey | FL | MH | 69 | — | 471 | 471 | 99.6% | |||||||||||||||||||||||||||||||||||||||||||||
| Bay Lake Estates | Nokomis | FL | MH | 34 | — | 228 | 228 | 94.7% | |||||||||||||||||||||||||||||||||||||||||||||
| Lake Village | Nokomis | FL | MH | 105 | 40 | 391 | 391 | 94.9% | |||||||||||||||||||||||||||||||||||||||||||||
| Royal Coachman | Nokomis | FL | RV | 111 | 2 | 546 | 505 | 100.0% | |||||||||||||||||||||||||||||||||||||||||||||
| Buccaneer Estates | North Fort Myers | FL | MH | 223 | 39 | 971 | 971 | 90.5% | |||||||||||||||||||||||||||||||||||||||||||||
| Island Vista Estates | North Fort Myers | FL | MH | 121 | — | 616 | 616 | 88.0% | |||||||||||||||||||||||||||||||||||||||||||||
| Lake Fairways | North Fort Myers | FL | MH | 259 | — | 896 | 896 | 99.1% | |||||||||||||||||||||||||||||||||||||||||||||
| Pine Lakes | North Fort Myers | FL | MH | 397 | 61 | 602 | 602 | 99.7% | |||||||||||||||||||||||||||||||||||||||||||||
| Pioneer Village | North Fort Myers | FL | RV | 90 | — | 733 | 423 | 100.0% | |||||||||||||||||||||||||||||||||||||||||||||
| Sunseekers RV Resort | North Fort Myers | FL | RV | 16 | — | 241 | 197 | 100.0% | |||||||||||||||||||||||||||||||||||||||||||||
| The Heritage | North Fort Myers | FL | MH | 214 | 6 | 449 | 449 | 99.8% | |||||||||||||||||||||||||||||||||||||||||||||
| Windmill Village - N. Ft. Myers | North Fort Myers | FL | MH | 69 | — | 491 | 491 | 88.4% | |||||||||||||||||||||||||||||||||||||||||||||
| Silver Dollar Golf & Trap Club Resort | Odessa | FL | RV | 836 | — | 459 | 383 | 100.0% | |||||||||||||||||||||||||||||||||||||||||||||
| Terra Ceia | Palmetto | FL | RV | 50 | — | 391 | 160 | 100.0% | |||||||||||||||||||||||||||||||||||||||||||||
| Arbors at Countrywood | Plant City | FL | MH | (g) | — | 62 | 62 | 59.7% | |||||||||||||||||||||||||||||||||||||||||||||
| Lakes at Countrywood | Plant City | FL | MH | 122 | 10 | 424 | 424 | 97.4% | |||||||||||||||||||||||||||||||||||||||||||||
| Meadows at Countrywood | Plant City | FL | MH | 140 | — | 737 | 737 | 99.7% | |||||||||||||||||||||||||||||||||||||||||||||
| Oaks at Countrywood | Plant City | FL | MH | 44 | — | 168 | 168 | 99.4% | |||||||||||||||||||||||||||||||||||||||||||||
31
| Property | City | State | Property Type |
Acres
(a)
|
Developable
Acres
(b)
|
Total Number of Sites as of 12/31/23 | Total Number of Annual Sites as of 12/31/23 | Annual Site Occupancy as of 12/31/23 | |||||||||||||||||||||||||||||||||||||||||||||
| Harbor Lakes | Port Charlotte | FL | RV | 80 | — | 528 | 390 | 100.0% | |||||||||||||||||||||||||||||||||||||||||||||
| Emerald Lake | Punta Gorda | FL | MH | 28 | — | 201 | 201 | 96.0% | |||||||||||||||||||||||||||||||||||||||||||||
| Gulf View | Punta Gorda | FL | RV | 78 | — | 206 | 104 | 100.0% | |||||||||||||||||||||||||||||||||||||||||||||
| Tropical Palms MH | Punta Gorda | FL | MH | 50 | 2 | 294 | 294 | 98.0% | |||||||||||||||||||||||||||||||||||||||||||||
| Kingswood | Riverview | FL | MH | 52 | — | 229 | 229 | 100.0% | |||||||||||||||||||||||||||||||||||||||||||||
| Winds of St. Armands North | Sarasota | FL | MH | 74 | — | 471 | 471 | 99.8% | |||||||||||||||||||||||||||||||||||||||||||||
| Winds of St. Armands South | Sarasota | FL | MH | 90 | 4 | 360 | 360 | 95.3% | |||||||||||||||||||||||||||||||||||||||||||||
| Topics RV Resort | Spring Hill | FL | RV | 35 | — | 230 | 175 | 100.0% | |||||||||||||||||||||||||||||||||||||||||||||
| Pine Island | St. James City | FL | RV | 31 | — | 363 | 13 | 100.0% | |||||||||||||||||||||||||||||||||||||||||||||
| Carefree Village | Tampa | FL | MH | 58 | — | 398 | 398 | 98.2% | |||||||||||||||||||||||||||||||||||||||||||||
| Tarpon Glen | Tarpon Springs | FL | MH | 24 | — | 168 | 168 | 99.4% | |||||||||||||||||||||||||||||||||||||||||||||
| Featherock | Valrico | FL | MH | 84 | — | 521 | 521 | 99.2% | |||||||||||||||||||||||||||||||||||||||||||||
| Bay Indies | Venice | FL | MH | 210 | — | 1,309 | 1,309 | 95.9% | |||||||||||||||||||||||||||||||||||||||||||||
| Ramblers Rest RV Resort | Venice | FL | RV | 117 | — | 647 | 381 | 100.0% | |||||||||||||||||||||||||||||||||||||||||||||
| Peace River | Wauchula | FL | RV | 72 | — | 454 | 49 | 100.0% | |||||||||||||||||||||||||||||||||||||||||||||
| Crystal Lake Zephyrhills | Zephyrhills | FL | MH | 147 | — | 518 | 518 | 81.3% | |||||||||||||||||||||||||||||||||||||||||||||
| Forest Lake Estates MH | Zephyrhills | FL | MH | 192 | 68 | 929 | 929 | 98.1% | |||||||||||||||||||||||||||||||||||||||||||||
| Forest Lake Village RV | Zephyrhills | FL | RV | 42 | — | 274 | 187 | 100.0% | |||||||||||||||||||||||||||||||||||||||||||||
| Sixth Avenue | Zephyrhills | FL | MH | 14 | — | 133 | 133 | 82.0% | |||||||||||||||||||||||||||||||||||||||||||||
| Other | Multiple | FL | MH | 7 | — | 133 | 133 | 22.6% | |||||||||||||||||||||||||||||||||||||||||||||
| Total Florida Market | 13,422 | 1,298 | 64,609 | 52,967 | 95.1% | ||||||||||||||||||||||||||||||||||||||||||||||||
| California | |||||||||||||||||||||||||||||||||||||||||||||||||||||
| Northern California: | |||||||||||||||||||||||||||||||||||||||||||||||||||||
| Monte del Lago | Castroville | CA | MH | 54 | — | 310 | 310 | 99.4% | |||||||||||||||||||||||||||||||||||||||||||||
| Colony Park | Ceres | CA | MH | 20 | — | 186 | 186 | 96.8% | |||||||||||||||||||||||||||||||||||||||||||||
| Russian River | Cloverdale | CA | RV | 41 | — | 135 | 1 | 100.0% | |||||||||||||||||||||||||||||||||||||||||||||
| Snowflower (d) | Emigrant Gap | CA | RV | 612 | — | 268 | — | —% | |||||||||||||||||||||||||||||||||||||||||||||
| Four Seasons | Fresno | CA | MH | 40 | — | 242 | 242 | 95.0% | |||||||||||||||||||||||||||||||||||||||||||||
| Yosemite Lakes (d) | Groveland | CA | RV | 403 | 30 | 299 | — | —% | |||||||||||||||||||||||||||||||||||||||||||||
| Tahoe Valley (d) (e) | Lake Tahoe | CA | RV | 86 | — | 413 | — | —% | |||||||||||||||||||||||||||||||||||||||||||||
| Sea Oaks | Los Osos | CA | MH | 18 | 1 | 125 | 125 | 100.0% | |||||||||||||||||||||||||||||||||||||||||||||
| Ponderosa Resort | Lotus | CA | RV | 22 | — | 170 | 5 | 100.0% | |||||||||||||||||||||||||||||||||||||||||||||
| Turtle Beach (i) | Manteca | CA | RV | 39 | — | 79 | — | —% | |||||||||||||||||||||||||||||||||||||||||||||
| Marina Dunes RV Resort (d) | Marina | CA | RV | 6 | — | 96 | — | —% | |||||||||||||||||||||||||||||||||||||||||||||
| Coralwood (e) | Modesto | CA | MH | 22 | — | 194 | 194 | 100.0% | |||||||||||||||||||||||||||||||||||||||||||||
| Lake Minden | Nicolaus | CA | RV | 165 | 82 | 323 | 6 | 100.0% | |||||||||||||||||||||||||||||||||||||||||||||
| Oceanside RV Resort (d) | Oceanside | CA | RV | 8 | — | 139 | — | —% | |||||||||||||||||||||||||||||||||||||||||||||
| Lake of the Springs | Oregon House | CA | RV | 954 | 507 | 541 | 20 | 100.0% | |||||||||||||||||||||||||||||||||||||||||||||
| Concord Cascade | Pacheco | CA | MH | 31 | — | 283 | 283 | 100.0% | |||||||||||||||||||||||||||||||||||||||||||||
| San Francisco RV | Pacifica | CA | RV | 12 | — | 122 | 1 | 100.0% | |||||||||||||||||||||||||||||||||||||||||||||
32
| Property | City | State | Property Type |
Acres
(a)
|
Developable
Acres
(b)
|
Total Number of Sites as of 12/31/23 | Total Number of Annual Sites as of 12/31/23 | Annual Site Occupancy as of 12/31/23 | |||||||||||||||||||||||||||||||||||||||||||||
| Quail Meadows | Riverbank | CA | MH | 20 | — | 146 | 146 | 100.0% | |||||||||||||||||||||||||||||||||||||||||||||
| California Hawaiian | San Jose | CA | MH | 50 | — | 418 | 418 | 100.0% | |||||||||||||||||||||||||||||||||||||||||||||
| Sunshadow | San Jose | CA | MH | 30 | — | 121 | 121 | 100.0% | |||||||||||||||||||||||||||||||||||||||||||||
| Village of the Four Seasons | San Jose | CA | MH | 30 | — | 271 | 271 | 99.6% | |||||||||||||||||||||||||||||||||||||||||||||
| Laguna Lake | San Luis Obispo | CA | MH | 100 | — | 300 | 300 | 100.0% | |||||||||||||||||||||||||||||||||||||||||||||
| Contempo Marin | San Rafael | CA | MH | 63 | 1 | 396 | 396 | 100.0% | |||||||||||||||||||||||||||||||||||||||||||||
| De Anza Santa Cruz | Santa Cruz | CA | MH | 30 | — | 198 | 198 | 99.5% | |||||||||||||||||||||||||||||||||||||||||||||
| Santa Cruz Ranch (d) | Scotts Valley | CA | RV | 7 | — | 106 | — | —% | |||||||||||||||||||||||||||||||||||||||||||||
| Royal Oaks | Visalia | CA | MH | 20 | — | 149 | 149 | 94.0% | |||||||||||||||||||||||||||||||||||||||||||||
| Pilot Knob RV Resort (d) | Winterhaven | CA | RV | 23 | — | 247 | — | —% | |||||||||||||||||||||||||||||||||||||||||||||
| Southern California: | |||||||||||||||||||||||||||||||||||||||||||||||||||||
| Soledad Canyon | Acton | CA | RV | 273 | — | 1,251 | 1 | 100.0% | |||||||||||||||||||||||||||||||||||||||||||||
| Los Ranchos | Apple Valley | CA | MH | 30 | — | 389 | 389 | 96.9% | |||||||||||||||||||||||||||||||||||||||||||||
| Date Palm Country Club (e) | Cathedral City | CA | MH | 232 | 3 | 538 | 538 | 99.1% | |||||||||||||||||||||||||||||||||||||||||||||
| Palm Springs Oasis RV Resort | Cathedral City | CA | RV | (g) | — | 140 | 31 | 100.0% | |||||||||||||||||||||||||||||||||||||||||||||
| Oakzanita Springs | Descanso | CA | RV | 145 | 5 | 146 | 24 | 100.0% | |||||||||||||||||||||||||||||||||||||||||||||
| Rancho Mesa | El Cajon | CA | MH | 20 | — | 158 | 158 | 99.4% | |||||||||||||||||||||||||||||||||||||||||||||
| Rancho Valley | El Cajon | CA | MH | 19 | — | 140 | 140 | 100.0% | |||||||||||||||||||||||||||||||||||||||||||||
| Royal Holiday | Hemet | CA | MH | 22 | — | 198 | 198 | 75.3% | |||||||||||||||||||||||||||||||||||||||||||||
| Idyllwild | Idyllwild-Pine Cove | CA | RV | 191 | — | 287 | 44 | 100.0% | |||||||||||||||||||||||||||||||||||||||||||||
| Pio Pico | Jamul | CA | RV | 176 | 10 | 512 | 66 | 100.0% | |||||||||||||||||||||||||||||||||||||||||||||
| Wilderness Lakes | Menifee | CA | RV | 73 | — | 529 | 44 | 100.0% | |||||||||||||||||||||||||||||||||||||||||||||
| Morgan Hill (d) | Morgan Hill | CA | RV | 69 | 6 | 339 | — | —% | |||||||||||||||||||||||||||||||||||||||||||||
| Pacific Dunes Ranch (d) | Oceana | CA | RV | 48 | — | 215 | — | —% | |||||||||||||||||||||||||||||||||||||||||||||
| San Benito | Paicines | CA | RV | 199 | 23 | 523 | 18 | 100.0% | |||||||||||||||||||||||||||||||||||||||||||||
| Palm Springs | Palm Desert | CA | RV | 35 | — | 401 | 15 | 100.0% | |||||||||||||||||||||||||||||||||||||||||||||
| Las Palmas Estates | Rialto | CA | MH | 18 | — | 136 | 136 | 100.0% | |||||||||||||||||||||||||||||||||||||||||||||
| Parque La Quinta | Rialto | CA | MH | 19 | — | 166 | 166 | 98.2% | |||||||||||||||||||||||||||||||||||||||||||||
| Rancho Oso (i) | Santa Barbara | CA | RV | 310 | 40 | 187 | — | —% | |||||||||||||||||||||||||||||||||||||||||||||
| Meadowbrook | Santee | CA | MH | 43 | — | 338 | 338 | 100.0% | |||||||||||||||||||||||||||||||||||||||||||||
| Lamplighter Village | Spring Valley | CA | MH | 32 | — | 270 | 270 | 100.0% | |||||||||||||||||||||||||||||||||||||||||||||
| Santiago Estates | Sylmar | CA | MH | 113 | 9 | 300 | 300 | 100.0% | |||||||||||||||||||||||||||||||||||||||||||||
| Total California Market | 4,973 | 717 | 13,440 | 6,248 | 98.4% | ||||||||||||||||||||||||||||||||||||||||||||||||
| Arizona: | |||||||||||||||||||||||||||||||||||||||||||||||||||||
| Apache East | Apache Junction | AZ | MH | 17 | — | 123 | 123 | 100.0% | |||||||||||||||||||||||||||||||||||||||||||||
| Countryside RV | Apache Junction | AZ | RV | 53 | — | 560 | 307 | 100.0% | |||||||||||||||||||||||||||||||||||||||||||||
| Denali Park | Apache Junction | AZ | MH | 33 | 5 | 162 | 162 | 99.4% | |||||||||||||||||||||||||||||||||||||||||||||
| Dolce Vita | Apache Junction | AZ | MH | 132 | 20 | 606 | 606 | 71.9% | |||||||||||||||||||||||||||||||||||||||||||||
| Golden Sun RV | Apache Junction | AZ | RV | 33 | — | 329 | 214 | 100.0% | |||||||||||||||||||||||||||||||||||||||||||||
33
| Property | City | State | Property Type |
Acres
(a)
|
Developable
Acres
(b)
|
Total Number of Sites as of 12/31/23 | Total Number of Annual Sites as of 12/31/23 | Annual Site Occupancy as of 12/31/23 | |||||||||||||||||||||||||||||||||||||||||||||
| Meridian RV Resort | Apache Junction | AZ | RV | 15 | — | 264 | 58 | 100.0% | |||||||||||||||||||||||||||||||||||||||||||||
| Valley Vista | Benson | AZ | RV | 6 | — | 145 | 4 | 100.0% | |||||||||||||||||||||||||||||||||||||||||||||
| Casita Verde | Casa Grande | AZ | RV | 14 | — | 192 | 93 | 100.0% | |||||||||||||||||||||||||||||||||||||||||||||
| Fiesta Grande | Casa Grande | AZ | RV | 77 | — | 767 | 541 | 100.0% | |||||||||||||||||||||||||||||||||||||||||||||
| Foothills West | Casa Grande | AZ | RV | 16 | — | 188 | 128 | 100.0% | |||||||||||||||||||||||||||||||||||||||||||||
| Sunshine Valley | Chandler | AZ | MH | 55 | — | 381 | 381 | 99.5% | |||||||||||||||||||||||||||||||||||||||||||||
| Verde Valley | Cottonwood | AZ | RV | 273 | 178 | 414 | 118 | 100.0% | |||||||||||||||||||||||||||||||||||||||||||||
| Casa del Sol East II | Glendale | AZ | MH | 29 | — | 239 | 239 | 97.1% | |||||||||||||||||||||||||||||||||||||||||||||
| Casa del Sol East III | Glendale | AZ | MH | 28 | — | 236 | 236 | 98.7% | |||||||||||||||||||||||||||||||||||||||||||||
| Palm Shadows | Glendale | AZ | MH | 33 | — | 293 | 293 | 93.5% | |||||||||||||||||||||||||||||||||||||||||||||
| Hacienda De Valencia | Mesa | AZ | MH | 51 | — | 363 | 363 | 99.2% | |||||||||||||||||||||||||||||||||||||||||||||
| Mesa Spirit | Mesa | AZ | RV | 90 | — | 1,600 | 838 | 100.0% | |||||||||||||||||||||||||||||||||||||||||||||
| Monte Vista Resort | Mesa | AZ | RV | 142 | — | 1,345 | 952 | 100.0% | |||||||||||||||||||||||||||||||||||||||||||||
| Seyenna Vistas | Mesa | AZ | MH | 60 | 4 | 407 | 407 | 98.3% | |||||||||||||||||||||||||||||||||||||||||||||
| The Highlands at Brentwood | Mesa | AZ | MH | 45 | — | 268 | 268 | 100.0% | |||||||||||||||||||||||||||||||||||||||||||||
| ViewPoint RV & Golf Resort | Mesa | AZ | RV | 332 | — | 2,414 | 1,993 | 100.0% | |||||||||||||||||||||||||||||||||||||||||||||
| Apollo Village | Peoria | AZ | MH | 29 | 3 | 238 | 238 | 95.4% | |||||||||||||||||||||||||||||||||||||||||||||
| Casa del Sol West | Peoria | AZ | MH | 31 | — | 245 | 245 | 96.7% | |||||||||||||||||||||||||||||||||||||||||||||
| Carefree Manor | Phoenix | AZ | MH | 16 | — | 130 | 130 | 97.7% | |||||||||||||||||||||||||||||||||||||||||||||
| Central Park | Phoenix | AZ | MH | 37 | — | 293 | 293 | 97.3% | |||||||||||||||||||||||||||||||||||||||||||||
| Desert Skies | Phoenix | AZ | MH | 24 | — | 166 | 166 | 98.8% | |||||||||||||||||||||||||||||||||||||||||||||
| Sunrise Heights | Phoenix | AZ | MH | 28 | — | 199 | 199 | 97.5% | |||||||||||||||||||||||||||||||||||||||||||||
| Whispering Palms | Phoenix | AZ | MH | 15 | — | 116 | 116 | 97.4% | |||||||||||||||||||||||||||||||||||||||||||||
| Desert Vista (d) | Salome | AZ | RV | 10 | — | 125 | — | —% | |||||||||||||||||||||||||||||||||||||||||||||
| Sedona Shadows | Sedona | AZ | MH | 48 | — | 210 | 210 | 93.8% | |||||||||||||||||||||||||||||||||||||||||||||
| Venture In | Show Low | AZ | RV | 26 | — | 389 | 270 | 100.0% | |||||||||||||||||||||||||||||||||||||||||||||
| Paradise | Sun City | AZ | RV | 80 | — | 950 | 778 | 100.0% | |||||||||||||||||||||||||||||||||||||||||||||
| The Meadows AZ | Tempe | AZ | MH | 60 | — | 390 | 390 | 97.7% | |||||||||||||||||||||||||||||||||||||||||||||
| Fairview Manor | Tucson | AZ | MH | 28 | — | 232 | 232 | 97.4% | |||||||||||||||||||||||||||||||||||||||||||||
| Voyager RV Resort | Tucson | AZ | RV | 35 | — | 1,801 | 1,098 | 100.0% | |||||||||||||||||||||||||||||||||||||||||||||
| The Crossing at Voyager (d) | Tucson | AZ | RV | 64 | 18 | 154 | — | —% | |||||||||||||||||||||||||||||||||||||||||||||
| Westpark | Wickenburg | AZ | MH | 48 | — | 269 | 269 | 86.2% | |||||||||||||||||||||||||||||||||||||||||||||
| Araby Acres | Yuma | AZ | RV | 25 | 3 | 337 | 257 | 100.0% | |||||||||||||||||||||||||||||||||||||||||||||
| Cactus Gardens | Yuma | AZ | RV | 43 | — | 430 | 228 | 100.0% | |||||||||||||||||||||||||||||||||||||||||||||
| Capri | Yuma | AZ | RV | 20 | — | 303 | 149 | 100.0% | |||||||||||||||||||||||||||||||||||||||||||||
| Desert Paradise | Yuma | AZ | RV | 26 | — | 260 | 84 | 100.0% | |||||||||||||||||||||||||||||||||||||||||||||
| Foothill Village | Yuma | AZ | RV | 18 | — | 180 | 17 | 100.0% | |||||||||||||||||||||||||||||||||||||||||||||
| Mesa Verde RV | Yuma | AZ | RV | 28 | — | 345 | 264 | 100.0% | |||||||||||||||||||||||||||||||||||||||||||||
| Suni Sands | Yuma | AZ | RV | 34 | — | 336 | 136 | 100.0% | |||||||||||||||||||||||||||||||||||||||||||||
| Total Arizona Market | 2,307 | 231 | 19,394 | 14,093 | 97.8% | ||||||||||||||||||||||||||||||||||||||||||||||||
34
| Property | City | State | Property Type |
Acres
(a)
|
Developable
Acres
(b)
|
Total Number of Sites as of 12/31/23 | Total Number of Annual Sites as of 12/31/23 | Annual Site Occupancy as of 12/31/23 | |||||||||||||||||||||||||||||||||||||||||||||
| Colorado: | |||||||||||||||||||||||||||||||||||||||||||||||||||||
| Hillcrest Village CO | Aurora | CO | MH | 72 | — | 602 | 602 | 99.8% | |||||||||||||||||||||||||||||||||||||||||||||
| Cimarron Village | Broomfield | CO | MH | 50 | — | 327 | 327 | 99.7% | |||||||||||||||||||||||||||||||||||||||||||||
| Holiday Village CO | Colorado Springs | CO | MH | 38 | — | 240 | 240 | 98.3% | |||||||||||||||||||||||||||||||||||||||||||||
| Bear Creek Village | Denver | CO | MH | 12 | — | 121 | 121 | 99.2% | |||||||||||||||||||||||||||||||||||||||||||||
| Holiday Hills Village | Denver | CO | MH | 99 | — | 736 | 736 | 98.2% | |||||||||||||||||||||||||||||||||||||||||||||
| Golden Terrace | Golden | CO | MH | 32 | — | 263 | 263 | 99.2% | |||||||||||||||||||||||||||||||||||||||||||||
| Golden Terrace South | Golden | CO | MH | 15 | — | 80 | 80 | 100.0% | |||||||||||||||||||||||||||||||||||||||||||||
| Golden Terrace South RV (d) | Golden | CO | RV | (g) | — | 80 | — | —% | |||||||||||||||||||||||||||||||||||||||||||||
| Golden Terrace West | Golden | CO | MH | 39 | — | 311 | 311 | 99.4% | |||||||||||||||||||||||||||||||||||||||||||||
| Blue Mesa Recreational Ranch (d) | Gunnison | CO | RV | — | — | 385 | — | —% | |||||||||||||||||||||||||||||||||||||||||||||
| Pueblo Grande | Pueblo | CO | MH | 33 | — | 250 | 250 | 97.6% | |||||||||||||||||||||||||||||||||||||||||||||
| Woodland Hills | Thornton | CO | MH | 55 | — | 434 | 434 | 99.8% | |||||||||||||||||||||||||||||||||||||||||||||
| Total Colorado Market | 445 | — | 3,829 | 3,364 | 99.1% | ||||||||||||||||||||||||||||||||||||||||||||||||
| Northeast: | |||||||||||||||||||||||||||||||||||||||||||||||||||||
| Stonegate Manor | North Windham | CT | MH | 114 | — | 372 | 372 | 91.7% | |||||||||||||||||||||||||||||||||||||||||||||
| Waterford Estates | Bear | DE | MH | 159 | 2 | 731 | 731 | 99.6% | |||||||||||||||||||||||||||||||||||||||||||||
| McNicol Place | Lewes | DE | MH | 25 | — | 93 | 93 | 100.0% | |||||||||||||||||||||||||||||||||||||||||||||
| Whispering Pines | Lewes | DE | MH | 67 | 2 | 393 | 393 | 99.7% | |||||||||||||||||||||||||||||||||||||||||||||
| Mariner's Cove | Millsboro | DE | MH | 101 | — | 375 | 375 | 99.2% | |||||||||||||||||||||||||||||||||||||||||||||
| Sweetbriar | Millsboro | DE | MH | 38 | — | 146 | 146 | 96.6% | |||||||||||||||||||||||||||||||||||||||||||||
| Aspen Meadows | Rehoboth Beach | DE | MH | 46 | — | 200 | 200 | 100.0% | |||||||||||||||||||||||||||||||||||||||||||||
| Camelot Meadows | Rehoboth Beach | DE | MH | 61 | — | 301 | 301 | 99.7% | |||||||||||||||||||||||||||||||||||||||||||||
| Gateway to Cape Cod | Rochester | MA | RV | 80 | 25 | 194 | 74 | 100.0% | |||||||||||||||||||||||||||||||||||||||||||||
| Hillcrest MA | Rockland | MA | MH | 19 | — | 79 | 79 | 91.1% | |||||||||||||||||||||||||||||||||||||||||||||
| The Glen | Rockland | MA | MH | 24 | — | 36 | 36 | 97.2% | |||||||||||||||||||||||||||||||||||||||||||||
| Old Chatham | South Dennis | MA | RV | 47 | — | 312 | 272 | 100.0% | |||||||||||||||||||||||||||||||||||||||||||||
| Sturbridge | Sturbridge | MA | RV | 223 | 125 | 155 | 96 | 100.0% | |||||||||||||||||||||||||||||||||||||||||||||
| Fernwood | Capitol Heights | MD | MH | 40 | 6 | 329 | 329 | 99.1% | |||||||||||||||||||||||||||||||||||||||||||||
| Williams Estates/Peppermint Woods | Middle River | MD | MH | 121 | — | 803 | 803 | 99.9% | |||||||||||||||||||||||||||||||||||||||||||||
| Mt. Desert Narrows (d) | Bar Harbor | ME | RV | 90 | 12 | 206 | — | —% | |||||||||||||||||||||||||||||||||||||||||||||
| Patten Pond | Ellsworth | ME | RV | 81 | 60 | 137 | 21 | 100.0% | |||||||||||||||||||||||||||||||||||||||||||||
| Pinehirst | Old Orchard Beach | ME | RV | 58 | — | 550 | 431 | 100.0% | |||||||||||||||||||||||||||||||||||||||||||||
| Narrows Too | Trenton | ME | RV | 42 | 8 | 207 | 29 | 100.0% | |||||||||||||||||||||||||||||||||||||||||||||
| Moody Beach | Wells | ME | RV | 48 | — | 274 | 117 | 100.0% | |||||||||||||||||||||||||||||||||||||||||||||
| Sandy Beach | Contoocook | NH | RV | 40 | — | 190 | 107 | 100.0% | |||||||||||||||||||||||||||||||||||||||||||||
| Pine Acres | Raymond | NH | RV | 100 | — | 421 | 248 | 100.0% | |||||||||||||||||||||||||||||||||||||||||||||
| Tuxbury Resort | South Hampton | NH | RV | 193 | 100 | 305 | 210 | 100.0% | |||||||||||||||||||||||||||||||||||||||||||||
| King Nummy | Cape May Court House | NJ | RV | 83 | — | 313 | 266 | 100.0% | |||||||||||||||||||||||||||||||||||||||||||||
| Acorn Campground | Green Creek | NJ | RV | 160 | 43 | 323 | 240 | 100.0% | |||||||||||||||||||||||||||||||||||||||||||||
35
| Property | City | State | Property Type |
Acres
(a)
|
Developable
Acres
(b)
|
Total Number of Sites as of 12/31/23 | Total Number of Annual Sites as of 12/31/23 | Annual Site Occupancy as of 12/31/23 | |||||||||||||||||||||||||||||||||||||||||||||
| Whippoorwill RV | Marmora | NJ | RV | 39 | — | 288 | 232 | 100.0% | |||||||||||||||||||||||||||||||||||||||||||||
| Mays Landing Resort | Mays Landing | NJ | RV | 18 | — | 168 | 96 | 100.0% | |||||||||||||||||||||||||||||||||||||||||||||
| Echo Farms | Ocean View | NJ | RV | 31 | — | 245 | 230 | 100.0% | |||||||||||||||||||||||||||||||||||||||||||||
| Lake and Shore | Ocean View | NJ | RV | 162 | — | 401 | 288 | 100.0% | |||||||||||||||||||||||||||||||||||||||||||||
| Pine Haven | Ocean View | NJ | RV | 97 | — | 629 | 559 | 100.0% | |||||||||||||||||||||||||||||||||||||||||||||
| Red Oak Shores (f) | Ocean View | NJ | RV | 155 | — | 223 | 205 | 100.0% | |||||||||||||||||||||||||||||||||||||||||||||
| Chestnut Lake | Port Republic | NJ | RV | 32 | — | 185 | 55 | 100.0% | |||||||||||||||||||||||||||||||||||||||||||||
| Sea Pines | Swainton | NJ | RV | 75 | 32 | 549 | 325 | 100.0% | |||||||||||||||||||||||||||||||||||||||||||||
| Pine Ridge at Crestwood | Whiting | NJ | MH | 188 | — | 1,035 | 1,035 | 91.3% | |||||||||||||||||||||||||||||||||||||||||||||
| Rondout Valley | Accord | NY | RV | 184 | 94 | 398 | 100 | 100.0% | |||||||||||||||||||||||||||||||||||||||||||||
| Alpine Lake RV Resort | Corinth | NY | RV | 200 | 54 | 500 | 386 | 100.0% | |||||||||||||||||||||||||||||||||||||||||||||
| Lake George Escape | Lake George | NY | RV | 178 | — | 576 | 135 | 100.0% | |||||||||||||||||||||||||||||||||||||||||||||
| The Woodlands | Lockport | NY | MH | 225 | 30 | 1,237 | 1,237 | 97.2% | |||||||||||||||||||||||||||||||||||||||||||||
| Greenwood Village | Manorville | NY | MH | 79 | — | 512 | 512 | 99.2% | |||||||||||||||||||||||||||||||||||||||||||||
| Brennan Beach | Pulaski | NY | RV | 201 | — | 1,377 | 1,234 | 100.0% | |||||||||||||||||||||||||||||||||||||||||||||
| Lake George Schroon Valley | Warrensburg | NY | RV | 151 | — | 151 | 104 | 100.0% | |||||||||||||||||||||||||||||||||||||||||||||
| Greenbriar Village | Bath | PA | MH | 63 | — | 319 | 319 | 96.2% | |||||||||||||||||||||||||||||||||||||||||||||
| Sun Valley | Bowmansville | PA | RV | 86 | 3 | 265 | 229 | 100.0% | |||||||||||||||||||||||||||||||||||||||||||||
| Green Acres | Breinigsville | PA | MH | 149 | — | 595 | 595 | 94.5% | |||||||||||||||||||||||||||||||||||||||||||||
| Gettysburg Farm | Dover | PA | RV | 124 | 62 | 265 | 88 | 100.0% | |||||||||||||||||||||||||||||||||||||||||||||
| Timothy Lake North | East Stroudsburg | PA | RV | 93 | — | 323 | 95 | 100.0% | |||||||||||||||||||||||||||||||||||||||||||||
| Timothy Lake South | East Stroudsburg | PA | RV | 65 | — | 327 | 137 | 100.0% | |||||||||||||||||||||||||||||||||||||||||||||
| Drummer Boy | Gettysburg | PA | RV | 89 | — | 465 | 256 | 100.0% | |||||||||||||||||||||||||||||||||||||||||||||
| Round Top | Gettysburg | PA | RV | 52 | — | 391 | 239 | 100.0% | |||||||||||||||||||||||||||||||||||||||||||||
| Circle M | Lancaster | PA | RV | 103 | 7 | 426 | 107 | 100.0% | |||||||||||||||||||||||||||||||||||||||||||||
| Hershey | Lebanon | PA | RV | 196 | 20 | 297 | 69 | 100.0% | |||||||||||||||||||||||||||||||||||||||||||||
| Robin Hill | Lenhartsville | PA | RV | 44 | 4 | 270 | 149 | 100.0% | |||||||||||||||||||||||||||||||||||||||||||||
| PA Dutch County | Manheim | PA | RV | 102 | 55 | 269 | 94 | 100.0% | |||||||||||||||||||||||||||||||||||||||||||||
| Spring Gulch | New Holland | PA | RV | 114 | 27 | 420 | 161 | 100.0% | |||||||||||||||||||||||||||||||||||||||||||||
| Lil Wolf | Orefield | PA | MH | 56 | — | 269 | 269 | 95.5% | |||||||||||||||||||||||||||||||||||||||||||||
| Scotrun | Scotrun | PA | RV | 63 | 6 | 178 | 119 | 100.0% | |||||||||||||||||||||||||||||||||||||||||||||
| Appalachian RV | Shartlesville | PA | RV | 86 | 30 | 358 | 214 | 100.0% | |||||||||||||||||||||||||||||||||||||||||||||
| Mountain View - PA | Walnutport | PA | MH | 45 | 1 | 187 | 187 | 94.1% | |||||||||||||||||||||||||||||||||||||||||||||
| Timber Creek | Westerly | RI | RV | 108 | — | 364 | 352 | 100.0% | |||||||||||||||||||||||||||||||||||||||||||||
| Total Northeast Market | 5,713 | 808 | 21,907 | 16,381 | 98.5% | ||||||||||||||||||||||||||||||||||||||||||||||||
| Southeast: | |||||||||||||||||||||||||||||||||||||||||||||||||||||
| Hidden Cove | Arley | AL | RV | 99 | 34 | 163 | 94 | 100.0% | |||||||||||||||||||||||||||||||||||||||||||||
| Dale Hollow State Park Marina | Burkesville | KY | Marina | 33 | — | 198 | 198 | 100.0% | |||||||||||||||||||||||||||||||||||||||||||||
| Diamond Caverns | Park City | KY | RV | 714 | 218 | 220 | 28 | 100.0% | |||||||||||||||||||||||||||||||||||||||||||||
| Forest Lake | Advance | NC | RV | 306 | 20 | 394 | 209 | 100.0% | |||||||||||||||||||||||||||||||||||||||||||||
36
| Property | City | State | Property Type |
Acres
(a)
|
Developable
Acres
(b)
|
Total Number of Sites as of 12/31/23 | Total Number of Annual Sites as of 12/31/23 | Annual Site Occupancy as of 12/31/23 | |||||||||||||||||||||||||||||||||||||||||||||
| Scenic | Asheville | NC | MH | 28 | — | 212 | 212 | 90.6% | |||||||||||||||||||||||||||||||||||||||||||||
| Boathouse Marina | Beaufort | NC | Marina | 9 | — | 547 | 378 | 100.0% | |||||||||||||||||||||||||||||||||||||||||||||
| Waterway RV | Cedar Point | NC | RV | 27 | — | 336 | 336 | 100.0% | |||||||||||||||||||||||||||||||||||||||||||||
| Twin Lakes | Chocowinity | NC | RV | 132 | 11 | 419 | 393 | 100.0% | |||||||||||||||||||||||||||||||||||||||||||||
| Holiday Trav-L-Park Resort | Emerald Isle | NC | RV | 23 | — | 299 | 134 | 100.0% | |||||||||||||||||||||||||||||||||||||||||||||
| Topsail Sound RV | Holly Ridge | NC | RV | 34 | 7 | 230 | 214 | 100.0% | |||||||||||||||||||||||||||||||||||||||||||||
| Green Mountain | Lenoir | NC | RV | 1,077 | 3 | 447 | 174 | 100.0% | |||||||||||||||||||||||||||||||||||||||||||||
| Lake Gaston | Littleton | NC | RV | 69 | — | 235 | 204 | 100.0% | |||||||||||||||||||||||||||||||||||||||||||||
| Lake Myers RV | Mocksville | NC | RV | 74 | — | 425 | 269 | 100.0% | |||||||||||||||||||||||||||||||||||||||||||||
| Bogue Pines | Newport | NC | MH | 50 | — | 150 | 150 | 100.0% | |||||||||||||||||||||||||||||||||||||||||||||
| Goose Creek | Newport | NC | RV | 92 | — | 735 | 697 | 100.0% | |||||||||||||||||||||||||||||||||||||||||||||
| Whispering Pines - NC | Newport | NC | RV | 34 | — | 278 | 172 | 100.0% | |||||||||||||||||||||||||||||||||||||||||||||
| Harbor Point | Sneads Ferry | NC | RV | 46 | — | 203 | 130 | 100.0% | |||||||||||||||||||||||||||||||||||||||||||||
| White Oak Shores | Stella | NC | RV | 220 | 51 | 511 | 436 | 100.0% | |||||||||||||||||||||||||||||||||||||||||||||
| White Oak Shores | Stella | NC | Marina | — | — | 56 | 23 | 100.0% | |||||||||||||||||||||||||||||||||||||||||||||
| Carolina Landing | Fair Play | SC | RV | 73 | 30 | 192 | 73 | 100.0% | |||||||||||||||||||||||||||||||||||||||||||||
| Inlet Oaks Village | Murrells Inlet | SC | MH | 35 | — | 172 | 172 | 100.0% | |||||||||||||||||||||||||||||||||||||||||||||
| Myrtle Beach Property (h) | Myrtle Beach | SC | RV | 80 | — | 813 | — | —% | |||||||||||||||||||||||||||||||||||||||||||||
| Rivers Edge Marina | North Charleston | SC | Marina | 4 | — | 503 | 458 | 100.0% | |||||||||||||||||||||||||||||||||||||||||||||
| The Oaks | Yemassee | SC | RV | 10 | — | 93 | 22 | 100.0% | |||||||||||||||||||||||||||||||||||||||||||||
| Natchez Trace | Hohenwald | TN | RV | 672 | 339 | 537 | 211 | 100.0% | |||||||||||||||||||||||||||||||||||||||||||||
| Cherokee Landing | Saulsbury | TN | RV | 254 | 124 | 339 | 9 | 100.0% | |||||||||||||||||||||||||||||||||||||||||||||
| Meadows of Chantilly | Chantilly | VA | MH | 82 | — | 499 | 499 | 100.0% | |||||||||||||||||||||||||||||||||||||||||||||
| Harbor View | Colonial Beach | VA | RV | 69 | — | 146 | 45 | 100.0% | |||||||||||||||||||||||||||||||||||||||||||||
| Lynchburg | Gladys | VA | RV | 170 | 59 | 222 | 58 | 100.0% | |||||||||||||||||||||||||||||||||||||||||||||
| Chesapeake Bay | Gloucester | VA | RV | 282 | 80 | 392 | 149 | 100.0% | |||||||||||||||||||||||||||||||||||||||||||||
| Bayport Development (c) | Jamaica | VA | RV | 541 | 523 | — | — | —% | |||||||||||||||||||||||||||||||||||||||||||||
| Virginia Landing | Quinby | VA | RV | 863 | — | 233 | 16 | 100.0% | |||||||||||||||||||||||||||||||||||||||||||||
| Grey's Point Camp | Topping | VA | RV | 125 | 16 | 791 | 580 | 100.0% | |||||||||||||||||||||||||||||||||||||||||||||
| Bethpage Camp Resort | Urbanna | VA | RV | 271 | 81 | 1,285 | 823 | 100.0% | |||||||||||||||||||||||||||||||||||||||||||||
| Williamsburg | Williamsburg | VA | RV | 65 | 10 | 211 | 81 | 100.0% | |||||||||||||||||||||||||||||||||||||||||||||
| Regency Lakes | Winchester | VA | MH | 165 | — | 523 | 523 | 98.9% | |||||||||||||||||||||||||||||||||||||||||||||
| Total Southeast Market | 6,828 | 1,606 | 13,009 | 8,170 | 99.7% | ||||||||||||||||||||||||||||||||||||||||||||||||
| Midwest Market: | |||||||||||||||||||||||||||||||||||||||||||||||||||||
| O'Connell's Yogi Bear RV Resort | Amboy | IL | RV | 286 | 77 | 812 | 450 | 100.0% | |||||||||||||||||||||||||||||||||||||||||||||
| Pheasant Lake Estates | Beecher | IL | MH | 238 | 190 | 613 | 613 | 93.5% | |||||||||||||||||||||||||||||||||||||||||||||
| Pine Country | Belvidere | IL | RV | 131 | 10 | 185 | 147 | 100.0% | |||||||||||||||||||||||||||||||||||||||||||||
| Willow Lake Estates | Elgin | IL | MH | 111 | — | 616 | 616 | 91.6% | |||||||||||||||||||||||||||||||||||||||||||||
| Golf Vista Estates | Monee | IL | MH | 144 | — | 497 | 497 | 83.5% | |||||||||||||||||||||||||||||||||||||||||||||
| Indian Lakes | Batesville | IN | RV | 545 | 82 | 1,212 | 737 | 100.0% | |||||||||||||||||||||||||||||||||||||||||||||
37
| Property | City | State | Property Type |
Acres
(a)
|
Developable
Acres
(b)
|
Total Number of Sites as of 12/31/23 | Total Number of Annual Sites as of 12/31/23 | Annual Site Occupancy as of 12/31/23 | |||||||||||||||||||||||||||||||||||||||||||||
| Horseshoe Lakes | Clinton | IN | RV | 289 | 66 | 123 | 81 | 100.0% | |||||||||||||||||||||||||||||||||||||||||||||
| Twin Mills RV | Howe | IN | RV | 137 | 24 | 501 | 340 | 100.0% | |||||||||||||||||||||||||||||||||||||||||||||
| Lakeside RV | New Carlisle | IN | RV | 13 | — | 89 | 89 | 100.0% | |||||||||||||||||||||||||||||||||||||||||||||
| Bear Cave | Buchanan | MI | RV | 25 | 10 | 136 | 57 | 100.0% | |||||||||||||||||||||||||||||||||||||||||||||
| St Claire | Saint Claire | MI | RV | 210 | 100 | 229 | 122 | 100.0% | |||||||||||||||||||||||||||||||||||||||||||||
| Cedar Knolls | Apple Valley | MN | MH | 93 | — | 457 | 457 | 95.6% | |||||||||||||||||||||||||||||||||||||||||||||
| Cimarron Park | Lake Elmo | MN | MH | 230 | 46 | 505 | 505 | 86.1% | |||||||||||||||||||||||||||||||||||||||||||||
| Rockford Riverview Estates | Rockford | MN | MH | 88 | — | 428 | 428 | 97.9% | |||||||||||||||||||||||||||||||||||||||||||||
| Rosemount Woods | Rosemount | MN | MH | 50 | — | 221 | 221 | 80.1% | |||||||||||||||||||||||||||||||||||||||||||||
| Buena Vista | Fargo | ND | MH | 76 | — | 399 | 399 | 64.7% | |||||||||||||||||||||||||||||||||||||||||||||
| Meadow Park | Fargo | ND | MH | 17 | — | 116 | 116 | 58.6% | |||||||||||||||||||||||||||||||||||||||||||||
| Kenisee Lake | Jefferson | OH | RV | 143 | 50 | 119 | 84 | 100.0% | |||||||||||||||||||||||||||||||||||||||||||||
| Wilmington | Wilmington | OH | RV | 109 | 41 | 169 | 122 | 100.0% | |||||||||||||||||||||||||||||||||||||||||||||
| Rainbow Lake Manor | Bristol | WI | MH | 99 | 6 | 302 | 302 | 87.1% | |||||||||||||||||||||||||||||||||||||||||||||
| Fremont Jellystone Park Campground | Fremont | WI | RV | 98 | 5 | 325 | 121 | 100.0% | |||||||||||||||||||||||||||||||||||||||||||||
| Yukon Trails | Lyndon Station | WI | RV | 150 | 29 | 219 | 133 | 100.0% | |||||||||||||||||||||||||||||||||||||||||||||
| Blackhawk Camping Resort | Milton | WI | RV | 214 | 24 | 490 | 330 | 100.0% | |||||||||||||||||||||||||||||||||||||||||||||
| Lakeland | Milton | WI | RV | 107 | 5 | 682 | 431 | 100.0% | |||||||||||||||||||||||||||||||||||||||||||||
| Westwood Estates | Pleasant Prairie | WI | MH | 95 | — | 344 | 344 | 89.8% | |||||||||||||||||||||||||||||||||||||||||||||
| Plymouth Rock | Plymouth | WI | RV | 133 | 40 | 610 | 416 | 100.0% | |||||||||||||||||||||||||||||||||||||||||||||
| Tranquil Timbers | Sturgeon Bay | WI | RV | 125 | — | 270 | 188 | 100.0% | |||||||||||||||||||||||||||||||||||||||||||||
| Lake of the Woods RV | Wautoma | WI | RV | 117 | — | 303 | 110 | 100.0% | |||||||||||||||||||||||||||||||||||||||||||||
| Neshonoc Lakeside | West Salem | WI | RV | 48 | — | 284 | 179 | 100.0% | |||||||||||||||||||||||||||||||||||||||||||||
| Arrowhead Resort | Wisconsin Dells | WI | RV | 166 | 40 | 377 | 199 | 100.0% | |||||||||||||||||||||||||||||||||||||||||||||
| Bay Point Marina | Marblehead | OH | RV | 48 | 9 | 184 | 184 | 100.0% | |||||||||||||||||||||||||||||||||||||||||||||
| Bay Point Marina | Marblehead | OH | Marina | 179 | — | 660 | 630 | 100.0% | |||||||||||||||||||||||||||||||||||||||||||||
| Total Midwest Market | 4,514 | 854 | 12,477 | 9,648 | 94.0% | ||||||||||||||||||||||||||||||||||||||||||||||||
| Nevada, Utah and Idaho: | |||||||||||||||||||||||||||||||||||||||||||||||||||||
| Coach Royale | Boise | ID | MH | 12 | — | 91 | 91 | 100.0% | |||||||||||||||||||||||||||||||||||||||||||||
| Maple Grove | Boise | ID | MH | 38 | — | 271 | 271 | 99.3% | |||||||||||||||||||||||||||||||||||||||||||||
| Shenandoah Estates | Boise | ID | MH | 24 | — | 153 | 153 | 100.0% | |||||||||||||||||||||||||||||||||||||||||||||
| West Meadow Estates | Boise | ID | MH | 29 | — | 178 | 178 | 100.0% | |||||||||||||||||||||||||||||||||||||||||||||
| Mountain View - NV | Henderson | NV | MH | 72 | — | 354 | 354 | 100.0% | |||||||||||||||||||||||||||||||||||||||||||||
| Bonanza Village | Las Vegas | NV | MH | 43 | — | 353 | 353 | 60.9% | |||||||||||||||||||||||||||||||||||||||||||||
| Boulder Cascade | Las Vegas | NV | MH | 39 | — | 299 | 299 | 90.0% | |||||||||||||||||||||||||||||||||||||||||||||
| Cabana | Las Vegas | NV | MH | 37 | — | 263 | 263 | 98.1% | |||||||||||||||||||||||||||||||||||||||||||||
| Flamingo West | Las Vegas | NV | MH | 37 | — | 258 | 258 | 100.0% | |||||||||||||||||||||||||||||||||||||||||||||
| Las Vegas | Las Vegas | NV | RV | 11 | — | 217 | 18 | 100.0% | |||||||||||||||||||||||||||||||||||||||||||||
| Villa Borega | Las Vegas | NV | MH | 40 | — | 293 | 293 | 78.8% | |||||||||||||||||||||||||||||||||||||||||||||
38
| Property | City | State | Property Type |
Acres
(a)
|
Developable
Acres
(b)
|
Total Number of Sites as of 12/31/23 | Total Number of Annual Sites as of 12/31/23 | Annual Site Occupancy as of 12/31/23 | |||||||||||||||||||||||||||||||||||||||||||||
| Westwood Village | Farr West | UT | MH | 46 | — | 314 | 314 | 100.0% | |||||||||||||||||||||||||||||||||||||||||||||
| St George (d) | Hurricane | UT | RV | 26 | — | 149 | — | —% | |||||||||||||||||||||||||||||||||||||||||||||
| All Seasons | Salt Lake City | UT | MH | 19 | — | 121 | 121 | 100.0% | |||||||||||||||||||||||||||||||||||||||||||||
| Total Nevada, Utah and Idaho | 473 | — | 3,314 | 2,966 | 92.0% | ||||||||||||||||||||||||||||||||||||||||||||||||
| Northwest: | |||||||||||||||||||||||||||||||||||||||||||||||||||||
| Cultus Lake (Canada) (e) | Lindell Beach | BC | RV | 15 | — | 178 | 41 | 100.0% | |||||||||||||||||||||||||||||||||||||||||||||
| Bend | Bend | OR | RV | 289 | 116 | 351 | 31 | 100.0% | |||||||||||||||||||||||||||||||||||||||||||||
| Shadowbrook | Clackamas | OR | MH | 21 | — | 156 | 156 | 98.1% | |||||||||||||||||||||||||||||||||||||||||||||
| Pacific City | Cloverdale | OR | RV | 105 | 50 | 307 | 33 | 100.0% | |||||||||||||||||||||||||||||||||||||||||||||
| Falcon Wood Village | Eugene | OR | MH | 23 | — | 183 | 183 | 98.4% | |||||||||||||||||||||||||||||||||||||||||||||
| Portland Fairview | Fairview | OR | RV | 30 | — | 407 | 233 | 100.0% | |||||||||||||||||||||||||||||||||||||||||||||
| Quail Hollow (e) | Fairview | OR | MH | 21 | — | 137 | 137 | 100.0% | |||||||||||||||||||||||||||||||||||||||||||||
| South Jetty | Florence | OR | RV | 57 | 5 | 204 | 8 | 100.0% | |||||||||||||||||||||||||||||||||||||||||||||
| Seaside | Seaside | OR | RV | 80 | 7 | 251 | 44 | 100.0% | |||||||||||||||||||||||||||||||||||||||||||||
| Whalers Rest | South Beach | OR | RV | 39 | 5 | 170 | 26 | 100.0% | |||||||||||||||||||||||||||||||||||||||||||||
| Mt. Hood Village | Welches | OR | RV | 115 | — | 626 | 211 | 100.0% | |||||||||||||||||||||||||||||||||||||||||||||
| Hope Valley RV | Turner | OR | RV | 69 | 23 | 164 | 157 | 100.0% | |||||||||||||||||||||||||||||||||||||||||||||
| Birch Bay | Blaine | WA | RV | 31 | 7 | 246 | 17 | 100.0% | |||||||||||||||||||||||||||||||||||||||||||||
| Mount Vernon | Bow | WA | RV | 311 | — | 251 | 27 | 100.0% | |||||||||||||||||||||||||||||||||||||||||||||
| Chehalis | Chehalis | WA | RV | 309 | — | 360 | 20 | 100.0% | |||||||||||||||||||||||||||||||||||||||||||||
| Grandy Creek (d) | Concrete | WA | RV | 63 | — | 179 | — | —% | |||||||||||||||||||||||||||||||||||||||||||||
| Tall Chief (d) | Fall City | WA | RV | 71 | — | 180 | — | —% | |||||||||||||||||||||||||||||||||||||||||||||
| Kloshe Illahee | Federal Way | WA | MH | 50 | — | 258 | 258 | 100.0% | |||||||||||||||||||||||||||||||||||||||||||||
| La Conner (e) | La Conner | WA | RV | 106 | — | 319 | 34 | 100.0% | |||||||||||||||||||||||||||||||||||||||||||||
| Leavenworth | Leavenworth | WA | RV | 255 | 30 | 266 | 5 | 100.0% | |||||||||||||||||||||||||||||||||||||||||||||
| Thunderbird Resort | Monroe | WA | RV | 45 | 6 | 136 | 12 | 100.0% | |||||||||||||||||||||||||||||||||||||||||||||
| Little Diamond | Newport | WA | RV | 360 | 30 | 520 | 2 | 100.0% | |||||||||||||||||||||||||||||||||||||||||||||
| Oceana | Ocean City | WA | RV | 16 | 7 | 84 | 9 | 100.0% | |||||||||||||||||||||||||||||||||||||||||||||
| Crescent Bar | Quincy | WA | RV | 14 | — | 115 | 11 | 100.0% | |||||||||||||||||||||||||||||||||||||||||||||
| Long Beach | Seaview | WA | RV | 17 | 10 | 144 | 14 | 100.0% | |||||||||||||||||||||||||||||||||||||||||||||
| Paradise RV | Silver Creek | WA | RV | 60 | — | 265 | 3 | 100.0% | |||||||||||||||||||||||||||||||||||||||||||||
| Total Northwest | 2,572 | 296 | 6,457 | 1,672 | 99.6% | ||||||||||||||||||||||||||||||||||||||||||||||||
| Texas: | |||||||||||||||||||||||||||||||||||||||||||||||||||||
| Alamo Palms | Alamo | TX | RV | 58 | — | 643 | 291 | 100.0% | |||||||||||||||||||||||||||||||||||||||||||||
| Bay Landing | Bridgeport | TX | RV | 443 | 235 | 293 | 65 | 100.0% | |||||||||||||||||||||||||||||||||||||||||||||
| Colorado River | Columbus | TX | RV | 218 | 22 | 232 | 23 | 100.0% | |||||||||||||||||||||||||||||||||||||||||||||
| Victoria Palms | Donna | TX | RV | 117 | — | 1,122 | 472 | 100.0% | |||||||||||||||||||||||||||||||||||||||||||||
| Lake Texoma (e) | Gordonville | TX | RV | 201 | 87 | 430 | 83 | 100.0% | |||||||||||||||||||||||||||||||||||||||||||||
| Lakewood | Harlingen | TX | RV | 30 | — | 301 | 96 | 100.0% | |||||||||||||||||||||||||||||||||||||||||||||
39
| Property | City | State | Property Type |
Acres
(a)
|
Developable
Acres
(b)
|
Total Number of Sites as of 12/31/23 | Total Number of Annual Sites as of 12/31/23 | Annual Site Occupancy as of 12/31/23 | |||||||||||||||||||||||||||||||||||||||||||||
| Paradise Park | Harlingen | TX | RV | 60 | — | 563 | 264 | 100.0% | |||||||||||||||||||||||||||||||||||||||||||||
| Sunshine RV Resort | Harlingen | TX | RV | 84 | — | 1,027 | 358 | 100.0% | |||||||||||||||||||||||||||||||||||||||||||||
| Tropic Winds | Harlingen | TX | RV | 112 | 65 | 531 | 202 | 100.0% | |||||||||||||||||||||||||||||||||||||||||||||
| Medina Lake | Lakehills | TX | RV | 208 | 50 | 387 | 24 | 100.0% | |||||||||||||||||||||||||||||||||||||||||||||
| Paradise South | Mercedes | TX | RV | 49 | — | 493 | 174 | 100.0% | |||||||||||||||||||||||||||||||||||||||||||||
| Lake Tawakoni (e) | Point | TX | RV | 324 | 11 | 293 | 44 | 100.0% | |||||||||||||||||||||||||||||||||||||||||||||
| Fun N Sun RV | San Benito | TX | RV | 135 | 40 | 1,435 | 611 | 100.0% | |||||||||||||||||||||||||||||||||||||||||||||
| Country Sunshine | Weslaco | TX | RV | 37 | — | 390 | 151 | 100.0% | |||||||||||||||||||||||||||||||||||||||||||||
| Leisure World | Weslaco | TX | RV | 38 | — | 333 | 177 | 100.0% | |||||||||||||||||||||||||||||||||||||||||||||
| Southern Comfort | Weslaco | TX | RV | 40 | — | 403 | 313 | 100.0% | |||||||||||||||||||||||||||||||||||||||||||||
| Trails End RV | Weslaco | TX | RV | 43 | — | 362 | 236 | 100.0% | |||||||||||||||||||||||||||||||||||||||||||||
| Lake Whitney | Whitney | TX | RV | 403 | 158 | 261 | 20 | 100.0% | |||||||||||||||||||||||||||||||||||||||||||||
| Lake Conroe | Willis | TX | RV | 129 | — | 705 | 317 | 100.0% | |||||||||||||||||||||||||||||||||||||||||||||
| Lake Conroe RV Resort (d) | Montgomery | TX | RV | 130 | — | 261 | — | —% | |||||||||||||||||||||||||||||||||||||||||||||
| Total Texas | 2,859 | 668 | 10,465 | 3,921 | 100.0% | ||||||||||||||||||||||||||||||||||||||||||||||||
| Grand Total All Markets | 44,106 | 6,478 | 168,901 | 119,430 | 96.5% | ||||||||||||||||||||||||||||||||||||||||||||||||
____________________________________
(a)
Acres are approximate. For certain Properties, the acres were estimated based on 10 Sites per acre.
(b)
Acres are approximate. There can be no assurance that developable acres will be developed. Development is contingent on many factors including, but not limited to, cost, ability to subdivide, accessibility, infrastructure needs, zoning, entitlement and topography.
(c)
Development asset not included in the property count as there are no sites and the property is not operational.
(d)
Property did not have annual Sites for 2023.
(e)
Land has been leased to us under a non-cancelable operating lease, including one Loggerhead Marina Property (See Item 8. Financial Statements and Supplementary Data—Note 3. Leases).
(f)
Property acquired in 2023.
(g)
Acres for this community have been included in the acres of the adjacent community listed directly above this Property.
(h)
RV community operated by a tenant pursuant to an existing ground lease.
(i)
Property was closed temporarily due to storm and flooding events in 2023.
40
Item 3. Legal Proceedings
The description of legal proceedings is incorporated herein by reference from Item 8. Financial Statements and Supplementary Data—Note 16. Commitments and Contingencies in this Form 10-K.
Item 4. Mine Safety Disclosures
None.
41
PART II
Item 5. Market for Registrant's Common Equity, Related Stockholder Matters and Issuer Purchases of Equity Securities.
Our shares of common stock are traded on the NYSE under the symbol ELS. As of December 31, 2023, there were 293 holders of record for 186,426,281 outstanding shares of our common stock. Additionally, there were 9,104,654 OP Units outstanding, which are exchangeable for an equivalent number of shares of our common stock or, at our option, cash.
Issuer Purchases of Equity Securities
| Period | Total Number of Shares Purchased (a) | Weighted Average Price Paid per Share (a) | Total Number of Shares Purchased as Part of Publicly Announced Plans or Programs | Maximum Number of Shares that May Yet be Purchased Under the Plans or Programs | ||||||||||||||||||||||
| 1/1/2023-3/31/2023 | 28,408 | $ | 68.02 | None | None | |||||||||||||||||||||
| 4/1/2023-6/30/2023 | — | $ | — | None | None | |||||||||||||||||||||
| 7/1/2023-9/30/2023 | — | $ | — | None | None | |||||||||||||||||||||
| 10/1/2023-12/31/2023 | — | $ | — | None | None | |||||||||||||||||||||
| 1/1/2023-12/31/2023 | 28,408 | $ | 68.02 | None | None | |||||||||||||||||||||
(a) All shares were repurchased at the open market price and represent common stock surrendered to us to satisfy income tax withholding obligations due to the vesting of Restricted Share Grants. Certain of our executive officers and directors may from time to time adopt non-discretionary, written trading plans that comply with Securities and Exchange Commission Rule 10b5-1, or otherwise monetize their equity-based compensation. Securities and Exchange Commission Rule 10b5-1 provides executives with a method to monetize their equity-based compensation in an automatic and non-discretionary manner over time.
Dividends and Distributions
We distribute regular quarterly dividends to our stockholders. In order to maintain our qualification as a REIT, we are required, among other things, to distribute annually at least 90% of our REIT taxable income, determined without regard to the dividends paid deduction and any net capital gain. In addition, we intend to distribute all or substantially all of our net income so that we will generally not be subject to U.S. federal income tax on our earnings.
In general, our Board of Directors makes decisions regarding the nature, frequency and amount of our dividends on a quarterly basis. The Board considers many factors when making these decisions, including our present and future liquidity needs, our current and projected financial condition and results of operations. As such, there can be no assurance that we will maintain the practice of paying regular quarterly dividends to continue to qualify as a REIT. See Item 1A. Risk Factors in this Form 10-K for a description of factors that may affect our ability to distribute dividends.
Item 6. [Reserved]
42
Item 7. Management's Discussion and Analysis of Financial Condition and Results of Operations
The following discussion and analysis should be read in conjunction with the consolidated financial statements and accompanying footnotes thereto included in this Annual Report on Form 10-K.
2023 Accomplishments
We continued our strong performance in 2023, as marked by these key operational and financial accomplishments:
•
Net income per Common Share on a fully diluted basis was $1.69 for the year ended December 31, 2023, 10.5% higher than the year ended December 31, 2022.
•
FFO per Common Share on a fully diluted basis was $2.77 for the year ended December 31, 2023, 7.1% higher than the year ended December 31, 2022.
•
Normalized FFO per Common Share on a fully diluted basis was $2.75 for the year ended December 31, 2023, 4.7% higher than the year ended December 31, 2022.
•
Core portfolio generated growth of 5.0% in income from property operations, excluding property management, for the year ended December 31, 2023, compared to the year ended December 31, 2022.
•
Core MH base rental income increased by 6.8% during the year ended December 31, 2023, compared to the year ended December 31, 2022. During the year ended December 31, 2023, we filled 109 expansion sites in our Core MH portfolio.
•
Manufactured homeowners within our Core portfolio increased by 554 to 66,623 as of December 31, 2023, compared to 66,069 as of December 31, 2022.
•
Core RV and marina base rental income for the year ended December 31, 2023 increased by 3.5%, compared to the year ended December 31, 2022.
•
Core Annual RV and marina base rental income for the year ended December 31, 2023 increased by 8.1%, compared to the year ended December 31, 2022 and includes 7.6% growth from rate increases.
•
New home sales of 905 for the year ended December 31, 2023.
•
Acquired one RV community for a purchase price of $9.5 million during the year ended December 31, 2023.
•
Added 994 expansion sites during the year ended December 31, 2023.
•
During the year ended December 31, 2023, we closed on four secured financing transactions totaling $463.8 million. The loans have a weighted average fixed interest rate of 5.05% per annum and a weighted average maturity of approximately eight years.
Overview and Outlook
We are a self-administered and self-managed real estate investment trust (“REIT”) with headquarters in Chicago, Illinois. We are a fully integrated owner of lifestyle-oriented properties (“Properties”) consisting of property operations and home sales and rental operations primarily within manufactured home (“MH”) and recreational vehicle (“RV”) communities and marinas. As of December 31, 2023, we owned or had an ownership interest in a portfolio of 451 Properties located throughout the United States and Canada containing 172,465 individual developed areas (“Sites”). These Properties are located in 35 states and British Columbia, with more than 110 Properties with lake, river or ocean frontage and more than 120 Properties within 10 miles of the coastal United States.
We invest in properties in sought-after locations near retirement and vacation destinations and urban areas across the United States with a focus on delivering an exceptional experience to our residents and guests that results in delivery of value to stockholders. Our business model is intended to provide an opportunity for increased cash flows and appreciation in value. We seek growth in earnings, Funds from Operations (“FFO”) and cash flows by enhancing the profitability and operation of our Properties and investments. We accomplish this by attracting and retaining high quality customers to our Properties, who take pride in our Properties and in their homes and efficiently managing our Properties by increasing occupancy, maintaining competitive market rents and controlling expenses. We also actively pursue opportunities that fit our acquisition criteria and are currently engaged in various stages of negotiations relating to the possible acquisition of additional properties.
We believe the demand from baby boomers for MH and RV communities will continue to be strong over the long term. It is estimated that approximately 10,000 baby boomers are turning 65 daily through 2029. These individuals, seeking an active lifestyle, will continue to drive the market for second-home sales as vacation properties, investment opportunities or retirement retreats. We expect it is likely that over the next decade, we will continue to see high levels of second-home sales and that manufactured homes and cottages in our Properties will continue to provide a viable second-home alternative to site-built homes. We also believe the Millennial and Generation Z demographic will contribute to our future long-term customer pipeline.
43
Management's Discussion and Analysis (continued)
After conducting a comprehensive study of RV ownership, according to the Recreational Vehicle Industry Association (“RVIA”), data suggested that RV sales are expected to benefit from an increase in demand from those born in the United States from 1980 to 2003, or Millennials and Gen Z, over the coming years. We believe the demand from baby boomers and these younger generations will continue to outpace supply for MH and RV communities. The entitlement process to develop new MH and RV communities is extremely restrictive. As a result, there have been limited new communities developed in our target geographic markets.
We generate the majority of our revenues from customers renting our Sites or entering into right-to-use contracts, also known as membership subscriptions, which provide them access to specific Properties for limited stays. MH Sites are generally leased on an annual basis to residents who own or lease factory-built homes, including manufactured homes. Annual RV and marina Sites are leased on an annual basis to customers who generally have an RV, factory-built cottage, boat or other unit placed on the site, including those Northern properties that are open for the summer season. Seasonal RV and marina Sites are leased to customers generally for one to six months. Transient RV and marina Sites are leased to customers on a short-term basis. The revenue from seasonal and transient Sites is generally higher during the first and third quarters. We consider the transient revenue stream to be our most volatile as it is subject to weather conditions and other factors affecting the marginal RV customer's vacation and travel preferences. We also generate revenue from customers renting our marina dry storage. Additionally, we have interests in joint venture Properties for which revenue is classified as Equity in income from unconsolidated joint ventures on the Consolidated Statements of Income and Comprehensive Income.
Approximately one quarter of our rental agreements on MH Sites contain rent increase provisions that are directly or indirectly connected to the published CPI statistics issued from June through September of the year prior to the increase effective date. Approximately two-thirds of these rental agreements are subject to a CPI floor of approximately 3.0% to 5.0%.
State and local rent control regulations affect 28 wholly-owned Properties, including 14 of our 47 California Properties, all 7 of our Delaware Properties, 1 of our 2 Maryland Properties, 1 of our 5 Massachusetts Properties, 1 of our 11 New Jersey Properties, 1 of our 7 New York Properties and 3 of our 11 Oregon Properties. These rent control regulations govern rent increases and generally permit us to increase rates by a percentage of the increase in the national, regional or local CPI, depending on the rent control ordinance. These rate increases generally range from 60.0% to 100.0% of CPI with certain limits depending on the jurisdiction.
The following table shows the breakdown of our Sites by type (amounts are approximate):
| Total Sites as of | |||||
| December 31, 2023 | |||||
| MH Sites | 73,000 | ||||
| RV Sites: | |||||
| Annual | 34,900 | ||||
| Seasonal | 12,500 | ||||
| Transient | 15,600 | ||||
| Marina Slips | 6,900 | ||||
|
Membership
(1)
|
26,000 | ||||
|
Joint Ventures
(2)
|
3,600 | ||||
|
Total
(3)
|
172,500 | ||||
_____________________
(1)
Primarily utilized to service the approximately 121,000 members. Includes approximately 6,200 Sites rented on an annual basis.
(2)
Includes approximately 2,000 annual Sites and 1,600 transient Sites.
(3)
Total does not foot due to rounding.
Membership Sites are primarily utilized to service approximately 121,000 annual subscription members, including 23,600 free trial members added through our RV dealer program. The remaining 97,400 have purchased a Thousand Trails Camping (“TTC”) membership, which is an annual subscription providing the member access to our Properties in one to five geographic regions of the United States. In 2023, a TTC membership for a single geographic region required an annual payment of $670. In addition, members are eligible to upgrade their subscriptions. A membership upgrade may offer (1) increased length of consecutive stay; (2) the ability to make earlier advance reservations; (3) discounts on rental accommodations and (4) access to additional properties, including non-membership recreational vehicle ("RV") properties. Each membership upgrade requires a non-refundable upfront payment, for which we offer financing options to eligible customers. As a customer acquisition tool, we have relationships with a network of RV dealers to provide each new RV owner with a free one-year trial subscription to a TTC membership.
44
Management's Discussion and Analysis (continued)
In our Home Sales and Rentals Operations business, our revenue streams include home sales, home rentals and brokerage services and ancillary activities. We generate revenue through home sales and rental operations by selling or leasing manufactured homes and cottages that are located in Properties owned and managed by us. We believe renting our vacant homes represents an attractive source of occupancy and an opportunity to convert the renter to a homebuyer in the future. Additionally, home sale brokerage services are offered to our residents who may choose to sell their homes rather than relocate them when moving from a Property. At certain Properties, we operate ancillary facilities, such as golf courses, pro shops, stores and restaurants.
In the manufactured housing industry, options for home financing, also known as chattel financing, are limited. Chattel financing options available today include community owner-funded programs or third-party lender programs that provide subsidized financing to customers and often require the community owner to guarantee customer defaults. Third-party lender programs have stringent underwriting criteria, sizable down payment requirements, short term loan amortization and high interest rates. We have a limited program under which we purchase loans made by an unaffiliated lender to homebuyers at our Properties.
Under the existing administration, the Federal Housing Finance Agency (the “FHFA”), overseer of Fannie Mae, Freddie Mac (the “GSEs”) and the Federal Home Loan Banks, has focused on equitable access to affordable and sustainable housing. In 2017, the FHFA published the Underserved Markets Plans for 2018-2020 (the “GSE Plans”) under the Duty-To-Serve (“DTS”) provisions mandated by the Federal Housing Enterprises Financial Safety and Soundness Act of 1992, as amended by the Housing and Economic Recovery Act of 2008. The GSEs subsequently added a 2021 Plan as a one-year extension and have since published their current 2022-2024 Plans.
The FHFA mandate requires the GSE Plans to address leadership in developing loan products and flexible underwriting guidelines in underserved markets to facilitate a secondary market for mortgages on manufactured homes titled as real property or personal property, blanket loans for certain categories of manufactured housing communities, preserving the affordability of housing for renters and homebuyers, and housing in rural markets. While the FHFA and the current GSE 2022-24 DTS Plans may have a positive impact on the ability of our customers to obtain chattel financing, the actual impact on us, as well as the industry, cannot be determined at this time.
In addition to net income computed in accordance with U.S. Generally Accepted Accounting Principles (“GAAP”), we assess and measure our overall financial and operating performance using certain Non-GAAP supplemental measures, which include: (i) FFO, (ii) Normalized FFO, (iii) Income from property operations, (iv) Income from property operations, excluding property management, and (v) Core Portfolio income from property operations, excluding property management (operating results for Properties owned and operated in both periods under comparison). We use these measures internally to evaluate the operating performance of our portfolio and provide a basis for comparison with other real estate companies. Definitions and reconciliations of these measures to the most comparable GAAP measures are included below in this discussion.
Results Overview
For the year ended December 31, 2023, net income available for Common Stockholders increased $29.6 million, or $0.16 per fully diluted Common Share, to $314.2 million, or $1.69 per fully diluted Common Share, compared to $284.6 million, or $1.53 per fully diluted Common Share, for the same period in 2022. For the year ended December 31, 2023, FFO available for Common Stock and OP Unit holders increased $36.1 million, or $0.18 per fully diluted Common Share, to $541.2 million, or $2.77 per fully diluted Common Share, compared to $505.1 million, or $2.59 per fully diluted Common Share, for the same period in 2022. For the year ended December 31, 2023, Normalized FFO available for Common Stock and OP Unit holders increased $24.4 million, or $0.12 per fully diluted Common Share, to $537.5 million, or $2.75 per fully diluted Common Share, compared to $513.1 million, or $2.63 per fully diluted Common Share, for the same period in 2022.
Our Core Portfolio could change from time-to-time depending on acquisitions, dispositions and significant transactions or unique situations. Our Core Portfolio in 2023 and 2022 includes all Properties acquired prior to December 31, 2021 that we have owned and operated continuously since January 1, 2022. Our Non-Core Portfolio includes all Properties that were not owned and operated during all of 2022 and 2023, including six properties in Florida impacted by Hurricane Ian and two properties in California that were impacted by storm and flooding events.
For the year ended December 31, 2023, property operating revenues in our Core Portfolio, increased 5.8% and property operating expenses in our Core Portfolio, excluding property management, increased 7.0%, from the year ended December 31, 2022, resulting in an increase in income from property operations, excluding property management, of 5.0%.
While we continue to focus on increasing the number of manufactured homeowners in our Core Portfolio, we also believe renting our vacant homes represents an attractive source of occupancy and an opportunity to potentially convert the renter to a new homebuyer in the future. We continue to expect there to be fluctuations in the sources of occupancy gains
45
Management's Discussion and Analysis (continued)
depending on local market conditions, availability of vacant sites and success with converting renters to homeowners. Our Core Portfolio average occupancy, including both homeowners and renters, in our MH communities was 94.9% and 95.1% for the years ended December 31, 2023 and December 31, 2022, respectively. For the year ended December 31, 2023, our Core Portfolio occupancy increased by 5 sites with an increase in homeowner occupancy of 554 sites and a decrease in rental occupancy of 549. In addition to maintaining occupancy, we have experienced rental rate increases during the year ended December 31, 2023, which contributed to a growth of 6.8% in Core MH base rental income compared to the same period in 2022.
RV and marina base rental income in our Core Portfolio for the year ended December 31, 2023, was 3.5% higher than the same period in 2022 and was driven by an increase in annual and seasonal revenues. Core RV and marina base rental income from annuals represents more than 68.6% of total Core RV and marina base rental income and increased 8.1% for the year ended December 31, 2023 compared to the same period in 2022. Core seasonal RV and marina base rental income increased 2.6% for the year ended December 31, 2023 compared to the same period in 2022. Core transient RV and marina base rental income decreased 11.0% for the year ended December 31, 2023 compared to the same period in 2022.
We continue to experience strong performance in our membership base within our Thousand Trails portfolio. For the year ended December 31, 2023, annual membership subscriptions revenue increased 3.4% over the same period in 2022. During the year ended December 31, 2023, we sold 20,758 TTC memberships and activated 25,232 TTC memberships through our RV dealer program.
The following table provides additional details regarding our TTC memberships for the past five years:
| 2023 | 2022 | 2021 | 2020 | 2019 | ||||||||||||||||||||||||||||
| TTC Origination | 45,990 | 51,415 | 50,523 | 44,129 | 41,484 | |||||||||||||||||||||||||||
| TTC Sales | 20,758 | 23,237 | 23,923 | 20,587 | 19,267 | |||||||||||||||||||||||||||
| RV Dealer TTC Activations | 25,232 | 28,178 | 26,600 | 23,542 | 22,217 | |||||||||||||||||||||||||||
Demand for our homes and communities remains strong as evidenced by factors including our high occupancy levels. We closed 905 new home sales during the year ended December 31, 2023 compared to 1,176 new home sales during the year ended December 31, 2022. Our strategy of converting existing residents to home buyers continues to be successful with approximately 25% of our home sales during the year ended December 31, 2023 coming from individuals who already reside in our communities as an existing renter or homeowner.
Our gross investment in real estate increased $336.7 million to $7,706.3 million as of December 31, 2023, from $7,369.6 million as of December 31, 2022, primarily due to capital improvements during the year ended December 31, 2023.
46
Management's Discussion and Analysis (continued)
Property Acquisitions/Dispositions and Joint Ventures
The following chart lists the Properties acquired or sold from January 1, 2022 through December 31, 2023 and Sites added through expansion opportunities at our existing Properties.
| Location | Type of Property | Transaction Date | Sites | |||||||||||||||||||||||
|
Total Sites as of January 1, 2022
(1) (2)
|
169,300 | |||||||||||||||||||||||||
| Acquisition Properties: | ||||||||||||||||||||||||||
| Blue Mesa Recreational Ranch | Gunnison, Colorado | Membership | February 18, 2022 | 385 | ||||||||||||||||||||||
| Pilot Knob RV Resort | Winterhaven, California | RV | February 18, 2022 | 247 | ||||||||||||||||||||||
| Holiday Trav-L-Park Resort | Emerald Isle, North Carolina | RV | June 15, 2022 | 299 | ||||||||||||||||||||||
| Oceanside RV Resort | Oceanside, California | RV | June 16, 2022 | 139 | ||||||||||||||||||||||
| Hiawasee KOA JV | Hiawassee, Georgia | Unconsolidated JV | November 10, 2022 | 283 | ||||||||||||||||||||||
| Whippoorwill Campground | Marmora, New Jersey | RV | December 20, 2022 | 288 | ||||||||||||||||||||||
| Red Oak Shores Campground | Ocean View, New Jersey | RV | March 28, 2023 | 223 | ||||||||||||||||||||||
| Expansion Site Development: | ||||||||||||||||||||||||||
| Sites added (reconfigured) in 2022 | 1,034 | |||||||||||||||||||||||||
| Sites added (reconfigured) in 2023 | 994 | |||||||||||||||||||||||||
| Ground Lease Termination: | ||||||||||||||||||||||||||
| Westwinds | San Jose, California | MH | August 31, 2022 | (723) | ||||||||||||||||||||||
|
Total Sites as of December 31, 2023
(1) (2)
|
172,500 | |||||||||||||||||||||||||
_____________________
(1)
Includes the marina slips.
(2)
Sites are approximate.
Markets
The following table identifies our largest markets by number of Sites and provides information regarding our Properties (excluding fourteen Properties owned through our Joint Ventures).
| Major Market | Total Sites |
Number of
Properties |
Percent of
Total Sites |
Percent of Total
Property Operating Revenue |
||||||||||||||||||||||
| Florida | 64,609 | 151 | 38.3 | % | 45.3 | % | ||||||||||||||||||||
| Northeast | 21,907 | 59 | 13.0 | % | 11.3 | % | ||||||||||||||||||||
| Arizona | 19,394 | 44 | 11.5 | % | 10.4 | % | ||||||||||||||||||||
| California | 13,440 | 47 | 8.0 | % | 10.6 | % | ||||||||||||||||||||
| Southeast | 13,009 | 34 | 7.7 | % | 5.8 | % | ||||||||||||||||||||
| Midwest | 12,477 | 31 | 7.4 | % | 5.4 | % | ||||||||||||||||||||
| Texas | 10,465 | 20 | 6.2 | % | 2.6 | % | ||||||||||||||||||||
| Northwest | 6,457 | 26 | 3.8 | % | 3.0 | % | ||||||||||||||||||||
| Colorado | 3,829 | 11 | 2.3 | % | 3.3 | % | ||||||||||||||||||||
| Other | 3,314 | 14 | 2.0 | % | 2.3 | % | ||||||||||||||||||||
| Total | 168,901 | 437 | 100.0 | % | 100.0 | % | ||||||||||||||||||||
Qualification as a REIT
Commencing with our taxable year ended December 31, 1993, we have elected to be taxed as a REIT for U.S. federal income tax purposes. We believe we have met the requirements and have qualified for taxation as a REIT and we plan to continue to meet these requirements. The requirements for qualification as a REIT are highly technical and complex, as they pertain to the ownership of our outstanding stock, the nature of our assets, the sources of our income and the amount of our
47
Management's Discussion and Analysis (continued)
distributions to our stockholders. Examples include that at least 95% of our gross income must come from sources that are itemized in the REIT tax laws and at least 90% of our REIT taxable income, computed without regard to our deduction for dividends paid and our net capital gain, must be distributed to stockholders annually. If we fail to qualify as a REIT and are unable to correct such failure, we would be subject to U.S. federal income tax at regular corporate rates. Additionally, we could remain disqualified as a REIT for four years following the year we first failed to qualify. Even if we qualify for taxation as a REIT, we are subject to certain foreign, state and local taxes on our income and property and U.S. federal income and excise taxes on our undistributed income.
Non-GAAP Financial Measures
Management's discussion and analysis of financial condition and results of operations include certain Non-GAAP financial measures that in management's view of the business are meaningful as they allow investors the ability to understand key operating details of our business that may not always be indicative of recurring annual cash flow of the portfolio. These Non-GAAP financial measures as determined and presented by us may not be comparable to similarly titled measures reported by other companies and include income from property operations and Core Portfolio, FFO, and Normalized FFO.
We believe investors should review Income from property operations and Core Portfolio, FFO, and Normalized FFO, along with GAAP net income and cash flows from operating activities, investing activities and financing activities, when evaluating an equity REIT's operating performance. A discussion of Income from property operations and Core Portfolio, FFO, Normalized FFO and a reconciliation to net income, are included below.
Income from Property Operations and Core Portfolio
We use income from property operations, income from property operations, excluding property management and Core Portfolio income from property operations, excluding property management, as alternative measures to evaluate the operating results of our Properties. Income from property operations represents rental income, membership subscriptions and upgrade sales, utility and other income less property and rental home operating and maintenance expenses, real estate taxes, membership sales and marketing expenses and property management expenses. Income from property operations, excluding property management, represents income from property operations excluding property management expenses. Property management represents the expenses associated with indirect costs such as off-site payroll and certain administrative and professional expenses. We believe exclusion of property management expenses is helpful to investors and analysts as a measure of the operating results of our properties, excluding items that are not directly related to the operation of the properties. For comparative purposes, we present bad debt expense within Property operating and maintenance in the current and prior periods. We believe that this Non-GAAP financial measure is helpful to investors and analysts as a measure of the operating results of our properties.
Our Core Portfolio consists of our Properties owned and operated during all of 2022 and 2023. Core Portfolio income from property operations, excluding property management, is useful to investors for annual comparison as it removes the fluctuations associated with acquisitions, dispositions and significant transactions or unique situations. Our Non-Core Portfolio includes all Properties that were not owned and operated during all of 2022 and 2023, including six properties in Florida impacted by Hurricane Ian and two properties in California that were impacted by storm and flooding events.
Funds from Operations (
“
FFO
”
) and Normalized Funds from Operations (
“
Normalized FFO
”
)
We define FFO as net income, computed in accordance with GAAP, excluding gains or losses from sales of properties, depreciation and amortization related to real estate, impairment charges and adjustments to reflect our share of FFO of unconsolidated joint ventures. Adjustments for unconsolidated joint ventures are calculated to reflect FFO on the same basis. We compute FFO in accordance with our interpretation of standards established by the National Association of Real Estate Investment Trusts (“NAREIT”), which may not be comparable to FFO reported by other REITs that do not define the term in accordance with the current NAREIT definition or that interpret the current NAREIT definition differently than we do.
We believe FFO, as defined by the Board of Governors of NAREIT, is generally a measure of performance for an equity REIT. While FFO is a relevant and widely used measure of operating performance for equity REITs, it does not represent cash flow from operations or net income as defined by GAAP, and it should not be considered as an alternative to these indicators in evaluating liquidity or operating performance.
We define Normalized FFO as FFO excluding non-operating income and expense items, such as gains and losses from early debt extinguishment, including prepayment penalties, defeasance costs, transaction/pursuit costs, and other miscellaneous non-comparable items.
48
Management's Discussion and Analysis (continued)
We believe that FFO and Normalized FFO are helpful to investors as supplemental measures of the performance of an equity REIT. We believe that by excluding the effect of gains or losses from sales of properties, depreciation and amortization related to real estate and impairment charges, which are based on historical costs and may be of limited relevance in evaluating current performance, FFO can facilitate comparisons of operating performance between periods and among other equity REITs. We further believe that Normalized FFO provides useful information to investors, analysts and our management because it allows them to compare our operating performance to the operating performance of other real estate companies and between periods on a consistent basis without having to account for differences not related to our normal operations. For example, we believe that excluding the early extinguishment of debt and other miscellaneous non-comparable items from FFO allows investors, analysts and our management to assess the sustainability of operating performance in future periods because these costs do not affect the future operations of the properties. In some cases, we provide information about identified non-cash components of FFO and Normalized FFO because it allows investors, analysts and our management to assess the impact of those items.
Our definitions and calculations of these Non-GAAP financial and operating measures and other terms may differ from the definitions and methodologies used by other REITs and accordingly, may not be comparable. These Non-GAAP financial and operating measures do not represent cash generated from operating activities in accordance with GAAP, nor do they represent cash available to pay distributions and should not be considered as an alternative to net income, determined in accordance with GAAP, as an indication of our financial performance, or to cash flows from operating activities, determined in accordance with GAAP, as a measure of our liquidity, nor is it indicative of funds available to fund our cash needs, including our ability to make cash distributions.
The following table reconciles net income available for Common Stockholders to income from property operations for the years ended December 31, 2023, 2022 and 2021:
| Total Portfolio | ||||||||||||||||||||
|
(amounts in thousands)
|
2023 | 2022 | 2021 | |||||||||||||||||
| Computation of Income from Property Operations: | ||||||||||||||||||||
| Net income available for Common Stockholders | $ | 314,191 | $ | 284,611 | $ | 262,462 | ||||||||||||||
| Redeemable preferred stock dividends | 16 | 16 | 16 | |||||||||||||||||
| Income allocated to non-controlling interests – Common OP Units | 15,470 | 14,198 | 13,522 | |||||||||||||||||
| Consolidated net income | 329,677 | 298,825 | 276,000 | |||||||||||||||||
| Equity in income of unconsolidated joint ventures | (2,713) | (3,363) | (3,881) | |||||||||||||||||
| Income tax benefit | (10,488) | — | — | |||||||||||||||||
| (Gain)/Loss on sale of real estate and impairment, net | 3,581 | — | 59 | |||||||||||||||||
| Gross revenues from home sales, brokered resales and ancillary services | (145,219) | (180,179) | (152,517) | |||||||||||||||||
| Interest income | (9,037) | (7,430) | (7,016) | |||||||||||||||||
| Income from other investments, net | (8,703) | (8,553) | (4,555) | |||||||||||||||||
| Property management | 76,170 | 74,083 | 65,979 | |||||||||||||||||
| Depreciation and amortization | 203,738 | 202,362 | 188,444 | |||||||||||||||||
| Cost of home sales, brokered resales and ancillary services | 107,668 | 139,012 | 120,623 | |||||||||||||||||
| Home selling expenses and ancillary operating expenses | 27,453 | 27,321 | 23,538 | |||||||||||||||||
| General and administrative | 47,280 | 44,857 | 39,576 | |||||||||||||||||
| Casualty-related charges/(recoveries), net | — | — | — | |||||||||||||||||
| Other expenses | 5,768 | 8,646 | 4,241 | |||||||||||||||||
| Early debt retirement | 68 | 1,156 | 2,784 | |||||||||||||||||
| Interest and related amortization | 132,342 | 116,562 | 108,718 | |||||||||||||||||
| Income from property operations, excluding property management | $ | 757,585 | $ | 713,299 | $ | 661,993 | ||||||||||||||
| Property management | $ | (76,170) | $ | (74,083) | $ | (65,979) | ||||||||||||||
| Income from property operations | $ | 681,415 | $ | 639,216 | $ | 596,014 | ||||||||||||||
49
Management's Discussion and Analysis (continued)
The following table presents a calculation of FFO available for Common Stock and OP Unitholders and Normalized FFO available for Common Stock and OP Unitholders for the years ended December 31, 2023, 2022 and 2021:
| (amounts in thousands) | 2023 | 2022 | 2021 | ||||||||||||||
| Computation of FFO and Normalized FFO: | |||||||||||||||||
| Net income available for Common Stockholders | $ | 314,191 | $ | 284,611 | $ | 262,462 | |||||||||||
| Income allocated to non-controlling interests – Common OP Units | 15,470 | 14,198 | 13,522 | ||||||||||||||
| Depreciation and amortization | 203,738 | 202,362 | 188,444 | ||||||||||||||
| Depreciation on unconsolidated joint ventures | 4,599 | 3,886 | 1,083 | ||||||||||||||
| Gain on unconsolidated joint ventures | (416) | — | — | ||||||||||||||
| Loss on sale of real estate and impairment, net | 3,581 | — | 59 | ||||||||||||||
| FFO available for Common Stock and OP Unit holders | 541,163 | 505,057 | 465,570 | ||||||||||||||
|
Deferred tax benefit
(1)
|
(10,488) | — | — | ||||||||||||||
|
Accelerated vesting of stock-based compensation expense
(2)
|
6,320 | — | — | ||||||||||||||
| Early debt retirement | 68 | 1,156 | 2,784 | ||||||||||||||
|
Transaction/pursuit costs
(3)
|
368 | 3,807 | 598 | ||||||||||||||
|
Lease termination expenses
(4)
|
90 | 3,119 | — | ||||||||||||||
| Normalized FFO available for Common Stock and OP Unit holders | $ | 537,521 | $ | 513,139 | $ | 468,952 | |||||||||||
| Weighted average Common Shares outstanding—Fully Diluted | 195,429 | 195,255 | 192,883 | ||||||||||||||
_____________________
(1)
Represents the release of the valuation allowance of U.S. federal and state deferred tax assets related to our taxable REIT subsidiaries.
(2)
Represents accelerated vesting of stock-based compensation expense of $6.3 million recognized during the quarter ended June 30, 2023 as a result of the passing of a member of our Board of Directors.
(3)
Represents transaction/pursuit costs related to unconsummated acquisitions included in Other expenses in the Consolidated Statements of Income.
(4)
Represents non-operating expenses associated with the Westwinds ground leases that terminated on August 31, 2022 and is included in General and Administrative expenses in the Consolidated Statement of Income.
50
Management's Discussion and Analysis (continued)
Results of Operations
This section discusses the comparison of our results of operations for the years ended December 31, 2023 and December 31, 2022. Our Core Portfolio could change from time-to-time depending on acquisitions, dispositions and significant transactions or unique situations. Our Core Portfolio consists of our Properties owned and operated during all of 2022 and 2023. Our Non-Core Portfolio includes all Properties that were not owned and operated during all of 2022 and 2023, including six properties in Florida impacted by Hurricane Ian and two properties in California that were impacted by storm and flooding events. For the comparison of our results of operations for the years ended December 31, 2022 and December 31, 2021 and discussion of our operating activities, investing activities and financing activities for these years, refer to Part II, Item 7. Management’s Discussion and Analysis of Financial Condition and Results of Operations of the Annual Report on Form 10-K/A for the fiscal year ended December 31, 2022, filed with the SEC on January 22, 2024.
Income from Property Operations
The following table summarizes certain financial and statistical data for our Core Portfolio and total portfolio:
| Core Portfolio | Total Portfolio | ||||||||||||||||||||||||||||||||||||||||||||||
|
(amounts in thousands)
|
2023 | 2022 | Variance |
%
Change |
2023 | 2022 | Variance |
%
Change |
|||||||||||||||||||||||||||||||||||||||
|
MH base rental income
(1)
|
$ | 668,504 | $ | 625,986 | $ | 42,518 | 6.8 | % | $ | 669,127 | $ | 633,958 | $ | 35,169 | 5.5 | % | |||||||||||||||||||||||||||||||
|
Rental home income
(1)
|
14,580 | 15,199 | (619) | (4.1) | % | 14,626 | 15,244 | (618) | (4.1) | % | |||||||||||||||||||||||||||||||||||||
|
RV and marina base rental income
(1)
|
405,965 | 392,349 | 13,616 | 3.5 | % | 425,664 | 409,615 | 16,049 | 3.9 | % | |||||||||||||||||||||||||||||||||||||
| Annual membership subscriptions | 64,026 | 61,715 | 2,311 | 3.7 | % | 65,379 | 63,215 | 2,164 | 3.4 | % | |||||||||||||||||||||||||||||||||||||
|
Membership upgrades sales
(2)
|
13,946 | 11,584 | 2,362 | 20.4 | % | 14,719 | 12,958 | 1,761 | 13.6 | % | |||||||||||||||||||||||||||||||||||||
|
Utility and other income
(3)
|
120,486 | 109,534 | 10,952 | 10.0 | % | 141,178 | 120,750 | 20,428 | 16.9 | % | |||||||||||||||||||||||||||||||||||||
| Property operating revenues | 1,287,507 | 1,216,367 | 71,140 | 5.8 | % | 1,330,693 | 1,255,740 | 74,953 | 6.0 | % | |||||||||||||||||||||||||||||||||||||
|
Property operating and maintenance
(1)(3)
|
455,654 | 426,447 | 29,207 | 6.8 | % | 468,741 | 442,586 | 26,155 | 5.9 | % | |||||||||||||||||||||||||||||||||||||
| Real estate taxes | 75,744 | 69,417 | 6,327 | 9.1 | % | 77,993 | 74,145 | 3,848 | 5.2 | % | |||||||||||||||||||||||||||||||||||||
| Rental home operating and maintenance | 5,390 | 5,370 | 20 | 0.4 | % | 5,400 | 5,393 | 7 | 0.1 | % | |||||||||||||||||||||||||||||||||||||
|
Membership sales and marketing
(4)
|
20,734 | 19,653 | 1,081 | 5.5 | % | 20,974 | 20,317 | 657 | 3.2 | % | |||||||||||||||||||||||||||||||||||||
| Property operating expenses, excluding property management | 557,522 | 520,887 | 36,635 | 7.0 | % | 573,108 | 542,441 | 30,667 | 5.7 | % | |||||||||||||||||||||||||||||||||||||
|
Income from property operations, excluding property management
(5)
|
729,985 | 695,480 | 34,505 | 5.0 | % | 757,585 | 713,299 | 44,286 | 6.2 | % | |||||||||||||||||||||||||||||||||||||
| Property management | 76,170 | 74,082 | 2,088 | 2.8 | % | 76,170 | 74,083 | 2,087 | 2.8 | % | |||||||||||||||||||||||||||||||||||||
|
Income from property operations
(5)
|
$ | 653,815 | $ | 621,398 | $ | 32,417 | 5.2 | % | $ | 681,415 | $ | 639,216 | $ | 42,199 | 6.6 | % | |||||||||||||||||||||||||||||||
_____________________
(1)
Rental income consists of the following total portfolio income items in this table: 1) MH base rental income, 2) Rental home income, 3) RV and marina base rental income and 4) Utility income, which is calculated by subtracting Other income on the Consolidated Statements of Income and Comprehensive Income from Utility and other income in this table. The difference between the sum of the total portfolio income items and Rental income on the Consolidated Statements of Income and Comprehensive Income is bad debt expense, which is presented in Property operating and maintenance expense in this table.
(2)
Membership upgrade sales revenue is net of deferrals of $21.0 million and $21.7 million for the years ended December 31, 2023 and 2022, respectively.
(3)
Includes bad debt expense for all periods presented.
(4)
Membership sales and marketing expense is net of sales commission deferrals of $3.2 million for the years ended December 31, 2023 and 2022.
(5)
See Non-GAAP Financial Measures section of the Management's Discussion and Analysis for definitions and reconciliations of these Non-GAAP measures to Net Income available for Common Shareholders.
Total portfolio income from property operations for 2023 increased $42.2 million, or 6.6%, from 2022, driven by an increase of $32.4 million, or 5.2%, from our Core Portfolio and an increase of $9.8 million from our Non-Core Portfolio. The increase in income from property operations from our Core Portfolio was primarily due to higher property operating revenues, primarily in MH base rental income and RV and marina base rental income, partially offset by an increase in property operating expenses, excluding property management. The increase in income from property operations from our Non-Core Portfolio was attributed to income from properties acquired in the fourth quarter of 2022 and during the year ended December 31, 2023.
51
Management's Discussion and Analysis (continued)
Property Operating Revenues
MH base rental income in our Core Portfolio for 2023 increased $42.5 million, or 6.8%, from 2022, which was primarily due to growth from rate increases of 7.0%. The average monthly base rental income per Site in our Core portfolio increased to approximately $810 in 2023 from approximately $757 in 2022. The average occupancy in our Core Portfolio was 94.9% in 2023 and 95.1% in 2022.
RV and marina base rental income is comprised of the following:
| Core Portfolio | Total Portfolio | ||||||||||||||||||||||||||||||||||||||||||||||
| (amounts in thousands) | 2023 | 2022 | Variance | % Change | 2023 | 2022 | Variance | % Change | |||||||||||||||||||||||||||||||||||||||
| Annual | $ | 278,304 | $ | 257,375 | $ | 20,929 | 8.1 | % | $ | 291,524 | $ | 266,100 | $ | 25,424 | 9.6 | % | |||||||||||||||||||||||||||||||
| Seasonal | 56,568 | 55,122 | 1,446 | 2.6 | % | 58,535 | 58,874 | (339) | (0.6) | % | |||||||||||||||||||||||||||||||||||||
| Transient | 71,093 | 79,852 | (8,759) | (11.0) | % | 75,605 | 84,641 | (9,036) | (10.7) | % | |||||||||||||||||||||||||||||||||||||
| RV and marina base rental income | $ | 405,965 | $ | 392,349 | $ | 13,616 | 3.5 | % | $ | 425,664 | $ | 409,615 | $ | 16,049 | 3.9 | % | |||||||||||||||||||||||||||||||
Core Annual RV and marina base rental income increased during the year ended December 31, 2023, from the year ended December 31, 2022, across all regions and was due to growth from rate increases of 7.6% and 0.5% from occupancy gains. The increase in Core Seasonal RV and marina base rental income was driven by increases in the South and West regions. The decrease in Core Transient RV and marina base rental income was mainly a result of unfavorable weather patterns.
Utility and other income in our Core Portfolio for 2023 increased $11.0 million, or 10.0%, from 2022. The increase was primarily due to higher utility income of $5.8 million and an increase in other property income of $5.2 million. Utility income increased across all utility types.
Property Operating Expenses
Property operating expenses, excluding property management, in our Core Portfolio for 2023 increased $36.6 million, or 7.0%, from 2022, primarily due to increases in property operating and maintenance expenses of $29.2 million and real estate taxes of $6.3 million. Property operating and maintenance expenses were higher in 2023, primarily due to increases in utility expenses of $9.6 million, insurance of $8.5 million, repair and maintenance expenses of $8.1 million and property payroll expenses of $3.1 million.
Home Sales and Other
The following table summarizes certain financial and statistical data for our Home Sales and Other Operations:
| (amounts in thousands, except home sales volumes) | 2023 | 2022 | Variance | % Change | |||||||||||||||||||
| Gross revenue from new home sales | $ | 88,546 | $ | 116,790 | $ | (28,244) | (24.2) | % | |||||||||||||||
| Cost of new home sales | 78,427 | 104,684 | (26,257) | (25.1) | % | ||||||||||||||||||
| Gross revenue from used home sales | 3,872 | 4,401 | (529) | (12.0) | % | ||||||||||||||||||
| Cost of used home sales | 4,050 | 4,212 | (162) | (3.8) | % | ||||||||||||||||||
| Gross revenue from brokered resales and ancillary services | 52,801 | 58,988 | (6,187) | (10.5) | % | ||||||||||||||||||
| Cost of brokered resales and ancillary services | 25,191 | 30,116 | (4,925) | (16.4) | % | ||||||||||||||||||
| Home selling and ancillary operating expenses | 27,453 | 27,321 | 132 | 0.5 | % | ||||||||||||||||||
| Home sales volumes: | |||||||||||||||||||||||
| New home sales | 905 | 1,176 | (271) | (23.0) | % | ||||||||||||||||||
| Used home sales | 313 | 337 | (24) | (7.1) | % | ||||||||||||||||||
| Brokered home resales | 630 | 808 | (178) | (22.0) | % | ||||||||||||||||||
Gross revenue from new home sales decreased $28.2 million and Cost of new home sales decreased $26.3 million during the year ended December 31, 2023, compared to the year ended December 31, 2022, primarily due to a decrease in the number of new homes sold.
52
Management's Discussion and Analysis (continued)
Rental Operations
The following table summarizes certain financial and statistical data for our MH Rental Operations:
| (amounts in thousands, except rental unit volumes) | 2023 | 2022 | Variance | % Change | |||||||||||||||||||
|
Rental operations revenue
(1)
|
$ | 38,633 | $ | 42,871 | $ | (4,238) | (9.9) | % | |||||||||||||||
| Rental home operating and maintenance | 5,390 | 5,370 | 20 | 0.4 | % | ||||||||||||||||||
|
Depreciation on rental homes
(2)
|
10,881 | 10,060 | 821 | 8.2 | % | ||||||||||||||||||
| Gross investment in new manufactured home rental units | $ | 245,130 | $ | 237,932 | $ | 7,198 | 3.0 | % | |||||||||||||||
| Gross investment in used manufactured home rental units | $ | 12,245 | $ | 15,127 | $ | (2,882) | (19.1) | % | |||||||||||||||
| Net investment in new manufactured home rental units | $ | 203,936 | $ | 205,946 | $ | (2,010) | (1.0) | % | |||||||||||||||
| Net investment in used manufactured home rental units | $ | 7,372 | $ | 10,837 | $ | (3,465) | (32.0) | % | |||||||||||||||
| Number of occupied rentals – new, end of period | 2,016 | 2,481 | (465) | (18.7) | % | ||||||||||||||||||
| Number of occupied rentals—used, end of period | 246 | 330 | (84) | (25.5) | % | ||||||||||||||||||
_____________________
(1)
Consists of Site rental income and home rental income. Approximately $24.1 million and $27.7 million for the years ended December 31, 2023 and December 31, 2022, respectively, of Site rental income is included in MH base rental income in the Core Portfolio Income from Property Operations table. The remainder of home rental income is included in rental home income in our Core Portfolio Income from Property Operations table.
(2)
Presented in Depreciation and amortization in the Consolidated Statements of Income and Comprehensive Income.
Other Income and Expenses
The following table summarizes other income and expenses:
| (amounts in thousands, expenses shown as negative) | 2023 | 2022 | Variance | % Change | |||||||||||||||||||
| Depreciation and amortization | $ | (203,738) | $ | (202,362) | $ | (1,376) | (0.7) | % | |||||||||||||||
| Interest income | 9,037 | 7,430 | 1,607 | 21.6 | % | ||||||||||||||||||
| Income from other investments, net | 8,703 | 8,553 | 150 | 1.8 | % | ||||||||||||||||||
| General and administrative | (47,280) | (44,857) | (2,423) | (5.4) | % | ||||||||||||||||||
| Other expenses | (5,768) | (8,646) | 2,878 | 33.3 | % | ||||||||||||||||||
| Early debt retirement | (68) | (1,156) | 1,088 | 94.1 | % | ||||||||||||||||||
| Interest and related amortization | (132,342) | (116,562) | (15,780) | (13.5) | % | ||||||||||||||||||
| Total other income and expenses, net | $ | (371,456) | $ | (357,600) | $ | (13,856) | (3.9) | % | |||||||||||||||
Total other income and expenses, net increased $13.9 million in 2023 compared to 2022, primarily due to higher interest and related amortization expenses, general and administrative, depreciation and amortization. The increase in interest and related amortization is due to higher debt levels in 2023 compared to 2022. The increase in general and administrative expenses was primarily due to higher payroll and related benefits. The increase in depreciation and amortization was due to depreciation on Non-Core properties acquired throughout 2022 and 2023.
Casualty related charges/(recoveries), net
During the year ended December 31, 2023 and December 31, 2022, we recognized expenses of approximately $13.4 million and $40.6 million related to debris removal and cleanup costs related to Hurricane Ian and an offsetting insurance recovery revenue accrual of $13.4 million and $40.6 million, respectively, related to the expected insurance recovery as a result of Hurricane Ian, which is included in Casualty related charges/recoveries, net in the Consolidated Statements of Income and Comprehensive Income.
During the year ended December 31, 2023 and December 31, 2022, we received insurance proceeds of approximately $68.3 million and zero, respectively, of which $10.6 million and zero was identified as business interruption recovery revenue, respectively.
Loss on sale of real estate and impairment, net
During the year ended December 31, 2023, we recorded a $3.6 million reduction to the carrying value of certain assets, as a result of property damage caused by weather events in 2023.
During the year ended December 31, 2022, we recorded a $5.4 million reduction to the carrying value of certain assets as a result of property damage caused by Hurricane Ian and offsetting insurance recovery revenue of $5.4 million for the expected recovery from this loss.
53
Management's Discussion and Analysis (continued)
Income tax benefit
During the year ended December 31, 2023, we released the full valuation allowance of $10.5 million related to our taxable REIT subsidiaries deferred tax assets.
Liquidity and Capital Resources
Liquidity
Our primary demands for liquidity include payment of operating expenses, dividend distributions, debt service, including principal and interest, capital improvements on Properties, home purchases and property acquisitions. We expect similar demand for liquidity will continue for the short-term and long-term. Our primary sources of cash include operating cash flows, proceeds from financings, borrowings under our unsecured Line of Credit (“LOC”) and proceeds from issuance of equity and debt securities.
One of our stated objectives is to maintain financial flexibility. Achieving this objective allows us to take advantage of strategic opportunities that may arise. When investing capital, we consider all potential uses, including returning capital to our stockholders or the conditions under which we may repurchase our stock. These conditions include, but are not limited to, market price, balance sheet flexibility, alternative opportunistic capital uses and capital requirements. We believe effective management of our balance sheet, including maintaining various access points to raise capital, managing future debt maturities and borrowing at competitive rates, enables us to meet this objective. Accessing long-term secured debt continues to be our focus.
Total secured debt encumbered a total of 120 and 114 of our Properties as of December 31, 2023 and December 31, 2022, respectively, and the gross carrying value of such Properties was approximately $3,194.1 million and $2,868.3 million, as of December 31, 2023 and December 31, 2022, respectively.
We also utilize interest rate swaps to add stability to our interest expense and to manage our exposure to interest rate movements. Interest rate swaps designated as cash flow hedges involve the receipt of variable amounts from a counterparty in exchange for making fixed-rate payments over the life of the agreements without exchange of the underlying notional amount. The changes in the fair value of the designated derivative are recorded in accumulated other comprehensive income (loss) on the Consolidated Balance Sheets and subsequently reclassified into earnings on the Consolidated Statements of Income and Comprehensive Income in the period that the hedged forecasted transaction affects earnings.
We expect to meet our short-term liquidity requirements, including principal payments, capital improvements and dividend distributions for the next twelve months, generally through available cash, net cash provided by operating activities and our LOC. As of December 31, 2023, our LOC had a remaining borrowing capacity of $469.0 million with the option to increase the borrowing capacity by $200.0 million, subject to certain conditions. The LOC bears interest at a rate of Secured Overnight Financing Rate plus 1.25% to 1.65%, requires an annual facility fee of 0.20% to 0.35% and matures on April 18, 2025.
We expect to meet certain long-term liquidity requirements, such as scheduled debt maturities, property acquisitions and capital improvements, using long-term collateralized and uncollateralized borrowings including the existing LOC and the issuance of debt securities.
For information regarding our debt activities and related borrowing arrangements, see Item 8. Financial Statements and Supplementary Data—Note 9. Borrowing Arrangements.
By the end of February 2024, we anticipate entering into a new at-the-market (“ATM”) equity offering program, pursuant to which we may sell, from time-to-time, shares of our common stock, par value $0.01 per share, having an aggregate offering price of up to $500.0 million.
The following table summarizes our cash flows activity:
| For the years ended December 31, | ||||||||||||||||||||
|
(amounts in thousands)
|
2023 | 2022 | 2021 | |||||||||||||||||
| Net cash provided by operating activities | $ | 548,005 | $ | 475,814 | $ | 509,027 | ||||||||||||||
| Net cash used in investing activities | (324,753) | (402,067) | (828,430) | |||||||||||||||||
| Net cash (used in) provided by financing activities | (215,662) | (174,798) | 418,741 | |||||||||||||||||
| Net increase (decrease) in cash and restricted cash | $ | 7,590 | $ | (101,051) | $ | 99,338 | ||||||||||||||
54
Management's Discussion and Analysis (continued)
Operating Activities
Net cash provided by operating activities increased $72.2 million to $548.0 million for the year ended December 31, 2023, from $475.8 million for the year ended December 31, 2022. The overall increase in net cash provided by operating activities was primarily due to a net increase in proceeds from insurance claims and higher income from property operations partially offset by changes in accounts payable and other liabilities.
The following table summarizes our purchase and sale activity of manufactured homes:
| For the years ended December 31, | ||||||||||||||||||||
|
(amounts in thousands)
|
2023 | 2022 | 2021 | |||||||||||||||||
| Purchase of manufactured homes | $ | (106,627) | $ | (123,522) | $ | (86,025) | ||||||||||||||
| Sale of manufactured homes | 74,802 | 96,103 | 81,062 | |||||||||||||||||
| Manufactured homes, net | $ | (31,825) | $ | (27,419) | $ | (4,963) | ||||||||||||||
Investing Activities
Net cash used in investing activities decreased $77.3 million to $324.8 million for the year ended December 31, 2023, from $402.1 million for the year ended December 31, 2022. The decrease in net cash used in investing activities was primarily due to a decrease in acquisitions of $130.7 million, partially offset by an increase in capital improvements of $67.8 million.
Capital improvements
The following table summarizes capital improvements:
| For the years ended December 31, | ||||||||||||||||||||
| (amounts in thousands) | 2023 | 2022 | 2021 | |||||||||||||||||
|
Asset preservation
(1)
|
$ | 58,969 | $ | 46,406 | $ | 43,618 | ||||||||||||||
|
Improvements and renovations
(2)
|
40,757 | 34,121 | 26,887 | |||||||||||||||||
|
Property upgrades and development
(3)
|
183,174 | 134,318 | 120,209 | |||||||||||||||||
|
Site development
(4)
|
27,005 | 22,105 | 10,370 | |||||||||||||||||
| Total property improvements | 309,905 | 236,950 | 201,084 | |||||||||||||||||
| Corporate | 7,181 | 12,327 | 3,181 | |||||||||||||||||
| Total capital improvements | $ | 317,086 | $ | 249,277 | $ | 204,265 | ||||||||||||||
_____________________
(1)
Includes upkeep of property infrastructure including utilities and streets and replacement of community equipment and vehicles.
(2)
Includes enhancements to amenities such as buildings, common areas, swimming pools and replacement of furniture and site amenities.
(3)
Includes $34.3 million of restoration and improvement capital expenditures related to Hurricane Ian for the year ended December 31, 2023.
(4)
Includes capital expenditures to improve the infrastructure required to set manufactured homes.
Financing Activities
Net cash used in financing activities increased $40.9 million to $215.7 million for the year ended December 31, 2023, from $174.8 million for the year ended December 31, 2022. The increase in net cash used in financing activities was primarily due to increased dividend distributions of $31.6 million.
55
Management's Discussion and Analysis (continued)
Contractual Obligations
As of December 31, 2023, we were subject to certain contractual payment obligations
(1)
as described in the following table:
|
(amounts in thousands)
|
Total | 2024 | 2025 | 2026 | 2027 | 2028 | Thereafter | |||||||||||||||||||||||||||||||||||||
|
Long Term Borrowings
(2)
|
$ | 3,548,149 | $ | 64,445 | $ | 182,820 | $ | 366,784 | $ | 269,481 | $ | 243,963 | $ | 2,420,655 | ||||||||||||||||||||||||||||||
|
Interest Expense
(3)
|
955,555 | 129,044 | 123,930 | 116,468 | 102,513 | 97,896 | 385,704 | |||||||||||||||||||||||||||||||||||||
| LOC Maintenance Fee | 1,317 | 1,017 | 300 | — | — | — | — | |||||||||||||||||||||||||||||||||||||
|
Ground Leases
(4)
|
7,253 | 675 | 680 | 684 | 689 | 685 | 3,840 | |||||||||||||||||||||||||||||||||||||
| Office and Other Leases | 27,417 | 3,804 | 3,710 | 3,346 | 3,082 | 2,906 | 10,569 | |||||||||||||||||||||||||||||||||||||
| Total Contractual Obligations | $ | 4,539,691 | $ | 198,985 | $ | 311,440 | $ | 487,282 | $ | 375,765 | $ | 345,450 | $ | 2,820,768 | ||||||||||||||||||||||||||||||
| Weighted average interest rates - Long Term Borrowings | 3.79 | % | 3.71 | % | 3.70 | % | 3.83 | % | 3.80 | % | 3.80 | % | 3.83 | % | ||||||||||||||||||||||||||||||
_____________________
(1)
We do not include insurance, property taxes and cancellable contracts in the contractual obligations table.
(2)
Balances exclude unamortized deferred financing costs of $29.5 million. Balances represent debt maturing and scheduled periodic payments as well as our LOC balance of $31.0 million outstanding as of December 31, 2023, on the Consolidated Balance Sheets.
(3)
Amounts include interest expected to be incurred on our secured and unsecured debt based on obligations outstanding as of December 31, 2023.
(4)
Amounts represent minimum future rental payments for land under non-cancelable operating leases at certain of our Properties expiring at various years through 2054.
We believe that we will be able to refinance our maturing debt obligations on a secured or unsecured basis; however, to the extent we are unable to refinance our debt as it matures, we believe that we will be able to repay such maturing debt through available cash as well as operating cash flows, asset sales and/or the proceeds from equity issuances. With respect to any refinancing of maturing debt, our future cash flow requirements could be impacted by significant changes in interest rates or other debt terms, including required amortization payments. As of December 31, 2023, approximately 18.3% of our outstanding debt is fully amortizing.
Critical Accounting Policies and Estimates
Our consolidated financial statements have been prepared in accordance with GAAP, which requires us to make estimates and assumptions that affect the reported amounts of assets, liabilities, revenues and expenses and the related disclosures. Actual results could differ from these estimates.
For additional information regarding our significant accounting policies, see Item 8. Financial Statements and Supplementary Data—Note 2. Summary of Significant Accounting Policies.
Impairment of Long-Lived Assets
We review our Properties for impairment whenever events or changes in circumstances indicate that the carrying value of the Property may not be recoverable. The economic performance and value of our real estate investments could be adversely impacted by many factors including factors outside of our control. We consider impairment indicators including, but not limited to, the following:
•
national, regional and/or local economic conditions;
•
competition from MH and RV communities and other housing options;
•
changes in laws and governmental regulations and the related costs of compliance;
•
changes in market rental rates or occupancy; and
•
physical damage or environmental indicators.
Any adverse changes in these factors could cause an impairment in our assets, including our investment in real estate and development projects in progress.
If an impairment indicator exists related to a long-lived asset, the expected future undiscounted cash flows are compared against the carrying amount of that asset. Forecasting cash flows requires us to make estimates and assumptions on various inputs including, but not limited to, rental revenue and expense growth rates, occupancy, levels of capital expenditure and capitalization rates. If the sum of the estimated undiscounted cash flows is less than the carrying amount of the asset, an impairment loss is recorded for the carrying amount in excess of the estimated fair value.
56
Management's Discussion and Analysis (continued)
Off Balance Sheet Arrangements
We do not have any off balance sheet arrangements that are reasonably likely to have a material effect on our financial condition, results of operations, liquidity or capital resources.
Inflation
Substantially all of the leases at our MH communities allow for monthly or annual rent increases which provide us with the ability to increase rent, where justified by the market. Such types of leases generally minimize our risks of inflation. In addition, rental rates for our annual RV and marina Sites are established on an annual basis. Our membership subscriptions generally provide for an annual dues increase, but dues may be frozen under the terms of certain contracts if the customer is over 61 years old. Currently, approximately 20.0% of our dues are frozen.
Some of our costs, including operating and administrative expenses, interest expense and construction costs are subject to inflation. These expenses include but are not limited to property-related contracted services, utilities, repairs and maintenance and insurance and general and administrative costs, including compensation costs.
Item 7A. Quantitative and Qualitative Disclosures About Market Risk
Our primary market risk exposure is interest rate changes at the time we need to obtain new or refinance existing long-term debt that is used to maintain liquidity and fund our operations. Our interest rate risk management objectives are to limit the impact of increasing interest rates on earnings and cash flows. To achieve our objectives, we borrow primarily at fixed rates and in some cases variable rates. With regard to variable rate financing, we assess interest rate cash flow risk by identifying and monitoring changes in interest rate exposure that may adversely impact future cash flows and by evaluating hedging opportunities.
The fair value of our long-term debt obligations is affected by changes in market interest rates, however our scheduled maturities are well laddered from 2025 to 2041, which minimizes the market risk until the debt matures. As of December 31, 2023, we had no secured debt maturing in 2024. In addition, 18.3% of our outstanding debt is fully amortizing, further reducing the risk related to increased interest rates.
For each increase in interest rates of 1.0% (or 100 basis points), the fair value of the total outstanding debt would decrease by approximately $302.1 million. For each decrease in interest rates of 1.0% (or 100 basis points), the fair value of the total outstanding debt would increase by approximately $330.7 million. Our secured debt has fixed interest rates so interest expense and cash flows would not be affected by fluctuations in interest rates. The variable rate on our unsecured $200.0 million term loan is fixed through the utilization of an interest rate swap through maturity of the term loan, so interest expense and cash flows would not be affected by fluctuations in interest rates. The variable rate on our unsecured $300.0 million term loan is fixed through the utilization of an interest rate swap, which matures March 25, 2024. After the maturity of the interest rate swap, our unsecured $300.0 million term loan will bear interest at SOFR plus 1.40% to 1.95% per annum. Our line of credit bears interest at a rate of SOFR plus 1.25% to 1.65%.
57
FORWARD-LOOKING STATEMENTS
In addition to historical information, this report includes certain “forward-looking statements” within the meaning of the Private Securities Litigation Reform Act of 1995. When used, words such as “anticipate,” “expect,” “believe,” “project,” “intend,” “may be” and “will be” and similar words or phrases, or the negative thereof, unless the context requires otherwise, are intended to identify forward-looking statements and may include without limitation, information regarding our expectations, goals or intentions regarding the future and the expected effect of our acquisitions. These forward-looking statements are subject to numerous assumptions, risks and uncertainties, including, but not limited to:
•
our ability to control costs and real estate market conditions, our ability to retain customers, the actual use of Sites by customers and our success in acquiring new customers at our Properties (including those that we may acquire);
•
our ability to maintain historical or increase future rental rates and occupancy with respect to properties currently owned or that we may acquire;
•
our ability to attract and retain customers entering, renewing and upgrading membership subscriptions;
•
our assumptions about rental and home sales markets;
•
our ability to manage counterparty risk;
•
our ability to renew our insurance policies at existing rates and on consistent terms;
•
home sales results could be impacted by the ability of potential homebuyers to sell their existing residences as well as by financial, credit and capital markets volatility;
•
results from home sales and occupancy will continue to be impacted by local economic conditions, including an adequate supply of homes at reasonable costs, lack of affordable manufactured home financing and competition from alternative housing options including site-built single-family housing;
•
impact of government intervention to stabilize site-built single-family housing and not manufactured housing;
•
effective integration of recent acquisitions and our estimates regarding the future performance of recent acquisitions;
•
the completion of future transactions in their entirety, if any, and timing and effective integration with respect thereto;
•
unanticipated costs or unforeseen liabilities associated with recent acquisitions;
•
the effect of potential damage from natural disasters, including hurricanes and other weather-related events, which could result in substantial costs to our business;
•
our ability to obtain financing or refinance existing debt on favorable terms or at all;
•
the effect of inflation and interest rates;
•
the effect from any breach of our, or any of our vendors', data management systems;
•
the dilutive effects of issuing additional securities;
•
the potential impact of, and our ability to remediate, material weaknesses in our internal control over financial reporting;
•
the outcome of pending or future lawsuits or actions brought by or against us, including those disclosed in our filings with the Securities and Exchange Commission; and
•
other risks indicated from time to time in our filings with the Securities and Exchange Commission.
In addition, these forward-looking statements are subject to risks related to the COVID-19 pandemic, many of which are unknown, including the duration of the pandemic, the extent of the adverse health impact on the general population and on our residents, customers and employees in particular, its impact on the employment rate and the economy, the extent and impact of governmental responses and the impact of operational changes we have implemented and may implement in response to the pandemic.
These forward-looking statements are based on management's present expectations and beliefs about future events. As with any projection or forecast, these statements are inherently susceptible to uncertainty and changes in circumstances. We are under no obligation to, and expressly disclaim any obligation to, update or alter our forward-looking statements whether as a result of such changes, new information, subsequent events or otherwise.
58
Item 8.
Financial Statements and Supplementary Data
See Index to Consolidated Financial Statements and Schedule on page F-1 of this Form 10-K.
Item 9. Changes In and Disagreements with Accountants on Accounting and Financial Disclosure
None.
Item 9A. Controls and Procedures
Evaluation of Disclosure Controls and Procedures
Our management, with the participation of our Chief Executive Officer (principal executive officer) and Chief Financial Officer (principal financial officer), maintains a system of disclosure controls and procedures, designed to provide reasonable assurance that information we are required to disclose in the reports that we file under the Securities Exchange Act of 1934, as amended, is recorded, processed, summarized and reported within the time periods specified in the Securities and Exchange Commission rules and forms. Notwithstanding the foregoing, a control system, no matter how well designed and operated, can provide only reasonable, not absolute, assurance that we will detect or uncover failures to disclose material information otherwise required to be set forth in our periodic reports.
Our management, with the participation of the Chief Executive Officer and the Chief Financial Officer, has evaluated the effectiveness of our disclosure controls and procedures as of December 31, 2023. Based on that evaluation as of the end of the period covered by this annual report, our Chief Executive Officer and Chief Financial Officer concluded that our disclosure controls and procedures were effective to give reasonable assurances to the timely collection, evaluation and our disclosure of information that would potentially be subject to disclosure under the Securities Exchange Act of 1934, as amended, and the rules and regulations promulgated thereunder as of December 31, 2023.
Changes in Internal Control Over Financial Reporting
Other than the item noted below, there were no material changes in our internal control over financial reporting during the year ended December 31, 2023.
Report of Management on Internal Control Over Financial Reporting
Our management is responsible for establishing and maintaining adequate internal control over financial reporting as defined in Rules 13a-15(f) and 15d-15(f) under the Securities Exchange Act of 1934. Our internal control over financial reporting is designed to provide reasonable assurance regarding the reliability of financial reporting and the preparation of financial statements for external purposes in accordance with GAAP.
Because of its inherent limitations, internal control over financial reporting may not prevent or detect misstatements. Also, projections of any evaluation of effectiveness to future periods are subject to the risk that controls may become inadequate because of changes in conditions, or that the degree of compliance with the policies or procedures may deteriorate.
Based on management's assessment, we maintained, in all material respects, effective internal control over financial reporting as of December 31, 2023. In making this assessment, management used the criteria established by the Committee of Sponsoring Organizations of the Treadway Commission (“COSO”) in “
Internal Control-Integrated Framework
”
(2013 framework).
The effectiveness of our internal control over financial reporting as of December 31, 2023, has been audited by our independent registered public accounting firm, as stated in its report on page F-4.
Remediation of Material Weakness
As previously reported in our 2022 Annual Report on Form 10-K/A, management identified a material weakness related to the evaluation of the classification of cash flows pursuant to the predominance principle in ASC 230 associated with the purchase and sale of manufactured homes within the Consolidated Statement of Cash Flows. During the quarter ended June 30, 2023, we enhanced our control activities related to the evaluation of the classification of cash flows pursuant to the predominance principle in ASC 230 associated with the purchase and sale of manufactured homes within the Consolidated Statement of Cash Flows. We tested the enhanced control activities as of June 30, 2023 and September 30, 2023 and
59
management has concluded, through its testing, that the control was operating effectively and the material weakness was remediated as of September 30, 2023.
Item 9B. Other Information
None.
Item 9C. Disclosure Regarding Foreign Jurisdictions that Prevent Inspections
Not applicable.
60
PART III
Items 10 and 11. Directors, Executive Officers and Corporate Governance, and Executive Compensation
The information required by Items 10 and 11 will be contained in the Proxy Statement on Schedule 14A for the 2024 Annual Meeting and is therefore incorporated by reference, and thus Items 10 and 11 have been omitted in accordance with General Instruction G(3) to Form 10-K.
Item 12. Security Ownership of Certain Beneficial Owners and Management and Related Stockholder Matters
Securities Authorized for Issuance Under Equity Compensation Plans
The following table presents securities authorized for issuance under our equity compensation plans as of December 31, 2023:
| Plan Category |
Number of securities to
be Issued upon Exercise of Outstanding Options, Warrants and Rights (a) |
Weighted-average Exercise Price of Outstanding Options, Warrants and Rights | Number of Securities Remaining Available for Future Issuance under Equity Compensation Plans (excluding securities reflected in column (a)) | ||||||||||||||
|
Equity compensation plans approved by security holders
(1)
|
89,435 | $ | 56.18 | 5,135,450 | |||||||||||||
|
Equity compensation plans not approved by security holders
(2)
|
N/A | N/A | 644,579 | ||||||||||||||
| Total | 89,435 | $ | 56.18 | 5,780,029 | |||||||||||||
_____________________
(1)
Represents shares of common stock under our Equity Incentive Plan effective May 13, 2014 (the
“
2014 Plan
”
).
(2)
Represents shares of common stock under our Employee Stock Purchase Plan effective July 1997, as amended and restated in May 2016. Under the Employee Stock Purchase Plan, eligible employees may make contributions which are used to purchase shares of common stock at a purchase price equal to 85% of the lesser of the closing price of a share of common stock on the first or last trading day of the purchase period. Purchases of common stock under the Employee Stock Purchase Plan are made on the first business day of the next month after the close of the purchase period. Under NYSE rules then in effect, stockholder approval was not required for the Employee Stock Purchase Plan because it is a broad-based plan available generally to all employees.
The information required by Item 403 of Regulation S-K “Security Ownership of Certain Beneficial Owners and Management” required by Item 12 will be contained in the Proxy Statement on Schedule 14A for the 2024 Annual Meeting and is therefore incorporated by reference, and thus has been omitted in accordance with General Instruction G(3) to Form 10-K.
Items 13 and 14. Certain Relationships and Related Transactions, and Director Independence, and Principal Accounting Fees and Services
The information required by Items 13 and 14 will be contained in the Proxy Statement on Schedule 14A for the 2024 Annual Meeting and is therefore incorporated by reference, and thus Items 13 and 14 have been omitted in accordance with General Instruction G(3) to Form 10-K.
61
PART IV
Item 15. Exhibits, Financial Statements Schedules
1.
Financial Statements
See Index to Consolidated Financial Statements and Schedule on page F-1 of this Form 10-K.
2.
Financial Statement Schedule
See Index to Consolidated Financial Statements and Schedule on page F-1 of this Form 10-K.
3.
Exhibits:
In reviewing the agreements included as exhibits to this Form 10-K, please remember they are included to provide you with information regarding their terms and are not intended to provide any other factual or disclosure information about us or the other parties to the agreements. The agreements may contain representations and warranties by each of the parties to the applicable agreement. These representations and warranties have been made solely for the benefit of the other parties to the applicable agreement and:
•
should not in all instances be treated as categorical statements of fact, but rather as a way of allocating the risk to one of the parties if those statements prove to be inaccurate;
•
have been qualified by disclosures that were made to the other party in connection with the negotiation of the applicable agreement, which disclosures are not necessarily reflected in the agreement;
•
may apply standards of materiality in a way that is different from what may be viewed as material to you or other investors; and
•
were made only as of the date of the applicable agreement or such other date or dates as may be specified in the agreement and are subject to more recent developments.
Accordingly, these representations and warranties may not describe the actual state of affairs as of the date they were made or at any other time. Additional information about us may be found elsewhere in this Form 10-K and our other public filings, which are available without charge through the SEC's website at
http://www.sec.gov
.
|
3.1
(a)
|
|||||
|
3.2
(b)
|
|||||
|
3.3
(c)
|
|||||
|
3.4
(d)
|
|||||
|
3.5
(e)
|
|||||
|
3.6
(f)
|
|||||
|
4.1
(g)
|
|||||
|
4.2
*
|
|||||
|
10.1
(i)
|
|||||
|
10.2
(j)
|
|||||
|
10.3
(k)
|
|||||
|
10.4
(h)
|
|||||
|
10.5
(l)(+)
|
|||||
|
10.6
(m)(+)
|
|||||
|
10.7
(n)(+)
|
|||||
62
|
10.8
(o)
|
|||||
|
10.9
(o)
|
|||||
|
10.10
(p)(+)
|
|||||
|
10.11
(q)(+)
|
|||||
|
10.12
(q)(+)
|
|||||
|
14
(r)
|
|||||
|
21
*
|
|||||
|
23
*
|
|||||
|
31.1
*
|
|||||
|
31.2
*
|
|||||
|
32.1
*
|
|||||
|
32.2
*
|
|||||
|
97*
(+)
|
|||||
|
101.SCH
*
|
Inline XBRL Taxonomy Extension Schema Document | ||||
|
101.CAL
*
|
Inline XBRL Taxonomy Extension Calculation Linkbase Document | ||||
|
101.LAB
*
|
Inline XBRL Taxonomy Extension Label Linkbase Document | ||||
|
101.PRE
*
|
Inline XBRL Taxonomy Extension Presentation Linkbase Document | ||||
|
101.DEF
*
|
Inline XBRL Taxonomy Extension Definition Linkbase Document | ||||
| 104 | Cover Page Interactive Data File included as Exhibit 101 (embedded within the Inline XBRL document) | ||||
The following documents are incorporated by reference.
(a)
Included as an exhibit to our Report on Form 8-K filed May 22, 2007
(b)
Included as an exhibit to our Report on Form 8-K filed November 26, 2013
(c)
Included as an exhibit to our Report on Form 8-K filed May 2, 2019
(d)
Included as an exhibit to our Report on Form 8-K filed February 25, 2020
(e)
Included as an exhibit to our Report on Form 8-K filed May 4, 2020
(f)
Included as an exhibit to our Report on Form 8-K filed July 28, 2023
(g)
Included as an exhibit to our Report on Form S-3 Registration Statement dated May 6, 2009, file No. 333-159014
(h)
Included as an exhibit to our Report on Form 10-K for the year ended December 31, 2020
(i)
Included as an exhibit to our Report on Form 10-Q for the quarter ended June 30, 1996
(j)
Included as an exhibit to our Report on Form 10-K for the year ended December 31, 2005
(k)
Included as an exhibit to our Report on Form 8-K filed January 2, 2014
(l)
Included as Appendix B to our Definitive Proxy Statement dated March 24, 2014, relating to Annual Meeting of Stockholders held on May 13, 2014
(m)
Included as an exhibit to our Report on Form 10-Q for the quarter ended June 30, 2016
(n)
Included as an exhibit to our Report on Form 10-K for the year ended December 31, 2006
(o)
Included as an exhibit to our Report on Form 8-K filed April 23, 2021
(p)
Included as an exhibit to our Report on Form 10-Q/A for the quarter ended March 31, 2023
(q)
Included as an exhibit to our Report on Form 8-K filed May 13, 2014
(r)
Included as an exhibit to our Report on Form 10-K/A for the year ended December 31, 2022
* Filed herewith
(+)
Management contract or compensatory plan or arrangement.
63
Item 16. Form 10-K Summary
None.
64
SIGNATURES
Pursuant to the requirements of Section 13 or 15(d) of the Securities Exchange Act of 1934, as amended, the Registrant has duly caused this report to be signed on its behalf by the undersigned, thereunto duly authorized.
|
EQUITY LIFESTYLE PROPERTIES, INC.,
a Maryland corporation |
||||||||||||||
| Date: | February 21, 2024 | By: |
/s/ M
ARGUERITE
N
ADER
|
|||||||||||
| Marguerite Nader | ||||||||||||||
| President and Chief Executive Officer | ||||||||||||||
| (Principal Executive Officer) | ||||||||||||||
| Date: | February 21, 2024 | By: |
/s/ P
AUL
S
EAVEY
|
|||||||||||
| Paul Seavey | ||||||||||||||
|
Executive Vice President and Chief Financial
Officer |
||||||||||||||
| (Principal Financial Officer) | ||||||||||||||
| Date: | February 21, 2024 | By: |
/s/ V
ALERIE
H
ENRY
|
|||||||||||
| Valerie Henry | ||||||||||||||
| Senior Vice President and Chief Accounting Officer | ||||||||||||||
| (Principal Accounting Officer) | ||||||||||||||
65
Equity LifeStyle Properties, Inc.—Signatures
Pursuant to the requirements of the Securities Exchange Act of 1934, as amended, this report has been signed below by the following persons on behalf of the Registrant and in the capacities and on the dates indicated.
| Name | Title | Date | ||||||||||||
|
/s/ M
ARGUERITE
N
ADER
|
President, Chief Executive Officer and Director (Principal Executive Officer) | February 21, 2024 | ||||||||||||
| Marguerite Nader | ||||||||||||||
|
/s/ P
AUL
S
EAVEY
|
Executive Vice President and Chief Financial Officer (Principal Financial Officer) | February 21, 2024 | ||||||||||||
| Paul Seavey | ||||||||||||||
|
/s/ V
ALERIE
H
ENRY
|
Senior Vice President and Chief Accounting Officer (Principal Accounting Officer) | February 21, 2024 | ||||||||||||
| Valerie Henry | ||||||||||||||
|
/s/ T
HOMAS
H
ENEGHAN
|
Chairman of the Board | February 21, 2024 | ||||||||||||
| Thomas Heneghan | ||||||||||||||
|
/s/ A
NDREW
B
ERKENFIELD
|
Director | February 21, 2024 | ||||||||||||
| Andrew Berkenfield | ||||||||||||||
|
/s/ D
ERRICK
B
URKS
|
Director | February 21, 2024 | ||||||||||||
| Derrick Burks | ||||||||||||||
|
/s/ P
HILIP
C
ALIAN
|
Director | February 21, 2024 | ||||||||||||
| Philip Calian | ||||||||||||||
|
/s/ D
AVID
C
ONTIS
|
Director | February 21, 2024 | ||||||||||||
| David Contis | ||||||||||||||
|
/s/ C
ONSTANCE
F
REEDMAN
|
Director | February 21, 2024 | ||||||||||||
| Constance Freedman | ||||||||||||||
|
/s/
RADHIKA PAPANDREOU
|
Director | February 21, 2024 | ||||||||||||
| Radhika Papandreou | ||||||||||||||
|
/s/ S
COTT
P
EPPET
|
Director | February 21, 2024 | ||||||||||||
| Scott Peppet | ||||||||||||||
|
/s/ S
HELI
R
OSENBERG
|
Director | February 21, 2024 | ||||||||||||
| Sheli Rosenberg | ||||||||||||||
66
INDEX TO CONSOLIDATED FINANCIAL STATEMENTS AND SCHEDULE
EQUITY LIFESTYLE PROPERTIES, INC.
| Page | ||||||||
|
Reports of Independent Registered Public Accounting Firm (PCAOB ID:
|
F-
2
|
|||||||
|
Consolidated Balance Sheets as of December 31, 2023 and 2022
|
F-
5
|
|||||||
|
Consolidated Statements of Income and Comprehensive Income for the years ended December 31, 2023, 2022 and 2021
|
F-
6
|
|||||||
|
Consolidated Statements of Changes in Equity for the years ended December 31, 2023, 2022 and 2021
|
F-
8
|
|||||||
|
Consolidated Statements of Cash Flows for the years ended December 31, 2023, 2022 and 2021
|
F-
9
|
|||||||
|
Notes to Consolidated Financial Statements
|
F-
11
|
|||||||
|
Schedule III—Real Estate and Accumulated Depreciation
|
S-
1
|
|||||||
Note that certain schedules have been omitted, as they are not applicable to us.
F-1
Report of Independent Registered Public Accounting Firm
To the Stockholders and Board of Directors of Equity LifeStyle Properties, Inc.
Opinion on the Financial Statements
We have audited the accompanying consolidated balance sheets of Equity LifeStyle Properties, Inc. (the Company) as of December 31, 2023 and 2022, the related consolidated statements of income and comprehensive income, changes in equity and cash flows for each of the three years in the period ended December 31, 2023, and the related notes and financial statement schedule listed in the Index at Item 15 (collectively referred to as the consolidated financial statements). In our opinion, the consolidated financial statements present fairly, in all material respects, the financial position of the Company at December 31, 2023 and 2022, and the results of its operations and its cash flows for each of the three years in the period ended December 31, 2023, in conformity with U.S. generally accepted accounting principles.
We also have audited, in accordance with the standards of the Public Company Accounting Oversight Board (United States) (PCAOB), the Company's internal control over financial reporting as of December 31, 2023, based on criteria established in Internal Control-Integrated Framework issued by the Committee of Sponsoring Organizations of the Treadway Commission (2013 framework) and our report dated February 21, 2024 expressed an unqualified opinion thereon.
Basis for Opinion
These financial statements are the responsibility of the Company's management. Our responsibility is to express an opinion on the Company’s financial statements based on our audits. We are a public accounting firm registered with the PCAOB and are required to be independent with respect to the Company in accordance with the U.S. federal securities laws and the applicable rules and regulations of the Securities and Exchange Commission and the PCAOB.
We conducted our audits in accordance with the standards of the PCAOB. Those standards require that we plan and perform the audit to obtain reasonable assurance about whether the financial statements are free of material misstatement, whether due to error or fraud. Our audits included performing procedures to assess the risks of material misstatement of the financial statements, whether due to error or fraud, and performing procedures that respond to those risks. Such procedures included examining, on a test basis, evidence regarding the amounts and disclosures in the financial statements. Our audits also included evaluating the accounting principles used and significant estimates made by management, as well as evaluating the overall presentation of the financial statements. We believe that our audits provide a reasonable basis for our opinion.
Critical Audit Matter
The critical audit matter communicated below is a matter arising from the current period audit of the consolidated financial statements that was communicated or required to be communicated to the audit committee and that: (1) relates to accounts or disclosures that are material to the consolidated financial statements and (2) involved our especially challenging, subjective or complex judgments. The communication of the critical audit matter does not alter in any way our opinion on the consolidated financial statements, taken as a whole and we are not, by communicating the critical audit matter below, providing a separate opinion on the critical audit matter or on the accounts or disclosures to which it relates.
F-2
|
Impairment
of
Long-Lived
Assets
|
|||||
| Description of the Matter |
At December 31, 2023, the Company’s consolidated net investment in real estate totaled $5.3 billion. As discussed in Note 2 to the consolidated financial statements, the Company’s investment in real estate is reviewed for impairment quarterly or whenever events or changes in circumstances indicate a possible impairment. If an impairment indicator exists related to an investment in real estate that is held and used, the expected future undiscounted cash flows are compared against the carrying amount of that asset. If the sum of the estimated undiscounted cash flows is less than the carrying amount of the asset, an impairment loss is recorded for the excess, if any, of the carrying amount of the asset over its estimated fair value.
Auditing the Company’s evaluation of impairment of long-lived assets was complex and highly subjective. The determination of the undiscounted cash flows for properties where impairment indicators have been identified is sensitive to significant assumptions such as forecasted net operating income, and capitalization rates used to estimate the property’s residual value, both of which can be affected by expectations about future market conditions, customer demand, and competition. |
||||
| How We Addressed the Matter in Our Audit |
We obtained an understanding, evaluated the design, and tested the operating effectiveness of controls related to the Company’s process for evaluating impairment of long-lived assets, including controls over management’s review of the assumptions described above.
To test the Company’s process for evaluating impairment of long-lived assets, we performed audit procedures that included, among others, assessing the methodology used, evaluating the assumptions discussed above and testing the completeness and accuracy of the underlying data used by the Company in its analyses. We compared the significant assumptions used by the Company to historical operational results, current market data, and real estate industry publications. As part of our procedures, we also evaluated significant variances between the forecasted cash flows and historical actual results and performed sensitivity analyses of significant assumptions to evaluate the changes in the undiscounted cash flows that would result from changes in the assumptions used by management. |
||||
/s/
Ernst & Young LLP
We have served as the Company’s auditor since 1996.
February 21, 2024
F-3
Report of Independent Registered Public Accounting Firm
To the Stockholders and Board of Directors of Equity LifeStyle Properties, Inc.
Opinion on Internal Control Over Financial Reporting
We have audited Equity LifeStyle Properties, Inc.’s (the Company) internal control over financial reporting as of December 31, 2023, based on criteria established in Internal Control-Integrated Framework issued by the Committee of Sponsoring Organizations of the Treadway Commission (2013 framework) (the COSO criteria). In our opinion, the Company maintained, in all material respects, effective internal control over financial reporting as of December 31, 2023, based on the COSO criteria.
We also have audited, in accordance with the standards of the Public Company Accounting Oversight Board (United States) (PCAOB), the consolidated balance sheets of the Company as of December 31, 2023 and 2022, the related consolidated statements of income and comprehensive income, changes in equity, and cash flows for each of the three years in the period ended December 31, 2023, and the related notes and financial statement schedule listed in the Index at Item 15 and our report dated February 21, 2024 expressed an unqualified opinion thereon.
Basis for Opinion
The Company’s management is responsible for maintaining effective internal control over financial reporting and for its assessment of the effectiveness of internal control over financial reporting included in the accompanying Report of Management on Internal Control Over Financial Reporting. Our responsibility is to express an opinion on the Company’s internal control over financial reporting based on our audit. We are a public accounting firm registered with the PCAOB and are required to be independent with respect to the Company in accordance with the U.S. federal securities laws and the applicable rules and regulations of the Securities and Exchange Commission and the PCAOB.
We conducted our audit in accordance with the standards of the PCAOB. Those standards require that we plan and perform the audit to obtain reasonable assurance about whether effective internal control over financial reporting was maintained in all material respects.
Our audit included obtaining an understanding of internal control over financial reporting, assessing the risk that a material weakness exists, testing and evaluating the design and operating effectiveness of internal control based on the assessed risk, and performing such other procedures as we considered necessary in the circumstances. We believe that our audit provides a reasonable basis for our opinion.
Definition and Limitations of Internal Control Over Financial Reporting
A company’s internal control over financial reporting is a process designed to provide reasonable assurance regarding the reliability of financial reporting and the preparation of financial statements for external purposes in accordance with generally accepted accounting principles. A company’s internal control over financial reporting includes those policies and procedures that (1) pertain to the maintenance of records that, in reasonable detail, accurately and fairly reflect the transactions and dispositions of the assets of the company; (2) provide reasonable assurance that transactions are recorded as necessary to permit preparation of financial statements in accordance with generally accepted accounting principles, and that receipts and expenditures of the company are being made only in accordance with authorizations of management and directors of the company; and (3) provide reasonable assurance regarding prevention or timely detection of unauthorized acquisition, use, or disposition of the company’s assets that could have a material effect on the financial statements.
Because of its inherent limitations, internal control over financial reporting may not prevent or detect misstatements. Also, projections of any evaluation of effectiveness to future periods are subject to the risk that controls may become inadequate because of changes in conditions, or that the degree of compliance with the policies or procedures may deteriorate.
/s/ Ernst & Young LLP
Chicago, Illinois
February 21, 2024
F-4
Equity LifeStyle Properties, Inc.
Consolidated Balance Sheets
(amounts in thousands, except share and per share data)
| December 31, 2023 | December 31, 2022 | ||||||||||
| Assets | |||||||||||
| Investment in real estate: | |||||||||||
| Land | $ |
|
$ |
|
|||||||
| Land improvements |
|
|
|||||||||
| Buildings and other depreciable property |
|
|
|||||||||
|
|
|
||||||||||
| Accumulated depreciation |
(
|
(
|
|||||||||
| Net investment in real estate |
|
|
|||||||||
| Cash and restricted cash |
|
|
|||||||||
| Notes receivable, net |
|
|
|||||||||
| Investment in unconsolidated joint ventures |
|
|
|||||||||
| Deferred commission expense |
|
|
|||||||||
| Other assets, net |
|
|
|||||||||
| Total Assets | $ |
|
$ |
|
|||||||
| Liabilities and Equity | |||||||||||
| Liabilities: | |||||||||||
| Mortgage notes payable, net | $ |
|
$ |
|
|||||||
| Term loan, net |
|
|
|||||||||
| Unsecured line of credit |
|
|
|||||||||
| Accounts payable and other liabilities |
|
|
|||||||||
| Deferred membership revenue |
|
|
|||||||||
| Accrued interest payable |
|
|
|||||||||
| Rents and other customer payments received in advance and security deposits |
|
|
|||||||||
| Distributions payable |
|
|
|||||||||
| Total Liabilities |
|
|
|||||||||
| Equity: | |||||||||||
| Stockholders' Equity: | |||||||||||
|
Preferred stock, $
|
|
|
|||||||||
|
Common stock, $
|
|
|
|||||||||
| Paid-in capital |
|
|
|||||||||
| Distributions in excess of accumulated earnings |
(
|
(
|
|||||||||
| Accumulated other comprehensive income |
|
|
|||||||||
| Total Stockholders’ Equity |
|
|
|||||||||
| Non-controlling interests – Common OP Units |
|
|
|||||||||
| Total Equity |
|
|
|||||||||
| Total Liabilities and Equity | $ |
|
$ |
|
|||||||
The accompanying notes are an integral part of the consolidated financial statements.
F-5
Equity LifeStyle Properties, Inc.
Consolidated Statements of Income and Comprehensive Income
(amounts in thousands, except per share data)
| Years Ended December 31, | |||||||||||||||||
| 2023 | 2022 | 2021 | |||||||||||||||
| Revenues: | |||||||||||||||||
| Rental income | $ |
|
$ |
|
$ |
|
|||||||||||
| Annual membership subscriptions |
|
|
|
||||||||||||||
| Membership upgrade sales |
|
|
|
||||||||||||||
| Other income |
|
|
|
||||||||||||||
| Gross revenues from home sales, brokered resales and ancillary services |
|
|
|
||||||||||||||
| Interest income |
|
|
|
||||||||||||||
| Income from other investments, net |
|
|
|
||||||||||||||
| Total revenues |
|
|
|
||||||||||||||
| Expenses: | |||||||||||||||||
| Property operating and maintenance |
|
|
|
||||||||||||||
| Real estate taxes |
|
|
|
||||||||||||||
| Membership sales and marketing |
|
|
|
||||||||||||||
| Property management |
|
|
|
||||||||||||||
| Depreciation and amortization |
|
|
|
||||||||||||||
| Cost of home sales, brokered resales and ancillary sales |
|
|
|
||||||||||||||
| Home selling expenses and ancillary operating expenses |
|
|
|
||||||||||||||
| General and administrative |
|
|
|
||||||||||||||
| Casualty-related charges/(recoveries), net |
|
|
|
||||||||||||||
| Other expenses |
|
|
|
||||||||||||||
| Early debt retirement |
|
|
|
||||||||||||||
| Interest and related amortization |
|
|
|
||||||||||||||
| Total expenses |
|
|
|
||||||||||||||
| Income before income taxes and other items |
|
|
|
||||||||||||||
| Gain/(Loss) on sale of real estate and impairment, net |
(
|
|
(
|
||||||||||||||
| Income tax benefit |
|
|
|
||||||||||||||
| Equity in income of unconsolidated joint ventures |
|
|
|
||||||||||||||
| Consolidated net income |
|
|
|
||||||||||||||
| Income allocated to non-controlling interests – Common OP Units |
(
|
(
|
(
|
||||||||||||||
| Redeemable perpetual preferred stock dividends |
(
|
(
|
(
|
||||||||||||||
| Net income available for Common Stockholders | $ |
|
$ |
|
$ |
|
|||||||||||
| Consolidated net income | $ |
|
$ |
|
$ |
|
|||||||||||
| Other comprehensive income (loss): | |||||||||||||||||
| Adjustment for fair market value of swaps |
(
|
|
|
||||||||||||||
| Consolidated comprehensive income |
|
|
|
||||||||||||||
| Comprehensive income allocated to non-controlling interests – Common OP Units |
(
|
(
|
(
|
||||||||||||||
| Redeemable perpetual preferred stock dividends |
(
|
(
|
(
|
||||||||||||||
| Comprehensive income attributable to Common Stockholders | $ |
|
$ |
|
$ |
|
|||||||||||
The accompanying notes are an integral part of the consolidated financial statements.
F-6
Equity LifeStyle Properties, Inc.
Consolidated Statements of Income and Comprehensive Income
(amounts in thousands, except per share data)
| Years Ended December 31, | |||||||||||||||||
| 2023 | 2022 | 2021 | |||||||||||||||
| Earnings per Common Share – Basic | $ |
|
$ |
|
$ |
|
|||||||||||
| Earnings per Common Share – Fully Diluted | $ |
|
$ |
|
$ |
|
|||||||||||
| Weighted average Common Shares outstanding – Basic |
|
|
|
||||||||||||||
| Weighted average Common Shares outstanding – Fully Diluted |
|
|
|
||||||||||||||
The accompanying notes are an integral part of the consolidated financial statements.
F-7
Equity LifeStyle Properties, Inc.
Consolidated Statements of Changes In Equity
(amounts in thousands)
|
Common
Stock |
Paid-in
Capital |
Redeemable Perpetual Preferred Stock |
Distributions
in Excess of Accumulated Earnings |
Accumulated
Other Comprehensive Income (Loss) |
Non-
Controlling Interests – Common OP Units |
Total
Equity |
|||||||||||||||||||||||||||||||||||
| Balance as of December 31, 2020 | $ |
|
$ |
|
$ |
|
$ |
(
|
$ |
|
$ |
|
$ |
|
|||||||||||||||||||||||||||
| Exchange of Common OP Units for Common Stock |
|
|
— | — | — |
(
|
|
||||||||||||||||||||||||||||||||||
| Issuance of OP Units | — | — | — | — | — |
|
|
||||||||||||||||||||||||||||||||||
| Issuance of Common Stock through employee stock purchase plan | — |
|
— | — | — | — |
|
||||||||||||||||||||||||||||||||||
| Issuance of Common Stock |
|
|
— | — | — | — |
|
||||||||||||||||||||||||||||||||||
| Compensation expenses related to restricted stock and stock options | — |
|
— | — | — | — |
|
||||||||||||||||||||||||||||||||||
| Repurchase of Common Stock or Common OP Units | — |
(
|
— | — | — | — |
(
|
||||||||||||||||||||||||||||||||||
| Adjustment for Common OP Unitholders in the Operating Partnership | — |
|
— | — | — |
(
|
|
||||||||||||||||||||||||||||||||||
| Adjustment for fair market value of swap | — | — | — | — |
|
— |
|
||||||||||||||||||||||||||||||||||
| Consolidated net income | — | — |
|
|
— |
|
|
||||||||||||||||||||||||||||||||||
| Distributions | — | — |
(
|
(
|
— |
(
|
(
|
||||||||||||||||||||||||||||||||||
| Other | — |
(
|
— | — | — | — |
(
|
||||||||||||||||||||||||||||||||||
| Balance as of December 31, 2021 |
|
|
|
(
|
|
|
|
||||||||||||||||||||||||||||||||||
| Exchange of Common OP Units for Common Stock | — |
|
— | — | — |
(
|
|
||||||||||||||||||||||||||||||||||
| Issuance of Common Stock through employee stock purchase plan | — |
|
— | — | — | — |
|
||||||||||||||||||||||||||||||||||
| Issuance of Common Stock |
|
|
— | — | — | — |
|
||||||||||||||||||||||||||||||||||
| Compensation expenses related to restricted stock and stock options | — |
|
— | — | — | — |
|
||||||||||||||||||||||||||||||||||
| Repurchase of Common Stock or Common OP Units | — |
(
|
— | — | — | — |
(
|
||||||||||||||||||||||||||||||||||
| Adjustment for Common OP Unitholders in the Operating Partnership | — |
(
|
— | — | — |
|
|
||||||||||||||||||||||||||||||||||
| Adjustment for fair market value of swap | — | — | — | — |
|
— |
|
||||||||||||||||||||||||||||||||||
| Consolidated net income | — | — |
|
|
— |
|
|
||||||||||||||||||||||||||||||||||
| Distributions | — | — |
(
|
(
|
— |
(
|
(
|
||||||||||||||||||||||||||||||||||
| Other | — |
(
|
— | — | — | — |
(
|
||||||||||||||||||||||||||||||||||
| Balance as of December 31, 2022 |
|
|
|
(
|
|
|
|
||||||||||||||||||||||||||||||||||
| Exchange of Common OP Units for Common Stock |
|
|
— | — | — |
(
|
|
||||||||||||||||||||||||||||||||||
| Issuance of Common Stock through employee stock purchase plan | — |
|
— | — | — | — |
|
||||||||||||||||||||||||||||||||||
| Compensation expenses related to restricted stock and stock options | — |
|
— | — | — | — |
|
||||||||||||||||||||||||||||||||||
| Repurchase of Common Stock or Common OP Units | — |
(
|
— | — | — | — |
(
|
||||||||||||||||||||||||||||||||||
| Adjustment for Common OP Unitholders in the Operating Partnership | — |
(
|
— | — | — |
|
|
||||||||||||||||||||||||||||||||||
| Adjustment for fair market value of swap | — | — | — | — |
(
|
— |
(
|
||||||||||||||||||||||||||||||||||
| Consolidated net income | — | — |
|
|
— |
|
|
||||||||||||||||||||||||||||||||||
| Distributions | — | — |
(
|
(
|
— |
(
|
(
|
||||||||||||||||||||||||||||||||||
| Other | — |
(
|
— | — | — | — |
(
|
||||||||||||||||||||||||||||||||||
| Balance as of December 31, 2023 | $ |
|
$ |
|
$ |
|
$ |
(
|
$ |
|
$ |
|
$ |
|
|||||||||||||||||||||||||||
The accompanying notes are an integral part of the consolidated financial statements.
F-8
Equity LifeStyle Properties, Inc.
Consolidated Statements of Cash Flows
(amounts in thousands)
| Years Ended December 31, | |||||||||||||||||
| 2023 | 2022 | 2021 | |||||||||||||||
| Cash Flows From Operating Activities: | |||||||||||||||||
| Consolidated net income | $ |
|
$ |
|
$ |
|
|||||||||||
| Adjustments to reconcile consolidated net income to net cash provided by operating activities: | |||||||||||||||||
| Loss on sale of real estate and impairment, net |
|
|
|
||||||||||||||
| Early debt retirement |
|
|
|
||||||||||||||
| Depreciation and amortization |
|
|
|
||||||||||||||
| Amortization of loan costs |
|
|
|
||||||||||||||
| Debt premium amortization |
(
|
(
|
(
|
||||||||||||||
| Equity in income of unconsolidated joint ventures |
(
|
(
|
(
|
||||||||||||||
| Distributions of income from unconsolidated joint ventures |
|
|
|
||||||||||||||
| Proceeds from insurance claims, net |
|
(
|
(
|
||||||||||||||
| Compensation expense related to incentive plans |
|
|
|
||||||||||||||
| Revenue recognized from membership upgrade sales upfront payments |
(
|
(
|
(
|
||||||||||||||
| Commission expense recognized related to membership sales |
|
|
|
||||||||||||||
| Deferred income tax benefit |
(
|
|
|
||||||||||||||
| Changes in assets and liabilities: | |||||||||||||||||
| Manufactured homes, net |
(
|
(
|
(
|
||||||||||||||
| Notes receivable, net |
(
|
(
|
(
|
||||||||||||||
| Deferred commission expense |
(
|
(
|
(
|
||||||||||||||
| Other assets, net |
(
|
(
|
(
|
||||||||||||||
| Accounts payable and other liabilities |
(
|
|
|
||||||||||||||
| Deferred membership revenue |
|
|
|
||||||||||||||
| Rents and other customer payments received in advance and security deposits |
|
|
|
||||||||||||||
| Net cash provided by operating activities |
|
|
|
||||||||||||||
| Cash Flows From Investing Activities: | |||||||||||||||||
| Real estate acquisitions, net |
(
|
(
|
(
|
||||||||||||||
| Business acquisitions |
|
|
(
|
||||||||||||||
| Proceeds from disposition of properties, net |
|
|
(
|
||||||||||||||
| Investment in unconsolidated joint ventures |
(
|
(
|
(
|
||||||||||||||
| Distributions of capital from unconsolidated joint ventures |
|
|
|
||||||||||||||
| Proceeds from insurance claims, net |
|
(
|
|
||||||||||||||
| Capital improvements |
(
|
(
|
(
|
||||||||||||||
| Net cash used in investing activities |
(
|
(
|
(
|
||||||||||||||
| Cash Flows From Financing Activities: | |||||||||||||||||
| Proceeds from stock options and employee stock purchase plan |
|
|
|
||||||||||||||
| Gross proceeds from the issuance of common stock |
|
|
|
||||||||||||||
| Distributions: | |||||||||||||||||
| Common Stockholders |
(
|
(
|
(
|
||||||||||||||
| Common OP Unitholders |
(
|
(
|
(
|
||||||||||||||
| Preferred Stockholders |
(
|
(
|
(
|
||||||||||||||
| Share based award tax withholding payments |
(
|
(
|
(
|
||||||||||||||
| Principal payments and mortgage debt repayment |
(
|
(
|
(
|
||||||||||||||
| Mortgage notes payable financing proceeds |
|
|
|
||||||||||||||
| Term loan proceeds |
|
|
|
||||||||||||||
| Term loan repayment |
|
|
(
|
||||||||||||||
| Line of credit repayment |
(
|
(
|
(
|
||||||||||||||
| Line of credit proceeds |
|
|
|
||||||||||||||
| Debt issuance and defeasance costs |
(
|
(
|
(
|
||||||||||||||
| Other |
(
|
(
|
(
|
||||||||||||||
| Net cash (used in) provided by financing activities |
(
|
(
|
|
||||||||||||||
| Net increase (decrease) in cash and restricted cash |
|
(
|
|
||||||||||||||
| Cash and restricted cash, beginning of period |
|
|
|
||||||||||||||
| Cash and restricted cash, end of period | $ |
|
$ |
|
$ |
|
|||||||||||
The accompanying notes are an integral part of the consolidated financial statements.
F-9
Equity LifeStyle Properties, Inc.
Consolidated Statements of Cash Flows
(amounts in thousands)
| Years Ended December 31, | |||||||||||||||||
| 2023 | 2022 | 2021 | |||||||||||||||
| Supplemental information: | |||||||||||||||||
| Cash paid for interest, net | $ |
|
$ |
|
$ |
|
|||||||||||
| Cash paid for the purchase of manufactured homes | $ |
|
$ |
|
$ |
|
|||||||||||
| Real estate acquisitions: | |||||||||||||||||
| Investment in real estate | $ |
(
|
$ |
(
|
$ |
(
|
|||||||||||
| Notes receivable, net |
|
(
|
|
||||||||||||||
| Other assets, net |
|
|
(
|
||||||||||||||
| Debt assumed |
|
|
|
||||||||||||||
| Deferred membership revenue |
|
|
|
||||||||||||||
| Accounts payable and other liabilities |
|
|
|
||||||||||||||
| Rents and other customer payments received in advance and security deposits |
|
|
|
||||||||||||||
| OP Units issued |
|
|
|
||||||||||||||
| Real estate acquisitions, net | $ |
(
|
$ |
(
|
$ |
(
|
|||||||||||
| Business acquisitions: | |||||||||||||||||
| Intangibles | $ |
|
$ |
|
$ |
(
|
|||||||||||
| Goodwill |
|
|
(
|
||||||||||||||
| Other assets, net |
|
|
(
|
||||||||||||||
| Accounts payable and other liabilities |
|
|
|
||||||||||||||
| Acquisition of business, net | $ |
|
$ |
|
$ |
(
|
|||||||||||
| Real estate dispositions: | |||||||||||||||||
| Investment in real estate | $ |
|
$ |
|
$ |
|
|||||||||||
| Loss on sale of real estate, net |
|
|
(
|
||||||||||||||
| Real estate dispositions, net | $ |
|
$ |
|
$ |
(
|
|||||||||||
The accompanying notes are an integral part of the consolidated financial statements.
F-10
Equity LifeStyle Properties, Inc.
Notes to Consolidated Financial Statements
Note 1—
Organization
Equity LifeStyle Properties, Inc. (“ELS”), a Maryland corporation, together with MHC Operating Limited Partnership (the “Operating Partnership”) and its other consolidated subsidiaries (the “Subsidiaries”), are referred to herein as “we,” “us,” and “our.” We are a fully integrated owner of lifestyle-oriented properties (“Properties”) consisting of property operations and home sales and rental operations primarily within manufactured home (“MH”) and recreational vehicle (“RV”) communities and marinas. We provide our customers the opportunity to place manufactured homes and cottages, RVs and/or boats on our Properties either on a long-term or short-term basis. Our customers may lease individual developed areas (“Sites”) or enter into right-to-use contracts, also known as membership subscriptions, which provide them access to specific Properties for limited stays.
Commencing with our taxable year ended December 31, 1993, we have elected to be taxed as a real estate investment trust (“REIT”) for U.S. federal income tax purposes. We believe we have qualified for taxation as a REIT. To maintain our qualification as a REIT, we must meet certain requirements, which are highly technical and complex. If we fail to qualify as a REIT, we could be subject to U.S. federal income tax at regular corporate rates. Additionally, we could remain disqualified as a REIT for four years following the year we first failed to qualify. Even as a REIT, we are subject to certain foreign, state and local taxes on our income and property and U.S. federal income and excise taxes on our undistributed income.
Our Properties are owned primarily by the Operating Partnership and managed internally by affiliates of the Operating Partnership. We are the general partner of the Operating Partnership and own
95.3
% as of December 31, 2023. We contributed the proceeds from our various equity offerings, including our initial public offering, to the Operating Partnership. In exchange for these contributions, we received units of common interests in the partnership (“OP Units”) equal to the number of shares of common stock issued in such equity offerings. The limited partners of the Operating Partnership (the “Common OP Unitholders”) receive an allocation of net income that is based on their respective ownership percentage in the Operating Partnership that is presented on the consolidated financial statements as Non-controlling interests—Common OP Units. As of December 31, 2023, the Non-controlling interests—Common OP Units were
9,104,654
, which are exchangeable for an equivalent number of shares of our common stock or, at our option, cash. The issuance of additional shares of common stock or OP Units would change the respective ownership of the Operating Partnership for the Common OP Unitholders.
Since we have elected to be taxed as a REIT for U.S. federal income tax purposes, certain activities, if performed by us, may not be qualifying REIT activities under the Internal Revenue Code of 1986, as amended (the “Code”). Accordingly, we have formed taxable REIT subsidiaries (each, a “TRS”). Our primary TRS is Realty Systems, Inc. (“RSI”) which, along with owning several properties, is engaged in the business of purchasing, selling and leasing factory-built homes located in Properties owned and managed by us. RSI also offers home sale brokerage services to our residents who may choose to sell their homes rather than relocate them when moving from a Property. Subsidiaries of RSI also operate ancillary activities at certain Properties, such as golf courses, pro shops, stores and restaurants.
F-11
Equity LifeStyle Properties, Inc.
Notes to Consolidated Financial Statements
Note 2—
Summary of Significant Accounting Policies
(a)
Basis of Presentation
The consolidated financial statements present the results of operations, financial position and cash flows of ELS, its majority-owned and controlled subsidiaries and variable interest entities (“VIEs”) in which ELS is the primary beneficiary. Intercompany balances and transactions have been eliminated.
The Operating Partnership meets the criteria as a VIE, where we are the general partner and controlling owner of approximately
95.3
%. The limited partners do not have substantive kick-out or participating rights. Our sole significant asset is our investment in the Operating Partnership, and consequently, substantially all of our assets and liabilities represent those assets and liabilities of the Operating Partnership. Additionally, we have the power to direct the Operating Partnership's activities and the obligation to absorb its losses or the right to receive its benefits. Accordingly, we are the primary beneficiary, and we have continued to consolidate the Operating Partnership.
Equity method of accounting is applied to entities in which ELS does not have a controlling interest or for VIEs in which ELS is not considered the primary beneficiary, but with respect to which it can exercise significant influence over the operations and major decisions. Our exposure to losses associated with unconsolidated joint ventures is primarily limited to the carrying value of these investments. Accordingly, distributions from a joint venture in excess of our carrying value are recognized in earnings.
(b)
Use of Estimates
The preparation of the consolidated financial statements in conformity with U.S. Generally Accepted Accounting Principles ("GAAP") requires management to make estimates and assumptions that affect the reported amounts of assets and liabilities, the disclosure of contingent assets and liabilities at the date of the financial statements and the reported amounts of revenues and expenses during the reporting period. Actual results could differ from these estimates. All property and site counts and acreage amounts are unaudited.
(c)
Investment in Real Estate
Investment in real estate is recorded at cost less accumulated depreciation. Direct and indirect costs related to real estate improvement projects are capitalized, including salaries and related benefits of employees who are directly responsible for and spend their time on the execution and supervision of such projects. Land improvements consist primarily of improvements such as grading, landscaping and infrastructure items, such as streets, sidewalks or water mains. Improvements to buildings and other depreciable property include clubhouses, laundry facilities, maintenance storage facilities, rental units and furniture, fixtures and equipment.
For development and expansion projects, we capitalize direct project costs, such as construction, architectural and legal, as well as, indirect project costs such as interest, real estate taxes and salaries and related benefits of employees who are directly involved in the project. Capitalization of these costs begins when the activities and related expenditures commence and cease when the project, or a portion of the project, is substantially complete and ready for its intended use.
Depreciation is computed on a straight-line basis based on the estimated useful lives of the associated real estate assets.
|
Useful Lives
(in years) |
||||||||
| Land and Building Improvements |
|
|||||||
| Manufactured Homes |
|
|||||||
| Furniture, Fixture and Equipment |
|
|||||||
| In-place leases | Expected term | |||||||
| Above and below-market leases | Applicable lease term | |||||||
Long-lived assets to be held and used, including our investment in real estate, are evaluated for impairment indicators quarterly or whenever events or changes in circumstances indicate a possible impairment. Our judgments regarding the existence of impairment indicators are based on factors such as operational performance, market conditions, environmental and
F-12
Equity LifeStyle Properties, Inc.
Notes to Consolidated Financial Statements
Note 2—Summary of Significant Accounting Policies (continued)
legal factors. Future events could occur which would cause us to conclude that impairment indicators exist and an impairment loss is warranted.
If an impairment indicator exists related to a long-lived asset that is held and used, the expected future undiscounted cash flows are compared against the carrying amount of that asset. Forecasting cash flows requires us to make estimates and assumptions on various inputs including, but not limited to, rental revenue and expense growth rates, occupancy, levels of capital expenditure and capitalization rates. If the sum of the estimated undiscounted cash flows is less than the carrying amount of the asset, an impairment loss is recorded for the carrying amount in excess of the estimated fair value, if any, of the asset.
(d)
Acquisitions
We account for acquisitions of investments in real estate by assessing each acquisition to determine if it meets the definition of a business or if it qualifies as an asset acquisition. We apply a screen test to evaluate if substantially all the fair value of the acquired property is concentrated in a single identifiable asset or group of similar identifiable assets to determine whether a transaction is accounted for as an asset acquisition or business combination. As most of our real estate acquisitions are concentrated in either a single asset or a group of similar identifiable assets, our real estate transactions are generally accounted for as asset acquisitions, which permits the capitalization of transaction costs to the basis of the acquired property.
In estimating the fair values for purposes of allocating the purchase price, we utilize a number of sources, including independent appraisals or internal valuations that may be available in connection with the acquisition or financing of the respective Property and other market data. We also consider information obtained about each Property as a result of our due diligence, marketing and leasing activities in estimating the fair value of the tangible and intangible assets acquired and liabilities assumed.
The following methods and assumptions are used to estimate the fair value of each class of asset acquired and liability assumed:
Land – Market approach based on similar, but not identical, transactions in the market. Adjustments to comparable sales based on both quantitative and qualitative data.
Depreciable property – Cost approach based on market comparable data to replace adjusted for local variations, inflation and other factors.
Manufactured homes – Sales comparison approach based on market prices for similar homes adjusted for differences in age or size.
In-place leases – In-place leases are determined through a combination of estimates of market rental rates and expense reimbursement levels as well as an estimate of the length of time required to replace each lease.
Above-market assets/below-market liabilities – Income approach based on discounted cash flows comparing contractual cash flows to be paid pursuant to the leases and our estimate of fair market lease rates over the remaining non-cancelable lease terms. For below-market leases, we also consider remaining initial lease terms plus any renewal periods.
Notes receivable – Income approach based on discounted cash flows comparing contractual cash flows at a market rate adjusted based on particular notes' or note holders' down payment, credit score and delinquency status.
Mortgage notes payable – Income approach based on discounted cash flows comparing contractual cash flows to cash flows of similar debt discounted based on market rates.
(e)
Intangibles and Goodwill
We record acquired intangible assets at their estimated fair value separate and apart from goodwill. We amortize identified intangible assets and liabilities that are determined to have finite lives over the period the assets and liabilities are expected to contribute directly or indirectly to the future cash flows of the Property or business acquired. Intangible assets subject to amortization are reviewed for impairment whenever events or changes in circumstances indicate that their carrying
F-13
Equity LifeStyle Properties, Inc.
Notes to Consolidated Financial Statements
Note 2—Summary of Significant Accounting Policies (continued)
amounts may not be recoverable. An impairment loss is recognized if the carrying amount of an intangible asset is not recoverable and its carrying amount exceeds its estimated fair value.
The excess of the cost of an acquired entity over the net of the amounts assigned to assets acquired (including identified intangible assets) and liabilities assumed in a business combination is recorded as goodwill. Goodwill is not amortized but is tested for impairment at a level of reporting referred to as a reporting unit on an annual basis, or more frequently if events or changes in circumstances indicate that the asset might be impaired.
As of December 31, 2023 and 2022, the gross carrying amount of identified intangible assets and goodwill was $
55.6
million, which is reported as a component of other assets, net on the Consolidated Balance Sheets. As of both December 31, 2023 and 2022, this amount was comprised of $
38.0
million of identified intangible assets and $
17.6
million of goodwill. Accumulated amortization of identified intangibles assets was $
12.2
million and $
7.7
million as of December 31, 2023 and 2022, respectively. The estimated annual aggregated amortization expense to be recognized over each of the next five years is $
3.6
million. The weighted average remaining useful life is approximately
seven years
.
(f)
Assets Held for Sale
In determining whether to classify a real estate asset held for sale, we consider whether: (i) management has committed to a plan to sell the asset; (ii) the asset is available for immediate sale in its present condition, subject only to terms that are usual and customary; (iii) we have initiated a program to locate a buyer; (iv) we believe that the sale of the real estate asset is probable within one year; (v) we are actively marketing the investment property for sale at a price that is reasonable in relation to its current value and (vi) actions required for us to complete the plan indicate that it is unlikely that any significant changes will be made. If all of the above criteria are met, we classify the real estate asset as held for sale. When all of the above criteria are met, we discontinue depreciation or amortization of the asset, measure it at the lower of its carrying amount or its fair value less estimated cost to sell and present it separately as an asset held for sale, net on the Consolidated Balance Sheets. We also present the liabilities related to assets held for sale, if any, separately on the Consolidated Balance Sheets. In connection with the held for sale evaluation, if the disposal represents a strategic shift that has, or will have, a major effect on our consolidated financial statements, then the transaction is presented as discontinued operations.
(g)
Restricted Cash
As of December 31, 2023 and 2022, restricted cash consisted of $
25.7
million and $
19.7
million, respectively, primarily related to cash reserved for customer deposits and escrows for insurance and real estate taxes.
(h)
Fair Value of Financial Instruments
We disclose the estimated fair value of our financial instruments according to a fair value hierarchy. The valuation hierarchy is based on the transparency of the lowest level of input that is significant to the valuation of an asset or a liability as of the measurement date. The three levels are defined as follows:
Level 1 - Inputs to the valuation methodology are quoted prices (unadjusted) for identical assets or liabilities in active markets.
Level 2 - Inputs to the valuation methodology include quoted prices for similar assets and liabilities in active markets and inputs that are observable for the asset or liability, either directly or indirectly, for substantially the full term of the financial instrument.
Level 3 - Inputs to the valuation methodology are unobservable and significant to the fair value measurement.
The carrying values of cash and restricted cash, accounts receivable and accounts payable approximate their fair market values due to the short-term nature of these instruments. The carrying value of the notes receivable approximates the fair market value as the interest rates are generally comparable to current market rates. Concentrations of credit risk with respect to notes receivable are limited due to the size of the receivable and geographic diversity of the underlying Properties.
The fair market value of mortgage notes payable, the term loan and interest rate derivative are measured with Level 2 inputs using quoted prices and observable inputs from similar liabilities as disclosed in Note 9. Borrowing Arrangements and Note 10. Derivative Instruments and Hedging Activities.
F-14
Equity LifeStyle Properties, Inc.
Notes to Consolidated Financial Statements
Note 2—Summary of Significant Accounting Policies (continued)
We also utilize Level 2 and Level 3 inputs as part of our determination of the purchase price allocation for our acquisitions as disclosed in Note 6. Investment in Real Estate.
(i)
Deferred Financing Costs, Net
(j)
Allowance for Credit Losses
| December 31, | ||||||||||||||
|
(amounts in thousands):
|
2023 | 2022 | ||||||||||||
| Balance, beginning of year | $ |
|
$ |
|
||||||||||
| Provision for losses |
|
|
||||||||||||
| Write-offs |
(
|
(
|
||||||||||||
| Balance, end of year | $ |
|
$ |
|
||||||||||
(k)
Revenue Recognition
Our revenue streams are predominantly derived from customers renting our Sites or entering into membership subscriptions. Our MH Sites and annual RV and marina Sites are leased on an annual basis. Seasonal RV and marina Sites are leased to customers generally for
to
six months
. Transient RV and marina Sites are leased to customers on a short-term basis. Leases with our customers are accounted for as operating leases. Rental income is accounted for in accordance with the Accounting Standard Codification (ASC) 842,
Leases
, and is recognized over the term of the respective lease or the length of a customer's stay. We do not separate expenses reimbursed by our customers (“utility recoveries”) from the associated rental revenue as we meet the practical expedient criteria to combine these lease and non-lease components. We assessed the criteria and concluded that the timing and pattern of transfer for rental revenue and the associated utility recoveries are the same and because our leases qualify as operating leases, we account for and present rental revenue and utility recoveries as a single component under Rental income in our Consolidated Statements of Income and Comprehensive Income.
(l)
Stock Based Compensation
Stock-based compensation expense for restricted stock awards with service conditions is measured based on the grant date fair value and recognized on a straight-line basis over the requisite service period of the individual grants.
Stock-based compensation expense for restricted stock awards with performance conditions is measured based on the grant date fair value and recognized on a straight-line basis over the performance period of the individual grants, when achieving the performance targets is considered probable. We estimate and revisit the probability of achieving the performance targets periodically by updating our forecasts throughout the performance period as necessary.
F-15
Equity LifeStyle Properties, Inc.
Notes to Consolidated Financial Statements
Note 2—Summary of Significant Accounting Policies (continued)
We also issue stock options by estimating the grant date fair value using the Black-Scholes option-pricing model and recognizing over the vesting period for options that are expected to vest. We estimate forfeitures at the time of grant based on historical experience, updated for changes in facts and circumstances, as appropriate, and in subsequent periods if actual forfeitures differ from those estimates. The expected volatility assumption is calculated based on our historical volatility, which is calculated over a period of time commensurate with the expected term of the options being valued. The risk-free interest rate assumption is based upon the U.S. Treasury yield curve in effect at the time of grant. The dividend yield assumption is based on our expectation of dividend payouts.
(m)
Insurance Recoveries
We carry comprehensive insurance coverage for losses resulting from property damage and environmental liability and business interruption claims on all of our properties. We record the estimated amount of expected insurance proceeds for property damage, clean-up costs and other losses incurred as an asset (typically a receivable from our insurance carriers) and income up to the amount of the losses incurred when receipt of insurance proceeds is deemed probable. Any amount of insurance recovery in excess of the losses incurred and any amount of insurance recovery related to business interruption are considered a gain contingency and are recognized in the period in which the insurance proceeds are received.
During the years ended December 31, 2023 and December 31, 2022, we recognized expenses of approximately $
13.4
million and $
40.6
million related to debris removal and cleanup related to Hurricane Ian and an offsetting insurance recovery revenue accrual of $
13.4
million and $
40.6
million, respectively, related to the expected insurance recovery as a result of Hurricane Ian, which is included in Casualty related charges/recoveries, net in the Consolidated Statements of Income and Comprehensive Income.
During the years ended December 31, 2023 and December 31, 2022, we received insurance proceeds of approximately $68.3 million and zero, respectively, of which $10.6 million and zero was identified as business interruption recovery revenue, respectively.
(n)
Non-Controlling Interests
The OP Units are exchangeable for shares of common stock on a
one
-for-one basis at the option of the Common OP Unitholders, which we may, in our discretion, cause the Operating Partnership to settle in cash. The exchange is treated as a capital transaction, which results in an allocation between stockholders' equity and non-controlling interests to account for the change in the respective percentage ownership of the underlying equity of the Operating Partnership.
Net income is allocated to Common OP Unitholders based on their respective ownership percentage of the Operating Partnership. Such ownership percentage is calculated by dividing the number of OP Units held by the Common OP Unitholders by the total OP Units held by the Common OP Unitholders and the shares of common stock held by the common stockholders. Issuance of additional shares of common stock or OP Units would change the percentage ownership of both the Non-controlling interests – Common OP Units and the common stockholders.
(o)
Income Taxes
F-16
Equity LifeStyle Properties, Inc.
Notes to Consolidated Financial Statements
Note 2—Summary of Significant Accounting Policies (continued)
In addition, we own certain TRSs, which are subject to federal and state income taxes at regular corporate tax rates and have federal net operating loss carryforwards. We maintained a valuation allowance against the TRSs' net deferred tax assets as of December 31, 2022. We regularly assess the need for a valuation allowance against our deferred tax assets and concluded at December 31, 2023 that it was more likely than not we would realize the benefit of the deferred tax assets. Therefore, we released the full valuation allowance of $
10.5
million in 2023.
The REIT remains subject to certain foreign, state and local income, excise or franchise taxes; however, they are not material to our operating results or financial position. We do not have unrecognized tax benefit items.
We, or one of our Subsidiaries, file income tax returns in the U.S. federal jurisdiction, various U.S. state jurisdictions and Canada. With few exceptions, we are no longer subject to U.S. federal, state and local, or non-U.S. income tax examinations by tax authorities for years before 2019.
As of December 31, 2023, net investment in real estate and notes receivable had a U.S. federal tax basis of approximately $
5.1
billion (unaudited) and $
57.0
million (unaudited), respectively.
During the years ended December 31, 2023, 2022 and 2021, our tax treatment of common stock distributions was as follows (unaudited):
| 2023 | 2022 | 2021 | |||||||||||||||
| Tax status of common stock distributions deemed paid during the year: | |||||||||||||||||
| Ordinary income | $ |
|
$ |
|
$ |
|
|||||||||||
| Long-term capital gains |
|
|
|
||||||||||||||
| Non-dividend distributions |
|
|
|
||||||||||||||
| Distributions declared per common stock outstanding | $ |
|
$ |
|
$ |
|
|||||||||||
The quarterly distribution paid on January 12, 2024 of $
0.447500
(unaudited) per share of common stock will all be allocable to 2023 for federal tax purposes.
(p)
New Accounting Pronouncements
In August 2023, the Financial Accounting Standards Board ("FASB") issued Accounting Standards Update 2023-05,
Business Combinations — Joint Venture Formations (Subtopic 805-60): Recognition and Initial Measurement
(“ASU 2023-05”). ASU 2023-05 addresses the accounting for contributions made to a joint venture, upon formation, in a joint venture’s separate financial statements. Prior to the amendment, the FASB did not provide specific authoritative guidance on the initial measurement of assets and liabilities assumed by a joint venture upon its formation. ASU 2023-05 requires a joint venture to recognize and initially measure its assets and liabilities at fair value (with exceptions to fair value measurement that are consistent with the business combinations guidance). ASU 2023-05 is effective for all joint venture formations with a formation date on or after January 1, 2025, with early adoption permitted. We are currently evaluating the impact of ASU 2023-05, but do not expect the adoption to have a material impact on our consolidated financial statements.
In November 2023, the FASB issued Accounting Standards Update 2023-07,
Segment Reporting (Topic 280)
: I
mprovements to Reportable Segment Disclosures
(“ASU 2023-07”), which aims to improve reportable segment disclosure requirements, primarily through enhanced disclosures about significant segment expenses. The amendments in ASU 2023-07 do not change how a public entity identifies its operating segments, aggregates those operating segments, or applies the quantitative thresholds to determine its reportable segments. ASU 2023-07 is effective for fiscal years beginning after December 15, 2023, and interim periods within fiscal years beginning after December 15, 2024, with early adoption permitted. We are currently evaluating the impact of ASU 2023-07 on our consolidated financial statements.
In December 2023, the FASB issued Accounting Standards Update 2023-09,
Income Taxes (Topic 740): Improvements to Income Tax Disclosures
("ASU 2023-09"), which enhances the transparency and decision usefulness of income tax disclosures. This update is effective for annual periods beginning after December 15, 2024. Early adoption is permitted for annual financial statements that have not yet been issued or made available for issuance. We are currently evaluating the impact of ASU 2023-09, but do not expect the adoption to have a material impact on our consolidated financial statements.
F-17
Equity LifeStyle Properties, Inc.
Notes to Consolidated Financial Statements
Note 3—
Leases
Lessor
Rental income derived from customers renting our Sites is accounted for in accordance with ASC 842,
Leases
, and is recognized over the term of the respective operating lease or the length of a customer's stay. MH Sites are generally leased on an annual basis to residents who own or lease factory-built homes, including manufactured homes. Annual RV and marina Sites are leased on an annual basis to customers who generally have an RV, factory-built cottage, boat or other unit placed on the site, including those Northern properties that are open for the summer season. Seasonal RV and marina Sites are leased to customers generally for
to
six months
. Transient RV and marina Sites are leased to customers on a short-term basis. In addition, customers may lease homes that are located in our communities.
The leases entered into between the customer and us for a rental of a Site are renewable upon the consent of both parties or, in some instances, as provided by statute. Long-term leases that are non-cancelable by the tenants are in effect at certain Properties. Rental rate increases at these Properties are primarily a function of increases in the Consumer Price Index, taking into consideration certain conditions. Additionally, periodic market rate adjustments are made as deemed appropriate. In addition, certain state statutes allow entry into long-term agreements that effectively modify lease terms related to rent amounts and increases over the term of the agreements.
The following table presents future minimum rents expected to be received under long-term non-cancelable tenant leases, as well as those leases that are subject to long-term agreements governing rent payments and increases:
|
(amounts in thousands)
|
As of December 31, 2023 | |||||||
| 2024 | $ |
|
||||||
| 2025 |
|
|||||||
| 2026 |
|
|||||||
| 2027 |
|
|||||||
| 2028 |
|
|||||||
| Thereafter |
|
|||||||
| Total | $ |
|
||||||
Lessee
We lease land under non-cancelable operating leases at
10
Properties expiring at various dates between 2028 and 2054. The majority of the leases have terms requiring fixed payments plus additional rents based on a percentage of gross revenues at those Properties. We also have other operating leases, primarily office space expiring at various dates through 2032. For the years ended December 31, 2023, 2022 and 2021, total operating lease payments were $
6.5
million, $
9.3
million and $
10.4
million, respectively.
The following table presents the operating lease payments for the year ended December 31, 2023, 2022 and 2021:
| Years Ended December 31, | ||||||||||||||||||||
| (amounts in thousands) | 2023 | 2022 | 2021 | |||||||||||||||||
| Fixed lease cost: | ||||||||||||||||||||
|
Ground leases
(1)
|
$ |
|
$ |
|
$ |
|
||||||||||||||
| Office and other leases |
|
|
|
|||||||||||||||||
| Variable lease cost: | ||||||||||||||||||||
|
Ground leases
(1)
|
|
|
|
|||||||||||||||||
| Office and other leases |
|
|
|
|||||||||||||||||
| Total lease cost | $ |
|
$ |
|
$ |
|
||||||||||||||
__________________
(1)
The Westwinds ground leases expired August 31, 2022, for additional information see Part I. Item 1. Financial Statements—Note 16. Commitments and Contingencies.
F-18
Equity LifeStyle Properties, Inc.
Notes to Consolidated Financial Statements
Note 3—Leases (continued)
The following table summarizes our minimum future rental payments, excluding variable costs, which are discounted by our incremental borrowing rate to calculate the lease liability for our operating leases as of December 31, 2023:
| (amounts in thousands) | Ground Leases | Office and Other Leases | Total | |||||||||||||||||
| 2024 | $ |
|
$ |
|
$ |
|
||||||||||||||
| 2025 |
|
|
|
|||||||||||||||||
| 2026 |
|
|
|
|||||||||||||||||
| 2027 |
|
|
|
|||||||||||||||||
| 2028 |
|
|
|
|||||||||||||||||
| Thereafter |
|
|
|
|||||||||||||||||
| Total undiscounted rental payments |
|
|
|
|||||||||||||||||
| Less imputed interest |
(
|
(
|
(
|
|||||||||||||||||
| Total lease liabilities | $ |
|
$ |
|
$ |
|
||||||||||||||
ROU assets and lease liabilities from our operating leases, included within
and
on the Consolidated Balance Sheets, were $
23.6
million and $
25.7
million, respectively, as of December 31, 2023. The weighted average remaining lease term for our operating leases was
eight years
and the weighted average incremental borrowing rate was
3.9
% at December 31, 2023.
ROU assets and lease liabilities from our operating leases, included within
and
on the Consolidated Balance Sheets, were $
25.9
million and $
28.0
million, respectively, as of December 31, 2022. The weighted average remaining lease term for our operating leases was
nine years
and the weighted average incremental borrowing rate was
3.8
% at December 31, 2022.
Note 4—
Earnings Per Common Share
Basic and fully diluted earnings per share are based on the weighted average shares outstanding during each year. The following table sets forth the computation of basic and diluted earnings per share of common stock (Common Share), for the years ended December 31, 2023, 2022 and 2021:
| Years Ended December 31, | |||||||||||||||||
| (amounts in thousands, except per share data) | 2023 | 2022 | 2021 | ||||||||||||||
| Numerators: | |||||||||||||||||
| Net income available to Common Stockholders—Basic | $ |
|
$ |
|
$ |
|
|||||||||||
| Amounts allocated to dilutive securities |
|
|
|
||||||||||||||
| Net income available to Common Stockholders—Fully Diluted | $ |
|
$ |
|
$ |
|
|||||||||||
| Denominator: | |||||||||||||||||
| Weighted average Common Shares outstanding—Basic |
|
|
|
||||||||||||||
| Effect of dilutive securities: | |||||||||||||||||
| Exchange of Common OP Units for Common Shares |
|
|
|
||||||||||||||
| Stock options and restricted stock |
|
|
|
||||||||||||||
| Weighted average Common Shares outstanding—Fully Diluted |
|
|
|
||||||||||||||
| Earnings per Common Share—Basic: | $ |
|
$ |
|
$ |
|
|||||||||||
| Earnings per Common Share—Fully Diluted: | $ |
|
$ |
|
$ |
|
|||||||||||
Note 5—
Common Stock and Other Equity Related Transactions
Equity Offering Program
There was no ATM activity under our prior ATM equity offering program during the year ended December 31, 2023.
F-19
Equity LifeStyle Properties, Inc.
Notes to Consolidated Financial Statements
Note 5—Common Stock and Other Equity Related Transactions (continued)
The following table presents the shares that were issued under our prior ATM equity offering programs, during the years ended December 31, 2022 and 2021:
| Years Ended December 31, | |||||||||||
|
(amounts in thousands, except share data)
|
2022 | 2021 | |||||||||
| Shares of common stock sold |
|
|
|||||||||
| Weighted average price | $ |
|
$ |
|
|||||||
| Total gross proceeds | $ |
|
$ |
|
|||||||
| Commissions paid to sales agents | $ |
|
$ |
|
|||||||
Employee Stock Purchase Plan
On May 10, 2016, we amended and restated the 1997 Non-Qualified Employee Stock Purchase Plan (“ESPP”). Pursuant to the ESPP, certain of our employees and directors may each annually acquire up to $
250,000
of our common stock. The common stock may be purchased monthly at a price equal to
85
% of the lesser of: (a) the closing price for a share of common stock on the last day of the offering period and (b) the closing price for a share of common stock on the first day of the offering period. Shares of common stock issued through the ESPP for the years ended December 31, 2023, 2022 and 2021, were
29,428
,
37,042
and
32,145
, respectively. As of December 31, 2023,
644,579
shares remained available to be sold under the ESPP, subject to adjustment by our Board of Directors.
Exchanges
Subject to certain limitations, Common OP Unitholders can request an exchange of any or all of their OP Units for shares of common stock at any time. Upon receipt of such a request, we may, in lieu of issuing shares of common stock, cause the Operating Partnership to pay cash.
Common Stock Activity and Distributions
The following table presents the changes in our outstanding common stock (excluding OP Units of
9,104,654
,
9,265,565
and
9,305,651
outstanding at December 31, 2023, 2022 and 2021, respectively):
| Years Ended December 31, | |||||||||||||||||
| 2023 | 2022 | 2021 | |||||||||||||||
| Shares outstanding at January 1, |
|
|
|
||||||||||||||
| Common stock issued through the ATM Equity Offering Program and its predecessor |
|
|
|
||||||||||||||
| Common stock issued through exchange of OP Units |
|
|
|
||||||||||||||
| Common stock issued through restricted stock grants |
|
|
|
||||||||||||||
| Common stock forfeitures |
|
(
|
|
||||||||||||||
| Common stock issued through ESPP and Dividend Reinvestment Plan |
|
|
|
||||||||||||||
| Common stock repurchased and retired |
(
|
(
|
(
|
||||||||||||||
| Shares outstanding at December 31, |
|
|
|
||||||||||||||
During the years ended December 31, 2023, 2022 and 2021, shares of common stock were surrendered to satisfy income tax withholding obligations primarily due to the vesting of restricted stock grants at a weighted average price of $
68.02
, $
77.22
and $
61.50
per share, respectively.
As of December 31, 2023, 2022 and 2021, ELS' percentage ownership of the Operating Partnership was approximately
95.3
%,
95.3
% and
95.2
%, respectively. The remaining approximately
4.7
%,
4.7
% and
4.8
% as of December 31, 2023, 2022 and 2021, respectively, was owned by the Common OP Unitholders.
F-20
Equity LifeStyle Properties, Inc.
Notes to Consolidated Financial Statements
Note 5—Common Stock and Other Equity Related Transactions (continued)
The following regular quarterly distributions have been declared and paid to common stockholders and Common OP Unitholders since January 1, 2021:
| Distribution Amount Per Share | For the Quarter Ended | Stockholder Record Date | Payment Date | |||||||||||||||||
|
$
|
March 31, 2021 | March 26, 2021 | April 9, 2021 | |||||||||||||||||
|
$
|
June 30, 2021 | June 25, 2021 | July 9, 2021 | |||||||||||||||||
|
$
|
September 30, 2021 | September 24, 2021 | October 8, 2021 | |||||||||||||||||
|
$
|
December 31, 2021 | December 31, 2021 | January 14, 2022 | |||||||||||||||||
|
$
|
March 31, 2022 | March 25, 2022 | April 8, 2022 | |||||||||||||||||
|
$
|
June 30, 2022 | June 24, 2022 | July 8, 2022 | |||||||||||||||||
|
$
|
September 30, 2022 | September 30, 2022 | October 14, 2022 | |||||||||||||||||
|
$
|
December 31, 2022 | December 30, 2022 | January 13, 2023 | |||||||||||||||||
|
$
|
March 31, 2023 | March 31, 2023 | April 14, 2023 | |||||||||||||||||
|
$
|
June 30, 2023 | June 30, 2023 | July 14, 2023 | |||||||||||||||||
|
$
|
September 30, 2023 | September 29, 2023 | October 13, 2023 | |||||||||||||||||
|
$
|
December 31, 2023 | December 29, 2023 | January 12, 2024 | |||||||||||||||||
Note 6—
Investment in Real Estate
Acquisitions
During the year ended December 31, 2023, we completed the acquisition of Red Oak Shores Campground, a
223
-site RV community located in Ocean View, New Jersey for a purchase price of $
9.5
million. We also acquired
two
land parcels adjacent to
two
of our properties, containing approximately
two
acres for a combined purchase price of $
0.5
million. All acquisitions were accounted for as asset acquisitions under
ASC 805, Business Combinations
and were funded from our unsecured line of credit.
Fair Value
We engaged third-party valuation firms to assist with our purchase price allocation when necessary.
The following table summarizes the fair value of the assets acquired and liabilities assumed for the years ended December 31, 2023 and 2022, which we determined using Level-3 inputs for land and buildings and other depreciable property and Level-2 inputs for the others:
| Years Ended December 31, | |||||||||||
|
(amounts in thousands)
|
2023 | 2022 | |||||||||
| Assets acquired | |||||||||||
| Land | $ |
|
$ |
|
|||||||
| Buildings and other depreciable property |
|
|
|||||||||
|
In-place leases
(a)
|
|
|
|||||||||
| Net investment in real estate | $ |
|
$ |
|
|||||||
| Other assets |
|
|
|||||||||
| Total assets acquired | $ |
|
$ |
|
|||||||
| Liabilities assumed | |||||||||||
| Other liabilities |
|
|
|||||||||
| Total liabilities assumed | $ |
|
$ |
|
|||||||
| Net assets acquired | $ |
|
$ |
|
|||||||
_____________________
(a)
In-place leases are included in buildings and other depreciable property on the Consolidated Balance Sheets.
F-21
Equity LifeStyle Properties, Inc.
Notes to Consolidated Financial Statements
Note 7—
Investment in Unconsolidated Joint Ventures
The following table summarizes our investment in unconsolidated joint ventures (investment amounts in thousands):
| Investment as of December 31, | Income/(Loss) for Years Ended December 31, | |||||||||||||||||||||||||||||||||||||||||||||||||||||||
| Investment |
Location
(a)
|
Number
of Sites |
Economic Interest
(b)
|
2023 | 2022 | 2023 | 2022 | 2021 | ||||||||||||||||||||||||||||||||||||||||||||||||
| Meadows | Various (2,2) |
|
|
% | $ |
|
$ |
|
$ |
|
$ |
|
$ |
|
||||||||||||||||||||||||||||||||||||||||||
| Lakeshore | Florida (3,3) |
|
(c)
|
|
|
|
|
|
||||||||||||||||||||||||||||||||||||||||||||||||
| Voyager | Arizona (1,1) |
|
|
% |
(d)
|
|
|
|
|
|
||||||||||||||||||||||||||||||||||||||||||||||
| ECHO JV | Various |
|
|
% |
|
|
(
|
|
|
|||||||||||||||||||||||||||||||||||||||||||||||
| RVC | Various |
|
|
% |
(e)
|
|
|
(
|
(
|
(
|
||||||||||||||||||||||||||||||||||||||||||||||
| Mulberry Farms | Arizona |
|
|
% |
|
|
(
|
(
|
|
|||||||||||||||||||||||||||||||||||||||||||||||
| Hiawassee KOA JV | Georgia |
|
|
% |
|
|
(
|
(
|
|
|||||||||||||||||||||||||||||||||||||||||||||||
|
|
$ |
|
$ |
|
$ |
|
$ |
|
$ |
|
||||||||||||||||||||||||||||||||||||||||||||||
_____________________
(a)
The number of Properties are shown parenthetically for the years ended December 31, 2023 and 2022, respectively.
(b)
The percentages shown approximate our economic interest as of December 31, 2023. Our legal ownership interest may differ.
(c)
Includes
two
joint ventures in which we own a
65
% interest in each and the Crosswinds joint venture in which we own a
49
% interest.
(d)
In March of 2023, we sold our
33
% interest in the utility plant servicing Voyager RV Resort.
(e)
Includes
three
joint ventures of which one joint venture owns a portfolio of
seven
operating RV communities and
two
joint ventures each own an RV property under development.
We recognized $
2.7
million, $
3.4
million and $
3.9
million (net of $
4.6
million, $
3.9
million and $
1.1
million of depreciation expense, respectively) of equity in income from unconsolidated joint ventures for the years ended December 31, 2023, 2022 and 2021, respectively. We received approximately $
7.0
million, $
21.6
million and $
3.2
million in distributions from joint ventures for the years ended December 31, 2023, 2022 and 2021, respectively. Approximately $
2.3
million, $
2.2
million and $
2.9
million of the distributions made to us exceeded our investment basis in joint ventures, and as such, were recorded as income from unconsolidated joint ventures for the years ended December 31, 2023, 2022 and 2021, respectively.
Note 8—
Notes Receivable, net
Notes receivable generally are presented at their outstanding unpaid principal balances, net of any allowances and unamortized discounts or premiums. Interest income is accrued on the unpaid principal balance. Discounts or premiums are amortized to income using the interest method.
We provide financing for non-refundable upfront payments required for membership upgrades (“Contracts Receivable”). As of December 31, 2023 and 2022, Contracts Receivable, net of allowance, was $
42.3
million and $
36.6
million, respectively. Contracts Receivable, as of December 31, 2023, had an average stated interest rate of
15.4
% per annum, a weighted average term remaining of
4.6
years and require monthly payments of principal and interest.
In certain cases, we purchase loans made by an unaffiliated lender to finance the sales of homes to our customers at our Properties (referred to as “Chattel Loans”). These loans are secured by the underlying homes sold and require monthly principal and interest payments. As of December 31, 2023 and 2022, we had $
7.6
million and $
8.8
million of Chattel Loans, respectively. As of December 31, 2023, the Chattel Loans receivable had an average stated interest rate of approximately
7.6
% per annum and had a weighted average term remaining of approximately
12
years.
Note 9—
Borrowing Arrangements
Mortgage Notes Payable
Our mortgage notes payable is classified as Level 2 in the fair value hierarchy as of December 31, 2023 and 2022.
The following table presents the fair value of our mortgage notes payable:
F-22
Equity LifeStyle Properties, Inc.
Notes to Consolidated Financial Statements
Note 9—Borrowing Arrangements (continued)
| As of December 31, 2023 | As of December 31, 2022 | |||||||||||||||||||||||||
| (amounts in thousands) | Fair Value | Carrying Value | Fair Value | Carrying Value | ||||||||||||||||||||||
| Mortgage notes payable, excluding deferred financing costs | $ |
|
$ |
|
$ |
|
$ |
|
||||||||||||||||||
As of December 31, 2023 and 2022, we had outstanding mortgage indebtedness on Properties of approximately $
2,990.0
million and $
2,693.2
million, respectively, net of deferred financing costs. The weighted average interest rate on our outstanding mortgage indebtedness, including the impact of premium/discount amortization and loan cost amortization on mortgage indebtedness, as of December 31, 2023 and December 31, 2022, was approximately
3.8
% and
3.7
% per annum, respectively. The debt bears interest at stated rates ranging from
2.4
% to
5.1
% per annum and matures on various dates ranging from 2025 to 2041. The debt encumbered a total of
120
and
114
of our Properties as of December 31, 2023 and December 31, 2022, respectively, and the gross carrying value of such Properties was approximately $
3,194.1
million and $
2,868.3
million, as of December 31, 2023 and December 31, 2022, respectively.
2023 Activity
During the year ended December 31, 2023 we closed on an incremental borrowing from an existing mortgage generating gross proceeds of $
89.0
million. The mortgage has a fixed interest rate of
5.04
% per annum and matures in
ten years
. We closed on
three
mortgages generating gross proceeds of $
375.0
million. The mortgages are secured by
20
MH or RV properties, have a weighted average fixed interest rate of
5.05
% per annum and a weighted average maturity of approximately
eight years
.
The proceeds were used to repay the outstanding balance on the unsecured line of credit (“LOC”) and $
100.4
million of principal on
three
mortgages that were due to mature in 2023 and 2024. The repaid mortgages had a weighted average fixed interest rate of
4.94
% per annum and were secured by
14
MH and RV properties.
2022 Activity
We repaid $
14.2
million of principal on
two
mortgage loans that were due to mature in 2022, incurring $
0.5
million of prepayment penalties. These mortgage loans had a weighted average interest rate of
5.25
% per annum and were secured by
three
RV communities.
We entered into a $
200.0
million secured refinancing transaction. The loan is secured by
one
MH community, has a fixed interest rate of
3.36
% per annum and has a maturity date of May 1, 2034. The net proceeds from the transaction were used to repay all debt scheduled to mature in 2022 and to repay amounts outstanding on the LOC.
Unsecured Debt
We previously entered into a Third Amended and Restated Credit Agreement (“Credit Agreement”), pursuant to which we have access to a $
500.0
million LOC and a $
300.0
million senior unsecured term loan (the “$
300
million Term Loan”). We have the option to increase the borrowing capacity by $
200.0
million, subject to certain conditions. On March 1, 2023, we amended the Credit Agreement to transition the LIBOR rate borrowings to Secured Overnight Financing Rate (“SOFR”) borrowings. The LOC bears interest at a rate of SOFR plus
1.25
% to
1.65
%, requires an annual facility fee of
0.20
% to
0.35
% and matures on April 18, 2025. The $
300
million Term Loan has an interest rate of SOFR plus
1.40
% to
1.95
% per annum and matures on April 17, 2026. For both the LOC and the $
300
million Term Loan, the spread over SOFR is variable based on leverage throughout the respective loan terms. As of December 31, 2023, the Company has no remaining LIBOR based borrowings.
During the year ended December 31, 2022, we entered into a $
200.0
million senior unsecured term loan agreement. The maturity date is January 21, 2027, with an interest rate of SOFR plus approximately
1.30
% to
1.80
%, depending on leverage levels.
The LOC had a balance of $
31.0
million and $
198.0
million outstanding as of December 31, 2023 and December 31, 2022, respectively. As of December 31, 2023, our LOC had a remaining borrowing capacity of $
469.0
million.
F-23
Equity LifeStyle Properties, Inc.
Notes to Consolidated Financial Statements
Note 9—Borrowing Arrangements (continued)
Future Maturities of Debt
The following table presents the aggregate scheduled payments of principal on long-term borrowings for each of the next five years and thereafter as of December 31, 2023:
| (amounts in thousands) | Amount | |||||||
| 2024 | $ |
|
||||||
| 2025 |
|
|||||||
| 2026 |
|
|||||||
| 2027 |
|
|||||||
| 2028 |
|
|||||||
| Thereafter |
|
|||||||
| Unamortized deferred financing costs |
(
|
|||||||
| Total | $ |
|
||||||
As of December 31, 2023, we were in compliance in all material respects with the covenants in our borrowing arrangements.
Note 10—
Derivative Instruments and Hedging Activities
Cash Flow Hedges of Interest Rate Risk
We record all derivatives at fair value. Our objective in utilizing interest rate derivatives is to add stability to our interest expense and to manage our exposure to interest rate movements. To accomplish this objective, we primarily use interest rate swaps as part of our interest rate risk management strategy. Interest rate swaps designated as cash flow hedges involve the receipt of variable amounts from a counterparty in our exchange for making fixed-rate payments over the life of the agreements without exchange of the underlying notional amount.
The changes in the fair value of the designated derivative that qualify as a cash flow hedge are recorded in Accumulated other comprehensive income (loss) on the Consolidated Balance Sheets and subsequently reclassified into earnings on the Consolidated Statements of Income and Comprehensive Income in the period that the hedged forecasted transaction affects earnings.
In March 2021, we entered into a Swap Agreement (the “2021 Swap”) with a notional amount of $
300.0
million allowing us to trade the variable interest rate associated with our $
300.0
million Term Loan for a fixed interest rate. In March 2023, we amended the 2021 Swap agreement to reflect the change in the $
300.0
million Term Loan interest rate benchmark from LIBOR to SOFR (see
Note 9. Borrowing Arrangements
). The 2021 Swap has a fixed interest rate of
0.41
% per annum and matures on March 25, 2024. Based on the leverage as of December 31, 2023, our spread over SOFR was
1.40
% resulting in an estimated all-in interest rate of
1.81
% per annum.
In April 2023, we entered into a Swap Agreement (the “2023 Swap”) with a notional amount of $
200.0
million allowing us to trade the variable interest rate associated with our $
200.0
million Term Loan for a fixed interest rate. The 2023 Swap has a fixed interest rate of
3.68
% per annum and matures on January 21, 2027. Based on the leverage as of December 31, 2023, our spread over SOFR was
1.20
% resulting in an estimated all-in interest rate of
4.88
% per annum.
Our derivative financial instruments are classified as Level 2 in the fair value hierarchy. The following table presents the fair value of our derivative financial instrument:
| As of December 31, | ||||||||||||||||||||
| (amounts in thousands) | Balance Sheet Location | 2023 | 2022 | |||||||||||||||||
| Interest Rate Swaps | Other assets, net | $ |
|
$ |
|
|||||||||||||||
F-24
Equity LifeStyle Properties, Inc.
Notes to Consolidated Financial Statements
Note 10—Derivative Instruments and Hedging Activities (continued)
The table below presents the effect of our derivative financial instrument on the Consolidated Statements of Income and Comprehensive Income:
| Derivatives in Cash Flow Hedging Relationship |
Amount of (gain)/loss recognized
in OCI on derivative for the year ended December 31, |
Location of (gain)/ loss reclassified from
accumulated OCI into income |
Amount of (gain)/loss reclassified from
accumulated OCI into income for the year ended December 31, |
|||||||||||||||||||||||||||||||||||||||||
| (amounts in thousands) | 2023 | 2022 | 2021 | (amounts in thousands) | 2023 | 2022 | 2021 | |||||||||||||||||||||||||||||||||||||
| Interest Rate Swaps | $ |
(
|
$ |
(
|
$ |
(
|
Interest Expense | $ |
(
|
$ |
(
|
$ |
|
|||||||||||||||||||||||||||||||
During the next twelve months, we estimate that $
5.6
million will be reclassified as a decrease to interest expense. This estimate may be subject to change as the underlying SOFR changes. We determined that no adjustment was necessary for non-performance risk on our derivative obligations. As of December 31, 2023, we had not posted any collateral related to the Swaps.
Note 11—
Deferred Revenue of Membership Upgrade Sales and Deferred Commission Expense
The components of the change in deferred revenue entry of membership subscriptions and deferred commission expense were as follows:
| As of | ||||||||||||||
|
(amounts in thousands)
|
2023 | 2022 | ||||||||||||
| Deferred revenue - upfront payments from membership upgrade sales as of December 31, | $ |
|
$ |
|
||||||||||
| Membership upgrade sales |
|
|
||||||||||||
| Revenue recognized from membership upgrade sales upfront payments |
(
|
(
|
||||||||||||
| Net increase in deferred revenue - upfront payments from membership upgrade sales |
|
|
||||||||||||
|
Deferred revenue - upfront payments from membership upgrade sales as of December 31,
(1)
|
$ |
|
$ |
|
||||||||||
| Deferred commission expense as of December 31, | $ |
|
$ |
|
||||||||||
| Deferred commission expense |
|
|
||||||||||||
| Commission expense recognized |
(
|
(
|
||||||||||||
| Net increase in deferred commission expense |
|
|
||||||||||||
| Deferred commission expense as of December 31, | $ |
|
$ |
|
||||||||||
_____________________
(1)
Included in Deferred membership revenue on the Consolidated Balance Sheet.
Note 12—
Transactions with Related Parties
We lease office space from Two North Riverside Plaza Joint Venture Limited Partnership, an entity affiliated with Samuel Zell, the former Chairman of our Board of Directors. Payments made in accordance with the lease agreement to this entity amounted to approximately $
1.9
million for the year ended December 31, 2023 and $
1.7
million for both the years ended December 31, 2022 and 2021.
Note 13—
Equity Incentive Awards
Our 2014 Equity Incentive Plan (the “2014 Plan”) was adopted by the Board of Directors on March 11, 2014 and approved by our stockholders on May 13, 2014. Pursuant to the 2014 Plan, our officers, directors, employees and consultants may be awarded restricted stock, options, including non-qualified stock options and incentive stock options and other forms of equity awards subject to conditions and restrictions determined by the Compensation, Nominating and Corporate Governance Committee of our Board of Directors (the “Compensation Committee”).
Equity awards under the 2014 Plan are made by the Compensation Committee, who determines the individuals eligible to receive awards, the types of awards and the terms, conditions and restrictions applicable to any award. Grants to directors are determined by the Board of Directors. As of December 31, 2023,
5,135,450
shares remained available for future grants.
F-25
Equity LifeStyle Properties, Inc.
Notes to Consolidated Financial Statements
Note 13—Equity Incentive Awards (continued)
Restricted stock and options under the 2014 Plan have a maximum contractual term of
ten years
from the date of grant and have an exercise price not less than the fair value of the stock on the grant date. Individual grants could have different vesting periods but generally no longer than three and a half years. All restricted stock awards have non-forfeitable rights to dividend payments even if the underlying stock does not entirely vest.
Grants Issued
During the quarter ended March 31, 2023,
82,884
shares of restricted stock were awarded to certain members of our management team. Of these shares,
50
% are time-based awards, vesting in equal installments over a
three-year
period on January 30, 2024, February 4, 2025 and February 3, 2026, respectively, and have a grant date fair value of $
3.0
million. The remaining
50
% are performance-based awards vesting in equal installments on January 30, 2024, February 4, 2025 and February 3, 2026, respectively, upon meeting performance conditions as established by the Compensation Committee in the year of the vesting period. They are valued using the closing price at the grant date when all the key terms and conditions are known to all parties. The
13,812
shares of restricted stock subject to 2023 performance goals have a grant date fair value of $
1.0
million.
During the quarter ended June 30, 2023, we awarded to certain members of our Board of Directors
60,391
shares of restricted stock at a fair value of approximately $
4.1
million and options to purchase
8,450
shares of common stock with an exercise price of $
68.01
. These are time-based awards subject to various vesting dates between October 25, 2023 and April 24, 2026.
Stock-based compensation expense, reported in General and administrative expense on the Consolidated Statements of Income and Comprehensive Income, for the years ended December 31, 2023, 2022 and 2021 was $
14.7
million, $
10.5
million and $
10.9
million, respectively. Stock-based compensation expense of $
14.7
million for the year ended December 31, 2023 includes accelerated vesting of stock-based compensation expense of $
6.3
million recognized during the quarter ended June 30, 2023, as a result of the passing of a member of our Board of Directors.
Restricted Stock
A summary of our restricted stock activities and related information, is as follows:
| Number of Shares | Weighted Average Grant Date Fair Value Per Share | ||||||||||
| Balance at December 31, 2020 |
|
$
|
|||||||||
| Shares granted |
|
$
|
|||||||||
| Shares forfeited/cancelled |
|
$
|
|||||||||
| Shares vested |
(
|
$
|
|||||||||
| Balance at December 31, 2021 |
|
$
|
|||||||||
| Shares granted |
|
$
|
|||||||||
| Shares forfeited/cancelled |
(
|
$
|
|||||||||
| Shares vested |
(
|
$
|
|||||||||
| Balance at December 31, 2022 |
|
$
|
|||||||||
| Shares granted |
|
$
|
|||||||||
| Shares forfeited/cancelled |
|
$
|
|||||||||
| Shares vested |
(
|
$
|
|||||||||
| Balance at December 31, 2023 |
|
$
|
|||||||||
Compensation expense to be recognized subsequent to December 31, 2023, for restricted stock granted during or prior to 2023 that have not yet vested was $
3.7
million, which is expected to be recognized over a weighted average term of
1.6
years.
F-26
Equity LifeStyle Properties, Inc.
Notes to Consolidated Financial Statements
Note 13—Equity Incentive Awards (continued)
Stock Options
The fair value of stock options granted was estimated on the grant date using the Black-Scholes-Merton model. The following table includes the assumptions made in the valuation:
| 2023 | 2022 | ||||||||||
| Dividend Yield |
|
|
|||||||||
| Risk-Free Interest Rate |
|
|
|||||||||
| Expected Life |
|
|
|||||||||
| Expected Volatility |
|
|
|||||||||
| Weighted Average Grant Date Fair Value Per Share |
$
|
$
|
|||||||||
There were
8,450
stock options granted during December 31, 2023.
No
options were forfeited or expired for the years ended December 31, 2023, 2022 and 2021.
A summary of our stock option activity and related information, is as follows:
| Shares Subject To Options |
Weighted Average
Exercise Price Per Share |
Weighted Average Outstanding Contractual Life (in years) | Average Intrinsic Value (in millions) | ||||||||||||||||||||
| Balance at December 31, 2020 |
|
$
|
|
$
|
|||||||||||||||||||
| Options issued |
|
$
|
|||||||||||||||||||||
| Balance at December 31, 2021 |
|
$
|
|
$
|
|||||||||||||||||||
| Options issued |
|
$
|
|||||||||||||||||||||
| Balance at December 31, 2022 |
|
$
|
|
$
|
|||||||||||||||||||
| Options issued |
|
$
|
|||||||||||||||||||||
| Balance at December 31, 2023 |
|
$
|
|
$
|
|||||||||||||||||||
| Exercisable at December 31, 2023 |
|
$
|
|
$
|
|||||||||||||||||||
Note 14—
Long-Term Cash Incentive Plan
2022 LTIP
On February 7, 2022, the Compensation Committee approved a Long-Term Cash Incentive Plan Award (the “2022 LTIP”) to provide a long-term cash bonus opportunity to certain members of our management. The 2022 LTIP was approved by the Compensation Committee pursuant to the authority set forth in the Long-Term Cash Incentive Plan approved by our Board of Directors on May 15, 2007. The total cumulative payment for all participants (the “2022 LTIP Eligible Payment”) is based upon certain performance conditions being met over a
three-year
period ending December 31, 2024.
The Compensation Committee has responsibility for administering the 2022 LTIP and may use its reasonable discretion to adjust the performance criteria or the 2022 LTIP Eligible Payment to take into account the impact of any major or unforeseen transaction or event. Our named executive officers are not participants in the 2022 LTIP. The 2022 LTIP Eligible Payment will be paid, at the discretion of the Compensation Committee, in cash upon completion of our annual audit for the 2024 fiscal year and upon satisfaction of the vesting conditions as outlined in the 2022 LTIP. For each of the years ended December 31, 2023 and 2022, we accrued compensation expense of approximately $
3.1
million.
Note 15—
Savings Plan
We maintain a qualified retirement plan under which eligible employees may defer compensation for income tax purposes under Section 401(k) of the Internal Revenue Code (the “401K Plan”). The 401K Plan permits eligible employees and those of any Subsidiary to defer up to
60.0
% of their compensation on a pre-tax basis subject to certain limits. In addition, we match
100.0
% of their contribution up to the first
3.0
% and then
50.0
% of the next
2.0
% for a maximum potential match of
4.0
%. Both employee's and our matching contributions vest immediately.
F-27
Equity LifeStyle Properties, Inc.
Notes to Consolidated Financial Statements
Our contribution to the 401K Plan was approximately $
2.8
million, $
2.4
million and $
2.0
million for the years ended December 31, 2023, 2022 and 2021, respectively.
Note 16—
Commitments and Contingencies
We are involved in various legal and regulatory proceedings (“Proceedings”) arising in the ordinary course of business. The Proceedings include, but are not limited to, legal claims made by employees, vendors and customers, and notices, consent decrees, information requests, additional permit requirements and other similar enforcement actions by governmental agencies relating to our utility infrastructure, including water and wastewater treatment plants and other waste treatment facilities and electrical systems. Additionally, in the ordinary course of business, our operations are subject to audit by various taxing authorities. Management believes these Proceedings taken together do not represent a material liability. In addition, to the extent any such Proceedings or audits relate to newly acquired Properties, we consider any potential indemnification obligations of sellers in our favor.
Beginning on August 31, 2023 through October 12, 2023, certain private party plaintiffs filed several putative class actions in the U.S. District Court for the Northern District of Illinois, Eastern Division, against Datacomp Appraisal Systems, Inc. (“Datacomp”) and several owner/operators of manufactured housing communities, including ELS (the “Datacomp Litigation”), alleging that the community owner/operators used JLT Market Reports produced by Datacomp to conspire to raise manufactured home lot rents in violation of Section 1 of the Sherman Act. ELS purchased Datacomp in connection with the MHVillage/Datacomp acquisition during the year ended December 31, 2021. On December 15, 2023, the plaintiffs filed an amended consolidated complaint captioned
, In re Manufactured Home Lot Rents Antitrust Litigation, No. 1:23-cv-6715
. Plaintiffs seek both injunctive relief and monetary damages, including attorneys’ fees. The defendants filed a motion to dismiss on January 29, 2024.
We believe that the Datacomp Litigation is without merit, and we intend to vigorously defend our interests in this matter. As of December 31, 2023, we have not made an accrual, as we are unable to predict the outcome of this matter or reasonably estimate any possible loss.
F-28
Equity LifeStyle Properties, Inc.
Notes to Consolidated Financial Statements
Note 17—
Reportable Segments
Operating segments are defined as components of an entity for which separate financial information is available that is evaluated regularly by the chief operating decision maker (“CODM”). The CODM evaluates and assesses performance on a monthly basis. Segment operating performance is measured on Net Operating Income (“NOI”). NOI is defined as total operating revenues less total operating expenses. Segments are assessed before interest income and depreciation and amortization.
We have identified
two
reportable segments: (i) Property Operations and (ii) Home Sales and Rentals Operations. The Property Operations segment owns and operates land lease Properties and the Home Sales and Rentals Operations segment purchases, sells and leases homes at the Properties. The distribution of the Properties throughout the United States reflects our belief that geographic diversification helps insulate the total portfolio from regional economic influences.
All revenues are from external customers and there is no customer who contributed 10% or more of our total revenues during the years ended December 31, 2023, 2022 and 2021.
The following tables summarize our segment financial information for the years ended December 31, 2023, 2022 and 2021:
| Year Ended December 31, 2023 | |||||||||||||||||
| (amounts in thousands) |
Property
Operations |
Home Sales
and Rentals Operations |
Consolidated | ||||||||||||||
| Operations revenues | $ |
|
$ |
|
$ |
|
|||||||||||
| Operations expenses |
(
|
(
|
(
|
||||||||||||||
| Income from segment operations |
|
|
|
||||||||||||||
| Interest income |
|
|
|
||||||||||||||
| Depreciation and amortization |
(
|
(
|
(
|
||||||||||||||
| Loss on sale of real estate and impairment, net |
(
|
|
(
|
||||||||||||||
| Income from operations | $ |
|
$ |
|
$ |
|
|||||||||||
| Reconciliation to consolidated net income: | |||||||||||||||||
| Corporate interest income |
|
||||||||||||||||
| Income from other investments, net |
|
||||||||||||||||
| General and administrative |
(
|
||||||||||||||||
| Other expenses |
(
|
||||||||||||||||
| Interest and related amortization |
(
|
||||||||||||||||
| Income tax benefit |
|
||||||||||||||||
| Equity in income of unconsolidated joint ventures |
|
||||||||||||||||
| Early debt retirement |
(
|
||||||||||||||||
| Consolidated net income | $ |
|
|||||||||||||||
| Total assets | $ |
|
$ |
|
$ |
|
|||||||||||
| Capital improvements | $ |
|
$ |
|
$ |
|
|||||||||||
F-29
Equity LifeStyle Properties, Inc.
Notes to Consolidated Financial Statements
Note 17—Reportable Segments (continued)
| Year Ended December 31, 2022 | |||||||||||||||||
| (amounts in thousands) |
Property
Operations |
Home Sales
and Rentals Operations |
Consolidated | ||||||||||||||
| Operations revenues | $ |
|
$ |
|
$ |
|
|||||||||||
| Operations expenses |
(
|
(
|
(
|
||||||||||||||
| Income from segment operations |
|
|
|
||||||||||||||
| Interest income |
|
|
|
||||||||||||||
| Depreciation and amortization |
(
|
(
|
(
|
||||||||||||||
| Income (loss) from operations | $ |
|
$ |
|
$ |
|
|||||||||||
| Reconciliation to consolidated net income: | |||||||||||||||||
| Corporate interest income |
|
||||||||||||||||
| Income from other investments, net |
|
||||||||||||||||
| General and administrative |
(
|
||||||||||||||||
| Other expenses |
(
|
||||||||||||||||
| Interest and related amortization |
(
|
||||||||||||||||
| Equity in income of unconsolidated joint ventures |
|
||||||||||||||||
| Early debt retirement |
(
|
||||||||||||||||
| Consolidated net income | $ |
|
|||||||||||||||
| Total assets | $ |
|
$ |
|
$ |
|
|||||||||||
| Capital improvements | $ |
|
$ |
|
$ |
|
|||||||||||
| Year Ended December 31, 2021 | |||||||||||||||||
| (amounts in thousands) |
Property
Operations |
Home Sales
and Rentals Operations |
Consolidated | ||||||||||||||
| Operations revenues | $ |
|
$ |
|
$ |
|
|||||||||||
| Operations expenses |
(
|
(
|
(
|
||||||||||||||
| Income from segment operations |
|
|
|
||||||||||||||
| Interest income |
|
|
|
||||||||||||||
| Depreciation and amortization |
(
|
(
|
(
|
||||||||||||||
| Loss on sale of real estate, net |
(
|
|
(
|
||||||||||||||
| Income (loss) from operations | $ |
|
$ |
|
$ |
|
|||||||||||
| Reconciliation to consolidated net income: | |||||||||||||||||
| Corporate interest income |
|
||||||||||||||||
| Income from other investments, net |
|
||||||||||||||||
| General and administrative |
(
|
||||||||||||||||
| Other expenses |
(
|
||||||||||||||||
| Interest and related amortization |
(
|
||||||||||||||||
| Equity in income of unconsolidated joint ventures |
|
||||||||||||||||
| Early debt retirement |
(
|
||||||||||||||||
| Consolidated net income | $ |
|
|||||||||||||||
| Total assets | $ |
|
$ |
|
$ |
|
|||||||||||
| Capital Improvements | $ |
|
$ |
|
$ |
|
|||||||||||
F-30
Equity LifeStyle Properties, Inc.
Notes to Consolidated Financial Statements
Note 17—Reportable Segments (continued)
The following table summarizes our financial information for the Property Operations segment for the years ended December 31, 2023, 2022 and 2021:
| Years Ended December 31, | |||||||||||||||||
| (amounts in thousands) | 2023 | 2022 | 2021 | ||||||||||||||
| Revenues: | |||||||||||||||||
| Rental income | $ |
|
$ |
|
$ |
|
|||||||||||
| Annual membership subscriptions |
|
|
|
||||||||||||||
| Membership upgrade sales |
|
|
|
||||||||||||||
| Other income |
|
|
|
||||||||||||||
| Gross revenues from ancillary services |
|
|
|
||||||||||||||
| Total property operations revenues |
|
|
|
||||||||||||||
| Expenses: | |||||||||||||||||
| Property operating and maintenance |
|
|
|
||||||||||||||
| Real estate taxes |
|
|
|
||||||||||||||
| Membership sales and marketing |
|
|
|
||||||||||||||
| Cost of ancillary services |
|
|
|
||||||||||||||
| Ancillary operating expenses |
|
|
|
||||||||||||||
| Property management |
|
|
|
||||||||||||||
| Total property operations expenses |
|
|
|
||||||||||||||
| Income from property operations segment | $ |
|
$ |
|
$ |
|
|||||||||||
The following table summarizes our financial information for the Home Sales and Rentals Operations segment for the years ended December 31, 2023, 2022 and 2021:
| Years Ended December 31, | |||||||||||||||||
| (amounts in thousands) | 2023 | 2022 | 2021 | ||||||||||||||
| Revenues: | |||||||||||||||||
|
Rental income
(1)
|
$ |
|
$ |
|
$ |
|
|||||||||||
| Gross revenue from home sales and brokered resales |
|
|
|
||||||||||||||
| Total revenues |
|
|
|
||||||||||||||
| Expenses: | |||||||||||||||||
| Cost of home sales and brokered resales |
|
|
|
||||||||||||||
| Home selling expenses |
|
|
|
||||||||||||||
| Rental home operating and maintenance |
|
|
|
||||||||||||||
| Total expenses |
|
|
|
||||||||||||||
| Income from home sales and rentals operations segment | $ |
|
$ |
|
$ |
|
|||||||||||
_____________________
(1)
Rental income within Home Sales and Rentals Operations does not include base rent related to the rental home Sites. Base rent is included within property operations.
Note 18—
Subsequent Events
Equity Incentive Awards
On February 2, 2024, the Compensation Committee approved the 2024 Restricted Stock Award Program for certain members of our management team pursuant to the authority set forth in the 2014 Plan. As a result, we awarded
90,378
shares of restricted stock. Of these shares,
50
% are time-based awards, vesting in equal installments over a
three-year
period on February 4, 2025, February 3, 2026 and February 2, 2027, respectively, and have a grant date fair value of $
3.0
million. The remaining
50
% are performance-based awards vesting in equal installments on February 4, 2025, February 3, 2026 and February 2, 2027, respectively, upon meeting performance conditions to be established by the Compensation Committee in the year of the vesting
F-31
Equity LifeStyle Properties, Inc.
Notes to Consolidated Financial Statements
Note 18—Subsequent Events (continued)
period. They are valued using the closing price at the grant date when all the key terms and conditions are known to all parties. The
15,062
shares of restricted stock subject to 2024 performance goals have a grant date fair value of $
1.0
million.
Dividend
F-32
Schedule III
Equity LifeStyle Properties, Inc.
Real Estate and Accumulated Depreciation
| Initial Cost to ELS |
Costs Capitalized
Subsequent to Acquisition (Improvements) |
Gross Amount Carried at 12/31/23 | ||||||||||||||||||||||||||||||||||||||||||||||||||||||||||||||||||||||||
|
Real Estate
(1)
|
Location | Encumbrances | Land | Depreciable Property | Land | Depreciable Property | Land | Depreciable Property |
Total
(3)
|
Accumulated
Depreciation |
Date of
Acquisition |
|||||||||||||||||||||||||||||||||||||||||||||||||||||||||||||||
| Properties Held for Long Term | ||||||||||||||||||||||||||||||||||||||||||||||||||||||||||||||||||||||||||
| Hidden Cove |
|
|
$ |
|
$ |
|
$ |
|
$ |
|
$ |
|
$ |
|
$ |
|
$ |
|
$ |
(
|
2006 | |||||||||||||||||||||||||||||||||||||||||||||||||||||
| Apache East |
|
|
(
|
|
|
|
|
|
|
|
(
|
2011 | ||||||||||||||||||||||||||||||||||||||||||||||||||||||||||||||
| Countryside RV |
|
|
(
|
|
|
|
|
|
|
|
(
|
2002 | ||||||||||||||||||||||||||||||||||||||||||||||||||||||||||||||
| Denali Park |
|
|
|
|
|
|
|
|
|
|
(
|
2011 | ||||||||||||||||||||||||||||||||||||||||||||||||||||||||||||||
| Dolce Vita |
|
|
(
|
|
|
|
|
|
|
|
(
|
2020 | ||||||||||||||||||||||||||||||||||||||||||||||||||||||||||||||
| Golden Sun RV |
|
|
(
|
|
|
|
|
|
|
|
(
|
2002 | ||||||||||||||||||||||||||||||||||||||||||||||||||||||||||||||
| Meridian RV Resort |
|
|
|
|
|
|
|
|
|
|
(
|
2020 | ||||||||||||||||||||||||||||||||||||||||||||||||||||||||||||||
| Valley Vista |
|
|
|
|
|
|
|
|
|
|
(
|
2010 | ||||||||||||||||||||||||||||||||||||||||||||||||||||||||||||||
| Casita Verde |
|
|
|
|
|
|
|
|
|
|
(
|
2006 | ||||||||||||||||||||||||||||||||||||||||||||||||||||||||||||||
| Fiesta Grande |
|
|
|
|
|
|
|
|
|
|
(
|
2006 | ||||||||||||||||||||||||||||||||||||||||||||||||||||||||||||||
| Foothills West |
|
|
|
|
|
|
|
|
|
|
(
|
2006 | ||||||||||||||||||||||||||||||||||||||||||||||||||||||||||||||
| Sunshine Valley |
|
|
(
|
|
|
|
|
|
|
|
(
|
2011 | ||||||||||||||||||||||||||||||||||||||||||||||||||||||||||||||
| Verde Valley |
|
|
|
|
|
|
|
|
|
|
(
|
2004 | ||||||||||||||||||||||||||||||||||||||||||||||||||||||||||||||
| Casa del Sol East II |
|
|
|
|
|
|
|
|
|
|
(
|
1996 | ||||||||||||||||||||||||||||||||||||||||||||||||||||||||||||||
| Casa del Sol East III |
|
|
|
|
|
|
|
|
|
|
(
|
1998 | ||||||||||||||||||||||||||||||||||||||||||||||||||||||||||||||
| Palm Shadows |
|
|
|
|
|
|
|
|
|
|
(
|
1993 | ||||||||||||||||||||||||||||||||||||||||||||||||||||||||||||||
| Hacienda De Valencia |
|
|
(
|
|
|
|
|
|
|
|
(
|
1984 | ||||||||||||||||||||||||||||||||||||||||||||||||||||||||||||||
| Mesa Spirit |
|
|
(
|
|
|
|
|
|
|
|
(
|
2014 | ||||||||||||||||||||||||||||||||||||||||||||||||||||||||||||||
| Monte Vista Resort |
|
|
(
|
|
|
|
|
|
|
|
(
|
2004 | ||||||||||||||||||||||||||||||||||||||||||||||||||||||||||||||
| Seyenna Vistas |
|
|
|
|
|
(
|
|
|
|
|
(
|
1994 | ||||||||||||||||||||||||||||||||||||||||||||||||||||||||||||||
| The Highlands at Brentwood |
|
|
(
|
|
|
|
|
|
|
|
(
|
1993 | ||||||||||||||||||||||||||||||||||||||||||||||||||||||||||||||
| ViewPoint RV & Golf Resort |
|
|
(
|
|
|
|
|
|
|
|
(
|
2004 | ||||||||||||||||||||||||||||||||||||||||||||||||||||||||||||||
| Apollo Village |
|
|
|
|
|
|
|
|
|
|
(
|
1994 | ||||||||||||||||||||||||||||||||||||||||||||||||||||||||||||||
| Casa del Sol West |
|
|
|
|
|
|
|
|
|
|
(
|
1996 | ||||||||||||||||||||||||||||||||||||||||||||||||||||||||||||||
| Carefree Manor |
|
|
|
|
|
|
|
|
|
|
(
|
1998 | ||||||||||||||||||||||||||||||||||||||||||||||||||||||||||||||
| Central Park |
|
|
(
|
|
|
|
|
|
|
|
(
|
1983 | ||||||||||||||||||||||||||||||||||||||||||||||||||||||||||||||
| Desert Skies |
|
|
(
|
|
|
|
|
|
|
|
(
|
1998 | ||||||||||||||||||||||||||||||||||||||||||||||||||||||||||||||
| Sunrise Heights |
|
|
(
|
|
|
|
|
|
|
|
(
|
1994 | ||||||||||||||||||||||||||||||||||||||||||||||||||||||||||||||
| Whispering Palms |
|
|
|
|
|
|
|
|
|
|
(
|
1998 | ||||||||||||||||||||||||||||||||||||||||||||||||||||||||||||||
| Desert Vista |
|
|
|
|
|
|
|
|
|
|
(
|
2010 | ||||||||||||||||||||||||||||||||||||||||||||||||||||||||||||||
| Sedona Shadows |
|
|
|
|
|
|
|
|
|
|
(
|
1997 | ||||||||||||||||||||||||||||||||||||||||||||||||||||||||||||||
| Venture In |
|
|
(
|
|
|
|
|
|
|
|
(
|
2006 | ||||||||||||||||||||||||||||||||||||||||||||||||||||||||||||||
| Paradise |
|
|
(
|
|
|
|
|
|
|
|
(
|
2004 | ||||||||||||||||||||||||||||||||||||||||||||||||||||||||||||||
| The Meadows AZ |
|
|
(
|
|
|
|
|
|
|
|
(
|
1994 | ||||||||||||||||||||||||||||||||||||||||||||||||||||||||||||||
S-1
Schedule III
Equity LifeStyle Properties, Inc.
Real Estate and Accumulated Depreciation
| Initial Cost to ELS |
Costs Capitalized
Subsequent to Acquisition (Improvements) |
Gross Amount Carried at 12/31/23 | ||||||||||||||||||||||||||||||||||||||||||||||||||||||||||||||||||||||||
|
Real Estate
(1)
|
Location | Encumbrances | Land | Depreciable Property | Land | Depreciable Property | Land | Depreciable Property |
Total
(3)
|
Accumulated
Depreciation |
Date of
Acquisition |
|||||||||||||||||||||||||||||||||||||||||||||||||||||||||||||||
| Fairview Manor |
|
|
|
|
|
|
|
|
|
|
(
|
1998 | ||||||||||||||||||||||||||||||||||||||||||||||||||||||||||||||
|
The Crossing at Voyager
(2)
|
|
|
|
|
|
|
|
|
|
|
(
|
2020 | ||||||||||||||||||||||||||||||||||||||||||||||||||||||||||||||
| Voyager |
|
|
(
|
|
|
|
|
|
|
|
(
|
2021 | ||||||||||||||||||||||||||||||||||||||||||||||||||||||||||||||
| Westpark |
|
|
(
|
|
|
|
|
|
|
|
(
|
2011 | ||||||||||||||||||||||||||||||||||||||||||||||||||||||||||||||
| Araby Acres |
|
|
|
|
|
|
|
|
|
|
(
|
2003 | ||||||||||||||||||||||||||||||||||||||||||||||||||||||||||||||
| Cactus Gardens |
|
|
(
|
|
|
|
|
|
|
|
(
|
2004 | ||||||||||||||||||||||||||||||||||||||||||||||||||||||||||||||
| Capri |
|
|
|
|
|
|
|
|
|
|
(
|
2006 | ||||||||||||||||||||||||||||||||||||||||||||||||||||||||||||||
| Desert Paradise |
|
|
|
|
|
|
|
|
|
|
(
|
2004 | ||||||||||||||||||||||||||||||||||||||||||||||||||||||||||||||
| Foothill Village |
|
|
|
|
|
|
|
|
|
|
(
|
2003 | ||||||||||||||||||||||||||||||||||||||||||||||||||||||||||||||
| Mesa Verde RV |
|
|
(
|
|
|
|
|
|
|
|
(
|
2007 | ||||||||||||||||||||||||||||||||||||||||||||||||||||||||||||||
| Suni Sands |
|
|
|
|
|
|
|
|
|
|
(
|
2004 | ||||||||||||||||||||||||||||||||||||||||||||||||||||||||||||||
| Cultus Lake |
|
|
|
|
|
|
|
|
|
|
(
|
2004 | ||||||||||||||||||||||||||||||||||||||||||||||||||||||||||||||
| Soledad Canyon |
|
|
|
|
|
|
|
|
|
|
(
|
2004 | ||||||||||||||||||||||||||||||||||||||||||||||||||||||||||||||
| Los Ranchos |
|
|
|
|
|
|
|
|
|
|
(
|
2011 | ||||||||||||||||||||||||||||||||||||||||||||||||||||||||||||||
| Monte del Lago |
|
|
(
|
|
|
|
|
|
|
|
(
|
1997 | ||||||||||||||||||||||||||||||||||||||||||||||||||||||||||||||
| Date Palm Country Club |
|
|
|
|
|
|
|
|
|
|
(
|
1994 | ||||||||||||||||||||||||||||||||||||||||||||||||||||||||||||||
| Palm Springs Oasis RV Resort |
|
|
|
|
|
|
|
|
|
|
(
|
1994 | ||||||||||||||||||||||||||||||||||||||||||||||||||||||||||||||
| Colony Park |
|
|
(
|
|
|
|
|
|
|
|
(
|
1998 | ||||||||||||||||||||||||||||||||||||||||||||||||||||||||||||||
| Russian River |
|
|
|
|
|
|
|
|
|
|
(
|
2004 | ||||||||||||||||||||||||||||||||||||||||||||||||||||||||||||||
| Oakzanita Springs |
|
|
|
|
|
|
|
|
|
|
(
|
2004 | ||||||||||||||||||||||||||||||||||||||||||||||||||||||||||||||
| Rancho Mesa |
|
|
(
|
|
|
|
|
|
|
|
(
|
1998 | ||||||||||||||||||||||||||||||||||||||||||||||||||||||||||||||
| Rancho Valley |
|
|
(
|
|
|
|
|
|
|
|
(
|
1983 | ||||||||||||||||||||||||||||||||||||||||||||||||||||||||||||||
| Snowflower |
|
|
|
|
|
|
|
|
|
|
(
|
2004 | ||||||||||||||||||||||||||||||||||||||||||||||||||||||||||||||
| Four Seasons |
|
|
|
|
|
|
|
|
|
|
(
|
1997 | ||||||||||||||||||||||||||||||||||||||||||||||||||||||||||||||
| Yosemite Lakes |
|
|
|
|
|
|
|
|
|
|
(
|
2004 | ||||||||||||||||||||||||||||||||||||||||||||||||||||||||||||||
| Royal Holiday |
|
|
|
|
|
|
|
|
|
|
(
|
1999 | ||||||||||||||||||||||||||||||||||||||||||||||||||||||||||||||
| Idyllwild |
|
|
|
|
|
|
|
|
|
|
(
|
2004 | ||||||||||||||||||||||||||||||||||||||||||||||||||||||||||||||
| Pio Pico |
|
|
|
|
|
|
|
|
|
|
(
|
2004 | ||||||||||||||||||||||||||||||||||||||||||||||||||||||||||||||
| Tahoe Valley |
|
|
|
|
|
|
|
|
|
|
(
|
2004 | ||||||||||||||||||||||||||||||||||||||||||||||||||||||||||||||
| Sea Oaks |
|
|
|
|
|
|
|
|
|
|
(
|
1997 | ||||||||||||||||||||||||||||||||||||||||||||||||||||||||||||||
| Ponderosa Resort |
|
|
|
|
|
|
|
|
|
|
(
|
2006 | ||||||||||||||||||||||||||||||||||||||||||||||||||||||||||||||
| Turtle Beach |
|
|
|
|
|
|
|
|
|
|
(
|
2004 | ||||||||||||||||||||||||||||||||||||||||||||||||||||||||||||||
| Marina Dunes RV Resort |
|
|
|
|
|
|
|
|
|
|
(
|
2020 | ||||||||||||||||||||||||||||||||||||||||||||||||||||||||||||||
| Wilderness Lakes |
|
|
|
|
|
|
|
|
|
|
(
|
2004 | ||||||||||||||||||||||||||||||||||||||||||||||||||||||||||||||
| Coralwood |
|
|
|
|
|
|
|
|
|
|
(
|
1997 | ||||||||||||||||||||||||||||||||||||||||||||||||||||||||||||||
S-2
Schedule III
Equity LifeStyle Properties, Inc.
Real Estate and Accumulated Depreciation
| Initial Cost to ELS |
Costs Capitalized
Subsequent to Acquisition (Improvements) |
Gross Amount Carried at 12/31/23 | ||||||||||||||||||||||||||||||||||||||||||||||||||||||||||||||||||||||||
|
Real Estate
(1)
|
Location | Encumbrances | Land | Depreciable Property | Land | Depreciable Property | Land | Depreciable Property |
Total
(3)
|
Accumulated
Depreciation |
Date of
Acquisition |
|||||||||||||||||||||||||||||||||||||||||||||||||||||||||||||||
| Morgan Hill |
|
|
|
|
|
|
|
|
|
|
(
|
2004 | ||||||||||||||||||||||||||||||||||||||||||||||||||||||||||||||
| Lake Minden |
|
|
|
|
|
|
|
|
|
|
(
|
2004 | ||||||||||||||||||||||||||||||||||||||||||||||||||||||||||||||
| Pacific Dunes Ranch |
|
|
|
|
|
|
|
|
|
|
(
|
2004 | ||||||||||||||||||||||||||||||||||||||||||||||||||||||||||||||
| Oceanside RV |
|
|
|
|
|
|
|
|
|
|
(
|
2022 | ||||||||||||||||||||||||||||||||||||||||||||||||||||||||||||||
| Lake of the Springs |
|
|
|
|
|
|
|
|
|
|
(
|
2004 | ||||||||||||||||||||||||||||||||||||||||||||||||||||||||||||||
| Concord Cascade |
|
|
(
|
|
|
|
|
|
|
|
(
|
1983 | ||||||||||||||||||||||||||||||||||||||||||||||||||||||||||||||
| San Francisco RV |
|
|
|
|
|
|
|
|
|
|
(
|
2005 | ||||||||||||||||||||||||||||||||||||||||||||||||||||||||||||||
| San Benito |
|
|
|
|
|
|
|
|
|
|
(
|
2004 | ||||||||||||||||||||||||||||||||||||||||||||||||||||||||||||||
| Palm Springs |
|
|
|
|
|
|
|
|
|
|
(
|
2004 | ||||||||||||||||||||||||||||||||||||||||||||||||||||||||||||||
| Las Palmas Estates |
|
|
|
|
|
|
|
|
|
|
(
|
2004 | ||||||||||||||||||||||||||||||||||||||||||||||||||||||||||||||
| Parque La Quinta |
|
|
|
|
|
|
|
|
|
|
(
|
2004 | ||||||||||||||||||||||||||||||||||||||||||||||||||||||||||||||
| Quail Meadows |
|
|
|
|
|
|
|
|
|
|
(
|
1998 | ||||||||||||||||||||||||||||||||||||||||||||||||||||||||||||||
| California Hawaiian |
|
|
(
|
|
|
|
|
|
|
|
(
|
1997 | ||||||||||||||||||||||||||||||||||||||||||||||||||||||||||||||
| Nicholson Plaza |
|
|
|
|
|
|
(
|
|
|
|
|
1997 | ||||||||||||||||||||||||||||||||||||||||||||||||||||||||||||||
| Sunshadow |
|
|
|
|
|
|
|
|
|
|
(
|
1997 | ||||||||||||||||||||||||||||||||||||||||||||||||||||||||||||||
| Village of the Four Seasons |
|
|
(
|
|
|
|
|
|
|
|
(
|
2004 | ||||||||||||||||||||||||||||||||||||||||||||||||||||||||||||||
| Westwinds (4 properties) |
|
|
|
|
|
|
(
|
|
|
|
|
1997 | ||||||||||||||||||||||||||||||||||||||||||||||||||||||||||||||
| Laguna Lake |
|
|
(
|
|
|
|
|
|
|
|
(
|
1998 | ||||||||||||||||||||||||||||||||||||||||||||||||||||||||||||||
| Contempo Marin |
|
|
(
|
|
|
|
|
|
|
|
(
|
1994 | ||||||||||||||||||||||||||||||||||||||||||||||||||||||||||||||
| Rancho Oso |
|
|
|
|
|
|
|
|
|
|
(
|
2004 | ||||||||||||||||||||||||||||||||||||||||||||||||||||||||||||||
| De Anza Santa Cruz |
|
|
(
|
|
|
|
|
|
|
|
(
|
1994 | ||||||||||||||||||||||||||||||||||||||||||||||||||||||||||||||
| Meadowbrook |
|
|
(
|
|
|
|
|
|
|
|
(
|
1998 | ||||||||||||||||||||||||||||||||||||||||||||||||||||||||||||||
| Santa Cruz Ranch |
|
|
|
|
|
|
|
|
|
|
(
|
2007 | ||||||||||||||||||||||||||||||||||||||||||||||||||||||||||||||
| Lamplighter Village |
|
|
(
|
|
|
|
|
|
|
|
(
|
1983 | ||||||||||||||||||||||||||||||||||||||||||||||||||||||||||||||
| Santiago Estates |
|
|
(
|
|
|
|
|
|
|
|
(
|
1998 | ||||||||||||||||||||||||||||||||||||||||||||||||||||||||||||||
| Royal Oaks |
|
|
|
|
|
|
|
|
|
|
(
|
1997 | ||||||||||||||||||||||||||||||||||||||||||||||||||||||||||||||
| Pilot Knob RV Resort |
|
|
|
|
|
|
|
|
|
|
(
|
2022 | ||||||||||||||||||||||||||||||||||||||||||||||||||||||||||||||
| Hillcrest Village CO |
|
|
(
|
|
|
|
|
|
|
|
(
|
1983 | ||||||||||||||||||||||||||||||||||||||||||||||||||||||||||||||
| Cimarron Village |
|
|
(
|
|
|
|
|
|
|
|
(
|
1983 | ||||||||||||||||||||||||||||||||||||||||||||||||||||||||||||||
| Holiday Village CO |
|
|
(
|
|
|
|
|
|
|
|
(
|
1983 | ||||||||||||||||||||||||||||||||||||||||||||||||||||||||||||||
| Bear Creek Village |
|
|
(
|
|
|
|
|
|
|
|
(
|
1998 | ||||||||||||||||||||||||||||||||||||||||||||||||||||||||||||||
| Holiday Hills Village |
|
|
(
|
|
|
|
|
|
|
|
(
|
1983 | ||||||||||||||||||||||||||||||||||||||||||||||||||||||||||||||
| Golden Terrace |
|
|
|
|
|
|
|
|
|
|
(
|
1983 | ||||||||||||||||||||||||||||||||||||||||||||||||||||||||||||||
| Golden Terrace South |
|
|
|
|
|
|
|
|
|
|
(
|
1997 | ||||||||||||||||||||||||||||||||||||||||||||||||||||||||||||||
| Golden Terrace West |
|
|
|
|
|
|
|
|
|
|
(
|
1986 | ||||||||||||||||||||||||||||||||||||||||||||||||||||||||||||||
S-3
Schedule III
Equity LifeStyle Properties, Inc.
Real Estate and Accumulated Depreciation
| Initial Cost to ELS |
Costs Capitalized
Subsequent to Acquisition (Improvements) |
Gross Amount Carried at 12/31/23 | ||||||||||||||||||||||||||||||||||||||||||||||||||||||||||||||||||||||||
|
Real Estate
(1)
|
Location | Encumbrances | Land | Depreciable Property | Land | Depreciable Property | Land | Depreciable Property |
Total
(3)
|
Accumulated
Depreciation |
Date of
Acquisition |
|||||||||||||||||||||||||||||||||||||||||||||||||||||||||||||||
| Blue Mesa Recreational Ranch |
|
|
|
|
|
|
|
|
|
|
(
|
2022 | ||||||||||||||||||||||||||||||||||||||||||||||||||||||||||||||
| Pueblo Grande |
|
|
|
|
|
|
|
|
|
|
(
|
1983 | ||||||||||||||||||||||||||||||||||||||||||||||||||||||||||||||
| Woodland Hills |
|
|
(
|
|
|
|
|
|
|
|
(
|
1994 | ||||||||||||||||||||||||||||||||||||||||||||||||||||||||||||||
| Stonegate Manor |
|
|
|
|
|
|
|
|
|
|
(
|
2011 | ||||||||||||||||||||||||||||||||||||||||||||||||||||||||||||||
| Waterford Estates |
|
|
(
|
|
|
|
|
|
|
|
(
|
1996 | ||||||||||||||||||||||||||||||||||||||||||||||||||||||||||||||
| McNicol Place |
|
|
|
|
|
|
|
|
|
|
(
|
1998 | ||||||||||||||||||||||||||||||||||||||||||||||||||||||||||||||
| Whispering Pines |
|
|
|
|
|
|
|
|
|
|
(
|
1988 | ||||||||||||||||||||||||||||||||||||||||||||||||||||||||||||||
| Mariner's Cove |
|
|
(
|
|
|
|
|
|
|
|
(
|
1987 | ||||||||||||||||||||||||||||||||||||||||||||||||||||||||||||||
| Sweetbriar |
|
|
|
|
|
|
|
|
|
|
(
|
1998 | ||||||||||||||||||||||||||||||||||||||||||||||||||||||||||||||
| Aspen Meadows |
|
|
(
|
|
|
|
|
|
|
|
(
|
1998 | ||||||||||||||||||||||||||||||||||||||||||||||||||||||||||||||
| Camelot Meadows |
|
|
|
|
|
|
|
|
|
|
(
|
1998 | ||||||||||||||||||||||||||||||||||||||||||||||||||||||||||||||
| Riverside RV Resort |
|
|
|
|
|
|
|
|
|
|
(
|
2016 | ||||||||||||||||||||||||||||||||||||||||||||||||||||||||||||||
| Toby’s RV Resort |
|
|
|
|
|
|
|
|
|
|
(
|
2003 | ||||||||||||||||||||||||||||||||||||||||||||||||||||||||||||||
| Aventura Marina |
|
|
|
|
|
|
|
|
|
|
(
|
2019 | ||||||||||||||||||||||||||||||||||||||||||||||||||||||||||||||
| Hi-Lift Marina |
|
|
|
|
|
|
|
|
|
|
(
|
2021 | ||||||||||||||||||||||||||||||||||||||||||||||||||||||||||||||
| Sunshine Key |
|
|
|
|
|
|
|
|
|
|
(
|
2004 | ||||||||||||||||||||||||||||||||||||||||||||||||||||||||||||||
| Windmill Manor |
|
|
(
|
|
|
|
|
|
|
|
(
|
1998 | ||||||||||||||||||||||||||||||||||||||||||||||||||||||||||||||
| Winter Quarters Manatee |
|
|
|
|
|
|
|
|
|
|
(
|
2004 | ||||||||||||||||||||||||||||||||||||||||||||||||||||||||||||||
| Clover Leaf Farms |
|
|
(
|
|
|
|
|
|
|
|
(
|
2011 | ||||||||||||||||||||||||||||||||||||||||||||||||||||||||||||||
| Clover Leaf Forest |
|
|
|
|
|
|
|
|
|
|
(
|
2011 | ||||||||||||||||||||||||||||||||||||||||||||||||||||||||||||||
| Myriad Development - Resort at Tranquility Lake |
|
|
|
|
|
|
|
|
|
|
(
|
2020 | ||||||||||||||||||||||||||||||||||||||||||||||||||||||||||||||
| Palm Harbour Marina |
|
|
|
|
|
|
(
|
|
|
|
(
|
2021 | ||||||||||||||||||||||||||||||||||||||||||||||||||||||||||||||
| Glen Ellen |
|
|
|
|
|
|
|
|
|
|
(
|
2002 | ||||||||||||||||||||||||||||||||||||||||||||||||||||||||||||||
| Hillcrest FL |
|
|
|
|
|
|
|
|
|
|
(
|
1998 | ||||||||||||||||||||||||||||||||||||||||||||||||||||||||||||||
| Holiday Ranch |
|
|
|
|
|
|
|
|
|
|
(
|
1998 | ||||||||||||||||||||||||||||||||||||||||||||||||||||||||||||||
| Serendipity |
|
|
(
|
|
|
|
|
|
|
|
(
|
2018 | ||||||||||||||||||||||||||||||||||||||||||||||||||||||||||||||
| Shady Lane Oaks |
|
|
|
|
|
|
|
|
|
|
(
|
2011 | ||||||||||||||||||||||||||||||||||||||||||||||||||||||||||||||
| Shady Lane Village |
|
|
|
|
|
|
|
|
|
|
(
|
2011 | ||||||||||||||||||||||||||||||||||||||||||||||||||||||||||||||
| Silk Oak Lodge |
|
|
|
|
|
|
|
|
|
|
(
|
2002 | ||||||||||||||||||||||||||||||||||||||||||||||||||||||||||||||
| Clerbrook Golf & RV Resort |
|
|
|
|
|
|
|
|
|
|
(
|
2006 | ||||||||||||||||||||||||||||||||||||||||||||||||||||||||||||||
| Lake Magic |
|
|
|
|
|
|
|
|
|
|
(
|
2004 | ||||||||||||||||||||||||||||||||||||||||||||||||||||||||||||||
| Orange Lake |
|
|
|
|
|
|
|
|
|
|
(
|
2011 | ||||||||||||||||||||||||||||||||||||||||||||||||||||||||||||||
| Orlando |
|
|
|
|
|
|
|
|
|
|
(
|
2004 | ||||||||||||||||||||||||||||||||||||||||||||||||||||||||||||||
| Cortez Village Marina |
|
|
|
|
|
|
|
|
|
|
(
|
2021 | ||||||||||||||||||||||||||||||||||||||||||||||||||||||||||||||
S-4
Schedule III
Equity LifeStyle Properties, Inc.
Real Estate and Accumulated Depreciation
| Initial Cost to ELS |
Costs Capitalized
Subsequent to Acquisition (Improvements) |
Gross Amount Carried at 12/31/23 | ||||||||||||||||||||||||||||||||||||||||||||||||||||||||||||||||||||||||
|
Real Estate
(1)
|
Location | Encumbrances | Land | Depreciable Property | Land | Depreciable Property | Land | Depreciable Property |
Total
(3)
|
Accumulated
Depreciation |
Date of
Acquisition |
|||||||||||||||||||||||||||||||||||||||||||||||||||||||||||||||
| Crystal Isles |
|
|
|
|
|
|
|
|
|
|
(
|
2004 | ||||||||||||||||||||||||||||||||||||||||||||||||||||||||||||||
| Cheron Village |
|
|
|
|
|
|
|
|
|
|
(
|
2011 | ||||||||||||||||||||||||||||||||||||||||||||||||||||||||||||||
| Carriage Cove |
|
|
(
|
|
|
|
|
|
|
|
(
|
1998 | ||||||||||||||||||||||||||||||||||||||||||||||||||||||||||||||
| Daytona Beach Marina |
|
|
|
|
|
|
|
|
|
|
(
|
2019 | ||||||||||||||||||||||||||||||||||||||||||||||||||||||||||||||
| Lake Haven |
|
|
(
|
|
|
|
|
|
|
|
(
|
1983 | ||||||||||||||||||||||||||||||||||||||||||||||||||||||||||||||
| Marker 1 Marina |
|
|
|
|
|
|
|
|
|
|
(
|
2020 | ||||||||||||||||||||||||||||||||||||||||||||||||||||||||||||||
| Coquina Crossing |
|
|
(
|
|
|
|
|
|
|
|
(
|
1999 | ||||||||||||||||||||||||||||||||||||||||||||||||||||||||||||||
| Colony Cove |
|
|
(
|
|
|
|
|
|
|
|
(
|
2011 | ||||||||||||||||||||||||||||||||||||||||||||||||||||||||||||||
| Ridgewood Estates |
|
|
(
|
|
|
|
|
|
|
|
(
|
2011 | ||||||||||||||||||||||||||||||||||||||||||||||||||||||||||||||
| Haselton Village |
|
|
|
|
|
|
|
|
|
|
(
|
2011 | ||||||||||||||||||||||||||||||||||||||||||||||||||||||||||||||
| Southern Palms RV |
|
|
|
|
|
|
|
|
|
|
(
|
1998 | ||||||||||||||||||||||||||||||||||||||||||||||||||||||||||||||
| Bulow Plantation |
|
|
|
|
|
|
|
|
|
|
(
|
1994 | ||||||||||||||||||||||||||||||||||||||||||||||||||||||||||||||
| Bulow RV |
|
|
|
|
|
|
|
|
|
|
(
|
1994 | ||||||||||||||||||||||||||||||||||||||||||||||||||||||||||||||
| Carefree Cove |
|
|
|
|
|
|
|
|
|
|
(
|
2004 | ||||||||||||||||||||||||||||||||||||||||||||||||||||||||||||||
| Everglades Lakes |
|
|
|
|
|
|
|
|
|
|
(
|
2018 | ||||||||||||||||||||||||||||||||||||||||||||||||||||||||||||||
| Park City West |
|
|
(
|
|
|
|
|
|
|
|
(
|
2004 | ||||||||||||||||||||||||||||||||||||||||||||||||||||||||||||||
| Sunshine Holiday MH |
|
|
(
|
|
|
|
|
|
|
|
(
|
2004 | ||||||||||||||||||||||||||||||||||||||||||||||||||||||||||||||
| Crystal Lakes-Fort Myers |
|
|
|
|
|
|
|
|
|
|
(
|
2018 | ||||||||||||||||||||||||||||||||||||||||||||||||||||||||||||||
| Fish Tale Marina |
|
|
|
|
|
|
|
|
|
|
(
|
2021 | ||||||||||||||||||||||||||||||||||||||||||||||||||||||||||||||
| Fort Myers Beach |
|
|
|
|
|
|
|
|
|
|
(
|
2004 | ||||||||||||||||||||||||||||||||||||||||||||||||||||||||||||||
| Gulf Air |
|
|
|
|
|
|
|
|
|
|
(
|
2004 | ||||||||||||||||||||||||||||||||||||||||||||||||||||||||||||||
| Lakeside Terrace |
|
|
|
|
|
|
|
|
|
|
(
|
2011 | ||||||||||||||||||||||||||||||||||||||||||||||||||||||||||||||
| Grand Island Resort |
|
|
|
|
|
|
|
|
|
|
(
|
2001 | ||||||||||||||||||||||||||||||||||||||||||||||||||||||||||||||
| Holiday Travel Park |
|
|
|
|
|
|
|
|
|
|
(
|
2018 | ||||||||||||||||||||||||||||||||||||||||||||||||||||||||||||||
| Hollywood Marina |
|
|
|
|
|
|
|
|
|
|
(
|
2019 | ||||||||||||||||||||||||||||||||||||||||||||||||||||||||||||||
| South Miami Marina |
|
|
|
|
|
|
|
|
|
|
(
|
2019 | ||||||||||||||||||||||||||||||||||||||||||||||||||||||||||||||
| Barrington Hills |
|
|
(
|
|
|
|
|
|
|
|
(
|
2004 | ||||||||||||||||||||||||||||||||||||||||||||||||||||||||||||||
| Jupiter Marina |
|
|
|
|
|
|
|
|
|
|
(
|
2019 | ||||||||||||||||||||||||||||||||||||||||||||||||||||||||||||||
| Sherwood Forest - MHP |
|
|
|
|
|
|
|
|
|
|
(
|
1998 | ||||||||||||||||||||||||||||||||||||||||||||||||||||||||||||||
| Sherwood Forest RV |
|
|
|
|
|
|
|
|
|
|
(
|
1998 | ||||||||||||||||||||||||||||||||||||||||||||||||||||||||||||||
| Tropical Palms |
|
|
|
|
|
|
|
|
|
|
(
|
2004 | ||||||||||||||||||||||||||||||||||||||||||||||||||||||||||||||
| Lake Worth Village |
|
|
|
|
|
|
|
|
|
|
(
|
2011 | ||||||||||||||||||||||||||||||||||||||||||||||||||||||||||||||
| Beacon Hill Colony |
|
|
|
|
|
|
|
|
|
|
(
|
2011 | ||||||||||||||||||||||||||||||||||||||||||||||||||||||||||||||
| Beacon Terrace |
|
|
(
|
|
|
|
|
|
|
|
(
|
2011 | ||||||||||||||||||||||||||||||||||||||||||||||||||||||||||||||
| Kings & Queens |
|
|
|
|
|
|
|
|
|
|
(
|
2011 | ||||||||||||||||||||||||||||||||||||||||||||||||||||||||||||||
S-5
Schedule III
Equity LifeStyle Properties, Inc.
Real Estate and Accumulated Depreciation
| Initial Cost to ELS |
Costs Capitalized
Subsequent to Acquisition (Improvements) |
Gross Amount Carried at 12/31/23 | ||||||||||||||||||||||||||||||||||||||||||||||||||||||||||||||||||||||||
|
Real Estate
(1)
|
Location | Encumbrances | Land | Depreciable Property | Land | Depreciable Property | Land | Depreciable Property |
Total
(3)
|
Accumulated
Depreciation |
Date of
Acquisition |
|||||||||||||||||||||||||||||||||||||||||||||||||||||||||||||||
| Lakeland Harbor |
|
|
(
|
|
|
|
|
|
|
|
(
|
2011 | ||||||||||||||||||||||||||||||||||||||||||||||||||||||||||||||
| Lakeland Junction |
|
|
(
|
|
|
|
|
|
|
|
(
|
2011 | ||||||||||||||||||||||||||||||||||||||||||||||||||||||||||||||
| Lantana Marina |
|
|
|
|
|
|
(
|
|
|
|
(
|
2019 | ||||||||||||||||||||||||||||||||||||||||||||||||||||||||||||||
| Maralago Cay |
|
|
(
|
|
|
|
|
|
|
|
(
|
1997 | ||||||||||||||||||||||||||||||||||||||||||||||||||||||||||||||
| South Lantana Marina |
|
|
|
|
|
|
|
|
|
|
(
|
2019 | ||||||||||||||||||||||||||||||||||||||||||||||||||||||||||||||
| Down Yonder |
|
|
|
|
|
|
|
|
|
|
(
|
1998 | ||||||||||||||||||||||||||||||||||||||||||||||||||||||||||||||
| East Bay Oaks |
|
|
(
|
|
|
|
|
|
|
|
(
|
1983 | ||||||||||||||||||||||||||||||||||||||||||||||||||||||||||||||
| Eldorado Village |
|
|
(
|
|
|
|
|
|
|
|
(
|
1983 | ||||||||||||||||||||||||||||||||||||||||||||||||||||||||||||||
| Paradise Park - Largo |
|
|
(
|
|
|
|
|
|
|
|
(
|
2017 | ||||||||||||||||||||||||||||||||||||||||||||||||||||||||||||||
| Shangri-La Mobile Home Park |
|
|
|
|
|
|
|
|
|
|
(
|
2004 | ||||||||||||||||||||||||||||||||||||||||||||||||||||||||||||||
| Vacation Village |
|
|
(
|
|
|
|
|
|
|
|
(
|
2004 | ||||||||||||||||||||||||||||||||||||||||||||||||||||||||||||||
| Whispering Pines - Largo |
|
|
|
|
|
|
|
|
|
|
(
|
2011 | ||||||||||||||||||||||||||||||||||||||||||||||||||||||||||||||
| Coachwood Colony |
|
|
|
|
|
|
|
|
|
|
(
|
2004 | ||||||||||||||||||||||||||||||||||||||||||||||||||||||||||||||
| Mid-Florida Lakes |
|
|
(
|
|
|
|
|
|
|
|
(
|
1994 | ||||||||||||||||||||||||||||||||||||||||||||||||||||||||||||||
| Fiesta Key |
|
|
|
|
|
|
|
|
|
|
(
|
2013 | ||||||||||||||||||||||||||||||||||||||||||||||||||||||||||||||
| Winter Quarters Pasco |
|
|
(
|
|
|
|
|
|
|
|
(
|
2004 | ||||||||||||||||||||||||||||||||||||||||||||||||||||||||||||||
| Coral Cay Plantation |
|
|
(
|
|
|
|
|
|
|
|
(
|
1994 | ||||||||||||||||||||||||||||||||||||||||||||||||||||||||||||||
| Lakewood Village |
|
|
|
|
|
|
|
|
|
|
(
|
1994 | ||||||||||||||||||||||||||||||||||||||||||||||||||||||||||||||
| Miami Everglades |
|
|
|
|
|
|
|
|
|
|
(
|
2015 | ||||||||||||||||||||||||||||||||||||||||||||||||||||||||||||||
| Southernaire |
|
|
|
|
|
|
|
|
|
|
(
|
2004 | ||||||||||||||||||||||||||||||||||||||||||||||||||||||||||||||
|
Country Place
(2)
|
|
|
(
|
|
|
|
|
|
|
|
(
|
1986 | ||||||||||||||||||||||||||||||||||||||||||||||||||||||||||||||
| Hacienda Village |
|
|
(
|
|
|
|
|
|
|
|
(
|
2002 | ||||||||||||||||||||||||||||||||||||||||||||||||||||||||||||||
| Harbor View Mobile Manor |
|
|
(
|
|
|
|
|
|
|
|
(
|
2002 | ||||||||||||||||||||||||||||||||||||||||||||||||||||||||||||||
| Bay Lake Estates |
|
|
(
|
|
|
|
|
|
|
|
(
|
1994 | ||||||||||||||||||||||||||||||||||||||||||||||||||||||||||||||
| Lake Village |
|
|
(
|
|
|
|
|
|
|
|
(
|
2011 | ||||||||||||||||||||||||||||||||||||||||||||||||||||||||||||||
| Royal Coachman |
|
|
|
|
|
|
|
|
|
|
(
|
2004 | ||||||||||||||||||||||||||||||||||||||||||||||||||||||||||||||
| Buccaneer Estates |
|
|
|
|
|
|
|
|
|
|
(
|
1994 | ||||||||||||||||||||||||||||||||||||||||||||||||||||||||||||||
| Island Vista Estates |
|
|
|
|
|
|
|
|
|
|
(
|
2006 | ||||||||||||||||||||||||||||||||||||||||||||||||||||||||||||||
| Lake Fairways |
|
|
(
|
|
|
|
|
|
|
|
(
|
1994 | ||||||||||||||||||||||||||||||||||||||||||||||||||||||||||||||
| Pine Lakes |
|
|
(
|
|
|
|
|
|
|
|
(
|
1994 | ||||||||||||||||||||||||||||||||||||||||||||||||||||||||||||||
| Pioneer Village |
|
|
(
|
|
|
|
|
|
|
|
(
|
2004 | ||||||||||||||||||||||||||||||||||||||||||||||||||||||||||||||
| Sunseekers RV Resort |
|
|
|
|
|
|
|
|
|
|
(
|
2018 | ||||||||||||||||||||||||||||||||||||||||||||||||||||||||||||||
| The Heritage |
|
|
|
|
|
|
|
|
|
|
(
|
1993 | ||||||||||||||||||||||||||||||||||||||||||||||||||||||||||||||
| Windmill Village - N. Ft. Myers |
|
|
|
|
|
|
|
|
|
|
(
|
1983 | ||||||||||||||||||||||||||||||||||||||||||||||||||||||||||||||
| Foxwood Farms |
|
|
|
|
|
|
|
|
|
|
(
|
2011 | ||||||||||||||||||||||||||||||||||||||||||||||||||||||||||||||
S-6
Schedule III
Equity LifeStyle Properties, Inc.
Real Estate and Accumulated Depreciation
| Initial Cost to ELS |
Costs Capitalized
Subsequent to Acquisition (Improvements) |
Gross Amount Carried at 12/31/23 | ||||||||||||||||||||||||||||||||||||||||||||||||||||||||||||||||||||||||
|
Real Estate
(1)
|
Location | Encumbrances | Land | Depreciable Property | Land | Depreciable Property | Land | Depreciable Property |
Total
(3)
|
Accumulated
Depreciation |
Date of
Acquisition |
|||||||||||||||||||||||||||||||||||||||||||||||||||||||||||||||
| Oak Bend |
|
|
|
|
|
|
|
|
|
|
(
|
1993 | ||||||||||||||||||||||||||||||||||||||||||||||||||||||||||||||
| Villas at Spanish Oaks |
|
|
|
|
|
|
|
|
|
|
(
|
1993 | ||||||||||||||||||||||||||||||||||||||||||||||||||||||||||||||
| Silver Dollar Golf & Trap Club Resort |
|
|
|
|
|
|
|
|
|
|
(
|
2004 | ||||||||||||||||||||||||||||||||||||||||||||||||||||||||||||||
| Okeechobee RV Resort |
|
|
|
|
|
|
|
|
|
|
(
|
2021 | ||||||||||||||||||||||||||||||||||||||||||||||||||||||||||||||
| Audubon Village - Florida |
|
|
|
|
|
|
|
|
|
|
(
|
2011 | ||||||||||||||||||||||||||||||||||||||||||||||||||||||||||||||
| Hidden Valley |
|
|
(
|
|
|
|
|
|
|
|
(
|
2011 | ||||||||||||||||||||||||||||||||||||||||||||||||||||||||||||||
| Starlight Ranch |
|
|
(
|
|
|
|
|
|
|
|
(
|
2011 | ||||||||||||||||||||||||||||||||||||||||||||||||||||||||||||||
| Holiday Village, Ormond Beach |
|
|
|
|
|
|
|
|
|
|
(
|
2002 | ||||||||||||||||||||||||||||||||||||||||||||||||||||||||||||||
| Sunshine Holiday-Daytona North |
|
|
|
|
|
|
|
|
|
|
(
|
2004 | ||||||||||||||||||||||||||||||||||||||||||||||||||||||||||||||
| Palm Beach Gardens Marina |
|
|
|
|
|
|
|
|
|
|
(
|
2019 | ||||||||||||||||||||||||||||||||||||||||||||||||||||||||||||||
| The Meadows, FL |
|
|
(
|
|
|
|
|
|
|
|
(
|
1999 | ||||||||||||||||||||||||||||||||||||||||||||||||||||||||||||||
| Terra Ceia |
|
|
|
|
|
|
|
|
|
|
(
|
2004 | ||||||||||||||||||||||||||||||||||||||||||||||||||||||||||||||
| Lakes at Countrywood |
|
|
|
|
|
|
|
|
|
|
(
|
2001 | ||||||||||||||||||||||||||||||||||||||||||||||||||||||||||||||
| Meadows at Countrywood |
|
|
|
|
|
|
|
|
|
|
(
|
1998 | ||||||||||||||||||||||||||||||||||||||||||||||||||||||||||||||
| Oaks at Countrywood |
|
|
|
|
|
(
|
|
|
|
|
(
|
1998 | ||||||||||||||||||||||||||||||||||||||||||||||||||||||||||||||
| Breezy Hill |
|
|
(
|
|
|
|
|
|
|
|
(
|
2002 | ||||||||||||||||||||||||||||||||||||||||||||||||||||||||||||||
| Hidden Harbour Marina |
|
|
|
|
|
|
|
|
|
|
(
|
2021 | ||||||||||||||||||||||||||||||||||||||||||||||||||||||||||||||
| Highland Wood Travel Park |
|
|
|
|
|
|
|
|
|
|
(
|
2002 | ||||||||||||||||||||||||||||||||||||||||||||||||||||||||||||||
| Inlet Harbor Marina |
|
|
|
|
|
|
|
|
|
|
(
|
2021 | ||||||||||||||||||||||||||||||||||||||||||||||||||||||||||||||
| Harbor Lakes |
|
|
(
|
|
|
|
|
|
|
|
(
|
2004 | ||||||||||||||||||||||||||||||||||||||||||||||||||||||||||||||
| Lighthouse Pointe at Daytona Beach |
|
|
|
|
|
|
|
|
|
|
(
|
1998 | ||||||||||||||||||||||||||||||||||||||||||||||||||||||||||||||
| Pickwick Village |
|
|
(
|
|
|
|
|
|
|
|
(
|
1998 | ||||||||||||||||||||||||||||||||||||||||||||||||||||||||||||||
| Rose Bay |
|
|
|
|
|
|
|
|
|
|
(
|
2016 | ||||||||||||||||||||||||||||||||||||||||||||||||||||||||||||||
| Emerald Lake |
|
|
(
|
|
|
|
|
|
|
|
(
|
2011 | ||||||||||||||||||||||||||||||||||||||||||||||||||||||||||||||
| Gulf View |
|
|
|
|
|
|
|
|
|
|
(
|
2004 | ||||||||||||||||||||||||||||||||||||||||||||||||||||||||||||||
| Tropical Palms MH |
|
|
|
|
|
|
|
|
|
|
(
|
2006 | ||||||||||||||||||||||||||||||||||||||||||||||||||||||||||||||
| Kingswood |
|
|
|
|
|
|
|
|
|
|
(
|
2018 | ||||||||||||||||||||||||||||||||||||||||||||||||||||||||||||||
| Palm Lake |
|
|
(
|
|
|
|
|
|
|
|
(
|
2018 | ||||||||||||||||||||||||||||||||||||||||||||||||||||||||||||||
| Riviera Beach Marina |
|
|
|
|
|
|
|
|
|
|
(
|
2019 | ||||||||||||||||||||||||||||||||||||||||||||||||||||||||||||||
| Indian Oaks |
|
|
|
|
|
|
|
|
|
|
(
|
1998 | ||||||||||||||||||||||||||||||||||||||||||||||||||||||||||||||
| Space Coast |
|
|
|
|
|
|
|
|
|
|
(
|
2014 | ||||||||||||||||||||||||||||||||||||||||||||||||||||||||||||||
| Covington Estates |
|
|
(
|
|
|
|
|
|
|
|
(
|
2011 | ||||||||||||||||||||||||||||||||||||||||||||||||||||||||||||||
| Winds of St. Armands North |
|
|
(
|
|
|
|
|
|
|
|
(
|
1983 | ||||||||||||||||||||||||||||||||||||||||||||||||||||||||||||||
| Winds of St. Armands South |
|
|
(
|
|
|
|
|
|
|
|
(
|
1983 | ||||||||||||||||||||||||||||||||||||||||||||||||||||||||||||||
S-7
Schedule III
Equity LifeStyle Properties, Inc.
Real Estate and Accumulated Depreciation
| Initial Cost to ELS |
Costs Capitalized
Subsequent to Acquisition (Improvements) |
Gross Amount Carried at 12/31/23 | ||||||||||||||||||||||||||||||||||||||||||||||||||||||||||||||||||||||||
|
Real Estate
(1)
|
Location | Encumbrances | Land | Depreciable Property | Land | Depreciable Property | Land | Depreciable Property |
Total
(3)
|
Accumulated
Depreciation |
Date of
Acquisition |
|||||||||||||||||||||||||||||||||||||||||||||||||||||||||||||||
| Topics RV Resort |
|
|
(
|
|
|
|
|
|
|
|
(
|
2004 | ||||||||||||||||||||||||||||||||||||||||||||||||||||||||||||||
| Pine Island |
|
|
|
|
|
|
|
|
|
|
(
|
2007 | ||||||||||||||||||||||||||||||||||||||||||||||||||||||||||||||
| St. Pete Marina |
|
|
|
|
|
|
(
|
|
|
|
(
|
2019 | ||||||||||||||||||||||||||||||||||||||||||||||||||||||||||||||
| Riverwatch Marina |
|
|
|
|
|
|
|
|
|
|
(
|
2021 | ||||||||||||||||||||||||||||||||||||||||||||||||||||||||||||||
| Carefree Village |
|
|
(
|
|
|
|
|
|
|
|
(
|
2011 | ||||||||||||||||||||||||||||||||||||||||||||||||||||||||||||||
| Tarpon Glen |
|
|
|
|
|
|
|
|
|
|
(
|
2011 | ||||||||||||||||||||||||||||||||||||||||||||||||||||||||||||||
| Featherock |
|
|
|
|
|
|
|
|
|
|
(
|
2011 | ||||||||||||||||||||||||||||||||||||||||||||||||||||||||||||||
| Bay Indies |
|
|
(
|
|
|
|
|
|
|
|
(
|
1994 | ||||||||||||||||||||||||||||||||||||||||||||||||||||||||||||||
| Ramblers Rest RV Resort |
|
|
(
|
|
|
|
|
|
|
|
(
|
2006 | ||||||||||||||||||||||||||||||||||||||||||||||||||||||||||||||
| Countryside at Vero Beach |
|
|
(
|
|
|
|
|
|
|
|
(
|
1998 | ||||||||||||||||||||||||||||||||||||||||||||||||||||||||||||||
| Heritage Plantation |
|
|
|
|
|
|
|
|
|
|
(
|
1994 | ||||||||||||||||||||||||||||||||||||||||||||||||||||||||||||||
| Heron Cay |
|
|
(
|
|
|
|
|
|
|
|
(
|
2011 | ||||||||||||||||||||||||||||||||||||||||||||||||||||||||||||||
| Holiday Village, Florida |
|
|
|
|
|
|
|
|
|
|
(
|
1998 | ||||||||||||||||||||||||||||||||||||||||||||||||||||||||||||||
| Sunshine Travel-Vero Beach |
|
|
|
|
|
|
|
|
|
|
(
|
2004 | ||||||||||||||||||||||||||||||||||||||||||||||||||||||||||||||
| Vero Beach Marina |
|
|
|
|
|
|
|
|
|
|
(
|
2019 | ||||||||||||||||||||||||||||||||||||||||||||||||||||||||||||||
| Vero Palm Estates |
|
|
(
|
|
|
|
|
|
|
|
(
|
2011 | ||||||||||||||||||||||||||||||||||||||||||||||||||||||||||||||
| Village Green |
|
|
(
|
|
|
|
|
|
|
|
(
|
2011 | ||||||||||||||||||||||||||||||||||||||||||||||||||||||||||||||
| Peace River |
|
|
|
|
|
|
|
|
|
|
(
|
2006 | ||||||||||||||||||||||||||||||||||||||||||||||||||||||||||||||
| Palm Beach Colony |
|
|
(
|
|
|
|
|
|
|
|
(
|
2011 | ||||||||||||||||||||||||||||||||||||||||||||||||||||||||||||||
| Parkwood Communities |
|
|
|
|
|
|
|
|
|
|
(
|
2011 | ||||||||||||||||||||||||||||||||||||||||||||||||||||||||||||||
| Three Flags |
|
|
|
|
|
|
|
|
|
|
(
|
2006 | ||||||||||||||||||||||||||||||||||||||||||||||||||||||||||||||
| Winter Garden |
|
|
|
|
|
|
|
|
|
|
(
|
2007 | ||||||||||||||||||||||||||||||||||||||||||||||||||||||||||||||
| Crystal Lake Zephyrhills |
|
|
|
|
|
|
|
|
|
|
(
|
2011 | ||||||||||||||||||||||||||||||||||||||||||||||||||||||||||||||
| Forest Lake Estates MH |
|
|
(
|
|
|
|
|
|
|
|
(
|
2016 | ||||||||||||||||||||||||||||||||||||||||||||||||||||||||||||||
| Forest Lake Village RV |
|
|
|
|
|
|
|
|
|
|
(
|
2016 | ||||||||||||||||||||||||||||||||||||||||||||||||||||||||||||||
| Sixth Avenue |
|
|
|
|
|
|
|
|
|
|
(
|
2004 | ||||||||||||||||||||||||||||||||||||||||||||||||||||||||||||||
| Coach Royale |
|
|
|
|
|
|
|
|
|
|
(
|
2011 | ||||||||||||||||||||||||||||||||||||||||||||||||||||||||||||||
| Maple Grove |
|
|
|
|
|
|
|
|
|
|
(
|
2011 | ||||||||||||||||||||||||||||||||||||||||||||||||||||||||||||||
| Shenandoah Estates |
|
|
(
|
|
|
|
|
|
|
|
(
|
2011 | ||||||||||||||||||||||||||||||||||||||||||||||||||||||||||||||
| West Meadow Estates |
|
|
(
|
|
|
|
|
|
|
|
(
|
2011 | ||||||||||||||||||||||||||||||||||||||||||||||||||||||||||||||
| O'Connell's Yogi Bear RV Resort |
|
|
(
|
|
|
|
|
|
|
|
(
|
2004 | ||||||||||||||||||||||||||||||||||||||||||||||||||||||||||||||
| Pheasant Lake Estates |
|
|
(
|
|
|
|
|
|
|
|
(
|
2013 | ||||||||||||||||||||||||||||||||||||||||||||||||||||||||||||||
| Pine Country |
|
|
|
|
|
|
|
|
|
|
(
|
2006 | ||||||||||||||||||||||||||||||||||||||||||||||||||||||||||||||
| Willow Lake Estates |
|
|
(
|
|
|
|
|
|
|
|
(
|
1994 | ||||||||||||||||||||||||||||||||||||||||||||||||||||||||||||||
| Golf Vista Estates |
|
|
(
|
|
|
|
|
|
|
|
(
|
1997 | ||||||||||||||||||||||||||||||||||||||||||||||||||||||||||||||
S-8
Schedule III
Equity LifeStyle Properties, Inc.
Real Estate and Accumulated Depreciation
| Initial Cost to ELS |
Costs Capitalized
Subsequent to Acquisition (Improvements) |
Gross Amount Carried at 12/31/23 | ||||||||||||||||||||||||||||||||||||||||||||||||||||||||||||||||||||||||
|
Real Estate
(1)
|
Location | Encumbrances | Land | Depreciable Property | Land | Depreciable Property | Land | Depreciable Property |
Total
(3)
|
Accumulated
Depreciation |
Date of
Acquisition |
|||||||||||||||||||||||||||||||||||||||||||||||||||||||||||||||
| Indian Lakes |
|
|
|
|
|
|
|
|
|
|
(
|
2004 | ||||||||||||||||||||||||||||||||||||||||||||||||||||||||||||||
| Horseshoe Lakes |
|
|
|
|
|
|
|
|
|
|
(
|
2004 | ||||||||||||||||||||||||||||||||||||||||||||||||||||||||||||||
| Twin Mills RV |
|
|
|
|
|
|
|
|
|
|
(
|
2006 | ||||||||||||||||||||||||||||||||||||||||||||||||||||||||||||||
| Lakeside RV |
|
|
|
|
|
|
|
|
|
|
(
|
2004 | ||||||||||||||||||||||||||||||||||||||||||||||||||||||||||||||
| Dale Hollow State Park Marina |
|
|
|
|
|
|
|
|
|
|
(
|
2021 | ||||||||||||||||||||||||||||||||||||||||||||||||||||||||||||||
| Diamond Caverns |
|
|
|
|
|
(
|
|
|
|
|
(
|
2006 | ||||||||||||||||||||||||||||||||||||||||||||||||||||||||||||||
| Gateway to Cape Cod |
|
|
|
|
|
|
|
|
|
|
(
|
2006 | ||||||||||||||||||||||||||||||||||||||||||||||||||||||||||||||
| Hillcrest MA |
|
|
|
|
|
|
|
|
|
|
(
|
2011 | ||||||||||||||||||||||||||||||||||||||||||||||||||||||||||||||
| The Glen |
|
|
|
|
|
|
|
|
|
|
(
|
2011 | ||||||||||||||||||||||||||||||||||||||||||||||||||||||||||||||
| Old Chatham |
|
|
(
|
|
|
|
|
|
|
|
(
|
2005 | ||||||||||||||||||||||||||||||||||||||||||||||||||||||||||||||
| Sturbridge |
|
|
|
|
|
|
|
|
|
|
(
|
2006 | ||||||||||||||||||||||||||||||||||||||||||||||||||||||||||||||
| Fernwood |
|
|
(
|
|
|
|
|
|
|
|
(
|
2011 | ||||||||||||||||||||||||||||||||||||||||||||||||||||||||||||||
| Williams Estates/Peppermint Woods |
|
|
|
|
|
|
|
|
|
|
(
|
2011 | ||||||||||||||||||||||||||||||||||||||||||||||||||||||||||||||
| Mt. Desert Narrows |
|
|
|
|
|
|
|
|
|
|
(
|
2007 | ||||||||||||||||||||||||||||||||||||||||||||||||||||||||||||||
| Patten Pond |
|
|
|
|
|
|
|
|
|
|
(
|
2007 | ||||||||||||||||||||||||||||||||||||||||||||||||||||||||||||||
| Pinehirst |
|
|
(
|
|
|
|
|
|
|
|
(
|
2005 | ||||||||||||||||||||||||||||||||||||||||||||||||||||||||||||||
| Narrows Too |
|
|
|
|
|
|
|
|
|
|
(
|
2007 | ||||||||||||||||||||||||||||||||||||||||||||||||||||||||||||||
| Moody Beach |
|
|
|
|
|
|
|
|
|
|
(
|
2006 | ||||||||||||||||||||||||||||||||||||||||||||||||||||||||||||||
| Bear Cave |
|
|
|
|
|
|
|
|
|
|
(
|
2006 | ||||||||||||||||||||||||||||||||||||||||||||||||||||||||||||||
| St Clair |
|
|
|
|
|
|
|
|
|
|
(
|
2004 | ||||||||||||||||||||||||||||||||||||||||||||||||||||||||||||||
| Cedar Knolls |
|
|
(
|
|
|
|
|
|
|
|
(
|
2011 | ||||||||||||||||||||||||||||||||||||||||||||||||||||||||||||||
| Cimarron Park |
|
|
|
|
|
|
|
|
|
|
(
|
2011 | ||||||||||||||||||||||||||||||||||||||||||||||||||||||||||||||
| Rockford Riverview Estates |
|
|
|
|
|
|
|
|
|
|
(
|
2011 | ||||||||||||||||||||||||||||||||||||||||||||||||||||||||||||||
| Rosemount Woods |
|
|
|
|
|
|
|
|
|
|
(
|
2011 | ||||||||||||||||||||||||||||||||||||||||||||||||||||||||||||||
| Boathouse Marina |
|
|
|
|
|
|
|
|
|
|
(
|
2021 | ||||||||||||||||||||||||||||||||||||||||||||||||||||||||||||||
| Forest Lake |
|
|
|
|
|
|
|
|
|
|
(
|
2004 | ||||||||||||||||||||||||||||||||||||||||||||||||||||||||||||||
| Scenic |
|
|
|
|
|
|
|
|
|
|
(
|
2006 | ||||||||||||||||||||||||||||||||||||||||||||||||||||||||||||||
| Waterway RV |
|
|
(
|
|
|
|
|
|
|
|
(
|
2004 | ||||||||||||||||||||||||||||||||||||||||||||||||||||||||||||||
| Twin Lakes |
|
|
|
|
|
|
|
|
|
|
(
|
2004 | ||||||||||||||||||||||||||||||||||||||||||||||||||||||||||||||
| Holiday Trav-L-Park Resort |
|
|
|
|
|
|
|
|
|
|
(
|
2022 | ||||||||||||||||||||||||||||||||||||||||||||||||||||||||||||||
| Topsail Sound RV |
|
|
|
|
|
|
|
|
|
|
(
|
2020 | ||||||||||||||||||||||||||||||||||||||||||||||||||||||||||||||
| Green Mountain |
|
|
|
|
|
|
|
|
|
|
(
|
2006 | ||||||||||||||||||||||||||||||||||||||||||||||||||||||||||||||
| Lake Gaston |
|
|
|
|
|
|
|
|
|
|
(
|
2006 | ||||||||||||||||||||||||||||||||||||||||||||||||||||||||||||||
| Lake Myers RV |
|
|
|
|
|
|
|
|
|
|
(
|
2006 | ||||||||||||||||||||||||||||||||||||||||||||||||||||||||||||||
| Bogue Pines |
|
|
|
|
|
|
|
|
|
|
(
|
2015 | ||||||||||||||||||||||||||||||||||||||||||||||||||||||||||||||
S-9
Schedule III
Equity LifeStyle Properties, Inc.
Real Estate and Accumulated Depreciation
| Initial Cost to ELS |
Costs Capitalized
Subsequent to Acquisition (Improvements) |
Gross Amount Carried at 12/31/23 | ||||||||||||||||||||||||||||||||||||||||||||||||||||||||||||||||||||||||
|
Real Estate
(1)
|
Location | Encumbrances | Land | Depreciable Property | Land | Depreciable Property | Land | Depreciable Property |
Total
(3)
|
Accumulated
Depreciation |
Date of
Acquisition |
|||||||||||||||||||||||||||||||||||||||||||||||||||||||||||||||
| Goose Creek |
|
|
(
|
|
|
|
|
|
|
|
(
|
2004 | ||||||||||||||||||||||||||||||||||||||||||||||||||||||||||||||
| Whispering Pines - NC |
|
|
|
|
|
|
|
|
|
|
(
|
2015 | ||||||||||||||||||||||||||||||||||||||||||||||||||||||||||||||
| Harbor Point RV |
|
|
|
|
|
|
|
|
|
|
(
|
2020 | ||||||||||||||||||||||||||||||||||||||||||||||||||||||||||||||
| White Oak Shores |
|
|
|
|
|
|
|
|
|
|
(
|
2019 | ||||||||||||||||||||||||||||||||||||||||||||||||||||||||||||||
| Buena Vista |
|
|
|
|
|
|
|
|
|
|
(
|
2011 | ||||||||||||||||||||||||||||||||||||||||||||||||||||||||||||||
| Meadow Park |
|
|
|
|
|
|
|
|
|
|
(
|
2011 | ||||||||||||||||||||||||||||||||||||||||||||||||||||||||||||||
| Sandy Beach |
|
|
|
|
|
|
|
|
|
|
(
|
2005 | ||||||||||||||||||||||||||||||||||||||||||||||||||||||||||||||
| Pine Acres |
|
|
|
|
|
|
|
|
|
|
(
|
2014 | ||||||||||||||||||||||||||||||||||||||||||||||||||||||||||||||
| Tuxbury Resort |
|
|
|
|
|
|
|
|
|
|
(
|
2007 | ||||||||||||||||||||||||||||||||||||||||||||||||||||||||||||||
| King Nummy |
|
|
|
|
|
|
|
|
|
|
(
|
2018 | ||||||||||||||||||||||||||||||||||||||||||||||||||||||||||||||
| Acorn Campground |
|
|
|
|
|
|
|
|
|
|
(
|
2020 | ||||||||||||||||||||||||||||||||||||||||||||||||||||||||||||||
| Whippoorwill RV |
|
|
|
|
|
|
|
|
|
|
(
|
2022 | ||||||||||||||||||||||||||||||||||||||||||||||||||||||||||||||
| Mays Landing Resort |
|
|
|
|
|
|
|
|
|
|
(
|
2014 | ||||||||||||||||||||||||||||||||||||||||||||||||||||||||||||||
| Echo Farms |
|
|
|
|
|
|
|
|
|
|
(
|
2014 | ||||||||||||||||||||||||||||||||||||||||||||||||||||||||||||||
| Lake and Shore |
|
|
|
|
|
|
|
|
|
|
(
|
2006 | ||||||||||||||||||||||||||||||||||||||||||||||||||||||||||||||
| Pine Haven |
|
|
|
|
|
|
|
|
|
|
(
|
2021 | ||||||||||||||||||||||||||||||||||||||||||||||||||||||||||||||
| Red Oak Shores Campground |
|
|
|
|
|
|
|
|
|
|
(
|
2023 | ||||||||||||||||||||||||||||||||||||||||||||||||||||||||||||||
| Chestnut Lake |
|
|
|
|
|
|
|
|
|
|
(
|
2004 | ||||||||||||||||||||||||||||||||||||||||||||||||||||||||||||||
| Sea Pines |
|
|
|
|
|
|
|
|
|
|
(
|
2006 | ||||||||||||||||||||||||||||||||||||||||||||||||||||||||||||||
| Pine Ridge at Crestwood |
|
|
(
|
|
|
|
|
|
|
|
(
|
2011 | ||||||||||||||||||||||||||||||||||||||||||||||||||||||||||||||
| Mountain View - NV |
|
|
(
|
|
|
|
|
|
|
|
(
|
2011 | ||||||||||||||||||||||||||||||||||||||||||||||||||||||||||||||
| Bonanza Village |
|
|
|
|
|
(
|
|
|
|
|
(
|
1983 | ||||||||||||||||||||||||||||||||||||||||||||||||||||||||||||||
| Boulder Cascade |
|
|
|
|
|
|
|
|
|
|
(
|
1998 | ||||||||||||||||||||||||||||||||||||||||||||||||||||||||||||||
| Cabana |
|
|
|
|
|
|
|
|
|
|
(
|
1994 | ||||||||||||||||||||||||||||||||||||||||||||||||||||||||||||||
| Flamingo West |
|
|
|
|
|
|
|
|
|
|
(
|
1994 | ||||||||||||||||||||||||||||||||||||||||||||||||||||||||||||||
| Las Vegas |
|
|
|
|
|
|
|
|
|
|
(
|
2004 | ||||||||||||||||||||||||||||||||||||||||||||||||||||||||||||||
| Villa Borega |
|
|
|
|
|
|
|
|
|
|
(
|
1997 | ||||||||||||||||||||||||||||||||||||||||||||||||||||||||||||||
| Rondout Valley |
|
|
|
|
|
|
|
|
|
|
(
|
2006 | ||||||||||||||||||||||||||||||||||||||||||||||||||||||||||||||
| Alpine Lake RV Resort |
|
|
|
|
|
|
|
|
|
|
(
|
2005 | ||||||||||||||||||||||||||||||||||||||||||||||||||||||||||||||
| Lake George Escape |
|
|
|
|
|
|
|
|
|
|
(
|
2005 | ||||||||||||||||||||||||||||||||||||||||||||||||||||||||||||||
| The Woodlands |
|
|
(
|
|
|
|
|
|
|
|
(
|
2011 | ||||||||||||||||||||||||||||||||||||||||||||||||||||||||||||||
| Greenwood Village |
|
|
|
|
|
|
|
|
|
|
(
|
1998 | ||||||||||||||||||||||||||||||||||||||||||||||||||||||||||||||
| Brennan Beach |
|
|
|
|
|
|
|
|
|
|
(
|
2005 | ||||||||||||||||||||||||||||||||||||||||||||||||||||||||||||||
| Lake George Schroon Valley |
|
|
|
|
|
|
|
|
|
|
(
|
2008 | ||||||||||||||||||||||||||||||||||||||||||||||||||||||||||||||
S-10
Schedule III
Equity LifeStyle Properties, Inc.
Real Estate and Accumulated Depreciation
| Initial Cost to ELS |
Costs Capitalized
Subsequent to Acquisition (Improvements) |
Gross Amount Carried at 12/31/23 | ||||||||||||||||||||||||||||||||||||||||||||||||||||||||||||||||||||||||
|
Real Estate
(1)
|
Location | Encumbrances | Land | Depreciable Property | Land | Depreciable Property | Land | Depreciable Property |
Total
(3)
|
Accumulated
Depreciation |
Date of
Acquisition |
|||||||||||||||||||||||||||||||||||||||||||||||||||||||||||||||
| Kenisee Lake |
|
|
|
|
|
|
|
|
|
|
(
|
2004 | ||||||||||||||||||||||||||||||||||||||||||||||||||||||||||||||
| Bay Point Marina |
|
|
|
|
|
|
|
|
|
|
(
|
2021 | ||||||||||||||||||||||||||||||||||||||||||||||||||||||||||||||
| Wilmington |
|
|
|
|
|
|
|
|
|
|
(
|
2004 | ||||||||||||||||||||||||||||||||||||||||||||||||||||||||||||||
| Bend |
|
|
|
|
|
|
|
|
|
|
(
|
2004 | ||||||||||||||||||||||||||||||||||||||||||||||||||||||||||||||
| Shadowbrook |
|
|
|
|
|
|
|
|
|
|
(
|
1997 | ||||||||||||||||||||||||||||||||||||||||||||||||||||||||||||||
| Pacific City |
|
|
|
|
|
|
|
|
|
|
(
|
2004 | ||||||||||||||||||||||||||||||||||||||||||||||||||||||||||||||
| Falcon Wood Village |
|
|
(
|
|
|
|
|
|
|
|
(
|
1997 | ||||||||||||||||||||||||||||||||||||||||||||||||||||||||||||||
| Portland Fairview |
|
|
(
|
|
|
|
|
|
|
|
(
|
2016 | ||||||||||||||||||||||||||||||||||||||||||||||||||||||||||||||
| Quail Hollow |
|
|
|
|
|
|
|
|
|
|
(
|
1997 | ||||||||||||||||||||||||||||||||||||||||||||||||||||||||||||||
| South Jetty |
|
|
|
|
|
|
|
|
|
|
(
|
2004 | ||||||||||||||||||||||||||||||||||||||||||||||||||||||||||||||
| Seaside |
|
|
|
|
|
|
|
|
|
|
(
|
2004 | ||||||||||||||||||||||||||||||||||||||||||||||||||||||||||||||
| Whalers Rest |
|
|
|
|
|
|
|
|
|
|
(
|
2004 | ||||||||||||||||||||||||||||||||||||||||||||||||||||||||||||||
| Hope Valley |
|
|
|
|
|
|
|
|
|
|
(
|
2021 | ||||||||||||||||||||||||||||||||||||||||||||||||||||||||||||||
| Mt. Hood Village |
|
|
|
|
|
|
|
|
|
|
(
|
2002 | ||||||||||||||||||||||||||||||||||||||||||||||||||||||||||||||
| Greenbriar Village |
|
|
|
|
|
|
|
|
|
|
(
|
2011 | ||||||||||||||||||||||||||||||||||||||||||||||||||||||||||||||
| Sun Valley |
|
|
|
|
|
|
|
|
|
|
(
|
2009 | ||||||||||||||||||||||||||||||||||||||||||||||||||||||||||||||
| Green Acres |
|
|
(
|
|
|
|
|
|
|
|
(
|
1988 | ||||||||||||||||||||||||||||||||||||||||||||||||||||||||||||||
| Gettysburg Farm |
|
|
|
|
|
|
|
|
|
|
(
|
2006 | ||||||||||||||||||||||||||||||||||||||||||||||||||||||||||||||
| Timothy Lake North |
|
|
|
|
|
|
|
|
|
|
(
|
2006 | ||||||||||||||||||||||||||||||||||||||||||||||||||||||||||||||
| Timothy Lake South |
|
|
|
|
|
|
|
|
|
|
(
|
2006 | ||||||||||||||||||||||||||||||||||||||||||||||||||||||||||||||
| Drummer Boy |
|
|
|
|
|
|
|
|
|
|
(
|
2019 | ||||||||||||||||||||||||||||||||||||||||||||||||||||||||||||||
| Round Top |
|
|
|
|
|
|
|
|
|
|
(
|
2019 | ||||||||||||||||||||||||||||||||||||||||||||||||||||||||||||||
| Circle M |
|
|
|
|
|
|
|
|
|
|
(
|
2006 | ||||||||||||||||||||||||||||||||||||||||||||||||||||||||||||||
| Hershey |
|
|
|
|
|
|
|
|
|
|
(
|
2004 | ||||||||||||||||||||||||||||||||||||||||||||||||||||||||||||||
| Robin Hill |
|
|
|
|
|
|
|
|
|
|
(
|
2009 | ||||||||||||||||||||||||||||||||||||||||||||||||||||||||||||||
| PA Dutch County |
|
|
|
|
|
|
|
|
|
|
(
|
2006 | ||||||||||||||||||||||||||||||||||||||||||||||||||||||||||||||
| Spring Gulch |
|
|
|
|
|
|
|
|
|
|
(
|
2004 | ||||||||||||||||||||||||||||||||||||||||||||||||||||||||||||||
| Lil Wolf |
|
|
|
|
|
|
|
|
|
|
(
|
2011 | ||||||||||||||||||||||||||||||||||||||||||||||||||||||||||||||
| Scotrun |
|
|
|
|
|
|
|
|
|
|
(
|
2006 | ||||||||||||||||||||||||||||||||||||||||||||||||||||||||||||||
| Appalachian RV |
|
|
|
|
|
|
|
|
|
|
(
|
2006 | ||||||||||||||||||||||||||||||||||||||||||||||||||||||||||||||
| Mountain View - PA |
|
|
|
|
|
|
|
|
|
|
(
|
2011 | ||||||||||||||||||||||||||||||||||||||||||||||||||||||||||||||
| Timber Creek |
|
|
|
|
|
|
|
|
|
|
(
|
2018 | ||||||||||||||||||||||||||||||||||||||||||||||||||||||||||||||
| Carolina Landing |
|
|
|
|
|
|
|
|
|
|
(
|
2004 | ||||||||||||||||||||||||||||||||||||||||||||||||||||||||||||||
| Inlet Oaks Village |
|
|
|
|
|
|
|
|
|
|
(
|
2006 | ||||||||||||||||||||||||||||||||||||||||||||||||||||||||||||||
| Myrtle Beach property |
|
|
|
|
|
|
|
|
|
|
(
|
2021 | ||||||||||||||||||||||||||||||||||||||||||||||||||||||||||||||
S-11
Schedule III
Equity LifeStyle Properties, Inc.
Real Estate and Accumulated Depreciation
| Initial Cost to ELS |
Costs Capitalized
Subsequent to Acquisition (Improvements) |
Gross Amount Carried at 12/31/23 | ||||||||||||||||||||||||||||||||||||||||||||||||||||||||||||||||||||||||
|
Real Estate
(1)
|
Location | Encumbrances | Land | Depreciable Property | Land | Depreciable Property | Land | Depreciable Property |
Total
(3)
|
Accumulated
Depreciation |
Date of
Acquisition |
|||||||||||||||||||||||||||||||||||||||||||||||||||||||||||||||
| Rivers Edge Marina |
|
|
|
|
|
|
|
|
|
|
(
|
2021 | ||||||||||||||||||||||||||||||||||||||||||||||||||||||||||||||
| The Oaks |
|
|
|
|
|
|
|
|
|
|
(
|
2006 | ||||||||||||||||||||||||||||||||||||||||||||||||||||||||||||||
| Natchez Trace |
|
|
|
|
|
|
|
|
|
|
(
|
2004 | ||||||||||||||||||||||||||||||||||||||||||||||||||||||||||||||
| Cherokee Landing |
|
|
|
|
|
|
|
|
|
|
(
|
2004 | ||||||||||||||||||||||||||||||||||||||||||||||||||||||||||||||
| Alamo Palms |
|
|
(
|
|
|
|
|
|
|
|
(
|
2012 | ||||||||||||||||||||||||||||||||||||||||||||||||||||||||||||||
| Bay Landing |
|
|
|
|
|
|
|
|
|
|
(
|
2004 | ||||||||||||||||||||||||||||||||||||||||||||||||||||||||||||||
| Colorado River |
|
|
|
|
|
|
|
|
|
|
(
|
2004 | ||||||||||||||||||||||||||||||||||||||||||||||||||||||||||||||
| Victoria Palms |
|
|
(
|
|
|
|
|
|
|
|
(
|
2012 | ||||||||||||||||||||||||||||||||||||||||||||||||||||||||||||||
| Lake Texoma |
|
|
|
|
|
|
|
|
|
|
(
|
2004 | ||||||||||||||||||||||||||||||||||||||||||||||||||||||||||||||
| Lakewood |
|
|
|
|
|
|
|
|
|
|
(
|
2004 | ||||||||||||||||||||||||||||||||||||||||||||||||||||||||||||||
| Paradise Park |
|
|
|
|
|
|
|
|
|
|
(
|
2004 | ||||||||||||||||||||||||||||||||||||||||||||||||||||||||||||||
| Sunshine RV Resort |
|
|
|
|
|
|
|
|
|
|
(
|
2004 | ||||||||||||||||||||||||||||||||||||||||||||||||||||||||||||||
| Tropic Winds |
|
|
|
|
|
|
|
|
|
|
(
|
2002 | ||||||||||||||||||||||||||||||||||||||||||||||||||||||||||||||
| Medina Lake |
|
|
|
|
|
|
|
|
|
|
(
|
2004 | ||||||||||||||||||||||||||||||||||||||||||||||||||||||||||||||
| Paradise South |
|
|
|
|
|
|
|
|
|
|
(
|
2004 | ||||||||||||||||||||||||||||||||||||||||||||||||||||||||||||||
| Lake Conroe KOA |
|
|
|
|
|
(
|
|
|
|
|
(
|
2021 | ||||||||||||||||||||||||||||||||||||||||||||||||||||||||||||||
| Lake Tawakoni |
|
|
|
|
|
|
|
|
|
|
(
|
2004 | ||||||||||||||||||||||||||||||||||||||||||||||||||||||||||||||
| Fun N Sun RV |
|
|
|
|
|
|
|
|
|
|
(
|
1998 | ||||||||||||||||||||||||||||||||||||||||||||||||||||||||||||||
| Country Sunshine |
|
|
|
|
|
|
|
|
|
|
(
|
2004 | ||||||||||||||||||||||||||||||||||||||||||||||||||||||||||||||
| Leisure World |
|
|
|
|
|
|
|
|
|
|
(
|
2020 | ||||||||||||||||||||||||||||||||||||||||||||||||||||||||||||||
| Southern Comfort |
|
|
(
|
|
|
|
|
|
|
|
(
|
2004 | ||||||||||||||||||||||||||||||||||||||||||||||||||||||||||||||
| Trails End RV |
|
|
|
|
|
|
|
|
|
|
(
|
2020 | ||||||||||||||||||||||||||||||||||||||||||||||||||||||||||||||
| Lake Whitney |
|
|
|
|
|
|
|
|
|
|
(
|
2004 | ||||||||||||||||||||||||||||||||||||||||||||||||||||||||||||||
| Lake Conroe |
|
|
|
|
|
|
|
|
|
|
(
|
2004 | ||||||||||||||||||||||||||||||||||||||||||||||||||||||||||||||
| Westwood Village |
|
|
|
|
|
|
|
|
|
|
(
|
1997 | ||||||||||||||||||||||||||||||||||||||||||||||||||||||||||||||
| St George |
|
|
|
|
|
|
|
|
|
|
(
|
2010 | ||||||||||||||||||||||||||||||||||||||||||||||||||||||||||||||
| All Seasons |
|
|
|
|
|
|
|
|
|
|
(
|
1997 | ||||||||||||||||||||||||||||||||||||||||||||||||||||||||||||||
| Meadows of Chantilly |
|
|
(
|
|
|
|
|
|
|
|
(
|
1994 | ||||||||||||||||||||||||||||||||||||||||||||||||||||||||||||||
| Harbor View |
|
|
|
|
|
|
|
|
|
|
(
|
2006 | ||||||||||||||||||||||||||||||||||||||||||||||||||||||||||||||
| Lynchburg |
|
|
|
|
|
|
|
|
|
|
(
|
2004 | ||||||||||||||||||||||||||||||||||||||||||||||||||||||||||||||
| Chesapeake Bay |
|
|
|
|
|
|
|
|
|
|
(
|
2004 | ||||||||||||||||||||||||||||||||||||||||||||||||||||||||||||||
| Bayport Development |
|
|
|
|
|
|
|
|
|
|
(
|
2020 | ||||||||||||||||||||||||||||||||||||||||||||||||||||||||||||||
| Virginia Landing |
|
|
|
|
|
|
|
|
|
|
(
|
2004 | ||||||||||||||||||||||||||||||||||||||||||||||||||||||||||||||
| Grey's Point Camp |
|
|
(
|
|
|
|
|
|
|
|
(
|
2017 | ||||||||||||||||||||||||||||||||||||||||||||||||||||||||||||||
| Bethpage Camp Resort |
|
|
(
|
|
|
|
|
|
|
|
(
|
2017 | ||||||||||||||||||||||||||||||||||||||||||||||||||||||||||||||
S-12
Schedule III
Equity LifeStyle Properties, Inc.
Real Estate and Accumulated Depreciation
| Initial Cost to ELS |
Costs Capitalized
Subsequent to Acquisition (Improvements) |
Gross Amount Carried at 12/31/23 | ||||||||||||||||||||||||||||||||||||||||||||||||||||||||||||||||||||||||
|
Real Estate
(1)
|
Location | Encumbrances | Land | Depreciable Property | Land | Depreciable Property | Land | Depreciable Property |
Total
(3)
|
Accumulated
Depreciation |
Date of
Acquisition |
|||||||||||||||||||||||||||||||||||||||||||||||||||||||||||||||
| Williamsburg |
|
|
|
|
|
|
|
|
|
|
(
|
2006 | ||||||||||||||||||||||||||||||||||||||||||||||||||||||||||||||
| Regency Lakes |
|
|
(
|
|
|
|
|
|
|
|
(
|
2011 | ||||||||||||||||||||||||||||||||||||||||||||||||||||||||||||||
| Birch Bay |
|
|
|
|
|
|
|
|
|
|
(
|
2004 | ||||||||||||||||||||||||||||||||||||||||||||||||||||||||||||||
| Mount Vernon |
|
|
|
|
|
|
|
|
|
|
(
|
2004 | ||||||||||||||||||||||||||||||||||||||||||||||||||||||||||||||
| Chehalis |
|
|
|
|
|
|
|
|
|
|
(
|
2004 | ||||||||||||||||||||||||||||||||||||||||||||||||||||||||||||||
| Grandy Creek |
|
|
|
|
|
|
|
|
|
|
(
|
2008 | ||||||||||||||||||||||||||||||||||||||||||||||||||||||||||||||
| Tall Chief |
|
|
|
|
|
|
|
|
|
|
(
|
2010 | ||||||||||||||||||||||||||||||||||||||||||||||||||||||||||||||
| Kloshe Illahee |
|
|
(
|
|
|
|
|
|
|
|
(
|
1997 | ||||||||||||||||||||||||||||||||||||||||||||||||||||||||||||||
| La Conner |
|
|
|
|
|
|
|
|
|
|
(
|
2004 | ||||||||||||||||||||||||||||||||||||||||||||||||||||||||||||||
| Leavenworth |
|
|
|
|
|
|
|
|
|
|
(
|
2004 | ||||||||||||||||||||||||||||||||||||||||||||||||||||||||||||||
| Thunderbird Resort |
|
|
|
|
|
|
|
|
|
|
(
|
2004 | ||||||||||||||||||||||||||||||||||||||||||||||||||||||||||||||
| Little Diamond |
|
|
|
|
|
|
|
|
|
|
(
|
2004 | ||||||||||||||||||||||||||||||||||||||||||||||||||||||||||||||
| Oceana |
|
|
|
|
|
|
|
|
|
|
(
|
2004 | ||||||||||||||||||||||||||||||||||||||||||||||||||||||||||||||
| Crescent Bar |
|
|
|
|
|
|
|
|
|
|
(
|
2004 | ||||||||||||||||||||||||||||||||||||||||||||||||||||||||||||||
| Long Beach |
|
|
|
|
|
|
|
|
|
|
(
|
2004 | ||||||||||||||||||||||||||||||||||||||||||||||||||||||||||||||
| Paradise RV |
|
|
|
|
|
|
|
|
|
|
(
|
2004 | ||||||||||||||||||||||||||||||||||||||||||||||||||||||||||||||
| Rainbow Lake Manor |
|
|
|
|
|
|
|
|
|
|
(
|
2013 | ||||||||||||||||||||||||||||||||||||||||||||||||||||||||||||||
| Fremont Jellystone Park Campground |
|
|
|
|
|
|
|
|
|
|
(
|
2004 | ||||||||||||||||||||||||||||||||||||||||||||||||||||||||||||||
| Yukon Trails |
|
|
|
|
|
|
|
|
|
|
(
|
2004 | ||||||||||||||||||||||||||||||||||||||||||||||||||||||||||||||
| Blackhawk Camping Resort |
|
|
|
|
|
|
|
|
|
|
(
|
2014 | ||||||||||||||||||||||||||||||||||||||||||||||||||||||||||||||
| Lakeland |
|
|
|
|
|
|
|
|
|
|
(
|
2014 | ||||||||||||||||||||||||||||||||||||||||||||||||||||||||||||||
| Westwood Estates |
|
|
(
|
|
|
|
|
|
|
|
(
|
2013 | ||||||||||||||||||||||||||||||||||||||||||||||||||||||||||||||
| Plymouth Rock |
|
|
|
|
|
|
|
|
|
|
(
|
2009 | ||||||||||||||||||||||||||||||||||||||||||||||||||||||||||||||
| Tranquil Timbers |
|
|
|
|
|
|
|
|
|
|
(
|
2006 | ||||||||||||||||||||||||||||||||||||||||||||||||||||||||||||||
| Lake of the Woods RV |
|
|
|
|
|
|
|
|
|
|
(
|
2019 | ||||||||||||||||||||||||||||||||||||||||||||||||||||||||||||||
| Neshonoc Lakeside |
|
|
|
|
|
(
|
|
|
|
|
(
|
2013 | ||||||||||||||||||||||||||||||||||||||||||||||||||||||||||||||
| Arrowhead |
|
|
|
|
|
|
|
|
|
|
(
|
2006 | ||||||||||||||||||||||||||||||||||||||||||||||||||||||||||||||
| Subtotal of Properties Held for Long Term |
(
|
|
|
|
|
|
|
|
(
|
|||||||||||||||||||||||||||||||||||||||||||||||||||||||||||||||||
| Realty Systems, Inc. |
|
|
|
|
|
|
|
|
(
|
2002 | ||||||||||||||||||||||||||||||||||||||||||||||||||||||||||||||||
| Management business and other |
|
|
|
(
|
|
|
|
|
(
|
|||||||||||||||||||||||||||||||||||||||||||||||||||||||||||||||||
| $ |
(
|
$ |
|
$ |
|
$ |
|
$ |
|
$ |
|
$ |
|
$ |
|
$ |
(
|
|||||||||||||||||||||||||||||||||||||||||||||||||||||||||
_____________________
(1)
The schedule excludes Properties in which we have a non-controlling joint venture interest and account for using the equity method of accounting.
(2)
All Properties were acquired, except for The Crossing at Voyager and Country Place, which were constructed.
(3)
Aggregate cost for federal income tax purposes is approximately $
5.1
billion.
S-13
Schedule III
Equity LifeStyle Properties, Inc.
Real Estate and Accumulated Depreciation
The following table presents the changes in gross investment in real estate:
| (amounts in thousands) | 2023 | 2022 | 2021 | ||||||||||||||
| Balance, beginning of year | $ |
|
$ |
|
$ |
|
|||||||||||
| Acquisitions |
|
|
|
||||||||||||||
| Improvements |
|
|
|
||||||||||||||
| Manufactured homes, net |
|
|
(
|
||||||||||||||
| Dispositions and other |
(
|
(
|
(
|
||||||||||||||
| Balance, end of year | $ |
|
$ |
|
$ |
|
|||||||||||
The following table presents the changes in accumulated depreciation related to investment in real estate:
| (amounts in thousands) | 2023 | 2022 | 2021 | ||||||||||||||
| Balance, beginning of year | $ |
|
$ |
|
$ |
|
|||||||||||
| Depreciation and amortization |
|
|
|
||||||||||||||
| Dispositions and other |
(
|
(
|
(
|
||||||||||||||
| Balance, end of year | $ |
|
$ |
|
$ |
|
|||||||||||
S-14
TABLE OF CONTENTS
Part IItem 1. BusinessItem 1A. Risk FactorsItem 1B. Unresolved Staff CommentsItem 1C. CybersecurityItem 2. PropertiesItem 3. Legal ProceedingsItem 4. Mine Safety DisclosuresPart IIItem 5. Market For Registrant's Common Equity, Related Stockholder Matters and Issuer Purchases Of Equity SecuritiesItem 6. [reserved]Item 7. Management's Discussion and Analysis Of Financial Condition and Results Of OperationsItem 7A. Quantitative and Qualitative Disclosures About Market RiskItem 8. Financial Statements and Supplementary DataItem 9. Changes in and Disagreements with Accountants on Accounting and Financial DisclosureItem 9A. Controls and ProceduresItem 9B. Other InformationItem 9C. Disclosure Regarding Foreign Jurisdictions That Prevent InspectionsPart IIIItem 12. Security Ownership Of Certain Beneficial Owners and Management and Related Stockholder MattersPart IVItem 15. Exhibits, Financial Statements SchedulesItem 16. Form 10-k SummaryNote 1 OrganizationNote 2 Summary Of Significant Accounting PoliciesNote 2 Summary Of Significant Accounting Policies (continued)Note 3 LeasesNote 3 Leases (continued)Note 4 Earnings Per Common ShareNote 5 Common Stock and Other Equity Related TransactionsNote 5 Common Stock and Other Equity Related Transactions (continued)Note 6 Investment in Real EstateNote 7 Investment in Unconsolidated Joint VenturesNote 8 Notes Receivable, NetNote 9 Borrowing ArrangementsNote 9 Borrowing Arrangements (continued)Note 10 Derivative Instruments and Hedging ActivitiesNote 9. Borrowing ArrangementsNote 10 Derivative Instruments and Hedging Activities (continued)Note 11 Deferred Revenue Of Membership Upgrade Sales and Deferred Commission ExpenseNote 12 Transactions with Related PartiesNote 13 Equity Incentive AwardsNote 13 Equity Incentive Awards (continued)Note 14 Long-term Cash Incentive PlanNote 15 Savings PlanNote 16 Commitments and ContingenciesNote 17 Reportable SegmentsNote 17 Reportable Segments (continued)Note 18 Subsequent EventsNote 18 Subsequent Events (continued)