EMCORE CORP
10-Ks and 10-Qs
|
|
|
|
|
|
|
|
|
|
|
|
|
|
|
|
|
|
|
|
|
|
|
|
|
|
|
|
|
|
|
|
|
|
|
|
|
|
|
|
|
|
|
|
|
|
|
|
|
|
|
|
|
|
|
|
FORM 10-K
|
x
|
ANNUAL REPORT PURSUANT TO SECTION 13 OR 15(d) OF THE SECURITIES EXCHANGE ACT OF 1934
|
For the fiscal year ended
September 30, 2015
or
|
¨
|
TRANSITION REPORT PURSUANT TO SECTION 13 OR 15(d) OF THE SECURITIES EXCHANGE ACT OF 1934
|
For the transition period from ___ to ___
Commission File Number
001-36632

EMCORE Corporation
(Exact name of registrant as specified in its charter)
|
New Jersey
(State or other jurisdiction of incorporation or organization)
|
22-2746503
(I.R.S. Employer Identification No.)
|
|
2015 W. Chestnut Street, Alhambra, California, 91803
(Address of principal executive offices) (Zip Code)
|
|
Registrant's telephone number, including area code:
(626) 293-3400
Securities registered pursuant to Section 12(b) of the Act:
|
Common Stock, no par value
(Title of each class)
|
NASDAQ Stock Market
(Name of each exchange on which registered)
|
Securities registered pursuant to Section 12(g) of the Act:
None
Indicate by check mark if the registrant is a well-known seasoned issuer, as defined in Rule 405 of the Securities Act
¨
Yes
x
No
Indicate by check mark if the registrant is not required to file reports pursuant to Section 13 or 15(d) of the Act.
¨
Yes
x
No
Indicate by check mark whether the registrant (1) has filed all reports required to be filed by Section 13 or 15(d) of the Securities Exchange Act of 1934 during the preceding 12 months (or for such shorter period that the registrant was required to file such reports), and (2) has been subject to such filing requirements for the past 90 days.
x
Yes
¨
No
Indicate by check mark whether the registrant has submitted electronically and posted on its corporate website, if any, every Interactive Data File required to be submitted and posted pursuant to Rule 405 of Regulation S-T during the preceding 12 months (or for such shorter period that the registrant was required to submit and post such files).
x
Yes
¨
No
Indicate by check mark if disclosure of delinquent filers pursuant to Item 405 of Regulation S-K is not contained herein, and will not be contained, to the best of the registrant's knowledge, in definitive proxy or information statements incorporated by reference in Part III of this Form 10-K or any amendment to this Form 10-K.
¨
Indicate by check mark whether the registrant is a large accelerated filer, an accelerated filer, a non-accelerated filer, or a smaller reporting company. See the definition of “large accelerated filer”, “accelerated filer”, and “smaller reporting company” in Rule 12b-2 of the Exchange Act.
¨
Large accelerated filer
x
Accelerated filer
¨
Non-accelerated filer
¨
Smaller reporting company
Indicate by check mark whether the registrant is a shell company (as defined in Rule 12b-2 of the Act).
¨
Yes
x
No
The aggregate market value of our common stock held by non-affiliates as of
March 31, 2015
(the last business day of our most recently completed second fiscal quarter) was approximately
$156.3 million
, based on the closing sale price of
$5.44
per share of common stock as reported on the NASDAQ Global Market. For purposes of this disclosure, shares of common stock held by officers and directors and by each person known by us to own 5% or more of our outstanding common stock have been excluded.
As of
December 7, 2015
, the number of shares outstanding of our no par value common stock totaled
25,711,928
.
.
DOCUMENTS INCORPORATED BY REFERENCE
In accordance with General Instruction G(3) of Form 10-K, certain information required by Part III hereof will either be incorporated into this Form 10-K by reference to our Definitive Proxy Statement for our Annual Meeting of Stockholders filed within 120 days of
September 30, 2015
or will be included in an amendment to this Form 10-K filed within 120 days of
September 30, 2015
.
CAUTIONARY STATEMENT
REGARDING FORWARD-LOOKING STATEMENTS
This Annual Report on Form 10-K includes forward-looking statements within the meaning of Section 27A of the Securities Act of 1933, as amended (the Securities Act) and Section 21E of the Securities and Exchange Act of 1934, as amended (the Exchange Act). These forward-looking statements are made pursuant to the safe harbor provisions of the Private Securities Litigation Reform Act of 1995. These forward-looking statements are largely based on our current expectations and projections about future events and financial trends affecting the financial condition of our business. Such forward-looking statements include, in particular, projections about our future results included in our Exchange Act reports, statements about our plans, strategies, business prospects, changes and trends in our business and the markets in which we operate. These forward-looking statements may be identified by the use of terms and phrases such as “anticipates”, “believes”, “can”, “could”, “estimates”, “expects”, “forecasts”, “intends”, “may”, “plans”, “projects”, "should", “targets”, “will”, "would", and similar expressions or variations of these terms and similar phrases. Additionally, statements concerning future matters such as our expected liquidity, development of new products, enhancements or technologies, sales levels, expense levels, and other statements regarding matters that are not historical are forward-looking statements. Management cautions that these forward-looking statements relate to future events or our future financial performance and are subject to business, economic, and other risks and uncertainties, both known and unknown, that may cause actual results, levels of activity, performance, or achievements of our business or our industry to be materially different from those expressed or implied by any forward-looking statements. Factors that could cause or contribute to such differences in results and outcomes include without limitation those discussed under Item 1A - Risk Factors as well as those discussed elsewhere in this Annual Report. These cautionary statements apply to all forward-looking statements wherever they appear in this Annual Report.
Forward-looking statements are based on certain assumptions and analysis made in light of our experience and perception of historical trends, current conditions and expected future developments as well as other factors that we believe are appropriate under the circumstances. While these statements represent our judgment on what the future may hold, and we believe these judgments are reasonable, these statements are not guarantees of any events or financial results. All forward-looking statements in this Annual Report are made as of the date hereof, based on information available to us as of the date hereof, and subsequent facts or circumstances may contradict, obviate, undermine, or otherwise fail to support or substantiate such statements. We caution you not to rely on these statements without also considering the risks and uncertainties associated with these statements and our business that are addressed in this Annual Report. Certain information included in this Annual Report may supersede or supplement forward-looking statements in our other reports filed with the Securities and Exchange Commission. We assume no obligation to update any forward-looking statement to conform such statements to actual results or to changes in our expectations, except as required by applicable law or regulation.
2
EMCORE Corporation
FORM 10-K
For The Fiscal Year Ended
September 30, 2015
TABLE OF CONTENTS
3
ITEM 1
.
Business
Company Overview
EMCORE Corporation and its subsidiaries (referred to herein as the “Company”, “we”, “our”, or “EMCORE”), established in 1984 as a New Jersey corporation, designs and manufactures Indium Phosphide (InP) optical chips, components, subsystems and systems for the broadband and specialty fiber optics market. EMCORE was the pioneer in linear fiber optic transmission technology, and today, is a leader in optical components, as well as a provider of complete end-to-end solutions for high-speed communications network infrastructures, enabling systems and service providers to meet growing demand for bandwidth and connectivity. EMCORE’s advanced optical technologies are designed for cable television (CATV) and fiber-to-the-premise (FTTP) networks, telecommunications and data centers, satellite communications, aerospace and defense, wireless networks, and broadcast and professional audio/video systems. With its world-class InP semiconductor wafer fabrication facility, EMCORE has fully vertically-integrated manufacturing capability and also provides contract design, foundry and component packaging services.
We currently have one reporting segment: Fiber Optics. Until the first quarter of 2015, we operated as two segments: Fiber Optics and Photovoltaics. EMCORE's Solar Photovoltaics business, which was sold in December 2014, provided products for space power applications including high-efficiency multi-junction solar cells, Covered Interconnect Cells and complete satellite solar panels. In addition, as further discussed below, EMCORE sold certain assets, and transferred certain liabilities, of the Company's telecommunications business, including the ITLA, micro-ITLA, T-TOSA and T-XFP product lines within the Company’s telecommunications business in January 2015.
Our headquarters and principal executive offices are located at 2015 W. Chestnut Avenue, Alhambra, California, 91803 and our main telephone number is (626) 293-3400. For specific information about us, our products or the markets we serve, please visit our website at http://www.emcore.com. The information contained in or linked to our website is not a part of, nor incorporated by reference into, this Annual Report on Form 10-K or a part of any other report or filing with the Securities and Exchange Commission (SEC).
We are subject to the information requirements of the Securities Exchange Act of 1934 (Exchange Act). We file periodic reports, current reports, proxy statements, and other information with the SEC. The SEC maintains a website at http://www.sec.gov that contains all of our information that has been filed or furnished electronically with the SEC. We make available free of charge on our website a link to our Annual Reports on Form 10-K, Quarterly Reports on Form 10-Q, Current Reports on Form 8-K, and amendments to those reports filed or furnished pursuant to Section 13(a) or 15(d) of the Exchange Act, as soon as reasonable practicable, after such material is electronically filed with, or furnished to, the SEC.
Overview of Our Industry and Markets We Serve
Compound semiconductor-based products provide the foundation of components, subsystems, and systems used in a broad range of technology markets. Compound semiconductor materials are capable of providing electrical or electro-optical functions, such as emitting optical communications signals and detecting optical communications signals.
Collectively, our products serve the telecommunications, CATV, FTTP, defense and homeland security, satellite communications and broadcast and professional audio video markets.
4
Fiber Optics Products
Our fiber optics products enable information that is modulated on light signals to be transmitted, routed (switched) and received in communication systems and networks. EMCORE primarily offers the following product lines:
|
▪
|
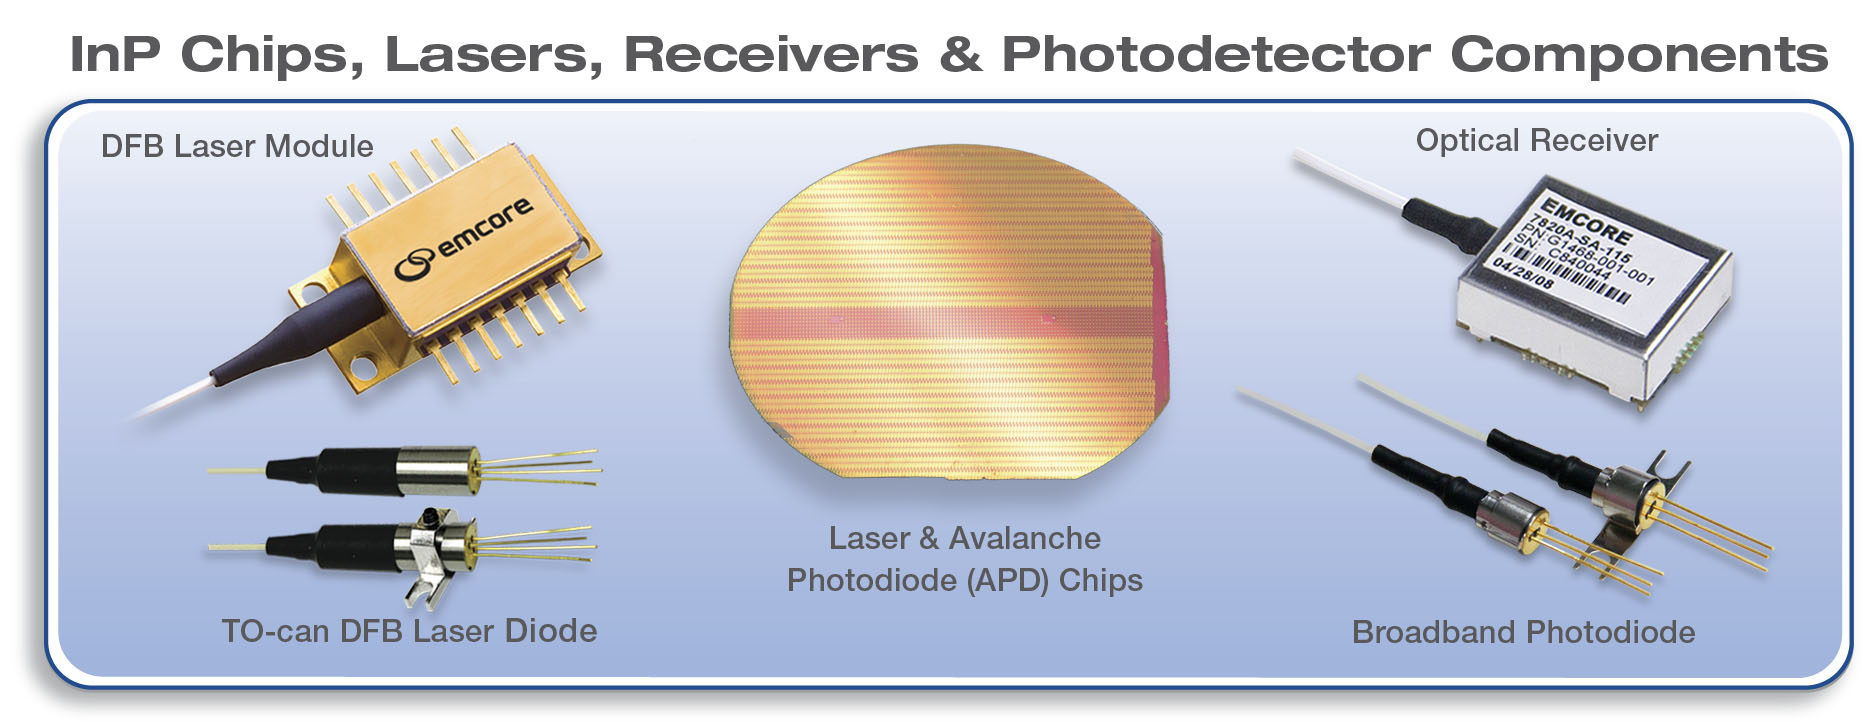
Laser, Receiver and Photodetector Component Products
- We believe that we are a leading provider of optical components including lasers, photodetectors, and various forms of packaged subassemblies. Our products include bare die (or chip), distributed feedback (DFB) lasers, positive-intrinsic-negative (PIN) and avalanche photodiode (APD) components for 10 Gb/s Ethernet, InfiniBand, FTTP, and telecom applications. We provide component products to the global fiber optics industry, and we also leverage the benefits of our vertically-integrated infrastructure through low-cost manufacturing and early access to newly developed internally-produced components.
|
|
▪
|
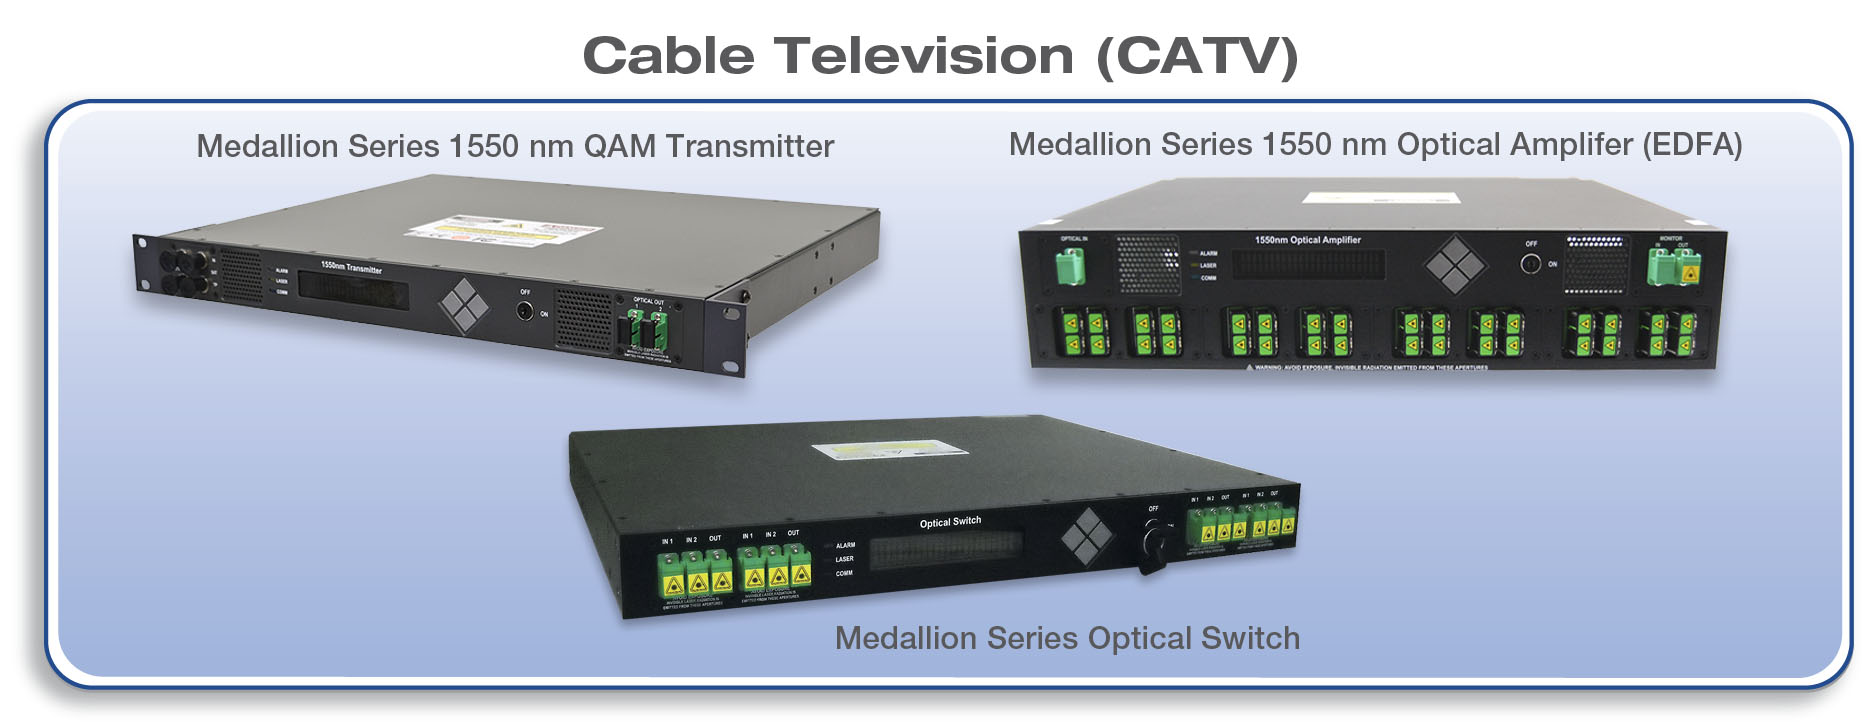
Cable Television (CATV) Products
- We believe that we are a market leader in providing radio frequency (RF) over fiber products for the CATV industry. Our products are used in hybrid fiber coaxial (HFC) networks that enable cable service operators to offer multiple advanced services to meet the expanding demand for high-speed Internet, on-demand and interactive video, and other advanced services, such as high-definition television (HDTV) and voice over IP (VoIP). Our CATV products include forward and return-path analog and digital lasers, photodetectors and subassembly components, broadcast analog and digital fiber-optic transmitters, and quadrature amplitude modulation (QAM) transmitters and receivers. Our products provide our customers with increased data transmission distance, speed and bandwidth, lower noise video reception, and lower power consumption.
|
5
|
▪
|
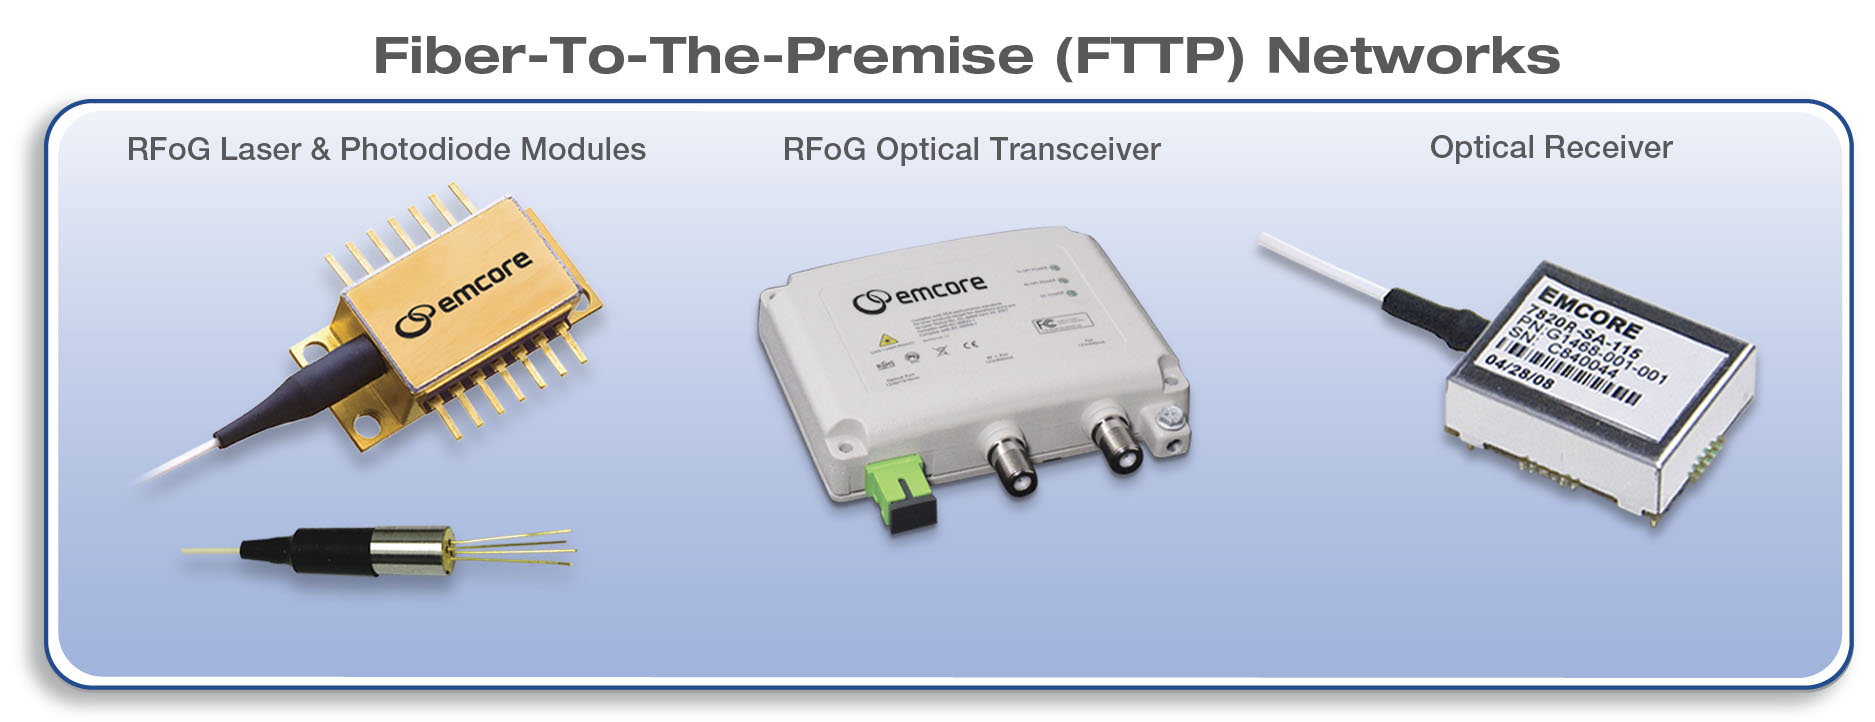
Fiber-To-The-Premises (FTTP) Products
- Telecommunications companies are extending their optical infrastructure to their business enterprise and residential customers because of higher bandwidth requirements. We have developed customer qualified FTTP components and subsystem products to support plans by telecommunications companies to offer voice, video, and data services through the deployment of new fiber optics-based access networks. Our FTTP products include passive optical network (PON) transceivers, RF over glass (RFoG) optical transceivers, analog fiber optic transmitters for video overlay and high-power erbium-doped fiber amplifiers (EDFA), analog and digital lasers, photodetectors and subassembly components, analog video receivers, and multi-dwelling unit (MDU) video receivers. Our products provide our customers with higher performance analog and digital designs, and support exceptional network performance capabilities for service providers.
|
|
▪
|
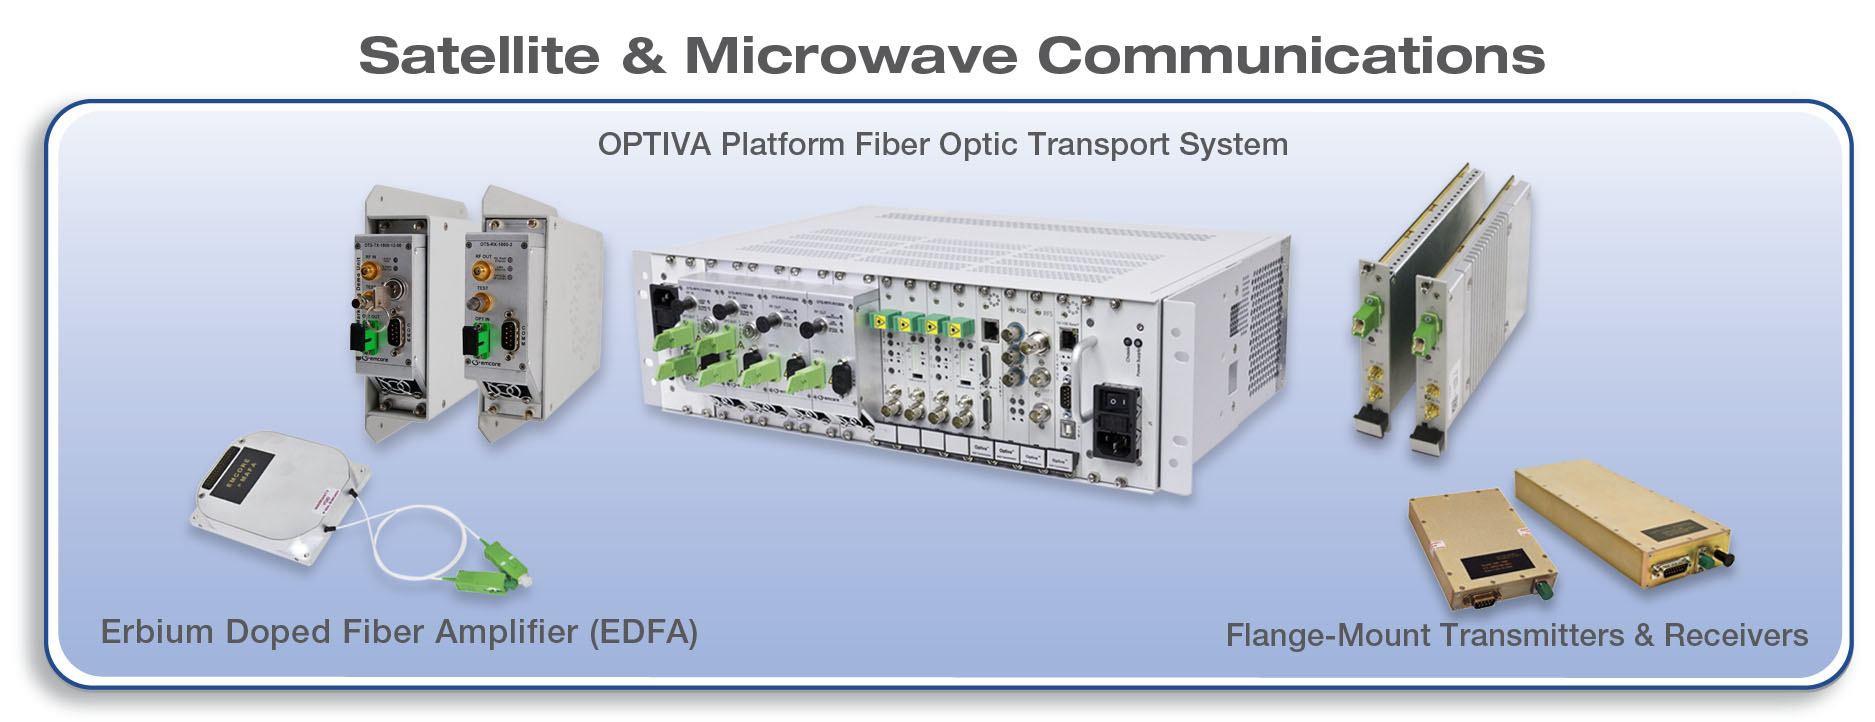
Satellite/Microwave Communications Products
- We believe that we are a leading provider of optical components and systems for use in equipment that provides high-performance optical data links for the terrestrial portion of satellite communications networks. Our products include transmitters, receivers, subsystems, and systems that transport wideband RF and microwave signals between satellite hub equipment and antenna dishes. Our products provide our customers with increased bandwidth and lower power consumption.
|
6
|
▪
|
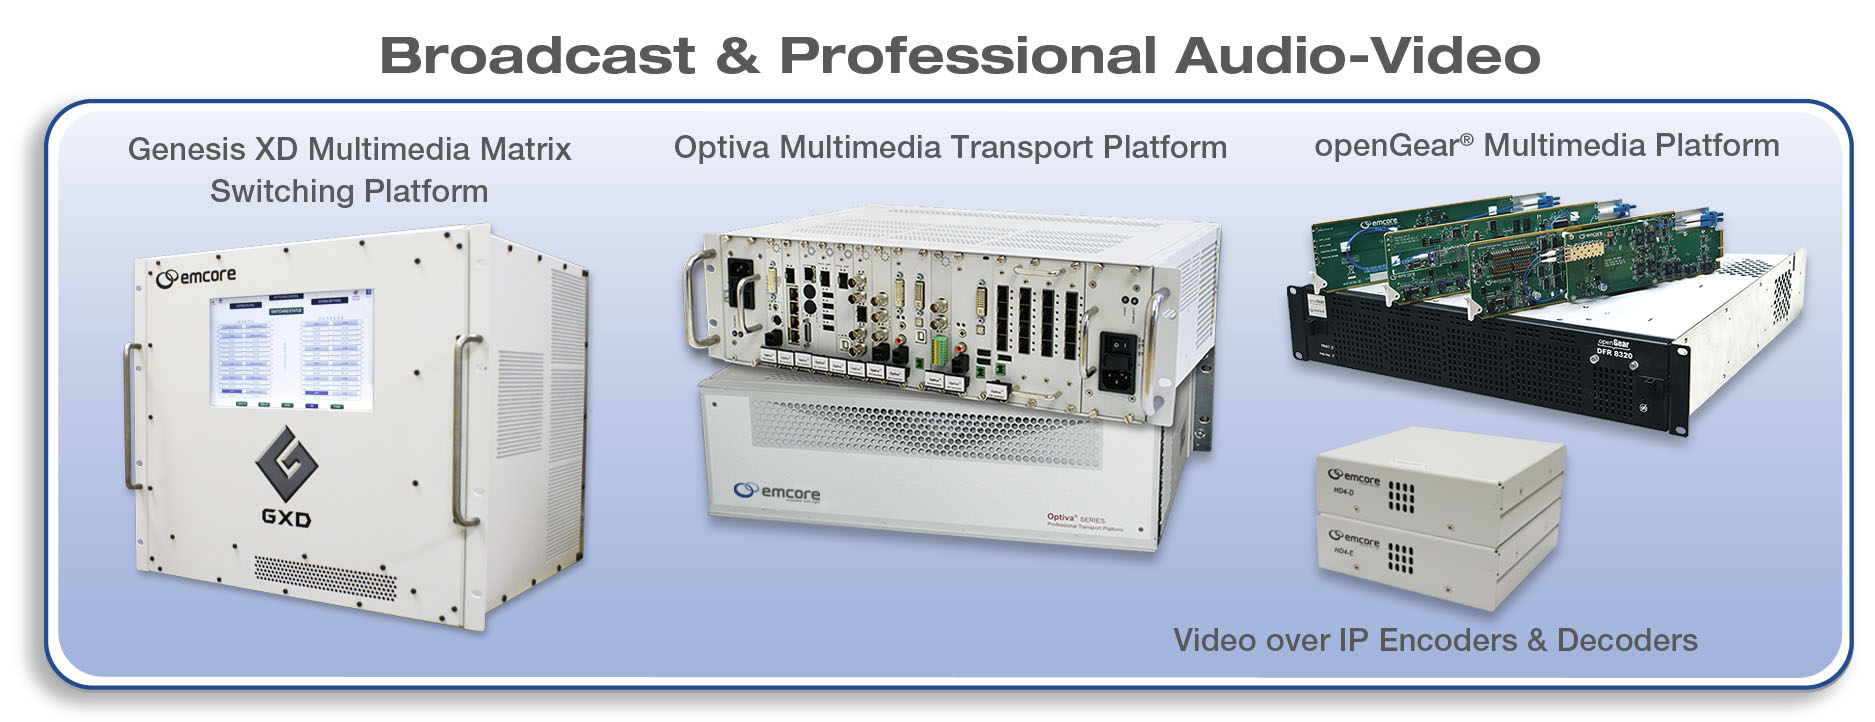
Broadcast & A/V Video Transport Products
- Our video transport product line focuses on developing targeted solutions that meet the evolving technology needs of our customers in broadcasting, government, transportation, IP television, and security and surveillance applications over private and public networks. Our video, audio, data, and RF transmission systems serve both analog and digital requirements, providing cost-effective, flexible solutions geared for infrastructure upgrades and expansion.
|
|
▪
|
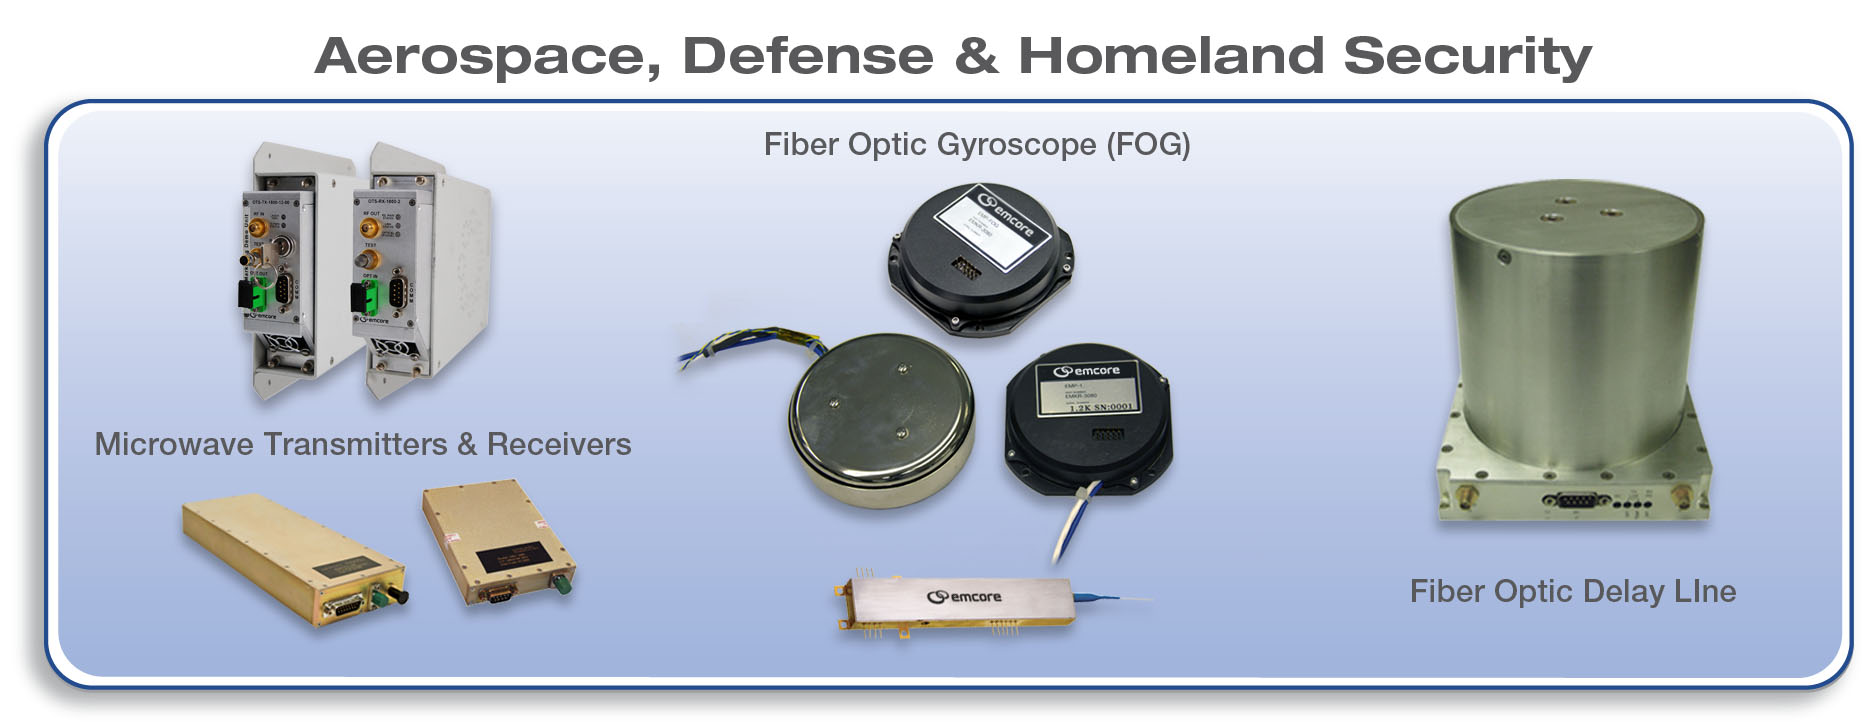
Defense and Homeland Security
Products
- Leveraging our expertise in RF module design and high-speed parallel optics, we provide a suite of ruggedized products that meet the reliability and durability requirements of the U.S. government and defense markets. Our specialty defense products include fiber optic gyro components used in commercial and military applications, high-frequency RF fiber optic link components for towed decoy systems, optical delay lines for radar systems, erbium-doped fiber amplifiers, pulse lasers for light detection and ranging spectroscopy systems and other products. Our products provide our customers with high frequency and dynamic range, compact form-factor, and extreme temperature, shock and vibration tolerance.
|
Customers include: Arris Technology Inc., BAE Systems, BUPT-GuoAn Broadband, Cisco Systems Inc. and Pace Plc. Significant customers are defined as customers representing greater than 10% of our consolidated revenue. Revenue from
four
of our significant customers represented
61%
of our consolidated revenue for the fiscal year ended
September 30, 2015
. Revenue from
three
of our significant customers represented
41%
and
40%
of our consolidated revenue for the fiscal years ended
September 30, 2014
and
2013
, respectively. See Note 16 - Geographical Information in the notes to our consolidated financial statements for additional information about our significant customers.
Geographical Information
See
Note 16 - Geographical Information
in the notes to our consolidated financial statements for disclosures related to geographic revenue and long-lived assets.
Strategic Plan
Strategy Committee of the Board of Directors
In addition to organic growth and development of our existing Fiber Optics business, we intend to pursue other strategies to enhance shareholder value. The Strategy and Alternatives Committee of the Company's Board of Directors (the "Strategy Committee"), which was established in December 2013, is charged with evaluating strategic opportunities for the Company that may enhance shareholder value. The Strategy Committee may from time to time consider strategic opportunities to enhance shareholder value, which may include acquisitions, investments in joint ventures, partnerships, and other strategic alternatives, such as dispositions, reorganizations, recapitalizations or other similar transactions, the repurchase of shares of our outstanding common stock or payment of dividends to our shareholders, and may engage financial and other advisors to assist it in doing so. Accordingly, the Strategy Committee of the Board of Directors and our management may from time to time be engaged in evaluating potential strategic opportunities and may enter into definitive agreements with respect to such transactions or other strategic alternatives. However, there is no assurance that the Strategy Committee will identify further strategic opportunities that the Company will determine to pursue, or that the consideration of any such opportunity would result in the completion of a strategic transaction.
7
Sale of Photovoltaics and Digital Products Businesses
On
September 17, 2014
, EMCORE entered into an Asset Purchase Agreement (the “Photovoltaics Agreement”) with SolAero Acquisition Corporation ("SolAero"), a Delaware corporation and an affiliate of private equity firm Veritas Capital, pursuant to which SolAero agreed to acquire substantially all of the assets, and assume substantially all of the liabilities, primarily related to or used in connection with the Company’s photovoltaics business, including EMCORE's subsidiaries EMCORE Solar Power, Inc. and EMCORE IRB Company, LLC (collectively, the "Photovoltaics Business" and, the sale of the Photovoltaics Business, the "Photovoltaics Asset Sale") for
$150.0 million
in cash, prior to a
$0.1 million
working capital adjustment pursuant to the Photovoltaics Agreement finalized and paid by EMCORE during the fiscal year ended
September 30, 2015
. On
December 10, 2014
, EMCORE completed the Photovoltaics Asset Sale.
On
October 22, 2014
, EMCORE entered into an Asset Purchase Agreement (the "Digital Products Agreement") with NeoPhotonics Corporation, a Delaware corporation ("NeoPhotonics") pursuant to which the Company agreed to sell certain assets, and transfer certain liabilities of the Company's telecommunications business (collectively, the "Digital Products Business" and, the sale of the Digital Products Business, the "Digital Products Assets Sale") to NeoPhotonics for an aggregate purchase price of
$17.5 million
, subject to certain purchase price adjustments, consisting of
$1.5 million
in cash at closing and a promissory note in the principal amount of
$16.0 million
(the "Promissory Note"). The Promissory Note provided that it would bear interest of
5.0%
per annum for the first year and
13.0%
per annum for the second year, payable semi-annually in cash, and would mature two years from the closing of the transaction. In addition, the Promissory Note was subject to prepayments under certain circumstances, and is secured by certain of the assets sold to NeoPhotonics in the transaction.
On
January 2, 2015
, EMCORE and NeoPhotonics entered into Amendment No. 1 (the "APA Amendment") to the Digital Products Agreement. Among other things, the APA Amendment revised the nature and timing of the financial deliverable requirements of the Company to NeoPhotonics under the original Digital Products Agreement. The assets sold pursuant to the Digital Products Agreement included certain fixed assets, inventory, accounts receivable and intellectual property for the ITLA, micro-ITLA, T-TOSA and T-XFP product lines within the Company’s telecommunications business. On
January 2, 2015
, EMCORE completed the sale of the Digital Products Business. On
April 16, 2015
, EMCORE and NeoPhotonics entered into an agreement to adjust the purchase price for the Digital Products Business, resulting in an adjusted balance of the Promissory Note of
$15.5 million
. On
April 17, 2015
, NeoPhotonics paid in full the balance outstanding of the Promissory Note of
$15.5 million
, plus accrued interest of
$0.2 million
.
We used a portion of the proceeds from the Photovoltaics Asset Sale and the Digital Products Assets Sale (collectively, the "Asset Sales") to pay for transaction costs associated with the Asset Sales, make payments required pursuant to existing retention award agreements, repay certain indebtedness, and for general working capital purposes. In June 2015, we also used a portion of the proceeds from the Asset Sales to repurchase
6.9 million
shares of our common stock for an aggregate cost of
$45.0 million
(excluding fees and expenses) pursuant to a modified "Dutch auction" tender offer we commenced in May 2015. At the discretion of our Board of Directors, we may use a portion of our existing balances of cash and cash equivalents to provide liquidity to our shareholders through one or more special dividends or the repurchase of additional shares of our common stock, make investments in other businesses and pursue other strategic opportunities or a combination thereof.
Sources of Raw Materials
We depend on a limited number of suppliers for certain raw materials, components, and equipment used in our products. We continually review our supplier relationships to mitigate risks and lower costs, especially where we depend on one or two suppliers for critical components or raw materials. While maintaining inventories that we believe are sufficient to meet our near-term needs, we strive not to carry significant inventories of raw materials. Accordingly, we maintain ongoing communications with our suppliers in order to prevent any interruptions in supply, and have implemented a supply-chain management program to maintain quality and lower purchase prices through standardized purchasing efficiencies and design requirements. To date, we generally have been able to obtain sufficient quantities of critical supplies in a timely manner.
We are subject to rules promulgated by the SEC pursuant to the Dodd-Frank Wall Street Reform and Consumer Protection Act regarding the use of "conflict minerals". These rules have imposed and will continue to impose additional costs and may introduce new risks related to our ability to verify the origin of any "conflict minerals" used in our products.
8
Manufacturing
We utilize MOCVD (metal-organic chemical vapor deposition) systems that are capable of processing virtually all compound semiconductor-based materials. Our operations include wafer fabrication, device design and production, fiber optic module, subsystem and system design and manufacture, and solar panel engineering and assembly. Many of our manufacturing operations are computer monitored or controlled to enhance production output and statistical control. We employ a strategy of minimizing ongoing capital investments, while maximizing the variable nature of our cost structure. We maintain supply agreements with key suppliers. Where we can gain cost advantages while maintaining quality and intellectual property control, we outsource the production of certain products, subsystems, components, and subassemblies to contract manufacturers located overseas. Our contract manufacturers maintain comprehensive quality assurance and delivery systems, and we continuously monitor them for compliance.
Our various manufacturing processes involve extensive quality assurance systems and performance testing. Our facilities have acquired and maintain certification status for their quality management systems. Our manufacturing facilities located in Alhambra, California; Ivyland, Pennsylvania; and Langfang, China are registered to ISO 9001 standards.
Sales and Marketing
We sell our products worldwide through our direct sales force, application engineers, third party sales representatives and distributors. Our sales force communicates with our customers' engineering, manufacturing, and purchasing personnel to provide optimized customer solutions through product design, qualifications, performance, and price. Our strategy is to use our direct sales force to sell to original equipment manufacturers and key accounts and to expand our use of distribution partners for increased coverage in both international markets and certain domestic segments.
Throughout our sales cycle, we work closely with our customers to qualify our products into their product lines and platforms. As a result, we develop strategic and long-lasting customer relationships with products and services that are tailored to our customers' requirements. We focus our marketing communication efforts on increasing brand awareness, communicating our technologies' advantages, and generating leads for our sales force. We use a variety of marketing methods, including our website, participation at trade shows, and selective advertising to achieve these goals.
Externally, our marketing group works with customers to define requirements, characterize market trends, define new product development activities, identify cost reduction initiatives, and manage new product introductions. Internally, our marketing group communicates and manages customer requirements with the goal of ensuring that our product development activities are aligned with our customers' needs. These product development activities allow our marketing group to manage new product introductions and new product and market trends. See
Note 16 - Geographical Information
in the notes to the consolidated financial statements for disclosures related to geographic revenue, and significant customers.
Research and Development
Our research and development efforts have been focused on maintaining our technological competitive edge by working to improve the quality and features of our product lines. We are also making investments to expand our existing technology and infrastructure in an effort to develop new products and production technology that we can use to expand into new markets. Our industry is characterized by rapid changes in process technologies with increasing levels of functional integration. Our efforts are focused on designing new proprietary processes and products, on improving the performance of our existing materials, components, and subsystems, and on reducing costs in the product manufacturing process.
As part of the ongoing effort to cut costs, many of our projects have focused on developing lower cost versions of our existing products. In view of the high cost of development, we solicit research contracts that provide opportunities to enhance our core technology base and promote the commercialization of targeted products. Generally, internal research and development funding is used for the development of products that will be released within twelve months and external funding is used for long-term research and development efforts.
9
We believe that in order to remain competitive, we must invest significant financial resources in developing new product features and enhancements and in maintaining customer satisfaction worldwide. Research and development expense was
$9.1 million
,
$9.3 million
and
$10.5 million
for the fiscal years ended
September 30, 2015
,
2014
and
2013
, respectively. As a percentage of revenue, research and development expenses were
11.2%
,
16.8%
and
17.2%
for the fiscal years ended
September 30, 2015
,
2014
and
2013
, respectively. Our research and development expense consists primarily of compensation expense including non-cash stock-based compensation expense, as well as engineering and prototype costs, depreciation expense, and other overhead expenses, as they related to the design, development, and testing of our products. These costs are expensed as incurred.
Intellectual Property and Licensing
We protect our proprietary technology by applying for patents, where appropriate, and in other cases by preserving the technology, related know-how, and information as trade secrets. The success and competitive advantage enjoyed by our product lines depends heavily on our ability to obtain intellectual property protection for our proprietary technologies. We also acquire, through license grants or assignments, rights to patents on inventions originally developed by others. As of
September 30, 2015
, we held approximately
80
U.S. patents and approximately
40
foreign patents and had over
30
additional patent applications pending. The issued patents cover various products in the major markets we serve. Our U.S. patents will expire on varying dates between 2016 and 2031. These patents and patent applications claim protection for various aspects of current or planned commercial versions of our materials, components, subsystems, and systems.
We also have entered into license agreements with the licensing agencies of universities and other organizations, under which we have obtained exclusive or non-exclusive rights to practice inventions claimed in various patents and applications issued or pending in the U.S. or other foreign jurisdictions. We do not believe our financial obligations under any of these agreements adversely affects our business, financial condition, or results of operations.
We rely on trade secrets to protect our intellectual property when we believe that publishing patents would make it easier for others to reverse engineer our proprietary processes. We also rely on other intellectual property rights such as trademarks and copyrights where appropriate. See
Note 9 - Intangible Assets
in the notes to our consolidated financial statements for additional disclosures related to intellectual property.
Environmental Regulations
We are subject to U.S. federal, state, and local laws and regulations concerning the use, storage, handling, generation, treatment, emission, release, discharge, and disposal of certain materials used in our research and development and production operations, as well as laws and regulations concerning environmental remediation, homeland security, and employee health and safety. The production of wafers and devices involves the use of certain hazardous raw materials, including, but not limited to, ammonia, phosphine, and arsine. We have in-house professionals to address compliance with applicable environmental, homeland security, and health and safety laws and regulations. We believe that we are currently in compliance with all applicable federal, state, and local environmental protection laws and regulations.
Competition
The markets for our products are extremely competitive and are characterized by rapid technological change, frequent introduction of new products, short product life cycles, and significant price erosion. We face actual and potential competition from numerous domestic and international companies. Many of these companies have significant engineering, manufacturing, marketing, and financial resources.
Partial lists of our competitors in the markets in which we participate include:
CATV Networks
. Our primary competitors include Applied Optoelectronics and Finisar at the subsystem level and Applied Optoelectronics and Sumitomo Electric Device Innovations at the component product level.
Satellite Communications Networks
. Our primary competitors include Foxcom and MITEQ, Inc.
Video Transport Products
. Our primary competitors include Evertz and Telecast.
10
In addition to the companies listed above, we compete with many research institutions and universities for research funding. We also sell our products to current competitors and companies with the capability of becoming competitors. As the markets for our products grow, new competitors are likely to emerge and current competitors may increase their market share. In the European Union (“EU”), political and legal arrangements encourage the purchase of EU-produced goods, which places us at a disadvantage against European competitors.
There are substantial barriers to entry by new competitors across our product lines. These barriers include the large number of existing patents, the time and costs required to develop products, the technical difficulty in manufacturing semiconductor-based products, the lengthy sales and qualification cycles, and the difficulties in hiring and retaining skilled employees with the required scientific and technical backgrounds. We believe that the primary competitive factors within our current markets are product cost, yield, throughput, performance and reliability, breadth of product line, product heritage, customer satisfaction, and customer commitment to competing technologies. Competitors may develop enhancements to or future generations of competitive products that offer superior price and performance characteristics. We believe that in order to remain competitive, we must invest significant financial resources in developing new product features and enhancements and in maintaining customer satisfaction worldwide.
Order Backlog
EMCORE's product sales are made pursuant to purchase orders, often with short lead times. These orders are subject to revision or cancellation and often are made without deposits. Products typically ship within the same quarter in which a purchase order is received; therefore, our order backlog at any particular date is not necessarily indicative of actual revenue or the level of orders for any succeeding period.
Employees
As of
September 30, 2015
, we had approximately
543
employees, including approximately
297
international employees that are located primarily in China. This represents a decrease of approximately
226
employees when compared to
September 30, 2014
, primarily as a result of the sales of the Photovoltaics Business and the Digital Products Business. None of our employees are covered by a collective bargaining agreement. We have never experienced any labor-related work stoppage and believe that our employee relations are good.
Competition is intense in the recruiting of personnel in the semiconductor industry. Our ability to attract and retain qualified personnel is essential to our continued success. We are focused on retaining key contributors, developing our staff, and cultivating their commitment to our Company.
11
ITEM 1A
.
Risk Factors
We are a much smaller company than in the recent past and dependent on fewer products for our success.
We are a much smaller company than in the recent past with a narrower, less diversified and more focused portfolio of products. Our smaller size could cause our cash flow and growth prospects to be more volatile and make us more vulnerable to focused competition. As a smaller company, we will be subject to greater revenue fluctuations if our older product lines sales were to decline faster than we anticipate. In addition, we may not be able to appropriately restructure our supporting functions to fit the needs of a smaller company.
We have a history of incurring losses from continuing operations and our future profitability is not assured.
For the fiscal years ended
September 30, 2015
, and
2013
, loss from continuing operations was
$2.3 million
,
$5.6 million
and we had income from continuing operations of
$4.1 million
for the fiscal year ended
September 30, 2014
. Our operating results for future periods are subject to numerous uncertainties and we cannot assure you that we will be profitable or that we will not experience substantial losses in the future. If we are not able to increase revenue and reduce our costs, we may not be able to achieve profitability in future periods and our cash flow and financial condition may be adversely affected.
Our future revenue is inherently unpredictable. As a result, our operating results are likely to fluctuate from period to period, and we may fail to meet the expectations of our analysts and/or investors, which may cause volatility in our stock price and may cause our stock price to decline.
Our quarterly and annual operating results have fluctuated substantially in the past and are likely to fluctuate significantly in the future due to a variety of factors, some of which are outside of our control. Factors that could cause our quarterly or annual operating results to fluctuate include:
|
•
|
a downturn in the markets for our customers' products;
|
|
•
|
discontinuation by our vendors, or unavailability of, components or services used in our products;
|
|
•
|
disruptions or delays in our manufacturing processes or in our supply of raw materials or product components;
|
|
•
|
a failure to anticipate changing customer product requirements;
|
|
•
|
market acceptance of our products;
|
|
•
|
cancellations or postponements of previously placed orders;
|
|
•
|
increased financing costs or any inability to obtain necessary financing;
|
|
•
|
the impact on our business of current or future cost reduction measures;
|
|
•
|
a loss of key personnel or the shortage of available skilled workers;
|
|
•
|
economic conditions in various geographic areas where we or our customers do business;
|
|
•
|
the impact of political uncertainties, such as government sequestration and uncertainties surrounding the federal budget, customer spending and demand for our products;
|
|
•
|
significant warranty claims, including those not covered by our suppliers;
|
|
•
|
other conditions affecting the timing of customer orders;
|
|
•
|
reductions in prices for our products or increases in the costs of our raw materials;
|
|
•
|
effects of competitive pricing pressures, including decreases in average selling prices of our products;
|
|
•
|
fluctuations in manufacturing yields;
|
|
•
|
obsolescence of products;
|
|
•
|
research and development expenses incurred associated with new product introductions;
|
|
•
|
natural disasters, such as hurricanes, earthquakes, fires, and floods;
|
|
•
|
the emergence of new industry standards;
|
|
•
|
the loss or gain of significant customers;
|
|
•
|
the introduction of new products and manufacturing processes;
|
|
•
|
changes in technology;
|
|
•
|
intellectual property disputes;
|
|
•
|
customs, import/export, and other regulations of the countries in which we do business;
|
|
•
|
the occurrence of M&A activities;
|
|
•
|
and acts of terrorism or violence and international conflicts or crises.
|
12
In addition, the limited lead times with which several of our customers order our products restrict our ability to forecast
revenue. We may also experience a delay in generating or recognizing revenue for a number of reasons. For example, orders at the beginning of each quarter typically represent a small percentage of expected revenue for that quarter and are generally cancelable at any time. We depend on obtaining orders during each quarter for shipment in that quarter to achieve our revenue objectives. Failure to ship these products by the end of a quarter may adversely affect our results of operations and cash flows.
As a result of the foregoing factors, we believe that period-to-period comparisons of our results of operations should not be solely relied upon as indicators of future performance.
We may undergo an "ownership change" within the meaning of Section 382 of the Code, which could affect our ability to offset U.S. federal income tax against our net operating losses and certain of our tax credit carryovers.
Section 382 of the Internal Revenue Code, as amended (the "Code") contains rules that limit the ability of a company that undergoes an ownership change to utilize its net operating losses and tax credits (the “Tax Benefits”) existing as of the date of such ownership change. Under the rules, such an ownership change is generally any change in ownership of more than 50% of a company's stock within a rolling three-year period. The rules generally operate by focusing on changes in ownership among shareholders considered by the rules as owning, directly or indirectly, 5% or more of the stock of a company and any change in ownership arising from new issuances of stock by the company.
If we were to undergo one or more "ownership changes" within the meaning of Section 382 of the Code, our net operating losses and certain of our tax credits existing as of the date of each ownership change may be unavailable, in whole or in part, to offset U.S. federal income tax resulting from our operations or any gains from the disposition of any of our assets and/or business, which could result in increased U.S. federal income tax liability.
On September 17, 2014, our Board of Directors adopted a Tax Benefits Preservation Plan (the “Rights Plan”) to help preserve the value of our Tax Benefits by reducing the risk of limitation of our Tax Benefits. The Rights Plan was approved by our shareholders on March 10, 2015. The Rights Plan is intended to reduce the likelihood that we will experience an ownership change by discouraging any person or group from becoming a “5% shareholder” or increasing their ownership of our common stock if they are already a “5% shareholder.” Although the Rights Plan is intended to reduce the likelihood of an “ownership change” that could adversely affect us, there is no assurance that the Rights Plan will prevent all transfers of our common stock that could result in such an “ownership change.
Our business and results of operations may continue to be negatively impacted by general economic, financial market conditions and market conditions in the industries in which we operate, and such conditions may increase the other risks that affect our business
.
In recent years, the world’s financial markets have experienced significant turmoil, resulting in reductions in available credit, increased costs of credit, extreme volatility in security prices, potential changes to existing credit terms, and rating downgrades of investments. These conditions materially and adversely affected the market conditions in the industries in which we operate and caused many of our customers to reduce their spending plans, leading them to draw down their existing inventory and reduce orders for our products, which, in turn, had a material adverse impact on our revenues. We cannot predict the timing, strength or duration of any economic slowdown or subsequent economic recovery, worldwide or within our industry. It is possible that economic conditions could result in further setbacks, and that these customers, or others, could as a result significantly reduce their capital expenditures, draw down their inventories, reduce production levels of existing products, defer introduction of new products or place orders and accept delivery for products for which they do not pay us due to their economic difficulties or other reasons. If any of these events occur, our business, financial condition, cash flows and results of operations may be adversely affected.
13
We expect to consider from time to time further strategic opportunities that may involve acquisitions, dispositions, investments in joint ventures, partnerships, and other strategic alternatives that may enhance shareholder value, any of which may result in the use of a significant amount of our management resources or significant costs, and we may not be able to fully realize the potential benefit of such transactions.
We expect to continue to consider acquisitions, dispositions, investments in joint ventures, partnerships, and other strategic alternatives that may enhance shareholder value. The Strategy Committee of the Board and our management may from time to time be engaged in evaluating potential transactions and other strategic alternatives. In addition, from time to time, we may engage financial advisors, enter into non-disclosure agreements, conduct discussions, and undertake other actions that may result in one or more transactions. Although there would be uncertainty that any of these activities or discussions would result in definitive agreements or the completion of any transaction, we may devote a significant amount of our management resources to analyzing and pursuing such a transaction, which could negatively impact our operations. In addition, we may incur significant costs in connection with seeking such transactions or other strategic alternatives regardless of whether the transaction is completed. In the event that we consummate an acquisition, dispositions, partnerships, or other or strategic alternatives in the future, we cannot assure you that we would fully realize the potential benefit of such a transaction and cannot predict the impact that such strategic transaction might have on our operations or stock price. We do not undertake to provide updates or make further comments regarding the evaluation of strategic alternatives, unless otherwise required by law.
Acquisitions of other companies or investments in joint ventures with other companies could adversely affect our operating results, dilute our shareholders' equity, or cause us to incur additional debt or assume contingent liabilities.
To increase our business, maintain our competitive position or for other business or strategic reasons, we may acquire other companies or engage in joint ventures or similar transactions in the future. Acquisitions, joint ventures and similar transactions involve a number of risks that could harm our business and result in the acquired business or joint venture not performing as expected, including:
|
•
|
insufficient experience with technologies and markets in which the acquired business is involved, which may be necessary to successfully operate and integrate the business;
|
|
•
|
problems integrating the acquired operations, personnel, technologies, or products with the existing business and products;
|
|
•
|
diversion of management's time and attention from our core business to the acquired business or joint venture;
|
|
•
|
potential failure to retain key technical, management, sales, and other personnel of the acquired business or joint venture;
|
|
•
|
difficulties in retaining relationships with suppliers and customers of the acquired business, particularly where such customers or suppliers compete with us;
|
|
•
|
reliance upon joint ventures which we do not control;
|
|
•
|
subsequent impairment of goodwill and acquired long-lived assets, including intangible assets; and
|
|
•
|
assumption of liabilities including, but not limited to, lawsuits, tax examinations, warranty issues, etc.
|
We may decide that it is in our best interests to enter into acquisitions, joint ventures or similar transactions that are dilutive to earnings per share or that adversely impact margins as a whole. In addition, acquisitions or joint ventures could require investment of significant financial resources and require us to obtain additional equity financing, which may dilute our shareholders' equity, or require us to incur indebtedness.
14
We are subject to the cyclical nature of the markets in which we compete and any future downturn may reduce demand for our products and revenue.
In the past, the markets in which we compete have experienced significant downturns, often connected with, or in anticipation of, the maturation of product cycles, for both manufacturers' and their customers' products, and declining general economic conditions. These downturns have been characterized by diminished product demand, production overcapacity, high inventory levels, and accelerated erosion of average selling prices. These markets are impacted by the aggregate capital expenditures of service providers and enterprises as they build out and upgrade their network infrastructure. These markets are highly cyclical and characterized by constant and rapid technological change, pricing pressures, evolving standards, and wide fluctuations in product supply and demand.
We may experience substantial period-to-period fluctuations in future results of operations. Any future downturn in the markets in which we compete, or changes in demand for our products from our customers, could result in a significant reduction in our revenue. It may also increase the volatility of the price of our common stock.
In addition, the communication networks industry from time to time has experienced and may again experience a pronounced downturn. To respond to a downturn, many service providers and enterprises may slow their capital expenditures, cancel or delay new developments, reduce their workforces and inventories, and take a cautious approach to acquiring new equipment and technologies, any of which could cause our results of operations to fluctuate from period to period and harm our business.
If spending for optical communications networks declines, our business may suffer.
Our future success depends on continued capital investment in global communications networks infrastructure and on continued demand for high-bandwidth, high-speed communications networks and the ability of original equipment manufacturers to meet this demand. Spending on communications networks is limited by several factors, including limited investment resources, uncertainty regarding the long-term evolution and sustainability of service provider business models, and a changing regulatory environment. We cannot be certain that demand for bandwidth-intensive content will continue to grow at the same pace in the future or that communications service providers will continue to increase spending to meet such demand. If expectations for growth of communications networks and bandwidth consumption are not realized and investment in communications networks does not grow as anticipated, our business, results of operations, and gross margins could be harmed.
If we fail to remediate deficiencies in our current system of internal controls, we may not be able to accurately report our financial results or prevent fraud. As a result, our business could be harmed and current and potential investors could lose confidence in our financial reporting, which could have a material adverse effect on the trading price of our equity securities.
We are subject to the ongoing internal control provisions of Section 404 of the Sarbanes-Oxley Act of 2002. These provisions provide for the identification of material weaknesses in internal control over financial reporting, which is a process to provide reasonable assurance regarding the reliability of financial reporting for external purposes in accordance with accounting principals generally accepted in the United States of America ("U.S. GAAP"). If we cannot provide reliable and timely financial reports, our brand, operating results, and the market value of our equity securities could be harmed. We have in the past discovered, and may in the future discover, areas of our internal controls that need improvement.
We have devoted significant resources to remediate and improve our internal controls. We have also been monitoring the effectiveness of these remediated measures. We cannot be certain that these measures will ensure adequate controls over our financial processes and reporting in the future. Any failure to implement required new or improved controls, or difficulties encountered in their implementation, could harm our operating results or cause us to fail to meet our reporting obligations.
Inadequate internal controls could also cause investors to lose confidence in our reported financial information, which could have an adverse effect on the trading price of our equity securities. Further, the impact of these events could also make it more difficult for us to attract and retain qualified persons to serve on our Board of Directors (the "Board") or as executive officers, which could harm our business.
15
We could be required to record an impairment charge as a result of changes to assumptions used in our impairment testing.
We have substantial long-lived assets recorded on our balance sheet. We will continue to evaluate the recoverability of the carrying amount of our property, plant and equipment on an ongoing basis, and we may incur substantial impairment charges, which would adversely affect our financial results. There can be no assurance that the outcome of such reviews in the future will not result in substantial impairment charges. Impairment assessment inherently involves judgment as to assumptions about expected future cash flows and the impact of market conditions on those assumptions. Future events and changing market conditions may impact our assumptions as to prices, costs, holding periods, or other factors that may result in changes in our estimates of future cash flows. Although we believe the assumptions we used in testing for impairment are reasonable, significant changes in any one of our assumptions could produce a significantly different result. In any period where our stock price, as determined by our market capitalization, is less than our book value, this too could indicate a potential impairment and we may be required to record an impairment charge in that period.
Our ability to achieve operational and material cost reductions and to realize production efficiencies for our operations is critical to our ability to achieve long-term profitability.
We have implemented a number of operational and material cost reductions and productivity improvement initiatives, which are intended to reduce our expense structure at both the cost of revenue and the operating expense levels. Cost reduction initiatives often involve the re-design of our products, which requires our customers to accept and qualify the new designs, potentially creating a competitive disadvantage for our products. These initiatives can be time-consuming, disruptive to our operations, and costly in the short-term. Successfully implementing these and other cost-reduction initiatives throughout our operations is critical to our future competitiveness and ability to achieve long-term profitability. However, there can be no assurance that these initiatives will be successful in creating profit margins sufficient to sustain our current operating structure and business.
The market price for our common stock has experienced significant price and volume volatility and is likely to continue to experience significant volatility in the future. This volatility may impair our ability to finance strategic transactions with our stock and otherwise harm our business.
Our stock price has experienced significant price and volume volatility for the past several years, and our stock price is likely to experience significant volatility in the future. The trading price of our common stock may be influenced by factors beyond our control, such as the recent unprecedented volatility of the financial markets and the current uncertainty surrounding domestic and foreign economies. The historical market prices of our common stock may not be indicative of future market prices and we may be unable to sustain or increase the value of our common stock. We have historically used equity incentive compensation as part of our overall compensation arrangements. The effectiveness of equity incentive compensation in retaining key employees may be adversely impacted by volatility in our stock price. Significant declines in our stock price may also interfere with our ability, if needed, to raise additional funds through equity financing or to finance strategic transactions with our stock. In addition, there may be increased risk of securities litigation following periods of fluctuations in our stock price. Securities class action lawsuits are often brought against companies after periods of volatility in the market price of their securities. These and other consequences of volatility in our stock price which could be exacerbated by macroeconomic conditions that affect the market generally, or our industry in particular, could have the effect of diverting management's attention and could materially harm our business.
We are substantially dependent on a small number of customers and the loss of any one of these customers could adversely affect our business, financial condition, results of operations, and cash flows.
A
small number of customers account for a significant portion of our revenue and our dependence on orders from a relatively small number of customers makes our relationship with each customer critically important to our business. If there is consolidation among our customer base, our customers may be able to command increased leverage in negotiating prices and other terms of sale, which could adversely affect our profitability. If we are required to reduce our pricing, our revenue and gross margins would be adversely impacted. Consolidation among our customer base may also lead to reduced demand for our products, replacement of our products by the combined entity with those of our competitors and cancellations of orders, each of which could adversely affect our business, financial condition, results of operations, and cash flows.
16
For example, in April 2015, Arris Group Inc. (“Arris”) announced plans to purchase Pace Plc (“Pace”). Pace and Arris are two of our largest customers. If the merger between Pace and Arris is completed, the combined entity would have accounted for approximately
32%
of our consolidated revenue in fiscal year 2015. If we fail to achieve historical levels of sales of our products to the new entity, the loss or reduction in sales could have a material adverse effect on our business, financial condition, results of operations, and cash flows. Furthermore, to the extent that unexpected delays or transition issues occur in connection with this transaction, we could experience an adverse effect on our business.
Customer demand is difficult to forecast and, as a result, we may be unable to optimally match production with customer demand.
We make planning and spending decisions, including determining the levels of business that we will seek and accept, production schedules, component procurement commitments, personnel needs and other resource requirements, based on our estimates of customer demand. The majority of our products are purchased pursuant to individual purchase orders. While our customers generally provide us with their demand forecasts, they are typically not contractually committed to buy any quantity of products beyond firm purchase orders. The short-term nature of our customer commitments and the possibility of unexpected changes in demand for their products limit our ability to accurately predict future customer demand. On occasion, customers have required rapid increases in production, which has strained our resources. We may not have sufficient capacity at any given time to meet the volume demands of our customers, or one or more of our suppliers may not have sufficient capacity at any given time to meet our volume demands. Conversely, a downturn in the markets in which our customers compete can cause, and in the past has caused, our customers to significantly reduce the amount of products ordered from us or to cancel existing orders, leading to lower utilization of our facilities. Because many of our costs and operating expenses are relatively fixed, reduction in customer demand would have an adverse effect on our gross margin, income (loss) from operations, and cash flow. During an industry downturn, there is also a higher risk that our trade receivables would be uncollectible.
Our operating results could be harmed if we are unable to obtain timely deliveries of sufficient components of acceptable quality from sole or limited sources of materials, components, or services, or if the prices of components for which we do not have alternative sources increase.
We currently obtain some materials, components, and services used in our products from limited or sole sources. We generally do not carry significant inventories of any raw materials. Because we often do not account for a significant part of our suppliers' businesses, we may not have access to sufficient capacity from these suppliers in periods of high demand. In addition, since we generally do not have guaranteed supply arrangements with our suppliers, we risk serious disruption to our operations if an important supplier terminates product lines, changes business focus, or goes out of business. Because some of these suppliers are located overseas, we may be faced with higher costs of purchasing these materials if the U.S. dollar weakens against other currencies. If we were to change any of our limited or sole source suppliers, we would be required to re-qualify each new supplier. Re-qualification could prevent or delay product shipments that could adversely affect our results of operations and cash flows. In addition, our reliance on these suppliers may adversely affect our production if the components vary in quality or quantity. If we are unable to obtain timely deliveries of sufficient components of acceptable quality or if the prices of components for which we do not have alternative sources increase, our business, financial condition, results of operations, and cash flows could be materially adversely affected.
If our contract manufacturers fail to deliver qualified quality products at reasonable prices and on a timely basis, our business, financial condition, results of operations, and cash flows could be adversely affected.
We use contract manufacturers located outside of the U.S. as a less-expensive alternative to our performing manufacturing of certain products. Contract manufacturers in Asia currently manufacture a significant portion of our high-volume fiber optics products. We supply inventory to our contract manufacturers, and we bear the risk of loss, theft, or damage to our inventory while it is held in their facilities.
If these contract manufacturers do not fulfill their obligations to us, or if we do not properly manage these relationships and the transition of production to these contract manufacturers, our existing customer relationships may suffer. In addition, by undertaking these activities, we run the risk that the reputation and competitiveness of our products and services may deteriorate as a result of the reduction of our ability to oversee and control quality and delivery schedules.
17
The use of contract manufacturers located outside of the U.S. also subjects us to the following additional risks that could significantly impair our ability to source our contract manufacturing requirements internationally, including:
- unexpected changes in regulatory requirements;
- legal uncertainties regarding liability, tariffs, and other trade barriers;
- inadequate protection of intellectual property in some countries;
- greater incidence of shipping delays;
- greater difficulty in overseeing manufacturing operations;
- greater difficulty in hiring talent needed to oversee manufacturing operations;
- potential political and economic instability and natural disasters;
- potential adverse actions by the U.S. government pursuant to its stated intention to reduce the loss of U.S. jobs;
- trade and travel restrictions; and
- the outbreak of infectious diseases which could result in travel restrictions or the closure of the facilities of our
contract manufacturers.
Any of these factors could significantly impair our ability to source our contract manufacturing requirements internationally. Prior to our customers accepting products manufactured at our contract manufacturers, they must qualify the product and manufacturing processes. The qualification process can be lengthy and expensive, with no guarantee that any particular product qualification process will lead to profitable product sales. The qualification process determines whether the product manufactured at our contract manufacturer achieves our customers' quality, performance, and reliability standards. Our expectations as to the time periods required to qualify a product line and ship products in volumes to our customers may be erroneous. Delays in qualification can impair our expected timing of the transfer of a product line to our contract manufacturer and may impair our expected amount of sales of the affected products. Any of these uncertainties could materially adversely affect our operating results and customer relationships.
If we do not keep pace with rapid technological change, our products may not be competitive.
We compete in markets that are characterized by rapid technological change, frequent new product introductions, changes in customer requirements, evolving industry standards, continuous improvement in products and the use of our existing products in new applications. We may not be able to develop the underlying core technologies necessary to create new products and enhancements at the same rate as or faster than our competitors, or to license the technology from third parties that is necessary for our products. Product development delays may result from numerous factors, including:
- changing product specifications and customer requirements;
- unanticipated engineering complexities;
- expense reduction measures we have implemented and others we may implement;
- difficulties in hiring and retaining necessary technical personnel; and
- difficulties in allocating engineering resources and overcoming resource limitations.
We cannot assure you that we will be able to identify, develop, manufacture, market, or support new or enhanced products successfully, if at all, or on a timely, cost effective, or repeatable basis. Our future performance will depend on our successful development and introduction of, as well as market acceptance of, new and enhanced products that address market changes, as well as current and potential customer requirements and our ability to respond effectively to product announcements by competitors, technological changes, or emerging industry standards. Because it is generally not possible to predict the amount of time required and the costs involved in achieving certain research, development and engineering objectives, actual development costs may exceed budgeted amounts and estimated product development schedules may be extended. If we are unable to develop, manufacture, market, or support new or enhanced products successfully, or incur budget overruns or delays in our research and development efforts, our business, financial condition, results of operations, and cash flows may be materially adversely affected.
18
Spending to develop and improve our technology may adversely impact our financial results.
We may need to increase our research and development and/or capital expenditures and expenses above our historical run-rate model in order to attempt to improve our existing technology and develop new technology. Increasing our investments in research and development of technology could cause our cost structure to fall out of alignment with demand for our products, which would have a negative impact on our financial results. If we are unable to obtain financing or implement cost reduction measures necessary to fund these types of expenditures, we may be unable to improve our technology or develop new technologies, which could have a material adverse effect on our business, financial condition and results of operations.
The competitive and rapidly evolving nature of our industries has in the past resulted and is likely in the future to result in reductions in our product prices and periods of reduced demand for our products.
We face substantial competition from a number of companies, many of which have greater financial, marketing, manufacturing, and technical resources than we do. Larger-sized competitors often spend more on research and development, which could give those competitors an advantage in meeting customer demands and introducing technologically innovative products before we do. We expect that existing and new competitors will continue to improve the design of their existing products and will introduce new products with enhanced performance characteristics.
The introduction of new products and more efficient production of existing products by our competitors have resulted and are likely in the future to result in price reductions, increases in expenses, and reduced demand for our products. In addition, some of our competitors may be willing to provide their products at lower prices, accept a lower profit margin, or spend more capital in order to obtain or retain business. Competitive pressures have required us to reduce the prices of some of our products. These competitive forces could diminish our market share and gross margins, resulting in an adverse effect on our business, financial condition, results of operations, and cash flows.
New competitors may also enter our markets, including some of our current and potential customers who may attempt to integrate their operations by producing their own components and subsystems or acquiring one of our competitors, thereby reducing demand for our products. In addition, rapid product development cycles, increasing price competition due to maturation of technologies, the emergence of new competitors in Asia with lower cost structures, and industry consolidation resulting in competitors with greater financial, marketing, and technical resources could result in lower prices or reduced demand for our products, which could have an adverse effect on our business, financial condition, results of operations, and cash flows.
Expected and actual introductions of new and enhanced products may cause our customers to defer or cancel orders for existing products and may cause our products to become obsolete. A slowdown in demand for existing products ahead of a new product introduction could result in a write-down in the value of inventory on hand related to existing products. We have in the past experienced a slowdown in demand for existing products and delays in new product development and such delays may occur in the future. To the extent customers defer or cancel orders for existing products due to a slowdown in demand or in anticipation of a new product release, or if there is any delay in development or introduction of our new products or enhancements of our products, our business, financial condition, results of operations, and cash flows could be materially adversely affected.
Our products are difficult to manufacture. Our production could be disrupted and our results of operations and cash flows could suffer if our production yields are low as a result of manufacturing difficulties.
We manufacture many of our wafers and products in our own production facilities. Difficulties in the production process, such
as contamination, raw material quality issues, human error, or equipment failure, could cause a substantial percentage of wafers and devices to be nonfunctional. These problems may be difficult to detect at an early stage of the manufacturing process and often are time-consuming and expensive to correct. Lower-than-expected production yields may delay shipments or result in unexpected levels of warranty claims, either of which could adversely affect our results of operations and cash flows. We have experienced difficulties in achieving planned yields in the past, particularly in pre-production and upon initial commencement of full production volumes, which have adversely affected our gross margins. Because the majority of our manufacturing costs are fixed, achieving planned production yields is critical to our results of operations and cash flows. Changes in manufacturing processes required as a result of changes in product specifications, changing customer needs and the introduction of new product lines could significantly reduce our manufacturing yields, resulting in low or negative margins on those products.
19
Also, we have substantial risk of interruption in manufacturing resulting from fire, natural disaster, equipment failures, or similar events, because we manufacture most of our products using a few facilities, and do not have back-up facilities available for manufacturing these products. We could also incur significant costs to repair and/or replace products that are defective and in some cases costly product redesigns and/or rework may be required to correct a defect. Additionally, any defect could adversely affect our reputation and result in the loss of future orders.
Some of the capital equipment used in the manufacture of our products have been developed and made specifically for us, is not readily available from multiple vendors, and would be difficult to repair or replace if it were to become damaged or stop working. If any of these suppliers were to experience financial difficulties or go out of business, or if there were any damage to, or a breakdown of our manufacturing equipment at a time when we are manufacturing commercial quantities of our products, our business, financial condition, results of operations, and cash flows could be materially adversely affected.
We are subject to warranty claims, product recalls, and product liability.
We may be subject to warranty or product liability claims that may lead to increased expenses in order to defend or settle such claims. We maintain product liability insurance, but such insurance is subject to significant deductibles and there is no guarantee that such insurance will be available or adequate to protect against any or all such claims. We may incur costs and expenses relating to a recall of one of our customers' products containing one of our products. The process of identifying a recalled product in devices that have been widely distributed may be lengthy and require significant resources, and we may incur significant replacement costs, contract damage claims from our customers, and harm to our reputation. Payments and expenses in connection with warranty and product liability claims could materially adversely affect our business, financial condition, results of operations, and cash flows.
It could be discovered that our products contain defects that may cause us to incur significant costs, divert management's attention, result in a loss of customers, and result in product liability claims.
Our products are complex and undergo quality testing and formal qualification by our customers and us. However, defects may occur from time to time. Our customers' testing procedures involve evaluating our products under likely and foreseeable failure scenarios and over varying amounts of time. For various reasons, such as the occurrence of performance problems that are unforeseeable in testing or that are detected only when products age or are operated under peak stress conditions, our products may fail to perform as expected long after customer acceptance. Failures could result from faulty components or design, problems in manufacturing, or other unforeseen reasons. For the majority of our products, we provide a product warranty of one year or less from date of shipment. For select customers, we provide extended warranties beyond our normal product warranty period for specified failures on a case-by-case basis. As a result, we could incur significant costs to repair or replace defective products under warranty, particularly when such failures occur in installed systems. We have experienced failures in the past and will continue to face this risk going forward, as our products are widely deployed throughout the world in multiple demanding environments and applications. In addition, we may in certain circumstances honor warranty claims after the warranty has expired or for problems not covered by warranty in order to maintain customer relationships. Any significant product failure could result in lost future sales of the affected product and other products, as well as customer relations problems, litigation, and damage to our reputation.
In addition, our products are typically embedded in, or deployed in conjunction with, our customers' products, which incorporate a variety of components, modules and subsystems and may be expected to interpolate with modules and subsystems produced by third parties. As a result, not all defects are immediately detectable and when problems occur, it may be difficult to identify the source of the problem. These problems may cause us to incur significant damages or warranty and repair costs, divert the attention of our engineering personnel from our product development efforts, and cause significant customer relations problems or loss of customers, all of which would harm our business. The occurrence of any defects in our products could also give rise to liability for damages caused by such defects. Although we carry product liability insurance to mitigate this risk, insurance may not adequately cover costs that may arise from defects in our products or otherwise, nor will it protect us from reputational harm that may result from such defects.
20
We face lengthy sales and qualification cycles for our new products and, in many cases, must invest a substantial amount of time and money before we receive orders.
Most of our products are tested by current and potential customers to determine whether they meet customer or industry specifications. The length of the qualification process, which can span a year or more, varies substantially by product and customer and, thus, can cause our results of operations and cash flows to be unpredictable. During a given qualification period, we invest significant resources and allocate substantial production capacity to manufacture these new products prior to any commitment to purchase by customers. In addition, it is difficult to obtain new customers during the qualification period as customers are reluctant to expend the resources necessary to qualify a new supplier if they have one or more existing qualified sources. If we are unable to meet applicable specifications or do not receive sufficient orders to profitably use our allocated production capacity, our business, financial condition, results of operations, and cash flows could be materially adversely affected.
Our historical and future budgets for operating expenses, capital expenditures, operating leases, and service contracts are based upon our assumptions as to the future market acceptance of our products. Because of the lengthy lead times required for product development and the changes in technology that typically occur while a product is being developed, it is difficult to accurately estimate customer demand for any given product. If our products do not achieve an adequate level of customer demand, our business, financial condition, results of operations, and cash flows could be materially adversely affected.
Shifts in industry-wide demands and inventories could result in significant inventory write-downs.
The life cycles of some of our products depend heavily upon the life cycles of the end products into which our products are designed. Products with short life cycles require us to manage production and inventory levels closely. We evaluate our ending inventories on a quarterly basis for excess quantities, impairment of value, and obsolescence. This evaluation includes analysis of sales levels by product and projections of future demand based upon input received from our customers, sales team, and management. If inventories on hand are in excess of demand, or if they are greater than 12-months old, appropriate write-downs may be recorded. In addition, we write off inventories that are considered obsolete based upon changes in customer demand, manufacturing process changes that result in existing inventory obsolescence, or new product introductions, which eliminate demand for existing products. Remaining inventory balances are adjusted to approximate the lower of our manufacturing cost or market value.
If future demand or market conditions are less favorable than our estimates, inventory write-downs may be required. We cannot assure investors that obsolete or excess inventories, which may result from unanticipated changes in the estimated total demand for our products and/or the estimated life cycles of the end products into which our products are designed, will not affect us beyond the inventory charges that we have already taken.
The types of sales contracts we use in the markets we serve subject us to unique risks in each of those markets.
We generally do not have long-term supply contracts with our customers, and we typically sell our products pursuant to purchase orders with short lead times, and even where we do have supply contracts, our customers are not obligated to purchase any minimum amount of our products. As a result, our customers could stop purchasing our products at any time, and we must fulfill orders in a timely manner to keep our customers.
Risks associated with the absence of long-term purchase commitments with our customers include the following:
|
•
|
our customers can stop purchasing our products at any time without penalty;
|
|
•
|
our customers may purchase products from our competitors; and
|
|
•
|
our customers are not required to make minimum purchases.
|
These risks are increased by the fact that our customers in this market are large sophisticated companies which have considerable purchasing power and control over their suppliers. If we are unable to fulfill these orders in a timely manner, it is likely that we will lose sales and customers.
Cancellations or rescheduling of customer orders could result in the delay or loss of anticipated sales without allowing us sufficient time to reduce, or delay the incurrence of, our corresponding inventory and operating expenses. In addition, changes in forecasts or the timing of orders expose us to the risks of inventory shortages or excess inventory.
21
Fixed-price development work inherently has more uncertainty than production contracts and therefore, entails more variability in estimates of the cost to complete the work. Many of these development programs have very complex designs. As technical or quality issues arise, we may experience schedule delays and adverse cost impacts, which could increase our estimated cost to perform the work, either of which could adversely affect our results of operations. Some fixed-price development contracts include initial production units in their scope of work. Successful performance of these contracts depends on our ability to meet production specifications and delivery rates. If we are unable to perform and deliver to contract requirements, our contract price could be reduced through the incorporation of liquidated damages, termination of the contract for default, or other financially significant consequences. Management uses its best judgment to estimate the cost to perform the work and the price we will eventually be paid on fixed-price development programs. While we believe the cost and price estimates incorporated in the financial statements are appropriate, future events could result in either favorable or unfavorable adjustments to those estimates.
We have significant international sales, which expose us to additional risks and uncertainties.
For the fiscal years ended
September 30, 2015
,
2014
and
2013
, sales to customers located outside the U.S. accounted for approximately
32%
,
33%
and
26%
, respectively, of our annual consolidated revenue, with revenue assigned to geographic regions based on our customers' billing address. Sales to customers in Asia represent the majority of our international sales. We believe that international sales will continue to account for a significant percentage of our revenue as we seek international expansion opportunities. Because of this, the following international commercial risks may adversely affect our revenue:
|
-
|
political and economic instability or changes in U.S. government policy with respect to these foreign countries may inhibit export of our products and limit potential customers' access to U.S. dollars in a country or region in which those potential customers are located;
|
|
-
|
we may experience difficulties in enforcing our legal contracts or the collecting of foreign accounts receivable in a timely manner and we may be forced to write off these receivables;
|
|
-
|
tariffs and other barriers may make our products less cost competitive;
|
|
-
|
the laws of certain foreign countries may not adequately protect our trade secrets and intellectual property or may be burdensome to comply with;
|
|
-
|
potentially adverse tax consequences to our customers may damage our cost competitiveness;
|
|
-
|
customs, import/export, and other regulations of the countries in which we do business may adversely affect our business;
|
|
-
|
currency fluctuations may make our products less cost competitive, affecting overseas demand for our products or otherwise adversely affecting our business; and
|
|
-
|
language and other cultural barriers may require us to expend additional resources competing in foreign markets or hinder our ability to effectively compete.
|
In addition, we may be exposed to additional legal risks under the laws of both the countries in which we operate and in the
United States, including the Foreign Corrupt Practices Act.
We have substantial operations in China, which exposes us to risks inherent in doing business in China.
EMCORE Hong Kong, Ltd., a wholly owned subsidiary of EMCORE, has a manufacturing facility in Langfang, China. Our Chinese subsidiary, Langfang EMCORE Optoelectronics Co. Ltd., is located approximately 20 miles southeast of Beijing and currently occupies a space of 52,000 square feet with a Class-10,000 clean room for optoelectronic device packaging. Another 36,000 square feet is available for future expansion. We have transferred the manufacturing of cost sensitive optoelectronic device packaging and testing to this facility. This facility, along with a strategic alignment with our existing contract-manufacturing partners, should enable us to improve our cost structure and gross margins across product lines. We expect to develop and provide improved service to our global customers by having a local presence in Asia.
22
Our China-based activities are subject to greater political, legal, and economic risks than those faced by our other operations. In particular, the political, legal, and economic climate in China (both at the national and regional levels) is extremely volatile and unpredictable. Our ability to operate in China may be adversely affected by changes in Chinese laws and regulations, such as those relating to taxation, import and export tariffs, environmental regulations, land use rights, intellectual property, and other matters, which laws and regulations remain highly underdeveloped and subject to change for political or other reasons, with little or no prior notice. Moreover, the enforceability of applicable existing Chinese laws and regulations is uncertain. In addition, we may not obtain the requisite legal permits to continue to operate in China and costs or operational limitations may be imposed in connection with obtaining and complying with such permits. Our business could be adversely harmed by any changes in the political, legal, or economic climate in China or the inability to enforce applicable Chinese laws and regulations.
As a result of a government order to ration power for industrial use, operations in our China facility may be subject to possible interruptions or shutdowns, adversely affecting our ability to complete manufacturing commitments on a timely basis. If we are required to make significant investments in generating capacity to sustain uninterrupted operations at our facility, we may not realize the reductions in costs anticipated from our expansion in China.
We intend to export the majority of the products manufactured at our facilities in China. Accordingly, upon application to and approval by the relevant governmental authorities, we will not be subject to certain Chinese taxes and are exempt from customs duty assessment on imported components or materials when the finished products are exported from China. We are, however, required to pay income taxes in China, subject to certain tax relief. We may become subject to other forms of taxation and duty assessments in China or may be required to pay for export license fees in the future. In the event that we become subject to any increased taxes or new forms of taxation imposed by authorities in China, our results of operations and cash flows could be adversely affected.
Protecting our trade secrets and obtaining patent protection is critical to our ability to effectively compete.
Our success and competitive position depends on protecting our trade secrets and other intellectual property. Our strategy is to rely on trade secrets and patents to protect our manufacturing and sales processes and products. Effective trade secret and patent protection may be unavailable or limited in certain foreign jurisdictions. In addition, in certain circumstances, our intellectual property rights associated with government contracts may be limited. Also, reliance on trade secrets is only an effective business practice if trade secrets remain undisclosed and a proprietary product or process is not reverse engineered or independently developed. We take measures to protect our trade secrets, including executing non-disclosure agreements with our employees, consultants, customers, suppliers, and joint venture partners. If parties breach these agreements, the measures we take are not properly implemented, or if a competitor is able to reproduce or otherwise capitalize on our technology despite the safeguards we have in place, it may be difficult, expensive, or impossible for us to obtain necessary legal protection. Disclosure of our trade secrets or reverse engineering of our proprietary products, processes, or devices could adversely affect our business, financial condition, results of operations, and cash flows.
Our failure to obtain or maintain the right to use certain intellectual property may materially adversely affect our business, financial condition, results of operations, and cash flows.
Our industries are characterized by frequent litigation regarding patent and other intellectual property rights. From time to time we have received, and may receive in the future, notice of claims of infringement of other parties' proprietary rights and licensing offers to commercialize third party patent rights. There can be no assurance that:
|
-
|
infringement claims (or claims for indemnification resulting from infringement claims) will not be asserted against us or that such claims will not be successful;
|
|
-
|
future assertions will not result in an injunction against the sale of infringing products, which could adversely affect our business, results of operations, and cash flows;
|
|
-
|
any patent owned or licensed by us will not be invalidated, circumvented, or challenged; or
|
|
-
|
we will not be required to obtain licenses, the expense of which may adversely affect our results of operations, and cash flows.
|
23
In addition, effective copyright and trade secret protection may be unavailable or limited in certain foreign jurisdictions. Litigation, which could result in substantial cost and diversion of our resources, may be necessary to defend our rights or defend us against claimed infringement of the rights of others. In certain circumstances, our intellectual property rights associated with government contracts may be limited.
Protection of the intellectual property owned or licensed to us may require us to initiate litigation, which can be an extremely expensive protracted procedure with an uncertain outcome. The availability of financial resources may limit our ability to commence or defend such litigation.
If we fail to protect, or incur significant costs in defending, our intellectual property and other proprietary rights, our business and results of operations could be materially harmed.
Our success depends to a significant degree on our ability to protect our intellectual property and other proprietary rights. We rely on a combination of patent, trademark, trade secret and unfair competition laws, as well as license agreements and other contractual provisions, to establish and protect our intellectual property and other proprietary rights. We have applied for patent registrations in the United States and selected international jurisdictions, most of which have been issued. We cannot guarantee that our pending applications will be approved by the applicable governmental authorities. Moreover, our existing and future patents and trademarks may not be sufficiently broad to protect our proprietary rights or may be held invalid or unenforceable in court. Failure to obtain patents registrations or a successful challenge to our registrations in the United States or other foreign countries may limit our ability to protect the intellectual property rights that these applications and registrations are intended to cover.
We also attempt to protect our intellectual property, including our trade secrets and know-how, through the use of trade secret and other intellectual property laws, and contractual provisions. We enter into confidentiality and invention assignment agreements with our employees and independent consultants. We also use non-disclosure agreements with other third parties who may have access to our proprietary technologies and information. Such measures, however, provide only limited protection, and there can be no assurance that our confidentiality and non-disclosure agreements will not be breached, especially after our employees or those of our third-party contract manufacturers end their employment or engagement, and that our trade secrets will not otherwise become known by competitors or that we will have adequate remedies in the event of unauthorized use or disclosure of proprietary information. Unauthorized third parties may try to copy or reverse engineer our products or portions of our products, otherwise obtain and use our intellectual property, or may independently develop similar or equivalent trade secrets or know-how. If we fail to protect our intellectual property and other proprietary rights, or if such intellectual property and proprietary rights are infringed or misappropriated, our business, results of operations or financial condition could be materially harmed.
Policing unauthorized use of our technology is difficult, and we cannot be certain that the steps we have taken will prevent the misappropriation, unauthorized use, or other infringement of our intellectual property rights. Further, we may not be able to effectively protect our intellectual property rights from misappropriation or other infringement in foreign countries where we have not applied for patent protections, and where effective patent, trademark, trade secret, and other intellectual property laws may be unavailable, or may not protect our proprietary rights as fully as U.S. law.
In the future, we may need to take legal actions to prevent third parties from infringing upon or misappropriating our intellectual property or from otherwise gaining access to our technology. Protecting and enforcing our intellectual property rights and determining their validity and scope could result in significant litigation costs and require significant time and attention from our technical and management personnel, which could significantly harm our business. In addition, we may not prevail in such proceedings. An adverse outcome of such proceedings may reduce our competitive advantage or otherwise harm our financial condition and our business.
We may be obligated to indemnify our customers and vendors for claims that our intellectual property infringes the rights of others, which may result in substantial expenses to us.
We may be required to indemnify our customers or vendors for intellectual property claims made against them for products incorporating our technology. As such, claims against our customers and vendors may require us to incur substantial expenses, such as legal expenses, damages for past infringement or royalties for future use. Future indemnity claims could adversely affect our business relationships and result in substantial costs to us.
24
We face certain litigation risks that could harm our business.
We are and may become subject to various legal proceedings and claims that arise in or outside the ordinary course of business. The results of complex legal proceedings are difficult to predict. Moreover, many of the complaints filed against us do not specify the amount of damages that plaintiffs seek, and we therefore are unable to estimate the possible range of damages that might be incurred should these lawsuits be resolved against us. While we are unable to estimate the potential damages arising from such lawsuits, certain of them assert types of claims that, if resolved against us, could give rise to substantial damages. Thus, an unfavorable outcome or settlement of one or more of these lawsuits could have a material adverse effect on our financial condition, liquidity, and results of operations. Even if these lawsuits are not resolved against us, the uncertainty and expense associated with unresolved lawsuits could seriously harm our business, financial condition, and reputation. Litigation is costly, time-consuming and disruptive to normal business operations. The costs of defending these lawsuits, particularly the securities class actions and stockholder derivative actions, have been significant, will continue to be costly, and may not be covered by our insurance policies. The defense of these lawsuits could also result in continued diversion of our management's time and attention away from business operations, which could harm our business. For additional discussion regarding litigation in which we are involved, see
Note 14 - Commitments and Contingencies
in the notes to our consolidated financial statements.
The costs of compliance with state, federal and international legal and regulatory requirements, such as environmental, labor, trade and tax regulations, and customers' standards of corporate citizenship could cause an increase in our operating costs.
We are subject to environmental and health and safety laws and regulations and must obtain certain permits and licenses relating to the use of hazardous materials. Our production activities involve the use of certain hazardous raw materials, including, but not limited to, ammonia, gallium, phosphine, and arsine. If our control systems are unsuccessful in preventing a release of these materials into the environment or other adverse environmental conditions or human exposure occurs, we could experience interruptions in our operations and incur substantial remediation and other costs or liabilities. In addition, certain foreign laws and regulations place restrictions on the concentration of certain hazardous materials, including, but not limited to, lead, mercury, and cadmium, in our products. Failure to comply with such laws and regulations could subject us to future liabilities or result in the limitation or suspension of the sale or production of our products. These regulations include the European Union's (EU) Restrictions on Hazardous Substances and Directive on Waste Electrical and Electronic Equipment. Failure to comply with environmental and health and safety laws and regulations may limit our ability to export products to the EU and could adversely affect our business, financial condition, results of operations, and cash flows. In addition, the Department of Homeland Security has commenced a program to evaluate the security of certain chemicals which may be of interest to terrorists, including chemicals utilized by us. This evaluation may lead to regulations or restrictions affecting our ability to utilize these chemicals or the costs of doing so.
In connection with our compliance with such environmental laws and regulations, as well as our compliance with industry environmental initiatives, the standards of business conduct required by some of our customers, and our commitment to sound corporate citizenship in all aspects of our business, we could incur substantial compliance and operating costs and be subject to disruptions to our operations. In addition, in the last few years, there has been increased media scrutiny and associated reports focusing on a potential link between working in semiconductor manufacturing clean room environments and certain illnesses, primarily different types of cancers. Regulatory agencies and industry associations have begun to study the issue to see if any actual correlation exists
.
Because we utilize clean rooms, we may become subject to liability claims. These reports may also affect our ability to recruit and retain employees. If we were found to be in violation of environmental and safety regulations laws or noncompliance with industry initiatives or standards of conduct, we could be subject to government fines or liabilities owed to our customers, which could have a material adverse effect on our business, financial condition, results of operations, and cash flows.
In addition, climate change is a significant topic of discussion and potential regulatory activity and has generated and may continue to generate federal or other regulatory responses in the near future. If we or our component suppliers fail to timely comply with applicable legislation, our customers may refuse to purchase our products or we may face increased operating costs as a result of taxes, fines or penalties, which would have a materially adverse effect on our business, financial condition and operating results.
25
In connection with our compliance with such environmental laws and regulations, as well as our compliance with industry environmental initiatives, the standards of business conduct required by some of our customers, and our commitment to sound corporate citizenship in all aspects of our business, we could incur substantial compliance and operating costs and be subject to disruptions to our operations and logistics. In addition, if we were found to be in violation of these laws or noncompliant with these initiatives or standards of conduct, we could be subject to governmental fines, liability to our customers and damage to our reputation and corporate brand which could cause our financial condition or operating results to suffer.
We are subject to anti-corruption laws in the jurisdictions in which we operate, including the U.S. Foreign Corrupt Practices Act (“FCPA”). Our failure to comply with these laws could result in penalties which could harm our reputation and have a material adverse effect on our business, results of operations and financial condition.
We are subject to the FCPA, which generally prohibits companies and their intermediaries from making improper payments to foreign officials for the purpose of obtaining or keeping business and/or other benefits, along with various other anticorruption laws. Although we have implemented policies and procedures designed to ensure that we, our employees and other intermediaries comply with the FCPA and other anticorruption laws to which we are subject, there is no assurance that such policies or procedures will work effectively all of the time or protect us against liability under the FCPA or other laws for actions taken by our employees and other intermediaries with respect to our business or any businesses that we may acquire.
We have manufacturing operations in China and other jurisdictions, many of which pose elevated risks of anti-corruption violations, and we export our products for sale internationally. This puts us in frequent contact with persons who may be considered “foreign officials” under the FCPA, resulting in an elevated risk of potential FCPA violations. If we are not in compliance with the FCPA and other laws governing the conduct of business with government entities (including local laws), we may be subject to criminal and civil penalties and other remedial measures, which could have an adverse impact on our business, financial condition, results of operations and liquidity. Any investigation of any potential violations of the FCPA or other anticorruption laws by U.S. or foreign authorities could harm our reputation and have an adverse impact on our business, financial condition and results of operations.
A failure to attract and retain managerial, technical, and other key personnel could reduce our revenue and our operational effectiveness.
Our future success depends, in part, on our ability to attract and retain certain key personnel, including scientific, operational, financial, and managerial personnel. In addition, our technical personnel represent a significant asset and serve as the source of our technological and product innovations. The competition for attracting and retaining key employees (especially scientists, technical personnel, and senior managers and executives) is intense. Because of this competition for skilled employees, we may be unable to retain our existing personnel or attract additional qualified employees in the future to keep up with our business demands and changes, and our business, financial condition, results of operations, and cash flows could be materially adversely affected. The risks involved in recruiting and retaining these key personnel may be increased by our lack of profitability, the volatility of our stock price, and the perceived effect of previously implemented reductions in force and other cost reduction efforts.
We are subject to risks associated with the availability and coverage of insurance.
For certain risks, we do not maintain insurance coverage because of cost or availability. Because we retain some portion of our insurable risks, and in some cases self-insure completely, unforeseen or catastrophic losses in excess of insured limits may have a material adverse effect on our business, financial position, results of operations, and cash flows.
Our business and operations would be adversely impacted in the event of a failure or security breach of our information technology infrastructure.
We rely upon the capacity, reliability, and security of our information technology hardware and software infrastructure and our ability to expand and update this infrastructure in response to our changing needs. We are constantly updating our information technology infrastructure. Any failure to manage, expand, and update our information technology infrastructure or any failure in the operation of this infrastructure could harm our business.
26
Despite our implementation of security measures, our systems are vulnerable to damages from computer viruses, natural disasters, unauthorized access, and other similar disruptions. Our business is also subject to break-ins, sabotage, and intentional acts of vandalism by third parties as well as employees. Any system failure, accident, or security breach could result in disruptions to our operations. To the extent that any disruption or security breach results in a loss or damage to our data, or inappropriate disclosure of confidential information, it could harm our business. In addition, we may be required to incur significant costs to protect against damage caused by these disruptions or security breaches in the future.
Certain provisions of New Jersey law, our charter and our agreements may make a takeover of our Company difficult even if such takeover could be beneficial to some of our shareholders.
New Jersey law and our certificate of incorporation, as amended, contain certain provisions that could delay or prevent a takeover attempt that our shareholders may consider to be in their best interests. Our Board of Directors is divided into three classes. Directors are elected to serve staggered three-year terms and are not subject to removal except for cause by the vote of the holders of at least 80% of our capital stock. In addition, approval by the holders of 80% of our voting stock is required for certain business combinations unless these transactions meet certain fair price criteria and procedural requirements or are approved by two-thirds of our continuing directors. We may in the future adopt other measures that may have the effect of delaying or discouraging an unsolicited takeover, even if the takeover were at a premium price or favored by a majority of unaffiliated shareholders. Certain of these measures may be adopted without any further vote or action by our shareholders and this could depress the price of our common stock.
On September 17, 2014, our Board of Directors adopted the Rights Plan to help preserve the value of our Tax Benefits by reducing the risk of limitation of our Tax Benefits. The Rights Plan is intended to reduce the likelihood that we will experience an ownership change by discouraging any person or group from becoming a “5% shareholder” or increasing their ownership of our common stock if they are already a “5% shareholder.” The Rights Plan could make it more difficult for a third party to acquire, or could discourage a third party from acquiring, us or a large block of our common stock. A third party that acquires 5% or more of our common stock could suffer substantial dilution of its ownership interest under the terms of the Rights Plan through the issuance of common stock or common stock equivalents to all stockholders other than such acquiring person.
Natural disasters or other catastrophic events could have a material adverse effect on our business
.
Natural disasters, such as hurricanes, earthquakes, fires, and floods, could materially adversely affect our operations and financial performance. Such events could result in physical damage to one or more of our facilities, the temporary closure of one or more of our facilities or those of our suppliers, a temporary lack of an adequate work force in a market, a temporary or long-term disruption in the supply of products from some local and overseas suppliers, a temporary disruption in the transport of goods from overseas, and delays in the delivery of goods. Public health issues, whether occurring in the United States or abroad, could disrupt our operations, disrupt the operations of suppliers or customers, or have an adverse impact on customer demand. As a result of any of these events, we may be required to suspend operations in some or all of our locations, which could have a material adverse effect on our business, financial condition, results of operations, and cash flows. These events could also reduce demand for our products or make it difficult or impossible to receive products from suppliers. Although we maintain business interruption insurance and other insurance intended to cover some or all of these risks, such insurance may be inadequate, whether because of coverage amount, policy limitations, the financial viability of the insurance companies issuing such policies, or other reasons.
We cannot predict the timing, amount or nature of any distributions to our shareholders.
We have never declared or paid any dividends on our common stock. In addition, our credit and security agreement, as amended, with Wells Fargo Bank, National Association, currently restricts distributions to our shareholders (other than distributions payable solely in our stock). As part of its strategic review, the Strategy and Alternatives Committee of our board of directors may consider, among other things, the use of a portion of our existing balances of cash and cash equivalents to provide liquidity to shareholders through one or more special dividends. Our board of directors is not currently able to predict the timing, amount or nature of, or the record dates for distributions, if any, to be made to our shareholders. In the event that we are unable to make a distribution to our shareholders or our board of directors determines not to make such a distribution, the success of an investment in our common stock will depend entirely upon any future appreciation in its value. There is no guarantee that our common stock will appreciate in value or even maintain the price at which stockholders have purchased their shares.
27
Our restructuring and cost reduction activities could result in management distraction, operational disruptions and other adverse effects on our business.
We are currently implementing, and may in the future implement, certain restructuring and cost reduction activities with respect to our broadband fiber optics business. The restructuring efforts could divert the attention of our management away from our operations, harm our reputation, reduce our revenue and/or increase our expenses. There can be no assurance that the restructuring activities will be successful, including allowing the business to achieve net income within the current fiscal year or any later date.
Litigation may substantially increase our costs and harm our business.
We are subject to lawsuits and will incur legal fees and other related costs. The expense of litigation may be significant. In addition, there can be no assurance that we will be successful in any lawsuit. Further, the amount of time that will be required to resolve any lawsuit is unpredictable and these actions may divert management’s attention from the day-to-day operations of our business, which could adversely affect our business, results of operations and cash flows. Litigation is subject to inherent uncertainties, and an adverse result in these matters that may arise from time to time could have a material adverse effect on our business, results of operations and financial condition.
***
The risks above are not the only risks we face. If any of the events described in our risk factors actually occur, or if additional risks and uncertainties not presently known to us or that we currently deem immaterial, materialize, then our business, financial condition, results of operations, and cash flows could be materially affected. Our risk factors include forward-looking statements and our actual results may differ substantially from those discussed in these forward-looking statements.
28
ITEM 1B
.
Unresolved Staff Comments
Not Applicable.
ITEM 2
.
Properties
The following chart contains certain information regarding each of our principal facilities.
|
Location
|
Function
|
Approximate
Square Footage
|
Term
(in calendar year)
|
|
Alhambra, California
|
Corporate Headquarters
Manufacturing and research and development facilities |
75,000
|
Several leases which expired in 2011; another lease which expires in 2017
(1) and (2)
|
|
Newark, California
|
Manufacturing and research and development facilities
|
30,000
|
Lease expires in 2016
(3)
|
|
Langfang, China
|
Manufacturing facility
|
52,000
|
Multiple leases, which expire in 2017
(1)
|
|
|
|
|
|
|
Ivyland, Pennsylvania
|
Manufacturing and research and development facility
|
9,000
|
Lease expires in 2016
(1)
|
Footnotes
|
(1)
|
Leases have the option to be renewed by us, subject to inflation and other adjustments.
|
|
(2)
|
Certain facility leases in Alhambra, California which have expired are being maintained on a month-to-month basis.
|
|
(3)
|
Newark, California lease expires in May 2016.
|
ITEM 3
. Legal Proceedings
See
Note 14- Commitments and Contingencies
in the notes to our consolidated financial statements for disclosures related to our legal proceedings, which disclosures are incorporated herein by reference.
ITEM 4
. Mine Safety Disclosures
Not Applicable.
29
ITEM 5
.
Market for Registrant's Common Equity, Related Stockholder Matters and Issuer Purchases of Equity
Securities
Our common stock is traded on the NASDAQ Global Market and is quoted under the symbol "EMKR". The reported closing sale price of our common stock on
December 7, 2015
was
$7.90
per share. As of
December 7, 2015
, we had approximately
99
shareholders of record. Many of our shares of common stock are held by brokers and other institutions on behalf of shareholders, and we are unable to estimate the number of these shareholders.
Price Range of Common Stock
The price ranges presented below represents the highest and lowest sales prices for our common stock on the NASDAQ Global Market during each quarter over the two most recent fiscal years.
|
High and Low Sales Price Ranges of EMCORE Corporation's Common Stock
|
First Quarter
|
Second Quarter
|
Third Quarter
|
Fourth Quarter
|
||||
|
Fiscal 2015
|
$5.00 - $5.80
|
$5.10 - $5.60
|
$5.37 - $6.59
|
$5.71 - $7.49
|
||||
|
Fiscal 2014
|
$4.33 - $5.62
|
$4.61 - $5.42
|
$3.50 - $5.30
|
$3.86 - $6.03
|
||||
Dividend Policy
We have never declared or paid dividends on our common stock since our formation. Under the terms of our credit facility with Wells Fargo Bank, National Association, we are restricted from paying dividends if any amounts are outstanding under our credit facility. As part of its strategic review, the Strategy and Alternatives Committee of our board of directors may from time to time consider, among other things, the use of a portion of our existing balances of cash and cash equivalents to provide liquidity to our shareholders through one or more special dividends. The payment of dividends, if any, in the future is at the discretion of the Board of Directors.
Unregistered Sales of Equity Securities and Use of Proceeds
Not Applicable.
30
Performance Graph
The following table and graph compares the yearly percentage change in the cumulative total shareholders' return on our common stock for the five-year period from September 30, 2010 through September 30, 2015 with the cumulative total return on the NASDAQ Composite Index and the NASDAQ Telecommunications Stock Index. The comparison assumes $100 was invested at the market close on September 30, 2010 in our common stock, the NASDAQ Composite Index and the NASDAQ Telecommunications Stock Index and that any dividends were reinvested. The stock price performance on the following graph is not necessarily indicative of future stock price performance.
The following stock performance graph does not constitute soliciting material, and should not be deemed filed or incorporated by reference into any of our filings under the Securities Act of 1933 or the Securities Exchange Act of 1934, except to the extent we specifically incorporate this stock performance graph by reference therein.
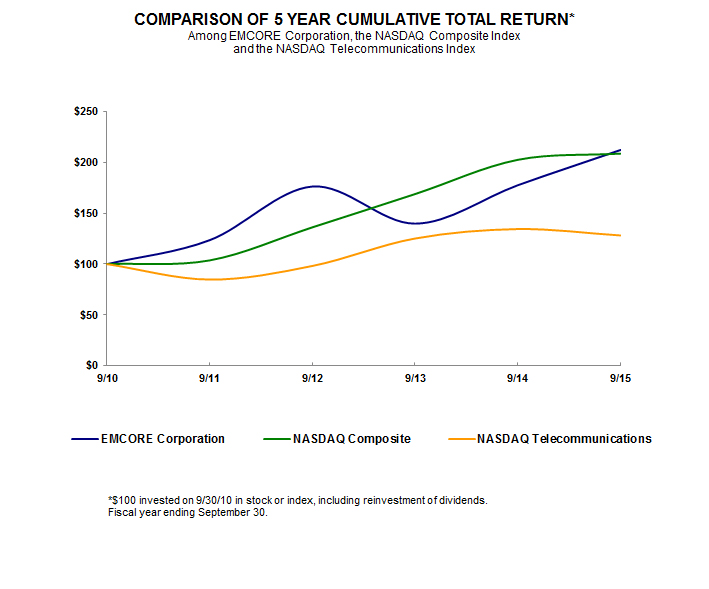
|
Data Table
|
As of September 30,
|
|||||||||||
|
2010
|
2011
|
2012
|
2013
|
2014
|
2015
|
|||||||
|
EMCORE Corporation
|
$100.00
|
$123.60
|
$176.34
|
$139.83
|
$177.59
|
$212.23
|
||||||
|
NASDAQ Composite
|
$100.00
|
$103.65
|
$136.22
|
$168.91
|
$202.57
|
$208.69
|
||||||
|
NASDAQ Telecommunications
|
$100.00
|
$84.78
|
$98.23
|
$125.19
|
$134.45
|
$128.23
|
||||||
31
ITEM 6
. Selected Financial Data
In the tables below, we have provided you with consolidated financial data. We derived the statement of operations data for the fiscal years ended
September 30, 2015
,
2014
, and
2013
and the balance sheet data as of
September 30, 2015
and
2014
from our audited consolidated financial statements included in
Financial Statements and Supplementary Data
under
Item 8
within this Annual Report, after giving effect to the discontinued operations of the Photovoltaics and Digital Products Businesses.
We derived the statement of operations data for the years ended September 30,
2012
and
2011
and the selected balance sheet data as of
September 30, 2013
,
2012
, and
2011
from audited consolidated financial statements that are not included in this Annual Report after giving effect to the discontinued operations of the Photovoltaics and Digital Products Businesses. You should read this financial data together with our
Management's Discussion and Analysis of Financial Condition and Results of Operations
under
Item 7
and
Financial Statements and Supplementary Data
under
Item 8
within this Annual Report. Our historic results are not necessarily indicative of the results that may be expected in the future.
Selected Financial Data
|
Statements of Operations Data
(in thousands, except loss per share)
|
For the Fiscal Years Ended September 30,
|
||||||||||||||||||||
|
|
2015
|
2014
|
2013
|
2012
|
2011
|
||||||||||||||||
|
Revenue
|
$
|
81,685
|
|
$
|
55,514
|
|
$
|
60,971
|
|
$
|
61,592
|
|
$
|
75,783
|
|
||||||
|
Gross profit
|
28,691
|
|
12,114
|
|
12,266
|
|
7,924
|
|
23,716
|
|
|||||||||||
|
Operating loss
|
(4,522
|
)
|
(20,331
|
)
|
(8,945
|
)
|
(20,437
|
)
|
(5,568
|
)
|
|||||||||||
|
(Loss) income from continuing operations
|
(2,272
|
)
|
4,082
|
|
(5,554
|
)
|
(21,202
|
)
|
(6,153
|
)
|
|||||||||||
|
Income (loss) from discontinued operations
|
65,372
|
|
770
|
|
10,542
|
|
(17,969
|
)
|
(28,066
|
)
|
|||||||||||
|
Net income (loss)
|
63,100
|
|
4,852
|
|
4,988
|
|
(39,171
|
)
|
(34,219
|
)
|
|||||||||||
|
Net income (loss) per basic and diluted share
|
|||||||||||||||||||||
|
Continuing operations
|
$
|
(0.08
|
)
|
$
|
0.13
|
|
$
|
(0.21
|
)
|
$
|
(0.90
|
)
|
$
|
(0.28
|
)
|
||||||
|
Discontinued operations
|
2.18
|
|
0.03
|
|
0.40
|
|
(0.76
|
)
|
(1.26
|
)
|
|||||||||||
|
Net income (loss) per basic and diluted share
|
$
|
2.10
|
|
$
|
0.16
|
|
$
|
0.19
|
|
$
|
(1.66
|
)
|
$
|
(1.54
|
)
|
||||||
|
Balance Sheet Data
(in thousands)
|
As of September 30,
|
||||||||||||||||||||
|
|
2015
|
2014
|
2013
|
2012
|
2011
|
||||||||||||||||
|
Cash, cash equivalents and restricted cash
|
$
|
112,260
|
|
$
|
22,169
|
|
$
|
16,919
|
|
$
|
9,129
|
|
$
|
16,142
|
|
||||||
|
Working capital
|
127,994
|
|
30,914
|
|
37,196
|
|
3,971
|
|
24,293
|
|
|||||||||||
|
Total assets
|
160,907
|
|
191,342
|
|
173,714
|
|
169,866
|
|
170,298
|
|
|||||||||||
|
Long-term liabilities
|
1,774
|
|
6,018
|
|
9,434
|
|
9,408
|
|
4,804
|
|
|||||||||||
|
Shareholders' equity
|
135,442
|
|
112,347
|
|
101,179
|
|
69,023
|
|
98,436
|
|
|||||||||||
Working capital, calculated as current assets minus current liabilities, is a financial metric we use that represents available operating liquidity.
32
Significant Transactions
Significant transactions that affect the comparability of our operating results and financial condition include:
Fiscal 2015
Continuing Operations
:
|
•
|
Common Stock Repurchase: In
April 2015
, EMCORE's Board of Directors authorized the Company to repurchase
$45.0 million
of shares of its common stock. On
May 15, 2015
, we announced the commencement of a modified "Dutch auction" tender offer to purchase for cash shares of our common stock (the "Tender Offer"). On
June 15, 2015
, we completed the Tender Offer and purchased
6.9 million
shares of our common stock at a purchase price of
$6.55
per share, for an aggregate cost of
$45.0 million
excluding fees and expenses. Repurchased common stock was recorded to treasury stock. The Company incurred costs of
$0.7 million
in connection with the Tender Offer, which were recorded to treasury stock.
|
|
•
|
Asset Retirement Obligations
:
As a result of the revision in the estimated amount and timing of cash flows for asset retirement obligations during the fiscal year ended
September 30, 2015
, the Company reduced asset retirement obligations liability by $
2.9 million
with an offsetting reduction to property, plant, and equipment, net of
$2.1 million
, and recorded a gain from change in estimate on ARO obligation of $
0.8 million
. The Company first reduced the net leasehold improvement asset to the extent of the carrying amount of the related asset initially recorded when the asset retirement obligations were established. The amount of the remaining reduction to the asset retirement obligations was recorded as a reduction to operating expenses.
See Note 14 - Commitments and Contingencies
in the notes to the consolidated financial statements for additional information.
|
Discontinued Operations
:
|
•
|
Photovoltaic and Digital Products Asset Sales: On
December 10, 2014
, we sold our Photovoltaics Business to SolAero for
$150.0 million
in cash. On
January 2, 2015
, we sold our Digital Products Business to NeoPhotonics for $17.0 million in cash and notes receivable that were paid in April 2015. These Asset Sales are reported as discontinued operations, which require retrospective restatement of prior periods to classify the results of operations for the businesses sold as discontinued operations. We have also reclassified the assets and liabilities that were sold within the descriptions "assets of discontinued operations" and "liabilities of discontinued operations" on the consolidated balance sheet as of
September 30, 2014
. No assets or liabilities that were sold from either the Photovoltaic Business or Digital Products Business remain on the consolidated balance sheet as of
September 30, 2015
. See
Note 4 - Discontinued Operations
in the notes to the consolidated financial statements for additional information.
|
Fiscal 2014
Continuing Operations
:
|
•
|
We recorded a net deferred tax valuation allowance release of
$24.1 million
as an income tax benefit during fiscal year
2014
. All of the
$24.1 million
in deferred tax assets were used in fiscal year
2015
when income tax expense was recorded as a result of the sale of the Photovoltaics Business, thus no cash was received for the deferred tax assets.
|
33
Fiscal 2013
Continuing Operations
:
|
•
|
Stock Sales: During August 2012, we filed a shelf registration statement on Form S-3 with the SEC pursuant to which we could, from time to time, sell up to an aggregate of
$50 million
of our common or preferred stock, warrants or debt securities. On August 23, 2012, the registration statement was declared effective by the SEC, which allowed us to access the capital markets for the three year period following this effective date as long as we continued to meet the eligibility requirements for the use of Form S-3. On October 3, 2012 we sold
1,832,410
shares of common stock for net proceeds of
$9.5 million
. In addition, on September 18, 2013, we sold
2,875,000
shares of common stock for net proceeds of
$11.7 million
.
See Note 15 - Equity
for additional disclosures.
|
|
•
|
Impact from Thailand Flood: During the fiscal year ended
September 30, 2013
, we recorded flood-related insurance proceeds of
$7.8 million
in the form of forgiveness of
$0.2 million
of outstanding capital lease obligations,
$1.0 million
of outstanding payables and
$6.6 million
in the form of a receivable, which was paid in cash. No additional flood-related insurance proceeds associated with this event are anticipated. See
Note 11 - Impact from Thailand Flood
for additional disclosures.
|
Discontinued Operations
:
|
•
|
Impact from Thailand Flood: During the fiscal year ended
September 30, 2013
, we recorded flood-related insurance proceeds of
$11.2 million
in the form of forgiveness of
$5.4 million
of outstanding capital lease obligations,
$4.2 million
of outstanding payables and
$1.6 million
in the form of a receivable, which was paid in cash. In addition, we capitalized
$1.2 million
of new manufacturing lines and recorded a corresponding amount to capital lease obligation.
|
|
•
|
Joint Venture: In March 2013, we sold certain solar assets and our ownership interest in Emcore Solar New Mexico to Suncore Photovoltaic Technology Co., Ltd. ("Suncore") for
$1.5 million
. In June 2013, we entered into an agreement to transfer our
40%
registered ownership interest in Suncore to San'an Optoelectronics Co., Ltd. ("San'an") for a purchase price of
$4.8 million
. The carrying value of our registered ownership interest in Suncore was $0 as of June 30, 2013. Upon completion of the share transfer, the Company recognized
$3.3 million
of deferred revenue from Suncore as well as the resulting gain of
$4.8 million
on our registered ownership interest which was recorded within discontinued operations.
|
Fiscal 2012
Continuing Operations
:
|
•
|
Impact from Thailand Flood: In October 2011, we announced that flood waters had severely impacted the inventory and production operations of our primary contract manufacturer in Thailand. The impacted areas included certain product lines for the Digital Products Business and CATV business.
|
During the fiscal year ended September 30, 2012, we recorded flood-related losses associated with damaged inventory and equipment of approximately
$3.2 million
. We capitalized the cost of our new manufacturing lines of approximately
$0.2 million
and recorded an equipment capital lease obligation of
$0.2 million
, net of equipment deposits. In addition, we recorded
$1.0 million
to cost of revenue for losses related to damaged inventory on order related to manufacturing product lines that were destroyed and received insurance related proceeds payment of
$4.2 million
. See
Note 11 - Impact from Thailand Flood
for additional disclosures.
Discontinued Operations
:
|
•
|
Impact from Thailand Flood: During the fiscal year ended September 30, 2012, we recorded flood-related losses associated with damaged inventory and equipment of approximately
$2.3 million
. We capitalized the cost of our new manufacturing lines of approximately
$5.0 million
and recorded an equipment capital lease obligation of
$4.2 million
, net of equipment deposits. In addition, we recorded
$0.6 million
to cost of revenue for losses related to damaged inventory on order related to manufacturing product lines that were destroyed and received insurance related proceeds payment of
$4.8 million
.
|
34
|
•
|
Sale of Fiber Optics-related Assets: On May 7, 2012, we completed the sale of certain assets associated with our Fiber Optics business to a subsidiary of Sumitomo Electric Industries, LTD and recorded a gain of approximately $2.8 million. We initially deferred approximately $4.9 million of the gain on sale until the indemnification obligation and purchase price adjustment contingencies are resolved. See
|
|
•
|
Impairment Charge: As of June 30, 2012, we performed an evaluation of an asset group within our Photovoltaics Business for impairment of long-lived assets. The impairment test was triggered by a determination that it was more likely than not those assets would be sold or otherwise disposed of before the end of their previously estimated useful lives. As a result of the evaluation, we determined that impairment existed and a charge of $1.4 million was recorded to write down the long-lived assets to an estimated fair value within discontinued operations. Of the total impairment charge, $1.1 million related to equipment and $0.3 million related to intangible assets.
|
|
•
|
Joint Venture: During the fiscal year ended September 30, 2012, Suncore increased its registered capital by recording a deemed capital distribution of $37.0 million which was distributed and reinvested in proportion to each entity's registered capital, of which San'an was allocated $22.2 million and EMCORE was allocated $14.8 million. During this same period, Suncore also recorded a cash dividend of approximately $4.1 million in proportion to each entity's registered capital of which San'an received $2.5 million and EMCORE received $1.6 million. We recorded the cash dividend as a reduction of our investment in Suncore. We incurred foreign income tax of approximately $1.6 million associated with these capital distributions. EMCORE's cash dividend was equal to the foreign income tax expense incurred on these capital distributions. During fiscal 2012, we held a 40% registered ownership in Suncore and we recorded a $1.2 million loss from this equity method investment within discontinued operations. As of September 30, 2012, our investment balance in was Suncore was zero and we stopped recording our proportionate share of Suncore's loss since we had no obligation or intent to fund the deficit balance.
|
|
•
|
Litigation Settlement: In May 2012, we reached a confidential settlement regarding certain outstanding litigation in exchange for a release of related claims. The settlement resulted in a charge of $1.0 million in our statement of operations and comprehensive loss.
|
Fiscal 2011
Continuing Operations
:
|
•
|
Asset Retirement Obligations: We have known conditional asset retirement conditions, such as certain asset decommissioning and restoration of rented facilities to be performed in the future. During the three months ended September 30, 2011, we completed a review of our asset retirement and environmental obligations and we recorded an asset retirement obligation with an offset to fixed assets totaling $3.8 million. See
Note 14 - Commitments and Contingencies
in the notes to the consolidated financial statements for additional information related to our asset retirement obligations.
|
|
•
|
Litigation Settlements: During the three months ended March 31, 2011, we received a cash payment of approximately $2.6 million, net of legal fees, in satisfaction of a judgment for damages awarded. See
Note 14 - Commitments and Contingencies
in the notes to the consolidated financial statements for additional information related to our litigation proceedings.
|
Discontinued Operations
:
|
•
|
Joint Venture: We entered into a joint venture agreement in fiscal 2010 with San'an for the purpose of engaging in the development,
manufacturing, and distribution of CPV receivers, modules, and systems for terrestrial solar power applications under a technology license from us. The joint venture, Suncore was established in January 2011. To date, we have contributed $12.0 million in cash to Suncore as a capital contribution and have received $8.5 million of consulting fees from an affiliate of San'an. We accounted for our 40% registered ownership investment in Suncore using the equity method of accounting and we have recorded the consulting fees as a reduction to our investment in Suncore. Included in discontinued operations during fiscal 2011 was a $1.8 million loss from this equity method investment.
|
35
|
•
|
Litigation expense: During the three months ended June 30, 2011, we accrued $1.5 million for litigation expense considered probable. See
Note 14 - Commitments and Contingencies
in the notes to the consolidated financial statements for additional information related to our litigation proceedings.
|
|
•
|
Impairment Charge: Included in discontinued operations during the three months ended September 30, 2011, was a non-cash impairment charge of approximately $8.0 million related to long-lived assets associated with our Digital Products Business.
|
|
•
|
Asset Retirement Obligations: We have known conditional asset retirement conditions, such as certain asset decommissioning and restoration of rented facilities to be performed in the future. During the three months ended September 30, 2011, we completed a review of our asset retirement and environmental obligations and we recorded an asset retirement obligation with an offset to fixed assets totaling $1.0 million. See
Note 14 - Commitments and Contingencies
in the notes to the consolidated financial statements for additional information related to our asset retirement obligations.
|
36
ITEM 7.
Management’s Discussion and Analysis of Financial Condition and Results of Operations
You should read the following discussion of our financial condition and results of operations in conjunction with the financial statements and the notes thereto included in
Financial Statements and Supplementary Data
under
Item 8
within this Annual Report. The following discussion contains forward-looking statements that reflect our plans, estimates, and beliefs. Our actual results could differ materially from those discussed in the forward-looking statements. Factors that could cause or contribute to these differences include those discussed below and elsewhere in this Annual Report, particularly in
Risk Factors
under
Item IA
.
Business Overview
EMCORE Corporation and its subsidiaries (referred to herein as the “Company”, “we”, “our”, or “EMCORE”) designs and manufactures Indium Phosphide (InP) optical chips, components, subsystems and systems for the broadband and specialty fiber optics market. EMCORE was the pioneer in linear fiber optic transmission technology, and today is a leader in optical components, as well as a provider of complete end-to-end solutions for high-speed communications network infrastructures, enabling systems and service providers to meet growing demand for bandwidth and connectivity. EMCORE’s advanced optical technologies are designed for cable television (CATV) and fiber-to-the-premise (FTTP) networks, telecommunications and data centers, satellite communications, aerospace and defense, wireless networks, and broadcast and professional audio/video systems. With its world-class InP semiconductor wafer fabrication facility, EMCORE has fully vertically-integrated manufacturing capability and also provides contract design, foundry and component packaging services.
Recent Developments
Sale of Photovoltaics and Digital Products Businesses
On
September 17, 2014
, EMCORE entered into an Asset Purchase Agreement (the “Photovoltaics Agreement”) with SolAero Technologies Corporation ("SolAero") (formerly known as Photon Acquisition Corporation) pursuant to which SolAero agreed to acquire substantially all of the assets, and assume substantially all of the liabilities, primarily related to or used in connection with the Company's photovoltaics business, including EMCORE's subsidiaries EMCORE Solar Power, Inc. and EMCORE IRB Company, LLC (collectively, the "Photovoltaics Business" and, the sale of the Photovoltaics Business, the "Photovoltaics Asset Sale") for
$150.0 million
in cash, prior to a
$0.1 million
working capital adjustment pursuant to the Photovoltaics Agreement finalized and paid by EMCORE during the fiscal year ended
September 30, 2015
. On
December 10, 2014
, EMCORE completed the Photovoltaics Asset Sale.
On
October 22, 2014
, EMCORE entered into an Asset Purchase Agreement (the "Digital Products Agreement") with NeoPhotonics Corporation, a Delaware corporation ("NeoPhotonics"), pursuant to which the Company agreed to sell certain assets, and transfer certain liabilities, of the Company's telecommunications business (collectively, the "Digital Products Business" and, the sale of the Digital Products Business, the "Digital Products Assets Sale") to NeoPhotonics for an aggregate purchase price of
$17.5 million
, subject to certain purchase price adjustments, consisting of
$1.5 million
in cash at closing and a promissory note in the principal amount of
$16.0 million
(the "Promissory Note").
On
January 2, 2015
, EMCORE and NeoPhotonics entered into Amendment No. 1 (the "APA Amendment") to the Digital Products Agreement. Among other things, the APA Amendment revised the nature and timing of the financial deliverable requirements of the Company to NeoPhotonics under the original Digital Products Agreement. The assets sold pursuant to the Digital Products Agreement included certain fixed assets, inventory, accounts receivable and intellectual property for the ITLA, micro-ITLA, T-TOSA and T-XFP product lines within the Company’s telecommunications business. On
January 2, 2015
, EMCORE completed the sale of the Digital Products Business. On
April 16, 2015
, EMCORE and NeoPhotonics entered into an agreement to adjust the purchase price resulting in an adjusted balance of the Promissory Note of
$15.5 million
. On
April 17, 2015
, NeoPhotonics paid in full the outstanding balance of the Promissory Note of
$15.5 million
, plus accrued interest of
$0.2 million
.
The Photovoltaics Asset Sale and Digital Products Asset Sale are reported as discontinued operations. Also see
Note 2 - Summary of Significant Accounting Policies
and
Note 4 - Discontinued Operations
in the notes to the consolidated financial statements for additional disclosures.
37
Common Stock Repurchase
In
April 2015
, EMCORE's Board of Directors authorized the Company to repurchase
$45.0 million
of shares of its common stock. On
May 15, 2015
, we announced the commencement of a modified "Dutch auction" tender offer to purchase for cash shares of our common stock (the "Tender Offer"). On
June 15, 2015
, we completed the Tender Offer and purchased
6.9 million
shares of our common stock at a purchase price of
$6.55
per share, for an aggregate cost of
$45.0 million
excluding fees and expenses. Repurchased common stock was recorded to treasury stock. The Company incurred costs of
$0.7 million
in connection with the Tender Offer, which were recorded to treasury stock.
Critical Accounting Policies
The preparation of consolidated financial statements in conformity with U.S. GAAP requires us to make estimates and assumptions that affect the reported amounts of assets and liabilities and disclosure of contingent assets and liabilities, as of the date of the financial statements, and the reported amounts of revenue and expenses during the reported period. The accounting estimates that require our most significant, difficult, and/or subjective judgments include:
|
•
|
the valuation of inventory, intangible assets, warrants and stock-based compensation;
|
|
•
|
the useful lives of assets and assessment of recovery of long-lived assets;
|
|
•
|
asset retirement obligations and contingencies including litigation and indemnification related;
|
|
•
|
the allowance for doubtful accounts and warranty accruals; and,
|
|
•
|
the valuation allowance for deferred tax assets.
|
We develop estimates based on historical experience and on various assumptions about the future that are believed to be reasonable based on the best information available to us. Our reported financial position or results of operations may be materially different under changed conditions or when using different estimates and assumptions, particularly with respect to significant accounting policies. In the event that estimates or assumptions prove to differ from actual results, adjustments are made in subsequent periods to reflect more current information. A listing and description of our critical accounting policies includes the following:
Prior Period Reclassifications
On
December 10, 2014
, we sold our Photovoltaics business to SolAero. On
January 2, 2015
, we sold our Digital Products Business to NeoPhotonics. The Photovoltaics Asset Sale and Digital Asset Sale are reported as discontinued operations, which require retrospective restatement of prior periods to classify the results of operations as discontinued operations. We have also reclassified the assets and liabilities that were sold to "assets of discontinued operations" and "liabilities of discontinued operations" within current and non-current assets and liabilities, respectively, on the consolidated balance sheet as of
September 30, 2014
. No Photovoltaics or Digital Products assets or liabilities that were sold remain on the consolidated balance sheet as of
September 30, 2015
. The financial results of the Photovoltaics Business and the Digital Products Business are presented as "discontinued operations" on the consolidated statements of operations and comprehensive income for the fiscal years ended
September 30, 2015
,
2014
and
2013
. See
Note 4 - Discontinued Operations
in our notes to the consolidated financial statements for additional information.
Reclassification of prior period amounts related to discontinued operations as a result of the sale of the Photovoltaics and Digital Products Businesses have been made to conform to the current period financial statement presentation. There were no other reclassifications expect for amounts related to discontinued operations.
Accounts Receivable
We regularly evaluate the collectability of our accounts receivable and maintain allowances for doubtful accounts for estimated losses resulting from the inability of our customers to meet their financial obligations to us. The allowance is based on the age of receivables and a specific identification of receivables considered at risk of collection. We classify charges associated with the allowance for doubtful accounts as sales, general, and administrative expense. If the financial condition of our customers were to deteriorate, impacting their ability to pay us, additional allowances may be required. See
Note 6 - Accounts Receivable
in the notes to the consolidated financial statements for additional information related to our receivables.
38
Inventory
Inventory is stated at the lower of cost or market, with cost being determined using the standard cost method that includes material, labor, and manufacturing overhead costs, which approximates weighted average cost. We write-down inventory once it has been determined that conditions exist that may not allow the inventory to be sold for its intended purpose or the inventory is determined to be excess or obsolete based on our forecasted future revenue. The charge related to inventory write-downs is recorded as a cost of revenue. The majority of the inventory write-downs are related to estimated allowances for inventory whose carrying value is in excess of net realizable value and on excess raw material components resulting from finished product obsolescence. In most cases where we sell previously written down inventory, it is typically sold as a component part of a finished product. The finished product is sold at market price at the time resulting in higher average gross margin on such revenue. We do not track the selling price of individual raw material components that have been previously written down or written off, since such raw material components usually are only a portion of the finished products and related sales price. We evaluate inventory levels at least quarterly against sales forecasts on a significant part-by-part basis, in addition to determining its overall inventory risk. We have incurred, and may in the future incur charges to write-down our inventory. See
Note 7 - Inventory
in the notes to the consolidated financial statements for additional information related to our inventory.
Valuation of Long-lived Assets
Long-lived assets consist primarily of property, plant, and equipment, net. Because most of our long-lived assets are subject to amortization, we review these assets for impairment in accordance with the provisions of Accounting Standards Codification ("ASC") 360,
Property, Plant, and Equipment.
We review long-lived assets for impairment whenever events or changes in circumstances indicate that its carrying amount may not be recoverable. Our impairment testing of long-lived assets consists of determining whether the carrying amount of the long-lived asset (asset group) is recoverable, in other words, whether the sum of the future undiscounted cash flows expected to result from the use and eventual disposition of the asset (asset group) exceeds its carrying amount. The determination of the existence of impairment involves judgments that are subjective in nature and may require the use of estimates in forecasting future results and cash flows related to an asset or group of assets. In making this determination, we use certain assumptions, including estimates of future cash flows expected to be generated by these assets, which are based on additional assumptions such as asset utilization, the length of service that assets will be used in our operations, and estimated salvage values. See
Note 8 - Property, Plant, and Equipment
, net in the notes to the consolidated financial statements for additional disclosures related to our long-lived assets.
Income Taxes
In accordance with the authoritative guidance on accounting for income taxes, we recognize income taxes using an asset and liability approach. This approach requires the recognition of taxes payable or refundable for the current year and deferred tax liabilities and assets for the future tax consequences of events that have been recognized in our consolidated financial statements or tax returns. The measurement of current and deferred taxes is based on provisions of the enacted tax law and the effects of future changes in tax laws or rates are not anticipated.
The authoritative guidance provides for recognition of deferred tax assets if the realization of such deferred tax assets is more likely than not to occur based on an evaluation of all available evidence, both positive and negative, and the relative weight of the evidence. With the exception of the gains resulting from the completed Photovoltaics Asset Sale, we have determined that at this time it is more likely than not that deferred tax assets attributable to all other items will not be realized, primarily due to uncertainties related to our ability to utilize our net operating loss carryforwards before they expire. Accordingly, we have established a valuation allowance for such deferred tax assets which we do not expect to realize. If there is a change in our ability to realize our deferred tax assets for which a valuation allowance has been established, then our tax valuation allowance may decrease in the period in which we determine that realization is more likely than not. Likewise, if we determine that it is not more likely than not that deferred tax assets will be realized, then a valuation allowance may be established for such deferred tax assets and our tax provision may increase in the period in which we make the determination. See
Note 13 - Income and other Taxes
in the notes to the consolidated financial statements for additional information related to our income taxes.
39
Revenue Recognition
Revenue is recognized upon shipment, provided persuasive evidence of a contract exists, the price is fixed, the product meets our customer's specifications, title and ownership have transferred to the customer, and there is reasonable assurance of collection of the sales proceeds. The majority of our products have shipping terms that are free on board or free carrier alongside (FCA) shipping point, which means that we fulfill our delivery obligation when the goods are handed over to the freight carrier at our shipping dock. This means the customer typically bears all costs and risks of loss or damage to the goods from that point. In certain cases, we ship our products cost insurance and freight. Under this arrangement, revenue is recognized under FCA shipping point terms, but we pay (and invoice the customer) for the cost of shipping and insurance to the customer's designated location. We account for shipping and related transportation costs by recording the charges that are invoiced to customers as revenue, with the corresponding cost recorded as cost of revenue. In those instances where inventory is maintained at a consigned location, revenue is recognized only when our customer pulls product for use and after title and ownership has transferred to the customer. Any warranty cost and remaining obligations that are inconsequential or perfunctory are accrued when the corresponding revenue is recognized.
Distributors
. We use a number of distributors around the world and recognize revenue upon shipment of product to these distributors. Title and risk of loss pass to the distributors upon shipment, and our distributors are contractually obligated to pay us on standard commercial terms, just like our other direct customers. We do not sell to our distributors on consignment and, except in the event of product discontinuance, do not give distributors a right of return.
Contract Manufacturers
. Prior to certain customers accepting product that is manufactured at one of our contract manufacturers, these customers require that they first qualify the product and manufacturing processes at our contract manufacturer. The customers' qualification process determines whether the product manufactured at our contract manufacturer achieves their quality, performance, and reliability standards. After a customer completes the initial qualification process, we receive approval to ship qualified product to that customer. As part of the manufacturing process at our contract manufacturers, the finished product is tested prior to shipment to the customer using the same criteria that our customer uses to test product it receives. Revenue is recognized upon shipment of customer-qualified product, provided persuasive evidence of a contract exists, the price is fixed, the product meets our customer's specifications, title and ownership have transferred to the customer, and there is reasonable assurance of collection of the sales proceeds.
Product Warranty Reserves
We provide our customers with limited rights of return for non-conforming shipments and warranty claims for certain products. Pursuant to ASC 450,
Contingencies,
we make estimates of product warranty expense using historical experience rates as a percentage of revenue and accrue estimated warranty expense as a cost of revenue. We estimate the costs of our warranty obligations based on historical experience of known product failure rates and anticipated rates if warranty claims, use of materials to repair or replace defective products, and service delivery costs incurred in correcting product issues. In addition, from time to time, specific warranty accruals may be made if unforeseen technical problems arise. Should our actual experience relative to these factors differ from our estimates, we may be required to record additional warranty reserves. Alternatively, if we provide more reserves than needed, we may reverse a portion of such provisions in future periods. See
Note 10 - Accrued Expenses and Other Current Liabilities
in the notes to the consolidated financial statements for additional disclosures related to our product warranty reserves.
40
Stock-Based Compensation
Stock-based compensation expense is measured at the stock option grant date, based on the fair value of the award, and is recorded to cost of revenue, sales, general, and administrative, and research and development expense based on an employee's responsibility and function over the requisite service period. We use the Black-Scholes option-pricing model and the straight-line attribution approach to determine the fair value of stock-based awards in accordance with ASC 718,
Compensation.
This option-pricing model requires the input of subjective assumptions, including the option's expected life, the price volatility of the underlying stock, risk-free interest rate and expected forfeitures. Expected term represents the period that stock-based awards are expected to be outstanding and is determined based on historical experience of similar awards, giving consideration to the contractual terms of the stock-based awards, vesting schedules and expectations of future employee behavior as influenced by changes to the terms of its stock-based awards. The expected stock price volatility is based on our historical stock prices. We are required to estimate forfeitures at the time of grant and revise those estimates in subsequent periods if actual forfeitures differ from those estimates. We use historical data to estimate pre-vesting option forfeitures and record stock-based compensation expense only for those awards that are expected to vest. If we use different assumptions for estimating stock-based compensation expense in future periods or if actual forfeitures differ materially from our estimated forfeitures, the change in our non-cash stock-based compensation expense could adversely affect our results of operations. See
Note 15 - Equity
in the notes to the consolidated financial statements for additional disclosures related to our stock-based compensation.
Litigation Contingencies
We are subject to various legal proceedings, claims, and litigation, either asserted or unasserted, that arise in the ordinary course of business. While the outcome of these matters is currently not determinable, we do not expect the resolution of these matters will have a material adverse effect on our business, financial position, results of operations, or cash flows. However, the results of these matters cannot be predicted with certainty. Professional legal fees are expensed when incurred. We accrue for contingent losses when such losses are probable and reasonably estimable. In the event that estimates or assumptions prove to differ from actual results, adjustments are made in subsequent periods to reflect more current information. Should we fail to prevail in any legal matter or should several legal matters be resolved against the Company in the same reporting period, then the financial results of that particular reporting period could be materially affected. See
Note 14 - Commitments and Contingencies
in the notes to our consolidated financial statements for disclosures related to our legal proceedings.
Warrant Valuation
As of
September 30, 2014
, warrants representing the right to purchase
400,001
shares, of our common stock were outstanding.
Since the warrants expired on
April 1, 2015
, no warrants were outstanding as of
September 30, 2015
. All of our warrants met the classification requirements for liability accounting pursuant to ASC 815,
Derivatives and Hedging
. See
Note 5 - Fair Value Accounting
in the notes to the consolidated financial statements for additional disclosures.
Asset Retirement Obligations
Pursuant to ASC 410,
Asset Retirement and Environmental Obligations
, an asset retirement obligation is recorded when there is a legal obligation associated with the retirement of a tangible long-lived asset and the fair value of the liability can reasonably be estimated. Upon initial recognition of an asset retirement obligation, a company increases the carrying amount of the long-lived asset by the same amount as the liability. Over time, the liabilities are accreted for the change in their present value through charges to operations costs. The initial capitalized costs are depleted over the useful lives of the related assets through charges to depreciation, depletion, and/or amortization. If the fair value of the estimated asset retirement obligation changes, an adjustment is recorded to both the asset retirement obligation and the asset retirement cost. Revisions in estimated liabilities can result from revisions of estimated inflation rates, escalating retirement costs, and changes in the estimated timing of settling asset retirement obligations.
We have known conditional asset retirement conditions, such as certain asset decommissioning and restoration of rented facilities to be performed in the future. See
Note 14 - Commitments and Contingencies
in the notes to the consolidated financial statements for additional disclosures related to our asset retirement obligations.
41
Insurance Recoveries
Insurance recoveries related to impairment losses previously recorded and other recoverable expenses will be recognized up to the amount of our related loss or expense in the period that recoveries become realizable. As of
September 30, 2015
and
2014
, we have not recorded any estimated amounts relating to potential future insurance recoveries in our consolidated statement of operations.
***
The above listing is not intended to be a comprehensive list of all of our accounting policies. In many cases, U.S. GAAP specifically dictates the accounting treatment of a particular transaction. There are also areas in which management's judgment in selecting any available alternative would not produce a materially different result. For a complete discussion of our accounting policies, recently adopted accounting pronouncements, and other required U.S. GAAP disclosures, we refer you to the accompanying footnotes to our consolidated financial statements in this Annual Report.
42
Results of Operations
The following table sets forth our consolidated statements of operations data expressed as a percentage of revenue:
|
For the Fiscal Years Ended September 30,
|
||||||||
|
|
2015
|
2014
|
2013
|
|||||
|
Revenue
|
100.0
|
%
|
100.0
|
%
|
100.0
|
%
|
||
|
Cost of revenue
|
64.9
|
|
78.2
|
|
79.9
|
|
||
|
Gross profit
|
35.1
|
|
21.8
|
|
20.1
|
|
||
|
Operating expense (income):
|
||||||||
|
Selling, general, and administrative
|
30.2
|
|
41.9
|
|
30.3
|
|
||
|
Research and development
|
11.2
|
|
16.8
|
|
17.2
|
|
||
|
Gain from change in estimate on ARO obligation
|
(1.0
|
)
|
—
|
|
—
|
|
||
|
Flood-related insurance proceeds
|
—
|
|
—
|
|
(12.8
|
)
|
||
|
Loss (gain) on sale of assets
|
0.3
|
|
(0.1
|
)
|
—
|
|
||
|
Total operating expense
|
40.7
|
|
58.6
|
|
34.7
|
|
||
|
Operating loss
|
(5.6
|
)
|
(36.8
|
)
|
(14.6
|
)
|
||
|
Other income (expense):
|
||||||||
|
Interest income (expense), net
|
0.1
|
|
(0.9
|
)
|
(1.3
|
)
|
||
|
Foreign exchange (loss) gain
|
(0.1
|
)
|
—
|
|
0.5
|
|
||
|
Gain on sale of investment
|
—
|
|
0.6
|
|
—
|
|
||
|
Change in fair value of financial instruments
|
0.1
|
|
0.1
|
|
0.8
|
|
||
|
Other income
|
—
|
|
0.1
|
|
—
|
|
||
|
Total other income (expense)
|
0.1
|
|
(0.1
|
)
|
—
|
|
||
|
Loss from continuing operations before income tax benefit
|
(5.5
|
)
|
(36.9
|
)
|
(14.6
|
)
|
||
|
Income tax benefit
|
2.7
|
|
44.2
|
|
5.5
|
|
||
|
(Loss) income from continuing operations
|
(2.8
|
)%
|
7.3
|
%
|
(9.1
|
)%
|
||
|
Income from discontinued operations, net of tax
|
80.0
|
%
|
1.4
|
%
|
17.3
|
%
|
||
|
Net income
|
77.2
|
%
|
8.7
|
%
|
8.2
|
%
|
||
43
Comparison of Financial Results for the Fiscal Year Ended September 30, 2015 and 2014
|
(in thousands, except percentages)
|
For the Fiscal Years Ended September 30,
|
||||||||||||
|
|
2015
|
|
2014
|
|
$ Change
|
|
% Change
|
||||||
|
Revenue
|
$
|
81,685
|
|
|
$
|
55,514
|
|
|
$
|
26,171
|
|
|
47.1%
|
|
Cost of revenue
|
52,994
|
|
|
43,400
|
|
|
9,594
|
|
|
22.1%
|
|||
|
Gross profit
|
28,691
|
|
12,114
|
|
|
16,577
|
|
|
136.8%
|
||||
|
Operating expense (income):
|
|||||||||||||
|
Selling, general, and administrative
|
24,711
|
|
|
23,239
|
|
|
1,472
|
|
|
6.3%
|
|||
|
Research and development
|
9,119
|
|
|
9,306
|
|
|
(187
|
)
|
|
(2.0)%
|
|||
|
Gain from change in estimate on ARO obligation
|
(845
|
)
|
|
—
|
|
|
(845
|
)
|
|
N/A
|
|||
|
Loss (gain) on sale of assets
|
228
|
|
|
(100
|
)
|
|
328
|
|
|
328.0%
|
|||
|
Total operating expense
|
33,213
|
|
|
32,445
|
|
768
|
|
2.4%
|
|||||
|
Operating loss
|
(4,522
|
)
|
(20,331
|
)
|
15,809
|
|
|
77.8%
|
|||||
|
Other income (expense):
|
|
|
|
|
|
|
|
|
|
|
|||
|
Interest income (expense), net
|
75
|
|
|
(522
|
)
|
|
597
|
|
|
114.4%
|
|||
|
Foreign exchange loss
|
(138
|
)
|
|
(7
|
)
|
|
(131
|
)
|
|
(1,871.4)%
|
|||
|
Gain on sale of investment
|
—
|
|
|
307
|
|
|
(307
|
)
|
|
(100.0)%
|
|||
|
Change in fair value of financial instruments
|
122
|
|
|
34
|
|
|
88
|
|
|
258.8%
|
|||
|
Other income
|
—
|
|
|
51
|
|
|
(51
|
)
|
(100.0)%
|
||||
|
Total other income (expense)
|
59
|
|
|
(137
|
)
|
|
196
|
|
|
143.1%
|
|||
|
Loss from continuing operations before income tax benefit
|
(4,463
|
)
|
|
(20,468
|
)
|
|
16,005
|
|
|
78.2%
|
|||
|
Income tax benefit
|
2,191
|
|
|
24,550
|
|
|
(22,359
|
)
|
|
(91.1)%
|
|||
|
(Loss) income from continuing operations
|
(2,272
|
)
|
4,082
|
|
(6,354
|
)
|
|
(155.7)%
|
|||||
|
Income from discontinued operations, net of tax
|
65,372
|
|
|
770
|
|
|
64,602
|
|
|
8,389.9%
|
|||
|
Net income
|
$
|
63,100
|
|
|
$
|
4,852
|
|
$
|
58,248
|
|
|
1,200.5%
|
|
Revenue
EMCORE offers a broad portfolio of compound semiconductor-based products for the broadband and specialty fiber optics market. EMCORE provides optical components, subsystems, and systems for CATV and FTTP networks, as well as products for satellite communications, video transport, and specialty photonics technologies for defense and homeland security applications.
For the fiscal year ended
September 30, 2015
, revenue increased
47.1%
compared to the prior year driven by significantly higher sales of our CATV products primarily to U.S. customers and our chip level devices. Sales of our CATV products, which include our quadrature amplitude modulation transmitters and receivers, represented the largest percentage of our total revenue during fiscal 2015. Sales of our chip level device products, which include our avalanche photodiodes and gain chips, increased as EMCORE expanded its sales to customers, primarily in Asia.
44
Gross Profit
Our cost of revenue consists of raw materials, compensation expense including non-cash stock-based compensation expense, depreciation expense and other manufacturing overhead costs, expenses associated with excess and obsolete inventories, and product warranty costs. Historically, our cost of revenue as a percentage of revenue, which we refer to as our gross margin, has fluctuated significantly due to product mix, manufacturing yields and sales volumes, and inventory and specific product warranty charges.
Consolidated gross margins were
35.1%
and
21.8%
for the fiscal years ended
September 30, 2015
and
2014
, respectively.
Stock-based compensation expense within cost of revenue totaled approximately
$0.3 million
and
$0.5 million
during the fiscal years ended
September 30, 2015
and
2014
, respectively.
For the fiscal ended
September 30, 2015
, gross margins increased when compared to the prior year. The increase in gross margins for the fiscal year ended
September 30, 2015
compared to
2014
was primarily due to higher sales volume and higher utilization of the manufacturing facility as we significantly increased production output resulting in higher levels of absorption. In addition, gross margins also increased from an improvement in product mix.
Selling, General and Administrative (SG&A)
SG&A consists primarily of compensation expense including non-cash stock-based compensation expense related to executive, finance, and human resources personnel, as well as sales and marketing expenses, professional fees, amortization expense on intangible assets, legal and patent-related costs, and other corporate-related expenses.
Stock-based compensation expense within SG&A totaled approximately
$2.8 million
and
$1.9 million
during the fiscal years ended
September 30, 2015
and
2014
, respectively.
SG&A expense for the fiscal year ended
September 30, 2015
was higher than the amount reported in the prior year primarily due to higher stock-based compensation and severance and compensation expense associated with the sales of the Photovoltaics and Digital Products Businesses.
As a percentage of revenue, SG&A expenses were
30.2%
and
41.9%
for the fiscal years ended
September 30, 2015
and
2014
, respectively.
Research and Development (R&D
)
R&D consists primarily of compensation expense including non-cash stock-based compensation expense, as well as engineering and prototype costs, depreciation expense, and other overhead expenses, as they related to the design, development, and testing of our products. Our R&D costs are expensed as incurred. We believe that in order to remain competitive, we must invest significant financial resources in developing new product features and enhancements and in maintaining customer satisfaction worldwide.
Stock-based compensation expense within R&D totaled approximately
$0.4 million
and
$0.6 million
during the fiscal years ended
September 30, 2015
and
2014
, respectively.
R&D expense for the fiscal year ended
September 30, 2015
was slightly lower than the amounts reported in the prior year primarily due to lower compensation costs attributed to lower headcount and lower material spending.
As a percentage of revenue, R&D expenses were
11.2%
and
16.8%
for the fiscal years ended
September 30, 2015
and
2014
, respectively.
45
Gain from Change in Estimate on ARO Obligation
As a result of the revision in the estimated amount and timing of cash flows for asset retirement obligations during the fiscal year ended
September 30, 2015
, the Company reduced the asset retirement obligations liability by $
2.9 million
with an offsetting reduction to property, plant, and equipment, net of
$2.1 million
, and recorded a gain from change in estimate on ARO obligation of $
0.8 million
. The Company first reduced the net leasehold improvement asset to the extent of the carrying amount of the related asset initially recorded when the asset retirement obligations were established. The amount of the remaining reduction to the asset retirement obligations was recorded as a reduction to operating expenses.
See Note 14 - Commitments and Contingencies
in the notes to the consolidated financial statements for additional information.
Operating Loss
Operating loss represents revenue less the cost of revenue and direct operating expenses incurred. Operating loss is a measure of profit and loss that executive management uses to assess performance and make decisions. As a percentage of revenue, our operating loss was
(5.6)%
, and
(36.8)%
for the fiscal years ended
September 30, 2015
and
2014
, respectively.
Other Income (Expense)
Interest income (expense), net
During the fiscal year ended
September 30, 2015
, we recorded
$0.2 million
of interest income earned on the Promissory Note from NeoPhotonics which was primarily offset by an equivalent amount of interest expense incurred on borrowings outstanding under our credit facility during the period. Interest expense for fiscal year ended
September 30, 2015
was lower than the amounts reported in the prior year due to higher borrowings outstanding under our credit facility during the fiscal year ended
September 30, 2014
.
Foreign Exchange
Gains and losses from foreign currency transactions denominated in currencies other than the U.S. dollar, both realized and unrealized, are recorded as foreign exchange gain (loss) on our consolidated statements of operations and comprehensive income. A majority of the gains or losses recorded relate to the change in value of the yuan renminbi relative to the U.S. dollar. The assets and liabilities of our foreign operations are translated from their respective functional currencies into U.S. dollars at the rates in effect at the consolidated balance sheet dates, and the revenue and expense amounts are translated at the average rate during the applicable periods reflected on the consolidated statements of operations and comprehensive income. Foreign currency translation adjustments are recorded as accumulated other comprehensive income.
Gain on Sale of Investment
During the fiscal year ended
September 30, 2014
, we sold our investment in a company that had a net book value of $0 at
September 30, 2013
, for
$0.3 million
.
Change in Fair Value of Financial Instruments
As of September 30,
2014
, warrants representing the right to purchase
400,001
shares, of our common stock were outstanding. Since the warrants expired on April 1, 2015, no warrants were outstanding as of
September 30, 2015
.
Income Tax Benefit
At
September 30, 2014
, the Company determined that it was more likely than not that certain deferred tax assets would be realized upon the sale of the Photovoltaic Business in fiscal year
2015
. As a result, a net deferred tax valuation allowance release of
$24.1 million
was recorded as an income tax benefit during fiscal year
2014
. The sale of the Photovoltaic Business closed on
December 10, 2014
and the Company realized a gain on the transaction.
During the fiscal year ended
September 30, 2015
, the Company utilized the
$24.1 million
of deferred tax assets. The Company expects to make a payment for alternative minimum taxes and the remaining income tax expense will be offset mainly through utilization of
$24.1 million
of deferred tax assets and utilization of net operating loss carry forwards.
46
For the fiscal years ended
September 30, 2015
and
2014
, the Company recorded income tax benefit from continuing operations losses of approximately
$2.2 million
and
$24.6 million
, respectively. For the fiscal years ended
September 30, 2015
, and
2014
, the Company recorded income tax expense within discontinued operations of approximately
$26.5 million
and
$0.5 million
, respectively. The income tax expense within discontinued operations includes estimated alternative minimum tax and other adjustments prescribed by ASC 740 in allocating expected annual income tax expense (benefit) between continuing operations and discontinued operations.
For fiscal years ended
September 30, 2015
and
2014
, the effective tax rate on continuing operations was
49.1%
, and
119.9%
and, respectively. The lower tax rate for fiscal year
2015
was primarily due to permanent differences, state tax benefits, foreign tax rate differentials, and release of state taxes associated with uncertain tax positions. The higher tax rate for fiscal year
2014
was mainly attributable to the partial release of the valuation allowance. The Company uses estimates to forecast the results from continuing operations for the current fiscal year as well as permanent differences between book and tax accounting. The Company believes its forecast of losses from continuing operations is a reasonable estimate. Actual results from continuing operations may differ significantly from the estimates previously forecasted, resulting in significant changes from one period to the next in the tax expense or benefit from continuing operations being recognized. Also see
Note 13 -Income and other Taxes
in the notes to the consolidated financial statements for more information.
Income from Discontinued Operations, Net of Tax
|
(in thousands, except percentages)
|
For the Fiscal Years Ended September 30,
|
||||||||||||
|
2015
|
2014
|
$ Change
|
% Change
|
||||||||||
|
Revenue
|
$
|
24,558
|
|
$
|
119,264
|
|
$
|
(94,706
|
)
|
(79.4)%
|
|||
|
Cost of revenue
|
17,352
|
|
98,704
|
|
(81,352
|
)
|
(82.4)%
|
||||||
|
Gross profit
|
7,206
|
|
20,560
|
|
(13,354
|
)
|
(65.0)%
|
||||||
|
Operating expense
|
5,040
|
|
19,337
|
|
(14,297
|
)
|
(73.9)%
|
||||||
|
Other income
|
779
|
|
17
|
|
762
|
|
4,482.4%
|
||||||
|
Gain on sale of discontinued operations
|
88,952
|
|
—
|
|
88,952
|
|
N/A
|
||||||
|
Income from discontinued operations before income tax expense
|
91,897
|
|
1,240
|
|
90,657
|
|
7,311.0%
|
||||||
|
Income tax expense
|
(26,525
|
)
|
(470
|
)
|
(26,055
|
)
|
(5,543.6)%
|
||||||
|
Income from discontinued operations, net of tax
|
$
|
65,372
|
|
$
|
770
|
|
$
|
64,602
|
|
8,389.9%
|
|||
During the fiscal year ended
September 30, 2015
, we recognized a gain of
$87.0 million
and
$2.0 million
on the sales of the Photovoltaics Business and Digital Products Business, respectively, which is recorded within income from discontinued operations under the caption "gain on sale of discontinued operations". During the fiscal year ended
September 30, 2015
, we recorded income from discontinued operations from the Photovoltaics Business and Digital Products Business of
$61.2 million
and
$4.2 million
, respectively. During the fiscal year ended
September 30, 2014
, we recorded income (loss) from discontinued operations from the Photovoltaics Business and Digital Products Business of
$8.9 million
and
$(8.1) million
, respectively.
47
Comparison of Financial Results for the Fiscal Years Ended September 30, 2014 and 2013
|
(in thousands, except percentages)
|
For the Fiscal Years Ended September 30,
|
||||||||||||
|
2014
|
2013
|
$ Change
|
% Change
|
||||||||||
|
Revenue
|
$
|
55,514
|
|
$
|
60,971
|
|
$
|
(5,457
|
)
|
(9.0)%
|
|||
|
Cost of revenue
|
43,400
|
|
48,705
|
|
(5,305
|
)
|
(10.9)%
|
||||||
|
Gross profit
|
12,114
|
|
12,266
|
|
(152
|
)
|
(1.2)%
|
||||||
|
Operating expense:
|
|
|
|||||||||||
|
Selling, general, and administrative
|
23,239
|
|
18,492
|
|
4,747
|
|
25.7%
|
||||||
|
Research and development
|
9,306
|
|
10,509
|
|
(1,203
|
)
|
(11.4)%
|
||||||
|
Flood-related insurance proceeds
|
—
|
|
(7,790
|
)
|
7,790
|
|
(100.0)%
|
||||||
|
Gain on sale of assets
|
(100
|
)
|
—
|
|
(100
|
)
|
N/A
|
||||||
|
Total operating expense
|
32,445
|
|
21,211
|
|
11,234
|
|
53.0%
|
||||||
|
Operating loss
|
(20,331
|
)
|
(8,945
|
)
|
(11,386
|
)
|
(127.3)%
|
||||||
|
Other income (expense):
|
|
|
|||||||||||
|
Interest expense, net
|
(522
|
)
|
(800
|
)
|
278
|
|
34.8%
|
||||||
|
Foreign exchange (loss) gain
|
(7
|
)
|
283
|
|
(290
|
)
|
(102.5)%
|
||||||
|
Gain on sale of investment
|
307
|
|
—
|
|
307
|
|
N/A
|
||||||
|
Change in fair value of financial instruments
|
34
|
|
515
|
|
(481
|
)
|
(93.4)%
|
||||||
|
Other income
|
51
|
|
—
|
|
51
|
|
N/A
|
||||||
|
Total other expense
|
(137
|
)
|
(2
|
)
|
(135
|
)
|
(6,750.0)%
|
||||||
|
Loss from continuing operations before income tax benefit
|
(20,468
|
)
|
(8,947
|
)
|
(11,521
|
)
|
(128.8)%
|
||||||
|
Income tax benefit
|
24,550
|
|
3,393
|
|
21,157
|
|
623.5%
|
||||||
|
Income (loss) from continuing operations
|
4,082
|
|
(5,554
|
)
|
9,636
|
|
173.5%
|
||||||
|
Income from discontinued operations, net of tax
|
770
|
|
10,542
|
|
(9,772
|
)
|
(92.7)%
|
||||||
|
Net income
|
$
|
4,852
|
|
$
|
4,988
|
|
$
|
(136
|
)
|
(2.7)%
|
|||
Revenue
For the fiscal year ended
September 30, 2014
, revenue decreased
9.0%
compared to the prior year driven by a decrease in sales from our video transmission products due to lower customer demand from North American customers and a decrease in sales from our Satcom products. Sales of our CATV products, which include our quadrature amplitude modulation transmitters and receivers, represented the largest percentage of our total fiber optics-related revenue.
Gross Profit
Cost of revenue consists of raw materials, compensation expense including non-cash stock-based compensation expense, depreciation expense and other manufacturing overhead costs, expenses associated with excess and obsolete inventories, and product warranty costs. Historically, our cost of revenue as a percentage of revenue, which we refer to as our gross margin, has fluctuated significantly due to product mix, manufacturing yields and sales volumes, and inventory and specific product warranty charges.
Consolidated gross margins were
21.8%
and
20.1%
for the fiscal years ended
September 30, 2014
and
2013
, respectively.
Stock-based compensation expense within cost of revenue totaled approximately
$0.5 million
and
$0.6 million
during the fiscal years ended
September 30, 2014
and
2013
, respectively.
48
For the fiscal year ended
September 30, 2014
, gross margins increased slightly when compared to the prior year primarily due to lower manufacturing variances associated with the transfer of manufacturing to a lower cost region.
Selling, General and Administrative (SG&A)
SG&A consists primarily of compensation expense including non-cash stock-based compensation expense related to executive, finance, and human resources personnel, as well as sales and marketing expenses, professional fees, amortization expense on intangible assets, legal and patent-related costs, and other corporate-related expenses.
Stock-based compensation expense within SG&A totaled approximately
$1.9 million
and
$1.4 million
during the fiscal years ended
September 30, 2014
and
2013
, respectively.
SG&A expense for the fiscal year ended
September 30, 2014
was higher than the amount reported in the same period during the prior year was primarily attributable to transaction costs and legal fees of $3.2 million associated with the sales of the Photovoltaics and Digital Products Businesses and higher severance related costs.
As a percentage of revenue, SG&A expenses were
41.9%
and
30.3%
for the fiscal years ended
September 30, 2014
and
2013
, respectively.
Research and Development (R&D
)
R&D consists primarily of compensation expense including non-cash stock-based compensation expense, as well as engineering and prototype costs, depreciation expense, and other overhead expenses, as they related to the design, development, and testing of our products. Our R&D costs are expensed as incurred. We believe that in order to remain competitive, we must invest significant financial resources in developing new product features and enhancements and in maintaining customer satisfaction worldwide.
Stock-based compensation expense within R&D totaled approximately
$0.6 million
and
$0.7 million
during the fiscal years ended
September 30, 2014
and
2013
, respectively.
R&D expense for the fiscal year ended
September 30, 2014
was lower than the amounts reported in the same period during the prior year primarily due to lower compensation costs attributed to lower headcount.
As a percentage of revenue, R&D expenses were
16.8%
and
17.2%
for the fiscal years ended
September 30, 2014
and
2013
, respectively.
Flood-related insurance proceeds
In October 2011, flood waters had severely impacted the inventory and production operations of our primary contract manufacturer in Thailand. The impacted areas included certain product lines for the Digital Products Business and CATV business. This had a significant impact on our operations and our ability to meet customer demand for certain of our fiber optics products.
We rebuilt the impacted production lines at other locations, including an alternative facility of our contract manufacturer in Thailand, as well as our own manufacturing facilities in the United States and China. See
Note 4 - Discontinued Operations
and
Note 11 - Impact from Thailand Flood
in the notes to the consolidated financial statements for additional disclosures related to the impact of the Thailand flood on our operations.
During the fiscal year ended
September 30, 2013
, we recorded flood-related insurance proceeds of
$7.8 million
in continuing operations in the form of forgiveness of
$0.2 million
of outstanding capital lease obligations,
$1.0 million
of outstanding payables and
$6.6 million
in the form of a receivable, which was paid in cash. No additional flood-related insurance proceeds associated with this event are anticipated. See
Note 11 - Impact from Thailand Flood
and
Note 4 - Discontinued Operations
for additional disclosures.
49
Operating Loss
Operating loss represents revenue less the cost of revenue and direct operating expenses incurred. Operating loss is a measure of profit and loss that executive management uses to assess performance and make decisions. As a percentage of revenue, our operating loss was
(36.8)%
, and
(14.6)%
for the fiscal years ended
September 30, 2014
and
2013
, respectively.
Other Income (Expense)
Gain on Sale of Investment
During the fiscal year ended
September 30, 2014
, we sold our investment in a company that had a net book value of $0 at
September 30, 2013
, for
$0.3 million
.
Income Tax Benefit
For the fiscal years ended September 30,
2014
and
2013
, the Company recorded income tax benefit from continuing operations losses of approximately
$24.6 million
and
$3.4 million
, respectively. For the fiscal years ended September 30,
2014
and
2013
, the Company recorded income tax expense within discontinued operations of approximately
$0.5 million
and
$3.5 million
, respectively. The income tax expense within discontinued operations includes estimated alternative minimum tax and other adjustments prescribed by ASC 740 in allocating expected annual income tax expense (benefit) between continuing operations and discontinued operations.
For fiscal years ended September 30,
2014
and
2013
, the effective tax rate on continuing operations was
119.9%
and
37.9%
, respectively. In determining the effective tax rate, the Company uses estimates to forecast the results from continuing operations for the current fiscal year as well as permanent differences between book and tax accounting. The Company believes its forecast of losses from continuing operations is a reasonable estimate. Actual results from continuing operations may differ significantly from the estimates previously forecasted, resulting in significant changes from one period to the next in the tax expense or benefit from continuing operations being recognized.
Income from Discontinued Operations, Net of Tax
|
(in thousands, except percentages)
|
For the Fiscal Years Ended September 30,
|
||||||||||||
|
2014
|
2013
|
$ Change
|
% Change
|
||||||||||
|
Revenue
|
$
|
119,264
|
|
$
|
107,176
|
|
$
|
12,088
|
|
11.3%
|
|||
|
Cost of revenue
|
98,704
|
|
91,244
|
|
7,460
|
|
8.2%
|
||||||
|
Gross profit
|
20,560
|
|
15,932
|
|
4,628
|
|
29.0%
|
||||||
|
Operating expense
|
19,337
|
|
17,977
|
|
1,360
|
|
7.6%
|
||||||
|
Flood-related insurance proceeds
|
—
|
|
(11,210
|
)
|
11,210
|
|
100.0%
|
||||||
|
Other income
|
17
|
|
90
|
|
(73
|
)
|
(81.1)%
|
||||||
|
Gain on sale of equity method investment
|
—
|
|
4,800
|
|
(4,800
|
)
|
(100.0)%
|
||||||
|
Income from discontinued operations before income tax expense
|
1,240
|
|
14,055
|
|
(12,815
|
)
|
(91.2)%
|
||||||
|
Income tax expense
|
(470
|
)
|
(3,513
|
)
|
3,043
|
|
86.6%
|
||||||
|
Income from discontinued operations, net of tax
|
$
|
770
|
|
$
|
10,542
|
|
$
|
(9,772
|
)
|
(92.7)%
|
|||
During the fiscal year ended
September 30, 2014
, we recorded income (loss) from discontinued operations from the Photovoltaics Business and Digital Products Business of
$8.9 million
and
$(8.1) million
, respectively. During the fiscal year ended September 30, 2013, we recorded income (loss) from discontinued operations from the Photovoltaics Business and Digital Products Business of
$13.6 million
and
$(3.1) million
, respectively.
During the fiscal year ended
September 30, 2013
, we recorded flood-related insurance proceeds of
$11.2 million
within discontinued operations.
See Note 11 - Impact of Thailand Flood
for additional information.
50
In March 2013, we sold certain solar assets and our ownership interest in Emcore Solar New Mexico (“ESNM”) to Suncore Photovoltaic Technology Co., Ltd. ("Suncore") for
$1.5 million
. In June 2013, we entered into an agreement to transfer our
40%
registered ownership interest in Suncore to San'an Optoelectronics Co., Ltd. ("San'an") for a purchase price of
$4.8 million
. Upon completion of the share transfer, the Company recognized
$3.3 million
of deferred revenue from Suncore as well as the resulting gain of
$4.8 million
on our registered ownership interest which was recorded within discontinued operations.
Order Backlog
EMCORE'S product sales are made pursuant to purchase orders, often with short lead times. These orders are subject to revision or cancellation and often are made without deposits. Products typically ship within the same quarter in which a purchase order is received; therefore, our order backlog at any particular date is not necessarily indicative of actual revenue or the level of orders for any succeeding period.
Liquidity and Capital Resources
Historically, we have consumed cash from operations and incurred significant losses from continuing operations. We have managed our liquidity position through sale of assets, a series of cost reduction initiatives, borrowings from our credit facility and capital markets transactions.
As of
September 30, 2015
, cash and cash equivalents totaled
$111.9 million
and net working capital totaled approximately
$128.0 million
. Net working capital, calculated as current assets minus current liabilities, is a financial metric we use which represents available operating liquidity. For the fiscal year ended
September 30, 2015
, we earned net income of
$63.1 million
.
During the fiscal year ended
September 30, 2015
, the following changes to our liquidity occurred:
|
•
|
Sale of Photovoltaics Business: On
December 10, 2014
, we completed the sale of our Photovoltaics Business for
$150.0 million
in cash, prior to working capital adjustments of
$0.1 million
. We believe these proceeds will provide us with working capital for fiscal year 2016 and beyond.
|
|
•
|
Sale of Digital Products Business: On
January 2, 2015
, we completed the sale of our Digital Products Business for
$1.5 million
in cash and an adjusted Promissory Note balance
$15.5 million
. On
April 17, 2015
, NeoPhotonics paid in full the outstanding balance of the Promissory Note, including accrued interest, in the amount of
$15.7 million
.
|
|
•
|
On
June 15, 2015
, we completed the Tender Offer and purchased
6.9 million
shares of our common stock at a purchase price of
$6.55
per share, for an aggregate cost of
$45.0 million
excluding fees and expenses. Repurchased common stock was recorded to treasury stock. We incurred costs of
$0.7 million
in connection with the Tender Offer, which were recorded to treasury stock.
|
|
•
|
Credit Facility: On November 11, 2010, we entered into a Credit and Security Agreement (credit facility) with Wells Fargo Bank, National Association ("Wells Fargo"). The credit facility, as it has been amended through its seventh amendment, currently provides us with a revolving credit of up to
$15.0 million
through
November 2018
that can be used for working capital requirements, letters of credit, and other general corporate purposes. The credit facility is secured by the Company's assets and is subject to a borrowing base formula based on the Company's eligible accounts receivable, inventory, and machinery and equipment accounts.
|
On
December 3, 2014
, we entered into a Sixth Amendment to the credit facility, pursuant to which Wells Fargo agrees, to automatically release all encumbrances covering certain of the Company’s assets to be sold pursuant to the Photovoltaics Agreement and the Digital Products Agreement. In addition, on
December 10, 2014
upon notice to Wells Fargo of the closing of the transaction contemplated by the Photovoltaics Agreement, the maximum borrowing allowed under the credit facility was reduced from
$35.0 million
to
$15.0 million
, and certain other changes to the borrowing base calculations went into effect. As of
September 30, 2015
, there were no amounts outstanding under the credit facility and the Company was in compliance with all financial covenants. As of
September 30, 2015
, the credit facility had approximately
$0.9 million
reserved for
three
stand-by letters of credit, leaving a remaining
$8.6 million
of borrowing available under the credit facility. As of
December 14, 2015
, there was no outstanding balance under this credit facility.
On
November 10, 2015
, we entered into a Seventh Amendment of the credit facility which extended the maturity date of the facility to
November 2018
, and adjusted the interest rate to LIBOR plus
2.5%
.
51
Cash Flow
The Consolidated Statements of Cash Flows for the fiscal years ended
September 30,
2015
,
2014
and
2013
, respectively,
reflects cash flows from both the continuing and discontinued operations of the Company.
Net Cash (Used In) Provided By Operating Activities
|
Operating Activities
(in thousands, except percentages)
|
For the Fiscal Years Ended September 30,
|
Fiscal 2015 vs Fiscal 2014
|
Fiscal 2014 vs Fiscal 2013
|
||||||||||||||||||||
|
2015
|
2014
|
2013
|
$ Change
|
% Change
|
$ Change
|
% Change
|
|||||||||||||||||
|
Net cash (used in) provided by operating activities
|
$
|
(3,917
|
)
|
$
|
1,001
|
|
$
|
(22,105
|
)
|
$
|
(4,918
|
)
|
(491.3)%
|
$
|
23,106
|
|
104.5%
|
||||||
Fiscal 2015
:
Our operating activities consumed cash of
$3.9 million
primarily due to the effect of adjustments for non-cash charges, including the gain on sale of the Photovoltaics Business of
$87.0 million
, including the gain on sale of the Digital Products Business of
$2.0 million
, and the gain from change in estimate on ARO obligation of
$0.8 million
, foreign currency translation adjustment of
$0.7 million
as well as the changes in our current assets and liabilities (or working capital components) of
$8.6 million
, partially offset by deferred income taxes of
$24.1 million
, stock-based compensation expense of
$4.6 million
, warranty provision of
$0.8 million
, depreciation, amortization and accretion expense of
$3.0 million
, allowance for doubtful accounts of
$0.6 million
, and our net income of
$63.1 million
. The change in our current assets and liabilities was primarily the result of an increase in inventory of
$3.4 million
, a decrease in accounts payable of
$3.2 million
, a decrease in accrued expenses and other liabilities of
$5.8 million
, partially offset by a decrease in accounts receivable of
$3.5 million
and other assets of
$0.4 million
,
Fiscal 2014
:
Our operating activities provided cash of $1.0 million primarily due to our net income of $4.9 million, changes in our current assets and liabilities (or working capital components) of $5.0 million, depreciation, amortization and accretion expense of $8.5 million, stock-based compensation expense of $4.4 million, warranty provision of $2.1 million, losses on inventory purchase commitments of $0.3 million and allowance for doubtful accounts of $0.2 million, partially offset by deferred income taxes of $24.1 million and the gain on sale of investment of $0.3 million. The change in our current assets and liabilities was primarily the result of a decrease in inventory of $5.5 million, other assets of $2.9 million and an increase in accounts payable of $3.1 million, partially offset by a decrease in accrued expenses and other liabilities of $3.1 million and an increase in accounts receivable of $3.3 million.
Fiscal 2013
:
Our operating activities consumed cash of $22.1 million primarily due to the changes in our current assets and liabilities (or working capital components) of $21.2 million, non-cash insurance proceeds of $16.1 million and the reclassification of the gain on sale of equity method investment of $4.8 million to investing activities partially offset by our net income of $5.0 million, depreciation, amortization and accretion expense of $8.7 million, stock-based compensation expense of $4.2 million and warranty provision of $2.9 million. The change in our current assets and liabilities was primarily the result of a decrease in accounts payable of $14.0 million, a decrease in accrued expenses and other current liabilities of $9.6 million, and an increase in accounts receivable of $5.0 million, partially offset by a decrease in inventory of $2.0 million and other assets of $5.4 million. The decrease in accounts payable is primarily a result of paying down balances that had increased in prior periods with the proceeds received in the current period from the issuance of common stock and the collection of other current assets.
52
Working Capital Components
:
Accounts Receivable: We generally expect the level of accounts receivable at any given quarter to reflect the level of sales in that quarter. Our accounts receivable balances have fluctuated historically due to the timing of account collections, timing of product shipments, and/or change in customer credit terms.
Inventory: We generally expect the level of inventory at any given quarter to reflect the change in our expectations of forecasted sales. Our inventory balances have fluctuated historically due to the timing of customer orders and product shipments, changes in our internal forecasts related to customer demand, as well as adjustments related to excess and obsolete inventory.
Accounts Payable: The fluctuation of our accounts payable balances is primarily driven by changes in inventory purchases as well as changes related to the timing of actual payments to vendors.
Accrued Expenses: Our largest accrued expense typically relates to compensation. Historically, fluctuations of our accrued expense accounts have primarily related to changes in the timing of actual compensation payments, receipt or application of advanced payments, adjustments to our warranty accrual, and accruals related to professional fees.
Net Cash Provided By (Used In) Investing Activities
|
Investing Activities
(in thousands, except percentages)
|
For the Fiscal Years Ended September 30,
|
Fiscal 2015 vs Fiscal 2014
|
Fiscal 2014 vs Fiscal 2013
|
||||||||||||||||||||
|
2015
|
2014
|
2013
|
$ Change
|
% Change
|
$ Change
|
% Change
|
|||||||||||||||||
|
Net cash provided by (used in) investing activities
|
$
|
165,276
|
|
$
|
(3,261
|
)
|
$
|
3,829
|
|
$
|
168,537
|
|
5,168.3%
|
$
|
(7,090
|
)
|
(185.2)%
|
||||||
Fiscal 2015
:
Our investing activities provided
$165.3 million
of cash primarily from proceeds from sale of the Photovoltaics Business of
$149.9 million
, proceeds from sale of the Digital Products Business of
$17.0 million
, and a decrease in restricted cash of
$1.1 million
partially offset by capital related expenditures of
$2.8 million
.
Fiscal 2014
:
Our investing activities consumed $3.3 million of cash primarily from capital related expenditures of $3.0 million, the funding of restricted cash of $0.7 million, partially offset by cash proceeds of $0.3 million from the sale of an investment.
Fiscal 2013
:
Our investing activities provided $3.8 million of cash primarily from the sale of an unconsolidated affiliate of $4.8 million, flood related insurance proceeds of $5.4 million, sale of certain assets of $1.2 million, and cash proceeds of $0.5 million related to the disposal of equipment partially offset by capital related expenditures of $7.2 million and the funding of restricted cash of $0.7 million.
53
Net Cash (Used In) Provided By Financing Activities
|
Financing Activities
(in thousands, except percentages)
|
For the Fiscal Years Ended September 30,
|
Fiscal 2015 vs Fiscal 2014
|
Fiscal 2014 vs Fiscal 2013
|
||||||||||||||||||||
|
2015
|
2014
|
2013
|
$ Change
|
% Change
|
$ Change
|
% Change
|
|||||||||||||||||
|
Net cash (used in) provided by financing activities
|
$
|
(70,266
|
)
|
$
|
6,576
|
|
$
|
25,284
|
|
$
|
76,842
|
|
(1,168.5)%
|
$
|
(18,708
|
)
|
(74.0)%
|
||||||
Fiscal 2015
:
Our financing activities consumed cash of
$70.3 million
primarily due to the net payment of
$26.5 million
on our bank credit facility, purchase of treasury stock of
$45.7 million
partially offset by
$1.9 million
in proceeds from stock plan transactions. See
Note 12 - Credit Facilities
in the notes to the consolidated financial statements for information related to borrowings under our credit facility.
Fiscal 2014
:
Our financing activities provided cash of $6.6 million primarily from $4.8 million of proceeds related to borrowings under our credit facility, and $1.8 million in proceeds from stock plan transactions. See
Note 1 - Description of Business
in the notes to the consolidated financial statements for information related to borrowings under our credit facility.
Fiscal 2013
:
Our financing activities provided $25.3 million of net cash primarily from proceeds of $21.2 million from the sale of common stock, $2.4 million of proceeds related to borrowings under our credit facility, and $1.7 million in proceeds from stock plan transactions. See
Note 1 - Description of Business
in the notes to the consolidated financial statements for information related to borrowings under our credit facility.
Contractual Obligations and Commitments
Our contractual obligations and commitments for the next five fiscal years are summarized in the table below:
|
(in thousands)
|
For the Fiscal Years Ended September 30,
|
||||||||||||||||||
|
Total
|
2016
|
2017 to 2018
|
2019 to 2020
|
2021 and later
|
|||||||||||||||
|
Purchase obligations
|
$
|
8,088
|
|
$
|
8,088
|
|
$
|
—
|
|
$
|
—
|
|
$
|
—
|
|
||||
|
Asset retirement obligations
|
2,030
|
|
305
|
|
45
|
|
1,680
|
|
—
|
|
|||||||||
|
Operating lease obligations
|
1,395
|
|
959
|
|
436
|
|
—
|
|
—
|
|
|||||||||
|
Total contractual obligations and commitments
|
$
|
11,513
|
|
$
|
9,352
|
|
$
|
481
|
|
$
|
1,680
|
|
$
|
—
|
|
||||
Interest payments are not included in the contractual obligations and commitments table above since they are insignificant to our consolidated results of operations.
The contractual obligations and commitments table above also excludes unrecognized tax benefits because we are unable to reasonably estimate the period during which this obligation may be incurred, if at all. As of
September 30, 2015
, we had unrecognized tax benefits of
$0.4 million
.
Purchase Obligations
Our purchase obligations represent agreements to purchase goods or services that are enforceable and legally binding, that specify all significant terms, including: fixed or minimum quantities to be purchased; fixed, minimum or variable price provisions; and the approximate timing of the transactions.
54
Asset Retirement Obligations
We have known conditional asset retirement conditions, such as certain asset decommissioning and restoration of rented facilities to be performed in the future. Our asset retirement obligations include assumptions related to renewal option periods where we expect to extend facility lease terms. Revisions in estimated liabilities can result from revisions of estimated inflation rates, escalating retirement costs, and changes in the estimated timing of settling asset retirement obligations. See
Note 14- Commitments and Contingencies
in the notes to the consolidated financial statements for additional information related to our asset retirement obligations.
Operating Leases
Operating leases include non-cancelable terms and exclude renewal option periods, property taxes, insurance and maintenance expenses on leased properties. See
Note 14- Commitments and Contingencies
in the notes to the consolidated financial statements for additional information related to our operating lease obligations.
Off-Balance Sheet Arrangements
We do not have any off-balance sheet arrangements other than our operating leases described above that have or reasonably likely to have a current or future material effect on our consolidated financial condition, results of operations, liquidity, capital expenditures or capital resources.
Geographical Information
See
Note 16- Geographic Information
in the notes to the consolidated financial statements for disclosures related to revenue, geographic revenue and significant customers.
Recent Accounting Pronouncements
See
Note 3 - Recent Accounting Pronouncements
in the notes to the consolidated financial statements for disclosures related to recent accounting pronouncements.
Restructuring Accruals
See
Note 10 - Accrued Expenses and Other Current Liabilitie
s in the notes to the consolidated financial statements for disclosures related to our severance and restructuring-related accrual accounts.
55
ITEM 7A
. Quantitative and Qualitative Disclosures about Market Risks
We are exposed to financial market risks, including changes in currency exchange rates and interest rates. We do not use derivative financial instruments for speculative purposes.
Foreign Currency Exchange Risks
The United States dollar is the functional currency for our consolidated financial statements. The functional currency for our China subsidiary is the yuan renminbi.
We recognize gains and losses due to the effect of exchange rate changes on foreign currency primarily due to our operations in in China. The assets and liabilities of our foreign operations are translated from their respective functional currencies into U.S. dollars at the rates in effect at the consolidated balance sheet dates, and the revenue and expense amounts are translated at the average rate during the applicable periods reflected on the consolidated statements of operations and comprehensive income. Foreign currency translation adjustments are recorded as accumulated other comprehensive income. Gains and losses from foreign currency transactions denominated in currencies other than the U.S. dollar, both realized and unrealized, are recorded as foreign exchange gain (loss) on our consolidated statements of operations and comprehensive income. A majority of the gain or losses recorded relates to the change in value of the yuan renminbi relative to the U.S. dollar.
During the normal course of business, we are exposed to market risks associated with fluctuations in foreign currency exchange rates, primarily the yuan renminbi. To reduce the impact of these risks on our earnings and to increase the predictability of cash flows, we use natural offsets in receipts and disbursements within the applicable currency as the primary means of reducing the risk.
Some of our foreign suppliers may adjust their prices (in US dollars) from time to time to reflect currency exchange fluctuations, and such price changes could impact our future financial condition or results of operations. We do not currently hedge our foreign currency exposure.
Interest Rate Risks
On November 11, 2010, we entered into the credit facility with Wells Fargo Bank. As of
September 30, 2015
, we had no borrowings outstanding under our credit facility. As of
September 30, 2015
, the credit facility had
$0.9 million
reserved for
three
outstanding stand-by letters of credit, leaving a remaining
$8.6 million
borrowing availability balance under this credit facility. As of
December 14, 2015
, there was no outstanding balance under the credit facility.
The credit facility, as it has been amended through its seventh amendment currently provides us with a revolving credit of up to
$15.0 million
through
November 2018
that can be used for working capital requirements, letters of credit, and other general corporate purposes. The credit facility is secured by the Company's assets and is subject to a borrowing base formula based on the Company's eligible accounts receivable, inventory, and machinery and equipment accounts. See
Note 12 - Credit Facilities
for additional information related to our bank credit facility.
We monitor our interest rate risk on cash balances primarily through cash flow forecasting. Cash that is surplus to immediate requirements is invested in short-term deposits with banks accessible with short notice and invested in money market accounts. We believe our current interest rate risk is immaterial.
Inflation Risks
Inflationary factors, such as increases in material costs and operating expenses, may adversely affect our results of operations and cash flows. Although we do not believe that inflation has had a material impact on our financial position or results of operations to date, an increase in the rate of inflation in the future may have an adverse effect on the levels of gross profit and operating expenses as a percentage of revenue if the sales prices for our products do not proportionately increase with these increases in expenses.
Credit Market Conditions
Recently, the U.S. and global capital markets have been experiencing turbulent conditions, particularly in the credit markets, as evidenced by tightening of lending standards, reduced availability of credit, and reductions in certain asset values. This could impact our ability to obtain additional funding through financing or asset sales.
56
ITEM 8
. Financial Statements
EMCORE CORPORATION
For the Fiscal Years Ended
September 30,
2015
,
2014
and
2013
(in thousands, except net (loss) income per share)
|
|
For the Fiscal Years Ended September 30,
|
||||||||||
|
|
2015
|
2014
|
2013
|
||||||||
|
Revenue
|
$
|
81,685
|
|
$
|
55,514
|
|
$
|
60,971
|
|
||
|
Cost of revenue
|
52,994
|
|
43,400
|
|
48,705
|
|
|||||
|
Gross profit
|
28,691
|
|
12,114
|
|
12,266
|
|
|||||
|
Operating expense (income):
|
|||||||||||
|
Selling, general, and administrative
|
24,711
|
|
23,239
|
|
18,492
|
|
|||||
|
Research and development
|
9,119
|
|
9,306
|
|
10,509
|
|
|||||
|
Gain from change in estimate on ARO obligation
|
(845
|
)
|
—
|
|
—
|
|
|||||
|
Flood-related insurance proceeds
|
—
|
|
—
|
|
(7,790
|
)
|
|||||
|
Loss (gain) on sale of assets
|
228
|
|
(100
|
)
|
—
|
|
|||||
|
Total operating expense
|
33,213
|
|
32,445
|
|
21,211
|
|
|||||
|
Operating loss
|
(4,522
|
)
|
(20,331
|
)
|
(8,945
|
)
|
|||||
|
Other income (expense):
|
|||||||||||
|
Interest income (expense), net
|
75
|
|
(522
|
)
|
(800
|
)
|
|||||
|
Foreign exchange (loss) gain
|
(138
|
)
|
(7
|
)
|
283
|
|
|||||
|
Gain on sale of investment
|
—
|
|
307
|
|
—
|
|
|||||
|
Change in fair value of financial instruments
|
122
|
|
34
|
|
515
|
|
|||||
|
Other income
|
—
|
|
51
|
|
—
|
|
|||||
|
Total other income (expense)
|
59
|
|
(137
|
)
|
(2
|
)
|
|||||
|
Loss from continuing operations before income tax benefit
|
(4,463
|
)
|
(20,468
|
)
|
(8,947
|
)
|
|||||
|
Income tax benefit
|
2,191
|
|
24,550
|
|
3,393
|
|
|||||
|
(Loss) income from continuing operations
|
(2,272
|
)
|
4,082
|
|
(5,554
|
)
|
|||||
|
Income from discontinued operations, net of tax
|
65,372
|
|
770
|
|
10,542
|
|
|||||
|
Net income
|
$
|
63,100
|
|
$
|
4,852
|
|
$
|
4,988
|
|
||
|
Foreign exchange translation adjustment
|
(990
|
)
|
214
|
|
247
|
|
|||||
|
Comprehensive income
|
$
|
62,110
|
|
$
|
5,066
|
|
$
|
5,235
|
|
||
|
Per share data:
|
|||||||||||
|
Net (loss) income per basic share:
|
|||||||||||
|
Continuing operations
|
$
|
(0.08
|
)
|
$
|
0.13
|
|
$
|
(0.21
|
)
|
||
|
Discontinued operations
|
2.18
|
|
0.03
|
|
0.40
|
|
|||||
|
Net income per basic share
|
$
|
2.10
|
|
$
|
0.16
|
|
$
|
0.19
|
|
||
|
Net (loss) income per diluted share:
|
|||||||||||
|
Continuing operations
|
$
|
(0.08
|
)
|
$
|
0.13
|
|
$
|
(0.21
|
)
|
||
|
Discontinued operations
|
2.18
|
|
0.03
|
|
0.40
|
|
|||||
|
Net income per diluted share
|
$
|
2.10
|
|
$
|
0.16
|
|
$
|
0.19
|
|
||
|
Weighted-average number of basic shares outstanding
|
30,012
|
|
30,453
|
|
26,531
|
|
|||||
|
Weighted-average number of diluted shares outstanding
|
30,012
|
|
30,777
|
|
26,531
|
|
|||||
The accompanying notes are an integral part of these consolidated financial statements.
57
EMCORE CORPORATION
As of
September 30,
2015
and
2014
(in thousands, except per share data)
|
As of
|
As of
|
||||||
|
September 30,
2015 |
September 30,
2014 |
||||||
|
ASSETS
|
|
|
|||||
|
Current assets:
|
|
||||||
|
Cash and cash equivalents
|
$
|
111,885
|
|
$
|
20,687
|
|
|
|
Restricted cash
|
375
|
|
1,482
|
|
|||
|
Accounts receivable, net of allowance of $462 and $116, respectively
|
17,319
|
|
12,769
|
|
|||
|
Inventory
|
17,130
|
|
15,644
|
|
|||
|
Deferred income taxes, net
|
—
|
|
3,908
|
|
|||
|
Prepaid expenses and other current assets
|
4,976
|
|
5,336
|
|
|||
|
Current assets of discontinued operations
|
—
|
|
44,065
|
|
|||
|
Total current assets
|
151,685
|
|
103,891
|
|
|||
|
Property, plant, and equipment, net
|
8,925
|
|
10,446
|
|
|||
|
Other intangible assets, net
|
—
|
|
82
|
|
|||
|
Deferred income taxes, net
|
—
|
|
20,172
|
|
|||
|
Other non-current assets, net of allowance of $3,561 and $3,561, respectively
|
297
|
|
512
|
|
|||
|
Non-current assets of discontinued operations
|
—
|
|
56,239
|
|
|||
|
Total assets
|
$
|
160,907
|
|
$
|
191,342
|
|
|
|
LIABILITIES and SHAREHOLDERS’ EQUITY
|
|||||||
|
Current liabilities:
|
|||||||
|
Borrowings from credit facility
|
$
|
—
|
|
$
|
26,518
|
|
|
|
Accounts payable
|
7,189
|
|
6,804
|
|
|||
|
Deferred gain associated with sale of assets
|
3,400
|
|
3,400
|
|
|||
|
Warrant liability
|
—
|
|
122
|
|
|||
|
Accrued expenses and other current liabilities
|
13,102
|
|
15,209
|
|
|||
|
Current liabilities of discontinued operations
|
—
|
|
20,924
|
|
|||
|
Total current liabilities
|
23,691
|
|
72,977
|
|
|||
|
Asset retirement obligations
|
1,774
|
|
4,543
|
|
|||
|
Other long-term liabilities
|
—
|
|
755
|
|
|||
|
Non-current liabilities of discontinued operations
|
—
|
|
720
|
|
|||
|
Total liabilities
|
25,465
|
|
78,995
|
|
|||
|
Commitments and contingencies (Note 14)
|
|
|
|
|
|||
|
Shareholders’ equity:
|
|||||||
|
Preferred stock, $0.0001 par value, 5,882 shares authorized; none issued or outstanding
|
—
|
|
—
|
|
|||
|
Common stock, no par value, 50,000 shares authorized; 32,586 shares issued and 25,676 shares outstanding as of September 30, 2015; 31,149 shares issued and 31,109 shares outstanding as of September 30, 2014
|
762,003
|
|
755,368
|
|
|||
|
Treasury stock at cost; 6,910 shares as of September 30, 2015 and 40 shares as of September 30, 2014
|
(47,721
|
)
|
(2,071
|
)
|
|||
|
Accumulated other comprehensive income
|
847
|
|
1,837
|
|
|||
|
Accumulated deficit
|
(579,687
|
)
|
(642,787
|
)
|
|||
|
Total shareholders’ equity
|
135,442
|
|
112,347
|
|
|||
|
Total liabilities and shareholders’ equity
|
$
|
160,907
|
|
$
|
191,342
|
|
|
The accompanying notes are an integral part of these consolidated financial statements.
58
EMCORE CORPORATION
Consolidated Statements of Shareholders' Equity
For the
Fiscal Years
Ended
September 30, 2015
,
2014
, and
2013
(in thousands)
|
Shares of Common Stock
|
Value of Common Stock
|
Treasury Stock
|
Accumulated Other Comprehensive Income
|
Accumulated Deficit
|
Total Shareholders' Equity
|
||||||||||||||||||
|
Balance as of September 30, 2012
|
24,372
|
|
722,345
|
|
(2,071
|
)
|
1,376
|
|
(652,627
|
)
|
69,023
|
|
|||||||||||
|
Net income
|
—
|
|
—
|
|
—
|
|
4,988
|
|
4,988
|
|
|||||||||||||
|
Translation adjustment
|
—
|
|
—
|
|
247
|
|
—
|
|
247
|
|
|||||||||||||
|
Stock-based compensation
|
475
|
|
4,027
|
|
—
|
|
—
|
|
—
|
|
4,027
|
|
|||||||||||
|
Stock option exercises
|
79
|
|
395
|
|
—
|
|
—
|
|
—
|
|
395
|
|
|||||||||||
|
Issuance of common stock - ESPP
|
344
|
|
1,292
|
|
—
|
|
—
|
|
—
|
|
1,292
|
|
|||||||||||
|
Issuance of common stock - ODPP
|
5
|
|
18
|
|
—
|
|
—
|
|
—
|
|
18
|
|
|||||||||||
|
Issuance of common stock from stock sales
|
4,707
|
|
21,189
|
|
—
|
|
—
|
|
—
|
|
21,189
|
|
|||||||||||
|
Balance as of September 30, 2013
|
29,982
|
|
749,266
|
|
(2,071
|
)
|
1,623
|
|
(647,639
|
)
|
101,179
|
|
|||||||||||
|
Net income
|
—
|
|
—
|
|
—
|
|
4,852
|
|
4,852
|
|
|||||||||||||
|
Translation adjustment
|
—
|
|
—
|
|
214
|
|
—
|
|
214
|
|
|||||||||||||
|
Stock-based compensation
|
633
|
|
4,074
|
|
—
|
|
—
|
|
—
|
|
4,074
|
|
|||||||||||
|
Stock option exercises
|
120
|
|
573
|
|
—
|
|
—
|
|
—
|
|
573
|
|
|||||||||||
|
Issuance of common stock - ESPP
|
341
|
|
1,182
|
|
—
|
|
—
|
|
—
|
|
1,182
|
|
|||||||||||
|
Issuance of common stock - ODPP
|
2
|
|
8
|
|
—
|
|
—
|
|
—
|
|
8
|
|
|||||||||||
|
Issuance of common stock - Board of Directors
|
31
|
|
265
|
|
—
|
|
—
|
|
—
|
|
265
|
|
|||||||||||
|
Balance as of September 30, 2014
|
31,109
|
|
755,368
|
|
(2,071
|
)
|
1,837
|
|
(642,787
|
)
|
112,347
|
|
|||||||||||
|
Net income
|
—
|
|
—
|
|
—
|
|
63,100
|
|
63,100
|
|
|||||||||||||
|
Translation adjustment
|
—
|
|
—
|
|
(990
|
)
|
—
|
|
(990
|
)
|
|||||||||||||
|
Stock-based compensation
|
948
|
|
4,320
|
|
—
|
|
—
|
|
—
|
|
4,320
|
|
|||||||||||
|
Purchase of treasury stock
|
(6,870
|
)
|
—
|
|
(45,650
|
)
|
—
|
|
—
|
|
(45,650
|
)
|
|||||||||||
|
Stock option exercises
|
290
|
|
1,409
|
|
—
|
|
—
|
|
—
|
|
1,409
|
|
|||||||||||
|
Issuance of common stock - ESPP
|
121
|
|
493
|
|
—
|
|
—
|
|
—
|
|
493
|
|
|||||||||||
|
Issuance of common stock - Board of Directors
|
78
|
|
413
|
|
—
|
|
—
|
|
—
|
|
413
|
|
|||||||||||
|
Balance as of September 30, 2015
|
25,676
|
|
$
|
762,003
|
|
$
|
(47,721
|
)
|
$
|
847
|
|
$
|
(579,687
|
)
|
$
|
135,442
|
|
||||||
The accompanying notes are an integral part of these consolidated financial statements.
59
EMCORE CORPORATION
For the Fiscal Years Ended September 30, 2015, 2014 and 2013
(in thousands)
|
For the Fiscal Years Ended September 30,
|
|||||||||||
|
2015
|
2014
|
2013
|
|||||||||
|
Cash flows from operating activities:
|
|||||||||||
|
Net income
|
$
|
63,100
|
|
$
|
4,852
|
|
$
|
4,988
|
|
||
|
Adjustments to reconcile net income to net cash used in operating activities:
|
|||||||||||
|
Depreciation, amortization and accretion expense
|
2,952
|
|
8,518
|
|
8,688
|
|
|||||
|
Stock-based compensation expense
|
4,586
|
|
4,439
|
|
4,209
|
|
|||||
|
Deferred income taxes
|
24,080
|
|
(24,080
|
)
|
—
|
|
|||||
|
Gain on sale of Photovoltaics Business
|
(86,958
|
)
|
—
|
|
—
|
|
|||||
|
Gain on sale of Digital Products Business
|
(1,994
|
)
|
—
|
|
—
|
|
|||||
|
Gain on sale of an investment
|
—
|
|
(307
|
)
|
(4,800
|
)
|
|||||
|
Provision adjustments related to doubtful accounts
|
556
|
|
245
|
|
119
|
|
|||||
|
Provision adjustments related to product warranty
|
838
|
|
2,114
|
|
2,914
|
|
|||||
|
Provision for losses on inventory purchase commitments
|
—
|
|
306
|
|
—
|
|
|||||
|
Change in fair value of financial instruments
|
(122
|
)
|
(34
|
)
|
(515
|
)
|
|||||
|
Gain from change in estimate on ARO obligation
|
(845
|
)
|
—
|
|
—
|
|
|||||
|
Reclassification of foreign currency translation adjustment
|
(744
|
)
|
—
|
|
—
|
|
|||||
|
Net loss on disposal (gain) of equipment
|
237
|
|
(100
|
)
|
—
|
|
|||||
|
Settlement of customer related warranty claim
|
(442
|
)
|
—
|
|
—
|
|
|||||
|
Expiration of specific historical sales allowance
|
(345
|
)
|
—
|
|
—
|
|
|||||
|
Adjustments of unrecognized gross tax benefits
|
(207
|
)
|
—
|
|
—
|
|
|||||
|
Non-cash insurance proceeds
|
—
|
|
—
|
|
(16,134
|
)
|
|||||
|
Gain on sale of assets
|
—
|
|
—
|
|
(338
|
)
|
|||||
|
Total non-cash adjustments
|
(58,408
|
)
|
(8,899
|
)
|
(5,857
|
)
|
|||||
|
Changes in operating assets and liabilities:
|
|||||||||||
|
Accounts receivable
|
3,526
|
|
(3,290
|
)
|
(4,967
|
)
|
|||||
|
Inventory
|
(3,440
|
)
|
5,481
|
|
2,016
|
|
|||||
|
Other assets
|
359
|
|
2,879
|
|
5,370
|
|
|||||
|
Accounts payable
|
(3,231
|
)
|
3,113
|
|
(14,032
|
)
|
|||||
|
Accrued expenses and other current liabilities
|
(5,823
|
)
|
(3,135
|
)
|
(9,623
|
)
|
|||||
|
Total change in operating assets and liabilities
|
(8,609
|
)
|
5,048
|
|
(21,236
|
)
|
|||||
|
Net cash (used in) provided by operating activities
|
(3,917
|
)
|
1,001
|
|
(22,105
|
)
|
|||||
|
Cash flows from investing activities:
|
|||||||||||
|
Proceeds from sale of Photovoltaics Business
|
149,936
|
|
—
|
|
—
|
|
|||||
|
Proceeds from sale of Digital Products Business
|
16,982
|
|
—
|
|
—
|
|
|||||
|
Cash proceeds from sale of investment
|
—
|
|
307
|
|
—
|
|
|||||
|
Cash proceeds from sale of equity method investment
|
—
|
|
—
|
|
4,800
|
|
|||||
|
Purchase of equipment
|
(2,799
|
)
|
(3,001
|
)
|
(7,242
|
)
|
|||||
|
Deposits on equipment orders
|
—
|
|
—
|
|
(3
|
)
|
|||||
|
Flood-related insurance proceeds from equipment
|
—
|
|
—
|
|
5,373
|
|
|||||
|
Proceeds from sale of assets
|
—
|
|
—
|
|
1,150
|
|
|||||
|
Decrease (increase) in restricted cash
|
1,107
|
|
(667
|
)
|
(733
|
)
|
|||||
|
Proceeds from disposal of property, plant and equipment
|
50
|
|
100
|
|
484
|
|
|||||
|
Net cash provided by (used in) investing activities
|
165,276
|
|
(3,261
|
)
|
3,829
|
|
|||||
|
Cash flows from financing activities:
|
|||||||||||
|
Payments on credit facilities
|
(26,518
|
)
|
4,813
|
|
2,390
|
|
|||||
|
Repurchases of common stock
|
(45,650
|
)
|
—
|
|
—
|
|
|||||
|
Proceeds from sale of common stock
|
—
|
|
—
|
|
21,189
|
|
|||||
|
Proceeds from stock plans
|
1,902
|
|
1,763
|
|
1,705
|
|
|||||
|
Net cash (used in) provided by financing activities
|
(70,266
|
)
|
6,576
|
|
25,284
|
|
|||||
|
Effect of exchange rate changes on foreign currency
|
105
|
|
267
|
|
49
|
|
|||||
|
Net increase in cash and cash equivalents
|
91,198
|
|
4,583
|
|
7,057
|
|
|||||
|
Cash and cash equivalents at beginning of period
|
20,687
|
|
16,104
|
|
9,047
|
|
|||||
|
Cash and cash equivalents at end of period
|
$
|
111,885
|
|
$
|
20,687
|
|
$
|
16,104
|
|
||
60
EMCORE CORPORATION
Consolidated Statements of Cash Flows
For the Fiscal Years Ended September 30, 2015, 2014 and 2013
(in thousands)
|
For the Fiscal Years Ended September 30,
|
|||||||||||
|
2015
|
2014
|
2013
|
|||||||||
|
SUPPLEMENTAL DISCLOSURE OF CASH FLOW INFORMATION
|
|||||||||||
|
Cash paid during the period for interest
|
$
|
194
|
|
$
|
429
|
|
$
|
704
|
|
||
|
Cash paid during the period for income taxes
|
$
|
938
|
|
$
|
—
|
|
$
|
15
|
|
||
|
NON-CASH INVESTING AND FINANCING ACTIVITIES
|
|||||||||||
|
Forgiveness of capital lease and accounts payable
|
$
|
—
|
|
$
|
—
|
|
$
|
10,761
|
|
||
|
Changes in accounts payable related to purchases of equipment
|
$
|
514
|
|
$
|
—
|
|
$
|
—
|
|
||
The accompanying notes are an integral part of these consolidated financial statements.
61
EMCORE Corporation
Notes to our Consolidated Financial Statements
|
NOTE 1.
|
Description of Business
|
Business Overview
EMCORE Corporation and its subsidiaries (referred to herein as the “Company”, “we”, “our”, or “EMCORE”), established in 1984 as a New Jersey corporation, designs and manufactures Indium Phosphide (InP) optical chips, components, subsystems and systems for the broadband and specialty fiber optics market. EMCORE is a provider of optical components, as well complete end-to end solutions for high-speed communications network infrastructures enabling systems and service providers to meet growing demand for bandwidth and connectivity. EMCORE's advance optical technologies are designed for Cable Television (CATV), Fiber-To-The-Premises (FTTP) networks, telecommunications and data centers, satellite communications, aerospace and defense, wireless networks, and broadcast and professional audio/video systems. With its InP semiconductor wafer fabrication facility, EMCORE has fully vertically-integrated manufacturing capability and also provides contract design, foundry and component packaging services.
We currently have
one
reporting segment: Fiber Optics. Until the first quarter of 2015, we operated as two segments: Fiber Optics and Photovoltaics. EMCORE's Solar Photovoltaics business, which was sold in December 2014, provided products for space power applications including high-efficiency multi-junction solar cells, Covered Interconnect Cells and complete satellite solar panels. In addition, EMCORE sold certain assets, and transferred certain liabilities, of the Company's telecommunications business, including the ITLA, micro-ITLA, T-TOSA and T-XFP product lines within the Company’s telecommunications business in January 2015. In addition to organic growth and development of our existing Fiber Optics market, we intend to pursue other strategies to enhance shareholder value, which may include acquisitions, investments in joint ventures, partnerships, and other strategic alternatives, such as dispositions, reorganizations, recapitalizations or other similar transactions. Accordingly, the Strategy Committee of the Board of Directors and our management may from time to time be engaged in evaluating potential strategic opportunities and may enter into definitive agreements with respect to, such transactions or other strategic alternatives.
Sale of Photovoltaics and Digital Products Businesses
On
September 17, 2014
, EMCORE entered into an Asset Purchase Agreement (the “Photovoltaics Agreement”) with SolAero Technologies Corporation ("SolAero") (formerly known as Photon Acquisition Corporation) pursuant to which SolAero agreed to acquire substantially all of the assets, and assume substantially all of the liabilities, primarily related to or used in connection with the Company's photovoltaics business, including EMCORE's subsidiaries EMCORE Solar Power, Inc. and EMCORE IRB Company, LLC (collectively, the "Photovoltaics Business" and, the sale of the Photovoltaics Business, the "Photovoltaics Asset Sale") for
$150.0 million
in cash, prior to a
$0.1 million
working capital adjustment pursuant to the Photovoltaics Agreement finalized and paid by EMCORE during the fiscal year ended
September 30, 2015
. On
December 10, 2014
, EMCORE completed the Photovoltaics Asset Sale.
On
October 22, 2014
, EMCORE entered into an Asset Purchase Agreement (the "Digital Products Agreement") with NeoPhotonics Corporation, a Delaware corporation ("NeoPhotonics"), pursuant to which the Company agreed to sell certain assets, and transfer certain liabilities, of the Company's telecommunications business (collectively, the "Digital Products Business" and, the sale of the Digital Products Business, the "Digital Products Assets Sale") to NeoPhotonics for an aggregate purchase price of
$17.5 million
, subject to certain adjustments, consisting of
$1.5 million
in cash at closing and a promissory note in the principal amount of
$16.0 million
(the "Promissory Note").
On
January 2, 2015
, EMCORE and NeoPhotonics entered into Amendment No. 1 (the "APA Amendment") to the Digital Products Agreement dated
October 22, 2014
. Among other things, the APA Amendment revised the nature and timing of the financial deliverable requirements of the Company to NeoPhotonics under the original Digital Products Agreement. The assets sold pursuant to the Digital Products Agreement included certain fixed assets, inventory, accounts receivable and intellectual property for the ITLA, micro-ITLA, T-TOSA and T-XFP product lines within the Company’s telecommunications business. On
January 2, 2015
, EMCORE completed the sale of the Digital Products Business. On
April 16, 2015
, EMCORE and NeoPhotonics entered into an agreement to adjust the purchase price resulting in an adjusted balance of the Promissory Note of
$15.5 million
. On
April 17, 2015
, NeoPhotonics paid in full the outstanding balance of the Promissory Note of
$15.5 million
, plus accrued interest of
$0.2 million
.
62
The Photovoltaics Asset Sale and Digital Products Asset Sale are reported as discontinued operations. Also see
Note 2 - Summary of Significant Accounting Policies
and
Note 4 - Discontinued Operations.
Sale of Fiber Optics-related Assets
On March 27, 2012, we entered into a Master Purchase Agreement with a subsidiary of Sumitomo Electric Industries, LTD (SEI), pursuant to which we agreed to sell certain assets and transfer certain obligations associated with our Fiber Optics business. On May 7, 2012, we completed the sale of these assets to SEI and recorded a gain of approximately
$2.8 million
. Under the terms of the Master Purchase Agreement, we agreed to indemnify SEI for up to
$3.4 million
of potential claims and expenses for the
two
-year period following the sale and we recorded this amount as a deferred gain on our balance sheet as of
September 30, 2015
and
2014
. SEI paid
$13.1 million
in cash and deposited approximately
$2.6 million
into escrow as security for indemnification obligations and any purchase price adjustments. During the fiscal year ended September 30, 2013, we resolved the purchase price contingencies resulting in the reduction of the purchase price by
$1.1 million
. The reduced purchase price is recorded as an offset to the escrow receivable of
$2.6 million
. There remains a deferred gain of
$3.4 million
related to our indemnification obligation to SEI and an escrow receivable of
$1.9 million
as of
September 30, 2015
, as claims were made under the Master Purchase Agreement against these balances prior to the end of the indemnification period in May 2014. We are not able to determine at this time the outcome of any potential settlements associated with the remaining claims and as a result have not recorded any related adjustments to the deferred gain amount.
In May 2012, we also entered into a separate facility lease and transition services agreement (TSA) with SEI related to financial services, supply chain, facility, and information infrastructure support functions to be provided by us. We believe the values assigned to the facility lease and TSA approximate fair value. During the fiscal years ended
September 30, 2014
and
2013
, we recognized
$3.3 million
and
$2.8 million
, respectively, related to TSA fees and facility rental income which was recorded as a benefit against operating expenses incurred for such services in discontinued operations.
The TSA included a
$0.5 million
credit to be applied against fees earned by Emcore over a twelve-month period through May 2013. We also incurred
$0.6 million
in expenses directly associated with this transaction. The TSA credit and transaction-related expenses incurred were applied against the proceeds received in determination of the gain recognized during the fiscal year ended September 30, 2012.
Liquidity and Capital Resources
Historically, we have consumed cash from operations and incurred significant net losses. We have managed our liquidity position through sale of assets, a series of cost reduction initiatives, borrowings from our credit facility and capital markets transactions.
On
June 15, 2015
, we completed the modified "Dutch auction" tender offer (the "Tender Offer") and purchased
6.9 million
shares of our common stock at a purchase price of
$6.55
per share, for an aggregate cost of
$45.0 million
excluding fees and expenses. Repurchased common stock was recorded to treasury stock. The Company incurred costs of
$0.7 million
in connection with the Tender Offer, which were recorded to treasury stock.
As of
September 30, 2015
, cash and cash equivalents totaled
$111.9 million
and net working capital totaled approximately
$128.0 million
. Net working capital, calculated as current assets minus current liabilities, is a financial metric we use which represents available operating liquidity. For the fiscal year ended
September 30, 2015
, we earned net income of
$63.1 million
.
For the fiscal year ended September 30, 2015, the following changes to our liquidity occurred:
|
•
|
Sale of Photovoltaics Business
: On
December 10, 2014
, we completed the sale of our Photovoltaics Business for
$150.0 million
in cash prior to working capital adjustments of
$0.1 million
. We believe these proceeds will provide us with working capital for fiscal year 2016 and beyond.
|
|
•
|
Sale of Digital Products Business
: On
January 2, 2015
, we completed the sale of our Digital Products Business for
$1.5 million
in cash and an adjusted Promissory Note balance of
$15.5 million
. On
April 17, 2015
, NeoPhotonics paid in full the outstanding balance of the Promissory Note of
$15.5 million
, plus accrued interest of
$0.2 million
.
|
63
|
•
|
Credit Facility
: On November 11, 2010, we entered into a Credit and Security Agreement (credit facility) with Wells Fargo Bank, National Association ("Wells Fargo"). The credit facility, as it has been amended through its seventh amendment, currently provides us with a revolving credit of up to
$15.0 million
through
November 2018
that can be used for working capital requirements, letters of credit, and other general corporate purposes. The credit facility is secured by the Company's assets and is subject to a borrowing base formula based on the Company's eligible accounts receivable, inventory, and machinery and equipment accounts.
|
On
December 3, 2014
, we entered into a Sixth Amendment to the credit facility, pursuant to which Wells Fargo agrees, to automatically release all encumbrances covering certain of the Company’s assets to be sold pursuant to the Photovoltaics Agreement and the Digital Products Agreement. In addition, on
December 10, 2014
upon notice to Wells Fargo of the closing of the transaction contemplated by the Photovoltaics Agreement, the maximum borrowing allowed under the credit facility was reduced from
$35.0 million
to
$15.0 million
, and certain other changes to the borrowing base calculations went into effect. As of
September 30, 2015
, there were no amounts outstanding under the credit facility and the Company was in compliance with all financial covenants. As of
September 30, 2015
, the credit facility had approximately
$0.9 million
reserved for
three
stand-by letters of credit, leaving a remaining
$8.6 million
of borrowing available under the credit facility. As of
December 14, 2015
, there was no outstanding balance under this credit facility.
On
November 10, 2015
, we entered into a Seventh Amendment of the credit facility which extended the maturity date of the facility to
November 2018
, and adjusted the interest rate to LIBOR plus
2.5%
.
|
NOTE 2.
|
Summary of Significant Accounting Policies
|
Principles of Consolidation
: Our consolidated financial statements have been prepared in accordance with accounting principles generally accepted in the United States of America (U.S. GAAP) and include the assets, liabilities, shareholders' equity, and operating results of the Company and its wholly owned subsidiaries. All significant intercompany accounts and transactions have been eliminated in consolidation. We are not the primary beneficiary of, nor do we hold a significant variable interest in, any variable interest entity.
Prior Period Reclassifications
: On
December 10, 2014
, we sold our Photovoltaics business to SolAero. On
January 2, 2015
, we sold our Digital Products Business to NeoPhotonics. The Photovoltaics Asset Sale and Digital Asset Sale are reported as discontinued operations, which require retrospective restatement of prior periods to classify the results of operations as discontinued operations. We have also reclassified the assets and liabilities that were sold to "assets of discontinued operations" and "liabilities of discontinued operations" within current and non-current assets and liabilities, respectively, on the consolidated balance sheet as of
September 30, 2014
. No Photovoltaics or Digital Products assets or liabilities that were sold remain on the consolidated balance sheet as of
September 30, 2015
. The financial results of the Photovoltaics Business and the Digital Products Business are presented as "discontinued operations" on the consolidated statements of operations and comprehensive income for the fiscal years ended
September 30, 2015
,
2014
and
2013
. See
Note 4 - Discontinued Operations
for additional information. The notes to our consolidated financial statements relate to our continuing operations only, unless otherwise indicated.
Reclassification of prior period amounts related to discontinued operations as a result of the sale of the Photovoltaics and Digital Products Businesses have been made to conform to the current period financial statement presentation. There were no other reclassifications expect for amounts related to discontinued operations.
Use of Estimates
: The preparation of consolidated financial statements in conformity with U.S. GAAP requires us to make estimates and assumptions that affect the reported amounts of assets and liabilities and disclosure of contingent assets and liabilities, as of the date of the financial statements, and the reported amounts of revenue and expenses during the reported period. The accounting estimates that require our most significant, difficult, and/or subjective judgments include:
|
•
|
the valuation of inventory, intangible assets, warrants and stock-based compensation;
|
|
•
|
the useful lives of assets and assessment of recovery of long-lived assets;
|
|
•
|
asset retirement obligations and contingencies, including litigation and indemnification-related;
|
|
•
|
the allowance for doubtful accounts and warranty accruals; and,
|
|
•
|
the valuation allowance for deferred tax assets.
|
64
We develop estimates based on historical experience and on various assumptions about the future that are believed to be reasonable based on the best information available to us. Our reported financial position or results of operations may be materially different under changed conditions or when using different estimates and assumptions, particularly with respect to significant accounting policies. In the event that estimates or assumptions prove to differ from actual results, adjustments are made in subsequent periods to reflect more current information.
Concentration of Credit Risk
: Financial instruments that may subject us to concentrations of credit risk consist primarily of cash and cash equivalents and accounts receivable. Our cash and cash equivalents are held in safekeeping primarily with Wells Fargo. When necessary, we perform credit evaluations on our customers' financial condition and occasionally we request deposits in advance of shipping product to our customers. These financial evaluations require significant judgment and are based on a variety of factors including, but not limited to, current economic trends, historical payment patterns, bad debt write-off experience, and financial review of the particular customer.
Cash and Cash Equivalents
: Cash and cash equivalents consists primarily of bank deposits and highly liquid short-term investments with a maturity of three months or less at the time of purchase.
Restricted Cash
: Restricted cash represents recently deposited cash that is temporarily restricted by our bank in accordance with the terms of the outstanding credit facility.
Accounts Receivable
: We regularly evaluate the collectability of our accounts receivable and maintain allowances for doubtful accounts for estimated losses resulting from the inability of our customers to meet their financial obligations to us. The allowance is based on the age of receivables and a specific identification of receivables considered at risk of collection. We classify charges associated with the allowance for doubtful accounts as selling, general, and administrative expense.
Inventory
: Inventory is stated at the lower of cost or market, with cost being determined using the standard cost method that includes material, labor, and manufacturing overhead costs, which approximates weighted average cost. We write-down inventory once it has been determined that conditions exist that may not allow the inventory to be sold for its intended purpose or the inventory is determined to be excess or obsolete based on our forecasted future sales. The charge related to inventory write-downs is recorded as a cost of revenue. The majority of the inventory write-downs are related to inventory whose carrying value is in excess of net realizable value and on excess raw material components resulting from finished product obsolescence. We do not track the selling price of individual raw material components that have been previously written down or written off, since such raw material components usually are only a portion of the finished products and related sales price. We evaluate inventory levels at least quarterly against sales forecasts on a significant part-by-part basis, in addition to determining its overall inventory risk. We have incurred, and may in the future incur charges to write-down our inventory.
Property, Plant, and Equipment
: Our property, plant, and equipment are recorded at cost. Plant and equipment are depreciated on a straight-line basis over the following estimated useful lives of the assets:
|
Estimated Useful Life
|
||
|
Equipment
|
—
|
three to ten years
|
|
Furniture and fixtures
|
—
|
five years
|
|
Computer hardware and software
|
—
|
five to seven years
|
|
Leasehold improvements
|
—
|
three to six years
|
Leasehold improvements are amortized over the lesser of the asset life or the lease term. Expenditures for repairs and maintenance are charged to expense as incurred. The costs for major renewals and improvements are capitalized and depreciated over their estimated useful lives of the related asset. The cost and related accumulated depreciation of the assets are removed from the accounts upon disposition and any resulting gain or loss is reflected in the consolidated statement of operations and comprehensive income.
Other intangible assets
: Our intangible assets consists primarily of intellectual property that has been internally-developed or acquired. Acquired intangible assets include core technology, trademarks and trade names, and customer contracts. Intangible assets are amortized using the straight-line method over estimated useful lives that could range up to fifteen years.
65
Valuation of Long-lived Assets
: Long-lived assets consist primarily of property, plant, and equipment, net and intangible assets. Since our long-lived assets are subject to amortization, we review these assets for impairment in accordance with the provisions of Accounting Standards Codification ("ASC") 360,
Property, Plant, and Equipment.
We review long-lived assets for impairment whenever events or changes in circumstances indicate that its carrying amount may not be recoverable. Our impairment testing of long-lived assets consists of determining whether the carrying amount of the long-lived asset (asset group) is recoverable, in other words, whether the sum of the future undiscounted cash flows expected to result from the use and eventual disposition of the asset (asset group) exceeds its carrying amount. The determination of the existence of impairment involves judgments that are subjective in nature and may require the use of estimates in forecasting future results and cash flows related to an asset or group of assets. In making this determination, we use certain assumptions, including estimates of future cash flows expected to be generated by these assets, which are based on additional assumptions such as asset utilization, the length of service that assets will be used in our operations, and estimated salvage values.
Asset Retirement and Environmental Obligations
: Pursuant to ASC 410,
Asset Retirement and Environmental Obligations
, an asset retirement obligation is recorded when there is a legal obligation associated with the retirement of a tangible long-lived asset and the fair value of the liability can reasonably be estimated. Upon initial recognition of an asset retirement obligation, a company increases the carrying amount of the long-lived asset by the same amount as the liability. Over time, the liabilities are accreted for the change in their present value through charges to operations costs. The initial capitalized costs are depleted over the useful lives of the related assets through charges to depreciation, and/or amortization. If the fair value of the estimated asset retirement obligation changes, an adjustment is recorded to both the asset retirement obligation and the asset retirement cost. Revisions in estimated liabilities can result from revisions of estimated inflation rates, escalating retirement costs, and changes in the estimated timing of settling asset retirement obligations.
We have known asset retirement conditions, such as certain asset decommissioning and restoration of rented facilities to be performed in the future. We previously completed a review of our asset retirement and environmental obligations and we recorded an asset retirement obligation with an offset to fixed assets totaling
$1.8 million
and
$4.5 million
as of
September 30, 2015
and
2014
, respectively. See
Note 14 - Commitments and Contingencie
s for additional information.
Fair Value of Financial Instruments
: We determine the fair value of our financial instruments in accordance with ASC 820,
Fair Value Measurements and Disclosures.
Equity investments
: We accounted for our equity investment in our Suncore Photovoltaic Technology Co., Ltd. ("Suncore") joint venture in accordance with ASC 323,
Investments - Equity Method and Joint Ventures
. An equity investment, in which we exercised significant influence but did not control and were not the primary beneficiary, was accounted for using the equity method. We regularly reviewed our investment to determine whether a decline in fair value below the cost basis was other than temporary. In our opinion, neither San'an Optoelectronics Co., Ltd. ("San'an") nor EMCORE held a controlling financial interest in Suncore because neither party had exclusive authority over decision-making related to significant ordinary course of business actions such as establishing a budget, compensation, and the hiring and firing of certain executive personnel. In June 2013, we entered into an agreement to sell our
40%
registered ownership interest in Suncore to San'An for a purchase price of
$4.8 million
. The sale closed during the fourth quarter of fiscal 2013. S
ee Note 4 - Discontinued Operations
for additional information.
Revenue Recognition
: Revenue is recognized upon shipment, provided persuasive evidence of a contract exists, the price is fixed, the product meets our customer's specifications, title and ownership have transferred to the customer, and there is reasonable assurance of collection of the sales proceeds. The majority of our products have shipping terms that are free on board or free carrier alongside (FCA) shipping point, which means that we fulfill our delivery obligation when the goods are handed over to the freight carrier at our shipping dock. This means the customer bears all costs and risks of loss or damage to the goods from that point. In certain cases, we pay for the cost of shipping and insurance to the customer's designated location but we invoice those costs to the customer. Under this arrangement, revenue is recognized under FCA shipping point terms. We account for shipping and related transportation costs by recording the charges that are invoiced to customers as revenue, with the corresponding cost recorded as cost of revenue. In those instances where inventory is maintained at a consigned location, revenue is recognized only when our customer pulls product for use and after title and ownership has transferred to the customer. Any warranty cost and remaining obligations that are inconsequential or perfunctory are accrued when the corresponding revenue is recognized.
Distributors:
We use a number of distributors around the world and recognize revenue upon shipment of product to these distributors. Title and risk of loss pass to the distributors upon shipment, and our distributors are contractually obligated to pay us on standard commercial terms, just like direct customers. We do not sell to our distributors on consignment and, except in the event of product discontinuance, do not give distributors a right of return.
66
Contract Manufacturers:
Prior to certain customers accepting product that is manufactured at one of our contract manufacturers, these customers require that they first qualify the product and manufacturing processes at our contract manufacturer. The customers' qualification process determines whether the product manufactured at our contract manufacturer achieves their quality, performance, and reliability standards. After a customer completes the initial qualification process, we receive approval to ship qualified product to that customer. As part of the manufacturing process at our contract manufacturers, the finished product is tested prior to shipment to the customer using the same criteria that our customer uses to test product it receives. Revenue is recognized upon shipment of customer-qualified product, provided persuasive evidence of a contract exists, the price is fixed, the product meets our customer's specifications, title and ownership have transferred to the customer, and there is reasonable assurance of collection of the sales proceeds.
Product Warranty Reserves
: We provide our customers with limited rights of return for non-conforming shipments and warranty claims for certain products. Pursuant to ASC 450,
Contingencies,
we make estimates of product warranty expense using historical experience rates as a percentage of revenue and accrue estimated warranty expense as a cost of revenue. We estimate the costs of our warranty obligations based on historical experience of known product failure rates and anticipated rates of warranty claims, use of materials to repair or replace defective products, and service delivery costs incurred in correcting product issues. In addition, from time to time, specific warranty accruals may be made if unforeseen technical problems arise. Should our actual experience relative to these factors differ from our estimates, we may be required to record additional warranty reserves. Alternatively, if we provide more reserves than needed, we may reverse a portion of such provisions in future periods.
Litigation Contingencies
: We are subject to various legal proceedings, claims, and litigation, either asserted or unasserted that arise in the ordinary course of business. Professional legal fees are expensed when incurred. We accrue for contingent losses when such losses are probable and reasonably estimable. In the event that estimates or assumptions prove to differ from actual results, adjustments are made in subsequent periods to reflect more current information. Should we fail to prevail in any legal matter or should several legal matters be resolved against the Company in the same reporting period, then the financial results of that particular reporting period could be materially affected.
Research and Development
: Research and development costs are charged as an expense when incurred.
Stock-Based Compensation
: Stock-based compensation expense is measured at the stock option grant date, based on the fair value of the award, and is recorded to cost of revenue, sales, general, and administrative, and research and development expense based on an employee's responsibility and function over the requisite service period. We use the Black-Scholes option-pricing model and the straight-line attribution approach to determine the fair value of stock-based awards in accordance with ASC 718,
Compensation.
This option-pricing model requires the input of highly subjective assumptions, including the option's expected life, the price volatility and risk-free interest rate of the underlying stock, and expected forfeitures.
Insurance Recoveries
: Insurance recoveries related to impairment losses previously recorded and other recoverable expenses will be recognized up to the amount of our related loss or expense in the period that recoveries become realizable. Insurance recoveries under business interruption coverage and insurance gains in excess of amounts previously written off related to impaired inventory and equipment or in excess of other recoverable expenses previously recognized will be recognized when they become realizable and all contingencies have been resolved. The evaluation of insurance recoveries requires estimates and judgments about future results which affect reported amounts and certain disclosures. Actual results could differ from those estimates. As of
September 30, 2015
, we do not expect to receive any further insurance recoveries.
Foreign Exchange
: We recognize gains and losses due to the effect of exchange rate changes on foreign currency primarily due to our operations in China. The assets and liabilities of our foreign operations are translated from their respective functional currencies into U.S. dollars at the rates in effect at the consolidated balance sheet dates, and the revenue and expense amounts are translated at the average rate during the applicable periods reflected on the consolidated statements of operations and comprehensive income. Foreign currency translation adjustments are recorded as other comprehensive income. Gains and losses from foreign currency transactions denominated in currencies other than the U.S. dollar, both realized and unrealized, are recorded as foreign exchange (loss) gain on our consolidated statements of operations and comprehensive income.
Income Taxes
: In accordance with ASC 740,
Income Taxes,
deferred tax assets and liabilities are recognized for the expected tax consequences of temporary differences between the tax bases of assets and liabilities and their reported amounts. We record valuation allowances against all deferred tax assets for amounts which are not considered more likely to be realized.
67
Comprehensive Income
: ASC 220,
Comprehensive Income
, establishes standards for reporting and display of comprehensive income and its components in financial statements. It requires that all items that are required to be recognized under accounting standards as components of comprehensive income be reported in the financial statement that is displayed with the same prominence as other financial statements. Our comprehensive income consists of both net income and foreign currency translation adjustments and it is presented in the accompanying consolidated statements of operations and comprehensive income.
Income (Loss) Per Share
: We are required, in periods in which we have net income, to calculate basic and diluted income per share using the two-class method. The two-class method is required because our unvested restricted stock awards are considered participating securities as these securities have the right to receive dividends or dividend equivalents should we declare dividends on our common stock. Under the two-class method, during periods of net income, net income is first reduced for distributions declared on all classes of securities to arrive at undistributed earnings. The undistributed earnings are then allocated on a pro-rata basis between the common shareholders and participating securities holders. The weighted-average number of common shares and participating securities outstanding during the period is then used to calculate basic and diluted income per share.
In periods in which we have a net loss, basic loss per share is calculated by dividing the loss attributable to common shareholders by the weighted-average number of common shares outstanding during the period.
|
NOTE 3.
|
Recent Accounting Pronouncements
|
There have been no recent accounting pronouncements or changes in accounting pronouncements that are of significance, or of potential significance, to us other than those discussed below:
|
•
|
In April 2014, the Financial Accounting Standards Board ("FASB") issued Accounting Standards Update ("ASU") 2014-08,
Presentation
of
Financial Statements (Topic 205) and Property, Plant, and Equipment (Topic 360) Reporting Discontinued Operations and Disclosures of Disposals of Components of an Entity
. This standard changes the criteria for reporting discontinued operations. Under the accounting standard update, a disposal of a component of an entity or a group of components of an entity is required to be reported in discontinued operations if the disposal represents a strategic shift that has, or will have, a major effect on an entity's operations and financial results when either it qualifies as held for sale, disposed of by sale, or disposed of other than by sale. In addition, the new guidance requires expanded disclosures about discontinued operations that will provide financial statement users with more information about the assets, liabilities, income, and expenses of discontinued operations. While early adoption is allowed, we have determined that we would not early adopt and as a result this accounting standard update will be effective for our fiscal year beginning on October 1, 2015. We do not expect the adoption of this standard to have a material impact on our Consolidated Financial Statements.
|
|
•
|
In May 2014, as part of its ongoing efforts to assist in the convergence of U.S. GAAP and International Financial Reporting Standards, the FASB issued ASU No. 2014-09,
Revenue from Contracts with Customers,
which requires an entity to recognize the amount of revenue to which it expects to be entitled for the transfer of promised goods or services to customers. Under the new standard, recognition of revenue occurs the seller satisfies a performance obligation by transferring to the customer promised goods or services in an amount that reflects the consideration to which the entity expects to receive in exchange for those goods or services. In addition, the standard requires disclosure of the nature, amount, timing, and uncertainty of revenue and cash flows arising from contracts with customers. In August, 2015, the FASB issued ASU No. 2015-14,
Revenue from Contracts with Customers
to defer the effective date of implementation by one year. The new standard will be effective for us beginning October 1, 2018 and early adoption is permitted as of October 1, 2017. The standard permits the use of either the retrospective or cumulative effect transition method. We anticipate this standard will not have a material impact on our Consolidated Financial Statements.
|
|
•
|
In August 2014, the FASB issued ASU 2014-15,
Presentation of Financial Statements-Going Concern (Subtopic 205-40): Disclosure of Uncertainties about an Entity's Ability to Continue as a Going Concern
. The standard provides guidance on determining when and how to disclose going-concern uncertainties in the financial statements. In addition, the standard requires management to perform interim and annual assessments of an entity’s ability to continue as a going concern within one year of the date the financial statements are issued. The guidance is effective for annual periods ending after December 15, 2016, and interim periods thereafter, with early adoption permitted. This accounting standard update will be effective for our fiscal year beginning October 1, 2017. We are currently evaluating the impact of this accounting standard update on our Consolidated Financial Statements.
|
68
|
•
|
In July 2015, the FASB issued ASU 2015-11, Inventory (Topic 330):
Simplifying the Measurement of Inventory
. The standard simplifies the subsequent measurement of inventory. This standard requires inventory to be measured at the lower of cost and net realizable value and applies only to inventories for which cost is determined by methods other than last-in-first-out and the retail inventory method. Under this guidance, net realizable value is one of several calculations an entity needs to make to measure inventory at lower of cost or market. The guidance is effective for fiscal years beginning after December 15, 2016 and interim periods within those fiscal years. Early adoption is permitted. The new standard will be effective for our fiscal year beginning October 1, 2017. We are currently evaluating the impact of this accounting standard update on our Consolidated Financial Statements.
|
|
•
|
In November 2015, the FASB issued ASU 2015-17, Income Taxes (Topic 740):
Balance Sheet Classification of Deferred Taxes.
Under this guidance, organizations that present a classified balance sheet are required to classify all deferred taxes as non-current assets or non-current liabilities. The guidance is effective for fiscal years beginning after December 15, 2017 and interim periods within those fiscal years. The new standard will be effective for our fiscal year beginning October 1, 2018 and early adoption is permitted. We are currently evaluating the impact of this accounting standard update on our Consolidated Financial Statements.
|
|
NOTE 4.
|
Discontinued Operations
|
Sale of Photovoltaics Business
On
September 17, 2014
, EMCORE entered into the Photovoltaics Agreement with SolAero pursuant to which the Company agreed to sell the Photovoltaics Business for
$150.0 million
in cash, subject to a working capital adjustment. On
December 10, 2014
, EMCORE completed the Photovoltaics Asset Sale.
The financial results of the Photovoltaics Business are reported as discontinued operations for the fiscal years ended
September 30,
2015
,
2014
and
2013
, respectively. In connection with this transaction, we sold net assets of
$60.3 million
to SolAero and incurred transaction costs of
$2.7 million
. During the fiscal year ended
September 30, 2015
, we recognized a gain of
$56.8 million
, net of tax on the sale of the Photovoltaics Business which is recorded within discontinued operations in the consolidated statements of operations and comprehensive income. During the fiscal year ended
September 30, 2015
, we made a payment of
$0.1 million
to SolAero to complete the working capital adjustment under the Photovoltaic Agreement. During the fiscal year ended
September 30, 2015
, we recognized gains of
$0.4 million
associated with the settlement of outstanding obligations on retained product warranties associated with the Photovoltaics Business.
We have classified the assets and liabilities that were sold as "assets of discontinued operations" and "liabilities of discontinued operations" within current and non-current assets and liabilities, respectively, on the consolidated balance sheets as of
September 30, 2014
. As of
September 30, 2014
, the carrying amount of goodwill related to the Photovoltaics Business was
$20.4 million
and this balance was reclassified to non-current assets of discontinued operations. No assets and liabilities of the Photovoltaics Business that were sold remain on the consolidated balance sheet as of
September 30, 2015
.
69
The following table presents the aggregate carrying amounts of the major classes of assets and liabilities related to the Photovoltaics Business as of
September 30, 2015
and
2014
:
|
As of
|
As of
|
||||||
|
(in thousands)
|
September 30,
2015 |
September 30,
2014 |
|||||
|
Assets of discontinued operations:
|
|||||||
|
Accounts receivable, net of allowance of $0
|
$
|
—
|
|
$
|
17,827
|
|
|
|
Inventory
|
—
|
|
7,203
|
|
|||
|
Prepaid expenses and other current assets
|
—
|
|
1,512
|
|
|||
|
Current assets of discontinued operations
|
—
|
|
26,542
|
|
|||
|
Property, plant and equipment, net
|
—
|
|
26,660
|
|
|||
|
Goodwill
|
—
|
|
20,384
|
|
|||
|
Other non-current assets, net
|
—
|
|
254
|
|
|||
|
Non-current assets of discontinued operations
|
—
|
|
47,298
|
|
|||
|
Total assets of discontinued operations
|
$
|
—
|
|
$
|
73,840
|
|
|
|
Liabilities of discontinued operations:
|
|||||||
|
Accounts payable
|
$
|
—
|
|
$
|
4,640
|
|
|
|
Accrued expenses and other current liabilities
|
—
|
|
5,398
|
|
|||
|
Current liabilities of discontinued operations
|
—
|
|
10,038
|
|
|||
|
Asset retirement obligations
|
—
|
|
720
|
|
|||
|
Non-current liabilities of discontinued operations
|
—
|
|
720
|
|
|||
|
Total liabilities of discontinued operations
|
$
|
—
|
|
$
|
10,758
|
|
|
The following table presents the statements of operations for the discontinued operations of the Photovoltaics Business:
|
For the Fiscal Years Ended September 30,
|
|||||||||||
|
(in thousands)
|
2015
|
2014
|
2013
|
||||||||
|
Revenue
|
$
|
12,614
|
|
$
|
73,226
|
|
$
|
71,170
|
|
||
|
Cost of revenue
|
8,245
|
|
52,317
|
|
52,806
|
|
|||||
|
Gross profit
|
4,369
|
|
20,909
|
|
18,364
|
|
|||||
|
Operating expense
|
2,240
|
|
6,654
|
|
5,107
|
|
|||||
|
Other income
|
779
|
|
17
|
|
90
|
|
|||||
|
Gain on sale of equity method investment
|
—
|
|
—
|
|
4,800
|
|
|||||
|
Gain on sale of discontinued operations
|
86,958
|
|
—
|
|
—
|
|
|||||
|
Income from discontinued operations before income tax
|
89,866
|
|
14,272
|
|
18,147
|
|
|||||
|
Income tax expense
|
(28,700
|
)
|
(5,412
|
)
|
(4,536
|
)
|
|||||
|
Income from discontinued operations, net of tax
|
$
|
61,166
|
|
$
|
8,860
|
|
$
|
13,611
|
|
||
In March 2013, we sold certain solar assets and our ownership interest in Emcore Solar New Mexico (“ESNM”) to Suncore for
$1.5 million
. In June 2013, we entered into an agreement to transfer our
40%
registered ownership interest in Suncore to San'an for a purchase price of
$4.8 million
. Upon completion of the share transfer, the Company recognized
$3.3 million
of deferred revenue from Suncore as well as the resulting gain of
$4.8 million
on our registered ownership interest which was recorded within discontinued operations.
70
Sale of Digital Products Business
On
October 22, 2014
, EMCORE entered into the Digital Products Agreement with NeoPhotonics pursuant to which the Company agreed to sell certain assets, and transferred certain liabilities of the Company's Digital Products Business to NeoPhotonics for an aggregate purchase price of
$17.5 million
, subject to certain purchase price adjustments, consisting of
$1.5 million
in cash at closing and the Promissory Note. The Promissory Note provided that it would bear interest of
5.0%
per annum for the first year and
13.0%
per annum for the second year, payable semi-annually in cash, and would mature two years from the closing of the transaction. In addition, the Promissory Note was subject to prepayments under certain circumstances, and is secured by certain of the assets sold to NeoPhotonics in the transaction.
On
January 2, 2015
, EMCORE and NeoPhotonics entered into the APA Amendment. Among other things, the APA Amendment revised the nature and timing of the financial deliverable requirements of the Company to NeoPhotonics under the original Digital Products Agreement. The assets sold pursuant to the Digital Products Agreement included certain fixed assets, inventory, accounts receivable and intellectual property for the ITLA, micro-ITLA, T-TOSA and T-XFP product lines within the Company’s telecommunications business. On
January 2, 2015
, EMCORE completed the sale of the Digital Products Business. On
April 16, 2015
, EMCORE and NeoPhotonics entered into an agreement to adjust the purchase price resulting in an adjusted balance of the Promissory Note of
$15.5 million
. On
April 17, 2015
, NeoPhotonics paid in full the outstanding balance of the Promissory Note of
$15.5 million
, plus accrued interest of
$0.2 million
.
The financial results of the Digital Products Business are reported as discontinued operations for the fiscal years ended
September 30, 2015
,
2014
and
2013
. In connection with this transaction, we sold net assets of
$13.3 million
to NeoPhotonics and incurred transaction costs of
$1.6 million
. During the fiscal year ended
September 30, 2015
, we recognized a gain of
$2.0 million
on the sale of the Digital Products Business which is recorded within discontinued operations in the consolidated statements of operations and comprehensive income.
We have classified the assets and liabilities that were sold within the descriptions "assets of discontinued operations" and "liabilities of discontinued operations" within current and non-current assets and liabilities, respectively, on the consolidated balance sheet as of
September 30, 2014
. No assets or liabilities from the Digital Products Business remain on the consolidated balance sheet as of
September 30, 2015
.
The following table presents the aggregate carrying amounts of the major classes of assets and liabilities related to the Digital Products Business as of
September 30, 2015
and
2014
:
|
As of
|
As of
|
||||||
|
(in thousands)
|
September 30,
2015 |
September 30,
2014 |
|||||
|
Assets held for sale:
|
|||||||
|
Accounts receivable, net of allowance of $0 and $17, respectively
|
$
|
—
|
|
$
|
14,268
|
|
|
|
Inventory
|
—
|
|
3,225
|
|
|||
|
Prepaid expenses and other current assets
|
—
|
|
30
|
|
|||
|
Current assets of discontinued operations
|
—
|
|
17,523
|
|
|||
|
Property, plant and equipment, net
|
—
|
|
7,881
|
|
|||
|
Other intangible assets, net
|
—
|
|
1,060
|
|
|||
|
Non-current assets of discontinued operations
|
—
|
|
8,941
|
|
|||
|
Total assets of discontinued operations
|
$
|
—
|
|
$
|
26,464
|
|
|
|
Liabilities held for sale:
|
|||||||
|
Accounts payable
|
—
|
|
10,848
|
|
|||
|
Accrued expenses and other current liabilities
|
—
|
|
38
|
|
|||
|
Current liabilities of discontinued operations
|
$
|
—
|
|
$
|
10,886
|
|
|
71
The following table presents the statements of operations for the discontinued operations of the Digital Products Business:
|
For the Fiscal Years Ended September 30,
|
|||||||||||
|
(in thousands)
|
2015
|
2014
|
2013
|
||||||||
|
Revenue
|
$
|
11,944
|
|
$
|
46,038
|
|
$
|
36,006
|
|
||
|
Cost of revenue
|
9,107
|
|
46,387
|
|
38,438
|
|
|||||
|
Gross profit (loss)
|
2,837
|
|
(349
|
)
|
(2,432
|
)
|
|||||
|
Operating expense
|
2,800
|
|
12,683
|
|
12,870
|
|
|||||
|
Flood-related insurance proceeds
|
—
|
|
—
|
|
(11,210
|
)
|
|||||
|
Gain on sale of discontinued operations
|
1,994
|
|
—
|
|
—
|
|
|||||
|
Income (loss) from discontinued operations before income tax
|
2,031
|
|
(13,032
|
)
|
(4,092
|
)
|
|||||
|
Income tax benefit
|
2,175
|
|
4,942
|
|
1,023
|
|
|||||
|
Income (loss) from discontinued operations
|
$
|
4,206
|
|
$
|
(8,090
|
)
|
$
|
(3,069
|
)
|
||
During the fiscal year ended
September 30, 2013
, we recorded flood-related insurance proceeds of
$11.2 million
within discontinued operations.
See Note 11 - Impact of Thailand Flood
for additional information.
|
NOTE 5.
|
Fair Value Accounting
|
ASC 820,
Fair Value Measurements,
establishes a valuation hierarchy for disclosure of the inputs to valuation techniques used to measure fair value. This standard describes a fair value hierarchy based on three levels of inputs, of which the first two are considered observable and the last unobservable, that may be used to measure fair value:
|
•
|
Level 1 inputs are unadjusted quoted prices in active markets for identical assets or liabilities.
|
|
•
|
Level 2 inputs are quoted prices for similar assets and liabilities in active markets or inputs that are observable for the assets or liabilities, either directly or indirectly, through market corroboration, for substantially the full term of the financial instrument.
|
|
•
|
Level 3 inputs are unobservable inputs based on our own assumptions used to measure assets or liabilities at fair value.
|
Classification of an asset or liability within this hierarchy is determined based on the lowest level input that is significant to the fair value measurement.
72
Valuation techniques used to measure fair value under ASC 820 must maximize the use of observable inputs and minimize the use of unobservable inputs. The following table lists our financial assets and liabilities that are measured at fair value on a recurring basis:
|
Fair Value Measurement
|
|||||||||||||
|
(in thousands)
|
Level 1
|
Level 2
|
Level 3
|
||||||||||
|
Quoted Prices in Active Markets for Identical Assets
|
Significant Other Observable Remaining Inputs
|
Significant Unobservable Inputs
|
Total
|
||||||||||
|
As of September 30, 2015
|
|||||||||||||
|
Assets:
|
|
|
|
|
|||||||||
|
Cash and cash equivalents
|
$
|
111,885
|
|
—
|
|
—
|
|
$
|
111,885
|
|
|||
|
Restricted cash
|
375
|
|
—
|
|
—
|
|
375
|
|
|||||
|
As of September 30, 2014
|
|||||||||||||
|
Assets:
|
|
|
|
|
|
|
|
|
|||||
|
Cash and cash equivalents
|
$
|
20,687
|
|
—
|
|
—
|
|
$
|
20,687
|
|
|||
|
Restricted cash
|
1,482
|
|
—
|
|
—
|
|
1,482
|
|
|||||
|
Liabilities:
|
|
|
|
|
|
|
|
|
|||||
|
Warrant liability
|
—
|
|
122
|
|
—
|
|
122
|
|
|||||
Cash consists primarily of bank deposits or, highly liquid short-term investments with a maturity of three months or less at the time of purchase. Restricted cash represents temporarily restricted deposits held as compensating balances against short-term borrowing arrangements.
As of
September 30, 2014
, warrants representing the right to purchase
400,001
shares, of our common stock were outstanding. Since the warrants expired on
April 1, 2015
, no warrants were outstanding as of
September 30, 2015
. All of our warrants met the classification requirements for liability accounting pursuant to ASC 815,
Derivatives and Hedging
. Historically, recording the change in the fair value of our warrants impacted our statements of operations and comprehensive income and was primarily due to the change in the closing price of our common stock.
|
Assumptions used in Monte Carlo Option Valuation Model
|
Warrants issued on October 1, 2009
|
||||
|
As of September 30, 2015
|
As of September 30, 2014
|
||||
|
Number of warrants issued
|
—
|
|
400,001
|
|
|
|
Expiration date
|
—
|
|
4/1/2015
|
|
|
|
Exercise price
|
—
|
|
$6.76 - $9.44
|
|
|
|
Expected dividend yield
|
—
|
|
—
|
|
|
|
Expected stock price volatility
|
—
|
|
51.71
|
%
|
|
|
Risk-free interest rate
|
—
|
|
0.30
|
%
|
|
|
Expected term (in years)
|
—
|
|
0.5
|
|
|
|
Total warrant valuation
|
—
|
|
$121,667
|
||
The carrying amounts of accounts receivable, prepaid expenses and other current assets, borrowings from our credit facility, accounts payable, accrued expenses and other current liabilities approximate fair value because of the short maturity of these instruments.
Impairment tests related to our long-lived assets involves comparing fair value to carrying amount. See
Note 8 - Property, Plant and Equipment
for disclosures related to recent long-lived asset impairment tests.
73
|
NOTE 6.
|
Accounts Receivable
|
The components of accounts receivable consisted of the following:
|
|
As of
|
|
As of
|
||||
|
(in thousands)
|
September 30,
2015 |
|
September 30, 2014
|
||||
|
Accounts receivable, gross
|
$
|
17,781
|
|
$
|
12,885
|
|
|
|
Allowance for doubtful accounts
|
(462
|
)
|
(116
|
)
|
|||
|
Accounts receivable, net
|
$
|
17,319
|
|
$
|
12,769
|
|
|
The allowance for doubtful accounts is based on the age of receivables and a specific identification of receivables considered at risk of collection.
The following table summarizes the changes in the allowance for doubtful accounts within accounts receivable:
|
Allowance for Doubtful Accounts
(in thousands)
|
For the Fiscal Years Ended September 30,
|
||||||||||
|
2015
|
2014
|
2013
|
|||||||||
|
Balance at beginning of period
|
$
|
116
|
|
$
|
22
|
|
$
|
108
|
|
||
|
Provision adjustment - expense, net of recoveries
|
556
|
|
54
|
|
—
|
|
|||||
|
Write-offs and other adjustments - additions (deductions) to receivable balances
|
(210
|
)
|
40
|
|
(86
|
)
|
|||||
|
Balance at end of period
|
$
|
462
|
|
$
|
116
|
|
$
|
22
|
|
||
|
NOTE 7.
|
Inventory
|
The components of inventory consisted of the following:
|
As of
|
As of
|
||||||
|
(in thousands)
|
September 30,
2015 |
September 30, 2014
|
|||||
|
Raw materials
|
$
|
9,261
|
|
$
|
7,255
|
|
|
|
Work in-process
|
3,207
|
|
4,403
|
|
|||
|
Finished goods
|
4,662
|
|
3,986
|
|
|||
|
Inventory
|
$
|
17,130
|
|
$
|
15,644
|
|
|
74
|
NOTE 8.
|
Property, Plant, and Equipment, net
|
The components of property, plant, and equipment, net consisted of the following:
|
As of
|
As of
|
||||||
|
(in thousands)
|
September 30,
2015 |
September 30, 2014
|
|||||
|
Equipment
|
$
|
24,913
|
|
$
|
23,185
|
|
|
|
Furniture and fixtures
|
1,109
|
|
1,109
|
|
|||
|
Computer hardware and software
|
2,177
|
|
2,026
|
|
|||
|
Leasehold improvements
|
1,480
|
|
5,576
|
|
|||
|
Construction in progress
|
875
|
|
49
|
|
|||
|
Property, plant, and equipment, gross
|
30,554
|
|
31,945
|
|
|||
|
Accumulated depreciation
|
(21,629
|
)
|
(21,499
|
)
|
|||
|
Property, plant, and equipment, net
|
$
|
8,925
|
|
$
|
10,446
|
|
|
During fiscal
2015
, as a result of a revision in the estimated amount of cash flows for asset retirement obligations ("ARO") relating to the extension of the Alhambra facility leases and changes in the required restoration efforts, the Company reduced its ARO liability by $
2.9 million
with an offsetting reduction to leasehold improvements of
$2.1 million
, net (
$4.0 million
of leasehold improvements and
$1.9 million
of accumulated depreciation) and recorded a gain from change in estimate on ARO obligation of $
0.8 million
. Also see
Note 14 - Commitments and Contingencies.
Depreciation expense totaled
$2.1 million
,
$2.5 million
and
$2.4 million
during the fiscal years ended
September 30, 2015
,
2014
and
2013
, respectively.
Impairment Testing
The impairment tests for our long-lived assets involve comparing fair value to the carrying amount. If the carrying value of the long-lived assets (asset group) exceeds the estimated undiscounted cash flows expected to be generated by the assets, impairment may exist. We derive fair value using both a guideline public company valuation method, a market based approach, and on a lesser extent, the discounted cash flow valuation method, an income based approach. A guideline public company valuation method entails a comparison to publicly traded companies within similar industry, product lines, market, growth, margins and risk and is generally based on published data regarding the public companies' stock price, revenue, and earnings. The discounted cash flow valuation method is based on discounted cash flow models using assumptions about revenue growth rates, appropriate discount rates relative to risk, and estimates of terminal value.
As of
September 30,
2014
and
2013
, we performed an impairment test on long-lived assets. The impairment test was triggered by a change in long-term financial and cash flow forecasts. The impairment testing indicated that no impairment existed and that future undiscounted cash flows exceeded the carrying value.
As of
September 30,
2015
, we performed an impairment test on long-lived assets. The impairment test was triggered by continued losses from operations realized in fiscal year 2015. The impairment testing indicated that no impairment existed and that future undiscounted cash flows exceeded the carrying value.
The Company will assess its long-lived assets for impairment whenever events or changes in circumstances indicate that its carrying amount may not be recoverable.
75
|
NOTE 9.
|
Intangible Assets
|
The following table sets forth the carrying value of intangible assets:
|
(in thousands)
|
As of September 30, 2015
|
As of September 30, 2014
|
||||||||||||||||||||||
|
Gross
Assets
|
Accumulated
Amortization
|
Net
Assets
|
Gross Assets
|
Accumulated
Amortization
|
Net
Assets
|
|||||||||||||||||||
|
Patents
|
$
|
3,274
|
|
(3,274
|
)
|
$
|
—
|
|
$
|
4,697
|
|
(4,615
|
)
|
$
|
82
|
|
||||||||
|
Total
|
$
|
3,274
|
|
$
|
(3,274
|
)
|
$
|
—
|
|
$
|
4,697
|
|
$
|
(4,615
|
)
|
$
|
82
|
|
||||||
Amortization expense related to intangible assets is included in selling, general, and administrative expense on our statement of operations and comprehensive income.
See
Note 8 - Property, Plant and Equipment
, for discussion on impairment.
|
NOTE 10.
|
Accrued Expenses and Other Current Liabilities
|
The components of accrued expenses and other current liabilities consisted of the following:
|
|
As of
|
|
As of
|
||||
|
(in thousands)
|
September 30,
2015 |
|
September 30, 2014
|
||||
|
Compensation
|
$
|
3,036
|
|
$
|
1,797
|
|
|
|
Warranty
|
1,664
|
|
2,285
|
|
|||
|
Termination fee
|
2,775
|
|
2,775
|
|
|||
|
Professional fees
|
1,147
|
|
2,181
|
|
|||
|
Customer deposits
|
133
|
|
593
|
|
|||
|
Deferred revenue
|
65
|
|
97
|
|
|||
|
Self insurance
|
606
|
|
1,470
|
|
|||
|
Income and other taxes
|
1,038
|
|
1,433
|
|
|||
|
Loss on sale contracts
|
—
|
|
119
|
|
|||
|
Severance and restructuring accruals
|
1,448
|
|
1,317
|
|
|||
|
Loss on inventory purchase commitments
|
—
|
|
306
|
|
|||
|
Other
|
1,190
|
|
836
|
|
|||
|
Accrued expenses and other current liabilities
|
$
|
13,102
|
|
$
|
15,209
|
|
|
Compensation
: As of
September 30, 2015
, compensation liabilities were higher compared to the prior year due to additional accruals for the Company's new bonus plans and higher headcount.
Professional Fees
: As of
September 30, 2015
, professional fees included legal fees associated with on-going litigation.
As of
September 30, 2014
, professional fees included transaction costs of
$1.8 million
associated with the sale of the Photovoltaics Business.
Income and other taxes
: For the fiscal year ended
September 30, 2015
, the Company reported
$2.2 million
of income tax benefit from continuing operations losses and
$26.5 million
of income tax expense within income from discontinued operations. For the fiscal year ended
September 30, 2014
, the Company reported
$24.6 million
of income tax benefit from continuing operations losses and
$0.5 million
of income tax expense within income from discontinued operations. The income tax expense within discontinued operations includes estimated alternative minimum tax and other adjustments prescribed by ASC 740 in allocating expected annual income tax expense (benefit) between continuing operations and discontinued operations.
76
During the fiscal year ended
September 30, 2015
, the Company utilized
$24.1 million
of deferred tax assets. The Company expects to make a payment for alternative minimum taxes and the remaining income tax expense will be offset mainly through utilization of
$24.1 million
of deferred tax assets and net operating loss carry forwards. Also see
Note 13 - Income and other Taxes.
Severance and restructuring accruals
: On
November 15, 2013
, Mr. Chris Larocca notified the Board of Directors of his decision to resign as the Company's Chief Operating Officer, effective as of
November 30, 2013
. The Company recorded a charge of
$0.5 million
in the fiscal year ended
September 30, 2014
related to the separation agreement entered into as part of Mr. Larocca's resignation.
On
September 17, 2014
, Dr. Hong Q. Hou announced he would resign as the Company's Chief Executive Officer, effective as of
January 2, 2015
or, if later,
fifteen
days following the date on which the Company hires a successor Chief Executive Officer. The Company and Dr. Hou entered into a separation agreement and general release, dated
September 17, 2014
(Dr. Hou 's Separation Agreement), which includes mutual releases by Dr. Hou and the Company of all claims related to Dr. Hou's employment and service relationship with, and termination of employment and service from, the Company. Dr. Hou's Separation Agreement provides for among other things, the continuation of his base salary for 86 weeks, benefits for
18 months
, outplacement services for a period of not more than
one
year and with a value not in excess of
$15,000
and immediate vesting of all his outstanding non-vested equity awards. These payments are not contingent upon any future service by Dr. Hou. The Company recorded a charge of approximately
$0.8 million
in the fiscal year ended
September 30, 2014
related to Dr. Hou's Separation Agreement.
On
December 10, 2014
, Monica Van Berkel announced she would resign as the Company's Chief Administrative Officer, effective as of
January 2, 2015
. The Company and Ms. Van Berkel entered into a separation agreement and general release, dated
December 10, 2014
(Ms. Van Berkel 's Separation Agreement), which includes mutual releases by Ms. Van Berkel and the Company of all claims related to Ms. Van Berkel's employment and service relationship with, and termination of employment and service from, the Company. Ms. Van Berkel's Separation Agreement provides for among other things, the continuation of her base salary for 74 weeks, benefits for
18
months, outplacement services for a period of not more than
one
year and with a value not in excess of
$15,000
and immediate vesting of all her outstanding non-vested equity awards. These payments are not contingent upon any future service by Ms. Van Berkel. The Company recorded a charge of approximately
$0.6 million
in the fiscal year ended
September 30, 2015
related to Ms. Van Berkel's Separation Agreement.
On
December 10, 2014
, Alfredo Gomez announced he would resign as the Company's General Counsel and Secretary, effective as of
February 13, 2015
or, if later, following the date on which the Company hires a successor in-house counsel. The Company and Mr. Gomez entered into a separation agreement and general release, dated
December 10, 2014
(Mr. Gomez's Separation Agreement), which includes mutual releases by Mr. Gomez and the Company of all claims related to Mr. Gomez's employment and service relationship with, and termination of employment and service from, the Company. Mr. Gomez's Separation Agreement provides for among other things, the continuation of his base salary for 68 weeks, benefits for
18
months outplacement services for a period of not more than
one
year and with a value not in excess of
$15,000
and immediate vesting of all his outstanding non-vested equity awards. These payments are not contingent upon any future service by Mr. Gomez. The Company recorded a charge of approximately
$0.5 million
in the fiscal year ended
September 30, 2015
related to Mr. Gomez's Separation Agreement.
In connection with the closing of the sale of the Digital Products Business, we accrued for the remaining lease costs of our Newark, California facility through the lease termination of
May 2016
. Included in the discontinued operations for the fiscal year ended
September 30, 2015
, was
$0.7 million
related for the remaining lease costs.
77
Our severance and restructuring-related accruals specifically relates to the separation agreements discussed above and non-cancelable obligations associated with an abandoned leased facility. Expense related to severance and restructuring accruals is included in selling, general, and administrative expense on our statement of operations and comprehensive income. The following table summarizes the changes in the severance and restructuring-related accrual accounts:
|
(in thousands)
|
Severance-related accruals
|
Restructuring- related accruals
|
Total
|
||||||||
|
Balance as of September 30, 2013
|
$
|
523
|
|
$
|
78
|
|
$
|
601
|
|
||
|
Expense - charged to accrual
|
1,776
|
|
—
|
|
1,776
|
|
|||||
|
Payments and accrual adjustments
|
(982
|
)
|
(78
|
)
|
(1,060
|
)
|
|||||
|
Balance as of September 30, 2014
|
1,317
|
|
—
|
|
1,317
|
|
|||||
|
Expense - charged to accrual
|
1,216
|
|
737
|
|
1,953
|
|
|||||
|
Payments and accrual adjustments
|
(1,423
|
)
|
(399
|
)
|
(1,822
|
)
|
|||||
|
Balance as of September 30, 2015
|
$
|
1,110
|
|
$
|
338
|
|
$
|
1,448
|
|
||
Warranty:
We generally provide product and other warranties on our components, power systems, and fiber optic products, in addition to certain already divested product lines where we retained the warranty obligations. Certain parts and labor warranties from our vendors can be assigned to our customers. Our reported financial position or results of operations may be materially different under changed conditions or when using different estimates and assumptions. In the event that estimates or assumptions prove to differ from actual results, adjustments are made in subsequent periods to reflect more current information.
The following table summarizes the changes in our product warranty accrual accounts:
|
Product Warranty Accruals
|
For the Fiscal Years Ended September 30,
|
||||||||||
|
(in thousands)
|
2015
|
2014
|
2013
|
||||||||
|
Balance at beginning of period
|
$
|
2,816
|
|
$
|
3,881
|
|
$
|
3,100
|
|
||
|
Provision for product warranty - expense
|
838
|
|
1,308
|
|
2,619
|
|
|||||
|
Adjustments and utilization of warranty accrual
|
(1,990
|
)
|
(2,373
|
)
|
(1,838
|
)
|
|||||
|
Balance at end of period
|
$
|
1,664
|
|
$
|
2,816
|
|
$
|
3,881
|
|
||
|
Current portion
|
$
|
1,664
|
|
$
|
2,285
|
|
$
|
3,350
|
|
||
|
Non-current portion
|
—
|
|
531
|
|
531
|
|
|||||
|
Product warranty liability at end of period
|
$
|
1,664
|
|
$
|
2,816
|
|
$
|
3,881
|
|
||
|
NOTE 11.
|
Impact from Thailand Flood
|
In October 2011, we announced that flood waters had severely impacted the inventory and production operations of our primary contract manufacturer in Thailand. The impacted areas included certain product lines for the Digital Products Business and CATV businesses. We rebuilt the impacted production lines at other locations, including an alternative facility of our contract manufacturer in Thailand, as well as our own manufacturing facilities in the United States and China.
During the fiscal year ended
September 30, 2013
, we recorded flood-related insurance proceeds of
$7.8 million
in the form of forgiveness of
$0.2 million
of outstanding capital lease obligations,
$1.0 million
of outstanding payables and
$6.6 million
in the form of a receivable, which was paid in cash. No additional flood-related insurance proceeds associated with this event are anticipated. See
Note 4 - Discontinued Operations
for additional information.
78
|
NOTE 12.
|
Credit Facilities
|
On November 11, 2010, we entered into a Credit and Security Agreement (credit facility) with Wells Fargo Bank, National Association ("Wells Fargo"). The credit facility is secured by the Company's assets and is subject to a borrowing base formula based on the Company's eligible accounts receivable, inventory, and machinery and equipment accounts.
On
December 3, 2014
, we entered into a Sixth Amendment to the credit facility, pursuant to which Wells Fargo agreed, to automatically release all encumbrances covering certain of the Company’s assets to be sold pursuant to the Photovoltaics Agreement and the Digital Products Agreement. In addition, on
December 10, 2014
, upon notice to Wells Fargo of the closing of the transaction contemplated by the Photovoltaics Agreement, the maximum borrowing allowed under the credit facility was reduced from
$35.0 million
to
$15.0 million
, and certain other changes to the borrowing base calculations went into effect.
On
November 10, 2015
, we entered into a Seventh Amendment of the credit facility which extended the maturity date of the facility to
November 2018
, and adjusted the interest rate to LIBOR plus
2.5%
.
As of
September 30, 2015
, there was no amounts outstanding under this credit facility and the Company was in compliance with all financial covenants. Also as of
September 30, 2015
, the credit facility had approximately
$0.9 million
reserved for
three
stand-by letters of credit and
$8.6 million
available for borrowing.
79
|
NOTE 13.
|
Income and other Taxes
|
The Company's loss from continuing operations before income taxes consisted of the following:
|
(Loss) income from continuing operations before income taxes
|
For the Fiscal Years Ended September 30,
|
||||||||||
|
(in thousands)
|
2015
|
2014
|
2013
|
||||||||
|
Domestic
|
$
|
(5,713
|
)
|
$
|
(19,792
|
)
|
$
|
(8,095
|
)
|
||
|
Foreign
|
1,250
|
|
(676
|
)
|
(852
|
)
|
|||||
|
Loss from continuing operations before income taxes
|
$
|
(4,463
|
)
|
$
|
(20,468
|
)
|
$
|
(8,947
|
)
|
||
The Company's income tax (benefit) expense consisted of the following:
|
Income tax benefit
|
For the Fiscal Years Ended September 30,
|
||||||||||
|
(in thousands)
|
2015
|
2014
|
2013
|
||||||||
|
Federal:
|
|||||||||||
|
Current
|
$
|
—
|
|
$
|
—
|
|
$
|
—
|
|
||
|
Deferred
|
(1,835
|
)
|
(21,285
|
)
|
(2,752
|
)
|
|||||
|
(1,835
|
)
|
(21,285
|
)
|
(2,752
|
)
|
||||||
|
State:
|
|||||||||||
|
Current
|
—
|
|
—
|
|
—
|
|
|||||
|
Deferred
|
(356
|
)
|
(2,454
|
)
|
(317
|
)
|
|||||
|
(356
|
)
|
(2,454
|
)
|
(317
|
)
|
||||||
|
Foreign:
|
|||||||||||
|
Current
|
—
|
|
—
|
|
—
|
|
|||||
|
Deferred
|
—
|
|
(811
|
)
|
(324
|
)
|
|||||
|
—
|
|
(811
|
)
|
(324
|
)
|
||||||
|
Total income tax benefit
|
$
|
(2,191
|
)
|
$
|
(24,550
|
)
|
$
|
(3,393
|
)
|
||
EMCORE Corporation is incorporated in the state of New Jersey. A reconciliation of the provision for income taxes, with the amount computed by applying the statutory U.S. federal and state income tax rates to continuing operations income before provision for income taxes is as follows:
|
Provision for Income Taxes
|
For the Fiscal Years Ended September 30,
|
||||||||||
|
(in thousands)
|
2015
|
2014
|
2013
|
||||||||
|
Income tax benefit computed at U.S. federal statutory rate
|
$
|
(1,518
|
)
|
$
|
(6,959
|
)
|
$
|
(3,042
|
)
|
||
|
State tax expense benefit, net of U.S. federal effect
|
(356
|
)
|
(776
|
)
|
(317
|
)
|
|||||
|
Foreign tax rate differential
|
(269
|
)
|
1,041
|
|
(34
|
)
|
|||||
|
Release of valuation allowance-domestic
|
—
|
|
(17,856
|
)
|
—
|
|
|||||
|
Other
|
108
|
|
—
|
|
—
|
|
|||||
|
Change in valuation allowance
|
(156
|
)
|
—
|
|
—
|
|
|||||
|
Income tax benefit
|
$
|
(2,191
|
)
|
$
|
(24,550
|
)
|
$
|
(3,393
|
)
|
||
|
Effective tax rate
|
49.1
|
%
|
119.9
|
%
|
37.9
|
%
|
|||||
80
Significant components of our deferred tax assets are as follows:
|
Deferred Tax Assets
|
As of September 30, 2015
|
As of September 30, 2014
|
||||||
|
(in thousands)
|
||||||||
|
Deferred tax assets:
|
||||||||
|
Federal net operating loss carryforwards
|
$
|
147,704
|
|
$
|
155,741
|
|
||
|
Foreign net operating loss carryforwards
|
66
|
|
646
|
|
||||
|
Income tax credit carryforwards
|
3,033
|
|
2,641
|
|
||||
|
Inventory reserves
|
2,283
|
|
4,439
|
|
||||
|
Accounts receivable reserves
|
149
|
|
51
|
|
||||
|
Accrued warranty reserve
|
587
|
|
1,171
|
|
||||
|
State net operating loss carryforwards
|
9,527
|
|
10,454
|
|
||||
|
Stock compensation
|
2,837
|
|
3,300
|
|
||||
|
Deferred compensation
|
1,080
|
|
1,647
|
|
||||
|
Fixed assets and intangibles
|
1,646
|
|
10,501
|
|
||||
|
Capital loss carryover
|
—
|
|
10,565
|
|
||||
|
Other
|
1,388
|
|
1,868
|
|
||||
|
Total deferred tax assets
|
170,300
|
|
203,024
|
|
||||
|
Valuation allowance
|
(170,300
|
)
|
(178,944
|
)
|
||||
|
Net deferred tax assets
|
$
|
—
|
|
$
|
24,080
|
|
||
At
September 30, 2014
, the Company determined that it was more likely than not that certain deferred tax assets would be realized upon the sale of the Photovoltaic Business in fiscal year
2015
. As a result, a net deferred tax valuation allowance release of
$24.6 million
was recorded as an income tax benefit during fiscal year
2014
. The sale of the Photovoltaic Business closed on
December 10, 2014
and the Company realized a gain on the transaction.
During the fiscal year ended
September 30, 2015
, the Company utilized the
$24.6 million
of deferred tax assets. The Company paid alternative minimum taxes of
$0.6 million
during the fiscal year ended
September 30, 2015
and the remaining income tax expense will be offset mainly through utilization of
$24.1 million
of capital loss and utilization of net operating loss carry forwards.
For the fiscal years ended
September 30, 2015
,
2014
and
2013
, the Company recorded income tax benefit from continuing operations losses of approximately
$2.2 million
,
$24.6 million
and
$3.4 million
, respectively. For the fiscal years ended
September 30, 2015
,
2014
and
2013
, the Company recorded income tax expense within discontinued operations of approximately
$26.5 million
,
$0.5 million
and
$3.5 million
, respectively. In the fiscal year ended
September 30, 2015
, the income tax expense within discontinued operations includes estimated alternative minimum tax and other adjustments prescribed by ASC 740.
For fiscal years ended
September 30, 2015
,
2014
and
2013
, the effective tax rate on continuing operations was
49.1%
,
119.9%
and
37.9%
, respectively. The lower tax rate for fiscal year
2015
was primarily due to permanent differences, state tax benefits, foreign tax rate differentials, and release of state taxes associated with uncertain tax positions. The higher tax rate for fiscal year
2014
was mainly attributable to the partial release of the valuation allowance. The Company uses estimates to forecast the results from continuing operations for the current fiscal year as well as permanent differences between book and tax accounting.
We have not provided for U.S. federal and state income taxes on non-U.S. subsidiaries undistributed earnings as of September 30, 2015 because we plan to indefinitely reinvest the unremitted earnings of our non-U.S. subsidiaries.
All remaining deferred tax assets will have a full valuation allowance at
September 30, 2015
. However, on a quarterly basis, the Company will evaluate the positive and negative evidence to assess whether the more likely than not criteria, mandated by ASC 740, has been satisfied in determining whether there will be further adjustments to the valuation allowance.
81
During the fiscal year ended
September 30, 2015
, we decreased previously recorded unrecognized tax benefits by
$0.2 million
, of which
$0.1 million
was recognized in income tax benefit from continuing operations and
$0.1 million
was recognized in income tax expense from discontinued operations. During the fiscal years ended
September 30, 2014
and
2013
, there were no material increases or decreases in unrecognized tax benefits. As of
September 30, 2015
and
2014
, we had approximately
$0.3 million
and
$0.4 million
, respectively, of interest and penalties accrued as tax liabilities on our balance sheet.
As of
September 30, 2015
, the Company had net operating loss carryforwards for U.S. federal income tax purposes of approximately
$434.4 million
which begin to expire in
2021
. As of
September 30, 2015
, the Company had foreign net operating loss carryforwards of
$0.5 million
which began to expire in
2019
, as well as state net operating loss carryforwards of approximately
$243.0 million
which began to expire in
2015
. As of
September 30, 2015
, the Company also had tax credits (primarily foreign income and U.S. research and development tax credits) of approximately
$3.0 million
. The research credits will begin to expire in
2018
. Utilization of net operating loss and tax credit carryforwards are subject to a substantial annual limitation due to the ownership change limitations set forth in Internal Revenue Code Section 382 and similar state provisions. The Company prepared an Internal Revenue Code 382 analysis to determine the annual limitations on the Company's consolidated net operating loss carryforwards. As a result of the
$434.4 million
of U.S. net operating loss carryforwards, approximately
$247.3 million
is subject to an annual limitation and
$187.1 million
of the net operating losses are not subject to an annual limitation. Such annual limitations could result in the expiration of the net operating loss and tax credit carryforwards before utilization.
A reconciliation of the beginning and ending amount of unrecognized gross tax benefits is as follows:
|
Unrecognized Gross Tax Benefit
(in thousands)
|
||||
|
Balance as of September 30, 2013
|
$
|
620
|
|
|
|
Adjustments based on tax positions related to the current year
|
—
|
|
||
|
Adjustments based on tax positions of prior years
|
—
|
|
||
|
Balance as of September 30, 2014
|
620
|
|
||
|
Adjustments based on tax positions related to the current year
|
—
|
|
||
|
Adjustments based on tax positions of prior years
|
(207
|
)
|
||
|
Balance as of September 30, 2015
|
$
|
413
|
|
|
We believe that it is reasonably possible that all of the uncertain tax position will be paid or settled within the next 12 months. We file income tax returns in the U.S. federal, state, and local jurisdictions. In April 2015 the IRS completed its exam of the September 30, 2012 tax return and the Company was notified there were no changes to the originally filed return. There are no state income tax returns under examination. The following tax years remain open to assessment for each of the more significant jurisdictions where we are subject to income taxes: after fiscal year 2012 for the U.S. federal, after fiscal year 2011 for the State of New Mexico, and after fiscal year 2010 for the state of California.
Included in discontinued operations during the fiscal years ended September 30,
2015
,
2014
and
2013
were
$0.2 million
,
$0.8 million
and
$1.8 million
, respectively, of New Mexico incentive tax credits received. The amount received was allocated to cost of goods sold, selling, general and administrative and research and development expense primarily based on the number of employees allocated to the related departments. These credits resulted in cash refunds and a reduction of future payroll and compensation taxes.
82
|
NOTE 14.
|
Commitments and Contingencies
|
Leases
: Estimated future minimum lease payments under non-cancelable operating leases with an initial or remaining term of one year or more are
$1.0 million
and
$0.4 million
for the fiscal years ended September 30, 2016 and 2017, respectively.
Operating Lease Obligations
: We lease certain land, facilities, and equipment under non-cancelable operating leases. Operating lease amounts exclude renewal option periods, property taxes, insurance, and maintenance expenses on leased properties. Our facility leases typically provide for rental adjustments for increases in base rent (up to specific limits), property taxes, insurance, and general property maintenance that would be recorded as rent expense. Rent expense was approximately
$1.3 million
,
$1.7 million
and
$2.3 million
for the fiscal years ended
September 30, 2015
,
2014
and
2013
respectively. There are no off-balance sheet arrangements other than our operating leases.
Asset Retirement Obligations ("ARO")
: We have known conditional asset retirement conditions, such as certain asset decommissioning and restoration of rented facilities to be performed in the future. Our asset retirement obligations include assumptions related to renewal option periods for those facilities where we expect to extend lease terms. The Company recognizes its estimate of the fair value of its asset retirement obligations in the period incurred in long-term liabilities. The fair value of the asset retirement obligations is also capitalized as property, plant and equipment.
In future periods, the asset retirement obligation is accreted for the change in its present value and capitalized costs are depreciated over the useful life of the related assets. If the fair value of the estimated asset retirement obligation changes, an adjustment will be recorded to both the asset retirement obligation and the asset retirement capitalized cost. Revisions in estimated liabilities can result from revisions of estimated inflation rates, changes in estimated retirement costs, and changes in the estimated timing of settling asset retirement obligations. The fair value of our asset retirement obligations were estimated by discounting projected cash flows over the estimated life of the related assets using credit adjusted risk-free rates which ranged from
3.25%
to
5.78%
. There were no asset retirement obligations settled during the fiscal year ended
September 30, 2015
and
2014
. Accretion expense of
$0.1 million
,
$0.2 million
and
$0.2 million
was recorded during the fiscal years ended
September 30, 2015
,
2014
and
2013
, respectively.
EMCORE leases a major facility in Alhambra, California covering
six
buildings where manufacturing, research and development, and general and administrative work is provided
.
Several leases related to these facilities, expired in 2011, and are being maintained on a month-to-month basis. In November 2014, a new lease for four of the six buildings was signed which was retroactively effective on
October 1, 2014
. The new lease extended the terms of the lease for
three
years plus a
three
year option to extend the lease and clarified the obligations and restoration work necessary to restore the buildings back to the requirements in the lease.
The Company’s asset retirement obligation consists of legal requirements to return the existing leased facilities to prescribed state and certain environmental work to be performed due to the presence of a manufacturing fabrication operation and significant changes to the facilities over the past thirty years. EMCORE had estimated a significant asset retirement obligation associated with this site.
83
During the year ended
September 30, 2015
, the Company completed an analysis of the new Alhambra lease and revised its estimated future cash flows of its asset retirement obligations. The analysis required estimating the probability or likelihood that the Company will be required to remove certain infrastructure and restore the leased properties as set forth in the new lease, and the timing and amount of those future costs. The analysis resulted in the downward revision of the Company’s asset retirement obligation liability. This change in the estimated cash flows resulted in a reduction in the asset retirement obligations liability by $
2.9 million
with an offsetting reduction to property, plant, and equipment, net of
$2.1 million
, and a gain from change in estimate of ARO obligation of $
0.8 million
. The Company first reduced the net leasehold improvement asset to the extent of the carrying amount of the related asset initially recorded when the asset retirement obligations were established. The amount of the remaining reduction to the asset retirement obligations was recorded as a reduction to operating expenses.
The following table summarizes asset retirement obligations activity:
|
Asset Retirement Obligations
|
September 30,
|
||
|
(in thousands)
|
2015
|
||
|
Balance at September 30, 2014
|
$
|
4,543
|
|
|
Accretion expense
|
110
|
|
|
|
Revision in estimated cash flows
|
(2,879
|
)
|
|
|
Balance at end of period
|
$
|
1,774
|
|
Indemnifications
: We have agreed to indemnify certain customers against claims of infringement of the intellectual property rights of others in our sales contracts with these customers. Historically, we have not paid any claims under these indemnification obligations. On
September 19, 2013
, we received written notice from a customer of our broadband products requesting indemnification relating to a lawsuit brought against them alleging patent infringement of a system incorporating our product. As of
September 30, 2015
, there has been no resolution to this claim.
In March 2012, we entered into a Master Purchase Agreement with SEI, pursuant to which we agreed to sell certain assets and transfer certain obligations. Under the terms of the Master Purchase Agreement, we have agreed to indemnify SEI for up to
$3.4 million
of potential claims and expenses for the
two
-year period following the sale and we recorded this amount as a deferred gain on our balance sheet as of
September 30, 2015
and
2014
as a result of these contingencies. In April 2013, May 2013 and May 2014, we received letters from SEI asserting indemnification claims under the Master Purchase Agreement.
As of September 30, 2015
, there has been no resolution to these claims. See
Note 1 - Description of Business
for additional disclosures related to this asset sale and below for additional disclosures related to the claims.
Legal Proceedings
: We are subject to various legal proceedings, claims, and litigation, either asserted or unasserted that arise in the ordinary course of business. While the outcome of these matters is currently not determinable, we do not expect the resolution of these matters will have a material adverse effect on our business, financial position, results of operations, or cash flows. However, the results of these matters cannot be predicted with certainty. Professional legal fees are expensed when incurred. We accrue for contingent losses when such losses are probable and reasonably estimable. In the event that estimates or assumptions prove to differ from actual results, adjustments are made in subsequent periods to reflect more current information. Should we fail to prevail in any legal matter or should several legal matters be resolved against the Company in the same reporting period, then the financial results of that particular reporting period could be materially affected.
84
a) Intellectual Property Lawsuits
We protect our proprietary technology by applying for patents where appropriate and, in other cases, by preserving the technology, related know-how and information as trade secrets. The success and competitive position of our product lines are impacted by our ability to obtain intellectual property protection for our research and development efforts. We have, from time to time, exchanged correspondence with third parties regarding the assertion of patent or other intellectual property rights in connection with certain of our products and processes.
b) Sumitomo Electric Industries Ltd.
On September 23, 2014, SEI, filed for arbitration against EMCORE, as required under the Master Purchase Agreement between the parties. SEI seeks
$47.5 million
from EMCORE, relating to claims for quality issues, expenses related to subpoenas issued in litigation against a vendor and customers of SEDU, a claim that EMCORE made fraudulent or negligent misrepresentations to SEI in the Master Purchase Agreement, and other breach of contract claims. We believe that the claims in this matter are without merit and we intend to defend ourselves vigorously against them. However, we cannot be certain as to its outcome, or that an adverse decision in such action will be reached and would have a material adverse effect on our business, financial condition, results of operation or cash flows. On
November 14, 2014
, EMCORE answered SEI’s complaint and asserted several legal defenses.
85
|
NOTE 15.
|
Equity
|
Common Stock Repurchase
In
April 2015
, EMCORE's Board of Directors authorized the Company to repurchase
$45.0 million
of shares of its common stock. On
May 15, 2015
, we announced the commencement of a modified "Dutch auction" tender offer to purchase for cash shares of our common stock (the "Tender Offer"). On
June 15, 2015
, we completed the Tender Offer and purchased
6.9 million
shares of our common stock at a purchase price of $
6.55
per share, for an aggregate cost of
$45.0 million
excluding fees and expenses. Repurchased common stock was recorded to treasury stock. The Company incurred costs of
$0.7 million
in connection with the Tender Offer, which were recorded to treasury stock.
Stock Sales
During August 2012, we filed a shelf registration statement on Form S-3 with the SEC pursuant to which we could, from time to time, sell up to an aggregate of
$50 million
of our common or preferred stock, warrants or debt securities. On August 23, 2012, the registration statement was declared effective by the SEC, which allowed us to access the capital markets for the
three
year period following this effective date as long as we continue to meet the eligibility requirements for the use of Form S-3. On October 3, 2012, we sold
1,832,410
shares of common stock for net proceeds of
$9.5 million
. In addition, on September 18, 2013, we sold
2,875,000
shares of common stock for net proceeds of
$11.7 million
.
Equity Plans
We provide long-term incentives to eligible officers, directors, and employees in the form of equity-based awards. We maintain
three
equity incentive compensation plans, collectively described below as our Equity Plans:
|
•
|
the 2000 Stock Option Plan (2000 Plan),
|
|
•
|
the 2010 Equity Incentive Plan (2010 Equity Plan),
|
|
•
|
the 2012 Equity Incentive Plan (2012 Equity Plan).
|
On
March 5, 2014
, our shareholders approved an amendment to the 2012 Equity Plan to increase the total number of shares of common stock available for grant under the 2012 Equity Plan by
1,000,000
shares, to a total authorized of
2,000,000
shares.
We issue new shares of common stock to satisfy awards issued under our Equity Plans.
Stock Options
Most of our stock options vest and become exercisable over a
four
to
five
year period and have a contractual life of
10
years. Certain stock options awarded are intended to qualify as incentive stock options pursuant to Section 422A of the Internal Revenue Code.
The following table summarizes stock option activity under the Equity Plans for the fiscal year ended
September 30, 2015
:
|
|
Number of Shares
|
Weighted Average Exercise Price
|
Weighted Average
Remaining Contractual Life
(in years)
|
Aggregate Intrinsic Value (*) (in thousands)
|
||||||
|
Outstanding as of September 30, 2014
|
1,431,190
|
|
$19.06
|
|||||||
|
Granted
|
37,350
|
|
$6.23
|
|||||||
|
Exercised
|
(289,467
|
)
|
$4.82
|
$
|
305
|
|
||||
|
Forfeited
|
(9,227
|
)
|
$5.28
|
|||||||
|
Expired
|
(473,387
|
)
|
$22.01
|
|||||||
|
Outstanding as of September 30, 2015
|
696,459
|
|
$22.47
|
2.91
|
$
|
436
|
|
|||
|
Exercisable as of September 30, 2015
|
651,732
|
|
$23.60
|
2.48
|
$
|
395
|
|
|||
|
Vested and expected to vest as of September 30, 2015
|
687,048
|
|
$22.70
|
2.82
|
$
|
428
|
|
|||
(*) Intrinsic value for stock options represents the “in-the-money” portion or the positive variance between a stock option's exercise price and the underlying stock price. For the fiscal year ended
September 30, 2014
and
2013
, the intrinsic value of options exercised was
$100,000
and
$94,000
.
86
As of
September 30, 2015
, there was approximately
$0.2 million
of unrecognized stock-based compensation expense, net of estimated forfeitures, related to non-vested stock options granted under the Equity Plans which is expected to be recognized over an estimated weighted average life of
4.1
years.
On
December 10, 2014
, in connection with the sale of the Photovoltaics Business, which constituted a change in control, the terms of approximately
56,000
stock options for approximately
80
employees were modified to include accelerated vesting effective as of that date. The total incremental benefit resulting from the modifications was approximately
$0.2 million
and is included in the Company's income from discontinued operations, net of tax, for the year ended
September 30, 2015
.
Valuation Assumptions
The fair value of each stock option grant was estimated on the date of grant using the Black-Scholes option valuation model, adhering to the straight-line attribution approach using the following weighted-average assumptions, of which the expected term and stock price volatility rate are highly subjective:
|
For the Fiscal Years Ended September 30,
|
|||||||||||
|
2015
|
2014
|
2013
|
|||||||||
|
Black-Scholes weighted average assumptions:
|
|||||||||||
|
Expected dividend rate
|
—
|
%
|
—
|
%
|
—
|
%
|
|||||
|
Expected stock price volatility rate
|
66.1
|
%
|
92.8
|
%
|
96.7
|
%
|
|||||
|
Risk-free interest rate
|
1.8
|
%
|
1.9
|
%
|
1.2
|
%
|
|||||
|
Expected term (in years)
|
6.0
|
|
6.0
|
|
6.0
|
|
|||||
|
Weighted average grant date fair value per share of stock options granted:
|
$
|
3.73
|
|
$
|
3.53
|
|
$
|
3.45
|
|
||
Expected Dividend Yield:
The Black-Scholes valuation model calls for a single expected dividend rate as an input. We have not issued any dividends.
Expected Stock Price Volatility Rate:
The fair values of stock-based payments were valued using the Black-Scholes valuation
method with a volatility factor based on our historical common stock prices.
Risk-Free Interest Rate
: The risk-free interest rate used in the Black-Scholes valuation method was based on the implied yield that was currently available on U.S. Treasury zero-coupon notes with an equivalent remaining term. Where the expected terms of stock-based awards do not correspond with the terms for which interest rates are quoted, we performed a straight-line interpolation to determine the rate from the available maturities.
Expected Term:
Expected term represents the period that our stock-based awards are expected to be outstanding and was determined based on historical experience of similar awards, giving consideration to the contractual terms of the stock-based awards, vesting schedules and expectations of future employee behavior as influenced by changes to the terms of stock-based awards.
Estimated Pre-vesting Forfeitures:
We are required to estimate forfeitures at the time of grant and revise those estimates in subsequent periods if actual forfeitures differ from those estimates. We use historical data to estimate pre-vesting option forfeitures and record stock-based compensation expense only for those awards that are expected to vest. If we use different assumptions for estimating stock-based compensation expense in future periods or if actual forfeitures differ materially from our estimated forfeitures, the change in our non-cash stock-based compensation expense could adversely affect our results of operations.
Restricted Stock
Restricted stock units (RSUs) granted under the 2010 Equity Plan and 2012 Equity Plan typically vest over
3
years and are subject to forfeiture if employment terminates prior to the lapse of the restrictions. RSUs are not considered issued or outstanding common stock until they vest.
87
The following table summarizes the activity related to RSUs for the fiscal year ended
September 30, 2015
:
|
Restricted Stock Activity
|
Restricted Stock Units
|
||||
|
Number of Shares
|
Weighted Average Grant Date Fair Value
|
||||
|
Non-vested as of September 30, 2014
|
966,579
|
|
$4.71
|
||
|
Granted
|
524,150
|
|
$5.38
|
||
|
Vested
|
(873,183
|
)
|
$4.74
|
||
|
Forfeited
|
(47,315
|
)
|
$4.89
|
||
|
Non-vested as of September 30, 2015
|
570,231
|
|
$5.26
|
||
As of
September 30, 2015
, there was approximately
$2.1 million
of remaining unamortized stock-based compensation expense, net of estimated forfeitures, associated with RSUs, which will be expensed over a weighted average remaining service period of approximately
2.0
years. The
0.6 million
outstanding non-vested RSUs have an aggregate intrinsic value of approximately
$3.9 million
and a weighted average remaining contractual term of
1.2
years. For the fiscal years ended
September 30, 2015
,
2014
and
2013
, the intrinsic value of RSUs vested was
$4.6 million
,
$2.4 million
and
$1.2 million
, respectively. Of the
0.6 million
outstanding non-vested RSUs at
September 30, 2015
, approximately
0.5 million
are expected to vest and have an aggregate intrinsic value of approximately
$3.7 million
and a weighted average remaining contractual term of
1.2
years. For the fiscal years ended
September 30, 2014
and
2013
, the weighted average grant date fair value of RSUs granted was
$4.89
and
$4.63
, respectively.
On
December 10, 2014
, in connection with the sale of the Photovoltaics Business, which constituted a change in control, the terms of approximately
147,000
RSUs for approximately
80
employees were modified to include accelerated vesting effective as of that date. The total incremental expense resulting from the modifications was approximately
$49,000
and is included in the Company's income from discontinued operations, net of tax, for the year ended
September 30, 2015
. In total, approximately
0.3 million
RSU's vested due to change in control provisions.
Stock-based compensation
The effect of recording stock-based compensation expense was as follows:
|
Stock-based Compensation Expense - by award type
|
For the Fiscal Years Ended September 30,
|
||||||||||
|
(in thousands)
|
2015
|
2014
|
2013
|
||||||||
|
Employee stock options
|
$
|
194
|
|
$
|
135
|
|
$
|
293
|
|
||
|
Restricted stock awards and units
|
2,658
|
|
1,683
|
|
1,343
|
|
|||||
|
Employee stock purchase plan
|
143
|
|
289
|
|
329
|
|
|||||
|
401(k) match in common stock
|
284
|
|
513
|
|
513
|
|
|||||
|
Outside director fees in common stock
|
341
|
|
367
|
|
166
|
|
|||||
|
Total stock-based compensation expense
|
$
|
3,620
|
|
$
|
2,987
|
|
$
|
2,644
|
|
||
|
Stock-based Compensation Expense - by expense type
|
For the Fiscal Years Ended September 30,
|
||||||||||
|
(in thousands)
|
2015
|
2014
|
2013
|
||||||||
|
Cost of revenue
|
$
|
341
|
|
$
|
466
|
|
$
|
562
|
|
||
|
Selling, general, and administrative
|
2,847
|
|
1,912
|
|
1,382
|
|
|||||
|
Research and development
|
432
|
|
609
|
|
700
|
|
|||||
|
Total stock-based compensation expense
|
$
|
3,620
|
|
$
|
2,987
|
|
$
|
2,644
|
|
||
88
For the fiscal years ended
September 30, 2015
,
2014
and
2013
, total stock-based compensation expense did not agree with the amount listed on our statements of shareholders' equity primarily due to the timing difference between the expense accrued and the issuance of common stock for the payment of outside directors fees and our 401(k) company match and due to reclassification of stock-based compensation expense related to discontinued operations.
The stock based compensation expense above relates to continuing operations. Included within discontinued operations is
$1.0 million
,
$1.5 million
, and
$1.6 million
of stock based compensation expense for the fiscal years ended
September 30,
2015
and
2014
and
2013
, respectively.
Capital Stock
Our authorized capital stock consists of
50 million
shares of common stock, no par value, and
5,882,000
shares of preferred stock,
$0.0001
par value. As of
September 30, 2015
, we had
32.6 million
and
25.7 million
shares of common stock issued and outstanding, respectively. There were no shares of preferred stock issued or outstanding as of
September 30, 2015
.
Warrants
As of
September 30, 2014
, warrants representing the right to purchase
400,001
shares, of our common stock were outstanding. Since the warrants expired on
April 1, 2015
, no warrants were outstanding as of
September 30, 2015
. See
Note 5 - Fair Value Accounting
for additional information related to the valuation of our warrants.
401(k) Plan
We have a savings plan that qualifies as a deferred salary arrangement under Section 401(k) of the Internal Revenue Code. Under this savings plan, participating employees may defer a portion of their pretax earnings, up to the Internal Revenue Service annual contribution limit. All employer contributions were made in common stock through June 2015 and since then have been made in cash. For the fiscal years ended
September 30, 2015
,
2014
and
2013
we contributed approximately
$0.3 million
,
$0.5 million
and
$0.5 million
, respectively, in common stock to the savings plan. Our matching contribution in cash for the fiscal year ended
September 30, 2015
was approximately
$0.2 million
. All participant accounts will have any of their holdings in company stock liquidated as of
December 3, 2015
.
Employee Stock Purchase Plan
We maintain an Employee Stock Purchase Plan (ESPP) that provides employees an opportunity to purchase common stock through payroll deductions. The ESPP is a 6-month duration plan with new participation periods beginning on
February 25
and
August 26
of each year. The purchase price is set at
85%
of the average high and low market price of our common stock on either the first or last day of the participation period, whichever is lower, and contributions are limited to the lower of
10%
of an employee's compensation or
$25,000
. At the 2012 Annual Meeting, our shareholders approved an amendment to the ESPP that increased the total number of shares of common stock on which options may be granted under the ESPP to
2,250,000
shares. On
March 5, 2014
, our shareholders approved an amendment to the ESPP that increased the total number of shares of common stock on which options may be granted under the ESPP by
1,000,000
shares to
3,250,000
shares. We issue new shares of common stock to satisfy the issuance of shares under this stock-based compensation plan. Common stock issued under the ESPP during the fiscal years ended
September 30, 2015
,
2014
and
2013
totaled
121,000
,
341,000
and
344,000
shares, respectively. As of
September 30, 2015
, the total amount of common stock issued under the ESPP totaled
2,278,272
shares.
Officer and Director Share Purchase Plan
On January 21, 2011, the Compensation Committee of the Board approved an Officer and Director Share Purchase Plan, or ODPP, which allows executive officers and directors to purchase shares of our common stock at fair market value in lieu of salary or, in the case of directors, director fees. Eligible individuals may voluntarily participate in the ODPP by authorizing payroll deductions or, in the case of directors, deductions from director fees for the purpose of purchasing common stock. Elections to participate in the ODPP may only be made during open trading windows under our insider trading policy when the participant does not otherwise possess material non-public information concerning the Company. The Board of Directors has authorized 125,000 shares to be made available for purchase by officers and directors under the ODPP. Common stock issued under the ODPP during the fiscal years ended
September 30, 2015
,
2014
and
2013
totaled
0
,
1,600
and
4,500
shares, respectively.
89
Income (Loss) Per Share
The following table sets forth the computation of basic and diluted net income (loss) per share:
|
Basic and Diluted Net (Loss) Income Per Share
|
For the Fiscal Years Ended September 30,
|
|||||||||||
|
(in thousands, except per share)
|
2015
|
2014
|
2013
|
|||||||||
|
Numerator:
|
||||||||||||
|
(Loss) income from continuing operations
|
$
|
(2,272
|
)
|
$
|
4,082
|
|
$
|
(5,554
|
)
|
|||
|
Income from discontinued operations
|
65,372
|
|
770
|
|
10,542
|
|
||||||
|
Total
|
63,100
|
|
4,852
|
|
4,988
|
|
||||||
|
Allocation of undistributed earnings - continuing operations
|
||||||||||||
|
Continuing operations
|
(2,272
|
)
|
4,082
|
|
(5,554
|
)
|
||||||
|
Undistributed earnings-allocated to participating securities
|
—
|
|
(6
|
)
|
(18
|
)
|
||||||
|
Allocation of undistributed earnings - continuing operations
|
(2,272
|
)
|
4,076
|
|
(5,572
|
)
|
||||||
|
Allocation of undistributed earnings - discontinued operations
|
||||||||||||
|
Discontinued operations
|
65,372
|
|
770
|
|
10,542
|
|
||||||
|
Undistributed earnings-allocated to participating securities
|
—
|
|
—
|
|
(8
|
)
|
||||||
|
Allocation of undistributed earnings - discontinued operations
|
65,372
|
|
770
|
|
10,534
|
|
||||||
|
Undistributed earnings allocated to common shareholders for basic net income per share
|
$
|
63,100
|
|
$
|
4,846
|
|
$
|
4,962
|
|
|||
|
Undistributed earnings allocated to common shareholders for diluted net income per share
|
$
|
63,100
|
|
$
|
4,846
|
|
$
|
4,962
|
|
|||
|
Denominator:
|
||||||||||||
|
Denominator for basic net (loss) income per share - weighted average shares outstanding
|
30,012
|
|
30,453
|
|
26,531
|
|
||||||
|
Dilutive options outstanding, unvested stock units and ESPP
|
—
|
|
324
|
|
—
|
|
||||||
|
Denominator for diluted net (loss) income per share - adjusted weighted average shares outstanding
|
30,012
|
|
30,777
|
|
26,531
|
|
||||||
|
Net (loss) income per basic share:
|
||||||||||||
|
Continuing operations
|
$
|
(0.08
|
)
|
$
|
0.13
|
|
$
|
(0.21
|
)
|
|||
|
Discontinued operations
|
2.18
|
|
0.03
|
|
0.40
|
|
||||||
|
Net income per basic share
|
$
|
2.10
|
|
$
|
0.16
|
|
$
|
0.19
|
|
|||
|
Net (loss) income per diluted share:
|
|
|
|
|||||||||
|
Continuing operations
|
$
|
(0.08
|
)
|
$
|
0.13
|
|
$
|
(0.21
|
)
|
|||
|
Discontinued operations
|
2.18
|
|
0.03
|
|
0.40
|
|
||||||
|
Net income per diluted share
|
$
|
2.10
|
|
$
|
0.16
|
|
$
|
0.19
|
|
|||
|
Weighted average antidilutive options, unvested restricted stock units and awards, warrants and ESPP shares excluded from the computation
|
1,391
|
|
1,936
|
|
2,672
|
|
||||||
|
Average market price of common stock
|
$
|
5.81
|
|
$
|
4.69
|
|
$
|
4.64
|
|
|||
For diluted income (loss) per share, the denominator includes all outstanding common shares and all potential dilutive common shares to be issued. For the fiscal years ended
September 30, 2015
,
2014
and
2013
, we excluded
1.4 million
,
1.9 million
and
2.7 million
, respectively, of weighted average outstanding stock options, restricted stock awards, restricted stock units and warrants from the calculation of diluted net income (loss) per share because their effect would have been anti-dilutive.
90
Future Issuances
As of
September 30, 2015
, we had common stock reserved for the following future issuances:
|
Future Issuances
|
Number of Common Stock Shares Available for Future Issuances
|
|
|
Exercise of outstanding stock options
|
696,459
|
|
|
Unvested restricted stock units
|
570,231
|
|
|
Purchases under the employee stock purchase plan
|
971,728
|
|
|
Issuance of stock-based awards under the Equity Plans
|
625,459
|
|
|
Purchases under the officer and director share purchase plan
|
88,741
|
|
|
Issuance of stock-based awards under the 2007 Directors' Stock Award Plan, as amended
|
208,162
|
|
|
Total reserved
|
3,160,780
|
|
|
NOTE 16.
|
Geographical Information
|
Following the sale of the Photovoltaics Business on
December 10, 2014
, the Company has one remaining reportable segment: Fiber Optics.
See also Note 4 - Discontinued Operations
for additional disclosures.
EMCORE's Fiber Optics business provides optical components, as well as a provider of complete end-to-end solutions for high-speed communications network infrastructures, enabling systems and service providers to meet growing demand for bandwidth and connectivity. EMCORE’s advanced optical technologies are designed for cable television (CATV) and fiber-to-the-premise (FTTP) networks, telecommunications and data centers, satellite communications, aerospace and defense, wireless networks, and broadcast and professional audio/video systems.
On
October 22, 2014
, EMCORE entered into the Digital Products Agreement with NeoPhotonics pursuant to which the Company agreed to sell the Digital Products Business to NeoPhotonics for an aggregate purchase price of
$17.5 million
, subject to certain purchase price adjustments. On
January 2, 2015
, EMCORE completed the sale of the Digital Products Business.
The financial results of the Photovoltaics and Digital Products Businesses are presented as "discontinued operations" on the consolidated statements of operations for the fiscal years ended
September 30, 2015
,
2014
and
2013
; and the assets and liabilities of the Photovoltaics and Digital Products Businesses are presented as "Assets of discontinued operations" and "Liabilities of discontinued operations" on the consolidated balance sheet as of
September 30, 2014
. No Photovoltaics or Digital Products assets and liabilities that were sold remain on the consolidated balance sheet as of
September 30, 2015
.
We evaluate our reportable segment pursuant to ASC 280,
Segment Reporting.
The Company's Chief Executive Officer is the chief operating decision maker and he assesses the performance of the operating segment and allocates resources to segment based on their business prospects, competitive factors, net revenue, operating results, and other non-GAAP financial ratios. Based on this evaluation, the Company operates as a single reportable segment.
91
Revenue
: The following tables set forth revenue by geographic region with revenue assigned to geographic regions based on our customers’ billing address and exclude the discontinued operations discussed above.
|
Revenue by Geographic Region
|
For the Fiscal Years Ended September 30,
|
||||||||||
|
(in thousands)
|
2015
|
2014
|
2013
|
||||||||
|
United States
|
$
|
55,736
|
|
$
|
37,284
|
|
$
|
45,228
|
|
||
|
Asia
|
16,885
|
|
8,652
|
|
11,583
|
|
|||||
|
Europe
|
8,249
|
|
7,746
|
|
3,729
|
|
|||||
|
Other
|
815
|
|
1,832
|
|
431
|
|
|||||
|
Total revenue
|
$
|
81,685
|
|
$
|
55,514
|
|
$
|
60,971
|
|
||
Significant Customers
: Significant customers are defined as customers representing greater than 10% of our consolidated revenue. Revenue from
four
of our significant customers represented
61%
of our consolidated revenue for the fiscal year ended
September 30, 2015
. Revenue from
three
of our significant customers represented
41%
and
40%
of our consolidated revenue for the fiscal years ended
September 30, 2014
and
2013
, respectively.
Long-lived Assets
: Long-lived assets consist primarily of property, plant, and equipment and intangible assets. Long-lived assets that were disposed of as the result of the Photovoltaics and Digital Products Asset Sales were included in "Assets of discontinued operations" on the Consolidated Balance Sheet as of
September 30, 2014
, and accordingly, are not included in the following table.
|
Long-lived Assets
|
As of
|
As of
|
|||||
|
(in thousands)
|
September 30, 2015
|
September 30, 2014
|
|||||
|
United States
|
$
|
3,356
|
|
$
|
4,997
|
|
|
|
International
|
5,569
|
|
5,531
|
|
|||
|
Long-lived assets
|
$
|
8,925
|
|
$
|
10,528
|
|
|
As of
September 30, 2015
and
2014
, approximately
38%
and
47%
, respectively, of our long-lived assets were located in the United States. The remaining assets are primarily located in China. During the fiscal year ended
September 30, 2015
, as a result of the revision in the estimated amount and timing of cash flows for asset retirement obligations in the United States, the Company reduced its asset retirement obligations liability by
$2.9 million
with an offsetting reduction to property, plant, and equipment, net of
$2.1 million
, and recorded a gain from the change in estimate on ARO obligation of
$0.8 million
.
See Note 14 - Commitments and Contingencies
for additional information.
92
|
NOTE 17.
|
Selected Quarterly Financial Information (unaudited)
|
The following tables present our unaudited consolidated results of operations for the eight most recently ended quarters. We believe that all necessary adjustments, consisting only of normal recurring adjustments, have been included in the amounts below to present fairly the selected quarterly information when read in conjunction with the consolidated financial statements and notes included elsewhere in this Annual Report. Our results from operations vary substantially from quarter to quarter. Accordingly, the operating results for a quarter are not necessarily indicative of results for any subsequent quarter or for the full year. We have experienced and expect to continue to experience significant fluctuations in quarterly results.
On
December 10, 2014
, we sold our Photovoltaics Business to SolAero. On
January 2, 2015
, we sold our Digital Products Business to NeoPhotonics. These asset sales are reported as discontinued operations, and therefore are excluded from the continuing operations presented below.
EMCORE CORPORATION
Quarterly Consolidated Statements of Operations
For the Fiscal Year Ended
September 30, 2015
(in thousands, except (loss) income per share)
(unaudited)
|
For the Three Months Ended
|
|||||||||||||||
|
December 31,
|
March 31,
|
June 30,
|
September 30,
|
||||||||||||
|
2014
|
2015
|
2015
|
2015
|
||||||||||||
|
Revenue
|
$
|
18,416
|
|
$
|
19,057
|
|
$
|
21,194
|
|
$
|
23,018
|
|
|||
|
Cost of revenue
|
13,237
|
|
12,678
|
|
13,511
|
|
13,568
|
|
|||||||
|
Gross profit
|
5,179
|
|
6,379
|
|
7,683
|
|
9,450
|
|
|||||||
|
Operating expense (income):
|
|||||||||||||||
|
Selling, general, and administrative
|
8,627
|
|
5,954
|
|
4,543
|
|
5,587
|
|
|||||||
|
Research and development
|
2,174
|
|
2,022
|
|
2,274
|
|
2,649
|
|
|||||||
|
Gain from change in estimate on ARO obligation
|
(845
|
)
|
—
|
|
—
|
|
—
|
|
|||||||
|
Loss on sale of assets
|
228
|
|
—
|
|
—
|
|
—
|
|
|||||||
|
Total operating expense
|
10,184
|
|
7,976
|
|
6,817
|
|
8,236
|
|
|||||||
|
Operating (loss) income
|
(5,005
|
)
|
(1,597
|
)
|
866
|
|
1,214
|
|
|||||||
|
Other income (expense):
|
|||||||||||||||
|
Interest (expense) income, net
|
(130
|
)
|
165
|
|
4
|
|
36
|
|
|||||||
|
Foreign exchange gain (loss)
|
57
|
|
(6
|
)
|
50
|
|
(239
|
)
|
|||||||
|
Change in fair value of financial instruments
|
36
|
|
86
|
|
—
|
|
—
|
|
|||||||
|
Total other (expense) income
|
(37
|
)
|
245
|
|
54
|
|
(203
|
)
|
|||||||
|
(Loss) income from continuing operations before income tax benefit (expense)
|
(5,042
|
)
|
(1,352
|
)
|
920
|
|
1,011
|
|
|||||||
|
Income tax benefit (expense)
|
1,912
|
|
396
|
|
(456
|
)
|
339
|
|
|||||||
|
(Loss) income from continuing operations
|
(3,130
|
)
|
(956
|
)
|
464
|
|
1,350
|
|
|||||||
|
Income from discontinued operations, net of tax
|
59,258
|
|
4,008
|
|
1,976
|
|
130
|
|
|||||||
|
Net income
|
$
|
56,128
|
|
$
|
3,052
|
|
$
|
2,440
|
|
$
|
1,480
|
|
|||
|
Per share data:
|
|||||||||||||||
|
Net (loss) income per basic share:
|
|||||||||||||||
|
Continuing operations
|
$
|
(0.10
|
)
|
$
|
(0.03
|
)
|
$
|
0.02
|
|
$
|
0.05
|
|
|||
|
Discontinued operations
|
1.90
|
|
0.13
|
|
$
|
0.06
|
|
0.01
|
|
||||||
|
Net income per basic share
|
$
|
1.80
|
|
$
|
0.10
|
|
$
|
0.08
|
|
$
|
0.06
|
|
|||
|
Net (loss) income per diluted share:
|
|||||||||||||||
|
Continuing operations
|
$
|
(0.10
|
)
|
$
|
(0.03
|
)
|
$
|
0.02
|
|
$
|
0.05
|
|
|||
|
Discontinued operations
|
1.90
|
|
0.13
|
|
0.06
|
|
0.01
|
|
|||||||
|
Net income per diluted share
|
$
|
1.80
|
|
$
|
0.10
|
|
$
|
0.08
|
|
$
|
0.06
|
|
|||
|
Weighted-average number of basic shares outstanding
|
31,217
|
|
32,077
|
|
31,203
|
|
25,615
|
|
|||||||
|
Weighted-average number of diluted shares outstanding
|
31,217
|
|
32,077
|
|
31,432
|
|
25,896
|
|
|||||||
93
EMCORE CORPORATION
Quarterly Consolidated Statements of Operations
For the Fiscal Year Ended
September 30, 2014
(in thousands, except (loss) income per share)
(unaudited)
|
For the Three Months Ended
|
|||||||||||||||
|
December 31,
|
March 31,
|
June 30,
|
September 30,
|
||||||||||||
|
2013
|
2014
|
2014
|
2014
|
||||||||||||
|
Revenue
|
$
|
14,663
|
|
$
|
12,953
|
|
$
|
13,596
|
|
$
|
14,302
|
|
|||
|
Cost of revenue
|
12,272
|
|
10,055
|
|
10,937
|
|
10,136
|
|
|||||||
|
Gross profit
|
2,391
|
|
2,898
|
|
2,659
|
|
4,166
|
|
|||||||
|
Operating expense (income):
|
|||||||||||||||
|
Selling, general, and administrative
|
5,656
|
|
4,328
|
|
5,364
|
|
7,891
|
|
|||||||
|
Research and development
|
1,824
|
|
2,676
|
|
2,340
|
|
2,466
|
|
|||||||
|
Gain on sale of assets
|
—
|
|
—
|
|
—
|
|
(100
|
)
|
|||||||
|
Total operating expense
|
7,480
|
|
7,004
|
|
7,704
|
|
10,257
|
|
|||||||
|
Operating loss
|
(5,089
|
)
|
(4,106
|
)
|
(5,045
|
)
|
(6,091
|
)
|
|||||||
|
Other income (expense):
|
|||||||||||||||
|
Interest expense, net
|
(126
|
)
|
(117
|
)
|
(134
|
)
|
(145
|
)
|
|||||||
|
Foreign exchange gain (loss)
|
100
|
|
(90
|
)
|
(12
|
)
|
(5
|
)
|
|||||||
|
Gain on sale of investment
|
290
|
|
17
|
|
—
|
|
—
|
|
|||||||
|
Change in fair value of financial instruments
|
(78
|
)
|
7
|
|
110
|
|
(5
|
)
|
|||||||
|
Other income
|
—
|
|
—
|
|
—
|
|
51
|
|
|||||||
|
Total other income (expense)
|
186
|
|
(183
|
)
|
(36
|
)
|
(104
|
)
|
|||||||
|
Loss from continuing operations before income tax benefit (expense)
|
(4,903
|
)
|
(4,289
|
)
|
(5,081
|
)
|
(6,195
|
)
|
|||||||
|
Income tax benefit (expense)
|
1,080
|
|
(433
|
)
|
732
|
|
23,171
|
|
|||||||
|
(Loss) income from continuing operations
|
(3,823
|
)
|
(4,722
|
)
|
(4,349
|
)
|
16,976
|
|
|||||||
|
Income (loss) from discontinued operations, net of tax
|
$
|
1,769
|
|
$
|
(710
|
)
|
$
|
1,199
|
|
$
|
(1,488
|
)
|
|||
|
Net (loss) income
|
$
|
(2,054
|
)
|
$
|
(5,432
|
)
|
$
|
(3,150
|
)
|
$
|
15,488
|
|
|||
|
Per share data:
|
|||||||||||||||
|
Net (loss) income per basic share:
|
|||||||||||||||
|
Continuing operations
|
$
|
(0.13
|
)
|
$
|
(0.16
|
)
|
$
|
(0.14
|
)
|
$
|
0.55
|
|
|||
|
Discontinued operations
|
0.06
|
|
(0.02
|
)
|
0.04
|
|
(0.05
|
)
|
|||||||
|
Net (loss) income per basic share
|
$
|
(0.07
|
)
|
$
|
(0.18
|
)
|
$
|
(0.10
|
)
|
$
|
0.50
|
|
|||
|
Net (loss) income per diluted share:
|
|||||||||||||||
|
Continuing operations
|
$
|
(0.13
|
)
|
$
|
(0.16
|
)
|
$
|
(0.14
|
)
|
$
|
0.55
|
|
|||
|
Discontinued operations
|
0.06
|
|
(0.02
|
)
|
0.04
|
|
(0.05
|
)
|
|||||||
|
Net (loss) income per diluted share
|
$
|
(0.07
|
)
|
$
|
(0.18
|
)
|
$
|
(0.10
|
)
|
$
|
0.50
|
|
|||
|
Weighted-average number of basic shares outstanding
|
29,938
|
|
30,392
|
|
30,656
|
|
30,752
|
|
|||||||
|
Weighted-average number of diluted shares outstanding
|
29,938
|
|
30,392
|
|
30,656
|
|
30,992
|
|
|||||||
94
Report of Independent Registered Public Accounting Firm
The Board of Directors and Stockholders
EMCORE Corporation:
We have audited the accompanying consolidated balance sheets of EMCORE Corporation and subsidiaries (the Company) as of
September 30, 2015
and
2014
, and the related consolidated statements of operations and comprehensive income, shareholders' equity, and cash flows for each of the years in the three-year period ended
September 30, 2015
. These consolidated financial statements are the responsibility of the Company's management. Our responsibility is to express an opinion on these consolidated financial statements based on our audits.
We conducted our audits in accordance with the standards of the Public Company Accounting Oversight Board (United States). Those standards require that we plan and perform the audit to obtain reasonable assurance about whether the financial statements are free of material misstatement. An audit includes examining, on a test basis, evidence supporting the amounts and disclosures in the financial statements. An audit also includes assessing the accounting principles used and significant estimates made by management, as well as evaluating the overall financial statement presentation. We believe that our audits provide a reasonable basis for our opinion.
In our opinion, the consolidated financial statements referred to above present fairly, in all material respects, the financial position of EMCORE Corporation and subsidiaries as of
September 30, 2015
and
2014
, and the results of their operations and their cash flows for each of the years in the three-year period ended
September 30, 2015
, in conformity with U.S. generally accepted accounting principles.
We also have audited, in accordance with the standards of the Public Company Accounting Oversight Board (United States), the Company's internal control over financial reporting as of
September 30, 2015
, based on criteria established in
Internal Control - Integrated Framework (1992)
issued by the Committee of Sponsoring Organizations of the Treadway Commission (COSO), and our report dated
December 14, 2015
, expressed an unqualified opinion on the effectiveness of the Company's internal control over financial reporting.
/s/ KPMG LLP
Albuquerque, New Mexico
December 14, 2015
95
ITEM 9
.
Changes in and Disagreements with Accountants on Accounting and Financial Disclosure
None.
ITEM 9A
.
Management's Annual Report on Internal Control over Financial Reporting
a. Evaluation of Disclosure Controls and Procedures
Our management, with the participation of its Chief Executive Officer (Principal Executive Officer) and Chief Financial Officer (Principal Financial Officer and Accounting Officer), evaluated the effectiveness of the Company's disclosure controls and procedures (as defined in Rules 13a-15(e) and 15d-15(e) promulgated under the Act) as of the end of the period covered by this Annual Report on Form 10-K. Based upon this evaluation, our Chief Executive Officer and our Chief Financial Officer concluded that our disclosure controls and procedures were effective as of the end of the period covered by this report.
b. Management's Annual Report on Internal Controls over Financial Reporting
Our management is responsible for establishing and maintaining adequate internal control over financial reporting, as such is defined in Exchange Act Rules 13a-15(f) and 15d-15(f). Under the supervision of our Chief Executive Officer and Chief Financial Officer and with the participation of our management, we conducted an evaluation of the effectiveness of our internal control over financial reporting as of
September 30, 2015
based on the framework in
Internal Control - Integrated Framework (1992)
issued by the Committee of Sponsoring Organizations of the Treadway Commission (“COSO”). Based on that evaluation, our management concluded that our internal control over financial reporting was effective as of
September 30, 2015
.
c. Changes in Internal Control over Financial Reporting
There were no changes in the Company's internal control over financial reporting (as defined in Rule 13a-15(f) and 15(d)-15(f) promulgated under the Act) during the quarter ended
September 30, 2015
that have materially affected, or are reasonably likely to materially affect, the Company's internal control over financial reporting.
d. Limitations on Effectiveness of Controls and Procedures
Our management, including our Chief Executive Officer and Chief Financial Officer, does not expect that our disclosure controls or our internal controls over financial reporting will prevent or detect all errors and all fraud. A control system, no matter how well designed and operated, can provide only reasonable, not absolute, assurance that the control system's objectives will be met. Further, the design of a control system must reflect the fact that there are resource constraints, and the benefits of controls must be considered relative to their costs. Because of the inherent limitations in all control systems, no evaluation of controls can provide absolute assurance that all control issues and instances of fraud, if any, within the Company have been detected. These inherent limitations include the realities that judgments in decision-making can be faulty, and that breakdowns can occur because of simple error or mistake. Controls can also be circumvented by individual acts, by collusion of two or more people, or by management override of the controls. The design of any system of controls is based, in part, upon certain assumptions about the likelihood of future events, and there can be no assurance that any design will succeed in achieving its stated goals under all potential future conditions. Over time, controls may become inadequate because of changes in conditions or deterioration in the degree of compliance with associated policies or procedures. Because of the inherent limitations in a cost-effective control system, misstatements due to error or fraud may occur and not be detected.
The effectiveness of our internal controls over financial reporting as of
September 30, 2015
, has been audited by KPMG LLP, our independent registered public accounting firm, as stated in their report which is included as follows.
96
Report of Independent Registered Public Accounting Firm
The Board of Directors and Stockholders
EMCORE Corporation:
We have audited EMCORE Corporation's internal control over financial reporting as of
September 30, 2015
, based on criteria established in
Internal Control - Integrated Framework (1992)
issued by the Committee of Sponsoring Organizations of the Treadway Commission (COSO). EMCORE Corporation's management is responsible for maintaining effective internal control over financial reporting and for its assessment of the effectiveness of internal control over financial reporting, included in the accompanying Management's Annual Report on Internal Control over Financial Reporting. Our responsibility is to express an opinion on the Company's internal control over financial reporting based on our audit.
We conducted our audit in accordance with the standards of the Public Company Accounting Oversight Board (United States). Those standards require that we plan and perform the audit to obtain reasonable assurance about whether effective internal control over financial reporting was maintained in all material respects. Our audit included obtaining an understanding of internal control over financial reporting, assessing the risk that a material weakness exists, and testing and evaluating the design and operating effectiveness of internal control based on the assessed risk. Our audit also included performing such other procedures as we considered necessary in the circumstances. We believe that our audit provides a reasonable basis for our opinion.
A company's internal control over financial reporting is a process designed to provide reasonable assurance regarding the reliability of financial reporting and the preparation of financial statements for external purposes in accordance with generally accepted accounting principles. A company's internal control over financial reporting includes those policies and procedures that (1) pertain to the maintenance of records that, in reasonable detail, accurately and fairly reflect the transactions and dispositions of the assets of the company; (2) provide reasonable assurance that transactions are recorded as necessary to permit preparation of financial statements in accordance with generally accepted accounting principles, and that receipts and expenditures of the company are being made only in accordance with authorizations of management and directors of the company; and (3) provide reasonable assurance regarding prevention or timely detection of unauthorized acquisition, use, or disposition of the company's assets that could have a material effect on the financial statements.
Because of its inherent limitations, internal control over financial reporting may not prevent or detect misstatements. Also, projections of any evaluation of effectiveness to future periods are subject to the risk that controls may become inadequate because of changes in conditions, or that the degree of compliance with the policies or procedures may deteriorate.
In our opinion, EMCORE Corporation maintained, in all material respects, effective internal control over financial reporting as of
September 30, 2015
, based on criteria established in
Internal Control — Integrated Framework (1992
) issued by the Committee of Sponsoring Organizations of the Treadway Commission.
We also have audited, in accordance with the standards of the Public Company Accounting Oversight Board (United States), the consolidated balance sheets of EMCORE Corporation and subsidiaries as of
September 30, 2015
and
2014
, and the related consolidated statements of operations and comprehensive income, shareholders' equity and cash flows for each of the years in the three-year period ended
September 30, 2015
, and our report dated
December 14, 2015
expressed an unqualified opinion on those consolidated financial statements.
/s/ KPMG LLP
Albuquerque, New Mexico
December 14, 2015
97
ITEM 9B
. Other Information
Not Applicable.
PART III
.
ITEM 10
. Directors, Executive Officers and Corporate Governance
Information regarding our executive officers and directors required by this Item is incorporated by reference to our Definitive Proxy Statement in connection with our Annual Meeting of Stockholders (Proxy Statement), which will be filed with the Securities and Exchange Commission within 120 days after the fiscal year ended
September 30, 2015
. Information required by Item 405 of Regulation S-K is incorporated by reference to the section entitled “Section 16(a) Beneficial Ownership Reporting Compliance” in the Proxy Statement referenced above. Information required by Items 407(c)(3), (d)(4) and (d)(5) of Regulation S-K is incorporated by reference to the Section entitled “Proposal 1: Election of Directors - Governance of the Company - Board Committees” in the Proxy Statement.
We have adopted a code of ethics entitled the “EMCORE Corporation Code of Business Conduct and Ethics,” which is applicable to all employees, officers, and directors of the Company. The full text of our Code of Business Conduct and Ethics is included with the Corporate Governance information available on our website (www.emcore.com). We intend to disclose any changes in or waivers from our code of ethics for our directors and executive officers to the extent disclosure is required by the applicable rules of the SEC and NASDAQ Stock Market LLC by posting such information on its website or by filing a Current Report on Form 8-K.
ITEM 11
. Executive Compensation
Information required by this Item is incorporated by reference to the sections entitled “Proposal 1: Election of Directors - Director Compensation for Fiscal Year
2015
” “Compensation Discussion and Analysis,” “Executive Compensation,” “Compensation Committee Report” and “Compensation Committee Interlocks and Insider Participation” in the Proxy Statement.
ITEM 12
. Security Ownership of Certain Beneficial Owners and Management and Related Stockholder Matters
Information regarding security ownership of certain beneficial owners and management is incorporated by reference to the section entitled “Security Ownership of Certain Beneficial Owners and Management” in the Proxy Statement.
Information regarding our equity compensation plans is incorporated by reference to the section entitled “Equity Compensation Plan Information ” in the Proxy Statement.
ITEM 13
. Certain Relationships, Related Transactions and Director Independence
Information required by this Item is incorporated by reference to the sections entitled “Proposal 1: Election of Directors - Governance of the Company - Related Person Transaction Approval Policy” and “Proposal 1 - Election of Directors - Governance of the Company - Director Independence” in the Proxy Statement.
ITEM 14
. Principal Accounting Fees and Services
Information required by this Item is incorporated by reference to the section entitled “Fiscal Years
2015
&
2014
Auditor Fees and Services” in the Proxy Statement.
98
ITEM 15
. Exhibits and Financial Statement Schedules
|
(a)(1)
|
Financial Statements
|
Included in Part II, Item 8 of this Annual Report on Form 10-K:
|
•
|
Consolidated Statements of Operations and Comprehensive Income for the fiscal years ended September 30,
2015
,
2014
, and
2013
|
|
•
|
Consolidated Balance Sheets as of September 30,
2015
and
2014
|
|
•
|
Consolidated Statements of Shareholders' Equity for the fiscal years ended September 30,
2015
,
2014
, and
2013
|
|
•
|
Consolidated Statements of Cash Flows for the fiscal years ended September 30,
2015
,
2014
, and
2013
|
|
•
|
Notes to Consolidated Financial Statements
|
|
•
|
Report of Independent Registered Public Accounting Firm
|
|
(a)(2)
|
Financial Statement Schedules
|
The applicable financial statement schedules required under this Item 15(a)(2) are presented in our consolidated financial statements and notes thereto under Item 8 of this Annual Report on Form 10-K.
|
(a)(3)
|
Exhibits
|
|
2.1
|
Master Purchase Agreement, dated March 27, 2012, between Sumitomo Electric Industries, Ltd. and the Company (incorporated by reference to Exhibit 2.1 to the Company's Quarterly Report on Form 10-Q/A filed on August 7, 2012). (+)
|
|
2.2
|
Asset Purchase Agreement, dated August 5, 2012, between Suncore Photovoltaic Technology Co, Ltd. and the Company (incorporated by reference to Exhibit 2.10 to the Company's Annual Report on Form 10-K filed on December 13, 2012).
|
|
2.3
|
Asset Purchase Agreement, dated as of September 17, 2014, by and between EMCORE Corporation and SolAero Technologies Corp. (f/k/a Photon Acquisition Corporation) ( incorporated by reference to Exhibit 2.1 to the Company's Current Report on Form 8-K filed on September 18, 2014).
|
|
2.4
|
Amendment No. 1, dated as of November 26, 2014, to that certain Asset Purchase Agreement, dated as of September 17, 2014, by and between EMCORE Corporation and SolAero Technologies Corp. (f/k/a Photon Acquisition Corporation) (incorporated by reference to Exhibit 2.1 to the Current Report on Form 8-K filed by the Registrant on November 26, 2014).
|
|
2.5
|
Asset Purchase Agreement, dated October 22, 2014, by and between EMCORE Corporation and NeoPhotonics Corporation (incorporated by reference to Exhibit 2.1 to the Company's Current Report on Form 8-K filed on October 24, 2014).
|
|
2.6
|
Amendment No. 1, dated January 2, 2015, to that certain Asset Purchase Agreement, dated as of October 22, 2014, by and between EMCORE Corporation and NeoPhotonics Corporation (incorporated by reference to Exhibit 2.1 to the Company's Current Report on Form 8-K filed on January 5, 2015).
|
|
3.1
|
Restated Certificate of Incorporation, dated April 4, 2008, (incorporated by reference to Exhibit 3.1 to the Company's Current Report on Form 8-K filed on April 4, 2008).
|
|
3.2
|
Certificate of Amendment of Restated Certificate of Incorporation, dated February 15, 2012 (incorporated by reference to Exhibit 3.1 to the Company's Current Report on Form 8-K filed on February 16, 2012).
|
|
3.3
|
Certificate of Amendment of Restated Certificate of Incorporation of EMCORE Corporation, dated September 18, 2014 (incorporated by reference to Exhibit 3.1 to the Company's Current Report on Form 8-K filed on September 18, 2014).
|
|
3.4
|
Certificate of Designation Establishing the Series A Junior Participating Preferred Stock and Fixing the Powers, Designations, Preferences and Relative, Participating, Optional and Other Special Rights, and the Qualifications, Limitations and Restrictions, of the Series A Junior Participating Preferred Stock, dated September 18, 2014 (incorporated by reference to Exhibit 3.1 to the Company's Current Report on Form 8-K filed on September 18, 2014).
|
|
3.5
|
By-Laws of EMCORE Corporation, as amended through December 10, 2014 (incorporated by reference to Exhibit 3.1 to the Company's Current Report on Form 8-K filed on December 10, 2014).
|
|
4.1
|
Specimen Certificate for Shares of Common Stock (incorporated by reference to Exhibit 4.1 to Amendment No. 3 to the registration statement on Form S-1 filed on February 24, 1997).
|
99
|
4.2
|
Tax Benefits Preservation Plan, dated September 17, 2014, by and between EMCORE Corporation and American Stock Transfer & Trust Company, LLC (incorporated by reference to Exhibit 4.1 to the Company's Current Report on Form 8-K filed on September 18, 2014).
|
|
10.1
|
Stipulation of Compromise and Settlement, dated as of November 28, 2007, executed by the Company and the other defendants and the plaintiffs in the Federal Court Action and the State Court Actions (incorporated by reference to Exhibit 10.19 to the Company’s Annual Report on Form 10-K filed on December 31, 2007).
|
|
10.2
|
Settlement Agreement, dated as of December 4, 2013, by and among Steven R. Becker, Matthew A. Drapkin, BC Advisors, LLC, Becker Drapkin Management, L.P., Becker Drapkin Partners (QP), L.P., Becker Drapkin Partners, L.P., and the Company (incorporated by reference to Exhibit 10.30 to the Company's Annual Report on Form 10- K filed on December 6, 2013).
|
|
10.3†
|
Outside Directors Cash Compensation Plan, effective October 20, 2005, as amended and restated on February 13, 2006 (incorporated by reference to Exhibit 10.3 to the Company’s Current Report on Form 8-K filed on February 17, 2006).
|
|
10.4†
|
Officer and Director Share Purchase Plan (incorporated by reference to Exhibit 10.1 to the Company’s Current Report on Form 8-K filed on January 27, 2011).
|
|
10.5†
|
2007 Directors' Stock Award Plan (incorporated by reference to Exhibit A to the Company's Proxy Statement filed on January 25, 2013).
|
|
10.6†
|
2010 Equity Incentive Plan, as amended and restated on June 14, 2011 (incorporated by reference to Exhibit 10.1 to the Company’s Current Report on Form 8-K filed on June 16, 2011).
|
|
10.7†
|
Form of award agreement under 2010 Equity Incentive Plan
|
|
10.8†
|
2012 Equity Incentive Plan, as amended on March 5, 2014 (incorporated by reference to Exhibit A to the Company's Proxy Statement filed on January 28, 2014).
|
|
10.9†
|
Form of award agreements under 2012 Equity Incentive Plan
|
|
10.10†
|
EMCORE Corporation 2000 Employee Stock Purchase Plan, as amended March 5, 2014 (incorporated by reference to Exhibit B to the Company's Proxy Statement filed on January 28, 2014).
|
|
10.11†
|
Form of Indemnification Agreement entered into with directors and executive officers (incorporated by reference to Exhibit 10.1 of the Company's Current Report on Form 8-K filed on December 14, 2012).
|
|
10.12†
|
Employment Agreement entered into by the Company and Dr. Hong Q. Hou as of August 2, 2011 (incorporated by reference to Exhibit 10.4 to the Company’s Quarterly Report on Form 10-Q filed on August 4, 2011).
|
|
10.13†
|
Separation Agreement and General Release, dated September 17, 2014, by and between EMCORE Corporation and Dr. Hong Q. Hou (incorporated by reference to Exhibit 10.1 to the Company's Current Report on Form 8-K filed on September 18, 2014).
|
|
10.14†
|
Retention Letter Agreement, dated September 17, 2014, between EMCORE Corporation and Dr. Hong Q. Hou (incorporated by reference to Exhibit 10.2 to the Company's Current Report on Form 8-K filed on September 18, 2014).
|
|
10.15†
|
Employment Agreement, dated December 10, 2014, by and between EMCORE Corporation and Jeff Rittichier (incorporated by reference to Exhibit 10.1 to the Company's Current Report on Form 8-K filed on December 10, 2014).
|
|
10.16†
|
Employment Agreement entered into by the Company and Mark B. Weinswig as of August 2, 2011 (incorporated by reference to Exhibit 10.5 to the Company’s Quarterly Report on Form 10-Q filed on August 4, 2011).
|
|
10.17†
|
Retention Letter Agreement, dated September 17, 2014, between EMCORE Corporation and Mark Weinswig (incorporated by reference to Exhibit 10.3 to the Company's Current Report on Form 8-K filed on September 18, 2014).
|
|
10.18†
|
Retention Letter Agreement, dated September 17, 2014, between EMCORE Corporation and Monica Van Berkel (incorporated by reference to Exhibit 10.4 to the Company's Current Report on Form 8-K filed on September 18, 2014).
|
|
10.19†
|
Separation Agreement and General Release, dated December 10, 2014, by and between EMCORE Corporation and Monica Van Berkel (incorporated by reference to Exhibit 10.2 to the Company's Current Report on Form 8-K filed on December 10, 2014).
|
|
10.20†
|
Retention Letter Agreement, dated September 17, 2014, between EMCORE Corporation and Alfredo Gomez (incorporated by reference to Exhibit 10.5 to the Company's Current Report on Form 8-K filed on September 18, 2014).
|
|
10.21†
|
Separation Agreement and General Release, dated December 10, 2014, by and between EMCORE Corporation and Alfredo Gomez (incorporated by reference to Exhibit 10.3 to the Company's Current Report on Form 8-K filed on December 10, 2014).
|
100
|
10.22†
|
EMCORE Corporation Fiscal 2015 Bonus Plan (incorporated by reference to Exhibit 10.1 to the Company’s Current Report on Form 8-K filed on August 28, 2015)
|
|
10.23†
|
EMCORE Corporation Fiscal 2016 Bonus Plan (incorporated by reference to Exhibit 10.1 to the Company’s Current Report on Form 8-K filed on November 18, 2015)
|
|
21.1**
|
Subsidiaries of the Company.
|
|
23.1**
|
Consent of KPMG LLP.
|
|
24.1
|
Power of Attorney (see the signature page of this Annual Report on Form 10-K)
|
|
31.1**
|
Certificate of Chief Executive Officer Pursuant to Section 302 of the Sarbanes-Oxley Act of 2002
|
|
31.2**
|
Certificate of Chief Financial Officer Pursuant to Section 302 of the Sarbanes-Oxley Act of 2002
|
|
32.1***
|
Certificate of Chief Executive Officer Pursuant to Section 906 of the Sarbanes-Oxley Act of 2002
|
|
32.2***
|
Certificate of Chief Financial Officer Pursuant to Section 906 of the Sarbanes-Oxley Act of 2002
|
|
101.INS**
|
XBRL Instance Document.
|
|
101.SCH**
|
XBRL Taxonomy Extension Schema Document.
|
|
101.CAL**
|
XBRL Taxonomy Extension Calculation Linkbase Document.
|
|
101.LAB**
|
XBRL Taxonomy Extension Label Linkbase Document.
|
|
101.PRE**
|
XBRL Taxonomy Extension Presentation Linkbase Document.
|
|
101.DEF**
|
XBRL Taxonomy Extension Definition Linkbase Document.
|
_________
**
Filed herewith
*** Furnished herewith
†
Management contract or compensatory plan
(+) CERTAIN CONFIDENTIAL INFORMATION CONTAINED IN THIS DOCUMENT, MARKED BY BRACKETS, HAS BEEN OMITTED AND FILED SEPARATELY WITH THE SECURITIES AND EXCHANGE COMMISSION PURSUANT TO RULE 24B-2 OF THE SECURITIES EXCHANGE ACT OF 1934, AS AMENDED.
101
SIGNATURES
Pursuant to the requirements of the Securities Exchange Act of 1934, the registrant has duly caused this report to be signed on its behalf by the undersigned thereunto duly authorized.
|
|
EMCORE CORPORATION
|
||
|
|
|
|
|
|
Date:
|
December 14, 2015
|
By:
|
/s/ Jeffrey Rittichier
|
|
|
|
Jeffrey Rittichier
|
|
|
|
|
Chief Executive Officer
(Principal Executive Officer)
|
|
|
|
|
|
|
|
|
|
|
|
|
Date:
|
December 14, 2015
|
By:
|
/s/ Mark Weinswig
|
|
|
|
Mark Weinswig
|
|
|
|
|
Chief Financial Officer
(Principal Financial and Accounting Officer)
|
|
Each person whose signature appears below constitutes and appoints and hereby authorizes Jeffrey Rittichier such person's true and lawful attorneys-in-fact, with full power of substitution or resubstitution, for such person and in his name, place and stead, in any and all capacities, to sign on such person's behalf, individually and in each capacity stated below, any and all amendments to this Form 10-K, and to file the same, with all exhibits thereto, and other documents in connection therewith, with the Commission granting unto said attorneys-in-fact, full power and authority to do and perform each and every act and thing requisite or necessary to be done in and about the premises, as fully to all intents and purposes as such person might or could do in person, hereby ratifying and confirming all that said attorneys-in-fact, or their substitute or substitutes, may lawfully do or cause to be done by virtue hereof.
102
Pursuant to the requirements of the Securities Exchange Act of 1934, this report has been signed below by the following persons on behalf of the Registrant in the capacities indicated, on
December 14, 2015
.
|
|
Signature
|
Title
|
|
|
|
|
|
/s/ Jeffrey Rittichier
|
Chief Executive Officer
|
|
|
Jeffrey Rittichier
|
(Principal Executive Officer)
|
|
|
/s/ Mark B. Weinswig
|
Chief Financial Officer
|
|
|
Mark B. Weinswig
|
(Principal Financial and Accounting Officer)
|
|
|
/s/ Robert L. Bogomolny
|
Director
|
|
|
|
Robert L. Bogomolny
|
|
|
|
||
|
/s/ Stephen L. Domenik
|
Director
|
|
|
Stephen L. Domenik
|
||
|
|
||
|
/s/ Gerald J. Fine, Ph.D.
|
Chairman of the Board
|
|
|
Gerald J. Fine, Ph.D.
|
||
|
|
/s/ Charles T. Scott
|
Director
|
|
|
Charles T. Scott
|
|
|
|
|
|
103
TABLE OF CONTENTS
Note 1 - Description Of BusinessNote 1. Description Of BusinessNote 2. Summary Of Significant Accounting PoliciesNote 3. Recent Accounting PronouncementsNote 4. Discontinued OperationsNote 5. Fair Value AccountingNote 6. Accounts ReceivableNote 7. InventoryNote 8. Property, Plant, and Equipment, NetNote 9. Intangible AssetsNote 10. Accrued Expenses and Other Current LiabilitiesNote 11. Impact From Thailand FloodNote 12. Credit FacilitiesNote 13. Income and Other TaxesNote 14. Commitments and ContingenciesNote 15. EquityNote 16. Geographical InformationNote 17. Selected Quarterly Financial Information (unaudited)