CHINA GREEN AGRICULTURE, INC.
10-Ks and 10-Qs
|
|
|
|
|
|
|
|
|
|
|
|
|
|
|
|
|
|
|
|
|
|
|
|
|
|
|
|
|
|
|
|
|
|
|
|
|
|
|
|
|
|
|
|
|
|
|
|
|
|
|
|
|
UNITED
STATES
SECURITIES
AND EXCHANGE COMMISSION
Washington,
DC 20549
FORM
10-K
x
ANNUAL
REPORT PURSUANT TO SECTION 13 OR 15(d)
OF
THE SECURITIES EXCHANGE ACT OF 1934
For the
fiscal year ended June 30, 2010
or
¨
TRANSITION
REPORT UNDER SECTION 13 OR 15(d) OF
THE
SECURITIES EXCHANGE ACT OF 1934
For
the transition period from _________ to _____________
Commission
file number: 000-18606
CHINA
GREEN AGRICULTURE, INC.
(Exact
name of registrant as specified in its charter)
|
Nevada
|
36-3526027
|
|
(State
or other jurisdiction of
incorporation
or organization)
|
(IRS
Employer Identification No.)
|
3rd Floor, Borough A, Block
A. No.181, South Taibai Road, Xi’an, Shaanxi Province,
People’s Republic of China
710065
(Address
of Principal Executive Offices, Including Zip Code)
Registrant’s
telephone number:
+86-
29-88266368
Securities
registered pursuant to Section 12(b) of the Act:
|
Title
of each class
|
Name
of each exchange on which registered
|
|
|
Common
Stock, $0.001 Par Value Per Share
|
NYSE
|
Securities
registered pursuant to Section 12(g) of the Act: None.
Indicate
by check mark if the registrant is a well-known seasoned issuer, as defined in
Rule 405 of the Securities Act. Yes
¨
No
x
Indicate
by check mark if the registrant is not required to file reports pursuant to
Section 13 or Section 15(d) of the Exchange Act. Yes
¨
No
x
Indicate
by check mark whether the registrant (1) has filed all reports required to be
filed by Section 13 or 15(d) of the Securities Exchange Act of 1934 during the
preceding 12 months (or for such shorter period that the registrant was required
to file such report(s)), and (2) has been subject to such filing requirements
for the past 90 days. Yes
x
No
¨
Indicate
by check mark whether the registrant has submitted electronically and posted on
its corporate Web site, if any, every Interactive Data File required to be
submitted and posted pursuant to Rule 405 of Regulation S-T (§ 232.405 of this
chapter) during the preceding 12 months (or for such shorter period that the
registrant was required to submit and post such files). Yes
¨
No
¨
Indicate
by check mark if disclosure of delinquent filers pursuant to Item 405 of
Regulation S-K is not contained herein, and will not be contained, to the best
of Registrant’s knowledge, in definitive proxy or information statements
incorporated by reference in Part III of this Form 10-K or any amendment to this
Form 10-K.
¨
Indicate
by check mark whether the registrant is a large accelerated filer, an
accelerated filer, a non-accelerated filer or a smaller reporting company.
See definitions of “large accelerated filer,” “accelerated filer,” and “smaller
reporting company” in Rule 12b-2 of the Exchange Act.
|
Large
accelerated filer
o
|
Accelerated
filer
o
|
|
Non-accelerated
filer
o
Do
not check if a smaller reporting
company
|
Smaller
reporting company
x
|
Indicate
by check mark whether the registrant is a shell company (as defined in Rule
12b-2 of the Exchange Act). Yes
¨
No
x
The
aggregate market value of the voting and non-voting common equity held by
non-affiliates computed by reference to the price at which the common equity was
last sold, or the average bid and asked price of such common equity, as of the
last business day of the registrant’s most recently completed second fiscal
quarter: $225,589,948.50 as of December 31, 2009, based on the closing
price $14.70 of the Company’s common stock on such date.
The
number of outstanding shares of the registrant’s common stock on August 26,
2010 was 26,848,259.
DOCUMENTS
INCORPORATED BY REFERENCE
Portions
of the registrant’s definitive Proxy Statement for the 2010 Annual Meeting of
Stockholders, which the registrant plans to file with the Securities and
Exchange Commission within 120 days after June 30, 2010 are incorporated by
reference in Part III of this Form 10-K to the extent described
herein.
TABLE OF CONTENTS
TO ANNUAL REPORT ON FORM
10-K
FOR
FISCAL YEAR ENDED JUNE 30, 2010
|
PAGE
|
||||
|
PART I
|
3
|
|||
|
Item 1.
|
Business
|
3
|
||
|
Item 1A.
|
Risk
Factors
|
22
|
||
|
Item 2.
|
Properties
|
36
|
||
|
Item 3.
|
Legal
Proceedings
|
38
|
||
|
Item 4.
|
(Removed
and Reserved)
|
38
|
||
|
PART II
|
38
|
|||
|
Item 5.
|
Market
for the Registrant’s Common Equity, Related Stockholder Matters and Issuer
Purchases of Equity Securities
|
38
|
||
|
Item 6.
|
Selected
Financial Data
|
40
|
||
|
Item 7.
|
Management’s
Discussion and Analysis of Financial Condition and Results
of Operations
|
40
|
||
|
Item 7A.
|
Quantitative
and Qualitative Disclosures about Market Risk
|
48
|
||
|
Item 8.
|
Financial
Statements and Supplementary Data
|
48
|
||
|
Item 9.
|
Changes
in and Disagreements with Accountants on Accounting and Financial
Disclosure
|
48
|
||
|
Item 9A.
|
Controls
and Procedures
|
49
|
||
|
Item 9B.
|
Other
Information
|
51
|
||
|
PART III
|
51
|
|||
|
Item 10.
|
Directors,
Executive Officers and Corporate Governance
|
51
|
||
|
Item 11.
|
Executive
Compensation
|
51
|
||
|
Item 12.
|
Security
Ownership of Certain Beneficial Owners and Management and Related
Stockholders Matters
|
51
|
||
|
Item 13.
|
Certain
Relationships and Related Transactions, and Director
Independence
|
51
|
||
|
Item 14.
|
Principal
Accountant Fees and Services
|
51
|
||
|
PART IV
|
51
|
|||
|
Item 15.
|
Exhibits
and Financial Statement Schedules
|
51
|
||
|
SIGNATURES
|
S-1
|
|||
|
EXHIBIT
INDEX
|
E-1
|
|||
|
FINANCIAL
STATEMENTS AND SUPPLEMENTARY DATA
|
F-1
|
|||
FORWARD-LOOKING
STATEMENTS
Certain
statements in this Report, and the documents incorporated by reference herein,
constitute "forward-looking statements". Such forward-looking statements include
statements, which involve risks and uncertainties, regarding, among other
things, (a) our projected sales, profitability, and cash flows, (b) our growth
strategies, (c) anticipated trends in our industries, (d) our future financing
plans, and (e) our anticipated needs for, and use of, working capital. They are
generally identifiable by use of the words “may,” “will,” “should,”
“anticipate,” “estimate,” “plan,” “potential,” “project,” “continuing,”
“ongoing,” “expects,” “management believes,” “we believe,” “we intend,” or
the negative of these words or other variations on these words or comparable
terminology. These statements may be found under “Management’s Discussion and
Analysis of Financial Condition and Results of Operations” and
“Business,” as well as in this Report generally. Actual events or results
may differ materially from those discussed in forward-looking statements as a
result of various factors including risks described in “Risk Factors” in
Item 1A of this Report and matters described in this report generally. In
light of these risks and uncertainties, there can be no assurance that the
forward-looking statements contained in this filing will in fact occur. You
should not place undue reliance on these forward-looking
statements.
2
The
forward-looking statements speak only as of the date on which they are made,
and, except to the extent required by federal securities laws, we undertake no
obligation to update any forward-looking statement to reflect events or
circumstances after the date on which the statement is made or to reflect the
occurrence of unanticipated events.
Unless
otherwise noted, all currency figures in this filing are in U.S. dollars.
References to "yuan" or "RMB" are to the Chinese yuan (also known as the
renminbi). According to
http://www.safe.gov.cn/model_safe_en/index.jsp
,
the official website of the PRC State Administration of Foreign Exchange, as of
August 26, 2010, US $1.00 = 6.8041 yuan (or 1 yuan = US$ 0.14697).
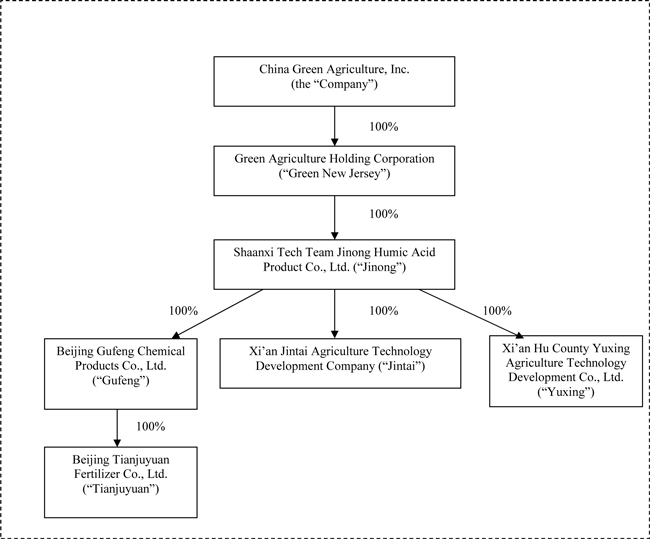
Unless
otherwise specified in this Report, the "Company", "we," "us," "our," and the
"Registrant" refer to (i) China Green Agriculture, Inc. (“Green Nevada”,
formerly known as Discovery Technologies, Inc.), a corporation incorporated in
the State of Nevada; (ii) Green Agriculture Holding Corporation (“Green New
Jersey”), a wholly-owned subsidiary of Green Nevada incorporated in the State of
New Jersey; (iii) Shaanxi TechTeam Jinong Humic Acid Product Co., Ltd.
(“Jinong”), a wholly-owned subsidiary of Green New Jersey organized under the
laws of the People’s Republic of China (the “PRC”); (iv) Xi’an Jintai
Agriculture Technology Development Company (“Jintai”), a wholly-owned subsidiary
of Jinong in the PRC; (v) Xi’an Hu County Yuxing Agriculture Technology
Development Co., Ltd. (“Yuxing”), a wholly-owned subsidiary of Jinong in the
PRC, (vi) Beijing Gufeng Chemical Products Co., Ltd., a wholly-owned subsidiary
of Jinong in the PRC (“Gufeng”), and (vii) its wholly-owned subsidiary in the
PRC, Beijing Tianjuyuan Fertilizer Co., Ltd. (“Tianjuyuan”).
|
ITEM
1.
|
BUSINESS
|
Overview
We are
engaged in the research, development, production and sale of various types of
fertilizers and agricultural products in the PRC though our wholly-owned Chinese
subsidiaries, Jinong, Jintai, Yuxing, Gufeng and Tianjuyuan. Our
primary business is fertilizer products, specifically humic acid-based compound
fertilizer produced through Jinong and compound fertilizer, blended fertilizer,
organic compound fertilizer and mixed organic-inorganic compound fertilizer
produced through Gufeng. In addition, through Jintai, we develop and
produce agricultural products, such as top-grade fruits, vegetables, flowers and
colored seedlings.
Jinong’s
fertilizer business was our main business as it produced approximately
$45,816,377 and $28,889,131, or 88.0% and 82.1% of our total revenues for the
years ended June 30, 2010 and 2009, respectively. Gufeng, a
Beijing-based fertilizer producer, that we acquired on July 2, 2010, had sales
revenues of $54,026,378 and $41,258,388 for the year ended December 20, 2009 and
2008, respectively. Through the acquisition of Gufeng and its direct,
wholly-owned subsidiary, Tianjuyuan, our total annual production capacity
increased from 55,000 to 355,000 metric tons.
Our
research and development system and plans underscore our strong commitment to
producing high quality fertilizer and agricultural products, as evidenced by the
following:
3
(i) Our
subsidiary Jintai operates advanced greenhouse facilities located on
approximately 137,000 square meters (1,474,656 square feet) of land in
Xi’an. These facilities consist of six “intelligent” greenhouses that
are equipped with automated systems, including advanced drip irrigation systems
and water purification facilities, to control environmental variables for
obtaining optimal results in the cultivation of our agriculture products and the
testing of our new fertilizers. Agricultural products manufactured by
Jintai also serve as a research and development base for our fertilizer
products.
(ii) Our
subsidiary Yuxing has the land use right to 353,000 square meters (approximately
3.8 million square feet) of land, on which we have constructed 100 sunlight
greenhouses and are in the process of building 12 “intelligent” greenhouses as
part of a pending research and development center to produce agricultural
products, such as colored seedlings, for commercial sale and to be a testing
field for new fertilizer products. We expect the research and
development center to become fully operational by 2012.
As of
June 30, 2010, we sold our products through a network of Jinong’s 573 regional
distributors covering 21 provinces, 4 autonomous regions and 3 central
government-controlled municipalities in China. We do not rely on any
single distributor as our top five distributors accounted for an approximately
2.5% of our fertilizer revenues for the fiscal year ended June 30,
2010. Through our acquisition of Gufeng and Tianjuyuan, there are
over 150 additional distributors that will be integrated into our sales
network.
As of
June 30, 2010, we developed 157 different fertilizer products. We conduct our
research and development activities through Jintai, Jinong’s direct,
wholly-owned subsidiary, which tests new fertilizers and grow high quality
flowers, vegetables and seedlings for commercial sale. Our product
offerings will increase by over 300 fertilizer products developed by Gufeng and
Tianjuyuan.
During
the fiscal years ended June 30, 2010 and 2009, excluding Gufeng, our revenues
were $52,090,752 and $35,207,997, respectively, and our net income was
$21,158,993 and $14,464,422, respectively.
Recent
Developments
On July
2, 2010, we, through our wholly-owned subsidiary Jinong, acquired Gufeng and its
direct, wholly-owned subsidiary, Tianjuyuan, pursuant to (i) a Share Transfer
Agreement with Mr. Qing Xin Jiang and Ms. Qiong Jia (collectively, the “Gufeng
Shareholders”) and (ii) a Supplementary Agreement with the Gufeng Shareholders,
under which Jinong acquired all of the equity interests in Gufeng for a purchase
price of RMB60 million (approximately $8.8 million) in cash and the issuance of
an aggregate of 2,275,931 shares of common stock, par value $0.001 per share, of
the Company to the Gufeng Shareholders or their designees.
Gufeng was founded in 1993, and
Tianjuyuan was founded in 2001. Both companies are Beijing-based
producers of compound fertilizer, blended fertilizer, organic compound
fertilizer and mixed, organic-inorganic compound fertilizer that sell their
products throughout China and abroad, including to Malaysia and the
Ukraine.
Our
History
The
Company was incorporated under the laws of the state of Kansas on February 6,
1987 under the name Videophone, Inc. The Company had no operations
from December 1996 to December 2007. In October 2007, the Company was
reincorporated in the state of Nevada. On December 26, 2007, the
Company acquired all of the issued and outstanding capital stock of Green New
Jersey, through a share exchange (the “Share Exchange”). As a result
of the Share Exchange, the Company owns 100% of Green New Jersey. The
Share Exchange occurred simultaneously with a private placement of $20,519,255
on December 26, 2007.
Green New
Jersey was incorporated on January 27, 2007 under the laws of the State of New
Jersey. On August 24, 2007, Green New Jersey acquired 100% of the
outstanding shares of Jinong, a company incorporated in the PRC on June 19,
2000. On January 19, 2007, Jinong incorporated Jintai as its direct,
wholly-owned subsidiary to be research and development base for fertilizer
products manufactured by Jinong.
4
After the
acquisition of Green New Jersey, the Company changed its name to China Green
Agriculture, Inc., effective February 5, 2008. The trading symbol changed from
DCOV.OB to CGAG.OB on the same day.
On July
23, 2009, Yuxing became a direct, wholly-owned subsidiary of Jinong to
facilitate the research and development of agricultural products and
fertilizers.
On March 9, 2009, the Company’s common
stock was listed on the NYSE Amex Equities under the trading symbol
“CGA”. On December 4, 2009, the Company voluntarily ceased trading
its common stock on the NYSE Amex Equities and transferred its listing to the
New York Stock Exchange on December 7, 2009. The Company’s ticker
symbol remains “CGA”.
On July
2, 2010, the Company, through Jinong, consummated a transaction to acquire all
of the equity interests of Gufeng and its subsidiary Tianjuyuan. As a result,
Gufeng and Tianjuyuan are now wholly-owned subsidiaries of Jinong and indirect
subsidiaries of the Company. For further details, please see “Recent
Developments”.
Our principal executive
offices are located at 3
rd
Floor,
Borough A, Block A. No. 181, South Taibai Road, Xi’an, Shaanxi Province,
People’s Republic of China 710065 and our telephone number is
+86-29-88266368. Our website address is
www.cgagri.com
.
Our current corporate structure is set
forth in the following diagram:
5
Industry Analysis
Fertilizer
Market in China
China is both the world’s largest
manufacturer and consumer of fertilizer.
According to the China
Statistical Year Book, China’s fertilizer consumption grew at a compound annual
growth rate of 2.5% from 1998 to 2007, reaching 51.1 million metric tons in
2007, as compared to 40.8 million metric tons in 1998.
According to a 2009 Market
Analysis and Development Trend Report of the Fertilizer Industry by Ai Kai Data
& Research Center, by the end of 2010, the total demand for fertilizer in
China will be 56 million tons, up 40% from 2003. The demand for
fertilizer products is continuing to grow as arable land becomes
scarce.
6
China
devotes less of its land to agricultural cultivation than most nations as
reported in the October 3, 2008 article in China Daily, and arable land, which
is defined as land that is capable of being cultivated and supporting
agricultural production, has been steadily reduced in China due to factors such
as increasing industrialization and urbanization, desertification, soil
degradation and low availability of water.
According to the figures provided by the
PRC Ministry of Land and Resources, in 2008, per capita farmland in China was
only 1,400 square meters (15,070 square feet), which is approximately 48.6% of
the world level. In addition, according to the Food and Agriculture Organization
of the United Nations, the Chinese population is expected to reach over 1.4
billion by 2050. As stated in a 2007 research report by Renmin
University of China, arable land in China is predicted to decrease by 20% by
2050. The implication is that by the middle of this century, per
capita farmland in China may be only 16% of the world average level. Moreover,
according to an article dated December 1, 2009 from the China Meteorological
Administration, it is estimated that by 2030, global warming may further reduce
China’s current grain production by 5-10%.
These statistics highlight the fact
that if China is to remain largely self sufficient on an agricultural basis, its
farmers will have to substantially increase crop yields to meet future demand.
Fertilizer demand throughout China has continued to grow as a result of
increased demand in food volume, low crop yields compared to other
producer nations and a decrease in arable land.
In addition to the fertilizer market
demand, governmental support on agricultural industry may serve as another
factor to our business growth. According to an article published in the
Guangming Daily Newspaper, in 2009, China’s government budgeted RMB595.5 billion
for spending on agriculture, rural areas and farmers, an increase of 37.9% from
the previous year. The newspaper article also reported that the budget included
RMB102.9 billion, twice the amount from the previous year, in direct subsidies
for grain production and purchases of agricultural materials. China’s government
is planning additional farm subsidies and land reform initiatives, and to
eliminate certain agricultural taxes and promote the production of organically
grown products by setting new standards. We believe that these supportive
government policies will encourage growth in China’s agricultural industry as
well as drive the sale of our fertilizers and agricultural
products.
Organic
versus Chemical Fertilizers
In general, fertilizer products are
categorized as either organic or chemical fertilizers. Organic fertilizers can
be natural or developed artificially. Natural organic fertilizers include
manure, slurry, worm castings, peat, seaweed, humic acid, brassin and guano.
Artificial organic fertilizers include compost, bloodmeal, bone meal, humic
acid, and are typically supplemented with other nutrient
ingredients. Chemical fertilizers normally are composed of synthetic
chemicals such as phosphate and potassium compounds. The primary difference
between organic fertilizers and chemical fertilizers is in the sourcing process
of ingredients as the nutrient contents are largely the same.
Over the last 20 years, the use of
chemical fertilizers in China has substantially increased food production as
ingredients in chemical fertilizers are fully absorbed into crops as compared to
organic fertilizers. However, years of chemical fertilizer use has created
unintended consequences for the Chinese agriculture industry. Many
chemical fertilizers lack minerals, which crops must absorb from soil to the
extent available. The overall effect is that soil with insufficient
natural resources will yield agricultural products lacking certain
minerals.
In addition, heavy use of chemical
fertilizers may create in "fertilizer burn", which is over-fertilization of a
single nutrient such as nitrogen. The resulting imbalance in compound
salts and soil acidification can dry roots and suspend crop
growth. Another drawback of chemical fertilizers is that they are
more easily depleted from soil by irrigation, rainfall and flooding as compared
to organic fertilizers. The production of chemical fertilizers can be
very intensive in energy consumption. For example, the production of
synthetic ammonia, a common chemical fertilizer, currently consumes about 5% of
the world’s natural gas consumption.
7
Organic fertilizers, on the other hand,
can improve the biodiversity and long-term productivity of
soil. Organic nutrients increase the abundance of soil organisms by
providing organic matter and micronutrients. Unlike chemical
fertilizers, the content, solubility, and release rates of organic fertilizer
nutrients are typically more dilutive and much less readily available to plants.
Organic fertilizers provide nutrients for crops as well as improve physical and
biological mechanisms for storing nutrients in soils, thus mitigating the risk
of over-fertilization. In addition, unlike chemical fertilizers,
organic fertilizers require less application to maintain soil fertility, which
averts the runoff caused by chemical fertilizers in components such as soluble
nitrogen and phosphorus. However, the composition of organic
fertilizer is more complex than a standardized chemical product, and thus more
costly to manufacture. As an alternative to pure chemical fertilizer
use, farmers can also use inorganic fertilizer supplemented with the application
of organic fertilizers.
Since the
1980s, China has intensified the use of chemical fertilizers in order to
increase crop yields. While the increase in crop yield has slowed in
recent years, the overuse of chemical fertilizers also caused many environmental
issues ranging from water pollution to soil damage. As a result, the PRC
government has been promoting the use of environmental friendly green
fertilizers as an effective alternative to chemical
fertilizers. Green fertilizers, including humic acid-based organic
compound fertilizers and mixed organic-inorganic compound fertilizers, assist
crops to gain incremental yield by adding various nutrients essential to soil
and crops, as well as protecting the environment. At present, green
fertilizer products are less used than chemical fertilizers in China, as they
are relatively new to farmers. However, the demand for these green
fertilizers has been increasing and we expect this trend to continue in the
coming years. Although we recently began to distribute our products
into several other Asian and Southeast Asian countries, the PRC is the principal
market for our organic compound fertilizers and related agricultural
products.
The “Green Food” Industry in the
PRC
The rise of the PRC industry for food
that is free from pollutants or harmful chemicals, or “green food”, is also
increasing demand for organic fertilizers. According to the China Green Food
Development Center, or CGFDC, an agency established by the PRC Ministry of
Agriculture, China’s domestic sales of green food increased at a compound annual
growth rate of 26.0% from RMB50 billion in 2001 to RMB200 billion in 2007, and
during the same period, China’s exports of green food increased at a compound
annual growth rate of 33.8%, from $400 million to $2.3 billion.
With the rapid development of the
organic food industry in China, an increasing number of companies have been
entering into the green food sector to take advantage of market opportunities.
In 1990, the PRC Ministry of Agriculture began to encourage the production of
green food. In 1992, the PRC Ministry of Agriculture established the CGFDC to
oversee food quality and the development and management of green food at the
national and provincial levels in the PRC. In 1993, the PRC Ministry
of Agriculture established regulations on the use of green food labeling. In
1996, an identifying trademark for green food was registered in the PRC and put
into use.
Crops grown with the use of our
products are eligible to qualify for the “AA Green Food” rating administered by
the CGFDC. The green food rating system consists of an “A” rating and
a more stringent “AA” rating. The “AA” rating indicates that the
crops contain minimal chemical residue from fertilizers. Although our
products themselves do not bear the “AA green food” designation, they are
(except for those produced by Gufeng) certified by the CGFDC as green food
production material.
According to the statistics from the
CGFDC, China's annual output of green food reached 15 million tons in
2008. However, the domestic consumption level remains relatively low,
comprising approximately 3% of the market share of food
commodities. The low consumption level is primarily due to: (i) small
scale of production of green food; (ii) lack of consumer awareness of green food
and (iii) the presence of counterfeit green food products that adversely affect
consumers purchases.
8
As described by the CGFDC, the
development strategy and goals of China’s green food industry are as follows:
first, to assure the standards of quality and focus on the development of key
products; second, to accelerate the industry’s pace of development to promote
and facilitate the industrialization of green food; third, to implement an
integrated development strategy emphasizing producers, production base and
farmers; fourth, to accelerate the pace of development with the aid of the
government and the market; and fifth, to carry out an international development
strategy, aimed at promoting the export of agricultural products.
According to the China Green Food
Industry Report 2008 by Research in China, a Chinese market research company,
the green food industry is a high growth industry with significant investment
potential. According to the report, leading green food producers will
experience growth as they achieve national and provincial agricultural
industrialization, because they are supported by favorable government policies
and tax breaks.
Growth
Strategy
We believe that our increased
production capacity to produce diverse fertilizer products and our research and
development capabilities, makes us well positioned to benefit from the
anticipated growth of the PRC fertilizer market. We expect to expand
sales and gain increased revenues through the following strategies:
Enhance Production
Utilization.
The current utilization rate of the production
facilities of Jinong and Gufeng are at 40% and 60%,
respectively. Jinong and Gufeng have a total annual production
capacity of 55,000 metric tons and 300,000 metric tons, respectively. To meet
the increasing customer demand, we plan to hire additional sale persons, upgrade
certain existing facilities and construct new facilities.
Expand Capacity and
Diversify Product Offerings.
Through our
acquisition of Gufeng, we increased our annual fertilizer production capacity to
350,000 metric tons and our portfolio of fertilizers to over 460
products. To meet the needs of farmers in the PRC, we will expand our
existing line of fertilizer products, develop new fertilizers and execute other
strategic acquisitions of PRC fertilizer manufacturers that complement our
strategies and product lines.
Capitalize on Synergies Created by
Research and Development Efforts.
In
connection with the pending construction of Yuxing’s research and development
center, we have completed the construction of 100 sunlight greenhouses (Phase I)
and are currently in the process of building 12 “intelligent” greenhouses (Phase
II). We expect the Yuxing facility to help us shorten the fertilizer
market cycle by providing an advanced testing field for new fertilizer products
manufactured by Jinong. In addition, through our research and
development efforts on fertilizers, we expect to simultaneously facilitate the
production of superior agricultural products, such as flower bulbs,
flowers, fruits and vegetables, resulting in increased revenues.
Products
Our principal products are our
fertilizers, which consist of liquid, granular and powdered fertilizers
developed to increase crop yields and quality without the harmful effects of
chemical fertilizers. Our manufacture and sell over 460 fertilizer
products from humic acid-based fertilizers to mixed organic-inorganic compound
fertilizers. In addition, we produce high quality agricultural
products such as fruits, vegetables and flowers for commercial
sale.
Fertilizer
Products
After our
acquisition of Gufeng, we expect that approximately 70% of our fertilizer
business, which is our main business, will continue to be the production and
sale of humic acid-based fertilizers through Jinong. We believe that Jinong
utilizes one of the most advanced automated humic acid production lines in
China. Humic acid is a complex natural, organic ingredient that is
essential for balanced, fertile soil. It is one of the major
constituents of organic matter in fertile soil, making a vital contribution to
the quality of the soil’s composition. When plant or animal matter decomposes,
it naturally turns into a form of humic acid-rich material, such as peat,
lignite or weathered coal.
9
Humic
acid exhibits a high capacity for cation exchange (a chemical process in which
cations of like charge are exchanged equally between a solid and a solution),
which serves to chelate plant nutrient elements and release them as the plant
requires. The chelation process prevents leaching of nutrients by holding them
in the soil solution. Moreover, humic acids can bind soil toxins
along with plant nutrients, thereby strongly stabilizing soils. The regular use
of humic acid organic liquid compound fertilizer can effectively reduce the use
of fertilizer, insecticide, herbicide and water. This mechanism is
important to environmental protection, because it can prevent contamination of
water sources caused by runoff.
In
nature, humic acid improves soil structure and aeration, nutrient absorption and
water retention. It also increases soil’s buffering capacity against
fluctuations in pH levels, and reduces soil crusting and erosion problems from
wind and water as well as radical toxic pollutants. Humic acid
promotes the development of root systems, seed germination and overall plant
development. It also enhances health, resistance to stress and
overall appearance of plants. We believe that there is no synthetic
material currently known to match humic acid's effectiveness and
versatility.
The pure
humic acid used in our fertilizers is distilled and extracted from weathered
coal by way of alkaline digestion and acid recrystallization. Our Jinong
fertilizers are dark brown to black in color, and principally used as a foliar
fertilizer (a liquid, water soluble fertilizer applied to a plant’s foliage by a
fine spray so that the plant can absorb the nutrients through its leaves), or
sprayed directly on soil or injected into the irrigation
systems. Benefits of using our products are to stimulate growth,
yield, and protect plants from drought, disease and temperature damage while
improving soil structure and enhancing soil fertility. For example,
green leafy vegetables will have more than 15% increase in yield by using our
fertilizer to effectively promote the development of root systems.
Through
Jinong, we have a multi-tiered product line of 157 fertilizer products, covering
three product categories: Broad Spectrum Fertilizers for general use, Functional
Fertilizers for the enhancement of certain characteristics in crops and Tailored
Fertilizers for custom needs of very specific crops. In addition to liquid
fertilizer products, Jinong also manufactures granular fertilizers and powdered
fertilizers such as Jinong Humic Acid Boron and Jinong HA high
potassium.
During
the fiscal years ended June 30, 2009 and 2010, we earned $28,889,131 and
$45,816,377, respectively, in gross revenues from sales of our fertilizer
products, representing 82.1% and 88.0 % of our total revenues for such
periods. Such amounts do not include revenues from Gufeng, which we
acquired on July 2, 2010. We expect Gufeng to contribute
approximately $88.4 million in revenues and $10.6 million in net income in the
fiscal year ending June 30, 2011.
Gufeng
and Tianjuyuan produce compound fertilizer, blended fertilizer, organic compound
fertilizer and mixed organic-inorganic compound fertilizer. Gufeng sells its
products under four brands, namely “KEBA”, “Mei Er An”, “Huang Cheng Gen” and
“SPR HOP”, which are all registered trademarks in the
PRC. Tianjuyuan’s products are marketed under the brands “AGR GFJ”
and “T.J.Y.” with T.J.Y. as a PRC registered trademark.
Gufeng
and Tianjuyuan manufacture 168 and 135 fertilizer products,
respectively. Their principal products include:
|
|
·
|
KEBA
fertilizer - a blended fertilizer composed of various elements such as
humic acid, potassium chloride, and potassium sulphate. It is
effective for preventing soil
hardening.
|
|
|
·
|
T.J.Y.
fertilizer - a slow release fertilizer composed of elements such as Sulfur
Coated Urea and Potassium Chloride. This fertilizer is
effective in delivering necessary nutrients to crops at various growth
stages of the crop.
|
10
Gufeng’s product lines are comprised of
50% hybrid organic-inorganic compound fertilizers, 40% inorganic formula
fertilizer, and 10% water soluble fertilizer. The relative sales
revenues from these products is approximately the same as the relative product
mix.
Agricultural
Products
Our
subsidiary, Jintai, produces top-grade fruits, vegetables, flowers and colored
seedlings for commercial sale. Jintai produces the following
categories of products:
|
|
·
|
Top-grade
flowers, including principally, faber cymbidium and phalaenopsis.
These two types of flowers are mainly distributed to the middle and
high-end consumers in Shaanxi Province and its adjacent areas. Their
seedlings are distributed across the country, primarily to the southern
regions of China.
|
|
|
·
|
Green
vegetables and fruits, including, principally, Holland
cucumbers, sweet and colored pimientos, eggplant and Japanese watermelons,
which are distributed to middle and high-end consumers in Shaanxi
Province, primarily in Xi’an.
|
|
|
·
|
Multicolored
seedlings, including, principally, photinia serrulata (Chinese Photinia),
which is distributed to customers across
China.
|
The gross
revenues from the sale of our agricultural products for the fiscal years ended
June 30, 2009 and 2010, were $6,318,866 and $6,274,375, respectively,
representing 17.9% and 12.1% of our total revenues, respectively.
Jintai
was originally established to be the research and development base for humic
acid fertilizers produced by Jinong. By simulating the various
growing conditions and cycles of a variety of plants, such as flowers,
vegetables and seedlings, Jintai can conduct experimental testing to enhance the
efficacy of our new fertilizers.
Fertilizer
Manufacturing Process
Our
production lines employ scientifically-designed production procedures and strict
quality control systems to ensure high quality in our products. Our
production lines are fully automated and run by a central control system with
minimal manual input by control technicians. The machinery and vats for the line
are supplied by a local medical machinery manufacturer and the automated control
systems were developed by us. Our access rights management system ensures that
our proprietary ingredient mixes are protected at all times from any
unauthorized use. Our computer server is connected to the electronic
scales on each of the material input bins to ensure that the exact quantity of
each element or ingredient is delivered every time, thus maintaining our quality
standards and reducing waste. Our production line that produces
liquid fertilizer and powered fertilizer is centrally controlled with a wireless
panoramic audio and video monitoring system that allows connectivity with mobile
terminals such as cell phones.
Through
Jinong, we operate a 6,500 square meter (69,965 square feet) production facility
that manufactures liquid fertilizer products and a 31,000 square meter (333,681
square feet) production facility that produces liquid and highly concentrated
(powdered) fertilizers. The total annual production capacity of these
facilities is 55,000 metric tons and their current utilization rate is
40%.
Through
Gufeng and Tianjuyuan, we operate seven manufacturing facilities comprising
17,930 square meters (192,927 square feet) located in South of Nanzhangdai
Village, Donggaocun Town in the Ping Gu District of Beijing. These
facilities produce powder based fertilizers and have a total annual production
capacity of 300,000 metric tons. The current utilization rate of
these facilities is 60%.
The
manufacturing techniques utilized by Gufeng include extruder granulation, rotary
drum steam granulation, urea-based spraying granulation and resin-coated
sustained release, which enable Gufeng to effectively meet the production
requirements of its different compound fertilizers. To ensure high
standards of quality, Gufeng and Tianjuyuan employ strict quality controls on
purchases of raw materials to sales of products to end users.
11
Excluding
Gufeng and Tianjuyuan, we produced and sold approximately 22,834 metric tons of
fertilizer products during the fiscal year ended June 30, 2010.
Raw
Materials and Suppliers
Fertilizer
Products
Among the
three materials that can be utilized to produce humic acid (weathered coal,
lignite and peat), we have chosen weathered coal as our principal raw material
because it is abundant and relatively cheap at approximately $50 per metric
ton. Although there are numerous weathered coal suppliers available,
we have been using Lupoling Coal Mine Industry and Trade Company (“Lupoling”) as
our sole supplier of weathered coal because of their high-quality weathered coal
and close proximity to our production facilities in Shaanxi
Province. We do not have any purchase volume commitment
pursuant to our supply agreement with Lupoling, which is renewable on a monthly
basis. Lupoling accounted for 0.37% of our purchases of raw materials
in fiscal 2010.
In
addition to weathered coal, we also use approximately 50 different components in
our production process, including elements such as sodium, calcium, zinc, iron
and potassium, all of which can be readily obtained from numerous sources in
local markets. We utilize spectral analysis technology to select the
raw materials with the best quality, and we have specially-trained buyers to
ensure the quality and consistency of the raw materials that we
procure.
The
fertilizer products that Gufeng and Tianjuyuan manufacture incorporate over 50
different raw materials, including coal, sulfuric acid and NPK (nitrogen,
phosphorus and kalium) related compounds such as amide and
hydronitrogen. Hubei Sanning Chemical Products Co., Ltd. and
Shuangying Group are the primary suppliers of raw materials to Gufeng,
accounting for approximately 20% and 10%, respectively, of Gufeng’s sales in
2009. The loss of any of these suppliers would not have a material
adverse effect on our business. We do not believe there is any
material risk of losing these suppliers during the next 12 months.
Our
products are packaged in bottles, bags and boxes. Each type of packaging
material, along with packaging labels, is readily available for purchase from
three to four manufacturers in Shaanxi Province.
Agricultural
Products
The
plants that generate our top-grade flowers and multi-colored seedlings are
mainly planted and cultivated in research and development facilities maintained
by Jintai. We purchase the seeds of green vegetables and fruits from
agricultural companies, such as Rijk Zwaan Company,
that import the seeds
from foreign markets including
Holland and
Japan. We cultivate our agricultural products by applying fertilizers
produced by Jinong.
Inventory
For our
fertilizer products, our efficient production methods allow us to maintain low
inventory levels, which keeps inventory costs down. We purchase raw
materials and packaging materials based on production
demands. Generally, we maintain less than one month’s supply of such
materials. The majority of sales orders we receive are shipped directly to
distributors after production. We normally carry finished goods up to
one week and do not maintain any work-in-process.
For our
agricultural products, we maintain about one month’s inventory because we need a
significant amount of agricultural products to serve as our product testing base
for the research and development of our new fertilizers.
12
Return
Policy
The
Company only accepts returns of defective fertilizer products. During the fiscal
year ended June 30, 2010, the Company did not experience any significant
returns.
Backlog
As of
June 30, 2010, we had a backlog of orders in the amount of $125,885 as compared
to $164,278 in backlog orders as of June 30, 2009.
Seasonality
The peak
selling season for fertilizer products of Jinong used to be from April through
September. However, during the fiscal year ended June 30, 2010, we did not have
any seasonality with respect to our fertilizer sales as approximately 52.7% of
our annual fertilizer sales volume occurred in the first fiscal quarter (summer)
and the fourth fiscal quarter (spring) because our addition of granular and
powder fertilizers experienced demand during the off-peak
season of our liquid fertilizers. Going forward, we may experience a different
seasonality pattern for our fertilizers as compared that in the past because
July through September is the off-peak season for fertilizers sold by
Gufeng.
The peak
selling season for our agricultural products is from October through March the
next calendar year during our second fiscal quarter (fall) and the third fiscal
quarter (winter). During the period from October 2009 through March 2010, Jintai
generated approximately $4.2 million, or 67.6% of our annual sales of
agricultural products. This was primarily due to the strong demand
for our high-end fruits and decorative flowers during the holiday
seasons.
Marketing,
Distribution and Customers
Overview
We
currently market our fertilizer products to private wholesalers and retailers of
agricultural farm products in 21 provinces, 4 autonomous regions and 3 central
government-controlled municipalities in China. For the year
ended June 30, 2010, the following five PRC provinces, collectively accounted
for 38.3% of our fertilizer revenue: Shandong (10.3%), Shaanxi (10.0%), Anhui
(6.2%), Heilongjiang (6.0%) and Henan (5.8%). We believe this
geographically diverse distribution greatly helps us to become a leader in the
humid acid fertilizer market as compared to regional competitors because we are
not heavily dependent on any single geographic area for sales and are able to
raise our brand/product awareness over a broad geographic area. We
also manufacture our humic fertilizer products for export to contracted
distributors in foreign countries, including India, Ecuador, Pakistan and
Lebanon. Total revenues from exported products currently account for less than
1% of our total sales revenue in fiscal 2010.
Our
agricultural products are distributed through various distribution channels in
Shaanxi Province and neighboring provinces. Decorative flowers are usually sold
through our fertilizer distributors to end-users such as flower shops, luxury
hotels and government agencies. Fruits and vegetables are sold to
high-end supermarkets and upscale restaurants. Seedlings are sold primarily to
city planning departments.
We
utilize a multi-tiered product strategy that allows us to tailor our fertilizer
products to the needs and preferences of the various geographic regions in
China. Our fertilizers can be tailored to different crops grown
in varying climate and soil conditions. For example, climate and
rainfall conditions in Southern and Eastern China allow farmers to grow high
margin crops such as fruit and seasonal vegetables. As a result,
these farmers can obtain more return on their investment by using more expensive
and specialized fertilizers. In contrast, we market a broader
spectrum, low-cost fertilizer to farmers in the Northwest areas of China because
climate conditions prevent them from investing in expensive
fertilizers.
13
Our
research and development capabilities, which are described more fully below,
allow us to develop products that are tailored to specific farming needs in
different regions, including different crops, humidity, weather and soil
conditions. For example, our “Red Medlar” product is specially
designed for medlar (a small, brown, apple-like fruit, hard and bitter when ripe
and eaten only when partly decayed) in the Ningxia Autonomous
Region. This product can effectively increase medlar yield and
protect it from foliar disease (the most common culprit for decreased yields of
medlar) and at the same time increase the quality of the fruit.
Marketing
Our marketing staff is trained to
closely work with distributors and customers, including retailers and farmers,
providing professional advice on customizing our products to customer needs and
offering agricultural knowledge and other extensive customer support. In
addition, our employees educate and inform our distributors and customers by
regularly organizing training courses on new agricultural
techniques.
W
e have a total of 21 full-time
marketing employees solely dedicated to collecting and analyzing marketing data
from across 21 provinces, four autonomous regions and three central
government-controlled municipalities in China. By industry norms, we
believe that our product development cycle of three to nine months is relatively
short. Through our regular collection of market data, including the
growth records of a variety of plants cultivated in different soil and climate
conditions, and feedback from our end-users, we are able to conduct nationwide
market analysis, ascertain new product needs, estimate demand and customer
demographics and develop new products that are tailored to current market
needs.
Although
we utilize television advertisements and mass media, the majority of our
marketing efforts are conducted through joint activities with our distributors.
Jinong has 121 independent contractors and 112 full-time employees in marketing
and sales. Gufeng and Tianjuyuan collectively have 50 independent contractors
and 21 full-time employees in marketing and sales. Our sales and
marketing staff works with and trains distributors and retail clients through
lectures and interactive meetings. We emphasize the technological
components of our products to end-users to help them understand the differences
in products and how to effectively use them. Word-of-mouth
advertising and sample trials of new products in new areas are also essential
components of our marketing efforts. In addition, we have established
nationwide telephone hotlines to answer customer questions and have constructed
an SMS text message platform to have real-time interaction with our
customers.
Our
best-selling fertilizers, based on sales volumes of Jinong for the fiscal year
ended June 30, 2010, are listed below:
|
Volume
|
Revenues
|
Percent of
|
||||||||||||
|
Ranking
|
Product Names
|
(Tons)
|
(USD)
|
Jinong’s Sales
|
||||||||||
|
1
|
Sheng
Gen Zhuang Miao
|
832.84 | $ | 1,900,426 | 4.15 | % | ||||||||
|
2
|
Guang
Pu
|
764.64 | $ | 1,894,209 | 4.13 | % | ||||||||
|
3
|
Humic
Acid Boron
|
293.75 | $ | 1,721,056 | 3.76 | % | ||||||||
|
4
|
Hong
Jia
|
318.41 | $ | 1,628,960 | 3.56 | % | ||||||||
|
5
|
Guo
Kang Mei
|
676.13 | $ | 1,537,870 | 3.36 | % | ||||||||
14
Fertilizer
Products
The
fertilizer product market in China is highly fragmented. Our primary
sales strategy is to establish contractual relationships with qualified
distributors throughout the country, who, in turn, will distribute
our products to wholesalers and retailers, and ultimately, the
farmers.
As of
June 30, 2010, we sold our products through a carefully constructed network of
about 573 distributors covering 21 provinces, 4 autonomous regions and 3 central
government-controlled municipalities in China. We developed 43
new distributors during the fiscal year ended June 30, 2010 and terminated 15
distributors based on our evaluation of their performance. By
integrating Gufeng’s network of over 150 distributors in China, we now have a
collective distribution system of over 723 distributors.
The
distributors sell our products to the smaller, local wholesale and retail
outlets who then sell to the end-users, typically farmers. We do not grant
provincial or regional exclusivity because there is currently no single
distributor sufficiently strong enough to warrant exclusivity. We enter into
non-exclusive written distribution agreements with chosen distributors that
demonstrate their ability in local business experience and sufficient regional
sales networks. The distribution agreements do not dictate distribution quantity
because changes in local market condition and weather changes can dramatically
affect sales quotas.
We have
representative offices and sales outlets in Beijing, Tianjin, Shanghai and
Chongqing, with each office having three to four representatives. These regional
offices allow us to more effectively coordinate national sales and marketing
teams. In addition, our sales department works closely with
distributors in various provinces to promote our products, maintain our profile
and to continue to cultivate retail relationships.
For the
fiscal year ended June 30, 2010, sales to our top 10 distributors accounted for
approximately 5.8% of our fertilizer product revenue. No single distributor
accounted for more than 1% of our fertilizer sales in fiscal 2010 with the top
distributor accounting for only 0.8%. As we do not have a significant
concentration of customers, we believe that the loss of any one customer would
not have any significant effect on our business. Neither Gufeng nor Tianjuyuan
rely on any single distributor for 5% or more of their annual fertilizer
revenue.
Agricultural
Products
We
distribute our agricultural products through several networks depending on the
type of product. Our top-grade flowers are mainly distributed through our
fertilizer distribution network. Our green vegetables and
fruits are mainly distributed to a variety of wholesale markets and supermarkets
in Xi’an, while our multi-colored seedlings are distributed to the seedling
centers and planting companies in China with which we have had long-term
cooperation. The following is a list of our top five customers in terms of
revenues for our agricultural products in the fiscal 2010. These customers
accounted for approximately 56.45% of the total revenues from our
agricultural products.
|
Ranking
|
Customer Name
|
Amount (USD)
|
Percentage
of
Jintai's sales
|
|||||||
|
1
|
Shaanxi
Fengshu Yuanli Luhua Co.
|
$
|
1,034,462
|
16.49
|
%
|
|||||
|
2
|
Tianxi
Yuanyi Co.
|
$
|
789,524
|
12.58
|
%
|
|||||
|
3
|
Zhuque
Gaoya shan
|
$
|
702,027
|
11.19
|
%
|
|||||
|
4
|
Shaanxi
Qintong Agriculture Co.
|
$
|
495,428
|
7.90
|
%
|
|||||
|
5
|
Zhouzhi
Ermiao Miaopu
|
$
|
519,863
|
8.29
|
%
|
|||||
15
Retail
Stores and Authorized Retailers
In an
effort to achieve full utilization of Jinong’s annual production capacity of
55,000 tons during the next three years while further expanding brand awareness
of Jinong products, we have successfully implemented two marketing programs in
Shaanxi, Hebei, Anhui, Jiangsu and Guangzhou provinces. These
marketing programs consist of the: (i) establishment of Company directly-owned
retail stores to sell Jinong-branded fertilizer products through the Company’s
designated sales personnel (the “Pilot Program”) and (ii) selection of qualified
retailers from the Company's distributor base of retail customer to be
designated "China Green Agriculture Authorized Retailers". Under the
Pilot Program, we currently have 16 directly-owned stores operating in Shaanxi
Province, with each store having an assigned territory in order not to compete
with any of the Company's existing distributors. Since the launch of
the Pilot Program in January 2010, we have worked closely with our existing
distributors to designate over 600 retailers as “China Green Agriculture
Retailers”. We have entered into agreements with these retailers to prominently
display "China Green Agriculture Authorized Retailer" on their exhibits, and
have well-positioned standardized shelf and product displays in their retail
stores. In addition, we provide the retailers with educational
materials on proper product use, the placement of our branded commercial ads on
their delivery trucks and billboard ads with our product logo and tagline to
target farmers.
Research
and Development
We
currently conduct the bulk of our research and development activities through
Jintai, with Yuxing providing certain research and development work as
well. Through these subsidiaries, we cultivate high-quality flowers,
green vegetables and fruits in our own greenhouses and sell them to various
end-users, including airlines, hotels and restaurants. Jintai
operates a advanced research and development facilities that: (i) provides
testing and an experimental data collection base for the function and feature of
new fertilizers produced by Jinong by simulating the growing conditions and
development stages of a variety of plants, such as flowers, vegetables and
seedlings, which, in turn (ii) produces plants, flowers and vegetables that can
be sold as commercial products to generate sales. In addition, our
research and development capabilities allow us to develop products that are
tailored to specific farming needs, including those required by different crops,
humidity, weather and soil conditions. We act as a testing base for
Northwest A&F University, an agriculture focused university in Shaanxi
Province, and work together to develop fertilizer products with high potential
for commercial success.
In
January 2007, we invested approximately $10 million to purchase and construct
advanced intelligent greenhouse facilities for Jintai to serve as our research
and development base. We believe it has quickly become one of the
leading green fertilizer research facilities in China. Flowers,
fruits and vegetables that are grown for experimental testing of Jinong’s humic
acid organic liquid compound fertilizers are of high quality and value and are
sold to local supermarkets and airline companies. We sold approximately
$6,274,375 of these agricultural products during the fiscal 2010.
During
fiscal 2010, we applied $12,956,621 of the proceeds from our public offerings in
July 2009 and November/December 2009 (the “Public Offerings”) toward
the partial payment of Yuxing’s pending research and development center, which
includes the construction of 100 sunlight greenhouses and 12 “intelligent”
greenhouses. Upon completion, we expect the research and development
center to expand our output of high quality agricultural products for commercial
sale while providing an advanced testing field for new fertilizer
products. The new facility will continue to increase our capability
to produce more products while shortening the new product development cycle,
which allows us to get products to market quickly, thus increasing revenues and
market share. In addition to developing new humic acid-based fertilizer
products, we are planning to develop other agricultural derivatives from humic
acid, such as humic-acid based organic pesticides, which can provide additional
revenue sources and increase profitability.
New
Products
With our
strong and advanced research and development, we have developed more than 157
products and continue to develop new products. During the fiscal year
ended June 30, 2010, we developed 23 new products, which contributed $9,138,691
to our sales revenue for the period.
16
Among the
new products we introduced in fiscal 2010 are several highly concentrated powder
fertilizers, granular fertilizers and liquid fertilizers. Of the new
products, we expect Jinong Humic Acid Boron, a powder based fertilizer, to
generate significant profit margins for us. To supplement our diverse
portfolio of fertilizers, we also introduced several tailored, functional and
broad-spectrum fertilizers.
In
addition to developing new humic acid-based fertilizer products, we are active
in developing derivatives from humic acid, such as humic acid liquid film mulch,
humic acid sodium fodder additives, highly concentrated humic acid powder
fertilizer, humic acid-based pesticide and humic acid compound
fertilizers. We are also developing soil-less seeding and breeding of
colored-leaf plants, rare flowers and new species of fruits and
vegetables.
Intellectual
Property
We hold
the following trademarks registered with the PRC Trademark Offices of National
Industrial and Commerce Administrative Bureau (the “PRC Trademark
Offices”):
|
Trademark
|
Registration Number
|
Valid Term
|
||
|
Jinong
|
No.3906984
|
May
7, 2007 to May 6, 2017
|
||
|
Mei
Er An
|
No.
1508004
|
January
21, 2001 to January 20, 2011
|
||
|
SPR
HOP
|
No.
3320282
|
May
28, 2004 to May 27, 2014
|
||
|
科霸
KEBA
|
No.
760379
|
August
14, 2005 to August 13, 2015
|
||
|
天聚缘
T.J.Y
|
No.
3320283
|
May
28, 2004 to May 27, 2014
|
||
|
Huang
Cheng Gen
|
No.
5219720
|
June
28, 2009 to June 27,
2019
|
A
registered trademark is protected in China for a term of 10 years, and renewable
for another 10 year term under PRC trademark law, as long as the renewal
application is submitted to the PRC Trademark Offices within six months prior to
the expiration of the initial term.
We have
one registered patent, which is held by Jinong. Jinong has one patent
for a fertilizer formulation and one pending patent application for our
proprietary production line and manufacturing processes as follows:
|
Patent/Pending
Patent
Application
|
Type of Patent
|
Patent No.
/Application No.
|
Inventor’s
Name and
Patent Holder
|
Date of
Application
|
Date of
Publication and
Term
|
|||||
|
Patent:
Production
facility
of Humic
Acid
Products
|
Utility
Model
Patent
|
Patent
No.: ZL
2007
2
0031884.2
|
Inventor:
Tao Li
Patent
Holder:
Jinong
|
May
29, 2007
|
May
14, 2008;
10
years
|
|||||
|
Pending
Patent
Application:
Method
and
recipe
of the
water
soluble
humic
acid
fertilizers
|
Utility
Model
Patent
|
Application
No.:
200710017334.x
|
Applicant:
Jinong
|
February
1,
2007
|
Pending.
|
17
The PRC
Patent Law was adopted by the PRC National People's Congress in 1984 and was
subsequently amended in 1992 and 2000. Under the PRC Patent Law, an
invention patent is valid for a term of 20 years and a utility or design patent
is valid for a term of 10 years. All of our registered patents are all utility
patents. Any use of patent without consent or a proper license from
the patent owner constitutes an infringement of patent rights.
In
addition to trademark and patent protection law in China, we also rely on
contractual confidentiality provisions to protect our intellectual property
rights and brand. To help safeguard our intellectual property, our
research and development personnel and executive officers are subject to
confidentiality agreements. They are also subject to a non-compete
covenant following the termination of employment with us and they agree that any
work product belongs to us. Moreover, we also take steps to limit the
number of people involved in the production process and, instead of disclosing
fertilizer ingredients to production employees, we refer to the ingredients by
numbers.
Competitive
Strengths
We
believe the following competitive advantages of our fertilizer products enable
us to compete in the PRC fertilizer market.
Nation-wide sales
network
. In the highly fragmented Chinese fertilizer market,
we have established our own distribution channels with private distributors that
sell our products to retail stores and farmers throughout China. With
our acquisition of Gufeng and Tianjuyuan, we have over 723 distributors
nationwide across 21 provinces, 4 autonomous regions and 3 central
government-controlled municipalities in China. Our distribution and
sales network is one of the largest among manufacturers of humic
acid fertilizers in China. Most of our competitors,
including larger competitors, do not have a sales team as large as ours that
specializes in the sale of humic acid fertilizer products. Moreover,
we expect the regional strengths of Gufeng’s distribution network to expand our
sales coverage to certain cities and counties as well as foreign
markets.
Strong Research and
Development
.
Our research and
development is managed effectively. Typically, it takes only three to nine
months from the decision to develop a new product to mass production, which
ensures product flow and helps to maintain market share. Our strong research and
development department is based at our intelligent greenhouse facilities. The
advanced equipment and soil-free techniques in such facilities simulate the
natural environment in different areas and control selected factors. As a
result, most of Jinong’s experimental work is conducted in Jintai’s greenhouse
facilities, thereby speeding up product development cycles, and cutting costs
without sacrificing accuracy of results. During the fiscal year ended
June 30, 2010, we generated approximately $6,274,375 revenue from sales of
Jintai’s agricultural products, and we anticipate that this source of revenue
will grow in the future. We are currently building 12
new greenhouses over an 88-acre parcel of land in connection with Yuxing's
pending research and development center, which will expand output of high
quality agricultural products for commercial sale while providing an advanced
testing field for new fertilizer products. The new facility will
continue to increase our capability to produce more products while shortening
the new product development cycle, which allows us to release products to market
quickly, thus increasing revenues and market share. In addition to
developing new humic acid-based fertilizer products, we are planning to develop
other agricultural derivatives from humic acid, such as humic-acid based organic
pesticides, which can provide additional revenue sources and increase
profitability. The new facility is expected to reach full capacity in
2012.
Gufeng and Tianjuyuan have a total of
10 employees in research and development. They have independently
developed six technologies: drying fan for urea-based compound fertilizer, heat
balance control system for flexible compound fertilizer, automatic control
system for the anti-block of compound fertilizer, water control technology for
low nitrogen, low potassium and high phosphorus compound
fertilizer, manufacturing technology for salt-alkaline resistance and
soil improvement of compound fertilizer and manufacturing technology for
compound HA fertilizer with high density(NPK≥51%). There is also one
technology under development that is, manufacturing technology for the sustained
release of blending and compound fertilizer.
18
While we
believe that our greenhouse facilities provide us with a competitive advantage
over our competitors, our larger competitors may have better understanding in
certain local markets where they have successfully marketed products over a
period of time and have specifically formulated fertilizers for local plant,
soil and climate conditions. To increase our competitiveness, we will
seek to diversify our fertilizers to benefit a wider range of plants and soil
conditions.
Well-known Brand
.
We believe that
purchasing decisions of customers are often based on strong brand
recognition. “Jinong” is a registered trademark and is well
recognized by end users in our specialty humic acid fertilizers; however,
certain large international fertilizer producers and traders who import
fertilizers to China, such as Cuikang (Hong Kong) Co., Ltd., a distributor for
Yara Phosyn Ltd., a British fertilizer company, have strong brand recognition
and domestic customers generally perceive the quality of the imported products
as higher or more stable than fertilizers currently produced in
China. Gufeng sells its products under four brands, namely Keba,
Meier’an, Huangchenggen and SPR HOP. Tianjuyuan’s products are
marketed under the brands AGR GFJ and T.J.Y. The primary
products sold under the Gufeng and Tianjuyuan brands, include T.J.Y High Silicon
compound fertilizer for rice cultivation, Keba blending fertilizer for corn and
Keba HA compound fertilizer for watermelon.
Automated Production Line and
Process
. All of our major production procedures are controlled
by a centralized computer system only accessible by authorized personnel. Our
production lines are fully automated to ensure that content in each product is
measured exactly according to its recipe by linking the computer server with the
electronic weights on each of the material input bins. In addition,
spectral analysis is used to accurately check the composition of materials.
During fiscal 2010, our highly advanced production lines manufactured a
multi-tiered line of 157 fertilizer products, and we believe that our automated
production lines are among the few advanced lines in our industry. We
have patent protection for Jinong’s proprietary production lines, one of which
has medical grade production equipment with precise quality control, and the
other capable of producing liquid, powder and granular
fertilizers. With the addition of Gufeng, we currently have an annual
production capacity of 355,000 metric tons.
Customer
Support
. We have over 121 local sales and support people
conducting on-site marketing for our products. The sales personnel
speak local dialects and are familiar with the needs of the local
farmers. We have 25 district managers who are responsible for all the
marketing personnel and services in each region of our distribution
network. We believe our strong on-site marketing team with emphasis
on after-sale services separates us from our competitors, including larger
competitors.
Competition
Fertilizer
Products
Based on
our internal estimates, there are approximately 2,000 organic fertilizer
manufacturers in China with no discernable market leaders in the
sector. We believe our competitors are currently comprised of
approximately 80% numerous small-sized local manufacturers, 9% are large
regional competitors such as China Agritech, Inc., 8% are international
companies and 3% are larger national competitors such as Yongye International,
Inc. We believe we are among the larger national fertilizer
manufacturers.
Gufeng’s primary competitor is
Yuntianhua Group Co., Ltd. (“Yuntianhua”), a large, state-owned fertilizer
manufacturer
bas
ed in Kunming, Yunnan
Province.
Yuntianhua manufactures, among other
things,
chemical
fertilizer, organic chemical products
and
salting chemical
products. Acetal Copolymer
based, organic fertilizer is a Yuntianhua product that competes with
Gufeng.
We have
smaller competitors which are generally producers of amino acid compound
fertilizers. The products of these producers are very price
competitive. However, these companies often lack adequate quality
control or process control technologies which produces inconsistent quality in
their products.
19
The
Chinese fertilizer market has been fully opened to foreign companies since
China’s entry into the World Trade Organization in December
2006. Accordingly, the PRC government has increased its fertilizer
import quota and, since January 2007, has reduced the import tariffs on foreign
fertilizer to 1%. However, foreign fertilizers are generally
more expensive than PRC manufactured fertilizers and are not customized to soil
conditions presented by China’s diverse climate and terrains
.
Agricultural
Products
The
competitive market faced by our agriculture products varies depending on the
categories and market of our three main products.
Top-grade
flowers: The main competitors to our flowers are in Xi'an and
its surrounding regions are Western Lanhua Company and the Ningdong Branch of
State Forestry Administration. We believe that our flower products have
comparative advantages in terms of the advanced technologies they are based on,
the superior species of the seedlings we select and the efficiency and stability
of our products. The main competitors to our flower seedlings are
Sanyi Agriculture Technology Co., Ltd in Gansu Province and Yunnan QianHui
Company in Yunnan Province. In addition, unlike most of our
competitors that lack adequate greenhouses, our greenhouse facilities enable us
to produce flower seedlings year-round.
Green
Vegetables and Fruits: Our competitors are primarily the vegetable
planting centers and planters in Shaanxi, Shandong and Gansu provinces that
produce vegetables such as cucumbers and peppers. Our competitive
advantage, which distinguishes us from other competitors, are our advanced
greenhouse facilities, which produce pollution-free green vegetables and fruits,
with the aid of our green fertilizers that improve soil conditions and limit
bacterial growth.
Multi-colored
Seedlings: Our main competitors are Zhejiang Senhe Company and
Chang’an Jiahe Seedling Co., Ltd. Our multi-colored seedlings,
primarily red photinia serrulata, are pure in species and are
imported from other
countries
.
These seedlings
have high survival rates and we sell them at fair market prices.
Employees
We have a
total of 586 full-time employees, of which 160 are employed by Jinong, 47 are
employed by Jintai, 16 are employed by Yuxing, 333 are employed by Gufeng and 30
are employed by Tianjuyuan.
None of
our employees are under collective bargaining agreements. We believe
that we maintain a satisfactory working relationship with our employees and we
have not experienced any significant labor disputes or any difficulty in
retaining our employees or recruiting staff for our operations.
Government
Regulation
Our business operations are subject to
various laws, including environmental, health and safety laws, and regulation by
governmental agencies on the provincial and state levels.
Business and company
registrations, along with the products, are certified on a regular basis and
must be in compliance with the laws and regulations of the PRC and provincial
and local governments and industry agencies, which are controlled and monitored
through the issuance of licenses and certificates including the
following:
“Green”
Certification
. Except for those manufactured by Gufeng and
Tianjuyuan, all of our fertilizer products are certified by the CGFDC as green
food production material. Our Green Food Production Material Certificate was
issued to Jinong on March 30, 2009 and will expire in March 2012. The
certificate is renewable with an application within 90 days prior to its
expiration. Currently, the CGFDC provides two different certifications within
the green food industry: namely, "Green Food Certification" which is granted to
edible foods and "Green Food Production Material Certification" which is granted
to production materials such as our fertilizer products that meet criteria such
as standards that increase human safety and ecological protection of the
environmental, in addition to promoting non-polluting product growth and the use
of non-genetically modified raw materials. Prior to July 2007, the
two categories mentioned above were combined into one category under which
companies were issued a "Green Food Certificate." In an effort to
improve social sustainable development and optimize the regulation of policy for
the PRC green food industry, the CGFDC separated the certification system into
two categories.
20
Operating license
.
Our operating
license enables us to undertake research and development, production, sales and
services of humic acid liquid fertilizer, sales of pesticides, and export and
import of products, technology and equipment. The license (registration no.
610000100003655) is valid through August 8, 2057. Once the term has
expired, the license is renewable. Gufeng and Tianjuyuan maintain
valid operating licenses, which expire on August 1, 2013 and August 7, 2021,
respectively.
Fertilizer Registration
.
Fertilizer
registration is required for the production of fertilizer and issued by the
Ministry of Agriculture of the PRC. The registration numbers held by
Jinong are: Agriculture Fertilizer Numbers. 1085, 1083, 1084, 467, 0865, 0896,
4081 and 4082. There are two kinds of registrations: interim registration and
formal registration. The interim registration is valid for one year and applies
to fertilizers in the stages of in-the-field testing and test selling. Our
certificates No. 467, No. 0865 and No. 0896 are interim fertilizer registration
certificates. Fertilizers that have completed in-the-field testing and test
selling must obtain formal registration, which, if granted, is valid for five
years, and thereafter must be renewed every five years. Our formal fertilizer
registration certificates are listed from No. 0079 through No. 1084
below. Gufeng and Tianjuyuan have 16 interim fertilizer
certificates and over 300 formal certificates that are current and valid for the
production of their fertilizer products.
|
|
Registration
No.
|
Trademark
|
Product
Name
|
Main Technique Index
|
Certificate
Issuance Date
|
Expiration
Date
|
||||||
|
1
|
No.
1085
|
Ji
Nong
|
Humic
Acid Liquid Fertilizer
|
Fe+Mn+Zn+B+Mo≥20
g/l;
Amino
acid
≥100
g/l
|
April
23, 2008
|
April
22, 2013
|
||||||
|
2
|
No.
1083
|
Ji
Nong
|
Humic
Acid Liquid Fertilizer
|
N+P2O5+K2O≥200g/l;
Humic
Acid≥40 g/l
|
April
23,2008
|
April
22, 2013
|
||||||
|
3
|
No.
1084
|
Ji
Nong
|
Humic
Acid Liquid Fertilizer
|
N+P2O5+K2O≥350g/l;
Humic
Acid≥30 g/l
|
April
23,2008
|
April
22, 2013
|
||||||
|
4
|
No.
467
|
Ji
Nong
|
Humic
Acid Liquid Fertilizer
|
N+P2O5+K2O≥23g/l;
Humic
Acid≥80g/l
Cu+Fe+Mn+Zn+B+Mo≥60
g/l
|
March
19, 2009
|
October
18, 2010*
|
||||||
|
5
|
No.0865
|
Ji
Nong
|
Refined
Organic Fertilizer
|
N
2
O
52
O≥10%;
organic
matter≥30%
|
January
25, 2010
|
January
2011*
|
||||||
|
6
|
No.0896
|
Ji
Nong
|
Refined
Organic Fertilizer
|
N
2
O
52
O≥8%;
organic
matter≥30%
|
January
25, 2010
|
April
2011*
|
||||||
|
7.
|
No.
4081
|
Ji
Nong
|
Humic
Acid
|
N+P
2
O
2
+K
2
O≥35.0%
|
November
4,
|
November 2010
|
||||||
|
Liquid
|
Humic
Acid≥3.0%
|
2009
|
||||||||||
|
Fertilizer
|
||||||||||||
|
8.
|
No.
4081
|
Ji
Nong
|
Humic
Acid
|
Fe+Mn+Zn+B≥6.0%
|
November
4,
|
November
2010
|
||||||
|
Liquid
|
Humic
Acid≥3.0%
|
2009
|
||||||||||
|
Fertilizer
|
*
Certificates No. 467, No. 0865 and No. 0896 are interim fertilizer registration
certificates with a one-year term. The Company will apply for formal
certificates before the expiration date.
21
As of the
date of this Report,
we believe we are in
material compliance with all registrations and requirements for the issuance and
maintenance of all licenses required to conduct our businesses and
operations.
An
investment in our common stock involves a high degree of risk. You should
carefully consider the following information about these risks, together with
the other information contained in this Report before investing in our common
stock. If any of the events anticipated by the risks described below occur, our
results of operations and financial condition could be adversely affected which
could result in a decline in the market price of our common stock, causing you
to lose all or part of your investment.
Risks
Related to our Business
We
do not presently maintain business disruption insurance. Any disruption of the
operations in our factories would damage our business.
Our operations could be interrupted by
fire, flood, earthquake and other events beyond our control for which we do not
carry adequate insurance. While we have property damage insurance and automobile
insurance, we do not carry business disruption insurance, which is not readily
available in China. Any disruption of the operations in our factories would have
a significant negative impact on our ability to manufacture and deliver
products, which would cause a potential diminution in sales, the cancellation of
orders, damage to our reputation and potential lawsuits.
We
do not presently maintain product liability insurance, and our property and
equipment insurance does not cover the full value of our property and equipment,
which leaves us with exposure in the event of loss or damage to our properties
or claims filed against us.
We currently do not carry any product
liability or other similar insurance. We cannot assure you that we would not
face liability in the event of the failure of any of our products. We cannot
assure you that, especially as China’s domestic consumer economy and industrial
economy continues to expand, product liability exposure and litigation will not
become more commonplace in the PRC, or that we will not face product liability
exposure or actual liability as we expand our sales into international markets,
like the United States, where product liability claims are more
prevalent.
Our
proprietary fertilizer formula may become obsolete or be illegally disclosed to
competitors, which could materially adversely affect the competitiveness of our
future fertilizer products.
The production of our fertilizer
products is based on our proprietary fertilizer formula. Our future success will
depend upon our ability to address the increasingly sophisticated needs of our
customers by supporting existing and emerging humic acid fertilizer products and
by developing and introducing enhancements to our existing products and new
products on a timely basis that keep pace with evolving industry standards and
changing customer requirements. If our proprietary formula becomes obsolete as
our competitors develop better products than ours, our future business and
financial results could be adversely affected. In addition, although we have
entered into confidentiality agreements with our key employees, we cannot assure
you that if there is a breach of such agreement by an employee, we would not be
adversely affected and lose any competitive advantage that we currently have
with respect to our
proprietary fertilizer
formula. If we are forced to take legal action to protect our
proprietary formula, we will incur significant expense and further can not
guarantee a favorable outcome.
22
If
we fail to adequately protect or enforce our intellectual property rights, we
may be exposed to intellectual property infringement and the value of our
intellectual property rights could diminish.
Our success, competitive position and
future revenues will depend in part on our ability to obtain and maintain patent
protection for our products, methods, processes and other technologies, to
preserve our trade secrets, to prevent third parties from infringing on our
proprietary rights and to operate without infringing the proprietary rights of
third parties. Jinong is in the process of applying for a patent in
the PRC for its proprietary formula as referenced above under the name of Method
and Recipe of the Water Soluble Humic Acid Fertilizers, which we expect to
receive in the next three months; however, we cannot assure you such patent will
be issued, or that existing or future issued patents will be sufficient to
provide us with meaningful protection or commercial advantage.
Jinong is the patent holder of a patent
named Production Facility of Humic Acid Products in the PRC. Our existing
production facility is protected by such patent. Gufeng and
Tianjuyuan do not have patents but currently possess seven proprietary
technologies.
However, we
cannot predict the degree and range of protection patents and confidentiality
agreements with respect to proprietary technologies will afford us against
competitors. Third parties may find ways to invalidate or otherwise circumvent
our patents and proprietary technologies. Third parties may attempt to obtain
patents claiming aspects similar to our patent applications.
We cannot assure you that our current or
potential competitors do not have, and will not obtain, patents that will
prevent, limit or interfere with our ability to make, use or sell our products
in the PRC.
If we need to initiate litigation or
administrative proceedings, such actions may be costly and may divert management
attention as well as expend other resources which could otherwise have been
devoted to our business. An adverse determination in any such litigation will
impair our intellectual property rights and may harm our business, prospects and
reputation. In addition, historically, implementation of PRC intellectual
property-related laws has been lacking, primarily because of ambiguities in the
PRC laws and difficulties in enforcement. Accordingly, intellectual property
rights and confidentiality protections in China may not be as effective as in
the United States or other countries, which increases the risk that we may not
be able to adequately protect our intellectual property. Moreover, litigation
may be necessary in the future to enforce our intellectual property rights.
Future litigation could result in substantial costs and diversion of our
management’s attention and resources, and could disrupt our business, as well as
have a material adverse effect on our financial condition and results of
operations. Given the relative unpredictability of China’s legal system and
potential difficulties enforcing a court judgment in China, there is no
guarantee that we would be able to halt any unauthorized use of our intellectual
property through litigation.
If
we infringe on the intellectual property rights of third parties, we could be
prevented from selling products, forced to pay damages and compelled to defend
against claims by third parties, which, if successful, could cause us to pay
significant damage awards and incur other costs.
Our success also depends in large part
on our ability to use and develop our technology and know-how without infringing
the intellectual property rights of third parties. As litigation becomes more
common in the PRC in resolving commercial disputes, we face a higher risk of
being the subject of intellectual property infringement claims. The validity and
scope of claims relating to humic acid fertilizer production technology and
related devices and machine patents involve complex technical, legal and factual
questions and analysis and, therefore, may be highly uncertain. The defense and
prosecution of intellectual property suits, patent opposition proceedings and
related legal and administrative proceedings can be both costly and time
consuming and may significantly divert the efforts and resources of our
technical and management personnel. An adverse determination in any such
litigation or proceedings to which we may become a party could subject us to
significant liability, including damage awards, to third parties, require us to
seek licenses from third parties (which may not be available on commercially
reasonable terms, if at all), to pay ongoing royalties, or to redesign our
products or subject us to injunctions preventing the manufacture and sale of our
products. Protracted litigation could also result in our customers or potential
customers deferring or limiting their purchase or use of our products until
resolution of such litigation.
23
The occurrence of any acts of God,
war, terrorist attacks and other emergencies which are beyond our control may
have a material adverse effect on our business operations and financial
condition
.
Acts of God, war, terrorist attacks and
other emergencies which are beyond our control may have a material adverse
effect on the economy and infrastructure in the PRC and on the livelihood of the
Chinese population. Our business operations and financial condition
may be materially and adversely affected should such events occur. We
cannot give assurance that any acts of God such as floods, earthquakes, drought
or any war, terrorist attack or other hostilities in any part of the PRC or even
the world, potential or threatened, will not, directly or indirectly, have a
material adverse effect on our business, financial condition and operating
results.
The
industry in which we do business is highly fragmented and competitive and we
face competition from numerous fertilizer manufacturers in China and
elsewhere.
We
compete with numerous local Chinese fertilizer manufacturers. Although we may
have greater resources than many of our competitors, most of which are small
local fertilizer companies, it is possible that these competitors have better
access in certain local markets to customers and prospects, an enhanced ability
to customize products to a particular region or locality and more established
local distribution channels within a small region. We also compete with a few
large PRC national competitors. Although we have advanced automated humic
acid-based fertilizer production lines and green house supported research and
development centers, we cannot assure you that such large competitors will not
develop their own similar production or research and development facilities.
Further, China’s access into the World Trade Organization could lead to
increased foreign competition for us. International producers and traders import
products into China that generally are of higher quality than those produced in
the local Chinese market. If they are localized and become familiar enough of
the type of fertilizer we produce, we may face additional competition. If we are
not successful in our marketing and advertising efforts to increase awareness of
our brands, our revenues could decline, which could have a material adverse
effect on our business, financial condition, results of operations and share
price.
Our major competitors may be better
able than we to successfully endure downturns in our industrial sector. In
periods of reduced demand for our products, we can either choose to maintain
market share by reducing our selling prices to meet competition or maintain
selling prices, which would likely sacrifice market share. Sales and overall
profitability would be reduced in either case. In addition, we cannot assure you
that additional competitors will not enter our existing markets, or that we will
be able to compete successfully against existing or new
competition.
If we are unable to design,
manufacture, and market fertilizer products in a timely and efficient manner, we
may not remain as competitive
.
Most of
our fertilizer products are characterized by short product development cycles
and targeted the unique climate and soil conditions where our customers are
located. Accordingly, we devote a substantial amount of resources to
product development. To compete successfully, we must develop and offer new
and/or improved fertilizer products that are suitable to evolving customer
needs. New fertilizers may be not widely proven. As a result, we may
experience performance difficulties, which may result in delays, setbacks and
cost overruns. Our inability to develop and offer new and/or improved
fertilizer products or to achieve customer acceptance of these products could
limit our ability to compete in the market or to grow revenues at desired rates
of growth.
Disruptions
in the supply of raw materials used in our products could cause us to be unable
to meet customer demand in a timely manner, which could result in the loss of
customers and net sales or could result in a lower profit margin for
us.
Jinong is supplied with over thirty
types of raw materials, of which weathered coal is the primary one as it is the
raw material from which humic acid is extracted and used to manufacture our
products. Although there are numerous weathered coal suppliers
available to us, to date, we have been using Lupoling Coal Mine Industry and
Trade Company of Jinzhong City located in the Shanxi Province (“Lupoling”) as
our sole supplier of weathered coal because of the high quality weathered coal
it provides and its closeness to us in location. Our supply agreement
with Lupoling is renewed on a monthly basis. If Lupoling does not intend to
renew the supply agreement with us for any reason, or if there are any business
interruptions at Lupoling and we are unable to locate an alternative supply in a
timely manner or on the same terms, we may not be able to meet customer demand
of humic acid-based fertilizers in a timely manner or maintain our standards of
quality for humic acid-based fertilizers, which may result in the loss of
customers and net sales or we may not be able to keep our profit margin on our
humic acid-based fertilizers.
24
Gufeng and Tianjuyuan are supplied with
approximately fifty types of raw materials from a diversified pool of
suppliers. Neither Gufeng nor Tianjuyuan are dependent on any single
supplier for its raw materials; however, if we experience a significant increase
in demand or if we need to replace any of these suppliers, we cannot be assured
that the adequate supply of raw materials or a replacement supplier will be
obtained in a timely manner to avoid any material adverse effect on our business
operations and financial condition.
Any
significant fluctuation in our production costs may have a material adverse
effect on our operating results.
The
prices for the raw materials and other inputs to manufacture our fertilizer
products are subject to market forces largely beyond our control, including the
price of weathered coal, our energy costs, mineral and non-mineral elements, and
freight costs. The costs for these inputs may fluctuate significantly based upon
changes in the economy and markets. Although we may pass any increase of such
costs through to our customers, in the event we are unable to do so, we could
incur significant losses and a diminution of our share price.
We
may be subject to more stringent governmental regulation on our agricultural
products.
The production and sale of our
agricultural products in the PRC is regulated by the PRC and the Shanxi
Provincial Government. The legal and regulatory regime governing our industry is
evolving, and we may become subject to different, including more stringent,
requirements than those currently applicable to us. While we believe a more
stringent standard will have a bigger impact on those manufacturers with poor
quality products, we cannot assure you any regulatory change will not adversely
affect our business.
If
we cannot renew our fertilizer registration certificates, we will be unable to
sell some or all of our products. If we cannot receive the formal fertilizer
registration certificates for our new products, upon the expiration of the
temporary registration certificates, we cannot continue to produce such new
products.
All
fertilizers produced in China must be registered with the PRC Ministry of
Agriculture. No fertilizer can be manufactured without such registration. There
are two kinds of registrations: interim registration and formal registration.
The interim registration is valid for one year and applies to fertilizers in the
stages of in-the-field testing and test selling. Fertilizers that have completed
in-the-field testing and test selling must obtain formal registration, which is
valid for five years, and thereafter must be renewed each five years. We have
obtained formal Fertilizer Registration Certificates covering all of our
fertilizer products from the PRC Ministry of Agriculture. After the
acquisition of Gufeng, we currently have 19 interim fertilizer registration
certificates for our fertilizer products, and will apply for formal registration
after we have completed field tests for these products.
Our belief is that the PRC Ministry of
Agriculture generally will grant an application for renewal in the absence of
illegal activity by the applicant. However, there is no assurance that the PRC
Ministry of Agriculture will grant renewal of our formal Fertilizer Registration
Certificates. If we cannot obtain the necessary renewal, we will not be able to
manufacture and sell our fertilizer products in China which will cause the
termination of part or all of our commercial operations for fertilizer products.
With respect to the transformation of the interim fertilizer registration
certificates to formal fertilizer registration certificates, we believe that we
can receive formal fertilizer registration certificates for our two interim
fertilizer registration certificates in due course; however, if the government
imposes additional burden on the application procedure or put temporary
suspension on its certificate granting process due to certain unexpected
incidents occurred in China, we cannot assure you that our formal fertilizer
registration certificates can be obtained without delay or can be
obtained at all in which case our production could be adversely
affected.
25
Potential
environmental liability could have a material adverse effect on our operations
and financial condition.
Our manufacturing operations are
subject to numerous laws, regulations, rules and specifications relating to the
environment, including, among others, the Integrated Emission Standard of Air
Pollutants GB 16297-1996 and the Standard of Environmental Noise of Urban Area
GB 3096-93. Failure to comply with any laws and regulations and
future changes to them may result in significant consequences to us, including
civil and criminal penalties, liability for damages and negative
publicity. Our business and operating results may be materially and
adversely affected if we were to be held liable for violating existing
environmental regulations or if we were to incur significant expenditures to
comply with environmental regulations affecting our operations.
Our
success depends on our management team and other key personnel, the loss of any
of whom could disrupt our business operations.
We
depend, to a large extent, on the abilities and participation of our current
management team, but have a particular reliance upon Mr. Tao Li, our CEO,
President and Chairman of the Board of Directors. The loss of the services of
Mr. Li, for any reason, may have a material adverse effect on our business and
prospects. We cannot assure you that the services of Mr. Li will continue to be
available to us, or that we will be able to find a suitable replacement for him.
We do not carry key man life insurance for our key personnel.
The
agricultural chemicals business is specialized and requires the employment of
personnel with significant scientific and operational experience in the
industry. Accordingly, we must attract, recruit and retain a sizeable workforce
of technically and scientifically competent employees. Our ability to
effectively implement our business strategy will depend upon, among other
factors, the successful recruitment and retention of additional management and
other key personnel that have the necessary scientific, technical and
operational skills and experience with the fertilizer industry. These
individuals are difficult to find in the PRC and we may not be able to retain
such skilled employees. If we are unable to hire individuals with the requisite
experience we may not be able to produce enough products to optimize profits,
research and development initiatives may be delayed and we may encounter
disruptions in production and research which will negatively impact our
financial condition, results of operations and share price.
Mr.
Tao Li, our Chairman, President and CEO may not devote all of his time to our
business.
Our
Chairman, President and CEO, Mr. Tao Li, also serves as Chairman of Xi’an
Techteam Science & Technology Industry (Group) Co. Ltd., a company that is
engaged in hi-tech application fields in China, and Chairman of Kingtone
Wirelessinfo Solution Holding Ltd, a publicly-traded, China-based developer and
provider of mobile enterprise solutions. This may give rise for Mr. Li in
allocating his time to each business. While Mr. Li anticipates having
sufficient time to devote to our business, a lack of adequate time spent by him
on our business may adversely affect our business, financial condition, results
of operations and share price.
26
If
we fail to maintain an effective system of internal control over financial
reporting, we may not be able to accurately report our financial results. As a
result, current and potential investors could lose confidence in our financial
reporting, which could harm our business and have an adverse effect on our stock
price
Pursuant to Section 404 of the
Sarbanes-Oxley Act of 2002, we are required to annually furnish a report by our
management on our internal control over financial reporting. Such report must
contain, among other matters, an assessment by our principal executive officer
and our principal financial officer on the effectiveness of our internal control
over financial reporting, including a statement as to whether or not our
internal control over financial reporting is effective as of the end of our
fiscal year. This assessment must include disclosure of any material weakness in
our internal control over financial reporting identified by management. In
addition, under current SEC rules, we will be required to obtain an attestation
from our independent registered public accounting firm as to our internal
control over financial reporting for our annual report on Form 10-K for our
fiscal year ending June 30, 2010. Performing the system and process
documentation and evaluation needed to comply with Section 404 is both costly
and challenging. During the course of our testing we may identify deficiencies
which we may not be able to remediate in time to meet the deadline imposed by
the Sarbanes-Oxley Act of 2002 for compliance with the requirements of Section
404. In addition, if we fail to maintain the adequacy of our internal
controls, as such standards are modified, supplemented or amended from time to
time, we may not be able to ensure that we can conclude on an ongoing basis that
we have effective internal controls over financial reporting in accordance with
Section 404 of the Sarbanes-Oxley Act of 2002. We engaged a
consulting firm in 2009 to help us design and implement effective internal
controls; however we cannot provide assurance that we will not fail to achieve
and maintain an effective internal control environment on an ongoing basis,
which may cause investors to lose confidence in our reported financial
information and have a material adverse effect on the price of our common
stock.
We
are responsible for the indemnification of our officers and
directors.
Our Bylaws provide for the
indemnification of our directors, officers, employees, and agents, under certain
circumstances, against costs and expenses incurred by them in any litigation to
which they become a party arising from their association with or activities on
our behalf. Consequently, we may be required to expend substantial funds to
satisfy these indemnity obligations.
Our
inability to successfully integrate Gufeng or any other businesses we acquire
could have adverse consequences on our business.
On July 2, 2010, we consummated the acquisition of Gufeng and Tianjuyuan,
Beijing-based producers of compound fertilizer, blended fertilizer, organic
compound fertilizer and mixed, organic-inorganic compound fertilizer. This
acquisition and future acquisitions may result in greater administrative burdens
and operating costs. We cannot assure you that we will be able to manage
or integrate acquired companies or businesses successfully. The process of
integrating Gufeng or other acquired businesses may be disruptive to our
business and may cause an interruption of or a loss of momentum in our business
as a result of the following factors, among others:
|
|
·
|
loss
of key employees or customers;
|
|
|
·
|
possible
inconsistencies in standards, controls, procedures and policies among the
combined companies and the need to implement company-wide financial,
accounting, information, production and other
systems;
|
|
|
·
|
failure
to maintain the quality of products that the companies have historically
provided;
|
|
|
·
|
failure
to upgrade existing production lines of Gufeng or effectively implement
humic acid production technology into existing manufacturing process of
Gufeng;
|
|
|
·
|
effectively
coordinating sales, marketing and distribution functions, including the
cross-selling of products;
|
|
|
·
|
the
need to coordinate geographically diverse organizations,
and
|
|
|
·
|
the
diversion of management's attention from our day-to-day business as a
result of the need to deal with any disruptions and difficulties and the
need to add management resources to do
so.
|
These disruptions and difficulties, if they occur, may cause us to fail to
realize the cost savings, revenue enhancements and other benefits that we may
expect from such acquisitions and may cause material adverse short- and
long-term effects on our operating results and financial
condition.
27
Our
inability to effectively improve the financial performance of Gufeng may have a
material adverse effect on our business, financial condition and results of
operations.
Although
Gufeng had sales revenues of $54,026,378 for its fiscal year ended December 20,
2009, Gufeng’s net income for such period was
$3,755,409. This was primarily due to the lower profit margins on
Gufeng’s products, inefficiencies in production and daily operations and
negative working capital. In addition, rising transportation costs
passed on by Gufeng’s distributors may further erode margins on Gufeng’s
products. As Gufeng is based in Beijing, it is susceptible to rising
costs of labor common in large cities such as Beijing, which may make it
difficult for us to expand the workforce of Gufeng and Tianjuyuan to meet our
production requirements and strategic goals.
During
the next 12 months, we will focus our efforts on integrating Gufeng’s employees,
products and distribution network into our business. However, there
is no assurance that we will be able to effectively do so, which may result in a
material adverse effect on our business, financial condition and results of
operations.
We
have not obtained the land use right over the premises on which certain
facilities of Gufeng, our indirect, wholly-owned subsidiary, is
located. As a result, the lack of a proper title certificate may
jeopardize our right to use the premises and our possession of the
buildings we built on such premises.
Through
Tianjuyuan, we lease approximately 47,333 square meters (509,488 square feet) of
land in the Ping Gu District of Beijing (the “Premises”). Under the
lease dated February 16, 2004 with the village committee of Dong Gao Village and
Zhen Nan Zhang Dai Village in the Beijing Ping Gu District (the “Lease”),
Tianjuyuan leases the land at an annual rent of RMB35,500 (approximately
$5,217). The term of the Lease is from February 1, 2004 to January
31, 2054. We were recently informed by our PRC counsel that the Lease
is invalid and unenforceable pursuant to the PRC Land Administration Law and
related regulations. Therefore, we are in the process of applying for
the proper land use right certificate from the relevant government authorities
in order to legitimize our right over the Premises. However,
there can be no assurance that such land use right certificate will be granted
to us. Until we obtain the land use right certificate, there exists a
risk that the PRC government may declare the Lease invalid, evict our personnel
from the Premises and tear down the buildings we built on the
Premises. As of the date of this report, we have no knowledge of any
pending or threatened governmental actions relating to the
Premises.
Risks
Related to Doing Business in the PRC
Substantially
all of our assets and operations are located in the PRC, and substantially all
of our revenue is sourced from the PRC. Accordingly our results of
operations and financial position are subject to a significant degree to
economic, political and legal developments in the PRC, including the following
risks:
Changes
in the policies of the PRC government could have a significant impact upon the
business we may be able to conduct in the PRC and the profitability of such
business.
The PRC’s economy is in a transition
from a planned economy to a market oriented economy subject to five-year and
annual plans adopted by the government that set national economic development
goals (Source: President Hu’s Report at 17th Party Congress). Policies of the
PRC government can have significant effects on economic conditions in China. The
PRC government has confirmed that economic development will follow the model of
a market economy, such as the United States. Under this direction, we believe
that the PRC will continue to strengthen its economic and trading relationships
with foreign countries and business development in the PRC will follow market
forces. While we believe that this trend will continue, we cannot assure you
that this will be the case. Our interests may be adversely affected by changes
in policies by the PRC government, including:
|
•
|
changes
in laws, regulations or their
interpretation
|
|
•
|
confiscatory
taxation
|
|
•
|
restrictions
on currency conversion, imports or sources of
supplies
|
28
|
•
|
expropriation
or nationalization of private
enterprises
|
Although
the PRC government has been pursuing economic reform policies for more than two
decades, we cannot assure you that the government will continue to pursue such
policies or that such policies may not be significantly altered, especially in
the event of a change in leadership, social or political disruption, or other
circumstances affecting the PRC's political, economic and social
life.
The
PRC laws and regulations governing our current business operations are sometimes
vague and uncertain. Any changes in such PRC laws and regulations may have a
material and adverse effect on our business.
There are substantial uncertainties
regarding the interpretation and application of PRC laws and regulations,
including, but not limited to, the laws and regulations governing our business,
and the enforcement and performance of our arrangements with customers in the
event of the imposition of statutory liens, death, bankruptcy and criminal
proceedings. We and any future subsidiaries are considered foreign persons or
foreign funded enterprises under PRC laws, and as a result, we are required to
comply with PRC laws and regulations. These laws and regulations are sometimes
vague and may be subject to future changes, and their official interpretation
and enforcement may involve substantial uncertainty. The effectiveness of newly
enacted laws, regulations or amendments may be delayed, resulting in detrimental
reliance by foreign investors. New laws and regulations that affect existing and
proposed future businesses may also be applied retroactively. We cannot predict
what effect the interpretation of existing or new PRC laws or regulations may
have on our businesses.
We derive a substantial portion of our
revenues from sales in the PRC and any downturn in the Chinese
economy could have a material adverse effect on our business and financial
condition.
All of our operations are conducted in
the PRC and s
ubstantially
all of our revenues are generated from sales in the PRC. We
anticipate that revenues from sales of our products in the PRC will continue to
represent a substantial proportion of our total revenues in the near
future. Any significant decline in the condition of the PRC economy
could, among other things, adversely affect consumer buying power and discourage
consumption of our products, which in turn would have a material adverse effect
on our revenues and profitability.
Inflation
in the PRC could negatively affect our profitability and growth.
While the PRC economy has experienced
rapid growth, it has been uneven among various sectors of the economy and in
different geographical areas of the country. Rapid economic growth can lead to
growth in the money supply and rising inflation. If prices for our products do
not rise at a rate that is sufficient to fully absorb inflation-driven increases
in our costs of supplies, our profitability can be adversely
affected.
According to the International Monetary
Fund or IMF, the inflation rate in China fluctuated on an annual basis from a
low rate of -1.4% in 1999 to the highest rate of 5.9% in
2008. The IMF estimates that the inflation rate in 2009 was
-0.7%. These fluctuations and economic factors have led to the
adoption by the Chinese government, from time to time, of various corrective
measures designed to restrict the availability of credit or regulate growth and
contain inflation. In order to control inflation in the past, the PRC government
has imposed controls on bank credits, limits on loans for fixed assets and
restrictions on state bank lending. The implementation of these and
other similar policies can impede economic growth and thereby harm the market
for our products.
29
Our subsidiaries are subject to
restrictions on paying dividends and making other payments to our subsidiary,
Green New Jersey; as a result, we might therefore, be unable to pay dividends to
you.
We are a holding company incorporated in
the State of Nevada and do not have any assets or conduct any business
operations other than our investments in our subsidiaries, Green New Jersey,
Jinong and Jintai, Gufeng and Tianjuyuan. As a result of our holding
company structure, we rely entirely on dividends payments from our subsidiaries
in PRC. PRC regulations currently permit payment of dividends only out of
accumulated profits, as determined in accordance with PRC accounting standards
and regulations. Our subsidiaries are also required to set aside a portion of
its after-tax profits according to PRC accounting standards and regulations to
fund certain reserve funds. We may experience difficulties such as lengthy
processing time from the foreign exchange administrative bureau’s side and
formality requirement on paperwork in completing the administrative procedures
necessary to obtain and remit foreign currency. Furthermore, if any of our
subsidiaries incurs debt on its own in the future, the instruments governing the
debt may restrict its ability to pay dividends or make other payments. If we or
Green New Jersey are unable to receive any profits from the operations of our
subsidiaries in the PRC, we may be unable to pay dividends on our common
stock.
Governmental control of currency
conversion may affect the value of your investment.
The PRC government imposes controls on
the convertibility of Renminbi (“RMB”) into foreign currencies and, in certain
cases, the remittance of currency out of the PRC. We receive substantially all
of our revenues in RMB, which is currently not a freely convertible currency.
Shortages in the availability of foreign currency may restrict our ability to
remit sufficient foreign currency to pay dividends, or otherwise satisfy foreign
currency dominated obligations. Under existing PRC foreign exchange regulations,
payments of current account items, including profit distributions, interest
payments and expenditures from the transaction, can be made in foreign
currencies without prior approval from the PRC State Administration of Foreign
Exchange (“SAFE”) by complying with certain procedural requirements. However,
approval from appropriate governmental authorities is required where RMB is to
be converted into foreign currency and remitted out of PRC to pay capital
expenses such as the repayment of bank loans denominated in foreign
currencies.
The PRC government also may at its
discretion restrict access in the future to foreign currencies for current
account transactions. If the foreign exchange control system prevents us from
obtaining sufficient foreign currency to satisfy our currency demands, we may
not be able to pay certain of our expenses as they come due.
The fluctuation of RMB may materially
and adversely affect your investment.
The value of the RMB against the U.S.
dollar and other currencies may fluctuate and is affected by, among other
things, changes in the PRC's political and economic conditions. As we rely
entirely on revenues earned in the PRC, any significant revaluation of RMB may
materially and adversely affect our cash flows, revenues and financial
condition. For example, to the extent that we need to convert U.S. dollars we
receive from an offering of our securities into RMB for our operations,
appreciation of the RMB against the U.S. dollar could lead the RMB equivalent of
the U.S. dollars be reduced and therefore could have a material adverse effect
on our business, financial condition and results of operations. Conversely, if
we decide to convert our RMB into U.S. dollars for the purpose of making
dividend payments on our common stock or for other business purposes and the
U.S. dollar appreciates against the RMB, the U.S. dollar equivalent of the RMB
we convert would be reduced. In addition, the depreciation of significant U.S.
dollar denominated assets could result in a charge to our income statement and a
reduction in the value of these assets.
30
Recent PRC regulations relating to the
establishment of offshore special purpose companies by PRC domestic residents
may subject our PRC resident beneficial owners to personal liability,
limit our ability to inject capital into our PRC subsidiaries, limit our
subsidiaries’ ability to increase their registered capital or distribute profits
to us, or may otherwise adversely affect us.
SAFE issued a public notice in October
2005 requiring PRC domestic residents to register with the local SAFE branch
before establishing or controlling any company outside of China for the purpose
of capital financing with assets or equities of PRC companies, referred to in
the notice as an “offshore special purpose company.” PRC domestic residents who
are stockholders of offshore special purpose companies and have completed round
trip investments but did not make foreign exchange registrations for overseas
investments before November 1, 2005 were retroactively required to register with
the local SAFE branch before March 31, 2006. PRC resident stockholders are also
required to amend their registrations with the local SAFE in certain
circumstances. Internal implementing guidelines issued by SAFE, which became
public in June 2007 (known as Notice 106), expanded the reach of Circular 75.
After consultation with China counsel, we do not believe that any of our PRC
domestic resident stockholders are subject to the SAFE registration requirement,
however, we cannot provide any assurances that all of our stockholders who are
PRC residents will not be required to make or obtain any applicable
registrations or approvals required by these SAFE regulations in the future. The
failure or inability of our PRC resident stockholders to comply with the
registration procedures set forth therein may subject us to fines and legal
sanctions, restrict our cross-border investment activities, or limit our PRC
subsidiaries’ ability to distribute dividends or obtain
foreign-exchange-dominated loans to our company.
As it is uncertain how the SAFE
regulations will be interpreted or implemented, we cannot predict how these
regulations will affect our business operations or future
strategy. For example, we may be subject to more stringent review and
approval process with respect to our foreign exchange activities, such as
remittance of dividends and foreign-currency-denominated borrowings, which may
adversely affect our results of operations and financial
condition. In addition, if we decide to acquire a PRC domestic
company, we cannot assure you that we or the owners of such company, as the case
may be, will be able to obtain the necessary approvals or complete the necessary
filings and registrations required by the SAFE regulations. This may
restrict our ability to implement our acquisition strategy and could adversely
affect our business and prospects.
We
may be subject to fines and legal sanctions by SAFE or other PRC government
authorities if we or our employees who are PRC citizens fail to comply with PRC
regulations relating to employee stock options granted by offshore listed
companies to PRC citizens.
On March 28, 2007, SAFE promulgated
the Operating Procedures for Foreign Exchange Administration of Domestic
Individuals Participating in Employee Stock Ownership Plans and Stock Option
Plans of Offshore Listed Companies, or Circular 78. Under Circular
78, Chinese citizens who are granted share options by an offshore listed company
are required, through a Chinese agent or Chinese subsidiary of the offshore
listed company, to register with SAFE and complete certain other procedures,
including applications for foreign exchange purchase quotas and opening special
bank accounts. We and our Chinese employees who have been granted
share options are subject to Circular 78. Failure to comply with
these regulations may subject us or our Chinese employees to fines and legal
sanctions imposed by SAFE or other PRC government authorities and may prevent us
from further granting options under our share incentive plans to our employees.
Such events could adversely affect our business operations.
The
PRC’s labor law restricts our ability to reduce our workforce in the PRC in the
event of an economic downturn and may increase our production
costs.
In June 2007, the National People’s
Congress of the PRC enacted new labor law legislation called the Labor Contract
Law, which became effective on January 1, 2008. The legislation formalized
workers’ rights concerning overtime hours, pensions, layoffs, employment
contracts and the role of trade unions. Considered one of the strictest labor
laws in the world, among other things, this new law provides for specific
standards and procedures for the termination of an employment contract and
places the burden of proof on the employer. In addition, the law requires the
payment of a statutory severance pay upon the termination of an employment
contract in most cases, including the case of the expiration of a fixed-term
employment contract. Further, the law requires an employer to conclude an
“employment contract without a fixed-term” with any employee who either has
worked for the same employer for 10 consecutive years or more or has had two
consecutive fixed-term contracts with the same employer. An “employment contract
without a fixed term” can no longer be terminated on the ground of the
expiration of the contract, although it can still be terminated pursuant to the
standards and procedures set forth under the new law. Because of the lack of
implementing rules for the new law and the precedents for the enforcement of
such a law, the standards and procedures set forth under the law in relation to
the termination of an employment contract have raised concerns among foreign
investment enterprises in the PRC that such “employment contract without a fixed
term” might in fact become a “lifetime, permanent employment contract.” Finally,
under this law, downsizing of either more than 20 people or more than 10% of the
workforce may occur only under specified circumstances, such as a restructuring
undertaken pursuant to the PRC’s Enterprise Bankruptcy Law, or where a company
suffers serious difficulties in production and/or business operations, or where
there has been a material change in the objective economic circumstances relied
upon by the parties at the time of the conclusion of the employment contract,
thereby making the performance of such employment contract not
possible. To date, there has been very little guidance and precedents
as to how such specified circumstances for downsizing will be interpreted and
enforced by the relevant PRC authorities. All of our employees working for us
exclusively within the PRC are covered by the new law and thus, our ability to
adjust the size of our operations when necessary in periods of recession or less
severe economic downturns may be curtailed. Accordingly, if we face future
periods of decline in business activity generally or adverse economic periods
specific to our business, this new law can be expected to exacerbate the adverse
effect of the economic environment on our results of operations and financial
condition.
31
Our business and financial performance
may be materially adversely affected if the PRC regulatory authorities determine
that our acquisition of Jinong constitutes a Round-trip Investment without the
PRC Ministry of Commerce (“MOFCOM”) approval.
On August 8, 2006, six PRC regulatory
agencies promulgated the Regulation on Merger and Acquisition of Domestic
Companies by Foreign Investors (the “2006 M&A Rules”), which became
effective on September 8, 2006. According to the 2006 M&A Rules,
a “Round-trip Investment” is defined as having taken place when a PRC business
that is owned, directly or indirectly, by PRC individual(s) is sold to a non-PRC
entity that is established or controlled, directly or indirectly, by those same
PRC individual(s) and their PRC affiliates. Under the 2006 M&A Rules, any
Round-trip Investment must be approved by the MOFCOM. The application
of the 2006 M&A Rules with respect to the definition of Round-trip
Investment remains unclear with no consensus currently existing among the
leading PRC law firms regarding the definition, scope of the applicability of
the MOFCOM approval.
We, through Green New Jersey, acquired
100% capital stock of Jinong (the “Jinong Acquisition”), Jinong was a PRC
business whose stockholders were two PRC individuals and a PRC entity, of which
Mr. Tao Li, our current Chairman, President and CEO was the controlling
stockholder holding 52% of its shares. The PRC regulatory authorities may take
the view that the Jinong Acquisition could be part of a Round-trip Investment
The PRC legal counsel of Jinong has opinioned that the Jinong Acquisition did
not violate any PRC law, which would include the 2006 M&A
Rules. We, however, cannot assure you that the PRC regulatory
authorities, MOFCOM in particular, may take the same view as the PRC legal
counsel. If the PRC regulatory authorities take the view that the Jinong
Acquisition constitutes a Round-trip Investment under the 2006 M&A Rules, we
cannot assure you we may be able to obtain the approval required from
MOFCOM.
If the PRC regulatory authorities take
the view that the Jinong Acquisition constitutes a Round-trip Investment without
MOFCOM approval, they could invalidate our acquisition and ownership of Jinong.
Additionally, the PRC regulatory authorities may take the view that the Jinong
Acquisition constitutes a transaction which requires the prior approval of the
China Securities Regulatory Commission, or CSRC, before MOFCOM approval is
obtained. We believe that if this takes place, we may be able to find a way to
re-establish control of Jinong’s business operations through a series of
contractual arrangements rather than an outright purchase of Jinong. We cannot
assure you that such contractual arrangements will be protected by PRC law or
that we can receive as complete or effective economic benefit and overall
control of Jinong’s business than if the Company had direct ownership of Jinong.
In addition, we cannot assure you that such contractual arrangements can be
successfully effected under PRC law. If we cannot obtain MOFCOM or CSRC approval
if required by the PRC regulatory authorities to do so, and if we cannot put in
place or enforce relevant contractual arrangements as an alternative and
equivalent means of control of Jinong, our business and financial performance
will be materially adversely affected.
32
PRC regulation of loans and direct
investment by offshore holding companies to PRC entities may delay or prevent us
from using the proceeds we received from this offering to make loans to our PRC
subsidiaries or to make additional capital contributions to our PRC
subsidiaries, which could materially and adversely affect our liquidity and our
ability to fund and expand our business.
We are an offshore holding company
conducting our operations in China through our PRC subsidiaries. In utilizing
the proceeds we received from any offering, we may make loans to our PRC
subsidiaries, whether currently in existence or to be formed in the future, or
make additional capital contributions to our PRC
subsidiaries.
Any loans we make to our PRC
subsidiaries cannot exceed statutory limits and must be registered with SAFE, or
its local counterparts. Under applicable PRC law, the government authorities
must approve a foreign-invested enterprise’s registered capital amount, which
represents the total amount of capital contributions made by the stockholders
that have registered with the registration authorities. In addition, the
authorities must also approve the foreign-invested enterprise’s total
investment, which is equal to the company’s registered capital plus the amount
of stockholder loans it is permitted to borrow under the law. The ratio of
registered capital to total investment cannot be lower than the minimum
statutory requirement. If we make loans to our operating subsidiaries in China
that does not exceed its current maximum amount of borrowings, we will have to
register each loan with SAFE or its local counterpart for the issuance of a
registration certificate of foreign debts. In practice, it could be
time-consuming to complete such SAFE registration process. Alternatively or
concurrently with the loans, we might make capital contributions to our
operating subsidiaries in China and such capital contributions involve
uncertainties of their own. Further, SAFE promulgated a new circular (known as
Circular 142) in August 2008 with respect to the administration of conversion of
foreign exchange capital contributions of a foreign invested enterprise. The
circular clarifies that RMB converted from foreign exchange capital
contributions can only be used for the activities within the approved business
scope of such foreign invested enterprise and cannot be used for domestic equity
investments unless otherwise permitted.
We cannot assure you that we will be
able to complete the necessary government registrations or obtain the necessary
government approvals on a timely basis, if at all, with respect to future loans
by us to our PRC subsidiaries or with respect to future capital contributions by
us to our PRC subsidiaries. If we fail to complete such registrations or obtain
such approvals, our ability to use the proceeds we receive from this offering
and to capitalize or otherwise fund our PRC operations may be negatively
affected, which could adversely and materially affect our liquidity and our
ability to fund and expand our business.
If
we were deemed as a “resident enterprise” by PRC tax authorities, we could be
subject to tax on our global income at the rate of 25% under the new Enterprise
Income Tax Law (“New EIT Law”) in the PRC and our non-PRC shareholders could be
subject to certain PRC taxes.
Under the
New EIT Law and the implementing rules, both of which became effective January
1, 2008, an enterprise established outside of the PRC with “de facto management
bodies” within the PRC may be considered a PRC “resident enterprise” and will be
subject to the enterprise income tax at the rate of 25% on its global income as
well as PRC enterprise income tax reporting obligations. The implementing rules
of the New EIT Law define “de facto management” as “substantial and overall
management and control over the production and operations, personnel,
accounting, and properties” of the enterprise. If we were to be considered a
“resident enterprise” by the PRC tax authorities, our global income would be
taxable under the New EIT Law at the rate of 25% and, to the extent we were to
generate a substantial amount of income outside of PRC in the future, we would
be subject to additional taxes. In addition, the dividends we pay to our non-PRC
enterprise shareholders and gains derived by such shareholders from the transfer
of our shares may also be subject to PRC withholding tax at the rate up to 10%,
if such income were regarded as China-sourced income. In addition, the recent
circular mentioned above details that certain Chinese-invested enterprises
controlled by Chinese enterprises or Chinese group enterprises will be
classified as “resident enterprises” if the following are located or resident in
China: senior management personnel and departments that are responsible for
daily production, operation and management; financial and personnel decision
making bodies; key properties, accounting books, company seal, and minutes of
board meetings and stockholders’ meetings; and half or more of the directors
with voting rights or senior management. However, as of the date hereof, no
final interpretation on the implementation of the “resident enterprise”
designation is available. Moreover, any such designation, when made by PRC tax
authorities, will be determined based on the facts and circumstances of
individual cases. As a result, we cannot determine the likelihood or
consequences of our being designated a “resident enterprise” as of the date
hereof.
33
If the
PRC tax authorities determine that we are a “resident enterprise,” we may be
subject to enterprise income tax at a rate of 25% on our worldwide income and
dividends paid by us to our non-PRC stockholders as well as capital gains
recognized by them with respect to the sale of our stock may be subject to a PRC
withholding tax. This will have an impact on our effective tax rate, a material
adverse effect on our net income and results of operations, and may require us
to withhold tax on our non-PRC stockholders.
Because
our principal assets are located outside of the United States and because almost
all of our directors and all our officers reside outside of the United States,
it may be difficult for you to use the United States Federal securities laws to
enforce your rights against us and our officers and most of our directors or to
enforce judgments of United States courts against us or our officers and most of
our directors in the PRC.
Almost
all of our present officers and directors reside outside of the United States.
In addition, our operating subsidiaries are located in the PRC and substantially
all of their assets are located outside of the United States. It may therefore
be difficult for investors in the United States to enforce their legal rights
based on the civil liability provisions of the United States Federal securities
laws against us and our officers and most of our directors in the courts of
either the United States or the PRC and, even if civil judgments are obtained in
courts of the United States, to enforce such judgments in PRC courts. Further,
it is unclear if extradition treaties now in effect between the United States
and the PRC would permit effective enforcement against us or our officers and
most of our directors of criminal penalties, under the United States Federal
securities laws or otherwise.
Failure
to comply with the U.S. Foreign Corrupt Practices Act could subject us to
penalties and other adverse consequences.
We
are required to comply with the United States Foreign Corrupt Practices Act,
which generally prohibits United States companies from engaging in bribery or
other prohibited payments to foreign officials for the purpose of obtaining or
retaining business. Foreign companies, including some that may compete with us,
are not subject to these prohibitions, and therefore may have a competitive
advantage over us. Corruption, extortion, bribery, pay-offs, theft and other
fraudulent practices may occur in the PRC. If our competitors engage in these
practices they may receive preferential treatment, giving our competitors an
advantage in securing business, which would put us at a disadvantage. We can
make no assurance that our employees or other agents will not engage in such
conduct for which we might be held responsible. If our employees or other agents
are found to have engaged in such practices, we could suffer severe penalties
and other consequences that may have a material adverse effect on our business,
financial condition and results of operations.
Risks Related to an Investment in our
Stock.
We have not paid any cash dividends and
no cash dividends will be paid in the foreseeable future.
We do not anticipate paying cash
dividends on our common stock in the foreseeable future and we may not have
sufficient funds legally available to pay dividends. Even if the
funds are legally available for distribution, we may nevertheless decide not to
pay, or may be unable to pay, any dividends. We intend to retain all
earnings for our company’s operations.
34
The
market price for our common stock may be volatile and subject to wide
fluctuations, which may adversely affect the price at which you can sell our
shares.
The
market price for our common stock may be volatile and subject to wide
fluctuations in response to factors including the following:
|
|
·
|
actual
or anticipated fluctuations in our quarterly operations
results;
|
|
|
·
|
changes
in financial estimates by securities research
analysts;
|
|
|
·
|
conditions
in foreign or domestic fertilizer and agricultural
markets;
|
|
|
·
|
changes
in the economic performance or market valuations of other companies in the
same industry;
|
|
|
·
|
announcements
by us or our competitors of new products, acquisitions, strategic
partnerships, joint ventures or capital
commitments;
|
|
|
·
|
addition
or departure of key personnel;
|
|
|
·
|
fluctuations
of exchange rates between the RMB and the U.S.
dollar;
|
|
|
·
|
intellectual
property litigation;
|
|
|
·
|
general
economic or political conditions in the PRC;
and
|
|
|
·
|
Other
events or factors, many of which are beyond our
control.
|
In addition, the securities market has
from time to time experienced significant price and volume fluctuations that are
not related to the operating performance of particular
companies. These market fluctuations may also materially and
adversely affect the market price of our stock, regardless of our actual
operating performance
.
Our
officers, directors and affiliates control us through their positions and stock
ownership and their interests may differ from other stockholders.
Our Chairman, President and CEO, Mr.
Tao Li, has the voting rights on 7,599,987, or 28.3%, of our issued and
outstanding common stock. As a result, he is able to influence the outcome of
stockholder votes on various matters, including the election of directors and
extraordinary corporate transactions, including business combinations. The
interests of Mr. Li may differ from other stockholders.
We
may require additional financing in the future and our operations could be
curtailed if we are unable to obtain required additional financing when
needed.
We may
need to obtain additional debt or equity financing to fund future capital
expenditures. Additional equity may result in dilution to the holders of our
outstanding shares of capital stock. Additional debt financing may include
conditions that would restrict our freedom to operate our business, such as
conditions that:
|
|
·
|
limit
our ability to pay dividends or require us to seek consent for the payment
of dividends;
|
|
|
·
|
increase
our vulnerability to general adverse economic and industry
conditions;
|
|
|
·
|
require
us to dedicate a portion of our cash flow from operations to payments on
our debt, thereby reducing the availability of our cash flow to fund
capital expenditures, working capital and other general corporate
purposes; and
|
35
|
|
·
|
limit
our flexibility in planning for, or reacting to, changes in our business
and our industry.
|
We cannot
guarantee that we will be able to obtain any additional financing on terms that
are acceptable to us, or at all.
There is no private ownership of land
in China. All land is owned by the government of the PRC on behalf of
all Chinese citizens or collectively owned by farmers.
Land use rights can be
allocated for free, granted or transferred with consideration upon approval by
the PRC State Land Administration Bureau or its authorized
branches.
Our principal executive offices are
located at 3rd floor, Borough A, Block A. No. 181, South Taibai Road, Xi’an,
Shaanxi province, PRC 710065. The office space is approximately 800 square
meters in area (8,611 square feet). It is leased from Xi’an Techteam
Science and Technology Industry (Group) Co., Ltd. (the “Group Company”), which
is controlled by Mr. Li, our Chairman, President and CEO, for a term of five
years from January 2008 at an annual rent of $11,355, which is the market rate
in that area.
Through Jinong, we own an approximately
6,500 square meters (69,965 square feet) production facility and an
approximately 31,000 square meters (333,681 square feet) production facility,
located in the Yang Ling Agriculture High-tech Demonstration Zone, on No. 6
Guhua 5 Road, Yangling, Xi’an, Shaanxi province, PRC 712100. The
production facilities are located on approximately 47,000 square meters (505,904
square feet) of land, which also contains office buildings, warehouses and
research laboratories. The production lines have a total annual
production capacity of 55,000 metric tons and have a current utilization rate of
40%. We own the land use rights for the land on which Jinong’s
manufacturing facilities are situated for a term of 50 years from
2001.
Jintai, Jinong’s wholly-owned subsidiary, is located in the
Caotan Modern Agriculture Development Zone in the northern suburb area of Xi’an.
Jintai has six intelligent greenhouses and six affiliated buildings, occupying
approximately 137,000 square meters (1,474,656 square feet) of
land. We lease the land used for Jintai’s operations from Xi’an
Jinong Hi-tech Agriculture Demonstration Zone for 10 years from January 2008
with an annual rent of approximately $9,140.
Yuxing, Jinong’s wholly-owned
subsidiary, has land use rights to over 353,000 square meters (3,799,660 square
feet) of land on which we have built 100 sunlight greenhouses as part of a
research and development center currently under construction. We
expect to finish completion of 12 “intelligent” greenhouses on this property by
2012.
Through our acquisition of Gufeng and
Tianjuyuan, we have added an additional 17,930 square meters (192,927 square
feet) of manufacturing, office and warehouse space located on approximately
42,726 square meters (459,898 square feet) of land. In addition, the
seven manufacturing facilities of Gufeng and Tianjuyuan collectively increased
our total annual production capacity by another 300,000 metric tons. The
collective utilization rate of these facilities is 60%.
Tianjuyuan leases approximately 47,333
square meters (509,488 square feet) of land in the Ping Gu District of
Beijing. Under the lease dated February 16, 2004 with the village
committee of Dong Gao Village and Zhen Nan Zhang Dai Village in the Beijing Ping
Gu District, Tianjuyuan leases the land at an annual rent of RMB35,500
(approximately $5,217). The lease term is from February 1, 2004 to
January 31, 2054. However, according to our PRC counsel, such lease is invalid
and unenforceable pursuant to the PRC Land Administration Law and related
regulations. Therefore, we are in the process of applying for the
proper land use right certificate from the relevant government
authority. There can be no assurance such land use right certificate
will be granted to us.
36
The
details on our properties and manufacturing facilities are described in the
table below:
|
Facility Location
and Production
Segment
|
Address
|
Area (square meters
/ square feet)
|
Ownership Status and
Term
|
|||
|
Xi’an –
Fertilizers (Jinong)
|
Yang
Ling Agriculture High-tech Demonstration Zone, No. 6 Guhua 5 Road,
Yangling, Xi’an, Shaanxi province
|
30,947
sq. m.
(333,111
sq. ft.)
|
Land
use right (Certificate #006012633) expires in January
2051
|
|||
|
Xi’an
– Fertilizers (Jinong)
|
Yang
Ling Agriculture High-tech Demonstration Zone, No. 6 Guhua 5 Road,
Yangling, Xi’an, Shaanxi province
|
6,495
sq. m.
(69,911
sq. ft.)
|
Building
Ownership Certificate (Certificate # 20050722)
|
|||
|
Xi’an
– Agricultural Products (Jintai)
|
Caotan
Modern Agriculture Development Zone, Middle Section of Shangji Road,
Caotan, Xi’an, Shaanxi Province
|
137,000
sq. m.
(1,474,656
sq. ft.)
|
Lease
from January 2008 to January 2018
|
|||
|
Xi’an
– research and development center (Yuxing)
|
North
Xin’anVillage, Weifeng, Hu County, Shaanxi Province
|
353,000
sq. m.
(3,799,660
sq. ft.)
|
Land
use right (Certificate #006001700) expires in August
2059
|
|||
|
Beijing
– fertilizers (Tianjuyuan & Gufeng)
|
South
of Nanzhangdai Village, Donggaocun Town, Ping Gu District,
Beijing
|
42,726
sq. m.
(459,898
sq. ft.)
|
Land
use right (Certificate #2003189) expires in August 2053
*
|
|||
|
Beijing
– fertilizers (Tianjuyuan & Gufeng)
|
South
of Nanzhangdai Village, Donggaocun Town, Ping Gu District,
Beijing
|
17,930
sq. m.
(192,997
sq. ft.)
|
Building
Ownership Certificate# 33142
*
|
|||
|
Beijing
– fertilizers (Tianjuyuan & Gufeng)
|
|
South
of Nanzhangdai Village, Donggaocun Town, Ping Gu District,
Beijing
|
|
47,333
sq. m.
(509,488
sq. ft.)
|
|
Lease
from February 2004 to January
2054
|
*
Tianjuyuan entered into
three loan agreements with China Agriculture Bank in 2010. In exchange,
Tianjuyuan mortgaged its land use right and building ownership. We summarize the
major information in the table below:
37
|
No.
|
Loan
Amount
|
Lending Institution
|
Contract
Period
|
Type of
Guarantee
|
Interest
Rate
|
Property under
Mortgage
|
||||||
|
1
|
RMB10.1
million ($1,484,399)
|
China
Agriculture Bank - Beijing Ping Gu District Branch
|
May
31, 2010 to May 30, 2011
|
Mortgage
|
5.5755%
(year)
|
Tianjuyuan’s
land (Certificate #2003189) and building (Certificate
#33142)
|
||||||
|
2
|
RMB8.4
million ($1,234,550)
|
China
Agriculture Bank - Beijing Ping Gu District Branch
|
January
14, 2010 to January 13, 2011
|
Mortgage
|
6.372%
(year)
|
Tianjuyuan’s
land (Certificate #2003189) and building (Certificate
#33142)
|
||||||
|
3
|
|
RMB8
million ($1,175,762)
|
|
China
Agriculture Bank - Beijing Ping Gu District Branch
|
|
April
9, 2010 to April 8, 2011
|
|
Mortgage
|
|
5.5755%
(year)
|
|
Tianjuyuan’s
land (Certificate # 2003189) and building (Certificate
#33142)
|
As of the
date of this report, we are not a party to any legal proceedings that,
individually or in the aggregate, are material to our company as a
whole.
Market
Information
We have
two classes of equity securities: (i) common stock, par value $.001 per share,
26,848,259 shares of which were outstanding as of August 26, 2010, and (ii)
preferred stock, par value $.001 per share, of which no shares were outstanding
as of August 25, 2010. Since December 7, 2009, our common stock
has been listed and traded on the NYSE under the symbol “CGA”. From
March 9, 2009 to December 4, 2009, our common stock was listed and traded on the
NYSE Amex Equities. From February August 27, 2007 until March 9,
2009, our common stock was traded on the Over-the-Counter Bulletin
Board.
Table I
below sets forth the high and low bid prices for our common stock for the fiscal
quarters ended September 30, 2008 and December 31, 2008 based on reports of
transactions on the Over-the-Counter Bulletin Board. Such prices reflect
inter-dealer prices, without retail markup, markdowns or commissions and may not
necessarily represent actual transactions.
Table
I
|
Quarter Ended
|
High Bid
|
Low Bid
|
||||||
|
09/30/2008
|
$
|
25.01
|
$
|
0.00
|
||||
|
12/31/2008
|
$
|
3.40
|
$
|
1.84
|
||||
38
Table II
below sets forth the high and low sales prices for our common stock for each
fiscal quarter from the quarter ended March 31, 2009 through the quarter ended
June 30, 2010 based on reports of transactions on the NYSE Amex Equities and
NYSE.
Table
II
|
Quarter Ended
|
High
|
Low
|
||||||
|
03/31/2009
|
$
|
3.90
|
$
|
2.60
|
||||
|
06/30/2009
|
$
|
9.00
|
$
|
3.28
|
||||
|
09/30/2009
|
$
|
15.00
|
$
|
6.81
|
||||
|
12/31/2009
|
$
|
18.70
|
$
|
10.02
|
||||
|
03/31/2010
|
$
|
17.89
|
$
|
12.31
|
||||
|
06/30/2010
|
$
|
14.49
|
$
|
8.91
|
||||
On August
26, 2010, the last sale price for our common stock on the NYSE was $10.52 per
share.
Holders
As of
August 26, 2010, there were approximately 635 shareholders of record of our
common stock. This does not reflect the number of persons or entities who held
stock in nominee or "street" name through various brokerage firms.
Dividends
Our board
of directors has not declared a dividend on our common stock during the last two
fiscal years or the subsequent interim period.
The
payment of dividends, if any, is at the discretion of the Board of Directors and
is contingent on the Company's revenues and earnings, capital requirements,
financial conditions and the ability of our operating subsidiaries, Jinong and
Jintai, to obtain approval to send monies out of the PRC. The PRC's national
currency, the Yuan, is not a freely convertible currency. Pleaser read “
Our subsidiaries are subject to
restrictions on paying dividends and making other payments to our subsidiary,
Green New Jersey; as a result, we might therefore, be unable to pay dividends to
you.
” under Item 1A “Risk Factors” of this Report.
Securities
Authorized for Issuance Under Equity Compensation Plans
On
October 27, 2009, our Board of Directors adopted the Company’s 2009 Equity
Incentive Plan (the “Incentive Plan”). On December 11, 2009, our stockholders
approved the Incentive Plan. The Incentive Plan gives us the ability to grant
stock options, stock appreciation rights (SARs), restricted stock and other
stock-based awards to our employees, consultants and to non-employee members of
our advisory board or our Board of Directors or the board of directors of any of
our subsidiaries.
As of
June 30, 2010, options to purchase an aggregate of 195,291 shares of common
stock had been granted under the Incentive Plan. Options granted in the future
under the Incentive Plan are within the discretion of our board of directors or
our compensation committee. The following table summarizes the number of shares
of our common stock authorized for issuance under our equity compensation plans
as of June 30, 2010.
39
Equity
Compensation Plan Information
|
Plan category
|
Number of securities to
be issued upon exercise
of outstanding options,
warrants and rights
(a)
|
Weighted-average
exercise price of
outstanding options,
warrants and rights
(b)
|
Number of securities
remaining available for
future issuance under
equity compensation
plans (excluding
securities reflected in
column (a))
(c)
|
|||||||||
|
Equity
compensation plans approved by security holders
|
195,291 | $ | 14.67 | 1,792,548 | ||||||||
|
Equity
compensation plans not approved by security holders
|
— | — | — | |||||||||
|
Total
|
195,291 | $ | 14.67 | 1,792,548 | ||||||||
Performance
Graph
Not
applicable to smaller reporting companies such as us.
Recent
Sales of Unregistered Securities; Use of Proceeds from Unregistered
Securities.
Sales of
unregistered securities by the Company have been previously disclosed in our
Form 8-Ks and 10-Qs filed with the SEC.
Issuer
Purchases of Equity Securities
None.
Not
applicable to smaller reporting companies such as us.
The
following discussion and analysis of our financial condition and results of
operations should be read in conjunction with our audited consolidated financial
statements and the notes to those financial statements appearing elsewhere in
this report. This discussion and analysis contains forward-looking statements
that involve significant risks and uncertainties. As a result of many factors,
such as the slow-down of the global financial market and its impact on economic
growth in general, the competition in the fertilizer industry and the impact of
such competition on pricing, revenues and margins, the weather conditions in the
areas where our customers are based, the cost of attracting and retaining highly
skilled personnel, the prospects for future acquisitions, and the factors set
forth elsewhere in this report, our actual results may differ materially from
those anticipated in these forward-looking statements. In light of this risks
and uncertainties, there can be no assurance that the forward-looking statements
contained in this filing will in fact occur. You should not place undue reliance
on the forward-looking statements contained in this report.
40
The
forward-looking statements speak only as of the date on which they are made,
and, except to the extent required by U.S. federal securities laws, we undertake
no obligation to update any forward-looking statement to reflect events or
circumstances after the date on which the statement is made or to reflect the
occurrence of unanticipated events. Further, the information about
our intentions contained in this report is a statement of our intention as of
the date of this report and is based upon, among other things, the existing
regulatory environment, industry conditions, market conditions and prices and
our assumptions as of such date. We may change our intentions, at any
time and without notice, based upon any changes in such factors, in our
assumptions or otherwise.
Unless
the context indicates otherwise, as used in the following discussion, “Company”,
“we,” “us,” and “our,” refer to (i) China Green Agriculture, Inc. (“Green
Nevada”, formerly known as Discovery Technologies, Inc.), a corporation
incorporated in the State of Nevada; (ii) Green Agriculture Holding Corporation
(“Green New Jersey”), a wholly-owned subsidiary of Green Nevada incorporated in
the State of New Jersey; (iii) Shaanxi TechTeam Jinong Humic Acid Product Co.,
Ltd. (“Jinong”), a wholly-owned subsidiary of Green New Jersey organized under
the laws of the PRC; (vi) Xi’an Jintai Agriculture Technology Development
Company (“Jintai”), wholly-owned subsidiary of Jinong in the PRC and (vii) Xi’an
Hu County Yuxing Agriculture Technology Development Co., Ltd. (“Yuxing”), a
wholly-owned subsidiary of Jinong in the PRC.
Unless
the context otherwise requires, all references to (i) “PRC” and “China” are to
the People’s Republic of China; (ii) “U.S. dollar,” “$” and “US$” are to United
States dollars; and (iii) “RMB”, “Yuan” and Renminbi are to the currency of the
PRC or China.
Overview
We,
through our indirect wholly-owned subsidiaries, Jinong, Jintai and Yuxing, are
engaged in the following businesses: (i) research, development, production,
distribution and sale of humic acid-based compound fertilizer; and (ii)
development, production and sale of agricultural products; namely, top-grade
fruits, vegetables, flowers and colored seedlings. Jintai and Yuxing also serve
as a research and development base for our fertilizer products. The
fertilizer business conducted through Jinong has been our main business,
generating approximately 88.0% and 82.1% of our total revenues in the fiscal
year ended June 30, 2010 and 2009, respectively.
We employ a multi-tiered product
strategy in which we tailor our products to the requirements and preferences of
the different geographic regions across China. The vast land area of China
produces varying characteristics including climate and soil conditions, which
require specific fertilizers to have productive crop yields. As of June 30,
2010, we developed and produced 157 different fertilizer products and sold
approximately 22,834 and 15,042 metric tons of fertilizer products for the years
ended June 30, 2010 and 2009, respectively. Our sales of fertilizer
products to five provinces accounted for approximately 38.3% of our fertilizer
revenue for the fiscal year ended June 30, 2010. Specifically, the
provinces and their respective percentage contribution to our fertilizer
revenues were Shandong (10.3%), Shaanxi (10.0%), Anhui (6.2%), Heilongjiang
(6.0%) and Henan (5.8%).
We sell our fertilizers products
through a large number of distributors covering 21 provinces, 4 autonomous
regions and 3 central government controlled municipalities in China. As of June
30, 2010, we had approximately 573 distributors in China. We are not dependent
on any one or group of distributors. The top five distributors accounted for
only 2.5% of our fertilizer revenues for the fiscal year ended June 30, 2010. In
addition, we export our humic acid-based compound fertilizer to contracted
distributors in foreign countries, including India, Ecuador, Pakistan and
Lebanon. However, the total revenues from exported products currently
account for less than 1% of our fertilizer revenues.
41
Through Jintai, we develop, produce and
sell high quality flowers, green vegetables and fruits to local marketplaces and
various horticulture and planting companies. We also use Jintai’s
greenhouse facilities to conduct research and development activities for our
fertilizer products. The five PRC provinces, which accounted for 100% of our
agriculture product revenue for the fiscal year ended June 30, 2010, were
Shaanxi (85.6%), Shanxi (5.7%), Sichuan (3.6%), Henan (2.9%) and Gansu
(2.2%). Jintai’s top five customers accounted for 56.4% of Jintai’s
sales for the fiscal year ended June 30, 2010.
Recent
Developments
During the three months ended June 30,
2010, we launched nine new humic acid-based liquid fertilizer products,
including five tailored fertilizers, three functional fertilizers and one
broad-spectrum fertilizer. These new products generated approximately $543,803,
or 3.6% of our fertilizer revenues for the three months ended June 30, 2010. We
also added 21 new distributors during the three months ended June 30, 2010.
These new distributors accounted for approximately $426,285, or 2.8% of our
fertilizer revenues for the three months ended June 30, 2010.
In an
effort to achieve full utilization of Jinong’s annual production capacity of
55,000 tons during the next three years while further expanding brand awareness
of Jinong products, we have successfully implemented two marketing programs in
Shaanxi, Hebei, Anhui, Jiangsu and Guangzhou provinces. As we have
previously announced, these marketing programs consist of the: (i) establishment
Company directly-owned retail stores to sell Jinong-branded fertilizer products
through the Company’s designated sales personnel (the “Pilot Program”) and (ii)
selection of qualified retailers from the Company's distributor base of retail
customer to be designated "China Green Agriculture Authorized
Retailers". Under the Pilot Program, we currently have 16
directly-owned stores operating in Shaanxi Province, with each store having an
assigned territory in order not to compete with any of the Company's existing
distributors. Since the launch of the Pilot Program in January 2010,
we have worked closely with our existing distributors to designate over 600
retailers as “China Green Agriculture Retailer”. We have entered into agreements
with these retailers to prominently display "China Green Agriculture Authorized
Retailer" on their exhibits, and have well-positioned standardized shelf and
product displays in their retail stores. In addition, we provide the
retailers with educational materials on proper product use, the placement of our
branded commercial ads on their delivery trucks and billboard ads with our
product logo and tagline to target farmers.
In June
2010, in connection with the construction of Yuxing’s research and development
center on 353,000 square meters (approximately 3.8 million square feet) land, we
completed Phase I of the project of building 100 sunlight
greenhouses. In July 2010, we completed seedling cultivation and
expect to finish seedling transplantation for these 100 sunlight greenhouses by
October 2010 and estimate a small contribution to our total revenue in fiscal
year 2011from the sales of the agricultural products produced by Yuxing. The new
research and development center will further increase the Company's ability to
introduce new customized, high-margin fertilizer products as well as expand its
production of cultivated agricultural products which are currently sold to the
local marketplace. Phase II of the project, which includes the construction of
12 intelligent greenhouses, is expected to be completed by the end of December
2011.
On July
2, 2010, we acquired Gufeng, and its wholly-owned subsidiary, Tianjuyuan, by
purchasing all of the outstanding equity interests of Gufeng for a purchase
price of RMB60 million (approximately $8.8 million) in cash plus an aggregate of
2,275,931 newly issued shares (the "Shares") of common stock of the Company to
Gufeng shareholders or their designees. The value of the Shares equaled RMB156
million (approximately $23 million), using the exchange rate of 6.7858 (the
middle price of US Dollar against the RMB on the issuing day of the Shares) and
the per share value of $10.101 (the average price of the closing price of the
Company’s common stock for ten consecutive trading days immediately before the
date of execution of Share Transfer Contract with the Gufeng
shareholders). In accordance with the Share Transfer Contract, 40% of
the Shares will be held in escrow pending satisfaction of certain conditions
such as “Make Good” targets of $88.4 million in revenue and $10.6 million in net
profit for Gufeng for the fiscal year ended June 30, 2011. In
addition, according to the Supplementary Agreement with the Gufeng shareholders,
the Company will provide RMB100 million (approximately $14.7 million) as
inter-company receivables to Gufeng for working capital purposes, with Jinong
retaining full control over the use of such funds. As a result of the
acquisition by the Company, Gufeng and Tianjuyuan became wholly-owned
subsidiaries of Jinong and indirect subsidiaries of the
Company.
42
Gufeng was founded in 1993 and
Tianjuyuan was founded in 2001. Both companies are Beijing-based producers of
compound fertilizer, blended fertilizer, organic compound fertilizer and mixed,
organic-inorganic compound fertilizer and sell their products throughout China
and abroad. Currently, Gufeng and Tianjuyuan have a total of approximately 363
full-time employees. For the three months ended March 31, 2010 and
2009, Gufeng had net sales of $17,075,083 and $13,946,656, gross profit of
$1,798,489 and $1,300,235, and net income of $1,095,818 and 746,390,
respectively. As of March 31, 2010 and December 20, 2009, the total
assets of Gufeng were $36,905,427 and $45,017,154, respectively.
Our acquisition of Gufeng improves our
competitive position by (i) increasing our maximum production capacity of
fertilizers from 55,000 metric tons to 355,000 metric ton per year, (ii)
adding over 150 new distributors to our existing nationwide
distribution network of 573 distributors as of June 30, 2010, and (iii)
broadening our fertilizer portfolio of organic and non-organic fertilizer
products to serve a larger base of end-users. In the next twelve
months, we plan to upgrade one of Gufeng’s existing production facilities and
build a new production line with an annual capacity of 200,000 metric
tons. Through our efforts on expanding Gufeng’s production capacity
and improving its product margins, we expect Gufeng to contribute approximately
$88.4 million in revenues and $10.6 million in net income for the fiscal year
ending June 30, 2011.
Results of
Operations
The following table shows the operating
results of the Company on a consolidated basis for the fiscal years ended June
30, 2010 and June 30, 2009.
|
Fiscal Year Ended
|
Fiscal Year Ended
|
|||||||
|
June 30, 2010
|
June 30, 2009
|
|||||||
|
Net
Sales
|
$ | 52,090,752 | $ | 35,207,997 | ||||
|
Cost
of Goods Sold
|
21,138,551 | 14,712,066 | ||||||
|
Gross
Profit
|
30,952,201 | 20,495,931 | ||||||
|
Selling
Expenses
|
2,203,345 | 1,412,101 | ||||||
|
General
and Administrative Expenses
|
3,822,234 | 1,993,817 | ||||||
|
Operating
Income
|
24,926,621 | 17,090,013 | ||||||
|
Total
Other Income (expense)
|
157,653 | (294,043 | ) | |||||
|
Income
Before Income Taxes
|
25,084,274 | 16,795,970 | ||||||
|
Provision
for Income Taxes
|
3,794,515 | 2,331,548 | ||||||
|
Net
Income
|
21,289,758 | 14,464,422 | ||||||
|
Net
Income Per Share (Basic and Fully Diluted)
|
0.91 | 0.78 | ||||||
|
Weighted
Average Shares Outstanding
|
23,468,246
shares
|
18,532,591
shares
|
||||||
Net
Sales
Our net sales for the fiscal year ended
June 30, 2010 were $52,090,752, an increase of $16,882,755, or 48.0%, from
$35,207,997 for the fiscal year ended June 30, 2009.
Jinong’s net sales, which accounted for
88.0% of our total net sales, were driven by sales of humic acid-based compound
fertilizers. For the fiscal year ended June 30, 2010, Jinong’s net sales
increased by $16,927,245, or 58.6%, to $45,816,377 from $28,889,131 for the
fiscal year ended June 30, 2009. Sales volume increased 51.8% to 22,835 metric
tons for the fiscal year ended June 30, 2010 from 15,042 metric tons for the
fiscal year ended June 30, 2009. This increase was mainly attributable to
expansion in production capacity and the introduction of 5 new powder and
granular fertilizer products, which accounted for 35% of the increase in the net
sales. Sales for the liquid based fertilizer group also increased in both volume
and amount, especially, the sales for functional fertilizer products had
contributed 32% of the increase in the net sales.
43
Jintai’s net sales, which include sales
of agricultural products, namely top-grade fruits, vegetables, flowers and
colored seedlings by using our existing and new fertilizers, decreased by
$44,491, or 0.7%, to $6,274,375 for the fiscal year ended June 30, 2010 from
$6,318,866 for the same period in 2009. As its greenhouse facility reached its
full capacity last year, we did not expect any growth from Jintai in the near
future unless we change dramatically our product mix and grow significantly more
higher-end agricultural produce. We are trying to grow gradually more
higher-margin products such as butterfly orchids and red-leaf flowers and
discontinue some lower margin products such as colored pepper and egg plant.
Therefore, we do expect a flat growth in revenues with a slight better margin
going forward.
Cost
of Goods Sold
Total cost of goods sold for the fiscal
year ended June 30, 2010 were $21,138,551, an increase of $6,426,485, or 43.7%,
from $14,712,066 for the fiscal year ended June 30, 2009.
Cost of goods sold by Jinong for the
fiscal year ended June 30, 2010 were $17,700,532, an increase of $6,527,295, or
58.4%, from $11,173,236 for the same period in 2009. As a percentage
of total net sales, cost of goods sold by Jinong accounted for approximately
34.0% and 31.7% for the fiscal year ended June 30, 2010 and 2009,
respectively. The increase in cost of goods sold was primarily
attributable to the increase in raw materials and packaging materials as a
result of our newly introduced powder and granular fertilizer
products.
Cost of goods sold by Jintai for the
fiscal year ended June 30, 2010 were $3,438,020, a decrease of $100,810, or
2.8%, from $3,538,830 for the same period in 2009. As a percentage of
total net sales, cost of goods sold by Jintai accounted for approximately 6.6%
and 10.1% for the fiscal year ended June 30, 2010 and 2009, respectively. The
increase in direct materials such as seedlings was largely offset by the
decrease in amortization and utility expenses.
Gross
Profit
Gross profit for the fiscal year ended
June 30, 2010 increased by $10,456,270, or 51.0%, to $30,952,201, as compared to
$20,495,931 for the fiscal year ended June 30, 2009. Gross profit
margin was approximately 59.4% and 58.2% for the fiscal year ended June 30, 2010
and 2009, respectively.
Gross profit generated by Jinong
increased by $10,399,950, or 58.7%, to $28,115,845 for the fiscal year ended
June 30, 2010 from $17,715,895 for the fiscal year ended June 30, 2009. Gross
profit margin from Jinong sales were approximately 61.4% and 61.3% for the
fiscal year ended June 30, 2010 and 2009, respectively. The increase
in gross profit margin was mainly due to the introduction of our powder based
fertilizer products, bringing 8.6% of our fertilizer revenues, which has a
higher profit margin as compared to those of the liquid based fertilizer
products we sold last year.
Gross profit from Jintai increased by
$56,320, or 2.0%, for the fiscal year ended June 30, 2010, to $2,836,355, as
compared to $2,780,036 for the fiscal year ended June 30, 2009. Gross
profit margin from Jintai sales were approximately 45.2% and 44.0% for the
fiscal year ended June 30, 2010 and 2009, respectively. The increase in gross
profit margin was primarily due to the increased sales in higher margin flowers
compared to a year ago and discontinued production of less profitable products
such as tomato, bitter melon and eggplant.
44
Selling
Expenses
Our selling expenses consist primarily
of salaries of sales personnel, advertising and promotion expenses, freight
charges and related compensation. Selling expenses were $2,203,345, or 4.2% of
net sales for the fiscal year ended June 30, 2010 as compared to $1,412,101, or
4.0% of net sales for the fiscal year ended June 30, 2009, an increase of
$791,244, or 56.0%. The increase was primarily attributable to the increase in
shipping costs and marketing expenses due to our recently introduced granular
based fertilizer products and new branding strategy with “Authorized
distributors/retailers”.
General
and Administrative Expenses
General and administrative expenses
consisted primarily of related salaries, rental expenses, business development,
depreciation and travel expenses incurred by our general and administrative
departments and legal and professional expenses. General and administrative
expenses were $3,822,234, or 7.3% of net sales, for the fiscal year ended June
30, 2010, as compared to $1,993,817, or 5.7% of net sales, for the fiscal year
ended June 30, 2009, an increase of $1,828,417. The increase was
mainly attributable to increased salaries and non-cash stock compensation
expense of $1,695,449 as a result of our issuance of options and restricted
shares to our directors, officers and employees under our 2009 Equity Incentive
Plan.
Total
Other Income (Expenses)
Total other income (expenses) consisted
of income from subsidies received from the PRC government, interest income,
interest expenses and bank charges. Total other income for the fiscal year ended
June 30, 2010 was $157,653, as compared to total other expenses of $294,043 for
the fiscal year ended June 30, 2009, an increase of $451,696. The
increase was mainly attributable to the increase in interest income from the
proceeds of the equity financings in 2009 and the decrease in interest expenses
due to repayment of our outstanding short-term loans.
Income
Taxes
Jinong is subject to a preferred tax
rate of 15% as a result of its business being classified as a High-Tech project
under the PRC Enterprise Income Tax Law (“EIT”) that became effective on January
1, 2008. Jinong incurred income tax expenses of $3,794,515 for the
fiscal year ended June 30, 2010, as compared to $2,331,548 for fiscal 2009, an
increase of $1,462,967, or 62.7%, which was primarily attributable to our
increased operating income.
Jintai has been exempt from paying
income tax since its formation as it produces products which fall into the tax
exemption list set out in the EIT. This exemption is expected to last as long as
the applicable provisions of the EIT do not change.
Net
Income
Net income for the fiscal year ended
June 30, 2010 was $21,289,758, an increase of $6,825,337, or 47.2%, compared
$14,464,422 for the fiscal year ended June 30, 2009. The increase was
attributable to the increase in gross profit. Net income as a percentage of
total net sales was approximately 40.9% and 41.1% for the fiscal year ended June
30, 2010 and 2009, respectively.
Discussion of Segment
Profitability Measures
As of June 30, 2010, we engaged in the
following business: the production and sale of fertilizers through Jinong, and
the production and sale of high quality agriculture products and research and
development on new fertilizer products by Jintai. Upon the completion of its
research and development center, Yuxing’s main business will be to conduct
research and development on new fertilizer products and sell high quality
agricultural products. Each of the segments and subsidiaries has its own annual
budget with regards to development, production and sales.
Liquidity and Capital
Resources
Our principal sources of liquidity
include cash from operations, borrowings from local commercial banks and net
proceeds of offerings of our securities consummated in the Public
Offerings.
45
As of June 30, 2010, cash and cash
equivalents were $62,335,437, an increase of $44,539,990 from $17,795,447 as of
June 30, 2009. This amount does not include restricted cash from our
escrow account. Pursuant to the Securities Purchase Agreement and Holdback
Escrow Agreement by and among the Company and the investors in the Private
Placement, a total of $250,000 cash from the Private Placement proceeds was
escrowed for investor relations-related expenditures. The funds are being
released to the Company on a monthly basis to pay invoices issued by the
Company’s investor relations firm. As of June 30, 2010, there was no outstanding
balance left in the escrow account, as compared to a balance of $83,579 as of
June 30, 2009.
We intend to use the net proceeds from
the Public Offerings to acquire new businesses, upgrade production lines and
complete the greenhouse facilities for agricultural products of Yuxing located
on approximately 88-acres of land in Hu County, 18 kilometer southeast of Xi’an
city. We believe that we have sufficient cash on hand and positive projected
cash flow from operations to support our business growth for the next twelve
months to the extent we do not have further significant acquisitions or
expansions. Notwithstanding the foregoing, we may seek additional financing for
expansion purposes, which may include equity financing at certain
point. There can be no assurance that any additional financing will
be available on acceptable terms, if at all. Any equity financing may result in
dilution to existing stockholders.
The
following table sets forth a summary of our cash flows for the periods
indicated:
|
Fiscal Year Ended June 30
|
||||||||
|
2010
|
2009
|
|||||||
|
Net
cash provided by / (used in) operating activities
|
$ | 12,232,035 | $ | 7,184,086 | ||||
|
Net
cash used in investing activities
|
(16,524,694 | ) | (5,097,721 | ) | ||||
|
Net
cash provided by / (used in) financing activities
|
48,451,549 | (926,957 | ) | |||||
|
Effect
of exchange rate change on cash and cash equivalents
|
381,100 | 23,623 | ||||||
|
Net
increase in cash and cash equivalents
|
44,539,990 | 1,183,031 | ||||||
|
Cash
and cash equivalents, beginning balance
|
17,795,447 | 16,612,416 | ||||||
|
Cash
and cash equivalents, ending balance
|
$ | 62,335,437 | $ | 17,795,447 | ||||
Operating
Activities
Net cash provided by operating
activities was $12,232,035 for the fiscal year ended June 30, 2010, an
increase of $5,047,949 from $7,184,086 for the fiscal year ended June 30,
2009. The increase was mainly due to an increase in net income and non-cash
expenses.
Investing
Activities
Net cash used in investing
activities in the fiscal year ended June 30, 2010 was $16,524,694, which was
mainly used to implement our new production line and procure land purchase
rights for the construction of Yuxing’s greenhouse facilities. The net cash used
in investing activities for the same period in 2009 was $5,097,721, most of
which was used for to implement new production lines and make upgrades of our
existing lines.
Financing
Activities
Net cash provided by financing
activities in the fiscal year ended June 30, 2010 totaled $48,451,549, mainly
due to the proceeds received from the Public Offerings. The net cash used in
financing activities for the same period in 2009 was $926,957 as we repaid
certain outstanding short-term loans. We did not have any loans
outstanding as of June 30, 2010.
46
Accounts
Receivable
We had accounts receivable of
$15,571,888 as of June 30, 2010, as compared to $8,167,715 as of June 30, 2009,
an increase of 90.7%, or $7,404,173. The increase was primarily due to the
increase in our sales. In addition, China has experienced significant adverse
weather since early this year, which impacted the performance of our
distributors across the country, especially for our distributors in the South
China where the major floods are. The management had adjusted the credit terms
and extended up to two months accordingly to our major distributors who have
established a good credit with the company in the past.
Our
allowance for doubtful accounts was $193,403 of June 30, 2010, as compared with
$119,178 as of June 30, 2009, an increase of 62.3%, or $74,224.
Inventories
We had an
inventory of $11,262,647 as of June 30, 2010, as compared to $7,162,249 as of
June 30, 2009, an increase of 57.3%, or $4,100,398. Inventory in Jinong
increased to $440,005 as of June 30, 2010 from $252,537 in the prior period and
inventory in Jintai increased to $10,822,641 as of June 30, 2010 from $6,909,712
in the prior period mainly due to the increased work in progress at Jintai’s
greenhouse facilities with more high-end flowers.
Off-Balance Sheet
Arrangements
As of June 30, 2010, we did not have
any off-balance sheet arrangements.
Critical Accounting Policies
and Estimates
Management's discussion and analysis of
its financial condition and results of operations are based upon our
consolidated financial statements, which have been prepared in accordance with
United States generally accepted accounting principles (“US GAAP”). Our
financial statements reflect the selection and application of accounting
policies which require management to make significant estimates and judgments.
See Note 2 to our consolidated financial statements, “Basis of Presentation and
Summary of Significant Accounting Policies.” We believe that the following
paragraphs reflect the more critical accounting policies that currently affect
our financial condition and results of operations:
Use of
estimates
The preparation of consolidated
financial statements in conformity with US GAAP requires management to make
estimates and assumptions that affect the reported amounts of assets and
liabilities and disclosure of contingent assets and liabilities at the date of
the consolidated financial statements and the amount of revenues and expenses
during the reporting periods. Management makes these estimates using the best
information available at the time the estimates are made. However, actual
results could differ materially from those estimates.
Revenue
recognition
Sales revenue is recognized at the date
of shipment to customers when a formal arrangement exists, the price is fixed or
determinable, the delivery is completed, no other significant obligations of the
Company exist and collectibility is reasonably assured. Payments
received before all of the relevant criteria for revenue recognition are
satisfied are recorded as unearned revenue.
The Company's revenue consists of
invoiced value of goods, net of value-added tax (VAT). No product return or
sales discount allowance is made as products delivered and accepted by customers
are normally not returnable and sales discounts are normally not granted after
products are delivered.
47
Cash and cash
equivalents
For purposes of the statement of cash
flows, the Company considers all cash on hand and in banks, certificates of
deposit and other highly-liquid investments with maturities of three months or
less, when purchased, to be cash and cash equivalents.
Accounts
receivable
The Company's policy is to maintain
reserves for potential credit losses on accounts receivable. The Company reviews
its accounts receivable outstanding balance and its assessment of the
collectability of specific customer accounts, the aging of accounts receivable,
its history of bad debts, and the general condition of the industry at each
fiscal year-end to determine if the bad debt allowance is adequate.
Segment
reporting
Statement of Financial Accounting
Standards No. 131 ("SFAS 131"), "Disclosure About Segments of an Enterprise and
Related Information" requires use of the "management approach" model for segment
reporting. The management approach model is based on the way a
company's management organizes segments within the company for making operating
decisions and assessing performance. Reportable segments are based on products
and services, geography, legal structure, management structure, or any other
manner in which management disaggregates a company.
As of June 30, 2010, the Company,
through its subsidiaries is engaged in the following business: the production
and sale of fertilizers through Jinong, and the production and sale of high
quality agriculture products and research and development on new fertilizer
products by Jintai. Upon the completion of its research and development center,
Yuxing’s main business will be to conduct research and development on new
fertilizer products and sell high quality agricultural products.
|
ITEM 7A.
|
QUANTITATIVE AND QUALITATIVE
DISCLOSURES ABOUT MARKET
RISKS
|
Not
applicable to smaller reporting companies such as us.
|
ITEM
8.
|
FINANCIAL STATEMENTS AND
SUPPLEMENTARY DATA
|
Balance
sheets, as of June 30, 2010 and 2009, and statements of operations,
stockholders’ equity and cash flows for each of the two years in the period
ended June 30, 2010 and 2009, together with the related notes and the reports of
independent registered public accounting firms, are set forth on the “F” pages
of this report.
|
ITEM 9.
|
CHANGES IN AND DISAGREEMENTS WITH
ACCOUNTANTS ON ACCOUNTING AND FINANCIAL
DISCLOSURE
|
None.
48
|
ITEM 9A
|
CONTROLS AND
PROCEDURES
|
Disclosure
Controls and Procedures
The
Company's Chief Executive Officer and Chief Financial Officer have reviewed and
evaluated the effectiveness of our disclosure controls and procedures, which
included inquiries made to certain other of the Company's employees. Based on
their evaluation, the Company's Chief Executive Officer and Chief Financial
Officer have each concluded that, as of June 30, 2010, the Company's disclosure
controls and procedures were effective and sufficient to ensure that we record,
process, summarize and report information required to be disclosed by the
Company in its periodic reports filed under the Securities and Exchange
Commission's rules and forms.
Management
Report on Internal Control Over Financial Reporting
Our management is responsible for
establishing and maintaining adequate internal control over financial reporting
to provide reasonable assurance regarding the reliability of our financial
reporting and the preparation of financial statements for external purposes in
accordance with U.S. generally accepted accounting principles. Internal control
over financial reporting includes those policies and procedures that (i) pertain
to the maintenance of records that in reasonable detail accurately and fairly
reflect the transactions and dispositions of the assets of the Company; (ii)
provide reasonable assurance that transactions are recorded as necessary to
permit preparation of financial statements in accordance with U.S. generally
accepted accounting principles, and that receipts and expenditures of the
Company are being made only in accordance with authorizations of management and
directors of the Company; and (iii) provide reasonable assurance regarding
prevention or timely detection of unauthorized acquisition, use, or disposition
of the Company’s assets that could have a material effect on the financial
statements.
Any
system of internal control, no matter how well designed, has inherent
limitations, including the possibility that a control can be circumvented or
overridden and misstatements due to error or fraud may occur and not be detected
in a timely manner. Also, because of changes in conditions, internal control
effectiveness may vary over time. Accordingly, even an effective system of
internal control will provide only reasonable assurance with respect to
financial statement preparation. In addition, the design of any system of
controls is based in part on certain assumptions about the likelihood of future
events, and there can be no assurance that any design will succeed in achieving
its stated goals under all potential future conditions. Over time, controls may
become inadequate because of changes in conditions or deterioration in the
degree of compliance with policies or procedures. Therefore, any current
evaluation of controls cannot and should not be projected to future
periods.
Management assessed our internal
control over financial reporting as of the year ended June 30, 2010. In making
this assessment, management used the criteria set forth by the Committee of
Sponsoring Organizations of the Treadway Commission (COSO) in the report
entitled "Internal Control-Integrated Framework." The COSO framework summarizes
each of the components of a company’s internal control system, including (i) the
control environment, (ii) risk assessment, (iii) control activities, (iv)
information and communication, and (v) monitoring.
A material weakness is a control
deficiency, or combination of control deficiencies, that results in more than a
remote likelihood that a material misstatement of the annual or interim
financial statements will not be prevented or detected. Based on this assessment
using the COSO criteria, management has identified the following material
weaknesses: we did not maintain effective controls over our process
to ensure the timely completeness and accuracy of the preparation and review of
our consolidated financial statements, resulting in several adjustments to the
consolidated financial statements, principally including timely transfer of
completed construction projects to property, plant and equipment, as well as a
reclassification of negative balances in accounts payable and accounts
receivable.
As a result of the existence of these
material weaknesses, our chief executive officer and our chief financial officer
have concluded that we did not maintain effective control over financial
reporting as of June 30, 2010, based on the criteria in Internal Control —
Integrated Framework.
To remediate the material weakness
described above, we have begun a plan to implement new measures to address the
internal control deficiency described above and will continue to evaluate and
may in the future implement additional measures.
We plan to develop further controls to
review and monitor the accounts in question, institute training to accounting
personnel to understand the entries required, and institute better policies and
procedures to ensure that entries are appropriately and timely recorded in the
financial statements.
The effectiveness of the Company’s
internal control over financial reporting as of June 30, 2010 has been audited
by Kabani & Company, Inc., an independent registered public accounting firm,
as stated in their report which appears herein.
Changes
in Internal Control over Financial Reporting
There were no changes in the Company’s
internal control over financial reporting that occurred during our fourth fiscal
quarter ended June 30, 2010 that has materially affected or is reasonably likely
to materially affect our internal control over financial reporting.
49
REPORT
OF INDEPENDENT REGISTERED PUBLIC ACCOUNTING FIRM
To the
Board of Directors and Stockholders of
China
Green Agriculture Inc. and its subsidiaries
We have audited China Green Agriculture
Inc. and its subsidiaries (the “Company”) internal control over financial
reporting as of June 30, 2010, based on criteria established in Internal
Control—Integrated Framework issued by the Committee of Sponsoring Organizations
of the Treadway Commission (COSO). The Company’s management is responsible for
maintaining effective internal control over financial reporting and for its
assessment of the effectiveness of internal control over financial reporting,
included in the accompanying Report of Management on Internal Control Over
Financial Reporting. Our responsibility is to express an opinion on the
company’s internal control over financial reporting based on our
audit.
We conducted our audit in accordance
with the standards of the Public Company Accounting Oversight Board (United
States). Those standards require that we plan and perform the audit to obtain
reasonable assurance about whether effective internal control over financial
reporting was maintained in all material respects. Our audit of internal control
over financial reporting included obtaining an understanding of internal control
over financial reporting, assessing the risk that a material weakness exists,
and testing and evaluating the design and operating effectiveness of internal
control based on the assessed risk. Our audit also included performing such
other procedures as we considered necessary in the circumstances. We believe
that our audit provides a reasonable basis for our opinion.
A company’s internal control over
financial reporting is a process designed to provide reasonable assurance
regarding the reliability of financial reporting and the preparation of
financial statements for external purposes in accordance with generally accepted
accounting principles. A company’s internal control over financial reporting
includes those policies and procedures that (1) pertain to the maintenance of
records that, in reasonable detail, accurately and fairly reflect the
transactions and dispositions of the assets of the company; (2) provide
reasonable assurance that transactions are recorded as necessary to permit
preparation of financial statements in accordance with generally accepted
accounting principles, and that receipts and expenditures of the company are
being made only in accordance with authorizations of management and directors of
the company; and (3) provide reasonable assurance regarding prevention or timely
detection of unauthorized acquisition, use, or disposition of the company’s
assets that could have a material effect on the financial
statements.
Because of its inherent limitations,
internal control over financial reporting may not prevent or detect
misstatements. Also, projections of any evaluation of effectiveness to future
periods are subject to the risk that controls may become inadequate because of
changes in conditions, or that the degree of compliance with the policies or
procedures may deteriorate.
A material weakness is a control
deficiency, or combination of deficiencies, in internal control over financial
reporting, such that there is a reasonable possibility that a material
misstatement of the Company’s annual or interim financial statements will not be
prevented or detected on a timely basis. The following material weakness has
been identified and included in management’s assessment. The Company did not
maintain effective controls over its process to ensure the timely completeness
and accuracy of the preparation and review of its consolidated financial
statements This resulted in several adjustments to the Company’s consolidated
financial statements, principally including timely transfer of completed
construction projects to property, plant and equipment, as well as
reclassification of negative balances in accounts payable and accounts
receivable. This material weakness was considered in determining the nature,
timing, and extent of audit tests applied in our audit of the 2010 financial
statements, and this report does not affect our report dated September 3, 2010
on those financial statements.
In our opinion, because of the effect
of the material weakness described above on the achievement of the objectives of
the control criteria, China Green Agriculture Inc. and its subsidiaries has not
maintained effective internal control over financial reporting as of June 30,
2010, based on criteria established in Internal Control—Integrated Framework
issued by the Committee of Sponsoring Organizations of the Treadway Commission
(COSO).
We have also audited, in accordance
with the standards of the Public Company Accounting Oversight Board (United
States), the balance sheets and the related statements of income, stockholders’
equity and comprehensive income, and cash flows of China Green Agriculture Inc.
and its subsidiaries, and our report dated September 3, 2010 expressed an
unqualified opinion.
/s/
KABANI & COMPANY, INC
CERTIFIED
PUBLIC ACCOUNTANTS
Los
Angeles, CA
September
3, 2010
50
None.
The
information required by this Item is incorporated herein by reference to the
section entitled “Directors and Executive Officers and Corporate Governance” of
our 2010 Proxy Statement.
The
information required by this Item is incorporated herein by reference to the
section entitled “Executive Compensation” of our 2010 Proxy
Statement.
|
ITEM12.
|
SECURITY OWNERSHIP OF CERTAIN
BENEFICIAL OWNERS AND MANAGEMENT AND RELATED STOCKHOLDERS
MATTERS
|
The
information required by this Item is incorporated herein by reference to the
section entitled “Security Ownership of Certain Beneficial Owners and Management
and Related Matters” of our 2010 Proxy Statement.
The
information required by this Item is incorporated herein by reference to the
section entitled “Certain Relationship of Certain Beneficial Owners and
Management and Related Matters” of our 2010 Proxy Statement.
The
information required by this Item is incorporated herein by reference to the
section entitled "Principal Accounting Fees and Services" of our 2010 Proxy
Statement.
(a)
The following documents are filed as part of this report:
Financial
Statements
The
following financial statements of China Green Agriculture, Inc. and Reports of
Independent Registered Public Accounting Firms are presented in the “F” pages of
this report:
|
Report
of Independent Registered Public Accounting Firm
|
F-1
|
|
|
Consolidated
Balance Sheets - as of June 30, 2010 and 2009
|
F-5
|
|
|
Consolidated
Statements of Income and Other Comprehensive Income - for the
Years ended June 30, 2010 and 2009
|
F-5
|
|
|
Consolidated
Statements of Shareholders’ Equity - for the Years ended June 30, 2010 and
2009
|
F-6
|
|
|
Consolidated
Statements of Cash Flows - for the Years ended June 30, 2010 and
2009
|
F-7
|
|
|
Notes
to Consolidated Financial Statements
|
F-8
-
F-28
|
51
(b)
Exhibits
See the
Exhibit Index following the signature page of this report, which Index is
incorporated herein by reference.
52
SIGNATURES
Pursuant
to the requirements of Section 13 or 15(d) of the Securities Exchange Act of
1934, the Registrant has duly caused this report to be signed on its behalf by
the undersigned, thereunto duly authorized.
|
China
Green Agriculture, Inc.
|
||
|
Date: September
3, 2010
|
By:
|
/s/ Tao Li |
|
Tao
Li, President and
CEO
|
||
Pursuant
to the requirements of Section 13 or 15(d) of the Securities Exchange Act of
1934, this report has been signed below by the following persons on behalf of
the Registrant and in the capacities and on the dates indicated.
|
September
3, 2010
|
/s/ Tao Li | |
|
Tao
Li, Chairman of the Board of Directors, President and CEO (principal
executive officer)
|
||
|
|
||
|
September
3, 2010
|
/s/ Ken Ren | |
| Ken Ren, Chief Financial Officer | ||
| (principal financial officer and principal | ||
|
accounting
officer)
|
||
|
September
3, 2010
|
/s/ Yu Hao | |
|
Yu
Hao, Director
|
||
|
|
||
|
September
3, 2010
|
/s/ Lianfu Liu | |
|
Lianfu
Liu, Director
|
||
|
September
3, 2010
|
/s/ Yizhao Zhang | |
|
Yizhao
Zhang, Director
|
||
|
September
3, 2010
|
/s/ Robert B. Fields | |
|
Robert
B. Fields,
Director
|
S-1
China
Green Agriculture, Inc.
Exhibit
Index to Annual Report on Form 10-K
For
the Year Ended June 30, 2010
|
3.1
|
Articles
of Incorporation (incorporated herein by reference to the Company’s
Quarterly Report on Form 10-QSB, for the quarter ended September 30, 2007,
filed with the SEC on November 9, 2007, Exhibit 3.1).
|
|
3.2
|
Certificate
of Change filed with the Secretary of State of the State of Nevada on
December 18, 2007 (incorporated herein by reference to the Company’s
Current Report on Form 8-K filed with the SEC on January 2, 2008, Exhibit
4.2).
|
|
3.3
|
Certificate
of Correction (incorporated herein by reference to the Company’s
Registration Statement on Form S-1 filed with the SEC on February 8, 2008,
Exhibit 4.1).
|
|
3.4
|
Articles
of Merger (incorporated herein by reference to the Company’s Current
Report on Form 8-K, filed February 5, 2008, Exhibit
3.1).
|
|
3.5
|
Bylaws
(incorporated herein by reference to the Company’s Quarterly Report on
Form 10-QSB, for the quarter ended September 30, 2007, filed with the SEC
on November 9, 2007, Exhibit 3.2).
|
|
4.1
|
Specimen
Common Stock Certificate (incorporated herein by reference to the
Company’s Registration Statement on Form S-3 filed with the SEC on June 8,
2009, Exhibit 4.1).
|
|
10.1
|
Employment
Agreement, dated January 16, 2008, by and between Shaanxi TechTeam Jinong
Humic Acid Product Co., Ltd. and Mr. Tao Li.
|
|
10.2
|
Employment
Agreement, dated June 21, 2010, by and between the Company and Mr. Ken Ren
(Incorporated herein by reference to our Current Report on Form 8-K filed
with the SEC on June 25, 2010)
|
|
10.3
|
Share
Transfer Agreement, dated July 1, 2010, by and between Shaanxi TechTeam
Jinong Humic Acid Product Co., Ltd., Qing Xin Jiang and Qiong Jia
(Incorporated herein by reference to the Current Report on Form 8-K filed
with the SEC on July 7, 2010).
|
|
10.4
|
Supplementary
Agreement, dated July 1, 2010, by and between Shaanxi TechTeam Jinong
Humic Acid Product Co., Ltd., Qing Xin Jiang and Qiong Jia (Incorporated
herein by reference to the Current Report on Form 8-K filed with the SEC
on July 7, 2010).
|
|
10.5
|
Form
of Restricted Stock Grant Agreement (Incorporated herein by reference to
the Current Report on Form 8-K filed with the SEC on January 11,
2010).
|
|
10.6
|
Form
of Non-Qualified Stock Option Grant Agreement (Incorporated herein by
reference to the Current Report on Form 8-K filed with the SEC on January
11, 2010).
|
|
14.1
|
Code
of Ethics (incorporated herein by reference to the Annual Report on Form
10-K filed with the SEC on September 26, 2008).
|
|
21.1
|
List
of Subsidiaries of the
Company.
|
E-1
|
23.1
|
Consent
of Kabani & Company, Inc., Independent Registered Public Accounting
Firm.
|
|
31.1
|
Certification
of Tao Li pursuant to Exchange Act Rules 13a-14(a) and 15d-14(a), as
adopted pursuant to Section 302 of the Sarbanes-Oxley Act of
2002.
|
|
31.2
|
Certification
of Ken Ren pursuant to Exchange Act Rules 13a-14(a) and 15d-14(a), as
adopted pursuant to Section 302 of the Sarbanes-Oxley Act of
2002.
|
|
32.1
|
Certification
pursuant to 18 U.S.C. Section 1350, as adopted pursuant to Section 906 of
the Sarbanes-Oxley Act of
2002.
|
E-2
REPORT
OF INDEPENDENT REGISTERED PUBLIC ACCOUNTING FIRM
To the
Board of Directors and Stockholders of
China
Green Agriculture Inc. and its subsidiaries
We have
audited the accompanying consolidated balance sheets of China Green Agriculture
Inc. and its subsidiaries (the “Company”) as of June 30, 2010 and 2009, and the
related consolidated statements of income and comprehensive income,
stockholders' equity, and cash flows for each of the two years in the period
ended June 30, 2010. These financial statements are the responsibility of the
Company's management. Our responsibility is to express an opinion on these
financial statements based on our audits.
We
conducted our audits in accordance with the standards of the Public Company
Accounting Oversight Board (United States). Those standards require that we plan
and perform the audit to obtain reasonable assurance about whether the financial
statements are free of material misstatement. An audit includes examining, on a
test basis, evidence supporting the amounts and disclosures in the financial
statements. An audit also includes assessing the accounting principles used and
significant estimates made by management, as well as evaluating the overall
financial statement presentation. We believe that our audits provide a
reasonable basis for our opinion.
In our
opinion, the financial statements referred to above present fairly, in all
material respects, the financial position of China Green Agriculture Inc. and
its subsidiaries as of June 30, 2010 and 2009, and the results of its operations
and its cash flows for each of the years in the two-year period ended June 30,
2010 in conformity with accounting principles generally accepted in the United
States of America.
We also
have audited, in accordance with the standards of the Public Company Accounting
Oversight Board (United States), China Green Agriculture Inc. and its
subsidiary’s internal control over financial reporting as of June 30, 2010,
based on criteria established in Internal Control—Integrated Framework issued by
the Committee of Sponsoring Organizations of the Treadway Commission (COSO), and
our report dated September 3, 2010 expressed an adverse opinion.
/s/
KABANI & COMPANY
CERTIFIED
PUBLIC ACCOUNTANTS
Los
Angeles, CA
September
3, 2010
F-1
AS
OF JUNE 30, 2010 AND 2009
(AUDITED)
|
June 30, 2010
|
June 30, 2009
|
|||||||
|
ASSETS
|
||||||||
|
Current
Assets
|
||||||||
|
Cash
and cash equivalents
|
$ | 62,335,437 | $ | 17,795,447 | ||||
|
Restricted
cash
|
- | 83,579 | ||||||
|
Accounts
receivable, net
|
15,571,888 | 8,167,715 | ||||||
|
Inventories
|
11,262,647 | 7,162,249 | ||||||
|
Other
assets
|
86,824 | 129,213 | ||||||
|
Deferred
offering cost
|
- | 160,500 | ||||||
|
Advances
to suppliers
|
221,280 | 95,255 | ||||||
|
Total
Current Assets
|
89,478,076 | 33,593,958 | ||||||
|
Plant,
Property and Equipment, Net
|
29,368,515 | 17,341,654 | ||||||
|
Construction
In Progress
|
257,077 | 9,609,649 | ||||||
|
Other
Assets - Non Current
|
1,098,704 | - | ||||||
|
Intangible
Assets, Net
|
11,585,570 | 1,073,165 | ||||||
|
Total
Assets
|
$ | 131,787,942 | $ | 61,618,426 | ||||
|
LIABILITIES
AND SHAREHOLDERS' EQUITY
|
||||||||
|
Current
Liabilities
|
||||||||
|
Accounts
payable
|
$ | 328,124 | $ | 926,883 | ||||
|
Unearned
revenue
|
41,645 | 24,000 | ||||||
|
Other
payables and accrued expenses
|
507,705 | 1,091,168 | ||||||
|
Advances
from other unrelated companies
|
- | 326,970 | ||||||
|
Amount
due to related parties
|
68,164 | 31,160 | ||||||
|
Taxes
payable
|
2,304,382 | 2,887,828 | ||||||
|
Short
term loans
|
- | 3,170,290 | ||||||
|
Total
Current Liabilities
|
3,250,020 | 8,458,299 | ||||||
|
Common
Stock, $.001 par value, 6,313,617 shares subject to
redemption
|
- | 20,519,255 | ||||||
|
Stockholders'
Equity
|
||||||||
|
Preferred
Stock, $.001 par value, 20,000,000 shares authorized, Zero shares issued
and outstanding
|
- | - | ||||||
|
Common
stock, $.001 par value, 115,197,165 shares authorized, 24,572,328 and
12,281,569 shares issued and outstanding as of June 30, 2010 and 2009,
respectively)
|
24,573 | 12,282 | ||||||
|
Additional
paid-in capital
|
75,755,682 | 2,060,162 | ||||||
|
Statuary
reserve
|
5,864,648 | 3,468,530 | ||||||
|
Retained
earnings
|
43,536,408 | 24,642,768 | ||||||
|
Accumulated
other comprehensive income
|
3,356,611 | 2,457,130 | ||||||
|
Total
Stockholders' Equity
|
128,537,922 | 32,640,872 | ||||||
|
Total
Liabilities and Stockholders' Equity
|
$ | 131,787,942 | $ | 61,618,426 | ||||
The
accompanying notes are an integral part of these consolidated financial
statements.
F-2
CONSOLIDATED
STATEMENTS OF INCOME AND COMPREHENSIVE INCOME
FOR
THE YEARS ENDED JUNE 30, 2010 AND 2009
(AUDITED)
|
For the Years Ended June 30,
|
||||||||
|
2010
|
2009
|
|||||||
|
Sales
|
||||||||
|
Jinong
|
$ | 45,816,377 | $ | 28,889,131 | ||||
|
Jintai
|
6,274,375 | 6,318,866 | ||||||
|
Net
sales
|
$ | 52,090,752 | $ | 35,207,997 | ||||
|
Cost
of goods sold
|
||||||||
|
Jinong
|
17,700,532 | 11,173,236 | ||||||
|
Jintai
|
3,438,020 | 3,538,830 | ||||||
|
Cost
of goods sold
|
21,138,551 | 14,712,066 | ||||||
|
Gross
profit
|
30,952,201 | 20,495,931 | ||||||
|
Operating
expenses
|
||||||||
|
Selling
expenses
|
2,203,345 | 1,412,101 | ||||||
|
General
and administrative expenses
|
3,822,234 | 1,993,817 | ||||||
|
Total
operating expenses
|
6,025,580 | 3,405,918 | ||||||
|
Income
from operations
|
24,926,621 | 17,090,013 | ||||||
|
Other
income (expense)
|
||||||||
|
Other
income (expense)
|
(5,321 | ) | 4,822 | |||||
|
Interest
income
|
275,449 | 334,948 | ||||||
|
Interest
expense
|
(112,475 | ) | (632,446 | ) | ||||
|
Total
other income (expense)
|
157,653 | (294,043 | ) | |||||
|
Income
before income taxes
|
25,084,274 | 16,795,970 | ||||||
|
Provision
for income taxes
|
3,794,515 | 2,331,548 | ||||||
|
Net
income
|
21,289,758 | 14,464,422 | ||||||
|
Other
comprehensive income
|
||||||||
|
Foreign
currency translation gain/(loss)
|
899,481 | 52,711 | ||||||
|
Comprehensive
income
|
$ | 22,189,239 | $ | 14,517,132 | ||||
|
Basic weighted average shares
outstanding
|
23,468,246 | 18,478,474 | ||||||
|
Basic
net earnings per share
|
$ | 0.91 | $ | 0.78 | ||||
|
Diluted
weighted average shares outstanding
|
23,468,246 | 18,532,591 | ||||||
|
Diluted
net earnings per share
|
0.91 | 0.78 | ||||||
Effect
of diluted security is anti-dliutive, therefore not considered in the
calculation of diluted weighted average shares outstanding.
The
accompanying notes are an integral part of these consolidated financial
statements.
F-3
STATEMENTS
OF STOCKHOLDERS' EQUITY
FOR
THE YEARS ENDED JUNE 30, 2010 AND 2009
(AUDITED)
|
Additional
|
Accumulated Other
|
Total
|
||||||||||||||||||||||||||
|
Number
|
Common
|
Paid In
|
Statutory
|
Retained
|
Comprehensive
|
Stockholders'
|
||||||||||||||||||||||
|
Of Shares
|
Stock
|
Capital
|
Reserve
|
Earnings
|
Income (loss)
|
Equity
|
||||||||||||||||||||||
|
BALANCE,
JUNE 30, 2008
|
12,068,086 | 12,068 | 1,200,077 | 1,882,797 | 11,764,079 | 2,404,419 | 17,263,441 | |||||||||||||||||||||
|
Net
income for the year ended June 30, 2009
|
- | - | - | - | 14,464,422 | - | 14,464,422 | |||||||||||||||||||||
|
Stock
options compensation
|
- | - | 155,804 | - | - | - | 155,804 | |||||||||||||||||||||
|
Issuance
of stock for liquidated damages
|
213,483 | 213 | 704,281 | - | - | - | 704,494 | |||||||||||||||||||||
|
Transfer
to statutory reserve
|
- | - | - | 1,585,733 | (1,585,733 | ) | - | - | ||||||||||||||||||||
|
Accumulative
other comprehensive loss
|
- | - | - | - | - | 52,711 | 52,711 | |||||||||||||||||||||
|
BALANCE,
JUNE 30, 2009
|
12,281,569 | $ | 12,282 | $ | 2,060,162 | $ | 3,468,530 | $ | 24,642,768 | $ | 2,457,130 | $ | 32,640,872 | |||||||||||||||
|
Net
income for the year ended June 30, 2010
|
- | - | - | - | 21,289,758 | - | 21,289,758 | |||||||||||||||||||||
|
Reclass
PIPE shares subject to redemption
|
6,313,617 | 6,314 | 20,512,941 | - | - | - | 20,519,255 | |||||||||||||||||||||
|
Stock
issued in relation to fund raising
|
5,627,564 | 5,628 | 51,487,208 | - | - | - | 51,492,835 | |||||||||||||||||||||
|
Issuance
of stock options for compensation
|
272,161 | 272 | 1,695,449 | 1,695,721 | ||||||||||||||||||||||||
|
Exercised
of stock options-cashless
|
77,418 | 77 | (77 | ) | - | - | - | - | ||||||||||||||||||||
|
Transfer
to statutory reserve
|
- | - | - | 2,396,118 | (2,396,118 | ) | - | |||||||||||||||||||||
|
Accumulative
other comprehensive loss
|
- | - | - | - | - | 899,481 | 899,481 | |||||||||||||||||||||
|
BALANCE,
MAR 31, 2010
|
24,572,329 | $ | 24,573 | $ | 75,755,682 | $ | 5,864,648 | $ | 43,536,408 | $ | 3,356,611 | $ | 128,537,922 | |||||||||||||||
The
accompanying notes are an integral part of these consolidated financial
statements.
F-4
CHINA
GREEN AGRICULTURE INC. AND SUBSIDIARIES
FOR
THE YEARS ENDED JUNE 30, 2010 AND 2009
(AUDITED)
|
2010
|
2009
|
|||||||
|
Cash
flows from operating activities
|
||||||||
|
Net
income
|
$ | 21,289,758 | $ | 14,464,422 | ||||
|
Adjustments
to reconcile net income to net cash
|
||||||||
|
provided
by operating activities
|
||||||||
|
Share
capital contribution - rental and interest paid by
shareholders
|
- | - | ||||||
|
Issuance
of equity for compensation
|
1,695,449 | 155,804 | ||||||
|
Depreciation
|
2,310,596 | 1,494,489 | ||||||
|
Amortization
|
287,521 | 108,525 | ||||||
|
Decrease
/ (Increase) in current assets
|
||||||||
|
Accounts
receivable
|
(7,278,914 | ) | (4,570,071 | ) | ||||
|
Other
receivables
|
50,286 | (13,234 | ) | |||||
|
Inventories
|
(4,006,562 | ) | (3,166,338 | ) | ||||
|
Advances
to suppliers
|
(124,298 | ) | 418,072 | |||||
|
Other
assets
|
(44,648 | ) | 10,875 | |||||
|
(Decrease)
/ Increase in current liabilities
|
||||||||
|
Accounts
payable
|
(602,750 | ) | 693,896 | |||||
|
Unearned
revenue
|
17,304 | (65,037 | ) | |||||
|
Tax
payables
|
(606,318 | ) | (2,996,862 | ) | ||||
|
Other
payables and accrued expenses
|
(755,389 | ) | 649,544 | |||||
|
Net
cash provided by operating activities
|
12,232,035 | 7,184,086 | ||||||
|
Cash
flows from investing activities
|
||||||||
|
Acquisition
of plant, property, and equipment
|
(14,092,793 | ) | (612,662 | ) | ||||
|
Acquisition
of intangible assets
|
(10,719,653 | ) | - | |||||
|
Advances
for construction in progress
|
(1,091,354 | ) | - | |||||
|
Amounts
increase / (decrease) in construction in progress
|
9,379,107 | (4,485,059 | ) | |||||
|
Net
cash used in investing activities
|
(16,524,694 | ) | (5,097,721 | ) | ||||
|
Cash
flows from financing activities
|
||||||||
|
Repayment
of loan
|
(3,178,477 | ) | (1,036,770 | ) | ||||
|
Shares
issuance cost
|
(2,232,302 | ) | - | |||||
|
Proceeds
from issuance of shares
|
53,778,748 | - | ||||||
|
Restricted
cash
|
83,579 | 109,813 | ||||||
|
Net
cash provided by / (used in) financing activities
|
48,451,549 | (926,957 | ) | |||||
|
Effect
of exchange rate change on cash and cash equivalents
|
381,100 | 23,623 | ||||||
|
Net
increase in cash and cash equivalents
|
44,539,990 | 1,183,031 | ||||||
|
Cash
and cash equivalents, beginning balance
|
17,795,447 | 16,612,416 | ||||||
|
Cash
and cash equivalents, ending balance
|
$ | 62,335,437 | $ | 17,795,447 | ||||
|
Supplement
disclosure of cash flow information
|
||||||||
|
Interest
expense paid
|
$ | 112,475 | $ | 188,798 | ||||
|
Income
taxes paid
|
$ | 3,081,886 | $ | 2,112,985 | ||||
|
Supplement
disclosure of non-cash investing and financing activities
|
||||||||
|
Completion
of construction in progress
|
$ | 9,379,107 | $ | - | ||||
The
accompanying notes are an integral part of these consolidated financial
statements.
F-5
CHINA
GREEN AGRICULTURE, INC. AND SUBSIDIARIES
Notes
To Consolidated Financial Statements
June
30, 2010 and 2009
China
Green Agriculture, Inc. (the “Company”, “we”, “us”), through its subsidiaries,
is engaged in the research, development, production, distribution and sale of
humic acid-based compound fertilizer, and the development, production and
distribution of agricultural products. The Company was incorporated in
1987.
On
December 26, 2007, the Company acquired 100% of the equity of Green Agriculture
Holding Corporation (“Green New Jersey”), through a share exchange (the “Share
Exchange”). Green New Jersey was incorporated on January 27, 2007 under the laws
of the State of New Jersey.
On August
24, 2007, Green New Jersey acquired 100% of the equity of Shaanxi TechTeam
Jinong Humic Acid Product Co., Ltd. (“Jinong”). Jinong was incorporated in the
People’s Republic of China (the “PRC”) on June 19, 2000. On January 19, 2007,
Jinong incorporated Xi’an Jintai Agriculture Technology Development Company
(“Jintai”).
On
December 23, 2008, Xi’an Hu County Yuxing Agriculture Technology Development
Co., Ltd. (“Yuxing”) was established and registered in Hu County, Xi’an by two
employees of Jinong. On July 23, 2009, 100% ownership of Yuxing was transferred
to Jinong for $146,250 which was the original contribution for the share capital
to establish Yuxing.
Accounting
Principles
The
financial statements and accompanying notes are prepared in accordance with
accounting principles generally accepted in the United States of
America.
Principles
of Consolidation
The
accompanying consolidated financial statements include the accounts of the
Company and its wholly-owned subsidiaries, Green New Jersey, Jinong, Jintai and
Yuxing. All significant inter-company accounts and transactions have been
eliminated in consolidation.
Use
of Estimates
The
preparation of consolidated financial statements in conformity with accounting
principles generally accepted in the United States of America requires
management to make estimates and assumptions that affect the reported amounts of
assets and liabilities and disclosure of contingent assets and liabilities at
the date of the consolidated financial statements and the amount of revenues and
expenses during the reporting periods. Management makes these estimates using
the best information available at the time the estimates are made. However,
actual results could differ from those results.
F-6
CHINA
GREEN AGRICULTURE, INC. AND SUBSIDIARIES
Notes
To Consolidated Financial Statements
June
30, 2010 and 2009
Subsequent
Events
The
Company evaluates events subsequent to the end of the fiscal year through the
date the financial statements are filed with the Securities and Exchange
Commission for recognition or disclosure in the consolidated financial
statements. Events that provide additional evidence about material conditions
that existed at the date of the balance sheet are evaluated for recognition in
the consolidated financial statements. Events that provide evidence about
conditions that did not exist at the date of the balance sheet but occurred
after the balance sheet date are evaluated for disclosure in the notes to the
consolidated financial statements.
Cash
and Cash Equivalents and Concentration of Cash
For
statement of cash flows purposes, the Company considers all cash on hand and in
banks, certificates of deposit with state owned banks in the PRC and banks in
the United States, and other highly-liquid investments with maturities of three
months or less, when purchased, to be cash and cash equivalents. The Company
maintains balances at financial institutions which, from time to time, may
exceed deposit insurance limits for the banks located in the United States.
Balances at financial institutions or state owned banks within the PRC are not
covered by insurance. Cash overdrafts are recorded as liabilities in the balance
sheet. The Company has not experienced any losses in such accounts and believes
it is not exposed to any significant risks on its cash in bank
accounts.
Accounts
Receivable
The
Company maintains an allowance for doubtful accounts for estimated losses
inherent in its accounts receivable portfolio. In establishing the required
allowance, management regularly reviews the composition of accounts receivable
and analyzes customer credit worthiness, current economic trends and changes in
customer payment patterns. Account balances are charged off against the
allowance after all means of collection have been exhausted and the potential
for recovery is considered remote. As of June 30, 2010 and 2009, the Company had
accounts receivable of $15,571,888 and $8,167,715, net of allowance for doubtful
accounts of $193,403 and $119,178, respectively.
Inventories
Inventory
is valued at the lower of cost (determined on a weighted average basis) or
market. Cost is determined using the last-in, first-out method (LIFO).
Inventories consist of raw materials, work in process, finished goods and
packaging materials. The Company reviews its inventories regularly for possible
obsolete goods and establishes reserves when determined necessary.
Property,
Plant and Equipment
Property,
plant and equipment are recorded at cost. Gains or losses on disposals are
reflected as gain or loss in the year of disposal. The cost of improvements that
extend the life of plant, property, and equipment are capitalized. These
capitalized costs may include structural improvements, equipment, and fixtures.
All ordinary repair and maintenance costs are expensed as incurred.
F-7
CHINA
GREEN AGRICULTURE, INC. AND SUBSIDIARIES
Notes
To Consolidated Financial Statements
June
30, 2010 and 2009
Depreciation
for financial reporting purposes is provided using the straight-line method over
the estimated useful lives of the assets:
|
Estimated Useful Life
|
||
|
Building
|
10-25
years
|
|
|
Agricultural
assets
|
8
years
|
|
|
Machinery
and equipment
|
5-15
years
|
|
|
Vehicles
|
3-5
years
|
Construction
in Progress
Construction
in progress represents the costs incurred in connection with the construction of
buildings or new additions to the Company’s plant facilities. Costs classified
to construction in progress include all cost of obtaining the asset and bringing
it to the location and condition necessary for its intended use. No depreciation
is provided for construction in progress until such time as the assets are
completed and are placed into service. Interest incurred during construction is
capitalized into construction in progress. All other interest is expensed as
incurred.
Long-Lived
Assets
The
Company tests long-lived assets for impairment whenever events or changes in
circumstances indicate that the carrying amount of an asset may not be
recoverable through the estimated undiscounted cash flows expected to result
from the use and eventual disposition of the assets. Whenever any such
impairment exists, an impairment loss will be recognized for the amount by which
the carrying value exceeds the fair value.
Intangible
Assets
The
Company records intangible assets acquired individually or as part of a group at
fair value. Intangible assets with definitive lives are amortized over the
useful life of the intangible asset, which is the period over which the asset is
expected to contribute directly or indirectly to the entity’s future cash flows.
The Company evaluates intangible assets for impairment at least annually and
more often whenever events or changes in circumstances indicate that the
carrying value may not be recoverable. Whenever any such impairment exists, an
impairment loss will be recognized for the amount by which the carrying value
exceeds the fair value.
Revenue
Recognition
Sales
revenue is recognized on the date of shipment to customers when a formal
arrangement exists, the price is fixed or determinable, the delivery is
completed, no other significant obligations of the Company exist and
collectability is reasonably assured. Payments received before all of the
relevant criteria for revenue recognition are satisfied are recorded as unearned
revenue. As of June 30, 2010 and 2009, the Company had unearned revenues of
$41,645 and $24,000, respectively.
F-8
CHINA
GREEN AGRICULTURE, INC. AND SUBSIDIARIES
Notes
To Consolidated Financial Statements
June
30, 2010 and 2009
The
Company's revenue consists of invoiced value of goods, net of a value-added tax
(VAT). No product return or sales discount allowance is made as products
delivered and accepted by customers are normally not returnable and sales
discounts are normally not granted after products are delivered.
Stock-Based
Compensation
The costs
of all employee stock options, as well as other equity-based compensation
arrangements, are reflected in the consolidated financial statements based on
the estimated fair value of the awards on the grant date. That cost is
recognized over the period during which an employee is required to provide
service in exchange for the award—the requisite service period (usually the
vesting period). Stock compensation for stock granted to non-employees is
determined as the fair value of the consideration received or the fair value of
equity instruments issued, whichever is more reliably measured.
Income
Taxes
The
Company accounts for income taxes using an asset and liability approach which
allows for the recognition and measurement of deferred tax assets based upon the
likelihood of realization of tax benefits in future years Under this method,
deferred income taxes are recognized for the tax consequences in future years of
differences between the tax bases of assets and liabilities and their financial
reporting amounts at each period end based on enacted tax laws and statutory tax
rates applicable to the periods in which the differences are expected to affect
taxable income. A valuation allowance is provided for deferred tax assets if it
is more likely than not these items will either expire before the Company is
able to realize their benefits, or that future deductibility is
uncertain.
Foreign
Currency Translation
The
reporting currency of the Company is the US dollar. The functional currency of
the Company and Green New Jersey is the US dollar. The functional currency of
Jinong and its subsidiaries Jintai and Yuxing is the Chinese Yuan or Renminbi
(“RMB”). For the subsidiaries whose functional currencies are other than the US
dollar, all asset and liability accounts were translated at the exchange rate on
the balance sheet date; stockholder's equity is translated at the historical
rates and items in the cash flow statements are translated at the average rate
in each applicable period. Translation adjustments resulting from this process
are included in accumulated other comprehensive income in the statement of
shareholders’ equity. The resulting translation gains and losses that arise from
exchange rate fluctuations on transactions denominated in a currency other than
the functional currency are included in the results of operations as
incurred.
Fair
Value of Financial Instruments
Fair
value is the price that would be received to sell an asset or paid to transfer a
liability in an orderly transaction between market participants at the
measurement date. Assets and liabilities measured at fair value are categorized
based on whether or not the inputs are observable in the market and the degree
that the inputs are observable. The categorization of financial assets and
liabilities within the valuation hierarchy is based upon the lowest level of
input that is significant to the fair value measurement.
F-9
CHINA
GREEN AGRICULTURE, INC. AND SUBSIDIARIES
Notes
To Consolidated Financial Statements
June
30, 2010 and 2009
The
Company's financial instruments primarily consist of cash and cash equivalents,
accounts receivable, other receivables, advances to suppliers, accounts payable,
other payables, tax payable, and related party advances and
borrowings.
As of the
balance sheet dates, the estimated fair values of the financial instruments were
not materially different from their carrying values as presented on the balance
sheet. This is attributed to the short maturities of the instruments and that
interest rates on the borrowings approximate those that would have been
available for loans of similar remaining maturity and risk profile at respective
balance sheet dates.
Statement
of Cash Flows
The
Company's cash flows from operations are calculated based on the local
currencies. As a result, amounts related to assets and liabilities reported on
the statement of cash flows may not necessarily agree with changes in the
corresponding balances on the balance sheet.
Earnings
per Share
Basic
earnings per share is computed based on the weighted average number of shares of
common stock outstanding during the period. Diluted earnings per share is
computed based on the weighted average number of shares of common stock plus the
effect of dilutive potential common shares outstanding during the period using
the treasury stock method. Dilutive potential common shares include outstanding
stock options, stock awards.
The
components of basic and diluted earnings per share as of June 30, 2010 and 2009
were as follows:
|
2010
|
2009
|
||||||||
|
Net
Income for Basic Earnings Per Share
|
$ | 21,289,758 | $ | 14,464,422 | |||||
|
Basic
Weighted Average Number of Shares
|
23,468,246 | 18,478,474 | |||||||
|
Net
Income per Share – Basic
|
0.91 | 0.78 | |||||||
|
Net
Income for Diluted Earnings Per Share
|
21,289,758 | 14,464,422 | |||||||
|
Diluted
Weighted Average Number of Shares
|
23,468,246 | 18,532,591 | |||||||
|
Net
Income per Share – Diluted
|
$ | 0.91 | $ | 0.78 | |||||
Recent
Accounting Pronouncements
In
January 2010, the FASB issued Accounting Standards Update No. 2010-06 (ASU
2010-06),
Fair Value
Measurements and Disclosures
which amends ASC Topic 820, adding new
requirements for disclosures for Levels 1 and 2, separate disclosures of
purchases, sales, issuances, and settlements relating to Level 3 measurements
and clarification of existing fair value disclosures. ASU 2010-06 is effective
for interim and annual periods beginning after December 15, 2009, except for the
requirement to provide Level 3 activity of purchases, sales, issuances, and
settlements on a gross basis, which will be effective for fiscal years beginning
after December 15, 2010 (the Company’s fiscal year 2011); early adoption is
permitted. The Company is currently evaluating the impact of adopting ASU
2010-06 on its financial statements.
F-10
CHINA
GREEN AGRICULTURE, INC. AND SUBSIDIARIES
Notes
To Consolidated Financial Statements
June
30, 2010 and 2009
Inventories
consist of the following as of June 30, 2010 and 2009:
|
2010
|
2009
|
|||||||
|
Raw
materials
|
$ | 314,268 | $ | 67,046 | ||||
|
Supplies
and packing materials
|
113,146 | 87,081 | ||||||
|
Work
in progress
|
10,686,325 | 6,901,124 | ||||||
|
Finished
goods
|
148,909 | 106,279 | ||||||
|
Totals
|
$ | 11,262,647 | $ | 7,162,249 | ||||
Other
assets consist of the following as of June 30, 2010 and 2009:
|
2010
|
2009
|
|||||||
|
Advances
|
$ | 41,875 | $ | 91,334 | ||||
|
Promotion
material
|
44,949 | 37,879 | ||||||
|
Total
|
$ | 86,824 | $ | 129,213 | ||||
Advances
represent advances made to non-related parties and employees. The amounts were
unsecured, interest free, and due on demand.
Deferred
offering cost, related to the public offering in July 2009, consists of the
following as of June 30, 2010 and 2009:
|
2010
|
2009
|
|||||||
|
Legal
costs
|
$ | - | $ | 130,000 | ||||
|
Accounting
costs
|
- | 30,500 | ||||||
|
Total
|
$ | - | $ | 160,500 | ||||
F-11
CHINA
GREEN AGRICULTURE, INC. AND SUBSIDIARIES
Notes
To Consolidated Financial Statements
June
30, 2010 and 2009
Property,
plant and equipment consist of the following as of June 30, 2010 and,
2009:
|
2010
|
2009
|
|||||||
|
Building
and improvements
|
$ | 11,719,363 | $ | 10,632,055 | ||||
|
Vehicles
|
117,295 | 23,784 | ||||||
|
Machinery
and equipment
|
21,628,525 | 8,620,173 | ||||||
|
Agriculture
assets
|
1,528,898 | 1,334,538 | ||||||
|
Total
|
34,994,081
|
20,610,551 | ||||||
|
Less:
accumulated depreciation
|
(5,625,566 | ) | (3,268,897 | ) | ||||
|
Total
property, plant and equipment
|
$ |
29,368,515
|
$ | 17,341,654 | ||||
Total
depreciation for the years ended June 30, 2009 and 2008 was $2,356,669 and
$1,497,610, respectively, of which 93% was recorded in cost of goods sold and 7%
was recorded in general, and administrative expense in each year.
As of
June 30, 2010 and, 2009, construction in progress, representing construction for
a new product line and other buildings amounted to $257,077 and $9,609,649,
respectively.
The
intangible assets are comprised of the following as of June 30, 2010 and
2009:
|
2010
|
2009
|
|||||||
|
Land
use right, net
|
$ | 11,495,059 | $ | 895,808 | ||||
|
Technology
know-how, net
|
90,512 | 177,357 | ||||||
|
Total
|
$ | 11,585,570 | $ | 1,073,165 | ||||
Land
Use Rights
On
September 25, 2009, Yuxing was granted a land use right for approximately 88
acres by the People’s Government and Land & Resources Bureau of Hu County,
Xi’an, Shaanxi Province. The fair value of the related intangible asset was
determined to be the respective cost of $10,791,845. The intangible asset is
being amortized over the grant period of 50 years.
On August
16, 2001, Jinong received a land use right as a contribution from a shareholder,
which was granted by the People’s Government and Land & Resources Bureau of
Yanling District, Shaanxi Province. The fair value of the related intangible
asset at the time of the contribution was determined to be $1,064,326. The
intangible asset is being amortized over the grant period of 50
years.
F-12
CHINA
GREEN AGRICULTURE, INC. AND SUBSIDIARIES
Notes
To Consolidated Financial Statements
June
30, 2010 and 2009
The Land
Use Rights consist of the following as of June 30, 2010 and 2009:
|
2010
|
2009
|
|||||||
|
Land
use rights
|
$ | 11,866,105 | $ | 1,064,326 | ||||
|
Less:
accumulated amortization
|
(371,047 | ) | (168,518 | ) | ||||
|
Total
|
$ | 11,495,059 | $ | 895,808 | ||||
Technology
Patent
On august
16, 2001, Jinong was issued a technology patent related to a proprietary formula
used in the production of humid acid. The fair value of the related intangible
asset was determined to be the respective cost of $866,338. The intangible asset
is being amortized over the patent period of 10 years.
The
technology patent consists of the following as of June 30, 2010 and
2009:
|
2010
|
2009
|
|||||||
|
Technology
Know-how
|
$ | 866,338 | $ | 858,326 | ||||
|
Less:
accumulated amortization
|
(775,826 | ) | (680,969 | ) | ||||
|
Total
|
$ | 90,512 | $ | 177,357 | ||||
Total
amortization expenses of intangible assets for the fiscal years ended June 30,
2010 and 2009 amounted to $287,251 and $108,525, respectively.
Amortization
expenses of intangible assets for the next five years after June 30, 2010 are as
follows:
|
June
30, 2011
|
$ | 323,956 | ||
|
June
30, 2012
|
241,200 | |||
|
June
30, 2013
|
237,322 | |||
|
June
30, 2014
|
237,322 | |||
|
June
30, 2015
|
237,322 | |||
|
Total
|
$ | 1,277,122 |
The
amount due to related parties is comprised of advances from the Company’s
officers and shareholders, which were unsecured notes, non-interest bearing and
due on demand. As of June 30, 2010 and 2009, the amount due to related parties
was $68,164 and $31,160, respectively.
F-13
CHINA
GREEN AGRICULTURE, INC. AND SUBSIDIARIES
Notes
To Consolidated Financial Statements
June
30, 2010 and 2009
Accrued
expenses and other payables consist of the following as of June 30, 2010 and
2009:
|
2010
|
2009
|
|||||||
|
Payroll
payable
|
$ | 8,848 | $ | 8,766 | ||||
|
Welfare
payable
|
164,051 | 177,865 | ||||||
|
Accrued
expenses
|
334,806 | 791,172 | ||||||
|
Other
levy payable
|
- | 113,365 | ||||||
|
Total
|
$ | 507,705 | $ | 1,091,168 | ||||
Loan
payables consist of the following as of June 30, 2010 and 2009:
|
2010
|
2009
|
|||||||
|
Short
term loans payable:
|
- | |||||||
|
Xi’an
Commercial Bank Xincheng Branch
|
$ | - | $ | 2,191,445 | ||||
|
Xi’an
Beilin District Rural Credit Union Wenyibeilu Branch
|
- | 555,166 | ||||||
|
Agriculture
Bank Yanglingshifangqu Branch
|
- | 423,679 | ||||||
|
Total
|
$ | - | $ | 3,170,290 | ||||
The
interest expenses from these short-term loans are $112,475 and $424,510 for the
fiscal years ended June 30, 2010 and 2009, respectively.
Enterprise
Income Tax
Effective
January 1, 2008, the new Enterprise Income Tax (“EIT”) law of the PRC replaced
the existing tax laws for Domestic Enterprises (“DES”) and Foreign Invested
Enterprises (“FIEs”). The new EIT rate of 25% replaced the 33% rate that was
applicable to both DES and FIEs. The two year tax exemption and three year 50%
tax reduction tax holiday for production-oriented FIEs was eliminated. Since
January 1, 2008, Jinong became subject to income tax in China at a rate of 15%
as a high-tech company, as a result of the expiration of its tax exemption on
December 31, 2007, and accordingly, it made provision for income taxes as of
June 30, 2010 and 2009 of $3,794,515, and $2,331,548, respectively, which is
mainly due to the operating income from Jinong. Jintai has been exempt from
paying income tax since its formation as it produces products which fall into
the tax exemption list set out in the EIT. This exemption is expected to last as
long as the applicable provisions of the EIT do not change.
F-14
CHINA
GREEN AGRICULTURE, INC. AND SUBSIDIARIES
Notes
To Consolidated Financial Statements
June
30, 2010 and 2009
Value-Added
Tax
All of
the Company’s fertilizer products that are produced and sold in the PRC were
subject to a Chinese Value-Added Tax (VAT) of 13% of the gross sales price. On
April 29, 2008, the PRC State of Administration of Taxation (SAT) released
Notice #56, “
Exemption of VAT
for Organic Fertilizer Products
”, which allows certain fertilizer
products to be exempt from VAT beginning June 1, 2008. The Company submitted the
application for exemption in May 2009, which was received effective September 1,
2009, continuing through December 31, 2015. The VAT exemption applies to all
agricultural products sold by Jingtai, and all but a nominal amount of
agricultural products sold by Jinong.
Income
Taxes and Related Payables
In
November 2009, the Company made a lump sum VAT payment of $2,994,100 to SAT,
representing the balance of VAT payable under the previous VAT tax structure. As
a result of this payment and the newly received VAT exemption, the Company
experienced a significant decrease in taxes payable.
Taxes
payable consist of the following as of June 30, 2010 and 2009:
|
2010
|
2009
|
|||||||
|
VAT
(credit) provision
|
$ | (24,655 | ) | $ | 1,216,191 | |||
|
Income
tax payable
|
2,020,253 | 1,290,777 | ||||||
|
Other
levies
|
308,784 | 380,860 | ||||||
|
Total
|
$ | 2,304,382 | $ | 2,887,828 | ||||
Income
taxes consist of the following as of June 30, 2010 and 2009:
|
2010
|
2009
|
|||||||
|
Current
Tax
|
$ | 3,794,515 | $ | 2,331,548 | ||||
|
Deferred
Tax
|
- | - | ||||||
|
Total
|
$ | 3,794,515 | $ | 2,331,548 | ||||
Tax
Rate Reconciliation
Substantially
all of the Company’s income before income taxes and related tax expense are from
PRC sources. Actual income tax benefit reported in the consolidated statements
of operations and comprehensive income differ from the amounts computed by
applying the US statutory income tax rate of 34% to income before income taxes
for the two years ended June 30, 2010 and 2009 for the following
reasons:
F-15
CHINA
GREEN AGRICULTURE, INC. AND SUBSIDIARIES
Notes
To Consolidated Financial Statements
June
30, 2010 and 2009
|
FY
2010
|
China
|
United
States
|
||||||
|
15%
|
34%
|
|||||||
|
Pretax
income (loss)
|
$ | 27,755,696 | $ | (2,671,463 | ) | |||
|
Expected
income tax expense (benefit)
|
4,163,354 | (908,284 | ) | |||||
|
Nontaxable
income on Jintai
|
(396,035 | ) | ||||||
|
Expected
income tax expense on Yuxing
|
27,196 | |||||||
|
Change
in valuation allowance
|
908,284 | |||||||
|
Actual
tax expense
|
$ | 3,794,515 | $ | 0 | ||||
|
FY
2009
|
China
|
United
States
|
||||||
|
15%
|
34%
|
|||||||
|
Pretax
income (loss)
|
$ | 18,188,877 | $ | (1,392,907 | ) | |||
|
Expected
income tax expense (benefit)
|
2,728,332 | (473,588 | ) | |||||
|
Nontaxable
income on Jintai
|
(366,936 | ) | ||||||
|
Nontaxable
income on Jinong
|
(29,848 | ) | ||||||
|
Change
in valuation allowance
|
473,588 | |||||||
|
Actual
tax expense
|
$ | 2,331,548 | $ | 0 | ||||
Significant
Components of Current and Deferred Taxes
The tax
effects of temporary differences that give rise to significant portions of the
deferred tax assets at June 30, 2010 and 2009 are presented below.
|
2010
|
2009
|
|||||||
|
Net
operating loss carryforwards
|
1,381,872 | 473,588 | ||||||
|
Less
valuation allowance
|
(1,381,872 | ) | (473,588 | ) | ||||
|
Net
deferred tax assets
|
$ | - | $ | - | ||||
The
valuation allowance for deferred tax assets as of June 30, 2010 and 2009 was
related to Federal net operating loss carryforwards that in the judgment of
management, are not more likely than not to be realized. In assessing the
realizability of deferred tax assets, management considers whether it is more
likely than not that some or all of the deferred tax assets will not be
realized. The ultimate realization of deferred tax assets depends on the
generation of future taxable income during the periods in which those temporary
differences are deductible.
F-16
CHINA
GREEN AGRICULTURE, INC. AND SUBSIDIARIES
Notes
To Consolidated Financial Statements
June
30, 2010 and 2009
Management
considers the scheduled reversal of deferred tax balances, projected future
taxable income, and tax planning strategies in making this assessment. Based
upon the level of historical taxable income and projections for future taxable
income over the periods in which the deferred tax assets are deductible,
management believes it is not more likely than not that the Company will realize
the benefits of these deductible differences. As a result of the exemptions
received as well as the calculation methodology for those taxes that are
payable, the Company has nominal deferred tax assets or liabilities in the PRC
tax jurisdiction.
Reclassification
of Temporary Equity
On
December 26, 2007 the Company issued 6,313,617 shares (the “Shares”) of common
stock to 31 accredited investors (the “Investors”) at $3.25 per share in a
private placement (the “Private Placement”). The Securities Purchase Agreement
(“SPA”) set forth a contingency which gave the Investors the right to redeem the
Shares in the event the Share Exchange was forced to be unwound as a result of
any material adverse effect due to PRC governmental actions. As a result of the
redemption feature, the Company recorded the Private Placement as temporary
equity. In July 2009, the Investors and the Company entered into a Waiver and
Consent where the Investors consented to waive all their rights associated with
the liquidated damages under Section 4.16 of SPA. As a result, such temporary
equity was no longer necessary for the purposes of the Company’s balance sheet
as of June 30, 2010.
Common
Stock
The
Company issued 4,025,000 shares of common stock at a public offering price of
$7.15 per share in an underwritten offering and received total gross proceeds of
approximately $28.8 million on July 24, 2009. The shares were sold under the
Company's previously filed shelf registration statement, which was declared
effective by the SEC on June 12, 2009. The Company intends to use the net
proceeds to expand its production facilities through the construction of new
greenhouse at Yuxing.
The
Company completed the sale of 1,282,052 shares of common stock at a public
offering price of $15.60 per share on November 25, 2009 in a registered direct
offering for gross proceeds of $20,000,011. On December 16, 2009, the placement
agent exercised rights to place up to 320,512 additional shares of common stock
at a price of $15.60 per share, for additional gross proceeds of $4,999,987. The
Company intends to use all of the net proceeds for working capital purposes. The
shares were sold under the Company's previously filed shelf registration
statement, which was declared effective by the SEC on June 12,
2009.
On
January 3, 2010, the Company made a one-time grant of an aggregate of 120,000
shares of restricted common stock of the Company to certain officers and
independent directors under the 2009 Equity Incentive Plan of the Company.
Pursuant to the terms of the grant, one-third of the shares vested on February
2, 2010, one-third of the shares will vest on December 31, 2010 and the
remaining one-third of the shares will vest on December 31, 2011. Additionally,
the Company made a one-time grant of an aggregate of 22,961 shares of
performance based restricted common stock to certain officers, which vests in
three equal installments on September 30, 2010, 2011 and 2012 if the Company
reaches certain financial targets.
F-17
CHINA
GREEN AGRICULTURE, INC. AND SUBSIDIARIES
Notes
To Consolidated Financial Statements
June
30, 2010 and 2009
On
February 10, 2010, the Company made a one-time grant of an aggregate of 50,700
shares of restricted common stock to certain members of management and key
employees under the 2009 Equity Incentive Plan. Pursuant to the terms of the
grant, one-third of the shares vested on March 10, 2010, one-third of the shares
will vest on December 31, 2010 and the remaining one-third of the shares will
vest on December 31, 2011. Additionally, the Company also granted to certain
members of management and key employees an aggregate of 70,500 shares of
performance based restricted common stock, which vests in three equal
installments on September 30, 2010, 2011 and 2012 if the Company achieves
certain financial targets for fiscal year 2010.
On
February 10, 2010, the Company issued a total of 8,000 shares of restricted
common stock to a consultant pursuant to the terms of a service agreement and
its 2009 Equity Incentive Plan, half of which shall vest in six months from the
date of grant, and the other half of which shall vest in one year from the date
of grant.
As of
June 30, 2010 and 2009, the Company’s common stock had a par value of $.001, and
had 115,197,165 shares of commons stock authorized, and 24,572,328 and
12,281,569 shares issued and outstanding.
Preferred
Stock
Under the
Company’s articles of incorporation, the board of directors has the authority,
without further action by stockholders, to designate up to 20,000,000 shares of
preferred stock in one or more series and to fix the rights, preferences,
privileges, qualifications and restrictions granted to or imposed upon the
preferred stock, including dividend rights, conversion rights, voting rights,
rights and terms of redemption, liquidation preference and sinking fund terms,
any or all of which may be greater than the rights of the common stock. If the
Company sells preferred stock under its registration statement on Form S-3, it
will fix the rights, preferences, privileges, qualifications and restrictions of
the preferred stock of each series in the certificate of designation relating to
that series and will file the certificate of designation that describes the
terms of the series of preferred stock the Company offers before the issuance of
the related series of preferred stock.
As of
June 30, 2010 and 2009, the Company had 20,000,000 shares of preferred stock
authorized, with a par value of $.001 per share, of which no shares are
outstanding.
On August
17, 2009, 84,500 options were exercised by certain officers, directors and
employees in a cashless manner, where the option holders received 61,239 shares
of common stock.
On
January 3, 2010, the Company made a one-time grant of options to purchase
150,000 shares of common stock to certain officers and directors under the 2009
Equity Incentive Plan at an exercise price of $14.70 per share, the closing
price of the previous trading day. Pursuant to the terms of the grant, one-third
of the options vested on February 2, 2010, one-third of the options will vest on
December 31, 2010 and the remaining one-third of the options will vest on
December 31, 2011.
F-18
CHINA
GREEN AGRICULTURE, INC. AND SUBSIDIARIES
Notes
To Consolidated Financial Statements
June
30, 2010 and 2009
On
January 3, 2010, the Company also made a performance-based grant of options to
purchase 45,291 shares of common stock to certain officers and directors under
the 2009 Equity Incentive Plan at an exercise price of $14.70 per share, the
closing price of the previous trading day. Pursuant to the terms of the grant,
one-third of the options will vest on September 30, 2010, one-third of the
options will vest on September 30, 2011 and the remaining one-third of the
options will vest on September 30, 2012, if the Company achieves both net sales
and income from operations targets for the fiscal year ended June 30,
2010.
On
February 3, 2010, one independent director resigned and all his vested and
unvested options were forfeited pursuant to his grant agreement with the
Company.
On
February 7, 2010, the Company appointed a new independent director and issued
options to him to purchase 10,000 shares of common stock under the 2009 Equity
Incentive Plan at an exercise price of $14.02 per share, the closing price on
the previous trading day. Pursuant to the terms of the grant, one-third of the
options vested on March 8, 2010, one-third of the options will vest on December
31, 2010 and the remaining one-third of the options will vest on December 31,
2011.
The
Company’s calculations were made using the Black-Scholes option-pricing model
with the following weighted average assumptions: expected life of 2 years;
75.2%-75.6% stock price volatility; risk-free interest rate of 1.63% and no
dividends during the expected term. Stock compensation expense is recognized
based on awards expected to vest. The forfeitures are estimated at the time of
grant and revised in subsequent periods pursuant to actual forfeitures, if it is
differ from those estimates. During the fiscal year ended June 30, 2010 and
2009, the Company recognized stock-based compensation expense of $1,695,449 and
$155,804, respectively.
Options
outstanding as of June 30, 2010 and related weighted average price and intrinsic
value are as follows:
|
Exercise Prices
|
Total Options
Outstanding
|
Weighted
Average
Remaining
Life (Years)
|
Total Weighted
Average
Exercise Price
|
Options
Exercisable
|
Aggregate
Intrinsic Value
|
||||||||||||||
|
$14.02-14.70
|
195,291 |
1.81
|
$ | 14.67 | 50,002 | - | |||||||||||||
F-19
CHINA
GREEN AGRICULTURE, INC. AND SUBSIDIARIES
Notes
To Consolidated Financial Statements
June
30, 2010 and 2009
The
following table summarizes the options outstanding as of June 30,
2010:
|
Outstanding,
July 1, 2008
|
121,500 | |||
|
Granted
|
28,000 | |||
|
Forfeited/Canceled
|
(28,000 | ) | ||
|
Exercised
|
- | |||
|
Outstanding,
June 30, 2009
|
121,500 | |||
|
Granted
|
205,291 | |||
|
Forfeited/Canceled
|
(22,000 | ) | ||
|
Exercised
|
(109,500 | ) | ||
|
Outstanding,
June 30, 2010
|
195,291 |
Market
Concentration
All of
the Company's revenue-generated operations are all conducted in the PRC.
Accordingly, the Company's business, financial condition and results of
operations may be influenced by the political, economic and legal environments
in the PRC, and by the general state of the PRC's economy.
The
Company's operations in the PRC are subject to specific considerations and
significant risks not typically associated with companies in North America and
Western Europe. These include risks associated with, among others, the
political, economic and legal environments and foreign currency exchange. The
Company's results may be adversely affected by, among other things, changes in
governmental policies with respect to laws and regulations, anti-inflationary
measures, currency conversion and remittance abroad, and rates and methods of
taxation.
Vendor
Concentration
One
vendor of Jintai accounted for 12.4% of the Company’s total purchases for the
fiscal year ended June 30, 2010. There is no accounts payable to this vender as
of June 30, 2010.
Concentration
of Cash
The
Company maintains large sums of cash in three major banks in China. The
aggregate balance in such accounts as of June 30, 2010 was $56,134,409. There is
no insurance securing these deposits in China. In addition, the Company also had
$3,309,036 in cash in two banks in the United States as of June 30, 2010, with
$500,000 secured by the U.S. Federal Deposit Insurance Corporation.
F-20
CHINA
GREEN AGRICULTURE, INC. AND SUBSIDIARIES
Notes
To Consolidated Financial Statements
June
30, 2010 and 2009
The
Company is organized into three main business segments: fertilizer production
(Jinong), agricultural products production (Jintai) and future research and
development centre that is currently under construction (Yuxing). The following
tables present a summary of operating information for the fiscal year ended June
30, 2010 and 2009, respectively and the balance sheet information as of June 30,
2010.
|
Revenues
from unaffiliated customers:
|
2010
|
2009
|
||||||
|
Jinong
|
$ | 45,816,377 | $ | 28,889,131 | ||||
|
Jintai
|
6,274,375 | 6,318,866 | ||||||
|
Consolidated
revenues
|
$ | 52,090,752 | $ | 35,207,997 | ||||
|
Operating
income :
|
2010
|
2009
|
||||||
|
Jinong
|
$ | 25,160,683 | $ | 15,846,248 | ||||
|
Jintai
|
2,640,016 | 2,445,913 | ||||||
|
Yuxing
|
(181,313 | ) | - | |||||
|
Reconciling
item (2)
|
(997,316 | ) | (1,060,976 | ) | ||||
|
Reconciling
item (2) - stock compensation
|
(1,695,449 | ) | (155,804 | ) | ||||
|
Consolidated
operating income
|
$ | 24,926,621 | $ | 17,075,381 | ||||
|
Net
income:
|
2010
|
2009
|
||||||
|
Jinong
|
$ | 21,502,252 | $ | 13,411,090 | ||||
|
Jintai
|
2,640,233 | 2,446,238 | ||||||
|
Yuxing
|
(181,304 | ) | ||||||
|
Reconciling
item (1)
|
21,342 | 7,867 | ||||||
|
Reconciling
item (2)
|
(2,692,765 | ) | (1,400,733 | ) | ||||
|
Consolidated
net income
|
$ | 21,289,758 | $ | 14,464,422 | ||||
F-21
CHINA
GREEN AGRICULTURE, INC. AND SUBSIDIARIES
Notes
To Consolidated Financial Statements
June
30, 2010 and 2009
|
Depreciation
and amortization:
|
2010
|
2009
|
||||||
|
Jinong
|
$ | 2,299,483 | $ | 1,512,212 | ||||
|
Jintai
|
119,973 | 90,803 | ||||||
|
Yuxing
|
178,661 | |||||||
|
Consolidated
depreciation and amortization
|
$ | 2,598,117 | $ | 1,603,015 | ||||
|
Interest
expense:
|
2010
|
2009
|
||||||
|
Jinong
|
$ | 112,475 | $ | 433,822 | ||||
|
Reconciling
item (1)
|
- | |||||||
|
Reconciling
item (2)
|
- | 198,624 | ||||||
|
Consolidated
interest expense
|
$ | 112,475 | $ | 632,446 | ||||
|
Capital
expenditures:
|
2010
|
2009
|
||||||
|
Jinong
|
$ | 4,243,089 | $ | 5,097,721 | ||||
|
Jintai
|
180,686 | - | ||||||
|
Yuxing
|
12,100,918 | - | ||||||
|
Consolidated
capital expenditures
|
$ | 16,524,694 | $ | 5,097,721 | ||||
|
Identifiable
assets:
|
2010
|
2009
|
||||||
|
Jinong
|
$ | 103,519,520 | $ | 53,096,423 | ||||
|
Jintai
|
12,198,845 | 8,250,834 | ||||||
|
Yuxing
|
12,748,003 | |||||||
|
Reconciling
item (1)
|
3,311,943 | 30,995 | ||||||
|
Reconciling
item (2)
|
(9,631 | ) | 240,174 | |||||
|
Consolidated
assets
|
$ | 131,787,942 | $ | 61,618,426 | ||||
(1)
Reconciling amounts refer to the unallocated assets or expenses of Green New
Jersey.
(2)
Reconciling amounts refer to the unallocated assets or expenses of the parent
company.
F-22
CHINA
GREEN AGRICULTURE, INC. AND SUBSIDIARIES
Notes
To Consolidated Financial Statements
June
30, 2010 and 2009
In July
2007, the Company signed an office lease with the Group Company and started to
pay the rent for $946 (RMB 6,460) per month.
In
January 2008, the Company signed a land lease with Xi’an Jinong Hi-tech
Agriculture Demonstration Zone for a monthly rent of $762 (RMB 5,200).
Accordingly, t
he Company recorded an aggregate of $20,494 and
$20,456 as rent expenses for the fiscal years ended June 30, 2010 and 2009,
respectively. Rent expenses for the 5 years after June 30, 2010 are as
follows:
|
June
30, 2011
|
$ | 20,494 | ||
|
June
30, 2012
|
20,494 | |||
|
June
30, 2013
|
20,494 | |||
|
June
30, 2014
|
20,494 | |||
|
June
30, 2015
|
20,494 | |||
|
Total
|
$ | 102,470 |
The
Company’s operations are primarily conducted through its PRC subsidiaries, which
can only pay dividends out of their retained earnings determined in accordance
with the accounting standards and regulations in the PRC and after it has met
the PRC requirements for appropriation to statutory reserves. In addition, the
Company’s businesses and assets are primarily denominated in RMB, which is not
freely convertible into foreign currencies. All foreign exchange transactions
take place either through the People’s Bank of China or other banks authorized
to buy and sell foreign currencies at the exchange rates quoted by the People’s
Bank of China. Approval of foreign currency payments by the People’s Bank of
China or other regulatory institutions requires submitting a payment application
form together with suppliers’ invoices, shipping documents and signed contracts.
These currency exchange control procedures imposed by the PRC government
authorities may restrict the ability of the Company’s PRC subsidiaries to
transfer their net assets to the Parent Company through loans, advances or cash
dividends.
The
Company’s PRC subsidiaries net assets amounted to $125,484,815 as of June 30,
2010, and thus exceeded 25% of the Company’s consolidated net assets.
Accordingly, condensed Parent Company financial statements have been prepared in
accordance with Rule 5-04 and Rule 12-04 of SEC Regulation S-X, and are as
follows.
F-23
CHINA
GREEN AGRICULTURE, INC. AND SUBSIDIARIES
Notes
To Consolidated Financial Statements
June
30, 2010 and 2009
Parent
Company Financial Statements
PARENT
COMPANY FINANCIAL INFORMATION OF CHINA GREEN AGRICULTURE, INC
|
Condensed
Balance Sheets
|
June 30, 2010
|
June 30, 2009
|
||||||
|
ASSETS
|
||||||||
|
Current
Assets:
|
||||||||
|
Cash
and cash equivalents
|
$ | 3,309,036 | $ | 28,499 | ||||
|
Restricted
cash
|
(2,907 | ) | 83,579 | |||||
|
Other
assets
|
15,445 | (1,410 | ) | |||||
|
Deferred
offering cost
|
- | 160,500 | ||||||
|
Total
Current Assets
|
$ | 3,321,574 | $ | 271,168 | ||||
|
Long-term
investments
|
66,426,628 | 19,167,863 | ||||||
|
Total
Assets
|
$ | 69,748,202 | $ | 19,439,031 | ||||
|
LIABILITIES
AND SHAREHOLDERS' EQUITY
|
||||||||
|
Current
Liabilities:
|
||||||||
|
Accounts
payable
|
$ | 64,520 | $ | 64,520 | ||||
|
Unearned
revenue
|
- | 38,343 | ||||||
|
Other
payables and accrued expenses
|
165,604 | 376,038 | ||||||
|
Amount
due to related parties
|
38,343 | 1,300 | ||||||
|
Total
Current Liabilities
|
$ | 268,467 | $ | 480,201 | ||||
|
Common
Stock, $.001 par value, 6,313,617 shares subject to
redemption
|
20,519,255 | |||||||
|
Stockholders’
Equity:
|
||||||||
|
Common
Stock
|
$ | 24,573 | $ | 12,282 | ||||
|
Additional
paid-in Capital
|
75,755,682 | 2,060,162 | ||||||
|
Foreign
currency translation
|
6,989 | 6,959 | ||||||
|
Retained
earnings
|
(6,307,509 | ) | (3,639,829 | ) | ||||
|
Total
Stockholders' Equity
|
69,479,735 | (1,560,426 | ) | |||||
|
Total
Liabilities and Stockholders' Equity
|
$ | 69,748,202 | $ | 19,439,031 | ||||
F-24
CHINA
GREEN AGRICULTURE, INC. AND SUBSIDIARIES
Notes
To Consolidated Financial Statements
June
30, 2010 and 2009
PARENT
COMPANY FINANCIAL INFORMATION OF CHINA GREEN AGRICULTURE, INC
|
Condensed
Statements of Income
|
June 30, 2010
|
June 30, 2009
|
||||||
|
Revenue
|
$ | - | $ | - | ||||
|
General
&Administrative expenses
|
2,646,338 | 1,202,149 | ||||||
|
Interest
expense
|
- | 198,624 | ||||||
|
Interest
income
|
21,342 | 7,867 | ||||||
|
Net
Income
|
$ | (2,667,680 | ) | $ | (1,392,907 | ) | ||
|
Condensed
Statements of Cash Flows
|
June 30, 2010
|
June 30, 2009
|
||||||
|
Net
cash provided by operating activities
|
$ | (1,156,400 | ) | $ | (1,577,100 | ) | ||
|
Net
cash used in investing activities
|
86,456 | 109,813 | ||||||
|
Net
cash provided by financing activities
|
4,350,480 | 699,798 | ||||||
|
Cash
and cash equivalents, beginning of year
|
28,499 | 795,988 | ||||||
|
Cash
and cash equivalents, end of year
|
$ | 3,309,036 | $ | 28,499 | ||||
Notes
to Condensed Parent Company Financial Information
As of
June 30, 2010 and 2009, there were no material contingencies, significant
provisions for long-term obligations, or guarantees of the Company, except as
separately disclosed in the Consolidated Financial Statements, if any. Certain
information and footnote disclosures normally included in financial statements
prepared in accordance with U.S. GAAP have been condensed or
omitted.
The
Company has evaluated events subsequent to June 30, 2010, to assess the need for
potential recognition or disclosure in this report. Such events were evaluated
through September 1, 2010, the date these consolidated financial statements were
issued.
On July
2, 2010, the Company closed an acquisition agreement with Beijing Gufeng
Chemical Products Co., Ltd (“Gufeng) and its wholly-owned subsidiary Beijing
Tianjuyuan Fertilizer Co., Ltd (“Tianjuyuan”) to purchase all of Gufeng’s
outstanding equity interests. The Company, through its wholly-owned subsidiary
Jinong, acquired Gufeng and its direct, wholly-owned subsidiary, Tianjuyuan,
pursuant to (i) a Share Transfer Agreement with Mr. Qing Xin Jiang and Ms. Qiong
Jia (collectively, the “Gufeng Shareholders”) and (ii) a Supplementary Agreement
with the Gufeng Shareholders, under which Jinong acquired all of the equity
interests in Gufeng for a purchase price of $8,849,558 in cash and the issuance
of an aggregate of 2,275,931 shares of common stock, par value $0.001 per share,
of the Company to the Gufeng Shareholders or their designees.
F-25
CHINA
GREEN AGRICULTURE, INC. AND SUBSIDIARIES
Notes
To Consolidated Financial Statements
June
30, 2010 and 2009
Gufeng
was founded in 1993, and its wholly-owned subsidiary Tianjuyuan was founded in
2001. Both companies are Beijing-based producers of compound fertilizer, blended
fertilizer, organic compound fertilizer and mixed, organic-inorganic compound
fertilizer that sell their products throughout China and abroad.
On July
23, 2010, the Company filed a shelf registration statement on Form S-3 with the
SEC. The registration statement, when declared effective, will permit the
Company to issue up to an aggregate of $200 million of securities, including
equity, debt and other securities as described in the registration
statement.
F-26
TABLE OF CONTENTS
Part IItem 1. BusinessItem 1A. Risk FactorsItem 2. PropertiesItem 3. Legal ProceedingsItem 4. (removed and Reserved)Part IIItem 5. Market For Registrant S Common Equity, Related Stockholder Matters and Issuer Purchases Of Equity SecuritiesItem 6. Selected Financial DataItem 7. Management's Discussion and Analysis Of Financial Condition and Results Of OperationsItem 7A. Quantitative and Qualitative Disclosures About Market RisksItem 8. Financial Statements and Supplementary DataItem 9. Changes in and Disagreements with Accountants on Accounting and Financial DisclosureItem 9A Controls and ProceduresItem 9B. Other InformationPart IIIItem 10. Directors, Executive Officers and Corporate GovernanceItem 11 Executive CompensationItem 13. Certain Relationships and Related Transactions, and Director IndependenceItem 14. Principal Accountant Fees and ServicesPart IVItem 15. Exhibits and Financial Statement SchedulesNote 1 Organization and Description Of BusinessNote 2 Basis Of Presentation and Summary Of Significant Accounting PoliciesNote 3 InventoriesNote 4 Other AssetsNote 5 Deferred Offering CostNote 6 - Property, Plant and EquipmentNote 7 Construction in ProgressNote 8 - Intagible AssetsNote 9 - Amount Due To Related PartiesNote 10 - Accrued Expenses and Other PayablesNote 11 - Loan PayablesNote 12 - Income TaxesNote 13 Stockholders EquityNote 14 Stock OptionsNote 15 Significant Risks and Uncertainties Including Business and Credit ConcentrationsNote 16 Segment ReportingNote 17 - Commitments and LeasesNote 18 Restricted Net AssetsNote 19 Subsequent Events