ENOVIS CORP
10-Ks and 10-Qs
|
|
|
|
|
|
|
|
|
|
|
|
|
|
|
|
|
|
|
|
|
|
|
|
|
|
|
|
|
|
|
|
|
|
|
|
|
|
|
|
|
|
|
|
|
|
|
|
|
|
|
|
|
|
|
|
|
|
|
|
|
|
COLFAX CORPORATION
NOTES TO CONSOLIDATED FINANCIAL STATEMENTS
UNITED STATES SECURITIES AND EXCHANGE COMMISSION
Washington, D.C. 20549
_________________________
Form 10-K
ANNUAL REPORT PURSUANT TO SECTION 13 OR 15(d) OF THE SECURITIES EXCHANGE ACT OF 1934
For the fiscal year ended December 31, 2017
OR
TRANSITION REPORT PURSUANT TO SECTION 13 OR 15(d) OF THE SECURITIES EXCHANGE ACT OF 1934
For the transition period from _______to_______
Commission File No. 001-34045
_________________________
COLFAX CORPORATION
(Exact name of registrant as specified in its charter)
|
DELAWARE
|
54-1887631
|
|
(State or other jurisdiction of
|
(I.R.S. Employer
|
|
incorporation or organization)
|
Identification Number)
|
|
420 National Business Parkway, 5th Floor
|
20701
|
|
Annapolis Junction, Maryland
|
(Zip Code)
|
|
(Address of principal executive offices)
|
|
301-323-9000
(Registrant’s telephone number, including area code)
_________________________
SECURITIES REGISTERED PURSUANT TO SECTION 12(b) OF THE ACT:
|
TITLE OF EACH CLASS
|
NAME OF EACH EXCHANGE ON WHICH REGISTERED
|
|
Common Stock, par value $0.001 per share
|
The New York Stock Exchange
|
SECURITIES REGISTERED PURSUANT TO SECTION 12(g) OF THE ACT:
None
_________________________
Indicate by check mark if the registrant is a well-known seasoned issuer, as defined in Rule 405 of the Securities Act. Yes
þ
No
¨
Indicate by check mark if the registrant is not required to file reports pursuant to Section 13 or Section 15(d) of the Securities Act. Yes
¨
No
þ
Indicate by check mark whether the registrant (1) has filed all reports required to be filed by Section 13 or 15(d) of the Securities Exchange Act of 1934 during the preceding 12 months (or for such shorter period that the registrant was required to file such reports), and (2) has been subject to such filing requirements for the past 90 days. Yes
þ
No
¨
Indicate by check mark whether the registrant has submitted electronically and posted on its corporate Web site, if any, every Interactive Data File required to be submitted and posted pursuant to Rule 405 of Regulation S-T (§232.405 of this chapter) during the preceding 12 months (or for such shorter period that the registrant was required to submit and post such files). Yes
þ
No
¨
Indicate by check mark if disclosure of delinquent filers pursuant to Item 405 of Regulation S-K is not contained herein, and will not be contained, to the best of registrant’s knowledge, in definitive proxy or information statements incorporated by reference in Part III of this Form 10-K or any amendment to this Form 10-K.
¨
Indicate by check mark whether the registrant is a large accelerated filer, an accelerated filer, a non-accelerated filer, a smaller reporting company, or an emerging growth company. See definitions of “large accelerated filer,” “accelerated filer” “smaller reporting company” and “emerging growth company” in Rule 12b-2 of the Exchange Act.
Large accelerated filer
þ
Accelerated filer
¨
Non-accelerated filer
¨
(Do not check if a smaller reporting company) Smaller reporting company
¨
Emerging growth company
¨
Indicate by check mark whether the registrant is a shell company (as defined in Rule 12b-2 of the Exchange Act). Yes
¨
No
þ
The aggregate market value of common shares held by non-affiliates of the Registrant on June 30, 2017 was $3.509 billion based upon the aggregate price of the registrant’s common shares as quoted on the New York Stock Exchange composite tape on such date.
As of
February 6, 2018
, the number of shares of the Registrant’s common stock outstanding was
123,328,077
.
EXHIBIT INDEX APPEARS ON PAGE
DOCUMENTS INCORPORATED BY REFERENCE
Part III incorporates certain information by reference from the Registrant’s definitive proxy statement for its
2018
annual meeting of stockholders to be filed pursuant to Regulation 14A within 120 days after the end of the Registrant’s fiscal year covered by this report. With the exception of the sections of the
2018
Proxy Statement specifically incorporated herein by reference, the
2018
Proxy Statement is not deemed to be filed as part of this Form 10-K.
1
TABLE OF CONTENTS
|
Item
|
Description
|
Page
|
|
Special Note Regarding Forward-Looking Statements
|
||
|
Part I
|
||
|
1
|
Business
|
|
|
1A
|
Risk Factors
|
|
|
1B
|
Unresolved Staff Comments
|
|
|
2
|
Properties
|
|
|
3
|
Legal Proceedings
|
|
|
4
|
Mine Safety Disclosures
|
|
|
Executive Officers of the Registrant
|
||
|
Part II
|
||
|
5
|
Market for the Registrant’s Common Equity, Related Stockholder Matters and Issuer Purchases of Equity Securities
|
|
|
6
|
Selected Financial Data
|
|
|
7
|
Management’s Discussion and Analysis of Financial Condition and Results of Operations
|
|
|
7A
|
Quantitative and Qualitative Disclosures About Market Risk
|
|
|
8
|
Financial Statements and Supplementary Data
|
|
|
9
|
Changes in and Disagreements with Accountants on Accounting and Financial Disclosure
|
|
|
9A
|
Controls and Procedures
|
|
|
9B
|
Other Information
|
|
|
Part III
|
||
|
10
|
Directors, Executive Officers and Corporate Governance
|
|
|
11
|
Executive Compensation
|
|
|
12
|
Security Ownership of Certain Beneficial Owners and Management and Related Stockholder Matters
|
|
|
13
|
Certain Relationships and Related Transactions, and Director Independence
|
|
|
14
|
Principal Accountant Fees and Services
|
|
|
Part IV
|
||
|
15
|
Exhibits and Financial Statement Schedules
|
|
|
16
|
Form 10-K Summary
|
|
|
Signatures
|
||
1
Unless otherwise indicated, references in this Annual Report on Form 10-K (this “Form 10-K”) to “Colfax,” “the Company,” “we,” “our,” and “us” refer to Colfax Corporation and its subsidiaries.
SPECIAL NOTE REGARDING FORWARD-LOOKING STATEMENTS
Some of the statements contained in this Form 10-K that are not historical facts are forward-looking statements within the meaning of Section 21E of the Securities Exchange Act of 1934 (the “Exchange Act”). We intend such forward-looking statements to be covered by the safe harbor provisions for forward-looking statements contained in Section 21E of the Exchange Act. Readers are cautioned not to place undue reliance on these forward-looking statements, which speak only as of the date this Form 10-K is filed with the Securities and Exchange Commission (the “SEC”). All statements other than statements of historical fact are statements that could be deemed forward-looking statements, including statements regarding: projections of revenue, profit margins, expenses, tax provisions and tax rates, earnings or losses from operations, impact of foreign exchange rates, cash flows, pension and benefit obligations and funding requirements, synergies or other financial items; plans, strategies and objectives of management for future operations including statements relating to potential acquisitions, compensation plans or purchase commitments; developments, performance or industry or market rankings relating to products or services; future economic conditions or performance; the outcome of outstanding claims or legal proceedings including asbestos-related liabilities and insurance coverage litigation; potential gains and recoveries of costs; assumptions underlying any of the foregoing; and any other statements that address activities, events or developments that we intend, expect, project, believe or anticipate will or may occur in the future. Forward-looking statements may be characterized by terminology such as “believe,” “anticipate,” “should,” “would,” “intend,” “plan,” “will,” “expect,” “estimate,” “project,” “positioned,” “strategy,” “targets,” “aims,” “seeks,” “sees,” and similar expressions. These statements are based on assumptions and assessments made by our management in light of their experience and perception of historical trends, current conditions, expected future developments and other factors we believe to be appropriate. These forward-looking statements are subject to a number of risks and uncertainties, including but not limited to the following:
|
•
|
changes in the general economy, as well as the cyclical nature of the markets we serve;
|
|
•
|
a significant or sustained decline in commodity prices, including oil;
|
|
•
|
our ability to identify, finance, acquire and successfully integrate attractive acquisition targets;
|
|
•
|
our exposure to unanticipated liabilities resulting from acquisitions;
|
|
•
|
our ability and the ability of our customers to access required capital at a reasonable cost;
|
|
•
|
our ability to accurately estimate the cost of or realize savings from our restructuring programs;
|
|
•
|
the amount of and our ability to estimate our asbestos-related liabilities;
|
|
•
|
the solvency of our insurers and the likelihood of their payment for asbestos-related costs;
|
|
•
|
material disruptions at any of our manufacturing facilities;
|
|
•
|
noncompliance with various laws and regulations associated with our international operations, including anti-bribery laws, export control regulations and sanctions and embargoes;
|
|
•
|
risks associated with our international operations;
|
|
•
|
risks associated with the representation of our employees by trade unions and work councils;
|
|
•
|
our exposure to product liability claims;
|
|
•
|
potential costs and liabilities associated with environmental, health and safety laws and regulations;
|
|
•
|
failure to maintain, protect and defend our intellectual property rights;
|
|
•
|
the loss of key members of our leadership team;
|
2
|
•
|
restrictions in our principal credit facility that may limit our flexibility in operating our business;
|
|
•
|
impairment in the value of intangible assets;
|
|
•
|
the funding requirements or obligations of our defined benefit pension plans and other post-retirement benefit plans;
|
|
•
|
significant movements in foreign currency exchange rates;
|
|
•
|
availability and cost of raw materials, parts and components used in our products;
|
|
•
|
new regulations and customer preferences reflecting an increased focus on environmental, social and governance issues, including new regulations related to the use of conflict minerals;
|
|
•
|
service interruptions, data corruption, cyber-based attacks or network security breaches affecting our information technology infrastructure;
|
|
•
|
risks arising from changes in technology;
|
|
•
|
the competitive environment in our industry;
|
|
•
|
changes in our tax rates or exposure to additional income tax liabilities, including the effects of the U.S. Tax Cuts and Jobs Act;
|
|
•
|
our ability to manage and grow our business and execution of our business and growth strategies;
|
|
•
|
the level of capital investment and expenditures by our customers in our strategic markets;
|
|
•
|
our financial performance; and
|
|
•
|
other risks and factors, listed in Item 1A. “Risk Factors” in Part I of this Form 10-K.
|
Any such forward-looking statements are not guarantees of future performance and actual results, developments and business decisions may differ materially from those envisaged by such forward-looking statements. These forward-looking statements speak only as of the date this Form 10-K is filed with the SEC. We do not assume any obligation and do not intend to update any forward-looking statement except as required by law. See Item 1A. “Risk Factors” in Part I of this Form 10-K for a further discussion regarding some of the factors that may cause actual results to differ materially from those that we anticipate.
3
Item 1.
Business
General
Colfax Corporation (the “Company”, “Colfax”, “we” or “us”) is a leading diversified industrial technology company that provides air and gas handling and fabrication technology products and services to customers around the world under the Howden and ESAB brands. The Company has been built through a series of acquisitions, as well as organic growth, since its founding in 1995. We seek to build an enduring premier global enterprise by applying the Colfax Business System (“CBS”) to pursue growth in revenues and improvements in profit and cash flow.
Colfax began with a series of acquisitions in the fluid handling and mechanical power transmission sectors. In 2004, we divested our mechanical power transmission operations to focus on fluid handling and, through the end of 2011, made a series of strategic acquisitions in this sector.
On January 13, 2012, we closed the acquisition of Charter International plc (“Charter”), which transformed Colfax from a fluid handling business into a diversified industrial enterprise with a broad global footprint. This acquisition provided an additional growth platform in the fragmented fabrication technology sector, while broadening the scope of our fluid handling platform to include air and gas handling products.
Following the acquisition of Charter, we completed 20 acquisitions to grow and strengthen our business. Four of those acquisitions related to our fluid handling operations, which we sold in December 2017, as discussed below. During the most recent three-year period, we completed four acquisitions in our Air and Gas Handling segment that expanded our portfolio of gas compression products and enhanced our fan product offering with ventilation control software. We also completed four acquisitions in our Fabrication Technology segment during the most recent three-year period that broadened our product offering and technology content.
In December 2017, we completed the divestiture of our fluid handling business. This represents a strategic milestone in the development of our portfolio and strengthens our balance sheet, providing more flexibility to execute our strategic growth strategy. See Note 4, “Discontinued Operations” in the accompanying Notes to Consolidated Financial Statements in this Form 10-K for more information about this transaction. We plan to continue our acquisition strategy in attractive markets that we believe will strengthen the core of our business and/or will broaden and diversify our portfolio.
Integral to our operations is the Colfax Business System, or “CBS”. CBS is our business management system including a comprehensive set of tools. It includes repeatable, teachable processes that we use to create superior value for our customers, shareholders and associates. Rooted in our core values, it is our culture. We believe that our management team’s access to, and experience in, the application of the CBS methodology is one of our primary competitive strengths.
Each year, Colfax associates in every business develop aggressive strategic and operating plans which are based on the
Voice of the Customer
. In these plans, we are clear about our market realities, our threats, our risks, our opportunities and most importantly, our vision. Our belief is that when we use the tools of CBS to drive the implementation of these plans, we are able to uniquely provide customers with the world class quality, delivery, cost and innovation they require. We believe that performance ultimately helps our customers and Colfax sustainably grow and succeed.
Reportable Segments
We report our operations through the Air and Gas Handling and Fabrication Technology segments. For certain financial information, including Net sales and long-lived assets by geographic area, see Note 17, “Segment Information” in the accompanying Notes to Consolidated Financial Statements in this Form 10-K.
Air and Gas Handling
Our Air and Gas Handling segment is a global supplier of a broad range of products, including heavy-duty centrifugal and axial fans, rotary heat exchangers, and gas compressors, as well as certain related products, systems, and services, which serves customers in the power generation, oil, gas and petrochemical, mining, wastewater, and general industrial and other end markets. Our air and gas handling products are principally marketed under the Howden brand name, and are manufactured and engineered
4
in facilities located in Asia, Europe, North and South America, Australia and Africa. The products and services are generally sold directly as well as through independent representatives and distributors.
Fabrication Technology
We formulate, develop, manufacture and supply consumable products and equipment for use in the cutting, joining and automated welding of steels, aluminum and other metals and metal alloys. For the year ended
December 31, 2017
, welding consumables represented approximately
42%
of our total Net sales. Our fabrication technology products are marketed under several brand names, most notably ESAB, which we believe is well known in the international welding industry. ESAB’s comprehensive range of welding consumables includes electrodes, cored and solid wires and fluxes using a wide range of specialty and other materials, and cutting consumables includes electrodes, nozzles, shields and tips. ESAB’s fabrication technology equipment ranges from portable welding machines to large customized automated cutting and welding systems. Products are sold into a wide range of end markets, including infrastructure, wind power, marine, pipelines, mobile/off-highway equipment, oil, gas, and mining. Our sales channels include both independent distributors and direct salespeople, depending on geography and end market.
The following discussions of
Industry and Competition
,
International Operations
,
Research and Development
,
Intellectual Property
,
Raw Materials
and
Backlog
,
Seasonality
,
Working Capital
,
Associates
and
Company Information and Access to SEC Reports
include information that is common to both of our reportable segments, unless indicated otherwise.
Industry and Competition
Our products and services are marketed worldwide. The markets served by our Air and Gas Handling segment are fragmented and competitive. Because we compete in selected niches of these markets and due to the diversity of our products and services, no single company competes directly with us across all our markets. We encounter a wide variety of competitors that differ by product line, including well-established regional competitors, competitors with greater specialization in particular markets, as well as larger competitors. The markets that our Fabrication Technology segment competes in are also served by Lincoln Electric and the welding business within Illinois Tool Works, Inc.
Our customer base is broadly diversified across many sectors of the economy, and we believe customers place a premium on quality, reliability, availability, design and application engineering support. We believe the principal elements of competition in our served markets are the technical ability to meet customer specifications, product quality and reliability, brand names, price, application expertise and engineering capabilities, timely delivery and strong aftermarket support. Our management believes that we are a leading competitor in each of our markets.
International Operations
Our products and services are available worldwide. We believe this geographic diversity allows us to draw on the skills of a global workforce, provides stability to our operations, allows us to drive economies of scale, provides revenue streams that may offset economic trends in individual economies and offers an opportunity to access new markets for products. In addition, we believe that our exposure to developing economies will provide additional opportunities for growth in the future. Our principal markets outside the U.S. are in Europe, Asia, the Middle East and South America. For the
year ended December 31, 2017
, approximately
78%
of our Net sales were shipped to locations outside of the U.S., with approximately
51.2%
shipped to locations in emerging markets.
Our international operations subject us to certain risks. See Item 1A. “Risk Factors
—
Risks Related to Our Business
—
The majority of our sales are derived from international operations. We are subject to specific risks associated with international operations.”
Research and Development
Our research and development activities vary by operating segment, focusing on innovation; developing new products, software and services; creating new applications for existing products; lowering the cost of manufacturing our existing products; and, redesigning existing product lines to increase efficiency and enhance performance.
Research and development expense was
$42.9 million
,
$39.3 million
and
$38.0 million
in 2017, 2016 and 2015, respectively. These amounts do not include development and application engineering costs incurred in conjunction with fulfilling customer orders and executing customer projects. We expect to continue making significant expenditures for research and development to
5
maintain and improve our competitive position.
Intellectual Property
We rely on a combination of intellectual property rights, including patents, trademarks, copyrights, trade secrets and contractual provisions to protect our intellectual property. Although we highlight recent additions to our patent portfolio as part of our marketing efforts, we do not consider any one patent or trademark or any group thereof essential to our business as a whole or to any of our business operations. We also rely on proprietary product knowledge and manufacturing processes in our operations.
Raw Materials and Backlog
We obtain raw materials, component parts and supplies from a variety of global sources, generally each from more than one supplier. Our principal raw materials and components are metals, castings, motors, seals and bearings. We believe that our sources of raw materials are adequate for our needs for the foreseeable future and the loss of any one supplier would not have a material adverse effect on our business or results of operations.
Manufacturing turnaround time for our Air and Gas Handling operating segment is generally sufficiently short to allow us to manufacture to order for most of our products, which helps to limit inventory levels. Backlog is primarily a function of requested customer delivery dates and generally ranges from several days to less than 12 months; although some orders may be delivered beyond 12 months. Backlog of air and gas handling orders as of
December 31, 2017
was
$0.9 billion
, compared with
$0.8 billion
as of
December 31, 2016
. A substantial majority of the air and gas handling order backlog as of
December 31, 2017
is expected to be filled within the current fiscal year.
Seasonality
As our air and gas handling customers seek to fully utilize capital spending budgets before the end of the year, historically our shipments have peaked during the fourth quarter. Also, our European operations typically experience a slowdown during the July, August and December vacation seasons. General economic conditions may, however, impact future seasonal variations.
Working Capital
We maintain an adequate level of working capital to support our business needs. There are no unusual industry practices or requirements related to working capital items.
Associates
As of
December 31, 2017
, we employed approximately
14,300
persons, of whom approximately
2,500
were employed in the United States and approximately
11,800
were employed outside of the United States.
Approximately
2%
of associates are covered by collective bargaining agreements with U.S. trade unions. In addition, approximately
41%
of our associates are represented by foreign trade unions and work councils in Europe, Asia, Central and South America, Canada, Africa and Australia, which subjects us to arrangements very similar to collective bargaining agreements. We have not experienced any work stoppages or strikes that have had a material adverse impact on operations. We consider our relations with our associates to be good.
Company Information and Access to SEC Reports
We were organized as a Delaware corporation in 1998. Our principal executive offices are located at 420 National Business Parkway, 5th Floor, Annapolis Junction, MD 20701, and our main telephone number at that address is (301) 323-9000. Our corporate website address is www.colfaxcorp.com.
We make available, free of charge through our website, our annual and quarterly reports on Form 10-K and Form 10-Q (including related filings in XBRL format), current reports on Form 8-K and any amendments to those reports as soon as practicable after filing or furnishing the material to the SEC. You may also request a copy of these filings, at no cost, by writing or telephoning us at: Investor Relations, Colfax Corporation, 420 National Business Parkway, 5th Floor, Annapolis Junction, MD 20701, telephone (301) 323-9000. Information contained on our website is not incorporated by reference in this report.
6
Item 1A.
Risk Factors
An investment in our Common stock involves a high degree of risk. You should carefully consider the risks and uncertainties described below, together with the information included elsewhere in this Form 10-K and other documents we file with the SEC. The risks and uncertainties described below are those that we have identified as material, but may not be the only risks to which Colfax might be exposed. Additional risks and uncertainties, which are currently unknown to us or that we do not currently consider to be material, may materially affect the business of Colfax and could have material adverse effects on our business, financial condition and results of operations. If any of the following risks were to occur, our business, financial condition and results of operations could be materially adversely affected, the value of our Common stock could decline and investors could lose all or part of the value of their investment in Colfax shares. Our business is also subject to general risks and uncertainties that affect many other companies, such as overall U.S. and non-U.S. economic and industry conditions, a global economic slowdown, geopolitical events, changes in laws or accounting rules, fluctuations in interest rates, terrorism, international conflicts, natural disasters or other disruptions of expected economic or business conditions. We operate in a continually changing business environment, and new risk factors emerge from time to time which we cannot predict. Additional risks and uncertainties not currently known to us or that we currently believe are immaterial also may impair our business, including our results of operations, liquidity and financial condition.
Risks Related to Our Business
Changes in the general economy and the cyclical nature of the markets that we serve could negatively impact the demand for our products and services and harm our operations and financial performance.
Colfax’s financial performance depends, in large part, on conditions in the markets we serve and on the general condition of the global economy, which impacts these markets. Any sustained weakness in demand for our products and services resulting from a downturn of or uncertainty in the global economy could reduce our sales and profitability.
In addition, we believe that many of our customers and suppliers are reliant on liquidity from global credit markets and, in some cases, require external financing to purchase products or finance operations. If our customers lack liquidity or are unable to access the credit markets, it may impact customer demand for our products and services and we may not be able to collect amounts owed to us.
Further, our products are sold in many industries, some of which are cyclical and may experience periodic downturns. Cyclical weakness in the industries that we serve could lead to reduced demand for our products and affect our profitability and financial performance.
The occurrence of any of the foregoing could have a material adverse effect on our business, financial condition and results of operations.
A continued significant or sustained decline in the levels of new capital investment and maintenance expenditures by certain of our customers could reduce the demand for our products and services and harm our operations and financial performance.
Demand for our products and services depends significantly on the level of new capital investment and planned maintenance expenditures by certain of our customers. The level of new capital expenditures by our customers is dependent upon many factors, including general economic conditions, availability of credit, economic conditions and investment activities within their respective industries and expectations of future market behavior. In addition, volatility in commodity prices can negatively affect the level of these new activities and can result in postponement of capital spending decisions or the delay or cancellation of existing orders. For example, conditions in the oil and gas industry are highly cyclical and subject to factors beyond our control. We believe demand for our products and services by many of our customers, particularly those within the oil, gas and petrochemical end market, to be primarily profit-driven, and historically these customers have tended to delay large capital projects, including expensive maintenance and upgrades, when the markets in which they participate experience volatility, reduced returns, or general levels of low activity. A reduction in demand for our products and services could result in the delay or cancellation of existing orders or lead to excess manufacturing capacity, which unfavorably impacts our absorption of fixed manufacturing costs. This reduced demand could have a material adverse effect on our business, financial condition and results of operations.
Acquisitions have formed a significant part of our growth strategy in the past and are expected to continue to do so. If we are unable to identify suitable acquisition candidates or successfully integrate the businesses we acquire, our growth strategy may not succeed.
7
We intend to seek acquisition opportunities both to expand into new markets and to enhance our position in our existing markets. However, our ability to do so will depend on a number of steps, including our ability to:
|
•
|
obtain debt or equity financing that we may need to complete proposed acquisitions;
|
|
•
|
identify suitable acquisition candidates;
|
|
•
|
negotiate appropriate acquisition terms;
|
|
•
|
complete the proposed acquisitions; and
|
|
•
|
integrate the acquired business into our existing operations.
|
If we fail to achieve any of these steps, our growth strategy may not be successful. In particular, a decline in our stock price has and may continue to make debt or equity financing more challenging to obtain. This may inhibit our ability to acquire new businesses in the future.
Acquisitions involve numerous risks, including risks related to integration, and we may not realize the anticipated benefits of our acquisitions.
Acquisitions involve numerous risks, including difficulties in the assimilation of the operations, systems, controls, technologies, personnel, services and products of the acquired company, the potential loss of key employees, customers and distributors of the acquired company and the diversion of our management’s attention from other business concerns. This is the case particularly in the fiscal quarters immediately following the completion of an acquisition because the operations of the acquired business are integrated into the acquiring business’ operations during this period. We may not accurately anticipate all of the changing demands that any future acquisition may impose on our management, our operational and management information systems and our financial systems. The failure to successfully integrate acquired businesses in a timely manner, or at all, could have an adverse effect on our business, financial condition and results of operations.
In addition, the anticipated benefits of an acquisition may not be realized fully or at all, or may take longer to realize than we expect. Actual operating, technological, strategic and sales synergies, if achieved at all, may be less significant than we expect or may take longer to achieve than anticipated. If we are not able to realize the anticipated benefits and synergies expected from our acquisitions within a reasonable time, our business, financial condition and results of operations may be adversely affected.
Acquisitions may result in significant integration costs, and unanticipated integration expense may harm our business, financial condition and results of operations.
Integration efforts associated with our acquisitions may require significant capital and operating expense. Such expenses may include information technology integration fees, legal compliance costs, facility closure costs and other restructuring expenses. Significant unanticipated expenses associated with integration activities may harm our business, financial condition and results of operations.
Our acquisitions may expose us to significant unanticipated liabilities and could adversely affect our business, financial condition and results of operations.
We may underestimate or fail to discover liabilities relating to acquisitions during our due diligence investigations, and we, as the successor owner of an acquired company, might be responsible for those liabilities. Such liabilities could include employment, retirement or severance-related obligations under applicable law or other benefits arrangements, legal claims, tax liabilities, warranty or similar liabilities to customers, product liabilities and personal injury claims, claims related to infringement of third party intellectual property rights, environmental liabilities and claims by or amounts owed to vendors or other third parties. The indemnification and warranty provisions in our acquisition agreements may not fully protect us from the impact of undiscovered liabilities. Indemnities or warranties are often limited in scope, amount or duration, and may not fully cover the liabilities for which they were intended. The liabilities that are not covered by the limited indemnities or warranties could have a material adverse effect on our business, financial condition and results of operations.
8
We may require additional capital to finance our operating needs and to finance our growth. If the terms on which the additional capital is available are unsatisfactory, if the additional capital is not available at all or if we are not able to fully access credit under our credit agreement, we may not be able to pursue our growth strategy.
Our growth strategy will require additional capital investment to complete acquisitions, integrate the completed acquisitions into our existing operations and expand into new markets.
We intend to pay for future acquisitions using cash, capital stock, notes, assumption of indebtedness or any combination of the foregoing. To the extent that we do not generate sufficient cash internally to provide the capital we require to fund our growth strategy and future operations, we will require additional debt or equity financing. This additional financing may not be available or, if available, may not be on terms acceptable to us. Further, high volatility in the capital markets and in our stock price may make it difficult for us to access the capital markets at attractive prices, if at all. If we are unable to obtain sufficient additional capital in the future, it may limit our ability to fully implement our growth strategy. Even if future debt financing is available, it may result in (i) increased interest expense, (ii) increased term loan payments, (iii) increased leverage and (iv) decreased income available to fund further acquisitions and expansion. It may also limit our ability to withstand competitive pressures and make us more vulnerable to economic downturns. If future equity financing is available, issuances of our equity securities may significantly dilute our existing stockholders.
In addition, our credit facility agreement includes restrictive covenants which could limit our financial flexibility. See
“Our Credit Agreement contains restrictions that may limit our flexibility in operating our business.”
below.
Our restructuring activities may subject us to additional uncertainty in our operating results.
We have implemented, and plan to continue to implement, restructuring programs designed to facilitate key strategic initiatives and maintain long-term sustainable growth, such as the sale of our Fluid Handling business. As such, we have incurred and expect to continue to incur expense relating to restructuring activities. We may not achieve or sustain the anticipated benefits of these programs. Further, restructuring efforts are inherently risky, and we may not be able to predict the cost and timing of such actions accurately or properly estimate their impact. We also may not be able to realize the anticipated savings we expect from restructuring activities.
Available insurance coverage, the number of future asbestos-related claims and the average settlement value of current and future asbestos-related claims of certain subsidiaries could be different than we have estimated, which could materially and adversely affect our business, financial condition and results of operations.
Certain subsidiaries are each one of many defendants in a large number of lawsuits that claim personal injury as a result of exposure to asbestos from products manufactured with components that are alleged to have contained asbestos. Such components were acquired from third-party suppliers and were not manufactured by any of our subsidiaries nor were the subsidiaries producers or direct suppliers of asbestos. Additionally, pursuant the purchase agreement related to the sale of our Fluid Handling business, we will retain the asbestos-related contingencies and insurance coverage related to the business, even though we will not retain an interest in the ongoing operations of the Fluid Handling business. For the purposes of our financial statements, we have estimated the future claims exposure and the amount of insurance available based upon certain assumptions with respect to future claims and liability costs. We estimate the liability costs to be incurred in resolving pending and forecasted claims for the next 15-year period.
Our decision to use a 15-year period is based on our belief that this is the extent of our ability to forecast liability costs. We also estimate the amount of insurance proceeds available for such claims based on the current financial strength of the various insurers, our estimate of the likelihood of payment and applicable current law. We reevaluate these estimates regularly. Although we believe our current estimates are reasonable, a change in the time period used for forecasting our liability costs, the actual number of future claims brought against us, the cost of resolving these claims, the likelihood of payment by, and the solvency of, insurers and the amount of remaining insurance available could be substantially different than our estimates, and future revaluation of our liabilities and insurance recoverables could result in material adjustments to these estimates, any of which could materially and adversely affect our business, financial condition and results of operations. In addition, we incur defense costs related to those claims, a portion of which has historically been reimbursed by our insurers. We also incur litigation costs in connection with actions against certain of the subsidiaries’ insurers relating to insurance coverage. While these costs may be significant, we may not be able to predict the amount or duration of such costs. Additionally, we may experience delays in receiving reimbursement from insurers, during which time we may be required to pay cash for settlement or legal defense costs. Any increase in the actual number of future claims brought against us, the defense costs of resolving these claims, the cost of pursuing claims against our insurers,
9
the likelihood and timing of payment by, and the solvency of, insurers and the amount of remaining insurance available, could materially and adversely affect our business, financial condition and results of operations.
A material disruption at any of our manufacturing facilities could adversely affect our ability to generate sales and meet customer demand.
If operations at any of our manufacturing facilities were to be disrupted as a result of a significant equipment failure, natural disaster, power outage, fire, explosion, terrorism, cyber-based attack, adverse weather conditions, labor disputes or other reason, our financial performance could be adversely affected as a result of our inability to meet customer demand for our products. Interruptions in production could increase our costs and reduce our sales. Any interruption in production capability could require us to make substantial capital expenditures to remedy the situation, which could negatively affect our profitability and financial condition. Any recovery under our property damage and business interruption insurance policies may not offset the lost sales or increased costs that may be experienced during the disruption of operations, which could adversely affect our business, financial condition and results of operations.
Failure to comply with the U.S. Foreign Corrupt Practices Act, the U.K. Bribery Act or other applicable anti-bribery laws could have an adverse effect on our business.
The U.S. Foreign Corrupt Practices Act, the U.K. Bribery Act and similar anti-bribery laws in other jurisdictions generally prohibit companies and their intermediaries from making improper payments for the purpose of obtaining or retaining business. Recent years have seen a substantial increase in anti-bribery law enforcement activity with more frequent and aggressive investigations and enforcement proceedings by both the Department of Justice and the U.S. Securities and Exchange Commission, increased enforcement activity by non-U.S. regulators and increases in criminal and civil proceedings brought against companies and individuals. Our policies mandate compliance with all anti-bribery laws. However, we operate in certain countries that are recognized as having governmental and commercial corruption. Our internal control policies and procedures may not always protect us from reckless or criminal acts committed by our employees or third-party intermediaries. Violations of these anti-bribery laws may result in criminal or civil sanctions, which could have a material adverse effect on our business, financial condition and results of operations. Furthermore, in the event that we believe or have reason to believe that our employees or agents have or may have violated applicable laws, including anti-corruption laws, we may be required to investigate or have outside counsel investigate the relevant facts and circumstances, which can be expensive and require significant time and attention from senior management.
We have done and may continue to do business in countries subject to U.S. sanctions and embargoes, and we may have limited managerial oversight over those activities. Failure to comply with various sanction and embargo laws may result in enforcement or other regulatory actions.
Certain of our independent foreign subsidiaries have conducted and may continue to conduct business in countries subject to U.S. sanctions and embargoes or may engage in business dealings with parties whose property or property interests may be blocked under non-country-specific U.S. sanctions programs, and we have limited managerial oversight over those activities. Failure to comply properly with various sanction and embargo laws to which we and our operations may be subject may result in enforcement or other regulatory actions. Specifically, from time to time, certain of our independent foreign subsidiaries sell products to companies and entities located in, or controlled by the governments of, certain countries that are or have previously been subject to sanctions and embargoes imposed by the U.S. government, United Nations or other countries where we maintain operations. With the exception of the U.S. sanctions against Cuba, and Iran to some extent, the applicable sanctions and embargoes generally do not prohibit our foreign subsidiaries from selling non-U.S.-origin products and services to countries that are or have previously been subject to sanctions and embargoes. However, our U.S. personnel, each of our domestic subsidiaries, as well as our employees of foreign subsidiaries who are U.S. citizens, are prohibited from participating in, approving or otherwise facilitating any aspect of the business activities in those countries or with persons prohibited under U.S. sanctions. These constraints impose compliance cost and risk on our operations and may negatively affect the financial or operating performance of such business activities.
Our efforts to comply with U.S. and other applicable sanction and embargo laws may not be effective, and as a consequence we may face enforcement or other actions if our compliance efforts are not or are perceived as not being wholly effective. Actual or alleged violations of these laws could lead to substantial fines or other sanctions which could result in substantial costs. In addition, Syria, Sudan and Iran and certain other sanctioned countries currently are identified by the U.S. State Department as state sponsors of terrorism, and have been subject to restrictive sanctions. Because certain of our independent foreign subsidiaries have contact with and transact limited business in certain U.S. sanctioned countries, including sales to enterprises controlled by agencies of the governments of such countries, our reputation may suffer due to our association with these countries, which may
10
have a material adverse effect on the price of our shares and our business, financial condition and results of operations. In addition, certain U.S. states and municipalities have enacted legislation regarding investments by pension funds and other retirement systems in companies that have business activities or contacts with countries that have been identified as state sponsors of terrorism and similar legislation may be pending in other states. As a result, pension funds and other retirement systems may be subject to reporting requirements with respect to investments in companies such as Colfax or may be subject to limits or prohibitions with respect to those investments that may have a material adverse effect on the price of our shares and our business, financial condition and results of operations.
If we fail to comply with export control regulations, we could be subject to substantial fines or other sanctions.
Some of our products manufactured or assembled in the U.S. are subject to the U.S. Export Administration Regulations, administered by the U.S. Department of Commerce, Bureau of Industry and Security, which require that an export license is obtained before such products can be exported to certain countries. Additionally, some of our products are subject to the International Traffic in Arms Regulations, which restrict the export of certain military or intelligence-related items, technologies and services to non-U.S. persons. Failure to comply with these laws could harm our business by subjecting us to sanctions by the U.S. government, including substantial monetary penalties, denial of export privileges and debarment from U.S. government contracts. The occurrence of any of the foregoing could have a material and adverse effect on our business, financial condition and results of operations.
The majority of our sales are derived from international operations. We are subject to specific risks associated with international operations.
In the year ended
December 31, 2017
, we derived approximately
76%
of our sales from operations outside of the U.S. and we have principal manufacturing facilities in
28
non-U.S. countries, and for 2018 we expect a majority of our sales to be from operations outside of the U.S. notwithstanding the sale of our Fluid Handling business. Sales from international operations, export sales and the use of manufacturing facilities outside of the U.S. by us are subject to risks inherent in doing business outside the U.S. These risks include:
|
•
|
economic or political instability;
|
|
•
|
partial or total expropriation of international assets;
|
|
•
|
limitations on ownership or participation in local enterprises;
|
|
•
|
trade protection measures by the U.S. or other nations, including tariffs or import-export restrictions, and other changes in trade relations;
|
|
•
|
currency exchange rate fluctuations and restrictions on currency repatriation;
|
|
•
|
labor and employment laws that may be more restrictive than in the U.S.;
|
|
•
|
significant adverse changes in taxation policies or other laws or regulations;
|
|
•
|
changes in laws and regulations or in how such provisions are interpreted or administered;
|
|
•
|
difficulties in enforcing our rights outside the U.S.;
|
|
•
|
difficulties in hiring and maintaining qualified staff and managing geographically diverse operations;
|
|
•
|
the disruption of operations from natural disasters, labor or political disturbances, terrorist activities, insurrection or war; and
|
|
•
|
uncertainties arising from local business practices and cultural considerations.
|
If any of these risks were to materialize, they may have a material adverse effect on our business, financial condition and results of operations.
If our associates represented by trade unions or works councils engage in a strike, work stoppage or other slowdown or if the representation committees responsible for negotiating with such trade unions or works councils are unsuccessful in negotiating new and acceptable agreements when the existing agreements with associates covered by collective bargaining expire, we could experience business disruptions or increased costs.
As of
December 31, 2017
, approximately 43% of our associates were represented by a number of different trade unions and works councils, and for 2018, as a result of the sale of our Fluid Handling business, we expect a similar percentage of associates to be represented by trade unions or work councils. Further, as of that date, we had approximately
14,300
associates, representing
11
83%
of our worldwide associate base, in foreign locations. In Canada, Australia and various countries in Europe, Asia, and Central and South America, by law, certain of our associates are represented by a number of different trade unions and works councils, which subject us to employment arrangements very similar to collective bargaining agreements. Further, the laws of certain foreign countries may place restrictions on our ability to take certain employee-related actions or require that we conduct additional negotiations with trade unions, works councils or other governmental authorities before we can take such actions.
If our associates represented by trade unions or works councils were to engage in a strike, work stoppage or other slowdown in the future, we could experience a significant disruption of our operations. Such disruption could interfere with our business operations and could lead to decreased productivity, increased labor costs and lost revenue. The representation committees that negotiate with the foreign trade unions or works councils on our behalf may not be successful in negotiating new collective bargaining agreements or other employment arrangements when the current ones expire. Furthermore, future labor negotiations could result in significant increases in our labor costs. The occurrence of any of the foregoing could have a material adverse effect on our business, financial condition and results of operations.
Our manufacturing business is subject to the possibility of product liability lawsuits, which could harm our business.
As the manufacturer of equipment for use in industrial markets, we face an inherent risk of exposure to product liability claims. Our products may not be free from defects. In addition, some of our products contain components manufactured by third parties, which may also have defects. Our product liability insurance policies have limits that may not be sufficient to cover claims made. In addition, this insurance may not continue to be available at a reasonable cost. With respect to components manufactured by third-party suppliers, the contractual indemnification that we seek from our third-party suppliers may be limited and thus insufficient to cover claims made against us. If insurance coverage or contractual indemnification is insufficient to satisfy product liability claims made against us, the claims could have an adverse effect on our business and financial condition. Even claims without merit could harm our reputation, reduce demand for our products, cause us to incur substantial legal costs and distract the attention of our management. The occurrence of any of the foregoing could have a material and adverse effect on our business, financial condition and results of operations.
As manufacturers, we are subject to a variety of environmental and health and safety laws for which compliance, or liabilities that arise as a result of noncompliance, could be costly.
Our businesses are subject to international, federal, state and local environmental and safety laws and regulations, including laws and regulations governing emissions of: regulated air pollutants; discharges of wastewater and storm water; storage and handling of raw materials; generation, storage, transportation and disposal of regulated wastes; and laws and regulations governing worker safety. These requirements impose on our businesses certain responsibilities, including the obligation to obtain and maintain various environmental permits. If we were to fail to comply with these requirements or fail to obtain or maintain a required permit, we could be subject to penalties and be required to undertake corrective action measures to achieve compliance. In addition, if our noncompliance with such regulations were to result in a release of hazardous materials into the environment, such as soil or groundwater, we could be required to remediate such contamination, which could be costly. Moreover, noncompliance could subject us to private claims for property damage or personal injury based on exposure to hazardous materials or unsafe working conditions. In addition, changes in applicable requirements or stricter interpretation of existing requirements may result in costly compliance requirements or otherwise subject us to future liabilities. The occurrence of any of the foregoing could have a material adverse effect on our business, financial condition and results of operations.
As the present or former owner or operator of real property, or generator of waste, we could become subject to liability for environmental contamination, regardless of whether we caused such contamination.
Under various federal, state and local laws, regulations and ordinances, and, in some instances, international laws, relating to the protection of the environment, a current or former owner or operator of real property may be liable for the cost to remove or remediate contamination on, under, or released from such property and for any damage to natural resources resulting from such contamination. Similarly, a generator of waste can be held responsible for contamination resulting from the treatment or disposal of such waste at any off-site location (such as a landfill), regardless of whether the generator arranged for the treatment or disposal of the waste in compliance with applicable laws. Costs associated with liability for removal or remediation of contamination or damage to natural resources could be substantial and liability under these laws may attach without regard to whether the responsible party knew of, or was responsible for, the presence of the contaminants. In addition, the liability may be joint and several. Moreover, the presence of contamination or the failure to remediate contamination at our properties, or properties for which we are deemed responsible, may expose us to liability for property damage or personal injury, or materially adversely affect our ability to sell our real property interests or to borrow using the real property as collateral. We could be subject to environmental liabilities in the
12
future as a result of historic or current operations that have resulted or will result in contamination. The occurrence of any of the foregoing could have a material adverse effect on our business, financial condition and results of operations.
Failure to maintain and protect our intellectual property rights or challenges to these rights by third parties may affect our operations and financial performance.
The market for many of our products is, in part, dependent upon patent, trademark, copyright and trade secret laws, agreements with employees, customers and other third parties to establish and maintain our intellectual property rights, and the Goodwill engendered by our trademarks and trade names. The protection and enforcement of these intellectual property rights is therefore material to a portion of our businesses. The failure to protect these rights may have a material adverse effect on our business, financial condition and results of operations. Litigation may be required to enforce our intellectual property rights, protect our trade secrets or determine the validity and scope of proprietary rights of others. It may be particularly difficult to enforce our intellectual property rights in countries where such rights are not highly developed or protected. Any action we take to protect or enforce our intellectual property rights could be costly and could absorb significant management time and attention. As a result of any such litigation, we could lose any proprietary rights we have.
In addition, third parties may claim that we or our customers are infringing upon their intellectual property rights. Claims of intellectual property infringement may subject us to costly and time-consuming defense actions and, should defenses not be successful, may result in the payment of damages, redesign of affected products, entry into settlement or license agreements, or a temporary or permanent injunction prohibiting us from manufacturing, marketing or selling certain of our products. It is also possible that others will independently develop technology that will compete with our patented or unpatented technology. The occurrence of any of the foregoing could have a material and adverse effect on our business, financial condition and results of operations.
The loss of key leadership could have a material adverse effect on our ability to run our business.
We may be adversely affected if we lose members of our senior leadership. We are highly dependent on our senior leadership team as a result of their expertise in our industry and our business. The loss of key leadership or the inability to attract, retain and motivate sufficient numbers of qualified management personnel could have a material adverse effect on our business, financial condition and results of operations.
Our credit agreement contains restrictions that may limit our flexibility in operating our business.
The credit agreement entered into on June 5, 2015 by and among the Company, as the borrower, certain U.S. subsidiaries of the Company identified therein, as guarantors, each of the lenders party thereto and Deutsche Bank AG New York Branch, as administrative agent, swing line lender and global coordinator (the “DB Credit Agreement”), contains various covenants that limit our ability to engage in specified types of transactions. These covenants limit our ability to, among other things:
|
•
|
incur additional indebtedness;
|
|
•
|
make certain investments;
|
|
•
|
create liens on certain assets to secure debt; and
|
|
•
|
consolidate, merge, sell or otherwise dispose of all or substantially all our assets.
|
In addition, under the DB Credit Agreement, we are required to satisfy and maintain compliance with a total leverage ratio and an interest coverage ratio. Limitations imposed by the DB Credit Agreement’s various covenants could have a materially adverse effect on our business, financial condition and results of operations.
Any impairment in the value of our intangible assets, including Goodwill, would negatively affect our operating results and total capitalization.
Our Total assets reflect substantial intangible assets, primarily Goodwill. The Goodwill results from our acquisitions, representing the excess of cost over the fair value of the net assets we have acquired. We assess at least annually whether there has been impairment in the value of our indefinite-lived intangible assets. If future operating performance at one or more of our business units were to fall significantly below current levels, if competing or alternative technologies emerge, or if market conditions for an acquired business decline, we could incur, under current applicable accounting rules, a non-cash charge to operating earnings for Goodwill impairment. Any determination requiring the write-off of a significant portion of unamortized intangible assets would adversely affect our business, financial condition, results of operations and total capitalization, the effect of which could be material.
13
Our defined benefit pension plans and post-retirement medical and death benefit plans are or may become subject to funding requirements or obligations that could adversely affect our business, financial condition and results of operations.
We operate defined benefit pension plans and post-retirement medical and death benefit plans for our current and former employees worldwide. Each plan’s funding position is affected by the investment performance of the plan’s investments, changes in the fair value of the plan’s assets, the type of investments, the life expectancy of the plan’s members, changes in the actuarial assumptions used to value the plan’s liabilities, changes in the rate of inflation and interest rates, our financial position, as well as other changes in economic conditions. Furthermore, since a significant proportion of the plans’ assets are invested in publicly traded debt and equity securities, they are, and will be, affected by market risks. Any detrimental change in any of the above factors is likely to worsen the funding position of each of the relevant plans, and this would likely require the plans’ sponsoring employers to increase the contributions currently made to the plans to satisfy our obligations. Any requirement to increase the level of contributions currently made could have a material adverse effect on our business, financial condition and results of operations.
Significant movements in foreign currency exchange rates may harm our financial results.
We are exposed to fluctuations in currency exchange rates. During the year ended
December 31, 2017
, approximately
76%
of our sales were derived from operations outside the U.S., and for 2018 we expect a majority of our sales to be outside of the U.S. notwithstanding the sale of our Fluid Handling business. A significant portion of our revenues and income are denominated in foreign currencies. Large fluctuations in the rate of exchange between foreign currencies and the U.S. dollar could have a material adverse effect on our business, financial condition and results of operations. Changes in the currency exchange rates may impact the financial results positively or negatively in one period and not another, which may make it difficult to compare our operating results from different periods.
We also face exchange risk from transactions with customers in countries outside the U.S. and from intercompany transactions between affiliates. Although we use the U.S. dollar as our functional currency for reporting purposes, we have manufacturing sites throughout the world and a substantial portion of our costs are incurred and sales are generated in foreign currencies. Costs incurred and sales recorded by subsidiaries operating outside of the U.S. are translated into U.S. dollars using exchange rates effective during the respective period. As a result, we are exposed to movements in the exchange rates of various currencies against the U.S. dollar. Further, we may be subject to foreign currency translation losses depending upon whether foreign nations devalue their currencies.
We have generally accepted the exposure to exchange rate movements in translation without using derivative financial instruments to manage this risk. Both positive and negative movements in currency exchange rates against the U.S. dollar will therefore continue to affect the reported amount of sales, profit, assets and liabilities in our Consolidated Financial Statements.
We are dependent on the availability of raw materials, as well as parts and components used in our products.
While we manufacture many of the parts and components used in our products, we purchase a substantial amount of raw materials, parts and components from suppliers. The availability and prices for raw materials, parts and components may be subject to curtailment or change due to, among other things, suppliers’ allocations to other purchasers, interruptions in production by suppliers, changes in exchange rates and prevailing price levels. Any significant change in the supply of, or price for, these raw materials, parts or components could materially affect our business, financial condition and results of operations. In addition, delays in delivery of raw materials, parts or components by suppliers could cause delays in our delivery of products to our customers.
We are currently working to streamline our supplier base. However, this could exacerbate certain of the risks described above. For example, as a result of maintaining relationships with fewer suppliers, we may become more dependent on such suppliers having adequate quantities of raw materials, parts or components that satisfy our requirements at prices that we consider appropriate, and on the timely delivery of such raw materials, parts or components to us. In addition, as a result of maintaining relationships with fewer suppliers, it may be more difficult or impossible to obtain raw materials, parts or components from alternative sources when such components and raw materials are not available from our regular suppliers.
New or changing regulations, and customer focus on environmental, social and governance responsibility, may impose additional costs on us and expose us to new risks, including with respect to the sourcing of our products.
Regulators, stockholders and other interested constituencies have focused increasingly on the environmental, social and governance practices of companies, which has resulted in new regulations that may impose costs on us and expose us to new risks.
14
We may be subject to additional regulations in the future arising from the increased focus on environmental, social and governance responsibility. In addition, our customers may require us to implement environmental, social or governance responsibility procedures or standards before they will continue to do business with us.
The occurrence of any of the foregoing could have a material adverse effect on the price of our shares and our business, financial condition and results of operations.
In addition to the regulations noted above, our businesses are subject to extensive regulation by U.S. and non-U.S. governmental and self-regulatory entities at the supranational, federal, state, local and other jurisdictional levels. These regulations are continually changing, differ or conflict across jurisdictions, and have tended to become more stringent over time. We, our representatives and the industries in which we operate may at times be under review and/or investigation by regulatory authorities. Failure to comply (or any alleged or perceived failure to comply) with relevant regulations could result in civil and criminal, monetary and non-monetary penalties, and any such failure or alleged failure (or becoming subject to a regulatory enforcement investigation) could also cause damage to our reputation, disrupt our business, limit our ability to manufacture, import, export and sell products and services, result in loss of customers and disbarment from selling to certain federal agencies and cause us to incur significant legal and investigatory fees. Compliance with these and other regulations may also affect our returns on investment, require us to incur significant expenses or modify our business model or impair our flexibility in modifying product, marketing, pricing or other strategies for growing our business.
Our information technology infrastructure could be subject to service interruptions, data corruption, cyber-based attacks or network security breaches, which could result in the disruption of operations or the loss of data confidentiality.
We rely on information technology networks and systems, including the Internet and third party service providers, to process, transmit and store electronic information, and to manage or support a variety of business processes and activities, including procurement, manufacturing, distribution, invoicing, collection, communication with our employees, customers, dealers and suppliers, business acquisitions and other corporate transactions, compliance with regulatory, legal and tax requirements, and research and development. These information technology networks and systems may be susceptible to damage, disruptions or shutdowns due to failures during the process of upgrading or replacing software, databases or components, power outages, hardware failures or computer viruses. If these information technology systems suffer severe damage, disruption or shutdown and business continuity plans do not effectively resolve the issues in a timely manner, our business, financial condition, results of operations, and liquidity could be materially adversely affected.
In addition, information technology security threats and sophisticated cyber-based attacks, including, but not limited to, denial-of-service attacks, hacking, “phishing” attacks, computer viruses, ransomware, malware employee or insider error, malfeasance, social engineering, or physical breaches, may cause deliberate or unintentional damage, destruction or misuse, manipulation, denial of access to or disclosure of confidential or important information by our employees, suppliers or third party service providers. Additionally, advanced persistent attempts to gain unauthorized access to our systems and those of third party service providers we rely on are increasing in sophistication and frequency. We have experienced, and expect to continue to confront attempts from hackers and other third parties to gain unauthorized access to our information technology systems and networks. Although these attacks to date have not had a material impact on us, we could in the future experience attacks that could have a material adverse effect on our business, financial condition, results of operations or liquidity. We can provide no assurance that our efforts to actively manage technology risks potentially affecting our systems and networks will be successful in eliminating or mitigating risks to our systems, networks and data or in effectively resolving such risks when they materialize. A failure of or breach in information technology security of our own systems, or those of our third-party vendors, could expose us and our employees, customers, dealers and suppliers to risks of misuse of information or systems, the compromise of confidential information, manipulation and destruction of data, defective products, production downtimes and operations disruptions. Any of these events in turn could adversely affect our reputation, competitive position, including loss of customers and revenue, business, results of operations and liquidity. In addition, such breaches in security could result in litigation, regulatory action and potential liability, as well as the costs and operational consequences of implementing further data protection measures.
To conduct our operations, we regularly move data across national borders, and consequently we are subject to a variety of continuously evolving and developing laws and regulations in the United States and abroad regarding privacy, data protection and data security. The scope of the laws that may be applicable to us is often uncertain and may be conflicting, particularly with respect to foreign laws. For example, the European Union’s General Data Protection Regulation (“GDPR”), which greatly increases the jurisdictional reach of European Union law and adds a broad array of requirements for handling personal data, including the public disclosure of significant data breaches, becomes effective in May 2018. Other countries have enacted or are enacting data localization laws that require data to stay within their borders. All of these evolving compliance and operational requirements impose significant costs that are likely to increase over time.
15
We may be subject to risks arising from changes in technology.
The supply chains in which we operate are subject to technological changes and changes in customer requirements. We may not successfully develop or implement new or modified types of products or technologies that may be required by our customers in the future. Further, the development of new technologies by competitors that may compete with our technologies could reduce demand for our products and affect our financial performance. Should we not be able to maintain or enhance the competitive values of our products or develop and introduce new products or technologies successfully, or if new products or technologies fail to generate sufficient revenues to offset research and development costs, our business, financial condition and operating results could be materially adversely affected.
The markets we serve are highly competitive and some of our competitors may have superior resources. If we are unable to respond successfully to this competition, this could reduce our sales and operating margins.
We sell most of our products in highly fragmented and competitive markets. We believe that the principal elements of competition in our markets are:
|
•
|
the ability to meet customer specifications;
|
|
•
|
application expertise and design and engineering capabilities;
|
|
•
|
product quality and brand name;
|
|
•
|
timeliness of delivery;
|
|
•
|
price; and
|
|
•
|
quality of aftermarket sales and support.
|
In order to maintain and enhance our competitive position, we intend to continue investing in manufacturing quality, marketing, customer service and support, distribution networks, and research and development. We may not have sufficient resources to continue to make these investments and we may not be able to maintain our competitive position. Our competitors may develop products that are superior to our products, develop methods of more efficiently and effectively providing products and services, or adapt more quickly than us to new technologies or evolving customer requirements. Some of our competitors may have greater financial, marketing and research and development resources than we have. As a result, those competitors may be better able to withstand the effects of periodic economic downturns. In addition, pricing pressures could cause us to lower the prices of some of our products to stay competitive. We may not be able to compete successfully with our existing competitors or with new competitors. If we fail to compete successfully, the failure may have a material adverse effect on our business, financial condition and results of operations.
Changes in our tax rates or exposure to additional income tax liabilities could adversely affect our financial results.
Our future effective income tax rates could be unfavorably affected by various factors including, among others, changes in the tax rates, rules and regulations in jurisdictions in which we generate income. For example, compliance with the 2017 U.S. Tax Cut and Jobs Act (“Tax Act”) may require the collection of information not regularly produced within our Company, the use of provisional estimates in our financial statements, and the exercise of significant judgment in accounting for its provisions. Many aspects of the Tax Act are unclear and may not be clarified for some time. As regulations and guidance evolve with respect to the Tax Act, and as we gather more information and perform more analysis, our results may differ from previous estimates and may materially affect our financial position.
In addition, foreign countries may consider changes to existing tax laws, in response to the Tax Act or otherwise, including allowing existing provisions to expire, that could significantly impact the treatment of income earned outside the U.S. An increase in our effective tax rate could have a material adverse effect on our after-tax results of operations.
On December 22, 2017, the Tax Act was signed into law making significant changes to the Internal Revenue Code which included how the U.S. imposes income tax on multinational corporations. Key changes in the Tax Act which are relevant to the Company and generally effective January 1, 2018 include a flat corporate income tax rate of 21 percent to replace the marginal rates that range from 15 percent to 35 percent, elimination of the corporate alternative minimum tax, the creation of a territorial tax system, a one-time tax on accumulated foreign subsidiary earnings (“Transition Tax”) to transition to the territorial system, a “minimum tax” on certain foreign earnings above an enumerated rate of return, a new base erosion anti-abuse tax that subjects
16
certain payments made by a U.S. company to its foreign subsidiary to additional taxes, and an incentive for U.S. companies to sell, lease or license goods and services outside the U.S. by taxing the income at a reduced effective rate. The Tax Act also imposes limits on executive compensation and interest expense deductions, while permitting the immediate expensing for the cost of new investments in certain property acquired after September 27, 2017.
The financial accounting literature requires registrants to account for the Tax Act in the period of enactment. The SEC issued Staff Accounting Bulletin No. 118 (“SAB 118”), which allows registrants to include a provisional amount to account for the implications of the Tax Act. Accordingly, of significance, the Company included a provisional estimate of approximately $52 million for the Transition Tax, payable over 8 years. Generally, the foreign earnings subject to the Transition Tax can be distributed without additional U.S. tax; however, if distributed, the amount could be subject to foreign taxes and U.S. state and local taxes. The Company continues to evaluate the implications of the Tax Act including actions we may take to address our business objectives. Therefore, the Company continues to maintain its indefinite reinvestment of foreign earnings assertion. The Company also included a provisional tax benefit estimate of approximately $55 million for the re-measurement of its U.S. deferred tax assets and liabilities to 21 percent.
The Tax Act introduces significant complexity, notably in the computation of the Transition Tax including interpretation of law, and the information required to perform the computations is significant. As additional regulatory guidance is issued by the applicable taxing authorities, as accounting treatment is clarified, and as we perform additional analysis on the application of the law, we will adjust our provisional estimates in the period completed, which could materially affect our tax obligations and effective tax rate.
In addition, the amount of income taxes we pay is subject to ongoing audits by U.S. federal, state and local tax authorities and by non-U.S. tax authorities. If these audits result in assessments different from amounts recorded, our future financial results may include unfavorable tax adjustments.
Risks and Other Considerations Related to our Common Stock
The issuances of additional Common and Preferred stock or the resale of previously restricted Common stock may adversely affect the market price of Colfax Common stock.
Pursuant to certain registration rights agreements we have entered with Mitchell P. Rales, Steven M. Rales, BDT CF Acquisition Vehicle, LLC, and Markel Corporation (collectively, the “Investors”), the Investors and their permitted transferees have registration rights for the resale of certain shares of Colfax Common stock. These registration rights would facilitate the resale of such securities into the public market, and any such resale would increase the number of shares of Colfax Common stock available for public trading. Sales by the Investors or their permitted transferees of a substantial number of shares of Colfax Common stock in the public market, or the perception that such sales might occur, could have a material adverse effect on the price of Colfax Common stock.
Additionally, under our Amended and Restated Certificate of Incorporation, there are additional authorized shares of Colfax Common stock. Furthermore, we may issue a significant number of additional shares, in connection with acquisitions or otherwise. We also may issue a significant number of additional shares, either into the marketplace through an existing shelf registration statement or through other mechanisms. Additional shares issued would have a dilutive effect on our earnings per share.
Provisions in our governing documents and Delaware law, and the percentage of Common stock owned by our largest stockholders, may delay or prevent an acquisition of Colfax that may be beneficial to our stockholders.
Our Amended and Restated Certificate of Incorporation, Amended and Restated Bylaws, and Delaware law contain provisions that may make it difficult for a third party to acquire us without the consent of our Board of Directors. These include provisions prohibiting stockholders from taking action by written consent, prohibiting special meetings of stockholders called by stockholders, prohibiting stockholder nominations and approvals without complying with specific advance notice requirements, and mandating certain procedural steps for stockholders who wish to introduce business or nominate a director candidate. In addition, our Board of Directors has the right to issue Preferred stock without stockholder approval, which our Board of Directors could use to affect a rights plan or “poison pill” that could dilute the stock ownership of a potential hostile acquirer and may have the effect of delaying, discouraging or preventing an acquisition of Colfax. Delaware law also imposes some restrictions on mergers and other business combinations between Colfax and any holder of 15% or more of its outstanding voting stock.
17
In addition, the percentage of Colfax Common stock owned Mitchell P. Rales, Steven M. Rales, and BDT Capital Partners, LLC and its affiliates could discourage a third party from proposing a change of control or other strategic transaction concerning Colfax.
Item 1B.
Unresolved Staff Comments
None.
Item 2.
Properties
Our corporate headquarters are located in Annapolis Junction, Maryland in a facility that we lease. As of
December 31, 2017
, our Air and Gas Handling reportable segment had
7
principal production facilities in the U.S. representing approximately
0.7
million and
0.1
million square feet of owned and leased space, and
28
principal production facilities in
17
different countries in Asia, Europe, the Americas, Australia and South Africa, representing a total of
2.6
million and
0.3
million square feet of owned and leased space, respectively. Additionally, as of
December 31, 2017
, our Fabrication Technology segment had a total of
6
production facilities in the U.S., representing a total of
0.6
million and
0.9
million square feet of owned and leased space, and
33
production facilities outside the U.S., representing a total of
6.9
million and
2.4
million square feet of owned and leased space, respectively, in 16 countries in Australia, Central and Eastern Europe, Central and South America and Asia.
Item 3.
Legal Proceedings
Discussion of legal matters is incorporated by reference to Part II, Item 8, Note 16, “Commitments and Contingencies,” in the Notes to the Consolidated Financial Statements.
Item 4.
Mine Safety Disclosures
None.
18
EXECUTIVE OFFICERS OF THE REGISTRANT
Set forth below are the names, ages, positions and experience of our executive officers. All of our executive officers hold office at the pleasure of our Board of Directors.
|
Name
|
Age
|
Position
|
||
|
Matthew L. Trerotola
|
50
|
President and Chief Executive Officer and Director, Colfax Corporation
|
||
|
Christopher M. Hix
|
55
|
Senior Vice President, Finance, Chief Financial Officer and Treasurer
|
||
|
Daniel A. Pryor
|
49
|
Executive Vice President, Strategy and Business Development
|
||
|
Ian Brander
|
56
|
Chief Executive Officer, Howden
|
||
|
Shyam Kambeyanda
|
47
|
Senior Vice President, President and CEO of ESAB
|
||
|
Lynn Clark
|
60
|
Senior Vice President, Global Human Resources
|
||
|
A. Lynne Puckett
|
55
|
Senior Vice President, General Counsel and Secretary
|
||
|
Jason MacLean
|
48
|
Senior Vice President, Colfax Business System and Supply Chain Strategy
|
||
Matthew L. Trerotola
has been President and Chief Executive Officer since July 2015. Prior to joining Colfax, Mr. Trerotola was an Executive Vice President and a member of DuPont’s Office of the Chief Executive, responsible for DuPont’s Electronics & Communications and Safety & Protection segments. Mr. Trerotola also had corporate responsibility for DuPont’s Asia-Pacific business. Many of Mr. Trerotola’s roles at DuPont involved applying innovation to improve margins and accelerate organic growth in global businesses. Prior to rejoining DuPont in 2013, Mr. Trerotola had served in leadership roles at Danaher Corporation since 2007, and was most recently Vice President and Group Executive for Life Sciences. Previously, Mr. Trerotola was Group Executive for Product Identification from 2009 to 2012, and President of the Videojet business from 2007 to 2009. While at McKinsey & Company from 1995 to 1999, Mr. Trerotola focused primarily on helping industrial companies accelerate growth. Mr. Trerotola earned his Masters of Business Administration (“M.B.A.”) from Harvard Business School and his Bachelor of Science (“B.S”) in Chemical Engineering from the University of Virginia.
Christopher M. Hix
has been Senior Vice President, Finance, Chief Financial Officer and Treasurer since July 2016. Prior to joining Colfax, Mr. Hix was the Chief Financial Officer of OM Group, Inc., a global, publicly-listed diversified industrial company. Mr. Hix served within OM Group from 2012 until the company’s acquisition in late 2015. Previously, Mr. Hix was the Chief Financial Officer of Robbins & Myers, a diversified industrial company from 2006 to 2011. Prior to that, Mr. Hix spent 13 years in a variety of positions with increasing responsibility in operating, financial and strategic roles within Roper Industries, a global, diversified industrial and technology company that underwent rapid growth and transition from private to public ownership during his tenure. Mr. Hix earned his M.B.A. from St. Mary’s College of California and his B.S. in Business Administration from the University of Southern California.
Daniel A. Pryor
has been the Executive Vice President‚ Strategy and Business Development since July 2013. Mr. Pryor was Senior Vice President, Strategy and Business Development from January 2011 through July 2013. Prior to joining Colfax‚ he was a Partner and Managing Director with The Carlyle Group‚ a global alternative asset manager, where he focused on industrial leveraged buyouts and led numerous portfolio company and follow-on acquisitions. While at The Carlyle Group, he served on the boards of portfolio companies Veyance Technologies, Inc., John Maneely Co., and HD Supply Inc. Prior to The Carlyle Group, he spent 11 years at Danaher Corporation in roles of increasing responsibility‚ most recently as Vice President - Strategic Development. Mr. Pryor earned his M.B.A. from Harvard Business School and his Bachelor of Arts in Economics from Williams College.
Ian Brander
has been the Chief Executive Officer of Howden since August 1, 2011. Prior to becoming Chief Executive Officer of Howden, he served as Operations Director beginning in 2008. His experience includes over 20 years at Howden in various roles in technical, project, commercial and general management positions associated with a wide range of products. He holds a Mechanical Engineering degree from the University of Strathclyde.
19
Shyam Kambeyanda
has been the Senior Vice President, President and Chief Executive Officer of ESAB since May 2016. Prior to joining Colfax‚ Mr. Kambeyanda most recently served as the President Americas for Eaton Corporation's Hydraulics Group. Mr. Kambeyanda joined Eaton in 1995 and has held a variety of positions of increasing responsibility in engineering, quality, ecommerce, product strategy, and operations management in the U.S., Mexico, Europe and Asia. Mr. Kambeyanda maintains a keen international perspective on driving growth and business development in emerging markets. Mr. Kambeyanda holds bachelor's degrees in Physics and General Science from Coe College in Iowa and in Electrical Engineering from Iowa State University. Mr. Kambeyanda also earned his M.B.A from Kellogg School of Management at Northwestern University and is a Six Sigma Green Belt.
Lynn Clark
has been the Senior Vice President, Global Human Resources since January 2013. Prior to joining Colfax, she served as senior vice president, global human resources for Mead Johnson Nutrition. Ms. Clark held roles of increasing responsibility in human resources at Bristol-Myers Squibb from 2001 to 2009, and prior to this, with Lucent Technologies and Allied Signal Corporation. Prior to her experience in human resources, she worked for 15 years in sales and marketing. Ms. Clark has a B.S in Education and a Master of Science in College Student Personnel from Bowling Green University in Ohio.
A. Lynne Puckett
has been the Senior Vice President, General Counsel and Secretary since September 2010. Prior to joining Colfax‚ she was a Partner with the law firm of Hogan Lovells US LLP from 1999 to 2010. Her experience includes a broad range of corporate and transactional matters‚ including mergers and acquisitions‚ venture capital financings‚ debt and equity offerings and general corporate and securities law matters. Before entering the practice of law‚ Ms. Puckett worked for the U.S. Central Intelligence Agency and a major U.S. defense contractor. Ms. Puckett holds a J.D. from the University of Maryland School of Law and a B.S. degree from James Madison University.
Jason MacLean
has been the Senior Vice President, Colfax Business System and Supply Chain Strategy since October 2017. Prior to joining Colfax, he was the Vice President of Advance Analytics at Cummins, Inc. Mr. MacLean was with Cummins since 2006 and served in multiple senior supply chain roles including the Vice President of Supply Chain & Manufacturing for all of Cummins. Mr. MacLean has a combination of supply chain, lean manufacturing and strategic experience. His experience includes applying advanced analytics, digital technologies, and automation to complement and multiply the impact from driving lean across a range of supply chains. He is a Six Sigma Green Belt. Mr. MacLean holds a bachelor's degree in English from the University of Pennsylvania and earned both an M.B.A. in Finance and a Masters in International Studies from the Wharton School of Business and the Lauder Institute, University of Pennsylvania.
20
Item 5.
Market for the Registrant’s Common Equity, Related Stockholder Matters and Issuer Purchases of Equity Securities
Our Common stock began trading on the New York Stock Exchange under the symbol CFX on May 8, 2008. As of
February 7, 201
8, there were 34,337 holders of record of our Common stock. The high and low sales prices per share of our Common stock, as reported on the New York Stock Exchange, for the fiscal periods presented are as follows:
|
|
Year Ended
|
|||||||||||||||
|
|
2017
|
2016
|
||||||||||||||
|
|
High
|
Low
|
High
|
Low
|
||||||||||||
|
First Quarter
|
$
|
41.99
|
|
$
|
35.31
|
|
$
|
30.18
|
|
$
|
18.22
|
|
||||
|
Second Quarter
|
$
|
41.96
|
|
$
|
36.60
|
|
$
|
33.63
|
|
$
|
24.62
|
|
||||
|
Third Quarter
|
$
|
42.93
|
|
$
|
37.26
|
|
$
|
31.66
|
|
$
|
25.19
|
|
||||
|
Fourth Quarter
|
$
|
43.29
|
|
$
|
33.31
|
|
$
|
39.84
|
|
$
|
28.47
|
|
||||
We have not paid any dividends on our Common stock since inception, and we do not anticipate the declaration or payment of dividends at any time in the foreseeable future.
Performance Graph
The graph below compares the cumulative total stockholder return on our Common stock with the cumulative total return of the Standard & Poor’s (“S&P”) 400 Industrial Index and the S&P Industrial Machinery Index. The graph assumes that $100 was invested on December 31, 2011 in each of our Common stock, the S&P 400 Industrial Index and the S&P Industrial Machinery Index, and that all dividends were reinvested. Note that we have elected to add the S&P 400 Industrial Index this year because this index is used in relative total shareholder return performance share units that we have granted to employees.
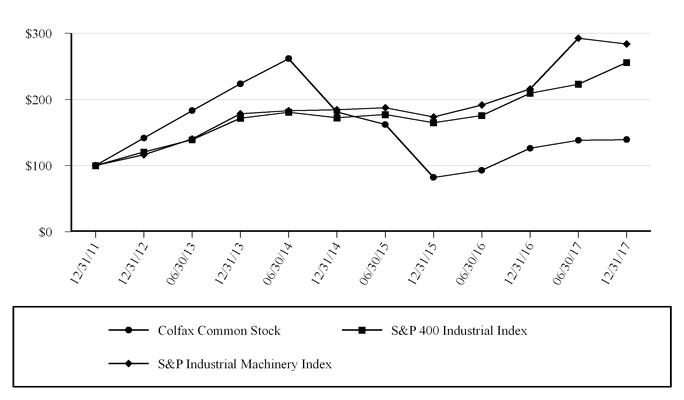
21
Issuer Repurchase of Equity Securities
On October 11, 2015, the Company’s Board of Directors authorized the repurchase of up to
$100.0 million
of the Company’s Common stock from time-to-time on the open market or in privately negotiated transactions, which were to be retired upon repurchase. The timing and amount of shares repurchased was determined by management based on its evaluation of market conditions and other factors. The repurchase program was conducted pursuant to SEC Rule 10b-18.
Under the repurchase program, the Company repurchased 1,000,000 shares of its Common stock in open market transactions for $20.8 million in 2016. In 2015, the Company repurchased 986,279 shares of its Common stock under the program in open market transactions for $27.4 million. The repurchase program expired as of December 31, 2016.
On February 12, 2018
, the Company’s Board of Directors authorized the repurchase of up to
$100.0 million
of the Company’s Common stock from time-to-time on the open market or in privately negotiated transactions. The timing and amount of shares repurchased is to be determined by management based on its evaluation of market conditions and other factors. The repurchase program has no expiration date and does not obligate the Company to acquire any specific number of shares. No shares have been repurchased to date.
22
Item 6.
Selected Financial Data
|
|
Year Ended and As of December 31,
|
|||||||||||||||||||
|
|
2017
(1)
|
2016
(2)
|
2015
(3)
|
2014
(4)
|
2013
(5)
|
|||||||||||||||
|
|
(In thousands, except per share data)
|
|||||||||||||||||||
|
Statement of Income Data:
|
|
|
|
|
|
|
|
|
|
|
||||||||||
|
Net sales
|
$
|
3,300,184
|
|
$
|
3,185,753
|
|
$
|
3,434,352
|
|
$
|
3,971,059
|
|
$
|
3,543,890
|
|
|||||
|
Operating income
|
29,151
|
|
236,800
|
|
265,620
|
|
377,428
|
|
318,494
|
|
||||||||||
|
Specific costs included in Operating income:
|
||||||||||||||||||||
|
Restructuring and other related charges
|
68,351
|
|
58,496
|
|
56,822
|
|
51,133
|
|
31,861
|
|
||||||||||
|
Goodwill and intangible asset impairment
|
152,700
|
|
238
|
|
1,486
|
|
—
|
|
—
|
|
||||||||||
|
Pension settlement loss (gain)
|
46,933
|
|
48
|
|
(582
|
)
|
190
|
|
(592
|
)
|
||||||||||
|
Dividends on preferred stock
|
—
|
|
—
|
|
—
|
|
2,348
|
|
20,396
|
|
||||||||||
|
Preferred stock conversion inducement payment
|
—
|
|
—
|
|
—
|
|
19,565
|
|
—
|
|
||||||||||
|
Net (loss) income from continuing operations
|
(54,540
|
)
|
154,752
|
|
176,950
|
|
400,381
|
|
160,606
|
|
||||||||||
|
Net (loss) income per share from continuing operations - diluted
|
(0.59
|
)
|
1.12
|
|
1.26
|
|
2.86
|
|
1.06
|
|
||||||||||
|
Net income (loss) per share from discontinued operations - diluted
|
1.81
|
|
(0.08
|
)
|
0.08
|
|
0.16
|
|
0.48
|
|
||||||||||
|
Balance Sheet and Other Data:
|
|
|
|
|
|
|
|
|
|
|
||||||||||
|
Cash and cash equivalents
|
262,019
|
|
208,814
|
|
178,993
|
|
281,066
|
|
275,793
|
|
||||||||||
|
Total assets
|
6,709,697
|
|
6,338,440
|
|
6,732,919
|
|
7,211,517
|
|
6,593,679
|
|
||||||||||
|
Total debt, including current portion
|
1,061,071
|
|
1,292,144
|
|
1,417,547
|
|
1,536,810
|
|
1,479,586
|
|
||||||||||
|
Net cash provided by operating activities
|
218,770
|
|
246,974
|
|
303,813
|
|
385,758
|
|
362,169
|
|
||||||||||
|
(1)
|
In 2017, we divested our Fluid Handling business for total consideration of
$864.9 million
. We reported a gain of
$308.4 million
which is included in Income (loss) from discontinued operations, net of taxes in the Consolidated Statements of Income. Refer to Note 4, “Discontinued Operations” in the accompanying Notes to Consolidated Financial Statements in this Form 10-K for additional information.
|
|
(2)
|
During 2016, we repurchased approximately $21 million of our Common stock. See Note 12, “Equity” in the accompanying Notes to Consolidated Financial Statements in this Form 10-K for additional information.
|
|
(3)
|
In 2015, we repurchased approximately $27 million of our Common stock. See Note 12, “Equity” in the accompanying Notes to Consolidated Financial Statements in this Form 10-K for additional information.
|
|
(4)
|
During 2014, we completed the acquisition of Victor Technologies Holdings, Inc. which enabled us to reassess the realizability of certain deferred tax assets on expected U.S. future income, resulting in a non-cash income tax benefit of $145.4 million.
In February 2014, we entered into a Conversion Agreement with BDT CF Acquisition Vehicle, LLC (the “BDT Investor”) pursuant to which the BDT Investor exercised its option to convert its shares of Series A Perpetual Convertible Preferred Stock into shares of our Common stock plus cash.
|
|
(5)
|
During 2013, we completed three acquisitions in our Air and Gas Handling segment. In February 2013 and November 2013, we refinanced our Debt resulting in an approximately $30 million write-off of deferred financing fees and original issue discount.
|
23
Item 7.
Management’s Discussion and Analysis of Financial Condition and Results of Operations
Management’s Discussion and Analysis of Financial Condition and Results of Operations (“MD&A”) is designed to provide a reader of our financial statements with a narrative from the perspective of Company’s management. This MD&A is divided into four main sections:
•
Overview
•
Results of Operations
•
Liquidity and Capital Resources
•
Critical Accounting Policies
The following MD&A should be read together with Item 6. “Selected Financial Data”, Part I, Item 1A. “Risk Factors” and the accompanying Consolidated Financial Statements and Notes to Consolidated Financial Statements included in this Form 10-K. The MD&A includes forward-looking statements. For a discussion of important factors that could cause actual results to differ materially from the results referred to in these forward-looking statements, see “Special Note Regarding Forward-Looking Statements.”
Overview
Please see Part I, Item 1. “Business” for a discussion of Colfax’s objectives and methodologies for delivering shareholder value and the sale of Colfax’s Fluid Handling business.
On September 24, 2017, we entered into a definitive purchase agreement (the “Purchase Agreement”) with CIRCOR International, Inc., a Delaware corporation (“CIRCOR” or the “Buyer”), pursuant to which CIRCOR agreed to purchase certain subsidiaries and assets comprising our Fluid Handling business (“Fluid Handling”).
On December 11, 2017 (the “Closing”)
, we completed the divestiture of Fluid Handling. Total consideration was
$864.9 million
, consisting of
$555.3 million
of cash,
3.3
million shares of CIRCOR common stock (the “CIRCOR Shares”), and assumption of
$168.0 million
of net retirement liabilities.
$65.0 million
of the cash consideration is expected to be collected during 2018 and is included in Other current assets in the accompanying Consolidated Balance Sheets as of December 31, 2017. The CIRCOR Shares we received represent
16.6%
of CIRCOR’s issued and outstanding shares on the Closing date. The purchase price is subject to certain adjustments pursuant to the Purchase Agreement. See Note 4, “Discontinued Operations” for further information.
The accounting requirements for reporting the sale of Fluid Handling as a discontinued operation were met during the third quarter of 2017. Accordingly, the results of operations for the Fluid Handling segment have been excluded from the discussion of our results of operations for all periods presented.
Prior to the sale of the Fluid Handling business, the Company conducted its operations through three operating segments: Air and Gas Handling, Fluid Handling and Fabrication Technology. The Air and Gas Handling and Fluid Handling operating segments were aggregated into a single reportable segment. Subsequent to the sale, the Company now conducts its continuing operations through the Air and Gas Handling and Fabrication Technology segments, which also represent the Company’s reportable segments.
|
•
|
Air and Gas Handling
- a global supplier of industrial centrifugal and axial fans, rotary heat exchangers, gas
|
compressors, ventilation control systems and software, and aftermarket services; and
|
•
|
Fabrication Technology
-
a global supplier of consumable products and equipment for use in the cutting, joining and automated welding of steels, aluminum and other metals and metal alloys
|
Certain amounts not allocated to the two reportable segments and intersegment eliminations are reported under the heading “Corporate and other.”
We have a global geographic footprint, with production facilities in Europe, North America, South America, Asia, Australia and Africa. Through our reportable segments, we serve a global customer base across multiple markets through a combination of direct sales and third-party distribution channels. Our customer base is highly diversified and includes commercial, industrial and government customers.
24
Integral to our operations is CBS. CBS is our business management system, including a comprehensive set of tools. It includes repeatable, teachable processes that we use to create superior value for our customers, shareholders and associates. Rooted in our core values, it is our culture. We believe that our management team’s access to, and experience in, the application of the CBS methodology is one of our primary competitive strengths.
Outlook
We believe that we are well positioned to grow our businesses organically over the long term by enhancing our product offerings and expanding our customer base. Our business mix is expected to be well balanced between long- and short-cycle businesses, sales in emerging markets and developed nations and fore- and aftermarket products and services. Given this balance, management does not use indices other than general economic trends and business initiatives to predict the overall outlook for the Company. Instead, the individual businesses monitor key competitors and customers, including to the extent possible their sales, to gauge relative performance and outlook for the future.
We face a number of challenges and opportunities, including the successful integration of new acquisitions, application and expansion of our CBS tools to improve margins and working capital management, and rationalization of assets and costs.
We expect strategic acquisitions to contribute to our growth. We believe that the extensive experience of our leadership team in acquiring and effectively integrating acquisition targets should enable us to capitalize on future opportunities.
Results of Operations
The following discussion of Results of Operations addresses the comparison of the periods presented. The Company’s management evaluates the operating results of each of its reportable segments based upon Net sales and Segment operating income (loss), which represents Operating income before Goodwill and intangible asset impairment charge, Pension settlement loss and Restructuring and other related charges.
Items Affecting Comparability of Reported Results
Our financial performance and growth are driven by many factors, principally our ability to serve global markets, fluctuations in the relationship of foreign currencies to the U.S. dollar, general economic market conditions, the global economy and capital spending levels, the availability of capital, our estimates concerning asbestos litigation expense and liabilities and availability of insurance thereto, the impact of restructuring initiatives, our ability to pass cost increases on to customers through pricing, the impact of sales mix, our ability to continue to grow through acquisitions, and other factors. These key factors have impacted our results of operations in the past and are likely to affect them in the future.
Global Operations
Our products and services are available worldwide. The manner in which our products and services are sold differs by region. During
2017
, approximately
78%
of our sales were shipped to locations outside of the U.S. Accordingly, we are affected by levels of industrial activity and economic and political factors in countries throughout the world. Our ability to grow and our financial performance will be affected by our ability to address a variety of challenges and opportunities that are a consequence of our global operations, including efficiently utilizing our global sales, manufacturing and distribution capabilities, participating in the expansion of market opportunities in emerging markets, successfully completing global strategic acquisitions and engineering innovative new product applications for end users in a variety of geographic markets. However, we believe that our geographic, end market, customer and product diversification may limit the impact that any one country or economy could have on our consolidated results.
Foreign Currency Fluctuations
A significant portion of our Net sales, approximately
76%
for 2017, is derived from operations outside the U.S., with the majority of those sales denominated in currencies other than the U.S. dollar. Because much of our manufacturing and employee costs are outside the U.S., a significant portion of our costs are also denominated in currencies other than the U.S. dollar. Changes in foreign exchange rates can impact our results of operations and are quantified when significant to our discussion. Changes in foreign exchange rates had an overall negligible impact on Net sales and Income from continuing operations before income taxes for the year ended December 31, 2017. Changes in foreign exchange rates since December 31, 2016 increased net assets by approximately 8%.
25
During 2016, we determined that an other-than-temporary lack of exchangeability between the Venezuelan bolivar and U.S. dollar, due to government controls, restricted our Venezuelan operations ability to pay dividends and satisfy other obligations denominated in U.S. dollars. In addition, other government-imposed restrictions affecting labor, production, and distribution prohibited the Company from controlling key operating decisions. These circumstances have caused us to no longer meet the accounting criteria of control in order to continue consolidating our Venezuelan operations. Therefore, we deconsolidated the financial statements of our Venezuelan operations as of September 30, 2016. As a result of the deconsolidation, we recorded a charge of $2.4 million, of which $0.5 million is included in Selling, general and administrative expense and $1.9 million is included in Income (loss) from discontinued operations, net of taxes, for the year ended December 31, 2016. Substantially all of this amount related to accumulated foreign currency translation charges previously included in Accumulated other comprehensive loss. Due to loss of control, we have applied the cost method of accounting for our Venezuelan operations beginning on September 30, 2016. Prior to, and at the date of deconsolidation, our Venezuelan operations represented
less than 1%
of our net assets, revenues and operating income.
Economic Conditions
Demand for our products depends in part on the level of new capital investment and planned maintenance by our customers. The level of capital expenditures depends, in turn, on general economic conditions as well as access to capital at reasonable cost. Additionally, volatility in commodity prices, including oil, can negatively affect the level of these activities and can result in postponement of capital spending decisions or the delay or cancellation of existing orders. While demand can be cyclical, we believe that our diversified operations generally limit the impact of a downturn in any one market on our consolidated results. During in the second half of 2017, declines in activity in the oil, gas, and petrochemical and power generation end markets impacted our Air and Gas Handling segment. These declines reduced the levels of capital invested and maintenance expenditures made by certain of our customers, which in turn has reduced the demand for our products and services.
Seasonality
As our air and gas handling customers seek to fully utilize capital spending budgets before the end of the year, historically our shipments have peaked during the fourth quarter. Also, our European operations typically experience a slowdown during the July, August and December vacation seasons. General economic conditions may, however, impact future seasonal variations.
Raw Material Costs
We believe our customers place a premium on quality, reliability, availability, design and application engineering support. Our results may be sensitive to price movements in our raw materials. Our largest material purchases are for components and raw materials including steel, iron, copper and aluminum. Historically, we have been generally successful in passing raw material price increases on to our customers. While we seek to take actions to manage this risk, future changes in component and raw material costs may adversely impact earnings.
Sales and Cost Mix
Our profit margins vary in relation to the relative mix of many factors, including the type of product, the location in which the product is manufactured, the end market for which the product is designed, and the percentage of total revenue represented by aftermarket sales and services, which tend to often have higher margins than foremarket products and consumables.
The mix of sales was as follows for the periods presented:
|
|
Year Ended December 31,
|
||||||||
|
|
2017
|
2016
|
2015
|
||||||
|
Foremarket and equipment
|
40
|
%
|
40
|
%
|
43
|
%
|
|||
|
Aftermarket and consumables
|
60
|
%
|
60
|
%
|
57
|
%
|
|||
26
Strategic Acquisitions
We complement our organic growth plans with strategic acquisitions. Acquisitions can significantly affect our reported results, and we report the change in our Net sales between periods both from existing and acquired businesses. Orders and order backlog are presented only for the longer-cycle Air and Gas Handling segment, where this information is relevant. The change in Net sales due to acquisitions for the periods presented in this filing represents the incremental sales from acquired businesses.
Air and Gas Handling
During 2017, the Company completed two acquisitions in our Air and Gas Handling segment for total consideration, net of cash received, of
$219.6 million
, subject to certain purchase price adjustments. This includes the acquisition of Siemens Turbomachinery Equipment GmbH (STE) from Siemens AG in the fourth quarter for cash consideration of
$214.6 million
. This acquisition broadened the segment’s range of compression solutions and expanded its product offering into smaller steam turbines.
During 2015, the Company completed two acquisitions for an aggregate purchase price of approximately
$196 million
. The acquisitions expanded our portfolio of air and gas compression products and enhanced our fan product offering with ventilation control software.
Fabrication Technology
During 2017, the Company completed three acquisitions for total consideration, net of cash, received of
$128.3 million
, subject to certain purchase price adjustments. These acquisitions broadened our product offering and technology content.
During 2016, the Company deployed approximately
$26 million
to acquire a business that increased the segment’s product and technology offerings.
27
Total Company
Sales, Orders and Backlog
Net sales from continuing operations decreased from
$3.4 billion
in
2015
to
$3.2 billion
in
2016
, and increased to
$3.3 billion
in
2017
. The following table presents the components of changes in consolidated Net sales from continuing operations and, for our Air and Gas Handling segment, orders and order backlog:
|
Air and Gas Handling
|
||||||||||||||||||||
|
Net Sales
|
Orders
(1)
|
Backlog at Period End
|
||||||||||||||||||
|
$
|
%
|
$
|
%
|
$
|
%
|
|||||||||||||||
|
(In millions)
|
||||||||||||||||||||
|
As of and for the year ended December 31, 2015
|
$
|
3,434.4
|
|
$
|
1,304.7
|
|
$
|
904.2
|
|
|||||||||||
|
Components of Change:
|
||||||||||||||||||||
|
Existing businesses
(2)
|
(160.3
|
)
|
(4.7
|
)%
|
(15.0
|
)
|
(1.1
|
)%
|
(58.7
|
)
|
(6.5
|
)%
|
||||||||
|
Acquisitions
(3)
|
52.9
|
|
1.5
|
%
|
66.6
|
|
5.1
|
%
|
—
|
|
—
|
%
|
||||||||
|
Foreign currency translation
(4)
|
(141.2
|
)
|
(4.0
|
)%
|
(51.3
|
)
|
(4.0
|
)%
|
(49.4
|
)
|
(5.5
|
)%
|
||||||||
|
|
(248.6
|
)
|
(7.2
|
)%
|
0.3
|
|
—
|
%
|
(108.1
|
)
|
(12.0
|
)%
|
||||||||
|
As of and for the year ended December 31, 2016
|
$
|
3,185.8
|
|
$
|
1,305.0
|
|
$
|
796.1
|
|
|||||||||||
|
Components of Change:
|
||||||||||||||||||||
|
Existing businesses
(2)
|
(15.7
|
)
|
(0.5
|
)%
|
(44.1
|
)
|
(3.4
|
)%
|
(57.0
|
)
|
(7.2
|
)%
|
||||||||
|
Acquisitions
(3)
|
85.2
|
|
2.7
|
%
|
34.7
|
|
2.7
|
%
|
105.3
|
|
13.2
|
%
|
||||||||
|
Foreign currency translation
(4)
|
44.9
|
|
1.4
|
%
|
10.9
|
|
0.8
|
%
|
49.0
|
|
6.2
|
%
|
||||||||
|
114.4
|
|
3.6
|
%
|
1.5
|
|
0.1
|
%
|
97.3
|
|
12.2
|
%
|
|||||||||
|
As of and for the year ended December 31, 2017
|
$
|
3,300.2
|
|
$
|
1,306.5
|
|
$
|
893.4
|
|
|||||||||||
(1)
Represents contracts for products or services, net of current year cancellations for orders placed in the current and prior period. Prior period amounts have been recast to conform to current year presentation.
(2)
Excludes the impact of foreign exchange rate fluctuations and acquisitions, thus providing a measure of growth due to factors such as price, product mix and volume.
(3)
Represents the incremental sales, orders and order backlog as a result of our acquisitions discussed previously.
(4)
Represents the difference between prior year sales, orders and order backlog valued at the actual prior year foreign exchange rates and prior year sales, orders and order backlog valued at current year foreign exchange rates.
The decrease in Net sales from existing businesses during
2017
compared to
2016
was attributable to decreases of
$74.7 million
in our Air and Gas Handling, mostly offset by an increase of
$59.0 million
in our Fabrication Technology segment. Air and Gas Handling orders, net of cancellations and excluding acquisitions and foreign currency translation effects, decreased
$44.1 million
during
2017
in comparison to
2016
due to large project bookings during the second half of
2016
that did not repeat, delays in orders in the second half of
2017
, and lower demand in power generation markets. The decline was partially offset by increases in general industrial and other end markets.
The decrease in Net sales from existing businesses during
2016
compared to
2015
was due to decreases of
$58.1 million
and
$102.2 million
in our Air and Gas Handling and Fabrication Technology segments, respectively. Orders, net of cancellations, from existing businesses for our Air and Gas Handling segment decreased during
2016
in comparison to
2015
due to declines in all end markets except mining. The unfavorable domestic and international macroeconomic conditions experienced during the first half of
2016
were partially offset by consecutive quarters of order growth during the second half of
2016
.
28
Operating Results
The following table summarizes our results from continuing operations for the comparable three year period.
|
Year Ended December 31,
|
|||||||||||
|
2017
|
2016
|
2015
|
|||||||||
|
(Dollars in millions)
|
|||||||||||
|
Gross profit
|
$
|
1,029.5
|
|
$
|
992.4
|
|
$
|
1,071.7
|
|
||
|
Gross profit margin
|
31.2
|
%
|
31.2
|
%
|
31.2
|
%
|
|||||
|
Selling, general and administrative expense
|
$
|
732.3
|
|
$
|
696.8
|
|
$
|
748.3
|
|
||
|
Restructuring and other related charges
|
68.4
|
|
58.5
|
|
56.8
|
|
|||||
|
Goodwill and intangible asset impairment charge
|
152.7
|
|
0.2
|
|
1.5
|
|
|||||
|
Pension settlement loss (gain)
|
46.9
|
|
—
|
|
(0.6
|
)
|
|||||
|
Operating income
|
29.2
|
|
236.8
|
|
265.6
|
|
|||||
|
Operating income margin
|
0.9
|
%
|
7.4
|
%
|
7.7
|
%
|
|||||
|
Interest expense
|
$
|
41.1
|
|
$
|
30.3
|
|
$
|
47.5
|
|
||
|
Provision for income taxes
|
42.6
|
|
51.8
|
|
41.2
|
|
|||||
2017 Compared to 2016
The
$37.1 million
increase in Gross profit during
2017
in comparison to
2016
was attributable to an increase of
$49.6 million
in our Fabrication Technology segment, partially offset by a decline of
$12.5 million
in our Air and Gas Handling segment. Acquisition-related growth in both segments contributed
$32.1 million
of Gross profit in
2017
, and foreign exchange translation added another
$14.0 million
to the increase. These increases combined with
$26.8 million
of savings from restructuring initiatives, helped offset the impact of lower new build project margins and higher material costs experienced in 2017, keeping Gross profit margin consistent with the prior year.
Selling, general and administrative expense increased by
$35.5 million
during
2017
in comparison to
2016
, which was attributable to increases in both Air and Gas Handling and Fabrication Technology. The increases were mainly driven by
$28.3 million
increases associated with acquisitions completed in 2017, a
$14.2 million
increase in business development related expenses, partially offset by the incremental benefits realized from our restructuring programs and cost savings initiatives. Restructuring and other related charges increased during
2017
compared to 2016, driven by accelerated cost reduction programs to eliminate excess cost in response to the current market conditions.
During 2017, we recorded impairment charges totaling
$152.7 million
. These charges consisted of a goodwill impairment of
$150.2 million
and an indefinite-lived trademark impairment charge of
$2.5 million
. Both charges related to our Air and Gas Handling segment. Additionally, we incurred a
$46.9 million
non-cash pension settlement loss in connection with a third-party buyout of one of the Company’s pension plans.
Interest expense during
2017
increased by
$10.8 million
compared to 2016, primarily attributable to the senior note offering of
€350 million
in April 2017 and higher interest rates on our senior unsecured debt.
Loss from continuing operations before income taxes was
$12.0 million
and the Provision for income taxes was
$42.6 million
for 2017. The effective tax rate for continuing operations during 2017 was
(355.0)%
, which was higher than the U.S. federal statutory tax rate primarily due to non-deductible impairment losses, losses in certain jurisdictions where a tax benefit is not expected to be recognized offset in part by foreign earnings where international tax rates that are lower than the 2017 U.S. tax rate. The Tax Act provisional amounts did not have a significant net impact on the effective tax rate for 2017. Income from continuing operations before income taxes was
$206.5 million
and the Provision for income taxes was
$51.8 million
for
2016
, resulting in a
25.1%
effective tax rate that was primarily driven by foreign earnings where international tax rates are lower than the U.S. federal tax rate.
29
2016 Compared to 2015
The
$79.3 million
decrease in Gross profit during
2016
in comparison to
2015
was attributable to decreases of
$43.9 million
and
$35.4 million
in our Air and Gas Handling segment and our Fabrication Technology segment, respectively. The decrease in Gross profit in both of our segments during
2016
as compared to
2015
was primarily due to lower overall volumes as a result of decline in numerous end-markets and geographic markets. Changes in foreign exchange rates decreased Gross profit by approximately
$40 million
. These decreases were offset by acquisition related growth and restructuring savings, each contributing approximately
$14 million
to Gross profit. The increase in Gross profit margin in our Fabrication Technology segment during
2016
as compared to
2015
was more than offset by the lower Gross profit margin in our Air and Gas Handling segment.
Selling, general and administrative expense decreased
$51.5 million
during
2016
in comparison to
2015
, which was attributable to decreases in both Air and Gas Handling and Fabrication Technology. Execution of structural cost reductions in both segments as a result of restructuring programs and cost savings initiatives was the primary driver in reducing Selling, general and administrative expense over the prior year. Changes in foreign exchange rates during
2016
decreased Selling, general, and administrative expenses by approximately
$27 million
. These decreases were partially offset by
$13 million
of acquisition-related growth in our Air and Gas Handling segment.
The decrease in Interest expense, net during
2016
was the result of the refinancing of our principal credit facility in
2015
. The refinancing resulted in, among other things, lower borrowing margins, lower outstanding borrowings and reduced non-cash interest expense in the current year by
$2.5 million
. Interest expense for
2015
also included a
$4.7 million
write-off of certain deferred financing fees and original issue discount in connection with the refinancing. Lower foreign currency charges in
2016
as compared to the prior year, contributed approximately
$10 million
of the decrease in Interest expense, net over the prior year.
Income before income taxes was
$206.5 million
and the Provision for income taxes was
$51.8 million
for
2016
. Income before income taxes was
$218.1 million
and the Provision for income taxes was
$41.2 million
for
2015
. The Provision for income taxes in both periods was impacted by the effect of foreign earnings where international tax rates are lower than the U.S. tax rate. The Provision for income taxes for
2015
was also impacted by a tax benefit of
$13.0 million
associated with the resolution of a liability for unrecognized tax benefits.
Business Segments
As discussed further above, the Company reports results in two reportable segments: Air and Gas Handling and Fabrication Technology.
Air and Gas Handling
We design, manufacture, install and maintain air and gas handling products for use in a wide range of markets, including power generation, oil, gas and petrochemical, mining, wastewater, and general industrial and other. Our air and gas handling products are principally marketed under the Howden brand name. Howden’s primary products are heavy-duty fans, rotary heat exchangers and compressors. The fans and heat exchangers are used in coal-fired and other types of power stations, both in combustion and emissions control applications, underground mines, steel sintering plants and other industrial facilities that require movement of large volumes of air in harsh applications. Howden’s compressors are mainly used in the oil, gas and petrochemical end markets.
The following table summarizes selected financial data for our Air and Gas Handling segment:
30
|
Year Ended
|
|||||||||||
|
2017
|
2016
|
2015
|
|||||||||
|
(Dollars in millions)
|
|||||||||||
|
Net sales
|
$
|
1,362.9
|
|
$
|
1,385.3
|
|
$
|
1,449.1
|
|
||
|
Gross profit
|
357.9
|
|
370.4
|
|
414.3
|
|
|||||
|
Gross profit margin
|
26.3
|
%
|
26.7
|
%
|
28.6
|
%
|
|||||
|
Selling, general and administrative expense
|
$
|
231.7
|
|
$
|
220.3
|
|
$
|
243.2
|
|
||
|
Segment operating income
|
126.2
|
|
150.1
|
|
171.0
|
|
|||||
|
Segment operating income margin
|
9.3
|
%
|
10.8
|
%
|
11.8
|
%
|
|||||
|
Items not included in segment results:
|
|||||||||||
|
Restructuring and other related items
|
$
|
52.2
|
|
$
|
26.8
|
|
$
|
27.2
|
|
||
|
Goodwill and intangible asset impairment charge
|
152.7
|
|
—
|
|
—
|
|
|||||
Net sales from existing businesses, as discussed and defined under “Sales, Orders and Backlog” above, decreased by
$74.7 million
during
2017
in comparison to
2016
primarily due to declines in the oil, gas, and petrochemical and power generation end markets, partially offset by increases in mining and general industrial and other end markets. Additionally, acquisition-related growth contributed
$37.1 million
, and changes in foreign exchange rates had a positive impact of
$15.2 million
on Net sales. Gross profit and Gross profit margin decreased during
2017
, which was primarily the result of lower volumes and project margins. These decreases were partially offset by
$8.6 million
of acquisition-related growth and
$18.6 million
incremental benefits realized from restructuring programs and cost savings initiatives. Selling, general and administrative expense increased during
2017
compared to
2016
, which is mainly the result of acquisition-related increases of
$10.4 million
. The lower Segment operating income and Segment operating income margin in
2017
compared to 2016 were the result of lower Gross profit and the increase in Selling, general and administrative expense discussed above. Restructuring and other related charges increased during
2017
driven by accelerated cost reduction programs to eliminate excess cost in response to the current market conditions. In 2017, we recorded a goodwill impairment charge of
$150.2 million
and a trade name impairment charge of
$2.5 million
, as a result of conclusions reached from performing our annual impairment tests.
The
$58.1 million
Net sales decrease due to existing businesses, as discussed and defined under “Sales, Orders and Backlog” above, during
2016
in comparison to
2015
was primarily due to declines in the oil, gas, and petrochemical and general industrial and other end markets. The power generation, marine and mining end markets were flat on a year over year basis. Additionally, changes in foreign exchange rates had a negative impact of
$57.2 million
on Net sales, partially offset by acquisition related growth of
$51.6 million
. Gross profit and Gross profit margin decreased during
2016
, which was primarily the result of lower volumes and, to a lesser extent, project margins. Foreign exchange rate changes as compared to prior year contributed
$16.5 million
to the decrease. These decreases were partially offset by
$13.0 million
of acquisition-related growth. Selling, general and administrative expense for
2016
decreased compared to
2015
primarily due to benefits realized from our restructuring programs and cost savings initiatives. Changes in foreign exchange rates represented approximately
$11 million
of the decrease in Selling, general and administrative expense when comparing
2016
to the prior year. The decrease in gross profit, discussed previously, were the primary driver in the reduction of Segment operating income and Segment operating income margin in
2016
. Restructuring and other related charges for the Air and Gas Handling segment remained relatively consistent in 2016 as the segment responds to the cyclical market downturn.
Fabrication Technology
We formulate, develop, manufacture and supply consumable products and equipment for use in the cutting, joining and automated welding of steels, aluminum and other metals and metal alloys. Our fabrication technology products are marketed under several brand names, most notably ESAB, which we believe is well known in the international cutting and welding industry. ESAB’s comprehensive range of welding consumables includes electrodes, cored and solid wires and fluxes using a wide range of specialty and other materials, and cutting consumables including electrodes, nozzles, shields and tips. ESAB’s fabrication technology equipment ranges from portable welding machines to large customized automated cutting and welding systems. Products are sold into a wide range of end markets, including infrastructure, wind power, marine, pipelines, mobile/off-highway equipment, oil, gas, and mining.
The following table summarizes selected financial data for our Fabrication Technology segment:
31
|
Year Ended
|
|||||||||||
|
2017
|
2016
|
2015
|
|||||||||
|
(Dollars in millions)
|
|||||||||||
|
Net sales
|
$
|
1,937.3
|
|
$
|
1,800.5
|
|
$
|
1,985.3
|
|
||
|
Gross profit
|
671.6
|
|
622.0
|
|
657.4
|
|
|||||
|
Gross profit margin
|
34.7
|
%
|
34.5
|
%
|
33.1
|
%
|
|||||
|
Selling, general and administrative expense
|
$
|
447.2
|
|
$
|
426.6
|
|
$
|
457.6
|
|
||
|
Segment operating income
|
$
|
224.4
|
|
$
|
195.4
|
|
$
|
199.8
|
|
||
|
Segment operating income margin
|
11.6
|
%
|
10.9
|
%
|
10.1
|
%
|
|||||
|
Items not included in segment results:
|
|||||||||||
|
Restructuring and other related items
|
$
|
16.2
|
|
$
|
31.7
|
|
$
|
29.7
|
|
||
|
Intangible asset impairment charge
|
—
|
|
0.2
|
|
1.5
|
|
|||||
The Net sales increase during
2017
compared to
2016
was primarily the result of an increase in existing businesses of
$59.0 million
, led by a market recovery in North America and growth in certain developing regions. Acquisition-related growth contributed
$48.1 million
of incremental sales in 2017, and foreign currency translation had a positive impact of
$29.7 million
. Gross profit increased in
2017
due to acquisition-related growth of
$23.4 million
and increases in volumes from existing businesses. Costs savings associated with restructuring programs added another
$8.2 million
of additional gross profit in the current year. These increases were partially offset by a
$38.6 million
increase in cost of goods sold due to higher commodity prices in 2017. Gross margin increased
20
basis points due to the positive impact from increased volumes and favorable mix, which was partially offset by higher raw material costs during the year. Selling, general and administrative expense increased by
$20.6 million
in
2017
as compared to
2016
and was primarily attributable to a
$17.9 million
increase in acquisition-related cost. Segment operating income margin expanded approximately
80
basis points due to higher sales and improved profit margin. Restructuring and other related items decreased in
2017
in comparison to
2016
, consistent with management’s plan.
The Net sales decrease during
2016
compared to
2015
was primarily the result of a decrease in existing businesses of $
102.2
million and changes in foreign exchange rates which had a negative impact of $83.9 million, partially offset by acquisition-related growth of
$1.3 million
. The
$102.2 million
Net sales decline due to existing businesses, as discussed and defined under “Sales, Orders and Backlog” above, during 2016 in comparison to 2015 was primarily the result of decreases in equipment sales and consumable volumes in North America. The lower volumes decreased Gross profit for 2016 by approximately
$40 million
as compared to 2015, and changes in foreign exchange rates contributed
$24 million
to the decrease. Gross profit margin for the segment increased in the current year due to favorable consumable pricing in selected markets and materials costs savings initiatives across the segment. The decrease in Selling, general and administrative expense during 2016 was primarily due to benefits realized from our restructuring programs and cost savings initiatives, totaling approximately
$29 million
. Changes in foreign exchange rates decreased Selling, general and administrative expense by approximately
$16 million
in 2016. Segment operating income margin increased despite the lower overall volumes primarily due to our execution on cost control. Restructuring and other related charges for the Fabrication Technology segment remained relatively consistent in 2016 as the segment responds to the cyclical market downturn.
Liquidity and Capital Resources
Overview
We have financed our capital and working capital requirements through a combination of cash flows from operating activities, various borrowings and issuances of equity. We expect that our primary ongoing requirements for cash will be for working capital, acquisitions, capital expenditures, asbestos-related expenses and funding of pension plans. If determined appropriate for strategic acquisitions or other corporate purposes, we believe we could raise additional funds in the form of debt or equity.
Equity Capital
On May 21, 2015, we contributed
66,000
shares of newly issued Colfax Common stock to our U.S. defined benefit pension plan. No contributions of our Common stock were made in 2016 and 2017.
On October 11, 2015, our Board of Directors authorized the repurchase of up to
$100.0 million
of our Common stock from time-to-time on the open market or in privately negotiated transactions, which were to be retired upon repurchase. The repurchase program was authorized until December 31, 2016 and did not obligate us to acquire any specific number of shares. The timing
32
and amount of shares repurchased was determined by management based on its evaluation of market conditions and other factors. The repurchase program was conducted pursuant to SEC Rule 10b-18. During the years ended December 31, 2016 and 2015, we repurchased
1,000,000
shares and
986,279
shares, respectively, of our Common stock in open market transactions for
$20.8 million
and
$27.4 million
, respectively. The repurchase program expired as of December 31, 2016.
Borrowing Arrangements
On June 5, 2015, we entered into a credit agreement by and among the Company, as the borrower, certain U.S. subsidiaries of the Company identified therein, as guarantors, each of the lenders party thereto and Deutsche Bank AG New York Branch, as administrative agent, swing line lender and global coordinator (the “DB Credit Agreement”). The proceeds of the loans under the DB Credit Agreement were used by us to repay in full balances under our preexisting credit agreement, as well as for working capital and general corporate purposes. The DB Credit Agreement consists of a term loan in the aggregate amount of
$750.0 million
(the “Term Loan”) and a revolving credit facility (the “Revolver”) with a commitment capacity of
$1.3 billion
, each of which had an initial maturity term of five years. The Revolver contains a
$50.0 million
swing line loan sub-facility. In conjunction with the DB Credit Agreement, we recorded a charge to Interest expense in the Consolidated Statement of Income for the year ended
December 31, 2015
of
$4.7 million
to write-off certain deferred financing fees and original issue discount and expensed
$0.4 million
of costs incurred in connection with the refinancing of the DB Credit Agreement.
The Term Loan and the Revolver bear interest, at our election, at either the base rate or the Eurocurrency rate (each as defined in the DB Credit Agreement), plus the applicable interest rate margin. The applicable interest rate margin results from the lower applicable interest rate margin (subject to certain exceptions) due to the Company’s total leverage ratio or the corporate family rating of the Company as determined by Standard & Poor’s and Moody’s (ranging from
1.25%
to
2.00%
, in the case of the Eurocurrency margin, and
0.25%
to
1.00%
, in the case of the base rate margin). Swing line loans bear interest at the applicable rate, as specified under the terms of the DB Credit Agreement, based upon the currency borrowed. As of
December 31, 2017
, the weighted-average interest rate of borrowings under the DB Credit Agreement was
3.07%
, excluding accretion of original issue discount and deferred financing fees, and there was
$1.3 billion
available on the revolving credit facility.
On April 19, 2017
, we issued senior unsecured notes with an aggregate principal amount of
€350 million
(the “Euro Notes”). Euro Notes are due on
April 15, 2025
and have an interest rate of
3.25%
. The proceeds from the Euro Notes offering were used to repay borrowings under our DB Credit Agreement and bilateral credit facilities totaling
€283.5 million
, as well as for general corporate purposes, and are guaranteed by certain of our domestic subsidiaries (the “Guarantees”). The Euro Notes and the Guarantees have not been, and will not be, registered under the Securities Act of 1933, as amended (the "Securities Act"), or the securities laws of any other jurisdiction.
As of
December 31, 2017
, the Company had an original issue discount of
$3.7 million
and deferred financing fees of
$9.2 million
included in its Consolidated Balance Sheet as of
December 31, 2017
, which will be accreted to Interest expense primarily using the effective interest method, over the life of the applicable debt agreements.
In addition to the debt agreements discussed above, the Company is party to various bilateral credit facilities with a borrowing capacity of
$217.9 million
. As of
December 31, 2017
, outstanding borrowings under these facilities totaled
$22.8 million
, with a weighted average borrowing rate of
1.00%
.
We are also party to letter of credit facilities with an aggregate capacity of
$780.6 million
. Total letters of credit of
$418.8 million
were outstanding as of
December 31, 2017
.
The Company was party to a receivables financing facility through a wholly-owned, special purpose bankruptcy-remote subsidiary which purchased trade receivables from certain of the Company’s subsidiaries on an ongoing basis and pledged them to support its obligation as borrower under the receivables financing facility. This special purpose subsidiary has a separate legal existence from its parent and its assets are not available to satisfy the claims of creditors of the selling subsidiaries or any other member of the consolidated group. According to the receivable financing facility agreement, the program limit was not to exceed
$80 million
and the scheduled termination date for the receivables financing facility was
December 19, 2017
. On
December 15, 2017
, the Company paid off the total outstanding borrowings under the receivables financing facility of
$52.4 million
, and the agreement was terminated.
Certain U.S. subsidiaries of the Company have agreed to guarantee the obligations of the Company under the DB Credit Agreement. The DB Credit Agreement contains customary covenants limiting the ability of the Company and its subsidiaries to, among other things, incur debt or liens, merge or consolidate with others, dispose of assets, make investments or pay dividends. In addition, the DB Credit Agreement contains financial covenants requiring the Company to maintain a total leverage ratio, as defined therein, of generally not more than 3.5 to 1.0 and minimum interest coverage ratio, as defined therein, of 3.0 to 1.0,
33
measured at the end of each quarter. The DB Credit Agreement contains various events of default (including failure to comply with the covenants under the DB Credit Agreement and related agreements) and upon an event of default the lenders may, subject to various customary cure rights, require the immediate payment of all amounts outstanding under the Term Loan and the Revolver. The Company is in compliance with all such covenants as of
December 31, 2017
. We believe that our sources of liquidity, including the DB Credit Agreement, are adequate to fund our operations for the next twelve months.
Cash Flows
As of
December 31, 2017
, we had
$262.0 million
of Cash and cash equivalents, an increase of
$40.3 million
from
$221.7 million
as of
December 31, 2016
. The Cash and cash equivalents as of
December 31, 2016
includes
$12.9 million
, related to the Fluid Handling business, which was reported in
Current portion of assets held for sale
in the Consolidated Balance Sheet. The following table summarizes the change in Cash and cash equivalents during the periods indicated:
|
Year Ended December 31,
|
|||||||||||
|
2017
|
2016
|
2015
|
|||||||||
|
(In millions)
|
|||||||||||
|
Net cash provided by operating activities
|
$
|
218.8
|
|
$
|
247.0
|
|
$
|
303.8
|
|
||
|
Purchases of fixed assets, net
|
(68.8
|
)
|
(63.2
|
)
|
(69.9
|
)
|
|||||
|
Acquisitions, net of cash received
|
(346.8
|
)
|
(26.0
|
)
|
(196.0
|
)
|
|||||
|
Proceeds from sale of business, net
|
490.3
|
|
—
|
|
—
|
|
|||||
|
Other, net
|
15.1
|
|
7.2
|
|
18.9
|
|
|||||
|
Net cash provided by (used
in) investing activities
|
89.8
|
|
(82.0
|
)
|
(247.0
|
)
|
|||||
|
Repayments of borrowings, net
|
(277.3
|
)
|
(118.8
|
)
|
(88.9
|
)
|
|||||
|
Proceeds from issuance of common stock, net
|
6.9
|
|
2.2
|
|
6.1
|
|
|||||
|
Repurchases of common stock
|
—
|
|
(20.8
|
)
|
(27.4
|
)
|
|||||
|
Other
|
(10.0
|
)
|
(7.8
|
)
|
(21.1
|
)
|
|||||
|
Net cash used in financing activities
|
(280.4
|
)
|
(145.2
|
)
|
(131.3
|
)
|
|||||
|
Effect of foreign exchange rates on Cash and cash equivalents
|
12.1
|
|
4.5
|
|
(33.5
|
)
|
|||||
|
Increase (decrease) in Cash and cash equivalents
|
$
|
40.3
|
|
$
|
24.3
|
|
$
|
(108.0
|
)
|
||
Cash provided by operating activities of discontinued operations, which is included in net cash provided by operating activities above, was
$65.2 million
,
$23.1 million
, and
$64.7 million
, respectively during
2017
,
2016
, and
2015
. Cash used in investing activities of discontinued operations, which is included in net cash provided by (used in) investing activities above, was
$10.1 million
,
$3.9 million
, and
$5.1 million
during
2017
,
2016
, and
2015
, respectively.
Cash flows from operating activities can fluctuate significantly from period to period due to changes in working capital and the timing of payments for items such as pension funding and asbestos-related costs. Changes in significant operating cash flow items are discussed below.
|
•
|
Net cash received or paid for asbestos-related costs, net of insurance proceeds, including the disposition of claims, defense costs and legal expenses related to litigation against our insurers, creates variability in our operating cash flows. We had net cash outflows of
$3.7 million
,
$16.0 million
and
$22.7 million
during
2017
,
2016
and
2015
, respectively. Net cash outflows for
2017
and
2016
were net of
$36.5 million
and
$23.6 million
, respectively, of reimbursements from insurance companies on our asbestos insurance receivable.
|
|
•
|
Funding requirements of our defined benefit plans, including pension plans and other post-retirement benefit plans, can vary significantly from period to period due to changes in the fair value of plan assets and actuarial assumptions. For
2017
,
2016
and
2015
, cash contributions for defined benefit plans were
$37.9 million
,
$34.5 million
and
$44.1 million
, respectively.
|
|
•
|
During
2017
,
2016
and
2015
, cash payments of
$30.7 million
,
$66.6 million
and
$57.7 million
, respectively, were made related to our restructuring initiatives.
|
|
•
|
Changes in net working capital also affected the operating cash flows for the periods presented. We define working capital as Trade receivables, net and Inventories, net reduced by Accounts payable and Customer advances and billings in excess of costs incurred. During
2017
, net working capital consumed cash of
$92.5 million
, before the impact of foreign exchange, primarily due to an increase in receivables and inventories driven by revenue growth and timing of collections and
|
34
shipments. During
2016
, net working capital consumed cash of
$31.4 million
, before the impact of foreign exchange, primarily due to an increase in receivables and lower billings in excess of costs incurred associated with our Air and Gas business segment. The net increase was offset by an increase in payables in our Air and Gas Handling segment and Fabrication Technology segment and partially offset by decline in inventory levels in our Fabrication Technology segment. During
2015
, net working capital provided cash of
$43.5 million
, before the impact of foreign exchange, primarily due to decrease in receivables with our Air and Gas Handling segment and Fabrication Technology segment, offset by lower billings in excess of costs incurred associated with our Air and Gas business segment.
Cash flows provided by investing activities during
2017
included net proceeds of
$490.3 million
from the sale of the Fluid Handling business segment and net cash outflows of
$346.8 million
associated with two acquisitions in our Air and Gas Handling segments and three acquisitions in our Fabrication Technology segment. Cash flows from investing activities during
2016
were impacted by the net cash outflows of approximately
$26 million
associated with an acquisition in our Fabrication Technology segment. Cash flows from investing activities during
2015
were impacted by the net cash outflows of
$196 million
associated with two acquisitions completed by our Air and Gas Handling segment.
Cash flows used in financing activities in
2017
,
2016
and
2015
reflect net repayments of borrowings. The outflow in
2017
is attributable to the repayment of borrowings under the DB credit agreement and bilateral credit facilities for
$651.8 million
, reduced by proceeds from the issuance of Euro Notes, discussed under “—Borrowing Arrangements” above. The cash outflows in
2016
and
2015
were attributable to repayment of borrowings under the DB credit agreement and bilateral credit facilities of
$118.8 million
and
$88.9 million
, respectively. Additionally, the cash flows during
2016
and
2015
were impacted by the share repurchases discussed under “Equity Capital” above.
Our Cash and cash equivalents as of December 31, 2017 included
$252.1 million
held in jurisdictions outside the U.S. We currently do not intend nor foresee a need to repatriate these funds. If however, we elect to repatriate future earnings from foreign jurisdictions, such repatriation remittances may be subject to taxes and other local statutory restrictions.
Prior Disclosure Under Section 13(r) of the Exchange Act
In the Company’s quarterly report for the period ended June 30, 2017, we reported pursuant to Section 13(r)(1)(A) of the Exchange Act that one of our non-U.S. ESAB subsidiaries sold a total of
$1,236,800
of welding products for end use in the Iranian petrochemical sector pursuant to General License H, which authorizes such transactions. Colfax subsequently learned that our ESAB subsidiary inadvertently mischaracterized the end market industry sector for a portion of these sales. After correction, the aggregate value of sales relating to the Iranian petrochemical sector for the relevant period was
$327,822
and did not require disclosure in the Quarterly Report. Accordingly, the Company did not make further disclosure of these sales in its quarterly report for the period ended September 29, 2017 or in this Annual Report.
Contractual Obligations
The following table summarizes our future contractual obligations as of
December 31, 2017
.
|
|
Less Than
One Year
|
1-3 Years
|
3-5 Years
|
More Than
5 Years
|
Total
|
|||||||||||||||
|
|
(In millions)
|
|||||||||||||||||||
|
Debt
|
$
|
5.8
|
|
$
|
621.3
|
|
$
|
—
|
|
$
|
443.1
|
|
$
|
1,070.2
|
|
|||||
|
Interest payments on debt
(1)
|
32.7
|
|
42.7
|
|
29.7
|
|
33.9
|
|
139.0
|
|
||||||||||
|
Operating leases
|
32.2
|
|
42.6
|
|
24.2
|
|
53.4
|
|
152.4
|
|
||||||||||
|
Capital leases
|
2.5
|
|
0.2
|
|
0.2
|
|
0.3
|
|
3.2
|
|
||||||||||
|
Purchase obligations
(2)
|
250.3
|
|
21.4
|
|
0.1
|
|
—
|
|
271.8
|
|
||||||||||
|
Total
|
$
|
323.5
|
|
$
|
728.2
|
|
$
|
54.2
|
|
$
|
530.7
|
|
$
|
1,636.6
|
|
|||||
|
(1)
|
Variable interest payments are estimated using a static rate of
3.07%
.
|
|
(2)
|
Excludes open purchase orders for goods or services that are provided on demand, the timing of which is not certain.
|
We have funding requirements associated with our pension and other post-retirement benefit plans as of
December 31, 2017
, which are estimated to be
$40.5 million
for the year ending
2018
. Other long-term liabilities, such as those for asbestos and other legal claims, employee benefit plan obligations, deferred income taxes and liabilities for unrecognized income tax benefits, are excluded from the above table since they are not contractually fixed as to timing and amount.
Off-Balance Sheet Arrangements
35
We do not have any off-balance sheet arrangements that provide liquidity, capital resources, market or credit risk support that expose us to any liability that is not reflected in our Consolidated Financial Statements at
December 31, 2017
other than outstanding letters of credit of
$418.8 million
, unconditional purchase obligations with suppliers of
$271.8 million
, and
$152.4 million
of future operating lease payments.
The Company and its subsidiaries have in the past divested certain of its businesses and assets. In connection with these divestitures, certain representations, warranties and indemnities were made to purchasers to cover various risks or unknown liabilities. We cannot estimate the potential liability, if any, that may result from such representations, warranties and indemnities because they relate to unknown and unexpected contingencies; however, we do not believe that any such liabilities will have a material adverse effect on our financial condition, results of operations or liquidity.
Critical Accounting Policies
The methods, estimates and judgments we use in applying our critical accounting policies have a significant impact on our results of operations and financial position. We evaluate our estimates and judgments on an ongoing basis. Our estimates are based upon our historical experience, our evaluation of business and macroeconomic trends and information from other outside sources, as appropriate. Our experience and assumptions form the basis for our judgments about the carrying value of assets and liabilities that are not readily apparent from other sources. Actual results may vary from what our management anticipates and different assumptions or estimates about the future could have a material impact on our results of operations and financial position.
We believe the following accounting policies are the most critical in that they are important to the financial statements and they require the most difficult, subjective or complex judgments in the preparation of the financial statements. For a detailed discussion on the application of these and other accounting policies, see Note 2, “Summary of Significant Accounting Policies” in the accompanying Notes to Consolidated Financial Statements in this Form 10-K.
Asbestos Liabilities and Insurance Assets
Certain subsidiaries are each one of many defendants in a large number of lawsuits that claim personal injury as a result of exposure to asbestos from products manufactured with components that are alleged to have contained asbestos. Such components were acquired from third-party suppliers, and were not manufactured by any of the Company’s subsidiaries nor were the subsidiaries producers or direct suppliers of asbestos. The manufactured products that are alleged to have contained asbestos generally were provided to meet the specifications of the subsidiaries’ customers, including the U.S. Navy.
On September 24, 2017, we entered into the Purchase Agreement with CIRCOR, pursuant to which CIRCOR agreed to purchase certain subsidiaries and assets comprising our Fluid Handling business. Pursuant to the Purchase Agreement, the Company will retain its asbestos-related contingencies and insurance coverages. However, as the Company will not retain an interest in the ongoing operations of the business subject to the contingencies, the Company has classified asbestos-related activity in its Consolidated Statements of Operations as part of Income (loss) from discontinuing operations, net of taxes.
We have projected future asbestos-related liability costs with regard to pending and future unasserted claims based upon the Nicholson methodology. The Nicholson methodology is a standard approach used by experts and has been accepted by numerous courts. This methodology is based upon risk equations, exposed population estimates, mortality rates, and other demographic statistics. In applying the Nicholson methodology for each subsidiary we performed: (1) an analysis of the estimated population likely to have been exposed or claim to have been exposed to products manufactured by the subsidiaries based upon national studies undertaken of the population of workers believed to have been exposed to asbestos; (2) a review of epidemiological and demographic studies to estimate the number of potentially exposed people that would be likely to develop asbestos-related diseases in each year; (3) an analysis of the subsidiaries’ recent claims history to estimate likely filing rates for these diseases and (4) an analysis of the historical asbestos liability costs to develop average values, which vary by disease type, jurisdiction and the nature of claim, to determine an estimate of costs likely to be associated with currently pending and projected asbestos claims. Our projections, based upon the Nicholson methodology, estimate both claims and the estimated cash outflows related to the resolution of such claims for periods up to and including the endpoint of asbestos studies referred to in item (2) above. It is our policy to record a liability for asbestos-related liability costs for the longest period of time that we can reasonably estimate. Accordingly, no accrual has been recorded for any costs which may be paid after the next 15 years.
Projecting future asbestos-related liability costs is subject to numerous variables that are difficult to predict, including, among others, the number of claims that might be received, the type and severity of the disease alleged by each claimant, the latency
36
period associated with asbestos exposure, dismissal rates, costs of medical treatment, the financial resources of other companies that are co-defendants in the claims, funds available in post-bankruptcy trusts, uncertainties surrounding the litigation process from jurisdiction to jurisdiction and from case to case, including fluctuations in the timing of court actions and rulings, and the impact of potential changes in legislative or judicial standards, including potential tort reform. Furthermore, any projections with respect to these variables are subject to even greater uncertainty as the projection period lengthens. These trend factors have both positive and negative effects on the dynamics of asbestos litigation in the tort system and the related best estimate of our asbestos liability, and these effects do not move in linear fashion but rather change over multiple year periods. Accordingly, we monitor these trend factors over time and periodically assess whether an alternative forecast period is appropriate. Taking these factors into account and the inherent uncertainties, we believe that we can reasonably estimate the asbestos-related liability for pending and future claims that will be resolved in the next 15 years and have recorded that liability as our best estimate. While it is reasonably possible that the subsidiaries will incur costs after this period, we do not believe the reasonably possible loss or range of reasonably possible loss is estimable at the current time. Accordingly, no accrual has been recorded for any costs which may be paid after the next 15 years. Defense costs associated with asbestos-related liabilities as well as costs incurred related to litigation against the subsidiaries’ insurers are expensed as incurred.
We assessed the subsidiaries’ existing insurance arrangements and agreements, estimated the applicability of insurance coverage for existing and expected future claims, analyzed publicly available information bearing on the current creditworthiness and solvency of the various insurers, and employed such insurance allocation methodologies as we believed appropriate to ascertain the probable insurance recoveries for asbestos liabilities. The analysis took into account self-insurance retentions, policy exclusions, pending litigation, liability caps and gaps in coverage, existing and potential insolvencies of insurers as well as how legal and defense costs will be covered under the insurance policies.
Each subsidiary has separate insurance coverage acquired prior to our ownership of each independent entity. In our evaluation of the insurance asset, we use differing insurance allocation methodologies for each subsidiary based upon the applicable law pertaining to the affected subsidiary.
Management’s analyses are based on currently known facts and a number of assumptions. However, projecting future events, such as new claims to be filed each year, the average cost of resolving each claim, coverage issues among layers of insurers, the method in which losses will be allocated to the various insurance policies, interpretation of the effect on coverage of various policy terms and limits and their interrelationships, the continuing solvency of various insurance companies, the amount of remaining insurance available, as well as the numerous uncertainties inherent in asbestos litigation could cause the actual liabilities and insurance recoveries to be higher or lower than those projected or recorded which could materially affect our financial condition, results of operations or cash flow.
See Note 16, “Commitments and Contingencies” in the accompanying Notes to Consolidated Financial Statements for additional information regarding our asbestos liabilities and insurance assets.
Retirement Benefits
Pension obligations and other post-retirement benefits are actuarially determined and are affected by several assumptions, including the discount rate, assumed annual rates of return on plan assets, and per capita cost of covered health care benefits. Changes in discount rate and differences from actual results for each assumption will affect the amounts of pension expense and other post-retirement expense recognized in future periods. These assumptions may also have an effect on the amount and timing of future cash contributions. See Note 14, “Defined Benefit Plans” in the accompanying Notes to Consolidated Financial Statements for further information.
Impairment of Goodwill and Indefinite-Lived Intangible Assets
Goodwill represents the costs in excess of the fair value of net assets acquired associated with our acquisitions. Indefinite-lived intangible assets consist of trade names.
We evaluate the recoverability of Goodwill and indefinite-lived intangible assets annually or more frequently if an event occurs or circumstances change in the interim that would more likely than not reduce the fair value of the asset below its carrying amount. Goodwill and indefinite-lived intangible assets are considered to be impaired when the carrying value of a reporting unit or asset exceeds its value.
In the evaluation of Goodwill for impairment, we first assess qualitative factors to determine whether it is more likely than not that the fair value of a reporting entity is less than its carrying value. If we determine that it is not more likely than not for a reporting unit’s fair value to be less than its carrying value, a calculation of the fair value is not performed. If we determine that
37
it is more likely than not for a reporting unit’s fair value to be less than its carrying value, a calculation of the reporting entity’s fair value is performed and compared to the carrying value of that entity. In certain instances, we may elect to forgo the qualitative assessment and proceed directly to the quantitative impairment test. If the carrying value of a reporting unit exceeds its fair value, Goodwill of that reporting unit is impaired. Pursuant to ASU 2017-04, which the Company elected to adopt during the three months ended December 31, 2017, if the carrying value of the reporting unit’s Goodwill is greater than its fair value, an impairment loss is recorded equal to the excess of the carrying value over its fair value.
Generally, we measure fair value of reporting units based on a present value of future discounted cash flows and a market valuation approach. The discounted cash flow models indicate the fair value of the reporting units based on the present value of the cash flows that the reporting units are expected to generate in the future. Significant estimates in the discounted cash flow models include: the weighted average cost of capital; long-term rate of growth and profitability of our business; and working capital effects. The market valuation approach indicates the fair value of the business based on a comparison against certain market information. Significant estimates in the market approach model include identifying appropriate market multiples and assessing earnings before interest, income taxes, depreciation and amortization.
The Company performed an annual qualitative test for both reporting units as of September 26, 2015, which indicated no impairment existed. During 2016, the Company experienced a concurrent decline in numerous end-markets and geographic markets that negatively impacted both of the Company’s reporting units. The Company elected not to perform qualitative assessments of Goodwill and instead, proceeded directly to performing the first step of quantitative Goodwill impairment test for its 2016 annual impairment test. The quantitative impairment assessment of Goodwill for each of the Fabrication Technology, Air and Gas Handling reporting units, based on the methodologies identified above, resulted in calculated fair values that exceeded the carrying values for both reporting units. As such, no impairment charges were recorded as a result of the annual Goodwill impairment analysis performed as of
October 1, 2016
and September 26, 2015.
Due to continued declines in various end markets for the Air and Gas Handling reporting unit, we performed a quantitative analysis for this reporting unit as of September 29, 2017 as part of our annual goodwill impairment testing. The quantitative Goodwill impairment assessment for the Air and Gas Handling reporting unit resulted in a calculated fair value lower than carrying value. As a result, an impairment charge of
$150.2 million
, which equals the excess of the carrying value over the fair value, was recorded. A qualitative assessment of Goodwill was performed for the Fabrication Technology reporting unit for the year ended December 31, 2017, which indicated no impairment existed.
In the evaluation of indefinite-lived intangible assets for impairment, we first assess qualitative factors to determine whether it is more likely than not that the fair value of the indefinite-lived intangible asset is less than its carrying value. If we determine that it is not more likely than not for the indefinite-lived intangible asset’s fair value to be less than its carrying value, a calculation of the fair value is not performed. If we determine that it is more likely than not that the indefinite-lived intangible asset’s fair value is less than its carrying value, a calculation is performed and compared to the carrying value of the asset. If the carrying amount of the indefinite-lived intangible asset exceeds its fair value, an impairment loss is recognized in an amount equal to that excess. We measure the fair value of our indefinite-lived intangible assets using the “relief from royalty” method. Significant estimates in this approach include projected revenues and royalty and discount rates for each trade name evaluated.
From time-to-time, we have identified certain indefinite-lived intangible assets that, due to indicators present at the specific operation associated with the indefinite-lived intangible asset, should be tested for impairment prior to our annual impairment evaluation. Prior to the annual impairment assessment during 2015, due to a decline in anticipated performance at an operation associated with certain intangible assets, we performed an analysis to evaluate if the identified intangible assets might be impaired. The analysis determined an indefinite-lived trade name within our Fabrication Technology segment was impaired based upon relief from royalty measurements and resulted in a
$1.5 million
impairment loss calculated as the difference between the fair value of the asset and its carrying value as of the date of the impairment test. The calculated fair value of the asset was
$2.8 million
and is included in Level Three of the fair value hierarchy.
The annual impairment analysis performed as of
October 1, 2016
and September 26, 2015 for indefinite-lived intangible assets resulted in no impairment charges.
During the annual impairment analysis for the year ended December 31, 2017, quantitative analyses were performed, as of September 29, 2017 for the Air and Gas Handling reporting unit trade names due to continued declines in various end markets. The analyses determined the fair value was lower than carrying value for one trade name, which resulted in an impairment charge of
$2.5 million
for that trade name. The calculated fair value of the trade name was
$11.7 million
and is included in Level Three of the fair value hierarchy. For another indefinite-lived intangible trade name, the analysis determined the fair value was marginally greater than its
$22.1 million
carrying value. A qualitative assessment was performed for the Fabrication Technology reporting unit trade names for the year ended December 31, 2017, which indicated no impairment existed.
38
Impairment charges related to Goodwill and Indefinite-lived intangible assets are included in Goodwill and intangible assets impairment charges in the Consolidated Statements of Income.
The continuation of a sustained decline in our end-markets and geographic markets could increase the risk of impairments in future years. Actual results could differ from our estimates and projections, which would also affect the assessment of impairment. As of December 31,
2017
, we have Goodwill of
$2.5 billion
and indefinite lived trade names of
$407.2 million
that are subject to at least annual review for impairment. See Note 8, “Goodwill and Intangible Assets” in the accompanying Notes to Consolidated Financial Statements for further information.
Income Taxes
We account for income taxes under the asset and liability method, which requires that deferred tax assets and liabilities be recognized using enacted tax rates for the effect of temporary differences between the book and tax bases of recorded assets and liabilities. Deferred tax assets are reduced by a valuation allowance if it is more likely than not that some portion of the deferred tax asset will not be realized. In evaluating the need for a valuation allowance, we take into account various factors, including the expected level of future taxable income and available tax planning strategies. If actual results differ from the assumptions made in the evaluation of our valuation allowance, we record a change in valuation allowance through income tax expense in the period such determination is made.
Accounting Standards Codification 740, “Income Taxes” prescribes a recognition threshold and measurement attribute for a position taken in a tax return. Under this standard, we must presume the income tax position will be examined by a relevant tax authority and determine whether it is more likely than not that the income tax position will be sustained upon examination based on its technical merits. An income tax position that meets the more-likely-than-not recognition threshold is then measured to determine the amount of the benefit to be recognized in the financial statements. Liabilities for unrecognized income tax benefits are reviewed periodically and are adjusted as events occur that affect our estimates, such as the availability of new information, the lapsing of applicable statutes of limitations, the conclusion of tax audits and, if applicable, the conclusion of any court proceedings. To the extent we prevail in matters for which liabilities for unrecognized tax benefits have been established or are required to pay amounts in excess of our liabilities for unrecognized tax benefits, our effective income tax rate in a given period could be materially affected. The Company recognizes interest and penalties related to unrecognized tax benefits in the
Provision for income taxes
in the Consolidated Statements of Income. Net liabilities for unrecognized income tax benefits, including accrued interest and penalties, were
$41.0 million
as of
December 31, 2017
and are included in Other liabilities or as a reduction to deferred tax assets in the accompanying Consolidated Balance Sheet.
On December 22, 2017, the Tax Cuts and Jobs Act of 2017 (the “Tax Act”) was signed into law making significant changes to the Internal Revenue Code which included how the U.S. imposes income tax on multinational corporations. Key changes in the Tax Act which are relevant to the Company and generally effective January 1, 2018 include a flat corporate income tax rate of 21 percent to replace the marginal rates that range from 15 percent to 35 percent, elimination of the corporate alternative minimum tax, the creation of a territorial tax system replacing the worldwide tax system, a one-time tax on accumulated foreign subsidiary earnings (“Transition Tax”) to transition to the territorial system, a “minimum tax” on certain foreign earnings above an enumerated rate of return, a new base erosion anti-abuse tax that subjects certain payments made by a U.S. company to its foreign subsidiary to additional taxes, and an incentive for U.S. companies to sell, lease or license goods and services outside the U.S. by taxing the income at a reduced effective rate. The new tax also imposes limits on executive compensation and interest expense deductions, while permitting the immediate expensing for the cost of new investments in certain property acquired after September 27, 2017.
On December 22, 2017, the SEC issued Staff Accounting Bulletin No. 118 (“SAB 118”) to address the application of U.S. GAAP in situations when a registrant does not have the necessary information available, prepared, or analyzed (including computations) in reasonable detail to complete the accounting for certain income tax effects of the Tax Act. SAB 118 allows registrants to include a provisional amount to account for the implications of the Tax Act where a reasonable estimate can be made and requires the completion of the accounting no later than one year from the date of enactment of the Tax Act or December 22, 2018. Additionally, the Company will file its 2017 U.S. income tax return in the fourth quarter of 2018, which may change our tax basis in temporary differences estimated as of December 31, 2017, which will result in an adjustment to the tax provision to the re-measurement amount recorded in the financial statements.
ASC 740 requires changes in tax rates and tax laws to be accounted for in the period of enactment in continuing operations. Accordingly, of significance, the Company included a provisional estimate of approximately $52 million for the Transition Tax, payable over 8 years. The Company also included a provisional estimate of approximately $55 million tax benefit for the re-measurement of its U.S. deferred tax assets and liabilities to 21 percent. The ultimate impact may differ from these provisional
39
amounts, possibly materially, due to, among other things, additional information necessary to complete the computation and analysis thereof, additional regulatory guidance that may be issued, and actions the Company may take as a result of the Tax Act. The accounting is expected to be complete by December 22, 2018. See Note 7 in these notes to the consolidated financial statements for additional information.
Revenue Recognition
We recognize revenue and costs from product sales when title passes to the buyer and all of the following criteria are met: persuasive evidence of an arrangement exists, the price is fixed or determinable, product delivery has occurred or services have been rendered, there are no further obligations to customers, and collectibility is probable. Product delivery occurs when title and risk of loss transfer to the customer. Our shipping terms vary based on the contract. If any significant obligations to the customer with respect to such sale remain to be fulfilled following shipment, typically involving obligations relating to installation and acceptance by the buyer, revenue recognition is deferred until such obligations have been fulfilled. Any customer allowances and discounts are recorded as a reduction in reported revenues at the time of sale because these allowances reflect a reduction in the sales price for the products sold. These allowances and discounts are estimated based on historical experience and known trends. Revenue related to service agreements is recognized as revenue over the term of the agreement. Progress billings are generally shown as a reduction of Inventories, net unless such billings are in excess of accumulated costs, in which case such balances are included in Customer advances and billings in excess of costs incurred in the Consolidated Balance Sheets.
We recognize revenue and cost of sales on air and gas handling long-term contracts using the “percentage of completion method” in accordance with GAAP. Under this method, contract revenues are recognized over the performance period of the contract in direct proportion to the costs incurred as a percentage of total estimated costs for the entirety of the contract. Any recognized revenues that have not been billed to a customer are recorded as a component of Trade receivables and any billings of customers in excess of recognized revenues are recorded as a component of Customer advances and billings in excess of costs incurred. As of
December 31, 2017
, there were
$219.8 million
of revenues in excess of billings and
$95.9 million
of billings in excess of revenues on long-term contracts in the Consolidated Balance Sheet.
We have contracts in various stages of completion. Such contracts require estimates to determine the appropriate cost and revenue recognition. Significant management judgments and estimates, including estimated costs to complete projects, must be made and used in connection with revenue recognized during each period. Current estimates may be revised as additional information becomes available. The revisions are recorded in income in the period in which they are determined using the cumulative catch-up method of accounting.
We maintain allowances for doubtful accounts for estimated losses resulting from the inability of our customers to make required payments. These allowances are based on recent trends of certain customers estimated to be a greater credit risk as well as general trends of the entire pool of customers. The allowance for doubtful accounts was
$31.5 million
and
$29.0 million
as of
December 31, 2017
and
2016
, respectively. If the financial condition of our customers were to deteriorate, resulting in an impairment of their ability to make payments, additional allowances could be required.
Recently Issued Accounting Pronouncements
For detailed information regarding recently issued accounting pronouncements and the expected impact on our financial statements, see Note 3, “Recently Issued Accounting Pronouncements” in the accompanying Notes to Consolidated Financial Statements included in this Form 10-K.
Item 7A.
Quantitative and Qualitative Disclosures About Market Risk
We are exposed to market risk from changes in short-term interest rates, foreign currency exchange rates and commodity prices that could impact our results of operations and financial condition. We address our exposure to these risks through our normal operating and financing activities. We do not enter into derivative contracts for trading purposes.
Interest Rate Risk
We are subject to exposure from changes in short-term interest rates related to interest payments on our borrowing arrangements. The majority of our borrowings as of
December 31, 2017
, including the DB Credit Agreement and the receivable facility, are variable rate facilities based on LIBOR or EURIBOR. In order to mitigate our interest rate risk, we may enter into interest rate swap or collar agreements. A hypothetical increase in the interest rate of 1.00% during
2017
would have increased Interest expense by approximately
$10.2 million
.
40
Exchange Rate Risk
We have manufacturing sites throughout the world and sell our products globally. As a result, we are exposed to movements in the exchange rates of various currencies against the U.S. dollar and against the currencies of other countries in which we manufacture and sell products and services. During
2017
, approximately
76%
of our sales were derived from operations outside the U.S. We have significant manufacturing operations in European countries that are not part of the Eurozone. Sales revenues are more highly weighted toward the Euro and U.S. dollar. We also have significant contractual obligations in U.S. dollars that are met with cash flows in other currencies as well as U.S. dollars. To better match revenue and expense as well as cash needs from contractual liabilities, we regularly enter into cross currency swaps and forward contracts.
We also face exchange rate risk from our investments in subsidiaries owned and operated in foreign countries. Euro denominated borrowings under the DB Credit Agreement and Euro Notes provide a natural hedge to a portion of our European net asset position. The effect of a change in currency exchange rates on our net investment in international subsidiaries, net of the translation effect of the Company’s Euro denominated borrowings, is reflected in the Accumulated other comprehensive loss component of Equity. A 10% depreciation in major currencies, relative to the U.S. dollar as of
December 31, 2017
(net of the translation effect of our Euro denominated borrowings) would result in a reduction in Equity of approximately
$332 million
.
We also face exchange rate risk from transactions with customers in countries outside the U.S. and from intercompany transactions between affiliates. Although we use the U.S. dollar as our functional currency for reporting purposes, we have manufacturing sites throughout the world, and a substantial portion of our costs are incurred and sales are generated in foreign currencies. Costs incurred and sales recorded by subsidiaries operating outside of the U.S. are translated into U.S. dollars using exchange rates effective during the respective period. As a result, we are exposed to movements in the exchange rates of various currencies against the U.S. dollar.
We have generally accepted the exposure to exchange rate movements in the translation of our financial statements into U.S. dollars without using derivative financial instruments to manage this risk. Both positive and negative movements in currency exchange rates against the U.S. dollar will, therefore, continue to affect the reported amount of sales, profit, assets and liabilities in our Consolidated Financial Statements.
Commodity Price Risk
We are exposed to changes in the prices of raw materials used in our production processes. Commodity futures contracts are periodically used to manage such exposure. As of
December 31, 2017
, our open commodity futures contracts were not material.
See Note 15, “Financial Instruments and Fair Value Measurements” in the accompanying Notes to Consolidated Financial Statements included in this Form 10-K for additional information regarding our derivative instruments.
41
Item 8.
Financial Statements and Supplementary Data
INDEX TO THE CONSOLIDATED FINANCIAL STATEMENTS
|
|
Page
|
|
|
|
|
Report of Independent Registered Public Accounting Firm – Internal Control Over Financial Reporting
|
|
|
Report of Independent Registered Public Accounting Firm – Consolidated Financial Statements
|
|
|
Consolidated Statements of Income
|
|
|
Consolidated Statements of Comprehensive Income (Loss)
|
|
|
Consolidated Balance Sheets
|
|
|
Consolidated Statements of Equity
|
|
|
Consolidated Statements of Cash Flows
|
|
|
Notes to Consolidated Financial Statements
|
|
|
Note 1. Organization and Nature of Operations
|
|
|
Note 2. Summary of Significant Accounting Policies
|
|
|
Note 3. Recently Issued Accounting Pronouncements
|
|
|
Note 4. Discontinued Operations
|
|
|
Note 5. Acquisitions
|
|
|
Note 6. Net Income Per Share from Continuing Operations
|
|
|
Note 7. Income Taxes
|
|
|
Note 8. Goodwill and Intangible Assets
|
|
|
Note 9. Property, Plant and Equipment, Net
|
|
|
Note 10. Inventories, Net
|
|
|
Note 11. Debt
|
|
|
Note 12. Equity
|
|
|
Note 13. Accrued Liabilities
|
|
|
Note 14. Defined Benefit Plans
|
|
|
Note 15. Financial Instruments and Fair Value Measurements
|
|
|
Note 16. Commitments and Contingencies
|
|
|
Note 17. Segment Information
|
|
|
Note 18. Selected Quarterly Data—(unaudited)
|
|
|
Note 19. Subsequent Event
|
|
42
Report of Independent Registered Public Accounting Firm
Internal Control Over Financial Reporting
To the Shareholders and the Board of Directors of Colfax Corporation
Opinion on Internal Control over Financial Reporting
We have audited Colfax Corporation’s internal control over financial reporting as of December 31, 2017, based on criteria established in Internal Control-Integrated Framework issued by the Committee of Sponsoring Organizations of the Treadway Commission (2013 framework), (the COSO criteria). In our opinion, Colfax Corporation (the Company) maintained, in all material respects, effective internal control over financial reporting as of December 31, 2017, based on the COSO criteria.
We also have audited, in accordance with the standards of the Public Company Accounting Oversight Board (United States) (PCAOB), the consolidated balance sheets of Colfax Corporation as of December 31, 2017 and 2016, the related consolidated statements of income, comprehensive income (loss), equity and cash flows for each of the three years in the period ended December 31, 2017, and the related notes and financial statement schedule listed in the Index at Item 15(A)(2) and our report dated
February 16, 2018
expressed an unqualified opinion thereon.
Basis for Opinion
The Company’s management is responsible for maintaining effective internal control over financial reporting and for its assessment of the effectiveness of internal control over financial reporting included in Management’s Annual Report on Internal Control Over Financial Reporting, appearing in Item 9A. Our responsibility is to express an opinion on the Company’s internal control over financial reporting based on our audit. We are a public accounting firm registered with the PCAOB and are required to be independent with respect to the Company in accordance with the U.S. federal securities laws and the applicable rules and regulations of the Securities and Exchange Commission and the PCAOB.
We conducted our audit in accordance with the standards of the PCAOB. Those standards require that we plan and perform the audit to obtain reasonable assurance about whether effective internal control over financial reporting was maintained in all material respects.
Our audit included obtaining an understanding of internal control over financial reporting, assessing the risk that a material weakness exists, testing and evaluating the design and operating effectiveness of internal control based on the assessed risk, and performing such other procedures as we considered necessary in the circumstances. We believe that our audit provides a reasonable basis for our opinion.
Definition and Limitations of Internal Control Over Financial Reporting
A company’s internal control over financial reporting is a process designed to provide reasonable assurance regarding the reliability of financial reporting and the preparation of financial statements for external purposes in accordance with generally accepted accounting principles. A company’s internal control over financial reporting includes those policies and procedures that (1) pertain to the maintenance of records that, in reasonable detail, accurately and fairly reflect the transactions and dispositions of the assets of the company; (2) provide reasonable assurance that transactions are recorded as necessary to permit preparation of financial statements in accordance with generally accepted accounting principles, and that receipts and expenditures of the company are being made only in accordance with authorizations of management and directors of the company; and (3) provide reasonable assurance regarding prevention or timely detection of unauthorized acquisition, use, or disposition of the company’s assets that could have a material effect on the financial statements.
Because of its inherent limitations, internal control over financial reporting may not prevent or detect misstatements. Also, projections of any evaluation of effectiveness to future periods are subject to the risk that controls may become inadequate because of changes in conditions, or that the degree of compliance with the policies or procedures may deteriorate.
/s/ Ernst & Young LLP
Baltimore, Maryland
February 16, 2018
43
Report of Independent Registered Public Accounting Firm
Consolidated Financial Statements
To the Shareholders and the Board of Directors of Colfax Corporation
Opinion on the Financial Statements
We have audited the accompanying consolidated balance sheets of Colfax Corporation (the Company) as of December 31, 2017 and 2016, the related consolidated statements of income, comprehensive income (loss), equity and cash flows for each of the three years in the period ended December 31, 2017, and the related notes and financial statement schedule listed in the Index at Item 15(A)(2) (collectively referred to as the “consolidated financial statements”). In our opinion, the consolidated financial statements present fairly, in all material respects, the financial position of the Company at December 31, 2017 and 2016, and the results of its operations and its cash flows for each of the three years in the period ended December 31, 2017, in conformity with U.S. generally accepted accounting principles.
We also have audited, in accordance with the standards of the Public Company Accounting Oversight Board (United States) (PCAOB), the Company's internal control over financial reporting as of December 31, 2017, based on criteria established in Internal Control-Integrated Framework issued by the Committee of Sponsoring Organizations of the Treadway Commission (2013 framework), and our report dated February 16, 2018 expressed an unqualified opinion thereon.
Basis for Opinion
These financial statements are the responsibility of the Company's management. Our responsibility is to express an opinion on the Company’s financial statements based on our audits. We are a public accounting firm registered with the PCAOB and are required to be independent with respect to the Company in accordance with the U.S. federal securities laws and the applicable rules and regulations of the Securities and Exchange Commission and the PCAOB.
We conducted our audits in accordance with the standards of the PCAOB. Those standards require that we plan and perform the audit to obtain reasonable assurance about whether the financial statements are free of material misstatement, whether due to error or fraud. Our audits included performing procedures to assess the risks of material misstatement of the financial statements, whether due to error or fraud, and performing procedures that respond to those risks. Such procedures included examining, on a test basis, evidence regarding the amounts and disclosures in the financial statements. Our audits also included evaluating the accounting principles used and significant estimates made by management, as well as evaluating the overall presentation of the financial statements. We believe that our audits provide a reasonable basis for our opinion.
/s/ Ernst & Young LLP
We have served as the Company’s auditor since 2000.
Baltimore, Maryland
February 16, 2018
44
COLFAX CORPORATION
Dollars in thousands, except per share amounts
|
Year Ended December 31,
|
|||||||||||
|
2017
|
2016
|
2015
|
|||||||||
|
Net sales
|
$
|
3,300,184
|
|
$
|
3,185,753
|
|
$
|
3,434,352
|
|
||
|
Cost of sales
|
2,270,709
|
|
2,193,371
|
|
2,362,666
|
|
|||||
|
Gross profit
|
1,029,475
|
|
992,382
|
|
1,071,686
|
|
|||||
|
Selling, general and administrative expense
|
732,340
|
|
696,800
|
|
748,340
|
|
|||||
|
Restructuring and other related charges
|
68,351
|
|
58,496
|
|
56,822
|
|
|||||
|
Goodwill and intangible asset impairment charge
|
152,700
|
|
238
|
|
1,486
|
|
|||||
|
Pension settlement loss (gain)
|
46,933
|
|
48
|
|
(582
|
)
|
|||||
|
Operating income
|
29,151
|
|
236,800
|
|
265,620
|
|
|||||
|
Interest expense
|
41,137
|
|
30,276
|
|
47,502
|
|
|||||
|
(Loss) income from continuing operations before income taxes
|
(11,986
|
)
|
206,524
|
|
218,118
|
|
|||||
|
Provision for income taxes
|
42,554
|
|
51,772
|
|
41,168
|
|
|||||
|
Net (loss) income from continuing operations
|
(54,540
|
)
|
154,752
|
|
176,950
|
|
|||||
|
Income (loss) from discontinued operations, net of taxes
|
224,047
|
|
(9,561
|
)
|
10,228
|
|
|||||
|
Net income
|
169,507
|
|
145,191
|
|
187,178
|
|
|||||
|
Less: income attributable to noncontrolling interest, net of taxes
|
18,417
|
|
17,080
|
|
19,439
|
|
|||||
|
Net income attributable to Colfax Corporation
|
$
|
151,090
|
|
$
|
128,111
|
|
$
|
167,739
|
|
||
|
Net (loss) income per share - basic
|
|||||||||||
|
Continuing operations
|
$
|
(0.59
|
)
|
$
|
1.12
|
|
$
|
1.27
|
|
||
|
Discontinued operations
|
$
|
1.82
|
|
$
|
(0.08
|
)
|
$
|
0.08
|
|
||
|
Consolidated operations
|
$
|
1.23
|
|
$
|
1.04
|
|
$
|
1.35
|
|
||
|
Net (loss) income per share - diluted
|
|||||||||||
|
Continuing operations
|
$
|
(0.59
|
)
|
$
|
1.12
|
|
$
|
1.26
|
|
||
|
Discontinued operations
|
$
|
1.81
|
|
$
|
(0.08
|
)
|
$
|
0.08
|
|
||
|
Consolidated operations
|
$
|
1.22
|
|
$
|
1.04
|
|
$
|
1.34
|
|
||
See Notes to Consolidated Financial Statements.
45
COLFAX CORPORATION
CONSOLIDATED STATEMENTS OF COMPREHENSIVE INCOME (LOSS)
Dollars in thousands
|
Year Ended December 31,
|
|||||||||||
|
2017
|
2016
|
2015
|
|||||||||
|
Net income
|
$
|
169,507
|
|
$
|
145,191
|
|
$
|
187,178
|
|
||
|
Other comprehensive income (loss):
|
|||||||||||
|
Foreign currency translation, net of tax of $(2,433), $0, and $751
|
269,432
|
|
(330,488
|
)
|
(317,909
|
)
|
|||||
|
Unrealized (loss) gain on hedging activities, net of tax of $(19,569), $(8,989), and $19,349
|
(23,593
|
)
|
17,692
|
|
11,659
|
|
|||||
|
Unrealized gain on available-for-sale securities, net of tax of $2,808, $0, and $0
|
5,152
|
|
—
|
|
—
|
|
|||||
|
Changes in unrecognized pension and other post-retirement benefit cost, net of tax of $4,882, $9,247, and $6,373
|
4,167
|
|
4,810
|
|
29,323
|
|
|||||
|
Changes in deferred tax related to pension and other post-retirement benefit cost
|
—
|
|
—
|
|
3,817
|
|
|||||
|
Amounts reclassified from Accumulated other comprehensive loss:
|
|||||||||||
|
Amortization of pension and other post-retirement net actuarial loss, net of tax of $2,463, $3,049, and $3,744
|
6,875
|
|
4,465
|
|
7,167
|
|
|||||
|
Amortization of pension and other post-retirement prior service cost, net of tax of $37, $93, and $115
|
93
|
|
155
|
|
133
|
|
|||||
|
Divestiture-related recognition of pension and other post-retirement cost and foreign currency translation, net of tax of $27,518, $0, and $0
|
167,857
|
|
—
|
|
—
|
|
|||||
|
Foreign currency translation adjustment resulting from Venezuela deconsolidation
|
—
|
|
2,378
|
|
—
|
|
|||||
|
Other comprehensive income (loss)
|
429,983
|
|
(300,988
|
)
|
(265,810
|
)
|
|||||
|
Comprehensive income (loss)
|
599,490
|
|
(155,797
|
)
|
(78,632
|
)
|
|||||
|
Less: comprehensive income (loss) attributable to noncontrolling interest
|
34,427
|
|
17,722
|
|
(3,347
|
)
|
|||||
|
Comprehensive income (loss) attributable to Colfax Corporation
|
$
|
565,063
|
|
$
|
(173,519
|
)
|
$
|
(75,285
|
)
|
||
See Notes to Consolidated Financial Statements.
46
COLFAX CORPORATION
Dollars in thousands, except share amounts
|
December 31,
|
|||||||
|
2017
|
2016
|
||||||
|
ASSETS
|
|||||||
|
CURRENT ASSETS:
|
|||||||
|
Cash and cash equivalents
|
$
|
262,019
|
|
$
|
208,814
|
|
|
|
Short term investments
|
149,608
|
|
—
|
|
|||
|
Trade receivables, less allowance for doubtful accounts of $31,488 and $29,005
|
970,199
|
|
838,796
|
|
|||
|
Inventories, net
|
429,627
|
|
364,972
|
|
|||
|
Other current assets
|
258,379
|
|
175,721
|
|
|||
|
Current portion of assets held for sale
|
—
|
|
150,275
|
|
|||
|
Total current assets
|
2,069,832
|
|
1,738,578
|
|
|||
|
Property, plant and equipment, net
|
552,802
|
|
505,431
|
|
|||
|
Goodwill
|
2,538,544
|
|
2,350,996
|
|
|||
|
Intangible assets, net
|
1,017,203
|
|
916,347
|
|
|||
|
Other assets
|
531,316
|
|
520,031
|
|
|||
|
Assets held for sale, less current portion
|
—
|
|
307,057
|
|
|||
|
Total assets
|
$
|
6,709,697
|
|
$
|
6,338,440
|
|
|
|
LIABILITIES AND EQUITY
|
|||||||
|
CURRENT LIABILITIES:
|
|||||||
|
Current portion of long-term debt
|
$
|
5,766
|
|
$
|
5,406
|
|
|
|
Accounts payable
|
587,129
|
|
515,520
|
|
|||
|
Customer advances and billings in excess of costs incurred
|
145,853
|
|
140,220
|
|
|||
|
Accrued liabilities
|
358,632
|
|
311,326
|
|
|||
|
Current portion of liabilities held for sale
|
—
|
|
87,183
|
|
|||
|
Total current liabilities
|
1,097,380
|
|
1,059,655
|
|
|||
|
Long-term debt, less current portion
|
1,055,305
|
|
1,286,738
|
|
|||
|
Other liabilities
|
829,748
|
|
732,729
|
|
|||
|
Liabilities held for sale, less current portion
|
—
|
|
165,974
|
|
|||
|
Total liabilities
|
2,982,433
|
|
3,245,096
|
|
|||
|
Equity:
|
|||||||
|
Common stock, $0.001 par value; 400,000,000 shares authorized; 123,245,827 and 122,780,261 issued and outstanding
|
123
|
|
123
|
|
|||
|
Additional paid-in capital
|
3,228,174
|
|
3,199,682
|
|
|||
|
Retained earnings
|
846,490
|
|
685,411
|
|
|||
|
Accumulated other comprehensive loss
|
(574,372
|
)
|
(988,345
|
)
|
|||
|
Total Colfax Corporation equity
|
3,500,415
|
|
2,896,871
|
|
|||
|
Noncontrolling interest
|
226,849
|
|
196,473
|
|
|||
|
Total equity
|
3,727,264
|
|
3,093,344
|
|
|||
|
Total liabilities and equity
|
$
|
6,709,697
|
|
$
|
6,338,440
|
|
|
See Notes to Consolidated Financial Statements.
47
COLFAX CORPORATION
CONSOLIDATED STATEMENTS OF EQUITY
Dollars in thousands, except share amounts and as noted
|
Common Stock
|
Additional Paid-In Capital
|
Retained Earnings
|
Accumulated Other Comprehensive Loss
|
Noncontrolling Interest
|
Total
|
|||||||||||||||
|
Shares
|
$ Amount
|
|||||||||||||||||||
|
Balance at January 1, 2015
|
123,730,578
|
|
$
|
124
|
|
$
|
3,200,832
|
|
$
|
389,561
|
|
$
|
(443,691
|
)
|
$
|
205,618
|
|
$
|
3,352,444
|
|
|
Net income
|
—
|
|
—
|
|
—
|
|
167,739
|
|
—
|
|
19,439
|
|
187,178
|
|
||||||
|
Distributions to noncontrolling owners
|
—
|
|
—
|
|
—
|
|
—
|
|
—
|
|
(15,690
|
)
|
(15,690
|
)
|
||||||
|
Other comprehensive loss, net of tax of $26.2 million and $0.4 million
|
—
|
|
—
|
|
—
|
|
—
|
|
(243,024
|
)
|
(22,786
|
)
|
(265,810
|
)
|
||||||
|
Stock repurchase
|
(986,279
|
)
|
(1
|
)
|
(27,366
|
)
|
—
|
|
—
|
|
—
|
|
(27,367
|
)
|
||||||
|
Common stock-based award activity
|
676,126
|
|
—
|
|
22,373
|
|
—
|
|
—
|
|
—
|
|
22,373
|
|
||||||
|
Contribution to defined benefit pension plan
|
66,000
|
|
—
|
|
3,428
|
|
—
|
|
—
|
|
—
|
|
3,428
|
|
||||||
|
Balance at December 31, 2015
|
123,486,425
|
|
123
|
|
3,199,267
|
|
557,300
|
|
(686,715
|
)
|
186,581
|
|
3,256,556
|
|
||||||
|
Net income
|
—
|
|
—
|
|
—
|
|
128,111
|
|
—
|
|
17,080
|
|
145,191
|
|
||||||
|
Distributions to noncontrolling owners
|
—
|
|
—
|
|
—
|
|
—
|
|
—
|
|
(7,830
|
)
|
(7,830
|
)
|
||||||
|
Other comprehensive (loss) income, net of tax of $3.4 million
|
—
|
|
—
|
|
—
|
|
—
|
|
(301,630
|
)
|
642
|
|
(300,988
|
)
|
||||||
|
Stock repurchase
|
(1,000,000
|
)
|
(1
|
)
|
(20,811
|
)
|
—
|
|
—
|
|
—
|
|
(20,812
|
)
|
||||||
|
Common stock-based award activity
|
293,836
|
|
1
|
|
21,226
|
|
—
|
|
—
|
|
—
|
|
21,227
|
|
||||||
|
Balance at December 31, 2016
|
122,780,261
|
|
123
|
|
3,199,682
|
|
685,411
|
|
(988,345
|
)
|
196,473
|
|
3,093,344
|
|
||||||
|
Cumulative effect of accounting change
|
—
|
|
—
|
|
—
|
|
9,989
|
|
—
|
|
—
|
|
9,989
|
|
||||||
|
Net income
|
—
|
|
—
|
|
—
|
|
151,090
|
|
—
|
|
18,417
|
|
169,507
|
|
||||||
|
Distributions to noncontrolling owners
|
—
|
|
—
|
|
—
|
|
—
|
|
—
|
|
(4,051
|
)
|
(4,051
|
)
|
||||||
|
Other comprehensive income, net of tax of $15.7 million
|
—
|
|
—
|
|
—
|
|
—
|
|
413,973
|
|
16,010
|
|
429,983
|
|
||||||
|
Common stock-based award activity
|
465,566
|
|
—
|
|
28,492
|
|
—
|
|
—
|
|
—
|
|
28,492
|
|
||||||
|
Balance at December 31, 2017
|
123,245,827
|
|
$
|
123
|
|
$
|
3,228,174
|
|
$
|
846,490
|
|
$
|
(574,372
|
)
|
$
|
226,849
|
|
$
|
3,727,264
|
|
See Notes to Consolidated Financial Statements.
48
COLFAX CORPORATION
Dollars in thousands
|
Year Ended December 31,
|
|||||||||||
|
2017
|
2016
|
2015
|
|||||||||
|
Cash flows from operating activities:
|
|||||||||||
|
Net income
|
$
|
169,507
|
|
$
|
145,191
|
|
$
|
187,178
|
|
||
|
Adjustments to reconcile net income to net cash provided by operating activities:
|
|||||||||||
|
Impairment of goodwill, intangibles and property, plant and equipment
|
183,751
|
|
6,082
|
|
12,505
|
|
|||||
|
Depreciation and amortization
|
132,203
|
|
137,176
|
|
142,037
|
|
|||||
|
Stock-based compensation expense
|
21,548
|
|
19,020
|
|
16,321
|
|
|||||
|
Non-cash interest expense
|
4,519
|
|
4,176
|
|
10,101
|
|
|||||
|
Deferred income tax expense (benefit)
|
12,066
|
|
(1,682
|
)
|
(22,717
|
)
|
|||||
|
Gain on sale of facility
|
(11,243
|
)
|
—
|
|
—
|
|
|||||
|
Gain on sale of business
|
(308,388
|
)
|
—
|
|
—
|
|
|||||
|
Pension settlement loss
|
46,933
|
|
—
|
|
—
|
|
|||||
|
Changes in operating assets and liabilities:
|
|||||||||||
|
Trade receivables, net
|
(44,345
|
)
|
(50,958
|
)
|
64,048
|
|
|||||
|
Inventories, net
|
(34,023
|
)
|
19,665
|
|
(390
|
)
|
|||||
|
Accounts payable
|
10,266
|
|
37,083
|
|
965
|
|
|||||
|
Customer advances and billings in excess of costs incurred
|
(24,388
|
)
|
(37,210
|
)
|
(21,094
|
)
|
|||||
|
Changes in other operating assets and liabilities
|
60,364
|
|
(31,569
|
)
|
(85,141
|
)
|
|||||
|
Net cash provided by operating activities
|
218,770
|
|
246,974
|
|
303,813
|
|
|||||
|
Cash flows from investing activities:
|
|||||||||||
|
Purchases of fixed assets
|
(68,765
|
)
|
(63,251
|
)
|
(69,877
|
)
|
|||||
|
Acquisitions, net of cash received
|
(346,764
|
)
|
(25,992
|
)
|
(196,007
|
)
|
|||||
|
Proceeds from sale of business, net
|
490,308
|
|
—
|
|
—
|
|
|||||
|
Other, net
|
15,097
|
|
7,249
|
|
18,927
|
|
|||||
|
Net cash provided by (used in) investing activities
|
89,876
|
|
(81,994
|
)
|
(246,957
|
)
|
|||||
|
Cash flows from financing activities:
|
|||||||||||
|
Borrowings under term credit facility
|
—
|
|
—
|
|
750,000
|
|
|||||
|
Payments under term credit facility
|
(65,628
|
)
|
(37,500
|
)
|
(1,232,872
|
)
|
|||||
|
Proceeds from borrowings on revolving credit facilities and other
|
1,046,457
|
|
896,742
|
|
1,498,039
|
|
|||||
|
Repayments of borrowings on revolving credit facilities and other
|
(1,632,658
|
)
|
(978,024
|
)
|
(1,104,055
|
)
|
|||||
|
Proceeds from borrowings on senior unsecured notes
|
374,450
|
|
—
|
|
—
|
|
|||||
|
Proceeds from issuance of common stock, net
|
6,944
|
|
2,206
|
|
6,052
|
|
|||||
|
Repurchases of common stock
|
—
|
|
(20,812
|
)
|
(27,367
|
)
|
|||||
|
Other
|
(10,012
|
)
|
(7,830
|
)
|
(21,066
|
)
|
|||||
|
Net cash used in financing activities
|
(280,447
|
)
|
(145,218
|
)
|
(131,269
|
)
|
|||||
|
Effect of foreign exchange rates on Cash and cash equivalents
|
12,090
|
|
4,499
|
|
(33,566
|
)
|
|||||
|
Increase (decrease) in Cash and cash equivalents
|
40,289
|
|
24,261
|
|
(107,979
|
)
|
|||||
|
Cash and cash equivalents, beginning of period
|
221,730
|
|
197,469
|
|
305,448
|
|
|||||
|
Cash and cash equivalents, end of period
|
$
|
262,019
|
|
$
|
221,730
|
|
$
|
197,469
|
|
||
|
Supplemental Disclosure of Cash Flow Information:
|
|||||||||||
|
Non-cash consideration received from sale of business
|
$
|
206,415
|
|
$
|
—
|
|
$
|
—
|
|
||
See Notes to Consolidated Financial Statements.
49
COLFAX CORPORATION
NOTES TO CONSOLIDATED FINANCIAL STATEMENTS
1. Organization and Nature of Operations
Colfax Corporation (the “Company” or “Colfax”) is a leading diversified industrial technology company that provides air and gas handling and fabrication technology products and services to customers around the world under the Howden and ESAB brands.
Sale of Fluid Handling Business
On December 11, 2017, the Company completed the sale of its Fluid Handling business (“Fluid Handling”) to CIRCOR International, Inc., a Delaware corporation (“CIRCOR” or the “Buyer”), pursuant to a definitive purchase agreement (the “Purchase Agreement”) signed on September 24, 2017. See Note 4, “Discontinued Operations” for further information.
2. Summary of Significant Accounting Policies
Principles of Consolidation
The Company’s Consolidated Financial Statements include the accounts of the Company and its subsidiaries. Less than wholly owned subsidiaries, including joint ventures, are consolidated when it is determined that the Company has a controlling financial interest, which is generally determined when the Company holds a majority voting interest. When protective rights, substantive rights or other factors exist, further analysis is performed in order to determine whether or not there is a controlling financial interest. The Consolidated Financial Statements reflect the assets, liabilities, revenues and expenses of consolidated subsidiaries and the noncontrolling parties’ ownership share is presented as a noncontrolling interest. All significant intercompany accounts and transactions have been eliminated.
During the year ended December 31, 2016, the Company determined that an other-than-temporary lack of exchangeability between the Venezuelan bolivar and U.S. dollar, due to government controls, has restricted the Company’s Venezuelan operations’ ability to pay dividends and satisfy other obligations denominated in U.S. dollars. In addition, other government-imposed restrictions affecting labor, production, and distribution are prohibiting the Company from controlling key operating decisions. These circumstances have caused the Company to no longer meet the accounting criteria of control in order to continue consolidating its Venezuelan operations. Therefore, the Company deconsolidated the financial statements of its Venezuelan operations as of September 30, 2016. As a result of the deconsolidation, the Company recorded a charge of
$2.4 million
, of which
$0.5 million
is included in Selling, general and administrative expense and
$1.9 million
is included in Income (loss) from discontinued operations, net of taxes, for the year ended December 31, 2016. Substantially all of this amount related to accumulated foreign currency translation charges previously included in Accumulated other comprehensive loss. Due to loss of control, the Company has applied the cost method of accounting for its Venezuelan operations beginning on September 30, 2016. Prior to, and at the date of deconsolidation, the Company’s Venezuelan operations represented
less than 1%
of the Company’s net assets, revenues and operating income.
Equity Method Investments
Investments in joint ventures, where the Company has a significant influence but not a controlling interest, are accounted for using the equity method of accounting. Investments accounted for under the equity method are initially recorded at the amount of the Company’s initial investment and adjusted each period for the Company’s share of the investee’s income or loss and dividends paid. All equity investments are reviewed periodically for indications of other than temporary impairment, including, but not limited to, significant and sustained decreases in quoted market prices or a series of historic and projected operating losses by investees. If the decline in fair value is considered to be other than temporary, an impairment loss is recorded and the investment is written down to a new carrying value. Investments in joint ventures acquired in a business combination are recognized in the opening balance sheet at fair value.
Revenue Recognition
The Company generally recognizes revenues and costs from product sales when all of the following criteria are met: persuasive evidence of an arrangement exists, the price is fixed or determinable, product delivery has occurred or services have been rendered, there are no further obligations to customers, and collectibility is reasonably assured. Product delivery occurs when title and risk of loss transfer to the customer. The Company’s shipping terms vary based on the contract. If any significant obligations to the customer with respect to such sale remain to be fulfilled following shipments, typically involving obligations relating to installation and acceptance by the buyer, revenue recognition is deferred until such obligations have been fulfilled. Any customer allowances
50
COLFAX CORPORATION
NOTES TO CONSOLIDATED FINANCIAL STATEMENTS — (Continued)
and discounts are recorded as a reduction in reported revenues at the time of sale because these allowances reflect a reduction in the sales price for the products sold. These allowances and discounts are estimated based on historical experience and known trends. Revenue related to service agreements is recognized as revenue over the term of the agreement. Progress billings are generally shown as a reduction of Inventories, net unless such billings are in excess of accumulated costs, in which case such balances are included in
Customer advances and billings in excess of costs incurred
in the Consolidated Balance Sheets.
The Company recognizes revenue and cost of sales on air and gas handling long-term contracts using the “percentage of completion method” in accordance with accounting principles generally accepted in the United States of America (“GAAP”). Under this method, contract revenues are recognized over the performance period of the contract in direct proportion to the costs incurred as a percentage of total estimated costs for the entirety of the contract. Any recognized revenues that have not been billed to a customer are recorded as a component of Trade receivables and any billings of customers in excess of recognized revenues are recorded as a component of Customer advances and billings in excess of costs incurred. As of
December 31, 2017
, there were
$219.8 million
of revenues in excess of billings and
$95.9 million
of billings in excess of revenues on long-term contracts in the Consolidated Balance Sheet. As of
December 31, 2016
, there were
$174.9 million
of revenues in excess of billings and
$108.2 million
of billings in excess of revenues on long-term contracts in the Consolidated Balance Sheet.
The Company has contracts in various stages of completion. Such contracts require estimates to determine the appropriate cost and revenue recognition. Significant management judgments and estimates, including estimated costs to complete projects, must be made and used in connection with revenue recognized during each period. Current estimates may be revised as additional information becomes available. The revisions are recorded in income in the period in which they are determined using the cumulative catch-up method of accounting. See Note 17, “Segment Information” for sales by major product group.
Amounts billed for shipping and handling are recorded as revenue. Shipping and handling expenses are recorded as a component of Cost of sales.
Taxes Collected from Customers and Remitted to Governmental Authorities
The Company collects various taxes and fees as an agent in connection with the sale of products and remits these amounts to the respective taxing authorities. These taxes and fees have been presented on a net basis in the Consolidated Statements of Income and are recorded as a component of Accrued liabilities in the Consolidated Balance Sheets until remitted to the respective taxing authority.
Research and Development Expense
Research and development costs of
$42.9 million
,
$39.3 million
and
$38.0 million
for the years ended December 31,
2017
,
2016
and
2015
, respectively, are expensed as incurred and are included in Selling, general and administrative expense in the Consolidated Statements of Income. These amounts do not include development and application engineering costs incurred in conjunction with fulfilling customer orders and executing customer projects.
Interest Expense, Net
Interest expense, net includes interest income of
$7.8 million
,
$6.6 million
and
$5.0 million
for the years ended December 31,
2017
,
2016
and
2015
, respectively, primarily associated with interest bearing deposits in certain foreign subsidiaries.
Cash and Cash Equivalents
Cash and cash equivalents include all financial instruments purchased with an initial maturity of three months or less.
Short Term Investments
Short term investments include the CIRCOR Shares received as part of the consideration received for the sale of Fluid Handling. The investments are classified as available-for-sale securities and are measured at fair value at the end of each reporting period, with any changes in fair value included in Other comprehensive income (loss).
51
COLFAX CORPORATION
NOTES TO CONSOLIDATED FINANCIAL STATEMENTS — (Continued)
Trade Receivables
Trade receivables are presented net of an allowance for doubtful accounts. The Company records an allowance for doubtful accounts based upon estimates of amounts deemed uncollectible and a specific review of significant delinquent accounts, factoring in current and expected economic conditions. Estimated losses are based on historical collection experience, and are reviewed periodically by management.
Inventories
Inventories, net include the cost of material, labor and overhead and are stated at the lower of cost (determined under various methods including average cost, last-in, first-out and first-in, first-out, but predominantly first-in, first-out) or net realizable value. For air and gas handling long-term contracts, cost is primarily determined based upon actual cost. The Company periodically reviews its quantities of inventories on hand and compares these amounts to the expected usage of each particular product. The Company records as a charge to Cost of sales any amounts required to reduce the carrying value of inventories to net realizable value.
Property, Plant and Equipment
Property, plant and equipment, net are stated at historical cost, which includes the fair values of such assets acquired. Depreciation of property, plant and equipment is recorded on a straight-line basis over estimated useful lives. Assets recorded under capital leases are amortized over the shorter of their estimated useful lives or the lease terms, which range from
three to 15 years
. Repair and maintenance expenditures are expensed as incurred unless the repair extends the useful life of the asset.
Impairment of Goodwill and Indefinite-Lived Intangible Assets
Goodwill represents the costs in excess of the fair value of net assets acquired associated with acquisitions by the Company. Indefinite-lived intangible assets consist of trade names.
The Company evaluates the recoverability of Goodwill and indefinite-lived intangible assets annually or more frequently if an event occurs or circumstances change in the interim that would more likely than not reduce the fair value of the asset below its carrying amount. Goodwill and indefinite-lived intangible assets are considered to be impaired when the carrying value of a reporting unit or asset exceeds its fair value. The Company currently has two reporting units: Air and Gas Handling and Fabrication Technology.
In the evaluation of Goodwill for impairment, the Company first assesses qualitative factors to determine whether it is more likely than not that the fair value of a reporting entity is less than its carrying value. If the Company determines that it is not more likely than not for a reporting unit’s fair value to be less than its carrying value, a calculation of the fair value is not performed. If the Company determines that it is more likely than not for a reporting unit’s fair value to be less than its carrying value, a calculation of the reporting entity’s fair value is performed and compared to the carrying value of that entity. In certain instances, the Company may elect to forgo the qualitative assessment and proceed directly to the quantitative impairment test. If the carrying value of a reporting unit exceeds its fair value, Goodwill of that reporting unit is impaired. In this case, pursuant to ASU 2017-04, which the Company elected to early adopt during the three months ended December 31, 2017, an impairment loss is recorded equal to the excess of the reporting unit’s carrying value over its fair value.
Generally, the Company measures fair value of reporting units based on a present value of future discounted cash flows and a market valuation approach. The discounted cash flow models indicate the fair value of the reporting units based on the present value of the cash flows that the reporting units are expected to generate in the future. Significant estimates in the discounted cash flow models include: the weighted average cost of capital; long-term rate of growth and profitability of our business; and working capital effects. The market valuation approach indicates the fair value of the business based on a comparison against certain market information. Significant estimates in the market approach model include identifying appropriate market multiples and assessing earnings before interest, income taxes, depreciation and amortization.
During the annual impairment analysis for the year ended December 31, 2017, due to continued declines in various end markets for the Air and Gas Handling reporting unit, the Company decided to perform a quantitative analysis for this reporting unit as of September 29, 2017. The quantitative Goodwill impairment assessment for the Air and Gas Handling reporting unit resulted in a calculated fair value lower than carrying value. As a result, an impairment charge of
$150.2 million
, which equals
52
COLFAX CORPORATION
NOTES TO CONSOLIDATED FINANCIAL STATEMENTS — (Continued)
the excess of the carrying value over the fair value, was recorded. A qualitative assessment of Goodwill was performed for the Fabrication Technology reporting unit for the year ended December 31, 2017, which indicated no impairment existed.
In the evaluation of indefinite-lived intangible assets for impairment, the Company first assesses qualitative factors to determine whether it is more likely than not that the fair value of the indefinite-lived intangible asset is less than its carrying value. If the Company determines that it is not more likely than not for the indefinite-lived intangible asset’s fair value to be less than its carrying value, a calculation of the fair value is not performed. If the Company determines that it is more likely than not that the indefinite-lived intangible asset’s fair value is less than its carrying value, a calculation is performed and compared to the carrying value of the asset. If the carrying amount of the indefinite-lived intangible asset exceeds its fair value, an impairment loss is recognized in an amount equal to that excess. The Company measures the fair value of its indefinite-lived intangible assets using the “relief from royalty” method. Significant estimates in this approach include projected revenues and royalty and discount rates for each trade name evaluated.
From time-to-time, the Company has identified certain indefinite-lived intangible assets that, due to indicators present at the specific operation associated with the indefinite-lived intangible asset, should be tested for impairment prior to the annual impairment evaluation. During the year ended December 31, 2015, an analysis was performed to evaluate certain intangible assets related to a specific operation within the Company due to a decline in anticipated performance at the operation associated with those assets. The analysis determined an indefinite-lived trade name within the Company’s Fabrication Technology segment was impaired based upon relief from royalty measurements and resulted in a
$1.5 million
impairment loss calculated as the difference between the fair value of the asset and its carrying value as of the date of the impairment test. The calculated fair value of the asset was
$2.8 million
and is included in Level Three of the fair value hierarchy.
The analyses performed as of
October 1, 2016
and September 26, 2015 resulted in no impairment charges.
During the annual impairment analysis for the year ended December 31, 2017, quantitative analyses were performed, as of September 29, 2017, for the Air and Gas Handling reporting unit trade names due to continued declines in various end markets. The analyses determined the fair value was lower than carrying value for one indefinite-lived trade name, which resulted in an impairment charge of
$2.5 million
for that trade name. The calculated fair value of the trade name was
$11.7 million
and is included in Level Three of the fair value hierarchy. For another indefinite-lived intangible trade name, the analysis determined the fair value was marginally greater than its
$22.1 million
carrying value. A qualitative assessment was performed for the Fabrication Technology reporting unit trade names for the year ended December 31, 2017, which indicated no impairment existed.
Impairment charges related to Goodwill and Indefinite-lived intangible assets are included in Goodwill and intangible assets impairment charges in the Consolidated Statements of Income.
Impairment of Long-Lived Assets Other than Goodwill and Indefinite-Lived Intangible Assets
Intangible assets primarily represent acquired customer relationships, acquired order backlog, acquired technology and software license agreements. Acquired order backlog is amortized in the same period the corresponding revenue is recognized. A portion of the Company’s acquired customer relationships is being amortized on an accelerated basis over periods ranging from
seven to 30 years
based on the present value of the future cash flows expected to be generated from the acquired customers. All other intangible assets are being amortized on a straight-line basis over their estimated useful lives, generally ranging from
two to 20 years
.
The Company assesses its long-lived assets other than Goodwill and indefinite-lived intangible assets for impairment whenever facts and circumstances indicate that the carrying amounts may not be fully recoverable. To analyze recoverability, the Company projects undiscounted net future cash flows over the remaining lives of such assets. If these projected cash flows are less than the carrying amounts, an impairment loss would be recognized, resulting in a write-down of the assets with a corresponding charge to earnings. The impairment loss is measured based upon the difference between the carrying amounts and the fair values of the assets. Assets to be disposed of are reported at the lower of the carrying amounts or fair value less cost to sell. Management determines fair value using the discounted cash flow method or other accepted valuation techniques.
The Company recorded asset impairment losses related to facility closures totaling
$31.0 million
,
$2.6 million
and
$9.3 million
during the years ended
December 31, 2017
,
2016
and
2015
, respectively, as a component of Restructuring and other related charges in the Consolidated Statements of Income. The aggregate carrying value of these assets subsequent to impairment was
$53.7 million
,
$2.7 million
and
$21.1 million
for the years ended
December 31, 2017
,
2016
and
2015
, respectively.
53
COLFAX CORPORATION
NOTES TO CONSOLIDATED FINANCIAL STATEMENTS — (Continued)
Derivatives
The Company is subject to foreign currency risk associated with the translation of the net assets of foreign subsidiaries to United States (“U.S.”) dollars on a periodic basis. The Company issued senior unsecured notes with an aggregate principal amount of
€350 million
(as defined and further discussed in Note 11, “Debt”) during the year ended
December 31, 2017
, which has been designated as a net investment hedge in order to mitigate a portion of this risk.
Derivative instruments are generally recognized on a gross basis in the Consolidated Balance Sheets in either Other current assets, Other assets, Accrued liabilities or Other liabilities depending upon their respective fair values and maturity dates. The Company designates a portion of its foreign exchange contracts as cash flow hedges and fair value hedges. For all instruments designated as hedges, including net investment hedges, cash flow hedges and fair value hedges, the Company formally documents the relationship between the hedging instrument and the hedged item, as well as the risk management objective and the strategy for using the hedging instrument. The Company assesses whether the relationship between the hedging instrument and the hedged item is highly effective at offsetting changes in the fair value both at inception of the hedging relationship and on an ongoing basis. For cash flow hedges and net investment hedges, unrealized gains and losses are recognized as a component of Accumulated other comprehensive loss in the Consolidated Balance Sheets to the extent that it is effective at offsetting the change in the fair value of the hedged item and realized gains and losses are recognized in the Consolidated Statements of Income consistent with the underlying hedged instrument. Gains and losses related to fair value hedges are recorded as an offset to the fair value of the underlying asset or liability, primarily Trade receivables and Accounts payable in the Consolidated Balance Sheets.
The Company does not enter into derivative contracts for trading purposes.
See Note 15, “Financial Instruments and Fair Value Measurements” for additional information regarding the Company’s derivative instruments.
Warranty Costs
Estimated expenses related to product warranties are accrued as the revenue is recognized on products sold to customers and included in Cost of sales in the Consolidated Statements of Income. Estimates are established using historical information as to the nature, frequency, and average costs of warranty claims.
The activity in the Company’s warranty liability, which is included in Accrued liabilities and Other liabilities in the Company’s Consolidated Balance Sheets, consisted of the following:
|
Year Ended
|
|||||||
|
2017
|
2016
|
||||||
|
(In thousands)
|
|||||||
|
Warranty liability, beginning of period
|
$
|
30,222
|
|
$
|
35,634
|
|
|
|
Accrued warranty expense
|
17,760
|
|
17,368
|
|
|||
|
Changes in estimates related to pre-existing warranties
|
1,453
|
|
4,701
|
|
|||
|
Cost of warranty service work performed
|
(22,600
|
)
|
(27,429
|
)
|
|||
|
Acquisitions
|
5,277
|
|
304
|
|
|||
|
Foreign exchange translation effect
|
2,065
|
|
(356
|
)
|
|||
|
Warranty liability, end of period
|
$
|
34,177
|
|
$
|
30,222
|
|
|
Income Taxes
Income taxes for the Company are accounted for under the asset and liability method. Deferred income tax assets and liabilities are recognized for the future tax consequences attributable to differences between the carrying amounts of existing assets and liabilities in the Consolidated Financial Statements and their respective tax basis. Deferred income tax assets and liabilities are measured using enacted tax rates expected to be applied to taxable income in the years in which those temporary differences are expected to be recovered or settled. Deferred income tax assets and liabilities are reported in Other assets and Other liabilities in the Company’s Consolidated Balance Sheets, respectively. The effect on deferred income tax assets and liabilities of a change in tax rates is generally recognized in
Provision for income taxes
in the period that includes the enactment date.
54
COLFAX CORPORATION
NOTES TO CONSOLIDATED FINANCIAL STATEMENTS — (Continued)
Valuation allowances are recorded if it is more likely than not that some portion of the deferred income tax assets will not be realized. In evaluating the need for a valuation allowance, the Company takes into account various factors, including the expected level of future taxable income and available tax planning strategies. Any changes in judgment about the valuation allowance are recorded through
Provision for income taxes
and are based on changes in facts and circumstances regarding realizability of deferred tax assets.
The Company must presume that an income tax position taken in a tax return will be examined by the relevant tax authority and determine whether it is more likely than not that the tax position will be sustained upon examination based upon the technical merits of the position. An income tax position that meets the more-likely-than-not recognition threshold is measured to determine the amount of benefit to recognize in the financial statements. The Company establishes a liability for unrecognized income tax benefits for income tax positions for which it is more likely than not that a tax position will not be sustained upon examination by the respective taxing authority to the extent such tax positions reduce the Company’s income tax liability. The Company recognizes interest and penalties related to unrecognized income tax benefits in the
Provision for income taxes
in the Consolidated Statements of Income.
Foreign Currency Exchange Gains and Losses
The Company’s financial statements are presented in U.S. dollars. The functional currencies of the Company’s operating subsidiaries are generally the local currencies of the countries in which each subsidiary is located. Assets and liabilities denominated in foreign currencies are translated at rates of exchange in effect at the balance sheet date. The amounts recorded in each year in Foreign currency translation are net of income taxes to the extent the underlying equity balances in the entities are not deemed to be permanently reinvested. Revenues and expenses are translated at average rates of exchange in effect during the year.
Transactions in foreign currencies are translated at the exchange rate in effect at the date of each transaction. Differences in exchange rates during the period between the date a transaction denominated in a foreign currency is consummated and the date on which it is either settled or translated for inclusion in the Consolidated Balance Sheets are recognized in Selling, general and administrative expense or Interest expense in the Consolidated Statements of Income for that period.
During the year ended
December 31, 2017
, the Company recognized net foreign currency transaction gains of
$0.04 million
and
$3.4 million
in Interest expense and Selling, general and administrative expense, respectively, in the Consolidated Statement of Income. During the year ended
December 31, 2016
, the Company recognized net foreign currency transaction gain of
$2.6 million
and
$5.0 million
in Interest expense and Selling, general and administrative expense, respectively, in the Consolidated Statement of Income. During the year ended
December 31, 2015
, net foreign currency transaction losses of
$3.7 million
and a gain of
$3.3 million
were recognized in Interest expense and Selling, general and administrative expense, respectively, in the Consolidated Statement of Income.
Debt Issuance Costs and Debt Discount
Costs directly related to the placement of debt are capitalized and amortized to Interest expense primarily using the effective interest method over the term of the related obligation. Net deferred issuance costs of
$9.2 million
and
$5.9 million
, respectively, were included in the Consolidated Balance Sheets as of December 31,
2017
and
2016
, which includes
$12.3 million
and
$15.6 million
, respectively, of accumulated amortization. As of December 31,
2017
,
$3.8 million
and
$5.4 million
of deferred issuance costs were included in Other assets and as a reduction of Long-term debt, respectively. As of December 31,
2016
,
$5.3 million
and
$0.6 million
of deferred issuance costs were included in Other assets and as a reduction of Long-term debt, respectively. Further, the carrying value of Long-term debt is reduced by an original issue discount, which is accreted to Interest expense using the effective interest method over the term of the related obligation. See Note 11, “Debt” for additional discussion regarding the Company’s borrowing arrangements.
Use of Estimates
The Company makes certain estimates and assumptions in preparing its Consolidated Financial Statements in accordance with GAAP. These estimates and assumptions affect the reported amounts of assets and liabilities, the disclosure of contingent assets and liabilities at the date of the Consolidated Financial Statements and the reported amounts of revenues and expenses for the period presented. Actual results may differ from those estimates.
55
COLFAX CORPORATION
NOTES TO CONSOLIDATED FINANCIAL STATEMENTS — (Continued)
Reclassifications
Certain prior period amounts have been reclassified to conform to current year presentations.
3. Recently Issued Accounting Pronouncements
Accounting Guidance Implemented in 2017
In July 2015, the FASB issued ASU No. 2015-11, “Inventory (Topic 330) - Simplifying the Measurement of Inventory”. The ASU requires an entity to measure inventory at the lower of cost and net realizable value, except for inventory that is measured using the last-in, first-out method or the retail inventory method. The Company adopted the ASU during the year ended December 31, 2017 on a prospective basis. The adoption of this standard did not have a material impact on the Company’s Consolidated Financial Statements.
In March 2016, the FASB issued ASU No. 2016-09, “Compensation - Stock Compensation (Topic 718)”. The ASU, among other things, aims to simplify shared-based payment accounting by recording all excess tax benefits and tax deficiencies as income tax expense or benefit in the income statement and eliminates the requirement that excess tax benefits be realized before they can be recognized. The effect for excess tax benefits not previously recognized is recorded as a cumulative adjustment to retained earnings pursuant to a modified retrospective adoption method. Excess tax benefits and deficiencies are accounted for as discrete items in the period the stock awards vest or otherwise are settled. Further, the guidance requires that excess tax benefits be presented as an operating activity on the statement of cash flows consistent with other income tax cash flows. The Company’s adoption of the ASU as of January 1, 2017 resulted in a cumulative catch-up adjustment that increased retained earnings by
$10.0 million
with a corresponding increase to U.S. deferred tax assets related to prior years’ unrecognized excess tax benefits. The Company has also elected to continue its entity-wide accounting policy to estimate the amount of awards that are expected to vest.
In December 2016, the FASB issued ASU No. 2016-19, “Technical Corrections and Improvements”. Among other things, the ASU provides clarification on the presentation of the costs of computer software developed or obtained for internal use. The Company retrospectively adopted the ASU during the year ended December 31, 2017 and reclassified the carrying value of internal-use computer software from Property, plant and equipment, net to Intangible assets, net. The carrying value of internal-use computer software was
$29.3 million
and
$32.3 million
, respectively, as of December 31, 2017 and December 31, 2016.
In January 2017, the FASB issued ASU No. 2017-04, “Intangibles-Goodwill and Other (Topic 350)”. The ASU modifies the measurement of a goodwill impairment loss from the portion of the carrying amount of goodwill that exceeds its implied fair value to the excess of the carrying amount of a reporting unit that exceeds its fair value. This eliminates step 2 of the goodwill impairment test under current guidance. The Company elected to early adopt ASU 2017-04 for the 2017 annual impairment tests performed as of the first day of the Company’s fourth quarter (September 29, 2017). The impact of the adoption is discussed in Note 2. “Summary of Significant Accounting Policies.”
New Accounting Guidance to be Implemented
In May 2014, the Financial Accounting Standards Board (“FASB”) issued Accounting Standards Update (“ASU”) No. 2014-09, “Revenue from Contracts with Customers (Topic 606)”. The ASU outlines a single set of comprehensive principles for recognizing revenue under U.S. GAAP and supersedes existing revenue recognition guidance. The main principle of the ASU is that revenue should be recognized to depict the transfer of promised goods or services to customers in an amount that reflects the consideration to which the entity expects to be entitled in exchange for those goods or services. The Company will apply the ASU and its related updates on a full retrospective basis as of January 1, 2018. The Company has completed a comprehensive assessment of customer contracts across the Company’s operating segments and evaluated the effect the ASU will have on the Company’s financial statements and related disclosures. The Company has concluded that the adoption of the ASU will not have a material impact on the Consolidated Financial Statements. As such, no cumulative catch-up adjustment will be recorded. The primary impact of adoption will be expanded disclosures that will enable users to better understand the nature, amount, timing, and uncertainty of revenues and cash flows arising from contracts with customers. Additionally, the Company has made appropriate revisions to its accounting policies, procedures, and internal controls, which took effect starting January 1, 2018, to comply with the effective date of the standard.
In January 2016, the FASB issued ASU 2016-01, “Financial Instruments - Overall (Subtopic 825-10): Recognition and Measurement of Financial Assets and Financial Liabilities,” which requires various changes to the measurement and disclosure of equity investments. For the Company, the most relevant change under ASU 2016-01 is the elimination of the available-for-
56
COLFAX CORPORATION
NOTES TO CONSOLIDATED FINANCIAL STATEMENTS — (Continued)
sale classification for equity securities with readily determinable fair values. The ASU is effective for fiscal periods beginning after December 15, 2017, at which point any changes in fair value of the Company’s Short term investments will be included as an adjustment to earnings, rather than other comprehensive income.
In February 2016, the FASB issued ASU No. 2016-02, “Leases (Topic 842)”. The ASU requires, among other things, a lessee to recognize assets and liabilities associated with the rights and obligations attributable to most leases but also recognize expenses similar to current lease accounting. The ASU also requires certain qualitative and quantitative disclosures designed to assess the amount, timing and uncertainty of cash flows arising from leases, along with additional key information about leasing arrangements. The guidance is effective for fiscal years, and interim periods within those fiscal years, beginning after December 15, 2018. The new guidance must be adopted using a modified retrospective transition and provides for certain practical expedients. The Company is in the process of analyzing initial data gathered to evaluate the impact of adopting the ASU on its Consolidated Financial Statements, the related systems required to capture the increased reporting and disclosures associated with the ASU, and its use of practical expedients. The Company will apply the ASU and its related updates on a modified retrospective basis as of January 1, 2019. The adoption of the guidance will have a material effect on the Consolidated Balance Sheets, resulting in the recording of an operating lease asset and liability.
In June 2016, the FASB issued ASU No. 2016-13, “Financial Instruments - Credit Losses (Topic 326): Measurement of Credit Losses on Financial Instruments”. The ASU is effective for fiscal periods beginning after December 15, 2019 and early adoption is permitted. The ASU eliminates the probable initial recognition threshold under current U.S. GAAP and broadens the information an entity must consider when developing its expected credit loss estimates to include forward-looking information. The Company is currently evaluating the impact of adopting the ASU on its Consolidated Financial Statements.
In August 2016, the FASB issued ASU No. 2016-15, “Statement of Cash Flows (Topic 203)”. The ASU addresses eight specific cash flow issues and clarifies their presentation and classification in the Statement of Cash Flows. The ASU is effective for fiscal years beginning after December 15, 2017 and is to be applied retrospectively with early adoption permitted. The Company concluded that the adoption of the ASU will not have a material impact on the Consolidated Financial Statements and will apply the ASU and its related updates on a retrospective basis as of January 1, 2018.
In October 2016, the FASB issued ASU 2016-16, “Accounting for Income Taxes: Intra-Entity Asset Transfers of Assets Other than Inventory”. The ASU eliminates the exception that the tax effects of an intra-entity transfer (sales) are deferred until the transferred asset is sold to a third party or recovered through use. The resulting impact will be the recognition of tax expense in the seller’s jurisdiction and any deferred tax asset in the buyer’s jurisdiction in the period the transfer occurs. The new guidance will not apply to intra entity sales of inventory whose tax effects will continue to be deferred until the inventory is sold to a third party. This new standard is effective for fiscal years beginning after December 15, 2017 and is to be applied on a modified retrospective approach with a cumulative adjustment effect recorded in retained earnings as of the beginning of the period of adoption. The Company does not expect the adoption of this ASU to have a material impact on the Consolidated Financial Statements.
In March 2017, the FASB issued ASU No. 2017-07, “Compensation - Retirement Benefits (Topic 715): Improving the Presentation of Net Periodic Pension Cost and Net Periodic Postretirement Benefit Cost”. This ASU requires that the service cost component of net benefit costs of pension and postretirement benefit plans be reported in the same line item as other compensation costs. Other components of net periodic pension cost and net periodic postretirement benefit cost will be presented in the income statement separately from the service cost component, and only the service cost will be eligible for capitalization. The guidance should be applied retrospectively for the presentation requirements and prospectively for the capitalization of the service cost. The ASU is effective for the Company during the first quarter of 2018, and it is not expected that the guidance will have a significant impact on the Company’s consolidated financial statements.
In August 2017, the FASB issued ASU No. 2017-12, “Derivatives and Hedging (Topic 815): Targeted Improvements to Accounting for Hedging Activities”. The ASU amends the current hedge accounting model and eliminates the requirement to separately measure and report hedge ineffectiveness and requires the entire change in the fair value of a hedging instrument to be presented in the same income statement line as the hedged item. The ASU also eases certain documentation and assessment requirements and modifies the accounting for components excluded from the assessment of hedge effectiveness. Companies are required to apply amendments to cash flow and net investment hedge relationship using modified retrospective method and apply prospective method for the presentation and disclosure requirements. The ASU is effective for fiscal periods beginning after December 15, 2018 and early adoption is permitted. The Company is currently evaluating the impact of adopting the ASU on its Consolidated Financial Statements and the timing of adoption.
On December 22, 2017, the SEC issued Staff Accounting Bulletin No. 118 (“SAB 118”) to address the application of U.S. GAAP in situations when a registrant does not have the necessary information available, prepared, or analyzed (including
57
COLFAX CORPORATION
NOTES TO CONSOLIDATED FINANCIAL STATEMENTS — (Continued)
computations) in reasonable detail to complete the accounting for certain income tax effects of the Tax Act. SAB 118 allows registrants to include a provisional amount to account for the implications of the Tax Act where a reasonable estimate can be made and requires the completion of the accounting no later than one year from the date of enactment of the Tax Act or December 22, 2018. Additionally, the Company will file its 2017 U.S. income tax return in Q4 which may change our tax basis in temporary differences estimated as of December 31, 2017 which will result in an adjustment to the tax provision to the re-measurement amount recorded in the financial statements.
4. Discontinued Operations
Sale of Fluid Handling Business
During the three months ended September 29, 2017, the Company entered into the Purchase Agreement to sell its Fluid Handling business to CIRCOR. The accounting requirements for reporting the divested business as a discontinued operation were met during the three months ended September 29, 2017. Accordingly, the accompanying Consolidated Financial Statements for all periods presented reflect the Fluid Handling business as a discontinued operation.
In connection with the Purchase Agreement, the Company and the Buyer entered into various agreements to provide a framework for their relationship after the disposition, including a transition services agreement. The amounts to be billed for future transition services are not expected to be material to the Company’s results of operations.
The sale was completed on December 11, 2017. Total consideration for the sale was
$864.9 million
, consisting of
$555.3 million
of cash,
3.3 million
shares of CIRCOR common stock (the “CIRCOR Shares”), valued at
$141.6 million
, and assumption of
$168.0 million
of net retirement liabilities.
$65.0 million
of the cash consideration is expected to be collected during 2018 and is included in Other current assets in the accompanying Consolidated Balance Sheets as of December 31, 2017. The CIRCOR shares are classified as Short term investments in the accompanying Consolidated Balance Sheets as of December 31, 2017. The consideration amount is subject to certain post-closing adjustments pursuant to the Purchase Agreement.
The Company recorded a pre-tax gain on disposal of
$308.4 million
which is included in Income (loss) from discontinued operations, net of taxes in the Consolidated Statements of Income. Included in the gain calculation was a reduction of the accumulated other comprehensive loss associated with the Fluid Handling business, which was
$167.9 million
, including
$76.5 million
in cumulative translation adjustments. Since the sale closing, the Company has not had material cash flows with the discontinued operation nor are there material items in the accompanying Consolidated Statements of Income that had been eliminated in consolidation prior to the disposal.
58
COLFAX CORPORATION
NOTES TO CONSOLIDATED FINANCIAL STATEMENTS — (Continued)
The key components of income (loss) from discontinued operations were as follows:
|
Year Ended December 31,
|
|||||||||||
|
2017
|
2016
|
2015
|
|||||||||
|
(In thousands)
|
|||||||||||
|
Net sales
|
$
|
436,682
|
|
$
|
461,294
|
|
$
|
532,701
|
|
||
|
Cost of sales
|
294,946
|
|
308,025
|
|
352,613
|
|
|||||
|
Selling, general and administrative expense
(1)
|
118,740
|
|
136,380
|
|
156,708
|
|
|||||
|
Divestiture-related expense, net
(2)
|
5,257
|
|
—
|
|
—
|
|
|||||
|
Restructuring and other related items
(3)
|
(6,768
|
)
|
15,674
|
|
4,355
|
|
|||||
|
Operating income (loss)
|
24,507
|
|
1,215
|
|
19,025
|
|
|||||
|
Interest income (loss)
(4)
|
473
|
|
260
|
|
(241
|
)
|
|||||
|
Gain on disposal
(5)
|
308,388
|
|
—
|
|
—
|
|
|||||
|
Income (loss) from discontinued operations before income taxes
|
333,368
|
|
1,475
|
|
18,784
|
|
|||||
|
Income taxes
|
109,321
|
|
11,036
|
|
8,556
|
|
|||||
|
Income (loss) from discontinued operations, net of taxes
|
$
|
224,047
|
|
$
|
(9,561
|
)
|
$
|
10,228
|
|
||
(1) Pursuant to the Purchase Agreement, the Company retained its asbestos-related contingencies and insurance coverages. However, as the Company did not retain an interest in the ongoing operations of the business subject to the contingencies, the Company has classified asbestos-related activity in its Consolidated Statements of Income as part of Income (loss) from discontinuing operations. See Note 16, “Commitments and Contingencies” for further information.
(2) Primarily related to professional and consulting fees associated with due diligence and preparation of regulatory filings, as well as employee benefit arrangements and other disposition-related activities.
(3) During the year ended December 31, 2017, the Company recorded a gain of approximately
$12 million
from the sale of a facility that was previously closed as part of restructuring activities.
(4) Interest expense has not been allocated to the discontinued operations.
(5) Calculated as the difference between total consideration received and net assets sold less costs to sell of
$14.3 million
. Included in the gain calculation is a reduction of
$167.9 million
of the accumulated other comprehensive loss associated with the Fluid Handling business.
59
COLFAX CORPORATION
NOTES TO CONSOLIDATED FINANCIAL STATEMENTS — (Continued)
The following table summarizes the major classes of assets and liabilities held for sale that were included in the Company’s Consolidated Balance Sheets as of December 31, 2016:
|
December 31, 2016
|
|||
|
(In thousands)
|
|||
|
ASSETS HELD FOR SALE
|
|||
|
Cash and cash equivalents
|
$
|
12,916
|
|
|
Trade receivables, less allowance for doubtful accounts of $12,506
|
74,818
|
|
|
|
Inventories, net
|
38,885
|
|
|
|
Other current assets
|
23,656
|
|
|
|
Property, plant, and equipment, net
|
66,474
|
|
|
|
Goodwill
|
212,330
|
|
|
|
Intangible assets, net
|
15,302
|
|
|
|
Other assets
|
12,951
|
|
|
|
Total assets held for sale
|
457,332
|
|
|
|
Less: current portion
|
150,275
|
|
|
|
Total assets held for sale, less current portion
|
307,057
|
|
|
|
LIABILITIES HELD FOR SALE
|
|||
|
Accounts payable
|
$
|
43,356
|
|
|
Customer advances and billings in excess of costs incurred
|
10,795
|
|
|
|
Accrued liabilities
|
33,032
|
|
|
|
Other Liabilities
|
165,974
|
|
|
|
Total liabilities held for sale
|
253,157
|
|
|
|
Less: current portion
|
87,183
|
|
|
|
Total liabilities held for sale, less current portion
|
165,974
|
|
|
Cash provided by operating activities of discontinued operations for the years ended December 31, 2017, 2016, and 2015 was
$65.2 million
,
$23.1 million
, and
$64.7 million
, respectively. Cash used in investing activities of discontinued operations was
$10.1 million
,
$3.9 million
, and
$5.1 million
for the years ended December 31, 2017, 2016, and 2015, respectively.
5. Acquisitions
The following acquisitions were accounted for using the acquisition method of accounting, and accordingly, the Consolidated Financial Statements include the financial position and results of operations from the respective date of acquisition:
Air and Gas Handling
During the
year ended December 31, 2017
, the Company completed
two
acquisitions in our Air and Gas Handling segment for total consideration, net of cash received, of
$219.6 million
, subject to certain purchase price adjustments. These acquisitions will broaden the segment’s range of compression solutions and expand its product offering into smaller steam turbines.
During the
year ended December 31, 2015
, the Company completed
two
acquisitions in our Air and Gas Handling segment for total consideration, net of cash received, of approximately
$196 million
. The acquisitions expanded our portfolio of gas compression products and enhanced our fan product offering with ventilation control software.
Fabrication Technology
During
year ended December 31, 2017
, the Company completed
three
acquisitions in our Fabrication Technology segment for total consideration, net of cash received, of
$129.2 million
, subject to certain purchase price adjustments. These acquisitions will expand and improve the segment’s high quality welding equipment and consumables.
60
COLFAX CORPORATION
NOTES TO CONSOLIDATED FINANCIAL STATEMENTS — (Continued)
During the year ended December 31, 2016, the Company completed an acquisition for total consideration, net of cash received, of approximately
$26 million
. This acquisition expanded our automation welding equipment portfolio.
General
During the years ended
December 31, 2017
,
2016
, and
2015
, the Company’s Consolidated Statements of Income included
$58.5 million
,
$1.3 million
, and
$47.9 million
of Net sales associated with acquisitions consummated during the respective period. Net Income attributable to Colfax Corporation common shareholders associated with acquisitions consummated during the years ended
December 31, 2017
,
2016
, and
2015
was not material.
Acquisitions consummated during the year ended December 31, 2017 are accounted for under the acquisition method of accounting. The assets acquired and liabilities assumed reported on the Consolidated Balance Sheets represent the Company’s best estimate. These amounts are based upon certain valuations and studies that have yet to be finalized and are subject to adjustment once the detailed analyses are completed.
6. Net (Loss) Income Per Share from Continuing Operations
Net income per share from continuing operations was computed as follows:
|
Year Ended December 31,
|
|||||||||||
|
2017
|
2016
|
2015
|
|||||||||
|
(In thousands, except share data)
|
|||||||||||
|
Computation of Net income (loss) per share from continuing operations - basic:
|
|||||||||||
|
Net (loss) income from continuing operations attributable to Colfax Corporation
(1)
|
$
|
(72,957
|
)
|
$
|
137,672
|
|
$
|
157,511
|
|
||
|
Weighted-average shares of Common stock outstanding - basic
|
123,229,806
|
|
122,911,581
|
|
124,101,033
|
|
|||||
|
Net (loss) income per share from continuing operations - basic
|
$
|
(0.59
|
)
|
$
|
1.12
|
|
$
|
1.27
|
|
||
|
Computation of Net income (loss) per share from continuing operations - diluted:
|
|||||||||||
|
Net (loss) income
from continuing operations
attributable to Colfax Corporation
(1)
|
$
|
(72,957
|
)
|
$
|
137,672
|
|
$
|
157,511
|
|
||
|
Weighted-average shares of Common stock outstanding - basic
|
123,229,806
|
|
122,911,581
|
|
124,101,033
|
|
|||||
|
Net effect of potentially dilutive securities - stock options and restricted stock units
|
—
|
|
287,145
|
|
768,616
|
|
|||||
|
Weighted-average shares of Common stock outstanding - diluted
|
123,229,806
|
|
123,198,726
|
|
124,869,649
|
|
|||||
|
Net (loss) income per share
from continuing operations
- diluted
|
$
|
(0.59
|
)
|
$
|
1.12
|
|
$
|
1.26
|
|
||
(1)
Net (loss) income from continuing operations attributable to Colfax Corporation for the respective periods is calculated using Net (loss) income from continuing operations less the income attributable to noncontrolling interest, net of taxes.
The weighted-average computation of the dilutive effect of potentially issuable shares of Common stock under the treasury stock method for the years ended
December 31, 2017
,
2016
and
2015
excludes approximately
5.0 million
,
4.5 million
and
3.0 million
outstanding stock-based compensation awards, respectively, as their inclusion would be anti-dilutive.
Included in the calculation of diluted net (loss) income per share from discontinued operations are
0.8 million
potentially dilutive securities for the year ended December 31, 2017.
61
COLFAX CORPORATION
NOTES TO CONSOLIDATED FINANCIAL STATEMENTS — (Continued)
7. Income Taxes
(Loss) income from continuing operations before income taxes
and
Provision for income taxes
consisted of the following:
|
|
Year Ended December 31,
|
||||||||||
|
|
2017
|
2016
|
2015
|
||||||||
|
|
(In thousands)
|
||||||||||
|
Income (loss) from continuing operations before income taxes:
|
|
|
|
|
|
|
|||||
|
Domestic operations
|
$
|
(29,470
|
)
|
$
|
(34,015
|
)
|
$
|
(35,048
|
)
|
||
|
Foreign operations
|
17,484
|
|
240,539
|
|
253,166
|
|
|||||
|
|
$
|
(11,986
|
)
|
$
|
206,524
|
|
$
|
218,118
|
|
||
|
Provision for (benefit from) income taxes:
|
|
|
|
|
|
|
|||||
|
Current:
|
|
|
|
|
|
|
|||||
|
Federal
|
$
|
49,259
|
|
$
|
621
|
|
$
|
471
|
|
||
|
State
|
(439
|
)
|
(592
|
)
|
941
|
|
|||||
|
Foreign
|
53,274
|
|
60,651
|
|
67,740
|
|
|||||
|
|
$
|
102,094
|
|
$
|
60,680
|
|
$
|
69,152
|
|
||
|
Deferred:
|
|
|
|
|
|
|
|||||
|
Domestic operations
|
$
|
(54,226
|
)
|
$
|
(2,924
|
)
|
$
|
(6,134
|
)
|
||
|
Foreign operations
|
(5,314
|
)
|
(5,984
|
)
|
(21,850
|
)
|
|||||
|
|
(59,540
|
)
|
(8,908
|
)
|
(27,984
|
)
|
|||||
|
|
$
|
42,554
|
|
$
|
51,772
|
|
$
|
41,168
|
|
||
See Note 4, “Discontinued Operations” for the income (loss) from discontinued operations before income taxes and related income taxes.
On December 22, 2017, the Tax Act was signed into law making significant changes to the Internal Revenue Code which included how the U.S. imposes income tax on multinational corporations. Key changes in the Tax Act which are relevant to the Company and generally effective January 1, 2018 include a flat corporate income tax rate of
21
percent to replace the marginal rates that range from
15
percent to
35
percent, elimination of the corporate alternative minimum tax, the creation of a territorial tax system replacing the worldwide tax system, a one-time tax on accumulated foreign subsidiary earnings to transition to the territorial system, a “minimum tax” on certain foreign earnings above an enumerated rate of return, a new base erosion anti-abuse tax that subjects certain payments made by a U.S. company to its foreign subsidiary to additional taxes, and an incentive for U.S. companies to sell, lease or license goods and services outside the U.S. by taxing the income at a reduced effective rate. The new tax also imposes limits on executive compensation and interest expense deductions, while permitting the immediate expensing for the cost of new investments in certain property acquired after September 27, 2017.
On December 22, 2017, the SEC issued Staff Accounting Bulletin No. 118 (“SAB 118”) to address the application of U.S. GAAP in situations when a registrant does not have the necessary information available, prepared, or analyzed (including computations) in reasonable detail to complete the accounting for certain income tax effects of the Tax Act. SAB 118 allows registrants to include a provisional amount to account for the implications of the Tax Act where a reasonable estimate can be made and requires the completion of the accounting no later than one year from the date of enactment of the Tax Act or December 22, 2018. Additionally, the Company will file its 2017 U.S. income tax return in Q4 which may change our tax basis in temporary differences estimated as of December 31, 2017 which will result in an adjustment to the tax provision to the re-measurement amount recorded in the financial statements.
ASC 740 requires changes in tax rates and tax laws to be accounted for in the period of enactment in continuing operations. Accordingly, of significance, the Company included a provisional estimate of approximately
$52 million
for the Transition Tax, payable over 8 years. Generally, the foreign earnings subject to the Transition Tax can be distributed without additional U.S. tax; however, if distributed, the amount could be subject to foreign taxes and U.S. state and local taxes. The Company continues to evaluate the implications of the Tax Act and its implications including actions we may take to address our business objectives. Therefore, the Company continues to maintain its indefinite reinvestment of foreign earnings. The Company also included a provisional estimate of approximately
$55 million
tax benefit for the re-measurement of its U.S. deferred tax assets and liabilities to 21 percent.
62
COLFAX CORPORATION
NOTES TO CONSOLIDATED FINANCIAL STATEMENTS — (Continued)
The Company’s
Provision for income taxes
from continuing operations differs from the amount that would be computed by applying the U.S. federal statutory rate as follows:
|
Year Ended December 31,
|
|||||||||||
|
2017
|
2016
|
2015
|
|||||||||
|
(In thousands)
|
|||||||||||
|
Taxes calculated at the U.S. federal statutory rate
|
$
|
(4,195
|
)
|
$
|
72,283
|
|
$
|
76,365
|
|
||
|
State taxes
|
86
|
|
228
|
|
768
|
|
|||||
|
Effect of tax rates on international operations
|
(13,916
|
)
|
(27,831
|
)
|
(36,305
|
)
|
|||||
|
Change in enacted international tax rates
|
536
|
|
(2,419
|
)
|
(4,415
|
)
|
|||||
|
Changes in valuation allowance and tax reserves
|
5,859
|
|
2,675
|
|
(55
|
)
|
|||||
|
Tax Act - re-measurement of U.S. deferred taxes
|
(54,988
|
)
|
—
|
|
—
|
|
|||||
|
Tax Act - mandatory repatriation taxes
|
52,381
|
|
—
|
|
—
|
|
|||||
|
Non-deductible impairment expenses
|
52,570
|
|
—
|
|
—
|
|
|||||
|
Other
|
4,221
|
|
6,836
|
|
4,810
|
|
|||||
|
Provision for income taxes
|
$
|
42,554
|
|
$
|
51,772
|
|
$
|
41,168
|
|
||
Deferred income taxes, net reflect the net tax effects of temporary differences between the carrying amounts of assets and liabilities for financial reporting purposes and the amounts used for income tax purposes. Deferred tax assets and liabilities are measured using enacted tax rates expected to apply to taxable income in the years in which those temporary differences are expected to reverse. As a result of the Tax Act becoming law on
December 22, 2017
and the reduction in the U.S. corporate income tax rate from
35%
to
21%
, the Company revalued its ending net U.S. deferred tax liabilities at
December 31, 2017
and recognized a provisional
$55 million
tax benefit in the Company’s Consolidated Statement of Income for the year ended
December 31, 2017
. The significant components of deferred tax assets and liabilities, in addition to the reconciliation of the beginning and ending amount of gross unrecognized tax benefits, are as follows:
|
December 31,
|
|||||||
|
2017
|
2016
|
||||||
|
(In thousands)
|
|||||||
|
Deferred tax assets:
|
|||||||
|
Post-retirement benefit obligation
|
$
|
23,297
|
|
$
|
66,911
|
|
|
|
Expenses currently not deductible
|
69,039
|
|
105,780
|
|
|||
|
Net operating loss carryforward
|
142,700
|
|
211,205
|
|
|||
|
Tax credit carryforward
|
4,148
|
|
10,882
|
|
|||
|
Depreciation and amortization
|
10,001
|
|
7,879
|
|
|||
|
Other
|
36,733
|
|
14,956
|
|
|||
|
Valuation allowance
|
(155,179
|
)
|
(153,740
|
)
|
|||
|
Deferred tax assets, net
|
$
|
130,739
|
|
$
|
263,873
|
|
|
|
Deferred tax liabilities:
|
|
|
|
|
|||
|
Depreciation and amortization
|
$
|
(271,359
|
)
|
$
|
(292,906
|
)
|
|
|
UK and other foreign benefit obligation
|
(11,317
|
)
|
(14,990
|
)
|
|||
|
Inventory
|
(12,109
|
)
|
(18,309
|
)
|
|||
|
Outside basis differences and other
|
(118,974
|
)
|
(178,166
|
)
|
|||
|
Total deferred tax liabilities
|
$
|
(413,759
|
)
|
$
|
(504,371
|
)
|
|
|
Total deferred tax liabilities, net
|
$
|
(283,020
|
)
|
$
|
(240,498
|
)
|
|
The Company evaluates the recoverability of its deferred tax assets on a jurisdictional basis by considering whether deferred tax assets will be realized on a more likely than not basis. To the extent a portion or all of the applicable deferred tax assets do not meet the more likely than not threshold, a valuation allowance is recorded. During the year ended December 31,
2017
, the valuation allowance increased from
$153.7 million
to
$155.2 million
with a net increase of
$17.3 million
recognized in
Provision for income
63
COLFAX CORPORATION
NOTES TO CONSOLIDATED FINANCIAL STATEMENTS — (Continued)
taxes
, a
$18.9 million
decrease due to reclassifications and the divestiture of Colfax Fluid Handling entities and a
$3.1 million
increase related to changes in foreign currency rates. Consideration was given to tax planning strategies and future taxable income as to how much of the relevant deferred tax asset could be realized on a more likely than not basis.
The Company has U.S. net operating loss carryforwards of
$16.3 million
expiring in years 2022 through 2033. The Company’s ability to use these various carryforwards to offset any taxable income generated in future taxable periods may be limited under Section 382 and other federal tax provisions. At December 31, 2017 the Company also has
$577.9 million
foreign net operating loss carryforwards primarily in Brazil, Czech Republic, Germany, India, Sweden, and the United Kingdom that may subject to local tax restrictive limitations including changes in ownership. Generally, the foreign net operating losses can be carried forward indefinitely, except in the Czech Republic and India where they will expire between 2019 and 2026.
For the year ended December 31, 2017, after accounting for the Tax Act provisional amounts, all undistributed earnings of the Company’s foreign subsidiaries, which are indefinitely reinvested outside the U.S., are provisionally estimated to be
$950 million
. The amount of deferred tax liability that would have been recognized had such earnings not been indefinitely reinvested is not reasonably determinable.
The Company records a liability for unrecognized income tax benefits for the amount of benefit included in its previously filed income tax returns and in its financial results expected to be included in income tax returns to be filed for periods through the date of its Consolidated Financial Statements for income tax positions for which it is more likely than not that a tax position will not be sustained upon examination by the respective taxing authority. A reconciliation of the beginning and ending amount of gross unrecognized tax benefits is as follows (inclusive of associated interest and penalties):
|
|
(In thousands)
|
||
|
Balance, December 31, 2014
|
$
|
77,525
|
|
|
Addition for tax positions taken in prior periods
|
3,924
|
|
|
|
Addition for tax positions taken in the current period
|
924
|
|
|
|
Reductions related to settlements with taxing authorities
|
(22,473
|
)
|
|
|
Reductions resulting from a lapse of applicable statute of limitations
|
(1,143
|
)
|
|
|
Other, including the impact of foreign currency translation
|
(5,879
|
)
|
|
|
Balance, December 31, 2015
|
$
|
52,878
|
|
|
Addition for tax positions taken in prior periods
|
6,552
|
|
|
|
Addition for tax positions taken in the current period
|
1,418
|
|
|
|
Reductions related to settlements with taxing authorities
|
(53
|
)
|
|
|
Reductions resulting from a lapse of applicable statute of limitations
|
(2,195
|
)
|
|
|
Other, including the impact of foreign currency translation
|
608
|
|
|
|
Balance, December 31, 2016
|
$
|
59,208
|
|
|
Addition for tax positions taken in prior periods
|
1,521
|
|
|
|
Addition for tax positions taken in the current period
|
424
|
|
|
|
Reductions related to settlements with taxing authorities
|
(10,708
|
)
|
|
|
Reductions resulting from a lapse of applicable statute of limitations
|
(3,677
|
)
|
|
|
Other, including the impact of foreign currency translation and U.S. tax rate changes
|
(5,750
|
)
|
|
|
Balance, December 31, 2017
|
$
|
41,018
|
|
The Company is routinely examined by tax authorities around the world. Tax examinations remain in process in multiple countries, including but not limited to Sweden, Germany, Indonesia, France, the Netherlands, Mexico, Brazil and various U.S. states. The Company files numerous group and separate tax returns in U.S. federal and state jurisdictions, as well as international jurisdictions. In the U.S., tax years dating back to 2003 remain subject to examination, due to tax attributes available to be carried forward to open or future tax years. With some exceptions, other major tax jurisdictions generally are not subject to tax examinations for years beginning before 2011.
The Company’s total unrecognized tax benefits were
$41.0 million
and
$59.2 million
as of
December 31, 2017
and
2016
, respectively, inclusive of
$5.4 million
and
$8.5 million
, respectively, of interest and penalties. The Company records interest and
64
COLFAX CORPORATION
NOTES TO CONSOLIDATED FINANCIAL STATEMENTS — (Continued)
penalties on uncertain tax positions as a component of
Provision for income taxes
, which was
$1.3 million
,
$2.7 million
and
$1.8 million
for the years ended
December 31, 2017
,
2016
and
2015
, respectively.
Due to the difficulty in predicting with reasonable certainty when tax audits will be fully resolved and closed, the range of reasonably possible significant increases or decreases in the liability for unrecognized tax benefits that may occur within the next 12 months is difficult to ascertain. Currently, the Company estimates that it is reasonably possible that the expiration of various statutes of limitations, resolution of tax audits and court decisions may reduce its tax expense in the next 12 months up to
$1.8 million
.
8. Goodwill and Intangible Assets
The following table summarizes the activity in Goodwill, by segment during the years ended
December 31, 2017
and
2016
:
|
|
Air and Gas Handling
|
Fabrication
Technology
|
Total
|
||||||||
|
|
(In thousands)
|
||||||||||
|
Balance, January 1, 2016
|
$
|
1,206,715
|
|
$
|
1,391,421
|
|
$
|
2,598,136
|
|
||
|
Goodwill attributable to acquisitions
|
1,317
|
|
15,242
|
|
16,559
|
|
|||||
|
Impact of foreign currency translation and other
|
(154,489
|
)
|
(109,210
|
)
|
(263,699
|
)
|
|||||
|
Balance, December 31, 2016
|
1,053,543
|
|
1,297,453
|
|
2,350,996
|
|
|||||
|
Goodwill attributable to acquisitions
(1)
|
107,024
|
|
74,180
|
|
181,204
|
|
|||||
|
Goodwill impairment
|
(150,200
|
)
|
—
|
|
(150,200
|
)
|
|||||
|
Impact of foreign currency translation and other
|
97,805
|
|
58,739
|
|
156,544
|
|
|||||
|
Balance, December 31, 2017
|
$
|
1,108,172
|
|
$
|
1,430,372
|
|
$
|
2,538,544
|
|
||
|
Accumulated goodwill impairment as of December 31, 2017
|
$
|
(150,200
|
)
|
$
|
—
|
|
$
|
(150,200
|
)
|
||
(1)
Includes purchase accounting adjustments associated with the two air and gas handling acquisitions and three fabrication technology acquisitions completed during the
year ended December 31, 2017
. See Note 5, “Acquisitions” for further discussion.
The following table summarizes the Company’s Intangible assets, excluding Goodwill:
|
|
December 31,
|
||||||||||||||
|
|
2017
|
2016
|
|||||||||||||
|
|
Gross
Carrying Amount |
Accumulated
Amortization |
Gross
Carrying Amount |
Accumulated
Amortization |
|||||||||||
|
|
(In thousands)
|
||||||||||||||
|
Trade names – indefinite life
|
$
|
407,167
|
|
$
|
—
|
|
$
|
363,132
|
|
$
|
—
|
|
|||
|
Acquired customer relationships
|
622,893
|
|
(184,100
|
)
|
541,419
|
|
(137,567
|
)
|
|||||||
|
Acquired technology
|
170,453
|
|
(62,491
|
)
|
137,902
|
|
(44,906
|
)
|
|||||||
|
Software
|
100,098
|
|
(71,010
|
)
|
82,235
|
|
(49,926
|
)
|
|||||||
|
Acquired backlog
|
10,398
|
|
(2,600
|
)
|
—
|
|
—
|
|
|||||||
|
Other intangible assets
|
48,695
|
|
(22,300
|
)
|
40,398
|
|
(16,340
|
)
|
|||||||
|
|
$
|
1,359,704
|
|
$
|
(342,501
|
)
|
$
|
1,165,086
|
|
$
|
(248,739
|
)
|
|||
Amortization expense related to intangible assets was included in the Consolidated Statements of Income as follows:
|
|
Year Ended December 31,
|
||||||||||
|
|
2017
|
2016
|
2015
|
||||||||
|
|
(In thousands)
|
||||||||||
|
Selling, general and administrative expense
|
$
|
71,119
|
|
$
|
57,365
|
|
$
|
56,758
|
|
||
65
COLFAX CORPORATION
NOTES TO CONSOLIDATED FINANCIAL STATEMENTS — (Continued)
See Note 2, “Summary of Significant Accounting Policies” for discussion regarding impairment of Intangible assets.
As of
December 31, 2017
, total amortization expense for intangible assets is expected to be
$76.5 million
,
$65.4 million
,
$62.1 million
,
$59.0 million
and
$52.8 million
for the years ending December 31,
2018
,
2019
,
2020
,
2021
and
2022
, respectively.
9. Property, Plant and Equipment, Net
|
|
|
December 31,
|
|||||||
|
|
Depreciable Life
|
2017
|
2016
|
||||||
|
|
(In years)
|
(In thousands)
|
|||||||
|
Land
|
n/a
|
$
|
47,584
|
|
$
|
31,855
|
|
||
|
Buildings and improvements
|
5-40
|
322,431
|
|
292,448
|
|
||||
|
Machinery and equipment
|
3-15
|
495,366
|
|
406,270
|
|
||||
|
|
|
865,381
|
|
730,573
|
|
||||
|
Accumulated depreciation
|
|
(312,579
|
)
|
(225,142
|
)
|
||||
|
Property, plant and equipment, net
|
|
$
|
552,802
|
|
$
|
505,431
|
|
||
Depreciation expense, including the amortization of assets recorded under capital leases, for the years ended
December 31, 2017
,
2016
and
2015
, was
$52.3 million
,
$52.5 million
and
$57.6 million
, respectively. Impairment of fixed assets recorded for the years ended
December 31, 2017
,
2016
and
2015
was
$30.9 million
,
$3.4 million
and
$9.3 million
, respectively.
10. Inventories, Net
Inventories, net consisted of the following:
|
December 31,
|
|||||||
|
2017
|
2016
|
||||||
|
(In thousands)
|
|||||||
|
Raw materials
|
$
|
141,827
|
|
$
|
121,886
|
|
|
|
Work in process
|
74,704
|
|
55,845
|
|
|||
|
Finished goods
|
250,364
|
|
221,866
|
|
|||
|
466,895
|
|
399,597
|
|
||||
|
Less: customer progress payments
|
(2,308
|
)
|
—
|
|
|||
|
Less: allowance for excess, slow-moving and obsolete inventory
|
(34,960
|
)
|
(34,625
|
)
|
|||
|
Inventories, net
|
$
|
429,627
|
|
$
|
364,972
|
|
|
Long-term debt consisted of the following:
|
December 31,
|
|||||||
|
2017
|
2016
|
||||||
|
(In thousands)
|
|||||||
|
Senior unsecured notes
|
$
|
414,862
|
|
$
|
—
|
|
|
|
Term loans
|
615,095
|
|
678,286
|
|
|||
|
Trade receivables financing arrangement
|
—
|
|
63,399
|
|
|||
|
Revolving credit facilities and other
|
31,114
|
|
550,459
|
|
|||
|
Total Debt
|
1,061,071
|
|
1,292,144
|
|
|||
|
Less: current portion
|
(5,766
|
)
|
(5,406
|
)
|
|||
|
Long-term debt
|
$
|
1,055,305
|
|
$
|
1,286,738
|
|
|
66
COLFAX CORPORATION
NOTES TO CONSOLIDATED FINANCIAL STATEMENTS — (Continued)
On June 5, 2015, the Company entered into a credit agreement (the “DB Credit Agreement”) by and among the Company, as the borrower, certain U.S. subsidiaries of the Company identified therein, as guarantors, each of the lenders party thereto and Deutsche Bank AG New York Branch, as administrative agent, swing line lender and global coordinator. The proceeds of the loans under the DB Credit Agreement were used by the Company to repay in full balances under its preexisting credit agreement, as well as for working capital and general corporate purposes. The DB Credit Agreement consists of an initial term loan in the aggregate amount of
$750.0 million
(the “Term Loan”) and a revolving credit facility (the “Revolver”) with a commitment capacity of
$1.3 billion
, each of which had an initial maturity term of
five
years. The Revolver contains a
$50.0 million
swing line loan sub-facility. In conjunction with the DB Credit Agreement, the Company recorded a charge to Interest expense in the Consolidated Statement of Income for the year ended December 31, 2015 of
$4.7 million
to write-off certain deferred financing fees and original issue discount and expensed
$0.4 million
of costs incurred in connection with the refinancing of the DB Credit Agreement.
The Term Loan and the Revolver bear interest, at the election of the Company, at either the base rate (as defined in the DB Credit Agreement) or the Eurocurrency rate (as defined in the DB Credit Agreement), in each case, plus the applicable interest rate margin. The applicable interest rate margin is based upon either, whichever results in the lower applicable interest rate margin (subject to certain exceptions), the Company’s total leverage ratio and the corporate family rating of the Company as determined by Standard & Poor’s and Moody’s (ranging from
1.25%
to
2.00%
, in the case of the Eurocurrency margin, and
0.25%
to
1.00%
, in the case of the base rate margin). Swing line loans bear interest at the applicable rate, as specified under the terms of the DB Credit Agreement, based upon the currency borrowed. As of
December 31, 2017
, the weighted-average interest rate of borrowings under the DB Credit Agreement was
3.07%
, excluding accretion of original issue discount and amortization of deferred financing fees, and there was
$1.3 billion
available on the revolving credit facility.
On April 19, 2017
, we issued senior unsecured notes with an aggregate principal amount of
€350 million
(the “Euro Notes”). Euro Notes are due in April 2025 and have an interest rate of
3.25%
. The proceeds from the Euro Notes offering were used to repay borrowings under our DB Credit Agreement and bilateral credit facilities totaling
€283.5 million
, as well as for general corporate purposes, and are guaranteed by certain of our domestic subsidiaries (the “Guarantees”). In conjunction with the issuance of the senior unsecured notes, the Company recorded
$6.0 million
of deferred financing fees. The Euro Notes and the Guarantees have not been, and will not be, registered under the Securities Act of 1933, as amended (the "Securities Act"), and are listed on the Irish stock exchange.
The Company had an original issue discount of
$3.7 million
and deferred financing fees of
$9.2 million
included in its Consolidated Balance Sheet as of
December 31, 2017
, which will be accreted to Interest expense primarily using the effective interest method, over the life of the applicable debt agreement.
In addition to the debt agreements discussed above, the Company is party to various bilateral credit facilities with a borrowing capacity of
$217.9 million
. As of
December 31, 2017
, outstanding borrowings under these facilities total
$22.8 million
, with a weighted average borrowing rate of
1.00%
.
The Company is also party to letter of credit facilities with an aggregate capacity of
$780.6 million
. Total letters of credit of
$418.8 million
were outstanding as of
December 31, 2017
.
The Company was party to a receivables financing facility through a wholly-owned, special purpose bankruptcy-remote subsidiary which purchased trade receivables from certain of the Company’s subsidiaries on an ongoing basis and pledged them to support its obligation as borrower under the receivables financing facility. This special purpose subsidiary has a separate legal existence from its parent and its assets are not available to satisfy the claims of creditors of the selling subsidiaries or any other member of the consolidated group. According to the receivable financing facility agreement, the program limit could not exceed
$80 million
and the scheduled termination date for the receivables financing facility was
December 19, 2017
. As of
December 15, 2017
, the Company paid off the total outstanding borrowings under the receivables financing facility which was
$52.4 million
and the agreement was terminated.
67
COLFAX CORPORATION
NOTES TO CONSOLIDATED FINANCIAL STATEMENTS — (Continued)
The contractual maturities of the Company’s debt as of
December 31, 2017
are as follows
(1)
:
|
|
(In thousands)
|
||
|
2018
|
$
|
5,766
|
|
|
2019
|
2,532
|
|
|
|
2020
|
618,750
|
|
|
|
Thereafter
|
443,111
|
|
|
|
Total contractual maturities
|
1,070,159
|
|
|
|
Debt discount
|
(9,088
|
)
|
|
|
Total debt
|
$
|
1,061,071
|
|
(1)
Represents scheduled payments required under the DB Credit Agreement through June 5, 2020 and the Euro Notes through
April 15, 2025
, as well as the contractual maturities of other debt outstanding as of
December 31, 2017
, and reflects management’s intention to repay scheduled maturities of the term loans outstanding under the DB Credit Agreement (if not extended) with proceeds from the revolving credit facility.
Certain U.S. subsidiaries of the Company have agreed to guarantee the obligations of the Company under the DB Credit Agreement. The DB Credit Agreement contains customary covenants limiting the ability of the Company and its subsidiaries to, among other things, incur debt or liens, merge or consolidate with others, dispose of assets, make investments or pay dividends. In addition, the DB Credit Agreement contains financial covenants requiring the Company to maintain a total leverage ratio, as defined therein, of generally not more than 3.5 to 1.0 and minimum interest coverage ratio, as defined therein, of 3.0 to 1.0, measured at the end of each quarter
. The DB Credit Agreement contains various events of default (including failure to comply with the covenants under the DB Credit Agreement and related agreements) and upon an event of default the lenders may, subject to various customary cure rights, require the immediate payment of all amounts outstanding under the Term Loan and the Revolver.
As of December 31, 2017, the Company is in compliance with the covenants under the DB Credit Agreement.
12. Equity
Common Stock
The Company contributed
66,000
shares of newly issued Colfax Common stock to its U.S. defined benefit pension plan on May 21, 2015. No contributions of Colfax Common stock were made during the
years ended December 31, 2017 and 2016
.
Share Repurchase Program
On October 11, 2015, the Company’s Board of Directors authorized the repurchase of up to
$100.0 million
of the Company’s Common stock from time-to-time on the open market or in privately negotiated transactions, which were to be retired upon repurchase. The repurchase program was authorized until December 31, 2016 and did not obligate the Company to acquire any specific number of shares. The timing and amount of shares repurchased was determined by management based on its evaluation of market conditions and other factors. The repurchase program was conducted pursuant to SEC Rule 10b-18. During the years ended December 31, 2016 and 2015, the Company repurchased
1,000,000
shares and
986,279
shares, respectively, of its Common stock in open market transactions for
$20.8 million
and
$27.4 million
, respectively. The repurchase program expired as of December 31, 2016.
On February 12, 2018
, the Company’s Board of Directors authorized the repurchase of up to
$100.0 million
of the Company’s Common stock from time-to-time on the open market or in privately negotiated transactions. The timing and amount of shares repurchased is to be determined by management based on its evaluation of market conditions and other factors. The repurchase program has no expiration date and does not obligate the Company to acquire any specific number of shares. No shares have been repurchased to date.
Accumulated Other Comprehensive Loss
The following table presents the changes in the balances of each component of Accumulated other comprehensive loss including reclassifications out of Accumulated other comprehensive loss for the years ended
December 31, 2017
,
2016
and
2015
. All amounts are net of tax and noncontrolling interest.
68
COLFAX CORPORATION
NOTES TO CONSOLIDATED FINANCIAL STATEMENTS — (Continued)
|
Accumulated Other Comprehensive Loss Components
|
|||||||||||||||||||
|
Net Unrecognized Pension And Other Post-Retirement Benefit Cost
|
Foreign Currency Translation Adjustment
|
Unrealized (Loss) Gain On Hedging Activities
|
Changes in Fair Value of Available-for-Sale Securities
|
Total
|
|||||||||||||||
|
(In thousands)
|
|||||||||||||||||||
|
Balance at January 1, 2015
|
$
|
(240,513
|
)
|
$
|
(227,059
|
)
|
$
|
23,881
|
|
$
|
—
|
|
$
|
(443,691
|
)
|
||||
|
Other comprehensive income (loss) before reclassifications:
|
|||||||||||||||||||
|
Net actuarial gain
|
28,349
|
|
—
|
|
—
|
|
—
|
|
28,349
|
|
|||||||||
|
Foreign currency translation adjustment
|
7,747
|
|
(301,011
|
)
|
(382
|
)
|
—
|
|
(293,646
|
)
|
|||||||||
|
Loss on long-term intra-entity foreign currency transactions
|
—
|
|
(550
|
)
|
—
|
|
—
|
|
(550
|
)
|
|||||||||
|
Gain on net investment hedges
|
—
|
|
—
|
|
14,537
|
|
—
|
|
14,537
|
|
|||||||||
|
Unrealized loss on cash flow hedges
|
—
|
|
—
|
|
(2,873
|
)
|
—
|
|
(2,873
|
)
|
|||||||||
|
Other
|
3,817
|
|
—
|
|
—
|
|
—
|
|
3,817
|
|
|||||||||
|
Other comprehensive income (loss) before reclassifications
|
39,913
|
|
(301,561
|
)
|
11,282
|
|
—
|
|
(250,366
|
)
|
|||||||||
|
Amounts reclassified from Accumulated other comprehensive loss
(1)
|
7,342
|
|
—
|
|
—
|
|
—
|
|
7,342
|
|
|||||||||
|
Net current period Other comprehensive income (loss)
|
47,255
|
|
(301,561
|
)
|
11,282
|
|
—
|
|
(243,024
|
)
|
|||||||||
|
Balance at December 31, 2015
|
$
|
(193,258
|
)
|
$
|
(528,620
|
)
|
$
|
35,163
|
|
$
|
—
|
|
$
|
(686,715
|
)
|
||||
|
Other comprehensive income (loss) before reclassifications:
|
|||||||||||||||||||
|
Net actuarial gain
|
4,815
|
|
—
|
|
—
|
|
—
|
|
4,815
|
|
|||||||||
|
Foreign currency translation adjustment
|
2,620
|
|
(312,017
|
)
|
722
|
|
—
|
|
(308,675
|
)
|
|||||||||
|
Loss on long-term intra-entity foreign currency transactions
|
—
|
|
(22,530
|
)
|
—
|
|
—
|
|
(22,530
|
)
|
|||||||||
|
Gain on net investment hedges
|
—
|
|
—
|
|
18,537
|
|
—
|
|
18,537
|
|
|||||||||
|
Unrealized loss on cash flow hedges
|
—
|
|
—
|
|
(789
|
)
|
—
|
|
(789
|
)
|
|||||||||
|
Other comprehensive income (loss) before reclassifications
|
7,435
|
|
(334,547
|
)
|
18,470
|
|
—
|
|
(308,642
|
)
|
|||||||||
|
Amounts reclassified from Accumulated other comprehensive loss
(1)(2)
|
4,634
|
|
2,378
|
|
—
|
|
—
|
|
7,012
|
|
|||||||||
|
Net current period Other comprehensive income (loss)
|
12,069
|
|
(332,169
|
)
|
18,470
|
|
—
|
|
(301,630
|
)
|
|||||||||
|
Balance at December 31, 2016
|
$
|
(181,189
|
)
|
$
|
(860,789
|
)
|
$
|
53,633
|
|
$
|
—
|
|
$
|
(988,345
|
)
|
||||
|
Other comprehensive (loss) income before reclassifications:
|
|||||||||||||||||||
|
Net actuarial gain
|
4,185
|
|
—
|
|
—
|
|
—
|
|
4,185
|
|
|||||||||
|
Foreign currency translation adjustment
|
(5,689
|
)
|
288,354
|
|
18
|
|
—
|
|
282,683
|
|
|||||||||
|
Unrealized gain on available-for-sale securities
|
—
|
|
—
|
|
—
|
|
5,152
|
|
5,152
|
|
|||||||||
|
Loss on long-term intra-entity foreign currency transactions
|
—
|
|
(29,372
|
)
|
—
|
|
—
|
|
(29,372
|
)
|
|||||||||
|
Loss on net investment hedges
|
—
|
|
—
|
|
(32,388
|
)
|
—
|
|
(32,388
|
)
|
|||||||||
|
Unrealized gain on cash flow hedges
|
—
|
|
—
|
|
8,875
|
|
—
|
|
8,875
|
|
|||||||||
|
Other comprehensive (loss) income before reclassifications
|
(1,504
|
)
|
258,982
|
|
(23,495
|
)
|
5,152
|
|
239,135
|
|
|||||||||
|
Amounts reclassified from Accumulated other comprehensive loss
(1)
|
6,981
|
|
—
|
|
—
|
|
—
|
|
6,981
|
|
|||||||||
|
Divestiture-related recognition of pension and other post-retirement cost and foreign currency translation
|
91,374
|
|
76,483
|
|
—
|
|
—
|
|
167,857
|
|
|||||||||
|
Net current period Other comprehensive income (loss)
|
96,851
|
|
335,465
|
|
(23,495
|
)
|
5,152
|
|
413,973
|
|
|||||||||
|
Balance at December 31, 2017
|
$
|
(84,338
|
)
|
$
|
(525,324
|
)
|
$
|
30,138
|
|
$
|
5,152
|
|
$
|
(574,372
|
)
|
||||
(1)
Included in the computation of net periodic benefit cost. See Note 14, “Defined Benefit Plans” for additional details.
(2)
Foreign currency translation adjustment reclassification is the result of deconsolidation of the Company’s Venezuelan operations during the year ended December 31, 2016. See Note 2, “Summary of Significant Accounting Policies” for further discussion.
69
COLFAX CORPORATION
NOTES TO CONSOLIDATED FINANCIAL STATEMENTS — (Continued)
During the year ended
December 31, 2017
, Noncontrolling interest increased by
$16.0 million
as a result of Other comprehensive income, primarily due to foreign currency translation adjustments. During the years ended December 31,
2016
and
2015
, Noncontrolling interest increased by
$0.6 million
and decreased by
$22.8 million
, respectively, as a result of Other comprehensive loss, primarily due to foreign currency translation adjustment.
Share-Based Payments
On May 13, 2016, the Company adopted the Colfax Corporation 2016 Omnibus Incentive Plan (the “2016 Plan”) which replaced the Colfax Corporation 2008 Omnibus Incentive Plan dated April 21, 2008, as amended and restated on April 2, 2012. The 2016 Plan provides the Compensation Committee of the Company’s Board of Directors discretion in creating employee equity incentives. Awards under the 2016 Plan may be made in the form of stock options, stock appreciation rights, restricted stock, restricted stock units, dividend equivalent rights, performance shares, performance units, and other stock-based awards.
The Company measures and recognizes compensation expense related to share-based payments based on the fair value of the instruments issued. Stock-based compensation expense is generally recognized as a component of Selling, general and administrative expense in the Consolidated Statements of Income, as payroll costs of the employees receiving the awards are recorded in the same line item.
The Company’s Consolidated Statements of Income reflect the following amounts related to stock-based compensation:
|
|
Year Ended December 31,
|
||||||||||
|
|
2017
|
2016
|
2015
|
||||||||
|
|
(In thousands)
|
||||||||||
|
Stock-based compensation expense
|
$
|
21,548
|
|
$
|
19,020
|
|
$
|
16,321
|
|
||
|
Deferred tax benefit
|
7,079
|
|
6,271
|
|
5,342
|
|
|||||
As of
December 31, 2017
, the Company had
$36.2 million
of unrecognized compensation expense related to stock-based awards that will be recognized over a weighted-average period of approximately
1.1 years
. The intrinsic value of awards exercised or issued upon vesting was
$12.3 million
,
$6.5 million
and
$21.8 million
during the years ended
December 31, 2017
,
2016
and
2015
, respectively.
Stock Options
Under the 2016 Plan, the Company may grant options to purchase Common stock, with a maximum term of 10 years at a purchase price equal to the market value of the Company’s Common stock on the date of grant. In the case of an incentive stock option granted to a holder of 10% of the Company’s outstanding Common stock, the Company may grant options to purchase Common stock with a maximum term of 5 years, at a purchase price equal to 110% of the market value of the Company’s Common stock on the date of grant.
Stock-based compensation expense for stock option awards is based upon the grant-date fair value using the Black-Scholes option pricing model. The Company recognizes compensation expense for stock option awards on a straight-line basis over the requisite service period of the entire award. The following table shows the weighted-average assumptions used to calculate the fair value of stock option awards using the Black-Scholes option pricing model, as well as the weighted-average fair value of options granted:
|
|
Year Ended December 31,
|
||||||||||
|
|
2017
|
2016
|
2015
|
||||||||
|
Expected period that options will be outstanding (in years)
|
4.78
|
|
4.95
|
|
5.02
|
|
|||||
|
Interest rate (based on U.S. Treasury yields at the time of grant)
|
1.92
|
%
|
1.41
|
%
|
1.62
|
%
|
|||||
|
Volatility
|
32.15
|
%
|
42.50
|
%
|
28.75
|
%
|
|||||
|
Dividend yield
|
—
|
|
—
|
|
—
|
|
|||||
|
Weighted-average fair value of options granted
|
$
|
12.16
|
|
$
|
9.47
|
|
$
|
11.87
|
|
||
During the years ended December 31, 2017 and 2016, expected volatility was estimated based on the historical volatility of the Company’s stock price; during the year ended December 31, 2015, expected volatility was estimated based on the historical
70
COLFAX CORPORATION
NOTES TO CONSOLIDATED FINANCIAL STATEMENTS — (Continued)
volatility of comparable public companies. The Company considers historical data to estimate employee termination within the valuation model. Separate groups of employees that have similar historical exercise behavior are considered separately for valuation purposes. Since the Company has limited option exercise history, it has generally elected to estimate the expected life of an award based upon the Securities and Exchange Commission-approved “simplified method” noted under the provisions of Staff Accounting Bulletin No. 107 with the continued use of this method extended under the provisions of Staff Accounting Bulletin No. 110.
Stock option activity is as follows:
|
|
Number
of Options |
Weighted-
Average Exercise Price |
Weighted-
Average Remaining Contractual Term (In years) |
Aggregate
Intrinsic Value (1) (In thousands) |
||||||||
|
Outstanding at January 1, 2017
|
4,327,827
|
|
$
|
37.49
|
|
|
|
|
||||
|
Granted
|
872,146
|
|
40.28
|
|
|
|
|
|||||
|
Exercised
|
(319,902
|
)
|
21.70
|
|
|
|
|
|||||
|
Forfeited and expired
|
(440,486
|
)
|
42.48
|
|
|
|
|
|||||
|
Outstanding at December 31, 2017
|
4,439,585
|
|
$
|
38.68
|
|
4.40
|
$
|
24,715
|
|
|||
|
Vested or expected to vest at December 31, 2017
|
4,304,963
|
|
$
|
38.47
|
|
4.38
|
$
|
24,589
|
|
|||
|
Exercisable at December 31, 2017
|
1,576,311
|
|
$
|
42.61
|
|
3.26
|
$
|
8,230
|
|
|||
|
(1)
|
The aggregate intrinsic value is based upon the difference between the Company’s closing stock price at the date of the Consolidated Balance Sheet and the exercise price of the stock option for in-the-money stock options. The intrinsic value of outstanding stock options fluctuates based upon the trading value of the Company’s Common stock.
|
Restricted Stock Units
Under the 2016 Plan, the Compensation Committee of the Board of Directors may award performance-based restricted stock units (“PRSUs”), the vesting of which is contingent upon meeting various performance goals. The vesting of the stock units is determined based on whether the Company achieves the applicable performance criteria established by the Compensation Committee of the Board of Directors. If the performance criteria are satisfied, the units are subject to additional time vesting requirements as determined at the time of grant. Under the 2016 Plan, the Compensation Committee of the Board of Directors may award non-performance-based restricted stock units (“RSUs”) to select executives, employees and outside directors. The Compensation Committee determines the terms and conditions of each award, including the restriction period and other criteria applicable to the awards. Directors may also elect to defer their annual board fees into RSUs with immediate vesting. Delivery of the shares underlying these director restricted stock units is deferred until termination of the director’s service on the Company’s Board of Directors. The fair value of PRSUs and RSUs is equal to the market value of a share of Common stock on the date of grant and the related compensation expense is recognized ratably over the requisite service period and, for PRSUs, when it is expected that any of the performance criterion will be achieved.
During the year ended
December 31, 2017
, we granted certain employees PRSUs, the vesting of which is based on the Company’s total shareholder return (“TSR”) ranking among a peer group over a three-year performance period. The awards also have a service requirement that equals to the respective performance periods. For these awards subject to market conditions, a binomial-lattice model (i.e., Monte Carlo simulation model) is used to calculate the fair value at grant date. The related compensation expense is recognized, on a straight-line basis, over the vesting period.
The performance criteria have not yet been met for the PRSUs granted during the years ended December 31, 2017, 2016 and 2015.
71
COLFAX CORPORATION
NOTES TO CONSOLIDATED FINANCIAL STATEMENTS — (Continued)
The activity in the Company’s PRSUs and RSUs is as follows:
|
|
PRSUs
|
RSUs
|
|||||||||||
|
|
Number
of Units |
Weighted-
Average Grant Date Fair Value |
Number
of Units |
Weighted-
Average Grant Date Fair Value |
|||||||||
|
Nonvested at January 1, 2017
|
627,316
|
|
$
|
36.25
|
|
583,898
|
|
$
|
34.54
|
|
|||
|
Granted
|
100,811
|
|
40.42
|
|
251,949
|
|
40.04
|
|
|||||
|
Vested
|
(53,498
|
)
|
41.06
|
|
(146,794
|
)
|
39.94
|
|
|||||
|
Forfeited and expired
|
(25,956
|
)
|
68.30
|
|
(173,254
|
)
|
36.50
|
|
|||||
|
Nonvested at December 31, 2017
|
648,673
|
|
$
|
35.22
|
|
515,799
|
|
$
|
35.03
|
|
|||
The fair value of shares vested during the years ended
December 31, 2017
,
2016
and
2015
was
$7.3 million
,
$6.5 million
and
$8.9 million
, respectively.
13. Accrued Liabilities
Accrued liabilities in the Consolidated Balance Sheets consisted of the following:
|
December 31,
|
|||||||
|
2017
|
2016
|
||||||
|
(In thousands)
|
|||||||
|
Accrued payroll
|
$
|
98,132
|
|
$
|
87,045
|
|
|
|
Accrued taxes
|
53,939
|
|
35,429
|
|
|||
|
Accrued asbestos-related liability
|
50,311
|
|
51,166
|
|
|||
|
Warranty liability - current portion
|
32,428
|
|
29,233
|
|
|||
|
Accrued restructuring liability - current portion
|
12,509
|
|
10,783
|
|
|||
|
Accrued third-party commissions
|
14,014
|
|
10,432
|
|
|||
|
Other
|
97,299
|
|
87,238
|
|
|||
|
Accrued liabilities
|
$
|
358,632
|
|
$
|
311,326
|
|
|
72
COLFAX CORPORATION
NOTES TO CONSOLIDATED FINANCIAL STATEMENTS — (Continued)
Accrued Restructuring Liability
The Company’s restructuring programs include a series of restructuring actions to reduce the structural costs of the Company. A summary of the activity in the Company’s restructuring liability included in Accrued liabilities and Other liabilities in the Consolidated Balance Sheets is as follows:
|
Year Ended December 31, 2017
|
|||||||||||||||||||
|
Balance at Beginning of Period
|
Provisions
|
Payments
|
Foreign Currency Translation
|
Balance at End of Period
(3)
|
|||||||||||||||
|
(In thousands)
|
|||||||||||||||||||
|
Restructuring and other related charges:
|
|||||||||||||||||||
|
Air and Gas Handling
:
|
|||||||||||||||||||
|
Termination benefits
(1)
|
$
|
4,855
|
|
$
|
21,605
|
|
$
|
(14,929
|
)
|
$
|
507
|
|
$
|
12,038
|
|
||||
|
Facility closure costs
(2)
|
1,234
|
|
3,961
|
|
(5,397
|
)
|
(15
|
)
|
(217
|
)
|
|||||||||
|
6,089
|
|
25,566
|
|
(20,326
|
)
|
492
|
|
11,821
|
|
||||||||||
|
Non-cash charges
(2)
|
26,628
|
|
|||||||||||||||||
|
52,194
|
|
||||||||||||||||||
|
Fabrication Technology:
|
|||||||||||||||||||
|
Termination benefits
(1)
|
3,712
|
|
5,590
|
|
(8,732
|
)
|
90
|
|
660
|
|
|||||||||
|
Facility closure costs
(2)
|
981
|
|
6,198
|
|
(7,150
|
)
|
13
|
|
42
|
|
|||||||||
|
4,693
|
|
11,788
|
|
(15,882
|
)
|
103
|
|
702
|
|
||||||||||
|
Non-cash charges
(2)
|
4,369
|
|
|||||||||||||||||
|
16,157
|
|
||||||||||||||||||
|
Corporate and Other:
|
|||||||||||||||||||
|
Facility closure costs
(2)
|
203
|
|
—
|
|
(133
|
)
|
14
|
|
84
|
|
|||||||||
|
203
|
|
—
|
|
(133
|
)
|
14
|
|
84
|
|
||||||||||
|
Total
|
$
|
10,985
|
|
37,354
|
|
$
|
(36,341
|
)
|
$
|
609
|
|
$
|
12,607
|
|
|||||
|
Non-cash charges
(2)
|
30,997
|
|
|||||||||||||||||
|
$
|
68,351
|
|
|||||||||||||||||
(1)
Includes severance and other termination benefits, including outplacement services. The Company recognizes the cost of involuntary termination benefits at the communication date or ratably over any remaining expected future service period. Voluntary termination benefits are recognized as a liability and an expense when employees accept the offer and the amount can be reasonably estimated.
(2)
Includes the cost of relocating associates, relocating equipment and lease termination expense in connection with the closure of facilities. During the year ended
December 31, 2017
, the Company recorded a
$4.4 million
non-cash impairment charge for a facility in our Fabrication Technology segment, that was previously closed as part of restructuring activities. The Company recorded a
$26.6 million
non-cash impairment charge for a facility in our Air and Gas Handling segment as part of the Corporate approved restructuring activities.
(3)
As of
December 31, 2017
,
$12.5 million
and
$0.1 million
of the Company’s restructuring liability was included in Accrued liabilities and Other liabilities, respectively.
73
COLFAX CORPORATION
NOTES TO CONSOLIDATED FINANCIAL STATEMENTS — (Continued)
|
Year Ended December 31, 2016
|
|||||||||||||||||||
|
Balance at Beginning of Period
|
Provisions
|
Payments
|
Foreign Currency Translation
|
Balance at End of Period
(3)
|
|||||||||||||||
|
(In thousands)
|
|||||||||||||||||||
|
Restructuring and other related charges:
|
|||||||||||||||||||
|
Air and Gas Handling
:
|
|||||||||||||||||||
|
Termination benefits
(1)
|
$
|
5,656
|
|
$
|
13,599
|
|
$
|
(14,502
|
)
|
$
|
102
|
|
$
|
4,855
|
|
||||
|
Facility closure costs
(2)
|
894
|
|
9,159
|
|
(8,702
|
)
|
(117
|
)
|
1,234
|
|
|||||||||
|
6,550
|
|
22,758
|
|
(23,204
|
)
|
(15
|
)
|
6,089
|
|
||||||||||
|
Non-cash charges
|
3,668
|
|
|||||||||||||||||
|
26,426
|
|
||||||||||||||||||
|
Fabrication Technology:
|
|||||||||||||||||||
|
Termination benefits
(1)
|
6,031
|
|
23,104
|
|
(25,263
|
)
|
(160
|
)
|
3,712
|
|
|||||||||
|
Facility closure costs
(2)
|
426
|
|
7,261
|
|
(6,611
|
)
|
(95
|
)
|
981
|
|
|||||||||
|
6,457
|
|
30,365
|
|
(31,874
|
)
|
(255
|
)
|
4,693
|
|
||||||||||
|
Non-cash charges
|
1,323
|
|
|||||||||||||||||
|
31,688
|
|
||||||||||||||||||
|
Corporate and Other:
|
|||||||||||||||||||
|
Facility closure costs
(2)
|
625
|
|
—
|
|
(344
|
)
|
(78
|
)
|
203
|
|
|||||||||
|
625
|
|
—
|
|
(344
|
)
|
(78
|
)
|
203
|
|
||||||||||
|
Total
|
$
|
13,632
|
|
53,123
|
|
$
|
(55,422
|
)
|
$
|
(348
|
)
|
$
|
10,985
|
|
|||||
|
Non-cash charges
(2)
|
4,991
|
|
|||||||||||||||||
|
$
|
58,114
|
|
|||||||||||||||||
(1)
Includes severance and other termination benefits, including outplacement services. The Company recognizes the cost of involuntary termination benefits at the communication date or ratably over any remaining expected future service period. Voluntary termination benefits are recognized as a liability and an expense when employees accept the offer and the amount can be reasonably estimated.
(2)
Includes the cost of relocating associates, relocating equipment and lease termination expense in connection with the closure of facilities.
(3)
As of
December 31, 2016
,
$10.8 million
and
$0.2 million
of the Company’s restructuring liability was included in Accrued liabilities and Other liabilities, respectively.
The Company expects to incur Restructuring and other related charges of approximately
$32.9 million
during the year ending December 31,
2018
related to its restructuring activities.
14
. Defined Benefit Plans
The Company sponsors various defined benefit plans, defined contribution plans and other post-retirement benefits plans, including health and life insurance, for certain eligible employees or former employees. The Company uses December 31
st
as the measurement date for all of its employee benefit plans.
In connection with the sale of the Fluid Handling business, the Buyer assumed the Fluid Handling liability for all foreign defined benefit plans specific to the Fluid Handling business, a portion of the U.S. defined benefit plan, and certain other postretirement obligations. Net benefit cost for the Fluid Handling business is included in Net income (loss) from discontinued operations, net of taxes, within the Consolidated Statements of Income. See Note 4, “Discontinued Operations” for further information.
During the year ended December 31, 2017, we settled a foreign pension plan - Charter Pension Scheme (CPS) - in connection with a third-party buyout arrangement. As a result of the settlement, we are no longer responsible for any liabilities under CPS and a loss of
$46.5 million
was recognized for the year ended December 31, 2017.
The following table summarizes the total changes in the Company’s pension and accrued post-retirement benefits and plan assets and includes a statement of the plans’ funded status:
74
COLFAX CORPORATION
NOTES TO CONSOLIDATED FINANCIAL STATEMENTS — (Continued)
|
|
Pension Benefits
|
Other Post-Retirement Benefits
|
|||||||||||||
|
|
Year Ended December 31,
|
Year Ended December 31,
|
|||||||||||||
|
|
2017
|
2016
|
2017
|
2016
|
|||||||||||
|
|
(In thousands)
|
||||||||||||||
|
Change in benefit obligation:
|
|
|
|
|
|
|
|
|
|||||||
|
Projected benefit obligation, beginning of year
|
$
|
1,475,276
|
|
$
|
1,550,643
|
|
$
|
26,295
|
|
$
|
33,093
|
|
|||
|
Acquisitions
|
42,830
|
|
—
|
|
310
|
|
—
|
|
|||||||
|
Service cost
|
4,951
|
|
4,059
|
|
11
|
|
39
|
|
|||||||
|
Interest cost
|
42,177
|
|
51,638
|
|
951
|
|
1,038
|
|
|||||||
|
Plan amendment
|
19,389
|
|
—
|
|
35
|
|
—
|
|
|||||||
|
Actuarial loss (gain)
|
78,124
|
|
126,505
|
|
1,307
|
|
(5,689
|
)
|
|||||||
|
Foreign exchange effect
|
82,425
|
|
(158,453
|
)
|
6
|
|
—
|
|
|||||||
|
Benefits paid
|
(93,009
|
)
|
(97,488
|
)
|
(1,875
|
)
|
(2,186
|
)
|
|||||||
|
Divestitures
|
(340,614
|
)
|
—
|
|
(11,751
|
)
|
—
|
|
|||||||
|
Settlements
|
(354,647
|
)
|
(1,591
|
)
|
—
|
|
—
|
|
|||||||
|
Other
|
367
|
|
(37
|
)
|
—
|
|
—
|
|
|||||||
|
Projected benefit obligation, end of year
|
$
|
957,269
|
|
$
|
1,475,276
|
|
$
|
15,289
|
|
$
|
26,295
|
|
|||
|
Accumulated benefit obligation, end of year
|
$
|
947,803
|
|
$
|
1,452,000
|
|
$
|
15,289
|
|
$
|
26,295
|
|
|||
|
Change in plan assets:
|
|
|
|
|
|
|
|
|
|||||||
|
Fair value of plan assets, beginning of year
|
$
|
1,297,900
|
|
$
|
1,337,405
|
|
$
|
—
|
|
$
|
—
|
|
|||
|
Acquisitions
|
36,538
|
|
—
|
|
—
|
|
—
|
|
|||||||
|
Actual return on plan assets
|
111,630
|
|
191,562
|
|
—
|
|
—
|
|
|||||||
|
Employer contribution
|
35,996
|
|
32,347
|
|
1,875
|
|
2,186
|
|
|||||||
|
Foreign exchange effect
|
74,565
|
|
(164,316
|
)
|
—
|
|
—
|
|
|||||||
|
Benefits paid
|
(93,009
|
)
|
(97,488
|
)
|
(1,875
|
)
|
(2,186
|
)
|
|||||||
|
Divestitures
|
(204,673
|
)
|
—
|
|
—
|
|
—
|
|
|||||||
|
Settlements
|
(354,647
|
)
|
(1,591
|
)
|
—
|
|
—
|
|
|||||||
|
Other
|
46
|
|
(19
|
)
|
—
|
|
—
|
|
|||||||
|
Fair value of plan assets, end of year
|
$
|
904,346
|
|
$
|
1,297,900
|
|
$
|
—
|
|
$
|
—
|
|
|||
|
Funded status, end of year
|
$
|
(52,923
|
)
|
$
|
(177,376
|
)
|
$
|
(15,289
|
)
|
$
|
(26,295
|
)
|
|||
|
Amounts recognized on the Consolidated Balance Sheet at December 31:
|
|
|
|
|
|
|
|
|
|||||||
|
Non-current assets
|
$
|
65,060
|
|
$
|
85,347
|
|
$
|
—
|
|
$
|
—
|
|
|||
|
Assets held for sale, less current portion
|
—
|
|
481
|
|
—
|
|
—
|
|
|||||||
|
Current liabilities
|
(4,171
|
)
|
(4,026
|
)
|
(1,507
|
)
|
(961
|
)
|
|||||||
|
Non-current liabilities
|
(113,812
|
)
|
(111,736
|
)
|
(13,782
|
)
|
(14,294
|
)
|
|||||||
|
Current portion of liabilities held for sale
|
—
|
|
(1,047
|
)
|
—
|
|
(1,213
|
)
|
|||||||
|
Liabilities held for sale, less current portion
|
—
|
|
(146,395
|
)
|
—
|
|
(9,827
|
)
|
|||||||
|
Total
|
$
|
(52,923
|
)
|
$
|
(177,376
|
)
|
$
|
(15,289
|
)
|
$
|
(26,295
|
)
|
|||
The accumulated benefit obligation and fair value of plan assets for the pension plans with accumulated benefit obligations in excess of plan assets were
$0.4 billion
and
$0.2 billion
, respectively, as of
December 31, 2017
and
$0.6 billion
and
$0.4 billion
, respectively, as of
December 31, 2016
.
The projected benefit obligation and fair value of plan assets for the pension plans with projected benefit obligations in excess of plan assets were
$0.4 billion
and
$0.2 billion
, respectively, as of
December 31, 2017
and
$0.6 billion
and
$0.4 billion
, respectively, as of
December 31, 2016
.
$0.3 billion
of the projected benefit obligation and
$0.2 billion
of the fair value of plan assets were included in assets held for sale and liabilities held for sale, respectively, in the Consolidated Balance Sheets as of
December 31, 2016
.
75
COLFAX CORPORATION
NOTES TO CONSOLIDATED FINANCIAL STATEMENTS — (Continued)
The following table summarizes the changes in the Company’s foreign pension benefit obligation, which is determined based upon an employee’s expected date of separation, and plan assets, included in the table above, and includes a statement of the plans’ funded status:
|
|
Foreign Pension Benefits
|
||||||
|
|
Year Ended December 31,
|
||||||
|
|
2017
|
2016
|
|||||
|
|
(In thousands)
|
||||||
|
Change in benefit obligation:
|
|
|
|
|
|||
|
Projected benefit obligation, beginning of year
|
$
|
1,033,193
|
|
$
|
1,075,223
|
|
|
|
Acquisitions
|
42,830
|
|
—
|
|
|||
|
Service cost
|
4,804
|
|
3,881
|
|
|||
|
Interest cost
|
27,133
|
|
34,298
|
|
|||
|
Plan amendments
|
19,389
|
|
—
|
|
|||
|
Actuarial loss (gain)
|
70,849
|
|
132,898
|
|
|||
|
Foreign exchange effect
|
82,425
|
|
(158,453
|
)
|
|||
|
Benefits paid
|
(60,510
|
)
|
(53,028
|
)
|
|||
|
Divestitures
|
(136,114
|
)
|
—
|
|
|||
|
Settlements
|
(354,647
|
)
|
(1,591
|
)
|
|||
|
Other
|
41
|
|
(35
|
)
|
|||
|
Projected benefit obligation, end of year
|
$
|
729,393
|
|
$
|
1,033,193
|
|
|
|
Accumulated benefit obligation, end of year
|
$
|
719,927
|
|
$
|
1,009,916
|
|
|
|
Change in plan assets:
|
|
|
|
|
|||
|
Fair value of plan assets, beginning of year
|
$
|
953,455
|
|
$
|
981,249
|
|
|
|
Acquisitions
|
36,538
|
|
—
|
|
|||
|
Actual return on plan assets
|
59,924
|
|
158,992
|
|
|||
|
Employer contribution
|
35,815
|
|
32,168
|
|
|||
|
Foreign exchange effect
|
74,565
|
|
(164,316
|
)
|
|||
|
Benefits paid
|
(60,510
|
)
|
(53,028
|
)
|
|||
|
Divestitures
|
(28,102
|
)
|
—
|
|
|||
|
Settlements
|
(354,647
|
)
|
(1,591
|
)
|
|||
|
Other
|
47
|
|
(19
|
)
|
|||
|
Fair value of plan assets, end of year
|
$
|
717,085
|
|
$
|
953,455
|
|
|
|
Funded status, end of year
|
$
|
(12,308
|
)
|
$
|
(79,738
|
)
|
|
Expected contributions to the Company’s pension and other post-employment benefit plans for the year ending December 31,
2018
, related to plans as of
December 31, 2017
, are
$40.5 million
. The following benefit payments are expected to be paid during each respective fiscal year:
|
|
Pension Benefits
|
Other Post-Retirement Benefits
|
|||||||||
|
|
All Plans
|
Foreign Plans
|
|||||||||
|
|
(In thousands)
|
||||||||||
|
2018
|
$
|
54,204
|
|
$
|
37,715
|
|
$
|
1,507
|
|
||
|
2019
|
54,784
|
|
38,495
|
|
1,354
|
|
|||||
|
2020
|
55,179
|
|
39,024
|
|
1,205
|
|
|||||
|
2021
|
56,779
|
|
40,866
|
|
1,079
|
|
|||||
|
2022
|
56,773
|
|
41,150
|
|
1,008
|
|
|||||
|
2023- 2027
|
292,410
|
|
200,091
|
|
4,232
|
|
|||||
76
COLFAX CORPORATION
NOTES TO CONSOLIDATED FINANCIAL STATEMENTS — (Continued)
The Company’s primary investment objective for its pension plan assets is to provide a source of retirement income for the plans’ participants and beneficiaries. The assets are invested with the goal of preserving principal while providing a reasonable real rate of return over the long term. Diversification of assets is achieved through strategic allocations to various asset classes. Actual allocations to each asset class vary due to periodic investment strategy changes, market value fluctuations, the length of time it takes to fully implement investment allocation positions, and the timing of benefit payments and contributions. The asset allocation is monitored and rebalanced as required, as frequently as on a quarterly basis in some instances. The following are the actual and target allocation percentages for the Company’s pension plan assets:
|
|
Actual Asset Allocation
December 31, |
Target |
|||||
|
|
2017
|
2016
|
Allocation
|
||||
|
U.S. Plans:
|
|
|
|||||
|
Equity securities:
|
|
|
|
|
|
||
|
U.S.
|
44
|
%
|
44
|
%
|
30% - 45%
|
||
|
International
|
16
|
%
|
15
|
%
|
10% - 20%
|
||
|
Fixed income
|
39
|
%
|
36
|
%
|
30% - 50%
|
||
|
Other
|
—
|
%
|
1
|
%
|
0% - 20%
|
||
|
Cash and cash equivalents
|
1
|
%
|
4
|
%
|
0% - 5%
|
||
|
Foreign Plans:
|
|
|
|
|
|
||
|
Equity securities
|
31
|
%
|
32
|
%
|
25%-40%
|
||
|
Fixed income securities
|
60
|
%
|
65
|
%
|
60%-75%
|
||
|
Cash and cash equivalents
|
1
|
%
|
1
|
%
|
0% - 25%
|
||
|
Other
|
8
|
%
|
2
|
%
|
0% - 10%
|
||
A summary of the Company’s pension plan assets for each fair value hierarchy level for the periods presented follows (see Note 15, “Financial Instruments and Fair Value Measurements” for further description of the levels within the fair value hierarchy):
|
|
December 31, 2017
|
||||||||||||||||||
|
|
Measured at Net Asset Value
(1)
|
Level
One |
Level
Two |
Level
Three |
Total |
||||||||||||||
|
|
(In thousands)
|
||||||||||||||||||
|
U.S. Plans:
|
|
|
|
|
|
|
|
|
|||||||||||
|
Cash and cash equivalents
|
$
|
—
|
|
$
|
1,591
|
|
$
|
—
|
|
$
|
—
|
|
$
|
1,591
|
|
||||
|
Equity securities:
|
|
|
|
|
|
|
|
|
|
|
|||||||||
|
U.S. large cap
|
49,351
|
|
—
|
|
—
|
|
—
|
|
49,351
|
|
|||||||||
|
U.S. small/mid cap
|
20,396
|
|
13,360
|
|
—
|
|
—
|
|
33,756
|
|
|||||||||
|
International
|
29,236
|
|
—
|
|
—
|
|
—
|
|
29,236
|
|
|||||||||
|
Fixed income mutual funds:
|
|
|
|
|
|
|
|
|
|
|
|||||||||
|
U.S. government and corporate
|
72,313
|
|
—
|
|
—
|
|
—
|
|
72,313
|
|
|||||||||
|
Other
(2)
|
—
|
|
1,015
|
|
—
|
|
—
|
|
1,015
|
|
|||||||||
|
Foreign Plans:
|
|
|
|
|
|
|
|
|
|
|
|||||||||
|
Cash and cash equivalents
|
—
|
|
3,636
|
|
—
|
|
—
|
|
3,636
|
|
|||||||||
|
Equity securities
|
78,681
|
|
142,152
|
|
—
|
|
—
|
|
220,833
|
|
|||||||||
|
Non-U.S. government and corporate bonds
|
—
|
|
430,546
|
|
2,077
|
|
—
|
|
432,623
|
|
|||||||||
|
Other
(2)
|
—
|
|
573
|
|
59,419
|
|
—
|
|
59,992
|
|
|||||||||
|
|
$
|
249,977
|
|
$
|
592,873
|
|
$
|
61,496
|
|
$
|
—
|
|
$
|
904,346
|
|
||||
|
(1)
|
Certain investments that are measured at fair value using the net asset value per share (or its equivalent) practical expedient (the “NAV”) have not been classified in the fair value hierarchy. These investments, consisting of common/collective trusts, are valued using the NAV provided by the Trustee. The NAV is based on the underlying investments held by the fund, that are traded in an active market, less its liabilities. These investments are able to be redeemed in the near-term.
|
|
(2)
|
Represents diversified portfolio funds, reinsurance contracts and money market funds.
|
77
COLFAX CORPORATION
NOTES TO CONSOLIDATED FINANCIAL STATEMENTS — (Continued)
|
|
December 31, 2016
|
||||||||||||||||||
|
|
Measured at Net Asset Value
(1)
|
Level
One |
Level
Two |
Level
Three |
Total |
||||||||||||||
|
|
(In thousands)
|
||||||||||||||||||
|
U.S. Plans:
|
|
|
|
|
|
|
|
|
|||||||||||
|
Cash and cash equivalents
|
$
|
—
|
|
$
|
16,517
|
|
$
|
—
|
|
$
|
—
|
|
$
|
16,517
|
|
||||
|
Equity securities:
|
|
|
|
|
|
|
|
|
|||||||||||
|
U.S. large cap
|
$
|
97,530
|
|
$
|
—
|
|
$
|
—
|
|
$
|
—
|
|
$
|
97,530
|
|
||||
|
U.S. small/mid cap
|
41,141
|
|
12,116
|
|
—
|
|
—
|
|
53,257
|
|
|||||||||
|
International
|
51,656
|
|
—
|
|
—
|
|
—
|
|
51,656
|
|
|||||||||
|
Fixed income mutual funds:
|
|
|
|
|
|
|
|
|
|||||||||||
|
U.S. government and corporate
|
123,663
|
|
—
|
|
—
|
|
—
|
|
123,663
|
|
|||||||||
|
Other
(2)
|
—
|
|
1,822
|
|
—
|
|
—
|
|
1,822
|
|
|||||||||
|
Foreign Plans:
|
|
|
|
|
|
|
|
|
|||||||||||
|
Cash and cash equivalents
|
—
|
|
8,758
|
|
—
|
|
—
|
|
8,758
|
|
|||||||||
|
Equity securities
|
129,525
|
|
144,696
|
|
32,966
|
|
—
|
|
307,187
|
|
|||||||||
|
Non-U.S. government and corporate bonds
|
—
|
|
292,288
|
|
321,657
|
|
—
|
|
613,945
|
|
|||||||||
|
Other
(2)
|
—
|
|
592
|
|
22,973
|
|
—
|
|
23,565
|
|
|||||||||
|
|
$
|
443,515
|
|
$
|
476,789
|
|
$
|
377,596
|
|
$
|
—
|
|
$
|
1,297,900
|
|
||||
|
(1)
|
Certain investments that are measured at fair value using the net asset value per share (or its equivalent) practical expedient (the “NAV”) have not been classified in the fair value hierarchy. These investments, consisting primarily of common/collective trusts, are valued using the NAV provided by the Trustee. The NAV is based on the underlying investments held by the fund, that are traded in an active market, less its liabilities. These investments are able to be redeemed in the near-term.
|
|
(2)
|
Represents diversified portfolio funds, reinsurance contracts and money market funds.
|
The following table sets forth the components of net periodic benefit cost and Other comprehensive loss of the Company’s defined benefit pension plans and other post-retirement employee benefit plans:
|
|
Pension Benefits
|
Other Post-Retirement Benefits
|
|||||||||||||||||||||
|
|
Year Ended December 31,
|
Year Ended December 31,
|
|||||||||||||||||||||
|
|
2017
|
2016
|
2015
|
2017
|
2016
|
2015
|
|||||||||||||||||
|
|
(In thousands)
|
||||||||||||||||||||||
|
Components of Net Periodic Benefit Cost:
|
|
|
|
|
|
|
|
|
|
|
|
|
|||||||||||
|
Service cost
|
$
|
4,951
|
|
$
|
4,059
|
|
$
|
4,612
|
|
$
|
11
|
|
$
|
39
|
|
$
|
33
|
|
|||||
|
Interest cost
|
42,177
|
|
51,638
|
|
54,807
|
|
951
|
|
1,038
|
|
1,170
|
|
|||||||||||
|
Amortization
|
10,660
|
|
8,334
|
|
11,515
|
|
(839
|
)
|
(407
|
)
|
259
|
|
|||||||||||
|
Settlement loss (gain)
|
46,933
|
|
48
|
|
(582
|
)
|
—
|
|
—
|
|
—
|
|
|||||||||||
|
Divestitures loss (gain)
|
(17,858
|
)
|
—
|
|
—
|
|
(13,744
|
)
|
—
|
|
—
|
|
|||||||||||
|
Other
|
—
|
|
37
|
|
525
|
|
207
|
|
—
|
|
174
|
|
|||||||||||
|
Expected return on plan assets
|
(48,484
|
)
|
(57,169
|
)
|
(58,107
|
)
|
—
|
|
—
|
|
—
|
|
|||||||||||
|
Net periodic benefit cost
|
$
|
38,379
|
|
$
|
6,947
|
|
$
|
12,770
|
|
$
|
(13,414
|
)
|
$
|
670
|
|
$
|
1,636
|
|
|||||
|
Change in Plan Assets and Benefit Obligations Recognized in Other Comprehensive Loss:
|
|
|
|
|
|
|
|
|
|
|
|
|
|||||||||||
|
Current year net actuarial (gain) loss
|
$
|
19,193
|
|
$
|
(9,523
|
)
|
$
|
(33,558
|
)
|
$
|
1,307
|
|
$
|
(5,689
|
)
|
$
|
(6,410
|
)
|
|||||
|
Current year prior service cost
|
19,389
|
|
—
|
|
—
|
|
35
|
|
—
|
|
—
|
|
|||||||||||
|
Less amounts included in net periodic benefit cost:
|
|
|
|
|
|
|
|
|
|
|
|
|
|||||||||||
|
Amortization of net loss
|
(10,682
|
)
|
(8,362
|
)
|
(11,515
|
)
|
971
|
|
655
|
|
(11
|
)
|
|||||||||||
|
Settlement/divestiture/other (gain) loss
|
(163,199
|
)
|
(74
|
)
|
(952
|
)
|
1,787
|
|
—
|
|
—
|
|
|||||||||||
|
Amortization of prior service cost
|
23
|
|
28
|
|
—
|
|
(132
|
)
|
(248
|
)
|
(248
|
)
|
|||||||||||
|
Total recognized in Other comprehensive loss
|
$
|
(135,276
|
)
|
$
|
(17,931
|
)
|
$
|
(46,025
|
)
|
$
|
3,968
|
|
$
|
(5,282
|
)
|
$
|
(6,669
|
)
|
|||||
78
COLFAX CORPORATION
NOTES TO CONSOLIDATED FINANCIAL STATEMENTS — (Continued)
Net periodic benefit cost of
$7.7 million
,
$7.1 million
and
$8.6 million
for the years ended
December 31, 2017
,
2016
and
2015
, respectively, are included in Income (loss) from discontinued operations.
The following table sets forth the components of net periodic benefit cost and Other comprehensive loss of the foreign defined benefit pension plans, included in the table above:
|
|
Foreign Pension Benefits
|
||||||||||
|
|
Year Ended December 31,
|
||||||||||
|
|
2017
|
2016
|
2015
|
||||||||
|
|
(In thousands)
|
||||||||||
|
Components of Net Periodic Benefit Cost:
|
|
||||||||||
|
Service cost
|
$
|
4,804
|
|
$
|
3,881
|
|
$
|
4,506
|
|
||
|
Interest cost
|
27,133
|
|
34,298
|
|
37,253
|
|
|||||
|
Amortization
|
4,229
|
|
1,870
|
|
4,272
|
|
|||||
|
Settlement loss (gain)
|
45,110
|
|
48
|
|
(582
|
)
|
|||||
|
Divestitures loss (gain)
|
(56,798
|
)
|
—
|
|
—
|
|
|||||
|
Other
|
—
|
|
37
|
|
525
|
|
|||||
|
Expected return on plan assets
|
(27,714
|
)
|
(32,596
|
)
|
(32,921
|
)
|
|||||
|
Net periodic benefit cost
|
$
|
(3,236
|
)
|
$
|
7,538
|
|
$
|
13,053
|
|
||
|
Change in Plan Assets and Benefit Obligations Recognized in Other Comprehensive Loss:
|
|
|
|
|
|
|
|||||
|
Current year net actuarial loss (gain)
|
$
|
42,854
|
|
$
|
4,867
|
|
$
|
(50,216
|
)
|
||
|
Current year prior service cost
|
19,389
|
|
—
|
|
—
|
|
|||||
|
Less amounts included in net periodic benefit cost:
|
|
|
|
|
|
|
|||||
|
Amortization of net loss
|
(4,251
|
)
|
(1,898
|
)
|
(4,272
|
)
|
|||||
|
Settlement/divestiture/other (gain) loss
|
(96,331
|
)
|
(74
|
)
|
(952
|
)
|
|||||
|
Amortization of prior service cost
|
23
|
|
28
|
|
—
|
|
|||||
|
Total recognized in Other comprehensive loss
|
$
|
(38,316
|
)
|
$
|
2,923
|
|
$
|
(55,440
|
)
|
||
The components of net unrecognized pension and other post-retirement benefit cost included in Accumulated other comprehensive loss in the Consolidated Balance Sheets that have not been recognized as a component of net periodic benefit cost are as follows:
|
|
Pension Benefits
|
Other Post-Retirement
Benefits |
|||||||||||||
|
|
December 31,
|
December 31,
|
|||||||||||||
|
|
2017
|
2016
|
2017
|
2016
|
|||||||||||
|
|
(In thousands)
|
||||||||||||||
|
Net actuarial loss (gain)
|
$
|
86,018
|
|
$
|
221,294
|
|
$
|
(2,603
|
)
|
$
|
(6,878
|
)
|
|||
|
Prior service cost
|
—
|
|
—
|
|
3
|
|
310
|
|
|||||||
|
Total
|
$
|
86,018
|
|
$
|
221,294
|
|
$
|
(2,600
|
)
|
$
|
(6,568
|
)
|
|||
The components of net unrecognized pension and other post-retirement benefit cost included in Accumulated other comprehensive loss in the Consolidated Balance Sheet that are expected to be recognized as a component of net periodic benefit cost during the year ending December 31,
2018
are as follows:
|
|
Pension Benefits
|
Other Post-
Retirement Benefits |
|||||
|
|
(In thousands)
|
||||||
|
Net actuarial loss (gain)
|
$
|
4,602
|
|
$
|
(91
|
)
|
|
|
Prior service cost
|
—
|
|
3
|
|
|||
|
Total
|
$
|
4,602
|
|
$
|
(88
|
)
|
|
79
COLFAX CORPORATION
NOTES TO CONSOLIDATED FINANCIAL STATEMENTS — (Continued)
The key economic assumptions used in the measurement of the Company’s pension and other post-retirement benefit obligations are as follows:
|
|
Pension Benefits
|
Other Post-Retirement
Benefits |
|||||||||
|
|
December 31,
|
December 31,
|
|||||||||
|
|
2017
|
2016
|
2017
|
2016
|
|||||||
|
Weighted-average discount rate:
|
|
|
|
|
|
|
|
|
|||
|
All plans
|
2.6
|
%
|
2.9
|
%
|
3.4
|
%
|
3.9
|
%
|
|||
|
Foreign plans
|
2.4
|
%
|
2.6
|
%
|
—
|
|
—
|
|
|||
|
Weighted-average rate of increase in compensation levels for active foreign plans
|
2.1
|
%
|
1.6
|
%
|
—
|
|
—
|
|
|||
The key economic assumptions used in the computation of net periodic benefit cost are as follows:
|
Pension Benefits
|
Other Post-Retirement Benefits
|
||||||||||||||||
|
|
Year Ended December 31,
|
Year Ended December 31,
|
|||||||||||||||
|
|
2017
|
2016
|
2015
|
2017
|
2016
|
2015
|
|||||||||||
|
Weighted-average discount rate:
|
|
|
|
|
|
|
|
|
|
|
|
|
|||||
|
All plans
|
2.9
|
%
|
3.6
|
%
|
3.3
|
%
|
3.9
|
%
|
4.0
|
%
|
3.6
|
%
|
|||||
|
Foreign plans
|
2.6
|
%
|
3.5
|
%
|
3.3
|
%
|
—
|
|
—
|
|
—
|
|
|||||
|
Weighted-average expected return on plan assets:
|
|
|
|
|
|
|
|
|
|
|
|
|
|||||
|
All plans
|
4.1
|
%
|
4.8
|
%
|
4.7
|
%
|
—
|
|
—
|
|
—
|
|
|||||
|
Foreign plans
|
3.3
|
%
|
4.1
|
%
|
3.9
|
%
|
—
|
|
—
|
|
—
|
|
|||||
|
Weighted-average rate of increase in compensation levels for active foreign plans
|
1.6
|
%
|
1.5
|
%
|
1.6
|
%
|
—
|
|
—
|
|
—
|
|
|||||
In determining discount rates, the Company utilizes the single discount rate equivalent to discounting the expected future cash flows from each plan using the yields at each duration from a published yield curve as of the measurement date.
For measurement purposes, a weighted-average annual rate of increase in the per capita cost of covered health care benefits of approximately
6.3%
was assumed.
The rate was assumed to decrease gradually to 4.50% by 2027 and remain at that level thereafter for benefits covered under the plans.
The expected long-term rate of return on plan assets was based on the Company’s investment policy target allocation of the asset portfolio between various asset classes and the expected real returns of each asset class over various periods of time that are consistent with the long-term nature of the underlying obligations of these plans.
Assumed health care cost trend rates have a significant effect on the amounts reported for the health care plan. A one-percentage point change in assumed health care cost trend rates would have the following pre-tax effects:
|
|
1% Increase
|
1% Decrease
|
|||||
|
|
(In thousands)
|
||||||
|
Effect on total service and interest cost components for the year ended December 31, 2017
|
$
|
88
|
|
$
|
(72
|
)
|
|
|
Effect on post-retirement benefit obligation at December 31, 2017
|
809
|
|
(682
|
)
|
|||
The Company maintains defined contribution plans covering certain union and non-union employees. The Company’s expense for the years ended
December 31, 2017
,
2016
and
2015
was
$29.0 million
,
$22.9 million
and
$26.5 million
, respectively. Total expense included in Income (loss) from discontinued operations for the years ended
December 31, 2017
,
2016
and
2015
was
$3.1 million
,
$2.8 million
and
$3.3 million
.
80
COLFAX CORPORATION
NOTES TO CONSOLIDATED FINANCIAL STATEMENTS — (Continued)
15. Financial Instruments and Fair Value Measurements
The Company utilizes fair value measurement guidance prescribed by accounting standards to value its financial instruments. The guidance establishes a fair value hierarchy based on the inputs used to measure fair value. This hierarchy prioritizes the inputs into three broad levels as follows:
Level One:
Inputs to the valuation methodology are unadjusted quoted prices for identical assets or liabilities in active markets.
Level Two:
Inputs to the valuation methodology include quoted prices for similar assets and liabilities in active markets, quoted prices for identical or similar assets or liabilities in inactive markets, and inputs that are observable for the asset or liability, either directly or indirectly, for substantially the full term of the financial instrument.
Level Three:
Inputs to the valuation methodology are unobservable and significant to the fair value measurement.
A financial instrument’s level within the fair value hierarchy is based on the lowest level of any input that is significant to the fair value measurement.
The carrying values of financial instruments, including Trade receivables, other receivables and Accounts payable, approximate their fair values due to their short-term maturities. The estimated fair value of the Company’s debt of
$1.1 billion
and
$1.3 billion
as of
December 31, 2017
and 2016, respectively, was based on current interest rates for similar types of borrowings and is in Level Two of the fair value hierarchy. The estimated fair values may not represent actual values of the financial instruments that could be realized as of the balance sheet date or that will be realized in the future.
81
COLFAX CORPORATION
NOTES TO CONSOLIDATED FINANCIAL STATEMENTS — (Continued)
A summary of the Company’s assets and liabilities that are measured at fair value on a recurring basis for each fair value hierarchy level for the periods presented is as follows:
|
December 31, 2017
|
|||||||||||||||
|
Level
One |
Level
Two |
Level
Three |
Total
|
||||||||||||
|
(In thousands)
|
|||||||||||||||
|
Assets:
|
|||||||||||||||
|
Cash equivalents
|
$
|
24,083
|
|
$
|
—
|
|
$
|
—
|
|
$
|
24,083
|
|
|||
|
Short term investments
|
—
|
|
149,608
|
|
—
|
|
149,608
|
|
|||||||
|
Foreign currency contracts related to sales - designated as hedges
|
—
|
|
3,287
|
|
—
|
|
3,287
|
|
|||||||
|
Foreign currency contracts related to sales - not designated as hedges
|
—
|
|
43
|
|
—
|
|
43
|
|
|||||||
|
Foreign currency contracts related to purchases - designated as hedges
|
—
|
|
493
|
|
—
|
|
493
|
|
|||||||
|
Foreign currency contracts related to purchases - not designated as hedges
|
—
|
|
1,038
|
|
—
|
|
1,038
|
|
|||||||
|
Deferred compensation plans
|
—
|
|
6,374
|
|
—
|
|
6,374
|
|
|||||||
|
$
|
24,083
|
|
$
|
160,843
|
|
$
|
—
|
|
$
|
184,926
|
|
||||
|
Liabilities:
|
|||||||||||||||
|
Foreign currency contracts related to sales - designated as hedges
|
$
|
—
|
|
$
|
1,257
|
|
$
|
—
|
|
$
|
1,257
|
|
|||
|
Foreign currency contracts related to sales - not designated as hedges
|
—
|
|
740
|
|
—
|
|
740
|
|
|||||||
|
Foreign currency contracts related to purchases - designated as hedges
|
—
|
|
1,332
|
|
—
|
|
1,332
|
|
|||||||
|
Foreign currency contracts related to purchases - not designated as hedges
|
—
|
|
449
|
|
—
|
|
449
|
|
|||||||
|
Deferred compensation plans
|
—
|
|
6,374
|
|
—
|
|
6,374
|
|
|||||||
|
$
|
—
|
|
$
|
10,152
|
|
$
|
—
|
|
$
|
10,152
|
|
||||
|
December 31, 2016
|
|||||||||||||||
|
Level
One |
Level
Two |
Level
Three |
Total
|
||||||||||||
|
(In thousands)
|
|||||||||||||||
|
Assets:
|
|||||||||||||||
|
Cash equivalents
|
$
|
24,603
|
|
$
|
—
|
|
$
|
—
|
|
$
|
24,603
|
|
|||
|
Short term investments
|
—
|
|
—
|
|
—
|
|
—
|
|
|||||||
|
Foreign currency contracts related to sales - designated as hedges
|
—
|
|
992
|
|
—
|
|
992
|
|
|||||||
|
Foreign currency contracts related to sales - not designated as hedges
|
—
|
|
1,285
|
|
—
|
|
1,285
|
|
|||||||
|
Foreign currency contracts related to purchases - designated as hedges
|
—
|
|
4,224
|
|
—
|
|
4,224
|
|
|||||||
|
Foreign currency contracts related to purchases - not designated as hedges
|
—
|
|
120
|
|
—
|
|
120
|
|
|||||||
|
Deferred compensation plans
|
—
|
|
4,586
|
|
—
|
|
4,586
|
|
|||||||
|
$
|
24,603
|
|
$
|
11,207
|
|
$
|
—
|
|
$
|
35,810
|
|
||||
|
Liabilities:
|
|||||||||||||||
|
Foreign currency contracts related to sales - designated as hedges
|
$
|
—
|
|
$
|
11,280
|
|
$
|
—
|
|
$
|
11,280
|
|
|||
|
Foreign currency contracts related to sales - not designated as hedges
|
—
|
|
256
|
|
—
|
|
256
|
|
|||||||
|
Foreign currency contracts related to purchases - designated as hedges
|
—
|
|
469
|
|
—
|
|
469
|
|
|||||||
|
Foreign currency contracts related to purchases - not designated as hedges
|
—
|
|
1,004
|
|
—
|
|
1,004
|
|
|||||||
|
Deferred compensation plans
|
—
|
|
4,586
|
|
—
|
|
4,586
|
|
|||||||
|
$
|
—
|
|
$
|
17,595
|
|
$
|
—
|
|
$
|
17,595
|
|
||||
There were no transfers in or out of Level One, Two or Three during the
year ended December 31, 2017
.
Cash Equivalents
The Company’s cash equivalents consist of investments in interest-bearing deposit accounts and money market mutual funds which are valued based on quoted market prices. The fair value of these investments approximate cost due to their short-term maturities and the high credit quality of the issuers of the underlying securities.
82
COLFAX CORPORATION
NOTES TO CONSOLIDATED FINANCIAL STATEMENTS — (Continued)
Short Term Investments
The short term investments held by the Company are CIRCOR Shares received as part of the consideration for the sale of Fluid Handling. Pursuant to the Purchase Agreement, the Company is prohibited from transferring any of the CIRCOR Shares for a period of six months following the date of closing (the “Lock-up Period”). Using available market inputs, the shares were valued and given an appropriate discount rate reflecting the Lock-up Period.
Derivatives
The Company periodically enters into foreign currency, interest rate swap and commodity derivative contracts. As the Company has manufacturing sites throughout the world and sells its products globally, the Company is exposed to movements in the exchange rates of various currencies. As a result, the Company enters into cross currency swaps and forward contracts to mitigate this exchange rate risk. Additionally, to mitigate a portion of the foreign exchange risk associated with the translation of the net assets of foreign subsidiaries, the Company’s DB Credit Agreement includes debt denominated in Euro which has been designated as a net investment hedge. See Note 11, “Debt” for details. As the Company’s borrowings under the DB Credit Agreement include variable interest rates, the Company periodically enters into interest rate swap or collar agreements to mitigate interest rate risk. Commodity futures contracts are used to manage costs of raw materials used in the Company’s production processes. There were no changes during the periods presented in the Company’s valuation techniques used to measure asset and liability fair values on a recurring basis.
Foreign Currency Contracts
Foreign currency contracts are measured using broker quotations or observable market transactions in either listed or over-the-counter markets. The Company primarily uses foreign currency contracts to mitigate the risk associated with customer forward sale agreements denominated in currencies other than the applicable local currency, and to match costs and expected revenues where production facilities have a different currency than the selling currency.
As of
December 31, 2017
and
2016
, the Company had foreign currency contracts with the following notional values:
|
December 31,
|
|||||||
|
2017
|
2016
|
||||||
|
(In thousands)
|
|||||||
|
Foreign currency contracts sold - not designated as hedges
|
$
|
37,143
|
|
$
|
85,542
|
|
|
|
Foreign currency contracts sold - designated as hedges
|
174,194
|
|
215,086
|
|
|||
|
Foreign currency contracts purchased - not designated as hedges
|
103,975
|
|
40,127
|
|
|||
|
Foreign currency contracts purchased - designated as hedges
|
59,055
|
|
84,604
|
|
|||
|
Total foreign currency derivatives
|
$
|
374,367
|
|
$
|
425,359
|
|
|
83
COLFAX CORPORATION
NOTES TO CONSOLIDATED FINANCIAL STATEMENTS — (Continued)
The Company recognized the following in its Consolidated Financial Statements related to its derivative instruments:
|
Year Ended
|
|||||||||||
|
2017
|
2016
|
2015
|
|||||||||
|
(In thousands)
|
|||||||||||
|
Contracts Designated as Hedges:
|
|||||||||||
|
Foreign Currency Contracts - related to customer sales contracts:
|
|||||||||||
|
Unrealized gain (loss)
|
$
|
3,812
|
|
$
|
1,847
|
|
$
|
(2,350
|
)
|
||
|
Realized gain (loss)
|
1,954
|
|
(4,771
|
)
|
(512
|
)
|
|||||
|
Foreign Currency Contracts - related to supplier purchase contracts:
|
|||||||||||
|
Unrealized gain (loss)
|
1,109
|
|
(1,269
|
)
|
(1,173
|
)
|
|||||
|
Realized (loss) gain
|
(2,737
|
)
|
2,570
|
|
756
|
|
|||||
|
Unrealized (loss) gain on net investment hedges
(1)
|
(32,388
|
)
|
18,537
|
|
14,537
|
|
|||||
|
Contracts Not Designated in a Hedge Relationship:
|
|||||||||||
|
Foreign Currency Contracts - related to customer sales contracts:
|
|||||||||||
|
Unrealized (loss) gain
|
(1,725
|
)
|
1,464
|
|
2,129
|
|
|||||
|
Realized gain (loss)
|
1,712
|
|
(285
|
)
|
(5,164
|
)
|
|||||
|
Foreign Currency Contracts - related to supplier purchases contracts:
|
|||||||||||
|
Unrealized gain (loss)
|
1,472
|
|
(1,095
|
)
|
(214
|
)
|
|||||
|
Realized (loss) gain
|
(358
|
)
|
(653
|
)
|
1,132
|
|
|||||
(1)
The unrealized (loss) gain on net investment hedges is attributable to the change in valuation of Euro denominated debt.
Concentration of Credit Risk
Financial instruments which potentially subject the Company to concentrations of credit risk consist primarily of trade accounts receivable. Concentrations of credit risk are considered to exist when there are amounts collectible from multiple counterparties with similar characteristics, which could cause their ability to meet contractual obligations to be similarly impacted by economic or other conditions. The Company performs credit evaluations of its customers prior to delivery or commencement of services and normally does not require collateral. Letters of credit are occasionally required when the Company deems necessary. Customers purchasing from our operations in China represented
23%
and
25%
of the Company’s Accounts receivable, net as of
December 31, 2017
and
2016
, respectively.
16
. Commitments and Contingencies
Asbestos and Other Product Liability Contingencies
Certain subsidiaries are each one of many defendants in a large number of lawsuits that claim personal injury as a result of exposure to asbestos from products manufactured with components that are alleged to have contained asbestos. Such components were acquired from third-party suppliers, and were not manufactured by any of the Company’s subsidiaries nor were the subsidiaries producers or direct suppliers of asbestos. The manufactured products that are alleged to have contained asbestos generally were provided to meet the specifications of the subsidiaries’ customers, including the U.S. Navy. The subsidiaries settle asbestos claims for amounts the Company considers reasonable given the facts and circumstances of each claim. The annual average settlement payment per asbestos claimant has fluctuated during the past several years. The Company expects such fluctuations to continue in the future based upon, among other things, the number and type of claims settled in a particular period and the jurisdictions in which such claims arise. To date, the majority of settled claims have been dismissed for no payment.
84
COLFAX CORPORATION
NOTES TO CONSOLIDATED FINANCIAL STATEMENTS — (Continued)
On September 24, 2017, we entered into the Purchase Agreement with CIRCOR, pursuant to which CIRCOR agreed to purchase certain subsidiaries and assets comprising the Fluid Handling business. Pursuant to the Purchase Agreement, the Company will retain its asbestos-related contingencies and insurance coverages. However, as the Company will not retain an interest in the ongoing operations of the business subject to the contingencies, the Company has classified asbestos-related activity in its Consolidated Statements of Income as part of Income (loss) from discontinuing operations, net of taxes.
Claims activity since December 31 related to asbestos claims is as follows:
|
Year Ended
|
|||||||||||
|
2017
|
2016
|
2015
|
|||||||||
|
(Number of claims)
|
|||||||||||
|
Claims unresolved, beginning of period
(1)
|
20,567
|
|
20,583
|
|
21,681
|
|
|||||
|
Claims filed
(2)
|
4,543
|
|
5,163
|
|
4,821
|
|
|||||
|
Claims resolved
(3)
|
(7,373
|
)
|
(5,179
|
)
|
(5,919
|
)
|
|||||
|
Claims unresolved, end of period
|
17,737
|
|
20,567
|
|
20,583
|
|
|||||
|
(In dollars)
|
|||||||||||
|
Average cost of resolved claims
(4)
|
$
|
6,154
|
|
$
|
8,872
|
|
$
|
6,056
|
|
||
(1)
Excludes claims filed by one legal firm that have been “administratively dismissed.”
(2)
Claims filed include all asbestos claims for which notification has been received or a file has been opened.
(3)
Claims resolved include all asbestos claims that have been settled, dismissed or that are in the process of being settled or dismissed based upon agreements or understandings in place with counsel for the claimants.
(4)
Excludes claims settled in Mississippi for which the majority of claims have historically been resolved for no payment and insurance recoveries.
The Company has projected each subsidiary’s future asbestos-related liability costs with regard to pending and future unasserted claims based upon the Nicholson methodology. The Nicholson methodology is a standard approach used by experts and has been accepted by numerous courts. It is the Company’s policy to record a liability for asbestos-related liability costs for the longest period of time that it can reasonably estimate.
The Company believes that it can reasonably estimate the asbestos-related liability for pending and future claims that will be resolved in the next
15 years
and has recorded that liability as its best estimate. While it is reasonably possible that the subsidiaries will incur costs after this period, the Company does not believe the reasonably possible loss or a range of reasonably possible losses is estimable at the current time. Accordingly, no accrual has been recorded for any costs which may be paid after the next 15 years. Defense costs associated with asbestos-related liabilities as well as costs incurred related to litigation against the subsidiaries’ insurers are expensed as incurred.
Each subsidiary has separate insurance coverage acquired prior to Company ownership of each independent entity. The Company has evaluated the insurance assets for each subsidiary based upon the applicable policy language and allocation methodologies, and law pertaining to the affected subsidiary’s insurance policies.
One of the subsidiaries was notified in 2010 by the primary and umbrella carrier who had been fully defending and indemnifying the subsidiary for
20 years
that the limits of liability of its primary and umbrella layer policies had been exhausted. The subsidiary has sought coverage from certain excess layer insurers whose terms and conditions follow form to the umbrella carrier, which parties’ dispute was resolved by the Delaware state courts during 2016. This litigation confirmed that asbestos-related costs should be allocated among excess insurers using an “all sums” allocation (which allows an insured to collect all sums paid in connection with a claim from any insurer whose policy is triggered, up to the policy’s applicable limits), that the subsidiary has rights to excess insurance policies purchased by a former owner of the business, and that, based on the
September 12, 2016
ruling by the Delaware Supreme Court, the subsidiary has a right to immediately access the excess layer policies. Further, the Delaware Supreme Court ruled in the subsidiary’s favor on a “trigger of coverage” issue, holding that every policy in place during or after the date of a claimant’s first significant exposure to asbestos was “triggered” and potentially could be accessed to cover that claimant’s claim. The Court also largely affirmed and reversed in part some of the prior lower court rulings on defense obligations and whether payment of such costs erode policy limits or are payable in addition to policy limits.
Based upon these rulings, the Company currently estimates that the subsidiary’s future expected recovery percentage is approximately
91.8%
of asbestos-related costs, with the subsidiary expected to be responsible for approximately
8.2%
of its future asbestos-related costs.
85
COLFAX CORPORATION
NOTES TO CONSOLIDATED FINANCIAL STATEMENTS — (Continued)
Since approximately mid-2011, the Company had funded
$142.8
million of the subsidiary’s asbestos-related defense and indemnity costs through
December 31, 2017
, which it expects to recover from insurers. Based on the above-referenced court rulings, the Company requested that its insurers reimburse all of the
$94.9 million
that remained outstanding at the time of the ruling, and the Company currently expects to receive substantially all of that amount. As of December 31, 2017,
$60.1 million
of that amount was reimbursed. Certain of the excess insurers have advised the subsidiary that they are still reviewing cost data relating to the other unreimbursed amounts. The subsidiary also has requested that certain excess insurers provide ongoing coverage for future asbestos-related defense and/or indemnity costs. The insurers to which the vast majority of pending claims have been tendered have not yet responded to this request. To the extent any disagreements concerning excess insurers’ payment obligations under the Delaware Supreme Court’s rulings remain, they are expected to be resolved by Delaware court action, which is still pending and has been remanded to the Delaware Superior Court for any further proceedings. In the interim, and while not impacting the results of operations, the Company’s cash funding for future asbestos-related defense and indemnity costs for which it expects reimbursement from insurers could range up to
$10 million
per quarter.
In 2003, another subsidiary filed a lawsuit against a large number of its insurers and its former parent to resolve a variety of disputes concerning insurance for asbestos-related bodily injury claims asserted against it. Court rulings in 2007 and 2009 clarified the insurers allocation methodology as mandated by the New Jersey courts, the allocation calculation related to amounts currently due from insurers, and amounts the Company expects to be reimbursed for asbestos-related costs incurred in future periods.
A final judgment at the trial court level was rendered in 2011 and confirmed by the Appellate Division in 2014. In 2015, the New Jersey Supreme Court refused to grant certification of the appeals, effectively ending the matter. The subsidiary expects to be responsible for approximately
21.6%
of all future asbestos-related costs.
During the year ended
December 31, 2015
, the Company recorded a
$4.1 million
pre-tax charge due to an increase in mesothelioma and lung cancer claims and higher settlement values per claim that have occurred and are expected to continue to occur in certain jurisdictions. The pre-tax charge was comprised of an increase in asbestos-related liabilities of
$20.2 million
partially offset by an increase in expected insurance recoveries of
$16.1 million
. During the year ended
December 31, 2016
, the Company recorded an
$8 million
increase in asbestos-related liabilities due to higher settlement values per claim. The related insurance asset was accordingly increased
$6.4 million
, resulting in a net pre-tax charge of
$1.6 million
. During the year ended
December 31, 2017
, the Company recorded an
$8.3 million
increase in asbestos-related liabilities due to higher settlement values per claim. The related insurance asset was accordingly increased
$6.7 million
, resulting in a net pre-tax charge of
$1.6 million
. For all periods, the net pre-tax charge is included in Income (loss) from discontinued operations, net of taxes in the Consolidated Statements of Income.
The Company’s Consolidated Balance Sheets included the following amounts related to asbestos-related litigation:
|
December 31,
|
|||||||
|
2017
|
2016
|
||||||
|
(In thousands)
|
|||||||
|
Long-term asbestos insurance asset
(1)
|
$
|
284,454
|
|
$
|
293,289
|
|
|
|
Long-term asbestos insurance receivable
(1)
|
73,489
|
|
92,269
|
|
|||
|
Accrued asbestos liability
(2)
|
50,311
|
|
51,166
|
|
|||
|
Long-term asbestos liability
(3)
|
310,326
|
|
330,194
|
|
|||
(1)
Included in Other assets in the Consolidated Balance Sheets.
(2)
Represents current accruals for probable and reasonably estimable asbestos-related liability cost that the Company believes the subsidiaries will pay through the next
12
months, overpayments by certain insurers and unpaid legal costs related to defending themselves against asbestos-related liability claims and legal action against the Company’s insurers, which is included in Accrued liabilities in the Consolidated Balance Sheets.
(3)
Included in Other liabilities in the Consolidated Balance Sheets.
Management’s analyses are based on currently known facts and a number of assumptions. However, projecting future events, such as new claims to be filed each year, the average cost of resolving each claim, coverage issues among layers of insurers, the method in which losses will be allocated to the various insurance policies, interpretation of the effect on coverage of various policy terms and limits and their interrelationships, the continuing solvency of various insurance companies, the amount of remaining insurance available, as well as the numerous uncertainties inherent in asbestos litigation could cause the actual liabilities and insurance recoveries to be higher or lower than those projected or recorded which could materially affect the Company’s financial condition, results of operations or cash flow.
86
COLFAX CORPORATION
NOTES TO CONSOLIDATED FINANCIAL STATEMENTS — (Continued)
General Litigation
The Company is also involved in various other pending legal proceedings arising out of the ordinary course of the Company’s business. None of these legal proceedings are expected to have a material adverse effect on the financial condition, results of operations or cash flow of the Company. With respect to these proceedings and the litigation and claims described in the preceding paragraphs, management of the Company believes that it will either prevail, has adequate insurance coverage or has established appropriate accruals to cover potential liabilities. Any costs that management estimates may be paid related to these proceedings or claims are accrued when the liability is considered probable and the amount can be reasonably estimated. There can be no assurance, however, as to the ultimate outcome of any of these matters, and if all or substantially all of these legal proceedings were to be determined adverse to the Company, there could be a material adverse effect on the financial condition, results of operations or cash flow of the Company.
Minimum Lease Obligations
The Company’s minimum obligations under non-cancelable operating leases are as follows:
|
|
December 31, 2017
|
||
|
|
(In thousands)
|
||
|
2018
|
$
|
32,208
|
|
|
2019
|
24,579
|
|
|
|
2020
|
18,051
|
|
|
|
2021
|
13,706
|
|
|
|
2022
|
10,485
|
|
|
|
Thereafter
|
53,403
|
|
|
|
Total
|
$
|
152,432
|
|
The Company’s operating leases extend for varying periods and, in some cases, contain renewal options that would extend the existing terms. During the years ended
December 31, 2017
,
2016
and
2015
, the Company’s net rental expense related to operating leases was
$38.5 million
,
$34.8 million
and
$35.6 million
, respectively.
Off-Balance Sheet Arrangements
As of
December 31, 2017
, the Company had
$271.8 million
of unconditional purchase obligations with suppliers, the majority of which is expected to be paid by December 31,
2018
.
17. Segment Information
Prior to the sale of the Fluid Handling business, the Company conducted its operations through three operating segments: Air and Gas Handling, Fluid Handling and Fabrication Technology. The Air and Gas Handling and Fluid Handling operating segments were aggregated into a single reportable segment. Subsequent to the sale, the Company now conducts its continuing operations through the Air and Gas Handling and Fabrication Technology operating segments, which also represent the Company’s reportable segments.
|
▪
|
Air and Gas Handling
- a global supplier of centrifugal and axial fans, rotary heat exchangers, gas compressors, ventilation control systems and software, and aftermarket services; and
|
|
▪
|
Fabrication Technology
-
a global supplier of consumable products and equipment for use in the cutting, joining and automated welding of steels, aluminum and other metals and metal alloys.
|
Certain amounts not allocated to the two reportable segments and intersegment eliminations are reported under the heading “Corporate and other.” The Company’s management evaluates the operating results of each of its reportable segments based upon Net sales and segment operating income (loss), which represents Operating income (loss) before restructuring and certain other charges.
87
COLFAX CORPORATION
NOTES TO CONSOLIDATED FINANCIAL STATEMENTS — (Continued)
The Company’s segment results were as follows:
|
Year Ended December 31,
|
|||||||||||
|
2017
|
2016
|
2015
|
|||||||||
|
(In thousands)
|
|||||||||||
|
Net sales:
|
|||||||||||
|
Air and Gas Handling
|
$
|
1,362,902
|
|
$
|
1,385,261
|
|
$
|
1,449,115
|
|
||
|
Fabrication Technology
|
1,937,282
|
|
1,800,492
|
|
1,985,237
|
|
|||||
|
Total Net sales
|
$
|
3,300,184
|
|
$
|
3,185,753
|
|
$
|
3,434,352
|
|
||
|
Segment operating income (loss)
(1)
:
|
|||||||||||
|
Air and Gas Handling
|
$
|
126,205
|
|
$
|
150,130
|
|
$
|
171,022
|
|
||
|
Fabrication Technology
|
224,362
|
|
195,435
|
|
199,823
|
|
|||||
|
Corporate and other
|
(53,432
|
)
|
(49,983
|
)
|
(47,499
|
)
|
|||||
|
Total segment operating income
|
$
|
297,135
|
|
$
|
295,582
|
|
$
|
323,346
|
|
||
|
Depreciation, amortization and other impairment charges:
|
|||||||||||
|
Air and Gas Handling
|
$
|
51,004
|
|
$
|
53,222
|
|
$
|
52,442
|
|
||
|
Fabrication Technology
|
71,372
|
|
74,901
|
|
83,427
|
|
|||||
|
Corporate and other
|
1,316
|
|
704
|
|
1,172
|
|
|||||
|
Total depreciation, amortization and other impairment charges
|
$
|
123,692
|
|
$
|
128,827
|
|
$
|
137,041
|
|
||
|
Capital expenditures:
|
|||||||||||
|
Air and Gas Handling
|
$
|
18,942
|
|
$
|
18,784
|
|
$
|
26,814
|
|
||
|
Fabrication Technology
|
34,167
|
|
32,662
|
|
35,261
|
|
|||||
|
Corporate and other
|
277
|
|
3,595
|
|
313
|
|
|||||
|
Total capital expenditures
|
$
|
53,386
|
|
$
|
55,041
|
|
$
|
62,388
|
|
||
(1)
The following is a reconciliation of (Loss) income before income taxes to segment operating income:
|
Year Ended December 31,
|
|||||||||||
|
2017
|
2016
|
2015
|
|||||||||
|
(Loss) income from continuing operations before income taxes
|
$
|
(11,986
|
)
|
$
|
206,524
|
|
$
|
218,118
|
|
||
|
Interest expense
|
41,137
|
|
30,276
|
|
47,502
|
|
|||||
|
Restructuring and other related charges
|
68,351
|
|
58,496
|
|
56,822
|
|
|||||
|
Goodwill and intangible asset impairment charge
|
152,700
|
|
238
|
|
1,486
|
|
|||||
|
Pension settlement loss (gain)
|
46,933
|
|
48
|
|
(582
|
)
|
|||||
|
Segment operating income
|
$
|
297,135
|
|
$
|
295,582
|
|
$
|
323,346
|
|
||
88
COLFAX CORPORATION
NOTES TO CONSOLIDATED FINANCIAL STATEMENTS — (Continued)
|
December 31,
|
|||||||
|
2017
|
2016
|
||||||
|
(In thousands)
|
|||||||
|
Investments in Equity Method Investees:
|
|||||||
|
Air and Gas Handling
|
$
|
7,151
|
|
$
|
4,616
|
|
|
|
Fabrication Technology
|
41,754
|
|
38,217
|
|
|||
|
|
$
|
48,905
|
|
$
|
42,833
|
|
|
|
Total Assets:
|
|||||||
|
Air and Gas Handling
|
$
|
2,845,190
|
|
$
|
2,454,981
|
|
|
|
Fabrication Technology
|
3,291,205
|
|
2,936,445
|
|
|||
|
Corporate and other
|
573,302
|
|
489,682
|
|
|||
|
Total
|
$
|
6,709,697
|
|
$
|
5,881,108
|
|
|
The detail of the Company’s operations by geography is as follows:
|
Year Ended December 31,
|
|||||||||||
|
2017
|
2016
|
2015
|
|||||||||
|
(In thousands)
|
|||||||||||
|
Net Sales by Origin
(1)
:
|
|||||||||||
|
United States
|
$
|
782,200
|
|
$
|
794,008
|
|
$
|
738,051
|
|
||
|
Foreign locations
|
2,517,984
|
|
2,391,745
|
|
2,696,301
|
|
|||||
|
Total Net sales
|
$
|
3,300,184
|
|
$
|
3,185,753
|
|
$
|
3,434,352
|
|
||
(1)
The Company attributes revenues from external customers to individual countries based upon the country in which the sale was originated.
|
December 31,
|
|||||||
|
2017
|
2016
|
||||||
|
(In thousands)
|
|||||||
|
Property, Plant and Equipment, Net
(1)
:
|
|||||||
|
United States
|
$
|
121,023
|
|
$
|
136,707
|
|
|
|
Germany
|
63,055
|
|
14,652
|
|
|||
|
Czech Republic
|
61,281
|
|
72,568
|
|
|||
|
India
|
57,387
|
|
38,900
|
|
|||
|
China
|
55,455
|
|
54,623
|
|
|||
|
Other Foreign Locations
|
194,601
|
|
187,981
|
|
|||
|
Property, plant and equipment, net
|
$
|
552,802
|
|
$
|
505,431
|
|
|
(1)
As the Company does not allocate all long-lived assets, specifically intangible assets, to each individual country, evaluation of long-lived assets in total is impracticable.
89
COLFAX CORPORATION
NOTES TO CONSOLIDATED FINANCIAL STATEMENTS — (Continued)
18. Selected Quarterly Data—(unaudited)
Provided below is selected unaudited quarterly financial data for the years ended
December 31, 2017
and
2016
.
|
|
Quarter Ended
|
||||||||||||||
|
|
March 31,
2017 (1) |
June 30,
2017 |
September 29,
2017 (1) |
December 31,
2017 |
|||||||||||
|
|
(In thousands, except per share data)
|
||||||||||||||
|
Net sales
|
$
|
733,630
|
|
$
|
847,962
|
|
$
|
844,509
|
|
$
|
874,083
|
|
|||
|
Gross profit
|
239,829
|
|
258,064
|
|
263,899
|
|
267,683
|
|
|||||||
|
Net income (Loss) from continuing operations
|
38,390
|
|
41,864
|
|
49,622
|
|
(184,416
|
)
|
|||||||
|
Income from discontinued operations, net of taxes
|
3,097
|
|
16,611
|
|
2,082
|
|
202,257
|
|
|||||||
|
Net income attributable to Colfax Corporation
|
38,542
|
|
53,394
|
|
45,863
|
|
13,291
|
|
|||||||
|
|
|
|
|
|
|
|
|
|
|||||||
|
Net income (loss) per share - basic
|
|
|
|
|
|
|
|
|
|||||||
|
Continuing operations
|
$
|
0.29
|
|
$
|
0.30
|
|
$
|
0.36
|
|
$
|
(1.53
|
)
|
|||
|
Discontinued operations
|
$
|
0.03
|
|
$
|
0.13
|
|
$
|
0.02
|
|
$
|
1.64
|
|
|||
|
Consolidated operations
|
$
|
0.31
|
|
$
|
0.43
|
|
$
|
0.37
|
|
$
|
0.11
|
|
|||
|
|
|
|
|
|
|
|
|
|
|||||||
|
Net income (loss) per share - diluted
|
|
|
|
|
|
|
|
|
|||||||
|
Continuing operations
|
$
|
0.29
|
|
$
|
0.30
|
|
$
|
0.35
|
|
$
|
(1.53
|
)
|
|||
|
Discontinued operations
|
$
|
0.03
|
|
$
|
0.13
|
|
$
|
0.02
|
|
$
|
1.63
|
|
|||
|
Consolidated operations
|
$
|
0.31
|
|
$
|
0.43
|
|
$
|
0.37
|
|
$
|
0.11
|
|
|||
|
|
Quarter Ended
|
||||||||||||||
|
|
April 1,
2016 |
July 1,
2016 |
September 30,
2016 |
December 31,
2016 |
|||||||||||
|
|
(In thousands, except per share data)
|
||||||||||||||
|
Net sales
|
$
|
765,707
|
|
$
|
841,117
|
|
$
|
766,521
|
|
$
|
812,408
|
|
|||
|
Gross profit
|
241,692
|
|
262,386
|
|
238,314
|
|
249,990
|
|
|||||||
|
Net Income from continuing operations
|
26,997
|
|
44,037
|
|
40,548
|
|
43,170
|
|
|||||||
|
Income (loss) from discontinued operations, net of taxes
|
(787
|
)
|
(74
|
)
|
(8,349
|
)
|
(351
|
)
|
|||||||
|
Net income attributable to Colfax Corporation
|
22,615
|
|
39,754
|
|
27,970
|
|
37,772
|
|
|||||||
|
Net income (loss) per share - basic
|
|||||||||||||||
|
Continuing operations
|
$
|
0.19
|
|
$
|
0.32
|
|
$
|
0.30
|
|
$
|
0.31
|
|
|||
|
Discontinued operations
|
$
|
(0.01
|
)
|
$
|
—
|
|
$
|
(0.07
|
)
|
$
|
—
|
|
|||
|
Consolidated operations
|
$
|
0.18
|
|
$
|
0.32
|
|
$
|
0.23
|
|
$
|
0.31
|
|
|||
|
Net income (loss) per share - diluted
|
|||||||||||||||
|
Continuing operations
|
$
|
0.19
|
|
$
|
0.32
|
|
$
|
0.30
|
|
$
|
0.31
|
|
|||
|
Discontinued operations
|
$
|
(0.01
|
)
|
$
|
—
|
|
$
|
(0.07
|
)
|
$
|
—
|
|
|||
|
Consolidated operations
|
$
|
0.18
|
|
$
|
0.32
|
|
$
|
0.23
|
|
$
|
0.31
|
|
|||
(1)
The sum of the net income per share amounts may not add due to rounding.
90
COLFAX CORPORATION
NOTES TO CONSOLIDATED FINANCIAL STATEMENTS — (Continued)
19. Subsequent Event
On February 12, 2018
, the Company’s Board of Directors authorized the repurchase of up to
$100.0 million
of the Company’s Common stock from time-to-time on the open market or in privately negotiated transactions. The timing and amount of shares repurchased is to be determined by management based on its evaluation of market conditions and other factors. The repurchase program has no expiration date and does not obligate the Company to acquire any specific number of shares. No shares have been repurchased to date.
91
Item 9.
Changes in and Disagreements with Accountants on Accounting and Financial Disclosure
None.
Item 9A.
Controls and Procedures
Evaluation of Disclosure Controls and Procedures
Under the supervision and with the participation of our management, including our Chief Executive Officer and Chief Financial Officer, we have evaluated the effectiveness of our disclosure controls and procedures as defined in Rule 13a-15(e) under the Securities Exchange Act of 1934, as amended (the “Exchange Act”), as of
December 31, 2017
. Based upon that evaluation, our Chief Executive Officer and Chief Financial Officer concluded that the Company’s disclosure controls and procedures were effective in providing reasonable assurance that the information required to be disclosed in this report on Form 10-K has been recorded, processed, summarized and reported as of the end of the period covered by this report on Form 10-K, and that such information is accumulated and communicated to our management, including our Chief Executive Officer and Chief Financial Officer, as appropriate, to allow timely decisions regarding required disclosure.
Changes in Internal Control over Financial Reporting
There have been no changes in our internal control over financial reporting (as defined in Rule 13a-15(f)) identified in connection with the evaluation required by Rule 13a-15(d) of the Exchange Act that occurred during the most recently completed fiscal quarter that has materially affected, or is reasonably likely to materially affect, our internal control over financial reporting.
Management’s Annual Report on Internal Control Over Financial Reporting
The management of Colfax Corporation is responsible for establishing and maintaining adequate internal control over financial reporting as defined in Rules 13a-15(f) and 15d-15(f) under the Securities Exchange Act of 1934. Our internal control over financial reporting is designed to provide reasonable assurance regarding the reliability of financial reporting and the preparation of financial statements for external purposes in accordance with U.S. GAAP. Internal control over financial reporting includes policies and procedures that:
|
(i)
|
pertain to the maintenance of records that, in reasonable detail, accurately and fairly reflect the transactions and dispositions of the Company’s assets;
|
|
(ii)
|
provide reasonable assurance that transactions are recorded as necessary to permit preparation of financial statements in accordance with accounting principles generally accepted in the United States of America, and that receipts and expenditures are being made only in accordance with the authorization of management and directors of the Company; and
|
|
(iii)
|
provide reasonable assurance regarding prevention or timely detection of unauthorized acquisition, use or disposition of the Company’s assets that could have a material effect on the financial statements.
|
Because of inherent limitations, internal control over financial reporting may not prevent or detect misstatements. Also, projections of any evaluation of effectiveness to future periods are subject to the risk that controls may become inadequate because of changes in conditions, or that the degree of compliance with existing policies or procedures may deteriorate.
Under the supervision and with the participation of our Chief Executive Officer and Chief Financial Officer, our management conducted an assessment of the effectiveness of internal control over financial reporting as of
December 31, 2017
based on the criteria established in
Internal Control - Integrated Framework
, issued by the Committee of Sponsoring Organizations of the Treadway Commission (2013 framework). Based on this assessment, our management has concluded that our internal control over financial reporting was effective as of
December 31, 2017
.
Our independent registered public accounting firm is engaged to express an opinion on our internal control over financial reporting, as stated in its report which is included in Part II, Item 8 of this Form 10-K under the caption “Report of Independent Registered Public Accounting Firm—Internal Control Over Financial Reporting.”
92
Item 9B.
Other Information
None.
93
Item 10.
Directors, Executive Officers and Corporate Governance
Information relating to our Executive Officers is set forth in Part I of this Form 10-K under the caption “Executive Officers of the Registrant.” Additional information regarding our Directors, Audit Committee and compliance with Section 16(a) of the Exchange Act is incorporated by reference to such information included in our proxy statement for our
2018
annual meeting to be filed with the SEC within 120 days after the end of the fiscal year covered by this Form 10-K (the “
2018
Proxy Statement”) under the captions “Election of Directors”, “Board of Directors and its Committees - Audit Committee” and “Section 16(a) Beneficial Ownership Reporting Compliance”.
As part of our system of corporate governance, our Board of Directors has adopted a code of ethics that applies to all employees, including our principal executive officer, our principal financial and accounting officer or other persons performing similar functions. A copy of the code of ethics is available on the Corporate Governance page of the Investor Relations section of our website at
www.colfaxcorp.com
. We intend to satisfy any disclosure requirement under Item 5.05 of Form 8-K regarding an amendment to, or a waiver from, a provision of our code of ethics by posting such information on our website at the address above.
Item 11.
Executive Compensation
Information responsive to this item is incorporated by reference to such information included in our
2018
Proxy Statement under the captions “Executive Compensation”, “Director Compensation”, “Compensation Discussion and Analysis”, “Compensation Committee Report” and “Compensation Committee Interlocks and Insider Participation.”
Item 12.
Security Ownership of Certain Beneficial Owners and Management and Related Stockholder Matters
Information responsive to this item is incorporated by reference to such information included in our
2018
Proxy Statement under the captions “Beneficial Ownership of Our Common Stock” and “Equity Compensation Plan Information.”
Item 13.
Certain Relationships and Related Transactions, and Director Independence
Information responsive to this item is incorporated by reference to such information included in our
2018
Proxy Statement under the captions “Certain Relationships and Related Person Transactions” and “Director Independence.”
Item 14.
Principal Accountant Fees and Services
Information responsive to this item is incorporated by reference to such information included in our
2018
Proxy Statement under the captions “Independent Registered Public Accounting Firm Fees and Services” and “Audit Committee’s Pre-Approval Policies and Procedures.”
94
Item 15.
Exhibits and Financial Statement Schedules
(A) The following documents are filed as part of this report.
(1) Financial Statements. The financial statements are set forth under “Item 8. Financial Statements and Supplementary Data” of this report on Form 10-K.
(2) Schedules. An index of Exhibits and Schedules begins on page
of this report. Schedules other than those listed below have been omitted from this Annual Report because they are not required, are not applicable or the required information is included in the financial statements or the notes thereto.
(3) Exhibits: See exhibits listed under Part (B) below.
|
(B)
|
Exhibits.
|
95
EXHIBIT INDEX
|
Exhibit
No.
|
|
Description
|
|
Location
|
|
Purchase Agreement, dated as of September 24, 2017, by and between Colfax Corporation and CIRCOR International, Inc.
|
Incorporated by reference to Exhibit 2.1 to Colfax Corporation’s Form 8-K (File No. 001-34045) as filed with the SEC on September 25, 2017
|
|||
|
|
Amended and Restated Certificate of Incorporation of Colfax Corporation
|
|
Incorporated by reference to Exhibit 3.01 to Colfax Corporation’s Form 8-K (File No. 001-34045) as filed with the SEC on January 30, 2012
|
|
|
|
|
|
|
|
|
|
Colfax Corporation Amended and Restated Bylaws
|
|
Incorporated by reference to Exhibit 3.02 to Colfax Corporation’s Form 10-Q (File No. 001-34045) as filed with the SEC on July 23, 2015
|
|
|
|
|
|
|
|
|
|
Specimen Common Stock Certificate
|
|
Incorporated by reference to Exhibit 4.1 to Colfax Corporation’s Form S-1 (File 333-148486) as filed with the SEC on May 1, 2008
|
|
|
|
|
|
|
|
|
Indenture, dated as of April 19, 2017, by and among Colfax Corporation, as issuer, the Subsidiary Guarantors named therein, Deutsche Trustee Company Limited, as trustee, Deutsche Bank AG, as paying agent, and Deutsche Bank Luxembough S.A., as transfer agent, registrar and authenticating agent, and Form of Global Note included therein
|
Incorporated by reference to Exhibit 4.1 to Colfax Corporation’s Form 8-K (File No. 001-34045) as filed with the SEC on April 19, 2017
|
|||
|
|
Conversion Agreement, dated February 12, 2014, between Colfax Corporation and BDT CF Acquisition Vehicle, LLC
|
|
Incorporated by reference to Exhibit 10.01 to Colfax Corporation’s Form 8-K (File No. 001-34045) as filed with the SEC on February 12, 2014
|
|
|
|
Colfax Corporation 2008 Omnibus Incentive Plan*
|
|
Incorporated by reference to Exhibit 10.1 to Colfax Corporation’s Form S-1 (File 333-148486) as filed with the SEC on April 23, 2008
|
|
|
|
|
|
|
|
|
|
Colfax Corporation 2008 Omnibus Incentive Plan, as amended and restated April 2, 2012*
|
|
Incorporated by reference to Exhibit 10.07 to Colfax Corporation’s Form 10-Q (File No. 001-34045) as filed with the SEC on August 7, 2012
|
|
|
|
|
|
|
|
|
Colfax Corporation 2016 Omnibus Incentive Plan*
|
Incorporated by reference to Exhibit 10.01 to Colfax Corporation’s Form 10-Q (File No. 001-34045) as filed with the SEC on July 28, 2016
|
|||
|
|
Form of Non-Qualified Stock Option Agreement for officers *
|
|
Incorporated by reference to Exhibit 10.5 to Colfax Corporation’s Form 10-K (File No. 001-34045) as filed with the SEC on February 14, 2017
|
|
|
Form of Non-Qualified Stock Option Agreement for non-officers *
|
Incorporated by reference to Exhibit 10.6 to Colfax Corporation’s Form 10-K (File No. 001-34045) as filed with the SEC on February 14, 2017
|
|||
|
|
Form of Performance Stock Unit Agreement*
|
|
Incorporated by reference to Exhibit 10.7 to Colfax Corporation’s Form 10-K (File No. 001-34045) as filed with the SEC on February 14, 2017
|
|
96
|
Exhibit
No.
|
Description
|
Location
|
||
|
Form of Restricted Stock Unit Agreement*
|
Incorporated by reference to Exhibit 10.8 to Colfax Corporation’s Form 10-K (File No. 001-34045) as filed with the SEC on February 14, 2017
|
|||
|
|
Form of Outside Director Deferred Stock Unit Agreement*
|
|
Incorporated by reference to Exhibit 10.9 to Colfax Corporation’s Form 10-K (File No. 001-34045) as filed with the SEC on February 14, 2017
|
|
|
|
Form of Outside Director Restricted Stock Unit Agreement (no deferral)*
|
|
Incorporated by reference to Exhibit 10.10 to Colfax Corporation’s Form 10-K (File No. 001-34045) as filed with the SEC on February 14, 2017
|
|
|
|
|
|
|
|
|
|
Form of Outside Director Deferred Stock Unit Agreement for deferral of grants of restricted stock *
|
|
Incorporated by reference to Exhibit 10.11 to Colfax Corporation’s Form 10-K (File No. 001-34045) as filed with the SEC on February 14, 2017
|
|
|
|
|
|
|
|
|
|
Form of Outside Director Deferred Stock Unit Agreement for deferral of director fees*
|
|
Incorporated by reference to Exhibit 10.12 to Colfax Corporation’s Form 10-K (File No. 001-34045) as filed with the SEC on February 14, 2017
|
|
|
|
Form of Outside Director Non-Qualified Stock Option Agreement*
|
|
Incorporated by reference to Exhibit 10.13 to Colfax Corporation’s Form 10-K (File No. 001-34045) as filed with the SEC on February 14, 2017
|
|
|
10.1
4
|
|
Colfax Corporation Amended and Restated Excess Benefit Plan, effective as of January 1, 2013*
|
|
Incorporated by reference to Exhibit 10.13 to Colfax Corporation’s Form 10-K (File No. 001-34045) as filed with the SEC on February 19, 2013
|
|
Colfax Corporation Nonqualified Deferred Compensation Plan, as effective January 1, 2016*
|
Incorporated by reference to Exhibit 10.15 to Colfax Corporation’s Form 10-K (File No. 001-34045) as filed with the SEC on February 16, 2016
|
|||
|
Employment Agreement between Matthew L. Trerotola and Colfax Corporation*
|
Incorporated by reference to Exhibit 10.01 to Colfax Corporation’s Form 8-K (File No. 001-34045) as filed with the SEC on July 23, 2015
|
|||
|
|
Letter Agreement between Colfax Corporation and Christopher Hix*
|
|
Incorporated by reference to Exhibit 10.02 to Colfax Corporation’s Form 10-Q (File No. 001-34045) as filed with the SEC on July 28, 2016
|
|
|
|
Employment Agreement between Colfax Corporation and Daniel A. Pryor*
|
|
Incorporated by reference to Exhibit 10.04 to Colfax Corporation’s Form 10-Q (File No. 001-34045) as filed with the SEC on August 7, 2012
|
|
|
|
|
|
|
|
|
Letter Agreement between Colfax Corporation and Shyam Kambeyanda*
|
Incorporated by reference to Exhibit 10.02 to Colfax Corporation’s Form 10-Q (File No. 001-34045) as filed with the SEC on July 28, 2017
|
|||
|
Form of Indemnification Agreement between the Company and each of its directors and executive officers
|
Incorporated by reference to Exhibit 10.3 to Colfax Corporation’s Form S-1 (File 333-148486) as filed with the SEC on May 1, 2008
|
|||
|
|
Colfax Corporation Annual Incentive Plan, as amended and restated April 2, 2012*
|
|
Incorporated by reference to Exhibit 10.24 to Colfax Corporation’s Form 10-K (File No. 001-34045) as filed with the SEC on February 19, 2013
|
|
97
|
Exhibit
No.
|
Description
|
Location
|
||
|
Colfax Executive Officer Severance Plan*
|
Incorporated by reference to Exhibit 10.02 to Colfax Corporation’s Form 10-Q (File No. 001-34045) as filed with the SEC on July 23, 2015
|
|||
|
Colfax Corporation Director Deferred Compensation Plan*
|
Incorporated by reference to Exhibit 10.9 to Colfax Corporation’s Form S-1 (File 333-148486) as filed with the SEC on April 23, 2008
|
|||
|
Amendment No. 1 to the Colfax Corporation Director Deferred Compensation Plan
|
Filed herewith
|
|||
|
Credit Agreement, dated as of June 5, 2015, among Colfax Corporation, as the borrower, certain U.S. subsidiaries of Colfax Corporation identified therein, as guarantors, each of the lenders party thereto and Deutsche Bank AG New York Branch, as administrative agent, swing line lender and global coordinator
|
Incorporated by reference to Exhibit 99.1 to Colfax Corporation’s Form 8-K (File No. 001-34045) as filed with the SEC on June 5, 2015
|
|||
|
Increase Agreement, dated as of September 25, 2015, among Colfax Corporation, as the borrower, the guarantors thereto, each of the lenders party thereto, Deutsche Bank AG New York Branch, as administrative agent, swing line leader and global coordinator and Deutsche Bank Securities, Inc., as lead arranger and bookrunnner
|
Incorporated by reference to Exhibit 10.04 to Colfax Corporation’s Form 10-Q (File No. 001-34045) as filed with the SEC on October 22, 2015
|
|||
|
Exhibit
No.
|
|
Description
|
|
Location
|
|
Second Amendment to the Credit Agreement, dated June 24, 2016, among Colfax Corporation, as the borrower, the guarantors party thereto, each of the lenders party thereto, and Deutsche Bank AG New York Branch, as administrative agent.
|
Incorporated by reference to Exhibit 10.02 to Colfax Corporation’s Form 10-Q (File No. 001-34045) as filed with the SEC on July 28, 2016
|
|||
|
|
Registration Rights Agreement, dated May 30, 2003, by and among Colfax Corporation, Colfax Capital Corporation, Janalia Corporation, Equity Group Holdings, L.L.C., and Mitchell P. Rales and Steven M. Rales
|
|
Incorporated by reference to Exhibit 10.4 to Colfax Corporation’s Form S-1 (File 333-148486) as filed with the SEC on March 11, 2008
|
|
|
|
|
|
|
|
|
|
Amendment No. 1 to the Registration Rights Agreement, by and among Colfax Corporation and Mitchell P. Rales and Steven M. Rales, dated February 18, 2013
|
|
Incorporated by reference to Exhibit 10.30 to Colfax Corporation’s Form 10-K (File No. 001-34045) as filed with the SEC on February 19, 2013
|
|
|
|
|
|
|
|
|
Amendment No. 2 to the Registration Rights Agreement, by and among Colfax Corporation and Mitchell P. Rales and Steven M. Rales, dated February 15, 2016
|
Incorporated by reference to Exhibit 10.37 to Colfax Corporation’s Form 10-K (File No. 001-34045) as filed with the SEC on February 16, 2016
|
|||
|
|
Securities Purchase Agreement, dated September 12, 2011, between BDT CF Acquisition Vehicle, LLC and Colfax Corporation
|
|
Incorporated by reference to Exhibit 99.2 to Colfax Corporation’s Form 8-K (File No. 001-34045) as filed with the SEC on September 15, 2011
|
|
|
|
|
|
|
|
|
|
Securities Purchase Agreement, dated September 12, 2011, between Mitchell P. Rales and Colfax Corporation
|
|
Incorporated by reference to Exhibit 99.3 to Colfax Corporation’s Form 8-K (File No. 001-34045) as filed with the SEC on September 15, 2011
|
|
|
|
|
|
|
|
|
|
Securities Purchase Agreement, dated September 12, 2011, between Steven M. Rales and Colfax Corporation
|
|
Incorporated by reference to Exhibit 99.4 to Colfax Corporation’s Form 8-K (File No. 001-34045) as filed with the SEC on September 15, 2011
|
|
|
|
|
|
|
|
|
|
Securities Purchase Agreement, dated September 12, 2011, between Markel Corporation and Colfax Corporation
|
|
Incorporated by reference to Exhibit 99.5 to Colfax Corporation’s Form 8-K (File No. 001-34045) as filed with the SEC on September 15, 2011
|
|
|
|
Registration Rights Agreement, dated as of January 24, 2012, between Colfax Corporation and BDT CF Acquisition Vehicle, LLC
|
|
Incorporated by reference to Exhibit 10.01 to Colfax Corporation’s Form 8-K (File No. 001-34045) as filed with the SEC on January 30, 2012
|
|
98
99
|
Exhibit
No.
|
|
Description
|
|
Location
|
|
|
Registration Rights Agreement, dated as of January 24, 2012, between Colfax Corporation and Mitchell P. Rales
|
|
Incorporated by reference to Exhibit 10.02 to Colfax Corporation’s Form 8-K (File No. 001-34045) as filed with the SEC on January 30, 2012
|
|
|
|
|
|
|
|
|
|
Registration Rights Agreement, dated as of January 24, 2012, between Colfax Corporation and Steven M. Rales
|
|
Incorporated by reference to Exhibit 10.03 to Colfax Corporation’s Form 8-K (File No. 001-34045) as filed with the SEC on January 30, 2012
|
|
|
|
|
|
|
|
|
|
Registration Rights Agreement, dated as of January 24, 2012, between Colfax Corporation and Markel Corporation
|
|
Incorporated by reference to Exhibit 10.04 to Colfax Corporation’s Form 8-K (File No. 001-34045) as filed with the SEC on January 30, 2012
|
|
|
|
|
|
|
|
|
Purchase Agreement, dated September 24, 2017, between Colfax Corporation and CIRCOR International, Inc.
|
Incorporated by reference to Exhibit 2.1 Colfax Corporation’s Form 8-K (File No. 001-34045) as filed with the SEC on September 25, 2017
|
|||
|
Stockholder Agreement, dated December 11, 2017, between Colfax Corporation and CIRCOR International, Inc.
|
Incorporated by reference to Exhibit 10.1 Colfax Corporation’s Form 8-K (File No. 001-34045) as filed with the SEC on December 15, 2017
|
|||
|
|
Subsidiaries of registrant
|
|
Filed herewith
|
|
|
|
|
|
|
|
|
|
Consent of Independent Registered Public Accounting Firm
|
|
Filed herewith
|
|
|
|
|
|
|
|
|
|
Certification of Chief Executive Officer Pursuant to Item 601(b)(31) of Regulation S-K, as adopted pursuant to Section 302 of the Sarbanes-Oxley Act of 2002.
|
|
Filed herewith
|
|
|
|
|
|
|
|
|
|
Certification of Chief Financial Officer Pursuant to Item 601(b)(31) of Regulation S-K, as adopted pursuant to Section 302 of the Sarbanes-Oxley Act of 2002.
|
|
Filed herewith
|
|
|
|
|
|
|
|
|
|
Certification of Chief Executive Officer, Pursuant to 18 U.S.C. Section 1350, as adopted pursuant to Section 906 of the Sarbanes-Oxley Act of 2002
|
|
Filed herewith
|
|
|
|
|
|
|
|
|
|
Certification of Chief Financial Officer, Pursuant to 18 U.S.C. Section 1350, as adopted pursuant to Section 906 of the Sarbanes-Oxley Act of 2002
|
|
Filed herewith
|
|
|
|
|
|
|
|
|
101.INS
|
|
XBRL Instance Document
|
|
Filed herewith
|
100
|
Exhibit
No.
|
|
Description
|
|
Location
|
|
101.SCH
|
|
XBRL Taxonomy Extension Schema Document
|
|
Filed herewith
|
|
|
|
|
|
|
|
101.CAL
|
|
XBRL Extension Calculation Linkbase Document
|
|
Filed herewith
|
|
|
|
|
|
|
|
101.DEF
|
|
XBRL Taxonomy Extension Definition Linkbase Document
|
|
Filed herewith
|
|
|
|
|
|
|
|
101.LAB
|
|
XBRL Taxonomy Extension Label Linkbase Document
|
|
Filed herewith
|
|
|
|
|
|
|
|
101.PRE
|
|
XBRL Taxonomy Extension Presentation Linkbase Document
|
|
Filed herewith
|
* Indicates management contract or compensatory plan, contract or arrangement.
101
Item 16.
Form 10-K Summary
None.
102
SIGNATURES
Pursuant to the requirements of Section 13 or 15(d) of the Securities Exchange Act of 1934, the Registrant has duly caused this report to be signed on its behalf by the undersigned, thereunto duly authorized on
February 16, 2018
.
COLFAX CORPORATION
By:
/s/ MATTHEW L. TREROTOLA
Matthew L. Trerotola
President and Chief Executive Officer
Pursuant to the requirements of Section 13 or 15(d) of the Securities Exchange Act of 1934, this report has been signed below by the following persons on behalf of the Registrant and in the capacities and on the date indicated.
Date:
February 16, 2018
103
SIGNATURES
|
/s/ MATTHEW L. TREROTOLA
|
|
Matthew L. Trerotola
|
|
President and Chief Executive Officer
|
|
(Principal Executive Officer)
|
|
/s/ CHRISTOPHER M. HIX
|
|
Christopher M. Hix
|
|
Senior Vice President, Finance, Chief Financial Officer and Treasurer
|
|
(Principal Financial and Accounting Officer)
|
|
/s/ MITCHELL P. RALES
|
|
Mitchell P. Rales
|
|
Chairman of the Board
|
|
/s/ PATRICK W. ALLENDER
|
|
Patrick W. Allender
|
|
Director
|
|
/s/ THOMAS S. GAYNER
|
|
Thomas S. Gayner
|
|
Director
|
|
/s/ RHONDA L. JORDAN
|
|
Rhonda L. Jordan
|
|
Director
|
|
/s/ SAN W. ORR, III
|
|
San W. Orr, III
|
|
Director
|
|
/s/ A. CLAYTON PERFALL
|
|
A. Clayton Perfall
|
|
Director
|
|
/s/ DIDIER TEIRLINCK
|
|
Didier Teirlinck
|
|
Director
|
|
/s/ RAJIV VINNAKOTA
|
|
Rajiv Vinnakota
|
|
Director
|
|
/s/ SHARON L. WIENBAR
|
|
Sharon L. Wienbar
|
|
Director
|
104
COLFAX CORPORATION AND SUBSIDIARIES
SCHEDULE II–VALUATION AND QUALIFYING ACCOUNTS
|
Balance at
Beginning of Period |
Charged to Cost and
Expense (1) |
Charged to Other
Accounts (2) |
Write-Offs Write-Downs and
Deductions |
Foreign
Currency Translation |
Balance at
End of Period |
|||||||||||||||||||
|
(In thousands)
|
||||||||||||||||||||||||
|
Year Ended December 31, 2017:
|
||||||||||||||||||||||||
|
Allowance for doubtful accounts
|
$
|
29,005
|
|
$
|
2,824
|
|
$
|
—
|
|
$
|
(2,271
|
)
|
$
|
1,930
|
|
$
|
31,488
|
|
||||||
|
Allowance for excess slow-moving and obsolete inventory
|
34,625
|
|
5,510
|
|
—
|
|
(6,440
|
)
|
1,266
|
|
34,961
|
|
||||||||||||
|
Valuation allowance for deferred tax assets
|
153,740
|
|
17,269
|
|
(1,562
|
)
|
(17,432
|
)
|
3,116
|
|
155,131
|
|
||||||||||||
|
Year Ended December 31, 2016:
|
||||||||||||||||||||||||
|
Allowance for doubtful accounts
|
$
|
27,582
|
|
$
|
7,420
|
|
$
|
—
|
|
$
|
(6,536
|
)
|
$
|
539
|
|
$
|
29,005
|
|
||||||
|
Allowance for excess slow-moving and obsolete inventory
|
28,352
|
|
22,764
|
|
—
|
|
(16,492
|
)
|
1
|
|
34,625
|
|
||||||||||||
|
Valuation allowance for deferred tax assets
|
161,030
|
|
21,013
|
|
(1,751
|
)
|
(14,813
|
)
|
(11,739
|
)
|
153,740
|
|
||||||||||||
|
Year Ended December 31, 2015:
|
||||||||||||||||||||||||
|
Allowance for doubtful accounts
|
$
|
24,779
|
|
$
|
5,219
|
|
$
|
—
|
|
$
|
691
|
|
$
|
(3,107
|
)
|
$
|
27,582
|
|
||||||
|
Allowance for excess slow-moving and obsolete inventory
|
25,395
|
|
7,488
|
|
—
|
|
(1,007
|
)
|
(3,524
|
)
|
28,352
|
|
||||||||||||
|
Valuation allowance for deferred tax assets
|
159,252
|
|
11,461
|
|
(3,862
|
)
|
(2,845
|
)
|
(2,976
|
)
|
161,030
|
|
||||||||||||
|
(1)
|
Amounts charged to expense are net of recoveries for the respective period.
|
|
(2)
|
Represents amount charge to Accumulated other comprehensive loss and reclassifications to deferred tax asset accounts.
|
S-1
TABLE OF CONTENTS
Part IItem 1. BusinessItem 1A. Risk FactorsItem 1B. Unresolved Staff CommentsItem 2. PropertiesItem 3. Legal ProceedingsItem 4. Mine Safety DisclosuresPart IIItem 5. Market For The Registrant S Common Equity, Related Stockholder Matters and Issuer Purchases Of Equity SecuritiesItem 6. Selected Financial DataItem 7. Management S Discussion and Analysis Of Financial Condition and Results Of OperationsItem 7A. Quantitative and Qualitative Disclosures About Market RiskItem 8. Financial Statements and Supplementary DataItem 9. Changes in and Disagreements with Accountants on Accounting and Financial DisclosureItem 9A. Controls and ProceduresItem 9B. Other InformationPart IIIItem 10. Directors, Executive Officers and Corporate GovernanceItem 11. Executive CompensationItem 12. Security Ownership Of Certain Beneficial Owners and Management and Related Stockholder MattersItem 13. Certain Relationships and Related Transactions, and Director IndependenceItem 14. Principal Accountant Fees and ServicesPart IVItem 15. Exhibits and Financial Statement SchedulesItem 16. Form 10-k Summary