ENSIGN GROUP, INC
10-Ks and 10-Qs
|
|
|
|
|
|
|
|
|
|
|
|
|
|
|
|
|
|
|
|
|
|
|
|
|
|
|
|
|
|
|
|
|
|
|
|
|
|
|
|
|
|
|
|
|
|
|
|
|
|
|
|
|
|
|
|
UNITED STATES
SECURITIES AND EXCHANGE COMMISSION
Washington, D.C. 20549
_____________________________
FORM 10-K
|
x
|
ANNUAL REPORT PURSUANT TO SECTION 13(a) OR 15(d) OF THE SECURITIES EXCHANGE ACT OF 1934.
|
For the fiscal year ended
December 31, 2016
.
|
o
|
TRANSITION REPORT PURSUANT TO SECTION 13 OR 15(d) OF THE SECURITIES EXCHANGE ACT OF 1934.
|
For the transition period from
to
.
Commission file number: 001-33757
__________________________
THE ENSIGN GROUP, INC.
(Exact Name of Registrant as Specified in Its Charter)
|
Delaware
|
33-0861263
|
|
(State or Other Jurisdiction of
|
(I.R.S. Employer
|
|
Incorporation or Organization)
|
Identification No.)
|
27101 Puerta Real, Suite 450
Mission Viejo, CA 92691
(Address of Principal Executive Offices and Zip Code)
(949) 487-9500
(Registrant’s Telephone Number, Including Area Code)
N/A
(Former Name, Former Address and Former Fiscal Year, If Changed Since Last Report)
_____________________________
|
Title of Each Class
|
|
Name of Each Exchange on Which Registered
|
|
Common Stock, par value $0.001 per share
|
|
NASDAQ Global Select Market
|
Securities registered pursuant to Section 12(g) of the Act:
None
Indicate by check mark if the registrant is a well-known seasoned issuer, as defined in Rule 405 of the Securities Act.
x
Yes
o
No
Indicate by check mark if the registrant is not required to file reports pursuant to Section 13 or Section 15(d) of the Act.
o
Yes
x
No
Indicate by check mark whether the registrant (1) has filed all reports required to be filed by Section 13 or 15(d) of the Securities Exchange Act of 1934 during the preceding 12 months (or for such shorter period that the registrant was required to file such reports), and (2) has been subject to such filing requirements for the past 90 days.
x
Yes
o
No
Indicate by check mark whether the registrant has submitted electronically and posted on its corporate Web site, if any, every Interactive Data File required to be submitted and posted pursuant to Rule 405 of Regulation S-T (§232.405 of this chapter) during the preceding 12 months (or for such shorter period that the registrant was required to submit and post such files).
x
Yes
o
No
Indicate by check mark if disclosure of delinquent filers pursuant to Item 405 of Regulation S-K is not contained herein, and will not be contained, to the best of the registrant's knowledge, in definitive proxy or information statements incorporated by reference in Part III of this Form 10-K or any amendment to this Form 10-K.
o
Indicate by check mark whether the registrant is a large accelerated filer, an accelerated filer, non-accelerated filer, or a smaller reporting company. See the definitions of “large accelerated filer”, “accelerated filer” and “smaller reporting company” in Rule 12b-2 of the Exchange Act. (Check one):
|
Large accelerated filer
x
|
Accelerated filer
o
|
Non-accelerated filer
o
|
Smaller reporting company
o
|
|
|
|
(Do not check if a smaller reporting company)
|
|
Indicate by a check mark whether the registrant is a shell company (as defined in Rule 12b-2 of the Exchange Act).
o
Yes
x
No
The aggregate market value of the registrant's common stock held by non-affiliates of the registrant, computed by reference to the closing price as of the last business day of the registrant's most recently completed second fiscal quarter, June 30, 2016, was approximately
$884,000,000
. Shares of Common Stock held by each executive officer, director and each person owning more than 10% of the outstanding Common Stock of the registrant have been excluded in that such persons may be deemed to be affiliates of the registrant. This determination of affiliate status is not necessarily a conclusive determination for other purposes.
As of
February 3, 2017
,
50,898,387
shares of the registrant’s common stock were outstanding.
DOCUMENTS INCORPORATED BY REFERENCE:
Part III of this Form 10-K incorporates information by reference from the Registrant's definitive proxy statement for the Registrant's 2017 Annual Meeting of Stockholders to be filed within 120 days after the close of the fiscal year covered by this annual report.
THE ENSIGN GROUP, INC.
INDEX TO ANNUAL REPORT ON FORM 10-K
FOR THE
FISCAL YEAR ENDED DECEMBER 31, 2016
TABLE OF CONTENTS
|
PART I.
|
|||
|
PART II.
|
|||
|
PART III.
|
|||
|
PART IV.
|
|||
|
EX-21.1
|
|||
|
EX-23.1
|
|||
|
EX-31.1
|
|||
|
EX-31.2
|
|||
|
EX-32.1
|
|||
|
EX-32.2
|
|||
|
EX-101
|
|||
CAUTIONARY NOTE REGARDING FORWARD-LOOKING STATEMENTS
This Annual Report on Form 10-K contains forward-looking statements, which include, but are not limited to our expected future financial position, results of operations, cash flows, financing plans, business strategy, budgets, capital expenditures, competitive positions, growth opportunities and plans and objectives of management. Forward-looking statements can often be identified by words such as “anticipates,” “expects,” “intends,” “plans,” “predicts,” “believes,” “seeks,” “estimates,” “may,” “will,” “should,” “would,” “could,” “potential,” “continue,” “ongoing,” similar expressions, and variations or negatives of these words. These statements are subject to the safe harbors created under the Securities Act of 1933 (Security Act) and the Securities Exchange Act of 1934 (Exchange Act). These statements are not guarantees of future performance and are subject to risks, uncertainties and assumptions that are difficult to predict. Therefore, our actual results could differ materially and adversely from those expressed in any forward-looking statements as a result of various factors, some of which are listed under the section “Risk Factors” in Part I, Item 1A of this Annual Report on Form 10-K. Accordingly, you should not rely upon forward-looking statements as predictions of future events. These forward-looking statements speak only as of the date of this Annual Report, and are based on our current expectations, estimates and projections about our industry and business, management's beliefs, and certain assumptions made by us, all of which are subject to change. We undertake no obligation to revise or update publicly any forward-looking statement for any reason, except as otherwise required by law.
As used in this Annual Report on Form 10-K, the words, "Ensign," Company," “we,” “our” and “us” refer to The Ensign Group, Inc. and its consolidated subsidiaries. All of our operating subsidiaries, the Service Center (defined below) and our wholly-owned captive insurance subsidiary (the Captive) are operated by separate, wholly-owned, independent subsidiaries that have their own management, employees and assets. References herein to the consolidated “Company” and “its” assets and activities, as well as the use of the terms “we,” “us,” “our” and similar terms in this Annual Report is not meant to imply, nor should it be construed as meaning, that The Ensign Group, Inc. has direct operating assets, employees or revenue, or that any of the subsidiaries are operated by The Ensign Group.
The Ensign Group, Inc. is a holding company with no direct operating assets, employees or revenues. In addition, certain of our wholly-owned independent subsidiaries, collectively referred to as the Service Center, provide centralized accounting, payroll, human resources, information technology, legal, risk management and other centralized services to the other operating subsidiaries through contractual relationships with such subsidiaries. In addition, our wholly-owned captive insurance subsidiary, which we refer to as the Captive, provides some claims-made coverage to our operating subsidiaries for general and professional liability, as well as for certain workers' compensation insurance liabilities.
We were incorporated in 1999 in Delaware. The Service Center address is 27101 Puerta Real, Suite 450, Mission Viejo, CA 92691, and our telephone number is (949) 487-9500. Our corporate website is located at
www.ensigngroup.net.
The information contained in, or that can be accessed through, our website does not constitute a part of this Annual Report.
Ensign
TM
is our United States trademark. All other trademarks and trade names appearing in this annual report are the property of their respective owners.
PART I.
Item 1.
Business
Company Overview
We, through our operating subsidiaries, are a provider of healthcare services across the post-acute care continuum, as well as other ancillary businesses located in Arizona, California, Colorado, Idaho, Iowa, Kansas, Nebraska, Nevada, Oregon, South Carolina, Texas, Utah, Washington and Wisconsin. Our operating subsidiaries, each of which strives to be the service of choice in the community it serves, provide a broad spectrum of skilled nursing, assisted living, home health and hospice and other ancillary services. As of
December 31, 2016
, we offered skilled nursing, assisted living and rehabilitative care services through
210
skilled nursing and assisted living facilities across
13
states. Our home health and hospice business provides home health, hospice and home care services from
39
agencies across
nine
states.
Our organizational structure is centered upon local leadership. We believe our organizational structure, which empowers leaders and staff at the local level, is unique within the healthcare services industry. Each of our operations is led by highly dedicated individuals who are responsible for key operational decisions at their operations. Leaders and staff are trained and motivated to pursue superior clinical outcomes, high patient and family satisfaction, operating efficiencies and financial performance at their operations.
3
We encourage and empower our leaders and staff to make their operation the “operation of choice” in the community it serves. This means that our leaders and staff are generally authorized to discern and address the unique needs and priorities of healthcare professionals, customers and other stakeholders in the local community or market, and then work to create a superior service offering for, and reputation in, that particular community or market. We believe that our localized approach encourages prospective customers and referral sources to choose or recommend the operation. In addition, our leaders are enabled and motivated to share real-time operating data and otherwise benchmark clinical and operational performance against their peers in order to improve clinical care, enhance patient satisfaction and augment operational efficiencies, promoting the sharing of best practices.
We view healthcare services primarily as a local business, influenced by personal relationships and community reputation. We believe our success is largely dependent upon our ability to build strong relationships with key stakeholders from the local healthcare community, based upon a solid foundation of reliably superior care. Accordingly, our brand strategy is focused on encouraging the leaders and staff of each operation to focus on clinical excellence, and promote their operation independently within their local community.
Much of our historical growth can be attributed to our expertise in acquiring real estate or leasing both under-performing and performing post-acute care operations and transforming them into market leaders in clinical quality, staff competency, employee loyalty and financial performance. We have also invested in new business lines that are complementary to our existing businesses, such as ancillary services. We plan to continue to grow our revenue and earnings by:
•
continuing to grow our talent base and develop future leaders;
•
increasing the overall percentage or “mix” of higher-acuity patients;
•
focusing on organic growth and internal operating efficiencies;
•
continuing to acquire additional operations in existing and new markets;
•
expanding and renovating our existing operations, and
•
strategically investing in and integrating other post-acute care healthcare businesses.
Company History
Our company was formed in 1999 with the goal of establishing a new level of quality care within the skilled nursing industry. The name “Ensign” is synonymous with a “flag” or a “standard,” and refers to our goal of setting the standard by which all others in our industry are measured. We believe that through our efforts and leadership, we can foster a new level of patient care and professional competence at our operating subsidiaries, and set a new industry standard for quality skilled nursing and rehabilitative care services.
We organize our operating subsidiaries into portfolio companies, which we believe has enabled us to maintain a local, field-driven organizational structure and attract additional qualified leadership talent, and to identify, acquire, and improve operations at a generally faster rate. Each of our portfolio companies has its own president. These presidents, who are experienced and proven leaders that are generally taken from the ranks of operational CEOs, serve as leadership resources within their own portfolio companies, and have the primary responsibility for recruiting qualified talent, finding potential acquisition targets, and identifying other internal and external growth opportunities. We believe this organizational structure has improved the quality of our recruiting and will continue to facilitate successful acquisitions.
Beginning in the fourth quarter of 2016, we realigned our operating segments to more closely correlate with our service
offerings, which coincide with the way that we measure performance and allocate resources. We have three reportable segments: (1) transitional and skilled services, which includes the operation of skilled nursing facilities; (2) assisted and independent living services, which includes the operation of assisted and independent living facilities; and (3) home health and hospice services, which includes our home health, home care and hospice businesses. Our Chief Executive Officer, who is our chief operating decision maker, or CODM, reviews financial information at the operating segment level. We also report an “all other” category that includes revenue from our urgent care centers, mobile diagnostics and other ancillary operations. Our urgent care centers, mobile diagnostics and other ancillary operations businesses are neither significant individually nor in aggregate and therefore do not constitute a reportable segment. Our reporting segments are business units that offer different services and that are managed separately to provide greater visibility into those operations. The expansion of our assisted and independent living services led us
4
to separate our assisted and independent living services into a distinct reportable segment in the fourth quarter of 2016. Previously, we had two reportable segments, transitional, skilled and assisted living services (TSA services), which included the operation of skilled nursing facilities and assisted living facilities; and (2) home health and hospice services. We have presented 2015 and 2014 financial information in this Annual Report on a comparative basis to conform with the current year segment presentation. For more information about our operating segments, as well as financial information, see Part II Item 7. Management’s Discussion and Analysis of Financial Condition and Results of Operations and Note 7,
Business Segments
of the Notes to Consolidated Financial Statements.
Recent Events
In 2016, we completed the sale of urgent care centers for
$41.5 million
. As a result of the sale, we recognized a pretax gain of
$19.2 million
, which is included in operating income. In accordance with the authoritative guidance for discontinued operations, neither transaction meets the criteria of a discontinued operation as they do not represent a strategic shift that has or will have a major effect on our operations and financial results. The sale of the investment supports our increased focus on growth opportunities in new business lines that are complementary to our existing transitional and skilled services.
On February 5, 2016, we amended our existing revolving credit facility to increase our aggregate principal amount available to
$250.0 million
. On July 19, 2016, we entered into a second amendment to our credit facility to increase the aggregate principal amount up to
$450.0 million
, comprised of a
$300.0 million
revolving credit facility and a
$150.0 million
term loan.
On November 4, 2015 and February 9, 2016, we announced that our Board of Directors authorized two stock repurchase programs, under which we may repurchase up to
$15.0 million
of our common stock under each program for a period of 12 months. During the first quarter of 2016, we repurchased
1.5 million
shares of our common stock for a total of
$30.0 million
and the repurchase programs expired upon the repurchase of the full authorized amount under the plans.
After careful consideration and some clinical survey challenges, we voluntarily discontinued operations in one of our skilled nursing facilities in the first quarter of 2016 in order to preserve the overall ability to serve the residents in surrounding counties. The operation represented approximately 0.5% of our revenue and adjusted EBITDAR in 2015. As part of this closure, we entered into an agreement with our landlord allowing for the closure of the property as well as other provisions to allow our landlord to transfer the property and the licenses free and clear of the applicable master lease. This arrangement will not impact the rent expense paid in 2016, or expected to be paid in future periods, and will have no material impact on our lease coverage ratios under our master lease agreements with CareTrust REIT, Inc. (collectively, the Master Leases). We recorded a continued obligation liability under the lease and related closing expenses of
$7.9 million
, including the present value of rental payments of approximately
$6.5 million
, which was recognized in the first quarter of 2016. Residents of the affected facility were transferred to other local skilled nursing facilities in an orderly fashion and in accordance with their individual clinical needs.
In November 2016, we entered into an agreement with our landlord to terminate the lease effective as of November 16, 2016. The lease of the facility was scheduled to expire on May 31, 2031.
Segments
Transitional and Skilled Services
As of December 31, 2016, our skilled nursing companies provided skilled nursing care at
170
operations, with
17,724
operational beds, in Arizona, California, Colorado, Idaho, Iowa, Kansas, Nebraska, Nevada, South Carolina, Texas, Utah, Washington and Wisconsin. Through our skilled nursing operations, we provide short stay patients and long stay patients with a full range of medical, nursing, rehabilitative, pharmacy and routine services, including daily dietary, social and recreational services. We generate our revenue from Medicaid, private pay, managed care and Medicare payors. During the year ended December 31, 2016, approximately
44.3%
and
28.8%
of our skilled nursing revenue was derived from Medicaid and Medicare programs, respectively.
Assisted and Independent Living Services
We provide assisted and independent living services at
61
operations, of which
21
are located on the same site location as our skilled nursing care operations. As of December 31, 2016, we had
4,450
assisted and independent living units. Our assisted living companies located in Arizona, California, Colorado, Idaho, Iowa, Kansas, Nebraska, Nevada, Texas, Utah, Washington and Wisconsin, provide residential accommodations, activities, meals, security, housekeeping and assistance in the activities of daily living to seniors who are independent or who require some support, but not the level of nursing care provided in a skilled nursing operation. Our independent living units are non-licensed independent living apartments in which residents are independent and
5
require no support with the activities of daily living. We generate revenue at these units primarily from private pay sources, with a portion earned from Medicaid or other state-specific programs. During the year ended December 31, 2016, approximately
78.6%
of our assisted and independent living revenue was derived from private pay sources.
Home Health and Hospice Services
Home Health
As of December 31, 2016, we provided home health care services in Arizona, California, Colorado, Idaho, Iowa, Oregon, Texas, Utah and Washington. Our home health care services generally consist of providing some combination of nursing, speech, occupational and physical therapists, medical social workers and certified home health aide services. Home health care is often a cost-effective solution for patients, and can also increase their quality of life and allow them to receive quality medical care in the comfort and convenience of a familiar setting. We derive the majority of our home health revenue from Medicare and managed care organizations. During the year ended December 31, 2016, approximately
53.7%
of our home health revenue were derived from Medicare.
Hospice
As of December 31, 2016, we provided hospice care services in Arizona, California, Colorado, Idaho, Iowa, Oregon, Texas, Utah and Washington. Hospice services focus on the physical, spiritual and psychosocial needs of terminally ill individuals and their families, and consists primarily of palliative and clinical care, education and counseling. We derive the majority of our hospice revenue from Medicare reimbursement. During the year ended December 31, 2016, approximately
86.7%
of our hospice revenue was derived from Medicare.
Other
We have historically operated urgent care clinics in Colorado and Washington. Our urgent care centers provided daily access to healthcare for minor injuries and illnesses, including x-ray and lab services, all from convenient neighborhood locations with no appointments. In 2016, we completed the sale of our urgent care centers for an aggregate purchase price of
$41.5 million
. As of December 31, 2016
,
we held a majority membership interest of mobile ancillary operations located in Arizona, California, Colorado, Idaho and Utah. We have invested in and are exploring new business lines that are complementary to our existing transitional and skilled services; assisted and independent living services and home health and hospice businesses. These new business lines consist of mobile ancillary services, including digital x-ray, ultrasound, electrocardiograms, sub-acute services and patient transportation to people in their homes or at long-term care facilities. To date these businesses are not meaningful contributors to our operating results.
Growth
We have an established track record of successful acquisitions. Much of our historical growth can be attributed to our expertise in acquiring real estate or leasing both under-performing and performing post-acute care operations and transforming them into market leaders in clinical quality, staff competency, employee loyalty and financial performance. With each acquisition, we apply our core operating expertise to improve these operations, both clinically and financially. In years where pricing has been high, we have focused on the integration and improvement of our existing operating subsidiaries while limiting our acquisitions to strategically situated properties.
In the last few years, our acquisition activity accelerated, allowing us to add
108
facilities between January 1, 2012 and December 31, 2016. From January 1, 2008 through December 31, 2016, we acquired
149
facilities, which added
11,288
operational skilled nursing beds and
3,872
assisted and independent living units to our operating subsidiaries.
During the
year ended
December 31, 2016
, we continued to expand our operations with the addition of
eighteen
stand-alone skilled nursing facilities,
one
post-acute care campus,
two
home health agencies and
five
hospice agencies. In addition, we opened
six
newly constructed post-acute care campuses and we have invested in new business lines that are complementary to our existing businesses. We also acquired the underlying real estate of
fifteen
assisted living operation, which we previously operated under a long-term lease agreement. The following table summarizes our growth through December 31, 2016:
6
|
|
December 31,
|
||||||||||||||||||||||||||||||||||
|
|
2006
|
2007
|
2008
|
2009
|
2010
|
2011
|
2012
|
2013
|
2014
|
2015
|
2016
|
||||||||||||||||||||||||
|
Cumulative number of skilled nursing, assisted and independent living operations
|
57
|
|
61
|
|
63
|
|
77
|
|
82
|
|
102
|
|
108
|
|
119
|
|
(1)
|
136
|
|
(1)
|
186
|
|
(2
|
)
|
210
|
|
|||||||||
|
Cumulative number of operational skilled nursing beds
|
5,984
|
|
6,436
|
|
6,635
|
|
8,250
|
|
8,548
|
|
9,787
|
|
10,215
|
|
10,949
|
|
12,379
|
|
14,925
|
|
17,724
|
|
|||||||||||||
|
Cumulative number of assisted living and independent living units
|
426
|
|
578
|
|
578
|
|
578
|
|
791
|
|
1,509
|
|
1,677
|
|
1,968
|
|
(1)
|
2,285
|
|
(1)
|
4,298
|
|
(2
|
)
|
4,450
|
|
|||||||||
|
Number of home health, hospice and home care agencies
|
—
|
|
—
|
|
—
|
|
1
|
|
3
|
|
7
|
|
10
|
|
16
|
|
25
|
|
32
|
|
39
|
|
|||||||||||||
|
Number of urgent care centers
|
—
|
|
—
|
|
—
|
|
—
|
|
—
|
|
—
|
|
3
|
|
7
|
|
14
|
|
17
|
|
—
|
|
(3
|
)
|
|||||||||||
(1) Included in 2013 operational units are operational units of the three independent living facilities we transferred to CareTrust REIT, Inc. (CareTrust) as part of the spin-off transaction (the Spin-Off). Prior to the Spin-Off, the Company separated the healthcare operations from the independent living operations at two locations, resulting in two separate facilities and transferred the two separate facilities and one stand-alone independent facility to CareTrust.
(2) Included in 2010-2015 operational beds and number of operations are operational beds and operation of one facility we voluntarily discontinued at in 2016. 2016 operational beds and number of operations do not include the closed facility.
(3) We completed the sale of urgent care centers in 2016.
New Market CEO and New Ventures Programs.
In order to broaden our reach into new markets, and in an effort to provide existing leaders in our company with the entrepreneurial opportunity and challenge of entering a new market and starting a new business, we established our New Market CEO program in 2006. Supported by our Service Center and other resources, a New Market CEO evaluates a target market, develops a comprehensive business plan, and relocates to the target market to find talent and connect with other providers, regulators and the healthcare community in that market, with the goal of ultimately acquiring facilities and establishing an operating platform for future growth. In addition, this program was expanded to broaden our reach to other lines of business closely related to the skilled nursing industry through our New Ventures program. For example, we entered into home health as part of this program. The New Ventures program encourages facility CEOs to evaluate service offerings with the goal of establishing an operating platform in new markets. We believe that this program will not only continue to drive growth, but will also provide a valuable training ground for our next generation of leaders, who will have experienced the challenges of growing and operating a new business.
Acquisition History
The following table sets forth the location of our facilities and the number of operational beds and units located at our facilities as of
December 31, 2016
:
|
CA
|
TX
|
AZ
|
WI
|
UT
|
CO
|
WA
|
ID
|
NE
|
KS
|
IA
|
SC
|
NV
|
Total
|
||||||||||||||||||||||||||||
|
Number of facilities
|
|||||||||||||||||||||||||||||||||||||||||
|
Skilled nursing operations
|
39
|
|
41
|
|
21
|
|
2
|
|
12
|
|
7
|
|
9
|
|
5
|
|
7
|
|
1
|
|
—
|
|
4
|
|
1
|
|
149
|
|
|||||||||||||
|
Assisted and independent living operations
|
6
|
|
2
|
|
6
|
|
15
|
|
1
|
|
3
|
|
1
|
|
3
|
|
1
|
|
—
|
|
—
|
|
—
|
|
2
|
|
40
|
|
|||||||||||||
|
Campuses
(1)
|
3
|
|
4
|
|
1
|
|
—
|
|
2
|
|
1
|
|
—
|
|
1
|
|
2
|
|
5
|
|
2
|
|
—
|
|
—
|
|
21
|
|
|||||||||||||
|
Number of operational beds/units
|
|||||||||||||||||||||||||||||||||||||||||
|
Operational skilled nursing bed
|
4,152
|
|
|
5,306
|
|
|
3,013
|
|
|
138
|
|
|
1,503
|
|
|
572
|
|
|
841
|
|
|
432
|
|
|
413
|
|
|
542
|
|
|
294
|
|
|
426
|
|
|
92
|
|
17,724
|
|
|
|
Assisted and independent living units
|
735
|
|
|
334
|
|
|
1,250
|
|
|
680
|
|
|
106
|
|
|
282
|
|
|
98
|
|
|
273
|
|
|
301
|
|
|
148
|
|
|
31
|
|
|
—
|
|
|
212
|
|
4,450
|
|
|
(1)
Campus represents a facility that offers both skilled nursing and assisted and/or independently living services.
As of
December 31, 2016
, we provided home health and hospice services through our
39
agencies in Arizona, California, Colorado, Idaho, Iowa, Oregon, Texas, Utah and Washington.
During the
year ended
December 31, 2016
, we expanded our operations with the addition of
two
home health agencies and
five
hospice agencies. In addition, we acquired
eighteen
stand-alone skilled nursing facilities and
one
post-acute care campus through a combination of long-term leases and purchases. As part of these acquisitions, we acquired the real estate at
two
of the skilled nursing operations and
one
post-acute care campus and entered into long term leases for
sixteen
skilled nursing operations. We did not acquire any material assets or assume any liabilities other than the tenant's post-assumption rights and obligations under the long-term lease. We also have invested in new ancillary services that are complementary to our existing transitional and
7
skilled services; assisted and independent living services and home health and hospice businesses. The aggregate purchase price for these acquisitions for the
year ended
December 31, 2016
was
$64.5 million
. The expansion of the operations added
2,336
operational skilled nursing beds and
ten
assisted living units operated by our operating subsidiaries. We entered into a separate operations transfer agreement with the prior operator as part of each transaction.
Our operating subsidiaries opened
six
newly constructed post-acute care campuses under long-term lease agreements, which added
463
operational skilled nursing beds and
142
assisted living units. In November 2016, we entered into an agreement with our landlord to terminate the lease effective as of November 16, 2016. The lease of the facility was scheduled to expire on May 31, 2031.
In addition to the acquisitions described above, we acquired the underlying real estate of
fifteen
assisted living operations, which the Company previously operated under a long-term lease agreement for an aggregate purchase price of
$127.3 million
. These acquisitions did not impact our unit count.
Subsequent to
December 31, 2016
, we acquired
one
skilled nursing and assisted living operation for a purchase price of
$5.8 million
, which included real estate. The addition of this operation added
124
operational skilled nursing beds and
nine
assisted living units operated by our operating subsidiaries.
For further discussion of our acquisitions, see Note 8,
Acquisitions
in the Notes to Consolidated Financial Statements.
Quality of Care Measures
In December 2008, the Centers for Medicare and Medicaid Services (CMS) introduced the Five-Star Quality Rating System to help consumers, their families and caregivers compare nursing homes more easily. The Five-Star Quality Rating System gives each skilled nursing operation a rating of between one and five stars in various categories. In cases of acquisitions, the previous operator's clinical ratings are included in our overall Five-Star Quality Rating. The prior operator's results will impact our rating until we have sufficient clinical measurements subsequent to the acquisition date. Generally we acquire facilities with a 1 or 2-Star rating and as we acquire them, it will impact our overall Five-Star Quality rating as a percentage of all our skilled nursing operations. We believe compliance and quality outcomes are precursors to outstanding financial performance. The table below summarizes the improvements we have made in these quality measures since 2011:
|
|
As of December 31,
|
||||||||||||||||
|
|
2011
|
2012
|
2013
|
2014
|
2015
|
2016
|
|||||||||||
|
Cumulative number of skilled nursing facilities
(1)
|
93
|
|
98
|
|
106
|
|
121
|
|
146
|
|
170
|
|
|||||
|
4 and 5-Star Quality Rated skilled nursing facilities
|
38
|
|
45
|
|
60
|
|
77
|
|
72
|
|
86
|
|
|||||
|
Percentage of 4 and 5-Star Quality Rated skilled nursing facilities
|
40.9
|
%
|
45.9
|
%
|
56.6
|
%
|
63.6
|
%
|
49.3
|
%
|
50.6
|
%
|
|||||
(1) Cumulative number includes only skilled nursing facilities as of the end of the respective period as star rating reports are only applicable to skilled nursing facilities.
Our star ratings starting in 2015 were impacted by changes in the CMS Five Star Quality Rating System requirements that were established on February 20, 2015. These changes include the use of antipsychotics in calculating the star ratings, modified calculations for staffing levels and reflect higher standards for nursing homes to achieve a high rating on the quality measure dimension. In 2016, CMS added six new quality measures to the Nursing Home Five-Star Quality Ratings, including the rate of hospitalization, emergency room use, community discharge, improvements in function, independently worsened and anxiety or hypnotic medication among nursing home residents. Since the revised standards for performance are more difficult to achieve, many nursing homes experienced a lower quality measure rating based on new measurement standard rather than a change in the quality of care. Because of these changes, we believe that it is not appropriate to compare our 2015 and 2016 star ratings with those that appeared in earlier years. In addition, our percentage of 4 and 5-Star Quality Rated skilled nursing facilities is also dependent on the number of newly acquired facilities. As mentioned above, generally we acquire facilities with a 1 or 2-Star rating. In 2016, we acquired and opened
25
skilled nursing facilities compared to
25
and
15
in 2015 and 2014, respectively.
Industry Trends
The post-acute care industry has evolved to meet the growing demand for post-acute and custodial healthcare services generated by an aging population, increasing life expectancies and the trend toward shifting of patient care to lower cost settings. The industry has evolved in recent years, which we believe has led to a number of favorable improvements in the industry, as described below:
|
•
|
Shift of Patient Care to Lower Cost Alternatives
. The growth of the senior population in the United States continues to increase healthcare costs, often faster than the available funding from government-sponsored healthcare programs. In
|
8
response, federal and state governments have adopted cost-containment measures that encourage the treatment of patients in more cost-effective settings such as skilled nursing facilities, for which the staffing requirements and associated costs are often significantly lower than acute care hospitals, inpatient rehabilitation facilities and other post-acute care settings. As a result, skilled nursing facilities are generally serving a larger population of higher-acuity patients than in the past.
|
•
|
Significant Acquisition and Consolidation Opportunities
. The skilled nursing industry is large and highly fragmented, characterized predominantly by numerous local and regional providers. We believe this fragmentation provides significant acquisition and consolidation opportunities for us.
|
|
•
|
Improving Supply and Demand Balance
. The number of skilled nursing facilities has declined modestly over the past several years. We expect that the supply and demand balance in the skilled nursing industry will continue to improve due to the shift of patient care to lower cost settings, an aging population and increasing life expectancies.
|
|
•
|
Increased Demand Driven by Aging Populations and Increased Life Expectancy
. As life expectancy continues to increase in the United States and seniors account for a higher percentage of the total U.S. population, we believe the overall demand for skilled nursing services will increase. At present, the primary market demographic for skilled nursing services is primarily individuals age 75 and older. According to the 2010 U.S. Census, there were over 40 million people in the United States in 2010 that are over 65 years old. The 2010 U.S. Census estimates this group is one of the fastest growing segments of the United States population and is expected to more than double between 2000 and 2030.
|
|
•
|
Accountable Care Organizations and Reimbursement Reforms
.
A significant goal of federal health care reform is to transform the delivery of health care by changing reimbursement for health care services to hold providers accountable for the cost and quality of care provided. Medicare and many commercial third party payors are implementing Accountable Care Organization (ACO) models in which groups of providers share in the benefit and risk of providing care to an assigned group of individuals. Other reimbursement methodology reforms include value-based purchasing, in which a portion of provider reimbursement is redistributed based on relative performance on designated economic, clinical quality, and patient satisfaction metrics. In addition, CMS is implementing demonstration and mandatory programs to bundle acute care and post-acute care reimbursement to hold providers accountable for costs across a broader continuum of care. These reimbursement methodologies and similar programs are likely to continue and expand, both in public and commercial health plans. On April 26, 2015, CMS announced its goal to have 30% of Medicare payments for quality and value through alternative payment models such as ACOs or bundled payments by 2016 and up to 50% by the end of 2018. In March 2016, CMS announced that its 30% target for 2016 was reached in January 2016.
|
We believe the post-acute industry has been and will continue to be impacted by several other trends. The use of long-term care insurance is increasing among seniors as a means of planning for the costs of skilled nursing services. In addition, as a result of increased mobility in society, reduction of average family size, and the increased number of two-wage earner couples, more seniors are looking for alternatives outside the family for their care.
Effects of Changing Prices
Medicare reimbursement rates and procedures are subject to change from time to time, which could materially impact our revenue. Medicare reimburses our skilled nursing operations under a PPS for certain inpatient covered services. Under the PPS, facilities are paid a predetermined amount per patient, per day, based on the anticipated costs of treating patients. The amount to be paid is determined by classifying each patient into a resource utilization group (RUG) category that is based upon each patient’s acuity level. As of October 1, 2010, the RUG categories were expanded from 53 to 66 with the introduction of minimum data set (MDS) 3.0. Should future changes in skilled nursing facility payments reduce rates or increase the standards for reaching certain reimbursement levels, our Medicare revenues could be reduced and/or our costs to provide those services could increase, with a corresponding adverse impact on our financial condition or results of operations.
Our Medicare reimbursement rates and procedures for our home health and hospice operations are based on the severity of the patient’s condition, his or her service needs and other factors relating to the cost of providing services and supplies. Our home health rates and services are bundled into 60-day episodes of care. Payments can be adjusted for: (a) an outlier payment if our patient’s care was unusually costly (capped at 10% of total reimbursement per provider number); (b) a low utilization payment adjustment (LUPA) if the number of visits during the episode was fewer than five; (c) a partial payment if our patient transferred to another provider or we received a patient from another provider before completing the episode; (d) a payment adjustment based upon the level of therapy services required (with various incremental adjustments made for additional visits, and larger payment increases associated with the sixth, fourteenth and twentieth visit thresholds); (e) a payment adjustment if we are unable to perform periodic therapy assessments; (f) the number of episodes of care provided to a patient, regardless of whether the same home health provider provided care for the entire series of episodes; (g) changes in the base episode payments established by the Medicare program; (h) adjustments to the base episode payments for case mix and geographic wages; and (i) recoveries of overpayments.
9
Various healthcare reform provisions became law upon enactment of the Patient Protection and Affordable Care Act and the Healthcare Education and Reconciliation Act (collectively, the ACA). The reforms contained in the ACA have affected our operating subsidiaries in some manner and are directed in large part at increased quality and cost reductions. Several of the reforms are very significant and could ultimately change the nature of our services, the methods of payment for our services and the underlying regulatory environment. These reforms include the possible modifications to the conditions of qualification for payment, bundling of payments to cover both acute and post-acute care and the imposition of enrollment limitations on new providers. The recent presidential and congressional elections in the United States could result in significant changes in, and uncertainty with respect to, legislation, regulation and government policy that could significantly impact our business and the health care industry. We continually monitor these developments in an effort to respond to the changing regulatory environment impacting our business.
On October 4, 2016, CMS released a final rule that reforms the requirements for long-term care (LTC) facilities, specifically skilled nursing facilities (SNFs) and nursing facilities (NFs), to participate in the Medicare and Medicaid programs. The regulations have not been updated since 1991 and have been revised to improve quality of life, care and services in LTC facilities, optimize resident safety, reflect current professional standards and improve the logical flow of the regulations. The regulations are effective November 28, 2016 and will be implemented in three phases. The first phase is effective November 28, 2016, the second phase is effective November 28, 2017 and the phase third becomes effective November 28, 2019.
A few highlights from the new regulation include the following:
|
•
|
investigate and report all allegations of abusive conduct, and refrain from employing individuals who have had a disciplinary action taken against their professional license by a state licensure body as a result of a finding of abuse, neglect, mistreatment of residents or misappropriation of their property;
|
|
•
|
document a transfer or discharge in the medical record and exchange certain information to a receiving provider or facility when a resident is transferred;
|
|
•
|
develop and implement a baseline care plan for each resident within 48 hours of their admission that includes instructions to provide effective and person-centered care that meets professional standards of quality care;
|
|
•
|
develop and implement a discharge planning process that prepares residents to be active partners in post-discharge care;
|
|
•
|
provide the necessary care and services to attain or maintain the highest practicable physical, mental and psychosocial well-being;
|
|
•
|
add a competency requirement for determining the sufficiency of nursing staff;
|
|
•
|
require that a pharmacist reviews a resident’s medical chart during each monthly drug regiment review;
|
|
•
|
refrain from charging a Medicare resident for loss or damage of dentures;
|
|
•
|
provide each resident with a nourishing, palatable and well-balanced diet;
|
|
•
|
conduct, document and annually review a facility-wide assessment to determine what resources are necessary to care for its residents;
|
|
•
|
refrain from entering into a binding arbitration agreement until after a dispute arises between the parties;
|
|
•
|
develop, implement and maintain an effective comprehensive, data-driven quality assurance and performance improvement program;
|
|
•
|
develop an Infection Prevention and Control Program; and
|
|
•
|
require their operating organization have in effect a compliance and ethics program.
|
CMS estimates that the average cost per facility for compliance with the new rule to be approximately $62,900 in the first year and approximately $55,000 in subsequent years. However, these amounts vary per organization. In addition to the monetary costs, these regulations may create compliance issues, as state regulators and surveyors interpret requirements that are less explicit.
On September 16, 2016, CMS issued its final rule concerning emergency preparedness requirements for Medicare and Medicaid participating providers, specifically skilled nursing facilities (SNFs), nursing facilities (NFs), and intermediate care
10
facilities for individuals with intellectual disabilities (ICF/IIDs). The rule is designed to ensure providers and suppliers have comprehensive and integrated emergency policies and procedures in place, in particular during natural and man-made disasters. Under the rule, facilities are required to 1) document risk assessment and emergency planning; 2) develop and implement policies and procedures based on that risk assessment; 3) develop and maintain an emergency preparedness communication plan in compliance with both federal and state law; and 4) develop and maintain an emergency preparedness training and testing program. The regulations outlined in the final rule must be implemented by November 15, 2017.
On July 29, 2016, CMS issued its final rule laying out the performance standards relating to preventable hospital readmissions from skilled nursing facilities. The final rule includes the SNF 30-day All Cause Readmission Measure which assesses the risk-standardized rate of all-cause, all condition, unplanned inpatient hospital readmissions for Medicare fee-for-service SNF patients within 30 days of discharge from admission to an inpatient prospective payment system hospital, CAH or psychiatric hospital. The final rule includes the SNF 30-Day Potentially Preventable Readmission Measure as the SNF all condition risk adjusted potentially preventable hospital readmission measure. This measure assesses the facility-level risk-standardized rate of unplanned, potentially preventable hospital readmissions for SNF patients within 30 days of discharge from a prior admission to an IPPS hospital, CAH, or psychiatric hospital. Hospital readmissions include readmissions to a short-stay acute-care hospital or CAH, with a diagnosis considered to be unplanned and potentially preventable. This measure is claims-based, requiring no additional data collection or submission burden for SNFs.
In addition, the proposed rule states, beginning in 2019, the achievement performance standard for skilled nursing facilities for quality measures specified under the SNF Value Based Purchasing Program (SNF VBP) will be the 25
th
percentile of national SNF performance on the quality measure during the applicable baseline period. This will affect the value based incentive payments paid to skilled nursing facilities.
On December 20, 2016, the Centers for Medicare & Medicaid Services (CMS) issued the final rule for a new Cardiac Rehabilitation Incentive (CR) model, which includes mandatory bundled payment programs for an acute myocardial infarction (AMI) episode of care or a coronary artery bypass graft (CABG) episode of care, and modifications to the existing Comprehensive Care for Joint Replacement (CJR) model to include surgical hip/femur fracture treatment episodes. The new mandatory cardiac programs mirror the Bundled Payments for Care Improvement (BPCI) and Comprehensive Care for Joint Replacement (CJR) models in that actual episode payments will be retrospectively compared against a target price. Similar to CJR, participating hospitals will be at risk for Medicare Part A and B payments in the inpatient admission and 90 days post-discharge. BPCI episodes would continue to take precedence over episodes in the CJR program and in the new cardiac bundled payment program. The cardiac model will be mandatory in 98 randomly selected geographic areas and the hip/femur procedure model will be mandatory in the same 67 geographic areas that were selected for CJR. CMS is also providing “Cardiac Rehabilitation Incentive Payments”, which can be used by hospitals to facilitate cardiac rehabilitation plans and adherence. The incentive will be provided to hospitals in 45 of the 98 geographic areas included in the mandatory bundled payment program and 45 geographic areas outside of the program. The final rule has a start date of July 1, 2017 and will continue for five performance years.
On November 16, 2015, CMS issued the final rule for a new mandatory CJR model focusing on coordinated, patient-centered care. Under this model, the hospital in which the hip or knee replacement takes place is accountable for the costs and quality of care from the time of the surgery through 90 days after, or an “episode” of care. Depending on the hospital’s quality and cost performance during the episode, the hospital either earns a financial reward or is required to repay Medicare for a portion of the costs. This payment is intended to give hospitals an incentive to work with physicians, home health agencies and nursing facilities to make sure beneficiaries receive the coordinated care they need with the goal of reducing avoidable hospitalizations and complications. This model initially covers 67 geographic areas throughout the country and most hospitals in those regions are required to participate. Following the implementation of the CJR program on April 1, 2016, our Medicare revenues derived from our affiliated skilled nursing facilities and other post-acute services related to lower extremity joint replacement hospital discharges could be increased or decreased in those geographic areas identified by CMS for mandatory participation in the bundled payment program.
Skilled Nursing
CMS Payment Rules.
On July 29, 2016, CMS issued its final rule outlining fiscal year 2017 Medicare payment rates and quality programs for skilled nursing facilities. The policies in the finalized rule continue to shift Medicare payments from volume to value. CMS projects that aggregate payments to skilled nursing facilities will increase by a net 2.4% for fiscal year 2017. This estimate increase reflected a 2.7% market basket increase, reduced by a 0.3% multi-factor productivity (MFP) adjustment required by the Patient Protection and Affordable Care Act (ACA). This final rule also further defines the skilled nursing facilities Quality Reporting Program and clarifies the Value-Based Purchasing Program to establish performance standards, baseline and performance periods, performance scoring methodology and feedback reports.
11
The Value-Based Purchasing Program final rule specifies the skilled nursing facility 30-day potentially preventable readmission measure, which assesses the facility-level risk standardized rate of unplanned, potentially preventable hospital readmissions for skilled nursing facility patients within 30 days of discharge from a prior admission to a hospital paid under the Inpatient Prospective Payment System, a critical access hospital, or a psychiatric hospital. There is also finalized additional policies related to the Value-Based Purchasing Program including: establishing performance standards; establishing baseline and performance periods; adopting a performance scoring methodology; and providing confidential feedback reports to the skilled nursing facilities. This final rule is to be effective in October 2017.
On July 30, 2015, CMS issued its final rule outlining fiscal year 2016 Medicare payment rates for skilled nursing facilities. CMS estimates that aggregate payments to skilled nursing facilities will increase by 1.2% for fiscal year 2016. This estimate increase reflected a 2.3% market basket increase, reduced by a 0.6% point forecast error adjustment and further reduced by 0.5% MFP adjustment required by the Patient Protection and Affordable Care Act (ACA). This final rule also identified a new skilled nursing facility value-based purchasing program and all-cause all-condition hospital readmission measure.
On July 31, 2014, CMS issued its final rule outlining fiscal year 2015 Medicare payment rates for skilled nursing facilities. CMS estimates that aggregate payments to skilled nursing facilities will increase by $750 million, or 2.0% for fiscal year 2015, relative to payments in 2014. The estimated increase reflects a 2.5% market basket increase, reduced by the 0.5% MFP adjustment required by ACA.
Should future changes in PPS include further reduced rates or increased standards for reaching certain reimbursement levels, our Medicare revenues derived from our affiliated skilled nursing facilities (including rehabilitation therapy services provided at our affiliated skilled nursing facilities) could be reduced, with a corresponding adverse impact on our financial condition or results of operations.
Home Health
On January 12, 2017, CMS issued a final rule that modernizes the Home Health Conditions of Participation (CoPs). This rule is a continuation of CMS's effort to improve quality of care while streamlining provider requirements to reduce unnecessary procedural requirements. The rule makes significant revisions to the conditions currently in place, including (1) adding new conditions of participation related to quality assurance and performance improvement programs (QAPI) and infection control; and (2) expanding or revising requirements related to patient rights, comprehensive evaluations, coordination and care planning, home health aide training and supervision, and discharge and transfer summary and time frames. Without any contrary action by the new administration, the new conditions are scheduled to be effective July 13, 2017.
On October 31, 2016, CMS issued final payment changes to the Medicare home health prospective payment system (HH PPS) for calendar year 2017. Under this rule, CMS projects that Medicare payments will be reduced by 0.7%. This decrease reflects a negative 0.97% adjustment to the national, standardized 60-day episode payment rate to account for nominal case-mix growth from 2012 through 2014; a 2.3% reduction in payments due to the final year of the four-year phase-in of the rebasing adjustments to the national, standardized 60-day episode payment rate, the national per-visit payment rates and the non-routine medical supplies (NRS) conversion factor; and the effects of the revised fixed-dollar loss (FDL) ratio used in determining outlier payments; partially offset by the home health payment update percentage of 2.5%.
On November 5, 2015, CMS issued final payment changes to the Medicare HH PPS for calendar year 2016. Under this rule, CMS projects that Medicare payments will be reduced by 1.4%. This decrease reflects a 1.9% home health payment update percentage; a 0.9% decrease in payments due to the 0.97% payment reduction to the national, standardized 60-day episode payment rate to account for nominal case-mix growth from 2012 through 2014; and a 2.4% decrease in payments due to the third year of the four-year phase-in of the rebasing adjustments to the national, standardized 60-day episode payment rate, the national per-visit payment rates, and the non-routine medical supplies (NRS) conversion factor. Along with the payment update, CMS is revising the ICD-10-CM translation list and adding certain initial encounter codes to the HH PPS Grouper based upon revised ICD-10-CM coding guidance.
Pursuant to the rule, CMS is also implementing a Home Health Value-Based Purchasing model effective for calendar year 2016, in which all Medicare-certified home health agencies (HHAs) in selected states will be required to participate. The model would apply a payment reduction or increase to current Medicare-certified HHA payments, depending on quality performance, for all agencies delivering services within nine randomly-selected states. Payment adjustments would be applied on an annual basis, beginning at 3.0% in the first payment adjustment year, 5.0% in the second payment adjustment year, 6.0% in the third payment adjustment year and 8.0% in the final two payment adjustment years. CMS estimates that implementing a home health value-based model will result in a 1.4% decrease in Medicare payments to home health agencies across the industry.
12
Lastly, CMS implemented a standardized cross-setting measure for calendar year 2016. The CoPs require home health agencies to submit OASIS assessments as a condition of payment and also for quality measurement purposes. Home health agencies that do not submit quality measure data to CMS will see a 2.0% reduction in their annual home health payment update percentage. Under the rule, all home health agencies are required to submit both admission and discharge OASIS assessments for a minimum of 70.0% of all patients with episodes of care occurring during the reporting period starting July 1, 2015. The rule will incrementally increase this compliance threshold by 10.0% in each of the subsequent periods (July 1, 2016 and July 1, 2017) to reach 90.0%.
On October 30, 2014, CMS announced payment changes to the Medicare HH PPS for calendar year 2015. Under this rule, CMS projects that Medicare payments to home health agencies in calendar year 2015 will be reduced by 0.3%, or $60 million. The decrease reflects the 2.1% home health payment update percentage and the rebasing adjustments to the national, standardized 60-day episode payment rate, the national per-visit payment rates, and the NRS conversion factor. CMS is also finalizing three changes to the face-to-face encounter requirements under the ACA. These changes include: a) eliminating the narrative requirement currently in regulation, b) establishing that if each HHA claim is denied, the corresponding physician claim for certifying/re-certifying patient eligibility for Medicare-covered home health services is considered non-covered as well because there is no longer a corresponding claim for Medicare-covered home health services and c) clarifying that a face-to-face encounter is required for certifications, rather than initial episodes; and that a certification (versus a re-certification) is generally considered to be any time a new start of care assessment is completed to initiate care. This rule also established a minimum submission threshold for the number of OASIS assessments that each HHA must submit under the Home Health Quality Reporting Program and the Home Health Conditions of Participant for speech language pathologist personnel.
Hospice
On July 29, 2016, CMS issued its final rule outlining fiscal year 2017 Medicare payment rates, wage index and cap amount for hospices serving Medicare beneficiaries. Under the final rule, hospices will see a 2.1% increase in their payments effective October 1, 2016. The hospice payment increase will be the net result of 2.7% inpatient hospital market basket update, reduced by a 0.3% productivity adjustment and by a 0.3% adjustment set by the Affordable Care Act. The hospice cap amount for fiscal year 2017 will be increased by 2.1% to $28,404.99, which is equal to the 2016 cap amount of $27,820.75 updated by the FY 2017 hospice payment update percentage of 2.1%. In addition, this rule would propose changes to the hospice quality reporting program, including care surveys and two new quality measures that will assess hospice staff visits to patients and caregivers in the last three and seven days of life and the percentage of hospice patients who received care processes consistent with guidelines.
On July 31, 2015, CMS issued its final rule outlining fiscal year 2016 Medicare payment rates and the wage index for hospices serving Medicare beneficiaries. Under the final rule, hospices will see an estimated 1.1% increase in their payments effective October 1, 2015. The hospice payment increase would be the net result of a hospice payment update to the hospice per diem rates of 2.1% (a “hospital market basket” increase of 2.4% minus 0.3% for reductions required by law) and 1.2% decrease in payments to hospices due to updated wage data and the phase-out of its wage index budget neutrality adjustment factor (BNAF), offset by the newly announced Core Based Statistical Areas (CBSA) delineation impact of 0.2%. The rule also created
two different payment rates for routine home care (RHC) that would result in a higher base payment rate for the first 60 days of hospice care and a reduced base payment rate for 61 or more days of hospice care and a Service Intensity Add-On (SIA) Payment for fiscal year 2016 and beyond in conjunction with the proposed RHC rates.
On August 1, 2014, CMS issued its final rule outlining fiscal year 2015 Medicare payment rates and the wage index for hospices serving Medicare beneficiaries. Under the final rule, hospices will see an estimated 1.4% increase in their payments for fiscal year 2015. The hospice payment increase would be the net result of a hospice payment update to the hospice per diem rates of 2.1% (a “hospital market basket” increase of 2.9% minus 0.8% for reductions required by law) and a 0.7% decrease in payments to hospices due to updated wage data and the sixth year of CMS’ seven-year phase-out of its wage index BNAF. The final rule also states that CMS will begin national implementation of the CAHPS Hospice Survey starting January 1, 2015. In the final rule, CMS requires providers to complete their hospice cap determination within 150 days after the cap period and remit any overpayments. If a hospice does not complete its cap determination in a timely fashion, its Medicare payments would be suspended until the cap determination is complete and received by the contractor. This is similar to the current practice for all other provider types that file cost reports with Medicare.
Medicare Part B Therapy Cap.
Some of our rehabilitation therapy revenue is paid by the Medicare Part B program under a fee schedule. Congress has established annual caps that limit the amounts that can be paid (including deductible and coinsurance amounts) for rehabilitation therapy services rendered to any Medicare beneficiary under Medicare Part B. The Deficit Reduction Act of 2005 (DRA) added Sec. 1833(g)(5) of the Social Security Act and directed CMS to develop a process that allows exceptions for Medicare beneficiaries to therapy caps when continued therapy is deemed medically necessary.
13
Annual limitations on beneficiary incurred expenses for outpatient therapy services under Medicare Part B are commonly referred to as “therapy caps.” All beneficiaries began a new cap year on January 1, 2016 since the therapy caps are determined on a calendar year basis. For physical therapy (PT) and speech-language pathology services (SLP) combined, the limit on incurred expenses is $1,960 in 2016 compared to $1,940 in 2015. For occupational therapy (OT) services, the limit is $1,960 for 2016 compared to $1,940 in 2015. Deductible and coinsurance amounts paid by the beneficiary for therapy services count toward the amount applied to the limit.
An “exceptions process” to the therapy caps exists; however, manual policies relevant to the exceptions process apply only when exceptions to the therapy caps are in effect. The therapy exception process, which under previous legislation was due to expire, was extended and the expected SGR of 21% to the Physician Fee Screen for outpatient therapy services was repealed through the MACRA. Under the legislation, the therapy cap exception extends through December 31, 2017. The application of the therapy caps, and related provisions, to outpatient hospitals is also extended until January 1, 2018.
A manual medical review process, as part of the therapy exceptions process, applies to therapy claims when a beneficiary’s incurred expenses exceed a threshold amount of $3,700 annually. Specifically, combined PT and SLP services that exceed $3,700 are subject to manual medical review, as well as OT services that exceed $3,700. A beneficiary’s incurred expenses apply towards the manual medical review thresholds in the same manner as it applies to the therapy caps. Manual medical review was in effect through a post-payment review system until March 31, 2015. On February 9, 2016, MACRA modified the requirement for manual medical review for services over the $3,700 therapy thresholds to eliminate the requirement for manual medical review of all claims exceeding the thresholds and instead allows a targeted review process.
Medicare Coverage Settlement Agreement.
A proposed federal class action settlement was filed in federal district court on October 16, 2012 that would end the Medicare coverage standard for skilled nursing, home health and outpatient therapy services that a beneficiary's condition must be expected to improve. The settlement was approved on January 24, 2013, which tasked CMS with revising its Medicare Benefit Manual and numerous other policies, guidelines and instructions to ensure that Medicare coverage is available for skilled maintenance services in the home health, skilled nursing and outpatient settings. CMS was also required to develop and implement a nationwide education campaign for all who make Medicare determinations to ensure that beneficiaries with chronic conditions are not denied coverage for critical services because their underlying conditions will not improve, after which the members of the class were given the opportunity for re-review of their claims. The major provisions of this settlement agreement have been implemented by CMS, which could favorably impact Medicare coverage reimbursement for our services. However, health care providers
may be subject to liability in the event they fail to appropriately adapt to the newly clarified reimbursement rules and consequently overbill state Medicaid programs in connection with services rendered to dual-eligible Medicare patients (i.e., by not maximizing Medicare coverage before billing Medicaid).
Historically, adjustments to reimbursement under Medicare have had a significant effect on our revenue. For a discussion of historic adjustments and recent changes to the Medicare program and related reimbursement rates, see Part II, Item 1A Risk Factors under the headings Risks Related to Our Business and Industry - “Our revenue could be impacted by federal and state changes to reimbursement and other aspects of Medicaid and Medicare,” “Our future revenue, financial condition and results of operations could be impacted by continued cost containment pressures on Medicaid spending,” “We may not be fully reimbursed for all services for which each facility bills through consolidated billing, which could adversely affect our revenue, financial condition and results of operations” and “Reforms to the U.S. healthcare system will impose new requirements upon us and may lower our reimbursements.” The federal government and state governments continue to focus on efforts to curb spending on healthcare programs such as Medicare and Medicaid. We are not able to predict the outcome of the legislative process. We also cannot predict the extent to which proposals will be adopted or, if adopted and implemented, what effect, if any, such proposals and existing new legislation will have on us. Efforts to impose reduced allowances, greater discounts and more stringent cost controls by government and other payors are expected to continue and could adversely affect our business, financial condition and results of operations.
Payor Sources
We derive revenue primarily from the Medicaid and Medicare programs, private pay patients and managed care payors. Medicaid typically covers patients that require standard room and board services, and provides reimbursement rates that are generally lower than rates earned from other sources. We monitor our quality mix, which is the percentage of non-Medicaid revenue from each of our facilities, to measure the level received from each payor across each of our business units. We intend to continue to focus on enhancing our care offerings to accommodate more high acuity patients.
Medicaid.
Medicaid is a state-administered program financed by state funds and matching federal funds. Medicaid programs are administered by the states and their political subdivisions, and often go by state-specific names, such as Medi-Cal in California and the Arizona Healthcare Cost Containment System in Arizona. Medicaid programs generally provide health benefits for
14
qualifying individuals, and may supplement Medicare benefits for financially needy persons aged 65 and older. Medicaid reimbursement formulas are established by each state with the approval of the federal government in accordance with federal guidelines. Seniors who enter skilled nursing facilities as private pay clients can become eligible for Medicaid once they have substantially depleted their assets. Medicaid is the largest source of funding for nursing home facilities.
Medicaid reimburses home health and hospice providers, physicians, and certain other health care providers for care provided to certain low income patients. Reimbursement varies from state to state and is based upon a number of different systems, including cost-based, prospective payment and negotiated rate systems. Rates are subject to statutory and regulatory changes and interpretations and rulings by individual state agencies.
Medicare.
Medicare is a federal program that provides healthcare benefits to individuals who are 65 years of age or older or are disabled. To achieve and maintain Medicare certification, a skilled nursing facility must sign a Medicare provider agreement and meet the CMS “Conditions of Participation” on an ongoing basis, as determined in periodic facility inspections or “surveys” conducted primarily by the state licensing agency in the state where the facility is located. Medicare pays for inpatient skilled nursing facility services under the prospective payment system. The prospective payment for each beneficiary is based upon the medical condition of and care needed by the beneficiary. Medicare skilled nursing facility coverage is limited to 100 days per episode of illness for those beneficiaries who require daily care following discharge from an acute care hospital.
The Medicare home health benefit is available both for patients who need care following discharge from a hospital and patients who suffer from chronic conditions that require ongoing but intermittent care. As a condition of participation under Medicare, beneficiaries must be homebound (meaning that the beneficiary is unable to leave his/her home without a considerable and taxing effort), require intermittent skilled nursing, physical therapy or speech therapy services, and receive treatment under a plan of care established and periodically reviewed by a physician. Medicare rates are based on the severity of the patient’s condition, his or her service needs and other factors relating to the cost of providing services and supplies, bundled into 60-day episodes of care. There is no limit to the number of episodes a patient may receive as long as he or she remains Medicare eligible.
The Medicare hospice benefit is also available to Medicare-eligible patients with terminal illnesses, certified by a physician, where life expectancy is six months or less. Medicare rates are based on standard prospective rates for delivering care over a base 90-day or 60-day period (90-day episodes of care for the first two episodes and 60-day episodes of care for any subsequent episodes). Payments are based on daily rates for each day a beneficiary is enrolled in the hospice benefit. Rates are set based on specific levels of care, are adjusted by a wage index to reflect health care labor costs across the country and are established annually through Federal legislation. Medicare payments are subject to two fixed annual caps, which are assessed on a provider number basis. The annual caps per patient, known as hospice caps, are calculated and published by the Medicare fiscal intermediary on an annual basis and cover the twelve month period from November 1 through October 31. The caps can be subject to annual and retroactive adjustments, which can cause providers to owe money back to Medicare if such caps are exceeded.
Managed Care and Private Insurance.
Managed care patients consist of individuals who are insured by certain third-party entities, typically a senior HMO plan, or who are Medicare beneficiaries who have assigned their Medicare benefits to a senior HMO plan. Another type of insurance, long-term care insurance, is also becoming more widely available to consumers, but is not expected to contribute significantly to industry revenues in the near term.
Private and Other Payors.
Private and other payors consist primarily of individuals, family members or other third parties who directly pay for the services we provide.
Billing and Reimbursement.
Our revenue from government payors, including Medicare and state Medicaid agencies, is subject to retroactive adjustments in the form of claimed overpayments and underpayments based on rate adjustments, audits or asserted billing and reimbursement errors. We believe billing and reimbursement errors, disagreements, overpayments and underpayments are common in our industry, and we are regularly engaged with government payors and their contractors in reviews, audits and appeals of our claims for reimbursement due to the subjectivity inherent in the processes related to patient diagnosis and care, recordkeeping, claims processing and other aspects of the patient service and reimbursement processes, and the errors or disagreements those subjectivities can produce.
We take seriously our responsibility to act appropriately under applicable laws and regulations, including Medicare and Medicaid billing and reimbursement laws and regulations. Accordingly, we employ accounting, reimbursement and compliance specialists who train, mentor and assist our clerical, clinical and rehabilitation staffs in the preparation of claims and supporting documentation, regularly monitor billing and reimbursement practices within our operating subsidiaries, and assist with the appeal of overpayment and recoupment claims generated by governmental, Medicare contractors and other auditors and reviewers. In addition, due to the potentially serious consequences that could arise from any impropriety in our billing and reimbursement
15
processes, we investigate allegations of impropriety or irregularity relative thereto, and sometimes do so with the aid of outside auditors (other than our independent registered public accounting firm), attorneys and other professionals.
Whether information about our billing and reimbursement processes is obtained from external sources or activities such as Medicare and Medicaid audits or probe reviews, internal investigations, or our regular day-to-day monitoring and training activities, we collect and utilize such information to improve our billing and reimbursement functions and the various processes related thereto. While, like other operators in our industry, we experience billing and reimbursement errors, disagreements and other effects of the inherent subjectivities in reimbursement processes on a regular basis, we believe that we are in substantial compliance with applicable Medicare and Medicaid reimbursement requirements. We continually strive to improve the efficiency and accuracy of all of our operational and business functions, including our billing and reimbursement processes.
The following table sets forth our total revenue by payor source generated by each of our reportable segments and our "All Other" category and as a percentage of total revenue for the periods indicated (dollars in thousands):
|
|
Year Ended December 31, 2016
|
|||||||||||||||||||||||||||
|
Transitional and Skilled Services
(2)
|
Assisted and Independent Living Services
(2)
|
Home Health and Hospice Services
|
All Other
|
|||||||||||||||||||||||||
|
|
Home Health Services
|
Hospice Services
|
Total Revenue
|
Revenue %
|
||||||||||||||||||||||||
|
Medicaid
|
$
|
521,063
|
|
$
|
26,397
|
|
$
|
4,131
|
|
$
|
6,367
|
|
$
|
—
|
|
$
|
557,958
|
|
33.7
|
%
|
||||||||
|
Medicare
|
396,519
|
|
—
|
|
32,376
|
|
48,124
|
|
—
|
|
477,019
|
|
28.8
|
|
||||||||||||||
|
Medicaid-skilled
|
87,517
|
|
—
|
|
—
|
|
—
|
|
—
|
|
87,517
|
|
5.3
|
|
||||||||||||||
|
Subtotal
|
1,005,099
|
|
26,397
|
|
36,507
|
|
54,491
|
|
—
|
|
1,122,494
|
|
67.8
|
|
||||||||||||||
|
Managed care
|
247,844
|
|
—
|
|
16,913
|
|
751
|
|
—
|
|
265,508
|
|
16.0
|
|
||||||||||||||
|
Private and other
|
121,860
|
|
97,239
|
|
6,906
|
|
245
|
|
40,612
|
|
(1)
|
266,862
|
|
16.2
|
|
|||||||||||||
|
Total revenue
|
$
|
1,374,803
|
|
$
|
123,636
|
|
$
|
60,326
|
|
$
|
55,487
|
|
$
|
40,612
|
|
$
|
1,654,864
|
|
100.0
|
%
|
||||||||
|
(1) Private and other payors in our "All Other" category includes revenue from all payors generated in our urgent care centers and other ancillary operations.
|
||||||||||||||||||||||||||||
|
(2) Certain revenues by payor source were reclassified between Medicaid and private and other to conform with the current year segment presentation.
|
||||||||||||||||||||||||||||
|
|
Year Ended December 31, 2015
|
|||||||||||||||||||||||||||
|
Transitional and Skilled Services
(2)
|
Assisted and Independent Living Services
(2)
|
Home Health and Hospice Services
|
All Other
|
|||||||||||||||||||||||||
|
|
Home Health Services
|
Hospice Services
|
Total Revenue
|
Revenue %
|
||||||||||||||||||||||||
|
Medicaid
|
$
|
430,368
|
|
$
|
19,642
|
|
$
|
3,598
|
|
$
|
5,348
|
|
$
|
—
|
|
$
|
458,956
|
|
34.2
|
%
|
||||||||
|
Medicare
|
332,429
|
|
—
|
|
26,828
|
|
36,246
|
|
—
|
|
395,503
|
|
29.5
|
|
||||||||||||||
|
Medicaid-skilled
|
71,905
|
|
—
|
|
—
|
|
—
|
|
—
|
|
71,905
|
|
5.4
|
|
||||||||||||||
|
Subtotal
|
834,702
|
|
19,642
|
|
30,426
|
|
41,594
|
|
—
|
|
926,364
|
|
69.1
|
|
||||||||||||||
|
Managed care
|
194,743
|
|
—
|
|
11,391
|
|
636
|
|
—
|
|
206,770
|
|
15.4
|
|
||||||||||||||
|
Private and other
|
96,943
|
|
68,487
|
|
6,138
|
|
171
|
|
36,953
|
|
(1)
|
208,692
|
|
15.5
|
|
|||||||||||||
|
Total revenue
|
$
|
1,126,388
|
|
$
|
88,129
|
|
$
|
47,955
|
|
$
|
42,401
|
|
$
|
36,953
|
|
$
|
1,341,826
|
|
100.0
|
%
|
||||||||
|
(1) Private and other payors in our "All Other" category includes revenue from all payors generated in our urgent care centers and other ancillary operations.
|
||||||||||||||||||||||||||||
|
(2) Certain revenues by payor source were reclassified between Medicaid and private and other to conform with the current year segment presentation.
|
||||||||||||||||||||||||||||
16
|
|
Year ended December 31, 2014
|
|||||||||||||||||||||||||||
|
Transitional and Skilled Services
(2)
|
Assisted and Independent Living Services
(2)
|
Home Health and Hospice Services
|
All Other
|
|||||||||||||||||||||||||
|
|
Home Health Services
|
Hospice Services
|
Total Revenue
|
Revenue %
|
||||||||||||||||||||||||
|
Medicaid
|
$
|
352,271
|
|
$
|
11,590
|
|
$
|
1,971
|
|
$
|
3,274
|
|
$
|
—
|
|
$
|
369,106
|
|
35.9
|
%
|
||||||||
|
Medicare
|
274,723
|
|
—
|
|
17,353
|
|
21,068
|
|
—
|
|
313,144
|
|
30.5
|
|
||||||||||||||
|
Medicaid-skilled
|
51,157
|
|
—
|
|
—
|
|
—
|
|
—
|
|
51,157
|
|
5.0
|
|
||||||||||||||
|
Subtotal
|
678,151
|
|
11,590
|
|
19,324
|
|
24,342
|
|
—
|
|
733,407
|
|
71.5
|
|
||||||||||||||
|
Managed care
|
138,215
|
|
—
|
|
7,213
|
|
368
|
|
—
|
|
145,796
|
|
14.2
|
|
||||||||||||||
|
Private and other
|
85,104
|
|
37,258
|
|
3,040
|
|
229
|
|
22,572
|
|
(1)
|
148,203
|
|
14.3
|
|
|||||||||||||
|
Total revenue
|
$
|
901,470
|
|
$
|
48,848
|
|
$
|
29,577
|
|
$
|
24,939
|
|
$
|
22,572
|
|
$
|
1,027,406
|
|
100.0
|
%
|
||||||||
|
(1) Private and other payors in our "All Other" category includes revenue from all payors generated in our urgent care centers and other ancillary operations.
|
||||||||||||||||||||||||||||
|
(2) Certain revenues by payor source were reclassified between Medicaid and private and other to conform with the current year segment presentation.
|
||||||||||||||||||||||||||||
Payor Sources as a Percentage of Skilled Nursing Services.
We use both our skilled mix and quality mix as measures of the quality of reimbursements we receive at our skilled nursing operations over various periods. The following table sets forth our percentage of skilled nursing patient days by payor source:
|
|
Year Ended December 31,
|
|||||||
|
|
2016
|
2015
|
|
2014
|
||||
|
Percentage of Skilled Nursing Days:
|
|
|
|
|||||
|
Medicare
|
14.4
|
%
|
14.6
|
%
|
|
14.2
|
%
|
|
|
Managed care
|
12.0
|
|
11.4
|
|
|
9.7
|
|
|
|
Other skilled
|
4.5
|
|
4.4
|
|
|
3.7
|
|
|
|
Skilled mix
|
30.9
|
|
30.4
|
|
|
27.6
|
|
|
|
Private and other payors
|
12.5
|
|
12.1
|
|
|
13.1
|
|
|
|
Quality mix
|
43.4
|
|
42.5
|
|
|
40.7
|
|
|
|
Medicaid
|
56.6
|
|
57.5
|
|
|
59.3
|
|
|
|
Total skilled nursing
|
100.0
|
%
|
100.0
|
%
|
|
100.0
|
%
|
|
Reimbursement for Specific Services
Reimbursement for Skilled Nursing Services.
Skilled nursing facility revenue is primarily derived from Medicaid, private pay, managed care and Medicare payors. Our skilled nursing operations provide Medicaid-covered services to eligible individuals consisting of nursing care, room and board and social services. In addition, states may, at their option, cover other services such as physical, occupational and speech therapies.
Reimbursement for Rehabilitation Therapy Services.
Rehabilitation therapy revenue is primarily received from private pay, managed care and Medicare for services provided at skilled nursing operations and assisted living operations. The payments are based on negotiated patient per diem rates or a negotiated fee schedule based on the type of service rendered.
Reimbursement for Assisted Living Services.
Assisted living facility revenue is primarily derived from private pay patients at rates we establish based upon the services we provide and market conditions in the area of operation. In addition, Medicaid or other state-specific programs in some states where we operate supplement payments for board and care services provided in assisted living facilities.
Reimbursement for Hospice Services.
Hospice revenues are primarily derived from Medicare. We receive one of four predetermined daily or hourly rates based on the level of care we furnish to the beneficiary. These rates are subject to annual adjustments based on inflation and geographic wage considerations.
17
We are subject to two limitations on Medicare payments for hospice services. First, if inpatient days of care provided to patients at a hospice exceed 20% of the total days of hospice care provided for an annual period beginning on November 1st, then payment for days in excess of this limit are paid at the routine home care rate.
Second, overall payments made by Medicare to us on a per hospice program basis are also subject to a cap amount calculated by the Medicare fiscal intermediary at the end of the hospice cap period. The Medicare revenue paid to a hospice program from November 1 to October 31 may not exceed the annual aggregate cap amounts. For cap years ended on or after October 31, 2012, and all subsequent cap years, the hospice aggregate cap is calculated using the proportional method. Under the proportional method, the hospice shall include in its number of Medicare beneficiaries only that fraction which represents the portion of a patient's total days of care in all hospices and all years that were spent in that hospice in that cap year, using the best data available at the time of the calculation. The whole and fractional shares of Medicare beneficiaries' time in a given cap year are then summed to compute the total number of Medicare beneficiaries served by that hospice in that cap year. The hospice's total Medicare beneficiaries in a given cap year is multiplied by the Medicare per beneficiary cap amount, resulting in that hospice's aggregate cap, which is the allowable amount of total Medicare payments that hospice can receive for that cap year. If a hospice exceeds its aggregate cap, then the hospice must repay the excess back to Medicare. The Medicare cap amount is reduced proportionately for patients who transferred in and out of our hospice services.
Reimbursement for Home Health Services
. We derive substantially all of the revenue from our home health business from Medicare and managed care sources. Our home health care services generally consist of providing some combination of the services of registered nurses, speech, occupational and physical therapists, medical social workers and certified home health aides. Home health care is often a cost-effective solution for patients, and can also increase their quality of life and allow them to receive quality medical care in the comfort and convenience of a familiar setting.
Competition
The post-acute care industry is highly competitive, and we expect that the industry will become increasingly competitive in the future. The industry is highly fragmented and characterized by numerous local and regional providers, in addition to large national providers that have achieved geographic diversity and economies of scale. Our operating subsidiaries also compete with inpatient rehabilitation facilities and long-term acute care hospitals. Competitiveness may vary significantly from location to location, depending upon factors such as the number of competing facilities, availability of services, expertise of staff, and the physical appearance and amenities of each location. We believe that the primary competitive factors in the post-acute care industry are:
|
•
|
ability to attract and to retain qualified management and caregivers;
|
|
•
|
reputation and achievements of quality healthcare outcomes;
|
|
•
|
attractiveness and location of facilities;
|
|
•
|
the expertise and commitment of the facility management team and employees; and
|
|
•
|
community value, including amenities and ancillary services.
|
We seek to compete effectively in each market by establishing a reputation within the local community as the “operation of choice.” This means that the operation leaders are generally free to discern and address the unique needs and priorities of healthcare professionals, customers and other stakeholders in the local community or market, and then create a superior service offering and reputation for that particular community or market that is calculated to encourage prospective customers and referral sources to choose or recommend the operation.
Increased competition could limit our ability to attract and retain patients, maintain or increase rates or to expand our business. Some of our competitors have greater financial and other resources than we have, may have greater brand recognition and may be more established in their respective communities than we are. Competing companies may also offer newer facilities or different programs or services than we offer, and may therefore attract individuals who are currently patients of our facilities, potential patients of our facilities, or who are otherwise receiving our healthcare services. Other competitors may have lower expenses or other competitive advantages than us and, therefore, provide services at lower prices than we offer.
There are few barriers to entry in the home health and hospice business in jurisdictions that do not require certificates of need or permits of approval. Our primary competition in these jurisdictions comes from local privately and publicly-owned and
18
hospital-owned health care providers. We compete based on the availability of personnel, the quality of services, expertise of visiting staff, and, in certain instances, on the price of our services. In addition, we compete with a number of non-profit organizations that finance acquisitions and capital expenditures on a tax-exempt basis and charity-funded programs that may have strong ties to their local medical communities and receive charitable contributions that are unavailable to us.
Our other services, such as assisted living facilities and other ancillary services, also compete with local, regional, and national companies. The primary competitive factors in these businesses are similar to those for our skilled nursing facilities and include reputation, cost of services, quality of clinical services, responsiveness to patient/resident needs, location and the ability to provide support in other areas such as third-party reimbursement, information management and patient recordkeeping.
Our Competitive Strengths
We believe that we are well positioned to benefit from the ongoing changes within our industry. We believe that our ability to acquire, integrate and improve our facilities is a direct result of the following key competitive strengths:
Experienced and Dedicated Employees.
We believe that our operating subsidiaries' employees are among the best in their respective industry. We believe each of our operating subsidiaries is led by an experienced and caring leadership team, including dedicated front-line care staff, who participates daily in the clinical and operational improvement of their individual operations. We have been successful in attracting, training, incentivizing and retaining a core group of outstanding business and clinical leaders to lead our operating subsidiaries. These leaders operate as separate local businesses. With broad local control, these talented leaders and their care staffs are able to quickly meet the needs of their patients and residents, employees and local communities, without waiting for permission to act or being bound to a “one-size-fits-all” corporate strategy.
Unique Incentive Programs.
We believe that our employee compensation programs are unique within the industry. Employee stock options and performance bonuses, based on achieving target clinical quality, cultural, compliance and financial benchmarks, represent a significant component of total compensation for our operational leaders. We believe that these compensation programs assist us in encouraging our leaders and key employees to act with a shared ownership mentality. Furthermore, our leaders are motivated to help local operations within a defined “cluster” and "market," which is a group of geographically-proximate operations that share clinical best practices, real-time financial data and other resources and information.
Staff and Leadership Development.
We have a company-wide commitment to ongoing education, training and professional development. Accordingly, our operational leaders participate in regular training. Most participate in training sessions at Ensign University, our in-house educational system. Other training opportunities are generally offered on a monthly basis. Training and educational topics include leadership development, our values, updates on Medicaid and Medicare billing requirements, updates on new regulations or legislation, emerging healthcare service alternatives and other relevant clinical, business and industry specific coursework. Additionally, we encourage and provide ongoing education classes for our clinical staff to maintain licensing and increase the breadth of their knowledge and expertise. We believe that our commitment to, and substantial investment in, ongoing education will further strengthen the quality of our operational leaders and staff, and the quality of the care they provide to our patients and residents.
Innovative Service Center Approach.
We do not maintain a corporate headquarters; rather, we operate a Service Center to support the efforts of each operation. Our Service Center is a dedicated service organization that acts as a resource and provides centralized information technology, human resources, accounting, payroll, legal, risk management, educational and other centralized services, so that local leaders can focus on delivering top-quality care and efficient business operations. Our Service Center approach allows individual operations to function with the strength, synergies and economies of scale found in larger organizations, but without what we believe are the disadvantages of a top-down management structure or corporate hierarchy. We believe our Service Center approach is unique within the industry, and allows us to preserve the “one-facility-at-a-time” focus and culture that has contributed to our success.
Proven Track Record of Successful Acquisitions.
We have established a disciplined acquisition strategy that is focused on selectively acquiring operations within our target markets. Our acquisition strategy is highly operations driven. Prospective leaders are included in the decision making process and compensated as these acquired operations reach pre-established clinical quality and financial benchmarks, helping to ensure that we only undertake acquisitions that key leaders believe can become clinically sound and contribute to our financial performance.
As of
December 31, 2016
, we have acquired
210
facilities with
17,724
operational skilled nursing beds and
4,420
assisted and independent units, through both long-term leases and purchases. We believe our experience in acquiring these facilities and our demonstrated success in significantly improving their operations enables us to consider a broad range of acquisition targets.
19
In addition, we believe we have developed expertise in transitioning newly-acquired facilities to our unique organizational culture and operating systems, which enables us to acquire facilities with limited disruption to patients, residents and facility operating staff, while significantly improving quality of care. We have also constructed new facilities to target demand, which exists for high-end healthcare facilities when we determine that market conditions justify the cost of new construction in some of our markets.
Reputation for Quality Care.
We believe that we have achieved a reputation for high-quality and cost-effective care and services to our patients and residents within the communities we serve. We believe that our achievement of quality outcomes enhances our reputation for quality, that when coupled with the integrated services that we offer, allows us to attract patients that require more intensive and medically complex care and generally result in higher reimbursement rates than lower acuity patients.
Community Focused Approach.
We view our services primarily as a local, community-based business. Our local leadership-centered management culture enables each operation's nursing and support staff and leaders to meet the unique needs of their patients and local communities. We believe that our commitment to this “one-operation-at-a-time” philosophy helps to ensure that each operation, its patients, their family members and the community will receive the individualized attention they need. By serving our patients, their families, the community and our fellow healthcare professionals, we strive to make each individual facility the operation of choice in its local community.
We further believe that when choosing a healthcare provider, consumers usually choose a person or people they know and trust, rather than a corporation or business. Therefore, rather than pursuing a traditional organization-wide branding strategy, we actively seek to develop the facility brand at the local level, serving and marketing one-on-one to caregivers, our patients, their families, the community and our fellow healthcare professionals in the local market.
Investment in Information Technology.
We utilize information technology that enables our facility leaders to access, and to share with their peers, both clinical and financial performance data in real time. Armed with relevant and current information, our operation leaders and their management teams are able to share best practices and the latest information, adjust to challenges and opportunities on a timely basis, improve quality of care, mitigate risk and improve both clinical outcomes and financial performance. We have also invested in specialized healthcare technology systems to assist our nursing and support staff. We have installed automated software and touch-screen interface systems in each facility to enable our clinical staff to more efficiently monitor and deliver patient care and record patient information. We believe these systems have improved the quality of our medical and billing records, while improving the productivity of our staff.
Our Growth Strategy
We believe that the following strategies are primarily responsible for our growth to date, and will continue to drive the growth of our business:
Grow Talent Base and Develop Future Leaders.
Our primary growth strategy is to expand our talent base and develop future leaders. A key component of our organizational culture is our belief that strong local leadership is a primary key to the success of each operation. While we believe that significant acquisition opportunities exist, we have generally followed a disciplined approach to growth that permits us to acquire an operation only when we believe, among other things, that we will have qualified leadership for that operation. To develop these leaders, we have a rigorous “CEO-in-Training Program” that attracts proven business leaders from various industries and backgrounds, and provides them the knowledge and hands-on training they need to successfully lead one of our operating subsidiaries. We generally have between five and 30 prospective administrators progressing through the various stages of this training program, which is generally much more rigorous, hands-on and intensive than the minimum 1,000 hours of training mandated by the licensing requirements of most states where we do business. Once administrators are licensed and assigned to an operation, they continue to learn and develop in our facility Chief Executive Officer Program, which facilitates the continued development of these talented business leaders into outstanding facility CEOs, through regular peer review, our Ensign University and on-the-job training.
In addition, our Chief Operating Officer Program recruits and trains highly-qualified Directors of Nursing to lead the clinical programs in our skilled nursing facilities. Working together with their facility CEO and/or administrator, other key facility leaders and front-line staff, these experienced nurses manage delivery of care and other clinical personnel and programs to optimize both clinical outcomes and employee and patient satisfaction.
Increase Mix of High Acuity Patients.
Many skilled nursing facilities are serving an increasingly larger population of patients who require a high level of skilled nursing and rehabilitative care, whom we refer to as high acuity patients, as a result of government and other payors seeking lower-cost alternatives to traditional acute-care hospitals. We generally receive higher reimbursement rates for providing care for these medically complex patients. In addition, many of these patients require therapy and other
20
rehabilitative services, which we are able to provide as part of our integrated service offerings. Where therapy services are medically necessary and prescribed by a patient's physician or other appropriate healthcare professional, we generally receive additional revenue in connection with the provision of those services. By making these integrated services available to such patients, and maintaining established clinical standards in the delivery of those services, we are able to increase our overall revenues. We believe that we can continue to attract high acuity patients and therapy patients to our facilities by maintaining and enhancing our reputation for quality care and continuing our community focused approach.
Focus on Organic Growth and Internal Operating Efficiencies.
We plan to continue to grow organically by focusing on increasing patient occupancy within our existing facilities. Although some of the facilities we have acquired were in good physical and operating condition, the majority have been clinically and financially troubled, with some facilities having had occupancy rates as low as 30% at the time of acquisition. Additionally, we believe that incremental operating margins on the last 20% of our beds are significantly higher than on the first 80%, offering opportunities to improve financial performance within our existing facilities. Our overall occupancy is impacted significantly by the number of facilities acquired and the operational occupancy on the acquisition date. Therefore, consolidated occupancy will vary significantly based on these factors. Our average occupancy rates for our skilled nursing facilities for the years ended December 31, 2016, 2015 and 2014 were
75.4%
,
77.6%
, and
77.3%
, respectively. Our average occupancy rates for our assisted and independent living facilities for the years ended December 31, 2016, 2015 and 2014 were
76.0%
,
75.3%
, and
77.3%
, respectively.
We also believe we can generate organic growth by improving operating efficiencies and the quality of care at the patient level. By focusing on staff development, clinical systems and the efficient delivery of quality patient care, we believe we are able to deliver higher quality care at lower costs than many of our competitors.
We also have achieved incremental occupancy and revenue growth by creating or expanding outpatient therapy programs in existing facilities. Physical, occupational and speech therapy services account for a significant portion of revenue in most of our skilled nursing facilities. By expanding therapy programs to provide outpatient services in many markets, we are able to increase revenue while spreading the fixed costs of maintaining these programs over a larger patient base. Outpatient therapy has also proven to be an effective marketing tool, raising the visibility of our facilities in their local communities and enhancing the reputation of our facilities with short-stay rehabilitation patients.
Add New Facilities and Expand Existing Facilities.
A key element of our growth strategy includes the acquisition of new and existing facilities from third parties and the expansion and upgrade of current facilities. In the near term, we plan to take advantage of the fragmented skilled nursing industry by acquiring operations within select geographic markets and may consider the construction of new facilities. In addition, we have targeted facilities that we believed were performing and operations that were underperforming, and where we believed we could improve service delivery, occupancy rates and cash flow. With experienced leaders in place at the community level, and demonstrated success in significantly improving operating conditions at acquired facilities, we believe that we are well positioned for continued growth. While the integration of underperforming facilities generally has a negative short-term effect on overall operating margins, these facilities are typically accretive to earnings within 12 to 18 months following their acquisition. For the
124
facilities that we acquired from 2001 through 2016, the aggregate EBITDAR (defined below) as a percentage of revenue improved from
11.7%
during the first full three months of operations to
13.4%
during the thirteenth through fifteenth months of operations.
Strategically Invest In and Integrate Other Post-Acute Care Healthcare Businesses.
Another important element to our growth strategy includes acquiring new and existing home health, hospice and other post-acute care healthcare businesses. Since 2010, we have steadily expanded our home health and hospice businesses through the acquisition of smaller third-party providers. Our strategy is to provide a more seamless experience to manage the transition of care throughout the post-acute continuum. Our objective is to simultaneously improve patient outcomes and reduce costs to payers, ACOs and hospital systems. We believe that the same principles that have guided our skilled nursing and assisted living operations are transferable to these businesses, including reliance on experienced local leaders at the community level to focus on integrating these operations into the continuum of care services we provide. Between 2009 and February 2017, we have acquired
19
hospice agencies,
20
home health and home care agencies, and we are well positioned for continued growth in these and other healthcare businesses.
Labor
The operation of our skilled nursing and assisted and independent living facilities, home health and hospice operations and urgent care centers requires a large number of highly skilled healthcare professionals and support staff. At December 31, 2016, we had approximately
19,482
full-time equivalent employees who were employed by our Service Center and our operating subsidiaries. For the year ended December 31, 2016, approximately
60.0%
of our total expenses were payroll related. Periodically, market forces, which vary by region, require that we increase wages in excess of general inflation or in excess of increases in
21
reimbursement rates we receive. We believe that we staff appropriately, focusing primarily on the acuity level and day-to-day needs of our patients and residents. In most of the states where we operate, our skilled nursing facilities are subject to state mandated minimum staffing ratios, so our ability to reduce costs by decreasing staff, notwithstanding decreases in acuity or need, is limited and subject to government audits and penalties in some states. We seek to manage our labor costs by improving staff retention, improving operating efficiencies, maintaining competitive wage rates and benefits and reducing reliance on overtime compensation and temporary nursing agency services.
The healthcare industry as a whole has been experiencing shortages of qualified professional clinical staff. We believe that our ability to attract and retain qualified professional clinical staff stems from our ability to offer attractive wage and benefits packages, a high level of employee training, an empowered culture that provides incentives for individual efforts and a quality work environment.
Government Regulation
The regulatory environment within the skilled nursing industry continues to intensify in the amount and type of laws and regulations affecting it. In addition to this changing regulatory environment, federal, state and local officials are increasingly focusing their efforts on the enforcement of these laws. In order to operate our businesses we must comply with federal, state and local laws relating to licensure, delivery and adequacy of medical care, distribution of pharmaceuticals, equipment, personnel, operating policies, fire prevention, rate-setting, billing and reimbursement, building codes and environmental protection. Additionally, we must also adhere to anti-kickback laws, physician referral laws, and safety and health standards set by the Occupational Safety and Health Administration (OSHA). Changes in the law or new interpretations of existing laws may have an adverse impact on our methods and costs of doing business.
Our operating subsidiaries are also subject to various regulations and licensing requirements promulgated by state and local health and social service agencies and other regulatory authorities. Requirements vary from state to state and these requirements can affect, among other things, personnel education and training, patient and personnel records, services, staffing levels, monitoring of patient wellness, patient furnishings, housekeeping services, dietary requirements, emergency plans and procedures, certification and licensing of staff prior to beginning employment, and patient rights. These laws and regulations could limit our ability to expand into new markets and to expand our services and facilities in existing markets.
State Regulations.
On March 24, 2011, the governor of California signed Assembly Bill 97 (AB 97), the budget trailer bill on health, into law. AB 97 outlines significant cuts to state health and human services programs. Specifically, the law reduced provider payments by 10% for physicians, pharmacies, clinics, medical transportation, certain hospitals, home health, and nursing facilities. AB X1 19 Long Term Care was subsequently approved by the governor on June 28, 2011. Federal approval was obtained on October 27, 2011. AB X1 19 limited the 10% payment reduction to skilled-nursing providers to 14 months for the services provided on June 1, 2011 through July 31, 2012. The 10% reduction in provider payments was repaid by December 31, 2012.
Federal Health Care Reform.
On April 16, 2015, the President signed into law MACRA. This bill includes a number of provisions, including (1) replacement of the Sustainable Growth Rate (SGR) formula used by Medicare to pay physicians with new systems for establishing annual payment rate updates for physicians' services, (2) an extension of the outpatient therapy cap exception process until December 31, 2017; and (3) payment updates for post-acute providers at 1% after other adjustments required by the ACA for 2018. In addition, it increases premiums for Part B and Part D of Medicare for beneficiaries with income above certain levels and makes numerous other changes to Medicare and Medicaid.
On October 30, 2015, CMS released a final rule addressing, among other things, implementation of certain provisions of MACRA, including the implementation of the new Merit-Based Incentive Payment System (MIPS). The current Value-Based Payment Modifier program is set to expire in 2018, with MIPS to begin in 2019. The October 30, 2015 final rule added measures where gaps exist in the current Physician Quality Reporting System (PQRS), which is used by CMS to track the quality of care provided to Medicare beneficiaries. The final rule also excludes services furnished in SNFs from the definition of primary care services for purposes of the Shared Savings Program. The final rule could impact our revenue in the future.
On February 20, 2015, CMS modified the
Five Star Quality Rating System
for nursing homes to include the use of antipsychotics in calculating the star ratings, modified calculations for staffing levels and reflect higher standards for nursing homes to achieve a high rating on the quality measure dimension. Since the standards for performance are more difficult to achieve, the number of our 4 and 5 star facilities could be reduced.
On January 13, 2017, CMS issued a Final Rule revising the conditions of participation for home health agencies serving Medicare beneficiaries. The rule makes significant revisions to the conditions currently in place, including (1) adding new
22
conditions of participation related to quality assurance and performance improvement programs; and (2) expanding or revising requirements related to patient rights, comprehensive evaluations, coordination and care planning, home health aide training and supervision, and discharge and transfer summary and time frames. Without any contrary action by the new administration, the new conditions are scheduled to be effective July 13, 2017.
On April 27, 2016, CMS added six new quality measures to its consumer-based Nursing Home Compare
website. These quality measures include the rate of rehospitalization, emergency room use, community discharge, improvements in function, independently worsened and antianxiety or hypnotic medication among nursing home residents. Beginning in July 2016, CMS incorporates all of these measures, except for the antianxiety/hypnotic medication measure, into the calculation of the Nursing Home Five-Star Quality Ratings.
On February 2, 2016, CMS issued its final rule concerning face-to-face requirements for Medicaid home health services. Under the rule, the Medicaid home health service definition was revised consistent with applicable sections of the ACA and H.R. 2 Medicare Access and CHIP Reauthorization Act of 2015 (MACRA). The rule also requires that for the initial ordering of home health services, the physician must document that a face-to-face encounter that is related to the primary reason the beneficiary requires home health services occurred no more than 90 days before or 30 days after the start of services. The final rule also requires that for the initial ordering of certain medical equipment, the physician or authorized non-physician provider (NPP) must document that a face-to-face encounter that is related to the primary reason the beneficiary requires medical equipment occurred no more than six months prior to the start of services.
The Improving Medicare Post-Acute Care Transformation Act of 2014 (the IMPACT Act), which was signed into law on October 6, 2014, requires the submission of standardized assessment data for quality improvement, payment and discharge planning purposes across the spectrum of post-acute care providers (PACs), including skilled nursing facilities and home health agencies. The IMPACT Act will require PACs to begin reporting: (1) standardized patient assessment data at admission and discharge by October 1, 2018 for post acute care providers, including skilled nursing facilities by January 1, 2019 for home health agencies; (2) new quality measures, including functional status, skin integrity, medication reconciliation, incidence of major falls, and patient preference regarding treatment and discharge at various intervals between October 1, 2016 and January 1, 2019; and (3) resource use measures, including Medicare spending per beneficiary, discharge to community, and hospitalization rates of potentially preventable readmissions by October 1, 2016 for post-acute care providers, including skilled nursing facilities and by January 1, 2017 for home health agencies. Failure to report such data when required would subject a facility to a two percent reduction in market basket prices then in effect.
The IMPACT Act further requires HHS and the Medicare Payment Advisory Commission (MedPAC), a commission chartered by Congress to advise it on Medicare payment issues, to study alternative PAC payment models, including payment based upon individual patient characteristics and not care setting, with corresponding Congressional reports required based on such analysis. The IMPACT Act also included provisions impacting Medicare-certified hospices, including: (1) increasing survey frequency for Medicare-certified hospices to once every 36 months; (2) imposing a medical review process for facilities with a high percentage of stays in excess of 180 days; and (3) updating the annual aggregate Medicare payment cap.
On April 1, 2014, the President signed into law the Protecting Access to Medicare Act of 2014, which averted a 24% cut in Medicare payments to physicians and other Part B providers until March 31, 2015. In addition, this law maintains the 0.5% update for such services through December 31, 2014 and provides a 0.0% update to the 2015 Medicare Physician Fee Schedule (MPFS) through March 31, 2015. Among other things, this law provides the framework for implementation of a value-based purchasing program for skilled nursing facilities. Under this legislation HHS is required to develop by October 1, 2016 measures and performance standards regarding preventable hospital readmissions from skilled nursing facilities. Beginning October 1, 2018, HHS will withhold 2% of Medicare payments to all skilled nursing facilities and distribute this pool of payment to skilled nursing facilities as incentive payments for preventing readmissions to hospitals.
On January 2, 2013, the President signed the American Taxpayer Relief Act of 2012 into law. This statute created a Commission on Long Term Care, the goal of which is to develop a plan for the establishment, implementation, and financing of a comprehensive, coordinated, and high-quality system that ensures the availability of long-term care services and supports for individuals in need of such services and supports. Any implementation of recommendations from this commission may have an impact on coverage and payment for our services.
On February 22, 2012, the President signed into law H.R. 3630, which among other things, delayed a cut in physician and Part B services. In establishing the funding for the law, payments to nursing facilities for patients' unpaid Medicare A co-insurance was reduced. The Deficit Reduction Act of 2005 had previously limited reimbursement of bad debt to 70% on privately responsibility co-insurance. However, under H.R. 3630, this reimbursement will be reduced to 65%.
23
Further, prior to the introduction of H.R. 3630, we were reimbursed for 100% of bad debt related to dual-eligible Medicare patients' co-insurance. H.R. 3630 will phase down the dual-eligible reimbursement over three years. Effective October 1, 2012, Medicare dual-eligible co-insurance reimbursement decreased from 100% to 88%, with further rates reductions to 77% and 65% as of October 1, 2013 and 2014, respectively. Any reductions in Medicare or Medicaid reimbursement could materially adversely affect our profitability.
On August 2, 2011, the President signed into law the Budget Control Act of 2011 (Budget Control Act), which raised the debt ceiling and put into effect a series of actions for deficit reduction. The Budget Control Act created a Congressional Joint Select Committee on Deficit Reduction (the Committee) that was tasked with proposing additional deficit reduction of at least $1.5 trillion over ten years. As the Committee was unable to achieve its targeted savings, this regulation triggered automatic reductions in discretionary and mandatory spending, or budget sequestration, starting in 2013, including reductions of not more than 2% to payments to Medicare providers. The Budget Control Act also requires Congress to vote on an amendment to the Constitution that would require a balanced budget.
On March 23, 2010, President Obama signed the ACA or the Affordable Care Act into law, which contained several sweeping changes to America’s health insurance system. Among other reforms contained in ACA, many Medicare providers received reductions in their market basket updates. Unlike for some other Medicare providers, ACA made no reduction to the market basket update for skilled nursing facilities in fiscal years 2010 or 2011. However, under ACA, the skilled nursing facility market basket update became subject to a full productivity adjustment beginning in fiscal year 2012. In addition, ACA enacted several reforms with respect to skilled nursing facilities and hospice organizations, including payment measures to realize significant savings of federal and state funds by deterring and prosecuting fraud and abuse in both the Medicare and Medicaid programs.
Some key provisions of ACA include (i) enhanced civil monetary penalties, (ii) substantial and onerous transparency requirements for Medicare-participating nursing facilities, (iii) face-to-face encounter requirements applicable to home health agencies and hospices, (iv) expanded authority to suspend payment if a provider is investigated for allegations or issues of fraud, (v) a requirement that overpayments for services provided to Medicare and Medicaid beneficiaries be reported to the applicable payor within sixty days of identification of the overpayment or the date of the corresponding cost report, (vi) implementation of a value-based purchasing program for Medicare payments to skilled nursing facilities, (vii) implementation of a value-based purchasing program for home health services, (viii) implementation of a voluntary bundled payments pilot program (i.e., Bundled Payments for Care Improvement), and (ix) the creation of Accountable Care Organizations
(
ACOs).
On June 28, 2012, the United States Supreme Court ruled that the enactment of ACA did not violate the Constitution of the United States. On June 25, 2015, the United States Supreme Court ruled that the tax credits described in Section 36B of ACA are available to individuals who purchase health insurance on an exchange created by the federal government. These rulings, taken together, permit the implementation of most of the provisions of ACA to proceed in substantially the same form contemplated after ACA’s enactment. The provisions of ACA discussed above are only examples of federal health reform provisions that we believe may have a material impact on the long-term care industry and on our business. However, the foregoing discussion is not intended to constitute, nor does it constitute, an exhaustive review and discussion of ACA. It is possible that these and other provisions of ACA may be interpreted, clarified, or applied to our affiliated facilities or operating subsidiaries in a way that could have a material adverse impact on the results of operations.
Regulations Regarding Our Facilities.
Governmental and other authorities periodically inspect our facilities to assess our compliance with various standards. The intensified regulatory and enforcement environment continues to impact healthcare providers, as these providers respond to periodic surveys and other inspections by governmental authorities and act on any noncompliance identified in the inspection process. Unannounced surveys or inspections generally occur at least annually, and also following a government agency's receipt of a complaint about a facility. We must pass these inspections to maintain our licensure under state law, to obtain or maintain certification under the Medicare and Medicaid programs, to continue participation in the Veterans Administration (VA) program at some facilities, and to comply with our provider contracts with managed care clients at many facilities. From time to time, we, like others in the healthcare industry, may receive notices from federal and state regulatory agencies alleging that we failed to comply with applicable standards. These notices may require us to take corrective action, may impose civil monetary penalties for noncompliance, and may threaten or impose other operating restrictions on skilled nursing facilities such as admission holds, provisional skilled nursing license or increased staffing requirements. If our facilities fail to comply with these directives or otherwise fail to comply substantially with licensure and certification laws, rules and regulations, we could lose our certification as a Medicare or Medicaid provider, or lose our state licenses to operate the facilities.
Regulations Protecting Against Fraud.
Various complex federal and state laws exist which govern a wide array of referrals, relationships and arrangements, and prohibit fraud by healthcare providers. Governmental agencies are devoting increasing attention and resources to such anti-fraud efforts. The Health Insurance Portability and Accountability Act of 1996 (HIPAA), and the Balanced Budget Act of 1997 (BBA) expanded the penalties for healthcare fraud. Additionally, in connection with our
24
involvement with federal healthcare reimbursement programs, the government or those acting on its behalf may bring an action under the False Claims Act (FCA), alleging that a healthcare provider has defrauded the government. These claimants may seek treble damages for false claims and payment of additional civil monetary penalties. The FCA allows a private individual with knowledge of fraud to bring a claim on behalf of the federal government and earn a percentage of the federal government's recovery. Due to these “whistleblower” incentives, suits have become more frequent. Many states also have a false claim prohibition that mirrors or tracks the federal FCA.
In May 2009, Congress passed the Fraud Enforcement and Recovery Act (FERA) of 2009 which made significant changes to the federal False Claims Act (FCA), expanding the types of activities subject to prosecution and whistleblower liability. Following changes by FERA, health care providers face significant penalties for the knowing retention of government overpayments, even if no false claim was involved. Health care providers can now be liable for knowingly and improperly avoiding or decreasing an obligation to pay money or property to the government. This includes the retention of any government overpayment. The government can argue, therefore, that a FCA violation can occur without any affirmative fraudulent action or statement, as long as it is knowingly improper. In addition, FERA extended protections against retaliation for whistleblowers, including protections not only for employees, but also contractors and agents. Thus, there is no need for an employment relationship in order to qualify for protection against retaliation for whistleblowing.
On January 2, 2013 the President signed the American Taxpayer Relief Act of 2012 into law. This statute lengthened the retrospective time period for which CMS can recover overpayments from health care providers, from three to five years following the year in which payment was made.
Regulations Regarding Financial Arrangements.
We are also subject to federal and state laws that regulate financial arrangement by healthcare providers, such as the federal and state anti-kickback laws, the Stark laws, and various state referral laws. The federal anti-kickback laws and similar state laws make it unlawful for any person to pay, receive, offer, or solicit any benefit, directly or indirectly, for the referral or recommendation for products or services which are eligible for payment under federal healthcare programs, including Medicare and Medicaid. For the purposes of the anti-kickback law, a “federal healthcare program” includes Medicare and Medicaid programs and any other plan or program that provides health benefits which are funded directly, in whole or in part, by the United States government.
The arrangements prohibited under these anti-kickback laws can involve nursing homes, hospitals, physicians and other healthcare providers, plans, suppliers and non-healthcare providers. These laws have been interpreted very broadly to include a number of practices and relationships between healthcare providers and sources of patient referral. The scope of prohibited payments is very broad, including anything of value, whether offered directly or indirectly, in cash or in kind. Federal “safe harbor” regulations describe certain arrangements that will not be deemed to constitute violations of the anti-kickback law. Arrangements that do not comply with all of the strict requirements of a safe harbor are not necessarily illegal, but, due to the broad language of the statute, failure to comply with a safe harbor may increase the potential that a government agency or whistleblower will seek to investigate or challenge the arrangement. The safe harbors are narrow and do not cover a wide range of economic relationships.
Violations of the federal anti-kickback laws can result in criminal penalties of up to $25,000 and five years imprisonment. Violations of the anti-kickback laws can also result in civil monetary penalties of up to $50,000 and an assessment of up to three times the total amount of remuneration offered, paid, solicited, or received. Violation of the anti-kickback laws may also result in an individual's or organization's exclusion from future participation in Medicare, Medicaid and other state and federal healthcare programs. Exclusion of us or any of our key employees from the Medicare or Medicaid program could have a material adverse impact on our operations and financial condition.
In addition to these regulations, we may face adverse consequences if we violate the federal Stark laws related to certain Medicare physician referrals. The Stark laws prohibit a physician from referring Medicare patients for certain designated health services where the physician has an ownership interest in or compensation arrangement with the provider of the services, with limited exceptions. Also, any services furnished pursuant to a prohibited referral are not eligible for payment by the Medicare programs, and the provider is prohibited from billing any third party for such services. The Stark laws provide for the imposition of a civil monetary penalty of $15,000 per prohibited claim, and up to $100,000 for knowingly entering into certain prohibited cross-referral schemes, and potential exclusion from Medicare for any person who presents or causes to be presented a bill or claim the person knows or should know is submitted in violation of the Stark laws. Such designated health services include physical therapy services; occupational therapy services; radiology services, including CT, MRI and ultrasound; durable medical equipment and services; radiation therapy services and supplies; parenteral and enteral nutrients, equipment and supplies; prosthetics, orthotics and prosthetic devices and supplies; home health services; outpatient prescription drugs; inpatient and outpatient hospital services; clinical laboratory services; and diagnostic and therapeutic nuclear medical services.
25
Regulations Regarding Patient Record Confidentiality.
We are also subject to laws and regulations enacted to protect the confidentiality of patient health information. For example, HHS has issued rules pursuant to HIPAA, which relate to the privacy of certain patient information. These rules govern our use and disclosure of protected health information. We have established policies and procedures to comply with HIPAA privacy and security requirements at these facilities.
We maintain a company-wide HIPAA compliance plan, which we believe complies with the HIPAA privacy and security regulations. The HIPAA privacy regulations and security regulations have and will continue to impose significant costs on our facilities in order to comply with these standards. There are numerous other laws and legislative and regulatory initiatives at the federal and state levels addressing privacy and security concerns. Our operations are also subject to any federal or state privacy-related laws that are more restrictive than the privacy regulations issued under HIPAA. These laws vary and could impose additional penalties for privacy and security breaches.
Antitrust Laws.
We are also subject to federal and state antitrust laws. Enforcement of the antitrust laws against healthcare providers is common, and antitrust liability may arise in a wide variety of circumstances, including third party contracting, physician relations, joint venture, merger, affiliation and acquisition activities. In some respects, the application of federal and state antitrust laws to healthcare is still evolving, and enforcement activity by federal and state agencies appears to be increasing. At various times, healthcare providers and insurance and managed care organizations may be subject to an investigation by a governmental agency charged with the enforcement of antitrust laws, or may be subject to administrative or judicial action by a federal or state agency or a private party. Violators of the antitrust laws could be subject to criminal and civil enforcement by federal and state agencies, as well as by private litigants.
Environmental Matters
Our business is subject to a variety of federal, state and local environmental laws and regulations. As a healthcare provider, we face regulatory requirements in areas of air and water quality control, medical and low-level radioactive waste management and disposal, asbestos management, response to mold and lead-based paint in our facilities and employee safety.
As an owner or operator of our facilities, we also may be required to investigate and remediate hazardous substances that are located on and/or under the property, including any such substances that may have migrated off, or may have been discharged or transported from the property. Part of our operations involves the handling, use, storage, transportation, disposal and discharge of medical, biological, infectious, toxic, flammable and other hazardous materials, wastes, pollutants or contaminants. In addition, we are sometimes unable to determine with certainty whether prior uses of our facilities and properties or surrounding properties may have produced continuing environmental contamination or noncompliance, particularly where the timing or cost of making such determinations is not deemed cost-effective. These activities, as well as the possible presence of such materials in, on and under our properties, may result in damage to individuals, property or the environment; may interrupt operations or increase costs; may result in legal liability, damages, injunctions or fines; may result in investigations, administrative proceedings, penalties or other governmental agency actions; and may not be covered by insurance.
We believe that we are in material compliance with applicable environmental and occupational health and safety requirements. However, we cannot assure you that we will not encounter liabilities with respect to these regulations in the future, and such liabilities may result in material adverse consequences to our operations or financial condition.
Available Information
We are subject to the reporting requirements under the Exchange Act. Consequently, we are required to file reports and information with the Securities and Exchange Commission (SEC), including reports on the following forms: annual reports on Form 10-K, quarterly reports on Form 10-Q, current reports on Form 8-K, and amendments to those reports filed or furnished pursuant to Section 13(a) or 15(d) of the Exchange Act. These reports and other information concerning our company may be accessed through the SEC's website at http://www.sec.gov.
You may also find on our website at http://www.ensigngroup.net, electronic copies of our annual reports on Form 10-K, quarterly reports on Form 10-Q, current reports on Form 8-K and amendments to those reports filed or furnished pursuant to Section 13(a) or 15(d) of the Exchange Act. Such filings are placed on our website as soon as reasonably possible after they are filed with the SEC. All such filings are available free of charge. Information contained in our website is not deemed to be a part of this Annual Report.
Item 1A.
Risk Factors
26
Set forth below are certain risk factors that could harm our business, results of operations and financial condition. You should carefully read the following risk factors, together with the financial statements, related notes and other information contained in this Annual Report on Form 10-K. This Annual Report on Form 10-K contains forward-looking statements that contain risks and uncertainties. Please refer to the section entitled "Cautionary Note Regarding Forward-Looking Statements" on page 1 of this Annual Report on Form 10-K in connection with your consideration of the risk factors and other important factors that may affect future results described below.
Risks Related to Our Business and Industry
Our revenue could be impacted by federal and state changes to reimbursement and other aspects of Medicaid and Medicare.
We derived
39.0%
and
39.6%
of our revenue from the Medicaid program for the
years ended December 31, 2016 and 2015
, respectively. We derived
28.8%
and
29.5%
of our revenue from the Medicare program for the
years ended December 31, 2016 and 2015
, respectively. If reimbursement rates under these programs are reduced or fail to increase as quickly as our costs, or if there are changes in the way these programs pay for services, our business and results of operations would be adversely affected. The services for which we are currently reimbursed by Medicaid and Medicare may not continue to be reimbursed at adequate levels or at all. Further limits on the scope of services being reimbursed, delays or reductions in reimbursement or changes in other aspects of reimbursement could impact our revenue. For example, in the past, the enactment of the Deficit Reduction Act of 2005 (DRA), the Medicaid Voluntary Contribution and Provider-Specific Tax Amendments of 1991 and the Balanced Budget Act of 1997 (BBA) caused changes in government reimbursement systems, which, in some cases, made obtaining reimbursements more difficult and costly and lowered or restricted reimbursement rates for some of our patients.
The Medicaid and Medicare programs are subject to statutory and regulatory changes affecting base rates or basis of payment, retroactive rate adjustments, annual caps that limit the amount that can be paid (including deductible and coinsurance amounts) for rehabilitation therapy services rendered to Medicare beneficiaries, administrative or executive orders and government funding restrictions, all of which may materially adversely affect the rates and frequency at which these programs reimburse us for our services. For example, the Medicaid Integrity Contractor (MIC) program is increasing the scrutiny placed on Medicaid payments, and could result in recoupments of alleged overpayments in an effort to rein in Medicaid spending. Recent budget proposals and legislation at both the federal and state levels have called for cuts in reimbursement for health care providers participating in the Medicare and Medicaid programs. Enactment and implementation of measures to reduce or delay reimbursement could result in substantial reductions in our revenue and profitability. Payors may disallow our requests for reimbursement based on determinations that certain costs are not reimbursable or reasonable because either adequate or additional documentation was not provided or because certain services were not covered or considered reasonably necessary. Additionally, revenue from these payors can be retroactively adjusted after a new examination during the claims settlement process or as a result of post-payment audits. New legislation and regulatory proposals could impose further limitations on government payments to healthcare providers.
In addition, on October 1, 2010, the next generation of the Minimum Data Set (MDS) 3.0 was implemented, creating significant changes in the methodology for calculating the resource utilization group (RUG) category under Medicare Part A, most notably eliminating Section T. Because therapy does not necessarily begin upon admission, MDS 2.0 and the RUGS-III system included a provision to capture therapy services that are scheduled to occur but have not yet been provided in order to calculate a RUG level that better reflects the level of care the recipient would actually receive. This is eliminated with MDS 3.0, which creates a new category of assessment called the Medicare Short Stay Assessment. This assessment provides for calculation of a rehabilitation RUG for patients discharged on or before day eight who received less than five days of therapy.
On December 20, 2016, the Centers for Medicare & Medicaid Services (CMS) issued the final rule for a new Cardiac Rehabilitation Incentive (CR) model, which includes mandatory bundled payment programs for an acute myocardial infarction (AMI) episode of care or a coronary artery bypass graft (CABG) episode of care, and modifications to the existing Comprehensive Care for Joint Replacement (CJR) model to include surgical hip/femur fracture treatment episodes. The new mandatory cardiac programs mirror the Bundled Payments for Care Improvement (BPCI) and Comprehensive Care for Joint Replacement (CJR) models in that actual episode payments will be retrospectively compared against a target price. Similar to CJR, participating hospitals will be at risk for Medicare Part A and B payments in the inpatient admission and 90 days post-discharge. BPCI episodes would continue to take precedence over episodes in the CJR program and in the new cardiac bundled payment program. The cardiac model will be mandatory in 98 randomly selected geographic areas and the hip/femur procedure model will be mandatory in the same 67 geographic areas that were selected for CJR. CMS is also providing “Cardiac Rehabilitation Incentive Payments”, which can be used by hospitals to facilitate cardiac rehabilitation plans and adherence. The incentive will be provided to hospitals in 45 of the 98 geographic areas included in the mandatory bundled payment program and 45 geographic areas outside of the program. The final rule has a start date of July 1, 2017 and will continue for five performance years.
27
On November 16, 2015, the Centers for Medicare & Medicaid Services (CMS) issued the final rule for a new mandatory Comprehensive Care for Joint Replacement (CJR) model focusing on coordinated, patient-centered care. Under this model, the hospital in which the hip or knee replacement takes place is accountable for the costs and quality of care from the time of the surgery through 90 days after, or an “episode” of care. Depending on the hospital’s quality and cost performance during the episode, the hospital either earns a financial reward or is required to repay Medicare for a portion of the costs. This payment is intended to give hospitals an incentive to work with physicians, home health agencies and nursing facilities to make sure beneficiaries receive the coordinated care they need with the goal of reducing avoidable hospitalizations and complications. This model initially covers 67 geographic areas throughout the country and most hospitals in those regions are required to participate. Following the implementation of the CJR program on April 1, 2016, our Medicare revenues derived from our affiliated skilled nursing facilities and other post-acute services related to lower extremity joint replacement hospital discharges could be increased or decreased in those geographic areas identified by CMS for mandatory participation in the bundled payment program.
On October 1, 2015, International Classification of Diseases (ICD) 10 was implemented as the new medical coding system. Some of the main points include: Claims with antibiotic removal devices (ARDs) on or after October 1, 2015 must contain a valid ICD-10 code. CMS will reject MDS assessments if a Section I diagnosis code version does not apply for the ARD entered. Flexibility is being provided to physician providers with coding, but this flexibility will not be passed on to facility-based providers, including skilled nursing facilities that are providing Part B services.
Various healthcare reform provisions became law upon enactment of the Patient Protection and Affordable Care Act and the Healthcare Education and Reconciliation Act (collectively, the ACA). The reforms contained in the ACA have affected our operating subsidiaries in some manner and are directed in large part at increased quality and cost reductions. Several of the reforms are very significant and could ultimately change the nature of our services, the methods of payment for our services and the underlying regulatory environment. These reforms include the possible modifications to the conditions of qualification for payment, bundling of payments to cover both acute and post-acute care and the imposition of enrollment limitations on new providers. As discussed below under the heading “-
Our business may be materially impacted if certain aspects of the Affordable Care Act are amended, repealed, or successfully challenged
”, any further amendments or revisions to the ACA or its implementing regulations could materially impact our business.
Skilled Nursing
On July 29, 2016, CMS issued its final rule outlining fiscal year 2017 Medicare payment rates and quality programs for skilled nursing facilities. The policies in the finalized rule continue to shift Medicare payments from volume to value. CMS projects that aggregate payments to skilled nursing facilities will increase by a net 2.4% for fiscal year 2017. This estimate increase reflected a 2.7% market basket increase, reduced by a 0.3% multi-factor productivity (MFP) adjustment required by ACA. This final rule also further defines the skilled nursing facilities Quality Reporting Program and clarifies the Value-Based Purchasing Program to establish performance standards, baseline and performance periods, performance scoring methodology and feedback reports.
The Value-Based Purchasing Program final rule specifies the skilled nursing facility 30-day potentially preventable readmission measure, which assesses the facility-level risk standardized rate of unplanned, potentially preventable hospital readmissions for skilled nursing facility patients within 30 days of discharge from a prior admission to a hospital paid under the Inpatient Prospective Payment System, a critical access hospital, or a psychiatric hospital. There is also finalized additional policies related to the Value-Based Purchasing Program including: establishing performance standards; establishing baseline and performance periods; adopting a performance scoring methodology; and providing confidential feedback reports to the skilled nursing facilities. This final rule is to be effective in October 2017.
On July 30, 2015, CMS published its final rule outlining fiscal year 2016 Medicare payment rates for skilled nursing facilities. CMS estimates that aggregate payments to skilled nursing facilities will increase by 1.2% for fiscal year 2016. This estimate increase reflected a 2.3% market basket increase, reduced by a 0.6% point forecast error adjustment and further reduced by 0.5% MFP adjustment required by the Patient Protection and Affordable Care Act (ACA). This final rule also identified a new skilled nursing facility value-based purchasing program and all-cause all-condition hospital readmission measure.
On July 31, 2014, CMS issued its final rule outlining fiscal year 2015 Medicare payment rates for skilled nursing facilities. CMS estimates that aggregate payments to skilled nursing facilities will increase by $750 million, or 2.0% for fiscal year 2015, relative to payments in 2014. The estimated increase reflects a 2.5% market basket increase, reduced by the 0.5% MFP adjustment required by ACA.
Home Health
28
On January 12, 2017, CMS issued a final rule that modernizes the Home Health Agency Conditions of Participation (CoPs). This rule is a continuation of CMS' effort to improve quality of care while streamlining provider requirements to reduce unnecessary procedural requirements. The rule makes significant revisions to the conditions currently in place, including (1) adding new conditions of participation related to quality assurance and performance improvement programs (QAPI) and infection control; and (2) expanding or revising requirements related to patient rights, comprehensive evaluations, coordination and care planning, home health aide training and supervision, and discharge and transfer summary and time frames. Without any contrary action by the new administration, the new conditions are scheduled to be effective July 13, 2017.
On October 31, 2016, CMS issued final payment changes to the Medicare home health prospective payment system (HH PPS) for calendar year 2017. Under this rule, CMS projects that Medicare payments will be reduced by 0.7%. This decrease reflects a negative 0.97% adjustment to the national, standardized 60-day episode payment rate to account for nominal case-mix growth from 2012 through 2014; a 2.3% reduction in payments due to the final year of the four-year phase-in of the rebasing adjustments to the national, standardized 60-day episode payment rate, the national per-visit payment rates and the non-routine medical supplies (NRS) conversion factor; and the effects of the revised fixed-dollar loss (FDL) ratio used in determining outlier payments; partially offset by the home health payment update percentage of 2.5%.
On November 5, 2015, CMS issued a final rule updating the Medicare HH PPS rates and wage index for calendar year 2016. In the final rule, CMS implemented the third year of the four year phase-in of rebasing adjustments to the HH PPS payment rates as required by ACA. In addition, CMS will decrease the national, standardized 60-day episode payment amount by 0.97% in each year for calendar years 2016, 2017 and 2018. Pursuant to the rule, CMS is also implementing a Home Health Value-Based Purchasing model effective for calendar year 2016, in which all Medicare-certified home health agencies (HHAs) will be required to participate. In the aggregate, CMS estimates that the net impact of the payment provisions of the final rule will result in a decrease of 1.4%, or $260 million, in aggregate Medicare payments to HHAs for calendar year 2016.
Pursuant to the rule, CMS is also implementing a Home Health Value-Based Purchasing model effective for calendar year 2016, in which all Medicare-certified HHAs in selected states will be required to participate. The model would apply a payment reduction or increase to current Medicare-certified HHA payments, depending on quality performance, for all agencies delivering services within nine randomly-selected states. Payment adjustments would be applied on an annual basis, beginning at 3.0% in the first payment adjustment year, 5.0% in the second payment adjustment year, 6.0% in the third payment adjustment year and 8.0% in the final two payment adjustment years. CMS estimates that implementing a home health value-based model will result in a 1.4% decrease in Medicare payments to home health agencies across the industry.
Lastly, CMS implemented a standardized cross-setting measure for calendar year 2016. The CoPs require home health agencies to submit OASIS assessments as a condition of payment and also for quality measurement purposes. Home health agencies that do not submit quality measure data to CMS will see a 2.0% reduction in their annual home health payment update percentage. Under the rule, all home health agencies are required to submit both admission and discharge OASIS assessments for a minimum of 70.0% of all patients with episodes of care occurring during the reporting period starting July 1, 2015. The rule will incrementally increase this compliance threshold by 10.0% in each of the subsequent periods (July 1, 2016 and July 1, 2017) to reach 90.0%.
On January 12, 2017, CMS issued a final rule that modernizes the CoPs. This rule is a continuation of CMS' effort to improve quality of care while streamlining provider requirements to reduce unnecessary procedural requirements. The updates focus on patient rights, care planning, delivery and coordination, and data-driven quality improvement. The final rule is effective July 13, 2017.
On October 30, 2014, CMS announced payment changes to the Medicare HH PPS for calendar year 2015. Under this rule, CMS projects that Medicare payments to home health agencies in calendar year 2015 will be reduced by 0.3%, or $60 million. The decrease reflects the 2.1% home health payment update percentage and the rebasing adjustments to the national, standardized 60-day episode payment rate, the national per-visit payment rates, and the non-routine medical supplies (NRS) conversion factor. CMS is also finalizing three changes to the face-to-face encounter requirements under the ACA. These changes include: a) eliminating the narrative requirement currently in regulation, b) establishing that if a HHA claim is denied, the corresponding physician claim for certifying/re-certifying patient eligibility for Medicare-covered home health services is considered non-covered as well because there is no longer a corresponding claim for Medicare-covered home health services and c) clarifying that a face-to-face encounter is required for certifications, rather than initial episodes; and that a certification (versus a re-certification) is generally considered to be any time a new start of care assessment is completed to initiate care. This rule also established a minimum submission threshold for the number of OASIS assessments that each HHA must submit under the Home Health Quality Reporting Program and the Home Health Conditions of Participant for speech language pathologist personnel.
Hospice
29
On July 29, 2016, CMS issued its final rule outlining fiscal year 2017 Medicare payment rates, wage index and cap amount for hospices serving Medicare beneficiaries. Under the final rule, hospices will see a 2.1% increase in their payments effective October 1, 2016. The hospice payment increase will be the net result of 2.7% inpatient hospital market basket update, reduced by a 0.3% productivity adjustment and by a 0.3% adjustment set by the Affordable Care Act. The hospice cap amount for fiscal year 2017 will be increased by 2.1% to $28,404.99, which is equal to the 2016 cap amount of $27,820.75 updated by the FY 2017 hospice payment update percentage of 2.1%. In addition, this rule proposes changes to the hospice quality reporting program, including care surveys and two new quality measures that will assess hospice staff visits to patients and caregivers in the last three and seven days of life and the percentage of hospice patients who received care processes consistent with guidelines.
On July 31, 2015, CMS issued its final rule outlining fiscal year 2016 Medicare payment rates and the wage index for hospices serving Medicare beneficiaries. Under the final rule, hospices will see an estimated 1.1% increase in their payments effective October 1, 2015. The hospice payment increase would be the net result of a hospice payment update to the hospice per diem rates of 2.1% (a “hospital market basket” increase of 2.4% minus 0.3% for reductions required by law) and a 1.2% decrease in payments to hospices due to updated wage data and the phase-out of its wage index budget neutrality adjustment factor (BNAF), offset by the newly announced Core Based Statistical Areas (CBSA) delineation impact of 0.2%. The rule also created
two different payment rates for routine home care (RHC) that would result in a higher base payment rate for the first 60 days of hospice care and a reduced base payment rate for 61 or more days of hospice care and a Service Intensity Add-On (SIA) Payment for fiscal year 2016 and beyond in conjunction with the proposed RHC rates.
On August 1, 2014, CMS issued its final rule outlining fiscal year 2015 Medicare payment rates and the wage index for hospices serving Medicare beneficiaries. Under the final rule, hospices will see an estimated 1.4% increase in their payments for fiscal year 2015. The hospice payment increase would be the net result of a hospice payment update to the hospice per diem rates of 2.1% (a “hospital market basket” increase of 2.9% minus 0.8% for reductions required by law) and a 0.7% decrease in payments to hospices due to updated wage data and the sixth year of CMS’ seven-year phase-out of its wage index BNAF. The final rule also states that CMS will begin national implementation of the CAHPS Hospice Survey starting January 1, 2015. In the final rule, CMS requires providers to complete their hospice cap determination within 150 days after the cap period and remit any overpayments. If a hospice does not complete its cap determination in a timely fashion, its Medicare payments would be suspended until the cap determination is complete and received by the contractor. This is similar to the current practice for all other provider types that file cost reports with Medicare.
On April 1, 2014, the President signed into law the Protecting Access to Medicare Act of 2014, which averted a 24% cut in Medicare payments to physicians and other Part B providers until March 31, 2015. In addition, this law maintained the 0.5% update for such services through December 31, 2014 and provides a 0.0% update to the 2015 Medicare Physician Fee Schedule (MPFS) through March 31, 2015. Among other things, this law provides the framework for implementation of a value-based purchasing program for skilled nursing facilities. Under this legislation HHS is required to develop by October 1, 2016 measures and performance standards regarding preventable hospital readmissions from skilled nursing facilities. Beginning October 1, 2018, HHS will withhold 2% of Medicare payments to all skilled nursing facilities and distribute this pool of payment to skilled nursing facilities as incentive payments for preventing readmissions to hospitals.
On April 16, 2015, the President signed into law MACRA. This bill includes a number of provisions, including replacement of the Sustainable Growth Rate (SGR) formula used by Medicare to pay physicians with new systems for establishing annual payment rate updates for physicians' services. In addition, it increases premiums for Part B and Part D of Medicare for beneficiaries with income above certain levels and makes numerous other changes to Medicare and Medicaid.
On October 30, 2015, CMS released a final rule (with comment period) addressing, among other things, implementation of certain provisions of MACRA, including the implementation of the new Merit-Based Incentive Payment System (MIPS). The current Value-Based Payment Modifier program is set to expire in 2018, with MIPS to begin in 2019. The October 30, 2015 final rule added measures where gaps exist in the current Physician Quality Reporting System (PQRS), which is used by CMS to track the quality of care provided to Medicare beneficiaries. The final rule also excludes services furnished in SNFs from the definition of primary care services for purposes of the Shared Savings Program. The final rule could impact our revenue in the future.
The Improving Medicare Post-Acute Care Transformation Act of 2014 (the IMPACT Act), which was signed into law on October 6, 2014, requires the submission of standardized assessment data for quality improvement, payment and discharge planning purposes across the spectrum of post-acute care providers (PACs), including skilled nursing facilities and home health agencies. The IMPACT Act will require PACs to begin reporting: (1) standardized patient assessment data at admission and discharge by October 1, 2018 for post acute care providers, including skilled nursing facilities by January 1, 2019 for home health agencies; (2) new quality measures, including functional status, skin integrity, medication reconciliation, incidence of major falls, and patient preference regarding treatment and discharge at various intervals between October 1, 2016 and January 1, 2019; and (3) resource
30
use measures, including Medicare spending per beneficiary, discharge to community, and hospitalization rates of potentially preventable readmissions by October 1, 2016 for post-acute care providers, including skilled nursing facilities and by January 1, 2017 for home health agencies. Failure to report such data when required would subject a facility to a two percent reduction in market basket prices then in effect.
The IMPACT Act further requires HHS and the Medicare Payment Advisory Commission (MedPAC), a commission chartered by Congress to advise it on Medicare payment issues, to study alternative PAC payment models, including payment based upon individual patient characteristics and not care setting, with corresponding Congressional reports required based on such analysis. The IMPACT Act also included provisions impacting Medicare-certified hospices, including: (1) increasing survey frequency for Medicare-certified hospices to once every 36 months; (2) imposing a medical review process for facilities with a high percentage of stays in excess of 180 days; and (3) updating the annual aggregate Medicare payment cap.
On January 2, 2013 the President signed the American Taxpayer Relief Act of 2012 into law. This statute delayed significant cuts in Medicare rates for physician services until December 31, 2013. The statute also created a Commission on Long Term Care, the goal of which was to develop a plan for the establishment, implementation, and financing of a comprehensive, coordinated, and high-quality system that ensures the availability of long-term care services and supports for individuals in need of such services and supports.
On February 22, 2012, the President signed into law H.R. 3630, which among other things, delayed a cut in physician and Part B services. In establishing the funding for the law, payments to nursing facilities for patients' unpaid Medicare A co-insurance was reduced. The Deficit Reduction Act of 2005 had previously limited reimbursement of bad debt to 70% on privately responsibility co-insurance. However, under H.R. 3630, this reimbursement will be reduced to 65%.
Further, prior to the introduction of H.R. 3630, we were reimbursed for 100% of bad debt related to dual-eligible Medicare patients' co-insurance. H.R. 3630 will phase down the dual-eligible reimbursement over three years. Effective October 1, 2012, Medicare dual-eligible co-insurance reimbursement decreased from 100% to 88%, with further reductions to 77% and 65% as of October 1, 2013 and 2014, respectively. Any reductions in Medicare or Medicaid reimbursement could materially adversely affect our profitability.
Our future revenue, financial condition and results of operations could be impacted by continued cost containment pressures on Medicaid spending.
Medicaid, which is largely administered by the states, is a significant payor for our skilled nursing services. Rapidly increasing Medicaid spending, combined with slow state revenue growth, has led many states to institute measures aimed at controlling spending growth. For example, in February 2009, the California legislature approved a new budget to help relieve a $42 billion budget deficit. The budget package was signed after months of negotiation, during which time California's governor declared a fiscal state of emergency in California. The new budget implemented spending cuts in several areas, including Medi-Cal spending. Further, California initially had extended its cost-based Medi-Cal long-term care reimbursement system enacted through Assembly Bill 1629 (A.B.1629) through the 2009-2010 and 2010-2011 rate years with a growth rate of up to five percent for both years. However, due to California's severe budget crisis, in July 2009, the State passed a budget-balancing proposal that eliminated this five percent growth cap by amending the current statute to provide that, for the 2009-2010 and 2010-2011 rate years, the weighted average Medi-Cal reimbursement rate paid to long-term care facilities shall not exceed the weighted average Medi-Cal reimbursement rate for the 2008-2009 rate year. In addition, the budget proposal increased the amounts that California nursing facilities will pay to Medi-Cal in quality assurance fees for the 2009-2010 and 2010-2011 rate years by including Medicare revenue in the calculation of the quality assurance fee that nursing facilities pay under A.B. 1629. Although overall reimbursement from Medi-Cal remained stable, individual facility rates varied.
California's Governor signed the budget trailer into law in October 2010. Despite its enactment, these changes in reimbursement to long-term care facilities were to be implemented retroactively to the beginning of the calendar quarter in which California submitted its request for federal approval of CMS. California’s Governor released a 2014-2015 budget that includes $1.2 billion in additional Medi-Cal funding. This proposal, however, would not eliminate retroactive rate cuts for hospital-based skilled nursing facilities.
Because state legislatures control the amount of state funding for Medicaid programs, cuts or delays in approval of such funding by legislatures could reduce the amount of, or cause a delay in, payment from Medicaid to skilled nursing facilities. Since a significant portion of our revenue is generated from our skilled nursing operating subsidiaries in California, these budget reductions, if approved, could adversely affect our net patient service revenue and profitability. We expect continuing cost containment pressures on Medicaid outlays for skilled nursing facilities, and any such decline could adversely affect our financial condition and results of operations.
31
To generate funds to pay for the increasing costs of the Medicaid program, many states utilize financial arrangements such as provider taxes. Under provider tax arrangements, states collect taxes or fees from healthcare providers and then return the revenue to these providers as Medicaid expenditures. Congress, however, has placed restrictions on states' use of provider tax and donation programs as a source of state matching funds. Under the Medicaid Voluntary Contribution and Provider-Specific Tax Amendments of 1991, the federal medical assistance percentage available to a state was reduced by the total amount of healthcare related taxes that the state imposed, unless certain requirements are met. The federal medical assistance percentage is not reduced if the state taxes are broad-based and not applied specifically to Medicaid reimbursed services. In addition, the healthcare providers receiving Medicaid reimbursement must be at risk for the amount of tax assessed and must not be guaranteed to receive reimbursement through the applicable state Medicaid program for the tax assessed. Lower Medicaid reimbursement rates would adversely affect our revenue, financial condition and results of operations.
We may not be fully reimbursed for all services for which each facility bills through consolidated billing, which could adversely affect our revenue, financial condition and results of operations.
Skilled nursing facilities are required to perform consolidated billing for certain items and services furnished to patients and residents. The consolidated billing requirement essentially confers on the skilled nursing facility itself the Medicare billing responsibility for the entire package of care that its patients receive in these situations. The BBA also affected skilled nursing facility payments by requiring that post-hospitalization skilled nursing services be “bundled” into the hospital's Diagnostic Related Group (DRG) payment in certain circumstances. Where this rule applies, the hospital and the skilled nursing facility must, in effect, divide the payment which otherwise would have been paid to the hospital alone for the patient's treatment, and no additional funds are paid by Medicare for skilled nursing care of the patient. At present, this provision applies to a limited number of DRGs, but already is apparently having a negative effect on skilled nursing facility utilization and payments, either because hospitals are finding it difficult to place patients in skilled nursing facilities which will not be paid as before or because hospitals are reluctant to discharge the patients to skilled nursing facilities and lose part of their payment. This bundling requirement could be extended to more DRGs in the future, which would accentuate the negative impact on skilled nursing facility utilization and payments. We may not be fully reimbursed for all services for which each facility bills through consolidated billing, which could adversely affect our revenue, financial condition and results of operations.
Reforms to the U.S. healthcare system will impose new requirements upon us and may lower our reimbursements.
ACA and the Health Care and Education Reconciliation Act of 2010 (the Reconciliation Act) include sweeping changes to how health care is paid for and furnished in the United States. As discussed below under the heading “-
Our business may be materially impacted if certain aspects of the Affordable Care Act are amended, repealed, or successfully challenged
”, any further amendments or revisions to ACA or its implementing regulations could materially impact our business. The recent presidential and congressional elections in the United States could result in significant changes in, and uncertainty with respect to, legislation, regulation and government policy that could significantly impact our business and the health care industry. We continually monitor these developments in an effort to respond to the changing regulatory environment impacting our business.
ACA, as modified by the Reconciliation Act, is projected to expand access to Medicaid for approximately 11 to 13 million additional people each year between 2015 - 2024. It also reduces the projected growth of Medicare by $106 billion by 2020 by tying payments to providers more closely to quality outcomes. It also imposes new obligations on skilled nursing facilities, requiring them to disclose information regarding ownership, expenditures and certain other information. This information is disclosed on a website for comparison by members of the public.
To address potential fraud and abuse in federal health care programs, including Medicare and Medicaid, ACA includes provider screening and enhanced oversight periods for new providers and suppliers, as well as enhanced penalties for submitting false claims. It also provides funding for enhanced anti-fraud activities. The new law imposes enrollment moratoria in elevated risk areas by requiring providers and suppliers to establish compliance programs. ACA also provides the federal government with expanded authority to suspend payment if a provider is investigated for allegations or issues of fraud. Section 6402 of the ACA provides that Medicare and Medicaid payments may be suspended pending a “credible investigation of fraud,” unless the Secretary of HHS determines that good cause exists not to suspend payments. To the extent the Secretary applies this suspension of payments provision to one of our affiliated facilities for allegations of fraud, such a suspension could adversely affect our results of operations.
Under ACA, HHS will establish, test and evaluate alternative payment methodologies for Medicare services through a five-year, national, voluntary pilot program starting in 2013. This program will provide incentives for providers to coordinate patient care across the continuum and to be jointly accountable for an entire episode of care centered around a hospitalization. HHS will develop qualifying provider payment methods that may include bundled payments and bids from entities for episodes of care. The bundled payment will cover the costs of acute care inpatient services; physicians’ services delivered in and outside of an acute
32
care hospital; outpatient hospital services including emergency department services; post-acute care services, including home health services, skilled nursing services; inpatient rehabilitation services; and inpatient hospital services. The payment methodology will include payment for services, such as care coordination, medication reconciliation, discharge planning and transitional care services, and other patient-centered activities. Payments for items and services cannot result in spending more than would otherwise be expended for such entities if the pilot program were not implemented. As with Medicare’s shared savings program discussed above, payment arrangements among providers on the backside of the bundled payment must take into account significant hurdles under the Anti-kickback Law, the Stark Law and the Civil Monetary Penalties Law. This pilot program may expand in 2016 if expansion would reduce Medicare spending without also reducing quality of care.
ACA attempts to improve the health care delivery system through incentives to enhance quality, improve beneficiary outcomes and increase value of care. One of these key delivery system reforms is the encouragement of Accountable Care Organizations (ACOs). ACOs will facilitate coordination and cooperation among providers to improve the quality of care for Medicare beneficiaries and reduce unnecessary costs. Participating ACOs that meet specified quality performance standards will be eligible to receive a share of any savings if the actual per capita expenditures of their assigned Medicare beneficiaries are a sufficient percentage below their specified benchmark amount. Quality performance standards will include measures in such categories as clinical processes and outcomes of care, patient experience and utilization of services.
We routinely receive Requests for Information (RFIs) from active referral and managed care networks asking for quality, rating, performance and other information about our SNFs operating in the geographic areas that they are being serviced. The RFIs are used to evaluate which SNFs should be included in each network of preferred providers. For those SNFs included in the network, the ACO and its associated providers may then recommend the SNF as a “preferred provider” to patients in need of skilled care. In the past, after responding to such RFIs, our SNFs have in some instances been rewarded with inclusion in a network of preferred providers, and in other instances have not been included. While referrals to a SNF in a preferred provider network will always be subject to a patient’s freedom of choice, as well as the patient’s physician’s medical judgment as to which facility will best serve the patient’s needs, the inclusion as a preferred provider in a network will likely result in an increase in overall admissions to that SNF. On the other hand, the failure to be included could result in some volume of patient admissions being shifted to other facilities that have been designated instead as preferred providers. As a result, to the extent that one of our SNF is not included in a preferred provider network, our revenues and results of operations could be adversely affected.
In addition, ACA required HHS to develop a plan to implement a value-based purchasing program for Medicare payments to skilled nursing facilities. HHS delivered a report to Congress outlining its plans for implementing this value-based purchasing program. The value-based purchasing program would provide payment incentives for Medicare-participating skilled nursing facilities to improve the quality of care provided to Medicare beneficiaries. Among the most relevant factors in HHS' plans to implement value-based purchasing for skilled nursing facilities is the current Nursing Home Value-Based Purchasing Demonstration Project, which concluded in 2012. HHS provided Congress with an outline of plans to implement a value-based purchasing program, and any permanent value-based purchasing program for skilled nursing facilities will be implemented after that evaluation.
On October 4, 2016, CMS released a final rule that reforms the requirements for long-term care (LTC) facilities, specifically skilled nursing facilities (SNFs) and nursing facilities (NFs), to participate in the Medicare and Medicaid programs. The regulations have not been updated since 1991 and have been revised to improve quality of life, care and services in LTC facilities, optimize resident safety, reflect current professional standards and improve the logical flow of the regulations. The regulations are effective November 28, 2016 and will be implemented in three phases. The first phase is effective November 28, 2016, the second phase is effective November 28, 2017 and the third phase becomes effective November 28, 2019.
A few highlights from the new regulation include the following:
|
•
|
investigate and report all allegations of abusive conduct, and refrain from employing individuals who have had a disciplinary action taken against their professional license by a state licensure body as a result of a finding of abuse, neglect, mistreatment of residents or misappropriation of their property;
|
|
•
|
document a transfer or discharge in the medical record and exchange certain information to a receiving provider or facility when a resident is transferred;
|
|
•
|
develop and implement a baseline care plan for each resident within 48 hours of their admission that includes instructions to provide effective and person-centered care that meets professional standards of quality care;
|
|
•
|
develop and implement a discharge planning process that prepares residents to be active partners in post-discharge care;
|
33
|
•
|
provide the necessary care and services to attain or maintain the highest practicable physical, mental and psychosocial well-being;
|
|
•
|
add a competency requirement for determining the sufficiency of nursing staff;
|
|
•
|
require that a pharmacist reviews a resident’s medical chart during each monthly drug regiment review;
|
|
•
|
refrain from charging a Medicare resident for loss or damage of dentures;
|
|
•
|
provide each resident with a nourishing, palatable and well-balanced diet;
|
|
•
|
conduct, document and annually review a facility-wide assessment to determine what resources are necessary to care for its residents;
|
|
•
|
refrain from entering into a binding arbitration agreement until after a dispute arises between the parties;
|
|
•
|
develop, implement and maintain an effective comprehensive, data-driven quality assurance and performance improvement program;
|
|
•
|
develop an Infection Prevention and Control Program; and
|
|
•
|
require their operating organization have in effect a compliance and ethics program.
|
CMS estimates that the average cost per facility for compliance with the new rule to be approximately $62,900 in the first year and approximately $55,000 in subsequent years. However, these amounts vary per organization. In addition to the monetary costs, these regulations may create compliance issues, as state regulators and surveyors interpret requirements that are less explicit.
On September 16, 2016, CMS issued its final rule concerning emergency preparedness requirements for Medicare and Medicaid participating providers, specifically skilled nursing facilities (SNFs), nursing facilities (NFs), and intermediate care facilities for individuals with intellectual disabilities (ICF/IIDs). The rule is designed to ensure providers and suppliers have comprehensive and integrated emergency policies and procedures in place, in particular during natural and man-made disasters. Under the rule, facilities are required to 1) document risk assessment and emergency planning; 2) develop and implement policies and procedures based on that risk assessment; 3) develop and maintain an emergency preparedness communication plan in compliance with both federal and state law; and 4) develop and maintain an emergency preparedness training and testing program. The regulations outlined in the final rule must be implemented by November 15, 2017.
On July 29, 2016, CMS issued its final rule laying out the performance standards relating to preventable hospital readmissions from skilled nursing facilities. The final rule includes the SNF 30-day All Cause Readmission Measure which assesses the risk-standardized rate of all-cause, all condition, unplanned inpatient hospital readmissions for Medicare fee-for-service SNF patients within 30 days of discharge from admission to an inpatient prospective payment system hospital, CAH or psychiatric hospital. The final rule includes the SNF 30-Day Potentially Preventable Readmission Measure as the SNF all condition risk adjusted potentially preventable hospital readmission measure. This measure assesses the facility-level risk-standardized rate of unplanned, potentially preventable hospital readmissions for SNF patients within 30 days of discharge from a prior admission to an IPPS hospital, CAH, or psychiatric hospital. Hospital readmissions include readmissions to a short-stay acute-care hospital or CAH, with a diagnosis considered to be unplanned and potentially preventable. This measure is claims-based, requiring no additional data collection or submission burden for SNFs.
In addition, the proposed rule states, beginning in 2019, the achievement performance standard for skilled nursing facilities for quality measures specified under the SNF Value Based Purchasing Program (SNF VBP) will be the 25
th
percentile of national SNF performance on the quality measure during the applicable baseline period. This will affect the value based incentive payments paid to skilled nursing facilities.
On February 2, 2016, CMS issued its final rule concerning face-to-face requirements for Medicaid home health services. Under the rule, the Medicaid home health service definition was revised consistent with applicable sections of the ACA and H.R. 2 Medicare Access and CHIP Reauthorization Act of 2015 (MACRA). The rule also requires that for the initial ordering of home health services, the physician must document that a face-to-face encounter that is related to the primary reason the beneficiary requires home health services occurred no more than 90 days before or 30 days after the start of services. The final rule also requires that for the initial ordering of certain medical equipment, the physician or authorized non-physician provider (NPP) must document that a face-to-face encounter that is related to the primary reason the beneficiary requires medical equipment occurred no more than 6 months prior to the start of services.
34
On April 27, 2016, CMS added six new quality measures to its consumer-based Nursing Home Compare
website. These quality measures include the rate of rehospitalization, emergency room use, community discharge, improvements in function, independently worsened and antianxiety or hypnotic medication among nursing home residents. Beginning in July 2016, CMS incorporates all of these measures, except for the antianxiety/hypnotic medication measure, into the calculation of the Nursing Home Five-Star Quality Ratings.
On July 6, 2015, CMS announced a proposal to launch Home Health Value-Based Purchasing model to test whether incentives for better care can improve outcomes in the delivery of home health services. The model would apply a payment reduction or increase to current Medicare-certified home health agency payments, depending on quality performance, for all agencies delivering services within nine randomly-selected states. Payment adjustments would be applied on an annual basis, beginning at 5.0% in each of the first two payment adjustment years, 6.0% in the third payment adjustment year and 8.0% in the final two payment adjustment years.
On June 28, 2012, the United States Supreme Court ruled that the enactment of ACA did not violate the Constitution of the United States. This ruling permits the implementation of most of the provisions of ACA to proceed. The provisions of ACA discussed above are only examples of federal health reform provisions that we believe may have a material impact on the long-term care industry and on our business. However, the foregoing discussion is not intended to constitute, nor does it constitute, an exhaustive review and discussion of ACA. It is possible that these and other provisions of ACA may be interpreted, clarified, or applied to our affiliated facilities or operating subsidiaries in a way that could have a material adverse impact on the results of operations.
On April 1, 2014, the President signed into law the Protecting Access to Medicare Act of 2014 which, among other things, provides the framework for implementation of a value-based purchasing program for skilled nursing facilities. Under this legislation HHS is required to develop by October 1, 2016 measures and performance standards regarding preventable hospital readmissions from skilled nursing facilities. Beginning October 1, 2018, HHS will withhold 2% of Medicare payments to all skilled nursing facilities and distribute this pool of payment to skilled nursing facilities as incentive payments for preventing readmissions to hospitals.
We cannot predict what effect these changes will have on our business, including the demand for our services or the amount of reimbursement available for those services. However, it is possible these new laws may lower reimbursement and adversely affect our business.
The Affordable Care Act and its implementation could impact our business.
In addition, the Affordable Care Act could result in sweeping changes to the existing U.S. system for the delivery and financing of health care. The details for implementation of many of the requirements under the Affordable Care Act will depend on the promulgation of regulations by a number of federal government agencies, including the HHS. It is impossible to predict the outcome of these changes, what many of the final requirements of the Health Reform Law will be, and the net effect of those requirements on us. As such, we cannot predict the impact of the Affordable Care Act on our business, operations or financial performance.
A significant goal of Federal health care reform is to transform the delivery of health care by changing reimbursement for health care services to hold providers accountable for the cost and quality of care provided. Medicare and many commercial third party payors are implementing Accountable Care Organization models in which groups of providers share in the benefit and risk of providing care to an assigned group of individuals at lower cost. Other reimbursement methodology reforms include value-based purchasing, in which a portion of provider reimbursement is redistributed based on relative performance on designated economic, clinical quality, and patient satisfaction metrics. In addition, CMS is implementing programs to bundle acute care and post-acute care reimbursement to hold providers accountable for costs across a broader continuum of care. These reimbursement methodologies and similar programs are likely to continue and expand, both in public and commercial health plans. Providers who respond successfully to these trends and are able to deliver quality care at lower cost are likely to benefit financially.
The Affordable Care Act and the programs implemented by the law may reduce reimbursements for our services and may impact the demand for the Company’s products. In addition, various healthcare programs and regulations may be ultimately implemented at the federal or state level. Failure to respond successfully to these trends could negatively impact our business, results of operations and/or financial condition. As discussed below under the heading “-
Our business may be materially impacted if certain aspects of the Affordable Care Act are amended, repealed, or successfully challenged”
, any further amendments or revisions to ACA or its implementing regulations could materially impact our business
.
35
Our business may be materially impacted if certain aspects of the Affordable Care Act are amended, repealed, or successfully challenged.
A number of lawsuits have been filed challenging various aspects of ACA and related regulations. In addition, the efficacy of ACA is the subject of much debate among members of Congress and the public. The recent presidential and congressional elections in the United States could result in significant changes in, and uncertainty with respect to, legislation, regulation and government policy that could significantly impact our business and the health care industry. In the event that legal challenges are successful or ACA is repealed or materially amended, particularly any elements of ACA that are beneficial to our business or that cause changes in the health insurance industry, including reimbursement and coverage by private, Medicare or Medicaid payers, our business, operating results and financial condition could be harmed. While it is not possible to predict whether and when any such changes will occur, specific proposals discussed during and after the election, including a repeal or material amendment of ACA, could harm our business, operating results and financial condition. In addition, even if ACA is not amended or repealed, the President and the executive branch of the federal government have a significant impact on the implementation of the provisions of ACA, and the new administration could make changes impacting the implementation and enforcement of ACA, which could harm our business, operating results and financial
condition. If we are slow or unable to adapt to any such changes, our business, operating results and financial condition could be adversely affected.
Increased competition for, or a shortage of, nurses and other skilled personnel could increase our staffing and labor costs and subject us to monetary fines.
Our success depends upon our ability to retain and attract nurses, Certified Nurse Assistants (CNAs) and therapists. Our success also depends upon our ability to retain and attract skilled management personnel who are responsible for the day-to-day operations of each of our affiliated facilities. Each facility has a facility leader responsible for the overall day-to-day operations of the facility, including quality of care, social services and financial performance. Depending upon the size of the facility, each facility leader is supported by facility staff that is directly responsible for day-to-day care of the patients and marketing and community outreach programs. Other key positions supporting each facility may include individuals responsible for physical, occupational and speech therapy, food service and maintenance. We compete with various healthcare service providers, including other skilled nursing providers, in retaining and attracting qualified and skilled personnel.
We operate one or more affiliated skilled nursing facilities in the states of Arizona, California, Colorado, Idaho, Iowa, Kansas, Nebraska, Nevada, South Carolina, Texas, Utah, Washington and Wisconsin. With the exception of Utah, which follows federal regulations, each of these states has established minimum staffing requirements for facilities operating in that state. Failure to comply with these requirements can, among other things, jeopardize a facility's compliance with the conditions of participation under relevant state and federal healthcare programs. In addition, if a facility is determined to be out of compliance with these requirements, it may be subject to a notice of deficiency, a citation, or a significant fine or litigation risk. Deficiencies (depending on the level) may also result in the suspension of patient admissions and/or the termination of Medicaid participation, or the suspension, revocation or nonrenewal of the skilled nursing facility's license. If the federal or state governments were to issue regulations which materially change the way compliance with the minimum staffing standard is calculated or enforced, our labor costs could increase and the current shortage of healthcare workers could impact us more significantly.
Increased competition for or a shortage of nurses or other trained personnel, or general inflationary pressures may require that we enhance our pay and benefits packages to compete effectively for such personnel. We may not be able to offset such added costs by increasing the rates we charge to the patients of our operating subsidiaries. Turnover rates and the magnitude of the shortage of nurses or other trained personnel vary substantially from facility to facility. An increase in costs associated with, or a shortage of, skilled nurses, could negatively impact our business. In addition, if we fail to attract and retain qualified and skilled personnel, our ability to conduct our business operations effectively would be harmed.
We are subject to various government reviews, audits and investigations that could adversely affect our business, including an obligation to refund amounts previously paid to us, potential criminal charges, the imposition of fines, and/or the loss of our right to participate in Medicare and Medicaid programs.
As a result of our participation in the Medicaid and Medicare programs, we are subject to various governmental reviews, audits and investigations to verify our compliance with these programs and applicable laws and regulations. We are also subject to audits under various government programs, including Recovery Audit Contractors (RAC), Zone Program Integrity Contractors (ZPIC), Program Safeguard Contractors (PSC) and Medicaid Integrity Contributors (MIC) programs, in which third party firms engaged by CMS conduct extensive reviews of claims data and medical and other records to identify potential improper payments under the Medicare programs. Private pay sources also reserve the right to conduct audits. We believe that billing and reimbursement errors and disagreements are common in our industry. We are regularly engaged in reviews, audits and appeals of our claims for reimbursement due to the subjectivities inherent in the process related to patient diagnosis and care, record keeping, claims
36
processing and other aspects of the patient service and reimbursement processes, and the errors and disagreements those subjectivities can produce. An adverse review, audit or investigation could result in:
|
•
|
an obligation to refund amounts previously paid to us pursuant to the Medicare or Medicaid programs or from private payors, in amounts that could be material to our business;
|
|
•
|
state or federal agencies imposing fines, penalties and other sanctions on us;
|
|
•
|
loss of our right to participate in the Medicare or Medicaid programs or one or more private payor networks;
|
|
•
|
an increase in private litigation against us; and
|
|
•
|
damage to our reputation in various markets.
|
In 2004, our Medicare fiscal intermediaries began to conduct selected reviews of claims previously submitted by and paid to some of our affiliated facilities. While we have always been subject to post-payment audits and reviews, more intensive “probe reviews” appear to be a permanent procedure with our fiscal intermediaries. All findings of overpayment from CMS contractors are eligible for appeal through the CMS defined continuum. With the exception of rare findings of overpayment related to objective errors in Medicare payment methodology or claims processing, the Organization utilizes all defenses at its disposal to demonstrate that the services provided meet all clinical and regulatory requirements for reimbursement.
If the government or court were to conclude that such errors and deficiencies constituted criminal violations, or were to conclude that such errors and deficiencies resulted in the submission of false claims to federal healthcare programs, or if it were to discover other problems in addition to the ones identified by the probe reviews that rose to actionable levels, we and certain of our officers might face potential criminal charges and/or civil claims, administrative sanctions and penalties for amounts that could be material to our business, results of operations and financial condition. In addition, we and/or some of the key personnel of our operating subsidiaries could be temporarily or permanently excluded from future participation in state and federal healthcare reimbursement programs such as Medicaid and Medicare. In any event, it is likely that a governmental investigation alone, regardless of its outcome, would divert material time, resources and attention from our management team and our staff, and could have a materially detrimental impact on our results of operations during and after any such investigation or proceedings.
In cases where claim and documentation review by any CMS contractor results in repeated poor performance, a facility can be subjected to protracted oversight. This oversight may include repeat education and re-probe, extended pre-payment review, referral to recovery audit or integrity contractors, or extrapolation of an error rate to other reimbursement outside of specifically reviewed claims. Sustained failure to demonstrate improvement towards meeting all claim filing and documentation requirements could ultimately lead to Medicare decertification. During the
year ended
December 31, 2016
, we have
eighteen
operating subsidiaries that were subject to probe reviews, both pre- and post-payment.
Twelve
of these reviews have successfully closed as of
December 31, 2016
. No operating subsidiary has been identified as needing oversight beyond single education and re-probe as of this filing, however,
two
operating subsidiaries are in their second round of education and re-probe.
Public and government calls for increased survey and enforcement efforts toward long-term care facilities could result in increased scrutiny by state and federal survey agencies. In addition, potential sanctions and remedies based upon alleged regulatory deficiencies could negatively affect our financial condition and results of operations.
CMS has undertaken several initiatives to increase or intensify Medicaid and Medicare survey and enforcement activities, including federal oversight of state actions. CMS is taking steps to focus more survey and enforcement efforts on facilities with findings of substandard care or repeat violations of Medicaid and Medicare standards, and to identify multi-facility providers with patterns of noncompliance. In addition, HHS has adopted a rule that requires CMS to charge user fees to healthcare facilities cited during regular certification, recertification or substantiated complaint surveys for deficiencies, which require a revisit to assure that corrections have been made. CMS is also increasing its oversight of state survey agencies and requiring state agencies to use enforcement sanctions and remedies more promptly when substandard care or repeat violations are identified, to investigate complaints more promptly, and to survey facilities more consistently.
The intensified and evolving enforcement environment impacts providers like us because of the increase in the scope or number of inspections or surveys by governmental authorities and the severity of consequent citations for alleged failure to comply with regulatory requirements. We also divert personnel resources to respond to federal and state investigations and other enforcement actions. The diversion of these resources, including our management team, clinical and compliance staff, and others take away from the time and energy that these individuals could otherwise spend on routine operations. As noted, from time to time in the ordinary course of business, we receive deficiency reports from state and federal regulatory bodies resulting from such
37
inspections or surveys. The focus of these deficiency reports tends to vary from year to year. Although most inspection deficiencies are resolved through an agreed-upon plan of corrective action, the reviewing agency typically has the authority to take further action against a licensed or certified facility, which could result in the imposition of fines, imposition of a provisional or conditional license, suspension or revocation of a license, suspension or denial of payment for new admissions, loss of certification as a provider under state or federal healthcare programs, or imposition of other sanctions, including criminal penalties. In the past, we have experienced inspection deficiencies that have resulted in the imposition of a provisional license and could experience these results in the future. We currently have no affiliated facilities operating under provisional licenses which were the result of inspection deficiencies.
Furthermore, in some states, citations in one facility impact other facilities in the state. Revocation of a license at a given facility could therefore impair our ability to obtain new licenses or to renew existing licenses at other facilities, which may also trigger defaults or cross-defaults under our leases and our credit arrangements, or adversely affect our ability to operate or obtain financing in the future. If state or federal regulators were to determine, formally or otherwise, that one facility's regulatory history ought to impact another of our existing or prospective facilities, this could also increase costs, result in increased scrutiny by state and federal survey agencies, and even impact our expansion plans. Therefore, our failure to comply with applicable legal and regulatory requirements in any single facility could negatively impact our financial condition and results of operations as a whole.
When a facility is found to be deficient under state licensing and Medicaid and Medicare standards, sanctions may be threatened or imposed such as denial of payment for new Medicaid and Medicare admissions, civil monetary penalties, focused state and federal oversight and even loss of eligibility for Medicaid and Medicare participation or state licensure. Sanctions such as denial of payment for new admissions often are scheduled to go into effect before surveyors return to verify compliance. Generally, if the surveyors confirm that the facility is in compliance upon their return, the sanctions never take effect. However, if they determine that the facility is not in compliance, the denial of payment goes into effect retroactive to the date given in the original notice. This possibility sometimes leaves affected operators, including us, with the difficult task of deciding whether to continue accepting patients after the potential denial of payment date, thus risking the retroactive denial of revenue associated with those patients' care if the operators are later found to be out of compliance, or simply refusing admissions from the potential denial of payment date until the facility is actually found to be in compliance. In the past, some of our affiliated facilities have been in denial of payment status due to findings of continued regulatory deficiencies, resulting in an actual loss of the revenue associated with the Medicare and Medicaid patients admitted after the denial of payment date. Additional sanctions could ensue and, if imposed, these sanctions, entailing various remedies up to and including decertification, would further negatively affect our financial condition and results of operations. In the first quarter of 2016, we elected to voluntarily close one operating subsidiary as a result of multiple regulatory deficiencies in order to avoid continued strain on our staff and other resources and to avoid restrictions on our ability to acquire new facilities or expand or operate existing facilities. In addition, from time to time, we have opted to voluntarily stop accepting new patients pending completion of a new state survey, in order to avoid possible denial of payment for new admissions during the deficiency cure period, or simply to avoid straining staff and other resources while retraining staff, upgrading operating systems or making other operational improvements. If we elect to voluntary close any operations in the future or to opt to stop accepting new patients pending completion of a state or federal survey, it could negatively impact our financial condition and results of operation.
Facilities with otherwise acceptable regulatory histories generally are given an opportunity to correct deficiencies and continue their participation in the Medicare and Medicaid programs by a certain date, usually within nine months, although where denial of payment remedies are asserted, such interim remedies go into effect much sooner. Facilities with deficiencies that immediately jeopardize patient health and safety and those that are classified as poor performing facilities, however, are not generally given an opportunity to correct their deficiencies prior to the imposition of remedies and other enforcement actions. Moreover, facilities with poor regulatory histories continue to be classified by CMS as poor performing facilities notwithstanding any intervening change in ownership, unless the new owner obtains a new Medicare provider agreement instead of assuming the facility's existing agreement. However, new owners (including us, historically) nearly always assume the existing Medicare provider agreement due to the difficulty and time delays generally associated with obtaining new Medicare certifications, especially in previously-certified locations with sub-par operating histories. Accordingly, facilities that have poor regulatory histories before we acquire them and that develop new deficiencies after we acquire them are more likely to have sanctions imposed upon them by CMS or state regulators. In addition, CMS has increased its focus on facilities with a history of serious quality of care problems through the special focus facility initiative. A facility's administrators and owners are notified when it is identified as a special focus facility. This information is also provided to the general public. The special focus facility designation is based in part on the facility's compliance history typically dating before our acquisition of the facility. Local state survey agencies recommend to CMS that facilities be placed on special focus status. A special focus facility receives heightened scrutiny and more frequent regulatory surveys. Failure to improve the quality of care can result in fines and termination from participation in Medicare and Medicaid. A facility “graduates” from the program once it demonstrates significant improvements in quality of care that are continued over time.
38
We have received notices of potential sanctions and remedies based upon alleged regulatory deficiencies from time to time, and such sanctions have been imposed on some of our affiliated facilities. We have had several affiliated facilities placed on special focus facility status, due largely or entirely to their respective regulatory histories prior to our acquisition of the operating subsidiaries, and have successfully graduated five operating subsidiaries from the program to date. Other operating subsidiaries may be identified for such status in the future.
Annual caps that limit the amounts that can be paid for outpatient therapy services rendered to any Medicare beneficiary may reduce our future revenue and profitability or cause us to incur losses.
Some of our rehabilitation therapy revenue is paid by the Medicare Part B program under a fee schedule. Congress has established annual caps that limit the amounts that can be paid (including deductible and coinsurance amounts) for rehabilitation therapy services rendered to any Medicare beneficiary under Medicare Part B. The BBA requires a combined cap for physical therapy and speech-language pathology and a separate cap for occupational therapy.
The DRA directs CMS to create a process to allow exceptions to therapy caps for certain medically necessary services provided on or after January 1, 2006 for patients with certain conditions or multiple complexities whose therapy services are reimbursed under Medicare Part B. A significant portion of the patients in our affiliated skilled nursing facilities and patients served by our rehabilitation therapy programs whose therapy is reimbursed under Medicare Part B have qualified for the exceptions to these reimbursement caps. DRA added Section 1833(g)(5) of the Social Security Act and directed them to develop a process that allows exceptions for Medicare beneficiaries to therapy caps when continued therapy is deemed medically necessary.
The therapy cap exception has been reauthorized in a number of subsequent laws, including the Protecting Access to Medicare Act of 2014. All beneficiaries began a new cap year on January 1, 2016 since the therapy caps are determined on a calendar year basis. For physical therapy (PT) and speech-language pathology services (SLP) combined, the limit on incurred expenses is $1,960 in 2016 compared to $1,940 in 2015. For occupational therapy (OT) services, the limit is $1,960 in 2016 compared to $1,960 in 2015. Deductible and coinsurance amounts paid by the beneficiary for therapy services count toward the amount applied to the limit.
The Multiple Procedure Payment Reduction (MPPR) continues at a 50% reduction applied to therapy procedure codes by reducing payments for practice expense of the second and subsequent procedure codes when services provided under subsequent codes are provided on the same day. The implementation of MPPR includes 1) facilities that provide Medicare Part B speech-language pathology, occupational therapy, and physical therapy services and bill under the same provider number; and 2) providers in private practice, including speech-language pathologists, who perform and bill for multiple services in a single day.
The application of annual caps, or the discontinuation of exceptions to the annual caps, could have an adverse effect on our rehabilitation therapy revenue. Most recently, the therapy cap exception was extended through December 31, 2017 pursuant to MACRA.
Our hospice operating subsidiaries are subject to annual Medicare caps calculated by Medicare. If such caps were to be exceeded by any of our hospice providers, our business and consolidated financial condition, results of operations and cash flows could be materially adversely affected.
With respect to our hospice operating subsidiaries, overall payments made by Medicare to each provider number are subject to an inpatient cap amount and an overall payment cap, which are calculated and published by the Medicare fiscal intermediary on an annual basis covering the period from November 1 through October 31. If payments received by any one of our hospice provider numbers exceeds either of these caps, we are required to reimburse Medicare for payments received in excess of the caps, which could have a material adverse effect on our business and consolidated financial condition, results of operations and cash flows. During the
year ended December 31, 2016
, we recorded
$1.3 million
of hospice cap expense.
We are subject to extensive and complex federal and state government laws and regulations which could change at any time and increase our cost of doing business and subject us to enforcement actions.
We, along with other companies in the healthcare industry, are required to comply with extensive and complex laws and regulations at the federal, state and local government levels relating to, among other things:
|
•
|
facility and professional licensure, certificates of need, permits and other government approvals;
|
|
•
|
adequacy and quality of healthcare services;
|
39
|
•
|
qualifications of healthcare and support personnel;
|
|
•
|
quality of medical equipment;
|
|
•
|
confidentiality, maintenance and security issues associated with medical records and claims processing;
|
|
•
|
relationships with physicians and other referral sources and recipients;
|
|
•
|
constraints on protective contractual provisions with patients and third-party payors;
|
|
•
|
operating policies and procedures;
|
|
•
|
certification of additional facilities by the Medicare program; and
|
|
•
|
payment for services.
|
The laws and regulations governing our operations, along with the terms of participation in various government programs, regulate how we do business, the services we offer, and our interactions with patients and other healthcare providers. These laws and regulations are subject to frequent change. We believe that such regulations may increase in the future and we cannot predict the ultimate content, timing or impact on us of any healthcare reform legislation. Changes in existing laws or regulations, or the enactment of new laws or regulations, could negatively impact our business. If we fail to comply with these applicable laws and regulations, we could suffer civil or criminal penalties and other detrimental consequences, including denial of reimbursement, imposition of fines, temporary suspension of admission of new patients, suspension or decertification from the Medicaid and Medicare programs, restrictions on our ability to acquire new facilities or expand or operate existing facilities, the loss of our licenses to operate and the loss of our ability to participate in federal and state reimbursement programs.
We are subject to federal and state laws, such as the federal False Claims Act, state false claims acts, the illegal remuneration provisions of the Social Security Act, the federal anti-kickback laws, state anti-kickback laws, and the federal “Stark” laws, that govern financial and other arrangements among healthcare providers, their owners, vendors and referral sources, and that are intended to prevent healthcare fraud and abuse. Among other things, these laws prohibit kickbacks, bribes and rebates, as well as other direct and indirect payments or fee-splitting arrangements that are designed to induce the referral of patients to a particular provider for medical products or services payable by any federal healthcare program, and prohibit presenting a false or misleading claim for payment under a federal or state program. They also prohibit some physician self-referrals. Possible sanctions for violation of any of these restrictions or prohibitions include loss of eligibility to participate in federal and state reimbursement programs and civil and criminal penalties. Changes in these laws could increase our cost of doing business. If we fail to comply, even inadvertently, with any of these requirements, we could be required to alter our operations, refund payments to the government, enter into a corporate integrity agreement, deferred prosecution or similar agreements with state or federal government agencies, and become subject to significant civil and criminal penalties. For example, in April 2013, we announced that we reached a tentative settlement with the Department of Justice (DOJ) regarding their investigation related to claims submitted to the Medicare program for rehabilitation services provided at skilled nursing facilities in Southern California. As part of the settlement, we entered into a Corporate Integrity Agreement with the Office of Inspector General-HHS. Failure to comply with the terms of the Corporate Integrity Agreement could result in substantial civil or criminal penalties and being excluded from government health care programs, which could adversely affect our financial condition and results of operations.
In May 2009, Congress passed the Fraud Enforcement and Recovery Act (FERA) of 2009 which made significant changes to the federal False Claims Act (FCA), expanding the types of activities subject to prosecution and whistleblower liability. Following changes by FERA, health care providers face significant penalties for known retention of government overpayments, even if no false claim was involved. Health care providers can now be liable for knowingly and improperly avoiding or decreasing an obligation to pay money or property to the government. This includes the retention of any government overpayment. The government can argue, therefore, that a FCA violation can occur without any affirmative fraudulent action or statement, as long as it is knowingly improper. The ACA supplements FERA by imposing an affirmative obligation on health care providers to return an overpayment to CMS within 60 days of “identification” or the date any corresponding cost report is due, whichever is later. On August 3, 2015, the U.S. District Court for the Southern District of New York held that the 60 day clock following “identification” of an overpayment begins to run when a provider is put on notice of a potential overpayment, rather than the moment when an overpayment is conclusively ascertained. On February 12, 2016, CMS published a final rule with respect to Medicare Parts A and B clarifying that providers have an obligation to proactively exercise “reasonable diligence,” and that the 60 day clock begins to run after the reasonable diligence period has concluded, which may take at most 6 months from the from receipt of credible information, absent extraordinary circumstances. Retention of any overpayment beyond this period may result in FCA liability. In addition, FERA extended protections against retaliation for whistleblowers, including protections not only for employees, but also contractors and agents. Thus, there is no need for an employment relationship in order to qualify for protection against retaliation for whistleblowing.
40
We are also required to comply with state and federal laws governing the transmission, privacy and security of health information. The Health Insurance Portability and Accountability Act of 1996 (HIPAA) requires us to comply with certain standards for the use of individually identifiable health information within our company, and the disclosure and electronic transmission of such information to third parties, such as payors, business associates and patients. These include standards for common electronic healthcare transactions and information, such as claim submission, plan eligibility determination, payment information submission and the use of electronic signatures; unique identifiers for providers, employers and health plans; and the security and privacy of individually identifiable health information. In addition, some states have enacted comparable or, in some cases, more stringent privacy and security laws. If we fail to comply with these state and federal laws, we could be subject to criminal penalties and civil sanctions and be forced to modify our policies and procedures.
On January 25, 2013, HHS promulgated new HIPAA privacy, security, and enforcement regulations, which increase significantly the penalties and enforcement practices of the Department regarding HIPAA violations. In addition, any breach of individually identifiable health information can result in obligations under HIPAA and state laws to notify patients, federal and state agencies, and in some cases media outlets, regarding the breach incident. Breach incidents and violations of HIPAA or state privacy and security laws could subject us to significant penalties, and could have a significant impact on our business. The new HIPAA regulations are effective as of March 26, 2013, and compliance was required by September 23, 2013.
Our failure to obtain or renew required regulatory approvals or licenses or to comply with applicable regulatory requirements, the suspension or revocation of our licenses or our disqualification from participation in federal and state reimbursement programs, or the imposition of other harsh enforcement sanctions could increase our cost of doing business and expose us to potential sanctions. Furthermore, if we were to lose licenses or certifications for any of our affiliated facilities as a result of regulatory action or otherwise, we could be deemed to be in default under some of our agreements, including agreements governing outstanding indebtedness and lease obligations.
Increased civil and criminal enforcement efforts of government agencies against skilled nursing facilities could harm our business, and could preclude us from participating in federal healthcare programs.
Both federal and state government agencies have heightened and coordinated civil and criminal enforcement efforts as part of numerous ongoing investigations of healthcare companies and, in particular, skilled nursing facilities. The focus of these investigations includes, among other things:
|
•
|
cost reporting and billing practices;
|
|
•
|
quality of care;
|
|
•
|
financial relationships with referral sources; and
|
|
•
|
medical necessity of services provided.
|
If any of our affiliated facilities is decertified or loses its licenses, our revenue, financial condition or results of operations would be adversely affected. In addition, the report of such issues at any of our affiliated facilities could harm our reputation for quality care and lead to a reduction in the patient referrals of our operating subsidiaries and ultimately a reduction in occupancy at these facilities. Also, responding to enforcement efforts would divert material time, resources and attention from our management team and our staff, and could have a materially detrimental impact on our results of operations during and after any such investigation or proceedings, regardless of whether we prevail on the underlying claim.
Federal law provides that practitioners, providers and related persons may not participate in most federal healthcare programs, including the Medicaid and Medicare programs, if the individual or entity has been convicted of a criminal offense related to the delivery of a product or service under these programs or if the individual or entity has been convicted under state or federal law of a criminal offense relating to neglect or abuse of patients in connection with the delivery of a healthcare product or service. Other individuals or entities may be, but are not required to be, excluded from such programs under certain circumstances, including, but not limited to, the following:
|
•
|
medical necessity of services provided;
|
|
•
|
conviction related to fraud;
|
|
•
|
conviction relating to obstruction of an investigation;
|
41
|
•
|
conviction relating to a controlled substance;
|
|
•
|
licensure revocation or suspension;
|
|
•
|
exclusion or suspension from state or other federal healthcare programs;
|
|
•
|
filing claims for excessive charges or unnecessary services or failure to furnish medically necessary services;
|
|
•
|
ownership or control of an entity by an individual who has been excluded from the Medicaid or Medicare programs, against whom a civil monetary penalty related to the Medicaid or Medicare programs has been assessed or who has been convicted of a criminal offense under federal healthcare programs; and
|
|
•
|
the transfer of ownership or control interest in an entity to an immediate family or household member in anticipation of, or following, a conviction, assessment or exclusion from the Medicare or Medicaid programs.
|
The OIG, among other priorities, is responsible for identifying and eliminating fraud, abuse and waste in certain federal healthcare programs. The OIG has implemented a nationwide program of audits, inspections and investigations and from time to time issues “fraud alerts” to segments of the healthcare industry on particular practices that are vulnerable to abuse. The fraud alerts inform healthcare providers of potentially abusive practices or transactions that are subject to criminal activity and reportable to the OIG. An increasing level of resources has been devoted to the investigation of allegations of fraud and abuse in the Medicaid and Medicare programs, and federal and state regulatory authorities are taking an increasingly strict view of the requirements imposed on healthcare providers by the Social Security Act and Medicaid and Medicare programs. Although we have created a corporate compliance program that we believe is consistent with the OIG guidelines, the OIG may modify its guidelines or interpret its guidelines in a manner inconsistent with our interpretation or the OIG may ultimately determine that our corporate compliance program is insufficient.
In some circumstances, if one facility is convicted of abusive or fraudulent behavior, then other facilities under common control or ownership may be decertified from participating in Medicaid or Medicare programs. Federal regulations prohibit any corporation or facility from participating in federal contracts if it or its principals have been barred, suspended or declared ineligible from participating in federal contracts. In addition, some state regulations provide that all facilities under common control or ownership licensed within a state may be de-licensed if one or more of the facilities are de-licensed. If any of our operating subsidiaries were decertified or excluded from participating in Medicaid or Medicare programs, our revenue would be adversely affected.
The Office of the Inspector General or other regulatory authorities may choose to more closely scrutinize billing practices in areas where we operate or propose to expand, which could result in an increase in regulatory monitoring and oversight, decreased reimbursement rates, or otherwise adversely affect our business, financial condition and results of operations.
In March 2016, the OIG released a report entitled “Hospices Inappropriately Billed Medicare Over $250 Million for General Inpatient Care.” The report analyzed the results of a medical record review of 2012 hospice general inpatient care stays to estimate the percentage of such stays that were billed inappropriately, and found that hospices billed one-third of general inpatient stays inappropriately, costing Medicare $268 million in 2012. Consequently, the OIG recommended, and CMS concurred with such recommendations, that CMS (1) increase its oversight of hospice general inpatient stay claims and review Part D payments for drugs for hospice beneficiaries; (2) ensure that a physician is involved in the decision to use general inpatient care; (3) conduct prepayment reviews for lengthy general inpatient care stays; (4) increase surveyor efforts to ensure that hospices meet care planning requirements; (5) establish additional enforcement remedies for poor hospice performance; and (6) follow up on inappropriate general inpatient care stays.
In September 2015, the OIG released a report entitled “The Medicare Payment System for Skilled Nursing Facilities Needs to Be Reevaluated.” Among other things, the report used Medicare cost reports to compare Medicare payments to skilled nursing facilities’ costs for therapy over a ten year period, and found that Medicare payments for therapy greatly exceeded skilled nursing facilities’ costs for therapy. The OIG recommended, and CMS concurred with such recommendations, that CMS evaluate the extent to which Medicare payment rates for therapy should be reduced, change the method for paying for therapy, adjust Medicare payments to eliminate any increases that are unrelated to beneficiary characteristics, and strengthen oversight of Skilled Nursing Facility billing.
In January 2015, the OIG released a report entitled “Medicare Hospices Have Financial Incentives to Provide Care in Assisted Living Facilities.” The report analyzed all Medicare hospices claims from 2007 through 2012, and raised concerns about the financial incentives created by the current payment system and the potential for hospices-especially for-profit hospices-to target
42
beneficiaries in assisted living facilities because they may offer the hospices the greatest financial gain. Accordingly, the report recommended that CMS reform payments to reduce the incentive for hospices to target beneficiaries with certain diagnoses and those likely to have long stays, target certain hospices for review, develop and adopt claims-based measures of quality, make hospice data publicly available for the beneficiaries, and provide additional information to hospices to educate them about how they compare to their peers. CMS concurred with all five recommendations.
In August 2012, the OIG released a report entitled “Inappropriate and Questionable Billing for Medicare Home Health Agencies.” The report analyzed data from home health, inpatient hospital, and skilled nursing facilities claims from 2010 to identify inappropriate home health payments. The report found that in 2010, Medicare made overpayments largely in connection with three specific errors: overlapping with claims for inpatient hospital stays, overlapping with claims for skilled nursing facility stays, or billing for services on dates after beneficiaries’ deaths. The report also concluded that home health agencies with questionable billing were located mostly in Texas, Florida, California, and Michigan. The report recommended that CMS implement claims processing edits or improve existing edits to prevent inappropriate payments for the three specific errors referenced above, increase monitoring of billing for home health services, enforce and consider lowering the ten percent cap on the total outlier payments a home health agency may receive annually, consider imposing a temporary moratorium on new home health agency enrollments in Florida and Texas, and take appropriate action regarding the inappropriate payments identified and home health agencies with questionable billing. CMS concurred with all five recommendations. Moratoria were subsequently put in place, and effective January 29, 2016, and extended on July 29, 2016, moratoria on new home health agencies and home health agency sub-units were extended in various counties in Florida, Michigan, Texas and Illinois. Additionally, following recommendations made by the OIG in an April 2014 report entitled “Limited Compliance with Medicare’s Home Health Face-to-Face Documentation Requirements,” CMS committed to implement a plan for oversight of home health agencies through Supplemental Medical Review Contractor audits of every home health agency in the country.
In December 2010, the OIG released a report entitled “Questionable Billing by Skilled Nursing Facilities.” The report examined the billing practices of skilled nursing facilities based on Medicare Part A claims from 2006 to 2008 and found, among other things, that for-profit skilled nursing facilities were more likely to bill for higher paying therapy RUGs, particularly in the ultra high therapy categories, than government and not-for-profit operators. It also found that for-profit skilled nursing facilities showed a higher incidence of patients using RUGs with higher activities of daily living (ADL) scores, and had a “long” average length of stay among Part A beneficiaries, compared to their government and not-for-profit counterparts. The OIG recommended that CMS vigilantly monitor overall payments to skilled nursing facilities, adjust RUG rates annually, change the method for determining how much therapy is needed to ensure appropriate payments and conduct additional reviews for skilled nursing operators that exceed certain thresholds for higher paying therapy RUGs. CMS concurred with and agreed to take action on three of the four recommendations, declining only to change the methodology for assessing a patient's therapy needs. The OIG issued a separate memorandum to CMS listing 384 specific facilities that the OIG had identified as being in the top one percent for use of ultra high therapy, RUGs with high ADL scores, or “long” average lengths of stay, and CMS agreed to forward the list to the appropriate fiscal intermediaries or other contractors for follow up. Although we believe our therapy assessment and billing practices are consistent with applicable law and CMS requirements, we cannot predict the extent to which the OIG's recommendations to CMS will be implemented and, what effect, if any, such proposals would have on us. Two of our affiliated facilities have been listed on the report. Our business model, like those of some other for-profit operators, is based in part on seeking out higher-acuity patients whom we believe are generally more profitable, and over time our overall patient mix has consistently shifted to higher-acuity and higher-RUGs patients in most facilities we operate. We also use specialized care-delivery software that assists our caregivers in more accurately capturing and recording ADL services in order to, among other things, increase reimbursement to levels appropriate for the care actually delivered. These efforts may place us under greater scrutiny with the OIG, CMS, our fiscal intermediaries, recovery audit contractors and others, as well as other government agencies, unions, advocacy groups and others who seek to pursue their own mandates and agendas. In its fiscal year 2014 work plan, OIG specifically stated that it will continue to study and report on questionable Part A and Part B billing practices amongst skilled nursing facilities.
In addition, in its 2016 Work Plan, the OIG indicated that it will review compliance with various aspects of the skilled nursing facility prospective payment system, including the documentation requirement in support of the claims paid by Medicare. According to the 2016 Work Plan, prior OIG reviews found that Medicare payments for therapy greatly exceeded skilled nursing facilities’ cost for therapy, and the OIG found that skilled nursing facilities have increasingly billed for the highest level of therapy even though key beneficiary characteristics remained largely the same. The OIG’s 2016 Work Plan provides that the OIG will review Medicare payments for portable x-ray equipment and services to determine whether payments were correct and were supported by documentation.
Efforts by officials and others to make or advocate for any increase in regulatory monitoring and oversight, adversely change RUG rates, reduce payment rates, revise methodologies for assessing and treating patients, conduct more frequent or intense reviews of our treatment and billing practices, or implement moratoria in areas where we operate or propose to expand, could
43
reduce our reimbursement, increase our costs of doing business and otherwise adversely affect our business, financial condition and results of operations.
State efforts to regulate or deregulate the healthcare services industry or the construction or expansion of healthcare facilities could impair our ability to expand our operations, or could result in increased competition.
Some states require healthcare providers, including skilled nursing facilities, to obtain prior approval, known as a certificate of need, for:
|
•
|
the purchase, construction or expansion of healthcare facilities;
|
|
•
|
capital expenditures exceeding a prescribed amount; or
|
|
•
|
changes in services or bed capacity.
|
In addition, other states that do not require certificates of need have effectively barred the expansion of existing facilities and the development of new ones by placing partial or complete moratoria on the number of new Medicaid beds they will certify in certain areas or in the entire state. Other states have established such stringent development standards and approval procedures for constructing new healthcare facilities that the construction of new facilities, or the expansion or renovation of existing facilities, may become cost-prohibitive or extremely time-consuming. In addition, some states the acquisition of a facility being operated by a non-profit organization requires the approval of the state Attorney General.
Our ability to acquire or construct new facilities or expand or provide new services at existing facilities would be adversely affected if we are unable to obtain the necessary approvals, if there are changes in the standards applicable to those approvals, or if we experience delays and increased expenses associated with obtaining those approvals. We may not be able to obtain licensure, certificate of need approval, Medicaid certification, Attorney General approval or other necessary approvals for future expansion projects. Conversely, the elimination or reduction of state regulations that limit the construction, expansion or renovation of new or existing facilities could result in increased competition to us or result in overbuilding of facilities in some of our markets. If overbuilding in the skilled nursing industry in the markets in which we operate were to occur, it could reduce the occupancy rates of existing facilities and, in some cases, might reduce the private rates that we charge for our services.
Changes in federal and state employment-related laws and regulations could increase our cost of doing business.
Our operating subsidiaries are subject to a variety of federal and state employment-related laws and regulations, including, but not limited to, the U.S. Fair Labor Standards Act which governs such matters as minimum wages, overtime and other working conditions, the Americans with Disabilities Act (ADA) and similar state laws that provide civil rights protections to individuals with disabilities in the context of employment, public accommodations and other areas, the National Labor Relations Act, regulations of the Equal Employment Opportunity Commission (EEOC), regulations of the Office of Civil Rights, regulations of state Attorneys General, family leave mandates and a variety of similar laws enacted by the federal and state governments that govern these and other employment law matters. Because labor represents such a large portion of our operating costs, changes in federal and state employment-related laws and regulations could increase our cost of doing business.
The compliance costs associated with these laws and evolving regulations could be substantial. For example, all of our affiliated facilities are required to comply with the ADA. The ADA has separate compliance requirements for “public accommodations” and “commercial properties,” but generally requires that buildings be made accessible to people with disabilities. Compliance with ADA requirements could require removal of access barriers and non-compliance could result in imposition of government fines or an award of damages to private litigants. Further legislation may impose additional burdens or restrictions with respect to access by disabled persons. In addition, federal proposals to introduce a system of mandated health insurance and flexible work time and other similar initiatives could, if implemented, adversely affect our operations. We also may be subject to employee-related claims such as wrongful discharge, discrimination or violation of equal employment law. While we are insured for these types of claims, we could experience damages that are not covered by our insurance policies or that exceed our insurance limits, and we may be required to pay such damages directly, which would negatively impact our cash flow from operations.
Compliance with federal and state fair housing, fire, safety and other regulations may require us to make unanticipated expenditures, which could be costly to us.
We must comply with the federal Fair Housing Act and similar state laws, which prohibit us from discriminating against individuals if it would cause such individuals to face barriers in gaining residency in any of our affiliated facilities. Additionally,
44
the Fair Housing Act and other similar state laws require that we advertise our services in such a way that we promote diversity and not limit it. We may be required, among other things, to change our marketing techniques to comply with these requirements.
In addition, we are required to operate our affiliated facilities in compliance with applicable fire and safety regulations, building codes and other land use regulations and food licensing or certification requirements as they may be adopted by governmental agencies and bodies from time to time. Like other healthcare facilities, our affiliated skilled nursing facilities are subject to periodic surveys or inspections by governmental authorities to assess and assure compliance with regulatory requirements. Surveys occur on a regular (often annual or biannual) schedule, and special surveys may result from a specific complaint filed by a patient, a family member or one of our competitors. We may be required to make substantial capital expenditures to comply with these requirements.
We depend largely upon reimbursement from third-party payors, and our revenue, financial condition and results of operations could be negatively impacted by any changes in the acuity mix of patients in our affiliated facilities as well as payor mix and payment methodologies.
Our revenue is affected by the percentage of the patients of our operating subsidiaries who require a high level of skilled nursing and rehabilitative care, whom we refer to as high acuity patients, and by our mix of payment sources. Changes in the acuity level of patients we attract, as well as our payor mix among Medicaid, Medicare, private payors and managed care companies, significantly affect our profitability because we generally receive higher reimbursement rates for high acuity patients and because the payors reimburse us at different rates. For the
year ended December 31, 2016
,
67.8%
of our revenue was provided by government payors that reimburse us at predetermined rates. If our labor or other operating costs increase, we will be unable to recover such increased costs from government payors. Accordingly, if we fail to maintain our proportion of high acuity patients or if there is any significant increase in the percentage of the patients of our operating subsidiaries for whom we receive Medicaid reimbursement, our results of operations may be adversely affected.
Initiatives undertaken by major insurers and managed care companies to contain healthcare costs may adversely affect our business. Among other initiatives, these payors attempt to control healthcare costs by contracting with healthcare providers to obtain services on a discounted basis. We believe that this trend will continue and may limit reimbursements for healthcare services. If insurers or managed care companies from whom we receive substantial payments were to reduce the amounts they pay for services, we may lose patients if we choose not to renew our contracts with these insurers at lower rates.
Compliance with state and federal employment, immigration, licensing and other laws could increase our cost of doing business.
We have hired personnel, including skilled nurses and therapists, from outside the United States. If immigration laws are changed, or if new and more restrictive government regulations proposed by the Department of Homeland Security are enacted, our access to qualified and skilled personnel may be limited.
We operate in at least one state that requires us to verify employment eligibility using procedures and standards that exceed those required under federal Form I-9 and the statutes and regulations related thereto. Proposed federal regulations would extend similar requirements to all of the states in which our affiliated facilities operate. To the extent that such proposed regulations or similar measures become effective, and we are required by state or federal authorities to verify work authorization or legal residence for current and prospective employees beyond existing Form I-9 requirements and other statutes and regulations currently in effect, it may make it more difficult for us to recruit, hire and/or retain qualified employees, may increase our risk of non-compliance with state and federal employment, immigration, licensing and other laws and regulations and could increase our cost of doing business.
We are subject to litigation that could result in significant legal costs and large settlement amounts or damage awards.
The skilled nursing business involves a significant risk of liability given the age and health of the patients and residents of our operating subsidiaries and the services we provide. We and others in our industry are subject to a large and increasing number of claims and lawsuits, including professional liability claims, alleging that our services have resulted in personal injury, elder abuse, wrongful death or other related claims. The defense of these lawsuits has in the past, and may in the future, result in significant legal costs, regardless of the outcome, and can result in large settlement amounts or damage awards. Plaintiffs tend to sue every healthcare provider who may have been involved in the patient's care and, accordingly, we respond to multiple lawsuits and claims every year.
In addition, plaintiffs' attorneys have become increasingly more aggressive in their pursuit of claims against healthcare providers, including skilled nursing providers and other long-term care companies, and have employed a wide variety of advertising and publicity strategies. Among other things, these strategies include establishing their own Internet websites, paying for premium
45
advertising space on other websites, paying Internet search engines to optimize their plaintiff solicitation advertising so that it appears in advantageous positions on Internet search results, including results from searches for our company and affiliated facilities, using newspaper, magazine and television ads targeted at customers of the healthcare industry generally, as well as at customers of specific providers, including us. From time to time, law firms claiming to specialize in long-term care litigation have named us, our affiliated facilities and other specific healthcare providers and facilities in their advertising and solicitation materials. These advertising and solicitation activities could result in more claims and litigation, which could increase our liability exposure and legal expenses, divert the time and attention of the personnel of our operating subsidiaries from day-to-day business operations, and materially and adversely affect our financial condition and results of operations. Furthermore, to the extent the frequency and/or severity of losses from such claims and suits increases, our liability insurance premiums could increase and/or available insurance coverage levels could decline, which could materially and adversely affect our financial condition and results of operations.
Healthcare litigation (including class action litigation) is common and is filed based upon a wide variety of claims and theories, and we are routinely subjected to varying types of claims. One particular type of suit arises from alleged violations of state-established minimum staffing requirements for skilled nursing facilities. Failure to meet these requirements can, among other things, jeopardize a facility's compliance with conditions of participation under certain state and federal healthcare programs; it may also subject the facility to a notice of deficiency, a citation, civil monetary penalty, or litigation. These class-action “staffing” suits have the potential to result in large jury verdicts and settlements, and have become more prevalent in the wake of a previous substantial jury award against one of our competitors. We expect the plaintiff's bar to continue to be aggressive in their pursuit of these staffing and similar claims.
We have in the past been subject to class action litigation involving claims of violations of various regulatory requirements. While we have been able to settle these claims without a material ongoing adverse effect on our business, future claims could be brought that may materially affect our business, financial condition and results of operations. Other claims and suits, including class actions, continue to be filed against us and other companies in our industry. For example, there has been an increase in the number of wage and hour class action claims filed in several of the jurisdictions where we are present. Allegations typically include claimed failures to permit or properly compensate for meal and rest periods, or failure to pay for time worked. If there were a significant increase in the number of these claims or an increase in amounts owing should plaintiffs be successful in their prosecution of these claims, this could have a material adverse effect to our business, financial condition, results of operations and cash flows. In addition, we contract with a variety of landlords, lenders, vendors, suppliers, consultants and other individuals and businesses. These contracts typically contain covenants and default provisions. If the other party to one or more of our contracts were to allege that we have violated the contract terms, we could be subject to civil liabilities which could have a material adverse effect on our financial condition and results of operations.
Were litigation to be instituted against one or more of our subsidiaries, a successful plaintiff might attempt to hold us or another subsidiary liable for the alleged wrongdoing of the subsidiary principally targeted by the litigation. If a court in such litigation decided to disregard the corporate form, the resulting judgment could increase our liability and adversely affect our financial condition and results of operations.
On February 26, 2009, Congress reintroduced the Fairness in Nursing Home Arbitration Act of 2009. After failing to be enacted into law in the 110th Congress in 2008, the Fairness in Nursing Home Arbitration Act of 2009 was introduced in the 111th Congress and referred to the House and Senate judiciary committees in March 2009. The 111th Congress did not pass the bill and therefore has been cleared from the present agenda. This bill was reintroduced in the 112th Congress as the Fairness in Nursing Home Arbitration Act of 2012, and was referred to the House Judiciary committee. If enacted, this bill would require, among other things, that agreements to arbitrate nursing home disputes be made after the dispute has arisen rather than before prospective patients move in, to prevent nursing home operators and prospective patients from mutually entering into a pre-admission pre-dispute arbitration agreement. We use arbitration agreements, which have generally been favored by the courts, to streamline the dispute resolution process and reduce our exposure to legal fees and excessive jury awards. If we are not able to secure pre-admission arbitration agreements, our litigation exposure and costs of defense in patient liability actions could increase, our liability insurance premiums could increase, and our business may be adversely affected.
The U.S. Department of Justice has conducted an investigation into the billing and reimbursement processes of some of our operating subsidiaries, which could adversely affect our operations and financial condition.
In October 2013, we entered into the Settlement Agreement with the DOJ pertaining to an investigation of certain of our operating subsidiaries. Pursuant to the Settlement Agreement, we made a single lump-sum remittance to the government in the amount of
$48.0 million
in October 2013. We have denied engaging in any illegal conduct, and have agreed to the settlement amount without any admission of wrongdoing in order to resolve the allegations and to avoid the uncertainty and expense of protracted litigation.
46
In connection with the settlement and effective as of October 1, 2013, we entered into a five-year corporate integrity agreement (the CIA) with the Office of Inspector General-HHS. The CIA acknowledges the existence of our current compliance program, which is in accord with the Office of the Inspector General (OIG)’s guidance related to an effective compliance program, and requires that we continue during the term of the CIA to maintain said compliance program designed to promote compliance with the statutes, regulations, and written directives of Medicare, Medicaid, and all other Federal health care programs. We are also required to notify the Office of Inspector General-HHS in writing, of, among other things: (i) any ongoing government investigation or legal proceeding involving an allegation that we have committed a crime or has engaged in fraudulent activities; (ii) any other matter that a reasonable person would consider a probable violation of applicable criminal, civil, or administrative laws related to compliance with federal healthcare programs; and (iii) any change in location, sale, closing, purchase, or establishment of a new business unit or location related to items or services that may be reimbursed by Federal health care programs. We are also required to retain an Independent Review Organization (IRO) to review certain clinical documentation annually for the term of the CIA.
Our participation in federal healthcare programs is not currently affected by the Settlement Agreement or the CIA. In the event of an uncured material breach of the CIA, we could be excluded from participation in federal healthcare programs and/or subject to prosecution.
If any additional litigation were to proceed in the future, and we are subjected to, alleged to be liable for, or agree to a settlement of, claims or obligations under federal Medicare statutes, the federal False Claims Act, or similar state and federal statutes and related regulations, our business, financial condition and results of operations and cash flows could be materially and adversely affected and our stock price could be adversely impacted. Among other things, any settlement or litigation could involve the payment of substantial sums to settle any alleged civil violations, and may also include our assumption of specific procedural and financial obligations going forward under a corporate integrity agreement and/or other arrangement with the government.
We conduct regular internal investigations into the care delivery, recordkeeping and billing processes of our operating subsidiaries. These reviews sometimes detect instances of noncompliance which we attempt to correct, which can decrease our revenue.
As an operator of healthcare facilities, we have a program to help us comply with various requirements of federal and private healthcare programs. Our compliance program includes, among other things, (1) policies and procedures modeled after applicable laws, regulations, government manuals and industry practices and customs that govern the clinical, reimbursement and operational aspects of our subsidiaries, (2) training about our compliance process for all of the employees of our operating subsidiaries, our directors and officers, and training about Medicare and Medicaid laws, fraud and abuse prevention, clinical standards and practices, and claim submission and reimbursement policies and procedures for appropriate employees, and (3) internal controls that monitor, for example, the accuracy of claims, reimbursement submissions, cost reports and source documents, provision of patient care, services, and supplies as required by applicable standards and laws, accuracy of clinical assessment and treatment documentation, and implementation of judicial and regulatory requirements (i.e., background checks, licensing and training).
From time to time our systems and controls highlight potential compliance issues, which we investigate as they arise. Historically, we have, and would continue to do so in the future, initiated internal inquiries into possible recordkeeping and related irregularities at our affiliated skilled nursing facilities, which were detected by our internal compliance team in the course of its ongoing reviews.
Through these internal inquiries, we have identified potential deficiencies in the assessment of and recordkeeping for small subsets of patients. We have also identified and, at the conclusion of such investigations, assisted in implementing, targeted improvements in the assessment and recordkeeping practices to make them consistent with the existing standards and policies applicable to our affiliated skilled nursing facilities in these areas. We continue to monitor the measures implemented for effectiveness, and perform follow-up reviews to ensure compliance. Consistent with healthcare industry accounting practices, we record any charge for refunded payments against revenue in the period in which the claim adjustment becomes known.
If additional reviews result in identification and quantification of additional amounts to be refunded, we would accrue additional liabilities for claim costs and interest, and repay any amounts due in normal course. Furthermore, failure to refund overpayments within required time frames (as described in greater detail above) could result in Federal False Claims Act (FCA) liability. If future investigations ultimately result in findings of significant billing and reimbursement noncompliance which could require us to record significant additional provisions or remit payments, our business, financial condition and results of operations could be materially and adversely affected and our stock price could decline.
47
We may be unable to complete future facility or business acquisitions at attractive prices or at all, which may adversely affect our revenue; we may also elect to dispose of underperforming or non-strategic operating subsidiaries, which would also decrease our revenue.
To date, our revenue growth has been significantly impacted by our acquisition of new facilities and businesses. Subject to general market conditions and the availability of essential resources and leadership within our company, we continue to seek both single-and multi-facility acquisition and business acquisition opportunities that are consistent with our geographic, financial and operating objectives.
We face competition for the acquisition of facilities and businesses and expect this competition to increase. Based upon factors such as our ability to identify suitable acquisition candidates, the purchase price of the facilities, prevailing market conditions, the availability of leadership to manage new facilities and our own willingness to take on new operations, the rate at which we have historically acquired facilities has fluctuated significantly. In the future, we anticipate the rate at which we may acquire facilities will continue to fluctuate, which may affect our revenue.
We have also historically acquired a few facilities, either because they were included in larger, indivisible groups of facilities or under other circumstances, which were or have proven to be non-strategic or less desirable, and we may consider disposing of such facilities or exchanging them for facilities which are more desirable. To the extent we dispose of such a facility without simultaneously acquiring a facility in exchange, our revenues might decrease.
We may not be able to successfully integrate acquired facilities and businesses into our operations, and we may not achieve the benefits we expect from any of our facility acquisitions.
We may not be able to successfully or efficiently integrate new acquisitions with our existing operating subsidiaries, culture and systems. The process of integrating acquisitions into our existing operations may result in unforeseen operating difficulties, divert management's attention from existing operations, or require an unexpected commitment of staff and financial resources, and may ultimately be unsuccessful. Existing operations available for acquisition frequently serve or target different markets than those that we currently serve. We also may determine that renovations of acquired facilities and changes in staff and operating management personnel are necessary to successfully integrate those acquisitions into our existing operations. We may not be able to recover the costs incurred to reposition or renovate newly operating subsidiaries. The financial benefits we expect to realize from many of our acquisitions are largely dependent upon our ability to improve clinical performance, overcome regulatory deficiencies, rehabilitate or improve the reputation of the operations in the community, increase and maintain occupancy, control costs, and in some cases change the patient acuity mix. If we are unable to accomplish any of these objectives at the operating subsidiaries we acquire, we will not realize the anticipated benefits and we may experience lower than anticipated profits, or even losses.
During the
year ended
December 31, 2016
, we continued to expand our operations with the addition of
18
stand-alone skilled nursing operations,
one
post-acute care campus,
six
newly constructed post-acute care campuses,
two
home health agencies and
five
hospice agencies with a total of
2,799
operational skilled nursing beds and
152
assisted living units. During the year ended December 31, 2015, we expanded our operations with the addition of
50
stand-alone skilled nursing and assisted living operations,
seven
home health, hospice and home care operations and
three
urgent care centers with a total of
2,580
operational skilled nursing beds and
2,013
assisted living units. This growth has placed and will continue to place significant demands on our current management resources. Our ability to manage our growth effectively and to successfully integrate new acquisitions into our existing business will require us to continue to expand our operational, financial and management information systems and to continue to retain, attract, train, motivate and manage key employees, including facility-level leaders and our local directors of nursing. We may not be successful in attracting qualified individuals necessary for future acquisitions to be successful, and our management team may expend significant time and energy working to attract qualified personnel to manage facilities we may acquire in the future. Also, the newly acquired facilities may require us to spend significant time improving services that have historically been substandard, and if we are unable to improve such facilities quickly enough, we may be subject to litigation and/or loss of licensure or certification. If we are not able to successfully overcome these and other integration challenges, we may not achieve the benefits we expect from any of our facility acquisitions, and our business may suffer.
In undertaking acquisitions, we may be adversely impacted by costs, liabilities and regulatory issues that may adversely affect our operations.
In undertaking acquisitions, we also may be adversely impacted by unforeseen liabilities attributable to the prior providers who operated those facilities, against whom we may have little or no recourse. Many facilities we have historically acquired were underperforming financially and had clinical and regulatory issues prior to and at the time of acquisition. Even where we have improved operating subsidiaries and patient care at affiliated facilities that we have acquired, we still may face post-acquisition
48
regulatory issues related to pre-acquisition events. These may include, without limitation, payment recoupment related to our predecessors' prior noncompliance, the imposition of fines, penalties, operational restrictions or special regulatory status. Further, we may incur post-acquisition compliance risk due to the difficulty or impossibility of immediately or quickly bringing non-compliant facilities into full compliance. Diligence materials pertaining to acquisition targets, especially the underperforming facilities that often represent the greatest opportunity for return, are often inadequate, inaccurate or impossible to obtain, sometimes requiring us to make acquisition decisions with incomplete information. Despite our due diligence procedures, facilities that we have acquired or may acquire in the future may generate unexpectedly low returns, may cause us to incur substantial losses, may require unexpected levels of management time, expenditures or other resources, or may otherwise not meet a risk profile that our investors find acceptable. For example, in July of 2006 we acquired a facility that had a history of intermittent noncompliance. Although the affiliated facility had already been surveyed once by the local state survey agency after being acquired by us, and that survey would have met the heightened requirements of the special focus facility program, based upon the facility's compliance history prior to our acquisition, in January 2008, state officials nevertheless recommended to CMS that the facility be placed on special focus facility status. In addition, in October of 2006, we acquired a facility which had a history of intermittent non-compliance. This affiliated facility was surveyed by the local state survey agency during the third quarter of 2008 and passed the heightened survey requirements of the special focus facility program. Both affiliated facilities have successfully graduated from the Centers for Medicare and Medicaid Services' Special Focus program. We've had other affiliated facilities that have successfully graduated from the program. Other affiliated facilities may be identified for special focus status in the future.
In addition, we might encounter unanticipated difficulties and expenditures relating to any of the acquired facilities, including contingent liabilities. For example, when we acquire a facility, we generally assume the facility's existing Medicare provider number for purposes of billing Medicare for services. If CMS later determined that the prior owner of the facility had received overpayments from Medicare for the period of time during which it operated the facility, or had incurred fines in connection with the operation of the facility, CMS could hold us liable for repayment of the overpayments or fines. If the prior operator is defunct or otherwise unable to reimburse us, we may be unable to recover these funds. We may be unable to improve every facility that we acquire. In addition, operation of these facilities may divert management time and attention from other operations and priorities, negatively impact cash flows, result in adverse or unanticipated accounting charges, or otherwise damage other areas of our company if they are not timely and adequately improved.
We also incur regulatory risk in acquiring certain facilities due to the licensing, certification and other regulatory requirements affecting our right to operate the acquired facilities. For example, in order to acquire facilities on a predictable schedule, or to acquire declining operations quickly to prevent further pre-acquisition declines, we frequently acquire such facilities prior to receiving license approval or provider certification. We operate such facilities as the interim manager for the outgoing licensee, assuming financial responsibility, among other obligations for the facility. To the extent that we may be unable or delayed in obtaining a license, we may need to operate the facility under a management agreement from the prior operator. Any inability in obtaining consent from the prior operator of a target acquisition to utilizing its license in this manner could impact our ability to acquire additional facilities. If we were subsequently denied licensure or certification for any reason, we might not realize the expected benefits of the acquisition and would likely incur unanticipated costs and other challenges which could cause our business to suffer.
Termination of our patient admission agreements and the resulting vacancies in our affiliated facilities could cause revenue at our affiliated facilities to decline.
Most state regulations governing skilled nursing and assisted living facilities require written patient admission agreements with each patient. Several of these regulations also require that each patient have the right to terminate the patient agreement for any reason and without prior notice. Consistent with these regulations, all of our skilled nursing patient agreements allow patients to terminate their agreements without notice, and all of our assisted living resident agreements allow patients to terminate their agreements upon thirty days' notice. Patients and residents terminate their agreements from time to time for a variety of reasons, causing some fluctuations in our overall occupancy as patients and residents are admitted and discharged in normal course. If an unusual number of patients or residents elected to terminate their agreements within a short time, occupancy levels at our affiliated facilities could decline. As a result, beds may be unoccupied for a period of time, which would have a negative impact on our revenue, financial condition and results of operations.
We face significant competition from other healthcare providers and may not be successful in attracting patients and residents to our affiliated facilities.
The post-acute care industry is highly competitive, and we expect that our industry may become increasingly competitive in the future. Our affiliated skilled nursing facilities compete primarily on a local and regional basis with many long-term care providers, from national and regional multi-facility providers that have substantially greater financial resources to small providers who operate a single nursing facility. We also compete with other skilled nursing and assisted living facilities, and with inpatient
49
rehabilitation facilities, long-term acute care hospitals, home healthcare and other similar services and care alternatives. Increased competition could limit our ability to attract and retain patients, attract and retain skilled personnel, maintain or increase private pay and managed care rates or expand our business.
We may not be successful in attracting patients to our operating subsidiaries, particularly Medicare, managed care, and private pay patients who generally come to us at higher reimbursement rates. Some of our competitors have greater financial and other resources than us, may have greater brand recognition and may be more established in their respective communities than we are. Competing companies may also offer newer facilities or different programs or services than we do and may thereby attract current or potential patients. Other competitors may have lower expenses or other competitive advantages, and, therefore, present significant price competition for managed care and private pay patients. In addition, some of our competitors operate on a not-for-profit basis or as charitable organizations and have the ability to finance capital expenditures on a tax-exempt basis or through the receipt of charitable contributions, neither of which are available to us.
If we do not achieve and maintain competitive quality of care ratings from CMS and private organizations engaged in similar monitoring activities, or if the frequency of CMS surveys and enforcement sanctions increases, our business may be negatively affected.
CMS, as well as certain private organizations engaged in similar monitoring activities, provides comparative data available to the public on its web site, rating every skilled nursing facility operating in each state based upon quality-of-care indicators. These quality-of-care indicators include such measures as percentages of patients with infections, bedsores and unplanned weight loss. In addition, CMS has undertaken an initiative to increase Medicaid and Medicare survey and enforcement activities, to focus more survey and enforcement efforts on facilities with findings of substandard care or repeat violations of Medicaid and Medicare standards, and to require state agencies to use enforcement sanctions and remedies more promptly when substandard care or repeat violations are identified. We have found a correlation between negative Medicaid and Medicare surveys and the incidence of professional liability litigation. From time to time, we experience a higher than normal number of negative survey findings in some of our affiliated facilities.
In December 2008, CMS introduced the Five-Star Quality Rating System to help consumers, their families and caregivers compare nursing homes more easily. The Five-Star Quality Rating System gives each nursing home a rating of between one and five stars in various categories. In cases of acquisitions, the previous operator's clinical ratings are included in our overall Five-Star Quality Rating. The prior operator's results will impact our rating until we have sufficient clinical measurements subsequent to the acquisition date. If we are unable to achieve quality of care ratings that are comparable or superior to those of our competitors, our ability to attract and retain patients could be adversely affected.
On February 20, 2015, CMS modified the
Five Star Quality Rating System
for nursing homes to include the use of antipsychotics in calculating the star ratings, modified calculations for staffing levels and reflect higher standards for nursing homes to achieve a high rating on the quality measure dimension. On August 10, 2016, CMS modified the
Five Star Quality Rating System
for nursing homes to include five of the six new quality measures added April 27, 2016 to its consumer-based Nursing Home Compare website as part of an initiative to broaden the quality of information available on that site. They include the rate of rehospitalization, emergency room use, community discharge, improvements in function, and independently worsened ability to move. Since the standards for performance on quality measures are increasing, the number of our 4 and 5 star facilities could be reduced. In addition, CMS announced proposals to adopt new standards that home health agencies must comply with in order to participate in the Medicare program, including the strengthening of patient rights and communication requirements that focus on patient well-being.
If we are unable to obtain insurance, or if insurance becomes more costly for us to obtain, our business may be adversely affected.
It may become more difficult and costly for us to obtain coverage for resident care liabilities and other risks, including property and casualty insurance. For example, the following circumstances may adversely affect our ability to obtain insurance at favorable rates:
|
•
|
we experience higher-than-expected professional liability, property and casualty, or other types of claims or losses;
|
|
•
|
we receive survey deficiencies or citations of higher-than-normal scope or severity;
|
|
•
|
we acquire especially troubled operations or facilities that present unattractive risks to current or prospective insurers;
|
|
•
|
insurers tighten underwriting standards applicable to us or our industry; or
|
50
|
•
|
insurers or reinsurers are unable or unwilling to insure us or the industry at historical premiums and coverage levels.
|
If any of these potential circumstances were to occur, our insurance carriers may require us to significantly increase our self-insured retention levels or pay substantially higher premiums for the same or reduced coverage for insurance, including workers compensation, property and casualty, automobile, employment practices liability, directors and officers liability, employee healthcare and general and professional liability coverages.
In some states, the law prohibits or limits insurance coverage for the risk of punitive damages arising from professional liability and general liability claims or litigation. Coverage for punitive damages is also excluded under some insurance policies. As a result, we may be liable for punitive damage awards in these states that either are not covered or are in excess of our insurance policy limits. Claims against us, regardless of their merit or eventual outcome, also could inhibit our ability to attract patients or expand our business, and could require our management to devote time to matters unrelated to the day-to-day operation of our business.
With few exceptions, workers' compensation and employee health insurance costs have also increased markedly in recent years. To partially offset these increases, we have increased the amounts of our self-insured retention (SIR) and deductibles in connection with general and professional liability claims. We also have implemented a self-insurance program for workers compensation in all states, except Washington and Texas, and elected non-subscriber status for workers' compensation in Texas. In Washington, the insurance coverage is financed through premiums paid by the employers and employees. If we are unable to obtain insurance, or if insurance becomes more costly for us to obtain, or if the coverage levels we can economically obtain decline, our business may be adversely affected.
Our self-insurance programs may expose us to significant and unexpected costs and losses.
We have maintained general and professional liability insurance since 2002 and workers' compensation insurance since 2005 through a wholly-owned subsidiary insurance company, Standardbearer Insurance Company, Ltd. (Standardbearer), to insure our self-insurance reimbursements (SIR) and deductibles as part of a continually evolving overall risk management strategy. We establish the insurance loss reserves based on an estimation process that uses information obtained from both company-specific and industry data. The estimation process requires us to continuously monitor and evaluate the life cycle of the claims. Using data obtained from this monitoring and our assumptions about emerging trends, we, along with an independent actuary, develop information about the size of ultimate claims based on our historical experience and other available industry information. The most significant assumptions used in the estimation process include determining the trend in costs, the expected cost of claims incurred but not reported and the expected costs to settle or pay damages with respect to unpaid claims. It is possible, however, that the actual liabilities may exceed our estimates of loss. We may also experience an unexpectedly large number of successful claims or claims that result in costs or liability significantly in excess of our projections. For these and other reasons, our self-insurance reserves could prove to be inadequate, resulting in liabilities in excess of our available insurance and self-insurance. If a successful claim is made against us and it is not covered by our insurance or exceeds the insurance policy limits, our business may be negatively and materially impacted.
Further, because our SIR under our general and professional liability and workers compensation programs applies on a per claim basis, there is no limit to the maximum number of claims or the total amount for which we could incur liability in any policy period.
In May 2006, we began self-insuring our employee health benefits. With respect to our health benefits self-insurance, our reserves and premiums are computed based on a mix of company specific and general industry data that is not specific to our own company. Even with a combination of limited company-specific loss data and general industry data, our loss reserves are based on actuarial estimates that may not correlate to actual loss experience in the future. Therefore, our reserves may prove to be insufficient and we may be exposed to significant and unexpected losses.
The geographic concentration of our affiliated facilities could leave us vulnerable to an economic downturn, regulatory changes or acts of nature in those areas.
Our affiliated facilities located in Arizona, California, and Texas account for the majority of our total revenue. As a result of this concentration, the conditions of local economies, changes in governmental rules, regulations and reimbursement rates or criteria, changes in demographics, state funding, acts of nature and other factors that may result in a decrease in demand and/or reimbursement for skilled nursing services in these states could have a disproportionately adverse effect on our revenue, costs and results of operations. Moreover, since
22.9%
of our affiliated facilities are located in California, we are particularly susceptible to revenue loss, cost increase or damage caused by natural disasters such as fires, earthquakes or mudslides.
51
In addition, our affiliated facilities in Iowa, Nebraska, Kansas, South Carolina, Washington and Texas are more susceptible to revenue loss, cost increases or damage caused by natural disasters including hurricanes, tornadoes and flooding. These acts of nature may cause disruption to us, the employees of our operating subsidiaries and our affiliated facilities, which could have an adverse impact on the patients of our operating subsidiaries and our business. In order to provide care for the patients of our operating subsidiaries, we are dependent on consistent and reliable delivery of food, pharmaceuticals, utilities and other goods to our affiliated facilities, and the availability of employees to provide services at our affiliated facilities. If the delivery of goods or the ability of employees to reach our affiliated facilities were interrupted in any material respect due to a natural disaster or other reasons, it would have a significant impact on our affiliated facilities and our business. Furthermore, the impact, or impending threat, of a natural disaster may require that we evacuate one or more facilities, which would be costly and would involve risks, including potentially fatal risks, for the patients. The impact of disasters and similar events is inherently uncertain. Such events could harm the patients and employees of our operating subsidiaries, severely damage or destroy one or more of our affiliated facilities, harm our business, reputation and financial performance, or otherwise cause our business to suffer in ways that we currently cannot predict.
The actions of a national labor union that has pursued a negative publicity campaign criticizing our business in the past may adversely affect our revenue and our profitability.
We continue to maintain our right to inform the employees of our operating subsidiaries about our views of the potential impact of unionization upon the workplace generally and upon individual employees. With one exception, to our knowledge the staffs at our affiliated facilities that have been approached to unionize have uniformly rejected union organizing efforts. If employees decide to unionize, our cost of doing business could increase, and we could experience contract delays, difficulty in adapting to a changing regulatory and economic environment, cultural conflicts between unionized and non-unionized employees, strikes and work stoppages, and we may conclude that affected facilities or operations would be uneconomical to continue operating.
The unwillingness on the part of both our management and staff to accede to union demands for “neutrality” and other concessions has resulted in a negative labor campaign by at least one labor union, the Service Employees International Union. From 2002 to 2007, this union, and individuals and organizations allied with or sympathetic to this union actively prosecuted a negative retaliatory publicity action, also known as a “corporate campaign,” against us and filed, promoted or participated in multiple legal actions against us. The union's campaign asserted, among other allegations, poor treatment of patients, inferior clinical services provided by the employees of our operating subsidiaries, poor treatment of the employees of our operating subsidiaries, and health code violations by our operating subsidiaries. In addition, the union has publicly mischaracterized actions taken by the DHS against us and our affiliated facilities. In numerous cases, the union's allegations created the false impression that violations and other events that occurred at facilities prior to our acquisition of those facilities were caused by us. Since a large component of our business involves acquiring underperforming and distressed facilities, and improving the quality of operations at these facilities, we may have been associated with the past poor performance of these facilities. To the extent this union or another elects to directly or indirectly prosecute a corporate campaign against us or any of our affiliated facilities, our business could be negatively affected.
The Service Employees International Union has issued in the past, and may again issue in the future, public statements alleging that we or other for-profit skilled nursing operators have engaged in unfair, questionable or illegal practices in various areas, including staffing, patient care, patient evaluation and treatment, billing and other areas and activities related to the industry and our operating subsidiaries. We continue to anticipate similar criticisms, charges and other negative publicity from such sources on a regular basis, particularly in the current political environment and following the December 2010 OIG report entitled “Questionable Billing by Skilled Nursing Facilities," described above in "
The Office of the Inspector General or other organizations may choose to more closely scrutinize the billing practices of for-profit skilled nursing facilities, which could result in an increase in regulatory monitoring and oversight, decreased reimbursement rates, or otherwise adversely affect our business, financial condition and results of operations
." Two of our affiliated facilities have been listed on the report. Such reports provide unions and their allies with additional opportunities to make negative statements about, and to encourage regulators to seek investigatory and enforcement actions against, the industry in general and non-union operators like us specifically. Although we believe that our operations and business practices substantially conform to applicable laws and regulations, we cannot predict the extent to which we might be subject to adverse publicity or calls for increased regulatory scrutiny from union and union ally sources, or what effect, if any, such negative publicity would have on us, but to the extent they are successful, our revenue may be reduced, our costs may be increased and our profitability and business could be adversely affected.
This union has also in the past attempted to pressure hospitals, doctors, insurers and other healthcare providers and professionals to cease doing business with or referring patients to us. If this union or another union is successful in convincing the patients of our operating subsidiaries, their families or our referral sources to reduce or cease doing business with us, our revenue may be reduced and our profitability could be adversely affected. Additionally, if we are unable to attract and retain
52
qualified staff due to negative public relations efforts by this or other union organizations, our quality of service and our revenue and profits could decline. Our strategy for responding to union allegations involves clear public disclosure of the union's identity, activities and agenda, and rebuttals to its negative campaign.
Our ability to respond to unions, however, may be limited by some state laws, which purport to make it illegal for any recipient of state funds to promote or deter union organizing. For example, such a state law passed by the California Legislature was successfully challenged on the grounds that it was preempted by the National Labor Relations Act, only to have the challenge overturned by the Ninth Circuit in 2006 before being ultimately upheld by the United States Supreme Court in 2008. In addition, proposed legislation making it more difficult for employees and their supervisors to educate co-workers and oppose unionization, such as the proposed Employee Free Choice Act which would allow organizing on a single “card check” and without a secret ballot and similar changes to federal law, regulation and labor practice being advocated by unions and considered by Congress and the National Labor Relations Board, could make it more difficult to maintain union-free workplaces in our affiliated facilities. Further, the expedited election rules adopted by the National Labor Relations Board took effect on April 14, 2015 and make it far easier for unions to organize employees. These and similar laws have the potential to facilitate unionization procedures or hinder employer responses thereto, which may hinder our ability to oppose unionization efforts and negatively affect our business.
Because we lease substantially all of our affiliated facilities, we could experience risks associated with leased property, including risks relating to lease termination, lease extensions and special charges, which could adversely affect our business, financial position or results of operations.
As of
December 31, 2016
, we leased
160
of our
210
affiliated facilities. Most of our leases are triple-net leases, which means that, in addition to rent, we are required to pay for the costs related to the property (including property taxes, insurance, and maintenance and repair costs). We are responsible for paying these costs notwithstanding the fact that some of the benefits associated with paying these costs accrue to the landlords as owners of the associated facilities.
Each lease provides that the landlord may terminate the lease for a number of reasons, including, subject to applicable cure periods, the default in any payment of rent, taxes or other payment obligations or the breach of any other covenant or agreement in the lease. Termination of a lease could result in a default under our debt agreements and could adversely affect our business, financial position or results of operations. There can be no assurance that we will be able to comply with all of our obligations under the leases in the future.
In addition, if some of our leased affiliated facilities should prove to be unprofitable, we could remain obligated for lease payments and other obligations under the leases even if we decided to withdraw from those locations. We could incur special charges relating to the closing of such facilities including lease termination costs, impairment charges and other special charges that would reduce our net income and could adversely affect our business, financial condition and results of operations.
Failure to generate sufficient cash flow to cover required payments or meet operating covenants under our long-term debt, mortgages and long-term operating leases could result in defaults under such agreements and cross-defaults under other debt, mortgage or operating lease arrangements, which could harm our operating subsidiaries and cause us to lose facilities or experience foreclosures.
We maintain a revolving credit facility with a lending consortium. As of
December 31, 2016
, our operating subsidiaries had
$270.1
million outstanding under our credit facility. On February 5, 2016, we amended our existing revolving credit facility to increase our aggregate principal amount available to
$250.0
million. On July 19, 2016, we entered into the Second Amended Credit Facility to increase the aggregate principal amount up to
$450.0
million comprised of a
$300.0
million revolving credit facility and a
$150.0
million term loan. We also had other outstanding indebtedness of approximately
$14.0 million
as of
December 31, 2016
under HUD-insured loans and promissory note issued in connection with various acquisitions with maturity dates ranging from 2027 through 2045.
In addition, we had
$1.8 billion
of future operating lease obligations as of
December 31, 2016
. We intend to continue financing our operating subsidiaries through mortgage financing, long-term operating leases and other types of financing, including borrowings under our lines of credit and future credit facilities we may obtain.
We may not generate sufficient cash flow from operations to cover required interest, principal and lease payments. In addition, our outstanding credit facilities and mortgage loans contain restrictive covenants and require us to maintain or satisfy specified coverage tests on a consolidated basis and on a facility or facilities basis. These restrictions and operating covenants include, among other things, requirements with respect to occupancy, debt service coverage, project yield, net leverage ratios, minimum interest coverage ratios and minimum asset coverage ratios. These restrictions may interfere with our ability to obtain additional
53
advances under existing credit facilities or to obtain new financing or to engage in other business activities, which may inhibit our ability to grow our business and increase revenue.
From time to time, the financial performance of one or more of our mortgaged facilities may not comply with the required operating covenants under the terms of the mortgage. Any non-payment, noncompliance or other default under our financing arrangements could, subject to cure provisions, cause the lender to foreclose upon the facility or facilities securing such indebtedness or, in the case of a lease, cause the lessor to terminate the lease, each with a consequent loss of revenue and asset value to us or a loss of property. Furthermore, in many cases, indebtedness is secured by both a mortgage on one or more facilities, and a guaranty by us. In the event of a default under one of these scenarios, the lender could avoid judicial procedures required to foreclose on real property by declaring all amounts outstanding under the guaranty immediately due and payable, and requiring us to fulfill our obligations to make such payments. If any of these scenarios were to occur, our financial condition would be adversely affected. For tax purposes, a foreclosure on any of our properties would be treated as a sale of the property for a price equal to the outstanding balance of the debt secured by the mortgage. If the outstanding balance of the debt secured by the mortgage exceeds our tax basis in the property, we would recognize taxable income on foreclosure, but would not receive any cash proceeds, which would negatively impact our earnings and cash position. Further, because our mortgages and operating leases generally contain cross-default and cross-collateralization provisions, a default by us related to one facility could affect a significant number of other facilities and their corresponding financing arrangements and operating leases.
Because our term loans, promissory notes, bonds, mortgages and lease obligations are fixed expenses and secured by specific assets, and because our revolving loan obligations are secured by virtually all of our assets, if reimbursement rates, patient acuity mix or occupancy levels decline, or if for any reason we are unable to meet our loan or lease obligations, we may not be able to cover our costs and some or all of our assets may become at risk. Our ability to make payments of principal and interest on our indebtedness and to make lease payments on our operating leases depends upon our future performance, which will be subject to general economic conditions, industry cycles and financial, business and other factors affecting our operating subsidiaries, many of which are beyond our control. If we are unable to generate sufficient cash flow from operations in the future to service our debt or to make lease payments on our operating leases, we may be required, among other things, to seek additional financing in the debt or equity markets, refinance or restructure all or a portion of our indebtedness, sell selected assets, reduce or delay planned capital expenditures or delay or abandon desirable acquisitions. Such measures might not be sufficient to enable us to service our debt or to make lease payments on our operating leases. The failure to make required payments on our debt or operating leases or the delay or abandonment of our planned growth strategy could result in an adverse effect on our future ability to generate revenue and sustain profitability. In addition, any such financing, refinancing or sale of assets might not be available on terms that are economically favorable to us, or at all.
If we decide to expand our presence in the assisted living, home health or hospice industries, we would become subject to risks in a market in which we have limited experience.
The majority of our affiliated facilities have historically been skilled nursing facilities. If we decide to expand our presence in the assisted living, home health and hospice industries or other relevant healthcare service, our existing overall business model would change and we would become subject to risks in a market in which we have limited experience. Although assisted living operating subsidiaries generally have lower costs and higher margins than skilled nursing, they typically generate lower overall revenue than skilled nursing operating subsidiaries. In addition, assisted living revenue is derived primarily from private payors as opposed to government reimbursement. In most states, skilled nursing, assisted living, home health and hospice care are regulated by different agencies, and we have less experience with the agencies that regulate assisted living, home health and hospice care. In general, we believe that assisted living is a more competitive industry than skilled nursing. If we decided to expand our presence in the assisted living, home health and hospice and urgent care, we might have to adjust part of our existing business model, which could have an adverse effect on our business.
If our referral sources fail to view us as an attractive skilled nursing provider, or if our referral sources otherwise refer fewer patients, our patient base may decrease.
We rely significantly on appropriate referrals from physicians, hospitals and other healthcare providers in the communities in which we deliver our services to attract appropriate residents and patients to our affiliated facilities. Our referral sources are not obligated to refer business to us and may refer business to other healthcare providers. We believe many of our referral sources refer business to us as a result of the quality of our patient care and our efforts to establish and build a relationship with our referral sources. If we lose, or fail to maintain, existing relationships with our referral resources, fail to develop new relationships, or if we are perceived by our referral sources as not providing high quality patient care, our occupancy rate and the quality of our patient mix could suffer. In addition, if any of our referral sources have a reduction in patients whom they can refer due to a decrease in their business, our occupancy rate and the quality of our patient mix could suffer.
54
Our systems are subject to security breaches and other cybersecurity incidents.
Our business is dependent on the proper functioning and availability of our computer systems and networks. While we have taken steps to protect the safety and security of our information systems and the patient health information and other data maintained within those systems, we cannot assure you that our safety and security measures and disaster recovery plan will prevent damage, interruption or breach of our information systems and operations. Because the techniques used to obtain unauthorized access, disable or degrade service, or sabotage systems change frequently and may be difficult to detect, we may be unable to anticipate these techniques or implement adequate preventive measures. In addition, hardware, software or applications we develop or procure from third parties may contain defects in design or manufacture or other problems that could unexpectedly compromise the security of our information systems. Unauthorized parties may attempt to gain access to our systems or facilities, or those of third parties with whom we do business, through fraud or other forms of deceiving our employees or contractors.
On occasion, we have acquired additional information systems through our business acquisitions. We have upgraded and expanded our information system capabilities and have committed significant resources to maintain, protect, enhance existing systems and develop new systems to keep pace with continuing changes in technology, evolving industry and regulatory standards, and changing customer preferences.
We license certain third party software to support our operations and information systems. Our inability, or the inability of third party software providers, to continue to maintain and upgrade our information systems and software could disrupt or reduce the efficiency of our operations. In addition, costs and potential problems and interruptions associated with the implementation of new or upgraded systems and technology or with maintenance or adequate support of existing systems also could disrupt or reduce the efficiency of our operations.
A cyber security attack or other incident that bypasses our information systems security could cause a security breach which may lead to a material disruption to our information systems infrastructure or business and may involve a significant loss of business or patient health information. If a cyber security attack or other unauthorized attempt to access our systems or facilities were to be successful, it could result in the theft, destructions, loss, misappropriation or release of confidential information or intellectual property, and could cause operational or business delays that may materially impact our ability to provide various healthcare services. Any successful cyber security attack or other unauthorized attempt to access our systems or facilities also could result in negative publicity which could damage our reputation or brand with our patients, referral sources, payors or other third parties and could subject us to substantial penalties under HIPAA and other federal and state privacy laws, in addition to private litigation with those affected.
Failure to maintain the security and functionality of our information systems and related software, or a failure to defend a cyber security attack or other attempt to gain unauthorized access to our systems, facilities or patient health information could expose us to a number of adverse consequences, the vast majority of which are not insurable, including but not limited to disruptions in our operations, regulatory and other civil and criminal penalties, fines, investigations and enforcement actions (including, but not limited to, those arising from the SEC, Federal Trade Commission, the OIG or state attorneys general), fines, private litigation with those affected by the data breach, loss of customers, disputes with payors and increased operating expense, which either individually or in the aggregate could have a material adverse effect on our business, financial position, results of operations and liquidity.
We may need additional capital to fund our operating subsidiaries and finance our growth, and we may not be able to obtain it on terms acceptable to us, or at all, which may limit our ability to grow.
Our ability to maintain and enhance our operating subsidiaries and equipment in a suitable condition to meet regulatory standards, operate efficiently and remain competitive in our markets requires us to commit substantial resources to continued investment in our affiliated facilities and equipment. We are sometimes more aggressive than our competitors in capital spending to address issues that arise in connection with aging and obsolete facilities and equipment. In addition, continued expansion of our business through the acquisition of existing facilities, expansion of our existing facilities and construction of new facilities may require additional capital, particularly if we were to accelerate our acquisition and expansion plans. Financing may not be available to us or may be available to us only on terms that are not favorable. In addition, some of our outstanding indebtedness and long-term leases restrict, among other things, our ability to incur additional debt. If we are unable to raise additional funds or obtain additional funds on terms acceptable to us, we may have to delay or abandon some or all of our growth strategies. Further, if additional funds are raised through the issuance of additional equity securities, the percentage ownership of our stockholders would be diluted. Any newly issued equity securities may have rights, preferences or privileges senior to those of our common stock.
55
The condition of the financial markets, including volatility and deterioration in the capital and credit markets, could limit the availability of debt and equity financing sources to fund the capital and liquidity requirements of our business, as well as, negatively impact or impair the value of our current portfolio of cash, cash equivalents and investments, including U.S. Treasury securities and U.S.-backed investments.
Financial markets experienced significant disruptions from 2008 through 2010. These disruptions impacted liquidity in the debt markets, making financing terms for borrowers less attractive and, in certain cases, significantly reducing the availability of certain types of debt financing. As a result of these market conditions, the cost and availability of credit has been and may continue to be adversely affected by illiquid credit markets and wider credit spreads. Concern about the stability of the markets has led many lenders and institutional investors to reduce, and in some cases, cease to provide credit to borrowers.
Further, our cash, cash equivalents and investments are held in a variety of interest-bearing instruments, including U.S. treasury securities. As a result of the uncertain domestic and global political, credit and financial market conditions, investments in these types of financial instruments pose risks arising from liquidity and credit concerns. Given that future deterioration in the U.S. and global credit and financial markets is a possibility, no assurance can be made that losses or significant deterioration in the fair value of our cash, cash equivalents, or investments will not occur. Uncertainty surrounding the trading market for U.S. government securities or impairment of the U.S. government's ability to satisfy its obligations under such treasury securities could impact the liquidity or valuation of our current portfolio of cash, cash equivalents, and investments, a substantial portion of which were invested in U.S. treasury securities. Further, unless and until the current U.S. and global political, credit and financial market crisis has been sufficiently resolved, it may be difficult for us to liquidate our investments prior to their maturity without incurring a loss, which would have a material adverse effect on our consolidated financial position, results of operations or cash flows.
Though we anticipate that the cash amounts generated internally, together with amounts available under the revolving credit facility portion of the Credit Facility, will be sufficient to implement our business plan for the foreseeable future, we may need additional capital if a substantial acquisition or other growth opportunity becomes available or if unexpected events occur or opportunities arise. We cannot assure you that additional capital will be available or available on terms favorable to us. If capital is not available, we may not be able to fund internal or external business expansion or respond to competitive pressures or other market conditions.
Delays in reimbursement may cause liquidity problems.
If we experience problems with our billing information systems or if issues arise with Medicare, Medicaid or other payors, we may encounter delays in our payment cycle. From time to time, we have experienced such delays as a result of government payors instituting planned reimbursement delays for budget balancing purposes or as a result of prepayment reviews. For example, in January 2009, the State of California announced expected cash shortages in February which impacted payments to Medi-Cal providers from late March through April. Medi-Cal had also delayed the release of the reimbursement rates which were announced in January 2010. These rate increases were put in place on a retrospective basis, effective August 1, 2009.
Further, on March 24, 2011, the governor of California signed Assembly Bill 97 (AB 97), the budget trailer bill on health, into law. AB 97 outlines significant cuts to state health and human services programs. Specifically, the law reduced provider payments by 10% for physicians, pharmacies, clinics, medical transportation, certain hospitals, home health, and nursing facilities. AB X1 19 Long Term Care was subsequently approved by the governor on June 28, 2011. Federal approval was obtained on October 27, 2011. AB X1 19 limited the 10% payment reduction to skilled-nursing providers to 14 months for the services provided on June 1, 2011 through July 31, 2012. The 10% reduction in provider payments was repaid by December 31, 2012. There can be no assurance that similar delays or reductions in our payment cycle of provider payments will not lead to material adverse consequences in the future.
Compliance with the regulations of the Department of Housing and Urban Development may require us to make unanticipated expenditures which could increase our costs.
Two
of our affiliated facilities are currently subject to regulatory agreements with the Department of Housing and Urban Development (HUD) that give the Commissioner of HUD broad authority to require us to be replaced as the operator of those facilities in the event that the Commissioner determines there are operational deficiencies at such facilities under HUD regulations. In 2006, one of our HUD-insured mortgaged facilities did not pass its HUD inspection. Following an unsuccessful appeal of the decision, we requested a re-inspection. The re-inspection occurred in the fourth quarter of 2009 and the facility passed its HUD re-inspection. Compliance with HUD's requirements can often be difficult because these requirements are not always consistent with the requirements of other federal and state agencies. Appealing a failed inspection can be costly and time-consuming and, if we do not successfully remediate the failed inspection, we could be precluded from obtaining HUD financing in the future or we
56
may encounter limitations or prohibitions on our operation of HUD-insured facilities. This facility was transferred to CareTrust as part of the Spin-Off.
Failure to comply with existing environmental laws could result in increased expenditures, litigation and potential loss to our business and in our asset value.
Our operating subsidiaries are subject to regulations under various federal, state and local environmental laws, primarily those relating to the handling, storage, transportation, treatment and disposal of medical waste; the identification and warning of the presence of asbestos-containing materials in buildings, as well as the encapsulation or removal of such materials; and the presence of other substances in the indoor environment.
Our affiliated facilities generate infectious or other hazardous medical waste due to the illness or physical condition of the patients. Each of our affiliated facilities has an agreement with a waste management company for the proper disposal of all infectious medical waste, but the use of a waste management company does not immunize us from alleged violations of such laws for operating subsidiaries for which we are responsible even if carried out by a third party, nor does it immunize us from third-party claims for the cost to cleanup disposal sites at which such wastes have been disposed.
Some of the affiliated facilities we lease, own or may acquire may have asbestos-containing materials. Federal regulations require building owners and those exercising control over a building's management to identify and warn their employees and other employers operating in the building of potential hazards posed by workplace exposure to installed asbestos-containing materials and potential asbestos-containing materials in their buildings. Significant fines can be assessed for violation of these regulations. Building owners and those exercising control over a building's management may be subject to an increased risk of personal injury lawsuits. Federal, state and local laws and regulations also govern the removal, encapsulation, disturbance, handling and disposal of asbestos-containing materials and potential asbestos-containing materials when such materials are in poor condition or in the event of construction, remodeling, renovation or demolition of a building. Such laws may impose liability for improper handling or a release into the environment of asbestos containing materials and potential asbestos-containing materials and may provide for fines to, and for third parties to seek recovery from, owners or operators of real properties for personal injury or improper work exposure associated with asbestos-containing materials and potential asbestos-containing materials. The presence of asbestos-containing materials, or the failure to properly dispose of or remediate such materials, also may adversely affect our ability to attract and retain patients and staff, to borrow when using such property as collateral or to make improvements to such property.
The presence of mold, lead-based paint, underground storage tanks, contaminants in drinking water, radon and/or other substances at any of the affiliated facilities we lease, own or may acquire may lead to the incurrence of costs for remediation, mitigation or the implementation of an operations and maintenance plan and may result in third party litigation for personal injury or property damage. Furthermore, in some circumstances, areas affected by mold may be unusable for periods of time for repairs, and even after successful remediation, the known prior presence of extensive mold could adversely affect the ability of a facility to retain or attract patients and staff and could adversely affect a facility's market value and ultimately could lead to the temporary or permanent closure of the facility.
If we fail to comply with applicable environmental laws, we would face increased expenditures in terms of fines and remediation of the underlying problems, potential litigation relating to exposure to such materials, and a potential decrease in value to our business and in the value of our underlying assets.
In addition, because environmental laws vary from state to state, expansion of our operating subsidiaries to states where we do not currently operate may subject us to additional restrictions in the manner in which we operate our affiliated facilities.
If we fail to safeguard the monies held in our patient trust funds, we will be required to reimburse such monies, and we may be subject to citations, fines and penalties.
Each of our affiliated facilities is required by federal law to maintain a patient trust fund to safeguard certain assets of their residents and patients. If any money held in a patient trust fund is misappropriated, we are required to reimburse the patient trust fund for the amount of money that was misappropriated. If any monies held in our patient trust funds are misappropriated in the future and are unrecoverable, we will be required to reimburse such monies, and we may be subject to citations, fines and penalties pursuant to federal and state laws.
We are a holding company with no operations and rely upon our multiple independent operating subsidiaries to provide us with the funds necessary to meet our financial obligations. Liabilities of any one or more of our subsidiaries could be imposed upon us or our other subsidiaries.
57
We are a holding company with no direct operating assets, employees or revenues. Each of our affiliated facilities is operated through a separate, wholly-owned, independent subsidiary, which has its own management, employees and assets. Our principal assets are the equity interests we directly or indirectly hold in our multiple operating and real estate holding subsidiaries. As a result, we are dependent upon distributions from our subsidiaries to generate the funds necessary to meet our financial obligations and pay dividends. Our subsidiaries are legally distinct from us and have no obligation to make funds available to us. The ability of our subsidiaries to make distributions to us will depend substantially on their respective operating results and will be subject to restrictions under, among other things, the laws of their jurisdiction of organization, which may limit the amount of funds available for distribution to investors or shareholders, agreements of those subsidiaries, the terms of our financing arrangements and the terms of any future financing arrangements of our subsidiaries.
Changes in federal and state income tax laws and regulations could adversely affect our provision for income taxes and estimated income tax liabilities.
We are subject to both state and federal income taxes. Our effective tax rate could be adversely affected by changes in the mix of earnings in states with different statutory tax rates, changes in the valuation of deferred tax assets and liabilities, changes in tax laws and regulations, changes in our interpretations of tax laws, including pending tax law changes. In addition, in certain cases more than one state in which we operate has indicated an intent to attempt to tax the same assets and activities, which could result in double taxation if successful. Unanticipated changes in our tax rates or exposure to additional income tax liabilities could affect our profitability.
We are subject to the continuous examination of our income tax returns by the Internal Revenue Service and other local, state and foreign tax authorities. We regularly assess the likelihood of outcomes resulting from these examinations to determine the adequacy of our estimated income tax liabilities. The outcomes from these continuous examinations could adversely affect our provision for income taxes and estimated income tax liabilities.
If the Spin-Off were to fail to qualify as a tax-free transaction for U.S. federal income tax purposes, we could be subject to significant tax liabilities and, in certain circumstances, we could be required to indemnify CareTrust for material taxes pursuant to indemnification obligations under the Tax Matters Agreement that we entered into with CareTrust.
We received a private letter ruling from the Internal Revenue Services (IRS), which provides substantially to the effect that, on the basis of certain facts presented and representations and assumptions set forth in the request submitted to the IRS, the Spin-Off will qualify as tax-free under Sections 368(a)(1)(D) and 355 of the Internal Revenue Code (the IRS Ruling). The IRS Ruling does not address certain requirements for tax-free treatment of the Spin-Off under Section 355 of the Code, and we received tax opinions from our tax advisor and counsel, substantially to the effect that, with respect to such requirements on which the IRS will not rule, such requirements have been satisfied. The IRS Ruling, and the tax opinions that we received from our tax advisor and counsel, rely on, among other things, certain facts, representations, assumptions and undertakings, including those relating to the past and future conduct of our and CareTrust’s businesses, and the IRS Ruling and the tax opinions would not be valid if such facts, representations, assumptions and undertakings were incorrect in any material respect. Notwithstanding the IRS Ruling and the tax opinions, the IRS could determine the Spin-Off should be treated as a taxable transaction for U.S. federal income tax purposes if it determines any of the facts, representations, assumptions or undertakings that were included in the request for the IRS Ruling are false or have been violated or if it disagrees with the conclusions in the opinions that are not covered by the IRS Ruling.
If the Spin-Off ultimately is determined to be taxable, we would recognize taxable gain in an amount equal to the excess, if any, of the fair market value of the shares of CareTrust common stock held by us on the distribution date over our tax basis in such shares. Such taxable gain and resulting tax liability would be substantial.
In addition, under the terms of the Tax Matters Agreement that we entered into with CareTrust in connection with the Spin-Off, we generally are responsible for any taxes imposed on CareTrust that arise from the failure of the Spin-Off to qualify as tax-free for U.S. federal income tax purposes, within the meaning of Sections 368(a)(1)(D) and 355 of the Code, to the extent such failure to qualify is attributable to certain actions, events or transactions relating to our stock, assets or business, or a breach of the relevant representations or any covenants made by us in the Tax Matters Agreement, the materials submitted to the IRS in connection with the request for the IRS Ruling or the representation letter provided in connection with the tax opinion relating to the Spin-Off. Our indemnification obligations to CareTrust and its subsidiaries, officers and directors are not limited by any maximum amount. If we are required to indemnify CareTrust under the circumstance set forth in the Tax Matters Agreement, we may be subject to substantial tax liabilities.
In connection with the Spin-Off, CareTrust will indemnify us and we will indemnify CareTrust for certain liabilities. There can be no assurance that the indemnities from CareTrust will be sufficient to insure us against the full amount of such liabilities, or that CareTrust’s ability to satisfy its indemnification obligation will not be impaired in the future.
58
Pursuant to the Separation and Distribution Agreement that we entered into with CareTrust in connection with the Spin-Off, the Tax Matters Agreement and other agreements we entered into in connection with the Spin-Off, CareTrust agreed to indemnify us for certain liabilities, and we agreed to indemnify CareTrust for certain liabilities. However, third parties might seek to hold us responsible for liabilities that CareTrust agreed to retain under these agreements, and there can be no assurance that CareTrust will be able to fully satisfy its indemnification obligations under these agreements. Moreover, even if we ultimately succeed in recovering from CareTrust any amounts for which we are held liable to a third party, we may be temporarily required to bear these losses while seeking recovery from CareTrust. In addition, indemnities that we may be required to provide to CareTrust could be significant and could adversely affect our business.
Risks Related to Ownership of our Common Stock
We may not be able to pay or maintain dividends and the failure to do so would adversely affect our stock price.
Our ability to pay and maintain cash dividends is based on many factors, including our ability to make and finance acquisitions, our ability to negotiate favorable lease and other contractual terms, anticipated operating cost levels, the level of demand for our beds, the rates we charge and actual results that may vary substantially from estimates. Some of the factors are beyond our control and a change in any such factor could affect our ability to pay or maintain dividends. In addition, the revolving credit facility portion of the Credit Facility restricts our ability to pay dividends to stockholders if we receive notice that we are in default under this agreement. The failure to pay or maintain dividends could adversely affect our stock price.
The market price and trading volume of our common stock may be volatile, which could result in rapid and substantial losses for our stockholders.
The market price of our common stock may be highly volatile and could be subject to wide fluctuations. In addition, the trading volume in our common stock may fluctuate and cause significant price variations to occur. We cannot assure you that the market price of our common stock will not fluctuate or decline significantly in the future. On some occasions in the past, when the market price of a stock has been volatile, holders of that stock have instituted securities class action litigation against the company that issued the stock. If any of our stockholders brought a lawsuit against us due to volatility in the market price of our common stock, we could incur substantial costs defending or settling the lawsuit. Such a lawsuit could also divert the time and attention of our management from our business.
Future offerings of debt or equity securities by us may adversely affect the market price of our common stock.
In February 2015, we completed a common stock offering, issuing approximately
5.5 million
shares at approximately
$20.50
per share and used a portion of the net proceeds of the offering to pay off outstanding amounts under our credit facility.
In the future, we may attempt to increase our capital resources by offering debt or additional equity securities, including commercial paper, medium-term notes, senior or subordinated notes, preferred shares or shares of our common stock. Upon liquidation, holders of our debt securities and preferred shares, and lenders with respect to other borrowings, would receive a distribution of our available assets prior to any distribution to the holders of our common stock. Additional equity offerings may dilute the economic and voting rights of our existing stockholders or reduce the market price of our common stock, or both. Because our decision to issue securities in any future offering will depend on market conditions and other factors beyond our control, we cannot predict or estimate the amount, timing or nature of our future offerings. Thus, holders of our common stock bear the risk of our future offerings reducing the market price of our common stock and diluting their shareholdings in us. We also intend to continue to actively pursue acquisitions of facilities and may issue shares of stock in connection with these acquisitions.
Any shares issued in connection with our acquisitions, the exercise of outstanding stock options or otherwise would dilute the holdings of the investors who purchase our shares.
Failure to maintain effective internal controls in accordance with Section 404 of the Sarbanes-Oxley Act could result in a restatement of our financial statements, cause investors to lose confidence in our financial statements and our company and have a material adverse effect on our business and stock price.
We produce our consolidated financial statements in accordance with the requirements of GAAP. Effective internal controls are necessary for us to provide reliable financial reports to help mitigate the risk of fraud and to operate successfully as a publicly traded company. As a public company, we are required to document and test our internal control procedures in order to satisfy the requirements of Section 404 of the Sarbanes-Oxley Act of 2002, or Section 404, which requires annual management assessments of the effectiveness of our internal controls over financial reporting.
59
Testing and maintaining internal controls can divert our management's attention from other matters that are important to our business. We may not be able to conclude on an ongoing basis that we have effective internal controls over financial reporting in accordance with Section 404 or our independent registered public accounting firm may not be able or willing to issue an unqualified report if we conclude that our internal controls over financial reporting are not effective. If either we are unable to conclude that we have effective internal controls over financial reporting or our independent registered public accounting firm is unable to provide us with an unqualified report as required by Section 404, investors could lose confidence in our reported financial information and our company, which could result in a decline in the market price of our common stock, and cause us to fail to meet our reporting obligations in the future, which in turn could impact our ability to raise additional financing if needed in the future.
Our amended and restated certificate of incorporation, amended and restated bylaws and Delaware law contain provisions that could discourage transactions resulting in a change in control, which may negatively affect the market price of our common stock.
Our amended and restated certificate of incorporation and our amended and restated bylaws contain provisions that may enable our Board of Directors to resist a change in control. These provisions may discourage, delay or prevent a change in the ownership of our company or a change in our management, even if doing so might be beneficial to our stockholders. In addition, these provisions could limit the price that investors would be willing to pay in the future for shares of our common stock. Such provisions set forth in our amended and restated certificate of incorporation or our amended and restated bylaws include:
|
•
|
our Board of Directors is authorized, without prior stockholder approval, to create and issue preferred stock, commonly referred to as “blank check” preferred stock, with rights senior to those of common stock;
|
|
•
|
advance notice requirements for stockholders to nominate individuals to serve on our Board of Directors or to submit proposals that can be acted upon at stockholder meetings;
|
|
•
|
our Board of Directors is classified so not all members of our board are elected at one time, which may make it more difficult for a person who acquires control of a majority of our outstanding voting stock to replace our directors;
|
|
•
|
stockholder action by written consent is limited;
|
|
•
|
special meetings of the stockholders are permitted to be called only by the chairman of our Board of Directors, our chief executive officer or by a majority of our Board of Directors;
|
|
•
|
stockholders are not permitted to cumulate their votes for the election of directors;
|
|
•
|
newly created directorships resulting from an increase in the authorized number of directors or vacancies on our Board of Directors are filled only by majority vote of the remaining directors;
|
|
•
|
our Board of Directors is expressly authorized to make, alter or repeal our bylaws; and
|
|
•
|
stockholders are permitted to amend our bylaws only upon receiving the affirmative vote of at least a majority of our outstanding common stock.
|
We are also subject to the anti-takeover provisions of Section 203 of the General Corporation Law of the State of Delaware. Under these provisions, if anyone becomes an “interested stockholder,” we may not enter into a “business combination” with that person for three years without special approval, which could discourage a third party from making a takeover offer and could delay or prevent a change of control. For purposes of Section 203, “interested stockholder” means, generally, someone owning more than 15% or more of our outstanding voting stock or an affiliate of ours that owned 15% or more of our outstanding voting stock during the past three years, subject to certain exceptions as described in Section 203.
These and other provisions in our amended and restated certificate of incorporation, amended and restated bylaws and Delaware law could discourage acquisition proposals and make it more difficult or expensive for stockholders or potential acquirers to obtain control of our Board of Directors or initiate actions that are opposed by our then-current Board of Directors, including delaying or impeding a merger, tender offer or proxy contest involving us. Any delay or prevention of a change of control transaction or changes in our Board of Directors could cause the market price of our common stock to decline.
60
Item 1B.
Unresolved Staff Comments
None.
Item 2.
Properties
Service Center.
We currently lease
29,829
square feet of office space in Mission Viejo, California for our Service Center pursuant to a lease that expires in August 2019. We have two options to extend our lease term at this location for an additional five-year term for each option. In 2015, we expanded our information technology department and entered into a lease of an office space of 4,972 square feet in Rancho Santa Margarita, California. The lease expires in July 31, 2019. We have two options to extend our lease term at this location for an additional five-year term for each option.
Facilities.
As of
December 31, 2016
, we operated
210
affiliated facilities in Arizona, California, Colorado, Idaho, Iowa, Kansas, Nebraska, Nevada, Oregon, South Carolina, Texas, Utah, Washington and Wisconsin, with the operational capacity to serve approximately
22,465
patients. As of
December 31, 2016
, we owned
50
of its
210
affiliated facilities and leased an additional
160
facilities through long-term lease arrangements, and had options to purchase
nine
of those
160
facilities. We currently do not manage any facilities for third parties, except on a short-term basis pending receipt of new operating licenses by our operating subsidiaries.
The following table provides summary information regarding the number of operational beds at our skilled nursing and assisted and independent living facilities at
December 31, 2016
:
|
CA
|
TX
|
AZ
|
WI
|
UT
|
CO
|
WA
|
ID
|
NE
|
KS
|
IA
|
SC
|
NV
|
Total
|
||||||||||||||||||||||||||||
|
Number of operational beds/units
|
|||||||||||||||||||||||||||||||||||||||||
|
Operational skilled nursing bed
|
4,152
|
|
|
5,306
|
|
|
3,013
|
|
|
138
|
|
|
1,503
|
|
|
572
|
|
|
841
|
|
|
432
|
|
|
413
|
|
|
542
|
|
|
294
|
|
|
426
|
|
|
92
|
|
17,724
|
|
|
|
Assisted and independent living units
|
735
|
|
|
334
|
|
|
1,250
|
|
|
680
|
|
|
106
|
|
|
282
|
|
|
98
|
|
|
273
|
|
|
301
|
|
|
148
|
|
|
31
|
|
|
—
|
|
|
212
|
|
4,450
|
|
|
|
Leased without a Purchase Agreement
|
3,823
|
|
5,001
|
|
3,702
|
|
—
|
|
1,248
|
|
570
|
|
735
|
|
453
|
|
367
|
|
140
|
|
325
|
|
—
|
|
304
|
|
16,668
|
|
|||||||||||||
|
Purchase Agreement or Leased with a Purchase Option
|
318
|
|
216
|
|
—
|
|
—
|
|
60
|
|
125
|
|
—
|
|
—
|
|
—
|
|
379
|
|
—
|
|
—
|
|
—
|
|
1,098
|
|
|||||||||||||
|
Owned
|
746
|
|
423
|
|
561
|
|
818
|
|
301
|
|
159
|
|
204
|
|
252
|
|
347
|
|
171
|
|
—
|
|
426
|
|
—
|
|
4,408
|
|
|||||||||||||
61
Home health and hospice agencies.
As of December 31, 2016, we had
39
home health, and home care hospice agencies in Arizona, California, Colorado, Idaho, Iowa, Oregon, Texas, Utah and Washington.
The following table provides summary information regarding the locations of our home health, home care and hospice agencies at December 31, 2016:
|
State
|
Home Health and Home Care Services
|
|
Hospice Services
|
|
|||
|
Arizona
|
2
|
|
3
|
|
|||
|
California
(1)
|
5
|
|
3
|
|
|||
|
Colorado
|
1
|
|
1
|
|
|||
|
Idaho
(1)
|
3
|
|
3
|
|
|||
|
Iowa
|
1
|
|
1
|
|
|||
|
Texas
|
2
|
|
3
|
|
|||
|
Oregon
|
1
|
|
1
|
|
|||
|
Utah
(1)
|
3
|
|
3
|
|
|||
|
Washington
(1)
|
2
|
|
1
|
|
|||
|
Total
|
20
|
|
19
|
|
|||
|
(1)
|
Including a home health and a hospice agency that are located in the same location
|
In 2016, we completed the sale of our urgent care centers for an aggregate sale price of
$41.5 million
. As a result of the sale, we recognized a pretax gain of
$19.2 million
, which is included in operating income. As of December 31, 2016, we no longer owned or operated urgent care centers.
Item 3.
Legal Proceedings
Regulatory Matters —
Laws and regulations governing Medicare and Medicaid programs are complex and subject to
interpretation. Compliance with such laws and regulations can be subject to future governmental review and interpretation and failure to comply can result in significant regulatory action including fines, penalties, and exclusion from certain governmental programs. We believe that we are in compliance in all material respects with all applicable laws and regulations.
Cost-Containment Measures —
Both government and private pay sources have instituted cost-containment measures designed to limit payments made to providers of healthcare services, and there can be no assurance that future measures designed to limit payments made to providers will not adversely affect us.
Indemnities —
From time to time, we enter into certain types of contracts that contingently require us to indemnify parties against third-party claims. These contracts primarily include (i) certain real estate leases, under which we may be required to indemnify property owners or prior facility operators for post-transfer environmental or other liabilities and other claims arising from our use of the applicable premises, (ii) operations transfer agreements, in which we agree to indemnify past operators of facilities we acquire against certain liabilities arising from the transfer of the operation and/or the operation thereof after the transfer, (iii) certain lending agreements, under which we may be required to indemnify the lender against various claims and liabilities, and (iv) certain agreements with our officers, directors and employees, under which we may be required to indemnify such persons for liabilities arising out of their employment relationships. The terms of such obligations vary by contract and, in most instances, a specific or maximum dollar amount is not explicitly stated therein. Generally, amounts under these contracts cannot be reasonably estimated until a specific claim is asserted. Consequently, because no claims have been asserted, no liabilities have been recorded for these obligations on our balance sheets for any of the periods presented.
Litigation —
We are party to various legal actions and administrative proceedings and are subject to various claims arising in the ordinary course of business, including claims that services provided to patients have resulted in injury or death and claims related to employment and commercial matters. Although we intend to vigorously defend ourselves in response to these claims, there can be no assurance that the outcomes of these matters will not have a material adverse effect on our results of operations and financial condition. In certain states in which we have or have had operations, insurance coverage for the risk of punitive damages arising from general and professional liability litigation may not be available due to state law public policy prohibitions. There can be no assurance that we will not be liable for punitive damages awarded in litigation arising in states for which punitive damage insurance coverage is not available.
62
The skilled nursing and post-acute care industry is extremely regulated. As such, in the ordinary course of business, we are continuously subject to state and federal regulatory scrutiny, supervision and control. Such regulatory scrutiny often includes inquiries, investigations, examinations, audits, site visits and surveys, some of which are non-routine. In addition to being subject to direct regulatory oversight of state and federal regulatory agencies, the skilled nursing and post-acute care industry is also subject to regulatory requirements, which could subject us to civil, administrative or criminal fines, penalties or restitutionary relief, and reimbursement authorities could also seek the suspension or exclusion of the provider or individual from participation in their program. We believe that there has been, and will continue to be, an increase in governmental investigations of long-term care providers, particularly in the area of Medicare/Medicaid false claims, as well as an increase in enforcement actions resulting from these investigations. Adverse determinations in legal proceedings or governmental investigations, whether currently asserted or arising in the future, could have a material adverse effect on our financial position, results of operations and cash flows.
In addition to the potential lawsuits and claims described above, we are also subject to potential lawsuits under the Federal False Claims Act and comparable state laws alleging submission of fraudulent claims for services to any healthcare program (such as Medicare) or payor. A violation may provide the basis for exclusion from federally-funded healthcare programs. Such exclusions could have a correlative negative impact on our financial performance. Some states, including California, Arizona and Texas, have enacted similar whistleblower and false claims laws and regulations. In addition, the Deficit Reduction Act of 2005 created incentives for states to enact anti-fraud legislation modeled on the Federal False Claims Act. As such, we could face increased scrutiny, potential liability and legal expenses and costs based on claims under state false claims acts in markets in which it does business.
In May 2009, Congress passed the Fraud Enforcement and Recovery Act (FERA) of 2009 which made significant changes to the Federal False Claims Act (FCA), expanding the types of activities subject to prosecution and whistleblower liability. Following changes by FERA, health care providers face significant penalties for the knowing retention of government overpayments, even if no false claim was involved. Health care providers can now be liable for knowingly and improperly avoiding or decreasing an obligation to pay money or property to the government. This includes the retention of any government overpayment. The government can argue, therefore, that a FCA violation can occur without any affirmative fraudulent action or statement, as long as it is knowingly improper. In addition, FERA extended protections against retaliation for whistleblowers, including protections not only for employees, but also contractors and agents. Thus, there is generally no need for an employment relationship in order to qualify for protection against retaliation for whistleblowing.
Healthcare litigation (including class action litigation) is common and is filed based upon a wide variety of claims and theories, and we are routinely subjected to varying types of claims. One particular type of suit arises from alleged violations of state-established minimum staffing requirements for skilled nursing facilities. Failure to meet these requirements can, among other things, jeopardize a facility's compliance with conditions of participation under certain state and federal healthcare programs; it may also subject the facility to a notice of deficiency, a citation, a civil money penalty, or litigation. These class-action “staffing” suits have the potential to result in large jury verdicts and settlements, and have become more prevalent in the wake of a previous substantial jury award against one of our competitors. We expect the plaintiffs' bar to continue to be aggressive in their pursuit of these staffing and similar claims.
A class action staffing suit was previously filed against us and certain of our California subsidiaries in the State of California, alleging, among other things, violations of certain Health and Safety Code provisions and a violation of the Consumer Legal Remedies Act at certain of our California affiliated facilities. In 2007, we settled this class action suit, and the settlement was approved by the affected class and the Court. A second such class action staffing suit was filed in Los Angeles in 2010 and was resolved in a settlement and Court approval in 2012. Neither of the referenced lawsuits or settlement had a material ongoing adverse effect on our business, financial condition or results of operations.
Other claims and suits, including class actions, continue to be filed against us and other companies in the industry. For example, we have been subjected to, and is currently involved in, class action litigation alleging violations of state and federal wage and hour law. If there were a significant increase in the number of these claims or an increase in amounts owing should plaintiffs be successful in their prosecution of these claims, this could materially adversely affect our business, financial condition, results of operations and cash flows.
We have in the past been subject to class action litigation involving claims of violations of various regulatory requirements. While we have been able to settle these claims without a material ongoing adverse effect on our business, future claims could be brought that may materially affect our business, financial condition and results of operations. Other claims and suits, including class actions, continue to be filed against us and other companies in the industry. By way of recent example, we defended a general/premise liability claim in San Luis Obispo, California, on behalf of an affiliated facility, involving an injury to a non-employee/contractor. We estimate that the settlement relative to this case will be approximately
$2.1 million
, which was recorded in the consolidated financial statements during the year ended
December 31, 2016
. Further, another one of the our independent operating
63
entities was sued on allegations of professional negligence, which the claim was recently settled. We estimated that the costs associated with the settlement of this second matter will be approximately
$2.8 million
, which was recorded in the consolidated financial statements during the year ended
December 31, 2016
. We do not expect that there will be any material ongoing adverse effect on our business, financial condition or results of operations in connection with the resolution of these matters.
Medicare Revenue Recoupments —
We are subject to reviews relating to Medicare services, billings and potential overpayments. During the year ended
December 31, 2016
,
eighteen
of our operating subsidiaries have been subject to probe reviews, both pre- and post-payment.
Twelve
of these reviews have successfully closed as of December 31, 2016. We anticipate that these probe reviews will increase in frequency in the future. If a facility fails a probe review and subsequent re-probes, the facility could then be subject to extended pre-pay review or extrapolation of the identified error rate to all billing in the same time period.
None of our operating subsidiaries are currently on extended prepayment review or subject to extrapolation, although that may occur in the future. As of
December 31, 2016
, we had
six
operating subsidiaries under probe review.
U.S. Government Inquiry —
In late 2006, we learned that we might be the subject of an on-going criminal and civil investigation by the DOJ. This was confirmed in March 2007. The investigation was prompted by a whistleblower complaint, and related primarily to claims submitted to the Medicare program for rehabilitation services provided at certain skilled nursing facilities in Southern California. We resolved and settled the matter for
$48.0 million
in 2013.
In October 2013, we executed a final settlement agreement with the Government and we remitted full payment of
$48.0 million
. In addition, we executed a corporate integrity agreement with the Office of Inspector General HHS as part of the resolution.
See additional description of our contingencies in Notes 16,
Debt
, 18,
Leases
and 20,
Commitments and Contingencies
in
Notes to Consolidated Financial Statements.
Item 4.
Mine Safety Disclosures
None.
PART II.
Item 5.
Market for Registrant's Common Equity, Related Stockholder Matters and Issuer Purchases of Equity Securities
All share and per share amounts presented reflect a two-for-one stock split effected in December 2015.
Market Information
Our common stock has been traded under the symbol “ENSG” on the NASDAQ Global Select Market since our initial public offering on November 8, 2007. Prior to that time, there was no public market for our common stock. The following table shows the high and low sale prices for the common stock as reported by the NASDAQ Global Select Market for the periods indicated:
|
|
High
|
|
Low
|
||||
|
Fiscal 2015
|
|||||||
|
First Quarter
|
$
|
24.00
|
|
$
|
20.21
|
|
|
|
Second Quarter
|
$
|
26.94
|
|
$
|
20.25
|
|
|
|
Third Quarter
|
$
|
27.04
|
|
$
|
20.99
|
|
|
|
Fourth Quarter
|
$
|
25.10
|
|
$
|
22.00
|
|
|
|
Fiscal 2016
|
|
|
|
|
|
||
|
First Quarter
|
$
|
23.20
|
|
$
|
17.60
|
|
|
|
Second Quarter
|
$
|
23.86
|
|
$
|
19.13
|
|
|
|
Third Quarter
|
$
|
22.10
|
|
$
|
17.87
|
|
|
|
Fourth Quarter
|
$
|
23.18
|
|
$
|
17.60
|
|
|
64
During fiscal 2016, we declared aggregate cash dividends of
$0.1625
per share of common stock, for a total of approximately
$8.3 million
. As of
February 3, 2017
, there were approximately
224
holders of record of our common stock.
Notwithstanding anything to the contrary set forth in any of our filings under the Securities Act or the Exchange Act that might incorporate future filings, including this Annual Report on Form 10-K, in whole or in part, the Stock Performance Graph and supporting data which follows shall not be deemed to be incorporated by reference into any such filings except to the extent that we specifically incorporate any such information into any such future filings.
The graph below shows the cumulative total stockholder return of an investment of $100 (and the reinvestment of any dividends thereafter) on December 31, 2011 in (i) our common stock, (ii) the Skilled Nursing Facilities Peer Group 1 and (iii) the NASDAQ Market Index. Our stock price performance shown in the graph below is not indicative of future stock price performance.
COMPARISON OF 60 MONTH CUMULATIVE TOTAL RETURN*
Among Ensign Group, the NASDAQ Composite Index
and a Peer Group
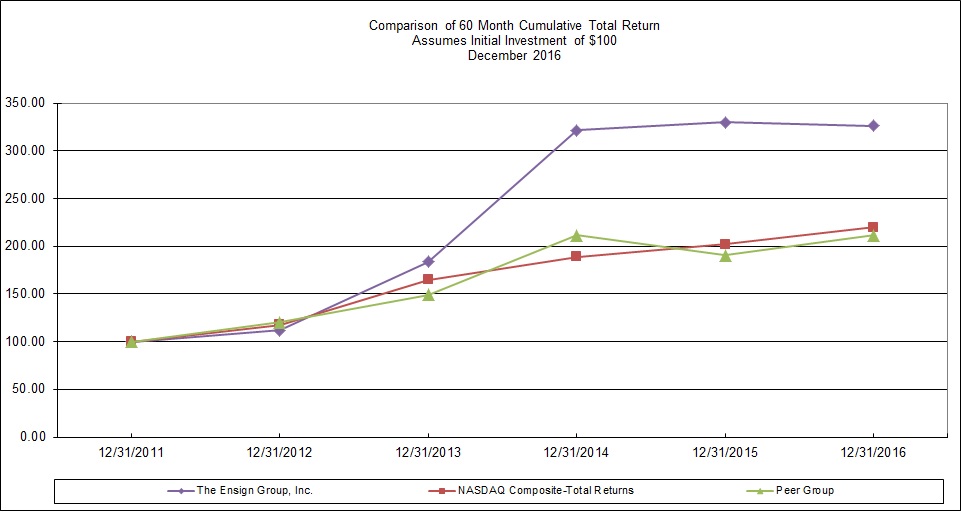
*$100 invested on 12/31/11 in stock in index, including reinvestment of dividends.
Fiscal year ending December 31.
|
December 31,
|
||||||||||||||||||
|
|
2011
|
2012
|
2013
|
2014
|
2015
|
2016
|
||||||||||||
|
The Ensign Group, Inc.
|
$
|
100.00
|
|
$
|
111.81
|
|
$
|
183.52
|
|
$
|
321.31
|
|
$
|
329.77
|
|
$
|
326.07
|
|
|
NASDAQ Market Index
|
$
|
100.00
|
|
$
|
117.45
|
|
$
|
164.57
|
|
$
|
188.84
|
|
$
|
201.98
|
|
$
|
219.89
|
|
|
Peer Group
|
$
|
100.00
|
|
$
|
119.99
|
|
$
|
149.19
|
|
$
|
211.16
|
|
$
|
190.53
|
|
$
|
211.67
|
|
The current composition of the Skilled Nursing Facilities Peer Group 1, SIC Code 8051 is as follows:
AdCare Health Systems, Inc., Diversicare Healthcare Services, Five Star Quality Care, Inc., National Healthcare Corporation, Genesis Healthcare, Inc., and The Ensign Group, Inc.
Dividend Policy
The following table summarizes common stock dividends declared to shareholders during the two most recent fiscal years:
65
|
|
Dividend per Share
|
|
Aggregate Dividend Declared
|
||||
|
|
(in thousands)
|
||||||
|
2015
|
|
|
|
|
|
||
|
First Quarter
|
$
|
0.0375
|
|
$
|
1,920
|
|
|
|
Second Quarter
|
$
|
0.0375
|
|
$
|
1,928
|
|
|
|
Third Quarter
|
$
|
0.0375
|
|
$
|
1,935
|
|
|
|
Fourth Quarter
|
$
|
0.0400
|
|
$
|
2,071
|
|
|
|
2016
|
|
|
|
|
|
||
|
First Quarter
|
$
|
0.0400
|
|
$
|
2,026
|
|
|
|
Second Quarter
|
$
|
0.0400
|
|
$
|
2,034
|
|
|
|
Third Quarter
|
$
|
0.0400
|
|
$
|
2,042
|
|
|
|
Fourth Quarter
|
$
|
0.0425
|
|
$
|
2,180
|
|
|
We do not have a formal dividend policy but we currently intend to continue to pay regular quarterly dividends to the holders of our common stock. From 2002 to 2016, we paid aggregate annual dividends equal to approximately
5%
to
18%
of our net income, after adjusting for the charge related to the U.S. Government inquiry settlement of
$33.0
million and
$15.0
million in fiscal years ended December 31, 2013 and 2012, respectively. However, future dividends will continue to be at the discretion of our board of directors, and we may or may not continue to pay dividends at such rate. We expect that the payment of dividends will depend on many factors, including our results of operations, financial condition and capital requirements, earnings, general business conditions, legal restrictions on the payment of dividends and other factors the Board of Directors deems relevant. A portion of the proceeds received from CareTrust in connection with the Spin-Off was used to pay dividend payments in 2015. See Note 23,
Spin-Off of Real Estate Assets Through a Real Estate Investment Trust
in the Notes to Consolidated Financial Statements for additional information.
The Credit Facility restricts our subsidiaries' and our ability to pay dividends to stockholders in excess of 20% of consolidated net income, or at all if we receive notice that we are in default under the facility. In addition, we are a holding company with no direct operating assets, employees or revenues. As a result, we are dependent upon distributions from our independent operating subsidiaries to generate the funds necessary to meet our financial obligations and pay dividends. It is possible that in certain quarters, we may pay dividends that exceed our net income for such period as calculated in accordance with GAAP.
Issuer Repurchases of Equity Securities
Common Stock Repurchase Program.
On November 4, 2015 and February 9, 2016, we announced that its Board of Directors authorized two stock repurchase programs, under which we may repurchase up to
$15.0 million
of our common stock under each program for a period of 12 months. Under these programs, we are authorized to repurchase our issued and outstanding common shares from time to time in open-market and privately negotiated transactions and block trades in accordance with federal securities laws. During the first quarter of 2016, we repurchased
1.5 million
shares of our common stock for a total of
$30.0 million
and the repurchase programs expired upon the repurchase of the full authorized amount under the plans.
66
Item 6.
Selected Financial Data
The financial data set forth below should be read in connection with Part II, Item 7.
Management's Discussion and Analysis of Financial Condition and Results of Operations
and with our consolidated financial statements and related notes thereto:
|
|
Year Ended December 31,
|
||||||||||||||||||
|
|
2016
|
2015
|
2014
|
2013
|
2012
|
||||||||||||||
|
|
(In thousands, except per share data)
|
||||||||||||||||||
|
Revenue
|
$
|
1,654,864
|
|
$
|
1,341,826
|
|
$
|
1,027,406
|
|
$
|
904,556
|
|
$
|
823,155
|
|
||||
|
Expense:
|
|||||||||||||||||||
|
Cost of services
|
1,341,814
|
|
1,067,694
|
|
822,669
|
|
725,989
|
|
656,424
|
|
|||||||||
|
Charge related to U.S. Government inquiry
|
—
|
|
—
|
|
—
|
|
33,000
|
|
15,000
|
|
|||||||||
|
Gain related to divestitures
|
(11,225
|
)
|
—
|
|
—
|
|
—
|
|
—
|
|
|||||||||
|
Rent - cost of services
|
124,581
|
|
88,776
|
|
48,488
|
|
13,613
|
|
13,281
|
|
|||||||||
|
General and administrative expense
|
69,165
|
|
64,163
|
|
56,895
|
|
40,103
|
|
31,819
|
|
|||||||||
|
Depreciation and amortization
|
38,682
|
|
28,111
|
|
26,430
|
|
33,909
|
|
28,358
|
|
|||||||||
|
Total expenses
|
1,563,017
|
|
1,248,744
|
|
954,482
|
|
846,614
|
|
|
744,882
|
|
||||||||
|
Income from operations
|
91,847
|
|
93,082
|
|
72,924
|
|
57,942
|
|
|
78,273
|
|
||||||||
|
Other income (expense):
|
|
|
|
|
|
|
|
|
|
|
|
||||||||
|
Interest expense
|
(7,136
|
)
|
(2,828
|
)
|
(12,976
|
)
|
(12,787
|
)
|
(12,229
|
)
|
|||||||||
|
Interest income
|
1,107
|
|
845
|
|
594
|
|
506
|
|
255
|
|
|||||||||
|
Other expense, net
|
(6,029
|
)
|
(1,983
|
)
|
(12,382
|
)
|
(12,281
|
)
|
(11,974
|
)
|
|||||||||
|
Income before provision for income taxes
|
85,818
|
|
91,099
|
|
60,542
|
|
45,661
|
|
66,299
|
|
|||||||||
|
Provision for income taxes
|
32,975
|
|
35,182
|
|
26,801
|
|
20,003
|
|
25,134
|
|
|||||||||
|
Income from continuing operations
|
52,843
|
|
55,917
|
|
33,741
|
|
25,658
|
|
41,165
|
|
|||||||||
|
Loss from discontinued operations
|
—
|
|
—
|
|
—
|
|
(1,804
|
)
|
(1,357
|
)
|
|||||||||
|
Net income
|
$
|
52,843
|
|
$
|
55,917
|
|
$
|
33,741
|
|
$
|
23,854
|
|
$
|
39,808
|
|
||||
|
Less: net income (loss) attributable to noncontrolling interests
|
2,853
|
|
485
|
|
(2,209
|
)
|
(186
|
)
|
(783
|
)
|
|||||||||
|
Net income attributable to The Ensign Group, Inc.
|
$
|
49,990
|
|
$
|
55,432
|
|
$
|
35,950
|
|
$
|
24,040
|
|
$
|
40,591
|
|
||||
|
Amounts attributable to The Ensign Group, Inc.:
|
|||||||||||||||||||
|
Income from continuing operations attributable to The Ensign Group, Inc.
|
$
|
49,990
|
|
$
|
55,432
|
|
$
|
35,950
|
|
$
|
25,844
|
|
$
|
41,948
|
|
||||
|
Loss from discontinued operations, net of income tax
|
—
|
|
—
|
|
—
|
|
(1,804
|
)
|
(1,357
|
)
|
|||||||||
|
Net income attributable to The Ensign Group, Inc.
|
$
|
49,990
|
|
$
|
55,432
|
|
$
|
35,950
|
|
$
|
24,040
|
|
$
|
40,591
|
|
||||
|
Net income per share
:
|
|
|
|
|
|
|
|
|
|
|
|||||||||
|
Basic:
|
|||||||||||||||||||
|
Income from continuing operations attributable to The Ensign Group, Inc.
|
$
|
0.99
|
|
$
|
1.10
|
|
$
|
0.80
|
|
$
|
0.59
|
|
$
|
0.98
|
|
||||
|
Loss from discontinued operations
(1)
|
—
|
|
—
|
|
—
|
|
(0.04
|
)
|
(0.03
|
)
|
|||||||||
|
Net income attributable to The Ensign Group, Inc.
|
$
|
0.99
|
|
$
|
1.10
|
|
$
|
0.80
|
|
$
|
0.55
|
|
$
|
0.95
|
|
||||
|
Diluted:
|
|||||||||||||||||||
|
Income from continuing operations attributable to The Ensign Group, Inc.
|
$
|
0.96
|
|
$
|
1.06
|
|
$
|
0.78
|
|
$
|
0.58
|
|
$
|
0.96
|
|
||||
|
Loss from discontinued operations
(1)
|
—
|
|
—
|
|
—
|
|
(0.04
|
)
|
(0.03
|
)
|
|||||||||
|
Net income attributable to The Ensign Group, Inc.
|
$
|
0.96
|
|
$
|
1.06
|
|
$
|
0.78
|
|
$
|
0.54
|
|
$
|
0.93
|
|
||||
|
Weighted average common shares outstanding
|
|
|
|
|
|
|
|
|
|
|
|||||||||
|
Basic
|
50,555
|
|
50,316
|
|
44,682
|
|
43,800
|
|
42,858
|
|
|||||||||
|
Diluted
|
52,133
|
|
52,210
|
|
46,190
|
|
44,728
|
|
43,884
|
|
|||||||||
|
(1)
On March 25, 2013, the Company agreed to terms to sell DRX, a national urgent care franchise system for approximately $8,000, adjusted for certain assets and liabilities. The asset sale was effective on April 15, 2013. The sale resulted in a pre-tax loss of $2,837 for the year ended December 31, 2013. The assets acquired at the initial purchase of DRX, including noncontrolling interest, were recorded at fair value. The initial fair value was greater than total cash paid to acquire all interests in DRX and the subsequent sale price. The sale of DRX has been accounted for as discontinued operations.
|
|||||||||||||||||||
67
|
December 31,
|
|||||||||||||||||||
|
|
2016
|
2015
|
2014
|
2013
|
2012
|
||||||||||||||
|
|
(In thousands, except per share data)
|
||||||||||||||||||
|
Consolidated Balance Sheet Data:
|
|
|
|
|
|
|
|
|
|
|
|
||||||||
|
Cash and cash equivalents
|
$
|
57,706
|
|
$
|
41,569
|
|
$
|
50,408
|
|
$
|
65,755
|
|
$
|
40,685
|
|
||||
|
Working capital
|
121,934
|
|
115,104
|
|
83,209
|
|
98,540
|
|
46,252
|
|
|||||||||
|
Total assets
|
1,001,025
|
|
747,759
|
|
493,916
|
|
716,315
|
|
690,862
|
|
|||||||||
|
Long-term debt, less current maturities
|
275,486
|
|
99,051
|
|
68,279
|
|
251,895
|
|
200,505
|
|
|||||||||
|
Equity
|
460,495
|
|
426,985
|
|
257,803
|
|
357,257
|
|
327,884
|
|
|||||||||
|
Cash dividends declared per common share
|
$
|
0.1625
|
|
$
|
0.1525
|
|
$
|
0.1425
|
|
$
|
0.1325
|
|
$
|
0.1225
|
|
||||
|
|
Year Ended December 31,
|
|||||||
|
|
2016
|
2015
|
2014
|
|||||
|
|
(In thousands)
|
|||||||
|
Other Non-GAAP Financial Data:
|
|
|
||||||
|
EBITDA
(1)
|
127,676
|
|
120,708
|
|
101,563
|
|
||
|
Adjusted EBITDA
(1)(2)
|
150,098
|
|
135,248
|
|
112,829
|
|
||
|
EBITDAR
(1)
|
252,257
|
|
209,484
|
|
150,051
|
|
||
|
Adjusted EBITDAR
(1)(2)
|
262,194
|
|
221,278
|
|
159,376
|
|
||
______________________
|
(1)
|
EBITDA, EBITDAR, Adjusted EBITDA and Adjusted EBITDAR are supplemental non-GAAP financial measures. Regulation G,
Conditions for Use of Non-GAAP Financial Measures
, and other provisions of the Exchange Act define and prescribe the conditions for use of certain non-GAAP financial information. We calculate EBITDA as net income from continuing operations, adjusted for net losses attributable to noncontrolling interest, before (a) interest expense, net, (b) provision for income taxes, and (c) depreciation and amortization. We calculate EBITDAR by adjusting EBITDA to exclude rent—cost of services. These non-GAAP financial measures are used in addition to and in conjunction with results presented in accordance with GAAP. These non-GAAP financial measures should not be relied upon to the exclusion of GAAP financial measures. These non-GAAP financial measures reflect an additional way of viewing aspects of our operations that, when viewed with our GAAP results and the accompanying reconciliations to corresponding GAAP financial measures, provide a more complete understanding of factors and trends affecting our business.
|
We believe EBITDA, Adjusted EBITDA, EBITDAR and Adjusted EBITDAR are useful to investors and other external users of our financial statements in evaluating our operating performance because:
|
•
|
they are widely used by investors and analysts in our industry as a supplemental measure to evaluate the overall operating performance of companies in our industry without regard to items such as interest expense, net and depreciation and amortization, which can vary substantially from company to company depending on the book value of assets, capital structure and the method by which assets were acquired; and
|
|
•
|
they help investors evaluate and compare the results of our operations from period to period by removing the impact of our capital structure and asset base from our operating results.
|
We use EBITDA, Adjusted EBITDA, EBITDAR and Adjusted EBITDAR:
|
•
|
as measurements of our operating performance to assist us in comparing our operating performance on a consistent basis;
|
|
•
|
to allocate resources to enhance the financial performance of our business;
|
|
•
|
to evaluate the effectiveness of our operational strategies; and
|
|
•
|
to compare our operating performance to that of our competitors.
|
We typically use EBITDA, Adjusted EBITDA, EBITDAR and Adjusted EBITDAR to compare the operating performance of each operation. EBITDA and EBITDAR are useful in this regard because they do not include such costs as net interest expense, income taxes, depreciation and amortization expense, and, with respect to EBITDAR, rent — cost of services, which may vary from period-to-period depending upon various factors, including the method used to finance operations, the amount of debt that we have incurred, whether an operation is owned or leased, the date of acquisition of a facility or business, and the tax law of the
68
state in which a business unit operates. As a result, we believe that the use of EBITDA and EBITDAR provide a meaningful and consistent comparison of our business between periods by eliminating certain items required by GAAP.
We also establish compensation programs and bonuses for our leaders that are partially based upon the achievement of Adjusted EBITDAR targets.
Despite the importance of these measures in analyzing our underlying business, designing incentive compensation and for our goal setting, EBITDA, Adjusted EBITDA, EBITDAR and Adjusted EBITDAR are non-GAAP financial measures that have no standardized meaning defined by GAAP. Therefore, our EBITDA, Adjusted EBITDA, EBITDAR and Adjusted EBITDAR measures have limitations as analytical tools, and they should not be considered in isolation, or as a substitute for analysis of our results as reported in accordance with GAAP. Some of these limitations are:
|
•
|
they do not reflect our current or future cash requirements for capital expenditures or contractual commitments;
|
|
•
|
they do not reflect changes in, or cash requirements for, our working capital needs;
|
|
•
|
they do not reflect the net interest expense, or the cash requirements necessary to service interest or principal payments, on our debt;
|
|
•
|
they do not reflect any income tax payments we may be required to make;
|
|
•
|
although depreciation and amortization are non-cash charges, the assets being depreciated and amortized will often have to be replaced in the future, and EBITDA and EBITDAR do not reflect any cash requirements for such replacements; and
|
|
•
|
other companies in our industry may calculate these measures differently than we do, which may limit their usefulness as comparative measures.
|
We compensate for these limitations by using them only to supplement net income on a basis prepared in accordance with GAAP in order to provide a more complete understanding of the factors and trends affecting our business.
Management strongly encourages investors to review our consolidated financial statements in their entirety and to not rely on any single financial measure. Because these non-GAAP financial measures are not standardized, it may not be possible to compare these financial measures with other companies’ non-GAAP financial measures having the same or similar names. For information about our financial results as reported in accordance with GAAP, see our consolidated financial statements and related notes included elsewhere in this document.
|
(2)
|
Adjusted EBITDA is EBITDA adjusted for non-core business items, which for the reported periods includes, to the extent applicable:
|
|
•
|
legal costs and charges in connection with the DOJ settlement;
|
|
•
|
gain on the sale of urgent care centers;
|
|
•
|
results related to a closed facility and a facility not at full operation, including continued obligations and closing expenses;
|
|
•
|
share-based compensation expense;
|
|
•
|
Spin-Off charges including results at three independent living facilities transferred to CareTrust in connection with the Spin-Off transaction;
|
|
•
|
costs incurred for facilities currently being constructed and other start-up operations;
|
|
•
|
insurance reserves in connection with the settlement of claims;
|
|
•
|
settlement of a class action lawsuit regarding minimum staffing requirements in the State of California;
|
|
•
|
impairment charges;
|
|
•
|
results at our urgent care centers (including the portion related to non-controlling interest);
|
|
•
|
acquisition-related costs;
|
|
•
|
costs incurred related to new systems implementation;
|
|
•
|
professional service fees including costs incurred to recognize income tax credits; and
|
|
•
|
breakup fee, net of costs, received in connection with a public auction in which we were the priority bidder
|
Adjusted EBITDAR is EBITDAR adjusted for the above noted non-core business items.
69
The table below reconciles net income to EBITDA, Adjusted EBITDA, EBITDAR and Adjusted EBITDAR for the periods presented:
|
Year Ended December 31,
|
|||||||||||||||||||
|
|
2016
|
2015
|
2014
|
2013
|
2012
|
||||||||||||||
|
|
(In thousands)
|
||||||||||||||||||
|
Consolidated statements of income data:
|
|
|
|||||||||||||||||
|
Net income
|
$
|
52,843
|
|
$
|
55,917
|
|
$
|
33,741
|
|
$
|
23,854
|
|
$
|
39,808
|
|
||||
|
Less: net income (loss) attributable to noncontrolling interests
|
2,853
|
|
485
|
|
(2,209
|
)
|
(186
|
)
|
(783
|
)
|
|||||||||
|
Loss from discontinued operations
|
—
|
|
—
|
|
—
|
|
1,804
|
|
1,357
|
|
|||||||||
|
Interest expense, net
|
6,029
|
|
1,983
|
|
12,382
|
|
12,281
|
|
11,974
|
|
|||||||||
|
Provision for income taxes
|
32,975
|
|
35,182
|
|
26,801
|
|
20,003
|
|
25,134
|
|
|||||||||
|
Depreciation and amortization
|
38,682
|
|
28,111
|
|
26,430
|
|
33,909
|
|
28,358
|
|
|||||||||
|
EBITDA
|
$
|
127,676
|
|
|
$
|
120,708
|
|
|
$
|
101,563
|
|
$
|
92,037
|
|
$
|
107,414
|
|
||
|
Facility rent—cost of services
|
124,581
|
|
88,776
|
|
48,488
|
|
13,613
|
|
13,281
|
|
|||||||||
|
EBITDAR
|
$
|
252,257
|
|
|
$
|
209,484
|
|
|
$
|
150,051
|
|
$
|
105,650
|
|
$
|
120,695
|
|
||
|
EBITDA
|
$
|
127,676
|
|
$
|
120,708
|
|
$
|
101,563
|
|
$
|
92,037
|
|
$
|
107,414
|
|
||||
|
Legal costs and charges related to the U.S. Government inquiry(a)
|
—
|
|
—
|
|
—
|
|
34,098
|
|
16,945
|
|
|||||||||
|
Gain on sale of urgent care centers(b)
|
(19,160
|
)
|
—
|
|
—
|
|
—
|
|
—
|
|
|||||||||
|
Results related to a closed facility and a facility not at full operation, including continued obligations and closing expenses(c)
|
8,705
|
|
—
|
|
—
|
|
—
|
|
—
|
|
|||||||||
|
Share-based compensation expense(d)
|
9,101
|
|
6,677
|
|
—
|
|
—
|
|
—
|
|
|||||||||
|
Spin-Off charges including results at three independent living facilities transferred to CareTrust(e)
|
—
|
|
—
|
|
8,904
|
|
4,050
|
|
—
|
|
|||||||||
|
Costs incurred for facilities currently being constructed and other start-up operations(f)
|
3,850
|
|
3,054
|
|
—
|
|
1,256
|
|
|||||||||||
|
Insurance reserve in connection with the settlement of claims(g)
|
4,924
|
|
—
|
|
—
|
|
—
|
|
—
|
|
|||||||||
|
Settlement of class action lawsuit(h)
|
—
|
|
—
|
|
—
|
|
1,524
|
|
2,596
|
|
|||||||||
|
Impairment of goodwill and other indefinite-lived intangibles(i)
|
—
|
|
—
|
|
—
|
|
490
|
|
2,225
|
|
|||||||||
|
Urgent care center losses (earnings)(j)
|
267
|
|
(1,132
|
)
|
(389
|
)
|
1,844
|
|
546
|
|
|||||||||
|
Acquisition related costs(k)
|
1,102
|
|
1,397
|
|
672
|
|
288
|
|
250
|
|
|||||||||
|
Costs incurred related to new systems implementation and professional service fee(l)
|
1,148
|
|
2,817
|
|
138
|
|
145
|
|
591
|
|
|||||||||
|
Breakup fee, net of costs, received in connection with a public auction(m)
|
—
|
|
(1,019
|
)
|
—
|
|
—
|
|
—
|
|
|||||||||
|
Rent related to items(c),(f) and (j) above
|
12,485
|
|
2,746
|
|
1,941
|
|
1,009
|
|
860
|
|
|||||||||
|
Adjusted EBITDA
|
$
|
150,098
|
|
|
$
|
135,248
|
|
|
$
|
112,829
|
|
$
|
136,741
|
|
$
|
131,427
|
|
||
|
Rent—cost of services
|
124,581
|
|
88,776
|
|
48,488
|
|
13,613
|
|
13,281
|
|
|||||||||
|
Less: rent related to items(c),(f) and (j) above
|
(12,485
|
)
|
(2,746
|
)
|
(1,941
|
)
|
(1,009
|
)
|
(860
|
)
|
|||||||||
|
Adjusted EBITDAR
|
$
|
262,194
|
|
|
$
|
221,278
|
|
|
$
|
159,376
|
|
$
|
149,345
|
|
$
|
143,848
|
|
||
|
(a)
|
Legal costs and charges incurred in connection with the settlement of the investigation into the billing and reimbursement processes of some of our operating subsidiaries conducted by the DOJ.
|
|
(b)
|
Gain recognized related to the sale of urgent care centers during the year ended December 31, 2016.
|
(c)
Results related to a closed facility and a facility not at full operation during year ended December 31, 2016, including the fair value of a continued obligation liability under the lease agreement and related closing expenses of
$7.9 million for the year ended December 31, 2016.
|
(d)
|
Share-based compensation expense incurred during the years ended December 31, 2016 and 2015
.
Adjusted EBITDA and EBITDAR for the years ended December 31, 2014, 2013, and 2012 did not include a non-GAAP adjustment related to share-based compensation expense of $5.2 million, $4.4 million and $4.7 million, respectively. If adjusted for share-based compensation expense, Adjusted EBITDA for the years ended December 31, 2014, 2013, and 2012 would have been $118.0 million, $141.1 million and $136.2 million, respectively, and Adjusted EBITDAR for the years ended December 31, 2014, 2013, and 2012 would have been $164.6 million, $153.7 million and $148.6 million, respectively.
|
|
(e)
|
Spin-Off charges including results at three independent living facilities transferred to CareTrust in connection with the Spin-Off transaction. The Company completed the Spin-Off in 2014; as such, these charges did not occur in 2012. In addition, the results during years ended December 31, 2013
|
70
and 2012 did not include rent expense from CareTrust subsequent to the Spin-Off. See Note 23,
Spin-Off of Real Estate Assets through a Real Estate Investment Trust
in the Notes to Consolidated Financial Statements.
|
(f)
|
Costs incurred for facilities currently being constructed and other start-up operations. This amount excludes rent, depreciation and interest expense.
|
(g) Insurance reserves in connection with the settlement of claims.
|
(h)
|
Settlement of a class action lawsuit regarding minimum staffing requirements in the State of California.
|
|
(i)
|
Impairment charges to goodwill for a skilled nursing facility in Utah during the year ended December 31, 2013 and a decline in the estimated fair value of redeemable noncontrolling interest of our urgent care franchising business during the year ended December 31, 2012.
|
(j)
Operating results at urgent care centers. This amount excludes rent, depreciation, interest expense and the net loss attributable to the variable interest entity associated with our urgent care business.
(k) Costs incurred to acquire operations which are not capitalizable.
|
(l)
|
Costs incurred related to new systems implementation; income tax credits which contributed to a decrease in the effective tax rate; and expenses incurred in connection with the stock-split effected in December 2015.
|
(m) Breakup fee, net of costs, received in connection with a public auction in which we were the priority bidder.
Item 7.
Management's Discussion and Analysis of Financial Condition and Results of Operations
The following discussion should be read in conjunction with the consolidated financial statements and accompanying notes, which appear elsewhere in this Annual Report. This discussion contains forward-looking statements that involve risks and uncertainties. Our actual results could differ materially from those anticipated in these forward-looking statements as a result of various factors, including those discussed below and elsewhere in this Annual Report.
See
Part I. Item 1A. Risk Factors
and
Cautionary Note Regarding Forward-Looking Statements.
Overview
We are a provider of health care services across the post-acute care continuum, as well as other ancillary businesses located in Arizona, California, Colorado, Idaho, Iowa, Kansas, Nebraska, Nevada, Oregon, South Carolina, Texas, Utah, Washington and Wisconsin. Our operating subsidiaries, each of which strives to be the service of choice in the community it serves, provide a broad spectrum of skilled nursing, assisted living, home health and hospice and other ancillary services. As of
December 31, 2016
, we offered skilled nursing, assisted living and rehabilitative care services through
210
skilled nursing and assisted living facilities across
13
states. Of the
210
facilities, we owned
50
and operated an additional
160
facilities under long-term lease arrangements, and had options to purchase
nine
of those
160
facilities. Our home health and hospice business provides home health, hospice and home care services from
39
agencies across
nine
states.
The following table summarizes our affiliated facilities and operational skilled nursing, assisted living and independent living beds by ownership status as of
December 31, 2016
:
|
Owned
|
Leased (with a Purchase Option)
|
Leased (without a Purchase Option)
|
Total
|
||||||||
|
Number of facilities
|
50
|
|
9
|
|
151
|
|
210
|
|
|||
|
Percentage of total
|
23.8
|
%
|
4.3
|
%
|
71.9
|
%
|
100.0
|
%
|
|||
|
Operational skilled nursing beds
|
2,857
|
|
830
|
|
14,037
|
|
17,724
|
|
|||
|
Percentage of total
|
16.1
|
%
|
4.7
|
%
|
79.2
|
%
|
100.0
|
%
|
|||
|
Assisted and independent living units
|
1,551
|
|
268
|
|
2,631
|
|
4,450
|
|
|||
|
Percentage of total
|
34.9
|
%
|
6.0
|
%
|
59.1
|
%
|
100.0
|
%
|
|||
Key Performance Indicators
We manage the fiscal aspects of our business by monitoring key performance indicators that affect our financial performance. These indicators and their definitions include the following:
Transitional and Skilled Services
|
•
|
Routine revenue.
Routine revenue is generated by the contracted daily rate charged for all contractually inclusive skilled nursing services. The inclusion of therapy and other ancillary treatments varies by payor source and by contract. Services provided outside of the routine contractual agreement are recorded separately as ancillary revenue, including Medicare Part B therapy services, and are not included in the routine revenue definition.
|
|
•
|
Skilled revenue.
The amount of routine revenue generated from patients in the skilled nursing facilities who are receiving higher levels of care under Medicare, managed care, Medicaid, or other skilled reimbursement programs. The other skilled patients that are included in this population represent very high acuity patients who are receiving high levels of nursing
|
71
and ancillary services which are reimbursed by payors other than Medicare or managed care. Skilled revenue excludes any revenue generated from our assisted living services.
|
•
|
Skilled mix.
The amount of our skilled revenue as a percentage of our total routine revenue. Skilled mix (in days) represents the number of days our Medicare, managed care, or other skilled patients are receiving services at the skilled nursing facilities divided by the total number of days patients (less days from assisted living services) from all payor sources are receiving services at the skilled nursing facilities for any given period (less days from assisted living services).
|
|
•
|
Quality mix.
The amount of routine non-Medicaid revenue as a percentage of our total routine revenue. Quality mix (in days) represents the number of days our non-Medicaid patients are receiving services at the skilled nursing facilities divided by the total number of days patients from all payor sources are receiving services at the skilled nursing facilities for any given period (less days from assisted living services).
|
|
•
|
Average daily rates.
The routine revenue by payor source for a period at the skilled nursing facilities divided by actual patient days for that revenue source for that given period.
|
|
•
|
Occupancy percentage (operational beds).
The total number of patients occupying a bed in a skilled nursing facility as a percentage of the beds in a facility which are available for occupancy during the measurement period.
|
|
•
|
Number of facilities and operational beds.
The total number of skilled nursing facilities that we own or operate and the total number of operational beds associated with these facilities.
|
Skilled and Quality Mix.
Like most skilled nursing providers, we measure both patient days and revenue by payor. Medicare, managed care and other skilled patients, whom we refer to as high acuity patients, typically require a higher level of skilled nursing and rehabilitative care. Accordingly, Medicare and managed care reimbursement rates are typically higher than from other payors. In most states, Medicaid reimbursement rates are generally the lowest of all payor types. Changes in the payor mix can significantly affect our revenue and profitability.
The following table summarizes our overall skilled mix and quality mix from our skilled nursing services for the periods indicated as a percentage of our total routine revenue (less revenue from assisted living services) and as a percentage of total patient days (less days from assisted living services):
|
Year Ended December 31,
|
||||||||
|
|
2016
|
2015
|
2014
|
|||||
|
Skilled Mix:
|
|
|||||||
|
Days
|
30.9
|
%
|
30.4
|
%
|
27.6
|
%
|
||
|
Revenue
|
52.5
|
%
|
52.6
|
%
|
50.8
|
%
|
||
|
Quality Mix:
|
||||||||
|
Days
|
43.4
|
%
|
42.5
|
%
|
40.7
|
%
|
||
|
Revenue
|
61.0
|
%
|
60.8
|
%
|
59.9
|
%
|
||
Occupancy.
We define occupancy derived from our transitional and skilled services as the ratio of actual patient days (one patient day equals one patient occupying one bed for one day) during any measurement period to the number of beds in facilities which are available for occupancy during the measurement period. The number of licensed beds in a skilled nursing facility that are actually operational and available for occupancy may be less than the total official licensed bed capacity. This sometimes occurs due to the permanent dedication of bed space to alternative purposes, such as enhanced therapy treatment space or other desirable uses calculated to improve service offerings and/or operational efficiencies in a facility. In some cases, three- and four-bed wards have been reduced to two-bed rooms for resident comfort, and larger wards have been reduced to conform to changes in Medicare requirements. These beds are seldom expected to be placed back into service. We believe that reporting occupancy based on operational beds is consistent with industry practices and provides a more useful measure of actual occupancy performance from period to period.
The following table summarizes our overall occupancy statistics for the periods indicated:
72
|
Year Ended December 31,
|
||||||||
|
|
2016
|
2015
|
2014
|
|||||
|
Occupancy for transitional and skilled services:
|
|
|||||||
|
Operational beds at end of period
|
17,724
|
|
14,925
|
|
12,379
|
|
||
|
Available patient days
|
6,125,902
|
|
4,991,886
|
|
4,275,558
|
|
||
|
Actual patient days
|
4,620,735
|
|
3,873,409
|
|
3,306,296
|
|
||
|
Occupancy percentage (based on operational beds)
|
75.4
|
%
|
77.6
|
%
|
77.3
|
%
|
||
Assisted and Independent Living Services
• Occupancy.
We define occupancy derived from our assisted and independent living services as the ratio of actual number of days our units are occupied during any measurement period to the number of units in facilities which are available for occupancy during the measurement period.
•
Average monthly revenue per unit
. The revenue for a period at an assisted and independent living facility divided by actual occupied units for that revenue source for that given period.
|
Year Ended December 31,
|
|||||||||||
|
|
2016
|
2015
|
2014
|
||||||||
|
Occupancy for assisted and independent living services:
|
|
||||||||||
|
Occupancy percentage (units)
|
76.0
|
%
|
|
75.3
|
%
|
77.3
|
%
|
||||
|
Average monthly revenue per unit
|
$
|
2,746
|
|
$
|
2,644
|
|
$
|
2,315
|
|
||
Home Health and Hospice
|
•
|
Medicare episodic admissions.
The total number of episodic admissions derived from patients who are receiving care under Medicare reimbursement programs.
|
|
•
|
Average Medicare revenue per completed episode.
The average amount of revenue for each completed 60-day episode generated from patients who are receiving care under Medicare reimbursement programs.
|
|
•
|
Average daily census.
The average number of patients who are receiving hospice care as a percentage of total number of patient days.
|
The following table summarizes our overall home health and hospice statistics for the periods indicated:
|
Year Ended December 31,
|
|||||||||||
|
|
2016
|
2015
|
2014
|
||||||||
|
Home health services:
|
|||||||||||
|
Average Medicare Revenue per Completed Episode
|
$
|
2,986
|
|
$
|
2,929
|
|
$
|
2,840
|
|
||
|
Hospice services:
|
|||||||||||
|
Average Daily Census
|
905
|
|
679
|
|
420
|
|
|||||
Segments
Beginning in the fourth quarter of 2016, we realigned our operating segments to more closely correlate with our service
offerings, which coincide with the way that we measure performance and allocate resources. We have three reportable segments: (1) transitional and skilled services, which includes the operation of skilled nursing facilities; (2) assisted and independent living services, which includes the operation of assisted and independent living facilities; and (3) home health and hospice services, which includes our home health, home care and hospice businesses. Our Chief Executive Officer, who is our chief operating decision maker, or CODM, reviews financial information at the operating segment level.
We also report an “all other” category that includes revenue from our mobile diagnostics and other ancillary operations. Our mobile diagnostics and other ancillary operations businesses are neither significant individually nor in aggregate and therefore do not constitute a reportable segment. Our reporting segments are business units that offer different services and that are managed separately to provide greater visibility into those operations. The expansion of our assisted and independent living services led us
73
to separate our assisted and independent living services into distinct reportable segment in the fourth quarter of 2016. Previously, we had two reportable segments; transitional, skilled and assisted living services (TSA services), which includes the operation of skilled nursing facilities and assisted living facilities; and (2) home health and hospice services. We have presented 2015 and 2014 financial information in this Annual Report on a comparative basis to conform with the current year segment presentation.
Revenue Sources
Transitional and Skilled Services
Within our skilled nursing operations, we generate our revenue from Medicaid, private pay, managed care and Medicare payors. We believe that our skilled mix, which we define as the number of days our Medicare, managed care and other skilled patients are receiving services at our skilled nursing operations divided by the total number of days patients are receiving services at our skilled nursing operations, from all payor sources (less days from assisted living and independent living services) for any given period, is an important indicator of our success in attracting high-acuity patients because it represents the percentage of our patients who are reimbursed by Medicare, managed care and other skilled payors, for whom we receive higher reimbursement rates.
We are participating in the established supplemental payment program in various states that provides supplemental Medicaid payments for skilled nursing facilities that are licensed to non-state government-owned entities such as county hospital districts. Several of our operating subsidiaries entered into transactions with several such hospital districts providing for the transfer of the licenses for those skilled nursing facilities to the hospital districts. Each affected operating subsidiary agreement between the hospital district and our subsidiary is terminable by either party to fully restore the prior license status.
Assisted and Independent Living Services.
Within our assisted and independent living operations, we generate revenue primarily from private pay sources, with a portion earned from Medicaid or other state-specific programs.
Home Health and Hospice Services
Home Health.
We provided home health care in Arizona, California, Colorado, Idaho, Iowa, Oregon, Texas, Utah and Washington as of
December 31, 2016
. We derive the majority of our revenue from our home health business from Medicare and managed care. The payment is adjusted for differences between estimated and actual payment amounts, an inability to obtain appropriate billing documentation or authorizations acceptable to the payor and other reasons unrelated to credit risk. The home health prospective payment system (PPS) provides home health agencies with payments for each 60-day episode of care for each beneficiary. If a beneficiary is still eligible for care after the end of the first episode, a second episode can begin. There are no limits to the number of episodes a beneficiary who remains eligible for the home health benefit can receive. While payment for each episode is adjusted to reflect the beneficiary’s health condition and needs, a special outlier provision exists to ensure appropriate payment for those beneficiaries that have the most expensive care needs. The payment under the Medicare program is also adjusted for certain variables including, but not limited to: (a) a low utilization payment adjustment if the number of visits was fewer than five; (b) a partial payment if the patient transferred to another provider or the Company received a patient from another provider before completing the episode; (c) a payment adjustment based upon the level of therapy services required; (d) the number of episodes of care provided to a patient, regardless of whether the same home health provider provided care for the entire series of episodes; (e) changes in the base episode payments established by the Medicare program; (f) adjustments to the base episode payments for case mix and geographic wages; and (g) recoveries of overpayments.
Hospice
. As of
December 31, 2016
, we provided hospice care in Arizona, California, Colorado, Idaho, Iowa, Oregon, Texas, Utah and Washington. We derive the majority of the revenue from our hospice business from Medicare reimbursement. The estimated payment rates are daily rates for each of the levels of care we deliver. The payment is adjusted for an inability to obtain appropriate billing documentation or authorizations acceptable to the payor and other reasons unrelated to credit risk. Additionally, as Medicare hospice revenue is subject to an inpatient cap limit and an overall payment cap, we monitor our provider numbers and estimate amounts due back to Medicare if a cap has been exceeded.
Beginning January 1, 2016, the Centers for Medicare & Medicaid Services (CMS) provided for two separate payment rates for routine care: payments for the first 60 days of care and care beyond 60 days. In addition to the two routine rates, Medicare is also reimbursing for a service intensity add-on (SIA). The SIA is based on visits made in the last seven days of life by a registered nurse (RN) or medical social worker (MSW) for patients in a routine level of care.
Other
74
We have historically operated urgent care clinics in Colorado and Washington. Our urgent care centers provided daily access to healthcare for minor injuries and illnesses, including x-ray and lab services, all from convenient neighborhood locations with no appointments. In 2016, we completed the sale of our urgent care centers for an aggregate purchase price of
$41.5 million
. As of
December 31, 2016
,
we held majority membership interests in our other ancillary operations. Payment for these services varies and is based upon the service provided. The payment is adjusted for an inability to obtain appropriate billing documentation or authorizations acceptable to the payor and other reasons unrelated to credit risk.
Primary Components of Expense
Cost of Services (exclusive of rent and depreciation and amortization shown separately).
Our cost of services represents the costs of operating our operating subsidiaries, which primarily consists of payroll and related benefits, supplies, purchased services, and ancillary expenses such as the cost of pharmacy and therapy services provided to patients. Cost of services also includes the cost of general and professional liability insurance and other general cost of services with respect to our operations.
Facility Rent - Cost of Services.
Rent - cost of services consists solely of base minimum rent amounts payable under lease agreements to third-party owners of the operating subsidiaries that we operate but do not own and does not include taxes, insurance, impounds, capital reserves or other charges payable under the applicable lease agreements.
General and Administrative Expense.
General and administrative expense consists primarily of payroll and related benefits and travel expenses for our Service Center personnel, including training and other operational support. General and administrative expense also includes professional fees (including accounting and legal fees), costs relating to our information systems, stock-based compensation and rent for our Service Center offices.
Depreciation and Amortization.
Property and equipment are recorded at their original historical cost. Depreciation is computed using the straight-line method over the estimated useful lives of the depreciable assets. The following is a summary of the depreciable lives of our depreciable assets:
|
Buildings and improvements
|
Minimum of three years to a maximum of 57 years, generally 45 years
|
|
Leasehold improvements
|
Shorter of the lease term or estimated useful life, generally 5 to 15 years
|
|
Furniture and equipment
|
3 to 10 years
|
Critical Accounting Policies
Our discussion and analysis of our financial condition and results of operations are based on our consolidated financial statements, which have been prepared in accordance with U.S. Generally Accepted Accounting Principles (GAAP). The preparation of these financial statements and related disclosures requires us to make judgments, estimates and assumptions that affect the reported amounts of assets and liabilities and disclosure of contingent assets and liabilities at the date of the financial statements and the reported amounts of revenue and expenses during the reporting period. On an ongoing basis we review our judgments and estimates, including but not limited to those related to doubtful accounts, income taxes, stock compensation, intangible assets and loss contingencies. We base our estimates and judgments upon our historical experience, knowledge of current conditions and our belief of what could occur in the future considering available information, including assumptions that we believe to be reasonable under the circumstances. By their nature, these estimates and judgments are subject to an inherent degree of uncertainty, and actual results could differ materially from the amounts reported. The following summarizes our critical accounting policies, defined as those policies that we believe: (a) are the most important to the portrayal of our financial condition and results of operations; and (b) require management's most subjective or complex judgments, often as a result of the need to make estimates about the effects of matters that are inherently uncertain.
Revenue Recognition
We recognize revenue when the following four conditions have been met: (i) there is persuasive evidence that an arrangement exists; (ii) delivery has occurred or service has been rendered; (iii) the price is fixed or determinable; and (iv) collection is reasonably assured. Our revenue is derived primarily from providing healthcare services to patients and is recognized on the date services are provided at amounts billable to individual patients. For patients under reimbursement arrangements with third-party payors, including Medicaid, Medicare and private insurers, revenue is recorded based on contractually agreed-upon amounts on a per patient basis.
Revenue from Medicare and Medicaid programs account for
67.8%
,
69.1%
, and
71.4%
of our consolidated total revenue for the years ended December 31, 2016, 2015 and 2014, respectively. We record revenue from these governmental and managed
75
care programs as services are performed at their expected net realizable amounts under these programs. Our revenue from governmental and managed care programs is subject to audit and retroactive adjustment by governmental and third-party agencies. Consistent with healthcare industry accounting practices, any changes to these governmental revenue estimates are recorded in the period the change or adjustment becomes known based on final settlement. We recorded adjustments upon settlement to revenue which were not material to our consolidated revenue for the years ended December 31, 2016, 2015 and 2014.
Our service specific revenue recognition policies are as follows:
Skilled Nursing Revenue
Our revenue is derived primarily from providing long-term healthcare services to patients and is recognized on the date services are provided at amounts billable to individual patients. For patients under reimbursement arrangements with third-party payors, including Medicaid, Medicare and private insurers, revenue is recorded based on contractually agreed-upon amounts or rate on a per patient, daily basis or as services are performed.
Assisted and Independent Living Revenue
Our revenue is recorded when services are rendered on the date services are provided at amounts billable to individual residents and consists of fees for basic housing and assisted living care. Residency agreements are generally for a term of 30 days, with resident fees billed monthly in advance. For patients under reimbursement arrangements with Medicaid, revenue is recorded based on contractually agreed-upon amounts or rate on a per resident, daily basis or as services. Revenue for certain ancillary charges is recognized as services are provided, and such fees are billed monthly in arrears.
Home Health Revenue
Medicare Revenue
Net service revenue is recorded under the Medicare prospective payment system based on a 60-day episode payment rate that is subject to adjustment based on certain variables including, but not limited to: (a) an outlier payment if patient care was unusually costly; (b) a low utilization payment adjustment if the number of visits was fewer than five; (c) a partial payment if the patient transferred to another provider or we received a patient from another provider before completing the episode; (d) a payment adjustment based upon the level of therapy services required; (e) the number of episodes of care provided to a patient, regardless of whether the same home health provider provided care for the entire series of episodes; (f) changes in the base episode payments established by the Medicare Program; (g) adjustments to the base episode payments for case mix and geographic wages; and (h) recoveries of overpayments.
We make adjustments to Medicare revenue on completed episodes to reflect differences between estimated and actual payment amounts, an inability to obtain appropriate billing documentation or authorizations acceptable to the payor and other reasons unrelated to credit risk. Therefore, we believe that its reported net service revenue and patient accounts receivable will be the net amounts to be realized from Medicare for services rendered.
In addition to revenue recognized on completed episodes, we also recognize a portion of revenue associated with episodes in progress. Episodes in progress are 60-day episodes of care that begin during the reporting period, but were not completed as of the end of the period. As such, we estimate revenue and recognize it on a daily basis. The primary factors underlying this estimate are the number of episodes in progress at the end of the reporting period, expected Medicare revenue per episode and our estimate of the average percentage complete based on visits performed.
Non-Medicare Revenue
Episodic Based Revenue —
We recognize revenue in a similar manner as we recognize Medicare revenue for episodic-based rates that are paid by other insurance carriers, including Medicare Advantage programs; however, these rates can vary based upon the negotiated terms.
Non-episodic Based Revenue —
Revenue is recorded on an accrual basis based upon the date of service at amounts equal to its established or estimated per-visit rates, as applicable.
Hospice Revenue
Revenue is recorded on an accrual basis based upon the date of service at amounts equal to the estimated payment rates. The estimated payment rates are daily rates for each of the levels of care we deliver. We make adjustments to revenue for an inability to obtain appropriate billing documentation or authorizations acceptable to the payor and other reasons unrelated to credit risk.
76
Additionally, as Medicare hospice revenue is subject to an inpatient cap limit and an overall payment cap, we monitor our provider numbers and estimated amounts due back to Medicare if a cap has been exceeded. We record these adjustments as a reduction to revenue and increases to other accrued liabilities.
Accounts Receivable and Allowance for Doubtful Accounts
Accounts receivable consist primarily of amounts due from Medicare and Medicaid programs, other government programs, managed care health plans and private payor sources. Estimated provisions for doubtful accounts are recorded to the extent it is probable that a portion or all of a particular account will not be collected.
In evaluating the collectability of accounts receivable, we consider a number of factors, including the age of the accounts, changes in collection patterns, the composition of patient accounts by payor type and the status of ongoing disputes with third-party payors. On an annual basis, the historical collection percentages are reviewed by payor and by state and are updated to reflect our recent collection experience. In order to determine the appropriate reserve rate percentages which ultimately establish the allowance, we analyze historical cash collection patterns by payor and by state. The percentages applied to the aged receivable balances are based on our historical experience and time limits, if any, for managed care, Medicare, Medicaid and other payors. We periodically refine our estimates of the allowance for doubtful accounts based on experience with the estimation process and changes in circumstances.
Self-Insurance
We are partially self-insured for general and professional liability up to a base amount per claim (the self-insured retention) with an aggregate, one-time deductible above this limit. Losses beyond these amounts are insured through third-party policies with coverage limits per claim, per location and on an aggregate basis for the Company. For claims made after January 1, 2013, the combined self-insured retention was
$0.5 million
per claim, subject to an additional one-time deductible of
$1.0 million
for California affiliated facilities and a separate, one-time, deductible of
$0.8 million
for non-California facilities. For all California affiliated facilities, the third-party coverage above these limits was
$1.0 million
per claim,
$3.0 million
per facility, with a
$5.0 million
blanket aggregate limit. For all facilities outside of California, except those located in Colorado, the third-party coverage above these limits was
$1.0 million
per claim,
$3.0 million
per facility, with a
$5.0 million
blanket aggregate and an additional state-specific aggregate where required by state law. In Colorado, the third-party coverage above these limits was
$1.0 million
per claim and
$3.0 million
per facility for skilled nursing facilities, which is independent of the aforementioned blanket aggregate limits that apply outside of Colorado. Starting January 1, 2017, the combined self-insured retention will be
$0.5 million
per claim, subject to an additional one-time deductible of
$0.8 million
for California affiliated facilities and a separate, one-time, deductible of
$1.0 million
for non-California facilities.
The self-insured retention and deductible limits for general and professional liability and workers' compensation for all states (except Texas and Washington for workers' compensation) are self-insured through the Captive, the related assets and liabilities of which are included in the accompanying consolidated balance sheets. The Captive is subject to certain statutory requirements as an insurance provider. These requirements include, but are not limited to, maintaining statutory capital. Our policy is to accrue amounts equal to the actuarially estimated costs to settle open claims of insureds, as well as an estimate of the cost of insured claims that have been incurred but not reported. We develop information about the size of the ultimate claims based on historical experience, current industry information and actuarial analysis, and evaluates the estimates for claim loss exposure on a quarterly basis.
Our operating subsidiaries are self-insured for workers’ compensation in California. To protect itself against loss exposure in California with this policy, we have purchased individual specific excess insurance coverage that insures individual claims that exceed
$0.5 million
per occurrence. In Texas, the operating subsidiaries have elected non-subscriber status for workers’ compensation claims and, effective February 1, 2011, we have purchased individual stop-loss coverage that insures individual claims that exceed
$0.8 million
per occurrence. As of July 1, 2014, our operating subsidiaries in all other states, with the exception of Washington, are under a loss sensitive plan that insures individual claims that exceed
$0.4 million
per occurrence. In Washington, the operating subsidiaries' coverage is financed through premiums paid by the employers and employees. The claims and pay benefits are managed through a state insurance pool. Outside of California, Texas and Washington, we have purchased insurance coverage that insures individual claims that exceed
$0.4 million
per accident. In all states except Washington, we accrue amounts equal to the estimated costs to settle open claims, as well as an estimate of the cost of claims that have been incurred but not reported. We use actuarial valuations to estimate the liability based on historical experience and industry information.
We self-fund medical (including prescription drugs) and dental healthcare benefits to the majority of our employees. We are fully liable for all financial and legal aspects of these benefit plans. To protect ourselves against loss exposure with this policy, we have purchased individual stop-loss insurance coverage that insures individual claims that exceed
$0.3 million
for each covered
77
person with an additional one-time aggregate individual stop loss deductible of
$0.1 million
. Beginning 2016, our policy does not include the additional one-time aggregate individual stop loss deductible of
$0.1 million
.
We believe that adequate provision has been made in the Financial Statements for liabilities that may arise out of patient care, workers’ compensation, healthcare benefits and related services provided to date. The amount of our reserves was determined based on an estimation process that uses information obtained from both company-specific and industry data. This estimation process requires us to continuously monitor and evaluate the life cycle of the claims. Using data obtained from this monitoring and our assumptions about emerging trends, we, with the assistance of an independent actuary, develop information about the size of ultimate claims based on our historical experience and other available industry information. The most significant assumptions used in the estimation process include determining the trend in costs, the expected cost of claims incurred but not reported and the expected costs to settle or pay damage awards with respect to unpaid claims. The self-insured liabilities are based upon estimates, and while we believe that the estimates of loss are reasonable, the ultimate liability may be in excess of or less than the recorded amounts. Due to the inherent volatility of actuarially determined loss estimates, it is reasonably possible that we could experience changes in estimated losses that could be material to net income. If our actual liability exceeds its estimates of loss, our future earnings, cash flows and financial condition would be adversely affected.
Leases and Leasehold Improvements
At the inception of each lease, we perform an evaluation to determine whether the lease should be classified as an operating or capital lease. We record rent expense for operating leases that contain scheduled rent increases on a straight-line basis over the term of the lease. The lease term used for straight-line rent expense is calculated from the date we are given control of the leased premises through the end of the lease term. The lease term used for this evaluation also provides the basis for establishing depreciable lives for buildings subject to lease and leasehold improvements, as well as the period over which we record straight-line rent expense.
Business Combinations
Our acquisition strategy is to purchase or lease operating subsidiaries that are complementary to our current affiliated facilities, accretive to our business or otherwise advance our strategy. The results of all of our operating subsidiaries are included in the accompanying Financial Statements subsequent to the date of acquisition. Acquisitions are typically paid for in cash and are accounted for using the acquisition method of accounting. We account for business combinations using the purchase method of accounting and, accordingly, the assets and liabilities of the acquired entities are recorded at their estimated fair values at the acquisition date. Goodwill represents the excess of the purchase price over the fair value of net assets, including the amount assigned to identifiable intangible assets. Given the time it takes to obtain pertinent information to finalize the acquired company’s balance sheet, the initial fair value might not be finalized at the time of the reported period. Accordingly, it is not uncommon for the initial estimates to be subsequently revised.
In accounting for business combinations, we are required to record the assets and liabilities of the acquired business at fair value. In developing estimates of fair values for long-lived assets, we utilize a variety of factors including market data, cash flows, growth rates, and replacement costs. Determining the fair value for specifically identified intangible assets involves significant judgment, estimates and projections related to the valuation to be applied to intangible assets such as favorable leases, customer relationships, Medicare licenses, and trade names. The subjective nature of management’s assumptions increases the risk associated with estimates surrounding the projected performance of the acquired entity. Additionally, as we amortize finite-lived acquired intangible assets over time, the purchase accounting allocation directly impacts the amortization expense recorded on the financial statements.
Income Taxes
Deferred tax assets have been presented on the balance sheet as a non-current asset for all periods presented related to the early adoption of authoritative guidance for the presentation of deferred taxes. Historically, these assets were classified as either current or non-current assets, as applicable. There is no effect on the consolidated statements of income or consolidated statements of cash flow.
Deferred tax assets and liabilities are established for temporary differences between the financial reporting basis and the tax basis of our assets and liabilities at tax rates in effect when such temporary differences are expected to reverse. We generally expect to fully utilize our deferred tax assets; however, when necessary, we record a valuation allowance to reduce our net deferred tax assets to the amount that is more likely than not to be realized.
78
When we take uncertain income tax positions that do not meet the recognition criteria, we record a liability for underpayment of income taxes and related interest and penalties, if any. In considering the need for and magnitude of a liability for such positions, we must consider the potential outcomes from a review of the positions by the taxing authorities.
In determining the need for a valuation allowance, the annual income tax rate, or the need for and magnitude of liabilities for uncertain tax positions, we make certain estimates and assumptions. These estimates and assumptions are based on, among other things, knowledge of operations, markets, historical trends and likely future changes and, when appropriate, the opinions of advisors with knowledge and expertise in certain fields. Due to certain risks associated with our estimates and assumptions, actual results could differ.
Recent Accounting Pronouncements
Except for rules and interpretive releases of the SEC under authority of federal securities laws and a limited number of grandfathered standards, the Financial Accounting Standards Board (FASB) Accounting Standards Codification™ (ASC) is the sole source of authoritative GAAP literature recognized by the FASB and applicable to us. We have reviewed the FASB issued Accounting Standards Update (ASU) accounting pronouncements and interpretations thereof that have effectiveness dates during the periods reported and in future periods. For any new pronouncements announced, we consider whether the new pronouncements could alter previous generally accepted accounting principles and determine whether any new or modified principles will have a material impact on our reported financial position or operations in the near term. The applicability of any standard is subject to the formal review of our financial management and certain standards are under consideration.
Recent Accounting Standards Adopted by the Company:
In November 2015, the Financial Accounting Standards Board (FASB) issued updated guidance requiring all deferred tax assets and liabilities be presented as non-current. We early adopted this guidance in the first quarter of fiscal year 2016, retrospectively. We have classified deferred tax amounts as non-current assets in the consolidated balance sheet for all periods presented. There was no effect on the consolidated statements of income or statement of cash flows. See the Consolidated Balance Sheets.
In April 2015, the FASB issued updated guidance requiring debt issuance costs related to a recognized debt liability to be presented in the consolidated balance sheet as a direct reduction from the carrying amount of the debt liability. We adopted this amendment during the first quarter of 2016. See Note 16,
Debt
to the Notes to Consolidated Financial Statements.
In August 2014, the FASB issued authoritative guidance requiring management to evaluate whether there are conditions and events that raise substantial doubt about the entity’s ability to continue as a going concern and to provide disclosures in certain circumstances. We adopted the new standard in the first quarter of fiscal year 2016. The adoption of this standard did not have a material effect on our financial statements.
Accounting Standards Recently Issued But Not Yet Adopted by the Company:
In August 2016, the FASB issued amended authoritative guidance to reduce the diversity in practice related to the presentation and classification of certain cash receipts and cash payments in the statement of cash flows. The new provisions target cash flow issues related to (i) debt prepayment or debt extinguishment costs, (ii) settlement of debt instruments with coupon rates that are insignificant relative to effective interest rates, (iii) contingent consideration payments made after a business combination, (iv) proceeds from settlement of insurance claims, (v) proceeds from the settlement of corporate-owned life insurance and bank-owned life insurance policies, (vi) distributions received from equity method investees, (vii) beneficial interests in securitization transactions and (viii) separately identifiable cash flows and application of the predominance principle. This guidance will be effective for fiscal years beginning after December 15, 2017, which will be our fiscal year 2018, with early adoption permitted. The adoption of this standard is not expected to have a material impact on our consolidated financial statements.
In April 2016, the FASB issued its standard to simplify several aspects the accounting for employee share-based payment transactions, which includes the accounting for income taxes, forfeitures, and statutory tax withholding requirements, as well as classification in the statement of cash flows. This guidance will be effective for annual periods beginning after December 15, 2016, which will be our fiscal year 2017, with early adoption permitted. The adoption of the guidance will result in a decrease in income tax expense and an increase in diluted share counts and net cash provided by operating activities.
In March 2016, the FASB issued its standard to amend the principal-versus-agent implementation guidance and illustrations in the Board’s new revenue standard, which includes accounting implication related to (1) determining the appropriate unit of account under the revenue standard’s principal-versus-agent guidance and (2) applying the indicators of whether an entity is a
79
principal or an agent in accordance with the revenue standard’s control principle. The guidance will be effective for fiscal years beginning after December 15, 2017, which will be our fiscal year 2018. The guidance has the same effective date as the new revenue standard and we are required to adopt the guidance by using the same transition method it would use to adopt the new revenue standard. Our evaluation of the adoption method and impact to the consolidated financial statements is ongoing and being performed concurrently with the new revenue standard.
In February 2016, the FASB issued amended authoritative guidance on accounting for leases. The new provisions require that a lessee of operating leases recognize in the statement of financial position a liability to make lease payments (the lease liability) and a right-of-use asset representing its right to use the underlying asset for the lease term. The lease liability will be equal to the present value of lease payments, with the right-of-use asset based upon the lease liability. The classification criteria for distinguishing between finance (or capital) leases and operating leases are substantially similar to the previous lease guidance, but with no explicit bright lines. As such, operating leases will result in straight-line rent expense similar to current practice. For short term leases (term of 12 months or less), a lessee is permitted to make an accounting election not to recognize lease assets and lease liabilities, which would generally result in lease expense being recognized on a straight-line basis over the lease term. This guidance applies to all entities and is effective for annual periods beginning after December 15, 2018, which will be our fiscal year 2019, with early adoption permitted. We are currently evaluating the impact this guidance will have on its consolidated financial statements but expect this adoption will result in a significant increase in the assets and liabilities on its consolidated balance sheet.
In January 2016, the FASB issued amended authoritative guidance which makes targeted improvements for financial instruments. The new provisions impact certain aspects of recognition, measurement, presentation and disclosure requirements of financial instruments. Specifically, the guidance will (1) require equity investments to be measured at fair value with changes in fair value recognized in net income, (2) simplify the impairment assessment of equity investments without readily determinable fair values, (3) eliminate the requirement to disclose the method and assumptions used to estimate fair value for financial instruments measured at amortized cost, and (4) require separate presentation of financial assets and financial liabilities by measurement category. The guidance is effective for annual and interim periods beginning after December 15, 2017, which will be our fiscal year 2018. Early adoption is not permitted. The adoption of this standard is not expected to have a material impact on our consolidated financial statements.
In May 2014, the FASB and International Accounting Standards Board issued their final standard on revenue from contracts with customers that outlines a single comprehensive model for entities to use in accounting for revenue arising from contracts with customers. The new standard supersedes most current revenue recognition guidance, including industry-specific guidance, and may be applied retrospectively to each period presented (full retrospective method) or retrospectively with the cumulative effect recognized in beginning retained earnings as of the date of adoption (modified retrospective method). In July 2015, the FASB formally deferred for one year the effective date of the new revenue standard and decided to permit entities to early adopt the standard. The guidance will be effective for fiscal years beginning after December 15, 2017, which will be our fiscal year 2018. We have initiated an adoption plan in fiscal year 2015, beginning with preliminary evaluation of the standard, and will continue by performing additional analysis of revenue streams and transactions for which the accounting may change under the new standard. The adoption plan, which also includes evaluation of the adoption method and the impact to the consolidated financial statements, is ongoing and will be completed by the end of fiscal year 2017. The new guidance requires enhanced disclosures, including revenue recognition policies to identify performance obligations and significant judgments in measurement and recognition. The FASB has issued and may issue in the future, interpretive guidance, which may impact our evaluation, however we currently anticipate adopting the standard as of January 1, 2018, using the modified retrospective method.
80
Results of Operations
The following table sets forth details of our revenue, expenses and earnings as a percentage of total revenue for the periods indicated:
|
Year Ended December 31,
|
||||||||
|
|
2016
|
2015
|
2014
|
|||||
|
Revenue
|
100.0
|
%
|
100.0
|
%
|
100.0
|
%
|
||
|
Expenses:
|
||||||||
|
Cost of services
|
81.1
|
|
79.6
|
|
80.1
|
|
||
|
Gain related to divestitures
|
(0.7
|
)
|
—
|
|
—
|
|
||
|
Rent—cost of services
|
7.5
|
|
6.6
|
|
4.7
|
|
||
|
General and administrative expense
|
4.2
|
|
4.8
|
|
5.5
|
|
||
|
Depreciation and amortization
|
2.3
|
|
2.1
|
|
2.6
|
|
||
|
Total expenses
|
94.4
|
|
93.1
|
|
92.9
|
|
||
|
Income from operations
|
5.6
|
|
6.9
|
|
7.1
|
|
||
|
Other income (expense):
|
||||||||
|
Interest expense
|
(0.4
|
)
|
(0.2
|
)
|
(1.3
|
)
|
||
|
Interest income
|
0.1
|
|
0.1
|
|
—
|
|
||
|
Other expense, net
|
(0.3
|
)
|
(0.1
|
)
|
(1.3
|
)
|
||
|
Income before provision for income taxes
|
5.3
|
|
6.8
|
|
5.8
|
|
||
|
Provision for income taxes
|
2.0
|
|
2.6
|
|
2.6
|
|
||
|
Net income
|
3.3
|
|
4.2
|
|
3.2
|
|
||
|
Less: net income (loss) attributable to the noncontrolling interests
|
0.2
|
|
—
|
|
(0.2
|
)
|
||
|
Net income attributable to The Ensign Group, Inc.
|
3.1
|
%
|
4.2
|
%
|
3.4
|
%
|
||
Year Ended
December 31, 2016
Compared to the Year Ended
December 31, 2015
Revenue
|
Year Ended December 31,
|
||||||||||||||
|
|
2016
|
2015
|
||||||||||||
|
Revenue Dollars
|
Revenue Percentage
|
Revenue Dollars
|
Revenue Percentage
|
|||||||||||
|
(Dollars in thousands)
|
||||||||||||||
|
Transitional and skilled services
|
$
|
1,374,803
|
|
83.1
|
%
|
$
|
1,126,388
|
|
|
83.9
|
%
|
|||
|
Assisted and independent living services
|
123,636
|
|
7.5
|
%
|
88,129
|
|
|
6.6
|
%
|
|||||
|
Home health and hospice services:
|
|
|
|
|||||||||||
|
Home health
|
60,326
|
|
3.6
|
|
47,955
|
|
|
3.6
|
|
|||||
|
Hospice
|
55,487
|
|
3.4
|
|
42,401
|
|
|
3.2
|
|
|||||
|
Total home health and hospice services
|
115,813
|
|
7.0
|
|
90,356
|
|
|
6.8
|
|
|||||
|
All other (1)
|
40,612
|
|
2.4
|
|
36,953
|
|
|
2.7
|
|
|||||
|
Total revenue
|
$
|
1,654,864
|
|
100.0
|
%
|
$
|
1,341,826
|
|
|
100.0
|
%
|
|||
Consolidated revenue
increased
$313.0 million
, or
23.3%
. Transitional and skilled services revenue increased by
$248.4 million
, or
22.1%
, mainly attributable to the increase in patient days, revenue per patient day and the impacts of acquisitions. Assisted and independent living services increased by
$35.5 million
, or
40.3%
, mainly due to the increase in occupancy and average monthly revenue per unit compared to the prior year period. Home health and hospice services revenue increased by
$25.5 million
, or
28.2%
, mainly due to an increase in volume and average daily census in existing agencies combined with acquisitions. Revenue from acquisitions increased consolidated revenue by
$271.4 million
in 2016 when comparing to 2015.
81
Transitional and Skilled Services
|
Year Ended December 31,
|
||||||||||||||
|
|
2016
|
2015
|
|
|
||||||||||
|
|
(Dollars in thousands)
|
Change
|
% Change
|
|||||||||||
|
Total Facility Results:
|
|
|
|
|
||||||||||
|
Transitional and skilled revenue
|
$
|
1,374,803
|
|
$
|
1,126,388
|
|
$
|
248,415
|
|
22.1
|
%
|
|||
|
Number of facilities at period end
|
149
|
|
131
|
|
18
|
|
13.7
|
%
|
||||||
|
Number of campuses at period end*
|
21
|
|
|
15
|
|
6
|
|
40.0
|
%
|
|||||
|
Actual patient days
|
4,620,735
|
|
3,873,409
|
|
747,326
|
|
19.3
|
%
|
||||||
|
Occupancy percentage — Operational beds
|
75.4
|
%
|
77.6
|
%
|
|
(2.2
|
)%
|
|||||||
|
Skilled mix by nursing days
|
30.9
|
%
|
30.4
|
%
|
|
0.5
|
%
|
|||||||
|
Skilled mix by nursing revenue
|
52.5
|
%
|
52.6
|
%
|
|
(0.1
|
)%
|
|||||||
|
Year Ended December 31,
|
||||||||||||||
|
|
2016
|
2015
|
|
|
||||||||||
|
|
(Dollars in thousands)
|
Change
|
% Change
|
|||||||||||
|
Same Facility Results(1):
|
|
|
|
|
||||||||||
|
Transitional and skilled revenue
|
$
|
898,385
|
|
$
|
871,450
|
|
$
|
26,935
|
|
3.1
|
%
|
|||
|
Number of facilities at period end
|
85
|
|
85
|
|
—
|
|
—
|
%
|
||||||
|
Number of campuses at period end*
|
12
|
|
12
|
|
—
|
|
—
|
%
|
||||||
|
Actual patient days
|
2,930,232
|
|
2,964,185
|
|
(33,953
|
)
|
(1.1
|
)%
|
||||||
|
Occupancy percentage — Operational beds
|
78.4
|
%
|
79.9
|
%
|
|
(1.5
|
)%
|
|||||||
|
Skilled mix by nursing days
|
30.1
|
%
|
30.2
|
%
|
|
(0.1
|
)%
|
|||||||
|
Skilled mix by nursing revenue
|
51.3
|
%
|
52.5
|
%
|
|
(1.2
|
)%
|
|||||||
|
Year Ended December 31,
|
||||||||||||||
|
|
2016
|
2015
|
|
|
||||||||||
|
|
(Dollars in thousands)
|
Change
|
% Change
|
|||||||||||
|
Transitioning Facility Results(2):
|
|
|
|
|
||||||||||
|
Transitional and skilled revenue
|
$
|
173,559
|
|
$
|
164,128
|
|
$
|
9,431
|
|
5.7
|
%
|
|||
|
Number of facilities at period end
|
23
|
|
23
|
|
—
|
|
—
|
%
|
||||||
|
Actual patient days
|
578,178
|
|
569,801
|
|
8,377
|
|
1.5
|
%
|
||||||
|
Occupancy percentage — Operational beds
|
72.9
|
%
|
71.8
|
%
|
|
1.1
|
%
|
|||||||
|
Skilled mix by nursing days
|
33.4
|
%
|
32.2
|
%
|
|
1.2
|
%
|
|||||||
|
Skilled mix by nursing revenue
|
55.4
|
%
|
54.7
|
%
|
|
0.7
|
%
|
|||||||
|
Year Ended December 31,
|
|||||||||||||
|
|
2016
|
2015
|
|
|
|||||||||
|
|
(Dollars in thousands)
|
Change
|
% Change
|
||||||||||
|
Recently Acquired Facility Results(3):
|
|
|
|
||||||||||
|
Transitional and skilled revenue
|
$
|
302,237
|
|
$
|
83,693
|
|
$
|
218,544
|
|
NM
|
|||
|
Number of facilities at period end
|
41
|
|
22
|
|
19
|
|
NM
|
||||||
|
Number of campuses at period end*
|
9
|
|
3
|
|
6
|
|
NM
|
||||||
|
Actual patient days
|
1,109,081
|
|
303,686
|
|
805,395
|
|
NM
|
||||||
|
Occupancy percentage — Operational beds
|
69.7
|
%
|
69.1
|
%
|
|
|
NM
|
||||||
|
Skilled mix by nursing days
|
31.7
|
%
|
30.9
|
%
|
|
|
NM
|
||||||
|
Skilled mix by nursing revenue
|
54.4
|
%
|
51.3
|
%
|
|
|
NM
|
||||||
82
|
Year Ended December 31,
|
|||||||||||||
|
|
2016
|
2015
|
|
|
|||||||||
|
|
(Dollars in thousands)
|
Change
|
% Change
|
||||||||||
|
Facility Closed(4):
|
|
|
|
||||||||||
|
Skilled nursing revenue
|
$
|
622
|
|
$
|
7,117
|
|
$
|
(6,495
|
)
|
NM
|
|||
|
Actual patient days
|
3,244
|
|
35,737
|
|
(32,493
|
)
|
NM
|
||||||
|
Occupancy percentage — Operational beds
|
70.7
|
%
|
71.5
|
%
|
NM
|
||||||||
|
Skilled mix by nursing days
|
9.6
|
%
|
12.7
|
%
|
|
NM
|
|||||||
|
Skilled mix by nursing revenue
|
14.9
|
%
|
26.9
|
%
|
|
NM
|
|||||||
__________________
* Campus represents a facility that offers both skilled nursing assisted and/or independently living services. Revenue and expenses related to skilled nursing and assisted and independent living services have been allocated and recorded in the respective reportable segment.
|
(1)
|
Same Facility results represent all facilities purchased prior to January 1, 2013.
|
|
(2)
|
Transitioning Facility results represents all facilities purchased from January 1, 2013 to December 31, 2014.
|
|
(3)
|
Recently Acquired Facility (Acquisitions) results represent all facilities purchased on or subsequent to January 1, 2015.
|
|
(4)
|
Facility Closed represent the result of one facility closed during the first quarter of 2016. These results were excluded from Same Facility results for the year ended December 31, 2015 for comparison purposes.
|
Transitional and skilled services revenue increased
$248.4 million
, or
22.1%
. Of the
$248.4 million
increase, Medicare and managed care revenue increased
$117.2 million
, or
22.2%
, Medicaid custodial revenue increased
$90.7 million
, or
21.1%
, private and other revenue increased
$24.9 million
, or
25.7%
, and Medicaid skilled revenue increased
$15.6 million
, or
21.7%
.
Transitional and skilled services revenue generated by Same Facilities increased
$26.9 million
, or
3.1%
, compared to the same quarter in the prior year. This increase reflects the following:
|
•
|
Medicaid revenue, including Medicaid skilled revenue,
increased
by
$24.5 million
, or
6.2%
, which was driven by a
6.6%
increase
in Medicaid revenue per patient day driven by the quality improvement program, the add-on to the reimbursement rate in California and the supplemental programs in Utah, partially offset by a
0.7%
decrease
in Medicaid days.
|
|
•
|
Managed care revenue
increased
by
$8.2 million
, or
5.9%
, as a result of a
4.7%
increase
in managed care days as well as a
1.2%
increase
in managed care revenue per patient day.
|
|
•
|
Medicare revenue
decreased
by
$11.6 million
, or
4.4%
, primarily due to a
9.8%
decrease
in Medicare days, partially offset by a
3.8%
increase
in Medicare revenue per patient day.
|
Transitional and skilled services revenue generated by Transitioning Facilities increased
$9.4 million
, or
5.7%
. This is due to
increases
in total patient days of
1.5%
, consisting of a
7.6%
increase
in managed care days, a
2.0%
increase
in Medicaid days and a
1.7%
increase
in Medicare days from the prior year. Revenue per patient day
increased
by
4.1%
, consisting of a
2.0%
increase
in Medicare, a
5.5%
increase
in Medicaid and a
1.7%
increase
in managed care revenue per patient day.
Transitional and skilled services revenue generated by Recently Acquired Facilities
increased
by approximately
$218.5 million
. Between January 1, 2015 and December 31, 2016, we have acquired
50
facilities in
eight
states.
Historically, we have generally experienced lower occupancy rates, lower skilled mix and quality mix at Recently Acquired Facilities and therefore, we anticipate generally lower overall occupancy during years of growth for our turnaround acquisitions. In the future, if we acquire additional turnaround operations into our overall portfolio, we expect this trend to continue. Accordingly, we anticipate our overall occupancy will vary from quarter to quarter based upon the maturity of the facilities within our portfolio. In 2016, our metrics for Recently Acquired Facilities include strategic acquisitions that have higher occupancy rates, higher skilled mix days and skilled mix revenue.
83
The following table reflects the change in the skilled nursing average daily revenue rates by payor source, excluding services that are not covered by the daily rate:
|
Year Ended December 31,
|
|||||||||||||||||||||||||||||||
|
|
Same Facility
|
Transitioning
|
Acquisitions
|
Total
|
|||||||||||||||||||||||||||
|
|
2016
|
2015
|
2016
|
2015
|
2016
|
2015
|
2016
|
2015
|
|||||||||||||||||||||||
|
Skilled Nursing Average Daily Revenue Rates:
|
|
|
|
|
|
|
|
|
|||||||||||||||||||||||
|
Medicare
|
$
|
586.51
|
|
$
|
565.20
|
|
$
|
566.32
|
|
$
|
555.33
|
|
$
|
491.49
|
|
$
|
475.51
|
|
$
|
556.89
|
|
$
|
555.50
|
|
|||||||
|
Managed care
|
424.70
|
|
419.83
|
|
468.01
|
|
460.21
|
|
409.95
|
|
414.14
|
|
428.53
|
|
427.16
|
|
|||||||||||||||
|
Other skilled
|
469.31
|
|
456.62
|
|
351.10
|
|
330.83
|
|
386.66
|
|
431.42
|
|
441.86
|
|
436.41
|
|
|||||||||||||||
|
Total skilled revenue
|
506.09
|
|
497.24
|
|
486.30
|
|
478.11
|
|
452.55
|
|
449.07
|
|
490.18
|
|
490.07
|
|
|||||||||||||||
|
Medicaid
|
208.41
|
|
195.44
|
|
195.57
|
|
185.31
|
|
174.45
|
|
188.54
|
|
198.92
|
|
193.04
|
|
|||||||||||||||
|
Private and other payors
|
204.33
|
|
190.12
|
|
198.11
|
|
199.83
|
|
182.50
|
|
198.94
|
|
197.87
|
|
192.04
|
|
|||||||||||||||
|
Total skilled nursing revenue
|
$
|
297.83
|
|
$
|
285.92
|
|
$
|
292.88
|
|
$
|
281.25
|
|
$
|
263.74
|
|
$
|
270.38
|
|
$
|
288.93
|
|
$
|
283.31
|
|
|||||||
Medicare daily rates at Same Facilities
increase
d by
3.8%
. The increase was attributable to a 2.4% net market basket increase, which went into effect in October 2016, compared to a net market basket increase of 1.2%, which went into effect in October 2015. In addition, the increase in Medicare daily rates was impacted by the continuous shift towards higher acuity patients.
The average Medicaid rates increased
3.0%
primarily due to increases in rates in various states, supplemental Medicaid payments received from the supplemental payment programs in Utah and Texas, the quality improvement program and the add-on to the reimbursement rate in California.
Payor Sources as a Percentage of Skilled Nursing Services.
We use both our skilled mix and quality mix as measures of the quality of reimbursements we receive at our affiliated skilled nursing facilities over various periods. The following tables set forth our percentage of skilled nursing patient revenue and days by payor source:
|
|
Year Ended December 31,
|
||||||||||||||||||||||
|
|
Same Facility
|
Transitioning
|
Acquisitions
|
Total
|
|||||||||||||||||||
|
|
2016
|
2015
|
2016
|
2015
|
2016
|
2015
|
2016
|
2015
|
|||||||||||||||
|
Percentage of Skilled Nursing Revenue:
|
|
|
|
|
|
|
|
|
|||||||||||||||
|
Medicare
|
27.2
|
%
|
29.6
|
%
|
23.4
|
%
|
23.9
|
%
|
32.2
|
%
|
29.1
|
%
|
27.8
|
%
|
28.6
|
%
|
|||||||
|
Managed care
|
16.1
|
|
15.7
|
|
26.1
|
|
25.6
|
|
18.5
|
|
16.5
|
|
17.9
|
|
17.2
|
|
|||||||
|
Other skilled
|
8.0
|
|
7.2
|
|
5.9
|
|
5.2
|
|
3.7
|
|
5.7
|
|
6.8
|
|
6.8
|
|
|||||||
|
Skilled mix
|
51.3
|
|
52.5
|
|
55.4
|
|
54.7
|
|
54.4
|
|
51.3
|
|
52.5
|
|
52.6
|
|
|||||||
|
Private and other payors
|
8.3
|
|
8.0
|
|
7.2
|
|
8.3
|
|
9.7
|
|
9.8
|
|
8.5
|
|
8.2
|
|
|||||||
|
Quality mix
|
59.6
|
|
60.5
|
|
62.6
|
|
63.0
|
|
64.1
|
|
61.1
|
|
61.0
|
|
60.8
|
|
|||||||
|
Medicaid
|
40.4
|
|
39.5
|
|
37.4
|
|
37.0
|
|
35.9
|
|
38.9
|
|
39.0
|
|
39.2
|
|
|||||||
|
Total skilled nursing
|
100.0
|
%
|
100.0
|
%
|
100.0
|
%
|
100.0
|
%
|
100.0
|
%
|
100.0
|
%
|
100.0
|
%
|
100.0
|
%
|
|||||||
84
|
|
Year Ended December 31,
|
||||||||||||||||||||||
|
|
Same Facility
|
Transitioning
|
Acquisitions
|
Total
|
|||||||||||||||||||
|
|
2016
|
2015
|
2016
|
2015
|
2016
|
2015
|
2016
|
2015
|
|||||||||||||||
|
Percentage of Skilled Nursing Days:
|
|
|
|
|
|
|
|
|
|||||||||||||||
|
Medicare
|
13.7
|
%
|
14.9
|
%
|
12.1
|
%
|
12.1
|
%
|
17.3
|
%
|
16.6
|
%
|
14.4
|
%
|
14.6
|
%
|
|||||||
|
Managed care
|
11.3
|
|
10.7
|
|
16.3
|
|
15.6
|
|
11.9
|
|
10.7
|
|
12.0
|
|
11.4
|
|
|||||||
|
Other skilled
|
5.1
|
|
4.6
|
|
5.0
|
|
4.5
|
|
2.5
|
|
3.6
|
|
4.5
|
|
4.4
|
|
|||||||
|
Skilled mix
|
30.1
|
|
30.2
|
|
33.4
|
|
32.2
|
|
31.7
|
|
30.9
|
|
30.9
|
|
30.4
|
|
|||||||
|
Private and other payors
|
12.3
|
|
12.0
|
|
10.6
|
|
11.7
|
|
14.0
|
|
13.3
|
|
12.5
|
|
12.1
|
|
|||||||
|
Quality mix
|
42.4
|
|
42.2
|
|
44.0
|
|
43.9
|
|
45.7
|
|
44.2
|
|
43.4
|
|
42.5
|
|
|||||||
|
Medicaid
|
57.6
|
|
57.8
|
|
56.0
|
|
56.1
|
|
54.3
|
|
55.8
|
|
56.6
|
|
57.5
|
|
|||||||
|
Total skilled nursing
|
100.0
|
%
|
100.0
|
%
|
100.0
|
%
|
100.0
|
%
|
100.0
|
%
|
100.0
|
%
|
100.0
|
%
|
100.0
|
%
|
|||||||
Assisted and Independent Living Services
|
Year Ended December 31,
|
||||||||||||||
|
|
2016
|
2015
|
|
|
||||||||||
|
|
(Dollars in thousands)
|
Change
|
% Change
|
|||||||||||
|
Revenue
|
123,636
|
|
88,129
|
|
$
|
35,507
|
|
40.3
|
%
|
|||||
|
Number of facilities at period end
|
40
|
|
40
|
|
—
|
|
—
|
%
|
||||||
|
Number of campuses at period end
|
21
|
|
15
|
|
6
|
|
40.0
|
%
|
||||||
|
Occupancy percentage (units)
|
76.0
|
%
|
75.3
|
%
|
|
0.7
|
%
|
|||||||
|
Average monthly revenue per unit
|
$
|
2,746
|
|
$
|
2,644
|
|
$
|
102
|
|
3.9
|
%
|
|||
Assisted and independent living revenue increased
$35.5 million
, or
40.3%
. The increase in revenue is primarily due to the increase in occupancy of
0.7%
, the increase in average monthly revenue per unit of
3.9%
, and coupled with the addition of 14 assisted and independent living operations in four states between January 1, 2015 and December 31, 2016.
Home Health and Hospice Services
|
Year Ended December 31,
|
||||||||||||||
|
|
2016
|
2015
|
Change
|
% Change
|
||||||||||
|
(Dollars in thousands)
|
||||||||||||||
|
Home health and hospice revenue
|
||||||||||||||
|
Home health services
|
$
|
60,326
|
|
$
|
47,955
|
|
$
|
12,371
|
|
25.8
|
%
|
|||
|
Hospice services
|
55,487
|
|
42,401
|
|
13,086
|
|
30.9
|
|
||||||
|
Total home health and hospice revenue
|
$
|
115,813
|
|
$
|
90,356
|
|
$
|
25,457
|
|
28.2
|
%
|
|||
|
Home health services:
|
|
|||||||||||||
|
Average Medicare Revenue per Completed Episode
|
$
|
2,986
|
|
$
|
2,929
|
|
$
|
57
|
|
1.9
|
%
|
|||
|
Hospice services:
|
|
|||||||||||||
|
Average Daily Census
|
905
|
|
679
|
|
226
|
|
33.3
|
%
|
||||||
Home health and hospice revenue increased
$25.5 million
, or
28.2%
. Of the
$25.5 million
increase, Medicare and managed care revenue increased
$23.1 million
, or
30.7%
. The increase in revenue is primarily due to the increase in volume, average daily census and average Medicare revenue per completed episode in existing agencies, coupled with the addition of
eight
home health, hospice and home care operations in
seven
states between January 1, 2015 and December 31, 2016.
85
Cost of Services
The following table sets forth our total cost of services by each of our reportable segments and our "All Other" category for the periods indicated (dollars in thousands):
|
Year Ended December 31,
|
||||||||||||||||||||||||||||||||||||||||
|
|
2016
|
2015
|
||||||||||||||||||||||||||||||||||||||
|
Transitional and Skilled Services
|
Assisted and Independent Living Services
|
Home Health and Hospice
|
All Other
|
Total
|
Transitional and Skilled Services
|
Assisted and Independent Living Services
|
Home Health and Hospice
|
All Other
|
Total
|
|||||||||||||||||||||||||||||||
|
Cost of service
|
$
|
1,130,691
|
|
$
|
78,872
|
|
$
|
96,753
|
|
$
|
35,498
|
|
$
|
1,341,814
|
|
$
|
902,352
|
|
|
$
|
57,396
|
|
|
$
|
74,557
|
|
|
$
|
33,389
|
|
$
|
1,067,694
|
|
|||||||
Consolidated cost of services increased
$274.1 million
, or
25.7%
, primarily due to acquisitions.
Transitional and Skilled Services
|
|
Year Ended December 31,
|
%
|
|||||||||||||
|
2016
|
2015
|
Change
|
Change
|
||||||||||||
|
(Dollars in thousands)
|
|||||||||||||||
|
Cost of service dollars
|
$
|
1,130,691
|
|
$
|
902,352
|
|
$
|
228,339
|
|
25.3
|
%
|
||||
|
Revenue percentage
|
82.2
|
%
|
80.1
|
%
|
2.1
|
%
|
|||||||||
Cost of services related to our transitional and skilled services segment
increased
$228.3 million
, or
25.3%
, due to additional costs at Recently Acquired Facilities of
$188.8 million
and organic operational growth. Cost of service as a percentage of revenue
increased
to
82.2%
. The main components of the increase are start-up costs related to newly constructed post-acute care campuses, additional costs related to our new labor management system roll-out and increases in health, general and professional liability costs of
$21.0 million
from the change in claims experience. In addition, our provision for doubtful accounts increased by
$8.0 million
. Same Facilities cost of services
increased
due to an increase in health, general and professional liability costs of
$12.5 million
, partially offset by the decrease in worker compensation costs of
$2.2 million
.
Assisted and Independent Living Services
|
|
Year Ended December 31,
|
%
|
|||||||||||||
|
2016
|
2015
|
Change
|
Change
|
||||||||||||
|
(Dollars in thousands)
|
|||||||||||||||
|
Cost of service dollars
|
$
|
78,872
|
|
$
|
57,396
|
|
$
|
21,476
|
|
37.4
|
%
|
||||
|
Revenue percentage
|
63.8
|
%
|
65.1
|
%
|
(1.3
|
)%
|
|||||||||
Cost of services related to our assisted and independent living services segment increased
$21.5 million
, or
37.4%
, primarily due to organic operational growth. The largest component of cost of services is labor expenses. Cost of services as a percentage of total revenue
decreased
by
1.3%
as a result of reduction in labor costs.
Home Health and Hospice Services
|
|
Year Ended December 31,
|
%
|
|||||||||||||
|
2016
|
2015
|
Change
|
Change
|
||||||||||||
|
(Dollars in thousands)
|
|||||||||||||||
|
Cost of service dollars
|
$
|
96,753
|
|
$
|
74,557
|
|
$
|
22,196
|
|
29.8
|
%
|
||||
|
Revenue percentage
|
83.5
|
%
|
82.5
|
%
|
1.0
|
%
|
|||||||||
Cost of services related to our home health and hospice services segment
increased
$22.2 million
, or
29.8%
due to additional costs at agencies acquired during 2016 of
$12.4 million
and organic operational growth. Cost of services as a percentage of total revenue
increased
by
1.0%
primarily due to costs related to start-up and transitioning operations. We have generally experienced higher costs due to the addition of resources at our newly acquired and start-up agencies.
86
Gain related to divestitures
. We recorded a gain of
$19.2 million
relate to the sale of our urgent care centers in 2016. The gain is partially offset by the charges of
$7.9 million
related to the closure of one facility in February 2016. The charges represent the present value of rental payments of
$6.5 million
related to our continued obligation liability under the lease and related closing expenses. Similar charges and gains did not occur in 2015.
Rent — Cost of Services
. Rent — cost of services increased
$35.8 million
, or
40.3%
, to
$124.6 million
. Rent - cost of service as a percentage of total revenue increased by
0.9%
to
7.5%
. The additional increase in rent was primarily due to new leases for newly opened and acquired operations.
General and Administrative Expense.
General and administrative expense increased by
$5.0 million
, or
7.8%
, to
$69.2 million
. The increase was primarily due to our operational growth during 2016, coupled with an increase in expenses incurred to acquire new operations and additional share-based compensation expense related to the new management subsidiary equity plan that was implemented in the second quarter of 2016, offset by a reduction in incentives. In addition, general and administrative expense as a percentage of revenue
decreased
as a percentage of revenue by
0.6%
to
4.2%
.
Depreciation and Amortization.
Depreciation and amortization expense
increased
$10.6 million
, or
37.6%
, to
$38.7 million
. Depreciation and amortization expense
increased
as a percentage of total revenue by
0.2%
to
2.3%
. This increase was primarily related to the additional depreciation and amortization incurred as a result of our newly acquired operations of
$6.2 million
. Of the increase at Recently Acquired Facilities,
$1.6 million
represented amortization expense of patient base intangible assets which are amortized over four to eight months.
Other Expense, net.
Other expense, net increased
$4.0 million
to
$6.0 million
. Other expense as a percentage of revenue increased by
0.2%
to
0.3%
. The increase is due to interest expense incurred related to additional borrowings under the credit facility.
Provision for Income Taxes.
The provision for income taxes is based upon our annual reported income for each respective accounting period and includes the effect of certain non-taxable and non-deductible items. Our effective tax rate was
38.4%
for the
year ended December 31, 2016
compared to
38.6%
for the same period in 2015. The effective tax rate was consistent with the prior year.
Year Ended December 31, 2015 Compared to the Year Ended December 31, 2014
Revenue
|
Year Ended December 31,
|
||||||||||||||
|
|
2015
|
2014
|
||||||||||||
|
Revenue Dollars
|
Revenue Percentage
|
Revenue Dollars
|
Revenue Percentage
|
|||||||||||
|
(Dollars in thousands)
|
||||||||||||||
|
Transitional and skilled services
|
$
|
1,126,388
|
|
83.9
|
%
|
$
|
901,470
|
|
87.7
|
%
|
||||
|
Assisted and independent living services
|
88,129
|
|
6.6
|
%
|
48,848
|
|
4.8
|
|
||||||
|
Home health and hospice services:
|
|
|
||||||||||||
|
Home health
|
47,955
|
|
3.6
|
|
29,577
|
|
2.9
|
|
||||||
|
Hospice
|
42,401
|
|
3.2
|
|
24,939
|
|
2.4
|
|
||||||
|
Total home health and hospice services
|
90,356
|
|
6.8
|
|
54,516
|
|
5.3
|
|
||||||
|
All other (1)
|
36,953
|
|
2.7
|
|
22,572
|
|
2.2
|
|
||||||
|
Total revenue
|
$
|
1,341,826
|
|
100.0
|
%
|
$
|
1,027,406
|
|
100.0
|
%
|
||||
Consolidated revenue increased $314.4 million, or 30.6%. Transitional and skilled services revenue increased by
$224.9 million
, or
25.0%
, mainly attributable to the increase in operational level occupancy, revenue per patient day skilled mix and the impact of acquisitions. Assisted and independent living revenue increased by
$39.3 million
, or
80.4%
, due to the increase in average monthly revenue per unit coupled with the addition of
31
assisted and independent living operations in
seven
states between January 1, 2014 and December 31, 2015. Home health and hospice services revenue increased by
$35.8 million
, or
65.7%
, mainly due to an increase in volume in existing agencies, revenue per episode, and census coupled with acquisitions. Revenue from acquisitions increased consolidated revenue by $233.8 million in 2015 compared to 2014.
87
Transitional and Skilled Services
|
Year Ended December 31,
|
||||||||||||||
|
|
2015
|
2014
|
|
|
||||||||||
|
|
(Dollars in thousands)
|
Change
|
% Change
|
|||||||||||
|
Total Facility Results:
|
|
|
|
|
||||||||||
|
Transitional and skilled revenue
|
$
|
1,126,388
|
|
$
|
901,470
|
|
$
|
224,918
|
|
25.0
|
%
|
|||
|
Number of facilities at period end
|
131
|
|
108
|
|
23
|
|
21.3
|
%
|
||||||
|
Number of campuses at period end*
|
15
|
|
12
|
|
3
|
|
25.0
|
%
|
||||||
|
Actual patient days
|
3,873,409
|
|
3,306,296
|
|
567,113
|
|
17.2
|
%
|
||||||
|
Occupancy percentage — Operational beds
|
77.6
|
%
|
77.3
|
%
|
|
0.3
|
%
|
|||||||
|
Skilled mix by nursing days
|
30.4
|
%
|
27.6
|
%
|
|
2.8
|
%
|
|||||||
|
Skilled mix by nursing revenue
|
52.6
|
%
|
50.8
|
%
|
|
1.8
|
%
|
|||||||
|
Year Ended December 31,
|
||||||||||||||
|
|
2015
|
2014
|
|
|
||||||||||
|
|
(Dollars in thousands)
|
Change
|
% Change
|
|||||||||||
|
Same Facility Results(1):
|
|
|
|
|
||||||||||
|
Transitional and skilled revenue
|
$
|
856,276
|
|
$
|
803,173
|
|
$
|
53,103
|
|
6.6
|
%
|
|||
|
Number of facilities at period end
|
82
|
|
82
|
|
—
|
|
—
|
%
|
||||||
|
Number of campuses at period end*
|
11
|
|
11
|
|
—
|
|
—
|
%
|
||||||
|
Actual patient days
|
2,909,817
|
|
2,900,145
|
|
9,672
|
|
0.3
|
%
|
||||||
|
Occupancy percentage — Operational beds
|
80.8
|
%
|
80.0
|
%
|
|
0.8
|
%
|
|||||||
|
Skilled mix by nursing days
|
30.3
|
%
|
28.4
|
%
|
|
1.9
|
%
|
|||||||
|
Skilled mix by nursing revenue
|
52.9
|
%
|
51.7
|
%
|
|
1.2
|
%
|
|||||||
|
Year Ended December 31,
|
||||||||||||||
|
|
2015
|
2014
|
|
|
||||||||||
|
|
(Dollars in thousands)
|
Change
|
% Change
|
|||||||||||
|
Transitioning Facility Results(2):
|
|
|
|
|
||||||||||
|
Transitional and skilled revenue
|
$
|
66,823
|
|
$
|
61,955
|
|
$
|
4,868
|
|
7.9
|
%
|
|||
|
Number of facilities at period end
|
12
|
|
12
|
|
—
|
|
—
|
%
|
||||||
|
Number of campuses at period end*
|
1
|
|
1
|
|
—
|
|
—
|
%
|
||||||
|
Actual patient days
|
271,918
|
|
271,629
|
|
289
|
|
0.1
|
%
|
||||||
|
Occupancy percentage — Operational beds
|
64.1
|
%
|
62.9
|
%
|
|
1.2
|
%
|
|||||||
|
Skilled mix by nursing days
|
20.9
|
%
|
19.1
|
%
|
|
1.8
|
%
|
|||||||
|
Skilled mix by nursing revenue
|
42.5
|
%
|
40.2
|
%
|
|
2.3
|
%
|
|||||||
|
Year Ended December 31,
|
|||||||||||||
|
|
2015
|
2014
|
|
|
|||||||||
|
|
(Dollars in thousands)
|
Change
|
% Change
|
||||||||||
|
Recently Acquired Facility Results(3):
|
|
|
|
||||||||||
|
Transitional and skilled revenue
|
$
|
203,289
|
|
$
|
36,342
|
|
$
|
166,947
|
|
NM
|
|||
|
Number of facilities at period end
|
37
|
|
15
|
|
22
|
|
NM
|
||||||
|
Number of campuses at period end*
|
3
|
|
—
|
|
3
|
|
NM
|
||||||
|
Actual patient days
|
691,674
|
|
134,522
|
|
557,152
|
|
NM
|
||||||
|
Occupancy percentage — Operational beds
|
71.7
|
%
|
61.1
|
%
|
NM
|
||||||||
|
Skilled mix by nursing days
|
34.2
|
%
|
28.7
|
%
|
|
NM
|
|||||||
|
Skilled mix by nursing revenue
|
54.9
|
%
|
48.5
|
%
|
|
NM
|
|||||||
__________________
* Campus represents a facility that offers both skilled nursing and assisted and/or independently living services. Revenue and expenses related to skilled nursing and assisted and independent living services have been allocated and recorded in the respective reportable segment.
|
(1)
|
Same Facility results represent all facilities purchased prior to January 1, 2012.
|
|
(2)
|
Transitioning Facility results represents all facilities purchased from January 1, 2012 to December 31, 2013.
|
|
(3)
|
Recently Acquired Facility (Acquisitions) results represent all facilities purchased on or subsequent to January 1, 2014.
|
88
Transitional and skilled services revenue increased
$224.9 million
, or
25.0%
. Of the
$224.9 million
increase, Medicare and managed care revenue increased
$114.2 million
, or
27.7%
, Medicaid custodial revenue increased
$78.1 million
, or
22.2%
, private and other revenue increased
$11.9 million
, or
13.9%
, and Medicaid skilled revenue increased
$20.7 million
, or
40.6%
.
Transitional and skilled services revenue generated by Same Facilities increased
$53.1 million
, or
6.6%
. This increase reflects the following:
|
•
|
Managed care revenue increased by
$15.6 million
, or
12.8%
, which was driven by a
10.4%
increase in managed care days as well as a
1.7%
increase in managed care revenue per patient day.
|
|
•
|
Medicare revenue increased by
$10.3 million
, or
4.1%
, as a result of a
1.8%
increase in Medicare days as well as a
2.2%
increase in Medicare revenue per patient day.
|
|
•
|
Medicaid revenue increased by
$21.4 million
, or
8.2%
, primarily due to a
7.7%
increase in Medicaid revenue per patient day.
|
|
•
|
In addition, Same Facilities patient days were also impacted by the flooding at one of our operating subsidiaries, which re-opened at the end of May 2015 and resulted in a decrease in the facility's patient days by 13,781 days.
|
Transitional and skilled services revenue generated by Transitioning Facilities increased
$4.9 million
, or
7.9%
. This increase is due to increases in total patient days and revenue per patient day of
2.3%
and
6.5%
, respectively.
Transitional and skilled services revenue generated by Recently Acquired Facilities increased by approximately
$166.9 million
. Since January 1, 2014, we have acquired 40 facilities in ten states.
Historically, we have generally experienced lower occupancy rates, lower skilled mix and quality mix at Recently Acquired Facilities and therefore, we anticipate generally lower overall occupancy during years of growth. In the future, if we acquire additional facilities into our overall portfolio, we expect this trend to continue. Accordingly, we anticipate our overall occupancy will vary from quarter to quarter based upon the maturity of the facilities within our portfolio. Included in our metrics at Recently Acquired Facilities are six facilities we acquired that are matured and have higher occupancy rates, higher skilled mix days and skilled mix revenue.
The following table reflects the change in the skilled nursing average daily revenue rates by payor source, excluding services that are not covered by the daily rate:
|
Year Ended December 31,
|
|||||||||||||||||||||||||||||||
|
|
Same Facility
|
Transitioning
|
Acquisitions
|
Total
|
|||||||||||||||||||||||||||
|
|
2015
|
2014
|
2015
|
2014
|
2015
|
2014
|
2015
|
2014
|
|||||||||||||||||||||||
|
Skilled Nursing Average Daily Revenue Rates:
|
|
|
|
|
|
|
|
|
|||||||||||||||||||||||
|
Medicare
|
$
|
568.08
|
|
$
|
556.11
|
|
$
|
485.63
|
|
$
|
462.51
|
|
$
|
524.90
|
|
$
|
542.66
|
|
$
|
555.50
|
|
$
|
549.12
|
|
|||||||
|
Managed care
|
419.39
|
|
412.26
|
|
462.72
|
|
456.88
|
|
443.60
|
|
448.43
|
|
427.16
|
|
416.74
|
|
|||||||||||||||
|
Other skilled
|
456.62
|
|
447.26
|
|
331.93
|
|
253.00
|
|
361.20
|
|
321.73
|
|
436.41
|
|
437.08
|
|
|||||||||||||||
|
Total skilled revenue
|
497.93
|
|
491.22
|
|
476.58
|
|
460.42
|
|
463.92
|
|
446.07
|
|
490.07
|
|
487.55
|
|
|||||||||||||||
|
Medicaid
|
194.26
|
|
180.40
|
|
176.59
|
|
166.35
|
|
195.14
|
|
187.52
|
|
193.04
|
|
179.45
|
|
|||||||||||||||
|
Private and other payors
|
193.90
|
|
189.28
|
|
145.30
|
|
149.56
|
|
209.51
|
|
209.85
|
|
192.04
|
|
185.79
|
|
|||||||||||||||
|
Total skilled nursing revenue
|
$
|
286.65
|
|
$
|
269.72
|
|
$
|
234.36
|
|
$
|
219.98
|
|
$
|
288.53
|
|
$
|
264.21
|
|
$
|
283.31
|
|
$
|
265.41
|
|
|||||||
Medicare daily rates at Same Facilities and Transitioning Facilities increased by 2.2% and 5.0%, respectively. The increases were impacted by a 1.2% net market basket increase, which went into effect in October 2015, compared to a net market basket increase of 2.0%, which went into effect in October 2014. In addition, the increase in Medicare daily rates was impacted by the continuous shift towards higher acuity patients.
The average Medicaid rates increased 7.6% primarily due to increases in rates in various states, supplemental Medicaid payments received from the supplemental payment program in the state of Texas, as well as quality improvement program from the states of Arizona and California.
89
Payor Sources as a Percentage of Skilled Nursing Services.
We use both our skilled mix and quality mix as measures of the quality of reimbursements we receive at our affiliated skilled nursing facilities over various periods. The following tables set forth our percentage of skilled nursing patient revenue and days by payor source:
|
|
Year Ended December 31,
|
||||||||||||||||||||||
|
|
Same Facility
|
Transitioning
|
Acquisitions
|
Total
|
|||||||||||||||||||
|
|
2015
|
2014
|
2015
|
2014
|
2015
|
2014
|
2015
|
2014
|
|||||||||||||||
|
Percentage of Skilled Nursing Revenue:
|
|
|
|
|
|
|
|
|
|||||||||||||||
|
Medicare
|
29.6
|
%
|
30.2
|
%
|
27.5
|
%
|
25.8
|
%
|
25.1
|
%
|
18.7
|
%
|
28.6
|
%
|
29.4
|
%
|
|||||||
|
Managed care
|
15.9
|
|
15.1
|
|
14.8
|
|
14.4
|
|
23.3
|
|
20.9
|
|
17.2
|
|
15.3
|
|
|||||||
|
Other skilled
|
7.4
|
|
6.4
|
|
0.2
|
|
—
|
|
6.5
|
|
8.9
|
|
6.8
|
|
6.1
|
|
|||||||
|
Skilled mix
|
52.9
|
|
|
51.7
|
|
42.5
|
|
|
40.2
|
|
54.9
|
|
|
48.5
|
|
52.6
|
|
50.8
|
|
||||
|
Private and other payors
|
8.1
|
|
9.0
|
|
9.7
|
|
11.4
|
|
8.0
|
|
8.6
|
|
8.2
|
|
9.1
|
|
|||||||
|
Quality mix
|
61.0
|
|
60.7
|
|
52.2
|
|
51.6
|
|
62.9
|
|
57.1
|
|
60.8
|
|
59.9
|
|
|||||||
|
Medicaid
|
39.0
|
|
39.3
|
|
47.8
|
|
48.4
|
|
37.1
|
|
42.9
|
|
39.2
|
|
40.1
|
|
|||||||
|
Total skilled nursing
|
100.0
|
%
|
100.0
|
%
|
100.0
|
%
|
100.0
|
%
|
100.0
|
%
|
100.0
|
%
|
100.0
|
%
|
100.0
|
%
|
|||||||
|
|
Year Ended December 31,
|
||||||||||||||||||||||
|
|
Same Facility
|
Transitioning
|
Acquisitions
|
Total
|
|||||||||||||||||||
|
|
2015
|
2014
|
2015
|
2014
|
2015
|
2014
|
2015
|
2014
|
|||||||||||||||
|
Percentage of Skilled Nursing Days:
|
|
|
|
|
|
|
|
|
|||||||||||||||
|
Medicare
|
14.9
|
%
|
14.6
|
%
|
13.3
|
%
|
12.2
|
%
|
13.8
|
%
|
9.1
|
%
|
14.6
|
%
|
14.2
|
%
|
|||||||
|
Managed care
|
10.8
|
|
9.9
|
|
7.5
|
|
6.9
|
|
15.2
|
|
12.3
|
|
11.4
|
|
9.7
|
|
|||||||
|
Other skilled
|
4.6
|
|
3.9
|
|
0.1
|
|
—
|
|
5.2
|
|
7.3
|
|
4.4
|
|
3.7
|
|
|||||||
|
Skilled mix
|
30.3
|
|
|
28.4
|
|
20.9
|
|
|
19.1
|
|
34.2
|
|
|
28.7
|
|
30.4
|
|
27.6
|
|
||||
|
Private and other payors
|
12.1
|
|
12.8
|
|
15.6
|
|
16.8
|
|
11.0
|
|
10.9
|
|
12.1
|
|
13.1
|
|
|||||||
|
Quality mix
|
42.4
|
|
41.2
|
|
36.5
|
|
35.9
|
|
45.2
|
|
39.6
|
|
42.5
|
|
40.7
|
|
|||||||
|
Medicaid
|
57.6
|
|
58.8
|
|
63.5
|
|
64.1
|
|
54.8
|
|
60.4
|
|
57.5
|
|
59.3
|
|
|||||||
|
Total skilled nursing
|
100.0
|
%
|
100.0
|
%
|
100.0
|
%
|
100.0
|
%
|
100.0
|
%
|
100.0
|
%
|
100.0
|
%
|
100.0
|
%
|
|||||||
Assisted and Independent Living Services
|
Year Ended December 31,
|
||||||||||||||
|
|
2015
|
2014
|
|
|
||||||||||
|
|
(Dollars in thousands)
|
Change
|
% Change
|
|||||||||||
|
Revenue
|
88,129
|
|
48,848
|
|
$
|
39,281
|
|
80.4
|
%
|
|||||
|
Number of facilities at period end
|
40
|
|
15
|
|
25
|
|
166.7
|
%
|
||||||
|
Number of campuses at period end
|
15
|
|
12
|
|
3
|
|
25.0
|
%
|
||||||
|
Occupancy percentage (units)
|
75.3
|
%
|
77.3
|
%
|
|
(2.0
|
)%
|
|||||||
|
Average monthly revenue per unit
|
$
|
2,644
|
|
$
|
2,315
|
|
$
|
329
|
|
14.2
|
%
|
|||
Assisted and independent living revenue increased
$39.3 million
, or
80.4%
. The increase in revenue is primarily due to the increase in average monthly revenue per unit coupled with the addition of 31 assisted and independent living operations in
seven
states between January 1, 2014 and December 31, 2015. The decrease in occupancy is due to acquisitions of assisted and living facilities with lower occupancy rates.
Home Health and Hospice Services
90
|
Year Ended December 31,
|
||||||||||||||
|
|
2015
|
2014
|
Change
|
% Change
|
||||||||||
|
(Dollars in thousands)
|
||||||||||||||
|
Home health and hospice revenue
|
||||||||||||||
|
Home health services
|
$
|
47,955
|
|
$
|
29,577
|
|
$
|
18,378
|
|
62.1
|
%
|
|||
|
Hospice services
|
42,401
|
|
24,939
|
|
17,462
|
|
70.0
|
|
||||||
|
Total home health and hospice revenue
|
$
|
90,356
|
|
$
|
54,516
|
|
$
|
35,840
|
|
65.7
|
%
|
|||
|
Home health services:
|
|
|||||||||||||
|
Average Medicare Revenue per Completed Episode
|
$
|
2,929
|
|
$
|
2,840
|
|
$
|
89
|
|
3.1
|
%
|
|||
|
Hospice services:
|
|
|||||||||||||
|
Average Daily Census
|
679
|
|
420
|
|
259
|
|
61.7
|
%
|
||||||
Home health and hospice revenue increased
$35.8 million
, or
65.7%
. Of the
$35.8 million
increase, Medicare and managed care revenue increased $29.1 million, or 63.3%, and Medicaid revenue increased $3.7 million, or 70.5%. The increase in revenue is primarily due to the increase in volume in existing agencies, revenue per episode and census, coupled with the addition of 16 home health, hospice and home care operations in seven states between January 1, 2014 and December 31, 2015.
Cost of Services
The following table sets forth our total cost of services by each of our reportable segments and our "All Other" category for the periods indicated (dollars in thousands):
|
Year Ended December 31,
|
||||||||||||||||||||||||||||||||||||||||
|
|
2015
|
2014
|
||||||||||||||||||||||||||||||||||||||
|
Transitional and Skilled Services
|
Assisted and Independent Living Services
|
Home Health and Hospice
|
All Other
|
Total
|
Transitional and Skilled Services
|
Assisted and Independent Living Services
|
Home Health and Hospice
|
All Other
|
Total
|
|||||||||||||||||||||||||||||||
|
Cost of service
|
$
|
902,352
|
|
|
$
|
57,396
|
|
|
$
|
74,557
|
|
|
$
|
33,389
|
|
$
|
1,067,694
|
|
$
|
723,998
|
|
$
|
32,684
|
|
$
|
43,497
|
|
$
|
22,490
|
|
$
|
822,669
|
|
|||||||
Consolidated cost of services increased $245.0 million, or 29.8%, primarily due to acquisitions for all segments, including the All Other category.
Transitional and Skilled Services
|
|
Year Ended December 31,
|
%
|
|||||||||||||
|
2015
|
2014
|
Change
|
Change
|
||||||||||||
|
(Dollars in thousands)
|
|||||||||||||||
|
Cost of service dollars
|
$
|
902,352
|
|
$
|
723,998
|
|
$
|
178,354
|
|
24.6
|
%
|
||||
|
Revenue percentage
|
80.1
|
%
|
80.3
|
%
|
(0.2
|
)%
|
|||||||||
Cost of services related to our transitional and skilled services segment increased
$178.4 million
, or
24.6%
due to additional costs at Recently Acquired Facilities of
$142.2 million
and organic operational growth. Cost of revenue decreased slightly as a percentage of revenue. The largest component of cost of services is labor expenses. Same Facility cost of services as a percentage of revenue decreased by
0.2%
as a result of reduction in labor costs and insurance expenses.
Assisted and Independent Living Services
|
|
Year Ended December 31,
|
%
|
|||||||||||||
|
2015
|
2014
|
Change
|
Change
|
||||||||||||
|
(Dollars in thousands)
|
|||||||||||||||
|
Cost of service dollars
|
$
|
57,396
|
|
$
|
32,684
|
|
$
|
24,712
|
|
75.6
|
%
|
||||
|
Revenue percentage
|
65.1
|
%
|
66.9
|
%
|
(1.8
|
)%
|
|||||||||
91
Cost of services related to our assisted and independent living services segment increased
$24.7 million
, or
75.6%
, primarily due newly acquired facilities. The largest component of costs of services is labor expenses. Cost of services as a percentage of total revenue
decreased
by 1.8% as a result of reduction in labor costs.
Home Health and Hospice Services
|
|
Year Ended December 31,
|
%
|
|||||||||||||
|
2015
|
2014
|
Change
|
Change
|
||||||||||||
|
(Dollars in thousands)
|
|||||||||||||||
|
Cost of service dollars
|
$
|
74,557
|
|
$
|
43,497
|
|
$
|
31,060
|
|
71.4
|
%
|
||||
|
Revenue percentage
|
82.5
|
%
|
79.8
|
%
|
2.7
|
%
|
|||||||||
Cost of services related to our home health and hospice services segment increased $31.1 million, or 71.4%, due to additional costs at agencies acquired during 2015 of $14.8 million and organic operational growth. Cost of services as a percentage of total revenue increased by 2.7% primarily due to costs related to start-up and transitioning operations. We have generally experienced higher costs due to the addition of resources at our newly acquired and start-up agencies.
Rent — Cost of Services
. Rent — cost of services increased $40.3 million, or 83.1%, to $88.8 million. Rent - cost of service as a percentage of total revenue increased by 1.9% to 6.6%. The increase in rent was primarily due to lease agreements under the Master Leases entered into with CareTrust in connection with the Spin-Off and new leases for newly opened and acquired operations. Rent expense under the Master Leases was $56.0 million for 2015, which included a full 12 months of rent under the Master Leases, compared to $32.7 million, which included rent under the Master Leases for the seven month period from the date of the Spin-Off in June 2014.
General and Administrative Expense.
General and administrative expense increased $7.3 million, or 12.8%, to $64.2 million. General and administrative expense decreased as a percentage of revenue by 0.7% to 4.8%. General and administrative expense in 2014 included costs of approximately $9.0 million incurred in connection with the Spin-Off. Excluding these costs, general and administrative expense as a percentage of revenue was 4.7% in 2014. The increase was primarily due to the operational growth during 2015 and the addition of resources in our post acute continuum team working on bundled payments, value-based programs for care improvement initiatives, managed care providers and other initiatives.
Depreciation and Amortization.
Depreciation and amortization expense decreased $1.7 million, or 6.4%, to $28.1 million. Depreciation and amortization expense decreased as a percentage of total revenue by 0.5% to 2.1%. This decrease was primarily related to the transfer of real properties to CareTrust in connection with the Spin-Off, offset by additional depreciation incurred as a result of our newly acquired operations of $6.9 million. Included in the depreciation and amortization associated with our newly acquired operations is $1.0 million of amortization expense of patient base intangible assets which are amortized over four to eight months.
Other Expense, net.
Other expense, net decreased $10.4 million to $2.0 million. Other expense as a percentage of revenue decreased by 1.2% to 0.1%. Interest expense in 2015 declined due to the payoff of debt in connection with the Spin-Off in 2014.
Provision for Income Taxes.
The provision for income taxes is based upon our annual reported income for each respective accounting period and includes the effect of certain non-taxable and non-deductible items. Our effective tax rate was 38.6% in 2015 compared to 44.4% in 2014. The effective income tax rate for 2014 was negatively impacted by charges of $14.8 million in connection with the Spin-Off, which included permanent non-deductible transaction costs. These costs did not recur in 2015.
92
Liquidity and Capital Resources
Our primary sources of liquidity have historically been derived from our cash flows from operations and long-term debt secured by our real property and our revolving credit facilities.
Historically, we have financed the majority of our acquisitions primarily through financing of our operating subsidiaries through mortgages, our revolving credit facility, and cash generated from operations. Cash paid for assets acquisition was
$120.9 million
,
$17.8 million
and
$7.9 million
for the years ended December 31, 2016, 2015 and 2014, respectively. Cash paid for business acquisitions was
$64.3 million
,
$110.8 million
and
$92.7 million
for 2016, 2015 and 2014, respectively. Total capital expenditures for property and equipment were
$65.7 million
,
$60.0 million
and
$53.7 million
for the years ended December 31, 2016, 2015 and 2014, respectively. We currently have approximately
$55.0 million
budgeted for renovation projects for 2017. We believe our current cash balances, our cash flow from operations and the amounts available under our credit facility will be sufficient to cover our operating needs for at least the next 12 months.
We may in the future seek to raise additional capital to fund growth, capital renovations, operations and other business activities, but such additional capital may not be available on acceptable terms, on a timely basis, or at all.
Our cash and cash equivalents as of
December 31, 2016
consisted of bank term deposits, money market funds and U.S. Treasury bill related investments. In addition, as of
December 31, 2016
, we held debt security investments of approximately
$35.2 million
, which were split between AA, A and BBB+ rated securities. Our market risk exposure is interest income sensitivity, which is affected by changes in the general level of U.S. interest rates. The primary objective of our investment activities is to preserve principal while at the same time maximizing the income we receive from our investments without significantly increasing risk. Due to the low risk profile of our investment portfolio, an immediate 10% change in interest rates would not have a material effect on the fair market value of our portfolio. Accordingly, we would not expect our operating results or cash flows to be affected to any significant degree by the effect of a sudden change in market interest rates on our securities portfolio.
The following table presents selected data from our consolidated statement of cash flows for the periods presented:
|
Year Ended December 31,
|
|||||||||||
|
|
2016
|
2015
|
2014
|
||||||||
|
|
(In thousands)
|
||||||||||
|
Net cash provided by operating activities
|
$
|
73,888
|
|
$
|
33,369
|
|
$
|
84,880
|
|
||
|
Net cash used in investing activities
|
(210,636
|
)
|
(168,538
|
)
|
(172,851
|
)
|
|||||
|
Net cash provided by financing activities
|
152,885
|
|
126,330
|
|
72,624
|
|
|||||
|
Net increase (decrease) in cash and cash equivalents
|
16,137
|
|
(8,839
|
)
|
(15,347
|
)
|
|||||
|
Cash and cash equivalents at beginning of period
|
41,569
|
|
50,408
|
|
65,755
|
|
|||||
|
Cash and cash equivalents at end of period
|
$
|
57,706
|
|
$
|
41,569
|
|
$
|
50,408
|
|
||
Year Ended
December 31, 2016
Compared to
Year Ended
December 31, 2015
Net cash provided by operating activities for the
year ended December 31, 2016
increased by
$40.5 million
. The
increase
was primarily due to the timing in accounts receivable collections and payments of the other operating assets and liabilities such as accounts payable and other accrued expenses. Operating activities for the year ended December 31, 2016 include the gain on sale of urgent care centers of
$19.2 million
. Similar gains did not occur in 2015.
Net cash used in investing activities for the
year ended December 31, 2016
increased by
$42.1 million
. The
increase
was primarily the result of the increase in purchases of business and asset acquisitions of
$73.6 million
, partially offset by the cash received from the sale of the urgent care centers of
$40.7 million
. In addition, capital expenditures increased by
$5.7 million
. The increase in capital expenditures in 2016 resulted from our continued investments in connection with constructing new facilities in existing and new markets and our continued investment in expanding and renovating our existing operations.
Net cash provided by financing activities increased by
$26.6 million
. This
increase
was primarily due to the receipt of
$510.0 million
in borrowing proceeds from our amendment of the credit facilities during the
year ended December 31, 2016
, partially offset by an increase in long-term debt repayments of
$345.1 million
and by the repurchases of common stock of
$30.0 million
.
Years Ended December 31, 2015 Compared to Years Ended December 31, 2014
93
Net cash provided by operating activities in 2015 decreased by $51.5 million. The decrease was primarily due to an increase in accounts receivable due to acquisitions which resulted in delayed timing of the receipt of payments for services provided to patients due to federal and state processing of licensure, offset by the timing of the other operating assets and liabilities such as payment of accounts payable and other accrued expenses and improved operating results in 2015. We also increased our insurance subsidiary deposits and investments by $10.8 million in 2015 compared to $1.5 million in 2014.
Net cash used in investing activities in 2015 decreased by $4.4 million. The decrease was due to the decrease in cash paid for business acquisitions and asset acquisitions, net of escrow deposits, of $3.0 million, offset by the increase in capital expenditures of $6.3 million and the increase in rent deposits for new lease agreements of $2.7 million. The increase in capital expenditures in 2015 resulted from our continued investments to constructing new facilities in existing and new markets and expanding and renovating our existing operations.
Net cash provided by financing activities increased by $53.7 million. This increase was primarily due to the net proceeds received from the common stock offering of $106.1 million and net proceeds from our revolving credit facility of $19.6 million on the revolving credit facility and other debt in 2015 and other cash outflows related to the Spin-Off during the year ended December 31, 2014 that did not recur in 2015.
Total long-term debt obligations, net of debt discount, outstanding as of the end of each fiscal year were as follows:
|
|
December 31,
|
||||||||||||||||||
|
|
2012
|
2013
|
2014
|
2015
|
2016
|
||||||||||||||
|
|
(In thousands)
|
||||||||||||||||||
|
Credit facilities and term loans
|
$
|
139,447
|
|
$
|
193,189
|
|
$
|
65,000
|
|
$
|
85,000
|
|
$
|
270,125
|
|
||||
|
Mortgage loan and promissory notes
|
68,245
|
|
66,117
|
|
3,390
|
|
14,671
|
|
14,032
|
|
|||||||||
|
Total
|
$
|
207,692
|
|
$
|
259,306
|
|
$
|
68,390
|
|
$
|
99,671
|
|
$
|
284,157
|
|
||||
The following table represents our cumulative growth from 2009 to the present:
|
|
December 31,
|
||||||||||||||||||||||
|
|
2009
|
2010
|
2011
|
2012
|
2013
|
2014
|
2015
|
2016
|
|||||||||||||||
|
Cumulative number of skilled nursing, assisted and independent living facilities
|
77
|
|
82
|
|
102
|
|
108
|
|
119
|
|
136
|
|
186
|
|
210
|
|
|||||||
|
Cumulative number of home health, home care and hospice agencies
|
1
|
|
3
|
|
7
|
|
10
|
|
16
|
|
25
|
|
32
|
|
39
|
|
|||||||
|
Cumulative number of urgent care centers
|
—
|
|
—
|
|
—
|
|
3
|
|
7
|
|
14
|
|
17
|
|
—
|
|
|||||||
Credit Facility with a Lending Consortium Arranged by SunTrust
We maintain a credit facility with a lending consortium arranged by SunTrust (as amended to date, the Credit Facility). On July 19, 2016, we entered into the second amendment to the credit facility (Second Amended Credit Facility), which amended the existing credit agreement to increase the aggregate principal amount up to
$450,000
. The Second Amended Credit Facility comprised of a
$300,000
revolving credit facility and a
$150,000
term loan. Borrowings under the term loan portion of the Second Amended Credit Facility will mature on February 5, 2021 and amortize in equal quarterly installments, in an aggregate annual amount equal to
5.0%
per annum of the original principal amount. The interest rates and commitment fee applicable to the Second Amended Credit Facility are similar to the Amended Credit Facility discussed below. Except as set forth in the Second Amended Credit Facility, all other terms and conditions of the Amended Credit Facility remained in full force and effect as described below.
On February 5, 2016, we amended our existing revolving credit facility to increase our aggregate principal amount available to
$250.0
million (the Amended Credit Facility). Under the Amended Credit Facility, we may seek to obtain incremental revolving or term loans in an aggregate amount not to exceed
$150.0 million
. The interest rates applicable to loans under the Amended Credit Facility are, at our option, equal to either a base rate plus a margin ranging from
0.75%
to
1.75%
per annum or LIBOR plus a margin ranging from
1.75%
to
2.75%
per annum, based on the Consolidated Total Net Debt to Consolidated EBITDA ratio (as defined in the agreement). In addition, we will pay a commitment fee on the unused portion of the commitments under the Amended Credit Facility that will range from
0.3%
to
0.5%
per annum, depending on the Consolidated Total Net Debt to
94
Consolidated EBITDA ratio of the Company and our subsidiaries. We are permitted to prepay all or any portion of the loans under the Amended Credit Facility prior to maturity without premium or penalty, subject to reimbursement of any LIBOR breakage costs of the lenders.
The Credit Facility is secured by a pledge of stock of our material operating subsidiaries as well as a first lien on substantially all of our personal property. The Credit Facility contains customary covenants that, among other things, restrict, subject to certain exceptions, the ability of the Company and our operating subsidiaries to grant liens on their assets, incur indebtedness, sell assets, make investments, engage in acquisitions, mergers or consolidations, amend certain material agreements and pay certain dividends and other restricted payments. Under the Credit Facility, we must comply with financial maintenance covenants to be tested quarterly, consisting of a maximum Consolidated Total Net Debt to Consolidated EBITDA ratio (which shall be increased to 3.50:1.00 for the current fiscal quarter and the immediate following three fiscal quarters), and a minimum interest/rent coverage ratio (which cannot be below 1.50:1.00). The majority of lenders can require that we and our operating subsidiaries mortgage certain of our real property assets to secure the credit facility if an event of default occurs, the Consolidated Total Net Debt to Consolidated EBITDA ratio is above 2.75:1.00 for two consecutive fiscal quarters, or our liquidity is equal or less than 10% of the Aggregate Revolving Commitment Amount (as defined in the agreement) for ten consecutive business days, provided that such mortgages will no longer be required if the event of default is cured, the Consolidated Total Net Debt to Consolidated EBITDA ratio is below 2.75:1.00 for two consecutive fiscal quarters, or our liquidity is above 10% of the Aggregate Revolving Commitment Amount (as defined in the agreement) or ninety consecutive days, as applicable. As of
December 31, 2016
, our operating subsidiaries had
$270.1 million
outstanding under the Credit Facility. The outstanding balance on the on the term loan was
$148.1 million
, of which
$7.5 million
is classified as short-term and the remaining
$140.6 million
is classified as long-term. The outstanding balance on the revolving Credit Facility was
$122.0 million
, which is classified as long-term. We were in compliance with all loan covenants as of
December 31, 2016
.
On May 30, 2014, we entered into the Credit Facility in an aggregate principal amount of
$150,000
from a syndicate of banks and other financial institutions. Under the Credit Facility, we may seek to obtain incremental revolving or term loans in an aggregate amount not to exceed
$75,000
.
The interest rates applicable to loans under the Credit Facility are, at our option, equal to either a base rate plus a margin ranging from
1.25%
to
2.25%
per annum or LIBOR plus a margin ranging from
2.25%
to
3.25%
per annum, based on the debt to Consolidated EBITDA ratio of the Company and our operating subsidiaries as defined in the agreement. In addition, the Company will pay a commitment fee on the unused portion of the commitments under the Credit Facility that will range from
0.30%
to
0.50%
per annum, depending on the debt to Consolidated EBITDA ratio of the Company and our operating subsidiaries. Loans made under the Credit Facility are not subject to interim amortization. We are not required to repay any loans under the Credit Facility prior to maturity, other than to the extent the outstanding borrowings exceed the aggregate commitments under the Credit Facility.
The Credit Facility is guaranteed, jointly and severally, by certain of our wholly owned subsidiaries, and is secured by substantially all of our personal property. Under the Credit Facility, we must comply with financial maintenance covenants to be tested quarterly, consisting of a maximum debt to consolidated EBITDA ratio, and a minimum interest/rent coverage ratio. The majority of lenders can require that the Company and our operating subsidiaries mortgage certain of their real property assets to secure the Credit Facility if an event of default occurs, the debt to consolidated EBITDA ratio is above
2.50
:
1.00
for two consecutive fiscal quarters, or our liquidity is equal or less than
10%
of the Aggregate Revolving Commitment Amount (as defined in the agreement) for ten consecutive business days, provided that such mortgages will no longer be required if the event of default is cured, the debt to consolidated EBITDA ratio is below
2.50
:
1.00
for two consecutive fiscal quarters, or our liquidity is above
10%
of the Aggregate Revolving Commitment Amount (as defined in the agreement) or ninety consecutive days, as applicable.
As of
February 6, 2017
, there was approximately
$300.0 million
outstanding under the Credit Facility.
Mortgage Loans and Promissory Note
We have outstanding indebtedness under mortgage loans and promissory note issued in connection with various acquisitions. The mortgage loans are insured with the U.S. Department of Housing and Urban Development (HUD), which subjects our operating subsidiaries to HUD oversight and periodic inspections. The mortgage loans and note bear fixed interest rates between
2.6%
and
5.3%
per annum. Amounts borrowed under the mortgage loans may be prepaid starting after the second anniversary of the notes subject to prepayment fees of the principal balance on the date of prepayment. These prepayment fees are reduced by
1.0%
per year for years
three
through
eleven
of the loan. There is no prepayment penalty after year
eleven
. The terms of the mortgage loans and note are between
12
and
33
years. The mortgage loans and note are secured by the real property comprising the facilities and the rents, issues and profits thereof, as well as all personal property used in the operation of the facilities. As of
December 31, 2016
, our operating subsidiaries had
$14.0 million
outstanding under the mortgage loans and note, of which
$0.6 million
is classified as short-term and the remaining
$13.4 million
is classified as long-term.
95
Contractual Obligations, Commitments and Contingencies
The following table sets forth our principal contractual obligations and commitments as of December 31, 2016, including the future periods in which payments are expected:
|
|
|
2017
|
|
2018
|
|
2019
|
|
2020
|
|
2021
|
Thereafter
|
|
Total
|
|||||||||||||||
|
|
|
|
|
|
|
(In thousands)
|
|
|
|
|||||||||||||||||||
|
Operating lease obligations
|
|
$
|
137,247
|
|
|
$
|
140,211
|
|
|
$
|
139,851
|
|
|
$
|
139,191
|
|
|
$
|
138,498
|
|
$
|
1,145,188
|
|
|
$
|
1,840,186
|
|
|
|
Long-term debt obligations
|
|
$
|
8,129
|
|
$
|
8,178
|
|
$
|
8,208
|
|
$
|
8,241
|
|
$
|
240,900
|
|
$
|
10,501
|
|
|
$
|
284,157
|
|
|||||
|
Interest payments on long-term debt
|
|
$
|
523
|
|
$
|
515
|
|
$
|
485
|
|
$
|
452
|
|
$
|
418
|
|
$
|
3,186
|
|
|
$
|
5,579
|
|
|||||
|
Total
|
|
$
|
145,899
|
|
$
|
148,904
|
|
$
|
148,544
|
|
$
|
147,884
|
|
$
|
379,816
|
|
$
|
1,158,875
|
|
$
|
2,129,922
|
|
||||||
Not included in the table above are our actuarially determined self-insured general and professional malpractice liability, workers' compensation and medical (including prescription drugs) and dental healthcare obligations which are broken out between current and long-term liabilities in our financial statements included in this Annual Report.
We lease from CareTrust REIT, Inc. (CareTrust) real property associated with
93
affiliated skilled nursing, assisted living and independent living facilities used in our operations under the Master Leases as a result of the tax free spin-off (Spin-Off). The Master Leases consist of multiple leases, each with its own pool of properties, that have varying maturities and diversity in property geography. Under each master lease, our individual subsidiaries that operate those properties are the tenants and CareTrust's individual subsidiaries that own the properties subject to the Master Leases are the landlords. The rent structure under the Master Leases includes a fixed component, subject to annual escalation equal to the lesser of the percentage change in the Consumer Price Index (but not less than zero) or
2.5%
.
We do not have the ability to terminate the obligations under a Master Lease prior to its expiration without CareTrust’s consent. If a Master Lease is terminated prior to its expiration other than with CareTrust’s consent, we may be liable for damages and incur charges such as continued payment of rent through the end of the lease term and maintenance and repair costs for the leased property.
The Master Leases arrangement is commonly known as a triple-net lease. Accordingly, in addition to rent, we are required to pay the following: (1) all impositions and taxes levied on or with respect to the leased properties (other than taxes on the income of the lessor), (2) all utilities and other services necessary or appropriate for the leased properties and the business conducted on the leased properties, (3) all insurance required in connection with the leased properties and the business conducted on the leased properties, (4) all facility maintenance and repair costs and (5) all fees in connection with any licenses or authorizations necessary or appropriate for the leased properties and the business conducted on the leased properties. Total rent expense under the Master Leases was approximately
$56.3 million
,
$56.0 million
and
$32.7 million
for the
years ended December 31, 2016, 2015 and 2014
, respectively.
At our option, the Master Leases may be extended for two or three five-year renewal terms beyond the initial term, on the same terms and conditions. If we elect to renew the term of a Master Lease, the renewal will be effective as to all, but not less than all, of the leased property then subject to the Master Lease.
Among other things, under the Master Leases, we must maintain compliance with specified financial covenants measured on a quarterly basis, including a portfolio coverage ratio and a minimum rent coverage ratio. The Master Leases also include certain reporting, legal and authorization requirements. As of
December 31, 2016
, we were in compliance with the Master Leases' covenants.
During the first quarter of 2016, we voluntarily discontinued operations in one of our skilled nursing facilities in order to preserve the overall ability to serve the residents in surrounding counties after careful consideration and some clinical survey challenges. As part of this closure, we entered into an agreement with our landlord allowing for the closure of the property as well as other provisions to allow our landlord to transfer the property and the licenses free and clear of the applicable master lease. This arrangement will not impact the rent expense to be paid in 2016, or expected to be paid in future periods, and will have no material impact on our lease coverage ratios under the Master Leases.
We also lease certain affiliated facilities and our administrative offices under non-cancelable operating leases, most of which have initial lease terms ranging from
five
to
20 years
. We have entered into multiple lease agreements with various landlords to operate newly constructed state-of-the-art, full-service healthcare resorts upon completion of construction. The term of each lease is
15
years with
two
five
-year renewal options and is subject to annual escalation equal to the percentage change in the Consumer
96
Price Index with a stated cap percentage. In addition, we lease certain of our equipment under non-cancelable operating leases with initial terms ranging from
three
to
five years
. Most of these leases contain renewal options, certain of which involve rent increases. Total rent expense, inclusive of straight-line rent adjustments and rent associated with the Master Leases noted above, was
$125.2 million
,
$89.3 million
and
$48.9 million
for the
years ended December 31, 2016, 2015 and 2014
, respectively.
Twenty-two
of our affiliated facilities, excluding the facilities that are operated under the Master Leases from CareTrust, are operated under
five
separate master lease arrangements. Under these master leases, a breach at a single facility could subject one or more of the other affiliated facilities covered by the same master lease to the same default risk. Failure to comply with Medicare and Medicaid provider requirements is a default under several of our leases, master lease agreements and debt financing instruments. In addition, other potential defaults related to an individual facility may cause a default of an entire master lease portfolio and could trigger cross-default provisions in our outstanding debt arrangements and other leases. With an indivisible lease, it is difficult to restructure the composition of the portfolio or economic terms of the lease without the consent of the landlord.
In November 2016, we entered into an agreement with our landlord to terminate the lease effective as of November 16, 2016. The lease of the facility was scheduled to expire on May 31, 2031. The lease terminates effective as of November 16, 2016. In addition, a number of our individual facility leases are held by the same or related landlords, and some of these leases include cross-default provisions that could cause a default at one facility to trigger a technical default with respect to others, potentially subjecting certain leases and facilities to the various remedies available to the landlords under separate but cross-defaulted leases. We are not aware of any defaults as of
December 31, 2016
.
U.S. Government Inquiry
In late 2006, we learned that we might be the subject of an on-going criminal and civil investigation by the DOJ. This was confirmed in March 2007. The investigation was prompted by a whistleblower complaint, and related primarily to claims submitted to the Medicare program for rehabilitation services provided at skilled nursing facilities in Southern California. We resolved and settled the matter for
$48.0 million
in 2013.
In October 2013, we and the government executed a final settlement agreement in accordance with the April agreement and we remitted full payment of
$48.0 million
. In addition, we executed a five-year corporate integrity agreement with the Office of Inspector General HHS as part of the resolution.
See additional description of our contingencies in Notes 16,
Debt,
18,
Leases
and 20,
Commitments and Contingencies
in Notes to Consolidated Financial Statements.
Inflation
We have historically derived a substantial portion of our revenue from the Medicare program. We also derive revenue from state Medicaid and similar reimbursement programs. Payments under these programs generally provide for reimbursement levels that are adjusted for inflation annually based upon the state’s fiscal year for the Medicaid programs and in each October for the Medicare program. These adjustments may not continue in the future, and even if received, such adjustments may not reflect the actual increase in our costs for providing healthcare services.
Labor and supply expenses make up a substantial portion of our cost of services. Those expenses can be subject to increase in periods of rising inflation and when labor shortages occur in the marketplace. To date, we have generally been able to implement cost control measures or obtain increases in reimbursement sufficient to offset increases in these expenses. We may not be successful in offsetting future cost increases.
Off-Balance Sheet Arrangements
As of December 31, 2016
, we had approximately
$2.3 million
on our credit facility of borrowing capacity pledged as collateral to secure outstanding letters of credit.
97
Item 7A.
Quantitative and Qualitative Disclosures about Market Risk
Interest Rate Risk.
We are exposed to risks associated with market changes in interest rates. Our credit facility exposes us to variability in interest payments due to changes in LIBOR interest rates. We manage our exposure to this market risk by monitoring available financing alternatives. Our mortgages and promissory notes require principal and interest payments through maturity pursuant to amortization schedules.
Our mortgages generally contain provisions that allow us to make repayments earlier than the stated maturity date. In some cases, we are not allowed to make early repayment prior to a cutoff date. Where prepayment is permitted, we are generally allowed to make prepayments only at a premium which is often designed to preserve a stated yield to the note holder. These prepayment rights may afford us opportunities to mitigate the risk of refinancing our debts at maturity at higher rates by refinancing prior to maturity.
At
December 31, 2016
, our subsidiaries had
$270.1 million
outstanding under the credit facility. On July 19, 2016, we entered into the Second Amended Credit Facility with a lending consortium arranged by SunTrust to make available a credit facility consisting of a
$300.0
million revolving line of credit and a
$150.0
million term loan component. Borrowings under the term loan portion of the credit facility mature on February 5, 2021 and amortize in equal quarterly installments, in an aggregate annual amount equal to
5.0%
per annum of the original principal amount. The interest rates, at our option, are equal to either a base rate plus a premium or LIBOR plus a premium. In addition, we are subject to pay a commitment fee on the unused portion of the commitments under the credit facility discussed in Item 7 of this Annual Report under the heading “Liquidity and Capital Resources.” Our exposure to fluctuations in interest rates may increase or decrease in the future with increases or decreases in the outstanding amount under the credit facility. As of
December 31, 2016
, our operating subsidiaries had
$270.1 million
outstanding under the credit facility. The outstanding balance on the on the term loan was
$148.1 million
, of which
$7.5 million
is classified as short-term and the remaining
$140.6 million
is classified as long-term. The outstanding balance on the revolving credit facility was
$122.0 million
, which is classified as long-term.
Our cash and cash equivalents as of
December 31, 2016
consisted of bank term deposits, money market funds and U.S. Treasury bill related investments. In addition, as of
December 31, 2016
, we held debt security investments of approximately
$35.2 million
, which were split between AA, A, and BBB+ rated securities. Our market risk exposure is interest income sensitivity, which is affected by changes in the general level of U.S. interest rates. The primary objective of our investment activities is to preserve principal while at the same time maximizing the income we receive from our investments without significantly increasing risk. Due to the low risk profile of our investment portfolio, an immediate 10% change in interest rates would not have a material effect on the fair market value of our portfolio. Accordingly, we would not expect our operating results or cash flows to be affected to any significant degree by the effect of a sudden change in market interest rates on our securities portfolio.
The above only incorporates those exposures that exist as of
December 31, 2016
and does not consider those exposures or positions which could arise after that date. If we diversify our investment portfolio into securities and other investment alternatives, we may face increased risk and exposures as a result of interest risk and the securities markets in general.
Item 8.
Financial Statements and Supplementary Data
Quarterly Financial Data (Unaudited)
The following table presents our unaudited quarterly consolidated results of operations for each of the eight quarters in the two-year period ended December 31, 2016. The unaudited quarterly consolidated information has been derived from our unaudited quarterly financial statements on Forms 10-Q, which were prepared on the same basis as our audited consolidated financial statements. You should read the following table presenting our quarterly consolidated results of operations in conjunction with our audited consolidated financial statements and the related notes included elsewhere in this Annual Report on Form 10-K. The operating results for any quarter are not necessarily indicative of the operating results for any future period.
98
|
|
Dec. 31,
|
|
Sept. 30,
|
|
June 30,
|
|
Mar. 31,
|
|
Dec. 31,
|
|
Sept. 30,
|
|
June 30,
|
|
Mar. 31,
|
||||||||||||||||
|
|
2016
|
|
2016
|
|
2016
|
|
2016
|
|
2015
|
|
2015
|
|
2015
|
|
2015
|
||||||||||||||||
|
|
(In thousands, except per share data)
|
||||||||||||||||||||||||||||||
|
Revenue
|
$
|
433,048
|
|
$
|
428,065
|
|
$
|
410,517
|
|
$
|
383,234
|
|
|
$
|
373,155
|
|
$
|
351,086
|
|
$
|
311,056
|
|
$
|
306,529
|
|
||||||
|
Cost of services
|
355,997
|
|
348,971
|
|
330,538
|
|
306,308
|
|
|
297,401
|
|
280,545
|
|
248,292
|
|
241,456
|
|
||||||||||||||
|
Total expenses
|
397,365
|
|
408,025
|
|
390,708
|
|
366,919
|
|
|
348,818
|
|
329,498
|
|
289,072
|
|
281,355
|
|
||||||||||||||
|
Income from operations
|
35,683
|
|
|
20,040
|
|
|
19,809
|
|
|
16,315
|
|
|
24,337
|
|
|
21,588
|
|
|
21,984
|
|
|
25,174
|
|
||||||||
|
Net income
|
$
|
21,006
|
|
$
|
11,184
|
|
$
|
11,363
|
|
$
|
9,290
|
|
$
|
14,437
|
|
$
|
13,159
|
|
$
|
13,233
|
|
$
|
15,088
|
|
|||||||
|
Income (loss) attributable to noncontrolling interests
|
2,669
|
|
29
|
|
37
|
|
118
|
|
836
|
|
(313
|
)
|
45
|
|
(82
|
)
|
|||||||||||||||
|
Net income attributable to The Ensign Group, Inc.
|
$
|
18,337
|
|
$
|
11,155
|
|
$
|
11,326
|
|
$
|
9,172
|
|
|
$
|
13,601
|
|
$
|
13,472
|
|
$
|
13,188
|
|
$
|
15,170
|
|
||||||
|
Net income per share attributable to The Ensign Group, Inc.
|
|||||||||||||||||||||||||||||||
|
Basic
|
$
|
0.36
|
|
$
|
0.22
|
|
$
|
0.23
|
|
$
|
0.18
|
|
|
$
|
0.27
|
|
$
|
0.26
|
|
$
|
0.26
|
|
$
|
0.32
|
|
||||||
|
Diluted
|
$
|
0.35
|
|
$
|
0.21
|
|
$
|
0.22
|
|
$
|
0.18
|
|
|
$
|
0.26
|
|
$
|
0.25
|
|
$
|
0.25
|
|
$
|
0.31
|
|
||||||
|
Weighted average common shares outstanding
(1)
:
|
|
|
|
||||||||||||||||||||||||||||
|
Basic
|
50,724
|
|
50,541
|
|
50,274
|
|
50,679
|
|
|
51,308
|
|
51,144
|
|
50,948
|
|
47,816
|
|
||||||||||||||
|
Diluted
|
52,231
|
|
52,045
|
|
51,931
|
|
52,334
|
|
|
53,193
|
|
53,070
|
|
52,866
|
|
49,652
|
|
||||||||||||||
(
The additional information required by this Item 8 is incorporated herein by reference to the financial statements set forth in Item 15 of this report,
Exhibits, Financial Statements and Schedules
.
Item 9.
Changes in and Disagreements with Accountants on Accounting and Financial Disclosures
None.
Item 9A.
Controls and Procedures
(a) Conclusion Regarding the Effectiveness of Disclosure Controls and Procedures
The Company maintains disclosure controls and procedures that are designed to ensure that information we are required to disclose in reports that we file or submit under the Exchange Act is recorded, processed, summarized and reported within the time periods specified in Securities and Exchange Commission rules and forms. In designing and evaluating our disclosure controls and procedures, our management recognized that any system of controls and procedures, no matter how well designed and operated, can provide only reasonable assurance of achieving the desired control objectives, as ours are designed to do, and management necessarily was required to apply its judgment in evaluating the cost-benefit relationship of possible controls and procedures.
In connection with the preparation of this Annual Report on Form 10-K our management evaluated, with the participation of our Chief Executive Officer and our Chief Financial Officer, the effectiveness of our disclosure controls and procedures, as such term is defined under Rule 13a-15(e) promulgated under the Exchange Act, and to ensure that information required to be disclosed is accumulated and communicated to our management, including our principal executive and financial officers, as appropriate to allow timely decisions regarding required disclosure. Based on this evaluation, our Chief Executive Officer and our Chief Financial Officer have concluded that our disclosure controls and procedures were effective as of the end of the period covered by this Annual Report on Form 10-K.
(b) Management's Report on Internal Control over Financial Reporting
Our management is responsible for establishing and maintaining adequate internal control over financial reporting, as defined in Rule 13a-15(f) promulgated under the Exchange Act. Internal control over financial reporting is designed to provide reasonable assurance regarding the reliability of financial reporting and the preparation of financial statements for external purposes in accordance with generally accepted accounting principles. Because of its inherent limitations, internal control over financial reporting may not prevent or detect misstatements. Also, projections of any evaluation of effectiveness to future periods are subject to the risk that controls may become inadequate because of changes in conditions, or that the degree of compliance with the policies or procedures may deteriorate.
99
Our management, with the participation of our Chief Executive Officer and our Chief Financial Officer, evaluated the effectiveness of our internal control over financial reporting using the criteria set forth by the Committee of Sponsoring Organizations of the Treadway Commission in
Internal Control - Integrated Framework (2013).
Based on our evaluation, our management concluded that our internal control over financial reporting was effective as of the end of the period covered by this Annual Report on Form 10-K.
Our independent registered public accounting firm, Deloitte & Touche LLP, has audited the consolidated financial statements included in this Annual Report on Form 10-K and, as part of their audit, has issued an audit report, included herein, on the effectiveness of our internal control over financial reporting. Their report is set forth below.
(c) Changes in Internal Control over Financial Reporting
There were no changes in our internal control over financial reporting, as defined in Rule 13a-15(f) promulgated under the Exchange Act, that occurred during the fourth quarter of fiscal 2016 that have materially affected, or are reasonably likely to materially affect, our internal control over financial reporting.
(d) Report of Independent Registered Accounting Firm
To the Board of Directors and Stockholders of The Ensign Group, Inc.
Mission Viejo, California
We have audited the internal control over financial reporting of The Ensign Group, Inc. and subsidiaries (the “Company”) as of December 31, 2016, based on criteria established in
Internal Control - Integrated Framework (2013)
issued by the Committee of Sponsoring Organizations of the Treadway Commission. The Company's management is responsible for maintaining effective internal control over financial reporting and for its assessment of the effectiveness of internal control over financial reporting, included in the accompanying Management's Report on Internal Control over Financial Reporting. Our responsibility is to express an opinion on the Company's internal control over financial reporting based on our audit.
We conducted our audit in accordance with the standards of the Public Company Accounting Oversight Board (United States). Those standards require that we plan and perform the audit to obtain reasonable assurance about whether effective internal control over financial reporting was maintained in all material respects. Our audit included obtaining an understanding of internal control over financial reporting, assessing the risk that a material weakness exists, testing and evaluating the design and operating effectiveness of internal control based on the assessed risk, and performing such other procedures as we considered necessary in the circumstances. We believe that our audit provides a reasonable basis for our opinion.
A company's internal control over financial reporting is a process designed by, or under the supervision of, the company's principal executive and principal financial officers, or persons performing similar functions, and effected by the company's board of directors, management, and other personnel to provide reasonable assurance regarding the reliability of financial reporting and the preparation of financial statements for external purposes in accordance with generally accepted accounting principles. A company's internal control over financial reporting includes those policies and procedures that (1) pertain to the maintenance of records that, in reasonable detail, accurately and fairly reflect the transactions and dispositions of the assets of the company; (2) provide reasonable assurance that transactions are recorded as necessary to permit preparation of financial statements in accordance with generally accepted accounting principles, and that receipts and expenditures of the company are being made only in accordance with authorizations of management and directors of the company; and (3) provide reasonable assurance regarding prevention or timely detection of unauthorized acquisition, use, or disposition of the company's assets that could have a material effect on the financial statements.
Because of the inherent limitations of internal control over financial reporting, including the possibility of collusion or improper management override of controls, material misstatements due to error or fraud may not be prevented or detected on a timely basis. Also, projections of any evaluation of the effectiveness of the internal control over financial reporting to future periods are subject to the risk that the controls may become inadequate because of changes in conditions, or that the degree of compliance with the policies or procedures may deteriorate.
In our opinion, the Company maintained, in all material respects, effective internal control over financial reporting as of December 31, 2016, based on the criteria established in
Internal Control - Integrated Framework (2013)
issued by the Committee of Sponsoring Organizations of the Treadway Commission.
100
We have also audited, in accordance with the standards of the Public Company Accounting Oversight Board (United States), the consolidated financial statements and financial statement schedule as of and for the year ended December 31, 2016 of the Company and our report dated February 8, 2017 expressed an unqualified opinion on those financial statements and financial statement schedule.
/s/ DELOITTE & TOUCHE LLP
Costa Mesa, California February 8, 2017
Item 9B.
Other Information
None.
Item 10.
Directors, Executive Officers and Corporate Governance
The information required by this Item is hereby incorporated by reference to our definitive proxy statement for the 2017 Annual Meeting of Stockholders.
We have adopted a code of ethics and business conduct that applies to all employees, including employees of our subsidiaries, as well as each member of our Board of Directors. The code of ethics and business conduct is available at our website at www.ensigngroup.net under the Investor Relations section. We intend to satisfy any disclosure requirement under Item 5.05 of Form 8-K regarding an amendment to, or waiver from, a provision of the code of ethics by posting such information on our website, at the address specified above.
Item 11.
Executive Compensation
The information required by this Item is hereby incorporated by reference to our definitive proxy statement for the 2017 Annual Meeting of Stockholders.
Item 12.
Security Ownership of Certain Beneficial Owners and Management and Related Stockholder Matters
The information required by this Item is hereby incorporated by reference to our definitive proxy statement for the 2017 Annual Meeting of Stockholders.
Item 13.
Certain Relationships and Related Transactions, and Director Independence
The information required by this Item is hereby incorporated by reference to our definitive proxy statement for the 2017 Annual Meeting of Stockholders.
Item 14.
Principal Accountant Fees and Services
The information required by this Item is hereby incorporated by reference to our definitive proxy statement for the 2017 Annual Meeting of Stockholders.
Item 15.
Exhibits, Financial Statements and Schedules
The following documents are filed as a part of this report:
(a) (1)
Financial Statements:
101
The Financial Statements described in Part II. Item 8 and beginning on page 105 are filed as part of this report.
(a) (2)
Financial Statement Schedule:
Schedule II: Valuation and Qualifying Accounts, immediately following the financial statements included in this Annual Report.
(a) (3)
Exhibits:
An “Exhibit Index” has been filed as a part of this Annual Report on Form 10-K and is incorporated herein by reference.
102
SIGNATURES
Pursuant to the requirements of the Securities Exchange Act of 1934, the registrant has duly caused this report to be signed on its behalf by the undersigned thereunto duly authorized.
|
|
THE ENSIGN GROUP, INC.
|
|
|
February 8, 2017
|
BY:
|
/s/ SUZANNE D. SNAPPER
|
|
|
|
Suzanne D. Snapper
|
|
|
|
Chief Financial Officer (Principal Financial Officer and Duly Authorized Officer)
|
Pursuant to the requirements of the Securities Exchange Act of 1934, this Report has been signed below by the following persons on behalf of the Registrant in the capacities and on the dates indicated.
|
Signature
|
|
Title
|
|
Date
|
|
|
|
|
|
|
|
/s/ CHRISTOPHER R. CHRISTENSEN
|
Chief Executive Officer, President and Director (principal executive officer)
|
|
February 8, 2017
|
|
|
Christopher R. Christensen
|
|
|||
|
/s/ SUZANNE D. SNAPPER
|
Chief Financial Officer (principal financial and accounting officer)
|
|
February 8, 2017
|
|
|
Suzanne D. Snapper
|
|
|||
|
/s/ ROY E. CHRISTENSEN
|
Chairman of the Board
|
|
February 8, 2017
|
|
|
Roy E. Christensen
|
|
|||
|
/s/ ANTOINETTE T. HUBENETTE
|
Director
|
|
February 8, 2017
|
|
|
Antoinette T. Hubenette
|
|
|||
|
/s/ JOHN G. NACKEL
|
Director
|
|
February 8, 2017
|
|
|
John G. Nackel
|
|
|||
|
/s/ DAREN J. SHAW
|
Director
|
February 8, 2017
|
||
|
Daren J. Shaw
|
||||
|
/s/ LEE A. DANIELS
|
Director
|
|
February 8, 2017
|
|
|
Lee A. Daniels
|
|
|||
|
/s/ BARRY M. SMITH
|
Director
|
|
February 8, 2017
|
|
|
Barry M. Smith
|
|
|||
103
THE ENSIGN GROUP, INC.
INDEX TO CONSOLIDATED FINANCIAL STATEMENTS
AND FINANCIAL STATEMENT SCHEDULES
|
Consolidated Financial Statements:
|
|
104
REPORT OF INDEPENDENT REGISTERED PUBLIC ACCOUNTING FIRM
To the Board of Directors and Stockholders of
The Ensign Group, Inc.
Mission Viejo, California
We have audited the accompanying consolidated balance sheets of The Ensign Group, Inc. and subsidiaries (the “Company”) as of December 31, 2016 and 2015, and the related consolidated statements of income, comprehensive income, stockholders' equity, and cash flows for each of the three years in the period ended December 31, 2016. Our audits also included the financial statement schedule listed in the Index at Item 15. These financial statements and the financial statement schedule are the responsibility of the Company's management. Our responsibility is to express an opinion on the financial statements and the financial statement schedule based on our audits.
We conducted our audits in accordance with the standards of the Public Company Accounting Oversight Board (United States). Those standards require that we plan and perform the audit to obtain reasonable assurance about whether the financial statements are free of material misstatement. An audit includes examining, on a test basis, evidence supporting the amounts and disclosures in the financial statements. An audit also includes assessing the accounting principles used and significant estimates made by management, as well as evaluating the overall financial statement presentation. We believe that our audits provide a reasonable basis for our opinion.
In our opinion, such consolidated financial statements present fairly, in all material respects, the financial position of The Ensign Group, Inc. and subsidiaries as of December 31, 2016 and 2015, and the results of their operations and their cash flows for each of the three years in the period ended December 31, 2016, in conformity with accounting principles generally accepted in the United States of America. Also, in our opinion, such financial statement schedule, when considered in relation to the basic consolidated financial statements taken as a whole, presents fairly, in all material respects, the information set forth therein.
We have also audited, in accordance with the standards of the Public Company Accounting Oversight Board (United States), the Company's internal control over financial reporting as of December 31, 2016, based on the criteria established in
Internal Control - Integrated Framework (2013)
issued by the Committee of Sponsoring Organizations of the Treadway Commission and our report dated February 8, 2017 expressed an unqualified opinion on the Company's internal control over financial reporting.
/s/ DELOITTE & TOUCHE LLP
Costa Mesa, California
February 8, 2017
105
THE ENSIGN GROUP, INC.
|
December 31,
|
|||||||
|
2016
|
2015
|
||||||
|
(In thousands, except par values)
|
|||||||
|
Assets
|
|
|
|||||
|
Current assets:
|
|
|
|||||
|
Cash and cash equivalents
|
$
|
57,706
|
|
$
|
41,569
|
|
|
|
Accounts receivable—less allowance for doubtful accounts of $39,791 and $30,308 at December 31, 2016 and December 31, 2015, respectively
|
244,433
|
|
209,026
|
|
|||
|
Investments—current
|
11,550
|
|
2,004
|
|
|||
|
Prepaid income taxes
|
302
|
|
8,141
|
|
|||
|
Prepaid expenses and other current assets
|
19,871
|
|
18,827
|
|
|||
|
Total current assets
|
333,862
|
|
279,567
|
|
|||
|
Property and equipment, net
|
484,498
|
|
299,633
|
|
|||
|
Insurance subsidiary deposits and investments
|
23,634
|
|
32,713
|
|
|||
|
Escrow deposits
|
1,582
|
|
400
|
|
|||
|
Deferred tax asset
|
23,073
|
|
20,852
|
|
|||
|
Restricted and other assets
|
12,614
|
|
9,631
|
|
|||
|
Intangible assets, net
|
35,076
|
|
45,431
|
|
|||
|
Goodwill
|
67,100
|
|
40,886
|
|
|||
|
Other indefinite-lived intangibles
|
19,586
|
|
18,646
|
|
|||
|
Total assets
|
$
|
1,001,025
|
|
$
|
747,759
|
|
|
|
Liabilities and equity
|
|
|
|||||
|
Current liabilities:
|
|
|
|||||
|
Accounts payable
|
$
|
38,991
|
|
$
|
36,029
|
|
|
|
Accrued wages and related liabilities
|
84,686
|
|
78,890
|
|
|||
|
Accrued self-insurance liabilities—current
|
21,359
|
|
18,122
|
|
|||
|
Other accrued liabilities
|
58,763
|
|
46,205
|
|
|||
|
Current maturities of long-term debt
|
8,129
|
|
620
|
|
|||
|
Total current liabilities
|
211,928
|
|
179,866
|
|
|||
|
Long-term debt—less current maturities
|
275,486
|
|
99,051
|
|
|||
|
Accrued self-insurance liabilities—less current portion
|
43,992
|
|
37,881
|
|
|||
|
Deferred rent and other long-term liabilities
|
9,124
|
|
3,976
|
|
|||
|
Total liabilities
|
540,530
|
|
320,774
|
|
|||
|
Commitments and contingencies (Notes 16, 18 and 20)
|
|
|
|||||
|
Equity:
|
|
|
|||||
|
Ensign Group, Inc. stockholders' equity:
|
|||||||
|
Common stock; $0.001 par value; 75,000 shares authorized; 52,787 and 50,838 shares issued and outstanding at December 31, 2016, respectively, and 51,918 and 51,370 shares issued and outstanding at December 31, 2015, respectively (Note 3)
|
52
|
|
51
|
|
|||
|
Additional paid-in capital (Note 3)
|
252,493
|
|
235,076
|
|
|||
|
Retained earnings
|
235,021
|
|
193,420
|
|
|||
|
Common stock in treasury, at cost, 1,520 and 123 shares at December 31, 2016 and December 31, 2015, respectively (Note 3)
|
(31,117
|
)
|
(1,223
|
)
|
|||
|
Total Ensign Group, Inc. stockholders' equity
|
456,449
|
|
427,324
|
|
|||
|
Non-controlling interest
|
4,046
|
|
(339
|
)
|
|||
|
Total equity
|
460,495
|
|
426,985
|
|
|||
|
Total liabilities and equity
|
$
|
1,001,025
|
|
$
|
747,759
|
|
|
106
THE ENSIGN GROUP, INC.
|
Year Ended December 31,
|
|||||||||||
|
|
2016
|
|
2015
|
2014
|
|||||||
|
(In thousands, except per share data)
|
|||||||||||
|
Revenue
|
$
|
1,654,864
|
|
$
|
1,341,826
|
|
$
|
1,027,406
|
|
||
|
Expense:
|
|||||||||||
|
Cost of services
|
1,341,814
|
|
1,067,694
|
|
822,669
|
|
|||||
|
Gain related to divestitures (Note 18 and 19)
|
(11,225
|
)
|
—
|
|
—
|
|
|||||
|
Rent—cost of services (Note 18)
|
124,581
|
|
88,776
|
|
48,488
|
|
|||||
|
General and administrative expense
|
69,165
|
|
64,163
|
|
56,895
|
|
|||||
|
Depreciation and amortization
|
38,682
|
|
28,111
|
|
26,430
|
|
|||||
|
Total expenses
|
1,563,017
|
|
1,248,744
|
|
954,482
|
|
|||||
|
Income from operations
|
91,847
|
|
93,082
|
|
72,924
|
|
|||||
|
Other income (expense):
|
|||||||||||
|
Interest expense
|
(7,136
|
)
|
(2,828
|
)
|
(12,976
|
)
|
|||||
|
Interest income
|
1,107
|
|
845
|
|
594
|
|
|||||
|
Other expense, net
|
(6,029
|
)
|
(1,983
|
)
|
(12,382
|
)
|
|||||
|
Income before provision for income taxes
|
85,818
|
|
91,099
|
|
60,542
|
|
|||||
|
Provision for income taxes
|
32,975
|
|
35,182
|
|
26,801
|
|
|||||
|
Net income
|
52,843
|
|
55,917
|
|
33,741
|
|
|||||
|
Less: net income (loss) attributable to noncontrolling interests
|
2,853
|
|
|
485
|
|
(2,209
|
)
|
||||
|
Net income attributable to The Ensign Group, Inc.
|
$
|
49,990
|
|
$
|
55,432
|
|
$
|
35,950
|
|
||
|
Net income per share attributable to The Ensign Group, Inc.:
|
|
||||||||||
|
Basic
|
$
|
0.99
|
|
$
|
1.10
|
|
$
|
0.80
|
|
||
|
Diluted
|
$
|
0.96
|
|
$
|
1.06
|
|
$
|
0.78
|
|
||
|
Weighted average common shares outstanding:
|
|
||||||||||
|
Basic
|
50,555
|
|
50,316
|
|
44,682
|
|
|||||
|
Diluted
|
52,133
|
|
52,210
|
|
46,190
|
|
|||||
|
Dividends per share
|
$
|
0.1625
|
|
$
|
0.1525
|
|
$
|
0.1425
|
|
||
See accompanying notes to consolidated financial statements.
107
THE ENSIGN GROUP, INC.
CONSOLIDATED STATEMENTS OF COMPREHENSIVE INCOME
|
|
Year Ended December 31,
|
||||||||||
|
|
2016
|
2015
|
2014
|
||||||||
|
(In thousands)
|
|||||||||||
|
Net income
|
52,843
|
|
55,917
|
|
33,741
|
|
|||||
|
Other comprehensive income, net of tax:
|
|
||||||||||
|
Unrealized gain on interest rate swap, net of income tax provision of $78 for the years ended December 31, 2014.
|
—
|
|
—
|
|
89
|
|
|||||
|
Reclassification of derivative loss to income, net of income tax benefit of $638 for the year ended December 31, 2014.
|
—
|
|
—
|
|
1,023
|
|
|||||
|
Comprehensive income
|
52,843
|
|
55,917
|
|
34,853
|
|
|||||
|
Less: net income (loss) attributable to noncontrolling interests
|
2,853
|
|
485
|
|
(2,209
|
)
|
|||||
|
Comprehensive income attributable to The Ensign Group, Inc.
|
$
|
49,990
|
|
$
|
55,432
|
|
$
|
37,062
|
|
||
See accompanying notes to consolidated financial statements.
108
THE ENSIGN GROUP, INC.
CONSOLIDATED STATEMENTS OF STOCKHOLDERS' EQUITY
|
|
Common Stock
|
|
Additional Paid-In Capital
|
|
Retained Earnings
|
|
Treasury Stock
|
|
Accumulated Other Comprehensive Loss
|
Non-Controlling Interest
|
|||||||||||||||||||||||
|
|
Shares
|
|
Amount
|
|
|
|
Shares
|
|
Amount
|
|
Total
|
||||||||||||||||||||||
|
Balance - January 1, 2014
|
22,113
|
|
22
|
|
101,364
|
|
257,502
|
|
237
|
|
(1,680
|
)
|
(1,112
|
)
|
1,161
|
|
357,257
|
|
|||||||||||||||
|
Issuance of common stock to employees and directors resulting from the exercise of stock options and grant of stock awards
|
415
|
|
—
|
|
3,475
|
|
—
|
|
(87
|
)
|
370
|
|
—
|
|
—
|
|
3,845
|
|
|||||||||||||||
|
Issuance of restricted stock to employees
|
63
|
|
—
|
|
—
|
|
—
|
|
—
|
|
—
|
|
—
|
|
—
|
|
—
|
|
|||||||||||||||
|
Dividends declared
|
—
|
|
—
|
|
—
|
|
(6,441
|
)
|
—
|
|
—
|
|
—
|
|
—
|
|
(6,441
|
)
|
|||||||||||||||
|
Employee stock award compensation
|
—
|
|
—
|
|
5,190
|
|
—
|
|
—
|
|
—
|
|
—
|
|
—
|
|
5,190
|
|
|||||||||||||||
|
Excess tax benefit from share-based compensation
|
—
|
|
—
|
|
4,264
|
|
—
|
|
—
|
|
—
|
|
—
|
|
—
|
|
4,264
|
|
|||||||||||||||
|
Net loss attributable to noncontrolling interest
|
—
|
|
—
|
|
—
|
|
—
|
|
—
|
|
—
|
|
—
|
|
(2,209
|
)
|
(2,209
|
)
|
|||||||||||||||
|
Distribution of net assets to CareTrust (Note 23)
|
—
|
|
—
|
|
—
|
|
(141,165
|
)
|
—
|
|
—
|
|
—
|
|
—
|
|
(141,165
|
)
|
|||||||||||||||
|
Net Income attributable to the Ensign Group, Inc.
|
—
|
|
—
|
|
—
|
|
35,950
|
|
—
|
|
—
|
|
—
|
|
—
|
|
35,950
|
|
|||||||||||||||
|
Termination of swap and other comprehensive income
|
—
|
|
—
|
|
—
|
|
—
|
|
—
|
|
—
|
|
1,112
|
|
—
|
|
1,112
|
|
|||||||||||||||
|
Balance - December 31, 2014
|
22,591
|
|
$
|
22
|
|
$
|
114,293
|
|
$
|
145,846
|
|
150
|
|
$
|
(1,310
|
)
|
$
|
—
|
|
$
|
(1,048
|
)
|
$
|
257,803
|
|
||||||||
|
Issuance of common stock to employees and directors resulting from the exercise of stock options and grant of stock awards
|
255
|
|
—
|
|
2,443
|
|
—
|
|
(27
|
)
|
87
|
|
—
|
|
—
|
|
2,530
|
|
|||||||||||||||
|
Issuance of restricted stock to employees
|
105
|
|
—
|
|
1,892
|
|
—
|
|
—
|
|
—
|
|
—
|
|
—
|
|
1,892
|
|
|||||||||||||||
|
Issuance of common stock through public offering, net of issuance costs
|
2,734
|
|
3
|
|
106,117
|
|
—
|
|
—
|
|
—
|
|
—
|
|
—
|
|
106,120
|
|
|||||||||||||||
|
Dividends declared
|
—
|
|
—
|
|
|
|
(7,858
|
)
|
—
|
|
—
|
|
—
|
|
—
|
|
(7,858
|
)
|
|||||||||||||||
|
Employee stock award compensation
|
—
|
|
—
|
|
6,677
|
|
—
|
|
—
|
|
—
|
|
—
|
|
—
|
|
6,677
|
|
|||||||||||||||
|
Excess tax benefit from share-based compensation
|
—
|
|
—
|
|
3,680
|
|
—
|
|
—
|
|
—
|
|
—
|
|
—
|
|
3,680
|
|
|||||||||||||||
|
Stock issued to effect stock split
|
25,685
|
|
26
|
|
(26
|
)
|
—
|
|
—
|
|
—
|
|
—
|
|
—
|
|
—
|
|
|||||||||||||||
|
Noncontrolling interest assumed related to acquisition
|
—
|
|
—
|
|
—
|
|
—
|
|
—
|
|
—
|
|
—
|
|
224
|
|
224
|
|
|||||||||||||||
|
Net income attributable to noncontrolling interest
|
—
|
|
—
|
|
—
|
|
—
|
|
—
|
|
—
|
|
—
|
|
485
|
|
485
|
|
|||||||||||||||
|
Net Income attributable to the Ensign Group, Inc.
|
—
|
|
—
|
|
—
|
|
55,432
|
|
—
|
|
—
|
|
—
|
|
—
|
|
55,432
|
|
|||||||||||||||
|
Balance - December 31, 2015
|
51,370
|
|
$
|
51
|
|
$
|
235,076
|
|
$
|
193,420
|
|
123
|
|
$
|
(1,223
|
)
|
$
|
—
|
|
$
|
(339
|
)
|
$
|
426,985
|
|
||||||||
|
Issuance of common stock to employees and directors resulting from the exercise of stock options and grant of stock awards
|
668
|
|
1
|
|
4,045
|
|
—
|
|
(55
|
)
|
106
|
|
—
|
|
—
|
|
4,152
|
|
|||||||||||||||
|
Issuance of restricted stock to employees
|
252
|
|
—
|
|
2,517
|
|
—
|
|
—
|
|
—
|
|
—
|
|
—
|
|
2,517
|
|
|||||||||||||||
|
Repurchase of common stock (Note 3)
|
(1,452
|
)
|
|
|
|
|
|
|
1,452
|
|
(30,000
|
)
|
—
|
|
—
|
|
(30,000
|
)
|
|||||||||||||||
|
Dividends declared
|
—
|
|
—
|
|
—
|
|
(8,282
|
)
|
—
|
|
—
|
|
—
|
|
—
|
|
(8,282
|
)
|
|||||||||||||||
|
Employee stock award compensation
|
—
|
|
—
|
|
7,776
|
|
—
|
|
—
|
|
—
|
|
—
|
|
—
|
|
7,776
|
|
|||||||||||||||
|
Excess tax benefit from share-based compensation
|
—
|
|
—
|
|
3,079
|
|
—
|
|
—
|
|
—
|
|
—
|
|
—
|
|
3,079
|
|
|||||||||||||||
|
Noncontrolling interest attributable to subsidiary equity plan (Note 17)
|
—
|
|
—
|
|
—
|
|
(107
|
)
|
—
|
|
—
|
|
—
|
|
1,432
|
|
1,325
|
|
|||||||||||||||
|
Noncontrolling interest assumed related to acquisition
|
—
|
|
—
|
|
—
|
|
—
|
|
—
|
|
—
|
|
—
|
|
100
|
|
100
|
|
|||||||||||||||
|
Net income attributable to noncontrolling interest
|
—
|
|
—
|
|
—
|
|
—
|
|
—
|
|
—
|
|
—
|
|
2,853
|
|
2,853
|
|
|||||||||||||||
|
Net Income attributable to the Ensign Group, Inc.
|
—
|
|
—
|
|
—
|
|
49,990
|
|
—
|
|
—
|
|
—
|
|
—
|
|
49,990
|
|
|||||||||||||||
|
Balance - December 31, 2016
|
50,838
|
|
$
|
52
|
|
$
|
252,493
|
|
$
|
235,021
|
|
1,520
|
|
$
|
(31,117
|
)
|
$
|
—
|
|
$
|
4,046
|
|
$
|
460,495
|
|
||||||||
See accompanying notes to consolidated financial statements.
109
THE ENSIGN GROUP, INC.
(In thousands)
|
Year Ended December 31,
|
|||||||||||
|
|
2016
|
2015
|
2014
|
||||||||
|
Cash flows from operating activities:
|
|
|
|||||||||
|
Net income
|
$
|
52,843
|
|
$
|
55,917
|
|
$
|
33,741
|
|
||
|
Adjustments to reconcile net income to net cash provided by operating activities:
|
|||||||||||
|
Depreciation and amortization
|
38,682
|
|
28,111
|
|
26,430
|
|
|||||
|
Amortization of deferred financing fees
|
825
|
|
591
|
|
687
|
|
|||||
|
Fixed assets impairment
|
137
|
|
—
|
|
—
|
|
|||||
|
Write-off of deferred financing fees
|
321
|
|
—
|
|
—
|
|
|||||
|
Deferred income taxes
|
(2,208
|
)
|
1,251
|
|
(3,110
|
)
|
|||||
|
Provision for doubtful accounts
|
28,512
|
|
19,802
|
|
13,179
|
|
|||||
|
Share-based compensation
|
9,101
|
|
6,677
|
|
5,190
|
|
|||||
|
Excess tax benefit from share-based compensation
|
(3,079
|
)
|
(3,680
|
)
|
(4,264
|
)
|
|||||
|
Loss on extinguishment of debt
|
—
|
|
—
|
|
4,067
|
|
|||||
|
Loss on termination of interest rate swap
|
—
|
|
—
|
|
1,661
|
|
|||||
|
(Gain)/loss on disposition of property and equipment
|
164
|
|
205
|
|
100
|
|
|||||
|
Gain on sale of urgent care centers
|
(19,160
|
)
|
—
|
|
—
|
|
|||||
|
Change in operating assets and liabilities
|
|
||||||||||
|
Accounts receivable
|
(63,617
|
)
|
(100,324
|
)
|
(31,867
|
)
|
|||||
|
Prepaid income taxes
|
7,839
|
|
(5,149
|
)
|
6,897
|
|
|||||
|
Prepaid expenses and other assets
|
(1,465
|
)
|
(10,340
|
)
|
864
|
|
|||||
|
Insurance subsidiary deposits and investments
|
(467
|
)
|
(10,785
|
)
|
(1,533
|
)
|
|||||
|
Losses related to operational closures (Note 18)
|
7,205
|
|
—
|
|
—
|
|
|||||
|
Accounts payable
|
577
|
|
1,780
|
|
7,978
|
|
|||||
|
Accrued wages and related liabilities
|
(4,978
|
)
|
22,178
|
|
16,644
|
|
|||||
|
Income taxes payable
|
987
|
|
—
|
|
—
|
|
|||||
|
Other accrued liabilities
|
12,588
|
|
21,403
|
|
6,337
|
|
|||||
|
Accrued self-insurance liabilities
|
8,125
|
|
5,418
|
|
1,881
|
|
|||||
|
Deferred rent liability
|
956
|
|
314
|
|
(2
|
)
|
|||||
|
Net cash provided by operating activities
|
73,888
|
|
33,369
|
|
84,880
|
|
|||||
|
Cash flows from investing activities:
|
|
|
|||||||||
|
Purchase of property and equipment
|
(65,699
|
)
|
(60,018
|
)
|
(53,693
|
)
|
|||||
|
Cash payment for business acquisitions
|
(64,310
|
)
|
(110,802
|
)
|
(92,669
|
)
|
|||||
|
Cash payment for asset acquisitions
|
(120,935
|
)
|
(17,750
|
)
|
(7,938
|
)
|
|||||
|
Escrow deposits
|
(1,582
|
)
|
(400
|
)
|
(16,153
|
)
|
|||||
|
Escrow deposits used to fund business acquisitions
|
400
|
|
16,153
|
|
1,000
|
|
|||||
|
Increase in restricted cash
|
—
|
|
—
|
|
(8,219
|
)
|
|||||
|
Use of restricted cash
|
—
|
|
5,082
|
|
3,137
|
|
|||||
|
Cash received from sale of urgent care centers and franchising businesses, net of note receivable
|
40,734
|
|
2,000
|
|
2,000
|
|
|||||
|
Cash proceeds from the sale of property and equipment and insurance proceeds
|
391
|
|
10
|
|
24
|
|
|||||
|
Restricted and other assets
|
365
|
|
(2,813
|
)
|
(340
|
)
|
|||||
|
Net cash used in investing activities
|
(210,636
|
)
|
(168,538
|
)
|
(172,851
|
)
|
|||||
|
Cash flows from financing activities:
|
|
|
|||||||||
|
Proceeds from revolving credit facility (Note 16)
|
844,000
|
|
334,000
|
|
495,677
|
|
|||||
|
Payments on revolving credit facility and other debt (Note 16 and Note 3)
|
(659,514
|
)
|
(314,417
|
)
|
(331,198
|
)
|
|||||
|
Proceeds from common stock offering (Note 3)
|
—
|
|
112,078
|
|
—
|
|
|||||
|
Issuance costs in connection with common stock offering (Note 3)
|
—
|
|
(5,961
|
)
|
—
|
|
|||||
|
Issuance of treasury stock upon exercise of options
|
106
|
|
87
|
|
370
|
|
|||||
|
Cash retained by CareTrust at separation (Note 23)
|
—
|
|
—
|
|
(78,731
|
)
|
|||||
|
Issuance of common stock upon exercise of options
|
6,563
|
|
4,337
|
|
3,475
|
|
|||||
|
Repurchase of shares of common stock (Note 3)
|
(30,000
|
)
|
—
|
|
—
|
|
|||||
|
Dividends paid
|
(8,173
|
)
|
(7,494
|
)
|
(6,297
|
)
|
|||||
|
Excess tax benefit from share-based compensation
|
3,181
|
|
3,700
|
|
4,280
|
|
|||||
|
Prepayment penalty on early retirement of debt
|
—
|
|
—
|
|
(2,069
|
)
|
|||||
|
Payments of deferred financing costs
|
(3,278
|
)
|
—
|
|
(12,883
|
)
|
|||||
|
Net cash provided by financing activities
|
152,885
|
|
126,330
|
|
72,624
|
|
|||||
|
Net increase (decrease) in cash and cash equivalents
|
16,137
|
|
(8,839
|
)
|
(15,347
|
)
|
|||||
|
Cash and cash equivalents beginning of period
|
41,569
|
|
50,408
|
|
65,755
|
|
|||||
|
Cash and cash equivalents end of period
|
$
|
57,706
|
|
$
|
41,569
|
|
$
|
50,408
|
|
||
See accompanying notes to consolidated financial statements.
110
THE ENSIGN GROUP, INC.
CONSOLIDATED STATEMENTS OF CASH FLOWS - (Continued)
|
Year Ended December 31,
|
|||||||||||
|
|
2016
|
2015
|
2014
|
||||||||
|
Supplemental disclosures of cash flow information:
|
|
|
|||||||||
|
Cash paid during the period for:
|
|
|
|||||||||
|
Interest
|
$
|
6,428
|
|
$
|
2,773
|
|
$
|
13,511
|
|
||
|
Income taxes
|
$
|
23,163
|
|
$
|
35,490
|
|
$
|
22,029
|
|
||
|
Non-cash financing and investing activity:
|
|
|
|||||||||
|
Accrued capital expenditures
|
$
|
6,828
|
|
$
|
4,171
|
|
$
|
3,109
|
|
||
|
Note receivable from sale of urgent care centers and franchising business
|
$
|
700
|
|
$
|
—
|
|
$
|
2,000
|
|
||
|
Favorable lease included in the fair value of assets acquisitions
|
$
|
7,190
|
|
$
|
—
|
|
$
|
—
|
|
||
|
Refundable deposits assumed as part of business acquisition
|
$
|
—
|
|
$
|
3,488
|
|
$
|
—
|
|
||
|
Debt assumed as part of asset acquisition
|
$
|
—
|
|
$
|
11,699
|
|
$
|
3,417
|
|
||
See accompanying notes to consolidated financial statements.
111
THE ENSIGN GROUP, INC.
NOTES TO CONSOLIDATED FINANCIAL STATEMENTS
(Dollars and shares in thousands, except per share data)
1. DESCRIPTION OF BUSINESS
The Company -
The Ensign Group, Inc. (collectively, Ensign or the Company), is a holding company with no direct operating assets, employees or revenue. The Company, through its operating subsidiaries, is a provider of health care services across the post-acute care continuum, as well as, other ancillary businesses. As of
December 31, 2016
, the Company operated
210
facilities,
39
home health, hospice and home care agencies and other ancillary operations located in Arizona, California, Colorado, Idaho, Iowa, Kansas, Nebraska, Nevada, Oregon, South Carolina, Texas, Utah, Washington and Wisconsin. The Company historically operated urgent care clinics in Colorado and Washington. The Company completed the sale of its urgent care centers in 2016. The Company's operating subsidiaries, each of which strives to be the operation of choice in the community it serves, provide a broad spectrum of skilled nursing, assisted living, home health, home care, hospice, urgent care and other ancillary services. The Company's operating subsidiaries have a collective capacity of approximately
17,700
operational skilled nursing beds and
4,450
assisted living and independent living units. As of
December 31, 2016
, the Company owned
50
of its
210
affiliated facilities and leased an additional
160
facilities through long-term lease arrangements and had options to purchase
9
of those
160
facilities. As of
December 31, 2015
, the Company owned
32
of its
186
affiliated facilities and leased an additional
154
facilities through long-term lease arrangements, and had options to purchase
20
of those
154
facilities.
Certain of the Company’s wholly-owned independent subsidiaries, collectively referred to as the Service Center, provide certain accounting, payroll, human resources, information technology, legal, risk management and other centralized services to the other operating subsidiaries through contractual relationships with such subsidiaries. The Company also has a wholly-owned captive insurance subsidiary (the Captive) that provides some claims-made coverage to the Company’s operating subsidiaries for general and professional liability, as well as coverage for certain workers’ compensation insurance liabilities.
Each of the Company's affiliated operations are operated by separate, wholly-owned, independent subsidiaries that have their own management, employees and assets. References herein to the consolidated “Company” and “its” assets and activities in this Annual Report is not meant to imply, nor should it be construed as meaning, that The Ensign Group, Inc. has direct operating assets, employees or revenue, or that any of the subsidiaries, are operated by The Ensign Group, Inc.
2. SUMMARY OF SIGNIFICANT ACCOUNTING POLICIES
Basis of Presentation —
The accompanying consolidated financial statements (Financial Statements) have been prepared in accordance with accounting principles generally accepted in the United States (GAAP). The Company is the sole member or shareholder of various consolidated limited liability companies and corporations established to operate various acquired skilled nursing and assisted living operations, home health, hospice and home care operations, urgent care centers and related ancillary services. All intercompany transactions and balances have been eliminated in consolidation. The Company presents noncontrolling interest within the equity section of its consolidated balance sheets. The Company presents the amount of consolidated net income that is attributable to The Ensign Group, Inc. and the noncontrolling interest in its consolidated statements of income.
The consolidated financial statements include the accounts of all entities controlled by the Company through its ownership of a majority voting interest and the accounts of any variable interest entities (VIEs) where the Company is subject to a majority of the risk of loss from the VIE's activities, or entitled to receive a majority of the entity's residual returns, or both. The Company assesses the requirements related to the consolidation of VIEs, including a qualitative assessment of power and economics that considers which entity has the power to direct the activities that "most significantly impact" the VIE's economic performance and has the obligation to absorb losses of, or the right to receive benefits that could be potentially significant to, the VIE. The Company's relationship with variable interest entities was not material during the year ended
December 31, 2016
.
The Company completed the sale of its urgent care centers for an aggregate purchase price of
$41,492
. The sale transactions do not meet the criteria of discontinued operations as they do not represent a strategic shift that has, or will have, a major effect on the Company’s operations and financial results.
Reclassifications
- Prior period results reflect reclassifications, for comparative purposes, related to the early adoption of authoritative guidance for the presentation of deferred taxes. Deferred tax assets have been presented on the balance sheets as a non-current asset for all periods presented. Historically, these assets were classified as either current or non-current assets, as applicable.
112
Estimates and Assumptions —
The preparation of Financial Statements in conformity with GAAP requires management to make estimates and assumptions that affect the reported amounts of assets and liabilities and disclosure of contingent assets and liabilities at the date of the financial statements and the reported amounts of revenue and expenses during the reporting periods. The most significant estimates in the Company’s Financial Statements relate to revenue, allowance for doubtful accounts, intangible assets and goodwill, impairment of long-lived assets, general and professional liability, workers' compensation and healthcare claims included in accrued self-insurance liabilities and income taxes. Actual results could differ from those estimates.
Fair Value of Financial Instruments —
The Company’s financial instruments consist principally of cash and cash equivalents, debt security investments, accounts receivable, insurance subsidiary deposits, accounts payable and borrowings. The Company believes all of the financial instruments’ recorded values approximate fair values because of their nature or respective short durations.
Revenue Recognition —
The Company recognizes revenue when the following four conditions have been met: (i) there is persuasive evidence that an arrangement exists; (ii) delivery has occurred or service has been rendered; (iii) the price is fixed or determinable; and (iv) collection is reasonably assured. The Company's revenue is derived primarily from providing healthcare services to patients and is recognized on the date services are provided at amounts billable to the individual. For reimbursement arrangements with third-party payors, including Medicaid, Medicare and private insurers, revenue is recorded based on contractually agreed-upon amounts on a per patient basis.
Revenue from the Medicare and Medicaid programs accounted for
67.8%
,
69.1%
and
71.4%
of the Company's revenue for the
years ended December 31, 2016, 2015 and 2014
, respectively. The Company records revenue from these governmental and managed care programs as services are performed at their expected net realizable amounts under these programs. The Company’s revenue from governmental and managed care programs is subject to audit and retroactive adjustment by governmental and third-party agencies. Consistent with healthcare industry accounting practices, any changes to these governmental revenue estimates are recorded in the period the change or adjustment becomes known based on final settlement. The Company recorded adjustments to revenue which were not material to the Company's consolidated revenue for the
years ended December 31, 2016, 2015 and 2014
.
The Company’s service specific revenue recognition policies are as follows:
Skilled Nursing Revenue
The Company’s revenue is derived primarily from providing long-term healthcare services to patients and is recognized on the date services are provided at amounts billable to individual patients. For patients under reimbursement arrangements with third-party payors, including Medicaid, Medicare and private insurers, revenue is recorded based on contractually agreed-upon amounts or rate on a per patient, daily basis or as services are performed.
Assisted and Independent Living Revenue
The Company's revenue is recorded when services are rendered on the date services are provided at amounts billable to individual residents and consists of fees for basic housing and assisted living care. Residency agreements are generally for a term of 30 days, with resident fees billed monthly in advance. For patients under reimbursement arrangements with Medicaid, revenue is recorded based on contractually agreed-upon amounts or rate on a per resident, daily basis or as services. Revenue for certain ancillary charges is recognized as services are provided, and such fees are billed monthly in arrears.
Home Health Revenue
Medicare Revenue
Net service revenue is recorded under the Medicare prospective payment system based on a 60-day episode payment rate that is subject to adjustment based on certain variables including, but not limited to: (a) an outlier payment if patient care was unusually costly; (b) a low utilization payment adjustment if the number of visits was fewer than five; (c) a partial payment if the patient transferred to another provider or the Company received a patient from another provider before completing the episode; (d) a payment adjustment based upon the level of therapy services required; (e) the number of episodes of care provided to a patient, regardless of whether the same home health provider provided care for the entire series of episodes; (f) changes in the base episode payments established by the Medicare program; (g) adjustments to the base episode payments for case mix and geographic wages; and (h) recoveries of overpayments.
The Company makes adjustments to Medicare revenue on completed episodes to reflect differences between estimated and actual payment amounts, an inability to obtain appropriate billing documentation or authorizations acceptable to the payor and
113
other reasons unrelated to credit risk. Therefore, the Company believes that its reported net service revenue and patient accounts receivable will be the net amounts to be realized from Medicare for services rendered.
In addition to revenue recognized on completed episodes, the Company also recognizes a portion of revenue associated with episodes in progress. Episodes in progress are 60-day episodes of care that begin during the reporting period, but were not completed as of the end of the period. As such, the Company estimates revenue and recognizes it on a daily basis. The primary factors underlying this estimate are the number of episodes in progress at the end of the reporting period, expected Medicare revenue per episode and its estimate of the average percentage complete based on visits performed.
Non-Medicare Revenue
Episodic Based Revenue -
The Company recognizes revenue in a similar manner as it recognizes Medicare revenue for episodic-based rates that are paid by other insurance carriers, including Medicare Advantage programs; however, these rates can vary based upon the negotiated terms.
Non-episodic Based Revenue -
Revenue is recorded on an accrual basis based upon the date of service at amounts equal to its established or estimated per-visit rates, as applicable.
Hospice Revenue
Revenue is recorded on an accrual basis based upon the date of service at amounts equal to the estimated payment rates. The estimated payment rates are daily rates for each of the levels of care the Company delivers. The Company makes adjustments to revenue for an inability to obtain appropriate billing documentation or authorizations acceptable to the payor and other reasons unrelated to credit risk. Additionally, as Medicare hospice revenue is subject to an inpatient cap limit and an overall payment cap, the Company monitors its provider numbers and estimates amounts due back to Medicare if a cap has been exceeded. The Company records these adjustments as a reduction to revenue and increases other accrued liabilities.
Accounts Receivable and Allowance for Doubtful Accounts —
Accounts receivable consist primarily of amounts due from Medicare and Medicaid programs, other government programs, managed care health plans and private payor sources. Estimated provisions for doubtful accounts are recorded to the extent it is probable that a portion or all of a particular account will not be collected.
In evaluating the collectability of accounts receivable, the Company considers a number of factors, including the age of the accounts, changes in collection patterns, the composition of patient accounts by payor type and the status of ongoing disputes with third-party payors. On an annual basis, the historical collection percentages are reviewed by payor and by state and are updated to reflect the recent collection experience of the Company. In order to determine the appropriate reserve rate percentages which ultimately establish the allowance, the Company analyzes historical cash collection patterns by payor and by state. The percentages applied to the aged receivable balances are based on the Company’s historical experience and time limits, if any, for managed care, Medicare, Medicaid and other payors. The Company periodically refines its estimates of the allowance for doubtful accounts based on experience with the estimation process and changes in circumstances.
Cash and Cash Equivalents
—
Cash and cash equivalents consist of bank term deposits, money market funds and treasury bill related investments with original maturities of three months or less at time of purchase and therefore approximate fair value. The fair value of money market funds is determined based on “Level 1” inputs, which consist of unadjusted quoted prices in active markets that are accessible at the measurement date for identical, unrestricted assets. The Company places its cash and short-term investments with high credit quality financial institutions.
Insurance Subsidiary Deposits and Investments —
The Company's captive insurance subsidiary cash and cash equivalents, deposits and investments are designated to support long-term insurance subsidiary liabilities and have been classified as short-term and long-term assets based on the expected future payments of the Company's captive insurance liabilities. The majority of these deposits and investments are currently held in AA, A and BBB+ rated debt security investments and the remainder is held in a bank account with a high credit quality financial institution. See further discussion at Note 5,
Fair Value Measurements.
Property and Equipment —
Property and equipment are initially recorded at their historical cost. Repairs and maintenance are expensed as incurred. Depreciation is computed using the straight-line method over the estimated useful lives of the depreciable assets (ranging from three to 59 years). Leasehold improvements are amortized on a straight-line basis over the shorter of their estimated useful lives or the remaining lease term.
Impairment of Long-Lived Assets —
The Company reviews the carrying value of long-lived assets that are held and used in the Company’s operating subsidiaries for impairment whenever events or changes in circumstances indicate that the carrying
114
amount of an asset may not be recoverable. Recoverability of these assets is determined based upon expected undiscounted future net cash flows from the operating subsidiaries to which the assets relate, utilizing management’s best estimate, appropriate assumptions, and projections at the time. If the carrying value is determined to be unrecoverable from future operating cash flows, the asset is deemed impaired and an impairment loss would be recognized to the extent the carrying value exceeded the estimated fair value of the asset. The Company estimates the fair value of assets based on the estimated future discounted cash flows of the asset. Management has evaluated its long-lived assets and recorded an impairment charge of
$137
related to the closure of one facility during the first quarter of 2016. The Company did not record impairment charges during the
years ended December 31, 2015 and 2014
.
Intangible Assets and Goodwill —
Definite-lived intangible assets consist primarily of favorable leases, lease acquisition costs, patient base, facility trade names and customer relationships. Favorable leases and lease acquisition costs are amortized over the life of the lease of the facility. Patient base is amortized over a period of four to eight months, depending on the classification of the patients and the level of occupancy in a new acquisition on the acquisition date. Trade names at affiliated facilities are amortized over 30 years and customer relationships are amortized over a period of up to 20 years.
The Company's indefinite-lived intangible assets consist of trade names and Medicare and Medicaid licenses. The Company tests indefinite-lived intangible assets for impairment on an annual basis or more frequently if events or changes in circumstances indicate that the carrying amount of the intangible asset may not be recoverable.
Goodwill represents the excess of the purchase price over the fair value of identifiable net assets acquired in business combinations. Goodwill is subject to annual testing for impairment. In addition, goodwill is tested for impairment if events occur or circumstances change that would reduce the fair value of a reporting unit below its carrying amount. The Company performs its annual test for impairment during the fourth quarter of each year. See further discussion at Note 12,
Goodwill and Other Indefinite-Lived Intangible Assets
.
Deferred Rent
- Deferred rent represents rental expense, determined on a straight-line basis over the life of the related lease, in excess of actual rent payments.
Self-Insurance
— The Company is partially self-insured for general and professional liability up to a base amount per claim (the self-insured retention) with an aggregate, one-time deductible above this limit. Losses beyond these amounts are insured through third-party policies with coverage limits per claim, per location and on an aggregate basis for the Company. For claims made after January 1, 2013, the combined self-insured retention was
$500
per claim, subject to an additional one-time deductible of
$1,000
for California affiliated facilities and a separate, one-time, deductible of
$750
for non-California facilities. For all California affiliated facilities, the third-party coverage above these limits was
$1,000
per claim,
$3,000
per facility, with a
$5,000
blanket aggregate limit. For all facilities outside of California, except those located in Colorado, the third-party coverage above these limits was
$1,000
per claim,
$3,000
per facility, with a
$5,000
blanket aggregate and an additional state-specific aggregate where required by state law. In Colorado, the third-party coverage above these limits was
$1,000
per claim and
$3,000
per facility for skilled nursing facilities, which is independent of the aforementioned blanket aggregate limits that apply outside of Colorado. Beginning on January 1, 2017, the combined self-insured retention will be
$500
per claim, subject to an additional one-time deductible of
$750
for California affiliated facilities and a separate, one-time, deductible of
$1,000
for non-California facilities.
The self-insured retention and deductible limits for general and professional liability and workers' compensation for all states (except Texas and Washington for workers' compensation) are self-insured through the Captive, the related assets and liabilities of which are included in the accompanying consolidated balance sheets. The Captive is subject to certain statutory requirements as an insurance provider. These requirements include, but are not limited to, maintaining statutory capital. The Company’s policy is to accrue amounts equal to the actuarially estimated costs to settle open claims of insureds, as well as an estimate of the cost of insured claims that have been incurred but not reported. The Company develops information about the size of the ultimate claims based on historical experience, current industry information and actuarial analysis, and evaluates the estimates for claim loss exposure on a quarterly basis.
The Company’s operating subsidiaries are self-insured for workers’ compensation in California. To protect itself against loss exposure in California with this policy, the Company has purchased individual specific excess insurance coverage that insures individual claims that exceed
$500
per occurrence. In Texas, the operating subsidiaries have elected non-subscriber status for workers’ compensation claims and, effective February 1, 2011, the Company has purchased individual stop-loss coverage that insures individual claims that exceed
$750
per occurrence. As of July 1, 2014, the Company’s operating subsidiaries in all other states, with the exception of Washington, are under a loss sensitive plan that insures individual claims that exceed
$350
per occurrence. In Washington, the operating subsidiaries' coverage is financed through premiums paid by the employers and employees. The claims and pay benefits are managed through a state insurance pool. Outside of California, Texas and Washington, the Company has purchased insurance coverage that insures individual claims that exceed
$350
per accident. In all states except
115
Washington, the Company accrues amounts equal to the estimated costs to settle open claims, as well as an estimate of the cost of claims that have been incurred but not reported. The Company uses actuarial valuations to estimate the liability based on historical experience and industry information.
In addition, the Company has recorded an asset and equal liability of
$4,104
and
$2,881
at
December 31, 2016
and
2015
, respectively, in order to present the ultimate costs of malpractice and workers' compensation claims and the anticipated insurance recoveries on a gross basis. See Note 13,
Restricted and Other Assets.
The Company self-funds medical (including prescription drugs) and dental healthcare benefits to the majority of its employees. The Company is fully liable for all financial and legal aspects of these benefit plans. To protect itself against loss exposure with this policy, the Company has purchased individual stop-loss insurance coverage that insures individual claims that exceed
$300
for each covered person with an additional one-time aggregate individual stop loss deductible of
$75
. Beginning 2016, the Company's policy does not include the additional one-time aggregate individual stop loss deductible of
$75
.
The Company believes that adequate provision has been made in the Financial Statements for liabilities that may arise out of patient care, workers’ compensation, healthcare benefits and related services provided to date. The amount of the Company’s reserves was determined based on an estimation process that uses information obtained from both company-specific and industry data. This estimation process requires the Company to continuously monitor and evaluate the life cycle of the claims. Using data obtained from this monitoring and the Company’s assumptions about emerging trends, the Company, with the assistance of an independent actuary, develops information about the size of ultimate claims based on the Company’s historical experience and other available industry information. The most significant assumptions used in the estimation process include determining the trend in costs, the expected cost of claims incurred but not reported and the expected costs to settle or pay damage awards with respect to unpaid claims. The self-insured liabilities are based upon estimates, and while management believes that the estimates of loss are reasonable, the ultimate liability may be in excess of or less than the recorded amounts. Due to the inherent volatility of actuarially determined loss estimates, it is reasonably possible that the Company could experience changes in estimated losses that could be material to net income. If the Company’s actual liability exceeds its estimates of loss, its future earnings, cash flows and financial condition would be adversely affected.
Income Taxes
— Deferred tax assets have been presented on the balance sheet as a non-current asset for all periods presented related to the early adoption of authoritative guidance for the presentation of deferred taxes. Historically, these assets were classified as either current or non-current assets, as applicable. There is no effect on the consolidated statements of income or consolidated statements of cash flow.
Deferred tax assets and liabilities are established for temporary differences between the financial reporting basis and the tax basis of the Company’s assets and liabilities at tax rates in effect when such temporary differences are expected to reverse. The Company generally expects to fully utilize its deferred tax assets; however, when necessary, the Company records a valuation allowance to reduce its net deferred tax assets to the amount that is more likely than not to be realized.
In determining the need for a valuation allowance or the need for and magnitude of liabilities for uncertain tax positions, the Company makes certain estimates and assumptions. These estimates and assumptions are based on, among other things, knowledge of operations, markets, historical trends and likely future changes and, when appropriate, the opinions of advisors with knowledge and expertise in certain fields. Due to certain risks associated with the Company’s estimates and assumptions, actual results could differ.
Noncontrolling Interest —
The noncontrolling interest in a subsidiary is initially recognized at estimated fair value on the acquisition date and is presented within total equity in the Company's consolidated balance sheets. The Company presents the noncontrolling interest and the amount of consolidated net income attributable to The Ensign Group, Inc. in its consolidated statements of income and net income per share is calculated based on net income attributable to The Ensign Group, Inc.'s stockholders. The carrying amount of the noncontrolling interest is adjusted based on an allocation of subsidiary earnings based on ownership interest.
Stock-Based Compensation —
The Company measures and recognizes compensation expense for all share-based payment awards made to employees and directors including employee stock options based on estimated fair values, ratably over the requisite service period of the award. Net income has been reduced as a result of the recognition of the fair value of all stock options and restricted stock awards issued, the amount of which is contingent upon the number of future grants and other variables.
Leases and Leasehold Improvements
- At the inception of each lease, the Company performs an evaluation to determine whether the lease should be classified as an operating or capital lease. The Company records rent expense for operating leases
116
that contain scheduled rent increases on a straight-line basis over the term of the lease. The lease term used for straight-line rent expense is calculated from the date the Company is given control of the leased premises through the end of the lease term. The lease term used for this evaluation also provides the basis for establishing depreciable lives for buildings subject to lease and leasehold improvements, as well as the period over which the Company records straight-line rent expense.
Recent Accounting Pronouncements —
Except for rules and interpretive releases of the Securities and Exchange Commission (SEC) under authority of federal securities laws and a limited number of grandfathered standards, the Financial Accounting Standards Board (FASB) Accounting Standards Codification (ASC) is the sole source of authoritative GAAP literature recognized by the FASB and applicable to the Company. For any new pronouncements announced, the Company considers whether the new pronouncements could alter previous generally accepted accounting principles and determines whether any new or modified principles will have a material impact on the Company's reported financial position or operations in the near term. The applicability of any standard is subject to the formal review of the Company's financial management and certain standards are under consideration.
Recent Accounting Standards Adopted by the Company:
In November 2015, the FASB issued updated guidance requiring all deferred tax assets and liabilities be presented as non-current. The Company early adopted this guidance in the first quarter of fiscal year 2016, retrospectively. The Company has classified deferred tax amounts as non-current assets in the consolidated balance sheet for all periods presented. There was no effect on the consolidated statements of income or statement of cash flows. See the Consolidated Balance Sheets.
In April 2015, the FASB issued updated guidance requiring debt issuance costs related to a recognized debt liability to be presented in the consolidated balance sheet as a direct reduction from the carrying amount of the debt liability. The new standard was effective for the Company in the first quarter of fiscal year 2016. The Company adopted this amendment during the first quarter of 2016. See Note 16,
Debt
to the Consolidated Financial Statements.
In August 2014, the FASB issued authoritative guidance requiring management to evaluate whether there are conditions and events that raise substantial doubt about the entity’s ability to continue as a going concern and to provide disclosures in certain circumstances. The new standard was effective for the Company in the first quarter of fiscal year 2016. The adoption of this standard did not have a material effect on the Company's financial statements.
Accounting Standards Recently Issued But Not Yet Adopted by the Company:
In August 2016, the FASB issued amended authoritative guidance to reduce the diversity in practice related to the presentation and classification of certain cash receipts and cash payments in the statement of cash flows. The new provisions target cash flow issues related to (i) debt prepayment or debt extinguishment costs, (ii) settlement of debt instruments with coupon rates that are insignificant relative to effective interest rates, (iii) contingent consideration payments made after a business combination, (iv) proceeds from settlement of insurance claims, (v) proceeds from the settlement of corporate-owned life insurance and bank-owned life insurance policies, (vi) distributions received from equity method investees, (vii) beneficial interests in securitization transactions and (viii) separately identifiable cash flows and application of the predominance principle. This guidance will be effective for fiscal years beginning after December 15, 2017, which will be the Company's fiscal year 2018, with early adoption permitted. The adoption of this standard is not expected to have a material impact on the Company’s consolidated financial statements.
In April 2016, the FASB issued its standard to simplify several aspects the accounting for employee share-based payment transactions, which includes the accounting for income taxes, forfeitures, and statutory tax withholding requirements, as well as classification in the statement of cash flows. This guidance will be effective for annual periods beginning after December 15, 2016, which will be the Company's fiscal year 2017, with early adoption permitted. The adoption of the guidance will result in a decrease in income tax expense and an increase in diluted share counts and net cash provided by operating activities.
In March 2016, the FASB issued its standard to amend the principal-versus-agent implementation guidance and illustrations in the Board’s new revenue standard, which includes accounting implication related to (1) determining the appropriate unit of account under the revenue standard’s principal-versus-agent guidance and (2) applying the indicators of whether an entity is a principal or an agent in accordance with the revenue standard’s control principle. The guidance will be effective for fiscal years beginning after December 15, 2017, which will be the Company's fiscal year 2018. The guidance has the same effective date as the new revenue standard and the Company is required to adopt the guidance by using the same transition method it would use to adopt the new revenue standard. The Company's evaluation of the adoption method and impact to the consolidated financial statements is ongoing and being performed concurrently with the new revenue standard.
117
In February 2016, the FASB issued amended authoritative guidance on accounting for leases. The new provisions require that a lessee of operating leases recognize in the statement of financial position a liability to make lease payments (the lease liability) and a right-of-use asset representing its right to use the underlying asset for the lease term. The lease liability will be equal to the present value of lease payments, with the right-of-use asset based upon the lease liability. The classification criteria for distinguishing between finance (or capital) leases and operating leases are substantially similar to the previous lease guidance, but with no explicit bright lines. As such, operating leases will result in straight-line rent expense similar to current practice. For short term leases (term of 12 months or less), a lessee is permitted to make an accounting election not to recognize lease assets and lease liabilities, which would generally result in lease expense being recognized on a straight-line basis over the lease term. This guidance applies to all entities and is effective for annual periods beginning after December 15, 2018, which will be the Company's fiscal year 2019, with early adoption permitted. The Company is currently evaluating the impact this guidance will have on its consolidated financial statements but expect this adoption will result in a significant increase in the assets and liabilities on its consolidated balance sheet.
In January 2016, the FASB issued amended authoritative guidance which makes targeted improvements for financial instruments. The new provisions impact certain aspects of recognition, measurement, presentation and disclosure requirements of financial instruments. Specifically, the guidance will (1) require equity investments to be measured at fair value with changes in fair value recognized in net income, (2) simplify the impairment assessment of equity investments without readily determinable fair values, (3) eliminate the requirement to disclose the method and assumptions used to estimate fair value for financial instruments measured at amortized cost, and (4) require separate presentation of financial assets and financial liabilities by measurement category. The guidance is effective for annual and interim periods beginning after December 15, 2017, which will be the Company's fiscal year 2018. Early adoption is not permitted. The adoption of this standard is not expected to have a material impact on the Company’s consolidated financial statements.
In May 2014, the FASB and International Accounting Standards Board issued their final standard on revenue from contracts with customers that outlines a single comprehensive model for entities to use in accounting for revenue arising from contracts with customers. The new standard supersedes most current revenue recognition guidance, including industry-specific guidance, and may be applied retrospectively to each period presented (full retrospective method) or retrospectively with the cumulative effect recognized in beginning retained earnings as of the date of adoption (modified retrospective method). In July 2015, the FASB formally deferred for one year the effective date of the new revenue standard and decided to permit entities to early adopt the standard. The guidance will be effective for fiscal years beginning after December 15, 2017, which will be the Company's fiscal year 2018. The Company has initiated an adoption plan in fiscal year 2015, beginning with preliminary evaluation of the standard, and will continue by performing additional analysis of revenue streams and transactions for which the accounting may change under the new standard. The adoption plan, which also includes evaluation of the adoption method and the impact to the consolidated financial statements, is ongoing and will be completed by the end of fiscal year 2017. The new guidance requires enhanced disclosures, including revenue recognition policies to identify performance obligations and significant judgments in measurement and recognition. The FASB has issued and may issue in the future, interpretive guidance, which may impact its evaluation, however the Company currently anticipates adopting the standard as of January 1, 2018, using the modified retrospective method.
3. COMMON STOCK
Common Stock Repurchase Program
On November 4, 2015 and February 9, 2016, the Company announced that its Board of Directors authorized two stock repurchase programs, under which the Company may repurchase up to
$15,000
of its common stock under each program for a period of 12 months. Under these programs, the Company is authorized to repurchase its issued and outstanding common shares from time to time in open-market and privately negotiated transactions and block trades in accordance with federal securities laws. During the first quarter of 2016, the Company repurchased
1,452
shares of its common stock for a total of
$30,000
and the repurchase programs expired upon the repurchase of the full authorized amount under the plans. The Company did not have stock repurchase programs in place during the the year ended December 31, 2014.
Common Stock Offering
On February 9, 2015, the Company entered into an underwriting agreement with Wells Fargo Securities, LLC as representative of the underwriters named therein (collectively, the Underwriters), pursuant to which the Company agreed to issue and sell to the Underwriters
5,000
shares of its common stock and also agreed to issue and sell to the Underwriters, at the option of the Underwriters, an aggregate of up to
750
additional shares of common stock (the Common Stock Offering).
118
Subsequently, the Company completed a common stock offering, issuing
5,467
shares at approximately
$20.50
per share. After deducting underwriting discounts and commissions of
$5,604
, excluding other issuance costs of
$357
, the Company received net proceeds of
$106,474
. The Company then used
$94,000
of the net proceeds to pay off outstanding amounts under its credit facility.
4. COMPUTATION OF NET INCOME PER COMMON SHARE
Basic net income per share is computed by dividing income from continuing operations attributable to The Ensign Group, Inc. stockholders by the weighted average number of outstanding common shares for the period. The computation of diluted net income per share is similar to the computation of basic net income per share except that the denominator is increased to include the number of additional common shares that would have been outstanding if the dilutive potential common shares had been issued.
A reconciliation of the numerator and denominator used in the calculation of basic net income per common share follows:
|
Year Ended December 31,
|
|||||||||||
|
|
2016
|
|
2015
|
2014
|
|||||||
|
Numerator:
|
|
|
|||||||||
|
Net income
|
$
|
52,843
|
|
$
|
55,917
|
|
$
|
33,741
|
|
||
|
Less: net income (loss) attributable to noncontrolling interests
|
2,853
|
|
485
|
|
(2,209
|
)
|
|||||
|
Net income attributable to The Ensign Group, Inc.
|
$
|
49,990
|
|
$
|
55,432
|
|
$
|
35,950
|
|
||
|
Denominator:
|
|
|
|||||||||
|
Weighted average shares outstanding for basic net income per share
|
50,555
|
|
50,316
|
|
44,682
|
|
|||||
|
Basic net income per common share attributable to The Ensign Group, Inc.
|
$
|
0.99
|
|
$
|
1.10
|
|
$
|
0.80
|
|
||
A reconciliation of the numerator and denominator used in the calculation of diluted net income per common share follows:
|
Year Ended December 31,
|
|||||||||||
|
|
2016
|
|
2015
|
2014
|
|||||||
|
Numerator:
|
|
|
|||||||||
|
Net income
|
$
|
52,843
|
|
$
|
55,917
|
|
$
|
33,741
|
|
||
|
Less: net income (loss) attributable to noncontrolling interests
|
2,853
|
|
485
|
|
(2,209
|
)
|
|||||
|
Net income attributable to The Ensign Group, Inc.
|
$
|
49,990
|
|
$
|
55,432
|
|
$
|
35,950
|
|
||
|
Denominator:
|
|
|
|||||||||
|
Weighted average common shares outstanding
|
50,555
|
|
50,316
|
|
44,682
|
|
|||||
|
Plus: incremental shares from assumed conversion
(1)
|
1,578
|
|
1,894
|
|
1,508
|
|
|||||
|
Adjusted weighted average common shares outstanding
|
52,133
|
|
52,210
|
|
46,190
|
|
|||||
|
Diluted net income per common share attributable to The Ensign Group, Inc.
|
$
|
0.96
|
|
$
|
1.06
|
|
$
|
0.78
|
|
||
(1) Options outstanding which are anti-dilutive and therefore not factored into the weighted average common shares amount above were
838
,
258
, and
1,084
for the
years ended December 31, 2016, 2015 and 2014
, respectively.
5. FAIR VALUE MEASUREMENTS
Fair value measurements are based on a three-tier hierarchy that prioritizes the inputs used to measure fair value. These tiers include: Level 1, defined as observable inputs such as quoted market prices in active markets; Level 2, defined as inputs other than quoted prices included within Level 1 that are observable for the asset or liability, either directly or indirectly; and Level 3, defined as unobservable inputs for which little or no market data exists, therefore requiring an entity to develop its own assumptions.
The following table summarizes the financial assets and liabilities measured at fair value on a recurring basis as of
December 31, 2016
and
2015
:
119
|
December 31,
|
||||||||||||||||||||||||
|
2016
|
2015
|
|||||||||||||||||||||||
|
Level 1
|
Level 2
|
Level 3
|
Level 1
|
Level 2
|
Level 3
|
|||||||||||||||||||
|
Cash and cash equivalents
|
$
|
57,706
|
|
$
|
—
|
|
$
|
—
|
|
$
|
41,569
|
|
$
|
—
|
|
$
|
—
|
|
||||||
Our non-financial assets, which include long-lived assets, including goodwill, intangible assets and property and equipment, are not required to be measured at fair value on a recurring basis. However, on a periodic basis, or whenever events or changes in circumstances indicate that their carrying value may not be recoverable, we assess our long-lived assets for impairment. When impairment has occurred, such long-lived assets are written down to fair value. See Note 2,
Summary of Significant Accounting Policies
for further discussion of the Company's significant accounting policies.
Debt Security Investments - Held to Maturity
At
December 31, 2016
and
2015
, the Company had approximately
$35,184
and
$34,717
, respectively, in debt security investments which were classified as held to maturity and carried at amortized cost. The carrying value of the debt securities approximates fair value. The Company has the intent and ability to hold these debt securities to maturity. Further, as of
December 31, 2016
, the debt security investments were held in AA, A and BBB+ rated debt securities.
6. REVENUE AND ACCOUNTS RECEIVABLE
Revenue for the
years ended December 31, 2016, 2015 and 2014
is summarized in the following tables:
|
|
Year Ended December 31,
|
||||||||||||||||||
|
|
2016
|
2015
|
2014
|
||||||||||||||||
|
Revenue
|
% of
Revenue
|
Revenue
|
% of
Revenue
|
Revenue
|
% of
Revenue
|
||||||||||||||
|
Medicaid
|
$
|
557,958
|
|
33.7
|
%
|
$
|
458,956
|
|
|
34.2
|
%
|
$
|
369,106
|
|
35.9
|
%
|
|||
|
Medicare
|
477,019
|
|
28.8
|
|
395,503
|
|
|
29.5
|
|
313,144
|
|
30.5
|
|
||||||
|
Medicaid — skilled
|
87,517
|
|
5.3
|
|
71,905
|
|
|
5.4
|
|
51,157
|
|
5.0
|
|
||||||
|
Total Medicaid and Medicare
|
1,122,494
|
|
67.8
|
|
926,364
|
|
|
69.1
|
|
733,407
|
|
71.4
|
|
||||||
|
Managed care
|
265,508
|
|
16.0
|
|
206,770
|
|
|
15.4
|
|
145,796
|
|
14.2
|
%
|
||||||
|
Private and other payors
(1)
|
266,862
|
|
16.2
|
|
208,692
|
|
|
15.5
|
|
148,203
|
|
14.4
|
%
|
||||||
|
Revenue
|
$
|
1,654,864
|
|
100.0
|
%
|
$
|
1,341,826
|
|
|
100.0
|
%
|
$
|
1,027,406
|
|
100.0
|
%
|
|||
(1) Private and other payors also includes revenue from all payors generated in urgent care centers and other ancillary services.
Accounts receivable as of
December 31, 2016
and
2015
is summarized in the following table:
|
December 31,
|
|||||||
|
2016
|
2015
|
||||||
|
Medicaid
|
$
|
111,031
|
|
$
|
90,677
|
|
|
|
Managed care
|
66,346
|
|
56,411
|
|
|||
|
Medicare
|
55,500
|
|
49,970
|
|
|||
|
Private and other payors
|
51,347
|
|
42,276
|
|
|||
|
|
284,224
|
|
239,334
|
|
|||
|
Less: allowance for doubtful accounts
|
(39,791
|
)
|
(30,308
|
)
|
|||
|
Accounts receivable, net
|
$
|
244,433
|
|
$
|
209,026
|
|
|
120
7. BUSINESS SEGMENTS
The Company has
three
reportable operating segments: (1) transitional and skilled services, which includes the operation of skilled nursing facilities; (2) assisted and independent living services, which includes the operation of assisted and independent living facilities; and (3) home health and hospice services, which includes the Company's home health, home care and hospice businesses. The Company's Chief Executive Officer, who is our chief operating decision maker, or CODM, reviews financial information at the operating segment level.
The Company also reports an “all other” category that includes revenue from its urgent care centers, mobile diagnostics and other ancillary operations. These operations are neither significant individually nor in aggregate and therefore do not constitute a reportable segment. In 2016, the Company completed the sale of its urgent care centers for an aggregate purchase price of
$41,492
. The reporting segments are business units that offer different services and that are managed separately to provide greater visibility into those operations. The expansion of the Company's assisted and independent living services led it to separate the assisted and independent living services into a distinct reportable segment in the fourth quarter of 2016. Previously, the Company had two reportable segments, transitional, skilled and assisted living services (TSA services), which includes the operation of skilled nursing facilities and assisted living facilities; and (2) home health and hospice services. The Company has presented 2015 and 2014 financial information on a comparative basis to conform with the current year segment presentation. Certain revenues by payor source were reclassified between Medicaid and private and other to conform with the current year segment presentation. See also Note 12,
Goodwill and Other Indefinite-Lived Intangible Assets
for comparative information on changes in the carrying amount of goodwill by segment.
As of
December 31, 2016
, transitional and skilled services included
149
wholly-owned affiliated skilled nursing facilities and
21
campuses that provide skilled nursing and rehabilitative care services. The Company provided room and board and social services through
40
wholly-owned affiliated assisted and independent living facilities and
21
campuses. Home health, home care and hospice services were provided to patients through the Company's
39
agencies. The Company's urgent care services, which is included in the "all other" category, were provided to patients by the Company's wholly owned urgent care operating subsidiaries. See also Note 19,
Divestitures
for further information relating to the sale of urgent care centers. As of
December 31, 2016
, the Company held majority membership interests in other ancillary operations, which operating results are included in the "all other" category.
The Company evaluates performance and allocates capital resources to each segment based on an operating model that is designed to maximize the quality of care provided and profitability. General and administrative expenses are not allocated to any segment for purposes of determining segment profit or loss, and are included in the "all other" category in the selected segment financial data that follows. The accounting policies of the reporting segments are the same as those described in Note 2
, Summary of Significant Accounting Policies.
The Company's CODM does not review assets by segment in his resource allocation and therefore assets by segment are not disclosed below.
Segment revenues by major payor source were as follows:
|
|
Year Ended December 31, 2016
|
|||||||||||||||||||||||
|
|
Transitional and Skilled Services
|
Assisted and Independent Living Services
|
Home Health and Hospice Services
|
All Other
|
Total Revenue
|
Revenue %
|
||||||||||||||||||
|
Medicaid
|
$
|
521,063
|
|
$
|
26,397
|
|
$
|
10,498
|
|
$
|
—
|
|
$
|
557,958
|
|
33.7
|
%
|
|||||||
|
Medicare
|
396,519
|
|
—
|
|
80,500
|
|
—
|
|
477,019
|
|
28.8
|
|
||||||||||||
|
Medicaid-skilled
|
87,517
|
|
—
|
|
—
|
|
—
|
|
87,517
|
|
5.3
|
|
||||||||||||
|
Subtotal
|
1,005,099
|
|
26,397
|
|
90,998
|
|
—
|
|
1,122,494
|
|
67.8
|
|
||||||||||||
|
Managed care
|
247,844
|
|
—
|
|
17,664
|
|
—
|
|
265,508
|
|
16.0
|
|
||||||||||||
|
Private and other
|
121,860
|
|
97,239
|
|
7,151
|
|
40,612
|
|
(1)
|
266,862
|
|
16.2
|
|
|||||||||||
|
Total revenue
|
$
|
1,374,803
|
|
$
|
123,636
|
|
$
|
115,813
|
|
$
|
40,612
|
|
$
|
1,654,864
|
|
100.0
|
%
|
|||||||
|
(1) Private and other payors in our "All Other" category includes revenue from all payors generated in the Company's urgent care centers and other ancillary operations.
|
||||||||||||||||||||||||
121
|
|
Year Ended December 31, 2015
|
|||||||||||||||||||||||
|
|
Transitional and Skilled Services
|
Assisted and Independent Living Services
|
Home Health and Hospice Services
|
All Other
|
Total Revenue
|
Revenue %
|
||||||||||||||||||
|
Medicaid
|
$
|
430,368
|
|
$
|
19,642
|
|
$
|
8,946
|
|
$
|
—
|
|
$
|
458,956
|
|
34.2
|
%
|
|||||||
|
Medicare
|
332,429
|
|
—
|
|
63,074
|
|
—
|
|
395,503
|
|
29.5
|
|
||||||||||||
|
Medicaid-skilled
|
71,905
|
|
—
|
|
—
|
|
—
|
|
71,905
|
|
5.4
|
|
||||||||||||
|
Subtotal
|
834,702
|
|
19,642
|
|
72,020
|
|
—
|
|
926,364
|
|
69.1
|
|
||||||||||||
|
Managed care
|
194,743
|
|
—
|
|
12,027
|
|
—
|
|
206,770
|
|
15.4
|
|
||||||||||||
|
Private and other
|
96,943
|
|
68,487
|
|
6,309
|
|
36,953
|
|
(1)
|
208,692
|
|
15.5
|
|
|||||||||||
|
Total revenue
|
$
|
1,126,388
|
|
|
$
|
88,129
|
|
|
$
|
90,356
|
|
|
$
|
36,953
|
|
$
|
1,341,826
|
|
100.0
|
%
|
||||
|
(1) Private and other payors in our "All Other" category includes revenue from all payors generated in the Company's urgent care centers and other ancillary operations.
|
||||||||||||||||||||||||
|
|
Year ended December 31, 2014
|
|||||||||||||||||||||||
|
Transitional and Skilled Services
|
Assisted and Independent Living Services
|
Home Health and Hospice Services
|
All Other
|
|||||||||||||||||||||
|
|
Total Revenue
|
Revenue %
|
||||||||||||||||||||||
|
Medicaid
|
$
|
352,271
|
|
$
|
11,590
|
|
$
|
5,245
|
|
$
|
—
|
|
$
|
369,106
|
|
35.9
|
%
|
|||||||
|
Medicare
|
274,723
|
|
—
|
|
38,421
|
|
—
|
|
313,144
|
|
30.5
|
|
||||||||||||
|
Medicaid-skilled
|
51,157
|
|
—
|
|
—
|
|
—
|
|
51,157
|
|
5.0
|
|
||||||||||||
|
Subtotal
|
678,151
|
|
11,590
|
|
43,666
|
|
—
|
|
733,407
|
|
71.4
|
|
||||||||||||
|
Managed care
|
138,215
|
|
—
|
|
7,581
|
|
—
|
|
145,796
|
|
14.2
|
|
||||||||||||
|
Private and other
|
85,104
|
|
37,258
|
|
3,269
|
|
22,572
|
|
(1)
|
148,203
|
|
14.4
|
|
|||||||||||
|
Total revenue
|
$
|
901,470
|
|
|
$
|
48,848
|
|
|
$
|
54,516
|
|
|
$
|
22,572
|
|
$
|
1,027,406
|
|
100.0
|
%
|
||||
|
(1) Private and other payors in our "All Other" category includes revenue from all payors generated in the Company's urgent care centers and other ancillary operations.
|
||||||||||||||||||||||||
The following table sets forth selected financial data consolidated by business segment:
|
|
Year Ended December 31, 2016
|
|||||||||||||||||||||||
|
|
Transitional and Skilled Services
|
Assisted and Independent Living Services
|
Home Health and Hospice Services
|
All Other
|
Elimination
|
Total
|
||||||||||||||||||
|
Revenue from external customers
|
$
|
1,374,803
|
|
$
|
123,636
|
|
$
|
115,813
|
|
$
|
40,612
|
|
$
|
1,654,864
|
|
|||||||||
|
Intersegment revenue
(1)
|
2,929
|
|
—
|
|
—
|
|
2,184
|
|
(5,113
|
)
|
—
|
|
||||||||||||
|
Total revenue
|
$
|
1,377,732
|
|
$
|
123,636
|
|
$
|
115,813
|
|
$
|
42,796
|
|
$
|
(5,113
|
)
|
$
|
1,654,864
|
|
||||||
|
Segment income (loss)
(2)
|
$
|
118,118
|
|
$
|
11,701
|
|
$
|
16,571
|
|
$
|
(54,543
|
)
|
$
|
—
|
|
$
|
91,847
|
|
||||||
|
Interest expense, net of interest income
|
(6,029
|
)
|
||||||||||||||||||||||
|
Income before provision for income taxes
|
$
|
85,818
|
|
|||||||||||||||||||||
|
Depreciation and amortization
|
$
|
26,298
|
|
$
|
4,157
|
|
$
|
924
|
|
$
|
7,303
|
|
$
|
—
|
|
$
|
38,682
|
|
||||||
(1) Intersegment revenue represents services provided at the Company's skilled nursing facilities, urgent care centers and other ancillary operations to the Company's other operating subsidiaries.
(2) Segment income excludes general and administrative expense for transitional and skilled services, assisted and independent living services and home health and hospice businesses. General and administrative expense is included in "All Other" category.
The Company's transitional and skilled services segment income for the year ended
December 31, 2016
included the continued obligation under the lease and related closing expenses of
$7,935
, including the present value of rental payments of approximately
122
$6,512
, which was recognized for the closure of one skilled nursing facility in the first quarter of 2016. See Note 18,
Leases
for further detail.
|
|
Year Ended December 31, 2015
|
|||||||||||||||||||||||
|
|
Transitional and Skilled Services
|
Assisted and Independent Living Services
|
Home Health and Hospice Services
|
All Other
|
Elimination
|
Total
|
||||||||||||||||||
|
Revenue from external customers
|
$
|
1,126,388
|
|
|
$
|
88,129
|
|
|
$
|
90,356
|
|
|
$
|
36,953
|
|
$
|
1,341,826
|
|
||||||
|
Intersegment revenue
(1)
|
2,447
|
|
—
|
|
881
|
|
(3,328
|
)
|
—
|
|
||||||||||||||
|
Total revenue
|
$
|
1,128,835
|
|
$
|
88,129
|
|
$
|
90,356
|
|
$
|
37,834
|
|
$
|
(3,328
|
)
|
$
|
1,341,826
|
|
||||||
|
Segment income (loss)
(2)
|
$
|
136,744
|
|
$
|
11,463
|
|
$
|
13,584
|
|
$
|
(68,709
|
)
|
$
|
—
|
|
$
|
93,082
|
|
||||||
|
Interest expense, net of interest income
|
$
|
(1,983
|
)
|
|||||||||||||||||||||
|
Income before provision for income taxes
|
$
|
91,099
|
|
|||||||||||||||||||||
|
Depreciation and amortization
|
$
|
18,008
|
|
$
|
3,338
|
|
$
|
980
|
|
$
|
5,785
|
|
$
|
—
|
|
$
|
28,111
|
|
||||||
(1) Intersegment revenue represents services provided at the Company's skilled nursing facilities, urgent care centers and other ancillary operations to the Company's other operating subsidiaries.
(2) Segment income excludes general and administrative expense for transitional and skilled services, assisted and independent living services and home health and hospice businesses. General and administrative expense is included in "All Other" category.
|
|
Year Ended December 31, 2014
|
|||||||||||||||||||||||
|
|
Transitional and Skilled Services
|
Assisted and Independent Living Services
|
Home Health and Hospice Services
|
All Other
|
Elimination
|
Total
|
||||||||||||||||||
|
Revenue from external customers
|
$
|
901,470
|
|
|
$
|
48,848
|
|
|
$
|
54,516
|
|
|
$
|
22,572
|
|
$
|
1,027,406
|
|
||||||
|
Intersegment revenue
(1)
|
2,066
|
|
—
|
|
735
|
|
(2,801
|
)
|
—
|
|
||||||||||||||
|
Total revenue
|
$
|
903,536
|
|
$
|
48,848
|
|
$
|
54,516
|
|
$
|
23,307
|
|
$
|
(2,801
|
)
|
$
|
1,027,406
|
|
||||||
|
Segment income (loss)
(2)
|
$
|
117,816
|
|
$
|
8,195
|
|
$
|
9,701
|
|
$
|
(62,788
|
)
|
$
|
—
|
|
$
|
72,924
|
|
||||||
|
Interest expense, net of interest income
|
$
|
(12,382
|
)
|
|||||||||||||||||||||
|
Income before provision for income taxes
|
$
|
60,542
|
|
|||||||||||||||||||||
|
Depreciation and amortization
|
$
|
19,673
|
|
$
|
1,996
|
|
$
|
539
|
|
$
|
4,222
|
|
$
|
—
|
|
$
|
26,430
|
|
||||||
(1) Intersegment revenue represents services provided at the Company's skilled nursing facilities, urgent care centers and other ancillary operations to the Company's other operating subsidiaries.
(2) Segment income excludes general and administrative expense for transitional and skilled services, assisted and independent living services and home health and hospice businesses. General and administrative expense is included in "All Other" category.
8. ACQUISITIONS
The Company’s acquisition focus is to purchase or lease operating subsidiaries that are complementary to the Company’s current affiliated operations, accretive to the Company's business or otherwise advance the Company's strategy. The results of all the Company’s operating subsidiaries are included in the accompanying Financial Statements subsequent to the date of acquisition. Acquisitions are accounted for using the acquisition method of accounting. The Company also enters into long-term leases that may include options to purchase the affiliated facilities. As a result, from time to time, the Company will acquire affiliated facilities that the Company has been operating under third-party leases.
During the
year ended
December 31, 2016
, the Company expanded its operations with the addition of
two
home health agencies and
five
hospice agencies. In addition, the Company acquired
eighteen
stand-alone skilled nursing operations and
one
post-acute care campus through a combination of long-term leases and purchases. As part of these acquisitions, the Company acquired the real estate at
two
of the skilled nursing operations and
one
post-acute care campus and entered into long term leases for
sixteen
skilled nursing operations. The Company did not acquire any material assets or assume any liabilities other than the tenant's post-assumption rights and obligations under the long-term lease. The Company also invested in new ancillary services that are complementary to its existing transitional and skilled services; assisted and independent living services and home health
123
and hospice businesses. The aggregate purchase price for these acquisitions for the
year ended
December 31, 2016
was
$64,521
. The expansion of skilled nursing operations added
2,336
operational skilled nursing beds and
ten
assisted living units operated by the Company's operating subsidiaries. The Company entered into a separate operations transfer agreement with the prior operator as part of each transaction.
The Company's operating subsidiaries opened
six
newly constructed post-acute care campuses under long-term lease agreements, which added
463
operational skilled nursing beds and
142
assisted living units.
During the year ended December 31, 2015, the Company continued to expand its operations with the addition of
50
stand-alone skilled nursing and assisted living operations,
seven
home health, hospice and home care agencies and
three
urgent care centers to its operations through a combination of long-term leases and purchases. The Company did not acquire any material assets or assume any liabilities other than the tenant's post-assumption rights and obligations under the long-term leases. As part of these transactions, we acquired the real estate at
18
of the skilled nursing and assisted and independent living operations. In addition, the Company has invested in new business lines that are complementary to its existing transitional and skilled services; assisted and independent living services and home health and hospice businesses. The aggregate purchase price conveyed in all acquisitions was
$119,965
, including the assumption of liabilities of
$8,939
. The expansion of skilled nursing and assisted and independent living operations added
2,580
and
2,013
operational skilled nursing beds and assisted and independent living units, respectively, operated by the Company's operating subsidiaries. The Company also entered into a separate operations transfer agreement with the prior operator as part of each transaction.
During the year ended December 31, 2014, the Company expanded its operations with the addition of
21
stand-alone skilled nursing and assisted living operations and
nine
home health, home care and hospice agencies to its operations through a combination of long-term leases and purchases. The aggregate purchase price was approximately
$96,085
, including the assumption of an existing HUD-insured loan of
$3,417
. The Company also entered into a separate operations transfer agreement with the prior operator as part of each transaction.
The table below presents the allocation of the purchase price for the operations acquired in business combinations during the
year ended
December 31, 2016
,
2015
and
2014
:
|
December 31,
|
|||||||||||
|
2016
|
2015
|
2014
|
|||||||||
|
Land
|
$
|
1,054
|
|
$
|
12,811
|
|
$
|
10,314
|
|
||
|
Building and improvements
|
21,057
|
|
73,502
|
|
41,995
|
|
|||||
|
Equipment, furniture, and fixtures
|
8,265
|
|
4,612
|
|
2,933
|
|
|||||
|
Assembled occupancy
|
1,299
|
|
895
|
|
905
|
|
|||||
|
Definite-lived intangible assets
|
363
|
|
360
|
|
729
|
|
|||||
|
Goodwill
|
30,343
|
|
10,617
|
|
6,334
|
|
|||||
|
Favorable leases
|
393
|
|
10,901
|
|
28,680
|
|
|||||
|
Other indefinite-lived intangible assets
|
1,741
|
|
6,285
|
|
4,195
|
|
|||||
|
Other assets acquired, net of liabilities assumed
|
6
|
|
(18
|
)
|
—
|
|
|||||
|
Total acquisitions
|
$
|
64,521
|
|
$
|
119,965
|
|
$
|
96,085
|
|
||
In addition to the business combinations above, in 2016, the Company acquired the underlying real estate of
fifteen
assisted living operation, which the Company previously operated under a long-term lease agreement for an aggregate purchase price of
$127,348
. For year ended December 31, 2015, the Company acquired the underlying real estate and assets of
three
skilled nursing operations, which the Company previously operated under long-term lease agreements for an aggregate purchase price of $
$23,998
, which included a promissory note of $
$6,248
. These asset acquisitions did not impact the Company's operational bed or unit counts.
Subsequent to
December 31, 2016
, the Company acquired
one
skilled nursing and assisted living operation for a purchase price of
$5,750
, which included real estate. The addition of this operation added
124
operational skilled nursing beds and
nine
assisted living units operated by the Company's operating subsidiaries.
124
9. ACQUISITIONS - PRO FORMA FINANCIAL INFORMATION
The Company has established an acquisition strategy that is focused on identifying acquisitions within its target markets that offer the greatest opportunity for investment return at attractive prices. The facilities acquired by the Company are frequently underperforming financially and can have regulatory and clinical challenges to overcome. Financial information, especially with underperforming facilities, is often inadequate, inaccurate or unavailable. As a result, the Company has developed an acquisition assessment program that is based on existing and potential resident mix, the local available market, referral sources and operating expectations based on the Company's experience with its existing facilities. Following an acquisition, the Company implements a well-developed integration program to provide a plan for transition and generation of profits from facilities that have a history of significant operating losses. Consequently, the Company believes that prior operating results are not meaningful as the information is not generally representative of the Company's current operating results or indicative of the integration potential of its newly acquired facilities.
The following table represents pro forma results of consolidated operations as if the acquisitions acquired from January 1, 2016 through the issuance date of the financial statements had occurred at the beginning of 2015, after giving effect to certain adjustments.
|
December 31,
|
|||||||
|
2016
|
|
2015
|
|||||
|
(Unaudited)
|
|||||||
|
Revenue
|
$
|
1,725,063
|
|
$
|
1,524,371
|
|
|
|
Net income attributable to The Ensign Group, Inc.
|
48,992
|
|
54,790
|
|
|||
|
Diluted net income per common share
|
$
|
0.94
|
|
$
|
1.05
|
|
|
Our pro forma assumptions are as follows:
|
•
|
Revenues and operating costs were based on actual results from the prior operator or from regulatory filings where available. If actual results were not available, revenues and operating costs were estimated based on available partial operating results of the prior operator of the facility, or if no information was available, estimates were derived from the Company’s post-acquisition operating results for that particular facility. Prior year results for the 2016 acquisitions were obtained from available financial information provided by prior operators or available cost reports filed by the prior operators.
|
|
•
|
Interest expense is based upon the purchase price and average cost of debt borrowed during each respective year when applicable, and depreciation is calculated using the purchase price allocated to the related assets through acquisition accounting.
|
The foregoing unaudited pro forma information is not indicative of what the results of operations would have been if the acquisitions had actually occurred at the beginning of the periods presented, and is not intended as a projection of future results or trends. Included in the table above are pro forma revenue and loss generated during the
year ended December 31, 2016
, by individually immaterial business acquisitions completed through the issuance date of the Financial Statements of $
70,199
and
$997
, respectively. Included in the table above are pro forma revenue and loss generated during the
year ended December 31, 2015
, by individually immaterial business acquisitions completed through the issuance date of the financial statements of
$182,546
and
$642
, respectively.
125
10. PROPERTY AND EQUIPMENT— Net
Property and equipment, net consist of the following:
|
December 31,
|
|||||||
|
2016
|
2015
|
||||||
|
Land
|
$
|
47,565
|
|
$
|
41,451
|
|
|
|
Buildings and improvements
|
304,263
|
|
151,434
|
|
|||
|
Equipment
|
153,170
|
|
114,752
|
|
|||
|
Furniture and fixtures
|
6,931
|
|
5,504
|
|
|||
|
Leasehold improvements
|
80,164
|
|
68,405
|
|
|||
|
Construction in progress
|
2,441
|
|
781
|
|
|||
|
|
594,534
|
|
382,327
|
|
|||
|
Less: accumulated depreciation
|
(110,036
|
)
|
(82,694
|
)
|
|||
|
Property and equipment, net
|
$
|
484,498
|
|
$
|
299,633
|
|
|
See Note 8,
Acquisitions
for information on acquisitions during the
year ended December 31, 2016
.
11. INTANGIBLE ASSETS — Net
|
|
Weighted Average Life (Years)
|
December 31,
|
||||||||||||||||||||||||
|
2016
|
2015
|
|||||||||||||||||||||||||
|
Gross Carrying Amount
|
Accumulated Amortization
|
Gross Carrying Amount
|
Accumulated Amortization
|
|||||||||||||||||||||||
|
Intangible Assets
|
Net
|
Net
|
||||||||||||||||||||||||
|
Lease acquisition costs
|
24.7
|
$
|
483
|
|
$
|
(78
|
)
|
$
|
405
|
|
$
|
604
|
|
$
|
(577
|
)
|
$
|
27
|
|
|||||||
|
Favorable leases
|
32.1
|
35,116
|
|
(4,589
|
)
|
30,527
|
|
43,248
|
|
(2,923
|
)
|
40,325
|
|
|||||||||||||
|
Assembled occupancy
|
0.0
|
1,897
|
|
(1,897
|
)
|
—
|
|
4,779
|
|
(4,476
|
)
|
303
|
|
|||||||||||||
|
Facility trade name
|
30.0
|
733
|
|
(269
|
)
|
464
|
|
733
|
|
(244
|
)
|
489
|
|
|||||||||||||
|
Customer relationships
|
18.5
|
4,933
|
|
(1,253
|
)
|
3,680
|
|
5,300
|
|
(1,013
|
)
|
4,287
|
|
|||||||||||||
|
Total
|
|
$
|
43,162
|
|
$
|
(8,086
|
)
|
$
|
35,076
|
|
$
|
54,664
|
|
$
|
(9,233
|
)
|
$
|
45,431
|
|
|||||||
Amortization expense was
$4,634
,
$3,824
and
$1,089
for the
years ended December 31, 2016, 2015 and 2014
, respectively. Of the
$4,634
in amortization expense incurred during the
year ended
December 31, 2016
, approximately
$1,602
related to the amortization of patient base intangible assets at recently acquired facilities, which is typically amortized over a period of four to eight months, depending on the classification of the patients and the level of occupancy in a new acquisition on the acquisition date. As of
December 31, 2016
, the Company removed
$582
in customer relationships as part of the sale of urgent care center and
$7,190
of favorable leases as part of the acquisition of the real estate of
fifteen
assisted living operations. In addition, the Company identified intangible assets that have become fully amortized during the year and removed the fully amortized balances from the gross asset and accumulated amortization amounts.
Estimated amortization expense for each of the years ending December 31 is as follows:
|
Year
|
Amount
|
||
|
2017
|
2,282
|
|
|
|
2018
|
2,282
|
|
|
|
2019
|
2,282
|
|
|
|
2020
|
1,573
|
|
|
|
2021
|
1,475
|
|
|
|
Thereafter
|
25,182
|
|
|
|
|
$
|
35,076
|
|
126
12. GOODWILL AND OTHER INDEFINITE-LIVED INTANGIBLE ASSETS
The Company performs its annual goodwill impairment analysis during the fourth quarter of each year for each reporting unit that constitutes a business for which discrete financial information is produced and reviewed by operating segment management and provides services that are distinct from the other components of the operating segment, in accordance with the provisions of Accounting Standards Codification topic 350, Intangibles—Goodwill and Other (ASC 350). This guidance provides the option to first assess qualitative factors to determine whether it is more likely than not that the fair value of a reporting unit is less than its carrying value, a "Step 0" analysis. If, based on a review of qualitative factors, it is more likely than not that the fair value of a reporting unit is less than its carrying value, the Company performs "Step 1" of the traditional two-step goodwill impairment test by comparing the net assets of each reporting unit to their respective fair values. The Company determines the estimated fair value of each reporting unit using a discounted cash flow analysis. In the event a unit's net assets exceed its fair value, an implied fair value of goodwill must be determined by assigning the unit's fair value to each asset and liability of the unit. The excess of the fair value of the reporting unit over the amounts assigned to its assets and liabilities is the implied fair value of goodwill. An impairment loss is measured by the difference between the goodwill carrying value and the implied fair value.
The Company performs its goodwill impairment test annually and evaluates goodwill when events or changes in circumstances indicate that its carrying value may not be recoverable. The Company performs the annual impairment testing of goodwill using October 1 as the measurement date. The Company completed its goodwill impairment test as of October 1, 2016 and no impairments were identified. In the fourth quarter of 2016, the Company separated the assisted and independent living services into a distinct reportable segment. The Company re-tested for goodwill impairment based on the new reporting units and no impairments were identified. As of
December 31, 2016
, the Company removed
$4,103
in goodwill as part of the sale of urgent care centers.
The following table represents activity in goodwill by segment as of and for the
year ended December 31, 2016
:
|
Goodwill
|
|||||||||||||||||||
|
|
Transitional and Skilled Services
|
Assisted and Independent Living Services
|
Home Health and Hospice Services
|
All Other
|
Total
|
||||||||||||||
|
January 1, 2014
|
$
|
13,338
|
|
$
|
316
|
|
$
|
7,278
|
|
$
|
3,003
|
|
$
|
23,935
|
|
||||
|
Impairments
|
—
|
|
—
|
|
—
|
|
$
|
—
|
|
$
|
—
|
|
|||||||
|
Additions
|
883
|
|
1,440
|
|
3,651
|
|
$
|
360
|
|
6,334
|
|
||||||||
|
December 31, 2014
|
$
|
14,221
|
|
$
|
1,756
|
|
$
|
10,929
|
|
$
|
3,363
|
|
$
|
30,269
|
|
||||
|
Impairments
|
—
|
|
—
|
|
—
|
|
$
|
—
|
|
$
|
—
|
|
|||||||
|
Additions
|
—
|
|
1,782
|
|
5,173
|
|
$
|
3,662
|
|
10,617
|
|
||||||||
|
December 31, 2015
|
$
|
14,221
|
|
$
|
3,538
|
|
$
|
16,102
|
|
$
|
7,025
|
|
$
|
40,886
|
|
||||
|
Less: Dispositions
|
—
|
|
—
|
|
—
|
|
$
|
(4,103
|
)
|
$
|
(4,103
|
)
|
|||||||
|
Purchase price adjustment
|
—
|
|
—
|
|
—
|
|
(26
|
)
|
(26
|
)
|
|||||||||
|
Additions
|
26,415
|
|
—
|
|
1,799
|
|
2,129
|
|
30,343
|
|
|||||||||
|
December 31, 2016
|
$
|
40,636
|
|
$
|
3,538
|
|
|
$
|
17,901
|
|
$
|
5,025
|
|
$
|
67,100
|
|
|||
There was no impairment charge to goodwill for the years ended December 31, 2016, 2015, and 2014. The Company anticipates that total goodwill recognized will be fully deductible for tax purposes as of
December 31, 2016
. See further discussion of goodwill acquired at Note 8,
Acquisitions
.
During the year ended
December 31, 2016
, the Company recorded
$1,709
in home health and hospice Medicare license and
$31
in trade name indefinite-lived intangible assets as part of its acquisitions. In addition, the Company removed
$800
in trade name as part of the sale of urgent care centers in 2016.
Other indefinite-lived intangible assets consists of the following:
127
|
December 31, 2016
|
December 31, 2015
|
||||||
|
Trade name
|
$
|
1,146
|
|
$
|
1,915
|
|
|
|
Medicare and Medicaid licenses
|
18,440
|
|
16,731
|
|
|||
|
|
$
|
19,586
|
|
$
|
18,646
|
|
|
13. RESTRICTED AND OTHER ASSETS
Restricted and other assets consist of the following:
|
December 31,
|
|||||||
|
2016
|
|
2015
|
|||||
|
Debt issuance costs, net
|
$
|
3,611
|
|
$
|
2,021
|
|
|
|
Long-term insurance losses recoverable asset
|
4,104
|
|
2,881
|
|
|||
|
Deposits with landlords
|
3,526
|
|
3,969
|
|
|||
|
Capital improvement reserves with landlords and lenders
|
673
|
|
760
|
|
|||
|
Note receivable from sale of urgent care centers
|
700
|
|
—
|
|
|||
|
Restricted and other assets
|
$
|
12,614
|
|
$
|
9,631
|
|
|
Included in restricted and other assets as of
December 31, 2016
and 2015, are anticipated insurance recoveries related to the Company's workers' compensation, general and professional liability claims that are recorded on a gross rather than net basis in accordance with an Accounting Standards Update issued by the FASB.
14. OTHER ACCRUED LIABILITIES
Other accrued liabilities consist of the following:
|
December 31,
|
|||||||
|
2016
|
|
2015
|
|||||
|
Quality assurance fee
|
$
|
4,604
|
|
$
|
6,120
|
|
|
|
Refunds payable
|
18,368
|
|
13,252
|
|
|||
|
Deferred revenue
|
6,994
|
|
6,696
|
|
|||
|
Cash held in trust for patients
|
2,373
|
|
3,016
|
|
|||
|
Resident deposits
|
6,099
|
|
5,884
|
|
|||
|
Dividends payable
|
2,186
|
|
2,072
|
|
|||
|
Property taxes
|
9,130
|
|
4,230
|
|
|||
|
Charges related to operational closure
|
1,972
|
|
—
|
|
|||
|
Other
|
7,037
|
|
4,935
|
|
|||
|
Other accrued liabilities
|
$
|
58,763
|
|
$
|
46,205
|
|
|
Quality assurance fee represents amounts payable to Arizona, California, Colorado, Idaho, Iowa, Kansas, Nebraska, Nevada, Utah, Washington and Wisconsin as a result of a mandated fee based on patient days or licensed beds. Refunds payable includes payables related to overpayments and duplicate payments from various payor sources. Deferred revenue occurs when the Company receives payments in advance of services provided. Resident deposits include refundable deposits to patients. Cash held in trust for patients reflects monies received from, or on behalf of, patients. Maintaining a trust account for patients is a regulatory requirement and, while the trust assets offset the liabilities, the Company assumes a fiduciary responsibility for these funds. The cash balance related to this liability is included in other current assets in the accompanying consolidated balance sheets.
128
15. INCOME TAXES
The provision for income taxes on continuing operations for the years ended December 31, 2016, 2015 and 2014 is summarized as follows:
|
|
Year Ended December 31,
|
||||||||||
|
|
2016
|
|
2015
|
|
2014
|
||||||
|
Current:
|
|
|
|
|
|
||||||
|
Federal
|
$
|
30,043
|
|
$
|
28,149
|
|
$
|
25,490
|
|
||
|
State
|
5,183
|
|
5,761
|
|
4,405
|
|
|||||
|
|
35,226
|
|
|
33,910
|
|
|
29,895
|
|
|||
|
Deferred:
|
|
|
|
|
|
||||||
|
Federal
|
(1,034
|
)
|
2,026
|
|
(2,438
|
)
|
|||||
|
State
|
(1,217
|
)
|
(754
|
)
|
(656
|
)
|
|||||
|
(2,251
|
)
|
|
1,272
|
|
|
(3,094
|
)
|
||||
|
Total
|
$
|
32,975
|
|
|
$
|
35,182
|
|
|
$
|
26,801
|
|
A reconciliation of the federal statutory rate to the effective tax rate for income from operations for the years ended December 31, 2016, 2015 and 2014, respectively, is comprised as follows:
|
|
December 31,
|
|||||||
|
|
2016
|
|
2015
|
|
2014
|
|||
|
Income tax expense at statutory rate
|
35.0
|
%
|
35.0
|
%
|
35.0
|
%
|
||
|
State income taxes - net of federal benefit
|
3.0
|
|
3.6
|
|
4.0
|
|
||
|
Non-deductible expenses
|
0.9
|
|
0.6
|
|
0.6
|
|
||
|
Non-deductible transaction costs
|
—
|
|
—
|
|
5.2
|
|
||
|
Other adjustments
|
(0.5
|
)
|
(0.6
|
)
|
(0.4
|
)
|
||
|
Total income tax provision
|
38.4
|
%
|
|
38.6
|
%
|
|
44.4
|
%
|
The Company's deferred tax assets and liabilities as of December 31, 2016 and 2015 are summarized as follows:
|
|
December 31,
|
||||||
|
|
2016
|
|
2015
|
||||
|
Deferred tax assets (liabilities):
|
|
|
|
||||
|
Accrued expenses
|
$
|
21,732
|
|
$
|
18,957
|
|
|
|
Allowance for doubtful accounts
|
15,956
|
|
12,313
|
|
|||
|
Tax credits
|
3,461
|
|
3,439
|
|
|||
|
Insurance
|
7,333
|
|
5,814
|
|
|||
|
Total deferred tax assets
|
48,482
|
|
|
40,523
|
|
||
|
State taxes
|
(1,023
|
)
|
(420
|
)
|
|||
|
Depreciation and amortization
|
(20,643
|
)
|
(14,773
|
)
|
|||
|
Prepaid expenses
|
(3,743
|
)
|
(4,478
|
)
|
|||
|
Total deferred tax liabilities
|
(25,409
|
)
|
|
(19,671
|
)
|
||
|
Net deferred tax assets
|
$
|
23,073
|
|
|
$
|
20,852
|
|
The Company had state credit carryforwards as of December 31, 2016 and 2015 of
$3,430
and
$3,439
, respectively. These carryforwards almost entirely relate to state limitations on the application of Enterprise Zone employment-related tax credits. Unless the Company uses the Enterprise Zone credits beforehand, the carryforward will begin to expire in 2023. The remainder of these carryforwards relates to credits against the Texas margin tax and is expected to carryforward until 2027.
129
The Company did not have federal net operating loss carryforward as of December 31, 2016. The Company had federal net operating loss carryforwards as of December 31, 2015 of
$4,389
. The Company also had state net operating losses as of December 31, 2016 and 2015 of
$67
and
$84
, respectively. These state net operating losses will begin to expire in 2032.
The Federal statutes of limitations on the Company's 2010, 2011, and 2012 income tax years lapsed during the third quarter of 2014, 2015, and 2016, respectively. During the fourth quarter of each year, various state statutes of limitations also lapsed. The lapses for the years ended December 31, 2016, 2015, and 2014 had no impact on the Company's unrecognized tax benefits.
As of December 31, 2016, 2015 and 2014, the Company did not have any unrecognized tax benefits, net of their state benefits, that would affect the Company's effective tax rate. The Company classifies interest and/or penalties on income tax liabilities or refunds as additional income tax expense or income. Such amounts are not material.
16. DEBT
Long-term debt consists of the following:
|
December 31,
|
|||||||
|
2016
|
2015
|
||||||
|
Term loan with SunTrust, interest payable quarterly
|
$
|
148,125
|
|
$
|
—
|
|
|
|
Credit facility with SunTrust
|
122,000
|
|
85,000
|
|
|||
|
Mortgage loans and promissory note, principal and interest payable monthly, interest at fixed rate
|
14,032
|
|
14,671
|
|
|||
|
|
284,157
|
|
99,671
|
|
|||
|
Less current maturities
|
(8,129
|
)
|
(620
|
)
|
|||
|
Less debt issuance costs
|
(542
|
)
|
—
|
|
|||
|
|
$
|
275,486
|
|
$
|
99,051
|
|
|
Credit Facility with a Lending Consortium Arranged by SunTrust
The Company maintains a credit facility with a lending consortium arranged by SunTrust (as amended to date, the Credit Facility). On July 19, 2016, the Company entered into the second amendment to the credit facility (Second Amended Credit Facility), which amended the existing credit agreement to increase the aggregate principal amount up to
$450,000
. The Second Amended Credit Facility comprised of a
$300,000
revolving credit facility and a
$150,000
term loan. Borrowings under the term loan portion of the Second Amended Credit Facility mature on February 5, 2021 and amortizes in equal quarterly installments, in an aggregate annual amount equal to
5.0%
per annum of the original principal amount. The interest rates and commitment fee applicable to the Second Amended Credit Facility are similar to the Amended Credit Facility discussed below. Except as set forth in the Second Amended Credit Facility, all other terms and conditions of the Amended Credit Facility remained in full force and effect as described below.
On February 5, 2016, the Company amended its existing revolving credit facility to increase its aggregate principal amount available to
$250,000
(the Amended Credit Facility). Under the credit facility, the Company may seek to obtain incremental revolving or term loans in an aggregate amount not to exceed
$150,000
. The interest rates applicable to loans under the credit facility are, at the Company's option, equal to either a base rate plus a margin ranging from
0.75%
to
1.75%
per annum or LIBOR plus a margin ranging from
1.75%
to
2.75%
per annum, based on the Consolidated Total Net Debt to Consolidated EBITDA ratio (as defined in the agreement). In addition, the Company will pay a commitment fee on the unused portion of the commitments under the credit facility that will range from
0.30%
to
0.50%
per annum, depending on the Consolidated Total Net Debt to Consolidated EBITDA ratio of the Company and its subsidiaries. The Company is permitted to prepay all or any portion of the loans under the credit facility prior to maturity without premium or penalty, subject to reimbursement of any LIBOR breakage costs of the lenders.
The Credit Facility is secured by a pledge of stock of the Company's material operating subsidiaries as well as a first lien on substantially all of its personal property. The credit facility contains customary covenants that, among other things, restrict, subject to certain exceptions, the ability of the Company and its operating subsidiaries to grant liens on their assets, incur indebtedness, sell assets, make investments, engage in acquisitions, mergers or consolidations, amend certain material agreements and pay certain dividends and other restricted payments. Under the Credit Facility, the Company must comply with financial maintenance covenants to be tested quarterly, consisting of a maximum Consolidated Total Net Debt to consolidated EBITDA ratio (which shall be increased
130
to
3.50
:
1.00
for the current fiscal quarter and the immediate following
three
fiscal quarters), and a minimum interest/rent coverage ratio (which cannot be below
1.50
:
1.00
). The majority of lenders can require that the Company and its operating subsidiaries mortgage certain of its real property assets to secure the Amended Credit Facility if an event of default occurs, the Consolidated Total Net Debt to consolidated EBITDA ratio is above
2.75
:
1.00
for
two
consecutive fiscal quarters, or its liquidity is equal or less than
10%
of the Aggregate Revolving Commitment Amount (as defined in the agreement) for
ten
consecutive business days, provided that such mortgages will no longer be required if the event of default is cured, the Consolidated Total Net Debt to consolidated EBITDA ratio is below
2.75
:
1.00
for
two
consecutive fiscal quarters, or its liquidity is above
10%
of the Aggregate Revolving Commitment Amount (as defined in the agreement) or
ninety
consecutive days, as applicable. As of
December 31, 2016
, the Company's operating subsidiaries had
$270,125
outstanding under the Credit Facility. The outstanding balance on the on the term loan was
$148,125
, of which
$7,500
is classified as short-term and the remaining
$140,625
is classified as long-term. The outstanding balance on the revolving Credit Facility was
$122,000
, which is classified as long-term. The Company was in compliance with all loan covenants as of
December 31, 2016
.
On May 30, 2014, the Company entered into the Credit Facility in an aggregate principal amount of
$150,000
from a syndicate of banks and other financial institutions. Under the Credit Facility, the Company may seek to obtain incremental revolving or term loans in an aggregate amount not to exceed
$75,000
.
The interest rates applicable to loans under the Credit Facility are, at the Company’s option, equal to either a base rate plus a margin ranging from
1.25%
to
2.25%
per annum or LIBOR plus a margin ranging from
2.25%
to
3.25%
per annum, based on the debt to Consolidated EBITDA ratio of the Company and its operating subsidiaries as defined in the agreement. In addition, the Company will pay a commitment fee on the unused portion of the commitments under the Credit Facility that will range from
0.30%
to
0.50%
per annum, depending on the debt to Consolidated EBITDA ratio of the Company and its operating subsidiaries. Loans made under the Credit Facility are not subject to interim amortization. The Company is not required to repay any loans under the Credit Facility prior to maturity, other than to the extent the outstanding borrowings exceed the aggregate commitments under the Credit Facility.
The Credit Facility is guaranteed, jointly and severally, by certain of the Company’s wholly owned subsidiaries, and is secured by substantially all of the Company's personal property. Under the Credit Facility, the Company must comply with financial maintenance covenants to be tested quarterly, consisting of a maximum debt to consolidated EBITDA ratio, and a minimum interest/rent coverage ratio. The majority of lenders can require that the Company and its operating subsidiaries mortgage certain of their real property assets to secure the Credit Facility if an event of default occurs, the debt to consolidated EBITDA ratio is above
2.50
:
1.00
for two consecutive fiscal quarters, or the Company’s liquidity is equal or less than
10%
of the Aggregate Revolving Commitment Amount (as defined in the agreement) for ten consecutive business days, provided that such mortgages will no longer be required if the event of default is cured, the debt to consolidated EBITDA ratio is below
2.50
:
1.00
for two consecutive fiscal quarters, or the Company’s liquidity is above
10%
of the Aggregate Revolving Commitment Amount (as defined in the agreement) or ninety consecutive days, as applicable.
As of
February 6, 2017
, there was approximately
$300,000
outstanding under the Credit Facility.
Mortgage Loans and Promissory Note
The Company had outstanding indebtedness under mortgage loans and promissory note issued in connection with various acquisitions. The mortgage loans are insured with the U.S. Department of Housing and Urban Development (HUD), which subjects the Company's operating subsidiaries to HUD oversight and periodic inspections. The mortgage loans and note bear fixed interest rates between
2.6%
and
5.3%
per annum. Amounts borrowed under the mortgage loans may be prepaid starting after the second anniversary of the notes subject to prepayment fees of the principal balance on the date of prepayment. These prepayment fees are reduced by
1.0%
per year for years
three
through
eleven
of the loan. There is no prepayment penalty after year
eleven
. The term of the mortgage loans and note is between
12
and
33 years
. The mortgage loans and note are secured by the real property comprising the facilities and the rents, issues and profits thereof, as well as all personal property used in the operation of the facilities. As of
December 31, 2016
, the Company's operating subsidiaries had
$14,032
outstanding under the mortgage loans and note, of which
$629
is classified as short-term and the remaining
$13,403
is classified as long-term. The Company was in compliance with all loan covenants as of
December 31, 2016
.
Based on Level 2, the carrying value of the Company's long-term debt is considered to approximate the fair value of such debt for all periods presented based upon the interest rates that the Company believes it can currently obtain for similar debt.
Future principal payments due under the long-term debt arrangements discussed above are as follows:
131
|
Years Ending
|
|
|||
|
December 31,
|
Amount
|
|||
|
2017
|
$
|
8,129
|
|
|
|
2018
|
8,178
|
|
||
|
2019
|
8,208
|
|
||
|
2020
|
8,241
|
|
||
|
2021
|
240,900
|
|
||
|
Thereafter
|
10,501
|
|
||
|
|
$
|
284,157
|
|
|
Off-Balance Sheet Arrangements
As of December 31, 2016
, the Company had approximately
$2,310
on the credit facility of borrowing capacity pledged as collateral to secure outstanding letters of credit.
17. OPTIONS AND AWARDS
Stock-based compensation expense consists of share-based payment awards made to employees and directors, including employee stock options and restricted stock awards, based on estimated fair values. As stock-based compensation expense recognized in the Company’s consolidated statements of income for the
years ended December 31, 2016, 2015 and 2014
was based on awards ultimately expected to vest, it has been reduced for estimated forfeitures. The Company estimates forfeitures at the time of grant and, if necessary, revises the estimate in subsequent periods if actual forfeitures differ.
The Company has three option plans, the 2001 Stock Option, Deferred Stock and Restricted Stock Plan (2001 Plan), the 2005 Stock Incentive Plan (2005 Plan) and the 2007 Omnibus Incentive Plan (2007 Plan), all of which have been approved by the Company's stockholders. The total number of shares available under all of the Company’s stock incentive plans was
3,042
as of
December 31, 2016
.
2001 Stock Option, Deferred Stock and Restricted Stock Plan
- The 2001 Plan authorizes the sale of up to
3,960
shares of common stock to officers, employees, directors, and consultants of the Company. Granted non-employee director options vest and become exercisable immediately. Generally, all other granted options and restricted stock vest over five years at 20% per year on the anniversary of the grant date. Options expire ten years from the date of grant. The exercise price of the stock is determined by the board of directors, but shall not be less than 100% of the fair value on the date of grant. There were
643
,
638
and
638
unissued shares of common stock available for issuance under this plan for each of the years ending December 31, 2016, 2015 and 2014, including shares that have been forfeited and are available for reissue.
2005 Stock Incentive Plan
- The 2005 Plan authorizes the sale of up to
1,000
shares of treasury stock of which only
1,000
shares were repurchased and therefore eligible for reissuance. Options granted to non-employee directors vest and become exercisable immediately. All other granted options vest over five years at 20% per year on the anniversary of the grant date. Options expire ten years from the date of grant. There were
294
unissued shares of common stock available for issuance under this plan for each of the years ending December 31, 2016, 2015 and 2014, including shares that have been forfeited and are available for reissue.
2007 Omnibus Incentive Plan
- The 2007 Plan authorizes the sale of up to
2,000
shares of common stock to officers, employees, directors and consultants of the Company. In addition, the number of shares of common stock reserved under the 2007 Plan will automatically increase on the first day of each fiscal year, beginning on January 1, 2008, in an amount equal to the lesser of (i) 1,000 shares of common stock, or (ii) 2% of the number of shares outstanding as of the last day of the immediately preceding fiscal year, or (iii) such lesser number as determined by the Company's board of directors. Granted non-employee director options vest and become exercisable in three equal annual installments, or the length of the term if less than three years, on the completion of each year of service measured from the grant date. All other granted options vest over five years at 20% per year on the anniversary of the grant date. Options expire 10 years from the date of grant. At December 31, 2016, 2015 and 2014, there were
2,105
,
1,740
, and
1,534
unissued shares of common stock available for issuance under this plan.
The Company uses the Black-Scholes option-pricing model to recognize the value of stock-based compensation expense for all share-based payment awards. Determining the appropriate fair-value model and calculating the fair value of stock-based awards at the grant date requires considerable judgment, including estimating stock price volatility, expected option life and
132
forfeiture rates. The Company develops estimates based on historical data and market information, which can change significantly over time. The Black-Scholes model required the Company to make several key judgments including:
|
•
|
The expected option term is calculated by the average of the contractual term of the options and the weighted average vesting period for all options. The calculation of the expected option term is based on the Company's experience due to sufficient history.
|
|
•
|
Estimated volatility also reflects the application of SAB 107 interpretive guidance and, accordingly, incorporates historical volatility of similar public entities until sufficient information regarding the volatility of the Company's share price becomes available. The Company utilized its own experience to calculate estimated volatility for options granted in the year 2016 and 2015.
|
|
•
|
The dividend yield is based on the Company's historical pattern of dividends as well as expected dividend patterns.
|
|
•
|
The risk-free rate is based on the implied yield of U.S. Treasury notes as of the grant date with a remaining term approximately equal to the expected term.
|
|
•
|
Estimated forfeiture rate of approximately
8.75%
per year is based on the Company's historical forfeiture activity of unvested stock options.
|
Stock Options
The Company granted
497
options and
299
restricted stock awards from the 2007 Plan during the
year ended December 31, 2016
. The Company used the following assumptions for stock options granted during the
years ended December 31, 2016, 2015 and 2014
:
|
Grant Year
|
Options Granted
|
Weighted Average Risk-Free Rate
|
Expected Life
|
Weighted Average Volatility
|
Weighted Average Dividend Yield
|
||||||
|
2016
|
497
|
|
1.38%
|
6.3 years
|
38%
|
0.80%
|
|||||
|
2015
|
637
|
|
1.69%
|
6.5 years
|
39%
|
0.63%
|
|||||
|
2014
|
2,058
|
|
1.82%
|
6.5 years
|
46%
|
0.62%
|
|||||
For the
years ended December 31, 2016, 2015 and 2014
, the following represents the exercise price and fair value displayed at grant date for stock option grants:
|
Grant Year
|
Granted
|
Weighted Average Exercise Price
|
Weighted Average Fair Value of Options
|
||||||||
|
2016
|
497
|
|
$
|
19.43
|
|
$
|
7.00
|
|
|||
|
2015
|
637
|
|
$
|
23.27
|
|
$
|
9.08
|
|
|||
|
2014
|
2,058
|
|
$
|
12.68
|
|
$
|
5.66
|
|
|||
The weighted average exercise price equaled the weighted average fair value of common stock on the grant date for all options granted during the periods ended
December 31, 2016, 2015 and 2014
and therefore, the intrinsic value was
$0
at date of grant.
133
The following table represents the employee stock option activity during the
years ended December 31, 2016, 2015 and 2014
:
|
Number of
Options
Outstanding
|
Weighted
Average
Exercise Price
|
Number of
Options Vested
|
Weighted
Average
Exercise Price
of Options
Vested
|
||||||||||
|
January 1, 2014
|
4,580
|
|
$
|
5.65
|
|
2,498
|
|
$
|
3.88
|
|
|||
|
Granted
|
2,058
|
|
12.68
|
|
|||||||||
|
Forfeited
|
(128
|
)
|
8.14
|
|
|||||||||
|
Exercised
|
(978
|
)
|
3.93
|
|
|||||||||
|
December 31, 2014
|
5,532
|
|
$
|
8.51
|
|
2,218
|
|
$
|
4.70
|
|
|||
|
Granted
|
637
|
|
|
23.27
|
|
||||||||
|
Forfeited
|
(233
|
)
|
|
12.55
|
|
||||||||
|
Exercised
|
(488
|
)
|
|
5.20
|
|
||||||||
|
December 31, 2015
|
5,448
|
|
$
|
10.36
|
|
2,526
|
|
$
|
6.35
|
|
|||
|
Granted
|
497
|
|
19.43
|
|
|
|
|||||||
|
Forfeited
|
(127
|
)
|
14.46
|
|
|
|
|||||||
|
Exercised
|
(642
|
)
|
6.47
|
|
|
|
|||||||
|
December 31, 2016
|
5,176
|
|
$
|
11.62
|
|
2,704
|
|
$
|
8.18
|
|
|||
The following summary information reflects stock options outstanding, vested and related details as of
December 31, 2016
:
|
Stock Options Vested
|
||||||||||||||||
|
|
Stock Options Outstanding
|
|||||||||||||||
|
Number Outstanding
|
Black-Scholes Fair Value
|
Remaining Contractual Life (Years)
|
Vested and Exercisable
|
|||||||||||||
|
Year of Grant
|
Exercise Price
|
|||||||||||||||
|
2008
|
2.56
|
-
|
4.06
|
415
|
|
$
|
618
|
|
2
|
415
|
|
|||||
|
2009
|
4.06
|
-
|
4.56
|
542
|
|
1,162
|
|
3
|
542
|
|
||||||
|
2010
|
4.77
|
-
|
4.96
|
143
|
|
347
|
|
4
|
143
|
|
||||||
|
2011
|
5.90
|
-
|
7.99
|
167
|
|
567
|
|
5
|
167
|
|
||||||
|
2012
|
6.56
|
-
|
7.96
|
528
|
|
1,952
|
|
6
|
390
|
|
||||||
|
2013
|
7.98
|
-
|
11.49
|
617
|
|
2,996
|
|
7
|
331
|
|
||||||
|
2014
|
10.55
|
-
|
18.94
|
1,688
|
|
9,547
|
|
8
|
597
|
|
||||||
|
2015
|
21.47
|
-
|
25.24
|
590
|
|
5,357
|
|
9
|
119
|
|
||||||
|
2016
|
18.79
|
-
|
19.89
|
486
|
|
3,396
|
|
10
|
—
|
|
||||||
|
Total
|
|
5,176
|
|
$
|
25,942
|
|
|
|
2,704
|
|
||||||
Restricted Stock Awards
The Company granted
299
,
323
and
56
restricted stock awards during the
years ended December 31, 2016, 2015 and 2014
, respectively. All awards were granted at an exercise price of
$0
and generally vest over
five years
. The fair value per share of restricted awards granted during
2016
,
2015
and
2014
ranged from
$18.79
to
$23.23
,
$21.00
to
$26.55
, and
$15.38
to
$22.36
, respectively.
A summary of the status of the Company's non-vested restricted stock awards as of
December 31, 2016
and changes during the
years ended December 31, 2016, 2015 and 2014
is presented below:
134
|
Non-Vested Restricted Awards
|
Weighted Average Grant Date Fair Value
|
|||||
|
Nonvested at January 1, 2014
|
460
|
|
$
|
14.34
|
|
|
|
Granted
|
56
|
|
17.75
|
|
||
|
Vested
|
(130
|
)
|
13.38
|
|
||
|
Forfeited
|
(20
|
)
|
15.12
|
|
||
|
Nonvested at December 31, 2014
|
366
|
|
$
|
15.15
|
|
|
|
Granted
|
323
|
|
22.99
|
|
||
|
Vested
|
(234
|
)
|
17.36
|
|
||
|
Forfeited
|
(30
|
)
|
16.81
|
|
||
|
Nonvested at December 31, 2015
|
425
|
|
$
|
19.79
|
|
|
|
Granted
|
299
|
|
20.55
|
|
||
|
Vested
|
(279
|
)
|
19.58
|
|
||
|
Forfeited
|
(16
|
)
|
20.85
|
|
||
|
Nonvested at December 31, 2016
|
429
|
|
$
|
20.42
|
|
|
During the
year ended December 31, 2016
, the Company granted
32
automatic quarterly stock awards to non-employee directors for their service on the Company's board of directors. The fair value per share of these stock awards ranged from
$19.61
to
$23.23
based on the market price on the grant date.
Total share-based compensation expense recognized for the
years ended December 31, 2016, 2015 and 2014
was as follows:
|
Year Ended December 31,
|
|||||||||||
|
|
2016
|
2015
|
2014
|
||||||||
|
Share-based compensation expense related to stock options
|
$
|
4,793
|
|
$
|
4,164
|
|
$
|
3,134
|
|
||
|
Share-based compensation expense related to restricted stock awards
|
2,371
|
|
1,931
|
|
1,657
|
|
|||||
|
Share-based compensation expense related to stock awards to non-employee directors
|
612
|
|
582
|
|
399
|
|
|||||
|
Total
|
$
|
7,776
|
|
$
|
6,677
|
|
$
|
5,190
|
|
||
For the year ended December 31, 2016, 2015 and 2014, the Company expensed
$612
,
$582
and
$399
, respectively, in share-based compensation related to the quarterly stock awards to non-employee directors.
In future periods, the Company expects to recognize approximately
$13,457
and
$7,594
in share-based compensation expense for unvested options and unvested restricted stock awards, respectively, that were outstanding as of
December 31, 2016
. Future share-based compensation expense will be recognized over
3.1
and
3.4
weighted average years for unvested options and restricted stock awards, respectively. There were
2,472
unvested and outstanding options at
December 31, 2016
, of which
2,333
are expected to vest. The weighted average contractual life for options outstanding, vested and expected to vest at
December 31, 2016
was
6.1
years.
The aggregate intrinsic value of options outstanding, vested, expected to vest and exercised as of and for the
years ended December 31, 2016, 2015 and 2014
is as follows:
|
December 31,
|
||||||||||||
|
Options
|
2016
|
2015
|
2014
|
|||||||||
|
Outstanding
|
$
|
55,610
|
|
$
|
67,508
|
|
$
|
75,689
|
|
|||
|
Vested
|
38,101
|
|
41,128
|
|
38,811
|
|
||||||
|
Expected to vest
|
15,983
|
|
23,508
|
|
31,160
|
|
||||||
|
Exercisable
|
9,199
|
|
8,709
|
|
10,496
|
|
||||||
The intrinsic value is calculated as the difference between the market value of the underlying common stock and the exercise price of the options.
135
Equity Instrument Denominated in the Shares of a Subsidiary
On May 26, 2016, the Company implemented a management equity plan and granted stock options and restricted stock awards of a subsidiary of the Company to employees and management of that subsidiary (Subsidiary Equity Plan). These awards generally vest over a period of five years or upon the occurrence of certain prescribed events. The value of the stock options and restricted stock awards is tied to the value of the common stock of the subsidiary. The awards can be put to the Company at various prescribed dates, which in no event is earlier than six months after vesting of the restricted awards or exercise of the stock options. The Company can also call the awards, generally upon employee termination.
The grant-date fair value of the 2016 awards is
$4,623
, which will be recognized as compensation expense over the relevant vesting periods, with a corresponding adjustment to noncontrolling interests. The grant value was determined based on an independent valuation of the subsidiary shares. For the
year ended December 31, 2016
, the Company expensed
$1,325
in share-based compensation related to the Subsidiary Equity Plan. There was
no
expense incurred for the
year ended December 31, 2015
and
2014
as the plan was implemented in the second quarter of 2016.
The aggregate number of the Company's common shares that would be required to settle these awards at current estimated fair values, including vested and unvested awards, at
December 31, 2016
is
212
. There was no comparable amount at
December 31, 2015
and 2014 as the plan was implemented in the second quarter of 2016.
18. LEASES
The Company leases from CareTrust REIT, Inc. (CareTrust) real property associated with
93
affiliated skilled nursing, assisted living and independent living facilities used in the Company’s operations under
eight
“triple-net” master lease agreements (collectively, the Master Leases), which ranges from
12
to
19
years. At the Company’s option, the Master Leases may be extended for two or three five-year renewal terms beyond the initial term, on the same terms and conditions. The extension of the term of any of the Master Leases is subject to the following conditions: (1) no event of default under any of the Master Leases having occurred and being continuing; and (2) the tenants providing timely notice of their intent to renew. The term of the Master Leases is subject to termination prior to the expiration of the then current term upon default by the tenants in their obligations, if not cured within any applicable cure periods set forth in the Master Leases.
The Company does not have the ability to terminate the obligations under a Master Lease prior to its expiration without CareTrust’s consent. If a Master Lease is terminated prior to its expiration other than with CareTrust’s consent, the Company may be liable for damages and incur charges such as continued payment of rent through the end of the lease term and maintenance and repair costs for the leased property.
Commencing the third year, the rent structure under the Master Leases includes a fixed component, subject to annual escalation equal to the lesser of (1) the percentage change in the Consumer Price Index (but not less than zero) or (2)
2.5%
. In addition to rent, the Company is required to pay the following: (1) all impositions and taxes levied on or with respect to the leased properties (other than taxes on the income of the lessor); (2) all utilities and other services necessary or appropriate for the leased properties and the business conducted on the leased properties; (3) all insurance required in connection with the leased properties and the business conducted on the leased properties; (4) all facility maintenance and repair costs; and (5) all fees in connection with any licenses or authorizations necessary or appropriate for the leased properties and the business conducted on the leased properties. Total rent expense under the Master Leases was approximately
$56,271
,
$56,000
and
$32,700
for the
years ended December 31, 2016, 2015 and 2014
, respectively.
At the Company's option, the Master Leases may be extended for two or three five-year renewal terms beyond the initial term, on the same terms and conditions. If the Company elects to renew the term of a Master Lease, the renewal will be effective as to all, but not less than all, of the leased property then subject to the Master Lease.
Among other things, under the Master Leases, the Company must maintain compliance with specified financial covenants measured on a quarterly basis, including a portfolio coverage ratio and a minimum rent coverage ratio. The Master Leases also include certain reporting, legal and authorization requirements. The Company is not aware of any defaults as of
December 31, 2016
.
During the first quarter of 2016, the Company voluntarily discontinued operations in one of its skilled nursing facilities in order to preserve the overall ability to serve the residents in surrounding counties after careful consideration and some clinical survey challenges. As part of this closure, the Company entered into an agreement with its landlord allowing for the closure of the property as well as other provisions to allow its landlord to transfer the property and the licenses free and clear of the applicable
136
master lease. This arrangement will not impact the rent expense to be paid in 2016, or expected to be paid in future periods, and will have no material impact on the Company's lease coverage ratios under the Master Leases. The Company recorded a continued obligation liability under the lease and related closing expenses of
$7,935
, including the present value of rental payments of approximately
$6,512
, which was recognized in the first quarter of 2016. Residents of the affected facility were transferred to other local skilled nursing facilities.
The Company also leases certain affiliated operations and its administrative offices under non-cancelable operating leases, most of which have initial lease terms ranging from
five
to
20 years
. The Company has entered into multiple lease agreements with various landlords to operate newly constructed state-of-the-art, full-service healthcare resorts upon completion of construction. The term of each lease is
15
years with
two
five
-year renewal options and is subject to annual escalation equal to the percentage change in the Consumer Price Index with a stated cap percentage. In addition, the Company leases certain of its equipment under non-cancelable operating leases with initial terms ranging from
three
to
five years
. Most of these leases contain renewal options, certain of which involve rent increases. Total rent expense, inclusive of straight-line rent adjustments and rent associated with the Master Leases noted above, was
$125,221
,
$89,264
and
$48,947
for the
years ended December 31, 2016, 2015 and 2014
, respectively.
Future minimum lease payments for all leases as of
December 31, 2016
are as follows:
|
Year
|
Amount
|
|||
|
2017
|
137,247
|
|
||
|
2018
|
140,211
|
|
||
|
2019
|
139,851
|
|
||
|
2020
|
139,191
|
|
||
|
2021
|
138,498
|
|
||
|
Thereafter
|
1,145,188
|
|
||
|
$
|
1,840,186
|
|
||
Twenty-two
of the Company’s affiliated facilities, excluding the facilities that are operated under the Master Leases with CareTrust, are operated under
five
separate master lease arrangements. Under these master leases, a breach at a single facility could subject one or more of the other facilities covered by the same master lease to the same default risk. Failure to comply with Medicare and Medicaid provider requirements is a default under several of the Company’s leases, master lease agreements and debt financing instruments. In addition, other potential defaults related to an individual facility may cause a default of an entire master lease portfolio and could trigger cross-default provisions in the Company’s outstanding debt arrangements and other leases. With an indivisible lease, it is difficult to restructure the composition of the portfolio or economic terms of the lease without the consent of the landlord.
In November 2016, the Company entered into an agreement with its landlord to terminate the lease effective as of November 16, 2016. The lease of the facility was scheduled to expire on May 31, 2031. The lease terminates effective as of November 16, 2016. In addition, a number of the Company's individual facility leases are held by the same or related landlords, and some of these leases include cross-default provisions that could cause a default at one facility to trigger a technical default with respect to others, potentially subjecting certain leases and facilities to the various remedies available to the landlords under separate but cross-defaulted leases. The Company is not aware of any defaults as of
December 31, 2016
.
19. DIVESTITURES
In 2016, the Company completed the sale of
seventeen
urgent care centers for an aggregate sale price of
$41,492
. As a result of the sale, the Company recognized a pretax gain of
$19,160
, which is included in operating income. Due to the disposition of the clinics, the Company is no longer the primary beneficiary and the variable interest entities associated with the urgent care operations was deconsolidated from the Company's consolidated financial statements as of
December 31, 2016
. At deconsolidation, the Company eliminated intercompany balances that previously existed. The sale of this investment supports the Company's increased focus on growth opportunities in its business lines that are complementary to its existing transitional and skilled services.
The sale transactions did not meet the criteria of a discontinued operation as they do not represent a strategic shift that has or will have a major effect on the Company’s operations and financial results.
137
20. COMMITMENTS AND CONTINGENCIES
Regulatory Matters —
Laws and regulations governing Medicare and Medicaid programs are complex and subject to interpretation. Compliance with such laws and regulations can be subject to future governmental review and interpretation, as well as significant regulatory action including fines, penalties, and exclusion from certain governmental programs. The Company believes that it is in compliance in all material respects with all applicable laws and regulations.
Cost-Containment Measures —
Both government and private pay sources have instituted cost-containment measures designed to limit payments made to providers of healthcare services, and there can be no assurance that future measures designed to limit payments made to providers will not adversely affect the Company.
Indemnities —
From time to time, the Company enters into certain types of contracts that contingently require the Company to indemnify parties against third-party claims. These contracts primarily include (i) certain real estate leases, under which the Company may be required to indemnify property owners or prior facility operators for post-transfer environmental or other liabilities and other claims arising from the Company’s use of the applicable premises, (ii) operations transfer agreements, in which the Company agrees to indemnify past operators of facilities the Company acquires against certain liabilities arising from the transfer of the operation and/or the operation thereof after the transfer, (iii) certain lending agreements, under which the Company may be required to indemnify the lender against various claims and liabilities, and (iv) certain agreements with the Company’s officers, directors and employees, under which the Company may be required to indemnify such persons for liabilities arising out of their employment relationships. The terms of such obligations vary by contract and, in most instances, a specific or maximum dollar amount is not explicitly stated therein. Generally, amounts under these contracts cannot be reasonably estimated until a specific claim is asserted. Consequently, because no claims have been asserted, no liabilities have been recorded for these obligations on the Company’s balance sheets for any of the periods presented.
Litigation —
The skilled nursing business involves a significant risk of liability given the age and health of the patients and residents served by the Company's operating subsidiaries. The Company, its operating subsidiaries, and others in the industry are subject to an increasing number of claims and lawsuits, including professional liability claims, alleging that services provided have resulted in personal injury, elder abuse, wrongful death or other related claims. The defense of these lawsuits may result in significant legal costs, regardless of the outcome, and can result in large settlement amounts or damage awards.
In addition to the potential lawsuits and claims described above, the Company is also subject to potential lawsuits under the Federal False Claims Act and comparable state laws alleging submission of fraudulent claims for services to any healthcare program (such as Medicare) or payor. A violation may provide the basis for exclusion from federally-funded healthcare programs. Such exclusions could have a correlative negative impact on the Company’s financial performance. Some states, including California, Arizona and Texas, have enacted similar whistleblower and false claims laws and regulations. In addition, the Deficit Reduction Act of 2005 created incentives for states to enact anti-fraud legislation modeled on the Federal False Claims Act. As such, the Company could face increased scrutiny, potential liability and legal expenses and costs based on claims under state false claims acts in markets in which it does business.
In May 2009, Congress passed the Fraud Enforcement and Recovery Act (FERA) of 2009 which made significant changes to the Federal False Claims Act (FCA), expanding the types of activities subject to prosecution and whistleblower liability. Following changes by FERA, health care providers face significant penalties for the knowing retention of government overpayments, even if no false claim was involved. Health care providers can now be liable for knowingly and improperly avoiding or decreasing an obligation to pay money or property to the government. This includes the retention of any government overpayment. The government can argue, therefore, that a FCA violation can occur without any affirmative fraudulent action or statement, as long as it is knowingly improper. In addition, FERA extended protections against retaliation for whistleblowers, including protections not only for employees, but also contractors and agents. Thus, there is generally no need for an employment relationship in order to qualify for protection against retaliation for whistleblowing.
Healthcare litigation (including class action litigation) is common and is filed based upon a wide variety of claims and theories, and the Company is routinely subjected to varying types of claims. One particular type of suit arises from alleged violations of state-established minimum staffing requirements for skilled nursing facilities. Failure to meet these requirements can, among other things, jeopardize a facility's compliance with conditions of participation under certain state and federal healthcare programs; it may also subject the facility to a notice of deficiency, a citation, a civil money penalty, or litigation. These class-action “staffing” suits have the potential to result in large jury verdicts and settlements, and have become more prevalent in the wake of a previous substantial jury award against one of the Company's competitors. The Company expects the plaintiff's bar to continue to be aggressive in their pursuit of these staffing and similar claims.
138
The Company has in the past been subject to class action litigation involving claims of alleged violations of regulatory requirements related to staffing. While the Company has been able to settle these claims without a material ongoing adverse effect on its business, future claims could be brought that may materially affect its business, financial condition and results of operations. Other claims and suits, including class actions, continue to be filed against the Company and other companies in its industry. If there were a significant increase in the number of these claims or an increase in amounts owing should plaintiffs be successful in their prosecution of these claims, this could materially adversely affect the Company’s business, financial condition, results of operations and cash flows.
The Company and its operating subsidiaries have been, and continue to be, subject to claims and legal actions that arise in the ordinary course of business, including potential claims related to patient care and treatment as well as employment related claims. For example, the Company has been subjected to, and is currently involved in, class action litigation alleging violations of state and federal wage and hour law. The Company does not believe that the ultimate resolution of these actions will have a material adverse effect on the Company’s business, cash flows, financial condition or results of operations. A significant increase in the number of these claims or an increase in amounts owing should plaintiffs be successful in their prosecution of these claims, could materially adversely affect the Company’s business, financial condition, results of operations and cash flows.
Other claims and suits continue to be filed against the Company and other companies in its industry. By way of recent example, a general/premises liability lawsuit was filed against one of the Company’s independent operating entities in San Luis Obispo, California, in connection with an alleged injury to a non-employee/contractor. The Company estimates that the cost of resolving this case will be approximately
$2,100
, which was recorded in the consolidated financial statements during the year ended
December 31, 2016
. Further, another one of the Company’s independent operating entities was sued on allegations of professional negligence, which the claim was recently settled. The Company estimated that the costs associated with the settlement of this second matter will be approximately
$2,800
, which was recorded in the consolidated financial statements during the year ended
December 31, 2016
. The Company does not expect that there will be any material ongoing adverse effect on the Company's business, financial condition or results of operations in connection with the resolution of these matters.
The Company cannot predict or provide any assurance as to the possible outcome of any litigation. If any litigation were to proceed, and the Company and its operating subsidiaries are subjected to, alleged to be liable for, or agrees to a settlement of, claims or obligations under Federal Medicare statutes, the Federal False Claims Act, or similar State and Federal statutes and related regulations, the Company's business, financial condition and results of operations and cash flows could be materially and adversely affected and its stock price could be adversely impacted. Among other things, any settlement or litigation could involve the payment of substantial sums to settle any alleged civil violations, and may also include the assumption of specific procedural and financial obligations by the Company or its subsidiaries going forward under a corporate integrity agreement and/or other arrangement with the government.
Medicare Revenue Recoupments —
The Company is subject to reviews relating to Medicare services, billings and potential overpayments. During the year ended
December 31, 2016
,
eighteen
of the Company's operating subsidiaries have been subject to probe reviews, both pre- and post-payment.
Twelve
of these reviews have successfully closed as of
December 31, 2016
. The Company anticipates that these probe reviews will increase in frequency in the future. If a facility fails a probe review and subsequent re-probes, the facility could then be subject to extended pre-pay review or extrapolation of the identified error rate to all billing in the same time period.
None of the Company's operating subsidiaries are currently on extended prepayment review or subject to extrapolation, although that may occur in the future. As of
December 31, 2016
, the Company has
six
operating subsidiaries under probe review.
U.S. Government Inquiry —
In October 2013, the Company completed and executed a settlement agreement (the Settlement Agreement) with the DOJ, which received the final approval of the Office of Inspector General-HHS and the United States District Court for the Central District of California. Pursuant to the Settlement Agreement, the Company made a single lump-sum remittance to the government in the amount of
$48,000
in October 2013. The Company has denied engaging in any illegal conduct and has agreed to the settlement amount without any admission of wrongdoing in order to resolve the allegations and to avoid the uncertainty and expense of protracted litigation.
In connection with the settlement and effective as of October 1, 2013, the Company entered into a five-year corporate integrity agreement (the CIA) with the Office of Inspector General-HHS. The CIA acknowledges the existence of the Company’s current compliance program, which is in accord with the Office of the Inspector General (OIG)’s guidance related to an effective compliance program, and requires that the Company continue during the term of the CIA to maintain a program designed to promote compliance with the statutes, regulations, and written directives of Medicare, Medicaid, and all other Federal health care programs. The Company is also required to notify the Office of Inspector General-HHS in writing, of, among other things: (i) any ongoing
139
government investigation or legal proceeding involving an allegation that the Company has committed a crime or has engaged in fraudulent activities; (ii) any other matter that a reasonable person would consider a probable violation of applicable criminal, civil, or administrative laws related to compliance with federal healthcare programs; and (iii) any change in location, sale, closing, purchase, or establishment of a new business unit or location related to items or services that may be reimbursed by federal health care programs. The Company is also required to retain an Independent Review Organization (IRO) to review certain clinical documentation annually for the term of the CIA.
The Company has met the requirements of its third year under the Settlement Agreement and passed its IRO audits. Participation in federal healthcare programs by the Company is not affected by the Settlement Agreement or the CIA. In the event of an uncured material breach of the CIA, the Company could be excluded from participation in federal healthcare programs and/or subject to prosecution.
Concentrations
Credit Risk
— The Company has significant accounts receivable balances, the collectability of which is dependent on the availability of funds from certain governmental programs, primarily Medicare and Medicaid. These receivables represent the only significant concentration of credit risk for the Company. The Company does not believe there are significant credit risks associated with these governmental programs. The Company believes that an appropriate allowance has been recorded for the possibility of these receivables proving uncollectible, and continually monitors and adjusts these allowances as necessary. The Company’s receivables from Medicare and Medicaid payor programs accounted for approximately
58.6%
and
58.8%
of its total accounts receivable as of
December 31, 2016
and 2015, respectively. Revenue from reimbursement under the Medicare and Medicaid programs accounted for
67.8%
,
69.1%
and
71.4%
of the Company's revenue for the
years ended December 31, 2016, 2015 and 2014
, respectively.
Cash in Excess of FDIC Limits
— The Company currently has bank deposits with financial institutions in the U.S. that exceed FDIC insurance limits. FDIC insurance provides protection for bank deposits up to
$250
. In addition, the Company has uninsured bank deposits with a financial institution outside the U.S. As of
February 6, 2017
, the Company had approximately
$2,500
in uninsured cash deposits. All uninsured bank deposits are held at high quality credit institutions.
21. SELF INSURANCE RESERVES
The following table represents activity in our insurance reserves as of and for the years ended December 31, 2016 and 2015:
|
|
General and Professional Liability
|
|
|
|
|
|
|
||||||||
|
|
|
Workers' Compensation
|
|
|
|
|
|||||||||
|
|
|
|
Health
|
|
Total
|
||||||||||
|
Balance January 1, 2015
|
30,401
|
|
15,758
|
|
3,801
|
|
$
|
49,960
|
|
||||||
|
Current year provisions
|
12,528
|
|
12,508
|
|
15,921
|
|
40,957
|
|
|||||||
|
Claims paid and direct expenses
|
(11,911
|
)
|
(8,822
|
)
|
(14,648
|
)
|
(35,381
|
)
|
|||||||
|
Change in long-term insurance losses recoverable
|
(308
|
)
|
775
|
|
—
|
|
467
|
|
|||||||
|
Balance December 31, 2015
|
30,710
|
|
20,219
|
|
5,074
|
|
56,003
|
|
|||||||
|
Current year provisions
|
23,149
|
|
12,887
|
|
38,151
|
|
74,187
|
|
|||||||
|
Claims paid and direct expenses
|
(18,186
|
)
|
(10,290
|
)
|
(37,586
|
)
|
(66,062
|
)
|
|||||||
|
Change in long-term insurance losses recoverable
|
637
|
|
586
|
|
—
|
|
1,223
|
|
|||||||
|
Balance December 31, 2016
|
$
|
36,310
|
|
|
$
|
23,402
|
|
|
$
|
5,639
|
|
|
$
|
65,351
|
|
Included in long-term insurance losses recoverable as of December 31, 2016 and 2015, are anticipated insurance recoveries related to the Company's general and professional liability claims that are recorded on a gross rather than net basis in accordance with GAAP.
140
|
22.
|
DEFINED CONTRIBUTION PLAN
|
The Company has a 401(k) defined contribution plan (the 401(k) Plan), whereby eligible employees may contribute up to
15%
of their annual basic earnings. Additionally, the 401(k) Plan provides for discretionary matching contributions (as defined in the 401(k) Plan) by the Company. The Company expensed matching contributions to the 401(k) Plan of
$862
,
$682
and
$565
during the years ended December 31, 2016, 2015 and 2014, respectively. Beginning in 2007, the 401(k) Plan allowed eligible employees to contribute up to
90%
of their eligible compensation, subject to applicable annual Internal Revenue Code limits.
23. SPIN-OFF OF REAL ESTATE ASSETS THROUGH A REAL ESTATE INVESTMENT TRUST
On June 1, 2014, the Company completed its plan to separate into
two
separate publicly traded companies by creating a newly formed, publicly traded real estate investment trust (REIT), known as CareTrust REIT, Inc. (CareTrust), through a tax free spin-off (the Spin-Off). The Company effected the Spin-Off by distributing to its stockholders one share of CareTrust common stock for each share of Ensign common stock held at the close of business on May 22, 2014, the record date for the Spin-Off. The Company received a private letter ruling from the Internal Revenue Service (IRS) substantially to the effect that the Spin-Off will qualify as a tax-free transaction for U.S. federal income tax purposes. The private letter ruling relies on certain facts, representations, assumptions and undertakings.
Prior to the Spin-Off, the Company entered into a Separation and Distribution Agreement with CareTrust, setting forth the mechanics of the Spin-Off, certain organizational matters and other ongoing obligations of the Company and CareTrust. The Company and CareTrust or their respective subsidiaries, as applicable, also entered into a number of other agreements to govern the relationship between CareTrust and the Company.
Immediately before the Spin-Off, on May 30, 2014, while CareTrust was a wholly-owned subsidiary of the Company, CareTrust raised
$260,000
of debt financing (the Bond). CareTrust also entered into the Fifth Amended and Restated Loan Agreement, with General Electric Capital Corporation (GECC), which consisted of an additional loan of
$50,676
to an aggregate principal amount of
$99,000
(the Ten Project Note). The Ten Project Note and the Bond were assumed by CareTrust in connection with the Spin-Off. CareTrust transferred
$220,752
to the Company, a portion of which the Company used to retire
$208,635
of long-term debt prior to maturity. The remaining portion was used to pay prepayment penalties and other third party fees relating to the early retirement of outstanding debt. The amount retained by the Company of
$8,219
was recorded as restricted cash, of which
$6,400
was classified as current assets and
$1,819
was classified as non-current assets as of June 1, 2014. The amount represented a portion of the proceeds received from CareTrust in connection with the Spin-Off that the Company intended to use to pay up to eight regular quarterly dividend payments. During the year ended December 31, 2015 and 2014, the Company utilized
$3,137
and
$5,082
, respectively, to pay the quarterly dividend payments. The remaining cash of
$78,731
that CareTrust retained on the Spin-Off date was transferred to CareTrust as part of the assets and liabilities contributed to CareTrust in connection with the Spin-Off.
As of March 31, 2014, the Company operated
120
affiliated facilities. Prior to the Spin-Off, the Company separated the healthcare operations from the independent living operations at two locations, resulting in a total of
122
affiliated facilities. In connection with the Spin-Off, the Company contributed to CareTrust the assets and liabilities associated with
94
real property and
three
independent living facilities that CareTrust now operates and that were previously owned by the Company. The results of the three independent living facilities that were transferred to CareTrust in connection with the Spin-Off were not material to the Company's results of operations for the years ended December 31, 2014 and 2013. The assets and liabilities were contributed to CareTrust based on their historical carrying values, which were as follows:
|
Cash and cash equivalents
|
$
|
78,731
|
|
|
|
Other current assets
|
34
|
|
||
|
Property and equipment, net
|
421,846
|
|
||
|
Deferred financing costs
|
11,088
|
|
||
|
Accounts payable and accrued expenses
|
(4,971
|
)
|
||
|
Current deferred tax liability
|
(125
|
)
|
||
|
Deferred tax liability
|
(5,925
|
)
|
||
|
Current maturities of long-term debt
|
(2,342
|
)
|
||
|
Long-term debt—less current maturities
|
(357,171
|
)
|
||
|
Net contribution
|
$
|
141,165
|
|
|
141
As a result of the Spin-Off, CareTrust owns all of the
94
real property and three independent living facilities that were transferred in connection with the Spin-Off. The Company leases the
94
real property facilities from CareTrust under
eight
“triple-net” master lease agreements (collectively, the Master Leases). The Company continues to operate the affiliated skilled nursing, assisted living and independent living facilities that are leased from CareTrust pursuant to the Master Leases. See Note 18, Leases for detail of the Master Leases arrangement. In addition, Christopher Christensen, the Company's Chief Executive Officer, served as a board member of CareTrust subsequent to the Spin-Off through April 15, 2015.
The Company did not incur transactions costs related to the Spin-Off for the year ended December 31, 2016 and 2015. The Company incurred transaction costs associated with the Spin-Off of
$9,026
for years ended December 31, 2014, which is included in general and administrative expenses within the consolidated statements of income.
|
(b)
|
Financial Statement Schedules
|
THE ENSIGN GROUP, INC. and SUBSIDIARIES
Schedule II
Valuation and Qualifying Accounts
|
|
|
|
Additions Charged to Costs and Expenses
|
|
|
|
||||||||||
|
|
Balance at Beginning of Year
|
|
|
|
Balances at End of Year
|
|||||||||||
|
|
|
|
|
|||||||||||||
|
|
|
Deductions
|
|
|||||||||||||
|
|
|
|
(In thousands)
|
|
|
|||||||||||
|
Year Ended December 31, 2014
|
|
|
|
|
|
|
|
|
|
|
||||||
|
Allowance for doubtful accounts
|
$
|
(16,540
|
)
|
$
|
(13,179
|
)
|
$
|
9,281
|
|
$
|
(20,438
|
)
|
||||
|
Year Ended December 31, 2015
|
||||||||||||||||
|
Allowance for doubtful accounts
|
$
|
(20,438
|
)
|
$
|
(19,802
|
)
|
$
|
9,932
|
|
(30,308
|
)
|
|||||
|
Year Ended December 31, 2016
|
||||||||||||||||
|
Allowance for doubtful accounts
|
$
|
(30,308
|
)
|
$
|
(28,512
|
)
|
$
|
19,029
|
|
(39,791
|
)
|
|||||
All other schedules have been omitted because the information required to be set forth therein is not applicable or is shown in the consolidated financial statements or notes thereto.
142
EXHIBIT INDEX
|
(c)
|
Exhibit Index
|
|
Exhibit
|
|
|
|
|
File
|
|
Exhibit
|
|
Filing
|
|
Filed
|
|||
|
No.
|
Exhibit Description*
|
|
Form
|
|
No.
|
|
No.
|
|
Date
|
|
Herewith
|
|||
|
2.1
|
|
Separation and Distribution Agreement, dated as of May 23, 2014, by and between The Ensign Group, Inc. and CareTrust REIT, Inc.
|
8-K
|
001-33757
|
2.1
|
|
6/5/2014
|
|||||||
|
3.1
|
|
Fifth Amended and Restated Certificate of Incorporation of The Ensign Group, Inc., filed with the Delaware Secretary of State on November 15, 2007
|
|
10-Q
|
|
001-33757
|
|
3.1
|
|
|
12/21/2007
|
|
|
|
|
3.2
|
|
Amendment to the Amended and Restated Bylaws, dated August 5, 2014
|
8-K
|
001-33757
|
3.2
|
|
8/8/2014
|
|||||||
|
3.3
|
|
Amended and Restated Bylaws of The Ensign Group, Inc.
|
|
10-Q
|
|
001-33757
|
|
3.2
|
|
|
12/21/2007
|
|
|
|
|
3.4
|
|
Certificate of Designation, Preferences and Rights of Series A Junior Participating Preferred Stock, as filed with the Secretary of State of the State of Delaware on November 7, 2013
|
8-K
|
001-33757
|
3.1
|
|
11/7/2013
|
|||||||
|
3.5
|
|
Certificate of Elimination of Series A Junior Participating Preferred Stock
|
8-K
|
001-33757
|
3.1
|
|
6/5/2014
|
|||||||
|
4.1
|
|
Specimen common stock certificate
|
|
S-1
|
|
333-142897
|
|
4.1
|
|
|
10/5/2007
|
|
|
|
|
10.1
|
|
+
|
The Ensign Group, Inc. 2001 Stock Option, Deferred Stock and Restricted Stock Plan, form of Stock Option Grant Notice for Executive Officers and Directors, stock option agreement and form of restricted stock agreement for Executive Officers and Directors
|
|
S-1
|
|
333-142897
|
|
10.1
|
|
|
7/26/2007
|
|
|
|
10.2
|
|
+
|
The Ensign Group, Inc. 2005 Stock Incentive Plan, form of Nonqualified Stock Option Award for Executive Officers and Directors, and form of restricted stock agreement for Executive Officers and Directors
|
|
S-1
|
|
333-142897
|
|
99.2
|
|
|
7/26/2007
|
|
|
|
10.3
|
|
+
|
The Ensign Group, Inc. 2007 Omnibus Incentive Plan
|
|
S-1
|
|
333-142897
|
|
10.3
|
|
|
10/5/2007
|
|
|
|
10.4
|
|
+
|
Amendment to The Ensign Group, Inc. 2007 Omnibus Incentive Plan
|
|
8-K
|
|
001-33757
|
|
10.2
|
|
|
7/28/2009
|
|
|
|
10.5
|
|
+
|
Form of 2007 Omnibus Incentive Plan Notice of Grant of Stock Options; and form of Non-Incentive Stock Option Award Terms and Conditions
|
|
S-1
|
|
333-142797
|
|
10.4
|
|
|
10/5/2007
|
|
|
|
10.6
|
|
+
|
Form of 2007 Omnibus Incentive Plan Restricted Stock Agreement
|
|
S-1
|
|
333-142897
|
|
10.5
|
|
|
10/5/2007
|
|
|
|
10.7
|
|
+
|
Form of Indemnification Agreement entered into between The Ensign Group, Inc. and its directors, officers and certain key employees
|
|
S-1
|
|
333-142897
|
|
10.6
|
|
|
10/5/2007
|
|
|
|
10.8
|
|
Fourth Amended and Restated Loan Agreement, dated as of November 10, 2009, by and among certain subsidiaries of The Ensign Group, Inc. as Borrowers, and General Electric Capital Corporation as Agent and Lender
|
|
8-K
|
|
001-33757
|
|
10.1
|
|
|
11/17/2009
|
|
|
|
|
10.9
|
|
Consolidated, Amended and Restated Promissory Note, dated as of December 29, 2006, in the original principal amount of $64,692,111.67, by certain subsidiaries of The Ensign Group, Inc. in favor of General Electric Capital Corporation
|
|
S-1
|
|
333-142897
|
|
10.8
|
|
|
7/26/2007
|
|
|
|
143
|
Exhibit
|
|
|
|
File
|
|
Exhibit
|
|
Filing
|
|
Filed
|
|||||
|
No.
|
Exhibit Description*
|
Form
|
|
No.
|
|
No.
|
|
Date
|
|
Herewith
|
|||||
|
10.10
|
|
Third Amended and Restated Guaranty of Payment and Performance, dated as of December 29, 2006, by The Ensign Group, Inc. as Guarantor and General Electric Capital Corporation as Agent and Lender, under which Guarantor guarantees the payment and performance of the obligations of certain of Guarantor's subsidiaries under the Third Amended and Restated Loan Agreement
|
|
S-1
|
|
333-142897
|
|
10.9
|
|
|
7/26/2007
|
|
|
|
|
|
10.11
|
|
Form of Amended and Restated Deed of Trust, Assignment of Rents, Security Agreement and Fixture Financing Statement, dated as of June 30, 2006 (filed against Desert Terrace Nursing Center, Desert Sky Nursing Home, Highland Manor Health and Rehabilitation Center and North Mountain Medical and Rehabilitation Center), by and among Terrace Holdings AZ LLC, Sky Holdings AZ LLC, Ensign Highland LLC and Valley Health Holdings LLC as Grantors, Chicago Title Insurance Company as Trustee, and General Electric Capital Corporation as Beneficiary and Schedule of Material Differences therein
|
S-1
|
333-142897
|
10.10
|
|
7/26/2007
|
|
|||||||
|
10.12
|
|
Deed of Trust, Assignment of Rents, Security Agreement and Fixture Financing Statement, dated as of June 30, 2006 (filed against Park Manor), by and among Plaza Health Holdings LLC as Grantor, Chicago Title Insurance Company as Trustee, and General Electric Capital Corporation as Beneficiary
|
S-1
|
|
333-142897
|
|
10.11
|
|
|
7/26/2007
|
|
|
|||
|
10.13
|
|
Deed of Trust, Assignment of Rents, Security Agreement and Fixture Financing Statement, dated as of June 30, 2006 (filed against Catalina Care and Rehabilitation Center), by and among Rillito Holdings LLC as Grantor, Chicago Title Insurance Company as Trustee, and General Electric Capital Corporation as Beneficiary
|
S-1
|
|
333-142897
|
|
10.12
|
|
|
7/26/2007
|
|
|
|||
|
10.14
|
|
Deed of Trust, Assignment of Rents, Security Agreement and Fixture Financing Statement, dated as of October 16, 2006 (filed against Park View Gardens at Montgomery), by and among Mountainview Communitycare LLC as Grantor, Chicago Title Insurance Company as Trustee, and General Electric Capital Corporation as Beneficiary
|
S-1
|
|
333-142897
|
|
10.13
|
|
|
7/26/2007
|
|
|
|||
|
10.15
|
|
Deed of Trust, Assignment of Rents, Security Agreement and Fixture Financing Statement, dated as of October 16, 2006 (filed against Sabino Canyon Rehabilitation and Care Center), by and among Meadowbrook Health Associates LLC as Grantor, Chicago Title Insurance Company as Trustee and General Electric Capital Corporation as Beneficiary
|
S-1
|
|
333-142897
|
|
10.14
|
|
|
7/26/2007
|
|
|
|||
|
10.16
|
|
Form of Deed of Trust, Assignment of Rents, Security Agreement and Fixture Financing Statement, dated as of December 29, 2006 (filed against Upland Care and Rehabilitation Center and Camarillo Care Center), by and among Cedar Avenue Holdings LLC and Granada Investments LLC as Grantors, Chicago Title Insurance Company as Trustee and General Electric Capital Corporation as Beneficiary and Schedule of Material Differences therein
|
S-1
|
|
333-142897
|
|
10.15
|
|
|
7/26/2007
|
|
|
|||
144
|
Exhibit
|
|
|
|
|
File
|
|
Exhibit
|
|
Filing
|
|
Filed
|
||||
|
No.
|
Exhibit Description*
|
|
Form
|
|
No.
|
|
No.
|
|
Date
|
|
Herewith
|
||||
|
10.17
|
|
Form of First Amendment to (Amended and Restated) Deed of Trust, Assignment of Rents, Security Agreement and Fixture Financing Statement, dated as of December 29, 2006 (filed against Desert Terrace Nursing Center, Desert Sky Nursing Home, Highland Manor Health and Rehabilitation Center, North Mountain Medical and Rehabilitation Center, Catalina Care and Rehabilitation Center, Park Manor, Park View Gardens at Montgomery, Sabino Canyon Rehabilitation and Care Center), by and among Terrace Holdings AZ LLC, Sky Holdings AZ LLC, Ensign Highland LLC, Valley Health Holdings LLC, Rillito Holdings LLC, Plaza Health Holdings LLC, Mountainview Communitycare LLC and Meadowbrook Health Associates LLC as Grantors, Chicago Title Insurance Company as Trustee, and General Electric Capital Corporation as Beneficiary and Schedule of Material Differences therein
|
S-1
|
|
333-142897
|
|
10.16
|
|
|
7/26/2007
|
|
|
|||
|
10.18
|
|
Amended and Restated Loan and Security Agreement, dated as of March 25, 2004, by and among The Ensign Group, Inc. and certain of its subsidiaries as Borrower, and General Electric Capital Corporation as Agent and Lender
|
S-1
|
|
333-142897
|
|
10.19
|
|
|
5/14/2007
|
|
|
|||
|
10.19
|
|
Amendment No. 1, dated as of December 3, 2004, to the Amended and Restated Loan and Security Agreement, by and among The Ensign Group, Inc. and certain of its subsidiaries as Borrower, and General Electric Capital Corporation as Lender
|
S-1
|
|
333-142897
|
|
10.20
|
|
|
5/14/2007
|
|
|
|||
|
10.20
|
|
Second Amended and Restated Revolving Credit Note, dated as of December 3, 2004, in the original principal amount of $20,000,000, by The Ensign Group, Inc. and certain of its subsidiaries in favor of General Electric Capital Corporation
|
S-1
|
|
333-142897
|
|
10.19
|
|
|
7/26/2007
|
|
|
|||
|
10.21
|
|
Amendment No. 2, dated as of March 25, 2007, to the Amended and Restated Loan and Security Agreement, by and among The Ensign Group, Inc. and certain of its subsidiaries as Borrower, and General Electric Capital Corporation as Lender
|
S-1
|
|
333-142897
|
|
10.22
|
|
|
5/14/2007
|
|
|
|||
|
10.22
|
|
Amendment No. 3, dated as of June 22, 2007, to the Amended and Restated Loan and Security Agreement, by and among The Ensign Group, Inc. and certain of its subsidiaries as Borrower and General Electric Capital Corporation as Lender
|
|
S-1
|
|
333-142897
|
|
10.21
|
|
|
7/26/2007
|
|
|
||
|
10.23
|
|
Amendment No. 4, dated as of August 1, 2007, to the Amended and Restated Loan and Security Agreement, by and among The Ensign Group, Inc. and certain of its subsidiaries as Borrowers and General Electric Capital Corporation as Lender
|
|
S-1
|
|
333-142897
|
|
10.42
|
|
|
8/17/2007
|
|
|
||
|
10.24
|
|
Amendment No. 5, dated September 13, 2007, to the Amended and Restated Loan and Security Agreement, by and among The Ensign Group, Inc. and certain of its subsidiaries as Borrowers and General Electric Capital Corporation as Lender
|
|
S-1
|
|
333-142897
|
|
10.43
|
|
|
10/5/2007
|
|
|
||
|
10.25
|
|
Revolving Credit Note, dated as of September 13, 2007, in the original principal amount of $5,000,000 by The Ensign Group, Inc. and certain of its subsidiaries in favor of General Electric Capital Corporation
|
|
S-1
|
|
333-142897
|
|
10.44
|
|
|
10/5/2007
|
|
|
||
|
10.26
|
|
Commitment Letter, dated October 3, 2007, from General Electric Capital Corporation to The Ensign Group, Inc., setting forth the general terms and conditions of the proposed amendment to the revolving credit facility, which will increase the available credit thereunder to $50.0 million
|
|
S-1
|
|
333-142897
|
|
10.46
|
|
|
10/5/2007
|
|
|
||
|
10.27
|
|
Amendment No. 6, dated November 19, 2007, to the Amended and Restated Loan and Security Agreement, by and among The Ensign Group, Inc. and certain of its subsidiaries as Borrowers and General Electric Capital Corporation as Lender
|
|
8-K
|
|
001-33757
|
|
10.1
|
|
|
11/21/2007
|
|
|
||
145
|
10.28
|
|
Amendment No. 7, dated December 21, 2007, to the Amended and Restated Loan and Security Agreement, by and among The Ensign Group, Inc. and certain of its subsidiaries as Borrowers and General Electric Capital Corporation as Lender
|
|
8-K
|
|
001-33757
|
|
10.1
|
|
|
12/27/2007
|
|
|
||
|
10.29
|
|
Amendment No. 1 and Joinder Agreement to Second Amended and Restated Loan and Security Agreement, by certain subsidiaries of The Ensign Group, Inc. as Borrower and General Electric Capital Corporation as Lender
|
|
8-K
|
|
001-33757
|
|
10.1
|
|
|
2/9/2009
|
|
|
||
146
|
Exhibit
|
|
|
|
|
File
|
|
Exhibit
|
|
Filing
|
|
Filed
|
||
|
No.
|
Exhibit Description*
|
|
Form
|
|
No.
|
|
No.
|
|
Date
|
|
Herewith
|
||
|
10.30
|
|
Second Amended and Restated Revolving Credit Note, dated February 4, 2009, by certain subsidiaries of The Ensign Group, Inc. as Borrowers for the benefit of General Electric Capital Corporation as Lender
|
|
8-K
|
|
001-33757
|
|
10.2
|
|
|
2/9/2009
|
|
|
|
10.31
|
|
Amended and Restated Revolving Credit Note, dated February 21, 2008, by certain subsidiaries of The Ensign Group, Inc. as Borrowers for the benefit of General Electric Capital Corporation as Lender
|
|
8-K
|
|
001-33757
|
|
10.2
|
|
|
2/27/2008
|
|
|
|
10.32
|
|
Ensign Guaranty, dated February 21, 2008, between The Ensign Group, Inc. as Guarantor and General Electric Capital Corporation as Lender
|
|
8-K
|
|
001-33757
|
|
10.3
|
|
|
2/27/2008
|
|
|
|
10.33
|
|
Holding Company Guaranty, dated February 21, 2008, by and among The Ensign Group, Inc. and certain of its subsidiaries as Guarantors and General Electric Capital Corporation as Lender
|
|
8-K
|
|
001-33757
|
|
10.4
|
|
|
2/27/2008
|
|
|
|
10.34
|
|
Pacific Care Center Loan Agreement, dated as of August 6, 1998, by and between G&L Hoquiam, LLC as Borrower and GMAC Commercial Mortgage Corporation as Lender (later assumed by Cherry Health Holdings, Inc. as Borrower and Wells Fargo Bank, N.A. as Lender)
|
|
S-1
|
|
333-142897
|
|
10.23
|
|
|
5/14/2007
|
|
|
|
10.35
|
|
Deed of Trust and Security Agreement, dated as of August 6, 1998, by and among G&L Hoquiam, LLC as Grantor, Ticor Title Insurance Company as Trustee and GMAC Commercial Mortgage Corporation as Beneficiary
|
|
S-1
|
|
333-142897
|
|
10.24
|
|
|
7/26/2007
|
|
|
|
10.36
|
|
Promissory Note, dated as of August 6, 1998, in the original principal amount of $2,475,000, by G&L Hoquiam, LLC in favor of GMAC Commercial Mortgage Corporation
|
|
S-1
|
|
333-142897
|
|
10.25
|
|
|
7/26/2007
|
|
|
|
10.37
|
|
Loan Assumption Agreement, by and among G&L Hoquiam, LLC as Prior Owner; G&L Realty Partnership, L.P. as Prior Guarantor; Cherry Health Holdings, Inc. as Borrower; and Wells Fargo Bank, N.A., the Trustee for GMAC Commercial Mortgage Securities, Inc., as Lender
|
|
S-1
|
|
333-142897
|
|
10.26
|
|
|
5/14/2007
|
|
|
|
10.38
|
|
Exceptions to Nonrecourse Guaranty, dated as of October 2006, by The Ensign Group, Inc. as Guarantor and Wells Fargo Bank, N.A. as Trustee for GMAC Commercial Mortgage Securities, Inc., under which Guarantor guarantees full and prompt payment of all amounts due and owing by Cherry Health Holdings, Inc. under the Promissory Note
|
|
S-1
|
|
333-142897
|
|
10.22
|
|
|
7/26/2007
|
|
|
|
10.39
|
|
Deed of Trust with Assignment of Rents, dated as of January 30, 2001, by and among Ensign Southland LLC as Trustor, Brian E. Callahan as Trustee and Continental Wingate Associates, Inc. as Beneficiary
|
|
S-1
|
|
333-142897
|
|
10.27
|
|
|
7/26/2007
|
|
|
|
10.40
|
|
Deed of Trust Note, dated as of January 30, 2001, in the original principal amount of $7,455,100, by Ensign Southland, LLC in favor of Continental Wingate Associates, Inc.
|
|
S-1
|
|
333-142897
|
|
10.28
|
|
|
5/14/2007
|
|
|
|
10.41
|
|
Security Agreement, dated as of January 30, 2001, by and between Ensign Southland, LLC and Continental Wingate Associates, Inc.
|
|
S-1
|
|
333-142897
|
|
10.29
|
|
|
5/14/2007
|
|
|
|
10.42
|
|
Master Lease Agreement, dated July 3, 2003, between Adipiscor LLC as Lessee and LTC Partners VI, L.P., Coronado Corporation and Park Villa Corporation collectively as Lessor
|
|
S-1
|
|
333-142897
|
|
10.30
|
|
|
5/14/2007
|
|
|
147
|
Exhibit
|
|
|
|
|
File
|
|
Exhibit
|
|
Filing
|
|
Filed
|
||
|
No.
|
Exhibit Description*
|
|
Form
|
|
No.
|
|
No.
|
|
Date
|
|
Herewith
|
||
|
10.43
|
|
Lease Guaranty, dated July 3, 2003, between The Ensign Group, Inc. as Guarantor and LTC Partners VI, L.P., Coronado Corporation and Park Villa Corporation collectively as Lessor, under which Guarantor guarantees the payment and performance of Adipiscor LLC's obligations under the Master Lease Agreement
|
|
S-1
|
|
333-142897
|
|
10.31
|
|
|
5/14/2007
|
|
|
|
10.44
|
|
Master Lease Agreement, dated September 30, 2003, between Permunitum LLC as Lessee, Vista Woods Health Associates LLC, City Heights Health Associates LLC, and Claremont Foothills Health Associates LLC as Sublessees, and OHI Asset (CA), LLC as Lessor
|
|
S-1
|
|
333-142897
|
|
10.32
|
|
|
5/14/2007
|
|
|
|
10.45
|
|
Lease Guaranty, dated September 30, 2003, between The Ensign Group, Inc. as Guarantor and OHI Asset (CA), LLC as Lessor, under which Guarantor guarantees the payment and performance of Permunitum LLC's obligations under the Master Lease Agreement
|
|
S-1
|
|
333-142897
|
|
10.33
|
|
|
5/14/2007
|
|
|
|
10.46
|
|
Lease Guaranty, dated September 30, 2003, between Vista Woods Health Associates LLC, City Heights Health Associates LLC and Claremont Foothills Health Associates LLC as Guarantors and OHI Asset (CA), LLC as Lessor, under which Guarantors guarantee the payment and performance of Permunitum LLC's obligations under the Master Lease Agreement
|
|
S-1
|
|
333-142897
|
|
10.34
|
|
|
5/14/2007
|
|
|
|
10.47
|
|
Master Lease Agreement, dated January 31, 2003, between Moenium Holdings LLC as Lessee and Healthcare Property Investors, Inc., d/b/a in the State of Arizona as HC Properties, Inc., and Healthcare Investors III collectively as Lessor
|
|
S-1
|
|
333-142897
|
|
10.35
|
|
|
5/14/2007
|
|
|
|
10.48
|
|
Lease Guaranty, between The Ensign Group, Inc. as Guarantor and Healthcare Property Investors, Inc. as Owner, under which Guarantor guarantees the payment and performance of Moenium Holdings LLC's obligations under the Master Lease Agreement
|
|
S-1
|
|
333-142897
|
|
10.36
|
|
|
5/14/2007
|
|
|
|
10.49
|
|
First Amendment to Master Lease Agreement, dated May 27, 2003, between Moenium Holdings LLC as Lessee and Healthcare Property Investors, Inc., d/b/a in the State of Arizona as HC Properties, Inc., and Healthcare Investors III collectively as Lessor
|
|
S-1
|
|
333-142897
|
|
10.37
|
|
|
5/14/2007
|
|
|
|
10.50
|
|
Second Amendment to Master Lease Agreement, dated October 31. 2004, between Moenium Holdings LLC as Lessee and Healthcare Property Investors, Inc., d/b/a in the State of Arizona as HC Properties, Inc., and Healthcare Investors III collectively as Lessor
|
|
S-1
|
|
333-142897
|
|
10.38
|
|
|
5/14/2007
|
|
|
|
10.51
|
|
Lease Agreement, by and between Mission Ridge Associates LLC as Landlord and Ensign Facility Services, Inc. as Tenant; and Guaranty of Lease, dated August 2, 2003, by The Ensign Group, Inc. as Guarantor in favor of Landlord, under which Guarantor guarantees Tenant's obligations under the Lease Agreement
|
|
S-1
|
|
333-142897
|
|
10.39
|
|
|
5/14/2007
|
|
|
|
10.52
|
|
First Amendment to Lease Agreement dated January 15, 2004, by and between Mission Ridge Associates LLC as Landlord and Ensign Facility Services, Inc. as Tenant
|
|
S-1
|
|
333-142897
|
|
10.40
|
|
|
5/14/2007
|
|
|
148
|
Exhibit
|
|
|
|
|
File
|
|
Exhibit
|
|
Filing
|
|
Filed
|
||
|
No.
|
Exhibit Description*
|
|
Form
|
|
No.
|
|
No.
|
|
Date
|
|
Herewith
|
||
|
10.53
|
|
Second Amendment to Lease Agreement dated December 13, 2007, by and between Mission Ridge Associates LLC as Landlord and Ensign Facility Services, Inc. as Tenant; and Reaffirmation of Guaranty of Lease, dated December 13, 2007, by The Ensign Group, Inc. as Guarantor in favor of Landlord, under which Guarantor reaffirms its guaranty of Tenants obligations under the Lease Agreement
|
|
10-K
|
|
001-33757
|
|
10.52
|
|
|
3/6/2008
|
|
|
|
10.54
|
|
Third Amendment to Lease Agreement dated February 21, 2008, by and between Mission Ridge Associates LLC as Landlord and Ensign Facility Services, Inc. as Tenant
|
|
10-K
|
|
001-33757
|
|
10.54
|
|
|
2/17/2010
|
|
|
|
10.55
|
|
Fourth Amendment to Lease Agreement dated July 15, 2009, by and between Mission Ridge Associates LLC as Landlord and Ensign Facility Services, Inc. as Tenant
|
|
10-K
|
|
001-33757
|
|
10.55
|
|
|
2/17/2010
|
|
|
|
10.56
|
|
Form of Independent Consulting and Centralized Services Agreement between Ensign Facility Services, Inc. and certain of its subsidiaries
|
|
S-1
|
|
333-142897
|
|
10.41
|
|
|
5/14/2007
|
|
|
|
10.57
|
|
Form of Health Insurance Benefit Agreement pursuant to which certain subsidiaries of The Ensign Group, Inc. participate in the Medicare program
|
|
S-1
|
|
333-142897
|
|
10.48
|
|
|
10/19/2007
|
|
|
|
10.58
|
|
Form of Medi-Cal Provider Agreement pursuant to which certain subsidiaries of The Ensign Group, Inc. participate in the California Medicaid program
|
|
S-1
|
|
333-142897
|
|
10.49
|
|
|
10/19/2007
|
|
|
|
10.59
|
|
Form of Provider Participation Agreement pursuant to which certain subsidiaries of The Ensign Group, Inc. participate in the Arizona Medicaid program
|
|
S-1
|
|
333-142897
|
|
10.50
|
|
|
10/19/2007
|
|
|
|
10.6
|
|
Form of Contract to Provide Nursing Facility Services under the Texas Medical Assistance Program pursuant to which certain subsidiaries of The Ensign Group, Inc. participate in the Texas Medicaid program
|
|
S-1
|
|
333-142897
|
|
10.51
|
|
|
10/19/2007
|
|
|
|
10.61
|
|
Form of Client Service Contract pursuant to which certain subsidiaries of The Ensign Group, Inc. participate in the Washington Medicaid program
|
|
S-1
|
|
333-142897
|
|
10.52
|
|
|
10/19/2007
|
|
|
|
10.62
|
|
Form of Provider Agreement for Medicaid and UMAP pursuant to which certain subsidiaries of The Ensign Group, Inc. participate in the Utah Medicaid program
|
|
S-1
|
|
333-142897
|
|
10.53
|
|
|
10/19/2007
|
|
|
|
10.63
|
|
Form of Medicaid Provider Agreement pursuant to which a subsidiary of The Ensign Group, Inc. participates in the Idaho Medicaid program
|
|
S-1
|
|
333-142897
|
|
10.54
|
|
|
10/19/2007
|
|
|
|
10.64
|
|
Six Project Promissory Note dated as of November 10, 2009, in the original principal amount of $40,000,000, by certain subsidiaries of the Ensign Group, Inc. in favor of General Electric Capital Corporation
|
|
8-K
|
|
001-33757
|
|
10.2
|
|
|
11/17/2009
|
|
|
|
10.65
|
|
Note, dated December 31, 2010 by certain subsidiaries of the Company.
|
8-K
|
001-33757
|
10.1
|
|
1/6/2011
|
||||||
149
|
Exhibit
|
|
|
|
|
File
|
|
Exhibit
|
|
Filing
|
|
Filed
|
|||
|
No.
|
Exhibit Description*
|
|
Form
|
|
No.
|
|
No.
|
|
Date
|
|
Herewith
|
|||
|
10.66
|
|
Revolving Credit and Term Loan Agreement, dated as of July 15, 2011, among the Ensign Group, Inc. and the several banks and other financial institutions and lenders from time to time party thereto (the "Lenders") and SunTrust Bank, in its capacity as administrative agent for the Lenders, as issuing bank and as swingline lender.
|
8-K
|
001-33757
|
10.1
|
|
7/19/2011
|
|||||||
|
10.67
|
|
Commercial Deeds of Trust, Security Agreements, Assignment of Leases and Rents and Future Filing, dated as of February 17, 2012, made by certain subsidiaries of the Company for the benefit of RBS Asset Finance, Inc. 8-K.
|
8-K
|
001-33757
|
10.1
|
|
2/22/2012
|
|||||||
|
10.68
|
|
First Amendment to Revolving Credit and Term Loan Agreement, dated as of October 27, 2011, among The Ensign Group, Inc. and the several banks and other financial institutions and lenders from time to time party thereto (the "Lenders") and SunTrust Bank, in its capacity as administrative agent for the Lenders, as issuing bank and as swingline lender.
|
10-K
|
001-33757
|
10.70
|
|
2/13/2013
|
|||||||
|
10.69
|
|
Second Amendment to Revolving Credit and Term Loan Agreement, dated as of April 30, 2012, among The Ensign Group, Inc. and the several banks and other financial institutions and lenders from time to time party thereto (the "Lenders") and SunTrust Bank, in its capacity as administrative agent for the Lenders, as issuing bank and as swingline lender.
|
10-K
|
001-33757
|
10.71
|
|
2/13/2013
|
|||||||
|
10.7
|
|
Third Amendment to Revolving Credit and Term Loan Agreement, dated as of February 1, 2013, among The Ensign Group, Inc. and the several banks and other financial institutions and lenders from time to time party thereto (the "Lenders") and SunTrust Bank, in its capacity as administrative agent for the Lenders, as issuing bank and as swingline lender.
|
8-K
|
001-33757
|
10.1
|
|
2/6/2012
|
|||||||
|
10.71
|
|
Fourth Amendment to Revolving Credit and Term Loan Agreement, dated as of April 16, 2013, among the Ensign Group, Inc. and the several banks and other financial institutions and lenders from time to time party thereto(the "Lenders") and SunTrust Bank, in its capacity as administrative agent fort he Lenders, as issuing bank and as swingline lender.
|
8-K
|
001-33757
|
10.1
|
|
4/22/2013
|
|||||||
|
10.72
|
|
Corporate Integrity Agreement between the Office of Inspector General of the Department of Health and Human Services and The Ensign Group, Inc. dated October 1, 2013.
|
10-K
|
001-33757
|
10.74
|
|
2/13/2014
|
|||||||
|
10.73
|
|
Settlement agreement dated October 1, 2013, entered into among the United States of America, acting through the United States Department of Justice and on behalf of the Office of Inspector General ("OIG-HHS") of the Department of Health and Human Services ("HHS") (collectively the "United States") and the Company.
|
8-K
|
001-33757
|
10.75
|
|
2/13/2014
|
|||||||
|
10.74
|
|
Form of Master Lease by and among certain subsidiaries of The Ensign Group, Inc. and certain subsidiaries of CareTrust REIT, Inc.
|
8-K
|
001-33757
|
10.1
|
|
6/5/2014
|
|||||||
|
10.75
|
|
Form of Guaranty of Master Lease by The Ensign Group, Inc. in favor of certain subsidiaries of CareTrust REIT, Inc., as landlords under the Master Leases
|
8-K
|
001-33757
|
10.2
|
|
6/5/2014
|
|||||||
|
10.76
|
|
Opportunities Agreement, dated as of May 30, 2014, by and between The Ensign Group, Inc. and CareTrust REIT, Inc.
|
8-K
|
001-33757
|
10.3
|
|
6/5/2014
|
|||||||
150
|
Exhibit
|
|
|
|
|
File
|
|
Exhibit
|
|
Filing
|
|
Filed
|
|||
|
No.
|
Exhibit Description*
|
|
Form
|
|
No.
|
|
No.
|
|
Date
|
|
Herewith
|
|||
|
10.77
|
|
Transition Services Agreement, dated as of May 30, 2014, by and between The Ensign Group, Inc. and CareTrust REIT, Inc.
|
8-K
|
001-33757
|
10.4
|
|
6/5/2014
|
|||||||
|
10.78
|
|
Tax Matters Agreement, dated as of May 30, 2014, by and between The Ensign Group, Inc. and CareTrust REIT, Inc.
|
8-K
|
001-33757
|
10.5
|
|
6/5/2014
|
|||||||
|
10.79
|
|
Employee Matters Agreement, dated as of May 30, 2014, by and between The Ensign Group, Inc. and CareTrust REIT, Inc.
|
8-K
|
001-33757
|
10.6
|
|
6/5/2014
|
|||||||
|
10.80
|
|
Contribution Agreement, dated as of May 30, 2014, by and among CTR Partnership L.P., CareTrust GP, LLC, CareTrust REIT, Inc. and The Ensign Group, Inc.
|
8-K
|
001-33757
|
10.7
|
|
6/5/2014
|
|||||||
|
10.81
|
|
Credit Agreement, dated as of May 30, 2014, by and among The Ensign Group, Inc., SunTrust Bank, as administrative agent, and the lenders party thereto
|
8-K
|
001-33757
|
10.8
|
|
6/5/2014
|
|||||||
|
10.82
|
|
Amended and Restated Credit Agreement as of February 5, 2016, by and among The Ensign Group, Inc., SunTrust Bank, as administrative agent, and the lenders party thereto
|
8-K
|
001-33757
|
10.1
|
|
2/8/2016
|
|||||||
|
10.83
|
|
Second Amended Credit Agreement as of July 19, 2016, by and among The Ensign Group, Inc., SunTrust Bank, as administrative agent, and the lenders party thereto
|
8-K
|
001-33757
|
10.1
|
|
7/25/2016
|
|||||||
|
10.84
|
|
Cornerstone Healthcare, Inc. 2016 Omnibus Incentive
|
10-Q
|
001-33757
|
10.2
|
|
8/1/2016
|
|||||||
|
10.85
|
|
Cornerstone Healthcare, Inc. Stockholders Agreement
|
10-Q
|
001-33757
|
10.2
|
|
8/1/2016
|
|||||||
|
21.1
|
|
Subsidiaries of The Ensign Group, Inc., as amended
|
|
X
|
||||||||||
|
23.1
|
|
Consent of Deloitte & Touche LLP
|
|
|
X
|
|||||||||
|
31.1
|
|
Certification of Chief Executive Officer pursuant to Section 302 of the Sarbanes-Oxley Act of 2002
|
|
|
X
|
|||||||||
|
31.2
|
|
Certification of Chief Financial Officer pursuant to Section 302 of the Sarbanes-Oxley Act of 2002
|
|
|
X
|
|||||||||
|
32.1
|
|
Certification of Chief Executive Officer pursuant to Section 906 of the Sarbanes-Oxley Act of 2002
|
|
|
X
|
|||||||||
|
32.2
|
|
Certification of Chief Financial Officer pursuant to Section 906 of the Sarbanes-Oxley Act of 2002
|
|
|
X
|
|||||||||
|
101
|
|
Interactive data file (furnished electronically herewith pursuant to Rule 406T of Regulations S-T)
|
||||||||||||
|
+
|
|
Indicates management contract or compensatory plan.
|
||||||||||||
|
*
|
|
Documents not filed herewith are incorporated by reference to the prior filings identified in the table above.
|
||||||||||||
151
TABLE OF CONTENTS
Part I. Item 1A. Risk FactorsItem 7A. Quantitative and Qualitative Disclosures About Market RiskItem 8. Financial Statements and Supplementary DataItem 9. Changes in and Disagreements with Accountants on Accounting and Financial DisclosuresItem 9A. Controls and ProceduresItem 9B. Other InformationPart IIIItem 10. Directors, Executive Officers and Corporate GovernanceItem 11. Executive CompensationItem 12. Security Ownership Of Certain Beneficial Owners and Management and Related Stockholder MattersItem 13. Certain Relationships and Related Transactions, and Director IndependenceItem 14. Principal Accountant Fees and ServicesPart IVItem 15. Exhibits, Financial Statements and Schedules