ENSERVCO CORP
10-Ks and 10-Qs
|
|
|
|
|
|
|
|
|
|
|
|
|
|
|
|
|
|
|
|
|
|
|
|
|
|
|
|
|
UNITED STATES
SECURITIES AND EXCHANGE COMMISSION
WASHINGTON, D.C. 20549
______________________
FORM 10-K
|
[X]
|
ANNUAL REPORT UNDER SECTION 13 OR 15(d) OF THE SECURITIES EXCHANGE ACT OF 1934.
|
For the fiscal year ended December 31, 2010
|
[ ]
|
TRANSITION REPORT UNDER SECTION 13 OR 15(d) OF THE SECURITIES EXCHANGE ACT OF 1934.
|
For the transition period from _______ to ______
Commission file number: 001-12531
ENSERVCO CORPORATION
(Exact name of registrant as specified in its charter)
|
Delaware
|
84-0811316
|
|
(State or other jurisdiction of
incorporation or organization)
|
(IRS Employer
Identification No.)
|
|
830 Tenderfoot Hill Road, Suite 310
Colorado Springs, CO
|
80906
|
|
(Address of principal executive offices)
|
(Zip Code)
|
Issuer’s telephone number:
(719) 867-9911
Securities registered pursuant to Section 12(b) of the Securities Exchange Act
: None
Securities registered pursuant to Section 12(g) of the Securities Exchange Act:
Common Stock, $0.005 par value
Indicate by check mark if the registrant is a well-known seasoned issuer, as defined in Rule 405 of the Securities Act:
o
Yes
x
No
Indicate by check mark whether the registrant has submitted electronically and posted on its corporate Web site, if any, every Interactive Data File required to be submitted and posted pursuant to Rule 405 of Regulation S-T (§232.405 of this chapter) during the preceding 12 months (or for such shorter period that the registrant was required to submit and post such files).
o
Yes
o
No
Indicate by check mark if the registrant is not required to file reports pursuant to Section 13 or Section 15(d) of the Act:
o
Yes
x
No
Indicate by check mark whether the registrant (1) has filed all reports required to be filed by Section 13 or 15(d) of the Securities Exchange Act of 1934 during the preceding 12 months (or for such shorter period that the registrant was required to file such reports), and (2) has been subject to such filing requirements for the past 90 days.
x
Yes
o
No
|
Indicate by check mark if disclosure of delinquent filers pursuant to Item 405 of Regulation S-K is not contained herein, and will not be contained, to the best of registrant’s knowledge, in definitive proxy or information statements incorporated by reference in Part III of this Form 10-K or any amendment to this Form 10-K.
x
|
Indicate by check mark whether the registrant is a large accelerated filer, an accelerated filer, a non-accelerated filer, or a smaller reporting company. See the definitions of “large accelerated filer,” “accelerated filer” and “smaller reporting company” in Rule 12b-2 of the Securities Exchange Act of 1934.
| Large accelerated filer o | Accelerated filer o |
| Non-accelerated filer o | Smaller reporting company þ |
| (Do not check if a smaller reporting company) |
Indicate by check mark whether the registrant is a shell company (as defined in Rule 12b-2 of the Securities Exchange Act of 1934). Yes
o
No
þ
The aggregate market value of the common stock held by non-affiliates of the Registrant as of June 30, 2010 was approximately $1,789,958 based upon the closing sale price of the Registrant’s Common Stock on such date. This determination of affiliate status is not necessarily a conclusive determination for other purposes.
As of March 15, 2011, there were 21,778,866 shares of the Registrant’s common stock outstanding.
2
Enservco Corporation (the “Company” or “Enservco”) was originally incorporated under the name Aspen Exploration Corporation (“Aspen”) as a Delaware corporation on February 28, 1980 for the primary purpose of acquiring, exploring and developing oil and natural gas and other mineral properties. On June 30, 2009, the Company disposed of all of its remaining oil and natural gas producing assets and as a result was no longer engaged in active business operations. On June 24, 2010, the Company entered into an Agreement and Plan of Merger and Reorganization (the “Agreement”) with Dillco Fluid Service, Inc. (“Dillco”) which set forth the terms by which Dillco merged with a subsidiary of Aspen (the “Merger Transaction”). The Merger Transaction closed on July 27, 2010, and resulted in Dillco becoming a wholly owned subsidiary of the Company. Dillco and its related entities are primarily engaged in the business of providing various services to participants in the oil and gas industry.
On December 30, 2010 the Company changed its name under Delaware law from Aspen Exploration Corporation to Enservco Corporation. The name change was approved by Company stockholders holding approximately 73% of the Company’s outstanding common stock in October 2010, although to assure compliance with the federal securities laws, the approval was not effective until December 2010. The name change was effected primarily because the Company believes the name “Enservco” better describes the Company’s current activities and operations of providing oil field services to the energy industry.
As used in this report, unless otherwise indicated the terms “Enservco” and/or “the Company” refer to Enservco Corporation and its subsidiary entities giving effect to the Merger Transaction, for all periods and events described. The term “Aspen” is intended to refer to the activities of Aspen Exploration Corporation without giving effect to the Merger Transaction, and all such references are intended to give context to the reader. Aspen filed its Annual Report on Form 10-K for its fiscal year ended June 30, 2010 on September 29, 2010, and information with respect to Aspen and its activities prior to the Merger Transaction are included in that report, as well as reports Aspen filed with the Securities and Exchange Commission prior to July 27, 2010.
The Company’s executive (or corporate) offices are located at 830 Tenderfoot Hills Rd., Suite 310, Colorado Springs, Colorado 80906. Our telephone number is (719) 867-9911, and our facsimile number is (719) 867-9912. Our website is www.enservco.com.
Corporate Structure
Immediately prior to closing the Merger Transaction, Dillco’s assets and the ownership interests of its subsidiaries were held and controlled primarily through a holding company, Enservco LLC (“LLC”). Starting in 2009 the LLC and its then principal interest holders engaged in a series of transactions aimed to help ensure all assets utilized by the LLC for its business operations were owned through the LLC and to otherwise create better internal efficiency. Certain of these reorganizational transactions are further described under Item 13 of this Annual Report.
3
On July 26, 2010, immediately prior to completion of the Merger Transaction, Dillco merged into LLC, with Dillco being the surviving entity in that transaction. Prior to that transaction, the LLC served as a holding company for Dillco, Heat Waves Hot Oil Express LLC (“Heat Waves”), and other entities that owned assets utilized by the Company in its business operations.
Immediately prior to the completion of the Merger Transaction, Dillco had two stockholders, Mr. Herman (who owned 90% of the outstanding Dillco stock) and Mr. Kasch (10%). Mr. Herman has been a Manager, Chairman, Chief Executive Officer, and control person of the LLC, Dillco, Heat Waves and the other Dillco subsidiaries since the time of their formation and/or acquisition by the LLC. Mr. Kasch has served as the Chief Financial Officer and a Manager for these same entities since the time of their formation and/or acquisition.
The Company’s business operations are conducted primarily through Dillco and its subsidiary and related entities. Dillco conducts certain of its business operations directly, but other portions of its operations and assets are (and historically were) operated and held in various subsidiary and related entities. However, Dillco and its wholly owned subsidiary Heat Waves are the primary operating entities through which Enservco conducts its operations. The below table provides an overview of the Company’s current subsidiaries.
|
Name
|
State of Formation
|
Ownership
|
Business
|
|
Dillco Fluid Service, Inc. (“Dillco”)
|
Kansas
|
100% by Enservco
|
Oil and natural gas field fluid logistic services primarily in the Hugoton Basin in western Kansas and northwestern Oklahoma.
|
|
Aspen Gold Mining Co.
|
Colorado
|
100% by Enservco
|
No active business operations or assets.
|
|
Heat Waves Hot Oil Services LLC (“Heat Waves”)
|
Colorado
|
100% by Dillco
|
Oil and natural gas well services, including logistics and stimulation.
|
|
HE Services, LLC (“HES”)
|
Nevada
|
100% by Heat Waves
|
No active business operations. Owns construction equipment used by Heat Waves.
|
|
Real GC, LLC (“Real GC”)
|
Colorado
|
100% by Heat Waves
|
No active business operations. Owns real property in Garden City, Kansas that is utilized by Heat Waves.
|
|
Trinidad Housing, LLC (“Trinidad Housing”)
|
Colorado
|
100% by Dillco.
|
No currently active business operations. Owns real property
in Trinidad, Colorado.
|
4
Overview of Business Operations
Enservco (through Heat Waves and Dillco) provides a wide range of services to a diverse group of independent and major oil and natural gas companies. These include well servicing (frac heating, hot oiling, pressure testing and acidizing), fluid services (fresh and salt water hauling, disposal and storage) and well site construction services. These services play a fundamental role in establishing and maintaining a well throughout its productive life. The Company’s operations are currently concentrated in domestic, onshore oil and natural gas producing regions in southern Kansas, northwestern Oklahoma, northeastern Utah, northern New Mexico, southern Wyoming, northwestern West Virginia and all of Colorado and southwestern Pennsylvania. Enservco is currently exploring opportunities, based on customer needs, to provide services in the Bakken Shale basin in North Dakota and to expand its operations in the Marcellus Shale formation in northeastern Pennsylvania and in the Niobrara Basin in northern Colorado and Wyoming.
Management believes that Enservco is strategically positioned with its ability to provide its services to a large customer base in key oil and natural gas basins in the United States. Management is optimistic that as a result of the significant expenditures the Company has made in new equipment in combination with the benefits that may be realized from the Merger Transaction, that the Company will be able to further grow and develop its business operations.
Historically, the Company focused its growth strategy on strategic acquisitions of operating companies and then expanding operations through additional capital investment consisting of the acquisition and fabrication of property and equipment. That strategy also included expanding the Company’s geographical footprint as well as expanding the services it provides. These strategies are exemplified by the acquisitions of operating entities (described below) and:
|
|
(1)
|
In 2008, 2009 and 2010, Dillco and Heat Waves spent approximately $7.8 million, $2.0 million and $2.2 million (not including capital leases of approximately $455,000), respectively, for the acquisition and fabrication of property and equipment; and
|
|
|
(2)
|
To expand its footprint, in mid-2008 Heat Waves moved into the Uintah basin in northwestern Utah and in early 2010 Heat Waves began providing services in the Marcellus Shale natural gas field in southwestern Pennsylvania and West Virginia.
|
Going forward the Company expects to continue to pursue its growth strategies of exploring additional acquisitions, potentially expanding the geographic areas in which it operates, and diversifying the products and services it provides to customers, as well as making further investments in its assets and equipment.
As noted above, the Company conducts its business operations and holds assets primarily through subsidiary entities. The following describes the operations and assets of Enservco’s subsidiaries through which it conducts its business operations.
Dillco
. From its inception in 1974, Dillco has focused primarily on providing water hauling/disposal/storage services, well site construction services and frac tank rental to energy companies working in the Hugoton gas field in western Kansas and northwestern Oklahoma. Water hauling/disposal has been the primary source of Dillco’s revenue. Dillco currently owns and operates a fleet of water hauling trucks and related assets, including specialized tank trucks, frac tanks, water disposal wells, construction and other related equipment. These assets transport, store
and dispose of both fresh and salt water, as well as provide well site construction and maintenance services.
5
Heat Waves
. Heat Waves provides a range of well stimulation/maintenance services to a diverse group of independent and major oil and natural gas companies. The primary services provided are intended to:
|
|
(1)
|
Assist in the fracturing of formations for newly drilled oil and natural gas wells; and
|
|
|
(2)
|
Help maintain and enhance the production of existing wells throughout their productive life.
|
These services consist of frac heating, hot oiling and acidizing. Heat Waves also provides some water hauling and well site construction services. Heat Waves’ operations are currently in southern Kansas, northwestern Oklahoma, northeastern Utah (Uintah Basin), northern New Mexico, southern and central Wyoming (Niobrara formation), Colorado (D-J Basin), and southwest Pennsylvania/ northwestern West Virginia, (Marcellus Shale). In addition to expanding its current operations in the Niobrara region, Heat Waves is currently exploring opportunities, to provide services in the Northern Marcellus Shale field, the Bakken Shale basin in North Dakota and the Eagle Ford Shale basin in south Texas.
HES
. HES owns construction and related equipment that Heat Waves uses in its well site construction and maintenance services. However, HES does not currently engage in any business activities itself. HES also owns a disposal well that Dillco uses for salt water disposal. HES acquired the well from Mr. Herman in March 2010 for $100,000, which amount was paid in September 2010.
Real GC
. Real GC owns land in Garden City, Kansas, which Heat Waves uses for the location of an acid dock facility, truck and inventory storage, and other related purposes.
Trinidad Housing
. Trinidad Housing owns land and a building in Trinidad, Colorado that was previously used as a nursing home. The building has been converted for use as rental housing for Heat Waves employees from out of town that were working at the Trinidad facility. There are currently no such employees at the Trinidad facility and the property is actively being marketed for sale.
Disposal Wells
. Dillco and HES together own a total of five licensed disposal wells.
Products and Services
The Company provides a range of services to owners and operators of oil and natural gas wells. Such services can generally be grouped into the three following categories:
|
|
(1)
|
Fluid management services, i.e., water hauling, frac tank rental and disposal services;
|
|
|
(2)
|
Well enhancement services, i.e., hot oiling, acidizing, frac hearing and pressure testing, and
|
|
|
(3)
|
Well site construction services.
|
6
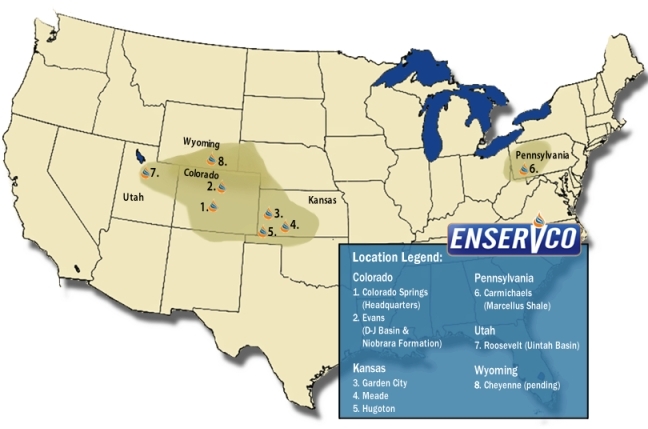
Dillco primarily provides fluid management and well site construction services whereas Heat Waves primarily provides well enhancement and construction services. The following map shows the primary areas in which Heat Waves and Dillco currently have active business operations.
The following is a more complete description of the services provided by Enservco through its subsidiaries.
Fluid Services
.
Water Hauling –
Historically water hauling has accounted for approximately 40% of the Company’s revenues on a consolidated basis. Dillco currently owns and operates approximately 30 water hauling trucks equipped with pumps to move water from or into wells, tanks and other storage facilities in order to assist customers in managing their water-cost needs. Each truck has a hauling capacity of up to 130 barrels (each barrel being equal to 42 U.S. gallons). The trucks are used to:
|
(1)
|
Transport water to fill frac tanks on well locations,
|
|
(2)
|
Transport contaminated water produced as a by-product of producing wells to disposal wells, including disposal wells that we own and operate,
|
|
(3)
|
Transport drilling and completion fluids to and from well locations, and
|
|
(4)
|
Following completion of fracturing operations, the trucks are used to transport the flow-back produced as a result of the fracturing process from the well site to disposal wells.
|
7
|
Most wells produce residual salt or fresh water in conjunction with the extraction of the oil or natural gas. Dillco’s trucks pick up water at the well site and transport it to a disposal well for injection or to other environmentally sound surface recycling facilities. This is regular maintenance work that is done on a periodic basis depending on the volume of water a well produces. Water-cost management is an ongoing need for oil and natural well gas operators throughout the life of a well. Dillco’s ability to outperform competitors in this segment is primarily dependent on logistical factors such as the proximity between areas where water is produced or used and where strategic placement and/or access to both disposal wells and recycling facilities. Dillco, Heat Waves and HES own five water disposal wells in Kansas and Oklahoma. It is management’s intent to expand Enservco’s disposal well holdings and access to recycling facilities.
|
Typically Dillco and a customer enter into a contract for services after that customer has completed a competitive bidding process. Requirements for minor or incidental water hauling services are usually purchased on a “call out” basis and charged according to a published schedule of rates. Dillco competes for services both on a call out and contractual basis.
Workover, completion, and remedial activities also provide the opportunity for higher operating margins from tank rentals and water hauling services. Drilling and workover jobs typically require water for multiple purposes. Completion and workover procedures often also require large volumes of water for fracturing operations, a process of stimulating a well hydraulically to increase production. All fluids are required to be transported from the well site to an approved disposal facility.
Competitors in the water hauling business are mostly small, regionally focused companies. The level of water hauling activity is comprised of a relatively stable demand for services related to the maintenance of producing wells and a highly variable demand for services used in the drilling and completion of new wells. As a result, the level of domestic onshore drilling activity significantly affects the level of the Company’s activity in this service area, and may vary from region to region and from season to season.
Disposal Well Services –
The Company owns five disposal wells that allow for the injection of salt water and incidental non-hazardous oil and natural gas wastes.
Our trucks frequently transport fluids to be disposed of into these disposal wells. The Company’s disposal wells are located in southwestern Kansas and northwestern Oklahoma in areas in proximity to our customers’ producing wells. Most oil and natural gas wells produce varying amounts of water throughout their productive lives. In the states in which we operate, oil and natural gas wastes and water produced from oil and natural gas wells are required by law to be disposed of in authorized facilities, including permitted water disposal wells. These disposal wells are licensed by state authorities pursuant to guidelines and regulations imposed by the Environmental Protection Agency and the Safe Drinking Water Act and are completed in an environmentally sound manner in permeable formations below the fresh water table.
Frac Tank Rental –
Dillco also generates revenues from the rental of frac tanks which can store up to 500 barrels of water and are used by oilfield operators to store fluids at the well site, including fresh water, salt water, and acid for frac jobs, flowback, temporary production and mud storage. Dillco transports the tanks on its trucks to well locations that are usually within a 30 mile
radius of its nearest yard but can range from just a couple of miles up to as many as 200 miles. Frac tanks are used during all phases of the life of a producing well. Dillco generally rents frac tanks at daily rates and charges hourly rates for the transportation of the tanks to and from the well site.
8
Well Enhancement Services
.
Well enhancement services consist of frac heating, acidizing, hot oiling services, and pressure testing. These services are provided primarily by Heat Waves which currently utilizes a fleet of approximately 100 custom designed trucks and other related equipment. Heat Waves’ operations are currently in southern Kansas, northwestern Oklahoma, northern New Mexico, southern Wyoming (Niobrara), Colorado (D-J Basin), northeastern Utah (Uintah Basin) and southwestern Pennsylvania/northwestern West Virginia (Marcellus Shale). Heat Waves is currently exploring opportunities, based on customer needs, to expand its operations in the Niobrara formation and to begin providing services in the Bakken Shale basin in North Dakota. Well enhancement services accounted for approximately 55% of the Company’s total revenues for its 2010 fiscal year on a consolidated basis.
Frac Heating
- Fracturing services are intended to enhance the production from oil and natural gas wells where the natural flow has been restricted by underground formations through the creation of conductive flowpaths to enable the hydrocarbons to reach the wellbore. The fracturing process consists of pumping a fluid slurry, which largely consists of fresh water and a “proppant” (explained below), into a cased well at sufficient pressure to fracture (i.e. create conductive flowpaths) the producing formation. Sand, bauxite or synthetic proppants are suspended in the fracturing fluid slurry and are pumped into the well under great pressure to fracture the formation. To ensure these solutions are properly mixed (gel frac) or that plain water (used in slick water fracs) can flow freely, the water frequently needs to be heated to a sufficient temperature as determined by the well owner/operator. Heat Waves owns and operates 15 frac heaters designed to heat large amounts of water stored in reservoirs or frac tanks.
Acidizing
- Acidizing is most often used for any of three functions:
|
|
●
|
Increasing permeability throughout the formation,
|
|
|
●
|
Cleaning up formation damage near the wellbore caused by drilling, and
|
|
|
●
|
For removing buildup of materials restricting the flow in the formation or through perforations in the well casing.
|
Acidizing entails pumping large volumes of specially formulated acids and/or chemicals into a well to dissolve materials blocking the flow of the oil or natural gas. The acid is pumped into the well under pressure and allowed time to react. The spent fluids are then flowed or swabbed out of the well, after which the well is put back into production.
Heat Waves provides acidizing services by utilizing its fleet of 5 mobile acid transport and pumping trucks. For most customers, Heat Waves supplies the acid solution and also pumps that solution into a given well. There are customers who provide their own solutions and hire Heat Waves to pump the solution.
9
Hot Oil Services
– Hot oil services involve the circulation of a heated fluid, typically oil, to dissolve or dislodge paraffin or other hydrocarbon deposits from the tubing of a producing oil or natural gas well. These deposits build up over a period of time from normal production operations, although the rate at which these products build up depends on the chemical character of the oil and natural gas being produced. This is performed by circulating the hot oil down the casing and back up the tubing to remove the deposits from the well bore. Hot oiling is intended to melt the hydrocarbon deposits. Hot oil servicing also includes the heating of oil storage tanks. The heating of storage tanks is done:
|
|
(1)
|
To eliminate water and other soluble waste in the tank for which the operator’s revenue is reduced at the refinery; and
|
|
|
(2)
|
Because heated oil flows more efficiently from the tanks to transports taking oil to the refineries in colder weather.
|
|
|
Heat Waves currently has 15 hot oil trucks in its fleet.
|
Pressure Testing
–
Pressure testing consist of pumping fluids into new or existing wells or other components of the well system such as flow lines to detect leaks, Hot oil trucks and pressure trucks are used to perform this service.
Construction and Roustabout Services
.
Dillco and Heat Waves derive revenue from their fleet of power units which includes dozers, trenchers, motor graders, backhoes and other heavy equipment used in road and well-site construction. Contracts for well site construction services are normally awarded by our customers on the basis of competitive bidding and may range in scope from several days to several weeks in duration. Construction service revenues are directly impacted by the drilling activities of oil and natural gas companies.
Ownership of Company Assets
As described above, Enservco owns and uses a fleet of trucks, frac tanks, disposal wells and other assets to provide its services and products. Substantially all of the equipment and personal property assets owned by Dillco and Heat Waves are subject to a security interest to secure loans made to Dillco and its subsidiary companies (which loans Enservco as the parent corporation has guaranteed).
Historically, some of the equipment utilized by Dillco and Heat Waves was leased from related entities - HNR and HES. Previously HNR and HES were not subsidiary entities of Dillco, but were owned separately by our Chief Executive Officer Mr. Herman and his family. HNR was formed to acquire certain assets utilized primarily by Dillco, and HES was formed to acquire construction equipment leased to Heat Waves. On December 31, 2009 Dillco acquired certain assets from HNR and then in March 2010 HES became a wholly owned subsidiary of Heat Waves.
10
Competitive Business Conditions
The markets in which Enservco currently operates are highly competitive. Competition is influenced by such factors as price, capacity, the quality and availability of equipment, availability of work crews, and reputation and experience of the service provider. Enservco believes that an important competitive factor in establishing and maintaining long-term customer relationships is having an experienced, skilled, and well-trained work force that is responsive to our customers’ needs. Although we believe customers consider all of these factors, price is often the primary factor in determining which service provider is awarded the work.
The demand for our services fluctuates primarily in relation to the worldwide commodity price (or anticipated price) of oil and natural gas which, in turn, is largely driven by the worldwide supply of, and demand for, oil and natural gas, political events, as well as speculation within the financial markets. Demand and prices are often volatile and difficult to predict and depends on events that are not within our control. Generally, as supply of those commodities decreases and demand increases, service and maintenance requirements increase as oil and natural gas producers drill new wells and attempt to maximize the productivity of their existing wells to take advantage of the higher priced environment. However, in a lower oil and natural gas price environment, as experienced during much of 2009 and into 2010, demand for service and maintenance decreases as oil and natural gas producers decrease their drilling activity and forego or reduce budgeted maintenance expenditures. Due to the amount of production related work performed by the Company (as compared to new drilling) our decrease in revenues in 2009 and 2010 from 2008 was not as severe as service companies whose primary services are related to new well development.
Enservco’s competition primarily consists of small regional or local contractors. Enservco attempts to differentiate itself from its competition in large part through its superior equipment and the range and quality of services it has the capability to provide. Enservco invests a significant amount of capital into purchasing, developing, and maintaining a fleet of trucks and other equipment that are critical to the services it provides. Further, Enservco concentrates on providing services to a diverse group of large and small independent oil and natural gas companies. We believe we have been successful using this business model and believe it will enable us to continue to grow our business.
Dependence on One or a Few Major Customers
Enservco serves numerous major and independent oil and natural gas companies that are active in its core areas of operations. During the fiscal year ended December 31, 2010, only one of the Company’s customers accounted for more than 10% of consolidated revenues at approximately 13% (all other customers were less than 7% of revenues, individually). For the year ended December 31, 2009, there were no customers that accounted for 10% or more of the Company's total revenues.
The Company notes for the year ended December 31, 2010, that though there are no other customers that accounted for more than 10% of revenues, the Company’s top five customers accounted for approximately 35% of its total revenues. The loss of any one of these customers or a sustained decrease in demand by any of such customers could result in a substantial loss of revenues and could have a material adverse effect on Enservco’s results of operations.
While the Company believes its equipment could be redeployed in the current market environment if Dillco and/or Heat Waves lost any material customers, such loss could have an adverse effect on the Company’s business until the equipment is redeployed. Except as discussed in the preceding sentences, we believe that the market for Enservco’s services is sufficiently diversified that it is not dependent on any single customer or a few major customers.
11
Seasonality
Portions of Enservco’s operations are impacted by seasonal factors, particularly with regards to its frac water heating and hot oiling services. In regards to frac heating, because customers rely on Heat Waves to heat large amounts of water for use in fracturing formations, demand for this service is much greater in the colder months. Similarly, hot oiling services are in higher demand during the colder months when they are needed for maintenance of existing wells and to heat oil storage tanks.
Acidizing and pressure testing are done primarily during non-winter months.
The hauling of water from producing wells is not as seasonal as our other services since wells produce water whenever they are pumping regardless of weather conditions. Hauling of water for the drilling or fracturing of wells is also not seasonal but dependent on when customers decide to drill or complete wells.
Raw Materials
Enservco purchases a wide variety of raw materials, parts, and components that are made by other manufacturers and suppliers for our use. Enservco is not dependent on any single source of supply for those parts, supplies or materials. However, there are a limited number of vendors for certain acids and chemicals. Enservco utilizes a limited number of suppliers and service providers available to fabricate and/or construct the trucks and equipment used in its hot oiling, frac heating, and acid related services.
Patents, Trademarks, Licenses, Franchises, Concessions, Royalty Agreements or Labor Contracts
Enservco (through Heat Waves and Dillco) enters into agreements with local property owners where its disposal wells are located by which the Company generally agrees to pay those property owners a fixed amount per month plus a percentage of revenues derived from utilizing those wells. The terms of these agreements are separately negotiated with the given property owner, and during its 2010 fiscal year the total amount paid under these various agreements by the Company was immaterial to the Company and its business operations.
The Company has filed for federal registration (through the United States Patent and Trademark Office) of “Enservco” as a trademark.
Government Regulation
Enservco (as a result of Heat Waves’ and Dillco’s business operations) is subject to a variety of government regulations ranging from environmental to OSHA to the Department of Transportation. The Company does not believe that it is in material violation of any regulations that would have a significant negative impact on Enservco’s operations.
12
Through the routine course of providing services, Enservco (through Heat Waves and Dillco) handles and stores bulk quantities of hazardous materials. If leaks or spills of hazardous materials handled, transported or stored by us occur, Enservco may be responsible under applicable environmental laws for costs of remediating any damage to the surface or sub-surface (including aquifers). Heat Waves’ and Dillco’s operations are subject to stringent federal, state and local laws regulating the discharge of materials into the environment or otherwise relating to health and safety or the protection of the environment. Numerous governmental agencies, such as the U.S. Environmental Protection Agency, commonly referred to as the “EPA,” issue regulations to implement and enforce these laws, which often require difficult and costly compliance measures. Failure to comply with these laws and regulations may result in the assessment of substantial administrative, civil and criminal penalties, as well as the issuance of injunctions limiting or prohibiting activities. In addition, some laws and regulations relating to the protection of the environment may, in certain circumstances, impose strict liability for environmental contamination, rendering a person liable for environmental damages and cleanup costs without regard to negligence or fault on the part of that person. Strict adherence with these regulatory requirements increases our cost of doing business and consequently affects our profitability. Enservco believes that it is in substantial compliance with current applicable environmental laws and regulations and that continued compliance with existing requirements will not have a material adverse impact on the Company’s operations. However, environmental laws and regulations have been subject to frequent changes over the years, and the imposition of more stringent requirements could have a materially adverse effect upon Enservco’s capital expenditures, earnings or our competitive position.
The Comprehensive Environmental Response, Compensation and Liability Act (“CERCLA”), also known as “Superfund,” imposes liability without regard to fault or the legality of the original conduct, on certain classes of persons who contributed to the release of a “hazardous substance” into the environment. In the course of Enserco’s operations (being those of Heat Waves and Dillco), it does not typically generate materials that are considered “hazardous substances.” One exception, however, would be spills that occur prior to well treatment materials being circulated down hole. For example, if Heat Weaves or Dillco spills acid on a roadway as a result of a vehicle accident in the course of providing well enhancement/stimulation services, or if a tank with acid leaks prior to down hole circulation, the spilled material may be considered a “hazardous substance.” In this respect, Enservco may occasionally be considered to “generate” materials that are regulated as hazardous substances and, as a result, may incur CERCLA liability for cleanup costs. Also, claims may be filed for personal injury and property damage allegedly caused by the release of hazardous substances or other pollutants.
Additionally, the Company (through Heat Waves and Dillco) operates facilities that are subject to requirements of the Clean Water Act, as amended, or “CWA,” the Safe Drinking Water Act, and analogous state laws that impose restrictions and controls on the discharge of pollutants into navigable waters. Spill prevention, control and counter-measure requirements under the CWA require implementation of measures to help prevent the contamination of navigable waters in the event of a hydrocarbon spill. Regulations in the states in which Enservco owns and operates wells (Kansas and Oklahoma) require us to obtain a permit to operate each of our disposal wells. The applicable regulatory agency may suspend or modify one of our permits if Enservco’s well operations are likely to result in pollution of freshwater, substantial violation of permit conditions or applicable rules, or if the well leaks into the environment.
Because Heat Waves’ and Dillco’s trucks travel over public highways to get to customer’s wells, Enservco is subject to the regulations of the Department of Transportation. These regulations
are very comprehensive and cover a wide variety of subjects from the maintenance and operation of vehicles to driver qualifications to safety. Violations of these regulations can result in penalties ranging from monetary fines to a restriction on the use of the vehicles. Under regulations effective July 1, 2010, the continued violation of regulations could result in a shutdown of all of the vehicles of either Dillco or Heat Waves. Enservco does not believe it is in significant violation of Department of Transportation regulations at this time that would result in a shutdown of vehicles.
13
Employees
As of March 15, 2011, Enservco employed approximately 120 full time employees. Of these employees, 3 are employed by Enservco Corporation, approximately 41 by Dillco, and approximately 76 by Heat Waves.
Enservco’s securities are highly speculative and involve a high degree of risk, including among other items the risk factors described below. The below risk factors are intended to generally describe certain risks that could materially affect the Company and its current business operations and activities.
You should carefully consider the risks described below and elsewhere herein in connection with any decision whether to acquire, hold or sell the Company’s securities. If any of the contingencies discussed in the following paragraphs or other materially adverse events actually occurs, the business, financial condition and results of operations could be materially and adversely affected. In such case, the trading price of our common stock could decline, and you could lose all or a significant part of your investment.
Operations Related Risks
Our business depends on domestic spending by the oil and natural gas industry, and our business has been, and may continue to be, adversely affected by industry and financial market conditions that are beyond our control.
We depend on our customers’ willingness to make operating and capital expenditures to explore, develop and produce oil and natural gas in the United States. Customers’ expectations for lower market prices for oil and natural gas, as well as the availability of capital for operating and capital expenditures, may cause them to curtail spending, thereby reducing demand for our services and equipment. As an example, Enservco believes the weak global economy and decrease in demand for oil and natural gas during much of 2009 significantly contributed to the Company’s net loss of approximately $5.9 million in fiscal 2009. On the other hand, the generally improving economic conditions and increasing activity in the oil and gas industry in late 2010 has likely benefitted Enservco.
Industry conditions are influenced by numerous factors over which Enservco has no control, such as the supply of and demand for oil and natural gas, domestic and worldwide economic conditions, weather conditions, political instability in oil and natural gas producing countries (such as currently occurring in the Middle East), and merger and divestiture activity among oil and natural gas producers. The volatility of the oil and natural gas industry and the consequent impact on exploration and production activity could adversely impact the level of drilling and activity by some of our
customers. This reduction may cause a decline in the demand for Enservco’s services or adversely affect the price of its services. In addition, reduced discovery rates of new oil and natural gas reserves in Enservco’s market areas also may have a negative long-term impact on its business, even in an environment of stronger oil and natural gas prices, to the extent existing production is not replaced and the number of producing wells for Enservco to service declines.
14
On-going volatility and uncertainty in the global economic environment has caused the oilfield services industry to experience volatility in terms of demand, and the rate at which demand may slow, or return to former levels, is uncertain. At times the recent volatility in prices for oil and natural gas has led many oil and natural gas producers to announce reductions in their capital budgets for certain periods. Limitations on the availability of capital, or higher costs of capital, for financing expenditures may cause these and other oil and natural gas producers to make on-going or additional reductions to capital budgets in the future even if commodity prices increase from current levels. These cuts in spending will curtail drilling programs as well as discretionary spending on well services, which may result in a reduction in the demand for Enservco’s services, the rates we can charge and our utilization. In addition, certain of Enservco’s customers could become unable to pay their suppliers, including Enservco. Any of these conditions or events could adversely affect our operating results.
If oil and natural gas prices remain volatile it could have an adverse effect on the demand for our services.
The demand for many of our services is primarily determined by current and anticipated oil and natural gas prices, and the related general production spending and level of drilling activity in the areas in which we have operations.
Prices for oil and natural gas historically have been extremely volatile and likely will continue to be volatile. Volatility or weakness in oil and natural gas prices (or the perception that oil and natural gas prices will decrease) affects the spending patterns of our customers and may result in the drilling of fewer new wells or lower production spending on existing wells. This, in turn, could result in lower demand for our services and may cause lower rates and lower utilization of Enservco’s well service equipment.
Demand for the majority of our services is substantially dependent on the levels of expenditures by the domestic oil and natural gas industry. Enservco has no influence over its customers’ capital expenditures. On-going economic volatility could have a material adverse effect on our financial condition, results of operations and cash flows.
Demand for the majority of our services depends substantially on the level of expenditures by participants in the domestic (United States) oil and natural gas industry for the exploration, development and production of oil and natural gas reserves. These expenditures are sensitive to the industry’s view of future economic growth in the United States and elsewhere, and the resulting impact on demand for oil and natural gas. The worldwide deterioration in the financial and credit markets, which began in the second half of 2008, resulted in diminished demand for oil and natural gas and significantly lower oil and natural gas prices during 2009 and at least the first half of 2010. This caused many of our customers to reduce or delay their oil and natural gas exploration and production spending in 2009 and the first half of 2010, which consequently reduced their demand for our services, and exerted downward pressure on the prices that we charged for our services and
products. Other worldwide political events may result in higher or lower prices for oil and natural gas and impact the demand for our services.
15
Furthermore, increasing oil and natural gas prices can lead to increasing costs of exploring for and producing oil and natural gas. The price of drill rigs, pipe, other equipment, fluids, and oil field services and the cost to companies like Enservco of providing those services generally increase with significant increases in oil and natural gas prices. The resulting reduction in cash flows being experienced by our customers during the past years, together with the reduced availability of credit and increased costs of borrowing funds could have significant adverse effects on the financial condition of some of our customers. This could result in project modifications, delays or cancellations, general business disruptions, and delay in, or nonpayment of, amounts that are owed to the Company, which could have a material adverse effect on our financial condition, results of operations and cash flows.
Environmental compliance costs and liabilities could reduce our earnings and cash available for operations.
We are subject to increasingly stringent laws and regulations relating to importation and use of hazardous materials and environmental protection, including laws and regulations governing air emissions, water discharges and waste management. We incur, and expect to continue to incur, capital and operating costs to comply with environmental laws and regulations. The technical requirements of these laws and regulations are becoming increasingly complex, stringent and expensive to implement. These laws may provide for “strict liability” for damages to natural resources or threats to public health and safety. Strict liability can render a party liable for damages without regard to negligence or fault on the part of the party. Some environmental laws provide for joint and several strict liability for remediation of spills and releases of hazardous substances.
The Company uses hazardous substances and wastes in its operations. Accordingly, we could become subject to potentially material liabilities relating to the investigation and cleanup of contaminated properties, and to claims alleging personal injury or property damage as the result of exposures to, or releases of, hazardous substances. In addition, stricter enforcement of existing laws and regulations, new laws and regulations, the discovery of previously unknown contamination or the imposition of new or increased requirements could require Enservco to incur costs or become the basis of new or increased liabilities that could reduce its earnings and cash available for operations. The Company believes it is currently in substantial compliance with environmental laws and regulations.
Competition within the well services industry may adversely affect our ability to market our services.
The well services industry is highly competitive and fragmented and includes numerous small companies capable of competing effectively in our markets on a local basis, as well as several large companies that possess substantially greater financial and other resources than Enservco. The Company’s larger competitors have greater resources that could allow those competitors to compete more effectively than can Enservco. The amount of equipment available may exceed demand, which could result in active price competition.
We depend on several significant customers, and a loss of one or more significant customers could adversely affect our results of operations.
Enservco’s customers consist primarily of major and independent oil and natural gas companies. During 2010, only one of the Company’s customers accounted for more than 10% of consolidated revenues at approximately 13% (all other customers were less than 7% of revenues, individually). During 2009, there were no customers that accounted for 10% or more of the Company's total revenues.
16
The Company notes, that though there was only one customer that accounted for more than 10% of revenues during 2010, the Company’s top five customers accounted for approximately 35% of its total revenues during the year. The loss of any one of these customers or a sustained decrease in demand by any of such customers could result in a substantial loss of revenues and could have a material adverse effect on Enservco’s results of operations.
While the Company believes its equipment could be redeployed in the current market environment if Dillco and/or Heat Waves lost any material customers, such loss could have an adverse effect on the Company’s business until the equipment is redeployed. Except as discussed in the preceding sentences, we believe that the market for Enservco’s services is sufficiently diversified that it is not dependent on any single customer or a few major customers.
Our operations are subject to inherent risks, some of which are beyond our control. These risks may be self-insured, or may not be fully covered under our insurance policies but, to the extent not covered, are self-insured by Enservco.
Our operations are subject to hazards inherent in the oil and natural gas industry, such as, but not limited to, accidents, blowouts, explosions, fires and oil spills. These conditions can cause:
|
§
|
Personal injury or loss of life,
|
|
§
|
Damage to or destruction of property, equipment and the environment, and
|
|
§
|
Suspension of operations by our customers.
|
The occurrence of a significant event or adverse claim in excess of the insurance coverage that we maintain or that is not covered by insurance could have a material adverse effect on our financial condition and results of operations. In addition, claims for loss of oil and natural gas production and damage to formations can occur in the well services industry. Litigation arising from a catastrophic occurrence at a location where our equipment and services are being used may result in our being named as a defendant in lawsuits asserting large claims.
The Company maintains insurance coverage that we believe to be customary in the industry against these hazards. However, we do not have insurance against all foreseeable risks, either because insurance is not available or because of the high premium costs. As such, not all of our property is insured. The occurrence of an event not fully insured against, or the failure of an insurer to meet its insurance obligations, could result in substantial losses. In addition, we may not be able to maintain adequate insurance in the future at rates it considers reasonable. Insurance may not be available to cover any or all of the risks to which we are subject, or, even if available, it may be inadequate, or insurance premiums or other costs could rise significantly in the future so as to make such insurance prohibitively expensive. It is likely that, in our insurance renewals, our premiums and deductibles will be higher, and certain insurance coverage either will be unavailable or considerably
more expensive than it has been in the recent past. In addition, our insurance is subject to coverage limits, and some policies exclude coverage for damages resulting from environmental contamination.
17
We may not be successful in identifying, making and integrating our acquisitions, if any, in the future.
We anticipate that a component of our growth strategy may be to make geographic-focused acquisitions aimed to strengthen our presence in selected regional markets. Pursuit of this strategy may be restricted by the on-going volatility and uncertainty within the credit markets which may significantly limit the availability of funds for such acquisitions. In addition to restricted funding availability, the success of this strategy will depend on our ability to identify suitable acquisition candidates and to negotiate acceptable financial and other terms. There is no assurance that we will be able to do so. The success of an acquisition depends on our ability to perform adequate due diligence before the acquisition and on our ability to integrate the acquisition after it is completed. While the Company intends to commit significant resources to ensure that it conducts comprehensive due diligence, there can be no assurance that all potential risks and liabilities will be identified in connection with an acquisition. Similarly, while we expect to commit substantial resources, including management time and effort, to integrating acquired businesses into ours, there is no assurance that we will be successful integrating these businesses. In particular, it is important that the Company be able to retain both key personnel of the acquired business and its customer base. A loss of either key personnel or customers could negatively impact the future operating results of any acquired business.
Compliance with climate change legislation or initiatives could negatively impact our business.
The U.S. Congress has considered legislation to mandate reductions of greenhouse gas emissions and certain states have already implemented, or may be in the process of implementing, similar legislation. Additionally, the U.S. Supreme Court has held in its decisions that carbon dioxide can be regulated as an “air pollutant” under the Clean Air Act, which could result in future regulations even if the U.S. Congress does not adopt new legislation regarding emissions. At this time, it is not possible to predict how legislation or new federal or state government mandates regarding the emission of greenhouse gases could impact our business; however, any such future laws or regulations could require us or our customers to devote potentially material amounts of capital or other resources in order to comply with such regulations. These expenditures could have a material adverse impact on our financial condition, results of operations, or cash flows.
Our success depends on key members of our management, the loss of any of whom could disrupt our business operations.
We depend to a large extent on the services of certain of our executive officers. The loss of the services of Michael D. Herman or Rick D. Kasch and/or Austin Peitz, or other key personnel, could disrupt our operations. Although we have entered into employment agreements with Messrs. Herman, Kasch and Peitz, that contain, among other things non-compete and confidentiality provisions, we may not be able to enforce the non-compete and/or confidentiality provisions in the employment agreements.
Debt Related Risks
Our indebtedness, which is currently collateralized by substantially all of our assets, could restrict our operations
and
make us more vulnerable to adverse economic conditions.
We currently have a significant amount of indebtedness. As of December 31, 2010, the Company owed approximately $11.8 million to banks and financial institutions (a significant portion of which has been guaranteed by Enservco as Dillco’s parent corporation), with another $1.05 million due through a revolving letter of credit and another $1.7 million of subordinated debt to Mr. Herman, (the largest individual stockholder of the Company).
18
Our current and future indebtedness could have important consequences. For example, it could:
|
§
|
Impair our ability to make investments and obtain additional financing for working capital, capital expenditures, acquisitions or other general corporate purposes,
|
|
§
|
Limit our ability to use operating cash flow in other areas of our business because we must dedicate a substantial portion of these funds to make principal and interest payments on our indebtedness,
|
|
§
|
Make us more vulnerable to a downturn in our business, our industry or the economy in general as a substantial portion of our operating cash flow will be required to make principal and interest payments on our indebtedness, making it more difficult to react to changes in our business and in industry and market conditions,
|
|
§
|
Put us at a competitive disadvantage to competitors that have less debt, and
|
|
§
|
Increase our vulnerability to interest rate increases to the extent that we incur variable rate indebtedness.
|
If we are unable to generate sufficient cash flow or are otherwise unable to obtain the funds required to make principal and interest payments on our indebtedness, or if we otherwise fail to comply with the various debt service covenants and/or reporting covenants in the business loan agreements or other instruments governing our current or any future indebtedness, we could be in default under the terms of our credit facilities or such other instruments. In the event of a default, the holders of our indebtedness could elect to declare all the funds borrowed under those instruments to be due and payable together with accrued and unpaid interest, the lenders under our credit facility could elect to terminate their commitments there under and we or one or more of our subsidiaries could be forced into bankruptcy or liquidation. Any of the foregoing consequences could restrict our ability to grow our business and cause the value of our common stock to decline.
We may be unable to meet the obligations of various financial covenants that are contained in the terms of our loan agreements with Great Western Bank.
Dillco’s agreements with Great Western Bank impose various obligations and financial covenants on Dillco, each of which Enservco (as the parent corporation) has guaranteed. The outstanding amount under a line of credit with Great Western Bank is due in full in May 2011 unless it is renewed on a year-to-year basis. Additionally, the term loan with Great Western Bank requires that Dillco make a $1.0 million payment on or before June 2, 2011. Both of these loans with Great Western Bank have a variable interest rate, are guaranteed by Enservco (as the parent corporation)
and each of its subsidiaries, and are collateralized by substantially all of Dillco’s and Heat Waves’ equipment, inventory and accounts receivable. Further, the related agreements with Great Western and the bank impose various financial covenants on Dillco including maintaining a prescribed debt service ratio, minimum net worth, maximum leverage ratio, and limit the Company’s ability to incur additional debt obligations. If Dillco is unable to comply with its obligations and covenants under the loan agreements and it declares an event of default all of Dillco’s obligations to Great Western Bank could be immediately due. Because Enservco (as the parent corporation) guaranteed Dillco’s debt to Great Western Bank any default by Dillco on its obligations to Great Western would likely directly impact Enservco.
19
The agreements between Dillco and its primary lender contain cross default provisions with the debt of our principal stockholder, Michael D. Herman.
Michael D. Herman is our principal stockholder, a director, and chief executive officer. Before closing of the Merger Transaction, Mr. Herman controlled Dillco and its affiliated entities, and had various personal and unrelated business loans with Great Western Bank and its predecessor lenders. When the Company negotiated its loan agreements with Great Western Bank, the bank insisted that they contain cross default provisions so that a default by Mr. Herman on his personal indebtedness with Great Western Bank would constitute a default on Great Western’s loans to Dillco. As a result of these cross-default provisions, should Mr. Herman default on any of the other debt he has through the bank in his personal capacity, the bank could declare Dillco’s loans in default and call upon Enservco’s guarantee with respect to Dillco’s loans (but not Mr. Herman’s separate obligations). Upon an event of default by Mr. Herman, Dillco might not be able to immediately satisfy its obligations to Great Western Bank which would likely adversely impair Enservco’s ability to conduct its business operations and pay its other obligations necessary to maintain its business operations.
The variable rate indebtedness with Great Western Bank subjects us to interest rate risk, which could cause our debt service obligations to increase significantly.
Dillco’s borrowings through Great Western Bank bear interest at variable rates, exposing the Company to interest rate risk. Absent our ability to hedge our variable rates, if such rates increase, Dillco’s debt service obligations on the variable rate indebtedness would increase even though the amount borrowed remained the same and the Company’s net income and cash available for servicing Dillco’s indebtedness would decrease.
Risks Related to Our Common Stock
It is likely that any efforts we may make to raise capital or effect a business transaction will result in substantial additional dilution to our stockholders.
As part of our growth strategy we may desire to raise capital and or utilize its common stock to effect strategic business transactions. Either such action will likely require that we issue equity (or debt) securities which would result in dilution to our existing stockholders. Although we will attempt to minimize the dilutive impact of any future capital-raising activities or business transactions, we cannot offer any assurance that we will be able to do so. If we are successful in raising additional working capital, we may have to issue additional shares of our common stock at prices at a discount from the then-current market price of our common stock.
The majority of our common stock is currently considered restricted stock and our common stock is not currently eligible to be resold pursuant to Rule 144.
A significant portion of our outstanding common stock was issued to our principal stockholders in July 2010 as “restricted securities” under Rule 144 under the Securities Act. Aspen issued these shares to Mr. & Mrs. Herman and Mr. Kasch in consideration for their interests in Dillco. As a former shell company, to the extent that any person holds restricted securities of Enservco or otherwise must rely on Rule 144 for resale, Rule 144(i) imposes additional restrictions on the ability of any holder to utilize the exemption from registration for sales contained in Rule 144.
20
Because we have no plans to pay dividends on our common stock, investors must look solely to stock appreciation for a return on their investment in us.
We do not anticipate paying any cash dividends on our common stock in the foreseeable future. We currently intend to retain all future earnings to fund the development and growth of our business. Any payment of future dividends will be at the discretion of our board of directors and will depend on, among other things, our earnings, financial condition, capital requirements, level of indebtedness, statutory and contractual restrictions applying to the payment of dividends and other considerations that the board of directors deems relevant. The terms of Dillco’s existing senior credit facility restrict the payment of dividends without the prior written consent of the lenders. Investors must rely on sales of their common stock after price appreciation, which may never occur, as the only way to realize a return on their investment. Investors seeking cash dividends should not purchase our common stock.
Our common stock is subject to the penny stock rules which limits the market for our common stock
.
Because our stock is not quoted on an exchange and since the market price of the common stock is less than $5.00 per share, the common stock is classified as a “penny stock.” SEC Rule 15g-9 under the Securities Exchange Act of 1934 (the “1934 Act”) imposes additional sales practice requirements on broker-dealers that recommend the purchase or sale of penny stocks to persons other than those who qualify as an “established customer” or an “accredited investor.” This includes the requirement that a broker-dealer must make a determination that investments in penny stocks are suitable for the customer and must make special disclosures to the customers concerning the risk of penny stocks. Many broker-dealers decline to participate in penny stock transactions because of the extra requirements imposed on penny stock transactions. Application of the penny stock rules to our common stock reduces the market liquidity of our shares, which in turn affects the ability of holders of our common stock to resell the shares they purchase, and they may not be able to resell at prices at or above the prices they paid.
General Corporate Risks
Indemnification of officers and directors may result in unanticipated expenses.
The Delaware General Corporation Law and our Amended and Restated Certificate of Incorporation and bylaws provide for the indemnification of our directors, officers, employees, and agents, under certain circumstances, against attorney’s fees and other expenses incurred by them in any litigation to which they become a party arising from their association with us or activities on our behalf. We also will bear the expenses of such litigation for any of their directors, officers,
employees, or agents, upon such person’s promise to repay them if it is ultimately determined that any such person shall not have been entitled to indemnification. This indemnification policy could result in substantial expenditures by us that we may be unable to recoup and could direct funds away from our business and products (if any).
21
We have significant obligations under the 1934 Act.
Because we are a public company filing reports under the Securities Exchange Act of 1934 Act, we are subject to increased regulatory scrutiny and extensive and complex regulation. The Securities and Exchange Commission has the right to review the accuracy and completeness of our reports, press releases, and other public documents. In addition, we are subject to extensive requirements to institute and maintain financial accounting controls and for the accuracy and completeness of our books and records. Normally these activities are overseen by an audit committee consisting of qualified independent directors. A majority of our Board of Directors currently does not consist of directors that are considered “independent.” Consequently, the protections normally provided to stockholders by boards of directors comprised by a majority of persons considered “independent” directors are not available. Although we hope to appoint qualified independent directors in the future should we enter into a business combination or acquire a business, we cannot offer any assurance that we will locate any person willing to serve in that capacity.
Forward-looking statements may prove to be inaccurate.
In our effort to make the information in this report more meaningful, this report contains both historical and forward-looking statements. All statements other than statements of historical fact are forward-looking statements within the meanings of Section 27A of the Securities Act of 1933 and Section 21E of the 1934 Act. Forward-looking statements in this report are not based on historical facts, but rather reflect the current expectations of our management concerning future results and events. It should be noted that because we are a “penny stock,” the protections provided by Section 27A of the Securities Act of 1933, and Section 21E of the 1934 Act do not apply to us. We have attempted to qualify our forward-looking statements with appropriate cautionary language to take advantage of the judicially-created doctrine of “bespeaks caution” and other protections.
Forward-looking statements involve known and unknown risks, uncertainties and other factors which may cause our actual results, performance and achievements to be different from any future results, performance and achievements expressed or implied by these statements. These factors are not necessarily all of the important factors that could cause actual results to differ materially from those expressed in the forward-looking statements in this prospectus. Other unknown or unpredictable factors also could have material adverse effects on our future results.
Risk of change of control.
Mr. Herman directly and indirectly owns approximately 60% of the Company’s outstanding common stock. Mr. Herman has significant personal indebtedness to Great Western Bank, also the Company’s principal lender. Mr. Herman has granted Great Western Bank a blanket lien on his personal assets. Therefore, should Mr. Herman default on his personal indebtedness to the Bank, the Bank may institute a collection action which could result in the transfer of Mr. Herman’s interest in Enservco to the Bank – which transfer would result in a change of control.
Concentration of ownership in Mr. Herman makes it unlikely that any stockholder will be able to influence the election of directors or engage in a change of control transaction.
Because Mr. Herman directly and indirectly owns approximately 60% of the Company’s outstanding common stock, he has the ability to elect all of our directors when they again stand for reelection. Furthermore, no person seeking control of Enservco through stock ownership will be able to succeed in doing so without negotiating an arrangement to do so with Mr. Herman. For so long as Mr. Herman continues to own a significant percentage of the outstanding shares of Enservco common stock, he will retain such control over the election of the board of directors and the negotiation of any change of control transaction.
22
Provisions in our charter documents could prevent or delay a change in control or a takeover.
Provisions in our bylaws provide certain requirements for the nomination of directors which preclude a stockholder from nominating a candidate to stand for election at any annual meeting. As described in Section 2.12 of the Company’s bylaws, nominations must be presented to the Company well in advance of a scheduled annual meeting, and the notification must include specific information as set forth in that section. The Company believes that such a provision provides reasonable notice of the nominees to the board of directors, but it may preclude stockholder nomination at a meeting where the stockholder is not familiar with nomination procedures and, therefore, may prevent or delay a change of control or takeover.
Although the Delaware General Corporation Law includes §112 which provides that bylaws of Delaware corporations may require the corporation to include in its proxy materials one or more nominees submitted by stockholders in addition to individuals nominated by the board of directors, the bylaws of Enservco do not so provide. As a result, if any stockholder desires to nominate persons for election to the board of directors, the proponent will have to incur all of the costs normally associated with a contested proxy contest and then, because of Mr. Herman’s controlling ownership, will likely not be able to succeed in its endeavor.
The Securities and Exchange Commission recently adopted rules that are also intended to help stockholders nominees for election, but it is not currently clear when or if these rules will become effective. Therefore, stockholders who desire to nominate directors may not be able to take advantage of certain newly enacted (or contemplated) statutes and regulations that are aimed to help stockholder nominees be elected to boards of directors, which is another factor that may delay or prevent a change of control or a takeover.
None
The following table sets forth real property owned and leased by the Company and its subsidiaries. Unless otherwise indicated, the properties are used in Heat Waves’ operations.
23
Owned Properties
:
|
Location/Description
|
Approximate Size
|
|
Roosevelt, UT
●
Shop
●
Land - shop
|
5,000 sq. ft.
1.1 acres
|
|
Garden City, KS
●
Shop*
●
Land – shop*
●
Land – acid dock, truck storage, etc.
|
11,700 sq. ft.
1 acre
10 acres
|
|
Trinidad, CO
●
Shop*(currently under short term sublease)
●
Land – shop*(currently under short term sublease)
●
Employee rental housing – house
●
Employee rental housing - land
|
9,200 sq. ft.
5 acres
5,734 sq. ft.
0.4 acre
|
|
Hugoton, KS (Dillco)
●
Shop/Office/Storage
●
Land – shop/office/storage
●
Land - office
|
9,367 sq. ft.
3.3 acres
10 acres
|
|
Meade, KS (Dillco)
●
Shop
●
Land
|
7,000 sq. ft.
1.2 acres
|
* Property is collateral for debt incurred at time of purchase.
Leased Properties:
|
Location/Description
|
Approximate Size
|
Monthly Rental
|
Lease Expiration
|
|
Roosevelt, UT
●
Shop
●
Land
|
6,000 sq. ft.
10 acres
|
Prepaid for 60 months @ $2,500 per month
|
November 2013
|
|
Platteville, CO
●
Shop
●
Land
|
3,200 sq. ft.
1.5 acres
|
$3,000
|
May 2011
|
|
Carmichaels, PA
●
Shop
●
Land
|
5,000 sq. ft.
12.1 acres
|
$8,500
|
April 2012
|
|
Roosevelt, UT
●
Employee housing
|
1,700 sq. ft.
|
$1,300
|
May 2011
|
|
Colorado Springs, CO
●
Corporate offices
|
2,067 sq. ft.
|
$2,000
|
May 2011
|
|
Edmond, OK**
●
Executive office
|
400 sq. ft.
|
$450
|
December 2011
|
** Lease commenced on January 1, 2011.
Note - All leases have renewal clauses
As of March 15, 2011, we are not a party to any legal proceedings that could have a material adverse effect on the Company’s business, financial condition or operating results. Further, to the Company’s knowledge no such proceedings have been threatened against the Company.
24
Market Information:
Our common stock is quoted on the Over-the-Counter Bulletin Board (“OTCBB”) and the OTCQX under the symbol “ENSV.” Prior to January 4, 2011 our common stock was quoted under symbol “ASPN”. The rules of both market places provide that companies not current in their reporting requirements under the 1934 Act will be removed from the quotation service. At present and at December 31, 2010 we believe we were in full compliance with these rules.
The table below sets forth the high and low closing prices of the Company’s Common Stock during the periods indicated as reported by the Internet source Yahoo Finance (http://finance.yahoo.com). The quotations reflect inter-dealer prices without retail mark-up, mark-down or commission and may not reflect actual transactions. As noted previously in this Form 10-K the Merger Transaction closed on July 27, 2010 and the terms of the Merger Transaction were first announced on or about June 24, 2010. Therefore, the prices below also include prices solely with respect to Aspen before the Merger Transaction.
|
2010
|
2009
|
|||||||||||||||
|
Price Range
|
Price Range
|
|||||||||||||||
|
High
|
Low
|
High
|
Low
|
|||||||||||||
|
First Quarter
|
$ | 0.34 | $ | 0.29 | $ | 0.78 | $ | 0.48 | ||||||||
|
Second Quarter
|
0.36 | 0.29 | 0.90 | 0.66 | ||||||||||||
|
Third Quarter
|
0.60 | 0.30 | 1.15 | 0.82 | ||||||||||||
|
Fourth Quarter
|
0.55 | 0.35 | 1.06 | 0.29 | ||||||||||||
The closing sales price of the Company’s common stock as reported on March 15, 2011, was $0.68 per share.
Holders:
As of March 15, 2011, there were approximately 870 holders of record of Company common stock. This does not include an indeterminate number of persons who hold our Common Stock in brokerage accounts and otherwise in ‘street name.’
Dividends:
Holders of common stock are entitled to receive such dividends as may be declared by the Company’s Board of Directors. The Company did not declare or pay dividends during its fiscal year ended December 31, 2010.
25
On November 2, 2009, and prior to the acquisition of Dillco, Aspen declared a cash dividend in the amount of $0.73 per share. The dividend was paid to stockholders of record on December 2, 2009. The distribution followed the final settlement of the sale of Aspen’s oil and natural gas assets to Venoco, Inc.
Decisions concerning dividend payments in the future will depend on income and cash requirements. However, in its agreements with Great Western Bank the Company represented that it would not pay any cash dividends on its common stock until its obligations to Great Western are satisfied. Furthermore, to the extent Enservco has any earnings, it will likely retain earnings to expand corporate operations and not use such earnings to pay dividends.
Securities Authorized for Issuance Under Equity Compensation Plans:
The following is provided with respect to compensation plans (including individual compensation arrangements) under which equity securities are authorized for issuance as of December 31, 2010:
|
Equity Compensation Plan Information
|
||||||||||||
|
Number of Securities
|
||||||||||||
|
Remaining Available
|
||||||||||||
|
Number of Securities
|
for Future Issuance
|
|||||||||||
|
to be Issued Upon
|
Weighted-Average
|
Under Equity
|
||||||||||
|
Exercise of
|
Exercise Price of
|
Compensation Plans
|
||||||||||
|
Outstanding Options,
|
Outstanding Options,
|
(Excluding Securities
|
||||||||||
|
Plan Category
|
Warrants, and Rights
|
Warrants, and Rights
|
Reflected in Column (a))
|
|||||||||
|
and Description
|
(a)
|
(b)
|
(c)
|
|||||||||
|
Equity Compensation Plans
|
||||||||||||
|
Approved by Security Holders
(1)
|
1,975,000 | $ | 0.49 | 1,525,000 | ||||||||
|
Equity Compensation Plans Not
|
||||||||||||
|
Approved by Security Holders
|
715,431 | (2) | 0.78 | - | ||||||||
|
Total
|
2,690,431 | $ | 0.57 | 1,525,000 | ||||||||
|
(1)
|
Represents options granted pursuant to the Company’s 2010 Stock Incentive Plan.
|
|
(2)
|
Consists of: (i) options to acquire 490,431 shares of Company common stock granted pursuant to Aspen’s 2008 Equity Plan; and (ii) warrants to acquire 225,000 shares of Company common stock exercisable at $0.49 per share.
|
26
Description of the 2008 Equity Plan
On February 27, 2008 Aspen’s Board of Directors adopted the 2008 Equity Plan (the “2008 Plan”). One million shares of common stock were initially reserved for the grant of stock options or issuance of stock bonuses under the 2008 Plan. The 2008 Plan was not approved by Aspen’s stockholders and therefore none of the options granted under the 2008 Plan qualify as incentive stock options under Section 422 of the Internal Revenue Code. The exercise period for options granted under the Plan did not exceed ten years from the date of grant. The 2008 Plan provides that an option may be exercised through the payment of cash, in accordance with the Plan’s cashless exercise provision, or in property or in a combination of cash, shares and property. On July 27, 2010, the 2008 Plan was terminated although persons holding vested options under the 2008 Plan will continue to hold those options in accordance with the terms of their contractual agreement(s). Thus, upon closing the Merger Transaction the Company assumed certain obligations with respect to the 2008 Plan.
Description of the 2010 Stock Incentive Plan
On July 27, 2010 the Company’s Board of Directors adopted the 2010 Stock Incentive Plan (the “2010 Plan”). The 2010 Plan permits the granting of equity-based awards to our directors, officers, employees, consultants, independent contractors and affiliates. Equity-based awards are intended to determined by a compensation committee (or, in the absence of a compensation committee, the Board of Directors and in either case referred to herein as the “Committee”) and are granted only in compliance with applicable laws and regulatory policy.
Although the adoption of the 2010 Plan was not contingent upon the Company receiving stockholder approval of the plan, the Company’s stockholders approved the adoption of the 2010 Plan on or about October 20, 2010. The stockholders’ approval of the 2010 Plan permits the issuance of options that qualify as Incentive Stock Options pursuant to Section 422 of the Internal Revenue Code of 1986, as amended (the “Code”).
Administration.
The Committee administers the 2010 Plan and has the full power and authority to determine when and to whom awards will be granted, and the type, amount, form of payment and other terms and conditions of each award, consistent with the provisions of the 2010 Plan. In addition, the Committee can specify whether, and under what circumstances, awards to be received under the 2010 Plan or amounts payable under such awards may be deferred automatically or at the election of either the holder of the award or the Committee. Subject to the provisions of the 2010 Plan, the Committee may amend or waive the terms and conditions, or accelerate the exercisability, of an outstanding award. The Committee has the authority to interpret the 2010 Plan and establish rules and regulations for the administration of the 2010 Plan.
The Committee may delegate its powers and duties under the 2010 Plan to one or more directors (including a director who is also an officer of the Company), except that it may not delegate its powers to grant awards to executive officers or directors who are subject to Section 16 of the 1934 Act, or to act in a way that would violate Section 162(m) of the Code. In addition, the Committee may authorize one or more Company officers to grant stock options under the 2010 Plan, provided that stock option awards made by those officers may not be made to executive officers or directors who are subject to Section 16 of the 1934 Act or subject to Section 162(m) of the Code. The Board may also exercise the powers of the Committee at any time, so long as its actions would not violate Section 162(m) of the Code.
27
Members of the Committee are not liable for actions or determinations made under the 2010 Plan if such actions or determinations are made in good faith.
Eligible Participants.
Any employee, officer, consultant, independent contractor or director providing services to the Company or any of its affiliates, who is selected by the Committee, is eligible to receive an award under the 2010 Plan.
Shares Available For Awards.
The aggregate number of shares of our common stock that may be issued through December 31, 2011 under all equity-based awards made under the 2010 Plan is 3,500,000 shares of common stock. Beginning on January 1, 2012 and on January 1 of each subsequent year that the 2010 Plan is in effect, the aggregate number of Shares that may be issued under the 2010 Plan shall be automatically adjusted to equal 15% of the Company’s issued and outstanding shares of common stock, calculated as of January 1 of the respective year. This aggregate amount is subject to further limitations, as follows:
|
▪
|
Through December 31, 2011, a maximum of 3,500,000 shares will be available for granting incentive stock options under the 2010 Plan, subject to the provisions of Section 422 or 424 of the Code or any successor provision;
|
|
|
▪
|
On January 1 of each subsequent year, a maximum of 15% of our issued and outstanding shares of common stock, calculated as of January 1 of the respective year, will be available for granting incentive stock options under the 2010 Plan, subject to the provisions of Section 422 or 424 of the Code or any successor provision; and
|
|
|
▪
|
The maximum number of shares that may be awarded under the 2010 Plan pursuant to grants of restricted stock, restricted stock units and stock awards will be 2,000,000.
|
The Committee may adjust the number of shares and share limits described above in the case of a stock dividend or other distribution, including a stock split, merger or other similar corporate transaction or event, in order to prevent dilution or enlargement of the benefits or potential benefits intended to be provided under the 2010 Plan.
Shares which are tendered for payment or which satisfy the tax withholding obligation with respect to an award become available for reissuance under the 2010 Plan. If an award is terminated without the issuance of any shares or if shares covered by an award are not purchased or are forfeited, the shares previously set aside for such award will be available for future awards under the 2010 Plan. If an award is payable only in cash and does not entitle the holder to receive or purchase shares, then the award will not be counted against the aggregate number of shares available under the 2010 Plan.
Types of Awards and Terms and Conditions
The 2010 Plan permits the granting of:
|
|
●
|
Stock options (including both incentive and non-qualified stock options);
|
|
|
●
|
Stock appreciation rights (“SARs”);
|
|
|
●
|
Restricted stock and restricted stock units;
|
|
|
●
|
Performance awards of cash, stock, other securities or property;
|
|
|
●
|
Other stock grants; and
|
|
|
●
|
Other stock-based awards.
|
28
Awards may be granted alone, in addition to, in combination with, or in substitution for, any other award granted under the 2010 Plan or any other compensation plan. Awards can be granted for no cash consideration or for any cash or other consideration as may be determined by the Committee or as required by applicable law. Awards may provide that upon the grant or exercise thereof, the holder will receive cash, shares of our common stock, other securities or property, or any combination of these in a single payment, installments or on a deferred basis. The exercise price per share under any stock option and the grant price of any SAR may not be less than the fair market value of our common stock on the date of grant of such option or SAR except to satisfy legal requirements of foreign jurisdictions or if the award is in substitution for an award previously granted by an entity acquired by the Company. Determinations of fair market value under the 2010 Plan will be made in accordance with methods and procedures established by the Committee.
Incentive stock options must expire no later than 10 years after the date of grant or, for persons who own more than 10% of the total voting power of all classes of stock, no later than five years after the date of grant. The term of all other awards shall be determined by the Committee.
Stock Options
. The holder of an option will be entitled to purchase a number of shares of our common stock at a specified exercise price during a specified time period, all as determined by the Committee. The option exercise price may be payable either in cash or, at the discretion of the Committee, in other securities or other property having a fair market value on the exercise date equal to the exercise price.
Stock Appreciation Rights
. The holder of a SAR is entitled to receive the excess of the fair market value (calculated as of the exercise date or, at the Committee’s discretion, as of any time during a specified period before or after the exercise date) of a specified number of shares of our common stock over the grant price of the SAR. SARs vest and become exercisable in accordance with a vesting schedule established by the Committee.
Restricted Stock and Restricted Stock Units
. The holder of restricted stock will own shares of our common stock subject to restrictions imposed by the Committee (including, for example, restrictions on the right to vote the restricted shares or to receive any dividends with respect to the shares) for a specified time period determined by the Committee. The holder of restricted stock units will have the right, subject to any restrictions imposed by the Committee, to receive shares of our common stock, or a cash payment equal to the fair market value of those shares, at some future date determined by the Committee.
Performance Awards
. The Committee may grant awards under the 2010 Plan that are intended to qualify as “performance-based compensation” within the meaning of Section 162(m) of the Code. A performance award may be payable in cash or stock and will be conditioned solely upon the achievement of one or more objective performance goals established by the Committee in
compliance with Section 162(m) of the Code. Subject to the terms of the 2010 Plan, the performance goals to be achieved during any performance period, the length of any performance period, the amount of any performance award granted, the amount of any payment or transfer to be made pursuant to any performance award and any other terms of and conditions of any performance award shall be determined by the Committee.
Stock Awards
. The Committee may grant unrestricted shares of our common stock, subject to terms and conditions determined by the Committee and the limitations in the 2010 Plan.
29
Other Stock-Based Awards
. The Committee is also authorized to grant other types of awards that are denominated or payable in, valued in whole or in part by reference to, or otherwise based on or related to our common stock, subject to terms and conditions determined by the Committee and the limitations in the 2010 Plan.
Duration, Termination and Amendment
. Unless discontinued or terminated by the Board, the 2010 Plan will expire on July 27, 2020. No awards may be made after that date. However, unless otherwise expressly provided in an applicable award agreement, any award granted under the 2010 Plan prior to expiration may extend beyond the expiration of the 2010 Plan through the award’s normal expiration date.
The Board may amend, alter, suspend, discontinue or terminate the 2010 Plan at any time, however, stockholder approval must be obtained for any action that would increase the number of shares of our common stock available under the 2010 Plan, increase the award limits under the 2010 Plan, permit awards of options or SARs at a price less than fair market value, permit re-pricing of options or SARs or cause Section 162(m) of the Code to become unavailable with respect to the 2010 Plan. Stockholder approval is also required for any action that requires stockholder approval under the rules and regulations of the Securities and Exchange Commission or any securities exchange or the Financial Industry Regulatory Authority that are applicable to the Company.
Prohibition on Re-pricing Awards
Without the approval of the Company’s stockholders, the Committee will not re-price, adjust or amend the exercise price of any options or the grant price of any SAR previously awarded, whether through amendment, cancellation and replacement grant or any other means, except in connection with a stock dividend or other distribution, including a stock split, merger or other similar corporate transaction or event, in order to prevent dilution or enlargement of the benefits, or potential benefits intended to be provided under the 2010 Plan.
Transferability of Awards
Unless otherwise provided by the Committee, awards under the 2010 Plan may only be transferred by will or by the laws of descent and distribution.
Federal Income Tax Consequences
The following is a summary of the principal U.S. federal income tax consequences generally applicable to awards under the 2010 Plan and applies to U.S. citizens and residents who receive awards under the 2010 Plan. Participants who are neither U.S. citizens nor residents but who
perform services in the United States may also be subject to U.S. federal income tax under some circumstances. In addition, former citizens or long-term residents of the United States may be subject to special expatriate tax rules, which are not addressed in this summary.
Grant of Options and SARs
. The grant of a stock option (either an incentive stock option or a non-qualified stock option) or SAR is not expected to result in any taxable income for the recipient.
Exercise of Incentive Stock Options
. The holder of an incentive stock option generally will have no taxable income upon exercising the option (except that an alternative minimum tax liability may arise). If stock is issued to the optionee pursuant to the exercise of an incentive stock option, and if no disqualifying disposition of such shares is made by such award holder within two years after the date of grant or within one year after the transfer of such shares to such award holder, then:
30
|
|
(1)
|
Upon the sale of such shares, any amount realized in excess of the exercise price will be taxed to such optionee as a long-term capital gain and any loss sustained will be a long-term capital loss, and
|
(2) We will not be entitled to a deduction for federal income tax purposes.
If the stock acquired upon the exercise of an incentive stock option is disposed of prior to the expiration of either holding period described above, generally:
|
|
(a)
|
The optionee will realize ordinary income in the year of disposition in an amount equal to the excess (if any) of the fair market value of such shares at exercise (or, if less, the amount realized on the disposition of such shares) over the exercise price paid for such shares, and
|
|
|
(b)
|
We will be entitled to deduct such amount for federal income tax purposes if the amount represents an ordinary and necessary business expense.
|
Any further gain (or loss) realized by the optionee will be taxed as short-term or long-term capital gain (or loss), as the case may be, and will not result in any deduction by us.
Exercise of Non-Qualified Stock Options and SARs
. Upon exercising a non-qualified stock option, the optionee must recognize ordinary income equal to the excess of the fair market value of the shares of our common stock acquired on the date of exercise over the exercise price, and we generally will be entitled at that time to an income tax deduction for the same amount. Upon exercising a SAR, the amount of any cash received and the fair market value on the exercise date of any shares of our common stock received are taxable to the recipient as ordinary income and generally are deductible by us.
Disposition of Acquired Shares.
The tax consequence upon a disposition of shares acquired through the exercise of an option or SAR will depend on how long the shares have been held and whether the shares were acquired by exercising an incentive stock option or by exercising a non-qualified stock option or SAR. Generally, there will be no tax consequence to us in connection with the disposition of shares acquired under an option or SAR, except that we may be entitled to an income tax deduction in the case of the disposition of shares acquired under an incentive stock option before the applicable incentive stock option holding periods set forth in the Internal Revenue Code have been satisfied.
For an award that is payable in shares of our common stock that are restricted as to transferability and subject to substantial risk of forfeiture, unless a special election is made pursuant to Section 83(b) of the Code, the holder of the award must recognize ordinary income equal to the excess of (x) the fair market value of the shares of our common stock received (determined as of the first time the shares became transferable or not subject to substantial risk of forfeiture, whichever occurs earlier) over (y) the amount (if any) paid for the shares of our common stock by the holder. The Company will be entitled at that time to a tax deduction for the same amount if and to the extent that amount satisfies general rules concerning deductibility.
31
Special Rules
. Special rules may apply in the case of individuals subject to Section 16(b) of the 1934 Act. In particular, unless a special election is made pursuant to Section 83(b) of the Code, shares of our common stock received pursuant to the exercise of an option or SAR may be treated as restricted as to transferability and subject to a substantial risk of forfeiture for a period of up to six months after the date of exercise. Accordingly, the amount of any ordinary income recognized, and the amount of the Company’s tax deduction, may be determined as of the end of such period.
Deductibility of Executive Compensation Under Code Section 162(m).
Section 162(m) of the Code generally limits to $1,000,000 the amount that a publicly-held corporation is allowed each year to deduct for the compensation paid to each of the corporation’s chief executive officer and the corporation’s other four most highly compensated executive officers. However, “qualified performance-based compensation” is not subject to the $1,000,000 deduction limit. In general, to qualify as performance-based compensation, the following requirements need to be satisfied:
|
|
(1)
|
Payments must be computed on the basis of an objective, performance-based compensation standard determined by a committee consisting solely of two or more “outside directors,”
|
|
|
(2)
|
The material terms under which the compensation is to be paid, including the business criteria upon which the performance goals are based, and a limit on the maximum bonus amount which may be paid to any participant with respect to any performance period, must be approved by a majority of the corporation’s stockholders, and
|
|
|
(3)
|
The Committee must certify that the applicable performance goals were satisfied before payment of any performance-based compensation, provided certification is not required for compensation attributable solely to the increase in the value of the Company’s stock.
|
The 2010 Plan has been designed to permit grants of options and SARs issued under the 2010 Plan to qualify under the performance-based compensation rules so that income attributable to the exercise of a non-qualified stock option or an SAR may be exempt from the $1,000,000 deduction limit. Grants of other Awards under the 2010 Plan may not qualify for this exemption. The 2010 Plan’s provisions are consistent in form with the performance-based compensation rules, so that (consistent with Treas. Reg. § 1.162-27(e)(4)(ii)(A)) if the committee that grants options or SARs consists exclusively of members of the Board of Directors of the Company who qualify as “outside directors,” and the exercise price (or deemed exercise price, with respect to SARs) is not less than the fair market value of the shares of common stock to which such grants relate, the compensation income arising on exercise of those options or SARs should qualify as performance-based
compensation which is deductible even if that income would be in excess of the otherwise applicable limits on deductible compensation income under Code Section 162(m).
Other Compensation Arrangements
On July 28, 2010, Enservco entered into an agreement with an investor relations firm and as part of the compensation paid pursuant to that agreement granted both principals of the firm a warrant to purchase 112,500 shares each of the Company’s common stock;
sum of warrants issued equaled 225,000 shares of common stock available for purchase
. The warrants are exercisable at $0.49 per share for a four year term. Each of the warrants may be exercised on a cash-less basis. The warrants also provide that subject to various conditions, the holders have piggy-back registration rights with respect to the shares of common stock that may be acquired upon the exercise of the warrants.
32
Recent Sales of Unregistered Securities
There were no sales of unregistered securities during the fiscal year ended December 31, 2010 or subsequently, that were not previously disclosed in reports filed by the Company with the Securities and Exchange Commission.
Smaller reporting companies are not required to provide the information required by this Item.
Cautionary Statement about Forward-Looking Statements
The management discussion and analysis and other portions of this report contain forward-looking statements (as such term is defined in Section 21E of the 1934 Act). These statements reflect our current expectations regarding our possible future results of operations, performance, and achievements. These forward-looking statements are made pursuant to the safe harbor provisions of the Private Securities Litigation Reform Act of 1995.
Wherever possible, we have tried to identify these forward-looking statements by using words such as “anticipate,” “believe,” “estimate,” “expect,” “plan,” “intend,” and similar expressions. These statements reflect our current beliefs and are based on information currently available to us. Accordingly, these statements are subject to certain risks, uncertainties, and contingencies, which could cause our actual results, performance, or achievements to differ materially from those expressed in, or implied by, such statements.
Although we believe that the expectations reflected in these forward-looking statements are reasonable, they do involve certain assumptions, risks and uncertainties. Our results could differ materially from those anticipated in these forward-looking statements as a result of certain factors, including, among others:
▪
future capital requirements and uncertainty of obtaining additional funding on terms acceptable to us;
|
|
▪
|
a decline in oil or natural gas production or oil or natural gas prices, the impact of price volatility in the oil and natural gas industries and the impact of general economic conditions on the demand for the services we offer to the oil and natural gas industries;
|
|
|
▪
|
activities of our competitors, many of whom have greater financial resources than we have;
|
33
|
|
▪
|
geographical diversity of our operations and the difficulties inherent in managing such geographically diverse operations;
|
|
|
▪
|
ongoing U.S. and global economic uncertainty;
|
|
|
▪
|
our ability to generate sufficient cash flows to repay our debt obligations;
|
|
|
▪
|
availability of borrowings under our credit facility;
|
|
|
▪
|
unanticipated increases in the cost of our operations;
|
|
|
▪
|
historical incurrence of losses;
|
|
|
▪
|
reliance on limited number of customers and creditworthiness of our customers;
|
|
|
▪
|
increases in interest rates and our failure to hedge against possible interest rate increases;
|
|
|
▪
|
our ability to retain key members of our senior management and key technical employees, and conflicts of interests with respect to our directors;
|
|
|
▪
|
our level of indebtedness;
|
|
|
▪
|
impact of environmental, health and safety, and other governmental regulations, and of current or pending legislation;
|
|
|
▪
|
effect of seasonal factors;
|
|
|
▪
|
further sales or issuances of common stock; and
|
|
|
▪
|
our common stock’s limited trading history.
|
Finally, our future results will depend upon various other risks and uncertainties, including, but not limited to, those detailed in our filings with the SEC and elsewhere in this Report. For additional information regarding risks and uncertainties, please read our filings with the SEC under the Exchange Act and the Securities Act. All forward-looking statements attributable to us or persons acting on our behalf are expressly qualified in their entirety by the cautionary statements in this paragraph and elsewhere in this Report. Other than as required under securities laws, we do not assume a duty to update these forward-looking statements, whether as a result of new information, subsequent events or circumstances, changes in expectations or otherwise.
Company Overview and Overview of the Information Presented
Aspen was incorporated under the laws of the State of Delaware on February 28, 1980 for the primary purpose of acquiring, exploring and developing oil and natural gas and other mineral properties. Historically, and through its fiscal year ended June 30, 2009, Aspen was engaged in a broad range of activities associated with the development of oil and natural gas reserves primarily in the Sacramento Valley in California, and in the East Poplar Field in Montana.
34
On June 30, 2009, Aspen disposed of all of its remaining oil and natural gas producing assets and as a result was no longer engaged in active business operations. On June 24, 2010, Aspen entered into an Agreement and Plan of Merger and Reorganization with Dillco Fluid Service, Inc. (“Dillco”) which set forth the terms by which Dillco became a wholly owned subsidiary of Aspen on July 27, 2010 (the “Merger Transaction”).
Aspen is now operating its business under the name “Enservco Corporation.” As such, throughout this report the terms the “Company” and/or “Enservco” are intended to refer to the company on a post Merger Transaction basis and as a whole, with respect to both historical and forward looking contexts.
On December 30, 2010, Aspen changed its name to “Enservco Corporation.” As such, throughout this report the terms the “Company” and/or “Enservco” are intended to refer to the company on a post Merger Transaction basis and as a whole, with respect to both historical and forward looking contexts. As a result of the Merger Transaction, the Company’s fiscal year was modified to be the calendar year as described below.
Enservco primarily conducts its business operations through two subsidiaries: Dillco and Heat Waves Hot Oil Service LLC (“Heat Waves”). However, certain assets utilized by Enservco in its business operations are owned by other subsidiary entities. Dillco and Heat Waves provide oil field services to the domestic onshore oil and natural gas industry. These services include pressure testing, hot oiling, acidizing, frac heating, freshwater and saltwater hauling, fluid disposal, frac tank rental, well site construction and other general oil field services. The Company currently operates in:
|
|
●
|
southern Kansas and northwestern Oklahoma,
|
|
|
●
|
northeastern Utah,
|
|
|
●
|
northern New Mexico,
|
|
|
●
|
southern Wyoming and Colorado (D-J Basin and Niobrara formation), and
|
|
|
●
|
northwestern West Virginia and southwest Pennsylvania in the Marcellus Shale region.
|
Heat Waves is currently exploring opportunities to provide services in the Bakken formation in North Dakota and the Eagle Ford formation in southwest and south central Texas.
Going forward the Company expects to continue to pursue its growth strategies of exploring additional acquisitions, potentially expanding the geographic areas in which it operates, and diversifying the products and services it provides to customers, as well as making further investments in its assets and equipment.
Accounting Treatment of the Merger
The merger by which Dillco became a wholly-owned subsidiary of Enservco was treated as a “reverse acquisition” for accounting purposes. In a reverse acquisition, although Aspen was considered to be the “legal acquirer” (that is, Aspen (now known as Enservco) survived as the parent corporation), Dillco was the “accounting acquirer” (that is because Dillco’s and its subsidiaries’ business was undeniably the more significant business). As a result, Dillco’s financial statements became the financial statements of the surviving company. Aspen’s financial condition is additive to Dillco’s financial statements for the period following the Merger Transaction.
35
Dillco’s fiscal year end is December 31, 2010 whereas prior to the Merger Transaction Aspen’s fiscal year end was June 30. Because Dillco was the accounting acquirer the Merger Transaction resulted in the Company’s fiscal year end being deemed to change to December 31. Thus, starting with its most recent Form 10-Q filed for the quarter ended September 30, 2010, the Company is now filing annual and quarterly reports based on the December 31 fiscal year end of Dillco rather than the former (pre-acquisition) June 30 fiscal year end of Aspen. Although not required to complete the change of the fiscal year, more than a majority of the Company’s stockholders approved that change (as well as a change to the Company’s tax year) by consent.
The financial statements included in this report are for Enservco’s year ended December 31, 2010 and 2009 and include Aspen’s financial statements only as a result of, and subsequent to, the Merger Transaction.
Discussion of Operations for the years ended December 31, 2010 and 2009
The following tables show the increases (decreases) for the periods noted. Please see information following the tables for management’s discussion of significant increases (decreases).
| Years Ended December 31, | ||||||||||||||||||||
| 2010 | % of Revenues | 2009 | % of Revenues | Increase (Decrease) | ||||||||||||||||
|
Revenues
|
$ | 18,641,286 | 100 | % | $ | 15,388,746 | 100 | % | $ | 3,252,540 | ||||||||||
|
Cost of Revenue
|
14,422,412 | 77 | % | 13,489,099 | 88 | % | 933,313 | |||||||||||||
|
Gross Profit
|
4,218,874 | 23 | % | 1,899,647 | 12 | % | 2,319,227 | |||||||||||||
|
Operating Expenses
|
||||||||||||||||||||
|
General and administrative expenses
|
2,540,859 | 14 | % | 1,486,124 | 10 | % | 1,054,735 | |||||||||||||
|
Depreciation and amortization
|
3,992,367 | 21 | % | 4,423,934 | 29 | % | (431,567 | ) | ||||||||||||
|
Total operating expenses
|
6,533,226 | 35 | % | 5,910,058 | 39 | % | 623,168 | |||||||||||||
|
Income (Loss) from Operations
|
(2,314,352 | ) | (12 | %) | (4,010,411 | ) | (26 | %) | 1,696,059 | |||||||||||
|
Other (Expense) Income
|
(457,501 | ) | (3 | %) | (912,171 | ) | (6 | %) | 454,670 | |||||||||||
|
Income (Loss) Before Income Tax (Expense) Benefit
|
(2,771,853 | ) | (15 | %) | (4,922,582 | ) | (32 | %) | 2,150,729 | |||||||||||
|
Income Tax (Expense) Benefit
|
926,188 | 5 | % | (972,882 | ) | (6 | %) | 1,899,070 | ||||||||||||
|
Net Income (Loss)
|
$ | (1,845,665 | ) | (10 | %) | $ | (5,895,464 | ) | (38 | %) | $ | 4,049,799 | ||||||||
| Income (Loss) Per Common Share (Basic and Diluted) | $ | (0.10 | ) | $ | (0.41 | ) | ||||||||||||||
| Weighted average number of common shares outstanding (used to calculate basic and diluted income (loss) per share) | 17,641,876 | 14,519,244 | ||||||||||||||||||
36
Enservco has determined that its business operations should be separated into three business segments for disclosure purposes. The following table sets forth revenue information for the Company’s three business segments operations during its 2009 and 2010 fiscal years:
|
FY 2010
|
FY 2009
|
|||||||
|
BY BUSINESS SEGMENT:
|
||||||||
|
Fluid Management
(1)
|
||||||||
|
Closed Locations
|
$ | 229,000 | $ | 592,000 | ||||
|
Continuing Locations
|
7,208,000 | 6,764,000 | ||||||
| 7,437,000 | 7,356,000 | |||||||
|
Well Enhancement Services
(2)
|
||||||||
|
Closed Locations
|
624,000 | 688,000 | ||||||
|
Continuing Locations
|
9,511,000 | 5,841,000 | ||||||
| 10,135,000 | 6,529,000 | |||||||
|
Construction and Roustabout Services
(3)
|
1,069,000 | 1,504,000 | ||||||
|
Total Revenues
|
$ | 18,641,000 | $ | 15,389,000 | ||||
|
Enservco has also determined that an understanding of the diversity of its operations by geography is important to an understanding of its business operations. Enservco only does business in the United States, but in what it believes are three geographically diverse regions. The following table sets forth revenue information for the Company’s three geographic regions during its 2009 and 2010 fiscal years:
|
||||||||
|
BY GEOGRAPHY:
|
||||||||
|
Eastern USA Region (4)
|
$ | 4,847,000 | $ | 50,000 | ||||
|
Rocky Mountain Region (6)
|
1,217,000 | 2,898,000 | ||||||
|
Central USA Region (5)
|
||||||||
|
Closed Locations
|
853,000 | 1,280,000 | ||||||
|
Continuing Locations
|
11,724,000 | 11,161,000 | ||||||
| 12,577,000 | 12,441,000 | |||||||
|
Total Revenues
|
$ | 18,641,000 | $ | 15,389,000 | ||||
Notes to tables:
|
|
(1)
|
Water hauling/disposal and frac tank rental.
|
|
|
(2)
|
Well enhancement services such as frac heating, acidizing, hot oil services, and pressure testing.
|
|
|
(3)
|
Well site construction services.
|
|
|
(4)
|
Consists of operations and services performed in Southwestern Pennsylvania and Northern West Virginia. Heat Waves began operations in this region in 2010.
|
|
|
(5)
|
Consists of Southwestern Kansas, Northwestern Oklahoma, Eastern Colorado and Northern New Mexico. Both Dillco and Heat Waves engage in business operations in this region.
|
|
|
(6)
|
Consists of Western Colorado and Northeastern Utah. Heat Waves is the only Company subsidiary operating in this region.
|
37
Revenues:
The approximately 20% increase in revenues in 2010 compared to the 2009 period was primarily a result of our closing marginal locations in 2010 and redeploying assets to initiate operations (fluid management and well enhancement) in the southern region of the Marcellus Shale formation (southwestern Pennsylvania and northern West Virginia) in December 2009. It should be noted that except for our location in the Rocky Mountain region and our Hugoton Basin location, revenues were up for all locations that we continue to operate. Management is optimistic that the Rocky Mountain region will rebound to previous levels due to new customers secured in the first quarter of 2011. The slight decline (6%) in water hauling revenues at our Hugoton basin location resulted from rate reductions implemented in 2009 by our competitors to capture market share. We matched these reduced prices which resulted in the Company successfully maintaining our market share and being awarded a new contract worth approximately $1 million for 2011.
The increase in revenue during the 2010 fiscal year would likely have been greater, however a decline in our well site construction services as a result of the continuing decline in drilling new wells near our Garden City, Kansas location where our construction equipment is located. We are investigating relocating the construction equipment to other basins where there is potentially more demand being generated by our customers or possibly selling the equipment.
We believe our operations in the Marcellus Shale region will continue to positively impact revenues in future months. Although the demand for certain of the services we provide in the Marcellus Shale region is seasonal, with higher demand during colder months, the Company believes demand for its water hauling services will not be as cyclical and to the extent improving economic conditions or other factors lead to an increase in oil and gas drilling operations, our water hauling operations may be increased as well. We also believe that our planned expansion of operations in the Niobrara in Wyoming and possible initiation of operations in the Bakken in North Dakota will have a positive impact on revenues.
Costs of Revenues and Gross Profit:
Gross profit for 2010 more than doubled from 2009. The primary reason for this improvement in profitability was the impact of high gross profit margins for the services we provided in the Marcellus Shale region.
In addition, the Company reduced the cost of revenues, as a percentage of revenues, and thereby increased gross profit by implementing cost controls during 2009 in response to the industry slowdown. The full impact of these cost controls was felt in 2010 as gross profit as a percentage of
revenues nearly doubled from 12.3% in 2009 to 22.6% in 2010. The most significant results of these cost controls were:
|
|
(1)
|
a reduction in labor costs due to policies enacted restricting overtime and unbillable “shop” time;
|
|
|
(2)
|
a decrease in worker’s compensation insurance premiums due to a decrease in our experience modification factor arising from an increased attention to worker safety and therefore a reduction in the number of accidents; and
|
|
|
(3)
|
a decrease in equipment insurance expenses resulting from renewing policies at lower rates.
|
38
The increase in profitability was partially offset by costs we incurred in establishing our operations in the Marcellus Shale region during our first two fiscal quarters of 2010 which included additional costs for site rental and from importing our frac heater operators from outside of Pennsylvania since we were not able to identify local drivers experienced in operating frac heaters. We have initiated a significant hiring and training program that will reduce our reliance on non-local drivers going forward.
General and Administrative Expenses:
Our general and administrative expenses increased significantly for the year ended December 2010 as compared to the same period in 2009. The increase in our general and administrative expenses contributed to the Company experiencing a net loss from operations of ($2,314,352) for fiscal 2010. This increase was primarily a result of expenses we directly or indirectly incurred in connection with the Merger Transaction and the costs incurred by the Company to assume and comply with obligations and activities associated with being a public company.
Approximately $425,000 of the increase is due to recognizing expense related to the granting of stock options and warrants to employees, members of the Board of Directors and our investor relations firm during the year. Another $350,000 of expenses is related to the Merger Transaction such as new D&O insurance premiums, fees paid to members of our Board of Directors (starting in the third quarter) and legal and accounting fees. An additional $100,000 of expenses is related to costs incurred to comply with SEC reporting obligations and associated other legal and accounting fees subsequent to the Merger Transaction. In addition, we incurred approximately $230,000 of additional salary, bonus, and benefit costs during the last two quarters of 2010 as a result of hiring of a new President/COO and a new Corporate Controller.
The increase in our general and administrative expenses was somewhat offset by the fact that the 2009 period included $125,000 of expense related to a workman’s compensation audit of prior years, whereas we did not incur similar expenses during 2010. Also during 2009, we recognized approximately $190,000 of bad debt expense as compared to approximately $90,000 during 2010. Historically we have had almost no bad debts but the industry’s economic problems of 2009 resulted in economic hardship for some of our customers. We recognized the bad debt expense once all collection efforts had been exhausted. Nevertheless, we anticipate that our general and administrative expenses will continue to increase in future years as we increase our operations and we continue to incur the costs of public company compliance.
Depreciation and Amortization:
Despite writing off the remaining value ($770,000) of a non-compete agreement in 2009 due to the death of the individual who was the party to the agreement, our depreciation and amortization expenses only decreased $400,000 in 2010 when compared to 2009 due to substantial property and equipment purchases.
39
Results of Operations:
Although we experienced a significant positive change in our gross profit for the year ended December 2010, the full impact of these improvements was not realized at the operating profit level, as the Company incurred a net loss for fiscal 2010 of $(1,845,665). This was primarily due to the significant increase in general and administrative expenses discussed above. We estimate that $550,000 of general and administrative expenses incurred in 2010 were one-time expenses during 2010 as they are related to warrants and grants issued to board members and our investor relations firm and costs associated with the Merger Transaction and certain restructuring leading up to the Merger Transaction, as well as the commencement of compliance with our reporting obligations. We do not believe that we will incur these expenses in future periods although it is likely that our general and administrative expenses will continue to increase as we expand our activities.
It should also be noted that because of the seasonality of our frac heating and hot oil business, the second and third quarters are historically our least profitable quarters, resulting in net operating losses for the majority of those months. We are attempting to address the seasonality of our operations through our increased water hauling capacity and our efforts to expand into other year-round service segments and basins with a longer heating season.
Income Taxes:
The increases in income tax benefit for both 2010 as compared to 2009 was primarily due to the benefit recognized from Aspen’s net operating loss realized in the Merger Transaction.
Adjusted EBITDA:
The following table sets forth a reconciliation from the Company’s Net Income (Loss) to Adjusted EBITDA:
|
Years Ended December 31,
|
|||||||||||||
|
2010
|
2009
|
Increase (Decrease)
|
|||||||||||
|
Net Income (Loss)
|
$ | (1,845,665 | ) | $ | (5,895,464 | ) | $ | 4,049,799 | |||||
|
Add Back (Deduct):
|
|||||||||||||
|
Interest Expense
|
728,241 | 699,125 | 29,116 | ||||||||||
|
Provision for income taxes
|
(926,188 | ) | 972,882 | (1,899,070 | ) | ||||||||
|
Depreciation and amortization
|
3,992,367 | 4,423,934 | (431,567 | ) | |||||||||
|
EBITDA
|
1,948,755 | 200,477 | 1,748,278 | ||||||||||
|
Add Back (Deduct):
|
|||||||||||||
|
Stock-based compensation
|
342,277 | - | 342,277 | ||||||||||
|
Loss on disposal of equipment
|
71,003 | 79,785 | (8,782 | ) | |||||||||
|
Unrealized derivative loss
|
- | 140,733 | (140,733 | ) | |||||||||
|
Gain on sale of investments
|
(188,186 | ) | - | (188,186 | ) | ||||||||
|
Interest and other income
|
(153,557 | ) | (7,472 | ) | (146,085 | ) | |||||||
|
Adjusted EBITDA*
|
$ | 2,020,292 | $ | 413,523 | $ | 1,606,769 | |||||||
*Note: See discussion to follow below for use of non-GAAP financial measurements.
40
Use of Non-GAAP Financial Measures:
Non-GAAP results are presented only as a supplement to the financial statements and for use within management’s discussion and analysis based on U.S. generally accepted accounting principles (GAAP). The non-GAAP financial information is provided to enhance the reader's understanding of the Company’s financial performance, but no non-GAAP measure should be considered in isolation or as a substitute for financial measures calculated in accordance with GAAP. Reconciliations of the most directly comparable GAAP measures to non-GAAP measures are provided within the schedules attached herein.
EBITDA is defined as net income plus or minus net interest plus taxes, depreciation and amortization. Adjusted EBITDA excludes from EBITDA stock-based compensation and, when appropriate, other items that management does not utilize in assessing the Company’s operating performance (see list of these items to follow below). None of these non-GAAP financial measures are recognized terms under GAAP and do not purport to be an alternative to net income as an indicator of operating performance or any other GAAP measure. Management uses these non-GAAP measures in its operational and financial decision-making, believing that it is useful to eliminate certain items in order to focus on what it deems to be a more reliable indicator of ongoing operating performance and the company’s ability to generate cash flow from operations. Management also believes that investors may find non-GAAP financial measures useful for the same reasons, although investors are cautioned that non-GAAP financial measures are not a substitute for GAAP disclosures.
All of the items included in the reconciliation from Net Income to EBITDA and from EBITDA to Adjusted EBITDA are either (i) non-cash items (e.g., depreciation, amortization of purchased intangibles, stock-based compensation, etc.) or (ii) items that management does not consider to be useful in assessing the Company’s operating performance (e.g., income taxes, gain on sale of investments, loss on disposal of assets, etc.). In the case of the non-cash items, management believes that investors can better assess the company’s operating performance if the measures are presented without such items because, unlike cash expenses, these adjustments do not affect the Company’s ability to generate free cash flow or invest in its business.
Because not all companies use identical calculations, the Company’s presentation of non-GAAP financial measures may not be comparable to other similarly titled measures of other companies. However, these measures can still be useful in evaluating the company’s performance against its peer companies because management believes the measures provide users with valuable insight into key components of GAAP financial disclosures.
Adjusted EBITDA increased by approximately $1.6 million from 2009 to 2010. The major components causing the positive change to Adjusted EBITDA were 1) an increase in net income (reduction in the net loss) due to the increase in Revenues, primarily due to redeploying our assets to
initiate operations in the southern region of the Marcellus Shale formation as discussed in the
Revenues
section above, and 2) a reduction in Cost of Revenues during the same period due to an improvement in profitability from the impact of high gross profit margins for our services the Marcellus Shale region and due to the implementation of cost controls during 2009 in response to the industry slowdown as discussed in the
Costs of Revenues & Gross Profit
section above.
41
Liquidity and Capital Resources:
The following table summarizes our statements of cash flows for the years ended December 31, 2010 and 2009 and (with the working capital table below) is important for understanding our liquidity:
|
Years Ended December 31,
|
|||||||||||||
|
2010
|
2009
|
Increase (Decrease)
|
|||||||||||
|
Net cash (used) provided in operating activities
|
$ | (222,717 | ) | $ | 2,054,190 | $ | (2,276,907 | ) | |||||
|
Net cash provided (used) in investing activities
|
1,316,769 | (1,988,026 | ) | 3,304,795 | |||||||||
|
Net cash provided (used) in financing activities
|
395,269 | (833,663 | ) | 1,228,932 | |||||||||
|
Net Increase (Decrease) in Cash and Cash Equivalents
|
1,489,321 | (767,499 | ) | 2,256,820 | |||||||||
|
Cash and Cash Equivalents, Beginning of Period
|
148,486 | 915,985 | (767,499 | ) | |||||||||
|
Cash and Cash Equivalents, End of Period
|
$ | 1,637,807 | $ | 148,486 | $ | 1,489,321 | |||||||
The following table sets forth a summary of certain aspects of our balance sheets at December 31, 2010 and 2009:
|
December 31,
|
December 31,
|
|||||||||||
|
2010
|
2009
|
Increase (Decrease)
|
||||||||||
|
Current Assets
|
$ | 7,375,954 | $ | 3,416,742 | $ | 3,959,212 | ||||||
|
Total Assets
|
$ | 22,620,876 | $ | 20,830,641 | $ | 1,790,235 | ||||||
|
Current Liabilities
|
$ | 6,223,475 | $ | 3,747,990 | $ | 2,475,485 | ||||||
|
Total Liabilities
|
$ | 18,015,432 | $ | 17,750,218 | $ | 265,214 | ||||||
|
Working Capital (Current Assets less: Current Liabilities)
|
$ | 1,152,479 | $ | (331,248 | ) | $ | 1,483,727 | |||||
|
Stockholders’ equity
|
$ | 4,605,444 | $ | 3,080,423 | $ | 1,525,021 | ||||||
We rely on cash generated from operations, borrowings under our credit facility and the cash that became available to us as a result of the Merger Transaction to satisfy our liquidity needs. Our ability to fund operating cash flow shortfalls, fund planned capital expenditures and make acquisitions will depend upon our future operating performance, and more broadly, on the availability of equity and debt financing, which will be affected by prevailing economic conditions in our industry and financial, business and other factors, some of which are beyond our control.
At December 31, 2010, we had approximately $1.0 million available under our asset based, revolving credit facility that could be used for working capital purposes and planned capital
expenditures. Our ability to fund our current operations and planned 2011 capital expenditures will primarily depend on our future operating performance, our ability to borrow from our primary lender, and our ability to raise capital. Based on our existing operating performance and our discussions with our primary lender regarding funding of future equipment fabrication, we believe we will have adequate funds to meet operational and capital expenditure needs well into fiscal year 2011, although we may need to raise additional capital during the second half of 2011 in order to meet our current forecasted capital expenditures. If our estimates turn out to be inaccurate, or we are unable to raise additional capital, the Company will likely adjust its expenditures and curtail certain of its planned operations.
42
The credit agreements evidencing our debt facilities contain standard covenants regarding leverage, minimum net worth, debt service coverage, additional debt limitations and loan to value ratios. The first measurement date for these covenants was December 31, 2010. The Company was able to meet all covenants at December 31, 2010 and the Company currently believes it will be able to satisfy these covenants through 2011.
As of December 31, 2010, our working capital increased from December 31, 2009 by approximately $1.5 million. There were various offsetting components contributing to the increase, several of which were related to the Merger Transaction. The major components causing the positive change to our working capital were –
Factors that increased our working capital -
|
|
1.
|
An increase of cash by $1.0 million due to a draw on the new equipment loan facility with our primary lender which was entered into in order to fund capital expenditures in late 2010 and early 2011 (the accompanying increase in our debt is reflected on our balance sheet as a long term liability);
|
|
|
2.
|
An increase in cash of approximately $490,000 primarily due to cash received in the Merger Transaction;
|
|
|
3.
|
An increase in accounts receivable of $2.0 million due primarily to the revenues earned from our heating and water hauling operations initiated in the Marcellus Shale region in late 2010;
|
|
|
4.
|
An increase of $320,000 in prepaid expenses and other currents assets resulting primarily from public company stocks received in the Merger Transaction which had a fair value of approximately $300,000 at December 31, 2010;
|
|
|
5.
|
An increase in income taxes receivable of approximately $250,000 due to the tax provision recorded for December 31, 2010; and
|
|
|
6.
|
A decrease in the outstanding balance on the revolving line of credit of approximately $300,000.
|
Factors that decreased our working capital -
| 1. |
An increase in accounts payable of approximately $650,000 due to the timing of expenses incurred during the beginning of the heating season (e.g. propane, diesel, travel, and other cost of goods and admin expenses in late 2010);
|
|
| 2. |
An increase in accrued expenses of approximately $150,000 due to a) the accrual of the 2011 - 2011 manager and hourly bonus plans, which was enacted November 2010 of approximately $40,000, b) accrued interest on the subordinated debt of approximately $50,000, and c) an increase in accrued payroll and vacation of approximately $60,000 due to timing of year-end and additional employees hired in the second half of 2010; and
|
|
| 3. |
An increase in the current portion of long-term debt of $2.0 million due to a) approximately $200,000 for the current portion of long-term debt associated with the $1.0 million draw on the equipment loan, and b) an increase of approximately $1.9 million in the current portion of long-term debt as a result of principal that will become due beginning in July of 2011 on the Company’s $9.1 million term loan with our primary lender. (There were no current maturities at December 31, 2009 on this term loan as payments are interest only until June 2, 2011. Beginning July 2011, fixed monthly payments for this term loan begin and a one-time $1 million dollar pay-down is required.)
|
43
Investing and Financing Activities:
We have kept our capital expenditures at the same levels for 2009 and 2010 with only $2.2 million in capital expenditures, not including capital leases of approximately $455,000, during the entire year in 2010. In order to fund our capital expenditures with other investing activities, we sold and disposed of obsolete or retired trucks and equipment through several transactions during 2010. The proceeds from these sales were approximately $820,000. Thus the relative increase in cash used for investing activities for 2010 as compared to the same period of 2009 was due primarily to these sales.
As of December 31, 2010 we had outstanding purchase orders of approximately $750,000 for heating and other units to meet the demand of our customers in the Marcellus Shale region. We expect to purchase most of this equipment in the first quarter of 2011. At this time we have no commitments for additional expenditures. However, we may decide to purchase some additional equipment in 2011 provided we have the resources to do so and it is economically feasible.
We experienced three major events in 2010 that had significant impacts on our investing activities. The first two events were 1) a refinancing of a majority of our debt (approximately $10.5 million) in our second fiscal quarter, and 2) the issuance of a new equipment loan agreement from our primary lending institution ($1.0 million). See Note 15 and Note 8 to the Consolidated Financial Statements above for further details of these events. The third major event was the Merger Transaction in our third fiscal quarter (see “Company Overview and Overview of the Information Presented” above) that provided approximately $3 million in net working capital.
Going forward, in 2011 the Company hopes to expand its business operations, including by potentially expanding its operations into new regions of the country, acquiring additional equipment and to increase the volume of services we currently offer, expanding the services if offers to its customers, and/or engaging in strategic transactions with companies that offer services that are similar or complimentary to those that the Company offers. Management has taken various preliminary steps to explore certain of these activities. To fully implement certain of these activities the Company likely will need to raise additional capital or borrow funds from its existing lender(s) or from other third parties. The Company believes that it can utilize cash flows, its existing line of credit, and remaining equipment and other loan balances to finance its plans to expand its business operations, however, should the Company desire to engage in certain strategic transactions or other significant expansions of its business operations it will likely have to obtain outside financing. There can be no assurance that financing will be available to the Company on reasonable terms, if at all.
General Terms of the Term Loan, Equipment Loan, and Line of Credit.
The terms of the Term Loan include a provision of interest-only payments until June 2, 2011. The first principal payment of $1,000,000 is due on June 2, 2011 with the balance being amortized by monthly principal and interest payments of $188,700 thru May 2, 2015. Finally, a balloon payment of the remaining unpaid principal balance is due on June 2, 2015.
The Line of Credit is due on June 2, 2011 unless renewed on a year-to-year basis.
44
The terms of the Equipment Loan include two consecutive interest only payments, beginning 12/23/2010, forty-seven monthly consecutive principal and interest payments of $23,291, beginning 2/23/2011, and one final principal and interest payment of $23,316 due on 1/23/2015.
The loans accrue interest at the variable rate of Prime plus 1% per annum with a 5.5% floor and are guaranteed by the Company and all of its subsidiaries and by Mr. Herman and his wife who are majority stockholders of Enservco. Additionally, the Term Loan and Line of Credit are secured by substantially all of Dillco’s and Heat Waves’ equipment and accounts receivable. The Equipment Loan is secured by the real property assets owned by the Company and its subsidiary entities as purchased with the funds of the equipment loan.
The loans contain various financial covenants that the Company is required to meet including maximum leverage ratios, minimum net worth and minimum debt service coverage. The loans also restrict the Company’s ability to incur additional debt. Management currently believes that the Company will be able to meet these covenants for the immediate future; however, the Company’s ability to continue to meet these financial covenants will ultimately be dependent on its results of operations. The loan agreements also contain cross default provisions such that should Mr. Herman default on any of the other debt he has with the bank, the bank could declare Dillco’s loans in default.
Long-term Commitments and Obligations
The Company’s long-term commitments and obligations as of December 31, 2010 consisted of the Term Loan, the Line of Credit, the Equipment Loan, as well as certain capital and operating leases, and excluded related party subordinated debt of $1.7 million. Amounts due under those commitments and obligations are summarized below. Although these obligations are not obligations of Enservco itself, as of the date of this report they are obligations and commitments of the Company on a consolidated basis and may affect the Company’s liquidity and financial obligations going forward.
Long-term debt and line of credit:
|
Year Ended December 31,
|
||||
|
2011
|
$ | 3,107,122 | ||
|
2012
|
2,818,222 | |||
|
2013
|
2,372,529 | |||
|
2014
|
2,435,985 | |||
|
2015
|
1,030,939 | |||
|
Thereafter
|
- | |||
|
Total
|
$ | 11,764,797 | ||
Operating Leases:
| Year Ended December 31, | ||||
| 2011 | $ | 168,900 | ||
| 2012 | 64,000 | |||
| 2013 | 27,500 | |||
| Total | $ | 260,400 | ||
`
45
Capital Leases:
|
Y
ear Ended December 31,
|
||||
|
2011
|
$ | 200,173 | ||
|
2012
|
171,332 | |||
|
2013
|
63,484 | |||
|
Total
|
$ | 434,989 | ||
The Company expects to be able to meet its long-term capital commitments through the use of its existing line of credit and anticipated positive cash flow from operations.
Off-balance Sheet Arrangements
The Company had no significant off-balance sheet arrangements that have or are reasonably likely to have a current or future effect on our financial condition, changes in financial condition, revenues or expenses, results of operations, liquidity, capital expenditures or capital resources that are material to our stockholders.
Critical Accounting Policies
The preparation of financial statements in conformity with U. S. generally accepted accounting principles requires management to make a variety of estimates and assumptions that affect (i) the reported amounts of assets and liabilities and disclosure of contingent assets and liabilities as of the date of the financial statements. and (ii) the reported amounts of revenues and expenses during the reporting periods covered by the financial statements.
Our management routinely makes judgments and estimates about the effect of matters that are inherently uncertain. As the number of variables and assumptions affecting the future resolution of the uncertainties increase, these judgments become even more subjective and complex. Although we believe that our estimates and assumptions are reasonable, actual results may differ significantly from these estimates. Changes in estimates and assumptions based upon actual results may have a material impact on our results of operation and/or financial condition. Our significant accounting policies are disclosed in Note 2 to the Financial Statements included in this Form 10-K.
While all of the significant accounting policies are important to the Company’s financial statements, the following accounting policies and the estimates derived there from have been identified as being critical:
Accounts Receivable.
Accounts receivable are stated at the amount billed to customers. The Company provides a reserve for doubtful accounts based on a review of outstanding receivables, historical collection information and existing economic conditions. The provision for uncollectible amounts is continually reviewed and adjusted to maintain the allowance at a level considered adequate to cover future losses. The allowance is management's best estimate of uncollectible amounts and is determined based on historical performance that is tracked by the Company on an ongoing basis. The losses ultimately incurred could differ materially in the near term from the amounts estimated in determining the allowance.
46
Property and Equipment.
Property and equipment consists of
(1) Trucks, trailers and pickups;
(2) Trucks that are in various stages of fabrication;
|
|
(3)
|
Real property which includes land and buildings used for office and shop facilities and wells used for the disposal of water; and
|
|
|
(4)
|
Other equipment such as tools used for maintaining and repairing vehicles, office furniture and fixtures, and computer equipment.
|
Property and equipment is stated at cost less accumulated depreciation. The Company charges repairs and maintenance against income when incurred and capitalizes renewals and betterments, which extend the remaining useful life or expand the capacity of the assets. Depreciation is recorded on a straight-line basis over estimated useful lives of 5 to 30 years.
Long-Lived Assets.
The Company reviews its long-lived assets for impairment whenever events or changes in circumstances indicate that the carrying amount of the asset may not be recovered. The Company looks primarily to the discounted future cash flows in its assessment of whether or not long-lived assets have been impaired. No impairments were recorded during the year ended December 31, 2010 or 2009.
Marketable Securities
.
The Company determines the appropriate classification of its investments in debt and equity securities at the time of purchase and re-evaluates such determinations at each balance sheet date. Debt securities are classified as held to maturity when the Company has the positive intent and ability to hold the securities to maturity. Debt securities for which the Company does not have the intent or ability to hold to maturity are classified as available for sale. Held-to-maturity securities are recorded as either short term or long term on the Balance Sheet, based on contractual maturity date and are stated at amortized cost. Marketable securities that are bought and held principally for the purpose of selling them in the near term are classified as trading securities and are reported at fair value, with unrealized gains and losses recognized in earnings, and are classified on the balance sheet as either short term or long term, based on contractual maturity date and are stated at amortized cost. Debt and marketable equity securities not classified as held to maturity or as trading, are classified as available for sale, and are carried at fair market value, with
the unrealized gains and losses, net of tax, included in the determination of comprehensive income and reported in stockholders’ equity, and are classified as current assets on the balance sheet.
The fair value of substantially all securities is determined by quoted market prices. The estimated fair value of securities for which there are no quoted market prices is based on similar types of securities that are traded in the market.
Income Taxes.
The Company’s subsidiaries, with the exception of Dillco (which is a C Corporation subject to federal and state income taxes), are limited liability companies and prior to January 1, 2010 were not subject to federal or state income taxes. Therefore, no provision or liability for 2009 income taxes has been included in the accompanying financial statements, except for income taxes relating to the financial statements of Dillco.
47
The Company recognizes deferred tax liabilities and assets (Note 11) based on the differences between the tax basis of assets and liabilities and their reported amounts in the financial statements that will result in taxable or deductible amounts in future years. Deferred tax assets and liabilities are measured using enacted tax rates expected to apply to taxable income in the years in which those temporary differences are expected to be recovered or settled. The effect of a change in tax rates on deferred tax assets and liabilities will be recognized in income in the period that includes the enactment date.
Effective January 1, 2009, the Company accounts for any uncertainty in income taxes by recognizing the tax benefit from an uncertain tax position only if it is more likely than not that the tax position will be sustained on examination by the taxing authorities, based on the technical merits of the position. The Company measures the tax benefits recognized in the financial statements from such a position based on the largest benefit that has a greater than 50% likelihood of being realized upon ultimate resolution. The application of income tax law is inherently complex. Laws and regulations in this area are voluminous and are often ambiguous. As such, the Company is required to make many subjective assumptions and judgments regarding income tax exposures. Interpretations of and guidance surrounding income tax law and regulations change over time and may result in changes to the Company’s subjective assumptions and judgments which can materially affect amounts recognized in the consolidate balance sheets and consolidated statements of income. The result of the reassessment of the Company’s tax positions did not have an impact on the consolidated financial statements.
When accounting for uncertainty in income taxes for those entities electing to be treated as limited liability companies for income tax purposes, if taxing authorities were to disallow any tax positions taken by the Company, the additional income taxes, if any, would be imposed on the member rather than the Company. Accordingly, there would be no effect on the Company’s financial statements.
Interest and penalties associated with tax positions are recorded in the period assessed as general and administrative expenses. No interest or penalties have been assessed as of December 31, 2009 and 2008. The Company’s income tax returns for tax years subject to examination by tax authorities include 2005 and 2006 through the current period for state and federal tax reporting purposes, respectively.
Not required.
The information required by this Item begins on page
71
of
Part III of this report on Form 10-K and is incorporated into this part by reference.
48
The following disclosure is with respect to not only the Company, but also with respect to Aspen and the Company’s subsidiary entities.
1.
Eide Bailly / Ehrhardt Keefe Steiner & Hottman PC
On July 27, 2010, Enservco’s Board of Directors informed Eide Bailly LLP (“Eide Bailly”) that it had dismissed Eide Bailly as the Company’s independent registered public accounting firm effective immediately. Eide Bailly served as the independent registered public accounting firm of Aspen. The dismissal of Eide Bailly was solely the result of the Merger Transaction as the Company believed that it was appropriate to appoint an accounting firm that had performed an audit of Dillco and was generally familiar with Dillco and its related entities and operations.
Also on July 27, 2010, the Board of Directors informed Ehrhardt Keefe Steiner & Hottman PC (EKS&H) certified public accountants, that such firm was appointed as the Company’s independent registered accounting firm effective on that same date. EKS&H was retained by Dillco to audit its 2009 and 2008 financial statements that were filed with the Company’s Current Report on Form 8-K filed on July 27, 2010. However, Enservco had not previously consulted EKS&H with regard to any matters including the application of accounting principles to a specified transaction, or an audit opinion that might be rendered with respect to the Company’s financial statements or any matter that was the subject of a disagreement or a reportable event.
Eide Bailly provided a report on Aspen’s financial statements for its fiscal years ended June 30, 2008 and 2009 and neither report contained an adverse opinion or disclaimer of opinion, nor was it modified as to uncertainty, audit scope, or accounting principles.
During Aspen’s fiscal year’s ended June 30, 2008 and June 30, 2009 and subsequently, there were no disagreements with Eide Bailly on any matter of accounting principles, practices, financial statement disclosure, or auditing scope or procedure which if not resolved to Eide Bailly’s satisfaction would have caused Eide Bailly to make reference to the subject matter of the disagreement in connection with its principal accounting report on the financial statements for Aspen’s fiscal year ended June 30, 2008 and June 30, 2009, or any subsequent report.
2.
Stockman Kast Ryan & Company
Prior to commencing discussions regarding the Merger Transaction, Dillco had engaged Stockman Kast Ryan & Co. (“Stockman Kast”) to audit its fiscal 2008 financial statements. Prior to issuance of the audit report, Dillco reached a conclusion that it intended to merge with a public company subject to the reporting requirements of the Securities Exchange Act of 1934, as amended. Stockman Kast is not registered with the Public Company Accounting Oversight Board, a requirement for a reporting company’s audit and therefore Dillco informed Stockman Kast that it was dismissed as Dillco’s independent registered public accounting firm. As such Stockman Kast has not provided any report on Dillco’s financial statements and thus no Stockman Kast report has contained an adverse opinion or disclaimer of opinion, nor was it modified as to uncertainty, audit scope, or accounting principles. There were no disagreements with Stockman Kast on any matter of accounting principles, practices, financial statement disclosure, or auditing scope or procedure.
49
Disclosure Controls and Procedures.
Disclosure controls and procedures are controls and other procedures that are designed to ensure that information required to be disclosed in our reports filed or submitted under the 1934 Act is recorded, processed, summarized and reported, within the time periods specified in the Securities and Exchange Commission’s rules and forms. Disclosure controls and procedures include, without limitation, controls and procedures designed to ensure that information required to be disclosed in our reports filed under the 1934 Act is accumulated and communicated to management, including our principal executive officer and our principal financial officer, as appropriate, to allow timely decisions regarding required disclosure.
Our management, under the direction of our Chief Executive Officer (who is our principal executive officer), and Chief Financial Officer (who is our principal accounting officer) has evaluated the effectiveness of our disclosure controls and procedures as required by 1934 Act Rule 13a-15(b) as of December 31, 2010 (the end of the period covered by this report). Based on that evaluation, our principal executive officer and our principal accounting officer concluded that these disclosure controls and procedures were effective as of such date.
Internal Control Over Financial Reporting
Our management is also responsible for establishing internal control over financial reporting (“ICFR”) as defined in Rules 13a-15(f) and 15d-15(f) under the 1934 Act. Our ICFR are intended to be designed to provide reasonable assurance regarding the reliability of financial reporting and the preparation of financial statements for external purposes in accordance with U.S. generally accepted accounting principles. Our ICFR are expected to include those policies and procedures that management believes are necessary that:
|
|
(1)
|
Pertain to the maintenance of records that, in reasonable detail, accurately and fairly reflect the transactions and dispositions of the assets of the Company;
|
|
|
(2)
|
Provide reasonable assurance that transactions are recorded as necessary to permit preparation of financial statements in accordance with generally accepted accounting principles, and that receipts and expenditures of the Company are being made only in accordance with authorizations of management and our directors; and
|
|
|
(3)
|
Provide reasonable assurance regarding prevention or timely detection of unauthorized acquisition, use or disposition of the Company’s assets that could have a material effect on the financial statements.
|
Management recognizes that there are inherent limitations in the effectiveness of any system of internal control, and accordingly, even effective internal control can provide only reasonable assurance with respect of financial statement preparation and may not prevent or detect misstatements. In addition, effective internal control at a point in time may become ineffective in future periods because of changes in conditions or due to deterioration in the degree of compliance with our established policies and procedures.
As of December 31, 2010, management assessed the effectiveness of the Company’s ICFR based on the criteria for effective ICFR established in Internal Control--Integrated Framework issued by the Committee of Sponsoring Organizations of the Treadway Commission (COSO) and SEC guidance on conducting such assessments by smaller reporting companies and non-accelerated filers. Based on that assessment, management concluded that, during the period covered by this report, such internal controls and procedures were effective as of December 31, 2010.
50
This Annual Report does not include an attestation report of our independent registered public accounting firm regarding internal control over financial reporting due to the permanent exemption from such requirement for smaller reporting companies.
There were no changes in our internal control over financial reporting during the quarter ended December 31, 2010, that have materially affected, or are reasonably likely to materially affect, our internal control over financial reporting.
None
Identification of Directors and Executive Officers:
As of March 15, 2011, the names, titles, and ages of the members of the Company’s Board of Directors and its executive officers are as set forth in the below table.
In the Merger Agreement, Aspen agreed to appoint two persons designated by Dillco to the Board of Directors – being Messrs. Herman and Laheney. Except for the Merger Agreement, there was no agreement or understanding between Company and any director or executive officer pursuant to which he was selected as an officer or director.
|
Name
|
Age
|
Position
|
|
Michael D. Herman
|
53
|
Chief Executive Officer, & Chairman of the Board of Directors
|
|
Rick D. Kasch
|
60
|
Chief Financial Officer, Executive Vice President, and Treasurer
|
|
Bob Maughmer
|
42
|
President and Chief Operating Officer
|
|
R.V. Bailey
|
77
|
Director
|
|
Kevan B. Hensman
|
54
|
Director
|
|
Gerard Laheney
|
73
|
Director
|
51
Michael D. Herman
. Mr. Herman was appointed as the Company’s Chief Executive Officer, President and as Chairman of the Board of Directors on July 27, 2010. On August 23, 2010 he ceased serving as President. Mr. Herman has served as the Chairman and control person of Dillco since December 2007 and Heat Waves since March 2006. Since 2005, Mr. Herman has served as the Chairman of Pyramid Oil Company (NYSE Amex: PDO), a California corporation involved in acquiring and developing oil and natural gas wells. Mr. Herman was the Chairman and owner of Key Food Ingredients LLC (“Key Food”) from January 1, 2005 until October, 2007. Key Food supplies dehydrated vegetables from its factory in Qingdao, China to customers worldwide. Mr. Herman was Chairman and owner of Telematrix, Inc. from October 1992 until December 1998, when that company was sold to a major hospitality company, and he repurchased a majority ownership interest in December 2004 and held that majority ownership interest until April 2006. Telematrix, Inc. designs and distributes communications products and telephones to hospitality and business customers globally. From November 2003 until February 2005, Mr. Herman was Chairman and majority stockholder of Ft. Lauderdale based Sunair Electronics but chose not to stand for re-election as a director in February 2006. Sunair Electronics is engaged in the design, manufacture and sale of high frequency communications equipment for long-range voice and data applications.
Rick D. Kasch
. Mr. Kasch was appointed as the Company’s Executive Vice President and Chief Financial Officer on July 27, 2010. Mr. Kasch served as the principal financial officer of the Company’s predecessor (Enservco LLC) since its inception in May 2007. Mr. Kasch also served as the principal financial officer, Secretary and Treasurer of Dillco since December 2007. Further, he has served as a manager and the principal financial officer for Heat Waves since March 2006. Since 2004, Mr. Kasch has also served as the Chief Financial Officer of Key Food Ingredients LLC, a company that distributes dehydrated vegetables. Additionally, Mr. Kasch has served as the Chief Financial Officer for various other companies, including software development companies and internet based companies. Mr. Kasch does not serve as a director of any public companies. Mr. Kasch received a BBA - Accounting degree from the University of South Dakota. Mr. Kasch is a CPA but does not hold an active license.
Bob Maughmer
. Mr. Maughmer was appointed as the Company’s President and Chief Operating Officer on August 23, 2010. Mr. Maughmer has 19 years of experience in the oil and gas industry, and his experience has focused primarily on drilling and completion operations. Prior to joining the Company, Mr. Maughmer served as a sales and technology manager for Superior Well Services, Inc. (NASDAQ SWSI) - a company that provides oilfield services in various oil and gas producing regions within the United States. Mr. Maughmer joined Superior as a result of its 2008
acquisition of Diamondback Energy Services, where Mr. Maughmer had been vice president of technology and business development from 2004 to 2006 and was actively involved in the creation and management of a fracture stimulation division. Prior to working at Superior from 2002 to 2006 Mr. Maughmer worked at BJ Services Company where he held the positions of technology manager and senior district engineer with BJ Services’ international divisions. Mr. Maughmer worked at Halliburton Energy Services from 1991 to 2002 where he held positions as account manager, technical advisor and operations engineer.
R. V. Bailey
. Mr. Bailey has served as a Company director since the completion of the Merger Transaction on July 27, 2010. Additionally, he previously served as an officer and director of Aspen from its inception, including as Aspen’s Chief Executive Officer from January 2008 until July 27, 2010. Mr. Bailey obtained a Bachelor of Science degree in Geology from the University of Wyoming in 1956. He has approximately 45 years experience in exploration and development of mineral deposits, primarily gold, uranium, coal, and oil and natural gas. His experience includes basic conception and execution of mineral exploration projects. Mr. Bailey is a member of several professional societies, including the Society for Mining and Exploration, the Society of Economic Geologists and the American Association of Petroleum Geologists, and has written a number of papers concerning mineral deposits in the United States. He is the co-author of a 542-page text published in 1977 concerning applied exploration for mineral deposits. Mr. Bailey is not a director of any other public companies.
52
Kevan B. Hensman
. Mr. Hensman has served as a director since the completion of the Merger Transaction on July 27, 2010. He served on Aspen’s Board starting on September 11, 2006, and served as Aspen’s Chief Financial Officer from January 2008 until July 27, 2010. Since April 2002, except for a one-year position as manager of Paramount Citrus Association, Mr. Hensman has served as an analyst for Truxtun Radiology Medical Group, LP with the duties of providing financial analysis; performing annual projects; and assisting the practice administrator in performing various duties and assignments. Additionally, Mr. Hensman has extensive experience in the oil and natural gas industry. From November 1997 to May 1999 Mr. Hensman served as the planner/natural gas analyst for Texaco Exploration and Production Company. Mr. Hensman served as the supervisor of fuel supply and acquisition analyst from February 1991 to October 1997 for Santa Fe Energy/Monterey Resources. Mr. Hensman received a Masters of Business Administration from the University of Phoenix Bakersfield in January 2011. In 1999, Mr. Hensman received a Bachelor of Science degree in finance from California State University Bakersfield (CSUB). Mr. Hensman is not a director of any other public company.
Gerard P. Laheney
. Mr. Laheney was appointed to the Company’s Board of Directors on July 27, 2010. Mr. Laheney has approximately twenty-seven years of experience in the financial industry as he has long served as a financial adviser and asset manager. Since 1993, Mr. Laheney has served as the President of Aegis Investment Management Company, an investment advisory firm specializing in global investment portfolio management. Mr. Laheney previously served in other positions in the financial industry, including serving as a Vice President of Dean Witter Reynolds from April 1990 to December 1993. Mr. Laheney currently serves on the Board of Directors of Reading International, Inc. (NASDAQ RDI). Further, Mr. Laheney previously served on the Board of Directors of Sunair Electronics.
Board of Directors – Composition
.
The Company’s Board of Directors seeks to ensure that it is composed of members whose particular experience, qualifications, attributes, and skills, when taken together, will allow the Board of Directors to satisfy its oversight obligations effectively. The Company does not currently have a separate nominating (or similar) committee as given the Company’s small size the Company does not yet believe such a committee is necessary. However, as the Company grows and considers trying to position itself for a potential listing on a stock exchange, it may consider establishing a separate nominating committee. Currently the Board of Directors as a whole is in charge of identifying and appointing appropriate persons to add to the Board of Directors when necessary. In identifying Board candidates it is the Board’s goal to identify persons who it believes have appropriate expertise and experience to contribute to the oversight of a company of the Company’s nature while also reviewing other appropriate factors.
The Company believes that each of the persons that now comprise its Board of Directors have the experience, qualifications, attributes and skills when taken as a whole will enable the Board of Directors to satisfy its oversight responsibilities effectively. With regard to the current members of the Board of Directors the following factors were among those considered that led to the Board’s conclusion that each would make valuable contributions to the Board:
53
|
|
§
|
Michael Herman
: Mr. Herman has been actively involved with the Company’s business operations and strategy, for several years and has a significant amount of knowledge regarding its current and contemplated business operations. Further, he has been active in the oil and natural gas producing and servicing business since the mid-1980’s and has a broad range of experience in business outside of the oil and natural gas industry that the Board believes is valuable in forming the Company’s business strategy and identifying new business opportunities.
|
|
|
§
|
R.V. Bailey
: Mr. Bailey has a significant amount of experience in the natural resource exploration and development arena, including his experience in the oil and natural gas sectors. Additionally, Mr. Bailey was a founding member of Aspen and gained a significant amount of experience with respect to the stockholder relations and the administration of companies subject to the reporting requirements of the Securities Exchange Act of 1934. Mr. Bailey is also familiar with a significant number of the Company’s larger pre-Merger Transaction stockholders.
|
|
|
§
|
Kevan B. Hensman
: Mr. Hensman has experience not only in the oil and natural gas industry but also with regard to financial analysis and accounting. The Board believes that given his varied background and experiences that are relevant to a company operating in the Company’s industry, Mr. Hensman makes a valuable member of the Board of Directors.
|
|
|
§
|
Gerard P. Laheney
: Mr. Laheney has a significant amount of experience within the asset management industry and with the capital markets. The Board believes Mr. Laheney’s experience and knowledge with the capital markets are valuable to the Board of Directors as a whole.
|
Significant Employees:
Although not an executive officer or director of the Company, Austin Peitz has been and is expected to be, a significant employee of the Company. Mr. Peitz has worked for Heat Waves since October 1999 and has been involved in nearly all aspects of operations since that time. Currently, Mr. Peitz is the Director of Operations for Heat Waves and is in charge of overseeing and coordinating field operations.
Involvement in Certain Legal Proceedings:
During the past ten years none of the persons serving as executive officers and/or directors of the Company has been the subject matter of any of the following legal proceedings that are required to be disclosed pursuant to Item 401(f) of Regulation S-K including: (a) any bankruptcy petition filed by or against any business of which such person was a general partner or executive officer either at the time of the bankruptcy or within two years prior to that time; (b) any criminal convictions; (c) any order, judgment, or decree permanently or temporarily enjoining, barring, suspending or otherwise limiting his involvement in any type of business, securities or banking activities; (d) any finding by a court, the SEC or the CFTC to have violated a federal or state securities or commodities law, any law or regulation respecting financial institutions or insurance companies, or any law or regulation prohibiting mail or wire fraud; or (e) any sanction or order of any self-regulatory organization or registered entity or equivalent exchange, association or entity. Further, no such legal proceedings are believed to be contemplated by governmental authorities against any director or executive officer.
54
Section 16(a) Beneficial Ownership Reporting Compliance:
Section 16(a) of the 1934 Act requires Enservco’s directors and officers and any persons who own more than ten percent of Enservco’s equity securities, to file reports of ownership and changes in ownership with the Securities and Exchange Commission (the “SEC”). All directors, officers and greater than ten-percent stockholders are required by SEC regulation to furnish the Company with copies of all Section 16(a) reports files. Based solely on our review of the copies of Forms 3, 4 and any amendments thereto furnished to us during the fiscal year completed December 31, 2010, and subsequently, we believe that during the Company’s 2010 fiscal year all filing requirements applicable to our officers, directors and greater-than-ten-percent stockholders were complied with.
Code of Ethics:
On July 27, 2010, our Board of Directors adopted a Code of Business Conduct and Ethics Whistleblower Policy that applies to all of our officers and employees, including our principal executive officer, principal financial officer and principal accounting officer. Our Code of Ethics establishes standards and guidelines to assist our directors, officers, and employees in complying with both the Company’s corporate policies and with the law and is posted at our website: www.enservco.com. Additionally, a copy of our Code of Business Conduct and Ethics and Whistleblower Policy was filed as an exhibit to our Current Report on Form 8-K dated July 27, 2010.
No Audit Committee:
The Company does not have a separately designated audit committee. Instead, the entire Board acts as the Company’s audit committee. Consequently the Company does not currently have a designated audit committee financial expert.
No Nominating Committee; Procedures by which Security Holders May Recommend Nominees to the Board of Directors; Communications with Members of the Board of Directors:
The Company does not have a separately designated nominating committee. The Company does not have such a committee because we currently believe that given our small size, the fact that a majority of the members of our Board are not currently considered “independent”, and because no Company securities are traded on a stock exchange, that such a committee is not currently necessary.
Unless and until the Company establishes a separate nominating committee, when a board vacancy occurs, the remaining board members will participate in deliberations concerning director nominees. In the future the Company may determine that it is appropriate to designate a separate nominating committee of the board of directors comprised solely of independent directors.
To date, the Board of Directors has not adopted a formal procedure by which stockholders may recommend nominees to the board of directors. However, our bylaws set forth the procedure by which eligible stockholders may nominate a person to the Board of Directors, which in relevant part provides that:
The Corporation will consider all recommendations from any person (or group) who has (or collectively if a group have) held more than 5% of the Corporation’s voting securities for longer than one year. Any stockholder who desires to submit a nomination of a person to stand for election of directors at the next annual or special meeting of the stockholders at which directors are to be elected must submit a notification of the stockholder’s intention to make a nomination (“Notification”) to the Corporation by the date mentioned in the most recent proxy statement under the heading “
Proposal From Stockholders
” as such date may be amended in cases where the annual meeting has been changed as contemplated in SEC Rule 14a-8(e), Question 5, and in that notification must provide the following additional information to the Corporation:
55
|
(i)
|
Name, address, telephone number and other methods by which the Corporation can contact the stockholder submitting the Notification and the total number of shares beneficially owned by the stockholder (as the term “beneficial ownership” is defined in SEC Rule 13d-3);
|
|
(ii)
|
If the stockholder owns shares of the Corporation’s voting stock other than on the records of the Corporation, the stockholder must provide evidence that he or she owns such shares (which evidence may include a current statement from a brokerage house or other appropriate documentation);
|
|
(iii)
|
Information from the stockholder regarding any intentions that he or she may have to attempt to make a change of control or to influence the direction of the Corporation, and other information regarding the stockholder any other persons associated with the stockholder that would be required under Items 4 and 5 of SEC Schedule 14A were the stockholder or other persons associated with the stockholder making a solicitation subject to SEC Rule 14a-12(c);
|
|
(iv)
|
Name, address, telephone number and other contact information of the proposed nominee; and
|
|
(v)
|
All information required by Item 7 of SEC Schedule 14A with respect to the proposed nominee, shall be in a form reasonably acceptable to Enservco.
|
56
|
The following table sets out the compensation received for the fiscal years December 31, 2010 and 2009 in respect to each of the individuals who served as the Company’s chief executive officer at any time during the last fiscal year, as well as the Company’s most highly compensated executive officers:
SUMMARY COMPENSATION TABLE
|
||||||||||||||||||||||||||||||||
| (1) |
Non-Equity
|
Non-Qualified
|
||||||||||||||||||||||||||||||
| Name and | Fiscal |
Stock
|
Option
|
Incentive Plan
|
Deferred Plan
|
All Other
|
||||||||||||||||||||||||||
|
Principal Position
|
Year
|
Salary
|
Bonus
|
Awards
|
Awards
|
Compensation
|
Compensation
|
Compensation
|
Total
|
|||||||||||||||||||||||
|
Michael D. Herman, CEO and Chairman (2)
|
2010
|
$ | - | $ | - | $ | - | $ | - | $ | - | $ | - | $ | 6,862 | (2) | $ | 6,862 | ||||||||||||||
|
|
2009
|
$ | - | $ | - | $ | - | $ | - | $ | - | $ | - | $ | 11,542 | (2) | $ | 11,542 | ||||||||||||||
|
Bob Maughmer, President & COO (4)
|
2010
|
$ | 77,885 | $ | 42,307 | $ | - | $ | 158,094 | $ | - | $ | - | $ | 11,878 | (3) | $ | 290,164 | ||||||||||||||
|
Austin Peitz, Director of Operations
|
2010
|
$ | 113,077 | $ | 44,106 | $ | - | $ | 68,131 | $ | - | $ | - | $ | 21,222 | (3) | $ | 246,536 | ||||||||||||||
|
2009
|
$ | 101,769 | $ | 24,845 | $ | - | $ | - | $ | - | $ | 19,878 | (3) | $ | 146,492 | |||||||||||||||||
|
Rick D. Kasch, CFO and Executive V. P.
|
2010
|
$ | 180,000 | $ | - | $ | - | $ | 45,421 | $ | - | $ | - | $ | 24,047 | (3) | $ | 249,468 | ||||||||||||||
|
2009
|
$ | 172,384 | $ | - | $ | - | $ | - | $ | - | $ | - | $ | 23,393 | (3) | $ | 195,777 | |||||||||||||||
|
|
(1)
|
Amounts represent the calculated fair value of stock options granted to the named executive officers based on provisions of ASC 718-10,
Stock Compensation.
See note 14 to the consolidated financial statements for discussion regarding assumptions used to calculate fair value under the Black-Scholes–Merton valuation model.
|
|
|
(2)
|
In both fiscal 2009 and fiscal 2010 Mr. Herman elected not to receive any base compensation because he believed that the funds that would have been used to pay his salary were better devoted to helping to grow and develop the Company’s business operations. Mr. Herman’s sole compensation from the Company during its last two fiscal years (and thus far in fiscal 2011) was derived from the Company paying his health, life, dental and vision insurance premiums. Mr. Herman is not involved in the day-to-day operations of the Company but serves as CEO to provide strategic guidance on an as needed basis. The Company evaluated the services provided by Mr. Herman during the years ended December 31, 2010 and 2009 and determined that it was not necessary to impute compensation for financial reporting purposes.
|
|
|
(3)
|
Represents: (i) automobile expenses incurred by the Company on behalf of Mr. Kasch and Mr. Peitz; (ii) health, life, dental and vision insurance premiums incurred on behalf of Mr. Kasch, Mr. Peitz and Mr. Maughmer by the Company; and (iii) matching contributions to the Company’s 401(k) plan on behalf of Mr. Kasch, Mr. Peitz and Mr. Maughmer.
|
|
|
|
|
(4)
|
Mr. Maughmer’s employment with the Company began in August 2010.
|
57
Narrative Disclosure to Summary Compensation Table
The Board of Directors acting in lieu of a compensation committee, is charged with reviewing and approving the terms and structure of the compensation of the Company’s executive officers. To date, the Company has not retained an independent compensation to assist the Company review and analyze the structure and terms of the Company’s executive officers.
The Company considers various factors when evaluating and determining the compensation terms and structure of its executive officers, including the following:
|
|
1.
|
The executive’s leadership and operational performance and potential to enhance long-term value to the Company’s stockholders;
|
|
|
2.
|
The Company’s financial resources, results of operations, and financial projections;
|
|
|
3.
|
Performance compared to the financial, operational and strategic goals established for the Company;
|
|
|
4.
|
The nature, scope and level of the executive’s responsibilities;
|
|
|
5.
|
Competitive market compensation paid by other companies for similar positions, experience and performance levels; and
|
|
|
6.
|
The executive’s current salary, the appropriate balance between incentives for long-term and short-term performance.
|
Company management is responsible for reviewing the base salary, annual bonus and long-term compensation levels for other Company employees, and the Company expects this practice to continue going forward. The entire Board of Directors remains responsible for significant changes to, or adoption, of new employee benefit plans.
The Company believes that the compensation environment for qualified professionals in the industry in which we operate is highly competitive. In order to compete in this environment, the compensation of our executive officers is primarily comprised of the following four components:
|
|
§
|
Base salary;
|
|
|
§
|
Stock option awards and/or equity based compensation;
|
|
|
§
|
Discretionary cash bonuses; and
|
|
|
§
|
Other employment benefits.
|
Base Salary.
Base salary, paid in cash, is the first element of compensation to our officers.
In determining base salaries for our key executive officers, the Company aims to set base salaries at a level we believe enables us to hire and retain individuals in a competitive environment and to reward individual performance and contribution to our overall business goals. The Board of Directors believes that base salary should be relatively stable over time, providing the executive a dependable, minimum level of compensation, which is approximately equivalent to compensation that may be paid by competitors for persons of similar abilities. The Board of Directors believes that base salaries for our executive officers are appropriate for persons serving as executive officers of public companies similar in size and complexity similar to the Company.
The Company’s Chief Executive Officer is not paid a base salary as he has elected to forego the receipt of a salary. The Company’s other executive officers receive their base salaries in accordance with the terms of their respective employment agreements (which are described below).
Stock Option Plan Benefits –
Each of the Company’s executive officers is eligible to be granted awards under the Company’s equity compensation plans. The Company believes that equity based compensation helps align management and executives’ interests with the interests of our
stockholders. Our equity incentives are also intended to reward the attainment of long-term corporate objectives by our executives. We also believe that grants of equity-based compensation are necessary to enable us to be competitive from a total remuneration standpoint. At the present time, we have one equity incentive plan for our management and employees, the 2010 Stock Incentive Plan. The material terms, and administration of the 2010 Stock Incentive Plan are further described under Item 5 of this Annual Report.
58
We have no set formula for granting awards to our executives or employees. In determining whether to grant awards and the amount of any awards, we take into consideration discretionary factors such as the individual’s current and expected future performance, level of
responsibilities, retention considerations, and the total compensation package.
The Company has granted each of its executive officers stock options, with the exception of our Chief Executive Officer. Our Chief Executive Officer expressed to the Company that he did not wish to receive such a grant because he believes that, given his significant stock ownership, it was more appropriate to allocate the options to other employees.
In conjunction with entering into an employment agreement on July 27, 2010 Rick Kasch, the Company’s Chief Financial Officer was granted an option to acquire 300,000 shares of Company common stock, and Mr. Peitz was granted an option to acquire 450,000 shares of Company common stock. The exercise price of both options is $0.49 (which is equal to the closing sales price of the Company’s common stock two days after the Company filed its Current Report on Form 8-K reporting the closing of the Merger Transaction). Both options are exercisable for a five year term, and one third of the options vested immediately upon grant with the remaining portion of the option to vest on a pro-rata basis on each of the first two anniversary dates of the option grant.
Additionally, at the time of his appointment as our Chief Operating Officer and President, on August 23, 2010 Bob Maughmer was granted an option to acquire 1 million shares of Company common stock. The option is exercisable for a five year term with an exercise price of $0.49 per share. One third of the options vested at the time of grant and the remaining two thirds vest on a pro rata basis on each anniversary date of the date of grant.
Discretionary Annual Bonus.
Discretionary cash bonuses are another prong of our compensation plan. The Board of Directors believes that it is appropriate that executive officers and other employees have the potential to receive a portion of their annual cash compensation as a cash bonus to encourage performance to achieve key corporate objectives and to be competitive from a total remuneration standpoint.
We have no set formula for determining or awarding discretionary cash bonuses to our other executives or employees. In determining whether to award bonuses and the amount of any bonuses, we have taken and expect to continue to take into consideration discretionary factors such as the individual’s current and expected future performance, level of responsibilities, retention considerations, and the total compensation package, as well as the Company’s overall performance including cash flow and other operational factors.
The employment agreements we have entered into with certain of our executive officers provide that each is eligible to receive a discretionary cash bonus. Such bonuses are to be considered and determined by the Board of Directors, and paid during the ninety day period beginning February 1 of the year following that year for which the bonus was earned. After the end of our 2010 fiscal year the Board of Directors awarded cash bonuses to the following Company executive:
59
| ● | Austin Peitz – Mr. Peitz was awarded a cash bonus of $68,131 for fiscal year 2010, the majority of the bonus was paid to Mr. Peitz in 2010. However, of this amount, approximately $10,000 is to be paid to Mr. Peitz on or about March 31, 2011. |
Other Compensation/Benefits.
Another element of the overall compensation is through providing our executive officers are various employment benefits, such as the payment of health and life insurance premiums on behalf of the executive officers. Additionally, the Company provides its executive officers with an automobile allowance. Our executive officers are also eligible to participate in our 401(k) plan on the same basis as other employees and the Company historically has made matching contributions to the 401(k) plan, including for the benefit of our executive officers.
Employment Agreements
We have entered into employment agreements with certain Company officers and key employees, including Messrs. Herman, Maughmer, Peitz and Kasch (all of whom are listed in the executive compensation table above).
Michael Herman –
Mr. Herman’s employment agreement is for a term through June 30, 2013. The agreement provides for no base salary. However, Mr. Herman will be eligible for an annual discretionary cash bonus based on Mr. Herman’s performance and the performance of the Company as a whole, with any bonus ultimately to be determined by the Board of Directors. Mr. Herman is entitled to receive standard employment benefits and a car allowance of $1,000 per month. If Mr. Herman is terminated without cause he will be entitled to health benefits for a period of eighteen months. The employment agreement also contains other standard provisions contained in agreements of this nature including confidentiality and non-competition provisions.
Rick Kasch –
Mr. Kasch’s employment agreement is for a term through June 30, 2013. The agreement provides for an annual salary of $180,000 through June 30, 2011 and then automatic increases of 5% effective on each July 1 during the term of the agreement. Pursuant to the agreement the Company agreed to grant Mr. Kasch an option to acquire 300,000 shares of Company common stock in accordance with the Company’s 2010 Stock Incentive Plan. Mr. Kasch is also entitled to standard employment benefits and the use of a Company automobile or alternatively a car allowance of at least $1,000. The employment agreement contains other standard provisions contained in agreements of this nature including confidentiality and non-competition provisions.
Mr. Kasch’s employment agreement also provides for severance compensation if his employment is terminated for the following two reasons:
|
1.
|
A termination without cause
- If Mr. Kasch is terminated without cause he will be entitled to all salary that would have been paid through the remaining term of the agreement, or if the agreement is terminated without cause during the final eighteen months of the agreement term Mr. Kasch will be entitled to receive a lump sum payment equal to eighteen months of his base salary. Additionally, if Mr. Kasch is terminated without cause, he will be entitled to health benefits for a period of eighteen months; and
|
|
2.
|
A termination upon a change of control event or a management change
- If Mr. Kasch resigns within ninety days following a change of control event or a management change (being the person to whom he directly reports) he will be entitled to a severance payment equal to eighteen months of his base salary with the amount being paid either in a lump sum payment or in accordance with the Company’s payroll practices. Further, Mr. Kasch will be entitled to health benefits for a period of eighteen months.
|
60
|
Austin Peitz -
Mr. Peitz’s employment agreement is for a term through June 30, 2013. The agreement provides for an annual salary of $120,000 through June 30, 2011 and then automatic increases of 5% effective on each July 1 during the term of the agreement. Pursuant to the agreement the Company agreed to grant Mr. Peitz an option to acquire 450,000 shares of Company common stock in accordance with the Company’s 2010 Stock Incentive Plan. Mr. Peitz is also entitled to standard employment benefits and the use of a Company automobile or alternatively a car allowance of at least $1,000. If Mr. Peitz is terminated without cause he is entitled to a severance payment equal to six months of his salary. The employment agreement contains other standard provisions contained in agreements of this nature including confidentiality and non-competition provisions.
|
Bob Maughmer
– On September 6, 2010 Enservco entered into an employment agreement with Mr. Maughmer, Enservco’s President and Chief Operating Officer. The employment agreement provides that Mr. Maughmer will be paid an annual salary of $225,000. On July 1 of each year that the employment agreement is in effect Mr. Maughmer’s salary will be increased by at least 5%. Mr. Maughmer is eligible to receive a discretionary annual bonus based on Mr. Maughmer’s performance and the Company’s financial condition. Mr. Maughmer is also entitled to standard employment benefits and a monthly car allowance of at least $1,000. Mr. Maughmer’s employment agreement is for a three year term and will not be automatically renewed at the end of that term. Instead, Mr. Maughmer will become an employee at will at the end of the initial term of the agreement unless otherwise agreed by Mr. Maughmer and the Company. If Mr. Maughmer’s employment is terminated without cause during the term of the agreement Mr. Maughmer will be entitled to his base salary through the remainder of the term of the agreement.
Stock Option, Stock Awards and Equity Incentive Plans
In accordance with the Company’s 2010 Stock Incentive Plan the Company granted certain of its executive officers stock options during the Company’s 2010 fiscal year. However, the Company granted no stock awards during the fiscal year.
The following table sets forth the outstanding equity awards for each named executive officer at December 31, 2010.
|
Option Awards
|
|||||||||||||
|
Number of Securities
|
|||||||||||||
|
Underlying Unexercised
|
|||||||||||||
|
Options
(#)
|
Option
|
Option
|
|||||||||||
|
Exercise
|
Expiration
|
||||||||||||
|
Name and Principal Position
|
Exercisable
|
Un-exercisable
|
Price
|
Date
|
|||||||||
|
Rick Kasch, Executive V.P and CFO (1)
|
100,000 | 200,000 | $ | 0.49 |
07/30/2015
|
||||||||
|
Austin Peitz, Director of Operations (2)
|
150,000 | 300,000 | $ | 0.49 |
07/30/2015
|
||||||||
|
Bob Maughmer, President and COO (3)
|
333,333 | 666,667 | $ | 0.49 |
08/23/2015
|
||||||||
|
|
|||||||||||||
| (1) |
On July 30, 2010 Mr. Kasch was granted an option to acquire 300,000 shares of the Company's common stock. The exercise price of the option is $0.49, and the option has a five year term. 100,000 shares underlying the option vested upon grant, with 100,000 shares to vest on each of July 30, 2011 and July 30, 2012.
|
| (2) |
On July 30, 2010 Mr. Peitz was granted an option to acquire 450,000 shares of the Company's common stock. The exercise price of the option is $0.49, and the option has a five year term. 150,000 shares underlying the option vested upon grant, with 150,000 shares to vest on each of July 30, 2011 and July 30, 2012.
|
| (3) |
On August 23, 2010 Mr. Maughmer was granted an option to acquire 1,000,000 shares of the Company’s common stock. The exercise price of the option is $0.49, and the option has a five year term. 333,333 shares underlying the option vested upon grant, with 333,333 shares to vest on each of August 23, 2011 and August 23, 2012.
|
61
Compensation of Directors
On July 27, 2010 the Company’s Board of Directors determined that each of the Company’s non-employee directors will receive $5,000 per fiscal quarter plus travel costs. Additionally, each of our non-employee directors was granted a stock option on July 27, 2010.
|
Incentive
|
Non-Qualified
|
|||||||||||||||||||||||
|
Fees Earned
|
Stock
|
|
Incentive
|
Deferred
|
||||||||||||||||||||
|
or Paid
|
Non-Qualified
|
Option
|
Plan
|
Compensation
|
|
|||||||||||||||||||
|
Name
|
in Cash
|
Awards
|
Awards
|
Compensation
|
on Earnings
|
Total
|
||||||||||||||||||
|
R.V. Bailey
(1)
|
$ | 13,000 | $ | - | $ | - | $ | - | $ | - | $ | 13,000 | ||||||||||||
|
Gerard Laheney
(2)
|
$ | 10,000 | $ | - | $ | 62,783 | $ | - | $ | - | $ | 72,783 | ||||||||||||
|
Kevan B. Hensman
(3)
|
$ | 10,000 | $ | - | $ | 7,848 | $ | - | $ | - | $ | 17,848 | ||||||||||||
|
|
(1)
|
Mr. Bailey received fees in the amount of $10,000 for serving on the Board of Directors. Mr. Bailey also received $500 per month starting July 27, 2010 for consultation services for the Company, as agreed upon in his termination agreement upon the Merger Transaction. Prior to the Merger Transaction, Mr. Bailey served as an officer and director of Aspen and was paid an annual salary and also granted an option in February 2010. The remuneration received by Mr. Bailey as an officer and director of Aspen was disclosed in Aspen’s Annual Report on Form 10-K for its fiscal year ended June 30, 2010.
|
|
|
(2)
|
Mr. Laheney received fees in the amount of $ 10,000 for serving on the Board of Directors. On July 30, 2010 Mr. Laheney was granted an option to acquire 200,000 shares of Company common stock. The option is exercisable for a five year term at $0.49 per share, and vested in full as of July 30, 2010.
|
|
|
(3)
|
Mr. Hensman received fees in the amount of $ 10,000 for serving on the Board of Directors. On July 30, 2010 Mr. Hensman was granted an option to acquire 25,000 shares of Company common stock. The option is exercisable for a five year term at
$0.49 per share, and vested in full as of July 30, 2010. Prior to the Merger Transaction Mr. Hensman served on Aspen’s Board of Directors and also as its Chief Financial Officer. Mr. Hensman earned fees in his capacity as Aspen’s Chief Financial Officer and was also granted an option by Aspen in February 2010. The remuneration received by Mr. Hensman as an officer and director of Aspen was disclosed in Aspen’s Annual Report on Form 10-K for its fiscal year ended June 30, 2010.
|
62
Security Ownership of Management
As of March 15, 2011 the Company had 21,778,866 shares of its common stock issued and outstanding. The following table sets forth the beneficial ownership of the Company’s common stock as of March 15, 2011 by each person who serves as a director and/or an executive officer of Enservco on that date, and the number of shares beneficially owned by all of the Company’s directors and named executive officers as a group:
|
Name and Address of
Beneficial Owner
|
Position
|
Amount and Nature
of Beneficial Ownership (1)
|
Percent of
Common Stock
|
|
Michael D. Herman
830 Tenderfoot Hill Rd.
Suite 310
Colorado Springs, CO 80906
|
Chief Executive Officer and Director
|
13,067,320 (2)
|
60%
|
|
R.V. Bailey
830 Tenderfoot Hill Rd.
Suite 310
Colorado Springs, CO 80906
|
Director
|
1,367,275 (3)
|
6.3%
|
|
Kevan B. Hensman
830 Tenderfoot Hill Rd.
Suite 310
Colorado Springs, CO 80906
|
Director
|
128,120 (4)
|
0.6%
|
|
Gerard Laheney
830 Tenderfoot Hill Rd.
Suite 310
Colorado Springs, CO 80906
|
Director
|
338,700 (5)
|
1.6%
|
|
Rick D. Kasch
830 Tenderfoot Hill Rd.
Suite 310
Colorado Springs, CO 80906
|
Chief Financial Officer, Executive Vice President, and Treasurer
|
1,551,924 (6)
|
7.1%
|
|
Bob Maughmer
830 Tenderfoot Hill Rd.
Suite 310
Colorado Springs, CO 80906
|
President and Chief Operating Officer
|
333,333 (7)
|
1.5%
|
|
All current directors, executive officers and named executive officers as a group (6 persons)
|
16,786,672
|
77%
|
63
|
|
(1)
|
Calculated in accordance with 1934 Act Rule 13d-3.
|
|
|
(2)
|
Consists of:
|
|
|
(i)
|
6,533,660 shares acquired by Mr. Herman at the closing of the Merger Transaction; and
|
|
|
(ii)
|
6,533,660 shares held by Mr. Herman’s spouse acquired at the closing of the Merger Transaction.
|
|
|
(3)
|
Consists of:
|
|
|
(i)
|
1,215,676 shares of stock held of record in the name of R. V. Bailey;
|
|
|
(ii)
|
3,959 shares of stock held jointly with Mr. Bailey’s spouse;
|
|
|
(iii)
|
11,220 shares of record in the name of Mieko Nakamura Bailey, his spouse (For the purposes of Section 16b of the Securities Exchange Act of 1934 Mr. Bailey disclaims beneficial ownership of the shares held by his spouse);
|
|
|
(iv)
|
stock options to purchase 36,420 shares of common stock at $2.14 per share; and
|
|
|
(v)
|
stock options to purchase 100,000 shares of common stock at $0.4125 per share that vested on July 27, 2010.
|
|
|
(4)
|
Consists of:
|
|
|
(i)
|
options to acquire 10,000 shares of common stock at $3.70 per share that are exercisable through September 11, 2011;
|
|
|
(ii)
|
options to acquire 18,120 shares of common stock that are exercisable at $2.14 per share;
|
|
|
(iii)
|
options to acquire 75,000 shares of common stock at $0.415 per share that vested on July 27, 2010; and
|
|
|
(iv)
|
options to acquire 25,000 options that were granted on July 30, 2010 and are exercisable for a five year term.
|
|
|
(5)
|
Consists of:
|
|
|
(i)
|
options to acquire 200,000 shares of common stock that were granted on July 30, 2010 and are exercisable for a five-year term; and
|
|
|
(ii)
|
138,700 shares acquired by Mr. Laheney from Hermanco, LLC (an affiliate of Mr. Herman).
|
|
|
(6)
|
Consists of
|
|
|
(i)
|
1,451,924 shares acquired upon the closing of the Merger Transaction;
|
|
|
(ii)
|
Options to acquire 100,000 shares of common stock granted on July 30, 2010 and that are exercisable for a five-year term at $0.49 per share.
|
Note: The unvested portion of the stock option granted to Mr. Kasch on July 30, 2010 (being an option to acquire 200,000 shares) is not included in Mr. Kasch’s beneficial ownership reported in the above table.
|
|
(7)
|
Consists of options to acquire 333,333 shares of Company common stock granted on August 23, 2010 and that are exercisable for a five year term at $0.49 per share.
|
Note: The unvested portion of the stock option (being an option to acquire 666,667 shares) is not included in Mr. Maughmer’s beneficial ownership reported in the above table.
64
Security Ownership of Certain Beneficial Owners
As of March 15, 2011, the Company is not aware of any persons that beneficially own more than 5% of its outstanding common stock who does not serve as an executive officer or director of the Company, except for Mr. Herman’s spouse whose shares are included in Mr. Herman’s beneficial ownership reported in the table above.
Employee/Director Hedging Is Not Permitted.
Section 14(j) of the 1934 Act requires each issuer to disclose whether any employee or member of the board of directors, or any designee of any employee or board member, is permitted to purchase hedges – that is, financial instruments that are designed to hedge or offset against any decrease in the market price for the issuer’s securities. On July 27, 2010, the Board of Directors adopted the Company’s “Code of Business Conduct and Ethics and Whistleblower Policy” which provides that the “Board of Directors has concluded that it is inappropriate for employees or members of the board of directors, or any designee of such persons, to purchase hedges” involving the Company’s securities.
Change in Control Arrangements
As of March 15, 2011, there are no arrangements that would result in a change in control of the Company except to the extent that Mr. Herman has personally guaranteed substantially all of Dillco’s indebtedness (which indebtedness Enservco has also guaranteed). In addition, Mr. Herman has significant personal indebtedness with Great Western Bank, the principal lender to Dillco. Mr. Herman has granted Great Western Bank a blanket lien on his personal assets. Therefore, should Mr. Herman default on his personal indebtedness to the Great Western Bank, the bank may institute a collection action which could result in the transfer of Mr. Herman’s interest in the Company to Great Western Bank – which transfer would result in a change of control.
Securities Authorized for Issuance Under Equity Compensation Plans
See Item 5, above, for information regarding securities authorized for issuance under equity compensation plans in the form required by Item 201(d) of Regulation SK.
Related Party Transactions
The following sets forth information regarding transactions between the Company (and its subsidiaries) and its officers, directors and significant stockholders since January 1, 2009. Any transactions between Aspen and its officers, directors, and significant stockholders occurring in Aspen’s last two fiscal years was disclosed in Aspen’s Annual Report on Form 10-K for its fiscal year ended June 30, 2010.
Employment Agreements
See Item 11 - Executive Compensation of this Form 10-K for a discussion of the employment agreements between the Company and each of Messrs. Herman, Kasch and Maughmer.
65
Loan Transactions
1. On November 21, 2009 Mr. Herman loaned $500,000 to Heat Waves pursuant to the terms of a promissory note (the “Heat Waves Note”). The Heat Waves Note accrues interest at 3% per annum and is due in full by December 31, 2018. As part of loan agreements with Great Western Bank, Mr. Herman agreed to subordinate the debt represented by this note to all obligations to the bank. Interest is to be paid annually in arrears but due to the subordination, interest is being accrued and as of December 31, 2010 accrued interest was $18,845.
2. On March 31, 2010, Mr. Herman loaned an additional $1,200,000 to Heat Waves pursuant to the terms of a promissory note (the “Heat Waves Note II”). The Heat Waves Note II accrues interest at 3% per annum and is due in full by December 31, 2018. As part of the loan agreements with Great Western Bank, Mr. Herman agreed to subordinate the debt represented by this note to all obligations to the bank. Interest is to be paid annually in arrears but due to the subordination, interest is being accrued and as of December 31, 2010 accrued interest was $30,360.
3. On July 27, 2010, Enservco (as the parent corporation) became the guarantor of Dillco’s indebtedness to Great Western Bank. Because of certain cross-default provisions, a default by Mr. Herman as to his personal indebtedness to Great Western Bank could result in a default by Dillco in its indebtedness even though at the time Dillco was in compliance with all of its covenants.
Asset Transfer and Sales; Membership Interest Transfer and Sales
1. On December 31, 2009, HNR sold certain assets to Dillco for $1,065,623. These assets included land, buildings, vehicles, equipment, and machinery used by Dillco as part of its business operations. The purchase price was based on an independent appraisal performed in December 2009. At the time of this transaction 100% of the membership interests of HNR were owned by Mr. Herman and his family members and the membership interests of Enservco LLC (being the former holding company of Dillco and its subsidiaries and related entities) were held by Mr. Herman (90%) and Mr. Kasch (10%).
2. On December 31, 2009, Mr. Herman transferred and assigned his membership interest in Real GC to Heat Waves in consideration for $174,382. This price was determined based on the parties’ estimate of the fair value of Real GC and the real property that it owns in Garden City, Kansas where an acid dock owned and utilized by Heat Waves is located. At the time of the transaction Mr. Herman was the sole member of Real GC, Enservco LLC (being the former holding company of Dillco and its subsidiaries and related entities) was the sole member of Heat Waves, and the membership interests of Enservco LLC were held by Mr. Herman (90%) and Mr. Kasch (10%).
3. On December 31, 2009, Enservco LLC (being the former holding company of Dillco and its subsidiaries and related entities) and Dillco entered into a Transfer and Contribution Agreement whereby Enservco LLC transferred, contributed, and conveyed all of its rights and interests in:
§
The assets it acquired from HNR on December 31, 2009 for $1,065,623.
§
Its rights and interests (100%) in the membership interests in both Heat Waves and Trinidad Housing.
Trinidad Housing owns a housing unit in Trinidad, Colorado that at times was previously utilized by certain Dillco employees. At the time of the transaction Enservco LLC owned 100% of the outstanding stock of Dillco itself and was the sole member of Trinidad Housing. Further, the membership interests of Enservco LLC were held at that time by Mr. Herman (90%) and Mr. Kasch (10%).
66
4. On March 1, 2010, Mes
srs. Herman and Kasch contributed their membership interests in HES to Enservco LLC (being the former holding company of Dillco and its subsidiaries and related entities). HES owns certain assets that it previously leased to Heat Waves including a disposal well, trucks and construction equipment. At the time of the transaction Mr. Herman held a 95% membership interest in HES and Mr. Kasch a 5% membership interest. Further, the membership interests of Enservco LLC were held by Mr. Herman (90%) and Rick Kasch (10%). Enservco LLC then contributed the HES membership interest to Dillco itself which in turn transferred the interest to Heat Waves. As a result, Heat Waves owns a 100% membership interest in HES.
5. On March 15, 2010, Mr. Herman sold a disposal well located in Oklahoma to HES in consideration for $100,000. Payment of the purchase price (which was due on or before September 15, 2010) was made on August 11, 2010.
Director Independence
As of March 15, 2011, the Company’s Board of Directors consists of Messrs. Herman, Bailey, Hensman, and Laheney. The Company utilizes the definition of “independent” as it is set forth in Section 803A of the NYSE Amex Company Guide. Further, the board considers all relevant facts and circumstances in its determination of independence of all members of the board (including any relationships). Currently, only Mr. Laheney is considered an independent director.
Audit Fees.
Ehrhardt Keefe Steiner & Hottman PC (EKS&H) billed the Company aggregate fees for audit services in the amount of approximately $126,745 for the fiscal year ended December 31, 2010 and approximately $63,190 for the fiscal year ended December 31, 2009. These amounts were billed for professional services that EKS&H provided for the audit of our annual financial statements, review of the financial statements included in our reports on 10-Q and other services typically provided by an accountant in connection with statutory and regulatory filings or engagements for those fiscal years.
Tax Fees.
EKS&H billed us aggregate fees in the amount of approximately $2,000 for the fiscal year ended December 31 2009, for tax compliance services, and $-0- for the fiscal year ended December 31, 2010 for tax compliance services.
67
Audit Committee’s Pre-Approval Practice.
Inasmuch as the Company does not have an audit committee, the Company’s board of directors performs the functions of its audit committee. Section 10A(i) of the 1934 Act prohibits our auditors from performing audit services for us as well as any services not considered to be “audit services” unless such services are pre-approved by the board of directors (in lieu of the audit committee) or unless the services meet certain
de minimis
standards.
The board of directors has adopted resolutions that provide that the board must:
Pre-approve all audit services that the auditor may provide to us or any subsidiary (including, without limitation, providing comfort letters in connection with securities underwritings or statutory audits) as required by §10A(i)(1)(A) of the 1934 Act.
Pre-approve all non-audit services (other than certain
de minimis
services described in §10A(i)(1)(B) of the 1934 Act that the auditors propose to provide to us or any of its subsidiaries.
The board of directors considers at each of its meetings whether to approve any audit services or non-audit services. In some cases, management may present the request; in other cases, the auditors may present the request. The board of directors approved EKS&H performing our audit for the 2010 fiscal year and approved EKS&H performing our audit for the 2011 fiscal year.
68
|
Exhibit No.
|
Title
|
|
|
2.01
|
Agreement and Plan of Merger and Reorganization dated June 24, 2010
(1)
|
|
|
3.01
|
Amended and Restated Certificate of Incorporation of Aspen Exploration Corporation.
(2)
|
|
|
3.02
|
Amended and Restated Bylaws.
(3)
|
|
|
10.01
|
Employment Agreement between Aspen Exploration Corporation and Michael D. Herman.
(3)
|
|
|
10.02
|
Employment Agreement between Aspen Exploration Corporation and Rick Kasch.
(3)
|
|
|
10.03
|
Employment Agreement between Aspen Exploration Corporation and Bob Maughmer.
(4)
|
|
|
10.04
|
2008 Equity Plan.
(5)
|
|
|
10.05
|
2010 Stock Incentive Plan.
(3)
|
|
|
10.06
|
Business Loan Agreement with Great Western Bank.
(3)
|
|
|
10.07
|
Business Loan Agreement with Great Western Bank.
(3)
|
|
|
10.08
|
Form of Indemnity Agreement.
(3)
|
|
|
14.1
|
Code of Business Conduct and Ethics Whistleblower Policy.
(3)
|
|
|
16.1
|
Letter of Eide Baily LLP dated July 27, 2010, regarding the change in certifying accountant
(3)
|
|
|
16.2
|
Letter of Stockman Kast Ryan & Co. dated July 20, 2010, regarding the change in certifying
|
|
|
accountant
(3)
|
||
|
21.1
|
Subsidiaries of Enservco Corporation.
(3)
|
|
|
31.1
|
Certification pursuant to Section 302 of the Sarbanes-Oxley Act of 2002, (Chief Executive Officer). Filed herewith.
|
|
|
|
||
|
31.2
|
Certification pursuant to Section 302 of the Sarbanes-Oxley Act of 2002 (Chief Financial Officer). Filed herewith.
|
|
|
|
||
|
32.1
|
Certification pursuant to 18 U.S.C. §1350, as adopted pursuant to Section 906 of the Sarbanes-Oxley Act of 2002 (Chief Executive Officer). Filed herewith.
|
|
|
32.2
|
Certification pursuant to 18 U.S.C. §1350, as adopted pursuant to Section 906 of the Sarbanes-Oxley Act of 2002 (Chief Financial Officer). Filed herewith.
|
|
(1)
|
Incorporated by reference from the Company’s Current Report on Form 8-K dated June 24, 2010 and filed on the same date.
|
|
(2)
|
Incorporated by reference from the Company’s Current Report on Form 8-K dated December 30, 2010, and filed on January 4, 2011.
|
|
(3)
|
Incorporated by reference from the Company’s Current Report on Form 8-K dated July 27, 2010, and filed on July 28, 2010.
|
|
(4)
|
Incorporated by reference from the Company’s Current Report on Form 8-K dated September 6, 2010, and filed on September 13, 2010.
|
|
(5)
|
Incorporated by reference from the Company’s Current Report on Form 8-K dated February 27, 2008, and filed on March 10, 2008.
|
69
SIGNATURES
In accordance with Section 13 or 15(d) of the Securities Exchange Act 1934, the Registrant has duly caused this report to be signed on its behalf by the undersigned, thereunto duly authorized.
March 25
,
2011
ENSERVCO CORPORATION,
a Delaware Corporation
/s/ Michael D. Herman
Principal Executive Officer
/s/ Rick D. Kasch
Principal Financial Officer & Principal Accounting Officer
Pursuant to the requirement of the Securities Exchange Act of 1934, this report has been signed below by the following persons on behalf of the Registrant and in the capacities and on the dates indicated:
|
Date
|
Name and Title
|
Signature
|
|
March 25
,
2011
|
Michael D. Herman
|
/s/ Michael D. Herman
|
|
Chief Executive Officer, and
|
||
|
Chairman of the Board
|
||
|
March 25
,
2011
|
R.V. Bailey
|
/s/ R.V. Bailey
|
|
Director
|
||
|
March 25
,
2011
|
Kevan B. Hensman
|
/s/ Kevan B. Hensman
|
|
Director
|
||
|
March 25
,
2011
|
Gerard Laheney
|
/s/ Gerard Laheney
|
|
Director
|
70
ENSERVCO CORPORATION AND SUBSIDIARIES
INDEX TO CONSOLIDATED FINANCIAL STATEMENTS
| Page | |
| Report of Independent Registered Public Accounting Firms | 72 |
| Financial Statements as of December 31, 2010 and December 31, 2009: | |
| Consolidated Balance Sheets | 73 |
| Consolidated Statements of Operations | 74 |
| Consolidated Statement of Stockholders’ Equity | 75 |
| Consolidated Statements of Cash Flows | 76-77 |
| Notes to Consolidated Financial Statements | 78-101 |
71
REPORT OF INDEPENDENT REGISTERED PUBLIC ACCOUNTING FIRM
The Board of Directors and Stockholders
Enservco Corporation
Colorado Springs, Colorado
We have audited the accompanying consolidated balance sheets of Enservco Corporation and subsidiaries (the "Company") as of December 31, 2010 and 2009, and the related consolidated statements of operations, stockholders' equity and accumulated other comprehensive income (loss) and cash flows for the years then ended. The Company's management is responsible for these consolidated financial statements. Our responsibility is to express an opinion on these consolidated financial statements based on our audits.
We conducted our audits in accordance with the standards of the Public Company Accounting Oversight Board (United States). Those standards require that we plan and perform the audits to obtain reasonable assurance about whether the consolidated financial statements are free of material misstatement. The Company is not required to have, nor were we engaged to perform, an audit of its internal control over financial reporting. Our audits included consideration of internal control over financial reporting as a basis for designing audit procedures that are appropriate in the circumstances, but not for the purpose of expressing an opinion on the effectiveness of the Company's internal control over financial reporting. Accordingly, we express no such opinion. Audits also include examining, on a test basis, evidence supporting the amounts and disclosures in the consolidated financial statements, assessing the accounting principles used and significant estimates made by management, as well as evaluating the overall financial statement presentation. We believe that our audits provide a reasonable basis for our opinion.
In our opinion, the consolidated financial statements referred to above present fairly, in all material respects, the financial position of Enservco Corporation and subsidiaries as of December 31, 2010 and 2009, and the results of their operations and their cash flows for the years then ended in conformity with accounting principles generally accepted in the United States of America.
/s/ Ehrhardt Keefe Steiner & Hottman PC
March 25, 2011
Denver, Colorado
72
|
December 31,
|
December 31,
|
|||||||
|
2010
|
2009
|
|||||||
|
ASSETS
|
||||||||
|
Current Assets
|
||||||||
|
Cash and cash equivalents
|
$ | 1,637,807 | $ | 148,486 | ||||
|
Accounts receivable, net
|
4,101,331 | 2,131,592 | ||||||
|
Prepaid expenses and other current assets
|
681,307 | 359,110 | ||||||
|
Inventories
|
300,527 | 309,927 | ||||||
|
Income taxes receivable
|
634,941 | 385,192 | ||||||
|
Deferred tax asset
|
20,041 | 82,435 | ||||||
|
Total current assets
|
7,375,954 | 3,416,742 | ||||||
|
Property and Equipment, net
|
14,452,298 | 16,452,812 | ||||||
|
Non-Competition Agreements, net
|
420,000 | 660,000 | ||||||
|
Goodwill
|
301,087 | 301,087 | ||||||
|
Other Assets
|
71,537 | - | ||||||
|
TOTAL ASSETS
|
$ | 22,620,876 | $ | 20,830,641 | ||||
|
LIABILITIES AND MEMBERS’ EQUITY
|
||||||||
|
Current Liabilities
|
||||||||
|
Accounts payable and accrued liabilities
|
$ | 2,066,353 | $ | 1,276,071 | ||||
|
Line of credit borrowings
|
1,050,000 | 1,339,507 | ||||||
|
Current portion of long-term debt
|
3,107,122 | 1,132,412 | ||||||
|
Total current liabilities
|
6,223,475 | 3,747,990 | ||||||
|
Long-Term Liabilities
|
||||||||
|
Related party payables
|
- | 199,995 | ||||||
|
Subordinated debt – related party
|
1,700,000 | 500,000 | ||||||
|
Long-term debt, less current portion
|
8,657,675 | 10,692,516 | ||||||
|
Interest rate swaps
|
- | 140,733 | ||||||
|
Deferred income taxes, net
|
1,434,282 | 2,468,984 | ||||||
|
Total long-term liabilities
|
11,791,957 | 14,002,228 | ||||||
|
Total liabilities
|
18,015,432 | 17,750,218 | ||||||
|
Equity
|
||||||||
|
Common stock. $.005 par value
Authorized: 100,000,000 shares
Issued: 21,882,466 shares
Treasury Stock: 103,600 shares
Issued and outstanding: 21,778,866 and -0- shares at December 31, 2010 and 2009, respectively
|
108,894 | - | ||||||
|
Additional paid-in-capital
|
5,489,823 | - | ||||||
|
Retained earnings
|
(1,150,011 | ) | - | |||||
|
Accumulated other comprehensive loss, available-for-sale securities
|
156,738 | - | ||||||
|
Members’ equity
|
- | 3,080,423 | ||||||
|
Total equity
|
4,605,444 | 3,080,423 | ||||||
|
TOTAL LIABILITIES AND EQUITY
|
$ | 22,620,876 | $ | 20,830,641 | ||||
See notes to consolidated financial statements.
73
|
For the Years Ended
|
||||||||
|
December 31,
|
||||||||
|
2010
|
2009
|
|||||||
|
Revenues
|
$ | 18,641,286 | $ | 15,388,746 | ||||
|
Cost of Revenue
|
14,422,412 | 13,489,099 | ||||||
|
Gross Profit
|
4,218,874 | 1,899,647 | ||||||
|
Operating Expenses
|
||||||||
|
General and administrative expenses
|
2,540,859 | 1,486,124 | ||||||
|
Depreciation and amortization
|
3,992,367 | 4,423,934 | ||||||
|
Total operating expenses
|
6,533,226 | 5,910,058 | ||||||
|
Income (Loss) from Operations
|
( 2,314,352 | ) | ( 4,010,411 | ) | ||||
|
Other (Expense) Income
|
||||||||
|
Interest expense
|
(728,241 | ) | (699,125 | ) | ||||
|
(Loss) on disposals of equipment
|
(71,003 | ) | (79,785 | ) | ||||
|
Unrealized derivative (loss)
|
- | (140,733 | ) | |||||
|
Gain on sale of investments
|
188,186 | - | ||||||
|
Interest and other income
|
153,557 | 7,472 | ||||||
|
Total other (expense)
|
( 457,501 | ) | ( 912,171 | ) | ||||
|
(Loss) Before Income Tax Benefit (Expense)
|
(2,771,853 | ) | (4,922,582 | ) | ||||
|
Income Tax Benefit (Expense)
|
926,188 | ( 972,882 | ) | |||||
|
Net Income (Loss)
|
$ | (1,845,665 | ) | $ | (5,895,464 | ) | ||
|
Other Comprehensive Income
Unrealized gain on securities, net of tax
|
156,738 | - | ||||||
|
Comprehensive (Loss)
|
$ | (1,688,927 | ) | $ | (5,895,464 | ) | ||
| Earnings per Common Share – Basic and Diluted | ||||||||
| Income (Loss) Per Common Share | $ | (0.10 | ) | $ | (0.41 | ) | ||
| Weighted average number of common shares outstanding | 17,641,876 | 14,519,214 | ||||||
| (presented on an equivalent basis) | ||||||||
See notes to consolidated financial statements.
74
Consolidated Statement of Equity
|
Shares
|
Par Value
|
APIC
|
Members Equity
|
Retained Earnings
|
Accumulated Other Comprehensive Income (Loss)
|
Total Equity
|
||||||||||||||||||||||
| Balance at January 1, 2009 | - | $ | - | $ | - | $ | 8,425,556 | $ | - | $ | (200,574 | ) | $ | 8,224,982 | ||||||||||||||
| Net (loss) | (5,895,464 | ) | (5,895,464 | ) | ||||||||||||||||||||||||
|
Contributions
|
2,070,552 | 2,070,552 | ||||||||||||||||||||||||||
|
Distributions
|
(678,722 | ) | (678,722 | ) | ||||||||||||||||||||||||
|
Deconsolidation of HNR
|
(841,499 | ) | (841,499 | ) | ||||||||||||||||||||||||
| Setlement of interest rate swap | ||||||||||||||||||||||||||||
|
agreement
|
- | - | - | - | - | 200,574 | 200,574 | |||||||||||||||||||||
|
Balance at December 31, 2009
|
- | $ | - | $ | - | $ | 3,080,423 | $ | - | $ | - | $ | 3,080,423 | |||||||||||||||
| Net (loss) | (1,845,665 | ) | (1,845,665 | ) | ||||||||||||||||||||||||
| Unrealized gain on marketable | ||||||||||||||||||||||||||||
|
securities, net of taxes of $100,210
|
156,738 | 156,738 | ||||||||||||||||||||||||||
|
Issuance of Stock Options
|
342,277 | 342,277 | ||||||||||||||||||||||||||
|
Issuance of Warrants
|
81,771 | 81,771 | ||||||||||||||||||||||||||
|
Consolidation of Aspen due to
|
||||||||||||||||||||||||||||
|
Merger Transaction
|
21,778,866 | 108,894 | 5,065,775 | (3,080,423 | ) | 695,654 | - | 2,789,900 | ||||||||||||||||||||
|
Balance at December 31, 2010
|
21,778,866 | $ | 108,894 | $ | 5,489,823 | $ | - | $ | (1,150,011 | ) | $ | 156,738 | $ | 4,605,444 | ||||||||||||||
See notes to consolidated financial statements.
75
|
For the Years Ended
|
||||||||
|
December 31,
|
||||||||
|
2010
|
2009
|
|||||||
|
OPERATING ACTIVITIES
|
||||||||
|
Net income (loss)
|
$ | (1,845,665 | ) | $ | (5,895,464 | ) | ||
|
Adjustments to reconcile net income to net cash provided by operating activities
|
||||||||
|
Depreciation and amortization
|
3,992,367 | 4,423,934 | ||||||
|
Loss on disposal of equipment
|
71,003 | 79,785 | ||||||
|
Deferred income taxes
|
(861,004 | ) | 1,342,463 | |||||
|
Unrealized (gain) loss on derivatives
|
(140,733 | ) | 140,733 | |||||
|
Stock-based compensation
|
342,277 | - | ||||||
|
Warrants issued to vendors
|
81,771 | - | ||||||
| Unrealized gain on available-for-sale securities | (395,927 | ) | - | |||||
| Sales of trading securities | 70,000 | - | ||||||
| Bad debt expense | 90,799 | 188,531 | ||||||
|
Changes in operating assets and liabilities
|
||||||||
|
Accounts receivable
|
(2,060,537 | ) | 1,960,120 | |||||
|
Income taxes receivable
|
16,407 | (98,786 | ) | |||||
|
Inventories
|
9,400 | 29,770 | ||||||
|
Other current assets
|
(11,931 | ) | 523,642 | |||||
|
Other non-current assets
|
(83,360 | ) | (412,554 | ) | ||||
|
Related party payables
|
(199,995 | ) | 162,750 | |||||
|
Accounts payable and accrued expenses
|
735,088 | (390,734 | ) | |||||
| Realized gain on trading securities | (32,677 | ) | - | |||||
|
Net cash (used) provided in operating activities
|
(222,717 | ) | 2,054,190 | |||||
|
INVESTING ACTIVITIES
|
||||||||
|
Purchases of property and equipment
|
(2,192,610 | ) | (2,014,415 | ) | ||||
|
Proceeds from sales of equipment
|
276,074 | 31,103 | ||||||
|
Purchase of investments
|
(1,425 | ) | (4,714 | ) | ||||
| Cash provided through Aspen Merger Transaction | 2,898,225 | - | ||||||
|
Sales of available-for-sale securities
|
336,505 | - | ||||||
|
Net cash provided (used) in investing activities
|
1,316,769 | (1,988,026 | ) | |||||
|
FINANCING ACTIVITIES
|
||||||||
|
Net line of credit (repayments) borrowings
|
(289,507 | ) | 1,202,500 | |||||
|
Proceeds from issuance of long-term debt
|
11,353,122 | 4,475,153 | ||||||
| Replacement of long-term debt | (10,668,346 | ) | (7,863,325 | ) | ||||
|
Distributions to members
|
- | (640,722 | ) | |||||
|
Cash distributed to member through deconsolidation of HNR
|
- | (77,821 | ) | |||||
|
Contributions from members
|
- | 2,070,552 | ||||||
|
Net cash provided (used) in financing activities
|
395,269 | (833,663 | ) | |||||
|
Net Increase (Decrease) in Cash and Cash Equivalents
|
1,489,321 | (767,499 | ) | |||||
|
Cash and Cash Equivalents, Beginning of Period
|
148,486 | 915,985 | ||||||
|
Cash and Cash Equivalents, End of Period
|
$ | 1,637,807 | $ | 148,486 | ||||
See notes to consolidated financial statements.
76
Consolidated Statements of Cash Flows (continued)
|
For the Years Ended
|
||||||||
|
December 31,
|
||||||||
|
2010
|
2009
|
|||||||
|
Supplemental Disclosure of Cash Flow Information
:
|
||||||||
|
Cash paid for interest
|
$ | 736,903 | $ | 690,463 | ||||
|
Cash paid for income taxes
|
$ | - | $ | 1,055,317 | ||||
|
Supplemental Disclosure of Investing and Financing Activities
:
|
||||||||
|
Non-cash impact of deconsolidation of HNR
|
$ | - | $ | 763,678 | ||||
|
Non-cash distribution of property and equipment to member
|
$ | - | $ | 38,000 | ||||
|
Non-cash commitments entered into for capital leases
|
$ | 455,093 | $ | - | ||||
| Non-cash contributions from members | $ | 548,000 | $ | - | ||||
|
Net Assets acquired through Aspen Merger Transaction
:
|
||||||||
|
Current Assets:
|
||||||||
|
Cash and cash equivalents
|
$ | 2,898,225 | $ | - | ||||
|
Federal income tax receivable
|
266,156 | - | ||||||
|
Investments
|
244,831 | - | ||||||
|
Prepaid expenses
|
11,265 | - | ||||||
|
Total Current Assets
|
3,420,477 | |||||||
|
Property plant and equipment
|
424 | - | ||||||
|
Deferred tax asset, non-current
|
111,306 | - | ||||||
|
Other Assets
|
18,823 | - | ||||||
|
Total Assets
|
$ | 3,551,030 | $ | - | ||||
|
Current Liabilities:
|
||||||||
|
Accounts payable and accrued liabilities
|
$ | 55,194 | $ | - | ||||
|
Net assets acquired through Aspen Merger Transaction
|
$ | 3,495,836 | $ | - | ||||
See notes to consolidated financial statements.
77
Notes to the Consolidated Financial Statements
The accompanying consolidated financial statements have been derived from the accounting records of Aspen Exploration Corporation (“Aspen”), Enservco LLC, Heat Waves Hot Oil Services LLC (“Heat Waves”), Dillco Fluid Service, Inc. (“Dillco”), Trinidad Housing LLC, HNR LLC, HES Services LLC, and Real GC LLC (collectively, the “Company”) as of December 31, 2010 and 2009 and the results of operations for the years then ended. The below table provides an overview of the Company’s current ownership hierarchy:
|
Name
|
State of Formation
|
Ownership
|
Business
|
|
Dillco Fluid Service, Inc. (“Dillco”)
|
Kansas
|
100% by Enservco
|
Oil and natural gas field fluid logistic services primarily in the Hugoton Basin in western Kansas and northwestern Oklahoma.
|
|
Aspen Gold Mining Co.
|
Colorado
|
100% by Enservco
|
No active business operations or assets.
|
|
Heat Waves Hot Oil Services LLC (“Heat Waves”)
|
Colorado
|
100% by Dillco
|
Oil and natural gas well services, including logistics and stimulation
|
|
HE Services, LLC (“HES”)
|
Nevada
|
100% by Heat Waves
|
No active business operations. Owns construction equipment used by Heat Waves.
|
|
Real GC, LLC (“Real GC”)
|
Colorado
|
100% by Heat Waves
|
No active business operations. Owns real property in Garden City, Kansas that is utilized by Heat Waves.
|
|
Trinidad Housing, LLC (“Trinidad Housing”)
|
Colorado
|
100% by Dillco.
|
No currently active business operations. Owns real property
in Trinidad, Colorado.
|
On July 27, 2010 Dillco became a wholly owned subsidiary of Aspen (the “Merger Transaction”). At the time of the Merger Transaction Aspen was not engaged in active business operations whereas Dillco conducted operations both directly and through subsidiary entities.
It should be noted that because the Merger Transaction closed on July 27, 2010, the results of operations for the periods ending December 31, 2010 and 2009 do not include those of Aspen until July 27, 2010. Additionally, the results of operations for the year ending December 31, 2010 and 2009 do not include those of HNR as it was deconsolidated as of December 31, 2009. On December 30, 2010, the Company changed its name from Aspen Exploration Corporation to Enservco Corporation.
78
The accompanying consolidated financial statements were prepared in accordance with accounting principles generally accepted in the United States of America (“GAAP”). All significant inter-company balances and transactions have been eliminated in the accompanying consolidated financial statements.
Cash and Cash Equivalents
The Company considers all highly liquid instruments purchased with an original maturity of three months or less to be cash equivalents. The Company continually monitors its positions with, and the credit quality of, the financial institutions with which it invests.
Accounts Receivable
Accounts receivable are stated at the amount billed to customers. The Company provides a reserve for doubtful accounts based on a review of outstanding receivables, historical collection information and existing economic conditions. The provision for uncollectible amounts is continually reviewed and adjusted to maintain the allowance at a level considered adequate to cover future losses. The allowance is management's best estimate of uncollectible amounts and is determined based on historical performance that is tracked by the Company on an ongoing basis. The losses ultimately incurred could differ materially in the near term from the amounts estimated in determining the allowance. As of December 31, 2010 and 2009 the Company has recorded an allowance for doubtful accounts balance of $110,000 and $211,371, respectively. Also, as of December 31, 2010 and 2009 the Company has recorded bad debt expense of $90,799 and $188,531, respectively.
Inventory
Inventory consists primarily of diesel fuel and chemicals that are used in the servicing of oil wells and is carried at the lower of cost or market in accordance with the first in, first out method.
Property and Equipment
Property and equipment consists of (1) trucks, trailers and pickups; (2) trucks that are in various stages of fabrication; (3) real property which includes land and buildings used for office and shop facilities and wells used for the disposal of water; and (4) other equipment such as tools used for maintaining and repairing vehicles, office furniture and fixtures, and computer equipment. Property and equipment is stated at cost less accumulated depreciation. The Company charges repairs and maintenance against income when incurred and capitalizes renewals and betterments, which extend the remaining useful life or expand the capacity of the assets. Depreciation is recorded on a straight-line basis over estimated useful lives of 5 to 30 years.
79
Leases
The Company conducts a major part of its operations from leased facilities. Each of these leases is accounted for as operating leases. Normally, the Company records rental expense on its operating leases over the lease term as it becomes payable. If rental payments are not made on a straight-line basis, per terms of the agreement, the Company records a deferred rent expense and recognizes the rental expense on a straight-line basis throughout the lease term. The majority of the Company’s facility leases contain renewal clauses and expire through November 2013. In most cases, management expects that in the normal course of business, leases will be renewed or replaced by other leases.
During 2010, the Company entered into several capital leases in order to acquire trucks and equipment. Each of these leases allow the Company to retain title of the equipment leased through the lease agreements upon final payment of all principal and interest due. The Company records the assets and liabilities associated with these leases at the present value of the minimum lease payments per the lease agreement. The assets and associated liabilities are separately identified in the balance sheet. The assets are classified as Property and Equipment and the liabilities are classified as current and long-term liabilities based on the contractual terms of the agreements and their associated maturities.
Long-Lived Assets
The Company reviews its long-lived assets for impairment whenever events or changes in circumstances indicate that the carrying amount of the asset may not be recovered. The Company looks primarily to the discounted future cash flows in its assessment of whether or not long-lived assets have been impaired. No impairments were recorded during the periods ended December 31, 2010 or 2009.
Revenue Recognition
The Company recognizes revenue when services are provided and collection is reasonably assured.
Earnings Per Share
Earnings per share is computed by dividing net income by the weighted average number of common shares outstanding for the period. Diluted earnings per share is calculated by dividing net income by the diluted weighted average number of common shares. The diluted weighted average number of common shares is computed using the treasury stock method for common stock that may be issued for outstanding stock options. For 2010, the Company excluded outstanding Stock-based Option Awards and Warrants of 2,690,431,which have a potentially dilutive impact on earnings per share. For 2009, the Company did not have any outstanding shares of Option Awards or Warrants as all outstanding shares for 2009 were issued through Aspen's 2008 Equity Plan as acquired through the Merger Transaction (see Note 14). Dilution is not permitted if there are net losses during the period. As such, the Company does not show dilutive earnings per share for the years ended December 31, 2010 and 2009.
Concentrations
During the year ended December 31, 2010, the Company had accounts receivable from two customers comprising 12% of accounts receivable each and one customer comprising 16% of
accounts receivable. Revenue from these three customers represented 3%, 4%, and 13% of total revenues for the year ended December 31, 2010, respectively.
80
During the year ended December 31, 2009, the Company had accounts receivable from two customers - each comprising 13% of accounts receivable. Revenue from these two customers represented 5% and 3% of total revenues for the year ended December 31, 2009.
Intangible Assets
Non-Competition Agreements
The non-competition agreements with the sellers of Heat Waves, Hot Oil Express, and Dillco have finite lives and are being amortized over a five-year period (Note 5). The Dillco non-competition agreement was written off in June 2009 upon the death of the contracted party. Amortization expense is expected to be recognized through June 2013.
Goodwill
Goodwill represents the excess of the cost over the fair value of net assets acquired, including identified intangible assets, recorded in connection with the acquisitions of Heat Waves. Goodwill is not amortized but is assessed for impairment at least annually. No impairment charge was recorded during the periods ended December 31, 2010 and 2009.
Marketable Securities
The Company determines the appropriate classification of its investments in debt and equity securities at the time of purchase and reevaluates such determinations at each balance sheet date. Debt securities are classified as held to maturity when the Company has the positive intent and ability to hold the securities to maturity. Debt securities for which the Company does not have the intent or ability to hold to maturity are classified as available for sale. Held-to-maturity securities are recorded as either short term or long term on the Balance Sheet, based on contractual maturity date and are stated at amortized cost. Marketable securities that are bought and held principally for the purpose of selling them in the near term are classified as trading securities and are reported at fair value, with unrealized gains and losses recognized in earnings. Debt and marketable equity securities not classified as held to maturity or as trading, are classified as available for sale, and are carried at fair market value, with the unrealized gains and losses, net of tax, included in the determination of comprehensive income and reported in stockholders’ equity.
The fair value of substantially all securities is determined by quoted market prices. The estimated fair value of securities for which there are no quoted market prices is based on similar types of securities that are traded in the market. See Note 9.
During 2010, the Company deemed it appropriate to reclassify its available-for-sale securities from Non-current Assets to Current Assets for comparability purposes. As such, at December 31, 2009, subsequent to the balance sheet date, the Company reclassified $97,034 out of Non-current Assets and into Current Assets.
In July 2010, the Company transferred all of its trading investments for Dillco to the available-for-sale category. Management determined that it no longer had the positive intent to buy
or hold the securities for the principal purpose of selling them in the near term nor was the Company’s primary business involved in the active trading of securities. See Note 9 below for further discussion.
81
For 2009, The Company’s short-term investments comprise equity securities, all of which are classified as trading securities and are carried at their fair value based on the quoted market prices of the securities at December 31, 2009. Net realized and unrealized gains and losses on trading securities are included in net earnings. For purpose of determining realized gains and losses, the cost of securities sold is based on specific identification. See Note 9.
Loan Fees and Other Deferred Costs
In the normal course of business, the Company often enters into loan agreements with their primary lending institutions. The majority of these lending agreements require origination fees and other fees in the course of executing the agreements. For all costs associated with the execution of the lending agreements, the Company recognizes these as capitalized costs and defers the expensing of these costs over the term of the loan agreement. These deferred costs are classified on the balance sheet as current or long-term assets based on the contractual terms of the loan agreements. All other costs not associated with the execution of the loan agreements are expensed as incurred.
Income Taxes
Enservco LLC (which served as the holding company for the Company’s various operating entities until July 2010) and its subsidiaries, with the exception of Dillco (which is a C Corporation subject to federal and state income taxes), are limited liability companies and prior to January 1, 2010 were not subject to federal or state income taxes. On January 1, 2010 Enservco LLC elected to be taxed as a corporation. Therefore, prior to January 1, 2010 no provision or liability for income taxes has been included in the accompanying financial statements, except for income taxes relating to the financial statements of Dillco and Aspen (named changed to Enservco on December 30, 2010), the current parent (or holding) company for the Company’s operations and assets.
The Company recognizes deferred tax liabilities and assets (Note 11) based on the differences between the tax basis of assets and liabilities and their reported amounts in the financial statements that will result in taxable or deductible amounts in future years. Deferred tax assets and liabilities are measured using enacted tax rates expected to apply to taxable income in the years in which those temporary differences are expected to be recovered or settled. The effect of a change in tax rates on deferred tax assets and liabilities will be recognized in income in the period that includes the enactment date. Deferred income taxes are classified as a net current or non-current asset or liability based on the classification of the related asset or liability for financial reporting purposes. A deferred tax asset or liability that is not related to an asset or liability for financial reporting is classified according to the expected reversal date. The Company records a valuation allowance to reduce deferred tax assets to an amount that the Company believes is more likely than not expected to be realized.
Effective January 1, 2009, the Company accounts for any uncertainty in income taxes by recognizing the tax benefit from an uncertain tax position only if it is more likely than not that the tax position will be sustained upon examination by the taxing authorities, based on the technical merits of the position. The Company measures the tax benefits recognized in the financial statements from such a position based on the largest benefit that has a greater than 50% likelihood of being realized
upon ultimate resolution. The application of income tax law is inherently complex. Laws and regulations in this area are voluminous and are often ambiguous. As such, the Company is required to make many subjective assumptions and judgments regarding income tax exposures. Interpretations of and guidance surrounding income tax law and regulations change over time and may result in changes to the Company’s subjective assumptions and judgments which can materially affect amounts recognized in the consolidated balance sheets and consolidated statements of income. The result of the reassessment of the Company’s tax positions did not have an impact on the consolidated financial statements.
82
When accounting for uncertainty in income taxes for those entities electing to be treated as limited liability companies for income tax purposes, if taxing authorities were to disallow any tax positions taken by the Company, the additional income taxes, if any, would be imposed on the member rather than the Company. Accordingly, there would be no effect on the Company’s financial statements.
Interest and penalties associated with tax positions are recorded in the period assessed as general and administrative expenses. No interest or penalties have been assessed as of December 31, 2009 and December 31, 2010. The Company files tax returns in the United States, in the states of Colorado, Kansas, Pennsylvania and Utah. The tax years 2007 through 2010 remain open to examination in the taxing jurisdictions to which the Company is subject.
Fair Value
Effective January 1, 2008, the Company adopted the authoritative guidance that applies to all financial assets and liabilities required to be measured and reported on a fair value basis. Beginning January 1, 2009, the Company also applied the guidance to non-financial assets and liabilities measured at fair value on a nonrecurring basis, including non-competition agreements and goodwill. The guidance defines fair value as the price that would be received to sell an asset or paid to transfer a liability (an exit price) in an orderly transaction between market participants at the measurement date. The guidance establishes a hierarchy for inputs used in measuring fair value that maximizes the use of observable inputs and minimizes the use of unobservable inputs by requiring that the most observable inputs be used when available.
Observable inputs are inputs that market participants would use in pricing the asset or liability developed based on market data obtained from sources independent of the Company. Unobservable inputs are inputs that reflect the Company’s assumptions of what market participants would use in pricing the asset or liability based on the best information available in the circumstances. The financial and nonfinancial assets and liabilities are classified based on the lowest level of input that is significant to the fair value measurement.
The hierarchy is broken down into three levels based on the reliability of the inputs as follows:
|
|
Level 1:
|
Quoted prices are available in active markets for identical assets or liabilities;
|
|
|
Level 2:
|
Quoted prices in active markets for similar assets and liabilities that are observable for the asset or liability; or
|
|
|
Level 3:
|
Unobservable pricing inputs that are generally less observable from objective sources, such as discounted cash flow models or valuations.
|
83
|
Stock-based Compensation
|
The Company accounts for stock-based compensation in accordance with Accounting Standards Codification 718, “
Stock Compensation
” (“ASC 718”), which required companies to recognize compensation expense for the share-based payments based on the estimated fair value of the awards. The effect of this guidance is described in Note 14.
Management Estimates
The preparation of the Company’s financial statements in conformity with accounting principles generally accepted in the United States of America requires management to make estimates and assumptions that affect the reported amounts of assets and liabilities and disclosure of contingent assets and liabilities at the date of the financial statements and the reported amounts of revenues and expenses during the reporting period. Actual results could differ from those estimates.
Accounting Pronouncements
Recently Adopted Accounting Guidance
In January 2010, the FASB issued additional guidance regarding fair value measurements, specifically requiring the disclosure of transfers in and out of Level 1 and 2 assets and liabilities (previously only required for those in Level 3) and more specific detailed disclosure of the activity in Level 3 fair value measurements (on a gross basis rather than a net basis). The new guidance also clarifies existing disclosure requirements regarding the level of disaggregation of asset and liability classes, as well as the valuation techniques and inputs used to measure fair value for Level 2 and Level 3 fair value measurements. The disclosure requirement for transfers in and out of Level 1 and 2 assets and liabilities was effective for the Company on January 1, 2010, and had no impact on the consolidated financial statements. The reporting of Level 3 activity on a gross basis will be effective for the company as of January 1, 2011, and is expected to not affect future consolidated financial statements as the Company currently does not hold any Level 3 assets or liabilities nor has the Company historically purchased or assumed Level 3 assets or liabilities which represent a significant component of total assets or liabilities.
On June 24, 2010, Aspen entered into an Agreement and Plan of Merger and Reorganization (the “Agreement”) with Dillco Fluid Service, Inc. (“Dillco”) which set forth the terms by which Dillco merged with a subsidiary of Aspen (the “Merger Transaction”). The Merger Transaction closed on July 27, 2010, and resulted in Dillco becoming a wholly owned subsidiary of the Company.
As part of the Merger Transaction, Aspen issued 14,519,244 shares of its common stock to the shareholders of Dillco, in exchange for all of the issued and outstanding shares of Dillco (7,259,622 shares).
The Merger Transaction was treated as a "reverse acquisition" for accounting purposes. In a reverse acquisition, although Aspen was considered to be the "legal acquirer" (that is, Aspen (now known as Enservco) survived as the parent corporation), Dillco was the "accounting acquirer" (that is because Dillco's and its subsidiaries' business was undeniably the more significant business). As a result, Dillco's financial statements became the financial statements of the surviving company. Aspen's financial condition is additive to Dillco's financial statements for the period following the Merger Transaction.
Effective with the agreement, the Company’s stockholders’ equity was recapitalized as that of Aspen,
or $72,596 from Dillco and $36,298 from Aspen for a total of $108,894, while 100% of the assets and liabilities of Aspen were recorded as being acquired in the reverse acquisition. See below for the Aspen net assets acquired by Dillco through the reverse merger acquisition:
84
|
Net Assets acquired through Aspen Merger Transaction
:
|
||||
|
Current Assets:
|
||||
|
Cash and cash equivalents
|
$ | 2,898,225 | ||
|
Federal income tax receivable
|
266,156 | |||
|
Investments
|
244,831 | |||
|
Prepaid expenses
|
11,265 | |||
|
Total Current Assets
|
3,420,477 | |||
|
Property plant and equipment
|
424 | |||
|
Deferred tax asset, non-current
|
111,306 | |||
|
Other Assets
|
18,823 | |||
|
Total Assets
|
$ | 3,551,030 | ||
|
Current Liabilities:
|
||||
|
Accounts payable and accrued liabilities
|
$ | 55,194 | ||
|
Net assets acquired through Aspen Merger Transaction
|
$ | 3,495,836 | ||
The accompanying financial statements exclude the financial position, results of operations and cash flows of Aspen prior to the July 27, 2010 acquisition. If Aspen’s activity for 2009 is presented, and its net loss of ($402,837) for the period from January 1, 2010 through July 26, 2010 is combined with the Company’s net loss of ($1,845,665) for 2010, the pro forma results are as follows:
|
Proforma Information (presented for the year ended December 31, 2010 and 2009)
|
|||||||||
| 2010 | 2009 | ||||||||
|
Proforma Revenues
|
$ | 18,641,286 | $ | 15,388,746 | |||||
|
Proforma Net Income (Loss)
|
$ | (2,248,502 | ) | $ | (7,091,870 | ) | |||
|
Income (Loss) Per Common Share – Basic and Diluted
|
$ | (0.13 | ) | $ | (0.33 | ) | |||
| Weighted average number of common shares outstanding |
17,641,876
|
21,778,866 | |||||||
85
Accumulated other comprehensive loss for the years ending December 31, 2010 and 2009, consists of net unrealized gains on available-for-sale securities in 2010 and interest rate swaps in 2009. Changes in accumulated other comprehensive loss for the periods presented, are as follows:
|
2010
|
2009
|
|||||||
|
Accumulated other comprehensive income (loss), January 1
|
$ | - | $ | (200,574 | ) | |||
|
Net unrealized gains on available-for-sale securities, net of taxes
|
||||||||
|
of $159,969 and $-0-, respectively
|
250,207 | - | ||||||
| Settlement of interest rate swap agreement | - | 200,574 | ||||||
|
Less: reclassification adjustment for gains realized in net income
|
(93,469 | ) | - | |||||
|
Accumulated other comprehensive income, December 31
|
$ | 156,738 | $ | - | ||||
Non-competition agreements consist of the following as of December 31, 2010 and 2009:
|
Non-competition agreements - net, at January 1, 2009
|
$ | 1,621,673 | ||
|
Amortization for the year ended December 31, 2009
|
(961,673 | ) | ||
|
Non-competition agreements - net, at December 31, 2009
|
660,000 | |||
|
Amortization for the year ended December 31, 2010
|
(240,000 | ) | ||
|
Non-competition agreements - net, at December 31, 2010
|
$ | 420,000 |
Amortization expense for the year ended December 31, 2009 and 2010 totaled $961,673 and $240,000, respectively. During the year ended December 31, 2009, the Dillco non-competition agreement was written off in full due to the death of the contracted party.
Amortization expense on these non-competition agreements for each of the next three years will be as follows:
|
Year Ended December 31,
|
||||
|
2011
|
$ | 240,000 | ||
|
2012
|
150,000 | |||
|
2013
|
30,000 | |||
|
Thereafter
|
- | |||
|
Total
|
$ | 420,000 | ||
86
Property and equipment consists of the following at:
|
December 31,
|
||||||||
|
2010
|
2009
|
|||||||
|
Trucks and vehicles
|
$ | 17,957,278 | $ | 15,775,425 | ||||
|
Other equipment
|
2,807,165 | 3,982,089 | ||||||
|
Buildings and improvements
|
1,717,618 | 1,705,313 | ||||||
|
Trucks in process
|
1,287,536 | 1,164,161 | ||||||
|
Capitalized truck leases
|
455,093 | - | ||||||
|
Land
|
521,420 | 516,420 | ||||||
|
Disposal wells
|
590,802 | 476,496 | ||||||
|
Total property and equipment
|
25,336,912 | 23,619,904 | ||||||
|
Accumulated depreciation
|
(10,884,614 | ) | (7,167,092 | ) | ||||
|
Property and equipment - net
|
$ | 14,452,298 | $ | 16,452,812 | ||||
Depreciation expense for the year ended December 31, 2010 and 2009 totaled $3,717,522 and $3,462,261, respectively.
See Note 15 regarding a refinancing of the Company’s debt subsequent to December 31, 2009, as the lines of credit discussed in this Note 7 have been terminated. The Company had a $4 million non-revolving line of credit and a $2 million revolving line of credit with a bank. The borrowings under both lines of credit were collateralized by substantially all assets of the Company and are guaranteed by the members of the Company. The lines of credit were subject to various covenants.
Non-Revolving Line of Credit
During the year ended December 31, 2009, the $4 million non-revolving line of credit was converted to a five-year term note (Note 8). The $4 million non-revolving line of credit had outstanding borrowings of $0 as of December 31, 2009. Interest on the non-revolving line of credit is indexed to the London Inter Bank Offered Rate (“LIBOR”) plus 2.31% per annum. Interest only payments were required monthly through the maturity date of September 4, 2009 when all outstanding principal and interest was due and at which time the Company converted the borrowings to a five-year term note (Note 8).
Revolving Line of Credit
The $2 million revolving line of credit had outstanding borrowings of $1,339,507 as of December 31, 2009. The Company’s borrowings under the revolving line of credit agreement were limited to the lesser of $2 million or 80% of Heat Waves and Dillco eligible accounts receivable, as defined. The definition of eligible accounts receivable contained various restrictions, including the
exclusion of receivables which are 90 days or older. During the year ended December 31, 2008 and until October 1, 2009 the interest rate was at the LIBOR rate plus 3.07% on the borrowings. Effective October 1, 2009, the Company amended the agreement and the interest rate changed to LIBOR plus 4.00%. Interest only payments were required monthly through the maturity date of July 2010.
87
Long-term debt consists of the following at (see Note 15 regarding refinancing of certain debt subsequent to December 31, 2009):
| December 31, | |||||||||
| 2010 | 2009 | ||||||||
|
Term Loan entered into as part of the debt refinancing, as described further within Note 15.
|
$ | 9,049,383 | $ | - | |||||
|
Notes payable to stockholder, subordinated to all bank debt, fixed interest at 3% compounding annually, interest paid in arrears December 31st of each year, due in December 2018.
|
1,700,000 | 500,000 | |||||||
|
Notes payable to equipment finance companies, interest at 2.97% to 4.74%, due in monthly principal and interest installments through January 2012, secured by equipment.
|
227,273 | 459,180 | |||||||
|
Note payable to the seller of Heat Waves, interest at 8%, due in installments in January and May 2009, secured by land. The note was garnished by the Internal Revenue Service (“IRS”) in 2009 and is due on demand.
|
386,000 | 422,000 | |||||||
|
Mortgage payable to a bank, interest at 8%, due in monthly payments through May 2012 with a balloon payment of $229,198 on June 15, 2012, secured by land, guaranteed by one of the members.
|
276,326 | 307,520 | |||||||
|
Note payable to the seller of Hot Oil Express, non-interest bearing, due in annual installments of $100,000 through March 2011, unsecured. Imputed interest is not significant. The company purchased fixed assets from Hot Oil Express during 2008.
|
100,000 | 200,000 | |||||||
|
Mortgage payable to a bank, interest at 8%, payable in monthly payments through August 2012 with a balloon payment of $141,707 on September 1, 2012, secured by land.
|
155,980 | 163,689 | |||||||
|
Notes payable to a vehicle finance company, interest at fixed rates from 6.19% to 10.25%, due in monthly installments through August 2015, secured by vehicles, guaranteed by one of the stockholders.
|
154,763 | 155,949 | |||||||
88
| December 31, | |||||||||
| 2010 | 2009 | ||||||||
|
Capital leases entered into with a leasing company in order to purchase trucks and trailers, interest at a fixed rate of 5%. Truck lease term of 24 months, due in monthly installments through September 2012. Trailer lease term of 36 months, payments due in monthly installments through September 2013.
|
$ | 411,072 | $ | - | |||||
|
Equipment Loan entered into with an original principal balance of $1,000,000, payable in two consecutive interest only payments, beginning 12/23/2010, forty-seven monthly consecutive principal and interest payments of $23,290.52, beginning 2/23/2011, and one final principal and interest payment of $23,315.49 due on 1/23/2015. Interest at Prime plus 1% with a 5.5% floor, collateralized by equipment purchased with the equipment loan, guaranteed by the subsidiaries and stockholders of the Company, subject to financial covenants (Note 16).
|
1,000,000 | - | |||||||
| Note payable to a bank, paid in full during 2010. | - | 365,178 | |||||||
|
Note payable to a bank, paid in full during 2010.
|
- | 3,975,154 | |||||||
|
Note payable to a bank, paid in full during 2010.
|
- | 2,510,859 | |||||||
|
Note payable to a bank, paid in full during 2010.
|
- | 1,686,236 | |||||||
|
Note payable to a bank, paid in full during 2010.
|
- | 1,295,115 | |||||||
|
Holdback payable to the seller of Dillco, paid in full during 2010.
|
- | 250,000 | |||||||
|
Other notes payable.
|
4,000 | 34,048 | |||||||
|
Total
|
13,464,797 | 12,324,928 | |||||||
|
Less current portion
|
(3,107,122 | ) | (1,132,412 | ) | |||||
|
Long-term debt, net of current portion
|
$ | 10,357,675 | $ | 11,192,516 | |||||
Aggregate maturities of debt are as follows:
|
Year Ended December 31,
|
||||
|
2011
|
$ | 3,107,122 | ||
|
2012
|
2,818,222 | |||
|
2013
|
2,372,529 | |||
|
2014
|
2,435,985 | |||
|
2015
|
1,030,939 | |||
|
Thereafter
|
1,700,000 | |||
|
Total
|
$ | 13,464,797 | ||
89
Available-for-sale securities
As discussed in Note 2 above, in July 2010, the Company transferred all of its trading investments for Dillco to the available-for-sale category. The securities transferred had a total amortized cost of $65,000, fair value of $61,533, sales of securities of $70,000 during 2010, and unrealized gross gains and losses of $69,370 and $2,837, respectively, at the time of the transfer.
Available-for-sale securities, classified as other current assets, is as follows at December 31, 2010:
| December 31, 2010 | ||||||||||||||||||||
|
Amortized Cost
|
Unrealized Gains in Accumulated Other Comprehensive Income
|
Unrealized Losses in Accumulated Other Comprehensive Income
|
Sales of Securities (at Cost)
|
Fair Value
|
||||||||||||||||
|
Common Stock (Mutual Funds)
|
$ | 306,364 | $ | 454,090 | $ | (58,163 | ) | $ | (336,505 | ) | $ | 365,786 | ||||||||
During the year ended December 31, 2010, available-for-sale securities were sold for total proceeds of $332,200. The gross realized gains on these sales totaled $154,084. For purpose of determining gross realized gains, the cost of securities sold is based on specific identification. Net unrealized holding gains on available-for-sale securities in the amount of $395,927 for the year ended December 31, 2010, have been included in accumulated other comprehensive income.
Trading securities
The composition of trading securities, classified as other current assets, is as follows at December 31, 2010 and 2009:
|
December 31, 2010
|
December 31, 2009
|
|||||||||||||||
|
Cost
|
Fair Value
|
Cost
|
Fair Value
|
|||||||||||||
|
Common Stock (Money Market)
|
$ | - | $ | - | $ | 65,000 | $ | 97,034 | ||||||||
Investment income from trading securities for the years ended December 31, 2010 and 2009 consists of the following:
|
December 31,
|
|||||||||
| 2010(a) | 2009 | ||||||||
|
Purchase of Investments - Reinvested Dividends
|
$ | 1,425 | $ | 4,714 | |||||
|
Net realized holding gains
|
32,677 | - | |||||||
|
Total Investment (Loss) Income
|
$ | 34,102 | $ | 4,714 | |||||
{a} Note: The marketable securities for Dillco were transferred from Trading to Available-for-Sale category in July 2010. As such, the investment income balances for the year ended December 31, 2010 noted herein are for the period up through the transfer date.
90
The following tables present the Company’s financial assets and liabilities that were accounted for at fair value on a recurring basis by level within the fair value hierarchy:
|
December 31, 2010
|
||||||||||||||||
|
Level 1
|
Level 2
|
Level 3
|
Total
|
|||||||||||||
|
Marketable Securities
|
$ | 365,786 | $ | - | $ | - | $ | 365,786 | ||||||||
|
Interest rate swap liability
|
- | - | - | - | ||||||||||||
|
Total
|
$ | 365,786 | $ | - | $ | - | $ | 365,786 | ||||||||
|
December 31, 2009
|
||||||||||||||||
|
Level 1
|
Level 2
|
Level 3
|
Total
|
|||||||||||||
|
Marketable Securities
|
$ | 97,034 | $ | - | $ | - | $ | 97,034 | ||||||||
|
Interest rate swap liability
|
- | - | 140,733 | 140,733 | ||||||||||||
|
Total
|
$ | 97,034 | $ | - | $ | 140,733 | $ | 237,767 | ||||||||
As of December 31, 2009, the Company’s derivative financial instruments were comprised of two interest rate swap agreements. The fair value of the interest rate swap agreements is determined based on both observable and unobservable pricing inputs and therefore, the data sources utilized in this valuation model was considered Level 3 inputs in the fair value hierarchy.
The Company’s estimates of fair value of the interest rate swaps include consideration of expected future interest rates, counterparty’s credit worthiness, the Company’s credit worthiness, and the time value of money. The consideration of these factors results in an estimated exit-price for each derivative asset or liability under a market place participant’s view.
Level 3 Reconciliation
The following table sets forth a reconciliation of changes in the fair value of financial assets and liabilities classified as Level 3 in the fair value hierarchy. Interest rate swap liabilities (Level 3) consist of the following:
| Level 3 | ||||
|
Balance, January 1, 2009
|
$ | 200,574 | ||
|
Change in value
|
(59,841 | ) | ||
|
Balance, December 31, 2009
|
140,733 | |||
|
Change in value
|
(140,733 | ) | ||
|
Balance, December 31, 2010
|
$ | - |
91
During and before the 2009 calendar (and fiscal) year, Enservco LLC and some of its subsidiaries had elected to be treated as limited liability companies for income tax purposes. Accordingly, all taxable income and losses for these entities are reported in the respective income tax returns of the member and no provision for income taxes has been recorded in the accompanying financial statements. Subsidiaries taxed as corporations, however, do record a provision for income taxes.
Pursuant to a reorganization of the Company effective as of December 31, 2009, the ownership of Heat Waves, Trinidad Housing, Real GC and certain assets of HNR were contributed to Dillco. Since Dillco is a C Corporation, this reorganization effectively resulted in a conversion from a limited liability corporation to a C Corporation for the entities and the assets of HNR. Accordingly, the corresponding net deferred tax liabilities of Dillco were recorded as liabilities of the Company with a corresponding increase in deferred income tax expense.
Also, pursuant to the Merger Transaction with Aspen (a C Corporation) at July 27, 2010, the Company has recorded all net deferred tax assets contributed by Aspen as part of the merger transaction as an increase in the deferred income tax benefit. The Company’s sources of pre-tax income is comprised of operations in the United States only, the Company has no foreign source of income.
Income tax expense (benefit) attributable to income (loss) before income taxes for the years presented consists of:
|
December 31,
|
||||||||
|
2010
|
2009
|
|||||||
|
Current
|
||||||||
|
Federal
|
$ | - | $ | (383,049 | ) | |||
|
State
|
- | 13,468 | ||||||
| - | (369,581 | ) | ||||||
|
Deferred
|
||||||||
|
Federal
|
(807,446 | ) | 1,227,924 | |||||
|
State
|
(118,742 | ) | 114,539 | |||||
| (926,188 | ) | 1,342,463 | ||||||
|
(Benefit from) provision for income taxes
|
$ | (926,188 | ) | $ | 972,882 | |||
92
Total income tax expense (benefit) from continuing operations differs from the amount computed by applying the statutory federal income (loss) tax rate of 34% to income before taxes. The reasons for this difference for the years ended December 31, 2010 and 2009 are as follows:
|
December 31,
|
||||||||
|
2010
|
2009
|
|||||||
|
Computed expected tax expense (benefit)
|
$ | (926,449 | ) | $ | (1,673,678 | ) | ||
|
Increase (reduction) in income taxes resulting from:
|
||||||||
|
State and local income taxes, net of federal impact
|
(136,242 | ) | (107,968 | ) | ||||
|
Deferred Tax Liabilities due to Change in Tax Status
|
105,752 | 1,807,600 | ||||||
|
Income tax at owner level (pass-through)
|
- | 939,497 | ||||||
|
Nondeductible differences
|
30,751 | 9,536 | ||||||
|
Other
|
- | (2,105 | ) | |||||
|
(Benefit from) provision for income taxes
|
$ | (926,188 | ) | $ | 972,882 | |||
In assessing the realization of deferred tax assets, management considers whether it is more likely than not that some portion or all of the deferred tax assets will not be realized. The ultimate realization of deferred tax assets is dependent upon the generation of future taxable income during the periods in which those temporary differences become deductible. Management considers the scheduled reversal of deferred tax liabilities, projected future taxable income, and tax planning strategies in making this assessment.
Based upon the level of historical taxable income and projections for future taxable income over the periods in which the deferred tax assets are deductible, management believes it is more likely than not that the Company will realize the benefits of these deductible differences, net of the existing valuation allowances. The amount of the deferred tax asset considered realizable, however, could be reduced in the near term if estimates of future taxable income during the carryforward period are reduced.
As of December 31, 2010, the Company had a valuation allowance of $114,000 which was associated with the Aspen upon the Merger Transaction. As of December 31, 2009, the Company did not have a valuation allowance.
As of December 31, 2010, the Company had Federal net operating loss carryforwards of approximately $889,280 to reduce future taxable income, which expire after 2029. As of December 31, 2010, there are additional State net operating losses relating to net operating losses carryforward from Aspen upon the Merger Transaction and also additional State net operating losses associated with the tax returns filed for Dillco.
93
The components of deferred income taxes for the years ended December 31, 2010 and 2009 are as follows:
|
December 31, 2010
|
December 31, 2009
|
|||||||||||||||
|
Current
|
Long-Term
|
Current
|
Long-Term
|
|||||||||||||
|
Deferred tax assets
|
||||||||||||||||
|
Reserves and accruals
|
$ | 134,244 | $ | - | $ | 82,435 | $ | - | ||||||||
|
Amortization
|
- | 175,402 | - | 120,830 | ||||||||||||
|
Capital losses
|
- | 8,324 | - | 8,324 | ||||||||||||
|
FAS 123R - Accrued NSO Expense
|
- | 335,336 | ||||||||||||||
|
Net operating losses
|
- | 434,856 | - | 66,038 | ||||||||||||
| 134,244 | 953,918 | 82,435 | 195,192 | |||||||||||||
|
Less: Valuation Allowance
|
(13,993 | ) | (100,007 | ) | - | - | ||||||||||
|
Total deferred tax assets
|
120,251 | 853,911 | 82,435 | 195,192 | ||||||||||||
|
Deferred tax liabilities
|
||||||||||||||||
|
Depreciation
|
- | (2,288,193 | ) | - | (2,664,176 | ) | ||||||||||
|
Acquired intangible assets
|
(100,210 | ) | - | - | - | |||||||||||
|
Total deferred tax liabilities
|
(100,210 | ) | (2,288,193 | ) | - | (2,664,176 | ) | |||||||||
|
Net deferred tax assets
|
$ | 20,041 | $ | (1,434,282 | ) | $ | 82,435 | $ | (2,468,984 | ) | ||||||
The Company leases six facilities under lease commitments that expire through November 2013. Future minimum lease commitments are as follows:
|
Year Ended December 31,
|
||||
|
2011
|
$ | 168,900 | ||
|
2012
|
64,000 | |||
|
2013
|
27,500 | |||
|
2014
|
- | |||
|
Total
|
$ | 260,400 | ||
94
In September and October 2010, the Company entered into capital leases for five water transport units (each unit includes one truck and one trailer), which have been included in Property and Equipment (Note 6) and are summarized in the table below:
|
Capitalized Trucks
|
$ | 218,807 | ||
|
Capitalized Trailers
|
236,286 | |||
|
Total Capital Leases
|
455,093 | |||
|
Less: Accumulated Depreciation
|
(18,370 | ) | ||
|
Net Assets Under Capital Leases
|
$ | 436,723 |
The following is a summary of the future minimum lease payments under capital leases, together with the present value of the net minimum lease payments as of December 31, 2010:
|
Year Ended December 31,
|
Minimum Lease
Payments
|
|||
|
2011
|
$ | 200,173 | ||
|
2012
|
171,332 | |||
|
2013
|
63,484 | |||
|
Total minimum lease payments
|
434,989 | |||
|
Less: Interest
|
(23,916 | ) | ||
|
Net minimum lease payments
|
411,073 | |||
|
Less: Current portion
|
(184,172 | ) | ||
|
Long-term portion of net minimum lease payments
|
$ | 226,901 | ||
On July 28, 2010, the Company entered into an agreement with an investor relations firm and as part of the compensation paid to this firm, pursuant to that agreement, granted both principals of the firm a warrant to purchase 112,500 shares each of the Company’s common stock; sum of warrants issued equaled 225,000 shares of common stock available for purchase. The warrants are exercisable at $0.49 per share for a four year term. Each of the warrants may be exercised on a cashless basis. The warrants also provide that subject to various conditions, the holders have piggy-back registration rights with respect to the shares of common stock that may be acquired upon the exercise of the warrants.
The fair value of each warrant is estimated on the date of issuance using the Black-Scholes option pricing model. The grants issued in 2010 were valued using the following weighted average assumptions: no dividend yield, expected volatility of 96.4%, risk free interest rate of 1.07% and term of 4 years. Expected volatility was calculated based upon actual historical stock price movements over the most recent periods through the date of issuance, equal to the expected warrant term. The warrant term was based on the life of the warrant as stated on the warrant agreement. With a stock price of $0.53 on the date of issuance, these warrants had a fair-value of $0.36 per share. These warrants are classified as equity instruments on the balance sheet at December 31, 2010.
As of December 31, 2010 the Company recognized expense (through operating expense as general and administrative expense) of $81,771 on these warrants.
95
2010 Option Plan
On July 27, 2010 the Company’s Board of Directors adopted the Aspen Exploration 2010 Stock Incentive Plan (the “2010 Plan”). The aggregate number of shares of our common stock that may be issued through December 31, 2011 under all equity-based awards made under the 2010 Plan is 3,500,000 shares. The number of shares subject to the 2010 Plan may be reset each year, commencing January 1, 2012, based on the number of shares of stock then outstanding.
From July 27, 2010 through December 31, 2010 the Company granted options to acquire a total of 1,975,000 shares of common stock granted pursuant to the 2010 Plan. A portion of these options are subject to vesting schedules.
The exercise price of the options granted under the 2010 Plan was determined based on the terms and conditions within the 2010 Plan agreement unless specifically defined within the individual stock option agreements. Pursuant to the 2010 Plan, four options to acquire an aggregate of 975,000 shares of common stock were granted on the date of the Merger Transaction. The exercise price of these options was based on the closing price on the second business day following the Merger Transaction. Subsequently, another option to acquire 1,000,000 shares of common stock was granted and the exercise price was based on the ten day average closing price prior to the grant date. The fair value of each option grant is estimated on the date of grant using the Black-Scholes option pricing model. The options issued under the 2010 Plan were valued using the following weighted average assumptions: no dividend yield, expected volatility of 105.3%, risk free interest rate of 0.80% and expected term of 3.2 years. Expected volatility was calculated based upon actual historical stock price movements over the most recent periods through the date of issuance, equal to the expected option term. Expected pre-vesting forfeitures were assumed to be zero. The expected option term was calculated using the “simplified” method.
As of December 31, 2010 the Company recognized expense (through operating expense as general and administrative expense) of $342,277 on these options. As of December 31, 2010 the Company had unrecognized expense of $324,529 associated with these options. The options were classified as equity instruments on the balance sheet at December 31, 2010.
2008 Option Plan
Through its fiscal year ended June 30, 2009 Aspen had one equity compensation plan, the “2008 Equity Plan.” An aggregate of 1,000,000 common shares were reserved for issuance under the 2008 Equity Plan and in February 2008 the Board of Directors granted directors and employees options to acquire 775,000 shares which vested based on meeting certain performance goals, exercisable at $2.14 per share through February 27, 2013. Of these, all but 150,428 have expired as of December 31, 2010 for failure to meet established performance goals or as a result of termination of employment. As of December 31, 2010, the Company did not have any unrecognized expense associated with these options.
The fair value of each option grant is estimated on the date of grant using the Black-Scholes option pricing model. The options issued under the 2008 Equity Plan were valued using the following weighted average assumptions: no dividend yield, expected volatility of 58%, risk free interest rate of 2.25% and expected term of 3.3 years. Expected volatility was calculated based upon
actual historical stock price movements over the most recent periods through the date of issuance, equal to the expected option term. Expected pre-vesting forfeitures were assumed to be zero. The expected option term was calculated using the “simplified” method.
96
Pursuant to the 2008 Equity Plan, on February 15, 2010, Aspen’s Board of Directors granted options to certain Aspen employees and consultants. The options were granted to persons who remained with Aspen and had provided (and were then expected to continue to provide) valuable services to Aspen, and to help align interests of the recipients with those of Aspen and its stockholders. In total, Aspen granted options to acquire 350,000 shares of its common stock which were exercisable at $0.4125 per share (equal to 125% of the closing price on the business day after the day the Company filed its Form 10-Q for the quarter ended December 31, 2009).
Each of the options expires on February 15, 2015. All of the options granted vested only upon a “change of control” (which term is defined in each recipient’s option agreement), and then only if Aspen had working capital of at least $3,000,000 on the date of the change of control event. This vesting event was achieved for all of the 350,000 options as a result of the Merger Transaction on July 27, 2010. On July 27, 2010, the Company terminated the 2008 Equity Plan, although such termination did not terminate or otherwise affect the contractual rights of persons who hold options to acquire common stock under the 2008 Equity Plan.
As the Merger Transaction occurred on July 27, 2010, the stock compensation expense associated with these 350,000 options was not recognized by the Company on its consolidated financial statements subsequent to July 27, 2010.
The following information summarizes information with respect to options granted under all equity plans:
|
Number of
Shares
|
Weighted-Average
Exercise Price
|
Weighted-Average Remaining
Contractual Term
|
||||||||||
|
Outstanding at July 1, 2009*
|
578,766 | $ | 2.32 | 2.71 | ||||||||
|
Granted
|
350,000 | 0.41 | ||||||||||
|
Exercised
|
- | - | ||||||||||
|
Forfeited or Expired
|
(438,335 | ) | 1.29 | |||||||||
|
Outstanding at June 30, 2010*
|
490,431 | 0.96 | 4.01 | |||||||||
|
Granted
|
1,975,000 | 0.49 | ||||||||||
|
Exercised
|
- | - | ||||||||||
|
Forfeited or Expired
|
- | - | ||||||||||
|
Outstanding at December 31, 2010
|
2,465,431 | $ | 0.59 | 3.34 | ||||||||
|
Exercisable at June 30, 2010
|
150,428 | $ | 2.24 | 2.57 | ||||||||
|
Exercisable at December 31, 2010
|
1,308,761 | $ | 0.49 | 3.34 | ||||||||
97
A summary of the status of nonvested shares underlying the options are presented below:
| Number of Shares | Weighted-Average Grant-Date Fair Value | ||||||||
|
Nonvested at July 1, 2009*
|
258,338 | $ | 0.91 | ||||||
|
Granted
|
350,000 | 0.41 | |||||||
|
Vested
|
- | - | |||||||
|
Forfeited
|
(258,338 | ) | 0.91 | ||||||
|
Nonvested at June 30, 2010*
|
350,000 | 0.41 | |||||||
|
Granted
|
1,975,000 | 0.32 | |||||||
|
Vested
|
(1,158,333 | ) | 0.47 | ||||||
|
Forfeited
|
- | - | |||||||
|
Nonvested at December 31, 2010
|
1,166,667 | $ | 0.32 |
*Note: Options prior to the merger acquisition on July 27, 2010 were reported on a fiscal year period from July 1 through June 30.
On June 2, 2010, Dillco entered into two debt agreements with a bank to refinance certain debt obligations owed to a previous lender. The terms of the first of these agreements include:
(1) principal amount of $9,100,000;
(2) payment of interest only in monthly installments from July 2010 to June 2011;
(3) a one-time, $1,000,000 principal payment due July 2011;
(4) beginning July 2011, fixed monthly principal and interest installments of $188,700 until June 2015 at which time the remaining principal becomes due;
(5) a variable rate interest of PRIME plus 1% (not to be less than 5.5%);
(6) collateral consists of the equipment, inventory, and accounts of the Company;
(7) the obligation is guaranteed by a person who is both an officer and director of the of the Company, and the obligation is also guaranteed by Aspen; and
(8) the loan is subject to certain financial covenants.
98
When the Company negotiated its loan agreements with the bank as part of the debt refinancing discussed above, the bank insisted that they contain cross default provisions so that a default by Michael D. Herman (the Company’s principal stockholder, a director, and chief executive officer) on his personal indebtedness with the bank would constitute a default on the bank’s loans to Dillco. As a result of these cross-default provisions, should Mr. Herman default on any of the other debt he has through the bank in his personal capacity, the bank could declare Dillco’s loans in default and call upon the Company’s guarantee with respect to Dillco’s loans (but not Mr. Herman’s separate obligations). Upon an event of default, Dillco might not be able to immediately satisfy its obligations to the bank which would likely adversely impair the Company’s ability to conduct its business operations and pay its other obligations necessary to maintain its business operations.
The Company incurred $30,030 in origination fees and approximately $19,700 in additional fees for the issuance of this term loan.
The terms of the second loan agreement are the same except that it is a one year, $2,000,000 revolving line of credit subject to a borrowing base defined as the lesser of $2,000,000 or 80% of defined eligible accounts receivable. At December 31, 2010 the outstanding balance on the revolving line of credit was $1,050,000. The Company incurred $10,000 in origination fees for the issuance of this line of credit.
99
The following sets forth information regarding transactions between the Company (and its subsidiaries) and its officers, directors and significant stockholders since January 1, 2009. Any transactions between Aspen and its officers, directors, and significant stockholders occurring in Aspen’s last two fiscal years prior to the Merger Transaction date was disclosed in Aspen’s Annual Report on Form 10-K for its fiscal year ended June 30, 2010.
Loan Transactions
1. On November 21, 2009, Mr. Herman loaned $500,000 to Heat Waves pursuant to the terms of a promissory note (the “Heat Waves Note”). The Heat Waves Note accrues interest at 3% per annum and is due in full by December 31, 2018. As part of loan agreements with the Company’s primary lending institution, Mr. Herman agreed to subordinate the debt represented by this note to all obligations to the bank. Interest is to be paid annually in arrears but due to the subordination, interest is being accrued and as of December 31, 2010 accrued interest was $18,845.
2. On March 31, 2010, Mr. Herman loaned an additional $1,200,000 to Heat Waves pursuant to the terms of a promissory note (the “Heat Waves Note II”). The Heat Waves Note II accrues interest at 3% per annum and is due in full by December 31, 2018. As part of the loan agreements with the Company’s primary lending institution, Mr. Herman agreed to subordinate the debt represented by this note to all obligations to the bank. Interest is to be paid annually in arrears but due to the subordination, interest is being accrued and as of December 31, 2010 accrued interest was $30,360.
3. On July 27, 2010, Enservco (as the parent corporation) became the guarantor of Dillco’s indebtedness to the Company’s primary lending institution.
Asset Transfer and Sales; Membership Interest Transfer and Sales
1. On December 31, 2009, HNR sold certain assets to Dillco for $1,065,623. These assets included land, buildings, vehicles, equipment, and machinery used by Dillco as part of its business operations. The purchase price was based on an independent appraisal performed in December 2009. At the time of this transaction 100% of the membership interests of HNR were owned by Mr. Herman and his family members and the membership interests of Enservco LLC (being the former holding company of Dillco and its subsidiaries and related entities) were held by Mr. Herman (90%) and Mr. Kasch (10%).
2. On December 31, 2009, Mr. Herman transferred and assigned his membership interest in Real GC to Heat Waves in consideration for $174,382. This price was determined based on the parties’ estimate of the fair value of Real GC and the real property that it owns in Garden City, Kansas where an acid dock owned and utilized by Heat Waves is located. At the time of the transaction Mr. Herman was the sole member of Real GC, Enservco LLC (being the former holding company of Dillco and its subsidiaries and related entities) was the sole member of Heat Waves, and the membership interests of Enservco LLC were held by Mr. Herman (90%) and Mr. Kasch (10%).
3. On December 31, 2009, Enservco LLC (being the former holding company of Dillco and its subsidiaries and related entities) and Dillco entered into a Transfer and Contribution Agreement whereby Enservco LLC transferred, contributed, and conveyed all of its rights and interests in:
§
The assets it acquired from HNR on December 31, 2009 for $1,065,623.
§
Its rights and interests (100%) in the membership interests in both Heat Waves and Trinidad Housing.
100
Trinidad Housing owns a housing unit in Trinidad, Colorado that at times was previously utilized by certain Dillco employees. At the time of the transaction Enservco LLC owned 100% of the outstanding stock of Dillco itself and was the sole member of Trinidad Housing. Further, the membership interests of Enservco LLC were held at that time by Mr. Herman (90%) and Mr. Kasch (10%).
4. On March 1, 2010, Messrs. Herman and Kasch contributed their membership interests in HES to Enservco LLC (being the former holding company of Dillco and its subsidiaries and related entities). HES owns certain assets that it previously leased to Heat Waves including a disposal well, trucks and construction equipment. At the time of the transaction Mr. Herman held a 95% membership interest in HES and Mr. Kasch a 5% membership interest. Further, the membership interests of Enservco LLC were held by Mr. Herman (90%) and Rick Kasch (10%). Enservco LLC then contributed the HES membership interest to Dillco itself which in turn transferred the interest to Heat Waves. As a result, Heat Waves owns a 100% membership interest in HES.
5. On March 15, 2010, Mr. Herman sold a disposal well located in Oklahoma to HES in consideration for $100,000. Payment of the purchase price (which was due on or before September 15, 2010) was made on August 11, 2010.
Subsequent to the balance sheet date, on various dates throughout the first quarter of 2011 (Q1 2011), the Company purchased an additional $187,898 in fixed assets which were funded through the equipment loan. Of these $187,898 in purchases subsequent to the balance sheet date, $116,648 were included in fixed assets as Truck and Vehicles and the remaining $71,250 were included in Fixed Assets as Trucks in Process.
Also subsequent to the balance sheet date, on or around January 15, 2011, the Company disposed of four water transports and a pick-up truck. The original cost of these fixed assets was approximately $219,030. The accumulated depreciation at the point of disposal was approximately $171,325. The Company received proceeds of approximately $1,845 for the disposed assets. As such, the Company recognized a loss on disposal of fixed assets of approximately $45,860 in Q1 2011.
101
TABLE OF CONTENTS
Part IItem 1. BusinessItem 1A. Risk FactorsItem 1B. Unresolved Staff CommentsItem 2. Description Of PropertiesItem 3. Legal ProceedingsItem 4. Removed and ReservedPart IIItem 5. Market For Common Equity and Related Stockholder Matters and Issuer Purchases Of Equity SecuritiesItem 6. Selected Financial DataItem 7. Management's Discussion and Analysis Of Financial Condition and Plan Of OperationItem 7A. Quantitative and Qualitative Disclosures About Market RiskItem 8. Financial StatementsItem 9. Changes in and Disagreements with Accountants on Accounting and Financial DisclosureItem 9A Controls and ProceduresItem 9B. Other InformationPart IIIItem 10. Directors, Executive Officers, and Corporate GovernanceItem 11. Executive CompensationItem 12. Security Ownership Of Certain Beneficial Owners and ManagementItem 13. Certain Relationships and Related TransactionsItem 14. Principal Accountant S Fees and ServicesPart IVItem 15. ExhibitsNote 1 Basis Of PresentationNote 2 - Summary Of Significant Accounting PoliciesNote 3 Reverse Merger and AcquisitionNote 4 Accumulated Other Comprehensive IncomeNote 5 - Non-competition AgreementsNote 6 - Property and EquipmentNote 7 Lines Of CreditNote 8 Long-term DebtNote 9 Marketable SecuritiesNote 10 - Fair Value MeasurementsNote 11 Income TaxesNote 12 Commitments and ContingenciesNote 13 WarrantsNote 14 Stockholder S EquityNote 15 Debt RefinanceNote 16 Related Party TransactionsNote 17 Subsequent Events