ENSERVCO CORP
10-Ks and 10-Qs
|
|
|
|
|
|
|
|
|
|
|
|
|
|
|
|
|
|
|
|
|
|
|
|
|
|
|
|
|
UNITED STATES
SECURITIES AND EXCHANGE COMMISSION
WASHINGTON, D.C. 20549
FORM 10-K
| x | ANNUAL REPORT UNDER SECTION 13 OR 15(d) OF THE SECURITIES EXCHANGE ACT OF 1934. |
For the fiscal year ended December 31, 2013
| ¨ | TRANSITION REPORT UNDER SECTION 13 OR 15(d) OF THE SECURITIES EXCHANGE ACT OF 1934. |
For the transition period from _______ to ______
Commission file number:
000-9494

ENSERVCO CORPORATION
(Exact name of registrant as specified in its charter)
|
Delaware
|
|
84-0811316
|
|
(State or other jurisdiction of
incorporation or organization)
|
|
(IRS Employer
Identification No.)
|
|
|
|
|
|
501 South Cherry St., Ste. 320
Denver, CO
|
|
80246
|
|
(Address of principal executive offices)
|
|
(Zip Code)
|
Registrant’s telephone number:
(303) 333-3678
Securities registered pursuant to Section 12(b) of the Securities Exchange Act
:
|
Title of each class
|
|
Name of each exchange on which registered
|
|
Common stock, $0.005 par value
|
|
NYSE MKT
|
Securities registered pursuant to Section 12(g) of the Securities Exchange Act
: None
Indicate by check mark if the registrant is a well-known seasoned issuer, as defined in Rule 405 of the Securities Act:
o
Yes
þ
No
Indicate by check mark if the registrant is not required to file reports pursuant to Section 13 or Section 15(d) of the Act:
o
Yes
þ
No
Indicate by check mark whether the registrant (1) has filed all reports required to be filed by Section 13 or 15(d) of the Securities Exchange Act of 1934 during the preceding 12 months (or for such shorter period that the registrant was required to file such reports), and (2) has been subject to such filing requirements for the past 90 days.
þ
Yes
o
No
Indicate by check mark whether the registrant has submitted electronically and posted on its corporate Web site, if any, every Interactive Data File required to be submitted and posted pursuant to Rule 405 of Regulation S-T (§232.405 of this chapter) during the preceding 12 months (or for such shorter period that the registrant was required to submit and post such files).
þ
Yes
o
No
Indicate by check mark if disclosure of delinquent filers pursuant to Item 405 of Regulation S-K is not contained herein, and will not be contained, to the best of registrant’s knowledge, in definitive proxy or information statements incorporated by reference in Part III of this Form 10-K or any amendment to this Form 10-K.
þ
Indicate by check mark whether the registrant is a large accelerated filer, an accelerated filer, a non-accelerated filer, or a smaller reporting company. See the definitions of “large accelerated filer,” “accelerated filer” and “smaller reporting company” in Rule 12b-2 of the Securities Exchange Act of 1934.
|
Large accelerated filer
o
|
Accelerated filer
o
|
|
Non-accelerated filer
o
|
Smaller reporting company
þ
|
|
(Do not check if a smaller reporting company)
|
|
Indicate by check mark whether the registrant is a shell company (as defined in Rule 12b-2 of the Securities Exchange Act of 1934). Yes
o
No
þ
The aggregate market value of the common stock held by non-affiliates of the Registrant was approximately $
8,970,647
based upon the closing sale price of the Registrant’s Common Stock of $0.90 as of June 28, 2013, the last trading day of the registrant’s most recently completed second fiscal quarter.
This determination of affiliate status is not necessarily a conclusive determination for other purposes.
As of March 20, 2014, there were 36,204,671 shares of the Enservco Corporation’s common stock outstanding.
DOCUMENTS INCORPORATED BY REFERENCE
Certain portions of the registrant’s definitive information statement to be filed with the Securities and Exchange Commission pursuant to Regulation 14A not later than 120 days after the registrant's fiscal year ended December 31, 2013, in connection with the registrant’s 2014 Annual Meeting of Shareholders, are incorporated herein by reference into Part III of this Annual Report on Form 10-K.
PART I
ITEM 1.
BUSINESS
The Company was incorporated as Aspen Exploration Corporation under the laws of the State of Delaware on February 28, 1980 for the primary purpose of acquiring, exploring and developing oil and natural gas and other mineral properties.
During the first half of 2009, Aspen disposed of its oil and natural gas producing assets and as a result was no longer engaged in active business operations.
On June 24, 2010, Aspen entered into an Agreement and Plan of Merger and Reorganization with Dillco Fluid Service, Inc. (“Dillco”) which set forth the terms by which Dillco became a wholly owned subsidiary of Aspen on July 27, 2010 (the “Merger Transaction”).
On December 30, 2010, Aspen changed its name to “Enservco Corporation.” As such, throughout this report the terms the “Company” and/or “Enservco” are intended to refer to the Company on a post Merger Transaction basis and as a whole, with respect to both historical and forward looking contexts.
As a result of the Merger Transaction, the Company’s fiscal year was modified to be the calendar year.
The Company’s executive (or corporate) offices are located at 501 South Cherry St., Ste. 320, Denver, CO 80246.
Our telephone number is (303) 333-3678, and our facsimile number is (720) 974-3417.
Our website is www.enservco.com.
Cautionary Note Regarding Forward-Looking Statements
The information discussed in this annual report on Form 10-K includes “forward-looking statements” within the meaning of Section 27A of the Securities Act of 1933 (the “Securities Act”) and Section 21E of the Securities Exchange Act of 1934 (the “Exchange Act”).
All statements, other than statements of historical facts, included herein concerning, among other things, planned capital expenditures, future cash flows and borrowings, pursuit of potential acquisition opportunities, our financial position, business strategy and other plans and objectives for future operations, are forward-looking statements. These forward-looking statements are identified by their use of terms and phrases such as “may,” “expect,” “estimate,” “project,” “plan,” “believe,” “intend,” “achievable,” “anticipate,” “will,” “continue,” “potential,” “should,” “could,” and similar terms and phrases.
Although we believe that the expectations reflected in these forward-looking statements are reasonable, they do involve certain assumptions, risks and uncertainties. Our results could differ materially from those anticipated in these forward-looking statements as a result of certain factors, including, among others:
| · | capital requirements and uncertainty of obtaining additional funding on terms acceptable to us; |
| · | price volatility of oil and natural gas prices, and the effect that lower prices may have on our customers’ demand for our services, the result of which may adversely impact our revenues and stockholders' equity; |
| · | a decline in oil or natural gas production, and the impact of general economic conditions on the demand for oil and natural gas and the availability of capital which may impact our ability to perform services for our customers; |
| · | the broad geographical diversity of our operations which, while expected to diversify the risks related to a slow-down in one area of operations, also adds to our costs of doing business; |
| · | constraints on us as a result of our substantial indebtedness, including restrictions imposed on us under the terms of our credit facility agreement and our ability to generate sufficient cash flows to repay our debt obligations; |
| · | our history of losses and working capital deficits which, at times, were significant; |
| 2 | ||
|
|
| · | adverse weather and environmental conditions; |
| · | reliance on a limited number of customers; |
| · | our ability to retain key members of our senior management and key technical employees; |
| · | impact of environmental, health and safety, and other governmental regulations, and of current or pending legislation with which we and our customers must comply; |
| · | developments in the global economy; |
| · | changes in tax laws; |
| · | the effects of competition; |
| · | the effect of seasonal factors; |
| · | further sales or issuances of our common stock and the price and volume volatility of our common stock; and |
| · | our common stock’s limited trading history. |
Finally, our future results will depend upon various other risks and uncertainties, including, but not limited to, those detailed in the section entitled “Risk Factors” included elsewhere in this annual report. All forward-looking statements attributable to us or persons acting on our behalf are expressly qualified in their entirety by the cautionary statements in this section and elsewhere in this annual report. Other than as required under securities laws, we do not assume a duty to update these forward-looking statements, whether as a result of new information, subsequent events or circumstances, changes in expectations or otherwise.
Corporate Structure
Immediately prior to closing the Merger Transaction and as a result of an internal reorganization that commenced in 2009, Dillco’s assets and the ownership interests of its subsidiaries were held and controlled primarily through a holding company, Enservco LLC (“LLC”).
On July 26, 2010, Dillco merged into LLC, with Dillco being the surviving entity in that transaction. Prior to that transaction, the LLC served as a holding company for Dillco, Heat Waves Hot Oil Service LLC (“Heat Waves”), and other entities that owned assets utilized by the Company in its business operations.
Immediately prior to the completion of the Merger Transaction, Dillco had two owners, Michael D. Herman (90%) and Rick D. Kasch (10%).
Mr. Herman has been a Manager, Chairman, Chief Executive Officer, and control person of the LLC, Dillco, Heat Waves and the other Dillco subsidiaries since the time of their formation and/or acquisition by the LLC.
Mr. Kasch served as the Chief Financial Officer and a Manager for these same entities since the time of their formation and/or acquisition.
Messrs. Herman and Kasch became significant shareholders of the Company as a result of the Merger Transaction.
On May 29, 2013, three of the Company’s former subsidiaries, being Trinidad Housing, LLC, Aspen Gold Mining Company, and Heat Waves, LLC, were dissolved and Enservco Frac Services, LLC is being dissolved by operation of law.
None of these dissolved subsidiaries was engaged in active business operations prior to its dissolution.
As part of a corporate reorganization in May 2013, Dillco transferred its ownership in Heat Waves to Enservco through a tax free exchange.
| 3 | ||
|
|
The Company’s business operations are conducted primarily through Heat Waves and Dillco.
The below table provides an overview of the Company’s current subsidiaries and their activities.
|
Name
|
|
State of
Formation |
|
Ownership
|
|
Business
|
|
Heat Waves Hot Oil Service LLC (“Heat Waves”)
|
|
Colorado
|
|
100% by Enservco
|
|
Oil and natural gas well services, including logistics and stimulation.
|
|
|
|
|
|
|
|
|
|
Dillco Fluid Service, Inc. (“Dillco”)
|
|
Kansas
|
|
100% by Enservco
|
|
Oil and natural gas field fluid logistic services primarily in the Hugoton Basin in western Kansas and northwestern Oklahoma.
|
|
|
|
|
|
|
|
|
|
HE Services, LLC (“HES”)
|
|
Nevada
|
|
100% by Heat Waves
|
|
No active business operations.
Owns construction equipment used by Heat Waves.
|
|
|
|
|
|
|
|
|
|
Real GC, LLC (“Real GC”)
|
|
Colorado
|
|
100% by Heat Waves
|
|
No active business operations.
Owns real property in Garden City, Kansas that is used by Heat Waves.
|
Overview of Business Operations
As described above, the Company primarily conducts its business operations through two subsidiaries, Dillco and Heat Waves, which provide oil field services to the domestic onshore oil and natural gas industry.
These services include pressure testing, hot oiling, acidizing, frac water heating, freshwater and saltwater hauling, fluid disposal, frac tank rental, well site construction and other general oil field services.
As described in the table above, certain assets utilized by Heat Waves and Dillco in their business operations are owned by other subsidiary entities.
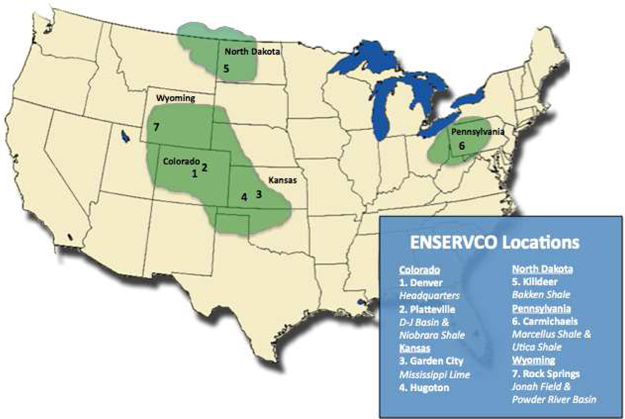
The Company currently operates in the following geographic regions:
| · | Eastern USA Region, including the southern region of the Marcellus Shale formation (southwestern Pennsylvania and northern West Virginia) and the Utica Shale formation in eastern Ohio. The Eastern USA Region operations are deployed from Heat Waves’ operations center in Carmichaels, Pennsylvania which opened in the first quarter of 2011. |
| · | Rocky Mountain Region, including western Colorado and southern Wyoming (D-J Basin and Niobrara formations), and western North Dakota and eastern Montana (Bakken formation). The Rocky Mountain Region operations are deployed from Heat Waves’ operations centers in Killdeer, North Dakota and Rock Springs, Wyoming; and Platteville, Colorado. |
| · | Central USA Region, including southwestern Kansas, Texas panhandle, northwestern Oklahoma, and northern New Mexico. The Central USA Region operations are deployed from operations centers in Garden City and Hugoton, Kansas. |
During 2012, the Company terminated its operations in the Uintah basin in northeastern Utah and sold the real property that it owned in Roosevelt, Utah.
The Company redeployed its equipment to its more stable and active operating centers.
Management believes that the Company is strategically positioned with its ability to provide its services to a large customer base in key oil and natural gas basins in the United States.
Management is optimistic that as a result of the significant expenditures the Company has made in new equipment in combination with expanding into new basins and geographical locations, the Company will be able to further grow and develop its business operations.
| 4 | ||
|
|
Historically, the Company focused its growth strategy on strategic acquisitions of operating companies and then expanding operations through additional capital investment consisting of the acquisition and fabrication of property and equipment.
That strategy also included expanding the Company’s geographical footprint as well as expanding the services it provides.
These strategies are exemplified by the acquisitions of operating entities (described in the
Operating Entities
section below) and:
| (1) |
In 2011, 2012 and 2013, Dillco and Heat Waves spent approximately $5.3 million, $3.8 million, and $5.8 million, respectively, for the acquisition and fabrication of property and equipment; and
|
|
| (2) |
To expand its footprint, in early 2010 Heat Waves began providing services in the Marcellus Shale natural gas field in southwestern Pennsylvania and West Virginia, and in September 2011 Heat Waves extended its services into the D-J Basin / Niobrara formation and the Bakken formation through opening new operation centers in southern Wyoming and western North Dakota, respectively.
Also, in late 2012 the Company expanded its operations, through its Pennsylvania operation center, into the Utica Shale formation in eastern Ohio.
|
Going forward, and subject to the availability of adequate financing, the Company expects to continue to pursue its growth strategies of exploring additional acquisitions, potentially expanding the geographic areas in which it operates, and diversifying the products and services it provides to customers, as well as making further investments in its assets and equipment.
Operating Entities
As noted above, the Company conducts its business operations and holds assets primarily through its subsidiary entities.
The following describes the operations and assets of the Company’s subsidiaries through which the Company conducts its business operations.
Dillco
. From its inception in 1974, Dillco has focused primarily on providing water hauling/disposal/storage services, well site construction services and frac tank rental to energy companies working in the Hugoton gas field in western Kansas and northwestern Oklahoma. Water hauling and disposal services have been the primary sources of Dillco’s revenue.
Dillco currently owns and operates a fleet of water hauling trucks and related assets, including specialized tank trucks, frac tanks, water disposal wells, construction and other related equipment. These assets transport, store and dispose of both fresh and salt water, as well as provide well site construction and maintenance services.
Heat Waves
. Heat Waves provides a range of well stimulation/maintenance services to a diverse group of independent and major oil and natural gas companies.
The primary services provided are intended to:
| (1) | Assist in the fracturing of formations for newly drilled oil and natural gas wells; and |
| (2) | Help maintain and enhance the production of existing wells throughout their productive life. |
These services consist of frac water heating, hot oiling and acidizing.
Heat Waves also provides some water hauling and well site construction services (though limited during 2012, as described within the
Construction and Roustabout Services
section below).
Heat Waves’ operations are currently in southwestern Kansas, Texas panhandle, northwestern Oklahoma, southern and central Wyoming (Niobrara formation), Colorado (D-J Basin), southwest Pennsylvania/ northwestern West Virginia (Marcellus Shale) region, eastern Ohio (Utica Shale), and western North Dakota and eastern Montana (Bakken formation).
| 5 | ||
|
|
HES
.
HES owns construction and related equipment that Heat Waves used in its well site construction and maintenance services.
However, HES does not currently engage in any business activities itself.
HES also owns a disposal well near Garden City, Kansas that Dillco uses for salt water disposal.
Products and Services
The Company provides a range of services to owners and operators of oil and natural gas wells.
Such services can generally be grouped into the three following categories:
| (1) | Well enhancement services, i.e., hot oiling, acidizing, frac water heating, and pressure testing; |
| (2) | Fluid management services, i.e., water/fluid hauling, frac tank rental, and disposal services; and |
| (3) | Well site construction and roustabout services. |
The following map shows the primary areas in which Heat Waves and Dillco currently have active business operations.
The following is a more complete description of the services provided by The Company through its subsidiaries.
| 6 | ||
|
|
Well Enhancement Services
.
Well enhancement services consist of frac water heating, acidizing, hot oiling services, and pressure testing.
These services are provided primarily by Heat Waves which currently utilizes a fleet of approximately 132 custom designed trucks and other related equipment.
Heat Waves’ operations are currently in southwestern Kansas, northwestern Oklahoma, Texas panhandle, southern Wyoming (Niobrara), Colorado (D-J Basin), southwestern Pennsylvania/northwestern West Virginia (Marcellus Shale) region, eastern Ohio (Utica Shale), and western North Dakota and eastern Montana (Bakken formation).
Well enhancement services accounted for approximately 80% of the Company’s total revenues for its 2013 fiscal year on a consolidated basis as compared to 65% for the 2012 fiscal year.
Frac Water Heating
- Fracturing services are intended to enhance the production from oil and natural gas wells where the natural flow has been restricted by underground formations through the creation of conductive flowpaths to enable the hydrocarbons to reach the wellbore. The fracturing process consists of pumping a fluid slurry, which largely consists of fresh water and a “proppant” (explained below), into a cased well at sufficient pressure to fracture (i.e. create conductive flowpaths) the producing formation.
Sand, bauxite or synthetic proppants are suspended in the fracturing fluid slurry and are pumped into the well under great pressure to fracture the formation.
To ensure these solutions are properly mixed (gel frac) or that plain water (used in slick water fracs) can flow freely, the water frequently needs to be heated to a sufficient temperature as determined by the well owner/operator.
Heat Waves currently owns and operates approximately 34 frac heaters (24 single burner units and 10 double burner units) designed to heat large amounts of water stored in reservoirs or frac tanks.
The Company has leased three additional frac heaters for the current heating season.
Acidizing
- Acidizing entails pumping large volumes of specially formulated acids and/or chemicals into a well to dissolve materials blocking the flow of the oil or
natural gas.
The acid is pumped into the well under pressure and allowed time to react. The spent fluids are then flowed or swabbed out of the well, after which the well is put back into production.
Acidizing is most often used to increase permeability throughout the formation, clean up formation damage near the wellbore caused by drilling, and to remove buildup of materials restricting the flow of oil and gas in the formation or through perforations in the well casing.
Heat Waves provides acidizing services by utilizing its fleet of three mobile acid transport and pumping trucks.
For most customers, Heat Waves supplies the acid solution and also pumps that solution into a given well.
There are customers who provide their own solutions and hire Heat Waves to pump the solution.
Hot Oil Services
– Hot oil services involve the circulation of a heated fluid, typically oil, to dissolve, melt, or dislodge paraffin or other hydrocarbon deposits from the tubing of a producing oil or natural gas well.
These deposits build up over a period of time from normal production operations, although the rate at which these products build up depends on the chemical character of the oil and natural gas being produced.
This is performed by circulating the hot oil down the casing and back up the tubing to remove the deposits from the well bore.
Hot oil servicing also includes the heating of oil storage tanks.
The heating of storage tanks is done:
| (1) | To eliminate water and other soluble waste in the tank for which the operator’s revenue is reduced at the refinery; and |
| (2) | Because heated oil flows more efficiently from the tanks to transports taking oil to the refineries in colder weather. |
| 7 | ||
|
|
Heat Waves currently owns and operates approximately 30 hot oil trucks in its fleet - 27 are actively working and 3 are used for standby work.
The Company currently has four hot oil trucks in fabrication and expects delivery near the start of the second quarter of 2014.
Pressure Testing
–
Pressure testing consists of pumping fluids into new or existing wells or other components of the well system such as flow lines to detect leaks.
Hot oil trucks and pressure trucks are used to perform this service.
Fluid Services
.
Water Hauling –
Water hauling accounted for approximately 19% of the Company’s revenues on a consolidated basis during 2013 as compared to 30% during our 2012 fiscal year.
The Company currently owns or leases, and operates approximately 65 water hauling trucks and trailers equipped with pumps to move water from or into wells, tanks and other storage facilities in order to assist customers in managing their water-cost needs.
Each truck has a hauling capacity of up to 130 barrels (each barrel being equal to 42 U.S. gallons). The trucks are used to:
| (1) | Transport water to fill frac tanks on well locations, |
| (2) | Transport contaminated water produced as a by-product of producing wells to disposal wells, including disposal wells that we own and operate, and |
| (3) | Transport drilling and completion fluids to and from well locations; following completion of fracturing operations, the trucks are used to transport the flow-back produced as a result of the fracturing process from the well site to disposal wells. |
Most wells produce residual salt or fresh water in conjunction with the extraction of the oil or natural gas. The Company’s trucks pick up water at the well site and transport it to a disposal well for injection or to other environmentally sound surface recycling facilities.
This is regular maintenance work that is done on a periodic basis depending on the volume of water a well produces.
Water-cost management is an ongoing need for oil and natural gas well operators throughout the life of a well.
The Company’s ability to outperform competitors in this segment is primarily dependent on logistical factors such as the proximity between areas where water is produced or used and the strategic placement and/or access to both disposal wells and recycling facilities.
The Company owns four water disposal wells in Kansas and Oklahoma.
It is management’s intent to maintain the Company’s disposal well holdings and access to recycling facilities, but also to use disposal wells and other facilities owned by third parties where appropriate.
Typically the Company and a customer enter into a contract for services after that customer has completed a competitive bidding process. Requirements for minor or incidental water hauling services are usually purchased on a “call out” basis and charged according to a published schedule of rates.
The Company competes for services both on a call out and contractual basis.
Workover, completion, and remedial activities also provide the opportunity for higher operating margins from tank rentals and water hauling services. Drilling and workover jobs typically require water for multiple purposes. Completion and workover procedures often also require large volumes of water for fracturing operations, a process of stimulating a well hydraulically to increase production. All fluids are required to be transported from the well site to an approved disposal facility.
Competitors in the water hauling business, where the Company provides this service, are mostly small, regionally focused companies. The level of water hauling activity is comprised of a relatively stable demand for services related to the maintenance of producing wells and a highly variable demand for services used in the drilling and completion of new wells.
As a result, the level of domestic onshore drilling activity significantly affects the level of the Company’s activity in this service area, and may vary from region to region and from season to season.
| 8 | ||
|
|
Disposal Well Services –
The Company owns four disposal wells in Kansas and Oklahoma that allow for the injection of salt water and incidental non-hazardous oil and natural gas wastes.
Our trucks frequently transport fluids to be disposed of into these disposal wells. The Company’s disposal wells are located in southwestern Kansas and northwestern Oklahoma in areas in proximity to our customers’ producing wells in those areas. Most oil and natural gas wells produce varying amounts of water throughout their productive lives. In the states in which we operate, oil and
natural gas wastes and water produced from oil and natural gas wells are required by law to be disposed of in authorized facilities, including permitted water disposal wells.
These disposal wells are licensed by state authorities pursuant to guidelines and regulations imposed by the Environmental Protection Agency and the Safe Drinking Water Act and are completed in an environmentally sound manner in permeable formations below the fresh water table.
Frac Tank Rental –
The Company also generates a small amount of revenues from the rental of frac tanks.
The Company currently owns approximately 20 frac tanks, which can store up to 500 barrels of water and are used by oilfield operators to store fluids at the well site, including fresh water, salt water, and acid for frac jobs, flowback, temporary production and mud storage. Frac tanks are used during all phases of the life of a producing well. The Company generally rents frac tanks at daily rates and charges hourly rates for the transportation of the tanks to and from the well site.
Construction and Roustabout Services
.
Well-site construction and roustabout services accounted for less than 1% of the Company’s revenues on a consolidated basis during 2013 and, similarly, accounted for an immaterial portion of the Company’s consolidated revenues during the 2012 fiscal year.
In December 2012, the Company made the decision to discontinue its Heat Waves’ well-site construction and roustabout line of service and initiated efforts to close the operations and sell related equipment.
During the first half of 2013, the Company sold a majority of these assets and redeployed the few remaining assets back into operations.
The results of operations from the Heat Waves well-site construction and roustabout line of service have been reported under
Loss from discontinued operations, net of tax
in the consolidated statements of operations for the years ended December 31, 2013 and 2012. For further discussion, please see Note 3, Discontinued Operations, within the Notes to the Consolidated Financial Statements within this report.
Ownership of Company Assets
As described above, the Company owns and uses a fleet of trucks, frac tanks, disposal wells and other assets to provide its services and products.
Substantially all of the equipment and personal property assets owned by Dillco and Heat Waves are subject to a security interest to secure loans made to the Company and its wholly-owned subsidiaries.
Historically, during portions of our fiscal year as supply and demand requires, the Company has leased additional trucks and equipment.
These leases are treated as operating leases for accounting purposes, and the rent expense associated with these leases is reported ratably over the term of the lease.
| 9 | ||
|
|
Competitive Business Conditions
The markets in which the Company currently operates are highly competitive. Competition is influenced by such factors as price, capacity, the quality, safety record and availability of equipment, availability of work crews, and reputation and experience of the service provider. The Company believes that an important competitive factor in establishing and maintaining long-term customer relationships is having an experienced, skilled, and well-trained work force that is responsive to our customers’ needs.
Although we believe customers consider all of these factors, price is often a primary factor in determining which service provider is awarded the work.
The demand for our services fluctuates primarily in relation to the worldwide commodity price (or anticipated price) of oil and
natural gas which, in turn, is largely driven by the worldwide supply of, and demand for, oil and natural gas, political events, as well as speculation within the financial markets.
Demand and prices are often volatile and difficult to predict and depends on events that are not within our control.
Generally, as supply of those commodities decreases and demand increases, service and maintenance requirements increase as oil and natural gas producers drill new wells and attempt to maximize the productivity of their existing wells to take advantage of the higher priced environment.
The Company’s competition primarily consists of small regional or local contractors.
The Company attempts to differentiate itself from its competition in large part through its superior equipment and the range and quality of services it has the capability to provide.
The Company invests a significant amount of capital into purchasing, developing, and maintaining a fleet of trucks and other equipment that are critical to the services it provides.
Further, the Company concentrates on providing services to a diverse group of large and small independent oil and natural gas companies. We believe we have been successful using this business model and believe it will enable us to continue to grow our business.
Dependence on One or a Few Major Customers
The Company serves numerous major and independent oil and natural gas companies that are active in its core areas of operations.
During the fiscal year ended December 31, 2013, one of the Company’s customers accounted for approximately 17% of consolidated revenues. No other customer exceeded 10% of consolidated revenues.
The Company’s top five customers in 2013 accounted for approximately 44% of its total revenues.
The loss of any one of these customers or a sustained decrease in demand by any of such customers could result in a substantial loss of revenues and could have a material adverse effect on the Company’s results of operations.
During the fiscal year ended December 31, 2012, two of the Company’s customers each accounted for approximately 11% of consolidated revenues. No other customer exceeded 7% of revenues.
The Company’s top five customers in 2012 accounted for approximately 40% of its total revenues.
While the Company believes its equipment could be redeployed in the current market environment if it lost any material customers, such loss could have an adverse effect on the Company’s business until the equipment is redeployed. We believe that the market for the Company’s services is sufficiently diversified that it is not dependent on any single customer or a few major customers.
Seasonality
Portions of the Company’s operations are impacted by seasonal factors, particularly with regards to its frac water heating and hot oiling services.
In regards to frac water heating, because customers rely on Heat Waves to heat large amounts of water for use in fracturing formations, demand for this service is much greater in the colder months.
Similarly, hot oiling services are in higher demand during the colder months when they are needed for maintenance of existing wells and to heat oil storage tanks.
Acidizing and pressure testing are done all year long with higher revenues during non-winter months.
| 10 | ||
|
|
The hauling of water from producing wells is not as seasonal as our other services since wells produce water whenever they are pumping regardless of weather conditions.
Hauling of water for the drilling or fracturing of wells is also not seasonal but dependent on when customers decide to drill or complete wells.
Raw Materials
The Company purchases a wide variety of raw materials, parts, and components that are made by other manufacturers and suppliers for our use.
The Company is not dependent on any single source of supply for those parts, supplies or materials. However, there are a limited number of vendors for propane and certain acids and chemicals.
The Company utilizes a limited number of suppliers and service providers available to fabricate and/or construct the trucks and equipment used in its hot oiling, frac water heating, and acid related services.
Patents, Trademarks, Licenses, Franchises, Concessions, Royalty Agreements or Labor Contracts
The Company enters into agreements with local property owners where its disposal wells are located by which the Company generally agrees to pay those property owners a fixed amount per month plus a percentage of revenues derived from utilizing those wells.
The terms of these agreements are separately negotiated with the given property owner, and during its 2013 and 2012 fiscal years the total amount paid under these various agreements by the Company was immaterial to the Company and its business operations.
As is the situation with all companies in the frac water heating service business, we rely on certain procedures and practices in performing our services.
We have a patent pending regarding certain of these used in our process of heating frac water.
We are aware that one unrelated company (the “Patent Owner”) has been awarded a patent related to the process they use for heating of frac water.
The Patent Owner is currently in litigation with a group of energy companies that are seeking to invalidate its patent.
After consultation with our patent attorneys, we do not currently believe we infringe on any valid claims of the Patent Owner’s patent.
Government Regulation
The Company and its subsidiaries are subject to a variety of government regulations ranging from environmental to OSHA to the Department of Transportation.
Our operations are also subject to stringent federal, state and local laws regulating the discharge of materials into the environment or otherwise relating to health and safety or the protection of the environment.
These
federal, state, and local laws and regulations relating to protection of the environment, wildlife protection, historic preservation, and health and safety are extensive and changing. The recent trend in environmental legislation and regulation is generally toward stricter standards, and we expect that this trend will continue as the governmental agencies issue and amend existing regulations.
Failure to comply with these laws and regulations as they currently exist or may be amended in the future may result in the assessment of substantial administrative, civil and criminal penalties, as well as the issuance of injunctions limiting or prohibiting activities.
Strict adherence with these regulatory requirements increases our cost of doing business and consequently affects our profitability.
The Company does not believe that it is in material violation of any regulations that would have a significant negative impact on the Company’s operations.
Through the routine course of providing services, the Company handles and stores bulk quantities of hazardous materials. If leaks or spills of hazardous materials handled, transported or stored by us occur, the Company may be responsible under applicable environmental laws for costs of remediating any damage to the surface or sub-surface (including aquifers).
| 11 | ||
|
|
The Comprehensive Environmental Response, Compensation and Liability Act (“CERCLA”), also known as “Superfund,” and comparable state statutes impose
strict, joint and several liability on owners and operators of sites and on persons who disposed of or arranged for the disposal of “hazardous substances” found at such sites. It is not uncommon for the government to file claims requiring cleanup actions, demands for reimbursement for government-incurred cleanup costs, or natural resource damages, or for neighboring landowners and other third parties to file claims for personal injury and property damage allegedly caused by hazardous substances released into the environment. The Federal Resource Conservation and Recovery Act, or RCRA, and comparable state statutes govern the disposal of “solid waste” and “hazardous waste” and authorize the imposition of substantial fines and penalties for noncompliance, as well as requirements for corrective actions. Although CERCLA currently excludes petroleum from its definition of “hazardous substance,” state laws affecting our operations may impose clean-up liability relating to petroleum and petroleum-related products. In addition, although RCRA classifies certain oil field wastes as “non-hazardous,” such exploration and production wastes could be reclassified as hazardous wastes thereby making such wastes subject to more stringent handling and disposal requirements. CERCLA, RCRA and comparable state statutes can impose liability for clean-up of sites and disposal of substances found on drilling and production sites long after operations on such sites have been completed. Other statutes relating to the storage and handling of pollutants include the Oil Pollution Act of 1990, or OPA, which requires certain owners and operators of facilities that store or otherwise handle oil to prepare and implement spill response plans relating to the potential discharge of oil into surface waters. The OPA contains numerous requirements relating to prevention of, reporting of, and response to oil spills into waters of the United States. State laws mandate oil cleanup programs with respect to contaminated soil. A failure to comply with OPA’s requirements or inadequate cooperation during a spill response action may subject a responsible party to civil or criminal enforcement actions.
In the course of the Company’s operations, it does not typically generate materials that are considered “hazardous substances.” One exception, however, would be spills that occur prior to well treatment materials being circulated down hole. For example, if the Company spills acid on a roadway as a result of a vehicle accident in the course of providing well enhancement/stimulation services, or if a tank with acid leaks prior to down hole circulation, the spilled material may be considered a “hazardous substance.” In this respect, the Company may occasionally be considered to “generate” materials that are regulated as hazardous substances and, as a result, may incur CERCLA liability for cleanup costs. Also, claims may be filed for personal injury and property damage allegedly caused by the release of hazardous substances or other pollutants.
The Clean Water Act (the “CWA”), and comparable state statutes, impose restrictions and controls on the discharge of pollutants, including spills and leaks of oil and other substances, into waters of the United States. The discharge of pollutants into regulated waters is prohibited, except in accordance with the terms of a permit issued by the Environmental Protection Agency (the “EPA”) or an analogous state agency. The CWA regulates storm water run-off from oil and natural gas facilities and requires a storm water discharge permit for certain activities. Such a permit requires the regulated facility to monitor and sample storm water run-off from its operations. The CWA and regulations implemented thereunder also prohibit discharges of dredged and fill material in wetlands and other waters of the United States unless authorized by an appropriately issued permit. The CWA and comparable state statutes provide for civil, criminal and administrative penalties for unauthorized discharges of oil and other pollutants and impose liability on parties responsible for those discharges for the costs of cleaning up any environmental damage caused by the release and for natural resource damages resulting from the release.
The Safe Drinking Water Act (the “SDWA”), and the Underground Injection Control (“UIC”) program promulgated thereunder, regulate the drilling and operation of subsurface injection wells, such as the disposal wells owned and operated by the Company. EPA directly administers the UIC program in some states and in others the responsibility for the program has been delegated to the state. The program requires that a permit be obtained before drilling a disposal well. Violation of these regulations and/or contamination of groundwater by oil and natural gas drilling, production, and related operations may result in fines, penalties, and remediation costs, among other sanctions and liabilities under the SWDA and state laws. In addition, third party claims may be filed by landowners and other parties claiming damages for alternative water supplies, property damages, and bodily injury.
| 12 | ||
|
|
Regulations in the states in which the Company owns and operates wells (Kansas and Oklahoma) require us to obtain a permit to operate each of our disposal wells. The applicable regulatory agency may suspend or modify one of our permits if the Company’s well operations are likely to result in pollution of freshwater, substantial violation of permit conditions or applicable rules, or if the well leaks into the environment.
The federal Energy Policy Act of 2005 amended the SDWA to exclude hydraulic fracturing from the definition of “underground injection” under certain circumstances.
However, the repeal of this exclusion has been advocated by certain advocacy organizations and others in the public.
The EPA at the request of Congress is currently conducting a national study examining the potential impacts of hydraulic fracturing on drinking water resources, with a draft of the final report expected to be released in 2014.
If new federal or state laws or regulations that significantly restrict hydraulic fracturing are adopted, such legal requirements could result in delays, eliminate certain drilling and injection activities, make it more difficult or costly for our customers to perform fracturing and increase their and our costs of compliance and doing business.
It is also possible that drilling and injection operations utilizing our services could adversely affect the environment, which could result in a requirement to perform investigations or clean-ups or in the incurrence of other unexpected material costs or liabilities.
Significant studies and research have been devoted to climate change and global warming, and climate change has developed into a major political issue in the United States and globally.
Certain research suggests that greenhouse gas emissions contribute to climate change and pose a threat to the environment.
Recent scientific research and political debate has focused in part on carbon dioxide and methane incidental to oil and natural gas exploration and production.
Many state governments have enacted legislation directed at controlling greenhouse gas emissions, and future state and federal legislation and regulation could impose additional restrictions or requirements in connection with our operations and favor use of alternative energy sources, which could increase operating costs and decrease demand for oil products.
As such, our business could be materially adversely affected by domestic and international legislation targeted at controlling climate change.
We are also subject to a number of federal and state laws and regulations, including the federal Occupational Safety and Health Act, or OSHA, and comparable state laws, whose purpose is to protect the health and safety of workers. In addition, the OSHA hazard communication standard, the EPA community right-to-know regulations under Title III of the federal Superfund Amendment and Reauthorization Act and comparable state statutes require that information be maintained concerning hazardous materials used or produced in our operations and that this information be provided to employees, state and local government authorities and citizens.
Because our trucks travel over public highways to get to customer’s wells, the Company is subject to the regulations of the Department of Transportation.
These regulations are very comprehensive and cover a wide variety of subjects from the maintenance and operation of vehicles to driver qualifications to safety.
Violations of these regulations can result in penalties ranging from monetary fines to a restriction on the use of the vehicles.
Under regulations effective July 1, 2010, the continued violation of regulations could result in a shutdown of all of the vehicles of either Dillco or Heat Waves.
The Company does not believe it is in violation of Department of Transportation regulations at this time that would result in a shutdown of vehicles.
| 13 | ||
|
|
Employees
As of March 14, 2014, the Company employed approximately 193 full time employees.
Of these employees, approximately 126 are employed by Heat Waves, approximately 55 by Dillco and 12 are employed by Enservco.
Available Information
We maintain a website at
http://www.enservco.com
. The information contained on, or accessible through, our website is not part of this Annual Report on Form 10-K. Our Annual Report on Form 10-K, Quarterly Reports on Form 10-Q, Current Reports on Form 8-K and amendments to reports filed or furnished pursuant to Sections 13(a) and 15(d) of the Exchange Act, are available on our website, free of charge, as soon as reasonably practicable after we electronically file such reports with, or furnish those reports to, the SEC.
We maintain a Code of Business Conduct and Ethics for Directors, Officers and Employees (“Code of Conduct”). A copy of our Code of Conduct may be found on our website in the Corporate Governance section under the main title “Investors”.
Our Code of Conduct contains information regarding whistleblower procedures.
We also maintain our Insider Trading Policy on our website.
The Company’s securities are highly speculative and involve a high degree of risk, including among other items the risk factors described below.
The below risk factors are intended to generally describe certain risks that could materially affect the Company and its current business operations and activities.
Y
ou should carefully consider the risks described below and elsewhere herein in connection with any decision whether to acquire, hold or sell the Company’s securities.
If any of the contingencies discussed in the following paragraphs or other materially adverse events actually occur, the business, financial condition and results of operations could be materially and adversely affected.
In such case, the trading price of our common stock could decline, and you could lose all or a significant part of your investment.
Operations Related Risks
Prior to 2012, we had losses and working capital deficits, which were at times significant and we cannot assure that we will continue to operate profitably in the future.
Although we have achieved income from operations in 2012 and 2013, we recognized a $(85,070) net loss in 2012 as compared to a $4.3 million net income in 2013. Our ability to be profitable in the future will depend on continuing to successfully implement our business diversification and acquisition activities, all of which are subject to many risks beyond our control.
Because of the risks set forth herein, we cannot assure you that we will be able maintain our profitability.
See, among other things, the Cautionary Note Regarding Forward-Looking Statements in addition to the other disclosures contained in this annual report.
Our success depends on key members of our management, the loss of any executive or key personnel could disrupt our business operations.
We depend to a large extent on the services of certain of our executive officers.
The loss of the services of Michael D. Herman, Rick D. Kasch, Austin Peitz, or other key personnel, could disrupt our operations.
Although we have entered into employment agreements with Messrs. Herman, Kasch and Peitz, that contain, among other things non-compete and confidentiality provisions, we may not be able to enforce the non-compete and/or confidentiality provisions in the employment agreements.
| 14 | ||
|
|
We depend on several significant customers, and a loss of one or more significant customers could adversely affect our results of operations.
The Company’s customers consist primarily of major and independent oil and natural gas companies.
During fiscal year 2013, one of the Company’s customers accounted for more than 10% of consolidated revenues, at approximately 17% of consolidated revenues; no other customer exceeded 10% of revenues during 2013.
During fiscal year 2012, two of the Company’s customers accounted for more than 10% of consolidated revenues, both at approximately 11%; no other customer exceeded 7% of revenues during 2012.
The Company notes that although there was only one customer in 2013 and two customers in 2012 that accounted for more than 10% of revenues within these fiscal years, the Company’s top five customers accounted for approximately 44% and 40% of its total annual revenues, respectively.
The loss of any one of these customers or a sustained decrease in demand by any of such customers could result in a substantial loss of revenues and could have a material adverse effect on the Company’s results of operations.
While the Company believes our equipment could be redeployed in the current market environment if we lost any material customers, such loss could have an adverse effect on the Company’s business until the equipment is redeployed. We believe that the market for the Company’s services is sufficiently diversified that it is not dependent on any single customer or a few major customers.
Our business depends on domestic spending by the oil and natural gas industry, and our business has been, and may in the future be, adversely affected by industry and financial market conditions that are beyond our control.
We depend on our customers’ willingness to make operating and capital expenditures to explore, develop and produce oil and natural gas in the United States.
Customers’ expectations for lower market prices for oil and natural gas, as well as the availability of capital for operating and capital expenditures, may cause them to curtail spending, thereby reducing demand for our services and equipment.
The increased activity in the oil and gas industry in drilling new wells since late 2010 has benefitted the Company.
We can make no assurances that the current level of drilling will continue or increase.
Industry conditions are influenced by numerous domestic and global factors over which the Company has no control, such as the supply of and demand for oil and natural gas, domestic and worldwide economic conditions, weather conditions, political instability in oil and natural gas producing countries, and merger and divestiture activity among oil and natural gas producers.
The volatility of the oil and natural gas industry and the consequent impact on commodity prices as well as exploration and production activity could adversely impact the level of drilling and activity by some of our customers.
This reduction may cause a decline in the demand for the Company’s services or adversely affect the price of its services.
In addition, reduced discovery rates of new oil and natural gas reserves in the Company’s market areas also may have a negative long-term impact on its business, even in an environment of stronger oil and natural gas prices, to the extent existing production is not replaced and the number of producing wells for the Company to service declines.
Ongoing volatility and uncertainty in the global economic environment has caused the oilfield services industry to experience volatility in terms of demand, and the rate at which demand may slow, or return to former levels, is uncertain.
At times the recent volatility in prices for oil and natural gas has led many oil and natural gas producers to announce reductions in their capital budgets for certain periods.
Limitations on the availability of capital, or higher costs of capital, for financing expenditures may cause these and other oil and natural gas producers to make on-going or additional reductions to capital budgets in the future even if commodity prices increase from current levels.
These cuts in spending will curtail drilling programs as well as discretionary spending on well services, which may result in a reduction in the demand for the Company’s services, the rates we can charge and our utilization.
In addition, certain of the Company’s customers could become unable to pay their suppliers, including the Company.
Any of these conditions or events could adversely affect our operating results.
| 15 | ||
|
|
If oil and natural gas prices remain volatile, it could have an adverse effect on the demand for our services.
The demand for many of our services is primarily determined by current and anticipated oil and natural gas prices, and the related general production spending and level of drilling activity in the areas in which we have operations.
Though we feel the domestic oil and gas industry rebounded in 2011 and has continued to push forward in a positive movement in 2012 and 2013 as compared to prior years, prices for oil and natural gas historically have been extremely volatile and likely will continue to be volatile.
Volatility or weakness in oil and natural gas prices (or the perception that oil and natural gas prices will decrease) affects the spending patterns of our customers and may result in the drilling of fewer new wells or lower production spending on existing wells.
This, in turn, could result in lower demand for our services and may cause lower rates and lower utilization of the Company’s well service equipment.
Higher oil and gas prices do not necessarily result in increased drilling activity because our customers’ expectation of future prices also drives demand for drilling services.
Oil and gas prices, as well as demand for the Company’s services, also depend upon other factors that are beyond the Company’s control, including the following:
|
|
·
|
demand for oil and natural gas;
|
|
|
·
|
cost of exploring for, producing, and delivering oil and natural gas;
|
|
|
·
|
expectations regarding future energy prices;
|
|
|
·
|
advancements in exploration and development technology;
|
|
|
·
|
adoption or repeal of laws regulating oil and gas production in the U.S.;
|
|
|
·
|
imposition or lifting of economic sanctions against foreign companies;
|
|
|
·
|
weather conditions;
|
|
|
·
|
rate of discovery of new oil and natural gas reserves;
|
|
|
·
|
tax policy regarding the oil and gas industry; and
|
|
|
·
|
development and use of alternative energy sources.
|
Demand for the majority of our services is substantially dependent on the levels of expenditures by the domestic oil and natural gas industry.
The Company has no influence over its customers’ capital expenditures.
On-going economic volatility could have a material adverse effect on our financial condition, results of operations and cash flows.
Demand for the majority of our services depends substantially on the level of expenditures by participants in the domestic (United States) oil and natural gas industry for the exploration, development and production of oil and natural gas reserves.
These expenditures are sensitive to the industry’s view of future economic growth in the United States and elsewhere, and the resulting impact on demand for oil and natural gas.
The worldwide deterioration in the financial and credit markets, which began in the second half of 2008, resulted in diminished demand for oil and natural gas and significantly lower oil and natural gas prices during 2009 and at least the first half of 2010.
This caused many of our customers to reduce or delay their oil and natural gas exploration and production spending in 2009 and the first half of 2010, which consequently reduced their demand for our services, and exerted downward pressure on the prices that we charged for our services and products.
Though we feel the domestic oil and gas industry rebounded in 2011, and has continued to push forward in a positive movement in 2012 and 2013 as compared to 2009 and 2010, other worldwide political events may result in higher or lower prices for oil and natural gas and impact the demand for our services.
| 16 | ||
|
|
Furthermore, increasing oil and natural gas prices can lead to increasing costs of exploring for and producing oil and natural gas.
Though the addition of frac stimulation into the domestic oil and gas industry has somewhat reduced the overall costs of producing oil and natural gas, the price of drill rigs, pipe, other equipment, fluids, and oil field services and the cost to companies like the Company of providing those services, has generally increased with significant increases in oil and natural gas prices.
The resulting reduction in cash flows being experienced by our customers during the past years due to the general deterioration of the financial and credit markets and the increase of the costs of exploring for and producing oil and natural gas as noted above, together with the reduced availability of credit and increased costs of borrowing funds, could have significant adverse effects on the financial condition of some of our customers.
This could result in project modifications, delays or cancellations, general business disruptions, and delay in, or nonpayment of, amounts that are owed to the Company, which could have a material adverse effect on our financial condition, results of operations and cash flows.
Environmental compliance costs and liabilities could reduce our earnings and cash available for operations.
We are subject to increasingly stringent laws and regulations relating to environmental protection and the importation and use of hazardous materials, including laws and regulations governing air emissions, water discharges and waste management.
We incur, and expect to continue to incur, capital and operating costs to comply with environmental laws and regulations.
The technical requirements of these laws and regulations are becoming increasingly complex, stringent and expensive to implement.
These laws may provide for “strict liability” for damages to natural resources or threats to public health and safety.
Strict liability can render a party liable for damages without regard to negligence or fault on the part of the party.
Some environmental laws provide for joint and several strict liability for remediation of spills and releases of hazardous substances.
The Company uses hazardous substances and transports hazardous wastes in its operations.
Accordingly, we could become subject to potentially material liabilities relating to the investigation and cleanup of contaminated properties, and to claims alleging personal injury or property damage as the result of exposures to, or releases of, hazardous substances.
In addition, stricter enforcement of existing laws and regulations, new laws and regulations, the discovery of previously unknown contamination or the imposition of new or increased requirements could require the Company to incur costs or become the basis of new or increased liabilities that could reduce its earnings and cash available for operations.
The Company believes it is currently in substantial compliance with environmental laws and regulations.
Competition within the well services industry may adversely affect our ability to market our services.
Although the well services industry is highly fragmented, it is highly competitive. The well services industry includes numerous small companies capable of competing effectively in our markets on a local basis, as well as several large companies that possess substantially greater financial and other resources than the Company.
The Company’s larger competitors have greater resources that could allow those competitors to compete more effectively than the Company.
The Company’s small competitors may be able to react to market conditions more quickly. The amount of equipment available may exceed demand at some point in time, which could result in active price competition.
| 17 | ||
|
|
The Company could be impacted by unfavorable results of legal proceedings, such as being found to have infringed on intellectual property rights.
As is the situation with all companies in the frac water heating service business, we rely on certain procedures and practices in performing our services.
We have a patent pending regarding certain of these used in our process of heating frac water.
We are aware that one unrelated company (the “Patent Owner”) has been awarded a patent related to the process they use for heating of frac water.
The Patent Owner is currently in litigation with a group of energy companies that are seeking to invalidate its patent.
After consultation with our patent attorneys, we do not currently believe we infringe on any valid claims of the Patent Owner’s patent.
Should the Patent Owner (or some other unknown third company) bring suit against us claiming we are infringing on their intellectual rights, we could be engaged in lengthy and costly litigation.
If found to be infringing, it could result in the payment of substantial damages or royalties or temporary or permanent injunction prohibiting us from heating frac water.
We believe that, in the event we were to lose such litigation, the probable resolution would be for us to enter into a license arrangement requiring payment of a royalty that would not have a
material
negative impact on our operating results and financial condition.
However, there is no assurance that such a resolution could be achieved.
Our operations are subject to inherent risks, some of which are beyond our control.
These risks may be self-insured, or may not be fully covered under our insurance policies, but to the extent not covered, are self-insured by the Company.
Our operations are subject to hazards inherent in the oil and natural gas industry, such as, but not limited to, accidents, blowouts, explosions, fires and oil spills.
These conditions can cause:
|
|
§
|
Personal injury or loss of life,
|
|
|
§
|
Damage to or destruction of property, equipment and the environment, and
|
|
|
§
|
Suspension of operations by our customers.
|
The occurrence of a significant event or adverse claim in excess of the insurance coverage that we maintain or that is not covered by insurance could have a material adverse effect on our financial condition and results of operations.
In addition, claims for loss of oil and natural gas production and damage to formations can occur in the well services industry.
Litigation arising from a catastrophic occurrence at a location where our equipment and services are being used may result in our being named as a defendant in lawsuits asserting large claims.
The Company maintains insurance coverage that we believe to be customary in the industry against these hazards.
However, we do not have insurance against all foreseeable risks, either because insurance is not available or because of the high premium costs.
The occurrence of an event not fully insured against, or the failure of an insurer to meet its insurance obligations, could result in substantial losses.
In addition, we may not be able to maintain adequate insurance in the future at reasonable rates.
Insurance may not be available to cover any or all of the risks to which we are subject, or, even if available, it may be inadequate, or insurance premiums or other costs could rise significantly in the future so as to make such insurance prohibitively expensive.
It is likely that, in our insurance renewals, our premiums and deductibles will be higher, and certain insurance coverage either will be unavailable or considerably more expensive than it has been in the recent past.
In addition, our insurance is subject to coverage limits, and some policies exclude coverage for damages resulting from environmental contamination.
| 18 | ||
|
|
We may not be successful in identifying, making and integrating business acquisitions, if any, in the future.
We anticipate that a component of our growth strategy may be to make geographically focused acquisitions aimed to strengthen our presence and expand services offered in selected regional markets.
Pursuit of this strategy may be restricted by the on-going volatility and uncertainty within the credit markets which may significantly limit the availability of funds for such acquisitions.
In addition to restricted funding availability, the success of this strategy will depend on our ability to identify suitable acquisition candidates and to negotiate acceptable financial and other terms.
There is no assurance that we will be able to do so.
The success of an acquisition depends on our ability to perform adequate due diligence before the acquisition and on our ability to integrate the acquisition after it is completed.
While the Company intends to commit significant resources to ensure that it conducts comprehensive due diligence, there can be no assurance that all potential risks and liabilities will be identified in connection with an acquisition.
Similarly, while we expect to commit substantial resources, including management time and effort, to integrating acquired businesses into ours, there is no assurance that we will be successful integrating these businesses.
In particular, it is important that the Company be able to retain both key personnel of the acquired business and its customer base.
A loss of either key personnel or customers could negatively impact the future operating results of any acquired business.
Compliance with climate change legislation or initiatives could negatively impact our business.
The U.S. Congress has considered legislation to mandate reductions of greenhouse gas emissions and certain states have already implemented, or may be in the process of implementing, similar legislation.
Additionally, the U.S. Supreme Court has held in its decisions that carbon dioxide can be regulated as an “air pollutant” under the Clean Air Act, which could result in future regulations even if the U.S. Congress does not adopt new legislation regarding emissions.
At this time, it is not possible to predict how legislation or new federal or state government mandates regarding the emission of greenhouse gases could impact our business; however, any such future laws or regulations could require us or our customers to devote potentially material amounts of capital or other resources in order to comply with such regulations.
These expenditures could have a material adverse impact on our financial condition, results of operations, or cash flows.
Debt Related Risks
Our indebtedness, which is currently collateralized by substantially all of our assets, could restrict our operations
and make us more vulnerable to adverse economic conditions.
We currently have a significant amount of indebtedness.
As of December 31, 2013, the Company owed approximately $13.8 million to banks and financial institutions under various collateralized debt facilities.
Our current and future indebtedness could have important consequences.
For example, it could:
|
|
§
|
Impair our ability to make investments and obtain additional financing for working capital, capital expenditures, acquisitions or other general corporate purposes,
|
|
|
§
|
Limit our ability to use operating cash flow in other areas of our business because we must dedicate a substantial portion of these funds to make principal and interest payments on our indebtedness,
|
|
|
|
|
|
|
§
|
Limit our ability to pay dividends to our stockholders,
|
|
|
§
|
Make us more vulnerable to a downturn in our business, our industry or the economy in general as a substantial portion of our operating cash flow will be required to make principal and interest payments on our indebtedness, making it more difficult to react to changes in our business and in industry and market conditions,
|
|
|
§
|
Put us at a competitive disadvantage to competitors that have less debt, or
|
| 19 | ||
|
|
|
|
§
|
Increase our vulnerability to interest rate increases to the extent that we incur variable rate indebtedness.
|
If we are unable to generate sufficient cash flow or are otherwise unable to obtain the funds required to make principal and interest payments on our indebtedness, or if we otherwise fail to comply with the various debt service covenants and/or reporting covenants in the business loan agreements or other instruments governing our current or any future indebtedness, we could be in default under the terms of our credit facilities or such other instruments.
The availability of borrowings under our credit facility is based on a borrowing base which is subject to redetermination by our lender based on a number of factors and the lender’s internal credit criteria.
In the event the amount outstanding under our credit facility at any time exceeds the borrowing base at such time, we may be required to repay a portion of our outstanding borrowings on an accelerated basis.
In the event of a default, the holders of our indebtedness could elect to declare all the funds borrowed under those instruments to be due and payable together with accrued and unpaid interest, the lenders under our credit facility could elect to terminate their commitments there under and we or one or more of our subsidiaries could be forced into bankruptcy or liquidation.
Any of the foregoing consequences could restrict our ability to grow our business and cause the value of our common stock to decline.
We may be unable to meet the obligations of various financial covenants that are contained in the terms of our loan agreements with our principal lender, PNC Bank, National Association.
The Company’s agreements with PNC impose various obligations and financial covenants on the Company.
The outstanding amount under the Revolving Credit, Term Loan, and Security Agreement, entered into with PNC in November 2012, is due in full in November 2015.
The term loan and revolving letter of credit with PNC have a variable interest rate, of which $3.5 million is guaranteed by the Company’s Chairman and CEO, and are collateralized by substantially all of the assets of the Company and its subsidiaries.
Further, the related agreements with PNC impose various financial covenants on the Company including maintaining a prescribed fixed charge coverage ratio, minimum tangible net worth, and limit the Company’s ability to incur additional debt or operating lease obligations.
If the Company is unable to comply with its obligations and covenants under the loan agreements and it declares an event of default, all of its obligations to PNC could be immediately due.
Although the Company has obtained waivers of financial covenants or modifications to our credit agreements in the past, there can be no assurance that we will be able to obtain these waivers or modifications in the future.
The variable rate indebtedness with PNC subjects us to interest rate risk, which could cause our debt service obligations to increase significantly.
The Company’s borrowings through PNC bear interest at variable rates, exposing the Company to interest rate risk.
The Company entered into an Interest Rate Swap Agreement with a notional balance of $11 million in conjunction with the November 2012 Revolving Credit, Term Loan, and Security Agreement entered into with PNC, effectively hedging a portion of our risk at a fixed interest rate of
4.25% plus 0.64% for the duration of the PNC Term Loan
.
However, the Company decided not to hedge against the interest rate risk associated with the revolving line of credit (with a maximum available balance of $5 million). We may increase, decrease or terminate some or all of these hedging arrangements in the future.
Depending on our overall hedging level, our debt service obligations could increase significantly in the event of large increases in interest rates.
| 20 | ||
|
|
Our debt obligations, which may increase in the future, may reduce our financial and operating flexibility.
As of December 31, 2013, we had approximately $13.8 million of secured indebtedness. As of March 7, 2014, we have borrowed approximately $1.9 million under our credit facility, and have approximately $2.9 million of borrowing capacity available under our credit facility.
In addition, we may incur substantial additional indebtedness in the future.
If new debt or other liabilities are added to our current debt levels, the related risks that we now face would increase.
A high level of indebtedness subjects us to a number of adverse risks.
In particular, a high level of indebtedness may make it more likely that a reduction in the borrowing base of our credit facility following a periodic redetermination could require us to repay a portion of outstanding borrowings, may impair our ability to obtain additional financing in the future, and increases the risk that we may default on our debt obligations.
In addition, we must devote a significant portion of our cash flows to servicing our debt, and we are subject to interest rate risk under our credit facility, which bears interest at a variable rate.
Any increase in our interest rates could have an adverse impact on our financial condition, results of operations and growth prospects.
Our ability to meet our debt obligations and to reduce our level of indebtedness depends on our future performance.
General economic conditions, oil and natural gas prices and financial, business and other factors affect our operations and our future performance.
Many of these factors are beyond our control.
If we do not have sufficient funds on hand to pay our debt when due, we may be required to seek a waiver or amendment from our lenders, refinance our indebtedness, incur additional indebtedness, sell assets or sell additional shares of securities.
We may not be able to complete such transactions on terms acceptable to us, or at all.
Our failure to generate sufficient funds to pay our debts or to undertake any of these actions successfully could result in a default on our debt obligations, which would materially adversely affect our business, results of operations and financial condition.
Risks Attendant with Principal Shareholder’s Guarantee of the Company’s Indebtedness to PNC.
Michael D. Herman is beneficial owner of 39.3% of the Company’s outstanding common stock and the chairman of its board of directors.
Our prior principal lender had required Mr. Herman to guarantee substantially all of the Company’s indebtedness to that lender. As a condition of making the November 2012 loan to the Company, PNC required Mr. Herman to guarantee $3,500,000 of the amount borrowed from PNC.
Although the guarantee is not collateralized by any of Mr. Herman’s assets, should the Company default on its obligations to PNC and the guarantor not meet his contractual obligations, it is possible that PNC may obtain possession and ownership of a controlling number of shares of the Company’s common stock.
The fact of the guarantee and his potential liability thereunder is a potential conflict between Mr. Herman’s personal interests and those of the Company.
Risks Related to Our Common Stock
Our existing shareholders could experience further dilution if we elect to raise equity capital to meet our liquidity needs or finance a strategic transaction.
As part of our growth strategy we may desire to raise capital and or utilize our common stock to effect strategic business transactions.
Either such action will likely require that we issue equity (or debt) securities which would result in dilution to our existing stockholders.
Although we will attempt to minimize the dilutive impact of any future capital-raising activities or business transactions, we cannot offer any assurance that we will be able to do so.
If we are successful in raising additional working capital, we may have to issue additional shares of our common stock at prices at a discount from the then-current market price of our common stock.
| 21 | ||
|
|
A significant portion of our common stock is currently considered restricted stock pursuant to Rule 144 and is subject to the rules applicable to “former shell companies”.
A significant portion of our outstanding common stock has been issued as “restricted securities” under Rule 144 under the Securities Act, including the shares issued to our President and Chairman in July 2010 and in an equity placement completed in November 2012.
As a former shell company, to the extent that any person holds restricted securities of the Company or otherwise must rely on Rule 144 for resale, Rule 144(i) imposes additional restrictions on the ability of any holder to utilize the exemption from registration for sales contained in Rule 144.
Because we have no plans to pay dividends on our common stock, investors must look solely to stock appreciation for a return on their investment in us.
We do not anticipate paying any cash dividends on our common stock in the foreseeable future.
We currently intend to retain all future earnings to fund the development and growth of our business.
Any payment of future dividends will be at the discretion of our board of directors and will depend on, among other things, our earnings, financial condition, capital requirements, level of indebtedness, statutory and contractual restrictions applying to the payment of dividends and other considerations that the board of directors deems relevant.
Investors must rely on sales of their common stock after price appreciation, which may never occur, as the only way to realize a return on their investment.
Investors seeking cash dividends should not purchase our common stock.
General Corporate Risks
Concentration of ownership in Mr. Herman makes it unlikely that any stockholder will be able to influence the election of directors or engage in a change of control transaction.
Because Mr. Herman directly and indirectly owns approximately 39.3% of the Company’s outstanding common stock,
he has the ability to heavily influence the election of our directors when they again stand for reelection.
Furthermore, it is likely that no person seeking control of the Company through stock ownership will be able to succeed in doing so without negotiating an arrangement to do so with Mr. Herman.
For so long as Mr. Herman continues to own a significant percentage of the outstanding shares of the Company common stock, he will retain such influence over the election of the board of directors and the negotiation of any change of control transaction.
Provisions in our charter documents could prevent or delay a change in control or a takeover.
Provisions in our bylaws provide certain requirements for the nomination of directors which preclude a stockholder from nominating a candidate to stand for election at any annual meeting.
As described in Section 2.12 of the Company’s bylaws, nominations must be presented to the Company well in advance of a scheduled annual meeting, and the notification must include specific information as set forth in that section.
The Company believes that such a provision provides reasonable notice of the nominees to the board of directors, but it may preclude stockholder nomination at a meeting where the stockholder is not familiar with nomination procedures and, therefore, may prevent or delay a change of control or takeover.
| 22 | ||
|
|
Although the Delaware General Corporation Law includes §112 which provides that bylaws of Delaware corporations may require the corporation to include in its proxy materials one or more nominees submitted by stockholders in addition to individuals nominated by the board of directors, the bylaws of the Company do not so provide.
As a result, if any stockholder desires to nominate persons for election to the board of directors, the proponent will have to incur all of the costs normally associated with a proxy contest.
Indemnification of officers and directors may result in unanticipated expenses.
The Delaware General Corporation Law and our Amended and Restated Certificate of Incorporation and bylaws provide for the indemnification of our directors, officers, employees, and agents, under certain circumstances, against attorney’s fees and other expenses incurred by them in any litigation to which they become a party arising from their association with us or activities on our behalf.
We also will bear the expenses of such litigation for any of our directors, officers, employees, or agents, upon such person’s promise to repay them if it is ultimately determined that any such person shall not have been entitled to indemnification.
This indemnification policy could result in substantial expenditures by us that we may be unable to recoup and could direct funds away from our business and products (if any).
We have significant obligations under the 1934 Act and the NYSE MKT.
Because we are a public company filing reports under the Securities Exchange Act of 1934, we are subject to increased regulatory scrutiny and extensive and complex regulation.
The Securities and Exchange Commission has the right to review the accuracy and completeness of our reports, press releases, and other public documents.
In addition, we are subject to extensive requirements to institute and maintain financial accounting controls and for the accuracy and completeness of our books and records.
Forward-looking statements may prove to be inaccurate.
In our effort to make the information in this report more meaningful, this report contains both historical and forward-looking statements.
All statements other than statements of historical fact are forward-looking statements within the meanings of Section 27A of the Securities Act of 1933 and Section 21E of the 1934 Act.
Forward-looking statements in this report are not based on historical facts, but rather reflect the current expectations of our management concerning future results and events.
It should be noted that because we are a “penny stock,” the protections provided by Section 27A of the Securities Act of 1933, and Section 21E of the 1934 Act do not apply to us.
We have attempted to qualify our forward-looking statements with appropriate cautionary language to take advantage of the judicially-created doctrine of “bespeaks caution” and other protections.
Forward-looking statements involve known and unknown risks, uncertainties and other factors which may cause our actual results, performance and achievements to be different from any future results, performance and achievements expressed or implied by these statements.
These factors are not necessarily all of the important factors that could cause actual results to differ materially from those expressed in the forward-looking statements in this annual report.
Other unknown or unpredictable factors also could have material adverse effects on our future results.
None
| 23 | ||
|
|
The following table sets forth real property owned and leased by the Company and its subsidiaries.
Unless otherwise indicated, the properties are used in Heat Waves’ operations.
Owned Properties
:
|
Location/Description
|
|
Approximate Size
|
|
Killdeer, ND(1)
·
Shop
·
Land – shop
·
Housing
·
Land – housing
|
|
10,000 sq. ft.
8 acres
5,000 sq. ft.
2 acres
|
|
Garden City, KS
·
Shop(1)
·
Land – shop(1)
·
Land – acid dock, truck storage, etc.
|
|
11,700 sq. ft.
1 acre
10 acres
|
|
Trinidad, CO (1) (2)
·
Shop
·
Land – shop
|
|
9,200 sq. ft.
5 acres
|
|
Hugoton, KS (Dillco)
·
Shop/Office/Storage
·
Land – shop/office/storage
·
Land – office
|
|
9,367 sq. ft.
3.3 acres
10 acres
|
(1) Property is collateral for mortgage debt obligation.
(2) Company is receiving $2,300 monthly under a short-term sublease agreement.
Leased Properties:
|
Location/Description
|
|
Approximate Size
|
|
Monthly Rental
|
|
Lease Expiration
|
|
|
|
Platteville
, CO
|
|
|
|
|
|
|
|
|
|
·
Shop
|
|
3,200 sq. ft.
|
|
$
|
3,000
|
|
Month-to-month
|
|
|
·
Land
|
|
1.5 acres
|
|
|
|
|
|
|
|
La Salle
, CO
(3)
|
|
|
|
|
|
|
|
|
|
·
Shop
|
|
6,000 sq. ft.
|
|
$
|
8,000
|
|
January 2021
|
|
|
·
Land
|
|
3.0 acres
|
|
|
|
|
|
|
|
Rock Springs
, WY
|
|
|
|
|
|
|
|
|
|
·
Shop
|
|
10,200 sq. ft.
|
|
$
|
6,500
|
|
August 2017
|
|
|
·
Land
|
|
3 acres
|
|
|
|
|
|
|
|
Carmichaels, PA
|
|
|
|
|
|
|
|
|
|
·
Shop
|
|
5,000 sq. ft.
|
|
$
|
9,000
|
|
April 2015
|
|
|
·
Land
|
|
12.1 acres
|
|
|
|
|
|
|
|
Denver
, CO
|
|
|
|
|
|
|
|
|
|
·
Corporate offices
|
|
3,497 sq. ft.
|
|
$
|
6,120
|
|
December 2016
|
|
(3) Lease commenced on February 1, 2014
Note - All leases have renewal clauses
| 24 | ||
|
|
As of March 10, 2014, we are not a party to any legal proceedings that could have a material adverse effect on the Company’s business, financial condition or operating results.
Further, to the Company’s knowledge no such proceedings have been threatened against the Company.
Not applicable.
Market Information
As of March 10, 2014, our common stock is traded on the NYSE MKT under the symbol “ENSV”.
Prior to March 10, 2014, our common stock was quoted on the Over-the-Counter Bulletin Board (“OTCBB”) and the OTCQX under the symbol “ENSV.” Prior to January 4, 2011 our common stock was quoted under symbol “ASPN”.
The table below sets forth the high and low closing prices of the Company’s Common Stock during the periods indicated as reported by the Internet source Yahoo Finance (http://finance.yahoo.com).
The quotations reflect inter-dealer prices without retail mark-up, mark-down or commission and may not reflect actual transactions.
|
|
|
2013
|
|
2012
|
|
||||||||
|
|
|
Price Range
|
|
Price Range
|
|
||||||||
|
|
|
High
|
|
Low
|
|
High
|
|
Low
|
|
||||
|
First Quarter
|
|
$
|
1.27
|
|
$
|
0.63
|
|
$
|
1.19
|
|
$
|
0.62
|
|
|
Second Quarter
|
|
$
|
1.35
|
|
$
|
0.90
|
|
|
0.75
|
|
|
0.42
|
|
|
Third Quarter
|
|
$
|
1.62
|
|
$
|
0.90
|
|
|
0.60
|
|
|
0.32
|
|
|
Fourth Quarter
|
|
$
|
1.83
|
|
$
|
1.22
|
|
|
0.74
|
|
|
0.32
|
|
The closing sales price of the Company’s common stock as reported on March 10, 2014, was $2.68 per share.
Holders
As of March 10, 2014, there were approximately 425 holders of record of Company common stock. This does not include an indeterminate number of persons who hold our Common Stock in brokerage accounts and otherwise in “street name”.
Dividends
Holders of common stock are entitled to receive such dividends as may be declared by the Company’s Board of Directors.
The Company did not declare or pay dividends during its fiscal years ended December 31, 2013 or 2012, and has no plans at present to declare or pay any dividends.
| 25 | ||
|
|
Decisions concerning dividend payments in the future will depend on income and cash requirements.
However, in its agreements with PNC, our principal lender, the Company represented that it would not pay any cash dividends on its common stock until its obligations to PNC are satisfied. Furthermore, to the extent the Company has any earnings, it will likely retain earnings to expand corporate operations and not use such earnings to pay dividends.
Securities Authorized for Issuance Under Equity Compensation Plans
The following is provided with respect to compensation plans (including individual compensation arrangements) under which equity securities are authorized for issuance as of December 31, 2013:
|
Equity Compensation Plan Information
|
|
||||||||
|
|
|
|
|
|
|
|
|
Number of Securities
|
|
|
|
|
|
|
|
|
|
|
Remaining Available
|
|
|
|
|
Number of Securities
|
|
|
|
|
|
for Future Issuance
|
|
|
|
|
to be Issued Upon
|
|
|
|
Weighted-Average
|
|
Under Equity
|
|
|
|
|
Exercise of
|
|
|
|
Exercise Price of
|
|
Compensation Plans
|
|
|
|
|
Outstanding Options,
|
|
|
|
Outstanding Options,
|
|
(Excluding Securities
|
|
|
Plan Category
|
|
Warrants, and Rights
|
|
|
|
Warrants, and Rights
|
|
Reflected in Column (a))
|
|
|
and Description
|
|
(a)
|
|
|
|
(b)
|
|
(c)
|
|
|
|
|
|
|
|
|
|
|
|
|
|
Equity Compensation Plans Approved by Security Holders
(1)
|
|
3,025,000
|
|
|
$
|
0.73
|
|
2,198,380
|
(3)
|
|
|
|
|
|
|
|
|
|
|
|
|
Equity Compensation Plans Not Approved by Security Holders
|
|
3,007,714
|
(2)
|
|
|
0.53
|
|
-
|
|
|
|
|
|
|
|
|
|
|
|
|
|
Total
|
|
6,032,714
|
|
|
$
|
0.63
|
|
2,198,380
|
|
| (1) |
Represents options granted pursuant to the Company’s 2010 Stock Incentive Plan.
|
| (2) |
Consists of:
(i) options to acquire 350,000 shares of Company common stock granted pursuant to Aspen’s 2008 Equity Plan at $0.41 per share; (ii) warrants issued in 2010 to acquire 42,500 shares of Company common stock exercisable at $0.49 per share; (iii) warrants issued in 2011 to acquire 100,000 shares of Company common stock exercisable at $0.77 per share, (iv) warrants issued October 2012 to the principals of the Company’s existing investor relations firm to acquire 225,000 shares of Company common stock exercisable at $0.55 per share,
(v) warrants issued November 2012 in conjunction with stock subscription agreements executed with equity investors to acquire 1,985,214 shares of Company common stock exercisable at $0.55 per share; (vi) warrants issued November 2012 to various service providers, for services rendered in conjunction with the execution of multiple stock subscription agreements, to acquire 105,000 shares of Company common stock exercisable at $0.55 per share; and (vii) warrants issued November 2012 to a single service provider, for investor relation services, to acquire 200,000 shares of Company common stock exercisable at $0.40 per share.
|
| (3) |
Calculated as 5,223,380 shares of common stock reserved per the 2010 Stock Incentive Plan (being 15% of 34,822,536 shares issued and outstanding at January 1, 2014 per the renewal clause noted within the plan) less the 3,025,000 shares of common stock noted in Column (a).
|
| 26 | ||
|
|
Description of the 2008 Equity Plan:
On February 27, 2008 Aspen’s Board of Directors adopted the 2008 Equity Plan (the “2008 Plan”).
One million shares of common stock were initially reserved for the grant of stock options or issuance of stock bonuses under the 2008 Plan.
The 2008 Plan was not approved by Aspen’s stockholders and therefore none of the options granted under the 2008 Plan qualify as incentive stock options under Section 422 of the Internal Revenue Code. The 2008 Plan provides that an option may be exercised through the payment of cash or remittance of any combination of cash, common shares of the Company, or property, as defined by the 2008 plan. The options may also be exercised in accordance with the Plan’s cashless exercise provision.
On July 27, 2010, the 2008 Plan was terminated, although persons holding vested options under the 2008 Plan will continue to hold those options in accordance with the terms of their contractual agreement(s).
Description of the 2010 Stock Incentive Plan:
On
July 27, 2010
the Company’s Board of Directors adopted the 2010 Stock Incentive Plan (the “2010 Plan”).
The 2010 Plan permits the granting of equity-based awards to our directors, officers, employees, consultants, independent contractors and affiliates.
Equity-based awards are intended to be determined by a compensation committee (or, in the absence of a compensation committee, the Board of Directors and in either case referred to herein as the “Committee”) and are granted only in compliance with applicable laws and regulatory policy.
The 2010 Plan was approved by the Company’s stockholders in October 2010 and permits the issuance of options that qualify as Incentive Stock Options pursuant to Section 422 of the Internal Revenue Code of 1986, as amended (the “Code”).
In the absence of a compensation committee, the Board of Directors administers the 2010 Plan.
Any employee, officer, consultant, independent contractor or director providing services to the Company or any of its affiliates, who is selected by the Committee, is eligible to receive an award under the 2010 Plan.
When the 2010 Plan was adopted, the aggregate number of shares of our common stock that could be issued was 3,500,000 shares of common stock.
Beginning on January 1, 2012 and on January 1 of each subsequent year that the 2010 Plan is in effect, the aggregate number of Shares that may be issued under the 2010 Plan shall be automatically adjusted to equal 15% of the Company’s issued and outstanding shares of common stock, calculated as of January 1 of the respective year.
As a result of the January 1, 2014 adjustment, the maximum number of shares that are subject to equity awards under the 2010 Plan was increased to
5,223,380
.
The maximum number of shares of restricted stock, restricted stock units and stock awards that may be granted under the 2010 Plan is 2,000,000 shares.
The 2010 Plan permits the granting of:
| · | Stock options (including both incentive and non-qualified stock options); |
| · | Stock appreciation rights (“SARs”); |
| · | Restricted stock and restricted stock units; |
| · | Performance awards of cash, stock, other securities or property; |
| · | Other stock grants; and |
| · | Other stock-based awards. |
Unless sooner discontinued or terminated by the Board, the 2010 Plan will expire on July 27, 2020.
No awards may be made after that date. However, unless otherwise expressly provided in an applicable award agreement, any award granted under the 2010 Plan prior to expiration extends beyond the expiration of the 2010 Plan through the award’s normal expiration date.
Without the approval of the Company’s stockholders, the Committee will not re-price, adjust or amend the exercise price of any options or the grant price of any SAR previously awarded, whether through amendment, cancellation and replacement grant or any other means, except in connection with a stock dividend or other distribution, including a stock split, merger or other similar corporate transaction or event, in order to prevent dilution or enlargement of the benefits, or potential benefits intended to be provided under the 2010 Plan.
| 27 | ||
|
|
Other Compensation Arrangements:
On July 28, 2010, the Company entered into an agreement with an investor relations firm and as part of the compensation paid pursuant to that agreement granted each of the principals of the firm a warrant to purchase 112,500 shares of the Company’s common stock (a total
of 225,000 shares)
.
The warrants are exercisable at $0.49 per share for a four year term.
Each of the warrants may be exercised on a cashless basis.
The warrants also provide that subject to various conditions, the holders have piggy-back registration rights with respect to the shares of common stock that may be acquired upon the exercise of the warrants.
A total of 182,500 of these warrants were exercised in 2013.
On May 9, 2011, the Company entered into an agreement with a financial advisor and as part of the compensation paid pursuant to that agreement granted the advisor a warrant to purchase 100,000 shares of the Company’s common stock.
The warrants are exercisable at $0.77 per share for a five year term.
The warrants may be exercised on a cashless basis.
The warrants also provide that subject to various conditions, the holders have piggy-back registration rights with respect to the shares of common stock that may be acquired upon the exercise of the warrants.
In October 2012, the Company granted each of the principals of its existing investor relations firm a warrant to purchase 112,500 shares of the Company’s common stock (a total
of 225,000 shares) for the firm’s part in creating awareness for the Company’s private equity placement, in November 2012, as discussed herein
.
The warrants are exercisable at $0.55 per share for a five year term.
Each of the warrants may be exercised on a cashless basis.
The warrants also provide that subject to various conditions, the holders have piggy-back registration rights with respect to the shares of common stock that may be acquired upon the exercise of the warrants.
In connection with the Company’s private placement in November 2012, the Company granted warrants to purchase 449,456 shares of the Company’s common stock to numerous unaffiliated consultants, for services rendered for the finding and execution of multiple stock subscriptions agreements with several equity investors.
These warrants are exercisable at $0.55 for a five year term and have the same terms and conditions as the warrants issued in the private placement.
As of December 31, 2013, 105,000 of these warrants remain outstanding.
On November 29, 2012, the Company entered into an investor relations services agreement with an unaffiliated consulting firm.
Pursuant to this services agreement, the Company issued the consulting firm 125,000 shares of common stock, at $0.40 per share, in lieu of cash fees.
The Company also granted the consulting firm a warrant to purchase 200,000 shares of the Company’s common stock.
The warrants became exercisable on May 31, 2013, based on certain conditions as set forth in the warrant agreement, at $0.40 per share for a five year term.
Each of the warrants may be exercised on a cashless basis.
The warrants also provide that subject to various conditions, the holders have piggy-back registration rights with respect to the shares of common stock that may be acquired upon the exercise of the warrants.
Recent Sales of Unregistered Securities
During the period from November 13, 2013 through March 14, 2014, a number of holders of common stock purchase warrants exercised those warrants and received shares of common stock as a result of such exercise. The warrants had originally been issued to accredited investors and underwriters in connection with an equity financing that the Company completed in November 2012. In total, warrants to acquire 1,973,569 shares of common stock at an exercise price of $0.55 per share were exercised by ten accredited investors. Of those:
| 28 | ||
|
|
| · | Warrants to acquire 262,962 common shares were exercised resulting in cash proceeds to the Company of $144,629; and |
| · | Warrants to acquire 1,710,607 common shares were exercised on a cashless basis resulting in the issuance of 1,278,760 shares of common stock. |
The following sets forth the information regarding those issuances required by Item 701 of SEC Regulation S-K.
(a) Securities Sold: Common Stock, $0.005 par value, of the Company. The dates of the sales are outlined above.
(b) Underwriters and Other Purchasers. The persons who exercised the warrants were all accredited investors as that term is defined in the federal securities laws. There were no underwriters involved in any of the exercise transactions.
(c) Consideration. Warrants to acquire 262,962 common shares were exercised resulting in cash proceeds to the Company of $144,629. Warrants to acquire 1,710,607 common shares were exercised on a cashless basis resulting in the issuance of 1,278,760 shares of common stock. In each case where the warrants are entitled to a cashless exercise, the Company has interpreted the term “fair market value” of the underlying shares to equal the ten day volume weighted average price (“VWAP”) for the Company’s common stock, ending on the day before notice of exercise is received by the Company.
(d) Exemption from Registration Claimed. The shares were issued upon exercise of the warrants to accredited investors and to underwriters pursuant to the exemptions from registration under the Securities Act of 1933 found in Section 4(a)(2) thereof and Rule 506 thereunder, as well as in Section 4(a)(5) thereof in that each of the purchasers was an accredited investor, and Section 3(a)(9) inasmuch as each of the warrant holders was an existing security holder of the Company. The offer was made without any form of advertising or general solicitation, and each of the accredited investors represented to the Company that they acquired the shares and the underlying securities for investment purposes only and without a view toward further distribution.
(e) Terms of Conversion or Exercise. Not applicable.
(f) Use of Proceeds. Not applicable.
| 29 | ||
|
|
Smaller reporting companies are not required to provide the information required by this Item.
The following discussion provides information regarding the results of operations for the years ended December 31, 2013 and 2012, and our financial condition, liquidity and capital resources as of December 31, 2013 and 2012. The financial statements and the notes thereto contain detailed information that should be referred to in conjunction with this discussion.
The following discussion and analysis should be read in conjunction with and our historical consolidated financial statements and the accompanying notes included elsewhere in this Annual Report on Form 10-K, as well as the Risk Factors and the
Cautionary Note Regarding Forward-Looking Statements included above
.
| 30 | ||
|
|
OVERVIEW
The Company provides fluid management and well enhancement services to the domestic onshore oil and natural gas industry. These services include frac water heating, hot oiling and acidizing (well enhancement services), and water hauling, fluid disposal, frac tank rental (fluid management services) and other general oilfield services. The Company owns and operates a fleet of more than 230 specialized trucks, trailers, frac tanks and other well-site related equipment and serves customers in several major domestic oil and gas fields including the DJ Basin/Niobrara field in Colorado, the Bakken field in North Dakota, the Marcellus and Utica Shale fields in Pennsylvania and Ohio, the Green River and Powder River Basins in Wyoming and the Mississippi Lime and Hugoton Fields in Kansas and Oklahoma.
The Company expects to continue to pursue its growth strategies of exploring additional acquisitions, potentially expanding the geographic areas in which it operates, and diversifying the products and services it provides to customers, as well as making further investments in its assets and equipment.
The Company may require additional debt or equity financing to fund the costs necessary to expand the services it offers.
There can be no assurance that the Company will be able to raise outside capital or have access to outside funding on reasonable terms, if at all.
RESULTS OF OPERATIONS
The following table shows selected financial data for the periods noted.
Please see information following the table for management’s discussion of significant changes.
|
|
|
Years Ended December 31,
|
|
|||||||||||
|
|
|
|
|
% of
|
|
|
|
|
|
|
% of
|
|
||
|
|
|
2013
|
|
Revenue
|
|
|
2012
|
|
|
Revenue
|
|
|||
|
FINANCIAL RESULTS:
|
|
|
|
|
|
|
|
|
|
|
|
|
|
|
|
Revenues
|
|
$
|
46,473,902
|
|
|
100
|
%
|
|
$
|
31,497,787
|
|
|
100
|
%
|
|
Cost of Revenue
|
|
|
31,944,279
|
|
|
69
|
%
|
|
|
23,545,101
|
|
|
75
|
%
|
|
Gross Profit
|
|
|
14,529,623
|
|
|
31
|
%
|
|
|
7,952,686
|
|
|
25
|
%
|
|
|
|
|
|
|
|
|
|
|
|
|
|
|
|
|
|
Operating Expenses
|
|
|
|
|
|
|
|
|
|
|
|
|
|
|
|
General and administrative expenses
|
|
|
4,070,884
|
|
|
9
|
%
|
|
|
3,291,898
|
|
|
11
|
%
|
|
Depreciation and amortization
|
|
|
2,088,767
|
|
|
4
|
%
|
|
|
2,960,153
|
|
|
9
|
%
|
|
Total operating expenses
|
|
|
6,159,651
|
|
|
13
|
%
|
|
|
6,252,051
|
|
|
20
|
%
|
|
|
|
|
|
|
|
|
|
|
|
|
|
|
|
|
|
Income from Operations
|
|
|
8,369,972
|
|
|
18
|
%
|
|
|
1,700,635
|
|
|
5
|
%
|
|
Interest Expense and Other
|
|
|
(867,335)
|
|
|
(2)
|
%
|
|
|
(872,368)
|
|
|
(3)
|
%
|
|
|
|
|
|
|
|
|
|
|
|
|
|
|
|
|
|
Income From Continuing Operations Before Tax
|
|
|
7,502,637
|
|
|
16
|
%
|
|
|
828,267
|
|
|
2
|
%
|
|
Income Tax Expense
|
|
|
(3,126,937)
|
|
|
(7)
|
%
|
|
|
(426,779)
|
|
|
(1)
|
%
|
|
Income From Continuing Operations
|
|
$
|
4,375,700
|
|
|
9
|
%
|
|
$
|
401,488
|
|
|
1
|
%
|
|
|
|
|
|
|
|
|
|
|
|
|
|
|
|
|
|
Net Income (Loss)
|
|
$
|
4,301,237
|
|
|
9
|
%
|
|
$
|
(85,070)
|
|
|
-
|
%
|
|
|
|
|
|
|
|
|
|
|
|
|
|
|
|
|
|
Net Income (Loss) per Common Share – Diluted
|
|
$
|
0.12
|
|
|
|
|
|
$
|
(0.00)
|
|
|
|
|
|
Diluted weighted average number of common shares
outstanding |
|
|
37,113,017
|
|
|
|
|
|
|
24,316,869
|
|
|
|
|
|
|
|
|
|
|
|
|
|
|
|
|
|
|
|
|
|
OTHER:
|
|
|
|
|
|
|
|
|
|
|
|
|
|
|
|
Adjusted EBITDA
(a)
From Continuing Operations
|
|
$
|
10,931,095
|
|
|
|
|
|
$
|
4,940,150
|
|
|
|
|
|
Adjusted EBITDA
(a)
Margin
|
|
|
24
|
%
|
|
|
|
|
|
16
|
%
|
|
|
|
| 31 | ||
|
|
(a)
Management believes that, for the reasons set forth below, adjusted EBITDA and adjusted EBITDA margin (even though a non-GAAP measure) is a valuable measurement of the Company's liquidity and performance and is consistent with the measurements offered by other companies in our industry. See further discussion of our use of EBITDA, the risks of non-GAAP measures, and the reconciliation to Net Income, in item 7.
Although the Company does not have segmented business operations, which would require segment reporting within the notes of its financial statements per accounting standards, we believe that revenue by service offering may be useful to readers of our financial statements. The following tables set forth revenue from continuing operations for the Company’s three service offerings and geographic areas during the years ending December 31, 2013 and 2012 (for discussion around revenue from discontinued operations, see the
Discontinued Operations
section below as well as Note 3 to our consolidated financial statements within the Form 10K accompanying this report):
|
|
|
Years Ended December 31,
|
|
||||
|
|
|
2013
|
|
2012
|
|
||
|
BY SERVICE OFFERING:
|
|
|
|
|
|
|
|
|
Well Enhancement Services
(1)
|
|
$
|
37,160,625
|
|
$
|
21,601,870
|
|
|
|
|
|
|
|
|
|
|
|
Fluid Management
(2)
|
|
|
9,014,182
|
|
|
9,503,952
|
|
|
|
|
|
|
|
|
|
|
|
Well Site Construction and Roustabout Services
(3)
|
|
|
299,095
|
|
|
391,965
|
|
|
|
|
|
|
|
|
|
|
|
Total Revenues
|
|
$
|
46,473,902
|
|
$
|
31,497,787
|
|
The Company has also determined that an understanding of the diversity of its operations by geography is important to an understanding of its business operations.
The Company only does business in the United States, in what it believes are three geographically diverse regions.
The following table sets forth revenue from continuing operations for the Company’s three geographic regions during the years ending December 31, 2013 and 2012 (again, for discussion around revenue from discontinued operations, see the
Discontinued Operations
section below as well as Note 3 to our consolidated financial statements within the Form 10K accompanying this report):
|
|
|
Years Ended December 31,
|
|
||||
|
|
|
2013
|
|
2012
|
|
||
|
BY GEOGRAPHIC AREA:
|
|
|
|
|
|
|
|
|
Rocky Mountain Region
(4)
|
|
$
|
26,059,306
|
|
$
|
16,299,862
|
|
|
|
|
|
|
|
|
|
|
|
Central USA Region
(5)
|
|
|
11,997,544
|
|
|
11,631,843
|
|
|
|
|
|
|
|
|
|
|
|
Eastern USA Region
(6)
|
|
|
8,417,052
|
|
|
3,566,082
|
|
|
|
|
|
|
|
|
|
|
|
Total Revenues
|
|
$
|
46,473,902
|
|
$
|
31,497,787
|
|
Notes to tables:
| (1) | Frac water heating, acidizing, hot oil services, and pressure testing. |
| (2) | Water hauling/disposal and frac tank rental. |
| (3) | Amounts herein represent our Dillco construction and roustabout services. During 2012, the Heat Waves’ construction and roustabout service line was discontinued. See Note 3 to our consolidated financial statements accompanying the Form 10K within this report for more details. |
| (4) | Consists of western Colorado, southeastern Wyoming, western North Dakota, and eastern Montana. Heat Waves is the only Company subsidiary operating in this region. |
| 32 | ||
|
|
| (5) | Consists of southwestern Kansas, northwestern Oklahoma, Texas panhandle, and northern New Mexico. Both Dillco and Heat Waves engage in business operations in this region. |
| (6) | Consists of the southern region of the Marcellus Shale formation (southwestern Pennsylvania and northern West Virginia) and the Utica Shale formation (eastern Ohio). Heat Waves is the only Company subsidiary operating in this region. |
Revenues
:
Revenues from continuing operations increased $15.0 million or 48% to $46.5 million for the year ended December 31, 2013.
The record revenue growth for 2013 was primarily attributable to revenues from our flagship well enhancement services, which increased $15.6 million or 72% from 2012 and overcame a reduction of about $490,000 in revenues in our fluid management services.
Well Enhancement Services
Well enhancement service revenues, which includes frac water heating, hot oiling, and acidizing services continued to show record growth in 2013 increasing $15.6 million or 72% to $37.2 million for the year ended December 31, 2013.
Increased customer demand particularly in the Rocky Mountain Region and Eastern USA Region combined with increased heating capacity from the addition of new frac water heating and hot oil equipment were the primary reason for our growth in 2013.
The following factors contributed to the increase in well enhancement revenues during 2013:
| (1) | During 2012 and 2013, the Company expanded its heating capacity by investing in additional trucks and equipment to meet the growing demand for our frac water heating and hot oiling services. As part of this expansion, the Company purchased and fabricated two new hot oil units and five double-burner frac water heating units which were deployed near the beginning of 2013. In addition, as part of our 2013 CAPEX program, four additional hot oil trucks were fabricated and deployed near the start of the fourth quarter of 2013 and three additional bobtail frac heaters and a double-burner frac heater deployed in December 2013; |
| (2) | Increased horizontal drilling and completion activity in the Niobrara Shale/DJ Basin by several customers resulted in higher frac water heating service during 2013 as compared to the same period last year; |
| (3) | Well Enhancement Service revenues during the first part of 2012 were affected by higher-than-average temperatures which reduced customer demand for heating services. Temperature and weather patterns during 2013 were more in line with historical averages, thus increasing demand for our frac water heating and hot oiling services; and |
| (4) | Well Enhancement Service Revenues in the Eastern USA region increased by approximately $4.9 million from 2012 to 2013 due to continued expansion into the Utica Shale market where exploration and production activity and demand for our services increased over 2012. |
Fluid Management Services
Fluid management service revenues, which represent about 19% of our consolidated revenues for 2013, declined $490,000 or 5% from 2012 to 2013.
This decline was primarily attributable to the lost revenue from a low margin water hauling customer in the Central USA region which services had been declining since early 2013.
The Company had been working to replace this business with higher margin business and finalized a service agreement with a new customer in September 2013 which replaced most of the monthly revenue lost from the previous customer.
Fluid management revenues during the fourth quarter returned back to 2012 levels. The Company will continue to try to maintain it’s pricing in this competitive market and prevent further dilution to its existing gross margins.
| 33 | ||
|
|
Well Site Construction and Roustabout Services
Well site construction and roustabout services, which represent less than 1% of 2013 revenues declined $93,000 or 24% from 2012.
These services are not a significant part of our business and are provided as ancillary services with our other services.
Geographic Areas
Revenues in the Rocky Mountain Region, which primarily consist of well enhancement services, continued to show strong growth increasing $9.8 million or 60% to $26.1 million for the year ended December 31, 2013.
Increased drilling and completion activity by several customers in the Niobrara Shale/DJ Basin combined with recent expansion of our service into Rock Springs contributed to this increase.
Revenues in the Central USA region increased $366,000 or 3% from 2012 to 2013 primarily due to increased well enhancement revenues from our Garden City yard, which more than offset the decline in water hauling services in this region.
Revenues in the Eastern USA region increased $4.9 million
or 136% primarily due to the continued expansion of our services into the Utica Shale market where exploration and production activity and demand for our services increased over 2012.
During 2013, the Company added to two sizable customers in addition to experiencing revenue growth with its two largest customers.
Historical Seasonality of Revenues
Because of the seasonality of our frac water heating and hot oiling business, revenues generated during the first and fourth quarters of our fiscal year, covering the months during what is known as our “heating season”, are significantly higher than revenues earned during the second and third quarters of our fiscal year.
In addition, the revenue mix of our service offerings also changes among quarters as our Well Enhancement services (which includes frac water heating and hot oiling) decrease as a percentage of total revenues and Fluid Management services and other services increase.
Thus, the revenues recognized in our quarterly financials in any given period are not indicative of the annual or quarterly revenues through the remainder of that fiscal year.
As an indication of this quarter-to-quarter seasonality, the Company generated revenues of $33.7 million (73%) during the first and fourth quarters of 2013 compared to $12.7 million (27%) during the second and third quarters of 2013.
In 2012, the Company earned revenues of $20.8 million (66%) during the first and fourth quarters of 2012, compared to $10.7 million (34%) during the second and third quarters of 2012.
While the Company is pursuing various strategies to lessen these quarterly fluctuations by increasing non-seasonal business opportunities, there can be no assurance that we will be successful in doing so.
Costs of Revenues and Gross Profit:
Cost of revenues for the year ended December 31, 2013 increased $8.4 million or 36% from the comparable period last year. As a percentage of revenues, cost of revenues for 2013 decreased to 69% of revenues as compared to 75% of revenues for 2012.
Gross profit for the year ended December 31, 2013 increased to $14.5 million or 31% of revenues as compared to $8.0 million or 25% of revenues during 2012.
Increased revenues from higher margin well enhancement services combined with improved labor efficiencies were the primary reasons for the corresponding increase in gross profits and gross margins. These increases were slightly tempered by a spike in propane prices in December 2013.
Below is a more detailed discussion of the factors that impacted gross margins:
| 34 | ||
|
|
| (1) | Well enhancement service revenues, which typically generate a higher gross profit margin than other services, increased to 80% of consolidated revenues for the year ended December 31, 2013 as compared to 68% during 2012. The increase in revenue from the higher margin well enhancement services increased the overall gross margin of the business; |
| (2) | Labor costs as a percentage of revenue were higher during 2012 due to the unseasonably warm weather during the first half of the 2012, which resulted in lower utilization of field personnel; |
| (3) | The Company’s cost of revenues include certain fixed cost components which do not fluctuate in relationship to changes in revenues. Items such as field office costs, employee housing, and other site overhead costs remained relatively flat during 2013. Accordingly, the increase in revenues during 2013 resulted in a higher gross margin as compared to 2012; and |
| (4) | In December 2013, a sudden spike in propane prices significantly impacted the gross margins our frac water heating business. At the time, approximately half of our frac water heating revenues were contractually priced on a fixed per barrel basis that included propane costs. As a result, gross margins significantly dropped on these contracts. Fortunately, these per barrel contracts contained a price adjustment clause that was triggered January 2014 and allowed us to move to a pricing schedule that allows us to bill propane on a cost plus basis. The increase in propane prices reduced gross margins for the fourth quarter of 2013 to 26% as compared to 32% in the fourth quarter of 2012. The Company anticipates that the revised pricing schedule will return margins to normal levels. |
General and Administrative Expenses:
For the year ended December 31, 2013, general and administrative expenses increased $779,000 or 24% from 2012. Higher stock based compensation associated with stock option grants, higher investor relations costs, and higher professional fees all contributed to this increase. Bad debt expense, which is included in general and administrative expense, also contributed $192,000 to this increase as the Company increased its allowance for doubtful accounts due to the corresponding increase in receivables.
As a percentage of revenues, general and administrative expenses decreased from 11% of revenues in 2012 to 9% of revenues for the year ended December 31, 2013 as compared to last year.
Depreciation and Amortization:
Depreciation and amortization expense for the year ended December 31, 2013 decreased $871,000, or 29% from 2012 primarily due to the change in useful lives of trucks, equipment and disposal wells in March 2012.
The Company reassessed the estimated useful lives of
this equipment and increased the useful lives of its trucks and equipment from 5-7 years to 10 years, and increased the useful lives of its disposal wells from 7-10 years to 15 years. This change in accounting estimate reduced depreciation and amortization expense by approximately $800,000 for the year ended December 31, 2013 as compared to 2012.
This decrease was partially offset by additional depreciation expense on new property and equipment added during 2012 and 2013. Lower amortization expense related to non-compete agreements also contributed to the overall decrease for 2013.
The non-compete agreements were fully amortized in February 2013.
| 35 | ||
|
|
Income from Continuing Operations:
For the year ended December 31, 2013, the Company recognized income from continuing operations of approximately $8.4 million as compared to $1.7 million for the comparative period last year.
As discussed above, increased revenue from well enhancement services contributed to a $15.6 million increase in revenues and a six percentage point improvement in gross margins (25% to 31%) as compared to the same period last year.
Lower depreciation and amortization expense due to the change in useful lives
also contributed to the improvement in income from continuing operations.
These increases were partially offset by a $779,000 increase in general and administrative expenses.
Management believes that this improvement in our results of operations reflects the beneficial effect of our expanded and increased operations (as discussed throughout this report), a focus on obtaining profitability, and the benefit of the colder weather in the first and last quarters of the year.
We believe that as long as we are able to control our costs and increase our revenues as a result of our expanding geographical regions and service areas, our financial performance will continue to improve over the long run, although on a quarter-to-quarter basis, there may still be periods of loss due to the seasonality of our operations, as discussed several times herein.
Income Taxes:
For 2013, the Company recognized income tax expense of $3.1 million on pre-tax net income from continuing operations before taxes of approximately $7.5 million as compared to income tax expense of $427,000 on pre-tax income of $828,000.
The effective tax rate on income from continuing operations for 2013 was approximately 42%.
This rate is higher than the federal statutory corporate tax rate of 34% primarily due to state and local income taxes.
During 2013, the company fully utilized the $2.4 million of prior year NOL carry forwards in 2013.
See
Note 11
Taxes on Income from Continuing Operations
in the notes to the accompanying audited consolidated financial statements
for further details.
Loss from Discontinued Operations, Net of Tax:
In December 2012, the Company made the decision to discontinue its Heat Waves well-site construction and roustabout line of service and immediately initiated efforts to close the North Dakota construction operations.
The Company reclassified its construction assets to fixed assets held for sale and initiated efforts to terminate its construction equipment leases.
Accordingly, the loss from discontinued operations, net of tax for the year ended December 31, 2013 was significantly lower at $74,000 as compared to $487,000 for 2012.
Since operations ceased in early 2013, the loss from discontinued operations in 2013 primarily consisted remaining contractual lease obligations from construction equipment leases.
| 36 | ||
|
|
Adjusted EBITDA*:
Management believes that, for the reasons set forth below, adjusted EBITDA (even though a non-GAAP measure) is a valuable measurement of the Company's liquidity and performance and is consistent with the measurements offered by other companies in the Company's industry.
The following table presents a reconciliation of net income to Adjusted EBITDA for each of the periods indicated
:
|
|
|
Years Ended December 31,
|
|
||||
|
|
|
2013
|
|
2012
|
|
||
|
EBITDA* From Continuing Operations:
|
|
|
|
|
|
|
|
|
Income From Continuing Operations
|
|
$
|
4,375,700
|
|
$
|
401,488
|
|
|
Add (Deduct):
|
|
|
|
|
|
|
|
|
Interest expense
|
|
|
1,072,912
|
|
|
902,152
|
|
|
Income tax expense
|
|
|
3,126,937
|
|
|
426,779
|
|
|
Depreciation and amortization
|
|
|
2,088,767
|
|
|
2,960,153
|
|
|
EBITDA* From Continuing Operations
|
|
|
10,664,316
|
|
|
4,690,572
|
|
|
Add (Deduct):
|
|
|
|
|
|
|
|
|
Stock-based compensation
|
|
|
472,356
|
|
|
279,362
|
|
|
(Gain) loss on disposal of equipment
|
|
|
(169,194)
|
|
|
5,739
|
|
|
Gain on sale of investments
|
|
|
-
|
|
|
(24,653)
|
|
|
Other income
|
|
|
(36,383)
|
|
|
(10,870)
|
|
|
Adjusted EBITDA* From Continuing Operations
|
|
$
|
10,931,095
|
|
$
|
4,940,150
|
|
|
|
|
|
|
|
|
|
|
|
EBITDA* From Discontinued Operations:
|
|
|
|
|
|
|
|
|
Loss From Discontinued Operations
|
|
$
|
(74,463)
|
|
$
|
(486,558)
|
|
|
Add (Deduct):
|
|
|
|
|
|
|
|
|
Interest expense
|
|
|
963
|
|
|
1,770
|
|
|
Income tax benefit
|
|
|
(47,607)
|
|
|
(311,078)
|
|
|
Depreciation and amortization
|
|
|
-
|
|
|
128,935
|
|
|
EBITDA* And Adjusted EBITDA* From Discontinued Operations
|
|
$
|
(121,107)
|
|
$
|
(666,931)
|
|
*Note:
See discussion to follow below for use of non-GAAP financial measurements.
Use of Non-GAAP Financial Measures:
Non-GAAP results are presented only as a supplement to the financial statements and for use within management’s discussion and analysis based on U.S. generally accepted accounting principles (GAAP). The non-GAAP financial information is provided to enhance the reader's understanding of the Company’s financial performance, but no non-GAAP measure should be considered in isolation or as a substitute for financial measures calculated in accordance with GAAP. Reconciliations of the most directly comparable GAAP measures to non-GAAP measures are provided within the schedules attached herein.
EBITDA is defined as net income plus interest expense, income taxes, and depreciation and amortization.
Adjusted EBITDA excludes from EBITDA stock-based compensation and, when appropriate, other items that management does not utilize in assessing the Company’s operating performance (see list of these items to follow below).
None of these non-GAAP financial measures are recognized terms under GAAP and do not purport to be an alternative to net income as an indicator of operating performance or any other GAAP measure.
Management uses these non-GAAP measures in its operational and financial decision-making, believing that it is useful to eliminate certain items in order to focus on what it deems to be a more reliable indicator of ongoing operating performance and the company’s ability to generate cash flow from operations.
Management also believes that investors may find non-GAAP financial measures useful for the same reasons, although investors are cautioned that non-GAAP financial measures are not a substitute for GAAP disclosures.
| 37 | ||
|
|
All of the items included in the reconciliation from Net Income to EBITDA and from EBITDA to Adjusted EBITDA are either (i) non-cash items (e.g., depreciation, amortization of purchased intangibles, stock-based compensation, warrants issued, etc.) or (ii) items that management does not consider to be useful in assessing the Company’s operating performance (e.g., income taxes, gain on sale of investments, loss on disposal of assets, etc.). In the case of the non-cash items, management believes that investors can better assess the company’s operating performance if the measures are presented without such items because, unlike cash expenses, these adjustments do not affect the Company’s ability to generate free cash flow or invest in its business.
Because not all companies use identical calculations, the Company’s presentation of non-GAAP financial measures may not be comparable to other similarly titled measures of other companies. However, these measures can still be useful in evaluating the company’s performance against its peer companies because management believes the measures provide users with valuable insight into key components of GAAP financial disclosures.
Changes in Adjusted EBITDA*
Adjusted EBITDA from Continuing Operations increased $6.0 million or 121% to $10.9 million for the year ended December 31, 2013 as compared to $4.9 million for 2012.
This increase
was primarily
due to an increase in revenues from our well enhancement services within our Rocky Mountain and Eastern USA regions.
The increased revenue was generated from both new and existing frac water heating and hot oiling customers in those regions.
In addition, well enhancement revenues also generate higher gross margins, which also contributed to the increase in EBITDA from Continuing Operations.
Adjusted EBITDA from Discontinued Operations for the year ended December 31, 2013 was a negative $121,000 as compared to a negative $667,000 in 2012.
The improved EBITDA from discontinued operations was primarily due to a decline in loss from operations as operations were ramped down in early 2013.
As noted above, most of the loss from operations and resulting negative EBITDA during 2013 was due to remaining equipment lease commitments paid in January and February 2013.
LIQUIDITY AND CAPITAL RESOURCES
The following table summarizes our statements of cash flows for the years ended December 31, 2013 and 2012 and (
combined with the working capital table and discussion below
) is important for understanding our liquidity:
|
|
|
Years Ended December 31,
|
|
||||
|
|
|
2013
|
|
2012
|
|
||
|
|
|
|
|
|
|
|
|
|
Net cash provided from operating activities
|
|
$
|
5,324,900
|
|
$
|
1,155,572
|
|
|
Net cash used in investing activities
|
|
|
(3,783,558)
|
|
|
(2,480,043)
|
|
|
Net cash used in (provided by) financing activities
|
|
|
(206,779)
|
|
|
1,441,093
|
|
|
Net Increase in Cash and Cash Equivalents
|
|
|
1,334,563
|
|
|
116,622
|
|
|
|
|
|
|
|
|
|
|
|
Cash and Cash Equivalents, Beginning of Period
|
|
|
533,627
|
|
|
417,005
|
|
|
|
|
|
|
|
|
|
|
|
Cash and Cash Equivalents, End of Period
|
|
$
|
1,868,190
|
|
$
|
533,627
|
|
Note: As discussed within Note 1 –
Basis of Presentation
within the Notes to the Consolidated Financial Statements, the Company has elected to not separately disclose cash flows pertaining to discontinued operations within the accompanying statements of cash flows for the years ending December 31, 2013 and 2012.
| 38 | ||
|
|
The following table sets forth a summary of certain aspects of our balance sheets at December 31, 2013 and 2012:
|
|
|
Years Ended December 31,
|
|
||||
|
|
|
2013
|
|
2012
|
|
||
|
|
|
|
|
|
|
|
|
|
Current Assets
|
|
$
|
15,129,379
|
|
$
|
9,553,558
|
|
|
Total Assets (including assets of discontinued operations)
|
|
|
33,422,248
|
|
|
25,857,026
|
|
|
Current Liabilities
|
|
|
6,955,618
|
|
|
8,018,088
|
|
|
Total Liabilities
|
|
|
20,577,132
|
|
|
19,040,678
|
|
|
Working Capital (Current Assets net of Current Liabilities)
|
|
|
8,173,761
|
|
|
1,535,470
|
|
|
Stockholders’ equity
|
|
|
12,845,116
|
|
|
6,816,348
|
|
Note: As discussed within Note 1 –
Basis of Presentation
within the Notes to the Consolidated Financial Statements, the Company has classified fixed assets associated with discontinued operations as
Fixed assets held for sale
in our consolidated balance sheet as of December 31, 2012.
The Company elected to present and disclose all other major classifications of assets and liabilities associated with these discontinued operations, other than the Fixed assets held for sale, within the notes to the financial statements; see Note 3 within the Notes to the Consolidated Financial Statements for further details.
Overview:
We have relied on cash flow from operations, borrowings under our credit facility and an equity raise in November 2012 to satisfy our liquidity needs. Our ability to fund operating cash flow shortfalls, fund capital expenditures, and make acquisitions will depend upon our future operating performance and on the availability of equity and debt financing, of which there can be no assurance and which will be affected by prevailing economic conditions in our industry and financial, business and other factors, some of which are beyond our control.
At December 31, 2013, we had approximately $1.9 million of cash and cash equivalents and approximately $4.8 million available under our asset based, revolving line of credit facility.
As reflected in the above table, cash generated from operations of $5.3 million for the year ended significantly improved our working capital situation.
On November 2, 2012, the Company and PNC Bank, National Association (“PNC”) entered into a credit facility under which the Company refinanced a majority of its existing indebtedness.
This refinancing positively bolstered our working capital position, as well as provided for a larger revolving credit facility.
Based on our existing operating performance, coupled with the recent refinancing, we believe we will have adequate funds to meet our projected operational needs for 2014.
However, if our estimates about our future operating performance turn out to be inaccurate, or if we are unable to raise additional capital in the absence of positive future operating performance, the Company will adjust its capital expenditures accordingly.
The PNC credit facility includes a $5.0 million revolving line of credit facility and an $11.0 million term loan facility (amended in November 2013 to $12,428,576).
Advances under both the revolving and term loans will incur interest based upon an effective Eurodollar rate or alternate base rate for domestic loans.
The revolving line of credit has a variable interest rate that is based, at the Company’s discretion, of LIBOR plus 3.25% for Eurodollar Loans or PNC bank rate plus 1.25% for domestic loans.
The revolving line of credit is secured with inventory and accounts of the company and has a facility fee of .375% per annum, which is applied to any undrawn portion of the maximum revolving advance amount.
As of December 31, 2013, the Company did not have any loan advances outstanding under the revolving line of credit.
| 39 | ||
|
|
Subsequent to the amendment to the credit agreement in November 2013, the term note had a principal amount of $12,428,576 and is payable in twenty-three fixed monthly principal payments of $172,620 beginning November 30, 2013 with the remaining principal balance due on November 2, 2015.
The term loan has a variable interest rate that is based, at the Company’s discretion of LIBOR plus 4.25% for Eurodollar Rate Loans or PNC Base Rate plus 2.25% for Domestic Rate Loans.
As discussed in Note 8 to the consolidated financial statements, the Company has entered into an interest rate swap to hedge the interest rate of the original term loan at an effective rate of 4.89% through the term of the loan.
As of December 31, 2013, the Company had $12,066,672 of Eurodollar Rate Loans and $16,664 Domestic Rate Loans under the term note.
The PNC credit facility has certain customary financial covenants that include, among others:
| (i) | an annual limit on capital expenditures ($10,150,000 for 2013 with ability to carryover unused portion to 2014 and $2,500,000 annually thereafter); |
| (ii) | a minimum fixed charge coverage ratio (as defined, not less than 1.1:1, measured as of the last day of each fiscal quarter, and must be determined based on trailing twelve month information); and |
| (iii) | a minimum tangible net worth test (set annually by the lender based upon financial projections of the Company and is measured on a quarterly basis. For 2013 the covenant requirement ranged from $4,244,000 to $5,114,000. The tangible net worth limit for 2014 was based upon projections and ranges from $13,065,000 to $15,313,000). |
These financial covenants could restrict our ability to secure additional debt financing or access funds under our revolving credit facility.
At December 31, 2013 the Company met all of the covenants imposed by the loan agreements with PNC
.
In current and prior periods, we have relied on cash generated from operations and borrowings under our credit facility to satisfy our liquidity needs. Our ability to fund operating cash flow shortfalls, fund capital expenditures, and make acquisitions will depend upon our future operating performance, and more broadly, on the availability of equity and debt financing, of which there can be no assurance and which will be affected by prevailing economic conditions in our industry and financial, business and other factors, some of which are beyond our control.
At December 31, 2013, we had approximately $4.8 million available under our asset based, revolving credit facility.
Working Capital:
As of December 31, 2013 we had working capital of approximately $8.2 million, an increase of $6.6 million from December 31, 2012.
This significant increase in working capital was attributable to the more than $5.3 million of cash flow from operations generated in 2013 and the use of this cash flow to pay down the Company’s revolving line of credit by $2.2 million.
Accounts receivable also increased $3.9 million or 50% from the comparable period last year due to higher monthly revenues during the fourth quarter of 2013.
Cash flow from Operating Activities:
Cash flow from operating activities for the year ended December 31, 2013 increased $4.2 million or 361% from 2012 primarily due to increased cash flows related to higher revenues and profitability in 2013.
This increase in cash flow from operations during 2013 was partially offset by approximately $3.7 million of net cash outflows for changes in working capital with a majority of this change related to an increase in accounts receivable.
| 40 | ||
|
|
Cash flow used in Investing Activities:
Cash flow used in investing activities for the year ended December 31, 2013 increased $1.3 million or 52% from 2012.
Higher capital expenditures related to the purchase and fabrication of new hot oil trucks and frac water heaters during 2013 was the primary reason for the increase and was partially offset by slightly higher proceeds on sale of equipment..
Cash flow used in Financing Activities:
Cash used by financing activities for the year ended December 31, 2013 was $207,000 as compared to $1.4 million of cash provided by financing activities for 2012. During 2013, cash proceeds from additional borrowings under the term loan of $3.7 million and proceeds from warrant exercises of $1.2 million were offset by $2.2 million of principal payments on the line of credit and $3.0 million of principal payments on the term loan.
During 2012, cash flow provided by financing activities was primarily due to $2.0 in proceeds from the private placement transaction.
Outlook:
The Company plans to continue to expand its business operations by acquiring and fabricating additional equipment and increasing the volume and scope of services offered to our existing customers.
As announced in a press release dated May 16, 2013, the Company announced a $6.0 million capital expenditure program with approximately $4.7 million allocated to expanding frac water heating and hot oiling capacity by 40% and 15%, respectively.
On November 14, 2013, PNC Bank approved an additional $4.0 million increase in capital expenditures, with approximately $3.3 million allocated toward acquiring and fabricating additional equipment.
The $4.0 million of additional capital expenditures was funded through a $3.0 million extension of the term loan facility with PNC and the remaining $1.0 million coming from proceeds of warrant exercises.
This additional $4.0 million of capital expenditures increased the
expenditure limit to $10.1 million. As of December 31, 2013, the Company has spent approximately $5.8 million of capital expenditures and plans to spend the majority of the remaining $4.3 million dollars during the first half of 2014.
The Company believes that its cash on hand and expected level of operating cash flows will be sufficient to fund the Company’s operations and capital spending programs for 2014.
The Company’s cash on hand will most likely be supplemented with available borrowing capacity under its $5 million revolving line of credit facility to fund operations during the remainder of the heating season (January to April 2014).
The Company also evaluates other geographical expansion opportunities and strategic transactions that could add services that are similar or complementary to those that the Company offers.
To fully implement certain of these activities the Company may need to raise additional capital or borrow funds from its existing lender(s) or from other third parties.
There can be no assurance that financing will be available to the Company on reasonable terms, if at all.
Capital Commitments and Obligations:
As of December 31, 2013 we had executed commitments for approximately $1.7 million of additional heating equipment.
The Company’s capital commitments and obligations as of December 31, 2013 consisted of the PNC Term Loan, the PNC Revolving Line of Credit, an Academy Bank Real Estate Loan entered into to fund the new operation center in North Dakota, as well as other bank debt and certain capital and operating leases. General terms and conditions for, and amounts due under, these commitments and obligations are summarized in the notes to the financial statements.
| 41 | ||
|
|
OFF-BALANCE SHEET ARRANGEMENTS
Other than the guarantees made by Mr. Herman on various loan agreements, the Company had no significant off-balance sheet arrangements that have or are reasonably likely to have a current or future effect on our financial condition, changes in financial condition, revenues or expenses, results of operations, liquidity, capital expenditures or capital resources that are material to our stockholders.
CRITICAL ACCOUNTING POLICIES
The preparation of financial statements in conformity with U.S. generally accepted accounting principles requires management to make a variety of estimates and assumptions that affect (i) the reported amounts of assets and liabilities and disclosure of contingent assets and liabilities as of the date of the financial statements, and (ii) the reported amounts of revenues and expenses during the reporting periods covered by the financial statements.
Our management routinely makes judgments and estimates about the effect of matters that are inherently uncertain. As the number of variables and assumptions affecting the future resolution of the uncertainties increase, these judgments become even more subjective and complex. Although we believe that our estimates and assumptions are reasonable, actual results may differ significantly from these estimates. Changes in estimates and assumptions based upon actual results may have a material impact on our results of operation and/or financial condition. Our significant accounting policies are disclosed in Note 2 to the Financial Statements included in this Form 10-K.
While all of the significant accounting policies are important to the Company’s financial statements, the following accounting policies and the estimates derived there from have been identified as being critical.
Accounts Receivable:
Accounts receivable are stated at the amount billed to customers.
The Company provides a reserve for doubtful accounts based on a review of outstanding receivables, historical collection information and existing economic conditions.
The provision for uncollectible amounts is continually reviewed and adjusted to maintain the allowance at a level considered adequate to cover future losses.
The allowance is management's best estimate of uncollectible amounts and is determined based on historical performance that is tracked by the Company on an ongoing basis.
The losses ultimately incurred could differ materially in the near term from the amounts estimated in determining the allowance.
Revenue Recognition:
The Company recognizes revenue when evidence of an arrangement exists, the fee is determinable, and services are provided and collection is reasonably assured.
Property and Equipment:
Property and equipment consists of (1) trucks, trailers and pickups; (2) trucks that are in various stages of fabrication; (3) real property which includes land and buildings used for office and shop facilities and wells used for the disposal of water; and (4) other equipment such as tools used for maintaining and repairing vehicles, office furniture and fixtures, and computer equipment.
Property and equipment is stated at cost less accumulated depreciation.
The Company charges repairs and maintenance against income when incurred and capitalizes renewals and betterments, which extend the remaining useful life, expand the capacity or increase the efficiency of the assets.
Depreciation is recorded on a straight-line basis over estimated useful lives of 5 to 30 years.
| 42 | ||
|
|
In April 2012, the Company reassessed the estimated useful lives of its trucks and equipment (including its well servicing units and equipment, fluid services equipment, construction equipment, and other vehicles) as well as the estimated useful lives of its disposal wells.
Through this assessment, the Company increased the useful lives of its trucks and equipment from 5-7 years to 10 years, and increased the useful lives of its disposal wells from 7-10 years to 15 years.
The Company has determined that this adjustment to its useful lives is a change in accounting estimate and has accounted for the change prospectively; i.e. the accounting change impacts interim reporting periods within fiscal year 2012 and future periods. The Company determined that this adjustment to its useful lives was a change in accounting estimate and has accounted for the change prospectively; i.e. the accounting change impacts interim reporting periods within fiscal year 2012 and future periods. For the years ended December 31, 2013 and 2012, the change in accounting estimate decreased depreciation for the period by approximately $3.4 million and $2.6 million (pre-tax difference), respectively. The impact of this change in accounting estimated increased Income from Operations and Net Income (Loss) by these amounts, or by approximately $0.10 per basic $0.09 per diluted common share, respectively, for 2013, and $0.11 earnings per basic and diluted common share for 2012.
Long-Lived Assets:
The Company reviews its long-lived assets for impairment whenever events or changes in circumstances indicate that the carrying amount of the asset may not be recovered.
The Company looks primarily to the discounted future cash flows in its assessment of whether or not long-lived assets have been impaired.
No impairments were recorded during the years ended December 31, 2013 or 2012.
Intangible Assets:
Non-Competition Agreements.
The non-competition agreements with the sellers of Heat Waves and Dillco have finite lives and were being amortized over the five-year contractual periods.
Amortization expense was fully recognized by February 2013.
Goodwill
.
Goodwill represents the excess of the cost over the fair value of net assets acquired, including identified intangible assets, recorded in connection with the acquisition of Heat Waves.
Goodwill is not amortized but is assessed for impairment at least annually.
Impairment.
The Company assesses goodwill and intangible assets with indefinite lives for impairment at the reporting unit level on an annual basis and between annual tests if events occur or circumstances change that would more likely than not reduce the fair value below its carrying amount. Guidance allows a qualitative assessment of impairment to determine whether it is more-likely-than-not that the intangible asset is impaired.
If it is determined that it is more-likely-than-not that and impairment exists, accounting guidance requires that the impairment test be performed through the application of a two-step fair value test.
The Company utilizes this method and recognizes a goodwill impairment loss in the event that the fair value of the reporting unit does not exceed its carrying value.
During fiscal years ending December 31, 2013 and 2012, the Company performed the annual impairment test as of the date ending at each of these fiscal years and determined in both fiscal years that no impairment existed.
Income Taxes:
The Company recognizes deferred tax liabilities and assets based on the differences between the tax basis of assets and liabilities and their reported amounts in the financial statements that will result in taxable or deductible amounts in future years.
Deferred tax assets and liabilities are measured using enacted tax rates expected to apply to taxable income in the years in which those temporary differences are expected to be recovered or settled.
The effect of a change in tax rates on deferred tax assets and liabilities will be recognized in income in the period that includes the enactment date.
Deferred income taxes are classified as a net current or non-current asset or liability based on the classification of the related asset or liability for financial reporting purposes. A deferred tax asset or liability that is not related to an asset or liability for financial reporting is classified according to the expected reversal date. The Company records a valuation allowance to reduce deferred tax assets to an amount that it believes is more likely than not expected to be realized.
| 43 | ||
|
|
The Company accounts for any uncertainty in income taxes by recognizing the tax benefit from an uncertain tax position only if it is more likely than not that the tax position will be sustained on examination by the taxing authorities, based on the technical merits of the position.
The Company measures the tax benefits recognized in the financial statements from such a position based on the largest benefit that has a greater than 50% likelihood of being realized upon ultimate resolution.
The application of income tax law is inherently complex.
Laws and regulations in this area are voluminous and are often ambiguous. As such, the Company is required to make many subjective assumptions and judgments regarding income tax exposures.
Interpretations of and guidance surrounding income tax law and regulations change over time and may result in changes to the Company’s subjective assumptions and judgments which can materially affect amounts recognized in the consolidated balance sheets and consolidated statements of income.
The result of the reassessment of the Company’s tax positions did not have an impact on the consolidated financial statements.
Interest and penalties associated with tax positions are recorded in the period assessed as general and administrative expenses.
No interest or penalties have been assessed as of December 31, 2013 or 2012.
The Company files tax returns in the United States, in the states of Colorado, Kansas, North Dakota, and Pennsylvania. The tax years 2010 through 2013 remain open to examination in the taxing jurisdictions to which the Company is subject.
Stock-based Compensation:
The Company uses the Black-Scholes pricing model as a method for determining the estimated fair value for all stock options awarded to employees, officers, and directors.
The expected term of the options is based upon evaluation of historical and expected further exercise behavior.
The risk-free interest rate is based upon U.S. Treasury rates at the date of grant with maturity dates approximately equal to the expected life of the grant.
Volatility is determined upon historical volatility of our stock and adjusted if future volatility is expected to vary from historical experience.
The dividend yield is assumed to be none as we have not paid dividends nor do we anticipate paying any dividends in the foreseeable future.
We also use the Black-Scholes valuation model to determine the fair value of warrants.
Expected volatility is based upon the weighted average of historical volatility over the contractual term of the warrant and implied volatility.
The risk-free interest rate is basis upon implied yield on a U.S. Treasury zero-coupon issue with a remaining term equal to the contractual term of the warrants.
The dividend yield is assumed to be none.
Not required.
The information required by this Item begins on page 50 of Part III of this report on Form 10-K and is incorporated into this part by reference.
| 44 | ||
|
|
None.
Disclosure Controls and Procedures
Disclosure controls and procedures are controls and other procedures that are designed to ensure that information required to be disclosed in our reports filed or submitted under the 1934 Act is recorded, processed, summarized and reported, within the time periods specified in the Securities and Exchange Commission’s rules and forms.
Disclosure controls and procedures include, without limitation, controls and procedures designed to ensure that information required to be disclosed in our reports filed under the 1934 Act is accumulated and communicated to management, including our principal executive officer and our principal financial officer, as appropriate, to allow timely decisions regarding required disclosure.
Our management, under the direction of our Chief Executive Officer (who is our principal executive officer), and Chief Financial Officer (who is our principal accounting officer) has evaluated the effectiveness of our disclosure controls and procedures as required by 1934 Act Rule 13a-15(b) as of December 31, 2013 (the end of the period covered by this report). Based on that evaluation, our principal executive officer and our principal accounting officer concluded that these disclosure controls and procedures
are effective to provide reasonable assurance that information required to be disclosed by the Company in the reports that it files or submits under the 1934 Act is accumulated and communicated to management, including the
Chief Executive Officer and the Chief Financial Officer,
to allow timely decisions regarding required disclosure and are effective to provide reasonable assurance that such information is recorded, processed, summarized and reported within the time periods specified by the SEC’s rules and forms.
The Company, including its
Chief Executive Officer and Chief Financial Officer
, does not expect that its internal controls and procedures will prevent or detect all error and all fraud. A control system, no matter how well conceived or operated, can provide only reasonable, not absolute, assurance that the objectives of the control system are met.
Management’s Annual Report on Internal Control Over Financial Reporting
In accordance with Item 308 of SEC Regulation S-K, management is required to provide an annual report regarding internal controls over our financial reporting. This report, which includes management’s assessment of the effectiveness of our internal controls over financial reporting, is found below.
Inasmuch as the Company is neither an accelerated filer nor a large accelerated filer, the Company is not obligated to provide an attestation report on the Company’s internal control over financial reporting by the Company’s registered public accounting firm.
Internal Control Over Financial Reporting
Our management is also responsible for establishing internal control over financial reporting (“ICFR”) as defined in Rules 13a-15(f) and 15d-15(f) under the 1934 Act. Our ICFR are intended to be designed to provide reasonable assurance regarding the reliability of financial reporting and the preparation of financial statements for external purposes in accordance with U.S. generally accepted accounting principles. Our ICFR are expected to include those policies and procedures that management believes are necessary that:
| 45 | ||
|
|
| (1) | Pertain to the maintenance of records that, in reasonable detail, accurately and fairly reflect the transactions and dispositions of the assets of the Company; |
| (2) | Provide reasonable assurance that transactions are recorded as necessary to permit preparation of financial statements in accordance with generally accepted accounting principles, and that receipts and expenditures of the Company are being made only in accordance with authorizations of management and our directors; and |
| (3) | Provide reasonable assurance regarding prevention or timely detection of unauthorized acquisition, use or disposition of the Company’s assets that could have a material effect on the financial statements. |
Management recognizes that there are inherent limitations in the effectiveness of any system of internal control, and accordingly, even effective internal control can provide only reasonable assurance with respect of financial statement preparation and may not prevent or detect misstatements. In addition, effective internal control at a point in time may become ineffective in future periods because of changes in conditions or due to deterioration in the degree of compliance with our established policies and procedures.
As of December 31, 2013, management (with the participation of the
Chief Executive Officer and the Chief Financial Officer
) conducted an evaluation of the effectiveness of the Company’s ICFR based on the framework set forth in
Internal Control—Integrated Framework
(1992) issued by the Committee of Sponsoring Organizations of the Treadway Commission (COSO) and SEC guidance on conducting such assessments by smaller reporting companies and non-accelerated filers.
Based on that assessment, management (with the participation of the
Chief Executive Officer and the Chief Financial Officer
) concluded that, during the period covered by this report, such internal controls and procedures were effective as of December 31, 2013.
None.
The information responsive to Items 401, 405, 406 and 407 of Regulation S-K to be included in our definitive Information Statement for our 2014 Annual Meeting of Shareholders, to be filed within 120 days of December 31, 2013, pursuant to Regulation 14A under the Securities Exchange Act of 1934, as amended (the “Information Statement”), is incorporated herein by reference.
The information responsive to Items 402 and 407 of Regulation S-K to be included in our Information Statement is incorporated herein by reference.
| 46 | ||
|
|
The information responsive to Items 201(d) and 403 of Regulation S-K to be included in our Information Statement is incorporated herein by reference.
The information responsive to Items 404 and 407 of Regulation S-K to be included in our Information Statement is incorporated herein by reference.
The information responsive to Item 9(e) of Schedule 14A to be included in our Information Statement is incorporated herein by reference.
|
Exhibit
No.
|
|
Title
|
|
|
|
|
|
3.01
|
|
Second Amended and Restated Certificate of Incorporation
(2)
|
|
3.02
|
|
Amended and Restated Bylaws.
(3)
|
|
10.01
|
|
2008 Equity Plan.
(4)
|
|
10.02
|
|
2010 Stock Incentive Plan.
(3)
|
|
10.03
|
|
Employment Agreement between the Company and Michael D. Herman.
(3)(6)(12)
|
|
10.04
|
|
Employment Agreement between the Company and Rick Kasch.
(3)(5)(6)(7)(12)
|
|
10.05
|
|
Employment Agreement between the Company and Austin Peitz
(11)
|
|
10.06
|
|
Employment Agreement between the Company and Robert Devers
(10)
|
|
10.07
|
|
Form of Indemnification Agreement
.
Filed herewith
|
|
10.08
|
|
Business Loan Agreement with PNC Bank, National Association.
(8)
|
|
10.09
|
|
First Amendment to Business Loan Agreement with PNC Bank, National Association. Filed herewith
|
|
10.10
|
|
Second Amendment to Business Loan Agreement with PNC Bank, National Association. Filed herewith
|
|
10.11
|
|
Third Amendment to Business Loan Agreement with PNC Bank, National Association. Filed herewith
|
|
11.1
|
|
Statement of Computation of per share earnings Filed herewith. (contained in Note 2 to the
Consolidated Financial Statements).
|
|
14.1
|
|
Code of Business Conduct and Ethics Whistleblower Policy.
(12)
|
|
14.2
|
|
Related Party Transaction Policy
(12)
|
|
14.3
|
|
Audit Committee Charter
(12)
|
|
21.1
|
|
Subsidiaries of Enservco Corporation, Filed herewith
|
|
23.2
|
|
Consent from EKS&H LLLP regarding Form S-8 Filed herewith
|
|
31.1
|
|
Certification pursuant to Section 302 of the Sarbanes-Oxley Act of 2002, (Principal Executive Officer). Filed herewith.
|
|
31.2
|
|
Certification pursuant to Section 302 of the Sarbanes-Oxley Act of 2002 (Principal Financial Officer). Filed herewith.
|
| 47 | ||
|
|
|
32.1
|
|
Certification pursuant to 18 U.S.C. §1350, as adopted pursuant to Section 906 of the Sarbanes- Oxley Act of 2002 (Chief Executive Officer). Filed herewith.
|
|
32.2
|
|
Certification pursuant to 18 U.S.C. §1350, as adopted pursuant to Section 906 of the Sarbanes
Oxley Act of 2002 (Chief Financial Officer). Filed herewith.
|
|
101.INS
|
|
XBRL Instance Document
|
|
101.SCH
|
|
XBRL Schema Document
|
|
101.CAL
|
|
XBRL Calculation Linkbase Document
|
|
101.LAB
|
|
XBRL Label Linkbase Document
|
|
101.PRE
|
|
XBRL Presentation Linkbase Document
|
|
101.DEF
|
|
XBRL Definition Linkbase Document
|
|
(1)
|
I
ntentionally omitted.
|
|
(2)
|
Incorporated by reference from the Company’s Current Report on Form 8-K dated December 30, 2010, and filed on January 4, 2011.
|
|
(3)
|
Incorporated by reference from the Company’s Current Report on Form 8-K dated July 27, 2010, and filed on July 28, 2010.
|
|
(4)
|
Incorporated by reference from the Company’s Current Report on Form 8-K dated February 27, 2008, and filed on March 10, 2008.
|
|
(5)
|
Incorporated by reference from the Company’s Quarterly Report on Form 10-Q for the quarter ended June 30, 2011, and filed on August 15, 2011.
|
|
(6)
|
Incorporated by reference from the Company’s Current Report on Form 8-K dated February 10, 2012, and filed on February 13, 2012.
|
|
(7)
|
Incorporated by reference from the Company’s Current Report on Form 8-K dated June 6, 2012, and filed on June 11, 2012.
|
|
(8)
|
Incorporated by reference from the Company’s Current Report on Form 8-K dated November 2, 2012, and filed on November 8, 2012.
|
|
(9)
|
Intentionally omitted.
|
|
(10)
|
Incorporated by reference from Exhibit 10.01 to the Company’s Current Report on Form 8-K dated April 29, 2013 and filed on May 2, 2013.
|
|
(11)
|
Incorporated by reference from Exhibit 10.03 to the Company’s Form 10-K/A for the year ended December 31, 2012 and filed on October 8, 2013.
|
|
(12)
|
Incorporated by reference from the Company’s Current Report on Form 8-K dated
May 29
, 201
3
, and filed on
May 31
, 201
3
.
|
| 48 | ||
|
|
SIGNATURES
In accordance with Section 13 or 15(d) of the Securities Exchange Act 1934, the Registrant has duly caused this report to be signed on its behalf by the undersigned, thereunto duly authorized.
March 20, 2014
|
|
ENSERVCO CORPORATION,
|
|
|
|
a Delaware Corporation
|
|
|
|
|
|
|
|
/s/ Michael D. Herman
|
|
|
|
Principal Executive Officer
|
|
|
|
|
|
|
|
/s/ Robert Devers
|
|
|
|
Principal Financial Officer & Principal Accounting Officer
|
|
Pursuant to the requirement of the Securities Exchange Act of 1934, this report has been signed below by the following persons on behalf of the Registrant and in the capacities and on the dates indicated:
|
Date
|
|
Name and Title
|
|
Signature
|
|
|
|
|
|
|
|
March 20, 2014
|
|
Michael D. Herman
|
|
/s/ Michael D. Herman
|
|
|
|
Chief Executive Officer
(principal executive officer),
and Chairman of the Board
|
|
|
|
|
|
|
|
|
|
March 20, 2014
|
|
Rick D. Kasch
|
|
/s/ Rick D. Kasch
|
|
|
|
President and Director
|
|
|
|
|
|
|
|
|
|
March 20, 2014
|
|
Robert Devers
|
|
/s/ Robert Devers
|
|
|
|
Treasurer and Chief Financial
Officer (principal financial
officer and principal accounting
officer)
|
|
|
|
|
|
|
|
|
|
March 20, 2014
|
|
Steven P. Oppenheim
|
|
/s/ Steven P. Oppenheim
|
|
|
|
Director
|
|
|
|
|
|
|
|
|
|
March 20, 2014
|
|
Gerard Laheney
|
|
/s/ Gerard Laheney
|
|
|
|
Director
|
|
|
| 49 | ||
|
|
ENSERVCO CORPORATION AND SUBSIDIARIES
INDEX TO CONSOLIDATED FINANCIAL STATEMENTS
|
|
Page
|
|
|
|
|
Report of Independent Registered Public Accounting Firm
|
51
|
|
|
|
|
Financial Statements as of December 31, 2013 and 2012:
|
|
|
|
|
|
Consolidated Balance Sheets
|
52
|
|
|
|
|
Consolidated Statements of Operations and Comprehensive Income (Loss)
|
53
|
|
|
|
|
Consolidated Statement of Stockholders’ Equity
|
54
|
|
|
|
|
Consolidated Statements of Cash Flows
|
55
-56
|
|
|
|
|
Notes to Consolidated Financial Statements
|
57-78
|
| 50 | ||
|
|
REPORT OF INDEPENDENT REGISTERED PUBLIC ACCOUNTING FIRM
The Board of Directors and Stockholders
Enservco Corporation
Denver
, Colorado
We have audited the accompanying consolidated balance sheets of Enservco Corporation and subsidiaries (the "Company") as of December 31, 2013 and 2012, and the related consolidated statements of operations and comprehensive income (loss), stockholders' equity, and cash flows for each of the years ended December 31, 2013 and 2012. These financial statements are the responsibility of the Company’s management.
Our responsibility is to express an opinion on these financial statements based on our audits.
We conducted our audits in accordance with the standards of the Public Company Accounting Oversight Board (United States).
Those standards require that we plan and perform the audits to obtain reasonable assurance about whether the financial statements are free of material misstatement. The Company is not required to have, nor were we engaged to perform, an audit of its internal control over financial reporting.
Our audits included consideration of internal control over financial reporting as a basis for designing audit procedures that are appropriate in the circumstances, but not for the purpose of expressing an opinion on the effectiveness of the Company's internal control over financial reporting. Accordingly, we express no such opinion.
An audit also includes examining, on a test basis, evidence supporting the amounts and disclosures in the financial statements, assessing the accounting principles used and significant estimates made by management, as well as evaluating the overall financial statement presentation. We believe that our audits provide a reasonable basis for our opinion.
In our opinion, the financial statements referred to above present fairly, in all material respects, the consolidated financial position of Enservco Corporation and subsidiaries as of December 31, 2013 and 2012, and the consolidated results of their operations and their cash flows for each of the years ended December 31, 2013 and 2012, in conformity with accounting principles generally accepted in the United States of America.
|
/s/ EKS&H LLLP
|
|
|
|
|
|
March 20, 2014
|
|
|
Denver
, Colorado
|
|
| 51 | ||
|
|
ENSERVcO CORPORATION
|
|
|
December 31,
|
|
December 31,
|
|
||
|
|
|
2013
|
|
2012
|
|
||
|
|
|
|
|
|
|
|
|
|
ASSETS
|
|
|
|
|
|
|
|
|
Current Assets
|
|
|
|
|
|
|
|
|
Cash and cash equivalents
|
|
$
|
1,868,190
|
|
$
|
533,627
|
|
|
Accounts receivable, net
|
|
|
11,685,866
|
|
|
7,791,342
|
|
|
Prepaid expenses and other current assets
|
|
|
923,758
|
|
|
802,020
|
|
|
Inventories
|
|
|
315,004
|
|
|
273,103
|
|
|
Deferred tax assets
|
|
|
336,561
|
|
|
153,466
|
|
|
Total current assets
|
|
|
15,129,379
|
|
|
9,553,558
|
|
|
|
|
|
|
|
|
|
|
|
Property and equipment, net
|
|
|
17,425,828
|
|
|
15,020,890
|
|
|
Fixed assets held for sale, net
|
|
|
-
|
|
|
304,429
|
|
|
Non-competition agreements, net
|
|
|
-
|
|
|
30,000
|
|
|
Goodwill
|
|
|
301,087
|
|
|
301,087
|
|
|
Long-term portion of interest rate swap
|
|
|
18,616
|
|
|
16,171
|
|
|
Other assets
|
|
|
547,338
|
|
|
630,891
|
|
|
|
|
|
|
|
|
|
|
|
TOTAL ASSETS
|
|
$
|
33,422,248
|
|
$
|
25,857,026
|
|
|
|
|
|
|
|
|
|
|
|
LIABILITIES AND STOCKHOLDERS’ EQUITY
|
|
|
|
|
|
|
|
|
Current Liabilities
|
|
|
|
|
|
|
|
|
Accounts payable and accrued liabilities
|
|
$
|
3,102,912
|
|
$
|
3,606,645
|
|
|
Line of credit borrowings
|
|
|
-
|
|
|
2,151,052
|
|
|
Income taxes payable
|
|
|
1,278,599
|
|
|
-
|
|
|
Current portion of long-term debt
|
|
|
2,562,141
|
|
|
2,236,343
|
|
|
Current portion of interest rate swap
|
|
|
11,966
|
|
|
24,048
|
|
|
Total current liabilities
|
|
|
6,955,618
|
|
|
8,018,088
|
|
|
|
|
|
|
|
|
|
|
|
Long-Term Liabilities
|
|
|
|
|
|
|
|
|
Long-term debt, less current portion
|
|
|
11,200,048
|
|
|
10,570,928
|
|
|
Deferred income taxes, net
|
|
|
2,421,466
|
|
|
451,662
|
|
|
Total long-term liabilities
|
|
|
13,621,514
|
|
|
11,022,590
|
|
|
Total liabilities
|
|
|
20,577,132
|
|
|
19,040,678
|
|
|
|
|
|
|
|
|
|
|
|
Commitments and Contingencies (Note 6)
|
|
|
|
|
|
|
|
|
|
|
|
|
|
|
|
|
|
Stockholders’ Equity
|
|
|
|
|
|
|
|
|
Preferred stock. $.005 par value, 10,000,000 shares authorized, no shares
issued or outstanding |
|
|
-
|
|
|
-
|
|
|
Common stock, 100,000,000 common shares authorized, 34,926,126 and 31,928,894
shares issued, respectively; 103,600 shares of treasury stock; and 34,822,536 and 31,825,294 shares outstanding, respectively |
|
|
174,113
|
|
|
159,127
|
|
|
Additional paid-in-capital
|
|
|
11,568,033
|
|
|
9,864,363
|
|
|
Accumulated earnings (deficit)
|
|
|
1,098,900
|
|
|
(3,202,337)
|
|
|
Accumulated other comprehensive income (loss)
|
|
|
4,070
|
|
|
(4,805)
|
|
|
Total stockholders’ equity
|
|
|
12,845,116
|
|
|
6,816,348
|
|
|
|
|
|
|
|
|
|
|
|
TOTAL LIABILITIES AND STOCKHOLDERS’ EQUITY
|
|
$
|
33,422,248
|
|
$
|
25,857,026
|
|
See accompanying notes to consolidated financial statements.
| 52 | ||
|
|
ENSERVcO CORPORATION
|
|
|
For the Years Ended
|
|
||||
|
|
|
December 31,
|
|
||||
|
|
|
2013
|
|
2012
|
|
||
|
|
|
|
|
|
|
|
|
|
Revenues
|
|
$
|
46,473,902
|
|
$
|
31,497,787
|
|
|
|
|
|
|
|
|
|
|
|
Cost of Revenue
|
|
|
31,944,279
|
|
|
23,545,101
|
|
|
|
|
|
|
|
|
|
|
|
Gross Profit
|
|
|
14,529,623
|
|
|
7,952,686
|
|
|
|
|
|
|
|
|
|
|
|
Operating Expenses
|
|
|
|
|
|
|
|
|
General and administrative expenses
|
|
|
4,070,884
|
|
|
3,291,898
|
|
|
Depreciation and amortization
|
|
|
2,088,767
|
|
|
2,960,153
|
|
|
Total operating expenses
|
|
|
6,159,651
|
|
|
6,252,051
|
|
|
|
|
|
|
|
|
|
|
|
Income from Operations
|
|
|
8,369,972
|
|
|
1,700,635
|
|
|
|
|
|
|
|
|
|
|
|
Other Income (Expense)
|
|
|
|
|
|
|
|
|
Interest expense
|
|
|
(1,072,912)
|
|
|
(902,152)
|
|
|
Gain (loss) on sale and disposal of equipment
|
|
|
169,194
|
|
|
(5,739)
|
|
|
Other income
|
|
|
36,383
|
|
|
35,523
|
|
|
Total other expense
|
|
|
(867,335)
|
|
|
(872,368)
|
|
|
|
|
|
|
|
|
|
|
|
Income From Continuing Operations Before Tax Expense
|
|
|
7,502,637
|
|
|
828,267
|
|
|
Income Tax Expense
|
|
|
(3,126,937)
|
|
|
(426,779)
|
|
|
|
|
|
|
|
|
|
|
|
Income From Continuing Operations, net of tax
|
|
$
|
4,375,700
|
|
$
|
401,488
|
|
|
|
|
|
|
|
|
|
|
|
Discontinued Operations
|
|
|
|
|
|
|
|
|
Loss from discontinued operations, before tax
|
|
|
(122,070)
|
|
|
(797,636)
|
|
|
Income tax benefit
|
|
|
47,607
|
|
|
311,078
|
|
|
Loss on discontinued operations, net of tax
|
|
$
|
(74,463)
|
|
$
|
(486,558)
|
|
|
|
|
|
|
|
|
|
|
|
Net Income (loss)
|
|
$
|
4,301,237
|
|
$
|
(85,070)
|
|
|
|
|
|
|
|
|
|
|
|
Other Comprehensive Income (Loss)
|
|
|
|
|
|
|
|
|
Unrealized gain (loss) on interest rate swap, net of tax
|
|
|
8,875
|
|
|
(4,805)
|
|
|
Settlements – interest rate swap
|
|
|
27,331
|
|
|
-
|
|
|
Reclassification into earnings
|
|
|
(27,331)
|
|
|
(40,579)
|
|
|
Unrealized gain on available-for-sale securities, net of tax
|
|
|
-
|
|
|
17,506
|
|
|
Total other comprehensive income (loss)
|
|
|
8,875
|
|
|
(27,878)
|
|
|
Comprehensive income (loss)
|
|
$
|
4,310,112
|
|
$
|
(112,948)
|
|
|
|
|
|
|
|
|
|
|
|
Earnings (Loss) per Common Share – Basic
|
|
|
|
|
|
|
|
|
Income from Continuing Operations
|
|
$
|
0.13
|
|
$
|
0.02
|
|
|
Loss from Discontinued Operations
|
|
|
(0.00)
|
|
|
(0.02)
|
|
|
Net Income (Loss)
|
|
$
|
0.13
|
|
$
|
(0.00)
|
|
|
|
|
|
|
|
|
|
|
|
Earnings (Loss) per Common Share – Diluted
|
|
|
|
|
|
|
|
|
Income from Continuing Operations
|
|
$
|
0.12
|
|
$
|
0.02
|
|
|
Loss from Discontinued Operations
|
|
|
(0.00)
|
|
|
(0.02)
|
|
|
Net Income (Loss)
|
|
$
|
0.12
|
|
$
|
(0.00)
|
|
|
|
|
|
|
|
|
|
|
|
Basic weighted average number of common shares outstanding
|
|
|
32,454,965
|
|
|
23,389,151
|
|
|
Add: Dilutive shares assuming exercise of options and warrants
|
|
|
4,658,052
|
|
|
927,718
|
|
|
Diluted weighted average number of common shares outstanding
|
|
|
37,113,017
|
|
|
24,316,869
|
|
See accompanying notes to consolidated financial statements.
| 53 | ||
|
|
ENSERVcO CORPORATION
Consolidated Statement of Stockholders’ Equity
|
|
|
|
|
|
|
|
|
|
|
|
|
|
Accumulated
|
|
|
|
|
|
|
|
|
|
|
|
|
|
Additional
|
|
Accumulated
|
|
Other
|
|
Total
|
|
||||
|
|
|
Common
|
|
Common
|
|
Paid-in
|
|
Earnings
|
|
Comprehensive
|
|
Stockholder’s
|
|
|||||
|
|
|
Shares
|
|
Stock
|
|
Capital
|
|
(Deficit)
|
|
Income
|
|
Equity
|
|
|||||
|
|
|
|
|
|
|
|
|
|
|
|
|
|
|
|
|
|
|
|
|
Balance at January 1, 2012
|
|
21,778,866
|
|
$
|
108,894
|
|
$
|
6,112,674
|
|
$
|
(3,117,267)
|
|
$
|
23,073
|
|
$
|
3,127,374
|
|
|
|
|
|
|
|
|
|
|
|
|
|
|
|
|
|
|
|
|
|
|
Common stock issued in private equity
transaction |
|
5,699,428
|
|
|
28,497
|
|
|
1,966,303
|
|
|
-
|
|
|
-
|
|
|
1,994,800
|
|
|
Common stock issued for services
|
|
125,000
|
|
|
625
|
|
|
49,375
|
|
|
-
|
|
|
-
|
|
|
50,000
|
|
|
Conversion of subordinated debt
|
|
4,222,000
|
|
|
21,111
|
|
|
1,456,649
|
|
|
-
|
|
|
-
|
|
|
1,477,760
|
|
|
Stock-based compensation
|
|
-
|
|
|
-
|
|
|
279,362
|
|
|
-
|
|
|
-
|
|
|
279,362
|
|
|
Net loss
|
|
-
|
|
|
-
|
|
|
-
|
|
|
(85,070)
|
|
|
-
|
|
|
(85,070)
|
|
|
Other comprehensive loss
|
|
-
|
|
|
-
|
|
|
-
|
|
|
-
|
|
|
(27,878)
|
|
|
(27,878)
|
|
|
|
|
|
|
|
|
|
|
|
|
|
|
|
|
|
|
|
|
|
|
Balance at December 31, 2012
|
|
31,825,294
|
|
$
|
159,127
|
|
$
|
9,864,363
|
|
$
|
(3,202,337)
|
|
$
|
(4,805)
|
|
$
|
6,816,348
|
|
|
|
|
|
|
|
|
|
|
|
|
|
|
|
|
|
|
|
|
|
|
Exercise of warrants
|
|
2,266,000
|
|
|
11,330
|
|
|
1,234,970
|
|
|
-
|
|
|
-
|
|
|
1,246,300
|
|
|
Cashless exercise of warrants
|
|
716,028
|
|
|
3,580
|
|
|
(3,580)
|
|
|
-
|
|
|
-
|
|
|
-
|
|
|
Cashless exercise of stock options
|
|
15,214
|
|
|
76
|
|
|
(76)
|
|
|
-
|
|
|
-
|
|
|
-
|
|
|
Stock-based compensation
|
|
-
|
|
|
-
|
|
|
472,356
|
|
|
-
|
|
|
-
|
|
|
472,356
|
|
|
Net income
|
|
-
|
|
|
-
|
|
|
-
|
|
|
4,301,237
|
|
|
-
|
|
|
4,301,237
|
|
|
Other comprehensive income
|
|
-
|
|
|
-
|
|
|
-
|
|
|
-
|
|
|
8,875
|
|
|
8,875
|
|
|
|
|
|
|
|
|
|
|
|
|
|
|
|
|
|
|
|
|
|
|
Balance at December 31, 2013
|
|
34,822,536
|
|
$
|
174,113
|
|
$
|
11,568,033
|
|
$
|
1,098,900
|
|
$
|
4,070
|
|
$
|
12,845,116
|
|
See accompanying notes to consolidated financial statements.
| 54 | ||
|
|
ENSERVCO CORPORATION
|
|
|
For the Years Ended
|
|
||||
|
|
|
December 31,
|
|
||||
|
|
|
2013
|
|
2012
|
|
||
|
|
|
|
|
|
|
|
|
|
OPERATING ACTIVITIES
|
|
|
|
|
|
|
|
|
Net income (loss)
|
|
$
|
4,301,237
|
|
$
|
(85,070)
|
|
|
Adjustments to reconcile net income (loss) to net cash provided by operating activities:
|
|
|
|
|
|
|
|
|
Depreciation and amortization (includes $-0- and $128,935 from discontinued
operations, respectively) |
|
|
2,088,767
|
|
|
3,089,088
|
|
|
(Gain) loss on disposal of equipment
|
|
|
(169,194)
|
|
|
5,739
|
|
|
Deferred income taxes
|
|
|
1,781,057
|
|
|
73,116
|
|
|
Stock-based compensation
|
|
|
472,356
|
|
|
279,362
|
|
|
Amortization of debt issuance costs
|
|
|
309,236
|
|
|
50,652
|
|
|
Bad debt expense
|
|
|
249,809
|
|
|
57,957
|
|
|
Realized gain on sale of marketable securities
|
|
|
-
|
|
|
(24,653)
|
|
|
Common stock issued to consultant for services
|
|
|
-
|
|
|
50,000
|
|
|
Changes in operating assets and liabilities
|
|
|
|
|
|
|
|
|
Accounts receivable
|
|
|
(4,144,333)
|
|
|
(3,344,045)
|
|
|
Inventories
|
|
|
(41,901)
|
|
|
276,329
|
|
|
Prepaid expense and other current assets
|
|
|
(121,738)
|
|
|
77,324
|
|
|
Other non-current assets
|
|
|
(175,262)
|
|
|
19,859
|
|
|
Accounts payable and accrued expenses
|
|
|
(503,733)
|
|
|
629,914
|
|
|
Income taxes payable
|
|
|
1,278,599
|
|
|
-
|
|
|
Net cash provided by operating activities
|
|
|
5,324,900
|
|
|
1,155,572
|
|
|
|
|
|
|
|
|
|
|
|
INVESTING ACTIVITIES
|
|
|
|
|
|
|
|
|
Purchases of property and equipment
|
|
|
(5,837,126)
|
|
|
(3,814,431)
|
|
|
Proceeds from sale and disposal of equipment
|
|
|
2,053,568
|
|
|
1,154,180
|
|
|
Sales of available-for-sale securities
|
|
|
-
|
|
|
180,208
|
|
|
Net cash used in investing activities
|
|
|
(3,783,558)
|
|
|
(2,480,043)
|
|
|
|
|
|
|
|
|
|
|
|
FINANCING ACTIVITIES
|
|
|
|
|
|
|
|
|
Proceeds from issuance of long-term debt
|
|
|
3,720,000
|
|
|
11,968,882
|
|
|
Repayment of long-term debt
|
|
|
(2,971,605)
|
|
|
(11,487,729)
|
|
|
Net line of credit payments
|
|
|
(2,151,052)
|
|
|
(112,175)
|
|
|
Payment of debt issuance costs
|
|
|
(50,422)
|
|
|
(922,685)
|
|
|
Proceeds from exercise of warrants
|
|
|
1,246,300
|
|
|
-
|
|
|
Proceeds from issuance of common stock
|
|
|
-
|
|
|
1,994,800
|
|
|
Net cash (used in) provided by financing activities
|
|
|
(206,779)
|
|
|
1,441,093
|
|
|
|
|
|
|
|
|
|
|
|
Net Increase in Cash and Cash Equivalents
|
|
|
1,334,563
|
|
|
116,622
|
|
|
|
|
|
|
|
|
|
|
|
Cash and Cash Equivalents, Beginning of Period
|
|
|
533,627
|
|
|
417,005
|
|
|
|
|
|
|
|
|
|
|
|
Cash and Cash Equivalents, End of Period
|
|
$
|
1,868,190
|
|
$
|
533,627
|
|
See accompanying notes to consolidated financial statements.
| 55 | ||
|
|
ENSERVcO CORPORATION
Consolidated Statements of Cash Flows (continued)
|
|
|
For the Years Ended
|
|
||||
|
|
|
December 31,
|
|
||||
|
|
|
2013
|
|
2012
|
|
||
|
|
|
|
|
|
|
|
|
|
Supplemental cash flow information:
|
|
|
|
|
|
|
|
|
Cash paid for interest
|
|
$
|
764,667
|
|
$
|
857,330
|
|
|
Cash paid for taxes
|
|
$
|
19,672
|
|
$
|
-
|
|
|
|
|
|
|
|
|
|
|
|
Supplemental Disclosure of Non-cash Investing and Financing Activities:
|
|
|
|
|
|
|
|
|
Equipment purchased through installment loans
|
|
$
|
206,523
|
|
$
|
438,025
|
|
|
Par value of common stock issued for cashless exercise of options and warrants
|
|
$
|
3,656
|
|
$
|
-
|
|
|
Increase in fair value of available-for-sale securities
|
|
$
|
-
|
|
$
|
29,415
|
|
|
Non-cash conversion of related party subordinated debt into shares of common
stock |
|
$
|
-
|
|
$
|
1,477,760
|
|
See accompanying notes to consolidated financial statements.
| 56 | ||
|
|
ENSERVcO CORPORATION
Notes to Consolidated Financial Statements
The accompanying consolidated financial statements have been derived from the accounting records of Enservco Corporation (formerly Aspen Exploration Corporation), Heat Waves Hot Oil Service LLC (“Heat Waves”), Dillco Fluid Service, Inc. (“Dillco”), Trinidad Housing LLC, HE Services LLC, Aspen Gold Mining Company, and Real GC LLC (collectively, the “Company”) as of December 31, 2013 and 2012 and the results of operations for the years then ended.
The below table provides an overview of the Company’s current ownership hierarchy:
|
|
|
State of
|
|
|
|
|
|
Name
|
|
Formation
|
|
Ownership
|
|
Business
|
|
Dillco Fluid Service, Inc. (“Dillco”)
|
|
Kansas
|
|
100% by Enservco
|
|
Oil and natural gas field fluid logistic services.
|
|
|
|
|
|
|
|
|
|
Heat Waves Hot Oil Service LLC (“Heat Waves”)
|
|
Colorado
|
|
100% by Enservco
|
|
Oil and natural gas well services, including logistics and stimulation.
|
|
|
|
|
|
|
|
|
|
HE Services, LLC (“HES”)
|
|
Nevada
|
|
100% by Heat Waves
|
|
No active business operations. Owns construction equipment used by Heat Waves.
|
|
|
|
|
|
|
|
|
|
Real GC, LLC (“Real GC”)
|
|
Colorado
|
|
100% by Heat Waves
|
|
No active business operations. Owns real property in Garden City, Kansas that is utilized by Heat Waves.
|
On May 29, 2013, three of the Company’s former subsidiaries, being Trinidad Housing, LLC, Aspen Gold Mining Company, and Heat Waves, LLC, were dissolved and Enservco Frac Services, LLC is being dissolved by operation of law. None of these dissolved subsidiaries was engaged in active business operations prior to dissolution.
As part of a corporate reorganization in May 2013, Dillco transferred its ownership in Heat Waves to Enservco through a tax free exchange.
The accompanying consolidated financial statements were prepared in accordance with accounting principles generally accepted in the United States of America (“GAAP”). Inter-company balances and transactions have been eliminated in the accompanying consolidated financial statements.
| 57 | ||
|
|
During the fourth quarter of 2012, the Company made the decision to discontinue its Heat Waves’ well-site construction and roustabout line of service.
As part of this decision, the Company had the intent and made plans during 2012 to sell off the trucks and equipment used in this line of service.
The Company classified these fixed assets as
Fixed assets held for sale
in our consolidated balance sheet as of December 31, 2012.
During the six months ended June 30, 2013, the Company sold a majority of its assets held for sale and at June 30, 2013, decided to redeploy the remaining assets held for sale back into operations.
Accordingly there are no
Fixed assets held for sale
in the consolidated balance sheets as of December 31, 2013.
The Company has disclosed all other major classifications of assets and liabilities associated with these discontinued operations, other than the
Fixed assets held for sale
, within the notes to the financial statements; see Note 3 for further details.
The Company has also delineated all results of operations as continuing operations or discontinued operations, from the well-site construction and roustabout line of service, for the years ended December 31, 2013 and 2012.
As such, the operating results of this line of service are reported as
Loss from discontinued operations, net of tax
in the consolidated statements of operations for all periods presented; see Note 3 for further details. The Company has not separately disclosed cash flows pertaining to discontinued operations within the accompanying statements of cash flows for the years ended December 31, 2013 and 2012.
Cash and Cash Equivalents
The Company considers all highly liquid instruments purchased with an original maturity of three months or less to be cash equivalents.
The Company continually monitors its positions with, and the credit quality of, the financial institutions with which it invests.
Accounts Receivable
Accounts receivable are stated at the amount billed to customers.
The Company provides a reserve for doubtful accounts based on a review of outstanding receivables, historical collection information and existing economic conditions.
The provision for uncollectible amounts is continually reviewed and adjusted to maintain the allowance at a level considered adequate to cover future losses.
The allowance is management's best estimate of uncollectible amounts and is determined based on historical
collection experience related to accounts receivable coupled with a review of the current status of existing receivables
.
The losses ultimately incurred could differ materially in the near term from the amounts estimated in determining the allowance.
As of December 31, 2013 and December 31, 2012, the Company had an allowance for doubtful accounts of $
245,000
and $
70,000
, respectively.
For the years ended
December 31, 2013 and 2012 the Company has recorded bad debt expense (net of recoveries) of $
249,809
and $
57,957
, respectively.
Concentrations
As of December 31, 2013, two customers each comprised
more than 10%
of the Company’s accounts receivable balance; at approximately
13
% and
12
%, respectively.
Revenues from these two customers represented
17
% and
9
% of total revenues, respectively, for the year ended December 31, 2013.
No other customer exceeded
10
% of total revenues for the year ended December 31, 2013.
As of December 31, 2012, three customers each comprised
more than 10%
of the Company’s accounts receivable balance; at approximately
19
%,
15
%, and
12
%, respectively.
Revenues from these three customers represented
11
%,
4
%, and
11
% of total revenues, respectively, for the year ended December 31, 2012.
No other customer exceeded
7
% of total revenues for the year ended December 31, 2012.
Inventories
Inventory consists primarily of propane, diesel fuel and chemicals that are used in the servicing of oil wells and is carried at the lower of cost or market in accordance with the first in, first out method.
The company periodically reviews the value of items in inventory and provides write-downs or write-offs of inventory based on its assessment of market conditions. Write-downs and write-offs are charged to cost of goods sold.
There were no write-downs or write-offs during the years ended December 31, 2013 or 2012.
| 58 | ||
|
|
Property and Equipment
Property and equipment consists of (1) trucks, trailers and pickups; (2) trucks that are in various stages of fabrication; (3) real property which includes land and buildings used for office and shop facilities and wells used for the disposal of water; and (4) other equipment such as tools used for maintaining and repairing vehicles, office furniture and fixtures, and computer equipment.
Property and equipment is stated at cost less accumulated depreciation.
The Company charges repairs and maintenance against income when incurred and capitalizes renewals and betterments, which extend the remaining useful life, expand the capacity
or efficiency
of the assets.
Depreciation is recorded on a straight-line basis over estimated useful lives of
5 to 30 years
.
In April, 2012, the Company reassessed the estimated useful lives of its trucks and equipment (including its well servicing units and equipment, fluid services equipment, construction equipment, and other vehicles) as well as the estimated useful lives of its disposal wells. Through this assessment, the Company increased the useful lives of its trucks and equipment from
5-7 years to 10 years
, and increased the useful lives of its disposal wells from
7-10 years to 15 years
. The Company determined that this adjustment to its useful lives
was
a change in accounting estimate and has accounted for the change prospectively; i.e. the accounting change impacts interim reporting periods within fiscal year 2012 and future periods. For the years ended December 31, 2013 and 2012, the change in accounting estimate decreased depreciation for the period by approximately $
3.4
million and $
2.6
million (pre-tax difference), respectively.
The impact of this change in accounting estimated increased
Income from Operations and Net Income (Loss) by
these amounts
, or by approximately $
0.10
per basic $
0.09
per diluted common share, respectively, for 2013, and $
0.11
earnings per basic and diluted common share for 2012.
Leases
The Company conducts a major part of its operations from leased facilities.
Each of these leases is accounted for as operating leases.
Normally, the Company records rental expense on its operating leases over the lease term as it becomes payable. If rental payments are not made on a straight-line basis, per terms of the agreement, the Company records a deferred rent expense and recognizes the rental expense on a straight-line basis throughout the lease term.
The majority of the Company’s facility leases contain renewal clauses and expire through August 2017.
In most cases, management expects that in the normal course of business, leases will be renewed or replaced by other leases.
The Company is leasing a number of trucks and equipment in the normal course of business, which is recorded as an operating lease.
The Company records rental expense on its equipment operating lease over the lease term as it becomes payable; there are no rent escalation terms associated with these equipment leases. On the equipment lease, a purchase options exist allowing the Company to purchase the leased equipment at the end of the lease term, based on the market price of the equipment at the time of the lease termination and exercised purchase option.
The equipment lease contains a renewal clause and expires on February 2017.
The Company
enters
into capital leases in order to acquire trucks and equipment.
Each of these leases allow the Company to obtain title of the equipment leased through the lease agreements upon final payment of all principal and interest due.
The Company records the assets and liabilities associated with these leases at the present value of the minimum lease payments per the lease agreement.
The assets and associated liabilities are classified as Property and Equipment and the liabilities are classified as current and long-term liabilities based on the contractual terms of the agreements and their associated maturities.
There are no outstanding capital leases as of December 31, 2013.
| 59 | ||
|
|
Long-Lived Assets
The Company reviews its long-lived assets for impairment whenever events or changes in circumstances indicate that the carrying amount of the asset may not be recovered.
The Company looks primarily to the undiscounted future cash flows in its assessment of whether or not long-lived assets have been impaired.
No impairments were recorded during the years ended December 31, 2013 or 2012.
Earnings Per Share
Earnings per share is computed by dividing net income by the weighted average number of common shares outstanding for the period. Diluted earnings per share is calculated by dividing net income by the diluted weighted average number of common shares. The diluted weighted average number of common shares is computed using the treasury stock method for common stock that may be issued for outstanding stock options and warrants.
As of December 31, 2013 and 2012, the Company had outstanding stock options and warrants to acquire an aggregate of
6,032,714
and
8,245,170
shares of Company common stock, respectively, which have a potentially dilutive impact on earnings per share.
Due to the presentation of discontinued operations (see Note 3) throughout this report, in accordance with accounting guidance the Company presented earnings (loss) per common share from continuing and discontinued operations within its financial statements for the years ended December 31, 2013 and 2012.
The incremental shares of the options and warrants to be included in the calculation of diluted earnings per share for
Income from Continuing Operations
during 2013 and 2012 had a dilutive impact on the Company’s earnings per share of
4,658,052
and
927,718
shares, respectively.
Dilution is not permitted if there are net losses during the period. As such, the Company does not show dilutive earnings per share for all other earnings (loss) per common share data presented within its financial statements for the year ended December 31, 2012.
Intangible Assets
Non-Competition Agreements
The non-competition agreements with the sellers of Heat Waves and Dillco have finite lives and are being amortized over the five-year contractual periods (Note 4).
All non-competition agreements are fully amortized as of December 31, 2013.
Amortization expense for the years ended December 31, 2013 and 2012 totaled $
30,000
and $
150,000
, respectively.
Goodwill
Goodwill represents the excess of the cost over the fair value of net assets acquired, including identified intangible assets, recorded in connection with the acquisitions of Heat Waves.
Goodwill is not amortized but is assessed for impairment at least annually.
Impairment
The Company assesses goodwill and intangible assets with indefinite lives for impairment at the reporting unit level on an annual basis and between annual tests if events occur or circumstances change that would more likely than not reduce the fair value below its carrying amount. Guidance allows a qualitative assessment of impairment to determine whether it is more-likely-than-not that the intangible asset is impaired.
If it is determined that it is more-likely-than-not that and impairment exists, accounting guidance requires that the impairment test be performed through the application of a two-step fair value test.
The Company utilizes this method and recognizes a goodwill impairment loss in the event that the fair value of the reporting unit does not exceed its carrying value.
During fiscal years ending December 31, 2013 and 2012, the Company performed the annual impairment test as of the date ending at each of these fiscal years and determined in both fiscal years that no impairment existed.
| 60 | ||
|
|
Derivative Instruments
The Company has swap agreements in place to hedge against changes in interest rates. The fair value of the Company’s derivative instruments is reflected as assets or liabilities on the balance sheets. The effective portion of changes in the fair value of the derivative instruments are deferred in
Accumulated other comprehensive loss
and are reclassified to income when the hedged transaction affects earnings. The ineffective portion of the change in fair value of the derivative instrument is recorded in earnings. The Company has not experienced any ineffectiveness in its hedging instruments. Transactions related to the Company’s derivative instruments accounted for as hedges are classified in the same category as the item hedged in the statement of cash flows. The Company does not hold derivative instruments for trading purposes.
The Company assesses the retrospective and prospective effectiveness of its derivative instruments on a quarterly basis to determine whether the hedging instruments have been highly effective in offsetting changes in fair value of the hedged items. The Company also assesses on a quarterly basis whether the hedging instruments are expected to be highly effective in the future. If a hedging instrument is not expected to be highly effective, the Company will stop hedge accounting prospectively. In those instances, the gains or losses remain in
Accumulated other comprehensive loss
until the hedged item affects earnings.
Income Taxes
Enservco LLC (which served as the holding company for the Company’s various operating entities until the time of the Merger Transaction in July 2010) and its subsidiaries, with the exception of Dillco (which is a C Corporation subject to federal and state income taxes), are limited liability companies and prior to January 1, 2010 were not subject to federal or state income taxes.
On January 1, 2010 Enservco LLC elected to be taxed as a corporation.
Therefore, prior to January 1, 2010 no provision or liability for income taxes has been included in the accompanying financial statements, except for income taxes relating to the financial statements of Dillco and Enservco (the current parent company for the Company’s operations and assets).
The Company recognizes deferred tax liabilities and assets (
Note 11
) based on the differences between the tax basis of assets and liabilities and their reported amounts in the financial statements that will result in taxable or deductible amounts in future years.
Deferred tax assets and liabilities are measured using enacted tax rates expected to apply to taxable income in the years in which those temporary differences are expected to be recovered or settled.
The effect of a change in tax rates on deferred tax assets and liabilities will be recognized in income in the period that includes the enactment date.
Deferred income taxes are classified as a net current or non-current asset or liability based on the classification of the related asset or liability for financial reporting purposes. A deferred tax asset or liability that is not related to an asset or liability for financial reporting is classified according to the expected reversal date. The Company records a valuation allowance to reduce deferred tax assets to an amount that it believes is more likely than not expected to be realized.
| 61 | ||
|
|
The Company accounts for any uncertainty in income taxes by recognizing the tax benefit from an uncertain tax position only if it is more likely than not that the tax position will be sustained on examination by the taxing authorities, based on the technical merits of the position.
The Company measures the tax benefits recognized in the financial statements from such a position based on the largest benefit that has a
greater than 50% likelihood
of being realized upon ultimate resolution.
The application of income tax law is inherently complex.
Laws and regulations in this area are voluminous and are often ambiguous. As such, the Company is required to make many subjective assumptions and judgments regarding income tax exposures.
Interpretations of and guidance surrounding income tax law and regulations change over time and may result in changes to the Company’s subjective assumptions and judgments which can materially affect amounts recognized in the consolidated balance sheets and consolidated statements of income.
The result of the reassessment of the Company’s tax positions did not have an impact on the consolidated financial statements.
Interest and penalties associated with tax positions are recorded in the period assessed as general and administrative expenses.
No interest or penalties have been assessed as of December 31, 2013 or 2012.
The Company files income tax returns in the United States and in the states in which it conducts its business operations. The tax years 2010 through 2013 remain open to examination in the taxing jurisdictions to which the Company is subject.
Fair Value
The Company follows authoritative guidance that applies to all financial assets and liabilities required to be measured and reported on a fair value basis.
The Company also applies the guidance to non-financial assets and liabilities measured at fair value on a nonrecurring basis, including non-competition agreements and goodwill.
The guidance defines fair value as the price that would be received to sell an asset or paid to transfer a liability (an exit price) in an orderly transaction between market participants at the measurement date. During the year ended December 31, 2013, the Company did not change any of its valuation techniques
; however, based upon review of the valuation criteria at December 31, 2013, the company determined that the fair value of the derivative instrument for interest rate swaps should be categorized under Level 2 as opposed to Level 3 and transferred $
6,650
from level 3 hierarchy to Level 2 hierarchy.
The guidance establishes a hierarchy for inputs used in measuring fair value that maximizes the use of observable inputs and minimizes the use of unobservable inputs by requiring that the most observable inputs be used when available.
Observable inputs are inputs that market participants would use in pricing the asset or liability developed based on market data obtained from sources independent of the Company.
Unobservable inputs are inputs that reflect the Company’s assumptions of what market participants would use in pricing the asset or liability based on the best information available in the circumstances.
The financial and nonfinancial assets and liabilities are classified based on the lowest level of input that is significant to the fair value measurement.
The hierarchy is broken down into three levels based on the reliability of the inputs as follows:
|
|
Level 1:
|
Quoted prices are available in active markets for identical assets or liabilities;
|
|
|
Level 2:
|
Quoted prices in active markets for similar assets and liabilities that are observable for the asset or liability; or
|
|
|
Level 3:
|
Unobservable pricing inputs that are generally less observable from objective sources, such as discounted cash flow models or valuations.
|
| 62 | ||
|
|
Stock-based Compensation
The Company uses the Black-Scholes pricing model as a method for determining the estimated fair value for all stock options awarded to employees, officers, and directors.
The expected term of the options is based upon evaluation of historical and expected further exercise behavior.
The risk-free interest rate is based upon U.S. Treasury rates at the date of grant with maturity dates approximately equal to the expected life of the grant.
Volatility is determined upon historical volatility of our stock and adjusted if future volatility is expected to vary from historical experience.
The dividend yield is assumed to be none as we have not paid dividends nor do we anticipate paying any dividends in the foreseeable future.
The Company also uses the Black-Scholes valuation model to determine the fair value of warrants.
Expected volatility is based upon the weighted average of historical volatility over the contractual term of the warrant and implied volatility.
The risk-free interest rate is based upon implied yield on a U.S. Treasury zero-coupon issue with a remaining term equal to the contractual term of the warrants.
The dividend yield is assumed to be none.
Loan Fees and Other Deferred Costs
In the normal course of business, the Company often enters into loan agreements with its primary lending institutions. The majority of these lending agreements require origination fees and other fees in the course of executing the agreements. For all costs associated with the execution of the lending agreements, the Company
defers
these costs and
amortizes them as interest expense
over the term of the loan agreement using the effective interest method. These deferred costs are classified on the balance sheet as current or long-term assets based on the contractual terms of the loan agreements. All other costs not associated with the execution of the loan agreements are expensed as incurred.
See Note 7 for loan fees recorded in the current period.
Revenue Recognition
The Company recognizes revenue when
evidence of an arrangement exists, the fee is determinable, and
services are provided and collection is reasonably assured.
Reclassifications
Certain reclassifications have been made to the prior period financial statements to conform to the current period presentation.
The Company reclassified $258,540 of site personnel costs from general and administrative expenses to cost of revenues on the consolidated statement of operations and comprehensive income (loss) for the year ended December 31, 2012 to conform to 2013 presentation.
Management Estimates
The preparation of the Company’s financial statements in conformity with accounting principles generally accepted in the United States of America requires management to make estimates and assumptions that affect the reported amounts of assets and liabilities and disclosure of contingent assets and liabilities at the date of the financial statements and the reported amounts of revenues and expenses during the reporting period.
Significant estimates include the realization of accounts receivable, stock based compensation expense, income tax provision, the valuation of deferred taxes, and the valuation of the Company’s interest rate swap.
Actual results could differ from those estimates.
| 63 | ||
|
|
Accounting Pronouncements
Recently Adopted
In February 2013, FASB issued ASU No. 2013-02,
“Reporting of Amounts Reclassified Out of Accumulated Other Comprehensive Income.”
ASU 2013-02 improves the reporting of reclassifications out of accumulated other comprehensive income by requiring an entity to report their corresponding effect(s) on net income. This pronouncement was effective for fiscal years, and interim periods within those years, beginning after December 15, 2012. The adoption of this guidance did not impact the Company’s consolidated financial position, results of operations, or cash flows
Recently Issued
During the fourth quarter of 2012, the Company made the decision to discontinue its Heat Waves’ well-site construction and roustabout line of service.
Discontinued operations for 2012 consisted of revenues and cost of goods sold (COGS) associated with the well-site construction and roustabout line of service, trade accounts receivable balances, trade accounts payable balances, a prior year tax provision adjustment, among other items.
Discontinued operations for 2013 consist primarily of remaining rental commitments paid for equipment that could not be redeployed.
The following table provides the components of discontinued operations, net of tax:
|
|
|
For the Years Ended
|
|
||||
|
|
|
December 31,
|
|
||||
|
|
|
2013
|
|
2012
|
|
||
|
|
|
|
|
|
|
|
|
|
Revenues
|
|
$
|
(1,225)
|
|
$
|
617,406
|
|
|
Cost of Revenue
|
|
|
119,882
|
|
|
1,284,337
|
|
|
Gross Profit
|
|
|
(121,107)
|
|
|
(666,931)
|
|
|
|
|
|
|
|
|
|
|
|
Operating Expenses
|
|
|
|
|
|
|
|
|
Depreciation and amortization
|
|
|
-
|
|
|
128,935
|
|
|
Loss from Operations
|
|
|
(121,107)
|
|
|
(795,866)
|
|
|
|
|
|
|
|
|
|
|
|
Other Expense
|
|
|
|
|
|
|
|
|
Interest expense
|
|
|
963
|
|
|
1,770
|
|
|
|
|
|
|
|
|
|
|
|
Loss from discontinued operations
|
|
|
(122,070)
|
|
|
(797,636)
|
|
|
Income tax benefit
|
|
|
47,607
|
|
|
311,078
|
|
|
Loss on discontinued operations, net of tax
|
|
$
|
(74,463)
|
|
$
|
(486,558)
|
|
| 64 | ||
|
|
The following table provides the major classes of assets and liabilities components of discontinued operations, as of:
|
|
|
December 31,
|
|
||||
|
|
|
2013
|
|
2012
|
|
||
|
|
|
|
|
|
|
|
|
|
Accounts Receivable
|
|
$
|
-
|
|
$
|
153,754
|
|
|
Fixed Assets Held for Sale
|
|
|
-
|
|
|
304,429
|
|
|
Total Discontinued Assets
|
|
$
|
-
|
|
$
|
458,183
|
|
|
|
|
|
|
|
|
|
|
|
Accounts payable and accrued liabilities
|
|
$
|
-
|
|
$
|
219,882
|
|
|
|
|
|
|
|
|
|
|
|
Total Discontinued Liabilities
|
|
$
|
-
|
|
$
|
219,882
|
|
On March 14, 2013, the Company sold several trucks and equipment used in its construction division, which were classified as fixed assets held for sale as of December 31, 2012, for cash proceeds of $
534,000
.
The book value at time of sale of these assets was approximately $
233,000
and commissions of $
10,000
were paid upon sale of the trucks and equipment.
As such, for the year ended December 31, 2013, the Company recorded a gain of approximately $
291,000
on the sale of these fixed assets held for sale.
At June 30, 2013, the Company determined that the remaining few assets held for sale could be redeployed back into operations of the business and transferred assets held for sale with a net book value of $
71,342
back into property and equipment.
Non-compete agreements consist of the following as of December 31, 2013 and 2012:
|
Non-compete agreements, net as of January 1, 2012
|
|
$
|
180,000
|
|
|
Amortization expense during 2012
|
|
|
(150,000)
|
|
|
Non-compete agreements, net at December 31, 2012
|
|
$
|
30,000
|
|
|
Amortization expense during 2013
|
|
|
(30,000)
|
|
|
Non-compete agreements, net at December 31, 2013
|
|
$
|
-
|
|
Property and equipment consists of the following at:
|
|
|
December 31,
|
|
||||
|
|
|
2013
|
|
2012
|
|
||
|
|
|
|
|
|
|
|
|
|
Trucks and vehicles
|
|
$
|
27,240,551
|
|
$
|
24,388,762
|
|
|
Other equipment
|
|
|
2,820,674
|
|
|
2,781,903
|
|
|
Buildings and improvements
|
|
|
2,364,353
|
|
|
2,403,477
|
|
|
Trucks in process
|
|
|
1,205,936
|
|
|
1,110,356
|
|
|
Land
|
|
|
596,420
|
|
|
601,420
|
|
|
Disposal wells
|
|
|
367,330
|
|
|
667,330
|
|
|
Total property and equipment
|
|
|
34,595,264
|
|
|
31,953,248
|
|
|
Accumulated depreciation
|
|
|
(17,169,436)
|
|
|
(16,932,358)
|
|
|
Property and equipment – net
|
|
$
|
17,425,828
|
|
$
|
15,020,890
|
|
Depreciation expense on property and equipment for the year ended December 31, 2013 and 2012 totaled $
2,058,767
and $
2,810,153
, respectively.
| 65 | ||
|
|
Operating Leases
As of December 31, 2013, the Company leases facilities and certain trucks and equipment under lease commitments that expire through August 2017.
All of these facility leases are accounted for as operating leases.
Future minimum lease commitments for these facilities and other operating leases are as follows:
|
Year Ended December 31,
|
|
|
|
|
|
2014
|
|
$
|
850,865
|
|
|
2015
|
|
|
597,312
|
|
|
2016
|
|
|
206,655
|
|
|
2017
|
|
|
52,000
|
|
|
2018
|
|
|
-
|
|
|
Total
|
|
$
|
1,706,832
|
|
Rent expense under operating leases for the year ended December 31, 2013 and 2012 was $
994,940
and $
358,480
, respectively.
At December 31, 2013, the Company had outstanding purchase orders and commitments of approximately $
1.7
million for additional frac water heating and hot oil equipment
.
On November 2, 2012, the Company entered into a
Revolving Line of Credit, Term Loan and Security Agreement (the “Credit Agreement”)
with PNC Bank, National Association (“PNC”) which refinanced a majority of its existing indebtedness.
The PNC credit facility included a $5.0 million revolving line of credit and a $11.0 million term loan note.
Revolving Line of Credit
As part of the Credit Agreement, the Company entered into a three year revolving credit note which provides for borrowings up to maximum of $
5,000,000
based upon 85% of defined eligible accounts receivable.
The revolving line of credit has a variable interest rate that is based, at the Company’s discretion, on a) LIBOR plus 3.25% or b) PNC bank rate plus 1.25%.
The revolving line of credit is secured with inventory and accounts of the company and has a maturity date of
November 2, 2015
.
The revolving line of credit also has a facility fee of .375% per annum, which is applied to any undrawn portion of the maximum revolving advance amount.
The Company’s borrowing base availability as of December 31, 2013 was $
4.8
million
.
As of December 31, 2013 and 2012, the outstanding balance on this revolving line of credit was $
0
and $
2,151,052
, respectively.
| 66 | ||
|
|
Term Loan
On November 2, 2012, the Company entered into an $
11,000,000
term note with PNC, payable in thirty five fixed monthly principal installments of $
130,952
beginning in November 2012 with the remaining principal balance due November 2, 2015.
The term loan has a variable interest rate that is based, at the Company’s discretion of LIBOR plus 4.25% for Eurodollar Rate Loans or PNC Base Rate plus 2.25% for Domestic Rate Loans.
The term loan is collateralized by equipment, inventory, and accounts of the Company and subject to financial covenants. As discussed in Note 8, the Company has entered into an interest rate swap to hedge the interest rate of the original term loan at an effective rate of
4.89
% through the term of the loan.
In November 2013, the Borrowers and PNC entered into an amendment to the Credit Agreement increasing the then-current principal balance of the term loan by $
3,000,000
to $
12,428,576
.
The amended term loan is payable in twenty-three fixed monthly principal payments of $
172,620
beginning November 30, 2013 with the remaining principal balance due on November 2, 2015.
As of December 31, 2013, the principal balance of the term note was $
12,083,336
and consisted of $
12,066,672
of Eurodollar Rate Loans with an effective interest rate of
4.419
% (before hedge) and $
16,664
Domestic Rate Loans with an effective interest rate of
5.5
%.
The PNC credit facility contains certain customary financial covenants that include, among others an annual limit on capital expenditures, a minimum fixed charge coverage ratio, and a minimum tangible net worth requirement. As of December 31, 2013, the Company was in compliance with all financial covenants under the Credit Agreement.
As discussed in Note 14, the Company’s Chairman and Chief Executive Officer, Michael Herman, has guaranteed $3,500,000 of the loan by PNC.
Debt Issuance Costs
In November 2012, the Company incurred $
922,685
of debt issuance costs related to the PNC credit facility and these costs are being amortized to interest expense over the term of the credit facility using the effective interest method.
An additional $
50,422
of debt issuance costs was incurred in connection with the PNC term loan amendment in November 2013. As of December 31, 2013 and 2012, $
324,012
and $
307,776
, respectively of unamortized debt issuance costs were included in
Prepaid expenses and other current assets
in the accompanying consolidated balance sheet.
The remaining long-term portion of debt issuance costs of $270,019 and $564,256 is included in
Other Assets
in the accompanying consolidated balance sheet for December 31, 2013 and 2012, respectively. During the year ended December 31, 2013 and 2012, the Company amortized $
309,236
and $
50,652
of these costs to
Interest Expense
.
On November 13, 2012 the Company entered into an Interest Rate Swap Agreement (“swap”) with PNC with a nominal value of $
11,000,000
in order to hedge the cash flow requirements for the variable interest rate associated with the PNC Term Loan.
The floating variable interest rate associated with the Term Loan debt of
4.25
% plus LIBOR was swapped for a fixed rate of
4.25
% plus
0.64
% for the duration of the PNC Term Loan.
At December 31, 2013 and 2012, updated valuations were performed and the Company recorded current liabilities of $
11,966
and $
24,048
(classified as
Accounts payable and accrued liabilities
), and long-term assets of $
18,616
and $
16,171
(classified as
Other Assets
), respectively, associated with the swap.
| 67 | ||
|
|
The Company determined that there was no ineffectiveness to the cash flow hedge, and recorded the change in valuation of $
8,875
and $
(4,805)
(net of taxes of $
5,652
and $
3,072
) as an unrealized loss within
Accumulated other comprehensive income
for the years ended December 31, 2013 and 2012, respectively.
Long-term debt consists of the following at December 31, 2013 and 2012:
|
|
|
December 31,
|
|
||||
|
|
|
2013
|
|
2012
|
|
||
|
|
|
|
|
|
|
|
|
|
PNC Term Loan, original principal balance of $11,000,000 at issuance, amended to
$12,428,576 in November 2013, payable in twenty-three fixed monthly principal installments of $172,620 beginning November 2013, with the remaining principal due November 2, 2015. Variable interest rate based of 4.25% plus 1 month LIBOR for Eurodollar Rate Loans and interest at PNC Base Rate plus 2.25% for Domestic Rate Loans, collateralized by equipment, inventory, and accounts of the Company and subject to financial covenants. (See Note 7.) |
|
$
|
12,083,336
|
|
$
|
10,738,096
|
|
|
|
|
|
|
|
|
|
|
|
Real Estate Loan for facility in North Dakota, interest at 3.75%, monthly principal and
interest payment of $5,255 ending October 3, 2028. Collateralized by land and property purchased with the loan. $100,000 of loan guaranteed by the Company’s Chairman and Chief Executive Officer. |
|
|
713,756
|
|
|
-
|
|
|
|
|
|
|
|
|
|
|
|
Real Estate Loan for facility in North Dakota, interest at prime plus
3.5% with a 4.75% floor (Refinanced in October 2013- see above) |
|
|
-
|
|
|
738,097
|
|
|
|
|
|
|
|
|
|
|
|
Note payable to the seller of Heat Waves. The note was garnished by the Internal Revenue
Service (“IRS”) in 2009 and is due on demand; payable in monthly installments of $3,000 per agreement with the IRS. |
|
|
281,000
|
|
|
314,000
|
|
|
|
|
|
|
|
|
|
|
|
Mortgage payable to a bank; interest at 7.25%, due in monthly payments
through February 2015 with a balloon payment of $111,875 on March 15, 2015, secured by land, guaranteed by the Company’s Chairman and Chief Executive Officer. |
|
|
153,018
|
|
|
204,941
|
|
|
|
|
|
|
|
|
|
|
|
Note payable entered with a lending institution to purchase field pickup trucks, interest at a
fixed rate of 8.05%. Term of 60 months, due in monthly installments of $4,688 through September 2016, secured by equipment purchased with the note. |
|
|
138,269
|
|
|
181,413
|
|
|
|
|
|
|
|
|
|
|
|
Mortgage payable to a bank, interest at 5.9%, payable monthly through January 2017 with
a balloon payment of $88,118 on February 1, 2017; secured by land. |
|
|
126,750
|
|
|
137,507
|
|
|
|
|
|
|
|
|
|
|
|
Notes payable to a vehicle finance company, interest at fixed rates from 4.89% to 7.8%,
due in monthly installments through August 2015, secured by vehicles, guaranteed by one of the stockholders. |
|
|
42,961
|
|
|
68,476
|
|
|
|
|
|
|
|
|
|
|
|
Note payable entered into with a lending institution in order to purchase
equipment, interest at a fixed rate of 8.2%. Term of 60 months, due in monthly installments through January 2017, secured by equipment purchased with the note. |
|
|
27,875
|
|
|
35,469
|
|
|
|
|
|
|
|
|
|
|
|
Note payable to vehicle finance companies, interest rates from 4.74% to 4.99%, terms
from 49 to 60 months, due in monthly installments through November 2018, secured by equipment purchased with the note. |
|
|
195,224
|
|
|
-
|
|
|
|
|
|
|
|
|
|
|
|
Note payable with a lending institution to purchase field equipment,
interest at a fixed rate of 6.50%. Paid in full during 2013. |
|
|
-
|
|
|
326,964
|
|
|
|
|
|
|
|
|
|
|
|
Capital leases to purchase trucks and trailers, interest at a fixed
rate of 5%. Paid in full in 2013. |
|
|
-
|
|
|
62,308
|
|
|
|
|
|
|
|
|
|
|
|
Total
|
|
|
13,762,189
|
|
|
12,807,271
|
|
|
Total current portion
|
|
|
(2,562,141)
|
|
|
(2,236,343)
|
|
|
Long term debt, net of current portion
|
|
|
11,200,048
|
|
|
10,570,928
|
|
Aggregate maturities of debt are as follows:
|
Year Ended December 31,
|
|
|
|
|
|
2014
|
|
$
|
2,562,141
|
|
|
2015
|
|
|
10,290,655
|
|
|
2016
|
|
|
149,119
|
|
|
2017
|
|
|
177,762
|
|
|
2018
|
|
|
66,068
|
|
|
Thereafter
|
|
|
516,444
|
|
|
Total
|
|
$
|
13,762,189
|
|
| 68 | ||
|
|
The following tables present the Company’s financial assets and liabilities that were accounted for at fair value on a recurring basis by level within the fair value hierarchy:
|
|
|
Fair Value Measurement Using
|
|
|
|
|
|||||||
|
|
|
Quoted
|
|
Significant
|
|
|
|
|
|
||||
|
|
|
Prices in
|
|
Other
|
|
Significant
|
|
|
|
||||
|
|
|
Active
|
|
Observable
|
|
Unobservable
|
|
|
|
||||
|
|
|
Markets
|
|
Inputs
|
|
Inputs
|
|
Fair Value
|
|
||||
|
|
|
(Level 1)
|
|
(Level 2)
|
|
(Level 3)
|
|
Measurement
|
|
||||
|
December 31, 2013
|
|
|
|
|
|
|
|
|
|
|
|
|
|
|
Derivative Instrument
|
|
|
|
|
|
|
|
|
|
|
|
|
|
|
Interest rate swap, net asset*
|
|
$
|
-
|
|
$
|
6,650
|
|
$
|
-
|
|
$
|
6,650
|
|
|
|
|
|
|
|
|
|
|
|
|
|
|
|
|
|
December 31, 2012
|
|
|
|
|
|
|
|
|
|
|
|
|
|
|
Derivative Instrument
|
|
|
|
|
|
|
|
|
|
|
|
|
|
|
Interest rate swap, net liability*
|
|
$
|
-
|
|
$
|
-
|
|
$
|
(7,877)
|
|
$
|
(7,877)
|
|
*Note: The interest rate swap as of December 31, 2013 consists of long-term assets of $
18,616
(classified as
Long-term portion of interest rate swap
), and current liabilities of $
11,966
(classified as
Current portion of interest rate swap
).
The interest rate swap as of December 31, 2012 consists of current liabilities of $
24,048
(classified as
Current portion of interest rate swap
), and long-term assets of $
16,171
(classified as
Long-term portion of interest rate swap
).
The Company’s derivative instrument (e.g. interest rate swap, or “swap”) is valued using models which require a variety of inputs, including contractual terms, market prices, yield curves, credit spreads, and correlations of such inputs. Some of the model inputs used in valuing the derivative instruments trade in liquid markets.
However, there are certain variables used which are not observable, due to the complexity of discounted cash flows for the cash flow hedge, etc.
As such, since these unobservable variables require more objectivity and involve significant management judgment, the derivative instruments are classified within Level 3 of the fair value hierarchy and are included in other assets, non-current, and other liabilities, current. The fair value of derivative instruments reflected in the table above and on the Consolidated Balance Sheets has been adjusted for non-performance risk. For applicable financial assets carried at fair value, the credit standing of the counterparties is analyzed and factored into the fair value measurement of those assets. Using prevailing interest rates on similar investments and foreign currency forward rates, the estimated fair value of the swap was $6,650 and ($7,877) at the years ended December 31, 2013 and 2012, respectively. The fair value estimate of the swap does not reflect its actual trading value.
| 69 | ||
|
|
The sources of income from continuing operations before income taxes are as follows:
|
|
|
December 31,
|
|
||||
|
|
|
2013
|
|
2012
|
|
||
|
|
|
|
|
|
|
|
|
|
United States
|
|
$
|
7,502,637
|
|
$
|
828,267
|
|
|
Foreign
|
|
|
-
|
|
|
-
|
|
|
Income before income taxes
|
|
|
7,502,637
|
|
|
828,267
|
|
The income tax provision from continuing operations consists of the following:
|
|
|
December 31,
|
|
||||
|
|
|
2013
|
|
2012
|
|
||
|
Current
|
|
|
|
|
|
|
|
|
Federal
|
|
$
|
1,130,009
|
|
$
|
-
|
|
|
State
|
|
|
220,900
|
|
|
-
|
|
|
|
|
|
1,350,909
|
|
|
-
|
|
|
Deferred
|
|
|
|
|
|
|
|
|
Federal
|
|
|
1,548,332
|
|
|
372,064
|
|
|
State
|
|
|
227,696
|
|
|
54,715
|
|
|
|
|
|
1,776,028
|
|
|
426,779
|
|
|
Total Income Tax Provision
|
|
$
|
3,126,937
|
|
$
|
426,779
|
|
A reconciliation of computed income taxes
by applying the statutory federal income tax rate of
34
% to income from continuing operations before taxes to the provision for income taxes for the years ended December 31, 2013 and 2012 is as follows:
Note 14 – Related Party Transactions
|
|
|
December 31,
|
|
||||
|
|
|
2013
|
|
2012
|
|
||
|
|
|
|
|
|
|
|
|
|
Computed income taxes at 34%
|
|
$
|
2,550,897
|
|
$
|
281,610
|
|
|
|
|
|
|
|
|
|
|
|
Increase in income taxes resulting from:
|
|
|
|
|
|
|
|
|
State and local income taxes, net of federal impact
|
|
|
475,132
|
|
|
41,413
|
|
|
Stock-based compensation
|
|
|
74,943
|
|
|
87,877
|
|
|
Other
|
|
|
25,965
|
|
|
15,879
|
|
|
|
|
|
|
|
|
|
|
|
Provision for income taxes
|
|
$
|
3,126,937
|
|
$
|
426,779
|
|
In assessing the realization of deferred tax assets, management considers whether it is more likely than not that some portion or all of the deferred tax assets will not be realized. The ultimate realization of deferred tax assets is dependent upon the generation of future taxable income during the periods in which those temporary differences become deductible. Management considers the scheduled reversal of deferred tax liabilities, projected future taxable income, and tax planning strategies in making this assessment.
Note 13 – Stock Options
| 70 | ||
|
|
Based upon the level of historical taxable income and projections for future taxable income over the periods in which the deferred tax assets are deductible, management believes it is more likely than not that the Company will realize the benefits of these deductible differences. The amount of the deferred tax asset considered realizable, however, could be reduced in the near term if estimates of future taxable income during the carryforward period are reduced.
Note 12 – Stockholders Equity
We have a requirement of reporting of taxes based on tax positions which meet a more likely than not standard and which are measured at the amount that is more likely than not to be realized. Differences between financial and tax reporting which do not meet this threshold are required to be recorded as unrecognized tax benefits. This standard also provides guidance on the presentation of tax matters and the recognition of potential IRS interest and penalties.
As of December 31, 2013 and 2012, the Company does not have an unrecognized tax liability.
The components of deferred income taxes for the years ended December 31, 2013 and 2012 are as follows:
|
|
|
December 31, 2013
|
|
December 31, 2012
|
|
||||||||
|
|
|
Current
|
|
Long-Term
|
|
Current
|
|
Long-Term
|
|
||||
|
Deferred tax assets
|
|
|
|
|
|
|
|
|
|
|
|
|
|
|
Reserves and accruals
|
|
$
|
336,561
|
|
$
|
-
|
|
$
|
166,766
|
|
$
|
-
|
|
|
Amortization
|
|
|
-
|
|
|
222,117
|
|
|
-
|
|
|
249,446
|
|
|
Capital losses
|
|
|
-
|
|
|
(1,982)
|
|
|
-
|
|
|
11,396
|
|
|
Non-qualified stock option expense
|
|
|
-
|
|
|
514,659
|
|
|
-
|
|
|
405,386
|
|
|
Loss Carryforwards
|
|
|
-
|
|
|
26,700
|
|
|
-
|
|
|
1,008,850
|
|
|
|
|
|
336,561
|
|
|
761,494
|
|
|
166,766
|
|
|
1,675,078
|
|
|
Less: Valuation Allowance
|
|
|
-
|
|
|
-
|
|
|
-
|
|
|
-
|
|
|
|
|
|
|
|
|
|
|
|
|
|
|
|
|
|
Total deferred tax assets
|
|
|
336,561
|
|
|
761,494
|
|
|
166,766
|
|
|
1,675,078
|
|
|
|
|
|
|
|
|
|
|
|
|
|
|
|
|
|
Deferred tax liabilities
|
|
|
|
|
|
|
|
|
|
|
|
|
|
|
Depreciation
|
|
|
-
|
|
|
(3,182,960)
|
|
|
-
|
|
|
(2,126,740)
|
|
|
Acquired intangible assets
|
|
|
-
|
|
|
-
|
|
|
(13,300)
|
|
|
-
|
|
|
|
|
|
|
|
|
|
|
|
|
|
|
|
|
|
Total deferred tax liabilities
|
|
|
-
|
|
|
(3,182,960)
|
|
|
(13,300)
|
|
|
(2,126,740)
|
|
|
|
|
|
|
|
|
|
|
|
|
|
|
|
|
|
Net deferred tax assets (liabilities)
|
|
$
|
336,561
|
|
$
|
(2,421,466)
|
|
$
|
153,466
|
|
$
|
(451,662)
|
|
As of December 31, 2013 and 2012, the Company did not record any valuation allowances.
The Company classifies penalty and interest expense related to income tax liabilities as an income tax expense.
There are no interest and penalties recognized in the statement of operations or accrued on the balance sheet.
The Company files tax returns in the United States, in the states of Colorado, Kansas,
Nebraska,
North Dakota, and Pennsylvania.
The tax years 2010 through 2013 remain open to examination in the taxing jurisdictions to which the Company is subject.
| 71 | ||
|
|
Private Placement.
In November 2012, the Company completed a Private Placement transaction of
5,699
Units to accredited investors at a price of $
350
per Unit for total proceeds of $
1,994,800
.
Each Unit was comprised of
1,000
shares of the Company’s common stock and warrants to purchase
500
shares of the Company’s common stock at $
0.55
per share for up to 5 years from the date of closing. This resulted in the issuance of
5,699,428
shares of common stock and warrants to purchase
2,849,714
shares of common stock.
In connection with this transaction, the Company issued
449,456
warrants as compensation to
third parties for services performed for the Company in connection with the Private Placement on
the same terms as the other warrants issued in the Private Placement.
Conversion of Subordinated Debt
On November 2, 2012, pursuant to conditions within the PNC Revolving Credit, Term Loan, and Security Agreement, Mr. Michael D. Herman (the Company’s Chairman and CEO) converted his $
1,477,760
of outstanding subordinated debt into
4,222,000
shares of the Company’s common stock and warrants to purchase
2,111,000
additional shares of common stock on the same terms and conditions as those of the Private Placement transaction above. In November 2013, Mr. Herman exercised all of his warrants for cash proceeds of $
1,161,050
.
In conjunction with the stock subscription agreements executed by the Private Placement investors, the Company and each investor also entered into a registration rights agreement; which agreement requires the payment of penalty fees to the equity investor in the event the Company is unable to timely register the shares of common stock acquired by the equity investor pursuant to the stock subscription agreement.
The Company filed a registration statement for these shares which was declared effective June 21, 2013.
If the Company fails to maintain the effectiveness of this registration statement, it may be subject to a penalty in cash or shares equal to 1.0% per month (prorated for any partial months), for the period(s) of time that the Company fails to maintain effectiveness of the registration statement underlying these shares.
Liquidated Damages shall not exceed
8
% of the original purchase price of such shares. The Company has not recorded an obligation for liquidated damages as the possibility of failing to maintain effectiveness is remote.
| 72 | ||
|
|
Proposed Stock Split
At the Company’s annual shareholder meeting held on July 25, 2013, in order to facilitate a possible listing on a national exchange, the shareholders of the Company adopted a proposal giving the board of directors discretion to implement a reverse stock split in a
ratio between one-for-two (1:2) up to one-for-three (1:3),
or anywhere in between, while maintaining or reducing the number of authorized shares of common stock and preferred stock at any proportion which the Board of Directors may deem appropriate in its discretion. The Company has met all listing requirements for the NYSE MKT and was approved for listing on March
5
, 2014 and accordingly there is no need to implement a stock split.
Warrants
In conjunction with the Private Placement and subordinated debt conversion in November 2012, the Company granted a one-half share warrant for every full share of common stock acquired by the equity investors or converted by Mr. Herman.
As such, the Company granted warrants to purchase
4,960,714
shares of the Company’s common stock, exercisable at $
0.55
per share for a
five year term
. Each of the warrants may be exercised on a cashless basis.
The warrants also provide that subject to various conditions, the holders have piggy-back registration rights with respect to the shares of common stock that may be acquired upon the exercise of the warrants.
In November 2012, the Company granted each of the principals of an existing investor relations firm warrants to acquire
112,500
shares of the Company’s common stock (a total of
225,000
shares) for the firms assistance in creating awareness for the Company’s Private Placement.
The warrants are exercisable at $
0.55
per share and expire 5 years from date of grant.
On November 29, 2012, the Company entered into an investor relations agreement with an unaffiliated firm.
Pursuant to this agreement and in lieu of cash fees, the Company issued the firm
125,000
shares of common stock at $0.40 per share and granted the firm a warrant to purchase
200,000
shares of common stock at $
0.40
per share through June 1, 2016.
The warrants vest based on performance criteria and may be exercised on a cashless basis.
The warrants also provide that subject to various conditions, the holders have piggy-back registration rights with respect to the shares of common stock that may be acquired upon the exercise of the warrants.
During the year ended December 31, 2013, the Company recognized stock-based compensation (through operating expense as general and administrative expense) of $
60,046
attributable to warrants issued on November 29, 2012.
A summary of warrant activity for the years ended December 31, 2013 and 2012 is as follows:
|
|
|
|
|
|
|
Weighted
|
|
|
|
||
|
|
|
|
|
Weighted
|
|
Average
|
|
|
|
||
|
|
|
|
|
Average
|
|
Remaining
|
|
Aggregate
|
|
||
|
|
|
|
|
Exercise
|
|
Contractual
|
|
Intrinsic
|
|
||
|
Warrants
|
|
Shares
|
|
Price
|
|
Life (Years)
|
|
Value
|
|
||
|
|
|
|
|
|
|
|
|
|
|
||
|
Outstanding at January 1, 2012
|
|
325,000
|
|
$
|
0.58
|
|
3.1
|
|
$
|
144,150
|
|
|
Issued for services
|
|
874,456
|
|
|
0.55
|
|
|
|
|
|
|
|
Issued for private placement
|
|
4,960,714
|
|
|
0.55
|
|
|
|
|
|
|
|
Exercised
|
|
-
|
|
|
-
|
|
|
|
|
|
|
|
Forfeited/cancelled
|
|
-
|
|
|
-
|
|
|
|
|
|
|
|
Outstanding at December 31, 2012
|
|
6,160,170
|
|
$
|
0.55
|
|
4.7
|
|
$
|
1,194,932
|
|
|
Issued
|
|
-
|
|
|
-
|
|
|
|
|
|
|
|
Exercised
|
|
(3,502,456)
|
|
|
0.55
|
|
|
|
|
|
|
|
Forfeited/Cancelled
|
|
-
|
|
|
-
|
|
|
|
|
|
|
|
Outstanding at December 31, 2013
|
|
2,657,714
|
|
$
|
0.55
|
|
3.7
|
|
$
|
3,359,170
|
|
|
|
|
|
|
|
|
|
|
|
|
|
|
|
Exercisable at December 31, 2013
|
|
2,657,714
|
|
$
|
0.55
|
|
3.7
|
|
$
|
3,359,170
|
|
| 73 | ||
|
|
During the year ended December 31, 2013 warrants to acquire
1,236,456
shares of common stock were exercised by way of cashless exercise whereby the warrant holders elected to receive
716,028
shares without payment of the exercise price and the remaining warrants for
520,428
shares were cancelled.
In addition, warrants to acquire
2,266,000
shares were exercised for cash payments totaling $
1,246,300
. The warrants exercised had a total intrinsic value of $
2,662,347
at the time of exercise.
On July 27, 2010 the Company’s board of directors adopted the 2010 Stock Incentive Plan (the “2010 Plan”). The aggregate number of shares of common stock that may be granted under the 2010 Plan is
reset at the beginning of each year based on
15
% of the number of shares of common stock then outstanding.
As such, on January 1, 2013 the number of shares of common stock available under the 2010 Plan was reset to
4,773,794
shares based upon
31,825,294
shares outstanding on that date
and on January 1, 2014, the 2010 plan was reset to
5,223,380
.
Options are typically granted with an exercise price equal to the estimated fair value of the Company's common stock at the date of grant with a vesting schedule of
one to three years
and a contractual term of
5
years.
As of December 31, 2013, there were
3,025,000
options outstanding under the 2010 Plan.
The “2008 Equity Plan” was established by Aspen Exploration in February 2008 and was retained by the Company after the Acquisition. An aggregate of
1,000,000
common shares were reserved for issuance under the 2008 Equity Plan. On July 27, 2010, the Company terminated the 2008 Equity Plan, although such termination did not terminate or otherwise affect the contractual rights of persons who hold options to acquire common stock under the 2008 Equity Plan.
As of December 31, 2013, there were
350,000
options outstanding under the 2008 Plan.
A summary of the range of assumptions used to value stock options granted for the years ended December, 2013 and 2012 are as follows:
|
|
|
For the Years Ended December 31,
|
|
|||
|
|
|
2013
|
|
2012
|
|
|
|
|
|
|
|
|
|
|
|
Expected volatility
|
|
125% - 139%
|
|
118% - 120%
|
|
|
|
Risk-free interest rate
|
|
0.32% - 0.66%
|
|
0.32% - 0.37%
|
|
|
|
Dividend yield
|
|
-
|
|
-
|
|
|
|
Expected term (in years)
|
|
2.5 – 3.5
|
|
3.0 – 3.5
|
|
|
During the year ended December 31, 2013, the Company granted options to acquire
658,000
shares of common stock with a weighted-average grant-date fair value of $0.84 per share. During the year ended December 31, 2013, options to acquire
38,332
shares of common stock were exercised by way of a cashless exercise whereby the option holders elected to receive
15,214
shares of common stock without payment of the exercise price and the remaining options for
23,118
shares were cancelled.
The options had an intrinsic value of $
13,383
at the time of exercise.
During the year ended December 31, 2012, the Company granted options to acquire
1,270,000
shares of common stock with a weighted-average grant-date fair value of $
0.46
per share. No options were exercised during the year ended December 31, 2012.
| 74 | ||
|
|
The following is a summary of stock option activity for all equity plans for the years ended December 31, 2013 and 2012:
|
|
|
|
|
|
|
Weighted
|
|
|
|
||
|
|
|
|
|
|
|
Average
|
|
|
|
||
|
|
|
|
|
Weighted
|
|
Remaining
|
|
|
|
||
|
|
|
|
|
Average
|
|
Contractual
|
|
Aggregate
|
|
||
|
|
|
|
|
Exercise
|
|
Term
|
|
Intrinsic
|
|
||
|
|
|
Shares
|
|
Price
|
|
(Years)
|
|
Value
|
|
||
|
|
|
|
|
|
|
|
|
|
|
||
|
Outstanding at January 1, 2012
|
|
3,305,431
|
|
$
|
0.70
|
|
2.5
|
|
$
|
1,064,876
|
|
|
Granted
|
|
1,270,000
|
|
|
0.65
|
|
|
|
|
|
|
|
Exercised
|
|
-
|
|
|
-
|
|
|
|
|
|
|
|
Forfeited or Expired
|
|
(1,500,000)
|
|
|
0.67
|
|
|
|
|
|
|
|
|
|
|
|
|
|
|
|
|
|
|
|
|
Outstanding at December 31, 2012
|
|
3,075,431
|
|
$
|
0.71
|
|
2.3
|
|
$
|
106,051
|
|
|
Granted
|
|
658,000
|
|
|
1.10
|
|
|
|
|
|
|
|
Exercised
|
|
(38,332)
|
|
|
0.72
|
|
|
|
|
|
|
|
Forfeited or Expired
|
|
(320,099)
|
|
|
1.42
|
|
|
|
|
|
|
|
|
|
|
|
|
|
|
|
|
|
|
|
|
Outstanding at December 31, 2013
|
|
3,375,000
|
|
$
|
0.70
|
|
2.6
|
|
$
|
3,760,325
|
|
|
Vested or Expected to Vest at December 31, 2013
|
|
3,375,000
|
|
$
|
0.70
|
|
2.6
|
|
$
|
3,760,325
|
|
|
Exercisable at December 31, 2013
|
|
2,708,332
|
|
$
|
0.69
|
|
1.5
|
|
$
|
3,020,823
|
|
The aggregate intrinsic value in the table above represents the total intrinsic value (the difference between the estimated fair value of the Company’s common stock and the exercise price, multiplied by the number of in-the-money options) that would have been received by the option holders had they exercised their options on December 31, 2013.
During the year ended December 31, 2013 and 2012, the Company recognized stock-based compensation costs for stock options of $
412,310
and $
279,362
, respectively in general and administrative expenses.
The Company currently expects all outstanding options to vest. Compensation cost is revised if subsequent information indicates that the actual number of options vested is likely to differ from previous estimates.
A summary of the status of non-vested shares underlying the options are presented below:
|
|
|
|
|
Weighted-
|
|
|
|
|
|
Number of
|
|
Average Grant-
|
|
|
|
|
|
Shares
|
|
Date Fair Value
|
|
|
|
|
|
|
|
|
|
|
|
Non-vested at January 1, 2012
|
|
1,123,334
|
|
$
|
0.48
|
|
|
Granted
|
|
1,270,000
|
|
|
0.33
|
|
|
Vested
|
|
(770,000)
|
|
|
0.54
|
|
|
Forfeited
|
|
(813,334)
|
|
|
0.59
|
|
|
Non-vested at December 31, 2012
|
|
810,000
|
|
$
|
0.37
|
|
|
Granted
|
|
658,000
|
|
|
0.84
|
|
|
Vested
|
|
(638,330)
|
|
|
0.60
|
|
|
Forfeited
|
|
(163,002)
|
|
|
0.67
|
|
|
Non-vested at December 31, 2013
|
|
666,668
|
|
$
|
0.54
|
|
| 75 | ||
|
|
As of December 31, 2013 there was $
248,793
of total unrecognized compensation costs related to non-vested shares under the qualified stock option plans which will be recognized over the remaining weighted-average period of
1.50
years.
The following sets forth information regarding transactions between the Company (and its subsidiaries) and its officers, directors and significant stockholders.
Related Party Loan Transactions:
During 2009 and 2010, Michael D. Herman (the Company’s Chairman and Chief Executive Officer), loaned $
1,700,000
to Heat Waves pursuant to the terms of two promissory notes.
Both notes accrued interest at
3
% per annum and were due in full by December 31, 2018.
In connection with a debt financing in June 2010, Mr. Herman agreed to subordinate the debt represented by both notes to all obligations to the then current lender.
Interest was to be paid annually in arrears on both notes, but due to the subordination interest was being accrued to the loan balances.
In July 2011, a principal payment in the amount of $
222,240
was approved by the board of directors and applied to the promissory note.
On October 4, 2011 and again on October 29, 2012, upon board approval, Mr. Herman received an interest payment in the amount of $
77,000
and $
7,000
, respectively, on this loan.
| 76 | ||
|
|
Conversion of Subordinated Debt:
In connection with the PNC financing in November 2012, Mr. Herman agreed to convert the outstanding principal balance of $
1,477,760
under both notes into common stock and warrants on the same terms as the private placement being offered to investors (i.e. Units at $
350
per Unit, each Unit consisting of
1,000
shares of Enservco common stock and warrants to purchase
500
shares at $
0.55
per share).
As a result, Mr. Herman was issued
4,222,000
shares of common stock and warrants to acquire
2,111,000
shares of common stock at $
0.55
per share.
The $
45,018
of accrued interest owed to Mr. Herman from the subordinated debt was paid in cash from funds received through the PNC agreement and Private Placement.
Also as a condition of the refinancing with PNC, PNC required that Mr. Herman enter into a guarantee agreement for $
3,500,000
and pledge
250,000
shares of an unaffiliated
publicly traded
company, owned by Mr. Herman.
Accordingly, the Board of Directors agreed to continue the $
12,500
per month guarantee fee that was previously being paid under the previous debt facility.
In connection with the PNC amendment in November 2013, PNC agreed to release the
250,000
shares of stock pledged under the agreement.
Loan Guaranty:
On October 3, 2013, the Company refinanced its real estate loan for its facility in North Dakota as described in Note 9.
Under the terms of the agreement, $
100,000
of the loan is guaranteed by Mike Herman, the Company’s Chief Executive Officer.
However, in the event the Company makes a principal payment equal to or greater than $100,000, the guaranty is released in full.
Related Party Purchase in Equity Offering:
In connection with the Private Placement completed in November 2012, the Company’s President, Rick Kasch, purchased
75
units for total consideration of $
26,250
.
Similar to unaffiliated investors, each Unit cost $350 and consisted of
1,000
shares of Enservco common stock and warrants to purchase
500
shares at $
0.55
per share).
As such, Mr. Kasch acquired
75,000
shares of common stock of the Company, and was granted warrants to purchase
37,500
shares of common stock of the Company at $
0.55
per share.
Warrant and option exercises
From January 1, 2014 to March 20, 2014, warrants to acquire
1,469,357
shares of common stock were exercised by way of cashless exercise whereby the warrant holders elected to receive
1,119,173
shares without payment of the exercise price and the remaining warrants for
350,184
shares were cancelled.
In addition, warrants to acquire
162,962
shares were exercised for cash payments totaling $
89,629
, and options to acquire
100,000
shares were exercised for cash payments totaling $
41,250
. The warrants and options exercised had a total intrinsic value of $
2,899,925
at the time of exercise.
Sale
of Equipment to Related Party
On February 3, 2014, the Board of Directors approved the sale of two trucks and a trailer to an entity owned
50
% by the Company’s Chairman and Chief Executive Officer for $
50,000
.
The equipment had not been in service for over two years and was not economically feasible to repair and return to service.
The Company was holding this equipment primarily for salvage purposes.
At the time of the sale, the equipment had a net book value of $
38,000
which resulted in a gain of $
12,000
.
The Company believes the price paid was at least equal to the fair market value of the units had they been sold through auction or in the open market.
NYSE MKT Listing
On March
5
, 2014, the Company was approved for listing on the NYSE MKT national exchange and began trading on March
10
,
2014.
| 77 | ||
|
|
TABLE OF CONTENTS
Part IItem 1. BusinessItem 1A. Risk FactorsItem 1B. Unresolved Staff CommentsItem 2. Description Of PropertiesItem 3. Legal ProceedingsItem 4. Mine Safety DisclosuresPart IIItem 5. Market For Common Equity and Related Stockholder Matters and Issuer Purchases Of Equity SecuritiesItem 6. Selected Financial DataItem 7. Management's Discussion and Analysis Of Financial Condition and Results Of OperationsItem 7A. Quantitative and Qualitative Disclosures About Market RiskItem 8. Financial StatementsItem 9. Changes in and Disagreements with Accountants on Accounting and Financial DisclosureItem 9A Controls and ProceduresItem 9B. Other InformationPart IIIItem 10. Directors, Executive Officers and Corporate GovernanceItem 11. Executive CompensationItem 12. Security Ownership Of Certain Beneficial Owners and Management and Related Stockholder MattersItem 13. Certain Relationships and Related Transactions, and Director IndependenceItem 14. Principal Accounting Fees and ServicesPart IVItem 15. ExhibitsNote 1 Basis Of PresentationNote 2 - Summary Of Significant Accounting PoliciesNote 3 Discontinued OperationsNote 4 - Non-compete AgreementsNote 5 - Property and EquipmentNote 6 Commitments and ContingenciesNote 7 Pnc Credit FacilityNote 8 Interest Rate SwapNote 9 Long-term DebtNote 10 - Fair Value MeasurementsNote 11 Income TaxesNote 12 Stockholders EquityNote 13 Stock OptionsNote 14 Related Party TransactionsNote 15 Subsequent Events