ENTEGRIS INC
10-Ks and 10-Qs
|
|
|
|
|
|
|
|
|
|
|
|
|
|
|
|
|
|
|
|
|
|
|
|
|
|
|
|
|
|
|
|
|
|
|
|
|
|
|
|
|
|
|
|
|
|
|
|
|
|
UNITED STATES
SECURITIES AND EXCHANGE COMMISSION
WASHINGTON, D.C. 20549
________________________________________
FORM 10-K
________________________________________
(Mark One)
|
x
|
ANNUAL REPORT PURSUANT TO SECTION 13 OR 15(d) OF THE SECURITIES EXCHANGE ACT OF 1934
|
For the fiscal year ended December 31,
2015
or
|
o
|
TRANSITION REPORT PURSUANT TO SECTION 13 OR 15(d) OF THE SECURITIES EXCHANGE ACT OF 1934
|
For the transition period from
to
Commission file number:
001-32598
_______________________________________
Entegris, Inc.
(Exact name of registrant as specified in its charter)
_______________________________________
|
Delaware
|
41-1941551
|
|
(State or Other Jurisdiction of
Incorporation or Organization)
|
(I.R.S. Employer
Identification No.)
|
129 Concord Road, Billerica, Massachusetts 01821
(Address of principal executive offices and zip code)
(978) 436-6500
(Registrant’s telephone number, including area code)
Securities registered pursuant to Section 12(b) of the Act:
|
Title of Class
|
Name of Exchange on which Registered
|
|
Common Stock, $0.01 Par Value
|
The Nasdaq Global Select Market
|
Securities registered pursuant to Section 12(g) of the Act: None
_______________________________________________________
Indicate by check mark if the registrant is a well known seasoned issuer, as defined in Rule 405 of the Securities Act.
x
Yes
o
No
Indicate by check mark if the registrant is not required to file reports pursuant to Section 13 or 15(d) of the Act.
o
Yes
x
No
Indicate by check mark whether the registrant: (1) has filed all reports required to be filed by Section 13 or 15(d) of the Securities Exchange Act of 1934 during the preceding 12 months (or for such shorter period that the registrant was required to file such reports), and (2) has been subject to such filing requirements for the past 90 days. Yes
x
No
o
Indicate by check mark whether the registrant has submitted electronically and posted on its corporate Web site, if any, every Interactive Data File required to be submitted and posted pursuant to Rule 405 of Regulation S-T (§232.405 of this chapter) during the preceding 12 months (or for such shorter period that the registrant was required to submit and post such files). Yes
x
No
o
Indicate by check mark if disclosure of delinquent filers pursuant to Item 405 of Regulation S-K (§229.405) is not contained herein and will not be contained, to the best of registrant’s knowledge, in definitive proxy or information statements incorporated by reference in Part III of Form 10-K or any amendment to this Form 10-K.
o
Indicate by check mark whether the registrant is a large accelerated filer, an accelerated filer, a non-accelerated filer or a smaller reporting company. (Check one):
|
Large Accelerated Filer
|
x
|
Accelerated Filer
|
o
|
|
Non-Accelerated Filer
|
o
(Do not check if a smaller reporting company)
|
Smaller reporting company
|
o
|
Indicate by check mark whether the registrant is a shell company (as defined in Rule 12b-2 of the Exchange Act). Yes
¨
No
ý
The aggregate market value of voting stock held by non-affiliates of the registrant, based on the last sale price of the Common Stock on June 27, 2015, the last business day of registrant’s most recently completed second fiscal quarter, was
$1,616,092,607
. Shares held by each officer and director of the registrant and by each person who owned 10 percent or more of the outstanding Common Stock have been excluded from this computation in that such persons may be deemed to be affiliates of the registrant. This determination of affiliate status for this purpose is not necessarily a conclusive determination for other purposes.
As of
February 22, 2016
,
140,640,495
shares of the registrant’s Common Stock were outstanding.
DOCUMENTS INCORPORATED BY REFERENCE
Portions of the registrant’s Definitive Proxy Statement for its 2016 Annual Meeting of Stockholders scheduled to be held on May 17, 2016, or the 2016 Proxy Statement, which will be filed with the Securities and Exchange Commission, or SEC, not later than 120 days after December 31,
2015
, are incorporated by reference into Part III of this Annual Report on Form 10-K. With the exception of the portions of the 2016 Proxy Statement expressly incorporated into this Annual Report on Form 10-K by reference, such document shall not be deemed filed as part of this Annual Report on Form 10-K.
ENTEGRIS, INC.
INDEX TO ANNUAL REPORT ON FORM 10-K
FOR THE FISCAL YEAR ENDED DECEMBER 31,
2015
|
|
Caption
|
Page
|
|
|
PART I
|
|||
|
Item 1.
|
|||
|
Item 1A.
|
|||
|
Item 1B.
|
|||
|
Item 2.
|
|||
|
Item 3.
|
|||
|
Item 4.
|
|||
|
PART II
|
|||
|
Item 5.
|
|||
|
Item 6.
|
|||
|
Item 7.
|
|||
|
Item 7A.
|
|||
|
Item 8.
|
|||
|
Item 9.
|
|||
|
Item 9A.
|
|||
|
Item 9B.
|
|||
|
PART III
|
|||
|
Item 10.
|
|||
|
Item 11.
|
|||
|
Item 12.
|
|||
|
Item 13.
|
|||
|
Item 14.
|
|||
|
PART IV
|
|||
|
Item 15.
|
|||
THE COMPANY
Entegris, Inc., referred in this report as Entegris or the Company, is a worldwide developer, manufacturer and supplier of yield-enhancing materials and solutions for advanced manufacturing processes in the semiconductor and other high-technology industries. Our products and materials are used to manufacture semiconductors, micro-electromechanical systems, flat panel displays, light emitting diodes or LEDs, high-purity chemicals, such as photoresists, solar cells, gas lasers, optical and magnetic storage devices, and critical components for aerospace, glass manufacturing and biomedical applications. We sell our products worldwide through a direct sales force and through selected distributors.
The Company was incorporated in Delaware in March 2005 in connection with a strategic merger of equals transaction between Entegris, Inc., a Minnesota corporation, and Mykrolis Corporation, a Delaware corporation. On April 30, 2014, the Company acquired ATMI, Inc., a Delaware Corporation based in Danbury, CT, referred to throughout this report as ATMI. This transaction is referred to alternatively as the Merger or the ATMI acquisition in this report. See OUR HISTORY below.
We offer a diverse product portfolio that includes approximately
20,000
standard and customized products which include both unit driven and capital expense driven products. As a result of the Merger, unit-driven products now comprise approximately 80% of our combined sales, with the remaining balance being capital driven products. Our unit-driven products are consumed or exhausted during the customer’s manufacturing process and rely on the level of semiconductor and other manufacturing activity to drive growth. Our unit-driven product class includes membrane-based liquid filters, resin-based gas purifiers, wafer shippers, disk-shipping containers and test assembly and packaging products, implant gas storage and delivery systems, copper electroplating materials, advanced precursor materials for thin film deposition and photoresist strip and post chemical mechanical planarization (CMP) or CMP cleaning materials and consumable graphite and silicon carbide components. Capital expense driven products, which generally have a lifetime of 18 months or more, rely on the expansion of manufacturing capacity to drive growth and include our fluid management components, systems and subsystems that transfer, monitor, and control process liquids used in the semiconductor manufacturing processes, gas filtration and purification components, systems and subsystems that remove contaminants at equipment and factory level for manufacturing, our process carriers that protect the integrity of in-process wafers and graphite, silicon carbide and specialty coated components for manufacturing equipment. Unit-driven products accounted for approximately
78%
,
74%
, and
66%
of our net sales for fiscal years
2015
,
2014
and
2013
, respectively, while capital expense-driven products accounted for approximately
22%
,
26%
and
34%
of our net sales for the fiscal years
2015
,
2014
and
2013
, respectively.
Our Internet address is
www.entegris.com
. On this web site, under the “Investors-Financial Information-SEC Filings” section, we post the following filings as soon as reasonably practicable after they are electronically filed with, or furnished to, the U.S. Securities and Exchange Commission (SEC): our annual, quarterly, and current reports on Forms 10-K, 10-Q, and 8-K; our proxy statements; any amendments to those reports or statements, and Form SD. All such filings are available on our web site free of charge. The SEC also maintains a web site (
www.sec.gov
) that contains reports, proxy and information statements, and other information regarding issuers that file electronically with the SEC. The content on our website, and any other website, as referred to in this Form 10-K is not incorporated by reference into this Form 10-K unless expressly noted.
SEMICONDUCTOR INDUSTRY BACKGROUND
Semiconductors, or integrated circuits, are the building blocks of today’s electronics and the backbone of the information age. The market for semiconductors has grown significantly over past decades. This trend is expected to continue as the advanced connectivity of devices to the internet or the “internet of things”, gathers increasing momentum. We believe that the connected devices, ranging from everyday devices, such as light bulbs and home heating thermostats interconnected through wireless technology to the internet and the cloud to permit remote monitoring and control of the device, to connected automobiles that offer a new level of safety and comfort to vehicle operators, will drive growth in the demand for semiconductors and create significant opportunities for our products. This new trend will supplement existing demand driven by applications in data processing, wireless communications, broadband infrastructure, personal computers, handheld electronic devices and other consumer electronics.
The manufacture of semiconductors is a highly complex process that consists of numerous and repeated process operations. The process starts with the delivery of raw silicon wafers from wafer manufacturers to semiconductor manufacturers and requires hundreds of highly complex and sensitive manufacturing steps, during which a variety of materials are repeatedly applied to the silicon wafer to build the integrated circuits on the wafer surface. We offer a broad range of products to purify, transport and monitor these critical process materials during the manufacturing process. We provide advanced chemical materials used in many
1
of these process steps and offer a broad range of products to purify, transport and monitor these critical process materials during the manufacturing process. The process operations that rely most heavily on our products and chemical materials are described below.
Deposition.
Deposition refers to placing layers of insulating or conductive materials on a wafer surface in thin films that make up the circuit elements of semiconductor devices. The two main deposition processes are physical vapor deposition, where a thin film is deposited on a wafer surface in a low-pressure gas environment, and chemical vapor deposition, where a thin film is deposited on a wafer surface using a gas medium and a chemical bonding process. In addition, electro-plating technology is used for the deposition of low resistance conductive materials such as copper. The control of uniformity and thickness of these films through our advanced precursor materials and electro-plating chemicals used during the process as well as our filtration and purification products, which remove defects and contaminants from materials are critical to the performance of the semiconductor circuit and, consequently, the manufacturing yield.
Chemical Mechanical Planarization (CMP).
The CMP process flattens, or planarizes, the topography of the surface of the wafer after deposition by use of mechanical force, CMP polishing pads and slurries containing abrasive particles in a chemical mixture. The purpose of CMP is to permit the patterning of small features on the resulting smooth surface by the photolithography process. We offer a broad range of products used by semiconductor manufacturers during and immediately following the CMP process. Our PlanarClean® and ESC-784 formulated chemical materials remove defects from wafer surfaces after the CMP process, and passivate the surface to prevent subsequent corrosion. Our filtration and purification systems are used to filter the liquid slurries and cleans chemistries to remove oversized particles and contaminants that can cause defects on a wafer’s surface, while not affecting the functionality of the solutions. Our Planarcore® polyvinyl alcohol (PVA) roller brushes are used in conjunction with our cleans chemistries to clean the wafer after completion of the CMP process to prepare the wafer for subsequent operations and our Planargem® pad conditioners are used to prepare the surface of the CMP polishing pad prior to every polishing cycle.
Photolithography.
Photolithography is the process step that defines the patterns of the circuits to be built on the chip. Before photolithography, a wafer is pre-coated with photoresist, a light-sensitive film composed of ultra-high purity chemicals in liquid form. The photoresist is exposed to specific forms of radiation, such as ultraviolet light, electrons or x-rays, to form patterns that eventually become the circuitry on the chip. This process is repeated many times, using different patterns and interconnects between layers to form the complex, multi-layer circuitry in a semiconductor chip. As device geometries decrease and wafer sizes increase, it is even more critical that these photoresists are dispensed onto the wafer with accurate thickness and uniformity, as well as with extremely low levels of contamination, so that manufacturers can achieve acceptable yields in the manufacturing process. Our liquid filtration and liquid dispense systems play a critical role in assuring the pure, accurate and uniform dispense of photoresists onto the wafer. In addition, ST and AP photoresist strip cleaning materials are proprietary chemistries used for negative resist removal, and our gas microcontamination control systems eliminate airborne amine contaminants that can disrupt effective photolithography processes.
Etch and Resist Strip.
Etch is the process of selectively removing precise areas of thin films that have been deposited on the surface of a wafer. It is used in conjunction with photolithography to define the multi-layer circuitry on a semiconductor chip. The photolithography process defines the patterns that make up the circuitry. During etch, specific areas of the film not covered by photoresist are removed to leave a desired circuit pattern. After the etch process, the hardened resist needs to be completely removed. Advanced etch and resist strip applications require our ST-250™ and TitanKlean® formulated solutions to remove photo resists and post-etch residues, and our gas filters and purifiers to help assure the purity of the process gas streams used in the etch process. As more and more materials are introduced at very advanced technology nodes, there is an increased need for wet chemistries that are capable of removing one material without removing anything else. This is driving demand for selective wet etch formulations.
Ion Implant.
Ion implantation provides a means for introducing impurities into the silicon crystal, typically into selected areas defined by the photolithographic process. This selective implanting of ions into defined areas creates electrically conductive areas that form the transistors of the integrated circuits. Ion implanters have the ability to implant selected elements into the silicon wafers at precise locations and depths by bombarding the silicon surface with a precisely controlled beam of electrically charged ions of specific atomic mass and energy. These ions are embedded into the silicon crystal structure, changing the electrical properties of the silicon. The precision of ion implantation techniques permits customers to achieve the necessary control of this doping process to construct up to 500 billion transistors of uniform characteristics on a 300mm wafer. Since these transistors are the starting point of all subsequent process steps, repeatability, uniformity and yield are extremely important. Our SDS® and VAC® gas delivery systems assure the safe, effective and efficient delivery of the toxic gases necessary for the implant process. In addition, our proprietary low temperature plasma coating process for core components are critical elements of ion implantation equipment.
2
Wet Cleaning.
Ultra-high purity chemicals and photoresists of precise composition are used to clean the wafers, to pattern circuit images and to remove photoresists after etch. Before processes such as photoresist coating, thin film deposition, ion implantation, diffusion and oxidation, and after processes such as ion implantation and etch, the photoresists must be stripped off, and the wafer cleaned in multiple steps using chemical processes. To maintain manufacturing yields and avoid defective products, the cleaning chemicals must be maintained at very high purity levels without the presence of foreign material such as particles, ions or organic contaminants. As described above, our proprietary formulated cleaning chemistries are used in these wet cleaning processes and our liquid filters and purifiers are used to assure the purity of these chemicals.
Our wafer and reticle carriers are high-purity “micro-environments” which carry wafers between each of the above process steps, protecting them from damage and contamination during these transport operations. Our fluid handling components assure the delivery of pure liquid chemicals to each of these process steps. Front-end wafer processing can involve hundreds of steps and take several weeks. As a result, a batch of 25 fully processed wafers, the standard number of wafers that can be transported in one of our 200 mm and 300 mm products, can be worth several million dollars. Since significant value is added to the wafer during each successive manufacturing step, it is essential that the wafer be well protected to minimize the risk of any damage. Thus, in the case of wafer carriers, precise wafer positioning, highly reliable and predictable cassette interface dimensions and advanced materials are crucial. The failure to prevent damage to wafers can severely impact integrated circuit performance, render an integrated circuit inoperable or disrupt manufacturing operations. Our products enable semiconductor manufacturers to: minimize contamination (semiconductor processing is now so sensitive that ionic contamination in certain processing chemicals is measured in parts per trillion); protect semiconductor devices from electrostatic discharge and shock; avoid process interruptions; prevent damage or abrasion to wafers and materials during automated processing caused by contact with other materials or equipment; prevent damage due to abrasion or vibration of work-in-process and finished goods during transportation to and from customer and supplier facilities; and eliminate the dangers associated with handling toxic chemicals.
Future Trends
. Semiconductor manufacturing has become increasingly complex in recent years as new materials and new process technologies have been introduced to enhance device performance and achieve productivity gains. We expect this trend to accelerate in future years. This increasing complexity of semiconductor devices has substantially increased the cost of semiconductor plant infrastructure and equipment and has made achieving target yields more difficult for semiconductor manufacturers adopting advanced processes. Fabrication of wafers at the advanced technology nodes requires larger diameter wafers and finer line widths that are more costly and more complex to manufacture than smaller wafer sizes and larger line widths. In addition, these advanced processes create new contamination and material compatibility risks, rendering larger wafers more vulnerable to damage or contamination. All of these difficulties increase the need and demand for our advanced materials and contamination control products. In response to the challenges faced by our semiconductor customers, we have been moving aggressively to collaborate with semiconductor equipment companies and device manufacturers to synthesize new materials, to develop enhanced methods of filtration and purification and to introduce advanced materials packaging and materials monitoring capabilities to address the challenges of the advanced technology nodes. These collaborations often include the outsourcing of the design and manufacture of innovative materials management and liquid delivery, measurement, control and purification systems to Entegris. Also our semiconductor customers have become increasingly focused on materials management solutions that enable them to safely store, handle, process and transport critical materials throughout the manufacturing process to minimize the potential for damage or degradation to their materials and to protect their investment in processed wafers. We believe that these trends provide opportunities for our advanced chemical, materials management and polymer engineering expertise and our advanced tool design capabilities to enable us to provide our semiconductor customers with innovative materials, materials management, purification, wafer transport, and process solutions enabling them to successfully manage this growing complexity.
Many of the processes used to manufacture semiconductors are also used to manufacture photovoltaic cells, LEDs, flat panel displays and magnetic storage devices resulting in the need for similar filtration, purification, control and measurement capabilities. We seek to leverage our products, technologies and expertise in serving semiconductor applications to address these important market opportunities.
OUR BUSINESS STRATEGY
Our objective is to be a leading global provider of advanced materials and solutions used in processing and manufacturing in high-technology industries. We intend to benefit from our market leading position and strengthen our core business in the semiconductor industry. We will also build upon our position as a worldwide developer, manufacturer and supplier of advanced specialty materials, filtration and purification solutions, delivery systems, and materials packaging solutions used by semiconductor device manufacturers to grow our business in other high value-added manufacturing process markets. Our strategy includes the following key elements:
Technology Leadership.
With the emergence of smaller and more powerful semiconductor devices, and the deployment of new materials and processes to produce them, we believe there is a need for greater materials management within the semiconductor
3
fabrication process. We seek to extend our technology by developing advanced products that address more stringent requirements for greater purification, protection and transport of high value-added materials and for contamination control, fluid delivery and monitoring, and system integration. We also support our customers’ operations by developing advanced chemical materials for use in their critical fabrication processes. We continuously improve our products as our customers’ needs evolve. For example, we have introduced sub-10 nanometer filtration products, advanced deposition materials for next generation transistor and interconnect technologies, advanced reticle pods for extreme ultra violet or EUV photolithography applications, advanced 300mm wafer carriers and advanced e-chucks for implant equipment to meet the rigorous demands of the advanced technology nodes faced by our customers.
Global Presence.
We have established a global infrastructure of design, manufacturing, distribution, service and technical support facilities to meet the needs of our customers. As semiconductor and other electronic device manufacturers have become increasingly global, they have required that suppliers offer comprehensive local repair, customer and technical support services. In response to this trend, we have, for example, expanded our operations in Taiwan and South Korea to provide manufacturing capabilities to support our important customers in these regions, we have established sales and service offices in China in anticipation of a growing semiconductor manufacturing base in that country and we have transferred customer support and logistics activities to local regions, including our expanded presence in Singapore, to enhance our global and regional management of supply chain and manufacturing processes, and we maintain advanced technology centers in Taiwan and South Korea. We maintain our customer relationships through a combination of direct sales and support personnel and selected independent sales representatives and distributors in Asia, Europe and the Middle East.
Operational Excellence
. We have also established leading edge manufacturing plants located in the United States, Malaysia, Japan, South Korea and Taiwan that possess the advanced manufacturing capabilities described under
Manufacturing
below. We have consolidated management of these plants under a single global operations organization with a charter to drive these plants to achieve world class manufacturing and quality standards. Our strategy is to develop our advanced manufacturing capabilities into a competitive advantage with our customers through implementation of the following priorities:
|
•
|
use of manufacturing equipment and facilities incorporating leading edge technology including advanced clean-room and cleaning procedures;
|
|
•
|
implementation of standardized manufacturing systems stressing optimization of overall equipment operational effectiveness, predictive maintenance, and direct labor productivity;
|
|
•
|
implementation of automated quality systems that provide both process monitoring and process control throughout the manufacturing process as well as predictive quality data allowing us to predict and remediate potential quality excursions before they occur;
|
|
•
|
excellence of supply chain management systems that assure a supply of high quality raw materials that is reliable and responsive to the changing requirements for our products;
|
|
•
|
conduct of manufacturing operations so as to assure the safety of our employees and of the individuals using our products; and
|
|
•
|
a streamlined manufacturing organization well-aligned internally as well as with our customers that is capable of rapid design and development of prototypes of new and derivative products; rapid response to customer feedback concerning prototypes and ability to quickly commercialize and ramp production of prototypes accepted by our customers.
|
Strong Customer Base.
We have established solid ongoing relationships with many of the world's leading semiconductor manufacturers, original equipment manufacturers (OEMs), and semiconductor materials suppliers. We intend to continue to leverage these relationships to participate in significant collaborations with our customers at the product design stage, which will facilitate our ability to introduce new products and applications that meet our customers’ needs. For example, we work with our key customers at the pre-design and design stages to identify and respond to their requests for current and future generations of products for emerging applications requiring cleaner materials as well as systems that maintain the integrity and stability of materials during transport through the manufacturing process. To respond to these opportunities we have developed advanced filtration and purification solutions as well a new packaging solutions based on process challenges identified by our customers. We believe that our large customer base will continue to be an important source of new product development opportunities that we intend to emphasize.
Comprehensive and Diverse Product Offerings.
The semiconductor manufacturing industry is characterized by rapid technological changes and intense competition, especially at the current time when the imperative of increased productivity is driving the move to the advanced technology nodes with the technological challenges inherent in these advances. We believe that semiconductor manufacturers are seeking suppliers who can provide a broad range of reliable, flexible and cost-effective products and materials, as well as the technological and application design expertise necessary to deliver other effective solutions. Our comprehensive offering of materials and components enables us to meet a broad range of customer needs and provide a single source of flexible product offerings for semiconductor device and capital equipment manufacturers as they seek to consolidate their supplier
4
relationships to a smaller select group with comprehensive capabilities. We believe our offering of consumable products and materials, creates a competitive advantage because we offer a comprehensive array of solutions to these challenges at the advanced technology nodes.
Adjacent Markets.
We leverage our accumulated expertise in the semiconductor industry by developing products for applications that employ similar production processes that utilize materials integrity management, high-purity fluids and integrated dispense system technologies. Outside of the semiconductor industry, our products are used in other manufacturing processes, including the manufacturing of flat panel displays, fuel cell components, high-purity chemicals, solar cells, optical magnetic storage devices and products for life sciences. We plan to continue to identify and develop products that address materials management and advanced materials processing applications where fluid management plays a critical role. We believe that by utilizing our technology to provide manufacturing solutions across multiple industries, we are able to increase the total available market for our products and reduce, to an extent, our exposure to the cyclicality of any particular market.
Strategic Acquisitions, Partnerships and Related Transactions
. We will continue to pursue strategic acquisitions and business partnerships that enable us to address gaps in our product offerings, secure new customers, diversify into complementary product markets and broaden our technological capabilities and product offerings. Our acquisition of ATMI, Inc. in April 2014 and of Jetalon Solutions, Inc. in April 2013 are examples of this strategy. ATMI brings a whole new portfolio of technologies and materials products to serve our semiconductor customers while Jetalon Solutions reinforces our presence in the semiconductor industry by providing new and complementary sensing and control technologies. Further, as the dynamics of the markets that we serve shift, we will reevaluate the ability of our existing businesses to provide value-added solutions to those markets in a manner that contributes to achieving our objectives; in the event that we conclude that a business is not able to do this, we expect to restructure or replace that business. The sale of our cleaning equipment business in 2008 is an example of this strategy. Finally, we are continuously evaluating opportunities for strategic alliances and joint development efforts with key customers and other industry leaders.
OUR SEGMENTS
We design, manufacture and market our products through two business segments: (i) our critical materials handling segment, which offers a wide range of products that purify, monitor and deliver critical liquids and gases to the semiconductor manufacturing process and similar manufacturing processes as well as microenvironments products to preserve the integrity of wafers, reticles and electronic components at various stages of transport, processing and storage and materials, components and services to a wide range of customers in the semiconductor industry and in adjacent and unrelated industries; and (ii) our electronic materials segment which offers a wide range of materials and materials delivery systems to support the advanced semiconductor manufacturing processes. Each segment has dedicated manufacturing resources managed by our global operations organization, and is composed of product-focused business units. Each business segment has its own dedicated marketing and engineering, research and development resources. The following is a detailed description of our two segments:
CRITICAL MATERIALS HANDLING SEGMENT
Liquid Microcontamination Control Products
. Liquid processing occurs during multiple manufacturing steps including photolithography, deposition, planarization and surface etching and cleaning. The fluids that are used include various mixtures of acids, bases, solvents, slurries and photochemicals, which in turn are used over a broad range of operating conditions. The design and performance of our liquid filtration and purification products are critical to the semiconductor manufacturing process because they directly reduce defects and improve the manufacturing yield. Specially designed proprietary filters remove nanometer-sized particles and bubbles from the different fluid streams that are used in the manufacturing process. Some of our filters are constructed with ultra-high molecular weight polyethylene flat sheet membranes that offer improved bubble clearance and gel removal to prevent defects in the wafers that occur if these elements are not removed. Our low hold-up volume disposable filters, with flat sheet membranes, use our Connectology
®
technology to allow filter changes in less than a minute, significantly faster than conventional filters, to reduce the amount of expensive chemicals lost each time a filter is changed and to minimize operator exposure to hazardous solvents and vapors during change out. In addition to the filtration of particles from fluids, we have also expanded our offerings for chemical purification, which targets the removal of specific molecules from a process chemical, to improve yield in processes such as wet cleaning.
Microenvironments Products
. Our microenvironment products fall into three sub-categories, wafer and reticle handling products, wafer shipping products and data storage products. We are a global producer of wafer and reticle handling products. We offer a wide variety of products that hold and position wafers as they travel between each piece of equipment used in the automated semiconductor manufacturing process. These specialized carriers provide precise wafer positioning, wafer protection and highly reliable and predictable cassette interfaces in automated fabs. Semiconductor manufacturers rely on our products to improve yields by protecting wafers from abrasion, degradation and contamination during the manufacturing process. We provide standard and
5
customized products that meet a spectrum of industry standards and customers’ wafer handling needs including front opening unified pods or FOUPs, wafer transport and process carriers, standard mechanical interface or SMIF pods and work-in-process boxes. To meet our customers’ varying wafer processing and transport needs, we offer wafer process carriers in a variety of materials, including advanced polymeric materials, and in sizes ranging from 100 mm through 300 mm. In addition, we offer FOUPs for developmental 450 mm wafers. We also provide mask and reticle handling products, including reticle SMIF pods for the protection of extremely valuable and contamination-sensitive lithography reticles. We are also a global provider of critical shipping products that preserve the integrity of raw silicon wafers as they are transported from wafer manufacturers to semiconductor manufacturers or finished wafers shipped to back end processors. We lead the market with our extensive, high-volume line of Ultrapak
®
and Crystalpak
®
products which are supplied to wafer manufacturers in a full range of sizes covering 100, 125, 150 and 200 mm wafers. We also offer a full-pitch, front-opening shipping box, or FOSB, for the transportation and automated interface of 300 mm wafers. For developmental 450 mm wafers, we offer a Single Wafer Shipper, a Multi-Application Carrier, or MAC, and a FOUP.
For the data storage market we offer products and solutions for magnetic disks and the read/write heads used to read and write today’s higher density disks.
Finally, we offer chip and matrix trays as well as carriers for bare die handling and integrated circuits that are compatible with industry standards, are available in a wide range of sizes with various feature sets and that offer dimensional stability and permanent electrostatic discharge protection.
Fluid Management Solutions Products
. We offer chemical management and distribution systems that assure the consistent, clean and safe delivery of sophisticated chemicals to the point-of-use in the semiconductor fab. Most of these products are made from perfluoroalkoxy or PFA, a fluoropolymer resin widely used in the semiconductor industry because of its high purity and inertness to chemicals. The innovative design and reliable performance of our products under the most stringent of process conditions has made us a leader in high-purity fluid transfer products. Both semiconductor manufacturers and semiconductor OEMs use our chemical management and distribution products. Our comprehensive product line provides our customers with a single-source provider for their process chemical management needs throughout the manufacturing process. Our chemical management and distribution products include valves, fittings, tubing, pipe, custom fabricated products and associated connection systems for high-purity chemical applications.
Our proprietary photochemical filtration and dispense systems integrate our patented two-stage, filter device and valve control technologies. Our two-stage technology permits the filtering and dispense functions to operate independently so that filtering and dispensing of photochemicals can occur at different rates, reducing the differential pressure across the filter, conserving expensive photochemicals and resulting in reduced defects in wafers. As described above, we offer a line of proprietary filters specifically designed to efficiently connect with these systems. Our patented digital valve control technology improves chemical uniformity on wafers and improves ease of optimized system operation. In addition, our integrated high-precision liquid dispense systems enable uniform application of photoresists for the spin-coating process, where uniformity is measured in units of Angstroms, a tiny fraction of the thickness of a human hair.
We offer a wide variety of measurement and control products for high-purity and corrosive applications. For electronic measurement and control of liquids, we provide a complete line of pressure and flow measurement and control products as well as all-plastic capacitance sensors for leak detection, valve position, chemical level and other measurements. We also offer mechanical gauge pressure measurement products. The acquisition of Jetalon Solutions added metrology and sensor products that use refractive index technology to achieve greater precision in real-time chemical blending, which is increasingly critical in applications where minute variations of process fluid concentration levels can adversely impact manufacturing yields. In semiconductor manufacturing, Jetalon Solutions products monitor and control liquid concentrations in all wet processing areas including wafer surface preparation and cleaning, photolithography, CMP, post-CMP cleaning, and copper electroplating. In the biopharmaceutical market, these solutions are used in both upstream and downstream processing in applications such as real-time in-line concentration monitoring of media and buffer preparations. This is an area of increasing interest for biopharmaceutical applications given the growing trend from batch manufacturing to real-time or continuous manufacturing processes.
Semiconductor process chemicals spend most of their time in contact with fluid storage containers, so it is critical for these containers to resist degradation by these process chemicals and avoid contributing contaminants to the chemicals. We offer rigid wall HPDE blow molded drums and rotationally molded composite containers and associated connection systems for semiconductor process chemicals in sizes ranging from 20 to 2,000 liters. We also offer container liners and container assemblies, such as NOWPak
®
and BrightPak™, in sizes ranging from 1 to 200 liters, for high-purity liquid materials packaging and dispensing systems for advanced photolithography applications as well as for flat-panel display and liquid containment and delivery systems.
Specialty Materials Products
. These products are made from specialized graphite or silicon carbide. Our Poco Graphite products sold to the semiconductor industry are used for critical components for semiconductor manufacturing equipment at various stages of the semiconductor manufacturing process including chemical vapor deposition or CVD, where our expendable graphite chamber
6
liners and shower heads are critical components used in the CVD chamber; dry or plasma etch, where our consumable graphite components deliver, baffle and confine the process gases during the etch process; and ion implant, where our consumable graphite components are critical elements of ion implantation equipment. In addition, our POCO
®
premium graphite is used to make precision consumable electrodes for electrical discharge machining, a non-contact precision thermoelectric machining process for hard and exotic metals and other materials. Poco Graphite also manufactures a number of graphite hot glass contact materials for use in the manufacture of glass containers. Finally, Poco Graphite manufactures a number of graphite consumable products for various industrial applications including bushings and thrust washers for aerospace applications, substrates for industrial print heads, components for scan heads in industrial optical applications, cathodes for fuel cells and materials for manufacturers of artificial heart valves for human implantation.
We also offer a variety of high-performance specialty coatings for critical components used in semiconductor and other high-technology manufacturing operations. These components, often in highly complex geometries, are coated by means of a proprietary low-temperature, plasma-assisted CVD process to provide corrosion and abrasion resistance and desired conductivity and hydrophobicity properties. We also provide complex assemblies such as electrostatic chucks for ion implant equipment, where our coatings prevent contamination of the process. Our coatings are also used in other high-technology applications such as aerospace optical components.
ELECTRONIC MATERIALS SEGMENT
Specialty Gas Solutions Products
.
Among the primary issues for semiconductor manufacturers are production throughput, cost, and safety because of the hazardous properties of the gases used in the ion implant processes. Our patented Safe Delivery Source
®
(SDS
®
) solutions use a standard gas cylinder containing a carbon-based adsorbent material. The cylinder is filled with gas under conditions such that the gas is adsorbed onto the adsorbent material at sub-atmospheric pressure. Sub-atmospheric storage of hazardous gases minimizes potential leaks of gas during transportation and use, thus providing significant safety and environmental improvements over traditional high-pressure and mechanical cylinders. In addition, SDS products allow more process gas to be stored in the cylinder, providing significantly higher rates of productivity than traditional methods of gas delivery used in ion implantation manufacturing processes. These advantages have led the majority of significant semiconductor manufacturers to adopt this technology as the industry standard for dopant gas delivery. Materials packaged in SDS systems include primarily arsine, phosphine, germanium and boron trifluoride. The third generation of SDS products, called SDS
®
3, maintains all the inherent safety features of previous generation SDS products, but dramatically increases the gas storage capacity by using a new adsorbent. The two to three times capacity improvement over the previous SDS products allows ion implanter users to reduce tool down time, resulting in significant cost savings for our customers. We also offer VAC
®
(Vacuum Actuated Cylinders), a complementary technology to SDS where select implant gases are stored under high pressure but delivered sub-atmospherically.
Our Wafergard
®
particle and molecular filtration products filter the gas entering the process chamber in order to eliminate system and wafer problems due to particulate, atmospheric and chemical contaminants. These filters are able to retain all particles 0.003 microns and larger. Our metal filters, such as stainless steel and nickel filters, reduce out gassing and improve corrosion resistance. Our GateKeeper
®
purifiers chemically react with and absorb contaminants, such as oxygen and water, to prevent contamination, and our Chambergard™ vent diffusers reduce particle contamination and processing cycle times. We offer a wide variety of gas purification products to meet the stringent requirements of semiconductor processing. Our GateKeeper
®
Gas Purification Systems contain dual-resin beds, providing a continuous supply of purified gas without process interruption. These gas purification systems are capable of handling higher flow rates and longer duty cycles than cartridge purifiers. Our product line also includes filter housings and Vaporsorb™ hybrid media chemical air filters which purify air entering tool enclosures and remove airborne molecular contaminants.
Advanced Deposition Materials Products
.
Several processes for depositing thin films such as CVD and atomic layer deposition (ALD) processes are enabled by advanced liquid, gaseous and solid precursors. We believe that we are well-positioned for the incorporation of ALD processes by the semiconductor industry with our ProE-Vap
®
ampoule. This proprietary container allows for reliable delivery of low volatility solid precursors required for processes that demand ALD, like high-k gates. We have also successfully adapted the carbon adsorption technology used in SDS and incorporated it into products for semiconductor deposition processes marketed under the SAGE
®
brand. These applications include: low-k plasma-enhanced deposition, or PE-CVD, processes using low-k materials, pre-metal dielectric high-density plasma, or HDP-CVD, and films using phosphine gases and thermal deposition processes using germane gases. Given the increasing need for new materials used in leading edge semiconductor processes, we are also developing a portfolio of new deposition products to meet the future needs of our customers.
Surface Preparation and Integration Products
.
We believe that we are a market leader in copper electroplating materials and processes in semiconductor development and manufacturing with our Viaform
®
(a trademark of Enthone Inc.) product, which includes inorganic and proprietary organic molecules that provide the wiring for copper interconnects allowing manufacturers to eliminate processing steps. We also focus on the total copper integration scheme with post-chemical mechanical planarization
7
(CMP) cleaning solutions. Our ST and AP photoresist strip and post-CMP cleaning materials are proprietary chemistries used for applications such as semiconductor post-etch residue removal, wafer etching, organics removal, negative resist removal, edge bead removal, and corrosion prevention. In addition to filters for the purification of CMP liquid chemical slurries, we offer a line of consumable PVA roller brush products to clean the wafer following the CMP process. Our unique Planarcore™
®
PVA brush is molded on the core to allow easy installation that reduces tool downtime and a dimensionally stable product that provides consistent wafer-to-wafer cleaning performance. In addition, our Planargem
®
pad conditioners, based on our silicon carbide capabilities, offer unique preparation solutions for each distinct CMP pad application, with significant improvement in CMP pad life.
Other Entegris products
.
We also offer our eVOLV™ wet chemical process to recycle electronic waste and recover precious metals and other high value materials from components and printed circuit boards and our BrightBlack
®
precision engineered carbon materials with high purity, high capacity, small tunable pores and excellent mechanical durability for gas capture, storage and release.
WORLDWIDE APPLICATIONS DEVELOPMENT AND FIELD SUPPORT CAPABILITIES
We provide strong technical support to our customers through local service groups and engineers consisting of field applications engineers, technical service groups, applications development groups and training capabilities. Our field applications engineers, located in the United States and approximately ten other countries, work directly with our customers on product qualification and process improvements in their facilities. In addition, in response to customer needs for local technical service and fast turnaround time, we maintain regional applications laboratories and technology centers. Our applications laboratories maintain process equipment that simulate customers’ applications and industry test standards and provide product evaluation and technical support for our customers; our regional technology centers collaborate with our customers to develop materials to meet their most advanced semiconductor manufacturing challenges.
OUR CUSTOMERS AND MARKETS
Within the semiconductor market, our major customer groups include semiconductor device manufacturers, OEMs that provide equipment to semiconductor device manufacturers, gas and chemical manufacturing companies and manufacturers of high-precision electronics.
Our most significant customers based on sales in
2015
include virtually all of the leading semiconductor device makers and equipment makers and leading wafer grower companies. We also sell our products to flat panel display OEMs, materials suppliers and manufacturers. The major manufacturers for flat panel displays and flat panel display equipment are concentrated in Japan, Korea and other parts of Asia.
In our other high-technology markets, our customers include manufacturers and suppliers in the solar and life science industries and, for our Poco Graphite products, electrical discharge machining customers, glass container manufacturers, aerospace manufacturers and manufacturers of biomedical implantation devices.
In
2015
,
2014
and
2013
, net sales to our top ten customers accounted for approximately
44%
,
42%
and
34%
, respectively, of combined net sales. In
2015
and
2014
, one individual customer accounted for approximately
12%
and
14%
of our net sales, respectively. In 2013, no single customer accounted for ten percent or more of net sales. International net sales represented
77%
,
75%
and
71%
, respectively, of net sales in
2015
,
2014
and
2013
. Approximately
2,400
customers purchased products from us during
2015
.
We may enter into supply agreements with our customers to govern the conduct of our business with our customers, including the manufacture of our products. These agreements generally have a term of one to three years, but do not contain any long-term purchase commitments. Instead, we work closely with our customers to develop non-binding forecasts of the future volume of orders. However, customers may cancel their orders, change production quantities from forecasted volumes or delay production for a number of reasons beyond our control.
SALES AND MARKETING
We sell our products worldwide, primarily through our direct sales force and strategic independent distributors located in offices in all major semiconductor markets, as well as through independent distributors elsewhere. As of December 31,
2015
, our sales and marketing force consisted of 526 employees worldwide. Our direct sales force is also supplemented by independent distributors, sales representatives and agents, which are directed to specific market segments.
8
Our unique capabilities and long-standing industry relationships have provided us with the opportunity for significant collaboration with our customers at the product design stage, which has facilitated our ability to introduce new materials and new solutions that meet our customers’ needs. We are constantly identifying for our customers the variety of materials, purification and process control challenges that may be addressed by our products. Our sales representatives provide our customers with worldwide support and information about our products and materials.
We believe that our technical support services are important to our marketing efforts. These services include assisting in defining a customer’s needs, evaluating alternative products and materials, designing a specific system to perform the desired separation or operation, training users and assisting customers in compliance with relevant government regulations. In addition, we maintain a network of service centers and technology centers located in all key markets internationally and in the United States to support our products and our customers with their advanced development needs.
COMPETITION
The market for our products is highly competitive. While price is an important factor, we compete primarily on the basis of the following factors:
|
historical customer relationships;
|
breadth of product line;
|
|
technical expertise;
|
breadth of geographic presence;
|
|
product quality and performance;
|
advanced manufacturing capabilities; and
|
|
total cost of ownership;
|
after-sales service.
|
|
customer service and support;
|
|
We believe that we compete favorably with respect to all of the factors listed above, but we cannot assure you that we will continue to do so. We believe that our key competitive strengths include our broad product line, our strong research and development infrastructure and investment, our manufacturing excellence, our advanced quality control systems, the low total cost of ownership of our products, our ability to provide our customers with quick order fulfillment and our technical applications expertise. However, our competitive position varies depending on the market segment and specific product areas within these segments. While we have longstanding relationships with a number of semiconductor and other electronic device manufacturers, we also face significant competition from companies that also have longstanding relationships with other semiconductor and electronic device manufacturers and, as a result, have been able to have their products specified by those customers for use in manufacturers’ fabrication facilities. In the markets for our consumable products, we believe that our differentiated membrane and materials management technologies, our materials and materials delivery systems, our strong supply chain capabilities that allow us to provide our customers with quick order fulfillment, and our technical expertise, which enables us to develop membranes to meet specific customer needs and assist our customers in improving the functionality of our membranes for particular applications, allow us to compete favorably. In these markets our competitors compete against us on the basis of price, as well as alternative membrane technology having different functionality, manufacturing capabilities and breadth of geographic presence.
The market for our products is highly fragmented, and we compete with a number of different companies. Our liquid filtration and other contamination control products compete with product offerings from a wide range of companies including both large companies, such as Pall Corporation, which was acquired by Danaher Corporation in 2015, as well as small Asian filter manufacturers. Our microenvironment product lines face competition largely on a product-by-product basis. We face competition from mid-size Japanese companies such as Miraial Co. Ltd. and Shin-Etsu Polymer Co., Ltd. and from small regional suppliers such as Gudeng Precision Industrial Co., Ltd. and e.PAK Resources Pte. Ltd. These companies compete with us primarily in 200 mm and below, and 300 mm applications. Our fluid management solutions products also face worldwide competition from companies such as Gemu Valves, Inc., Integrated Automation, Inc. (CKD) and Tokyo Keiso Co., Ltd. Our materials packaging products primarily compete with glass and plastic bottle manufacturers. Our Poco Graphite products compete with products manufactured by companies such as Mersen (France), Tokai Carbon Co., Ltd. (Japan) and Toyo Tanso Co., Ltd. (Japan). There are numerous domestic and foreign companies that offer products that compete with our Electronic Materials products including Air Products and Chemicals (Electronics Division), DuPont Electronic Technologies, Dow Chemical Company (including Rohm and Haas), BASF and Air Liquide as well as several smaller companies that specialize in niche markets. Our SDS adsorbent based sub-atmospheric gas delivery systems face competition from Praxair, Inc. as well as from a number of companies that compete with high-pressure gas cylinders and solid sources. Our gas filtration products compete with companies such as SAES Pure Gas, Inc., Donaldson Company, Inc. and Mott Corporation. Some of our competitors are larger and have greater resources than we do. In some cases, our competitors are smaller than us, but well-established in specific product niches. We believe that none of our competitors competes with us across all of our product offerings and that, within the markets that we serve, we offer a broader line of products, make use of a wider range of process control technologies and address a broader range of applications than any single competitor.
9
ENGINEERING, RESEARCH AND DEVELOPMENT
Our aggregate engineering, research and development expenses in
2015
,
2014
and
2013
were
$105.9 million
,
$87.7 million
and
$55.3 million
, respectively. As of December 31,
2015
, we had 454 employees in engineering, research and development. In addition, we have followed a practice of supplementing our internal research and development efforts by licensing technology from unaffiliated third parties and/or acquiring distribution rights with respect to products incorporating externally owned technologies when we believe it is in our long-term interests to do so. These R&D expenses consist of personnel and other direct and indirect costs for internally funded project development, including the use of outside service providers. We also participate in joint development efforts with several key semiconductor manufacturers, advanced technology developers, and semiconductor equipment manufacturers.
To meet the global needs of our customers, we have engineering, research and development capabilities in California, Connecticut, Minnesota, Massachusetts, Colorado, Texas, Japan, Korea, Taiwan, France, China and Malaysia. Our engineering, research and development efforts are directed toward developing and improving our technology platforms for semiconductor and advanced processing applications and identifying and developing products for new applications for which fluid management plays a critical role.
We use sophisticated methodologies to research, develop and characterize our materials and products. Our materials technology laboratories are equipped to analyze the physical, rheological, thermal, chemical and compositional nature of the polymers we use. Our materials lab includes standard and advanced polymer analysis equipment such as inductively coupled plasma mass spectrometry (ICP/MS), inductively coupled plasma atomic emission spectrometry (ICP/AES), Fourier transform infrared spectroscopy (FTIR) and automated thermal desorption gas chromatography/mass spectrometry (ATD-GC/MS). This advanced analysis equipment allows us to detect contaminants in materials that could harm the semiconductor manufacturing process to levels as low as parts per billion, and in many cases parts per trillion.
Our capabilities to test and characterize our materials and products are focused on continuously reducing risks and threats to the integrity of the critical materials that our customers use in their manufacturing processes. We expect that technology and product engineering, research and development will continue to represent an important element in our ability to develop and characterize our materials and products.
Key elements of our engineering, research and development expenditures over the past three years have included the development of new product platforms to meet the manufacturing needs for 28 and 20 nanometer and smaller semiconductor devices. Driven by the proliferation of new materials and chemicals in the manufacturing processes and more demanding platforms for contamination control for 300 mm wafers, investments were made for new contamination control products in the area of copper interconnects, deep ultra-violet (DUV) and EUV photolithography, and chemical and gas management technologies for advanced wafer cleans, deposition and etch equipment. We made additional investments in the area of advanced process control, monitoring and diagnostics capabilities for future generations of semiconductor manufacturing processes, including the development of a manufacturing capability for the production of Single Wafer Carriers, Multi Application Carriers and FOUPs for the next generation 450 mm wafers. Our employees also work closely with our customers’ development personnel. These relationships help us identify and define future technical needs on which to focus our engineering, research and development efforts. In addition, we participate in Semiconductor Equipment and Materials International (SEMI
®
), an association of semiconductor equipment suppliers, and leading industry consortia, such as the Interuniversity Microelectronics Centre (imec
®
) and Semiconductor Manufacturing Technology (SEMATECH), including its Global 450 Consortium (G450C). For example, we have participated with SEMI to develop specifications for the next generation wafer shipping and handling products and with a major customer to develop specific wafer handling products for 450 mm wafers. We also support research at academic and other institutions targeted at advances in materials science and semiconductor process development.
We also form strategic alliances, including joint development programs and collaborative marketing efforts, to develop new products and to accelerate the introduction of our products. These programs have led to significant technological advances, including the development of proprietary advanced materials and semiconductor manufacturing processes. We have a strategic alliance with Enthone, Inc. (Enthone), a subsidiary of Alent plc, pursuant to which we hold the exclusive worldwide marketing and distribution rights to Enthone’s copper ECD products, including its ViaForm products. Under the terms of the agreement, Enthone continues to manufacture the ViaForm products for us. We also have smaller alliances and programs in Asia to enhance our core technology base and promote the introduction of new and innovative products.
MANUFACTURING
10
Our customers rely on our products and materials to assure the integrity of the critical materials used in their manufacturing processes by providing dimensional precision and stability, purity, cleanliness and consistent performance. Our ability to meet our customers’ expectations, combined with our substantial investments in worldwide manufacturing capacity, position us to respond to the increasing demands of the semiconductor industry and other industries that require yield enhancing materials and solutions.
To meet our customer needs worldwide, we have established an extensive global manufacturing network with manufacturing and coating facilities in the United States, Japan, Taiwan, France, Malaysia and South Korea. Because we work in an industry where contamination control is paramount, we maintain Class 100 to Class 10,000 clean rooms for manufacturing and assembly. We believe that our worldwide manufacturing operations and our advanced manufacturing capabilities are important competitive advantages. Our advanced manufacturing capabilities include:
|
•
|
Injection Molding.
Our manufacturing expertise is based on our long experience with injection molding. Using molds produced from computer-aided processes, our manufacturing technicians utilize specialized injection molding equipment and operate within specific protocols and procedures established to consistently produce precision products.
|
|
•
|
Extrusion.
Extrusion is accomplished through the use of heat and force from a screw to melt solid polymer pellets in a cylinder and then forcing the resulting melt through a die to produce tubing and pipe. We have established contamination-free on-line laser marking and measurement techniques to properly identify products during the extrusion process and ensure consistency in overall dimension and wall thickness. In addition, we use extrusion technology to extrude a polymer mix into flat sheet and hollow fiber membranes.
|
|
•
|
Blow Molding.
Blow molding consists of the use of heat and force from a screw to melt solid polymer pellets in a cylinder and then forcing the resulting melt through a die to create a hollow tube. The molten tube is clamped in a mold and expanded with pressurized gas until it takes the shape of the mold. We utilize advanced three-layer processing to manufacture premium grade 55 gallon drums, leading to cost savings while simultaneously assuring durability, strength and purity.
|
|
•
|
Rotational Molding.
Rotational molding is accomplished by the placing of a solid polymer powder in a mold, placing the mold in an oven and rotating the mold on two axes so that the melting polymer coats the entire surface of the mold. This forms a part in the shape of the mold upon cooling. We use rotational molding in manufacturing containers up to 5,000 liters.
|
|
•
|
Compression Molding.
In compression molding, thermoset polymers are processed. Today, we use this manufacturing process primarily for manufacturing integrated flow controllers and valves market. We use the same expertise as in injection molding to assure a consistently produced precision product.
|
|
•
|
Membrane Casting.
We cast membrane by extruding a polymer into flat sheet or hollow fiber format that is passed through a chamber with controlled atmospheric conditions to control the development of voids or pores in the membrane. Once cast, the membrane is subjected to solvent extraction and annealing steps. The various properties of the membranes that we offer are developed during subsequent process steps.
|
|
•
|
Cartridge Manufacturing.
We fabricate the membrane we manufacture as well as membranes manufactured by others into finished filtration cartridges in a variety of configurations. The fabrication process involves membrane processing into pleated and other configurations around a central core and enclosing it in a framework of end caps and protective screening for use in fabricated cartridge housings. We also manufacture filter cartridges that are integrated into their own housings and incorporate our patented Connectology
™®
quick connect technology.
|
|
•
|
Specialty Coating Capabilities.
We fabricate high performance electrostatic chucks by using highly engineered materials and advance vacuum coatings. We have proprietary low-temperature, plasma-assisted CVD and physical vapor deposition (PVD) processes that deposit coatings on a variety of vacuum compatible materials, including metals, alloys, ceramics, semiconductors and polymers, with superior density, purity and uniformity.
|
|
•
|
Graphite Synthesis.
We have a differentiated proprietary graphite synthesis process that produces premium graphite with superior strength, uniformity and performance. This synthesis process consists of blending and forming petroleum cokes into “green” billets, baking over an extended period between 800 to 1,100°C, followed by a graphitization process at temperatures between 2,000 to 3,000°C. The graphite produced by this process is sold in bulk, machined into specific components or converted into silicon carbide through controlled exposure to silicon monoxide gas.
|
|
•
|
Machining.
Machining consists of the use of computer-controlled equipment to create shapes, such as valve bodies and other specific components, out of solid polymer blocks or rods, premium graphite and silicon carbide. Our computerized machining capabilities enable speed and repeatability in volume manufacturing of our machined products, particularly products utilized in chemical delivery applications.
|
|
•
|
Assembly.
We have established protocols, flow charts, work instructions and quality assurance procedures to assure proper assembly of component parts. The extensive use of robotics throughout our facilities reduces labor costs, diminishes the possibility of contamination and assures process consistency.
|
|
•
|
Tool Making.
We employ tool development staff in the United States and Malaysia and have tool-making capabilities in Malaysia. Our toolmakers produce the majority of the tools we use throughout the world.
|
11
|
•
|
High-Purity Materials Packaging.
We have established protocols, flow charts, work instructions and quality assurance procedures to assure proper and ultraclean assembly of materials packaging products in reliable, consistent and repeatable processes.
|
|
•
|
Gas Delivery Systems.
We use state of the art, secure gas cabinets with advanced leak monitoring capabilities and have established protocols, flow charts, work instructions and quality and safety assurance procedures to assure the safe, efficient and cost effective filling of gas cylinders.
|
We have made significant investments in systems and equipment to create innovative products and tool designs, including metrology and 3D printing capabilities for rapid analysis and production prototype of products.
In addition we use contract manufacturers for certain of our gas microcontamination control and other electronic materials products both in the U.S. and Asia.
Entegris’ products are made from a wide variety of raw materials that are generally available in quantity from alternate sources of supply. However, certain materials included in the Company’s products, such as certain filtration membranes, polymer resins and petroleum coke used by our Critical Materials Handling segment are obtained from a single source or a limited group of suppliers. Our Electronic Materials segment uses a broad range of specialty and commodity chemicals and polymers in the development of its products, including parts and sub-assemblies that are obtained from outside suppliers. We seek, where possible, to have several sources of supply for all of these materials. Likewise, we may, in some instances, rely on a single or a limited number of suppliers, or upon suppliers in a single country, for some of the materials used by our Electronic Materials segment, however, we have not experienced any sustained interruption in production or the supply of materials to our Electronic Materials segment, and we do not anticipate any significant difficulties in obtaining the materials necessary to manufacture these products. Although the Company seeks to reduce dependence on these sole and limited source suppliers, the partial or complete loss of these sources could interrupt our manufacturing operations and result in an adverse effect on the Company’s results of operations. Furthermore, a significant increase in the price of one or more of these components could also adversely affect the Company’s results of operations.
PATENTS AND OTHER INTELLECTUAL PROPERTY RIGHTS
We rely on a combination of patent, copyright, trademark and trade secret laws and license agreements to establish and protect our proprietary rights. As of December 31,
2015
our combined patent portfolio included 643 current U.S. patents, 1,320 current foreign patents, including counterparts to U.S. filings, 309 pending U.S. patent applications, 73 pending filings under the Patent Cooperation Treaty not yet nationalized and 1,054 pending foreign patent applications. While we believe that patents may be important for aspects of our business, we believe that our success also depends upon close customer contact, innovation, technological expertise, responsiveness and worldwide distribution. Additionally, while our patented technology may delay or deter a competitor in offering a competing product, we do not believe that our patent portfolio functions as a barrier to entry for any of our competitors. In addition, while we license and will continue to license technology used in the manufacture and distribution of products from third parties, we do not consider any particular license to be material to our business. We also license our technology to third parties from time to time and, in particular, as required for our patented technology to be designated as the standard by SEMI or other standard setting organizations within the semiconductor industry.
We require each of our employees, including our executive officers, to enter into standard agreements pursuant to which the employee agrees to keep confidential all of our proprietary information and to assign to us all inventions made while employed by us. We also require all outside scientific collaborators, sponsored researchers, and other advisors and consultants who are provided confidential information to execute confidentiality agreements upon the commencement of the consulting or collaboration relationship in question. These agreements generally provide that all confidential information developed or made known to the entity or individual during the course of the entity’s or individual’s relationship with the Company is to be kept confidential and not disclosed to third parties except in specific limited circumstances.
The patent position of any manufacturer, including us, is subject to uncertainties and may involve complex legal and factual issues. Litigation has in the past and may in the future be necessary to enforce our patents and other intellectual property rights or to defend ourselves against claims of infringement or invalidity. The steps that we have taken in seeking patents and other intellectual property protections may prove inadequate to deter misappropriation of our technology and information. In addition, our competitors may independently develop technologies that are substantially equivalent or superior to our technology.
GOVERNMENTAL REGULATION
Our operations are subject to federal, state and local regulatory requirements relating to environmental, waste management and health and safety matters, including measures relating to the release, use, storage, treatment, transportation, discharge, disposal
12
and remediation of contaminants, hazardous substances and wastes, as well as practices and procedures applicable to the construction and operation of our plants. There can be no assurance that we will not incur material costs and liabilities or that our past or future operations will not result in exposure to injury or claims of injury by employees or the public. Although some risk of costs and liabilities related to these matters is inherent in our business, as with many similar businesses, we believe that our business is operated in substantial compliance with applicable regulations. However, new, modified or more stringent requirements or enforcement policies could be adopted, which could adversely affect us. While we expect that capital expenditures will be necessary to assure that any new manufacturing facility is in compliance with environmental and health and safety laws, we do not expect these expenditures to be material.
EMPLOYEES
As of December 31,
2015
, we had 3,419 full-time employees, as well as approximately 138 temporary and part-time employees. Of our full-time employees, 454 work in engineering, research and development and 526 work in sales and marketing. Given the variability of business cycles in the semiconductor industry and the quick response time required by our customers, it is critical that we be able to quickly adjust the size of our production staff to maximize efficiency. Therefore, we use skilled temporary labor as required.
None of our employees are represented by a labor union or covered by a collective bargaining agreement other than statutorily mandated programs in certain European countries.
INFORMATION ABOUT OUR OPERATING SEGMENTS
Our financial reporting segments are Critical Materials Handling (CMH), and Electronic Materials (EM). See Item 7. Management’s Discussion and Analysis of Financial Condition and Results of Operations - Segment Analysis below for a discussion of revenue and segment profitability with respect to each of these reporting segments, which discussion is incorporated herein by reference. See also note 15 to our consolidated financial statements. Further, in
2015
,
2014
and
2013
approximately
77%
,
75%
and
71%
, respectively, of our net sales were made to customers outside North America. Industry and geographic segment information is also discussed in note 15 to the Entegris, Inc. consolidated financial statements (the “Financial Statements”) included in response to Item 8 below, which note is incorporated herein by reference.
OTHER INFORMATION
Our shareholder rights plan, which was originally adopted by our Board of Directors on July 27, 2005, expired pursuant to its terms on August 8, 2015, along with the preferred share purchase rights issued thereunder.
OUR HISTORY
Effective April 30, 2014, the Company completed the acquisition of ATMI, Inc., a Delaware corporation based in Danbury, CT, for a cash purchase price of $34.00 per ATMI share pursuant to a merger transaction in which ATMI, Inc. became a wholly owned subsidiary of the Company. ATMI, Inc. was incorporated under the laws of Delaware in 1997, and its predecessor company was incorporated under the laws of Delaware in 1987.
Effective August 6, 2005 Entegris, Inc., a Minnesota corporation, and Mykrolis Corporation, a Delaware corporation, completed a strategic merger of equals transaction, pursuant to which they were each merged into the Company to carry on the combined businesses. Entegris Minnesota was incorporated in June 1999 to effect the business combination of Fluoroware, Inc., which began operating in 1966, and EMPAK, Inc., which began operating in 1980.
Mykrolis was organized as a Delaware corporation on October 16, 2000 under the name Millipore MicroElectronics, Inc. in connection with the spin-off by Millipore Corporation of its microelectronics business unit which was completed on February 27, 2002.
EXECUTIVE OFFICERS OF THE REGISTRANT
The following is a list, as of January 31, 2016, of our Executive Officers. All of the Corporate Officers listed below were elected to serve until the first Directors Meeting following the 2016 Annual Stockholders Meeting.
13
|
Name
|
Age
|
Office
|
First Appointed
To Office*
|
|
|
CORPORATE OFFICERS
|
||||
|
Bertrand Loy
|
50
|
|
President & Chief Executive Officer
|
2001
|
|
Gregory B. Graves
|
55
|
|
Executive Vice President, Chief Financial
Officer & Treasurer
|
2002
|
|
Peter W. Walcott
|
69
|
|
Senior Vice President
,
Secretary & General Counsel
|
2001
|
|
John J. Murphy
|
63
|
|
Senior Vice President, Human Resources
|
2005
|
|
Todd Edlund
|
53
|
|
Senior Vice President & Chief Operating Officer
|
2007
|
|
Christian F. Kramer
|
53
|
|
Senior Vice President & Chief Commercial Officer
|
2014
|
|
William Shaner
|
48
|
|
Senior Vice President, Global Operations
|
2007
|
|
Corey Rucci
|
56
|
|
Vice President, Business Development
|
2014
|
|
Gregory Marshall
|
58
|
|
Vice President, Quality and EH&S
|
2011
|
|
Michael D. Sauer
|
50
|
|
Vice President, Controller & Chief Accounting Officer
|
2011
|
* With either the Company or a predecessor company
Bertrand Loy
has served as our Chief Executive Officer, President and a director since November 2012. Prior to his promotion, Mr. Loy served as our Executive Vice President and Chief Operating Officer since 2008. From August 2005 until July 2008, he served as our Executive Vice President and Chief Administrative Officer in charge of our global supply chain and manufacturing operations. He served as the Vice President and Chief Financial Officer of Mykrolis from January 2001 until August 2005. Prior to that, Mr. Loy served as the Chief Information Officer of Millipore Corporation during 1999 and 2000. From 1995 until 1999, he served as the Division Controller and Head of Manufacturing for Millipore’s Laboratory Water Division. From 1989 until 1995, Mr. Loy served Sandoz Pharmaceuticals (now Novartis) in a variety of financial, audit and controller positions located in Europe, Central America and Japan. Mr. Loy served as a director of BTU International, Inc., (supplier of advanced thermal processing equipment) until its acquisition in January 2015. He also serves as a director of Harvard Bioscience, Inc. (scientific equipment) since November 2014 and Semiconductor Equipment and Materials International (“SEMI”) (global high technology manufacturing trade association) since July 2013.
Gregory B. Graves
has served as our Executive Vice President and Chief Financial Officer since July 2008. Prior to that he served as Senior Vice President and Chief Financial Officer since April 2007. Prior to April 2007, he served as Senior Vice President, Strategic Planning & Business Development since the effectiveness of the merger with Mykrolis. Mr. Graves served as the Chief Business Development Officer of Entegris Minnesota since September 2002 and from September 2003 until August 2004 he also served as Senior Vice President of Finance. Prior to joining Entegris Minnesota, Mr. Graves held positions in investment banking and corporate development, including at U.S. Bancorp Piper Jaffray from June 1998 to August 2002 and at Dain Rauscher from October 1996 to May 1998.
Peter W. Walcott
has been our Senior Vice President, Secretary and General Counsel since the effectiveness of the merger with Mykrolis. He served as the Vice President, Secretary and General Counsel of Mykrolis since October 2000. Mr. Walcott served as the Assistant General Counsel of Millipore Corporation from 1981 until March 2001.
John J. Murphy
joined us as our Senior Vice President, Human Resources in October 2005. He served as the Senior Vice President Human Resources of HNTB, an engineering and architectural services firm, from February 2004 until October 2005 and as Corporate Vice President, Human Resources of Cadence Design Systems, Inc. from May 2000 through October 2003. Prior to that Mr. Murphy held senior human resources positions with Williams Companies, L.M. Ericsson Telephone Company and General Electric Company.
Todd Edlund
has been our Senior Vice President and Chief Operating Officer since November 2014. Prior to that he was Senior Vice President and General Manager of our Critical Materials Handling business and prior to the merger with ATMI, he was the Vice President and General Manager of our Contamination Control Solutions Division since December 2007. He served as the Vice President and General Manager of our Liquid Systems Business Unit from 2005 to 2007, and prior to that as Entegris Minnesota’s Vice President of Sales for semiconductor markets from 2003 to 2005. Prior to 2003, Mr. Edlund held a variety of positions with our predecessor companies since 1995.
Christian F. Kramer
has been our Senior Vice President and Chief Commercial Officer since November of 2014; prior to that he served as Senior Vice President and General Manager of our Electronic Materials businesses since the merger with ATMI. Prior to that Mr. Kramer served ATMI as Senior Vice President and General Manager, Microelectronics, since February 2013. Mr. Kramer joined ATMI in 2010 and, through 2012, served as Senior Vice President of ATMI Material Solutions. Prior to joining
14
ATMI, Mr. Kramer was Vice President, Global Strategic Account Management for Tokyo Electron America, a global manufacturer of capital equipment used in the semiconductor industry, from 1998 through 2010. Prior to that, Mr. Kramer held various commercial leadership positions in the semiconductor industry.
William Shaner
has been our Senior Vice President Global Operations since February 2014. Previously he served as our Vice President and General Manager, Microenvironments Division since 2007. He has served in a variety of sales, marketing, business development and engineering roles since joining Entegris in 1995.
Gregory Marshall
has been our Vice President, Quality and EH&S since March of 2010. Prior to that he served as our Global Director of Quality since the merger with Mykrolis Corporation, prior to which he served as the Director of Quality for Mykrolis. Prior to joining Mykrolis, Mr. Marshall served as the Director of US Quality for Kokusai Semiconductor Equipment Corporation
.
Corey Rucci
assumed his current position of Vice President, Business Development in February 2014. Prior to that he served as Vice President and General Manager of our Specialty Materials Division since 2011 and as General Manager of Poco Graphite, Inc. (POCO) since 2008 when we acquired POCO. Prior to joining Entegris, Mr. Rucci served POCO as the President and Chief Operating Officer since 2007, Chief Operating Officer since 2005, Chief Financial Officer since 2001 and Vice President of Business Development since 1998. Prior to that he worked at UNOCAL Corp. for 17 years in a variety of accounting, marketing and business development roles.
Michael D. Sauer
has been our Vice President, Controller and Chief Accounting Officer since June 2012. Prior to that, he served as the Corporate Controller since 2008. From the time of the merger with Mykrolis until April 2008, Mr. Sauer served as Director of Treasury and Risk Management. Mr. Sauer joined Fluoroware, Inc., a predecessor to Entegris Minnesota in 1988 and held a variety of finance and accounting positions until 2001 when he became the Director of Business Development for Entegris Minnesota, the successor to Fluoroware, serving in that position until the merger with Mykrolis.
Table of Contents
Risks Relating to our Business and Industry
The semiconductor industry has historically been highly cyclical, and industry downturns reduce net sales and profits.
Our business depends on the purchasing patterns of semiconductor manufacturers, which, in turn, depend on the current and anticipated demand for semiconductors and products utilizing semiconductors. The semiconductor industry has historically been highly cyclical with periodic significant downturns, which often have resulted in significantly decreased expenditures by semiconductor manufacturers. Even moderate cyclicality can cause our operating results to fluctuate significantly from one period to the next. We have in the past experienced significant revenue deterioration and incurred significant operating losses due to a severe downturn in both the capital and unit-driven segments of the semiconductor industry. We are unable to predict the ultimate duration and severity of future downturns for the semiconductor industry.
Furthermore, in periods of reduced demand, we must continue to maintain a satisfactory level of engineering, research and development expenditures and continue to invest in our infrastructure. At the same time, we have to manage our operations to be able to respond to any significant increases in demand, if they occur. In addition, because we typically do not have significant backlog, changes in order patterns have a more immediate impact on our revenues. We expect the semiconductor industry to continue to be cyclical. During downturns our revenue is reduced, and there is likely to be an increase in pricing pressure and shifts in product and customer mix, all of which may affect gross margin and net income. Such fluctuations in our results could cause our stock price to decline significantly. We believe that period-to-period comparisons of our results of operations may not be meaningful, and you should not rely upon them as indicators of our future performance.
The semiconductor industry is subject to rapid demand shifts, which are difficult to predict. As a result, our inability to meet demand in response to these rapid shifts may cause a reduction in our market share.
Our ability to increase sales of our products, particularly our capital equipment products, depends in part upon our ability to ramp up the use of our manufacturing capacity for such products in a timely manner and to quickly mobilize our supply chain. In order to meet the demands of our customers, we may be required to ramp up our manufacturing capacity in as little as a few months. If we are unable to expand our manufacturing capacity on a timely basis or manage such expansion effectively, our customers could seek such products from other suppliers, and our market share could be reduced. Because demand shifts in the semiconductor industry are rapid and difficult to foresee, we may not be able to increase capacity quickly enough to respond to any such increase in demand.
15
We may not be able to accurately forecast demand for our products.
We typically operate our business on a just-in-time shipment basis with a modest level of backlog and we order supplies and plan production based on internal forecasts of demand. Due to these factors, we have, in the past, and may again in the future, fail to accurately forecast demand for our products, in terms of both volume and specific products for which there will be demand. This has led to, and may in the future lead to, delays in product shipments, disappointment of customer expectations, or, alternatively, an increased risk of excess inventory and of inventory obsolescence. If we fail to accurately forecast demand for our products, our business, financial condition and operating results could be materially and adversely affected.
Semiconductor industry up-cycles may not reach historic levels and instead may reflect a lower rate of long-term growth.
There may not be new high-opportunity applications to drive growth in the semiconductor industry, as was the case in earlier market cycles. Accordingly, the semiconductor industry may experience lower growth rates during any recovery cycle than has historically been the case and its longer-term performance may reflect this lower growth rate. We are unable to predict the duration or ultimate severity of any downturn or the growth rate of any recovery cycle that may follow.
If we are unable to maintain our technological expertise in design and manufacturing processes, we will not be able to successfully compete.
The semiconductor industry is subject to rapid technological change, changing customer requirements and frequent new product introductions. Because of this, the life cycle of our products is difficult to determine. We believe that our future success will depend upon our ability to develop and provide products that meet the changing needs of our customers, including the shrinking of integrated circuit line-widths and the use of new classes of materials, such as copper, titanium nitride and organic and inorganic dielectric materials, which are materials that have either a low or high resistance to the flow of electricity. This requires that we successfully anticipate and respond to technological changes in manufacturing processes in a cost-effective and timely manner. Any inability to develop the technical specifications for any of our new products or enhancements to our existing products or to manufacture and ship these products or enhancements in volume in a timely manner could harm our business prospects and significantly reduce our sales. In addition, if new products have reliability or quality problems, we may experience reduced orders, higher manufacturing costs, delays in acceptance and payment, additional service and warranty expense, and damage to our reputation.
Our sales are somewhat concentrated on a small number of key customers and, therefore, our net sales and profitability may materially decline if one or more of our key customers does not continue to purchase our existing and new products in significant quantities.
We depend and expect to continue to depend on a limited number of customers for a large portion of our business, and changes in several customers’ orders could have a significant impact on our operating results. Our top ten customers accounted for
44%
,
42%
and
34%
of our net sales in
2015
,
2014
and
2013
, respectively. If any one of our key customers decides to purchase significantly less from us or to terminate its relationship with us entirely, our net sales and profitability may decline significantly. We could also lose our key customers or significant sales to our key customers because of factors beyond our control, such as a significant disruption in our customers’ businesses generally or in a specific product line, a change in the manufacturing sourcing policies or practices of these customers or the timing of customer inventory adjustments. For example, our EM customers’ and their customers’ aggressive management of inventory has already adversely affected EM’s results of operations in the past and may adversely affect future results of operations.
These customers may stop incorporating our products into their products with limited notice to us and suffer little or no penalty for doing so. The semiconductor industry is currently undergoing consolidation with a number of major firms merging or being acquired. If any of our customers merge or are acquired, we may experience lower overall sales from the merged or surviving companies. Because one of our strategies has been to develop long-term relationships with key customers in the product areas in which we focus, and because we have a long product design and development cycle for most of our products and prospective customers typically require lengthy product qualification periods prior to placing volume orders, we may be unable to replace these customers quickly or at all.
We are subject to order and shipment uncertainties and many of our costs are fixed, and, therefore, any significant changes, cancellations or deferrals of orders or shipments could cause our net sales and profitability to decline or fluctuate.
We do not usually obtain long-term purchase orders or commitments from our customers. Instead, we work closely with our customers to develop non-binding forecasts of the future volume of orders. Customers may cancel their orders, change production quantities from forecasted volumes or delay production for reasons beyond our control. Order cancellations or deferrals could cause us to hold inventory for longer than anticipated, which could reduce our profitability, restrict our ability to fund our operations and cause us to incur unanticipated reductions or delays in our revenue. Our customers often change their orders multiple times between initial order and delivery. Such changes usually relate to quantities or delivery dates, but sometimes relate to the specifications of the products we are supplying. If a customer does not pay for these products, we could incur significant charges against our income. In addition, our profitability may be affected by the generally fixed nature of our costs. Because a substantial portion of our costs is fixed, we may experience deterioration in gross margins when volumes decline.
16
Competition from existing or new companies in the microelectronics industry could cause us to experience downward pressure on prices, fewer customer orders, reduced margins, the inability to take advantage of new business opportunities and the loss of market share.
We operate in a highly competitive industry. We compete against many domestic and foreign companies that have substantially greater manufacturing, financial, research and development and marketing resources than we do. In addition, some of our competitors may have more developed relationships with our existing customers than we do, which may enable them to have their products specified for use more frequently by these customers. We also face competition from the manufacturing operations of our current and potential customers, who continually evaluate the benefits of internal manufacturing versus outsourcing. As more OEMs dispose of their manufacturing operations and increase the outsourcing of their products to liquid and gas delivery system and other component companies, we may face increasing competitive pressures to grow our business in order to maintain our market share. If we are unable to maintain our competitive position, we could experience downward pressure on prices, fewer customer orders, reduced margins, the inability to take advantage of new business opportunities and a loss of market share. Further, we expect that existing and new competitors will improve the design of their existing products and will introduce new products with enhanced performance characteristics. The introduction of new products or more efficient production of existing products by our competitors could diminish our market share and increase pricing pressure on our products. Further, customers continue to demand lower prices, shorter delivery times and enhanced product capability. If we do not respond adequately to such pressures, we could lose customers or orders. If we are unable to compete successfully, we could experience pricing pressures, reduced gross margins and order cancellation, which could have a material adverse effect on our results of operations.
The limited market acceptance of our 300 mm shipper products as well as our other products could continue to harm our operating results.
The broad adoption of 300 mm wafers has contributed to the increasing complexity of the semiconductor manufacturing process. The greater diameter of these wafers requires higher tooling costs and presents more complex handling, storage and transportation challenges. We have made and continue to make substantial investments in our 300 mm wafer shipping products, but there is no guarantee that a sufficient number of our customers will adopt our 300 mm wafer shipping product lines. Sales of our shipping products for these applications has, to date been, and could continue in the future to be modest, and we might not recover our development costs.
Semiconductor and other electronic device manufacturers may direct semiconductor capital equipment manufacturers to use a specified supplier’s product in their equipment. Accordingly, our success depends in part on our ability to have semiconductor and other electronic device manufacturers specify that our products be used at their fabrication facilities. Some of our competitors may have more developed relationships with semiconductor and other electronic device manufacturers, which enable them to have their products specified for use in manufacturers’ fabrication facilities.
From time to time, we make capital investments in anticipation of future business opportunities; if we are unable to obtain the anticipated business, our revenue and profitability may decline.
In the semiconductor market, the first company to introduce an innovative product meeting an identified customer need often will have a significant advantage over offerings of competitive products. For this reason, we may make significant capital investments in technology and manufacturing capacity in advance of future business developing and without any commitment from our customers to purchase products manufactured as a result of these investments. For example, we have made significant capital investments to develop the capability to manufacture shippers and FOUPs for 450 mm wafers, however, the size and timing of the development of the market for 450 mm wafer shippers and FOUPs remains uncertain. Major semiconductor manufacturers have delayed the implementation of 450 mm manufacturing while others have announced that they would not initiate 450 mm manufacturing until after 2020, so we cannot assure you that we will be able to successfully sell significant quantities of our 450 mm shipper and FOUP products or realize a return on our investment in the near term or ever. If we are unable to achieve broad market acceptance for these products or if a competitive product is preferred by our customers, we may not be able to recoup our investment, we may lose market share and our revenue and profitability may decline.
We may acquire other businesses, form joint ventures or divest businesses that could negatively affect our profitability, require us to incur debt and dilute your ownership of the Company.
As part of our business strategy, we have, and we expect to continue to address gaps in our product offerings, diversify into complementary product markets or pursue additional technology and customers through acquisitions, joint ventures or other types of collaborations. We also expect to adjust our portfolio of businesses to meet our ongoing strategic objectives. As a result, we may enter markets in which we have no or limited prior experience and may encounter difficulties in divesting businesses that no longer meet our objectives. Competition for acquiring attractive businesses in our industry is substantial. In executing this part of our business strategy, we may experience difficulty in identifying suitable acquisition candidates or in completing selected transactions at appropriate valuations. Alternatively, we may be required to undertake multiple transactions at the same time in order to take advantage of acquisition opportunities that do arise; this could strain our ability to effectively execute and integrate these transactions. We would consider a variety of financing alternatives for each acquisition which could include borrowing funds, reducing our cash balances or issuing additional shares of our common stock to complete an acquisition. This could impair our liquidity and dilute your ownership of the Company. Further, we may not be able to successfully integrate any acquisitions that we do make into our existing business operations, and we could assume
17
unknown or contingent liabilities or experience negative effects on our reported results of operations from dilutive results from operations and/or from future potential impairment of acquired assets, including goodwill, related to future acquisitions. We may experience difficulties in operating in foreign countries or over significant geographical distances and in retaining key employees or customers of an acquired business, and our management’s attention could be diverted from other business issues. We may not identify or complete these transactions in a timely manner, on a cost-effective basis or at all, and we may not realize the benefits of any acquisition or joint venture.
We may not effectively penetrate new markets.
Part of our business strategy is to leverage our expertise in our core competencies for growth in new and adjacent markets, such as photovoltaic cells, LEDs, flat panel displays, lithium ion batteries and magnetic storage devices and life sciences. Our ability to grow our business could be limited if we are unable to execute on this strategy.
Certain of our EM products are used to transport toxic gases used in the semiconductor manufacturing process
. Our patented SDS systems use a standard gas cylinder containing a carbon-based adsorbent material. The cylinder is filled with gas under conditions such that the gas is adsorbed onto the adsorbent material at sub-atmospheric pressure to minimize potential leaks of gas during transportation and use. Likewise our VAC systems use a complementary technology where select implant gases are stored under high pressure but delivered sub-atmospherically. While we believe that these delivery systems are the safest available in the industry, as with any products involved in the transport and storage of toxic gases, if a leak were to occur during transport or during storage at our customers’ location, serious damage could result including injury or death to any person exposed to those toxic gases creating significant product liability for us. While we believe we maintain adequate levels of product liability insurance, there can be no assurance that our insurance will be adequate to satisfy any such liabilities and our financial results or financial condition could be adversely affected.
Our results of operations could be adversely affected by climate change or natural catastrophes, such as the March 2011 earthquake and tsunami in Japan and the June 2012 wildfires in Colorado Springs, Colorado, in the locations in which we, our customers or our suppliers operate.
We have manufacturing and other operations in locations subject to natural events such as severe weather and earthquakes that could disrupt operations. In addition, our suppliers and customers also have operations in such locations. A natural disaster that results in a prolonged disruption to our operations, or our customers’ or suppliers’ operations, may adversely affect our results of operations and financial condition. Also, climate change poses both regulatory and physical risks that could harm our results of operations or affect the way we conduct our businesses. While the March 2011 earthquake and tsunami in Japan did not materially impair manufacturing operations at our Yonezawa, Japan plant and while the June 2012 wildfires did not materially impair manufacturing operations at our Colorado Springs plant, there can be no assurance that future such catastrophes will not impact our manufacturing operations or those of our supply chain partners by disrupting our ability to manufacture and deliver products to our customers, resulting in an adverse impact on our business and results of operations.
We may be subject to information technology system failures, network disruptions and breaches in data security.
Information technology system failures, network disruptions and breaches of data security from cyber attacks, employee social media use on our computers or through failure of our internet service providers and other cloud computing service providers to successfully secure their own systems could disrupt our operations, causing customer communication and order management issues, unintentional disclosure of customer, employee and proprietary information, and disruption in transaction processing, which could affect our reputation and reporting of financial results. While our management has taken steps to address these concerns by implementing network security, hiring personnel and establishing internal control measures, there can be no assurance that a system failure or data security breach will not have a material adverse effect on our financial condition and operating results.
We will have a substantial amount of indebtedness, which could adversely affect our financial health and our ability to obtain financing in the future, react to changes in our business and to make payments on the indebtedness.
As of December 31,
2015
, we have an aggregate principal amount of approximately
$667 million
of outstanding total indebtedness, comprised of our 6% senior unsecured notes due April 1, 2022 (“Notes”) and our senior secured term loan facility due 2021 (“Term Loan”). In addition we have approximately $75 million of unutilized capacity under a senior secured asset-based revolving credit facility (“ABL Facility”), which is subject to a borrowing base.
Subject to the limits contained in the credit agreements governing our Term Loan and our ABL Facility, and the indenture that governs the Notes, we may be able to incur substantial additional debt from time to time to finance working capital, capital expenditures, investments or acquisitions, or for other purposes. If we do so, the risks related to our high level of debt could intensify. Specifically, our high level of debt could have important consequences to investors, including:
|
•
|
making it more difficult for us to satisfy our obligations with respect to the Notes, the Term Loan and the ABL Facility;
|
18
|
•
|
limiting our ability to obtain additional financing to fund future working capital, capital expenditures, acquisitions or other general corporate requirements;
|
|
•
|
requiring a substantial portion of our cash flow to be dedicated to debt service payments instead of other purposes, thereby reducing the amount of cash flow available for working capital, capital expenditures, acquisitions and other general corporate purposes;
|
|
•
|
increasing our vulnerability to adverse changes in general economic, industry and competitive conditions;
|
|
•
|
exposing us to the risk of increased interest rates as certain of our borrowings, including borrowings under the Notes, the Term Loan and the ABL Facility;
|
|
•
|
limiting our flexibility in planning for and reacting to changes in the industry in which we compete;
|
|
•
|
preventing us from raising funds necessary to repurchase all Notes tendered to us upon the occurrence of certain changes of control, which could constitute a default under the indenture governing the Notes;
|
|
•
|
placing us at a disadvantage compared to other, less leveraged competitors or competitors with comparable debt at more favorable interest rates; and
|
|
•
|
increasing our cost of borrowing.
|
In addition, the indenture that governs the Notes and the credit agreements governing our Term Loan and our ABL Facility contain restrictive covenants that will limit our ability to engage in activities that may be in our long-term best interest. Our failure to comply with those covenants could result in an event of default which, if not cured or waived, could result in the acceleration of substantially all of our debt.
Despite our current level of indebtedness, we and our subsidiaries may still be able to incur substantially more debt. This could further exacerbate the risks to our financial condition described above and prevent us from fulfilling our obligations under our existing indebtedness.
We and our subsidiaries may be able to incur significant additional indebtedness in the future. Although the indenture that governs the Notes and the credit agreements governing our Term Loan and our ABL Facility contain restrictions on the incurrence of additional indebtedness, these restrictions are subject to a number of qualifications and exceptions, and the additional indebtedness incurred in compliance with these restrictions could be substantial. If we incur any additional indebtedness that ranks equally with the Notes, subject to collateral arrangements, the holders of that debt will be entitled to share ratably with the holders of the Notes and the lenders under the Term Loan and the ABL Facility in any proceeds distributed in connection with any insolvency, liquidation, reorganization, dissolution or other winding up of our Company. These restrictions also will not prevent us from incurring obligations that do not constitute indebtedness. Our Term Loan also provides that we will have the right at any time to request additional loans and commitments, and to the extent that the aggregate amount of such additional loans and commitments exceeds $225 million, the incurrence thereof will be subject to our secured net leverage ratio being less than a specified ratio, or in the case of unsecured loans or other unsecured debt, or loans or other debt secured by junior liens, our total net leverage ratio being less than a specified ratio. The lenders under these facilities will not be under any obligation to provide any such additional term loans or commitments, and any additional term loans or increase in commitments will be subject to several conditions precedent and limitations. If new debt is added to our current debt levels, the related risks that the Company now faces could intensify.
We may not be able to generate sufficient cash to service all of our indebtedness and may be forced to take other actions to satisfy our obligations under our indebtedness, which may not be successful.
Our ability to make scheduled payments on or refinance our debt obligations depends on our financial condition and operating performance, which are subject to prevailing economic, industry and competitive conditions and to certain financial, business, legislative, regulatory and other factors beyond our control. We may be unable to maintain a level of cash flow from operating activities sufficient to permit us to pay the principal, premium, if any, and interest on our indebtedness.
If our cash flow and capital resources are insufficient to fund our debt service obligations, we could face substantial liquidity problems and could be forced to reduce or delay investments and capital expenditures or to dispose of material assets or operations, seek additional debt or equity capital or restructure or refinance our indebtedness. Our ability to restructure or refinance our debt will depend on the condition of the capital markets and our financial condition at such time. Any refinancing of our debt could be at higher interest rates and may require us to comply with more onerous covenants, which could further restrict our business operations. We may not be able to effect any such alternative measures on commercially reasonable terms or at all and, even if successful, those alternative actions may not allow us to meet our scheduled debt service obligations. The credit agreements governing our Term Loan and our ABL Facility, and the indenture that governs the Notes restrict our ability to dispose of assets and use the proceeds from those dispositions and may also restrict our ability to raise debt or equity capital to be used to repay other indebtedness when it becomes due. We may not be able to consummate those dispositions or to obtain proceeds in an amount sufficient to meet any debt service obligations then due.
19
Our inability to generate sufficient cash flow to satisfy our debt obligations, or to refinance our indebtedness on commercially reasonable terms or at all, would materially and adversely affect our financial position and results of operations and our ability to satisfy our obligations under our indebtedness.
If we cannot make scheduled payments on our debt, we will be in default and holders of the Notes could declare all outstanding principal and interest to be due and payable, the lenders under the Term Loan and the ABL Facility could terminate their commitments to loan money, our secured lenders could foreclose against the assets securing their borrowings and we could be forced into bankruptcy or liquidation.
The terms of our credit agreements governing our Term Loan and our ABL Facility, and the indenture governing the Notes restrict our current and future operations, particularly our ability to respond to changes or to take certain actions.
The credit agreements governing our Term Loan and our ABL Facility and the indenture that governs the Notes contain a number of restrictive covenants that impose significant operating and financial restrictions on us and may limit our ability to engage in acts that may be in our long-term best interest, including restrictions on our ability to:
•
incur certain liens;
•
incur additional indebtedness and guarantee indebtedness;
•
pay dividends or make other distributions in respect of, or repurchase or redeem, capital stock;
•
prepay, redeem or repurchase certain debt;
•
make investments, loans, advances and acquisitions;
•
sell or otherwise dispose of assets, including capital stock of our subsidiaries;
•
enter into transactions with affiliates;
•
alter the businesses we conduct;
•
enter into agreements restricting our subsidiaries’ ability to pay dividends; and
•
consolidate, merge or sell all or substantially all of our assets.
In addition, the restrictive covenants in the credit agreement governing our ABL Facility may, at certain times, require us to maintain a fixed charge coverage ratio. Our ability to meet this financial ratio can be affected by events beyond our control.
A breach of the covenants under the indenture that governs the Notes or under the credit agreements governing our Term Loan and our ABL Facility could result in an event of default under the applicable indebtedness. Such a default may allow the creditors to accelerate the related debt and may result in the acceleration of any other debt to which a cross-acceleration or cross-default provision applies. In addition, an event of default under the credit agreement governing our ABL Facility would permit the lenders under our ABL Facility to terminate all commitments to extend further credit under that facility. Furthermore, if we were unable to repay the amounts due and payable under our Term Loan and our ABL Facility, those lenders could proceed against the collateral granted to them to secure that indebtedness, which could force us into bankruptcy or liquidation. In the event our lenders or note holders accelerate the repayment of our borrowings, we and our subsidiaries may not have sufficient assets to repay that indebtedness.
If our operating performance declines, we may in the future need to obtain waivers from the required lenders under our Term Loan and our ABL Facility to avoid being in default. If we breach our covenants under our Term Loan and our ABL Facility and seek a waiver, we may not be able to obtain a waiver from the required lenders. If this occurs we would be in default under the applicable facility, the lenders could exercise their rights, as described above, and we could be forced into bankruptcy or liquidation.
The restrictions contained in the credit agreements governing our Term Loan and our ABL Facility and the indenture that governs the Notes could adversely affect our ability to:
•
finance our operations;
•
make needed capital expenditures;
•
make strategic acquisitions or investments or enter into joint ventures;
•
withstand a future downturn in our business, the industry or the economy in general;
|
•
|
compete effectively and engage in business activities, including future opportunities, that may be in our best interest; and
|
|
•
|
plan for or react to market conditions or otherwise execute our business strategies.
|
These restrictions may affect our ability to grow in accordance with our plans.
A lowering or withdrawal of the ratings assigned to our debt securities by rating agencies may increase our future borrowing costs and reduce our access to capital.
The Notes have been rated by Standard & Poor’s and Moody’s. There is no assurance
20
that such credit ratings will remain in effect for any given period of time. Rating agencies also may lower, suspend or withdraw ratings on the Notes or our other debt in the future. Any lowering, suspension or withdrawal of such ratings may have an adverse effect on the market prices or marketability of our indebtedness.
Any future lowering of our ratings likely would make it more difficult or more expensive for us to obtain additional debt financing. If any credit rating initially assigned to our indebtedness is lowered or withdrawn for any reason, the value of that indebtedness could deteriorate.
Manufacturing Risks
Our dependence on single and limited source suppliers could affect our ability to manufacture our products.
We rely on single or limited source suppliers for some plastic polymers, filtration membranes, petroleum coke and the various materials, such as chemicals and gases, which we use in the production of our EM products, that are critical to the manufacturing of our products. At times, we have experienced a limited supply of certain polymers as well as the need to substitute polymers, resulting in delays, increased costs and the risks associated with qualifying new polymers with our customers. An industry-wide increase in demand for these polymers could affect the ability of our suppliers to provide sufficient quantities to us. If we are unable to obtain an adequate quantity of such supplies, our manufacturing operations may be interrupted.
In addition, suppliers may discontinue production of polymers specified in certain of our products, requiring us in some instances to certify an alternative source with our customers. If we are unable to obtain an adequate quantity of such supplies for any reason, our manufacturing operations may be adversely affected. Obtaining alternative sources would likely result in increased costs and shipping delays, which could decrease profitability and damage our relationships with current and potential customers.
Prices for polymers can vary widely. In a volatile oil price environment, some suppliers have added and may in the future add surcharges to the prices of the polymers we purchase. While we have long-term arrangements with certain key suppliers of polymers that fix our price for purchases up to specified quantities, if our polymer requirements exceed the quantities specified, we could be exposed to higher material costs. If the cost of polymers increases and we are unable to correspondingly increase the sales price of our products, our profit margins will decline.
Our filtration products incorporate a wide variety of filter membranes designed to meet specific customer filtration needs, not all of which are produced internally. In the event that a manufacturer of outsourced membrane discontinues supply or production, we may be required to identify and qualify an alternative filter membrane for that application to incorporate into our products. This could require extensive lead times and increased costs which may cause us to lose sales and cause our profit margins to decline.
Our graphite synthesis process requires petroleum coke that meets specified criteria. While there are multiple suppliers for this petroleum coke, the sources are limited and our required criteria may cause the price of this petroleum coke to increase.
The unavailability or reduced
availability of the materials or resources we use for our EM products may require us to reduce production of EM products or may require us to incur additional costs in order to obtain an adequate supply of these materials or resources. The occurrence of any of these events could adversely affect our business and results of operations.
Our production processes are becoming increasingly complex, and our production could be disrupted if we are unable to avoid manufacturing difficulties.
Our manufacturing processes are complex and require the use of expensive and technologically sophisticated equipment and materials. These processes are frequently modified to improve manufacturing yields and product quality. We have, on occasion, experienced manufacturing difficulties, such as temporary shortages of raw materials and occasional critical equipment breakdowns that have delayed deliveries to customers. A number of our product lines are manufactured at only one or two facilities, and any disruption could impact our sales until another facility could commence or expand production of such products.
Our manufacturing operations are subject to numerous risks, including the introduction of impurities in the manufacturing process and other manufacturing difficulties that may not be well understood for an extended period of time and that could lower manufacturing yields and make our products unmarketable; the costs and demands of managing and coordinating geographically diverse manufacturing facilities; and the disruption of production in one or more facilities as a result of a slowdown or shutdown in another facility. We could experience these or other manufacturing difficulties, which might result in a loss of customers and exposure to warranty and product liability claims.
Third-party membrane suppliers may disrupt our ability to manufacture products to meet our customer needs.
Certain of our membrane products rely on membranes manufactured by third parties. In the event that these membranes are no longer available
21
or cost-effective and we are unable to acquire an alternative source, our ability to manufacture these products may be disrupted and our profits may decline.
Our membrane manufacturing operations may be disrupted if we are unable to successfully transition manufacturing to our own facility.
The Membrane Manufacturing and Supply Transition Agreement (the Membrane Agreement) between us and EMD Millipore Corporation, dated November 22, 2013, provides that our lease of space in Millipore’s Bedford, Massachusetts facility and our right to use certain manufacturing equipment owned by Millipore expires on June 30, 2016. While we have opened a new membrane manufacturing plant in Bedford, MA to house these membrane manufacturing operations, qualification of this new membrane manufacturing plant is still under way and will require significant lead time to complete. In addition, the transition of membrane manufacturing operations to this new facility, which will also consolidate certain other existing operations in Massachusetts, continues to be complex and time consuming. In addition, our current membrane manufacturing is operating at capacity. Consequently, delays in completion of the qualification of our new membrane manufacturing facility or a failure to execute the transition of our membrane manufacturing operations effectively and expeditiously might disrupt our manufacture of membrane, exacerbate our capacity constraints and result in a loss of customers or exposure to warranty, product liability claims and breach of contract claims.
We may lose sales if we are unable to timely procure, repair or replace capital equipment necessary to manufacture many of our products.
If our existing equipment fails, or we are unable to obtain new equipment quickly enough to satisfy any increased demand for our products, we may lose sales to competitors. In particular, we do not maintain duplicate tools or equipment for most of our important products. Fixing or replacing complex tools is time consuming, and we may not be able to replace a damaged tool in time to meet customer requirements. In addition, from time to time we may upgrade or add new manufacturing equipment that may require substantial lead times to build and qualify. Delays in building and qualifying new equipment could result in a disruption of our manufacturing processes and prevent us from meeting our customers’ requirements so that they would seek other suppliers.
We incur significant cash outlays over long-term periods in order to research, develop, manufacture and market new products that may never reach market or may have limited market acceptance.
We make significant cash expenditures to engineer, research, develop and market new products. For example, we incurred
$105.9 million
,
$87.7 million
and
$55.3 million
for engineering, research and development expense in
2015
,
2014
and
2013
, respectively. The development period for a product can be very long. Following development, it may take a number of years for sales of that product to reach a substantial level, if ever. We cannot be certain of the success of a new product. A product concept may never progress beyond the development stage or may only achieve limited acceptance in the marketplace. If this occurs, we do not receive a direct return on our expenditures and may not even realize any indirect benefits. Additionally, capacity expansion may be necessary in order to manufacture a new product. If sales levels do not increase to offset the additional fixed operating expenses associated with any such expansion, our profitability could decline and our prospects could be harmed. For example, as noted above, while we have made significant capital investments to develop the capability to manufacture shippers and FOUPs for 450 mm wafers, the size and timing of the development of the market for 450 mm wafer shippers and FOUPs remains uncertain. Major semiconductor manufacturers have delayed the implementation of 450 mm manufacturing while others have announced that they would not initiate 450 mm manufacturing until after 2020, so we cannot assure you that we will be able to successfully sell significant quantities of our 450 mm shipper and FOUP products or realize a return on our investment in the near term or ever.
We are subject to a variety of environmental laws that could cause us to incur significant expenses.
In addition to other regulatory requirements affecting our business, we are subject to a variety of federal, state, local and non-U.S. regulatory requirements relating to the use, disposal, clean-up of, and human exposure to, hazardous chemicals. We generate and handle materials that are considered hazardous waste under applicable law. Certain of our manufacturing operations require the discharge of substantial quantities of wastewater into publicly owned waste treatment works which require us to assure that our wastewater complies with volume and content limitations. If we fail to comply with any present or future regulations, we could be subject to future liabilities or the suspension of production. In addition, compliance with these or future laws could restrict our ability to expand our facilities or to build or acquire new facilities or may require us to acquire costly equipment, incur other significant expenses, such as remediation of contamination found on any site that we may acquire, or modify our manufacturing processes.
We are continually evaluating our manufacturing operations within our plants in order to achieve efficiencies and gross margin improvements. If we are unable to successfully manage transfers or realignments of our manufacturing operations, our ability to deliver products to our customers could be disrupted and our business, financial condition and results of operations could be adversely affected.
In order to enhance the efficiency and cost effectiveness of our manufacturing operations, we have in the past and may in the future move several product lines from one of our plants to another and to consolidate manufacturing operations in certain of our plants. Our product lines involve technically complex manufacturing processes that require considerable expertise to operate. If we are unable to establish stable processes to efficiently and effectively produce high quality products in relocated manufacturing processes in the destination plant, production may be disrupted and we may not be able to deliver these products
22
to meet customer orders in a timely manner, which may cause us to lose credibility with our customers and harm our business. There can be no assurance that these complex manufacturing processes can be stabilized and that the cost savings that we anticipate will be achieved.
Loss of our key personnel could harm our business because of their experience in the semiconductor industry and their technological expertise. Similarly, our inability to attract and retain new qualified personnel could inhibit our ability to operate and grow our business successfully.
We depend on the services of our key senior executives and technological experts because of their experience in the semiconductor industry and their technical expertise. The loss of the services of one or several of our key employees or an inability to attract, train and retain qualified and skilled employees, specifically research and development and engineering personnel, could result in the loss of customers or otherwise inhibit our ability to operate and grow our business successfully. In the past and currently, during downturns in the semiconductor industry our predecessor companies have, and we have, had to impose salary reductions on senior employees and freeze or eliminate merit increases in an effort to maintain our financial position. These actions may have an adverse effect on employee loyalty and may make it more difficult for us to attract and retain key personnel.
We face the risk of product liability claims.
The manufacture and sale of our products involve the risk of product liability claims. In addition, a failure of one of our products at a customer site could interrupt the business operations of the customer. Our existing insurance coverage limits may not be adequate to protect us from all liabilities that we might incur in connection with the manufacture and sale of our products if a successful product liability claim or series of product liability claims were brought against us.
If we are unable to protect our intellectual property rights, our business and prospects could be harmed.
Our future success and competitive position depend in part upon our ability to obtain and maintain proprietary technology used in our principal product families. We rely, in part, on patent, trade secret and trademark law to protect that technology. We routinely enter into confidentiality agreements with our employees and with third parties. However, there can be no assurance that these agreements will not be breached, that we will have adequate remedies for any breach or that our confidential and proprietary information and technology will not be independently developed by or become otherwise known to third parties. We have obtained a number of patents relating to our products and have filed applications for additional patents. We cannot assure you that any of our pending patent applications will be approved, that we will develop additional proprietary technology that is patentable, that any patents owned by or issued to us will provide us with competitive advantages or that these patents will not be challenged by third parties. Patent filings by third parties, whether made before or after the date of our filings, could render our intellectual property less valuable. Competitors may misappropriate our intellectual property, and disputes as to ownership of intellectual property may arise. In addition, if we do not obtain sufficient international protection for our intellectual property, our competitiveness in international markets could be significantly impaired, which would limit our growth and future revenue. Furthermore, there can be no assurance that third parties will not design around our patents.
Protection of our intellectual property rights has in the past resulted and may continue to result in costly litigation.
We may from time to time be required to institute litigation in order to enforce our patents, copyrights or other intellectual property rights, to protect our trade secrets, to determine the validity and scope of the proprietary rights of others or to defend against claims of infringement. Such litigation could result in substantial costs and diversion of resources and could negatively affect our sales, profitability and prospects regardless of whether we are able to successfully enforce our rights. For example, in January 2011 we settled multiple patent litigations with Pall Corporation. We prosecuted and defended these cases vigorously and incurred substantial costs in pursuing them. It may become necessary for us to initiate other costly patent litigation against this or other competitors in order to protect and/or perfect our intellectual property rights. We cannot predict how any existing or future litigation will be resolved or what their impact will be on us.
If we infringe on the proprietary technology of others, our business and prospects could be harmed.
Our commercial success will depend, in part, on our ability to avoid infringing or misappropriating any patents or other proprietary rights owned by third parties. If we are found to infringe or misappropriate a third party’s patent or other proprietary rights, we could be required to pay damages to such third party, alter our products or processes, obtain a license from the third party or cease activities utilizing such proprietary rights, including making or selling products utilizing such proprietary rights. If we are required to obtain a license from a third party, there can be no assurance that we will be able to do so on commercially favorable terms, if at all.
International Risks
We conduct a significant amount of our sales activity and manufacturing efforts outside the United States, which subjects us to additional business risks and may cause our profitability to decline due to increased costs.
Sales to customers outside the United States accounted for approximately
77%
,
75%
and
71%
, respectively, of our net sales in
2015
,
2014
and
2013
, respectively. We anticipate that international sales will continue to account for a majority of our net sales. In addition, a number of our key domestic customers derive a significant portion of their revenues from sales in international markets. We also manufacture a
23
significant portion of our products outside the United States and are dependent on international suppliers for many of our parts. We intend to continue to pursue opportunities in both sales and manufacturing internationally. Our international operations are subject to a number of risks and potential costs that could adversely affect our revenue and profitability, including:
|
•
|
unexpected changes in regulatory requirements that could impose additional costs on our operations or limit our ability to operate our business;
|
|
•
|
greater difficulty in collecting our accounts receivable and longer payment cycles than are typical in domestic operations;
|
|
•
|
changes in labor conditions and difficulties in staffing and managing foreign operations;
|
|
•
|
expense and complexity of complying with U.S. and foreign import and export regulations;
|
|
•
|
liability for foreign taxes assessed at rates higher than those applicable to our domestic operations; and
|
|
•
|
political and economic instability.
|
In the past, we have incurred costs or experienced disruptions due to the factors described above and expect to do so in the future. For example, our operations in Asia, and particularly South Korea, Taiwan and Japan, have been negatively impacted in the past as a result of regional economic instability. In addition, Taiwan and South Korea account for a growing portion of the world’s semiconductor manufacturing. There have historically been strained relations between China and Taiwan and there are continuing tensions between North Korea and other countries, including South Korea and the United States. Any adverse developments in those relations could significantly disrupt the worldwide production of semiconductors, which may lead to reduced sales of our products. Furthermore, we incur additional legal compliance costs associated with our international operations and could become subject to legal penalties in foreign countries if we do not comply with local laws and regulations, which may be substantially different from those in the United States. In a number of foreign countries, some companies engage in business practices that are prohibited by U.S. law applicable to us such as the Foreign Corrupt Practices Act. Although we implement policies and procedures designed to ensure compliance with these laws, there can be no assurance that all of our employees, contractors and agents, as well as those companies to which we outsource certain of our business operations, including those based in countries where practices that violate such U.S. laws may be customary or common, will not take actions in violation of our policies. Any such violation, even if prohibited by our policies, could have an adverse effect on our business and results of operations.
We will lose sales if we are unable to obtain government authorization to export certain of our products or to import certain of our products into foreign markets, and we would be subject to legal and regulatory consequences if we do not comply with applicable export and import control laws and regulations.
Exports of certain of our products are subject to export controls imposed by the U.S. Government and administered by the U.S. Departments of State and Commerce. In certain instances, these regulations may require pre-shipment authorization from the administering department. For products subject to the Export Administration Regulations (EAR) administered by the Department of Commerce’s Bureau of Industry and Security, the requirement for a license is dependent on the type and end use of the product, the final destination, the identity of the end user and whether a license exception might apply. Virtually all exports of products subject to the International Traffic in Arms Regulations (ITAR) administered by the Department of State’s Directorate of Defense Trade Controls, require a license. Certain of our products are subject to EAR and ITAR. Products developed and manufactured in our foreign locations are subject to export controls of the applicable foreign nation.
Given the current global political climate, obtaining export licenses can be difficult and time-consuming. Failure to obtain export licenses for these shipments could significantly reduce our revenue and materially and adversely affect our business, financial condition and results of operations. Compliance with U.S. Government regulations may also subject us to additional fees and costs. The absence of comparable restrictions on competitors in other countries may adversely affect our competitive position.
In addition, certain countries require import and other special licenses in order for certain of our products to be imported into or sold in that country. Our inability to satisfy these requirements in a timely manner has in the past, and may continue to, prevent us from meeting our customers’ expectations in these countries and to lose sales. For example, in response to recent explosions at gas storage facilities in Singapore and China, the import of gas canisters and chemicals viewed as dangerous have come under increased regulatory scrutiny by governmental officials. This increased regulation may impair the ability of our Electronic Materials business segment to import those products into Singapore and China and may cause us to lose sales.
Our results of operations could be adversely affected by changes in taxation or by adverse tax rulings.
We have facilities in foreign countries and, as a result, are subject to taxation and audit by a number of taxing authorities. Tax rates vary among the jurisdictions in which we operate. Our results of operations could be affected by market opportunities or decisions we make that cause us to increase or decrease operations in one or more countries, or by changes in applicable tax rates or audits by the taxing authorities in countries in which we operate. In addition, we are subject to laws and regulations in various locations that govern the determination of which is the appropriate jurisdiction to decide when and how much profit has been earned and is subject to taxation in that jurisdiction. Changes in these laws and regulations could affect the locations where we are deemed to earn income, which could in turn affect our results of operations. We have deferred tax assets on our balance sheet. Changes in applicable tax
24
laws and regulations could affect our ability to realize those deferred tax assets, which could also affect our results of operations. Each quarter we forecast our tax liability based on our forecast of our performance for the year. If that performance forecast changes, our forecasted tax liability may change.
We have undertaken a number of complex internal reorganizations of our foreign subsidiaries in order to rationalize and streamline our foreign operations, focus our management efforts on certain local opportunities and to take advantage of favorable business conditions in certain localities. While we have exercised diligence in undertaking this internal reorganization, there can be no assurance that this reorganization, or any future internal reorganization, will not result in adverse tax consequences in the United States or in foreign countries in which we have operations. This could adversely impact our profitability from foreign operations and result in a material reduction in our results of operations.
We may be subject to increased import duties as we seek to source more of the materials from which our products are made from foreign countries.
In an effort to reduce the cost of our products or to obtain the highest quality materials, we expect that our purchases of raw materials and components from foreign countries will increase. Those of our products manufactured in the United States or other countries from these materials and components may consequently be burdened by import duties imposed by the United States or those other countries, and these additional costs may be substantial and may put our products at a competitive disadvantage.
Fluctuations in the value of the U.S. dollar in relation to other currencies may lead to lower net income and shareholders’ equity or may cause us to raise prices, which could result in reduced net sales.
Foreign currency exchange rate fluctuations could have an adverse effect on our net sales, results of operations and shareholders’ equity. Foreign currency fluctuations against the U.S. dollar could require us to increase prices to foreign customers, which could result in lower net sales by us to such customers. Alternatively, if we do not adjust the prices for our products in response to foreign currency fluctuations, our profitability could decline. In addition, sales made by our foreign subsidiaries are generally denominated in the currency of the country in which these products are sold, and the currency we receive in payment for such sales could be less valuable at the time of receipt versus the time of sale as a result of foreign currency exchange rate fluctuations.
We are subject to restrictions on the transfer of currency from certain countries in which we conduct operations that could impair our ability to transfer our funds from one of our subsidiaries to another.
These regulations are complex and may interfere with the conduct of our business operations in the ordinary course. In some jurisdictions even an unintentional violation of these regulations can result in criminal penalties.
Volatility in the global economy could adversely affect our results.
Financial markets in the United States, Europe and Asia have been experiencing extreme disruption in recent years, including, among other things, volatility in securities prices, severely diminished liquidity and credit availability, rating downgrades of sovereign debt and declining valuation of certain investments, declines in consumer confidence, declines in economic growth, volatility in unemployment rates, and uncertainty about economic stability. In the past such conditions have had a significant adverse impact on our industry and financial condition and results of operations. There may be further changes in the global economy, which could lead to further challenges in our business and negatively impact our financial results. Tightness of credit in financial markets could adversely affect the ability of our customers and suppliers to obtain financing for significant purchases and operations and could result in a decrease in orders and spending for our products and services. We are unable to predict the likely duration and severity of any disruption in European or global financial markets and adverse economic conditions and the effects they may have on our business and financial condition. If uncertain economic conditions return or deteriorate, our business and results of operations could be further materially and adversely affected.
An increased concentration of wafer manufacturing in Japan could result in lower sales of our wafer shipper products.
A large percentage of the world’s 300 mm raw silicon wafer manufacturing currently takes place in Japan. Our market share in Japan is currently lower than in other regions we serve. Further, we expect that a large percentage of 450 mm raw silicon wafer manufacturing will, in the future, take place in Japan. If we are unable to persuade these wafer suppliers to use our new 450 mm shippers, we may not be able to achieve a significant market share and may not be able to benefit from our investment in 450 mm shipper manufacturing capacity.
Terrorist attacks, such as the attacks that occurred in New York and Washington, D.C. on September 11, 2001, and other acts of violence or war may affect the markets in which we operate or our operations and hurt our ability to manufacture products and our profitability.
Terrorist attacks may negatively affect our operations and any security we issue. There can be no assurance that there will not be future terrorist attacks against the United States or U.S. businesses. These attacks or other armed conflicts may directly impact our physical facilities or those of our suppliers or customers. Our primary facilities include headquarters, research and development and manufacturing facilities in the United States; sales, research and development and manufacturing facilities in Japan, South Korea, Taiwan and Malaysia; and sales and service facilities in Europe and Asia. Attacks may also disrupt
25
the global insurance and reinsurance industries with the result that we may not be able to obtain insurance at historical terms and levels for our facilities. Furthermore, such attacks may make travel and the transportation of our supplies and products more difficult and more expensive and may ultimately affect the sales of our products in the United States and overseas. As a result of terrorism, the United States may enter into additional armed conflicts, which could have a further impact on our domestic and international sales, our supply chain, our production capacity and our ability to deliver products to our customers. The consequences of these armed conflicts and the associated instability are unpredictable, and we may not be able to foresee events that could have an adverse effect on our business and any security we issue.
Risks Related to Owning our Common Stock
The price of our common stock has been volatile in the past and may be volatile in the future.
The price of our common stock has been volatile in the past and may be volatile in the future. While in 2015 the closing price of our stock on The NASDAQ Global Select Market (“NASDAQ”) ranged from a low of $12.01 to a high of $15.02, on January 21, 2016, the closing price of our stock was $10.60, and, as in past years, the price of our common stock may show greater volatility.
The trading price of our common stock is subject to significant volatility in response to various factors, some of which are beyond our control, including the following: the failure to meet the published expectations of securities analysts; changes in financial estimates by securities analysts; press releases or announcements by, or changes in market values of, comparable companies; volatility in the markets for high-technology stocks, general stock market price and volume fluctuations, which are particularly common among securities of high-technology companies; stock market price and volume fluctuations attributable to inconsistent trading volume levels; the cyclicality of the semiconductor industry and a potential industry downturn; our performance; our ability to repay when due any debt obligations we may incur in the future; our ability to respond to rapid shifts in demand; our ability to compete effectively; loss of key customers or decline in order volumes for new and existing products; our high fixed costs; manufacturing difficulties; risks associated with our significant foreign operations; additions or departures of key personnel; involvement in or adverse results from litigation; and perceived dilution from stock issuances.
Furthermore, stock prices for many companies fluctuate widely for reasons that may be unrelated to their operating results. Those fluctuations and general economic, political and market conditions, such as recessions, terrorist or other military actions, or international currency fluctuations, as well as public perception of equity values of publicly traded companies may adversely affect the market price of our common stock. These market fluctuations may cause the trading price of our common stock to decrease. Future decreases in our stock price may adversely impact our ability to raise sufficient additional capital in the future, if needed.
If our common stock trades below book value or our business outlook erodes, we could be required to record material impairment losses for our long-lived assets, including property, plant and equipment and our identifiable intangibles.
In accordance with U.S. generally accepted accounting principles, we review our long-lived assets whenever events or changes in circumstances indicate that the carrying amount of such assets may not be recoverable. If the carrying amount of an asset or group of assets exceeds its undiscounted cash flows, the asset will be written down to its fair value.
The evaluation of the recoverability of long-lived assets requires us to make significant estimates and assumptions. These estimates and assumptions primarily include, but are not limited to, the identification of the asset group at the lowest level of independent cash flows and the primary asset of the group; and long-range forecasts of revenue, reflecting management’s assessment of general economic and industry conditions, operating income, depreciation and amortization and working capital requirements.
Due to the inherent uncertainty involved in making these estimates, which are made in a particular economic environment, actual results could differ from those estimates. In addition, changes in the underlying assumptions would have a significant impact on the conclusion that an asset group’s carrying value is recoverable, or the determination of any impairment charge if it was determined that the asset values were indeed impaired.
Due to the uncertain economic environment within the semiconductor industry, we continually monitor circumstances and events to determine whether asset impairment testing is warranted.
It is possible that in the future we may no longer be able to conclude that there is no impairment of our long-lived assets, nor can we provide assurance that material impairment charges of long-lived assets will not occur in future periods.
Our annual and quarterly operating results are subject to fluctuations as a result of rapid demand shifts and our modest level of backlog, and if we fail to meet the expectations of securities analysts or investors, the market price of our common stock may decrease significantly.
Our sales and profitability can vary significantly from quarter to quarter and year to year. Because our expense levels are relatively fixed in the short-term, an unanticipated decline in revenue in a particular quarter could significantly reduce our net income, or lead to a net loss, in that quarter. In addition, we make a substantial portion of our shipments shortly
26
after we receive the order, and therefore we operate with a relatively modest level of backlog. As a consequence of the just-in-time nature of shipments and the modest level of backlog, our results of operations may decline quickly and significantly in response to changes in order patterns or rapid decreases in demand for our products. We anticipate that fluctuations in operating results will continue in the future. Such fluctuations in our results could cause us to fail to meet the expectations of securities analysts or investors, which could cause the market price of our common stock to decline substantially. We believe that period-to-period comparisons of our results of operations may not be meaningful, and you should not rely upon them as indicators of our future performance.
If we fail to maintain an effective system of internal controls, we may not be able to accurately report our financial results. As a result, current and potential stockholders could lose confidence in our financial reporting, which would harm our business and the trading price of our stock.
Effective internal controls are necessary for us to provide reliable financial reports. If we cannot provide reliable financial reports, our business and operating results could be harmed. We have in the past discovered, and may in the future, identify material weaknesses in internal control over financial reporting. Each of these past material weaknesses represented a reasonable possibility that a material misstatement of our annual or interim financial statements would not have been prevented or detected.
Any failure to implement and maintain the improvements that we have made to our controls over our financial reporting, or difficulties encountered in the implementation of these improvements in our controls, could cause us to fail to meet our reporting obligations. Any failure in our internal controls that leads to a material weakness could also cause investors to lose confidence in our reported financial information, which could have a negative impact on the trading price of our stock.
Changes in the securities laws and regulations have in the past and may continue to increase our costs, and any future changes would likely increase our costs.
The Sarbanes-Oxley Act of 2002 and the Dodd-Frank Wall Street Reform and Consumer Protection Act, as well as related rules and listing standards promulgated by the Securities and Exchange Commission and the NASDAQ, required changes in some of our corporate governance, securities disclosure and compliance practices. Compliance with these rules and listing standards has increased our legal and financial and accounting costs, and we expect these increased costs to continue indefinitely. While these costs are no longer increasing, they may in fact increase in the future. In addition, due, at least in part, to the turmoil over the past several years in the securities and credit markets, as well as the global economy, many U.S. and international governmental, regulatory and supervisory authorities including, but not limited to, the SEC and the NASDAQ, have enacted additional changes in their laws, regulations and rules and may be contemplating additional changes. These changes, and any such future changes, may cause our legal and financial accounting costs to increase. We also expect these developments may make it more difficult and more expensive for us to obtain director and officer liability insurance in the future, and we may be forced to accept reduced coverage or incur substantially higher costs to obtain coverage. Likewise, these developments may make it more difficult for us to attract and retain qualified members of our board of directors, particularly independent directors, or qualified executive officers.
Provisions in our charter documents and Delaware law may delay or prevent an acquisition of us, which could decrease the value of your shares.
Our certificate of incorporation and by-laws and Delaware law contain provisions that could make it harder for a third party to acquire us without the consent of our board of directors. These provisions include limitations on actions by our stockholders by written consent. In addition, our board of directors has the right to issue preferred stock without stockholder approval, which could be used to dilute the stock ownership of a potential hostile acquirer.
Our restated certificate of incorporation makes us subject to the anti-takeover provisions of Section 203 of the Delaware General Corporation Law. In general, Section 203 prohibits publicly held Delaware corporations to which it applies from engaging in a “business combination” with an “interested stockholder” for a period of three years after the date of the transaction in which the person became an interested stockholder, unless the business combination is approved in a prescribed manner. This provision could discourage others from bidding for our shares of common stock and could, as a result, reduce the likelihood of an increase in the price of our common stock that would otherwise occur if a bidder sought to buy our common stock.
Our certificate of incorporation authorizes the issuance of shares of blank check preferred stock.
Our certificate of incorporation provides that our board of directors is authorized to issue from time to time, without further stockholder approval, up to 5,000,000 shares of preferred stock in one or more series and to fix and designate the rights, preferences, privileges and restrictions of the preferred stock, including dividend rights, conversion rights, voting rights, redemption rights and terms of redemption and liquidation preferences. Such shares of preferred stock could have preferences over our common stock with respect to dividends and liquidation rights. Our issuance of preferred stock may have the effect of delaying or preventing a change in control. Our issuance of preferred stock could decrease the amount of earnings and assets available for distribution to the holders of common stock or could adversely affect the rights and powers, including voting rights, of the holders of common stock. The issuance of preferred stock could have the effect of decreasing the market price of our common stock.
27
Your percentage ownership in us may be diluted by future issuances of capital stock, which could reduce your influence over matters on which stockholders vote.
Subject to applicable NASDAQ standards, our board of directors has the authority, without action or vote of our stockholders, to issue all or any part of our authorized but unissued shares. Issuances of common stock or the exercise of employee and director stock options would dilute your percentage ownership interest, which will have the effect of reducing your influence over matters on which our stockholders vote. In addition, we may issue substantial quantities of our common stock in order to affect acquisitions which would also dilute your ownership interest. If the issuances are made at prices that reflect a discount from the then current trading price of our common stock, your interest in the book value of our common stock might be diluted.
Not Applicable.
Our principal executive offices are located in Billerica, Massachusetts. We also have manufacturing, research and equipment cleaning facilities in the United States, Japan, France, Taiwan, South Korea and Malaysia. Information about our principal facilities is set forth below:
|
Location
|
Principal Function
|
Approximate
Square Feet
|
Leased/
Owned
|
|
Bedford, Massachusetts
(1)
|
Research &Manufacturing
|
80,000
|
Owned
|
|
Billerica, Massachusetts
(1) (2)
|
Executive Offices, Research & Manufacturing
|
175,000
|
Leased
|
|
Bloomington, MN
(1)
|
Research & Manufacturing
|
68,000
|
Leased
|
|
Burnet, TX
(3)
|
Research & Manufacturing
|
77,000
|
Owned
|
|
Chaska, Minnesota
(1)
|
Executive Offices, Research & Manufacturing
|
186,000
|
Owned
|
|
Colorado Springs, CO
(1)
|
Manufacturing
|
82,000
|
Owned
|
|
Colorado Springs, CO
(1)
|
Manufacturing
|
40,000
|
Leased
|
|
Danbury, CT
(3)
|
Research & Manufacturing
|
73,000
|
Leased
|
|
Danbury, CT
(3)
|
Executive Offices
|
31,000
|
Leased
|
|
Decatur, Texas
(1)
|
Manufacturing
|
359,000
|
Owned
|
|
Hsin-chu, Taiwan
(1) (3)
|
Executive Offices, Research &Manufacturing
|
109,000
|
Leased
|
|
Yangmei City, Taiwan
(1)
|
Manufacturing
|
40,000
|
Leased
|
|
JangAn, South Korea
(3)
|
Manufacturing
|
127,000
|
Owned
|
|
Kulim, Malaysia
(1)
|
Manufacturing
|
195,000
|
Owned
|
|
Montpellier, France
(1)
|
Cleaning Services
|
53,000
|
Owned
|
|
Suwon, South Korea
(1) (3)
|
Executive Offices & Research
|
42,000
|
Leased
|
|
Tokyo, Japan
(1) (3)
|
Executive Offices & Research
|
27,000
|
Leased
|
|
Wonju City, South Korea
(1)
|
Manufacturing
|
39,000
|
Owned
|
|
Yonezawa, Japan
(1)
|
Manufacturing
|
185,000
|
Owned
|
|
1.
|
Facility used by our Critical Materials Handling segment.
|
|
2.
|
This lease has been extended through March 31, 2019 and is subject to one five-year renewal option.
|
|
3.
|
Facility used by our Electronics Materials segment.
|
We lease approximately 4,200 square feet of manufacturing space in a facility located at 80 Ashby Road, Bedford, Massachusetts owned by EMD Millipore Corporation pursuant to a Membrane Manufacturing and Supply Transition Agreement that expires June 30, 2016. We also lease approximately 13,000 square feet of research and development and manufacturing office space located in San Diego, California, approximately 31,000 square feet of office, research and development and manufacturing space located in Franklin, Massachusetts, an aggregate of approximately 23,000 square feet of manufacturing space in Anseong, South Korea, approximately 15,000 square feet of office space in Round Rock, Texas, and approximately 3,300 square feet of office space in Tempe, Arizona.
We lease approximately 10,000 square feet for our Asia manufacturing management offices in Singapore. In addition, we maintain a worldwide network of sales, service, repair or cleaning centers in the United States, Germany, France, Israel, Japan, Malaysia, Taiwan, Singapore, China and South Korea. Leases for our facilities expire through December 2019. We currently expect to be able to extend the terms of expiring leases or to find suitable replacement facilities on reasonable terms.
28
We believe that our facilities are well-maintained and suitable for their respective operations. All of our facilities are generally utilized within a normal range of production volume.
As of December 31,
2015
, we were not involved in any legal proceedings that we believe will have a material impact on our consolidated financial position, results of operations or cash flows. From time to time the Company may be a party to litigation involving claims against the Company arising in the ordinary course of our business. We are not aware of any material potential litigation or claims against us which would have a material adverse effect upon our financial statements.
Not applicable.
29
Market Information and Holders:
Entegris’ Common Stock, $0.01 par value, trades on the NASDAQ Global Select Market under the symbol “ENTG”. The following table sets forth the high and low sales prices of the Company shares for each full quarterly period during
2015
and
2014
. As of
February 22, 2016
there were
1,222
shareholders of record. On
February 22, 2016
, the last sale price reported on the Nasdaq Global Select Market for our common stock was
$12.12
per share.
|
|
2015
|
2014
|
|||||||||||||
|
|
Low
|
High
|
Low
|
High
|
|||||||||||
|
First quarter
|
$
|
11.90
|
|
$
|
13.94
|
|
$
|
10.20
|
|
$
|
12.50
|
|
|||
|
Second quarter
|
$
|
13.02
|
|
$
|
15.11
|
|
$
|
10.69
|
|
$
|
13.86
|
|
|||
|
Third quarter
|
$
|
12.63
|
|
$
|
15.20
|
|
$
|
11.43
|
|
$
|
14.05
|
|
|||
|
Fourth quarter
|
$
|
12.36
|
|
$
|
14.32
|
|
$
|
10.67
|
|
$
|
13.96
|
|
|||
Dividend Policy:
The Company has never declared or paid any cash dividends on its capital stock. The Company currently intends to retain all available earnings for use in its business operations and does not anticipate paying any cash dividends in the foreseeable future. Furthermore, the credit agreements governing our Term Loan and our ABL Facility and the indenture that governs the Notes contain restrictions that limit our ability to pay dividends.
Issuer Sales of Unregistered Securities During the Past Three Years:
None
Comparative Stock Performance
The following graph compares the cumulative total shareholder return on the common stock of Entegris, Inc. from December 31,
2010
through December 31,
2015
with cumulative total return of (1) The NASDAQ Composite Index (NASDAQ), and (2) The Philadelphia Semiconductor Index, assuming $100 was invested at the close of trading December 31, 2010 in Entegris, Inc. common stock, the NASDAQ Composite Index and the Philadelphia Semiconductor Index and that all dividends are reinvested.
30
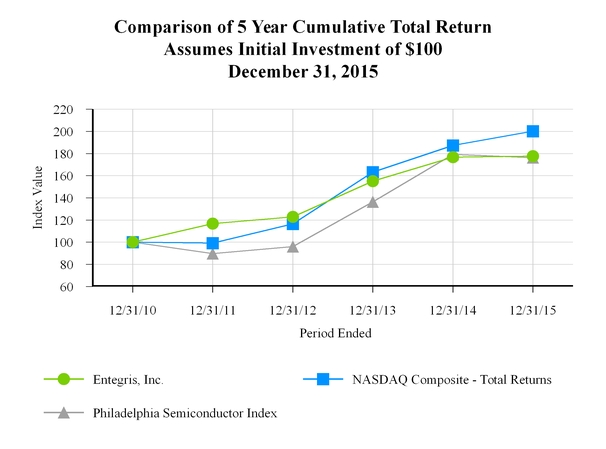
|
December 31,
2010
|
December 31,
2011
|
December 31,
2012
|
December 31,
2013
|
December 31,
2014
|
December 31,
2015
|
||||||
|
Entegris, Inc.
|
$100.00
|
$116.87
|
$122.89
|
$155.15
|
$176.84
|
$177.64
|
|||||
|
NASDAQ Composite
|
100.00
|
99.17
|
116.48
|
163.21
|
187.27
|
200.31
|
|||||
|
Philadelphia Semiconductor Index
|
100.00
|
89.63
|
96.08
|
136.28
|
179.15
|
176.25
|
|||||
Issuer Purchases of Equity Securities:
The Company repurchased none of its common stock in
2015
.
On February 5, 2016, the Company’s Board of Directors authorized a repurchase program covering up to an aggregate of
$100 million
of the Company’s common stock in open market transactions and in accordance with one or more pre-arranged stock trading plans to be established in accordance with Rule 10b5-1 under the Securities Exchange Act of 1934, as amended. The authorization expires February 17, 2017.
The table that follows presents selected financial data for each of the last five years from the Company’s consolidated financial statements and should be read in conjunction with the Company’s Consolidated Financial Statements and the related Notes and with “Management’s Discussion and Analysis of Financial Condition and Results of Operations” included elsewhere in this Annual Report on Form 10-K. The selected financial data set forth below as of December 31,
2015
and
2014
and for the years ended December 31,
2015
,
2014
and
2013
are derived from our audited financial statements included in this Annual Report on Form 10-K. All other selected financial data set forth below is derived from our audited financial statements not included in this Annual Report on Form 10-K. The selected financial data set forth below as of December 31,
2015
and 2014 and for the years ended December 31,
2015
and 2014 include the results of operations of ATMI, Inc. since April 30, 2014. Our historical results are not necessarily indicative of our results of operations to be expected in the future.
31
|
(In thousands, except per share amounts)
|
Year ended December 31, 2015
|
Year ended December 31, 2014
|
Year ended December 31, 2013
|
Year ended December 31, 2012
|
Year ended December 31, 2011
|
||||||||||||||
|
Operating Results
|
|||||||||||||||||||
|
Net sales
|
$
|
1,081,121
|
|
$
|
962,069
|
|
$
|
693,459
|
|
$
|
715,903
|
|
$
|
749,259
|
|
||||
|
Gross profit
|
470,231
|
|
376,683
|
|
294,214
|
|
307,383
|
|
325,930
|
|
|||||||||
|
Selling, general and administrative expenses
|
198,914
|
|
231,833
|
|
137,123
|
|
147,405
|
|
140,847
|
|
|||||||||
|
Engineering, research and development expenses
|
105,900
|
|
87,711
|
|
55,320
|
|
50,940
|
|
47,980
|
|
|||||||||
|
Amortization of intangible assets
|
47,349
|
|
37,067
|
|
9,347
|
|
9,594
|
|
10,225
|
|
|||||||||
|
Contingent consideration fair value adjustment
|
—
|
|
(1,282
|
)
|
(1,813
|
)
|
—
|
|
—
|
|
|||||||||
|
Operating income
|
118,068
|
|
21,354
|
|
94,237
|
|
99,444
|
|
126,878
|
|
|||||||||
|
Income (loss) before income taxes and equity in affiliate net income (loss)
|
92,185
|
|
(13,392
|
)
|
96,195
|
|
99,703
|
|
127,964
|
|
|||||||||
|
Income tax expense (benefit)
|
10,202
|
|
(21,572
|
)
|
21,669
|
|
30,881
|
|
4,217
|
|
|||||||||
|
Net income
|
80,296
|
|
7,887
|
|
74,526
|
|
68,825
|
|
124,246
|
|
|||||||||
|
Net income attributable to Entegris, Inc.
|
80,296
|
|
7,887
|
|
74,526
|
|
68,825
|
|
123,846
|
|
|||||||||
|
Earnings Per Share Data
|
|||||||||||||||||||
|
Diluted earnings per share
|
$
|
0.57
|
|
$
|
0.06
|
|
$
|
0.53
|
|
$
|
0.50
|
|
$
|
0.91
|
|
||||
|
Weighted average shares outstanding – diluted
|
141,121
|
|
140,062
|
|
139,618
|
|
138,412
|
|
136,223
|
|
|||||||||
|
Operating Ratios – % of net sales
|
|||||||||||||||||||
|
Gross profit
|
43.5
|
%
|
39.2
|
%
|
42.4
|
%
|
42.9
|
%
|
43.5
|
%
|
|||||||||
|
Selling, general and administrative expenses
|
18.4
|
|
24.1
|
|
19.8
|
|
20.6
|
|
18.8
|
|
|||||||||
|
Engineering, research and development expenses
|
9.8
|
|
9.1
|
|
8.0
|
|
7.1
|
|
6.4
|
|
|||||||||
|
Amortization of intangible assets
|
4.4
|
|
3.9
|
|
1.3
|
|
1.3
|
|
1.4
|
|
|||||||||
|
Contingent consideration fair value adjustment
|
—
|
|
(0.1
|
)
|
—
|
|
—
|
|
—
|
|
|||||||||
|
Operating income
|
10.9
|
|
2.2
|
|
13.6
|
|
13.9
|
|
16.9
|
|
|||||||||
|
Income (loss) before income taxes and equity in affiliate net income (loss)
|
8.5
|
|
(1.4
|
)
|
13.9
|
|
13.9
|
|
17.1
|
|
|||||||||
|
Effective tax rate
|
11.1
|
|
161.1
|
|
22.5
|
|
31.0
|
|
3.3
|
|
|||||||||
|
Net income attributable to Entegris, Inc.
|
7.4
|
|
0.8
|
|
10.7
|
|
9.6
|
|
16.5
|
|
|||||||||
|
Cash Flow Statement Data
|
|||||||||||||||||||
|
Depreciation and amortization
|
$
|
101,654
|
|
$
|
83,704
|
|
$
|
38,815
|
|
$
|
37,607
|
|
$
|
37,064
|
|
||||
|
Capital expenditures
|
71,977
|
|
57,733
|
|
60,360
|
|
49,929
|
|
30,267
|
|
|||||||||
|
Net cash provided by operating activities
|
120,918
|
|
126,423
|
|
109,402
|
|
115,162
|
|
157,286
|
|
|||||||||
|
Net cash used in investing activities
|
(63,638
|
)
|
(860,295
|
)
|
(47,029
|
)
|
(72,467
|
)
|
(28,431
|
)
|
|||||||||
|
Net cash (used in) provided by financing activities
|
(92,787
|
)
|
747,648
|
|
(3,895
|
)
|
10,890
|
|
10,864
|
|
|||||||||
|
Balance Sheet and Other Data
|
|||||||||||||||||||
|
Current assets
|
$
|
710,762
|
|
$
|
765,655
|
|
$
|
612,305
|
|
$
|
579,324
|
|
$
|
502,999
|
|
||||
|
Current liabilities
|
175,550
|
|
262,520
|
|
97,585
|
|
93,263
|
|
92,594
|
|
|||||||||
|
Working capital
|
535,212
|
|
503,135
|
|
514,720
|
|
486,061
|
|
410,405
|
|
|||||||||
|
Current ratio
|
4.05
|
|
2.92
|
|
6.27
|
|
6.21
|
|
5.43
|
|
|||||||||
|
Long-term debt, including current maturities
|
667,287
|
|
766,796
|
|
—
|
|
—
|
|
—
|
|
|||||||||
|
Shareholders’ equity
|
802,883
|
|
748,441
|
|
756,843
|
|
694,799
|
|
608,238
|
|
|||||||||
|
Total assets
|
1,657,940
|
|
1,762,091
|
|
875,294
|
|
811,544
|
|
724,663
|
|
|||||||||
|
Return on average shareholders’ equity – %
|
10.4
|
%
|
1.0
|
%
|
10.3
|
%
|
10.6
|
%
|
23.2
|
%
|
|||||||||
|
Shares outstanding at end of year
|
140,716
|
|
139,793
|
|
138,734
|
|
138,458
|
|
135,821
|
|
|||||||||
32
The following discussion and analysis of the Company’s consolidated financial condition and results of operations should be read along with the consolidated financial statements and the accompanying notes to the consolidated financial information included elsewhere in this Annual Report on Form 10-K. This discussion contains forward-looking statements that involve numerous risks and uncertainties, including, but not limited to, those described in the “Cautionary Statements” sections of this Item 7 below. The Company’s actual results may differ materially from those contained in any forward-looking statements. You should review the Item 1A “Risk Factors” of this Annual Report on Form 10-K for a discussion of important factors that could cause actual results to differ materially from the results described in or implied by the forward-looking statements contained in the following discussion and analysis.
Cautionary Statements
This Annual Report on Form 10-K and the documents incorporated by reference in this Annual Report on Form 10-K contain “forward-looking statements” within the meaning of the Private Securities Litigation Reform Act of 1995. The information in this Management’s Discussion and Analysis of Financial Condition and Results of Operations, except for the historical information, contains forward-looking statements. These forward-looking statements reflect the Company’s current views with respect to future events and financial performance. The words “believe,” “expect,” “anticipate,” “intend,” “estimate,” “forecast,” “project,” “may,” "will,” “would,” “could,” “should” and similar expressions are intended to identify these “forward-looking statements.” You should read statements that contain these words carefully because they discuss future expectations, contain projections of future results of operations or of financial position or state other “forward-looking” information. All forecasts and projections in this report are “forward-looking statements,” and are based on management’s current expectations of the Company’s near-term results, based on current information available pertaining to the Company. The important factors listed below, as well as any cautionary language elsewhere in this Annual Report on Form 10-K, provide examples of risks, uncertainties and events that may cause our actual results to differ materially from the expectations described in these forward-looking statements. The risks which could cause actual results to differ from those contained in such “forward looking statements” include, without limitation, the risks described under Item 1A of this Annual Report on Form 10-K for the year ended December 31,
2015
under the headings “Risks Relating to our Business and Industry,” “Risks Related to our Indebtedness,” “Manufacturing Risks,” “International Risks” and “Risks Related to Owning Our Common Stock” as well as in the Company’s quarterly reports on Form 10-Q and current reports on Form 8-K as filed with the Securities and Exchange Commission. Any forward-looking statements in this Annual Report on Form 10-K are not guarantees of future performance, and actual results, developments and business decisions may differ from those envisaged by such forward-looking statements, possibly materially. We disclaim any duty to update any forward-looking statements.
Overview
This overview is not a complete discussion of the Company’s financial condition, changes in financial condition and results of operations; it is intended merely to facilitate an understanding of the most salient aspects of its financial condition and operating performance and to provide a context for the detailed discussion and analysis that follows and must be read in its entirety in order to fully understand the Company’s financial condition and results of operations.
The Company is a leading provider of a wide range of products and services for purifying, protecting and transporting the critical materials used in processing and manufacturing in the microelectronics and other high-technology industries. Entegris derives most of its revenue from the sale of products and services to the semiconductor and related industries. The Company’s customers consist primarily of semiconductor manufacturers, semiconductor equipment and materials suppliers as well as thin film transistor-liquid crystal display (TFT-LCD) and hard disk manufacturers, which are served through direct sales efforts, as well as sales and distribution relationships, in the United States, Asia, Europe and the Middle East.
The Company offers a diverse product portfolio which includes more than
20,000
standard and customized products that it believes provide the most comprehensive offering of contamination control solutions and microenvironment products and services to maintain the purity and integrity of critical materials used by the semiconductor and other high-technology industries. Certain of these products are unit-driven and consumable products that rely on the level of semiconductor manufacturing activity to drive growth, while others are capital-expenditure driven and rely on expansion of manufacturing capacity to drive growth. The Company’s unit-driven and consumable products includes membrane-based liquid filters and housings, metal-based gas filters, resin-based gas purifiers, wafer shippers, disk-shipping containers and test assembly and packaging products and consumable graphite and silicon carbide components used in plasma etch, ion implant and chemical vapor deposition processes in semiconductor manufacturing. The Company’s capital expense-driven products include components, systems and subsystems that use electro-mechanical, pressure differential and related technologies to permit semiconductor and other electronics manufacturers to monitor and control the flow and condition of process liquids used in these manufacturing processes, and process carriers that protect the integrity of in-process wafers.
33
Key operating factors
Key factors, which management believes have the largest impact on the overall results of operations of the Company, include:
|
•
|
Level of sales
Since a significant portion of the Company’s product costs (except for raw materials, purchased components and direct labor) are largely fixed in the short-to-medium term, an increase or decrease in sales affects gross profits and overall profitability significantly. Also, increases or decreases in sales and operating profitability affect certain costs such as incentive compensation and commissions, which are highly variable in nature. The Company’s sales are subject to the effects of industry cyclicality, technological change, substantial competition, pricing pressures and foreign currency fluctuation.
|
|
•
|
Variable margin on sales
The Company’s variable margin on sales is determined by selling prices and the costs of manufacturing and raw materials. This is affected by a number of factors, which include the Company’s sales mix, purchase prices of raw material (especially polymers, membranes, stainless steel and purchased components), competition, both domestic and international, direct labor costs, and the efficiency of the Company’s production operations, among others.
|
|
•
|
Fixed cost structure
The Company’s operations include a number of large fixed or semi-fixed cost components, which include salaries, indirect labor and benefits, facility costs, lease expense, and depreciation and amortization. It is not possible to vary these costs easily in the short-term as volumes fluctuate. Accordingly, increases or decreases in sales volume can have a large effect on the usage and productivity of these cost components, resulting in a large impact on the Company’s profitability.
|
Overall Summary of Financial Results for the Year Ended December 31,
2015
Total net sales for the year ended December 31,
2015
were
$1,081.1 million
, up
$119 million
, or
12%
, from sales of
$962.1 million
for the year ended December 31,
2014
. This sales improvement was principally driven by the inclusion of the incremental sales of $120.3 million through April 2015 of ATMI, Inc. (ATMI), which the Company acquired on April 30, 2014.
Exclusive of the effect of the added ATMI sales and unfavorable foreign currency translation effects of
$32.7 million
, the Company's sales increased
3%
, reflecting an increase in overall demand from the Company's semiconductor industry customers, particularly an increase in the sale of specialty materials products. The Company believes this sales increase was primarily volume driven and that the effect of selling price erosion was nominal. Overall demand from the semiconductor industry reflected the following factors: slightly improved demand from device makers, as wafer starts and semiconductor unit production increased; higher industry fab utilization rates; and increased capital spending levels. Based on the information available, the Company believes sales of its products exceeded semiconductor industry growth measures for
2015
.
The Company's gross profit rose by $
93.5 million
for the year ended December 31,
2015
, to
$470.2 million
, up from
$376.7 million
for the year ended December 31,
2014
. Accordingly, the Company reported a
43.5%
gross margin rate compared to
39.2%
in 2013. The gross profit and gross margin figures in 2014 included a
$48.6 million
charge for fair value write-up of acquired ATMI inventory sold during that year. Excluding that charge, the Company's gross margin for 2014 was
44.2%
.
The Company's selling, general and administrative (SG&A) expenses fell in
2015
, mainly due to absence of the ATMI merger-related expenditures incurred in 2014 and a reduction in integration costs recorded in
2015
compared to a year earlier.
As a result of the aforementioned and other factors discussed below, net income for
2015
was
$80.3 million
, or
$0.57
per diluted share, compared to net income of
$7.9 million
, or
$0.06
per diluted share, in
2014
.
During
2015
, the Company’s operating activities provided cash flow of
$121 million
. Cash and cash equivalents, and short-term investments were
$352 million
at December 31,
2015
compared with
$394 million
at December 31,
2014
. The Company had long-term borrowings, including current maturities, of
$667 million
at December 31,
2015
compared with
$767 million
at December 31, 2014.
Critical Accounting Policies
Management’s discussion and analysis of financial condition and results of operations are based upon the Company’s consolidated financial statements, which have been prepared in accordance with accounting principles generally accepted in the United States. The preparation of these consolidated financial statements requires the Company to make estimates, assumptions and judgments that affect the reported amounts of assets, liabilities, revenues and expenses and related disclosure of contingent assets and liabilities. At each balance sheet date, management evaluates its estimates, including, but not limited to, those related to inventories, long-lived assets (property, plant and equipment, goodwill and identified intangibles), income taxes and business
34
combinations. The Company bases its estimates on historical experience and various other assumptions that are believed to be reasonable under the circumstances. If management made different judgments or utilized different estimates, this could result in material differences in the amount and timing of the Company’s results of operations for any period. In addition, actual results could be different from the Company’s current estimates, possibly resulting in increased future charges to earnings.
The critical accounting policies affected most significantly by estimates, assumptions and judgments used in the preparation of the Company’s consolidated financial statements are discussed below.
Inventory Valuation
The Company uses certain estimates and judgments to properly value its inventory. The Company’s inventories are recorded at the lower of cost or net realizable value. The Company evaluates its ending inventories for obsolescence and excess quantities each quarter. This evaluation includes analyses of inventory levels, historical write-off trends, expected product lives, and historical and projected sales levels by product. Inventories that are considered obsolete are written off or a full allowance is recorded. In addition, allowances are established for inventory quantities in excess of forecasted demand. Inventory allowances were
$13.2 million
and
$11.9 million
at December 31,
2015
and
2014
, respectively.
The Company’s inventories include materials and products subject to technological obsolescence, which are sold in highly competitive industries. If future demand or market conditions are less favorable than current conditions or the Company’s projected outlook for sales, inventory write-downs or additional allowances may be required and would be reflected in cost of sales in the period the revision is made.
Impairment of Long-Lived Assets
As of December 31,
2015
, the Company had
$321.3 million
of net property, plant and equipment and
$258.9 million
of net intangible assets. The Company routinely considers whether indicators of impairment of the value of its long-lived assets, particularly its manufacturing equipment, and its intangible assets, are present. A long-lived asset (asset group) shall be tested for recoverability whenever events or changes in circumstances (triggering events) indicate that its carrying amount may not be recoverable. The following are examples of such events or changes in circumstances:
|
a.
|
A significant decrease in the market price of a long-lived asset (asset group)
|
|
b.
|
A significant adverse change in the extent or manner in which a long-lived asset (asset group) is being used or in its physical condition
|
|
c.
|
A significant adverse change in legal factors or in the business climate that could affect the value of a long-lived asset (asset group), including an adverse action or assessment by a regulator
|
|
d.
|
An accumulation of costs significantly in excess of the amount originally expected for the acquisition or construction of a long-lived asset (asset group)
|
|
e.
|
A current-period operating or cash flow loss combined with a history of operating or cash flow losses or a projection or forecast that demonstrates continuing losses associated with the use of a long-lived asset (asset group)
|
|
f.
|
A current expectation that, more likely than not, a long-lived asset (asset group) will be sold or otherwise disposed of significantly before the end of its previously estimated useful life.
|
If such indicators are present, it is determined whether the sum of the estimated undiscounted cash flows attributable to the asset group in question is less than its carrying value. If less, an impairment loss is recognized based on the excess of the carrying amount of the assets in the group over its respective fair value. Fair value is determined by discounting estimated future cash flows, appraisals or other methods deemed appropriate. If the asset groups determined to be impaired are to be held and used, the Company recognizes an impairment charge to the extent the fair value attributable to the asset group is less than the assets’ carrying value. The fair value of the assets then becomes the assets’ new carrying value, which is depreciated or amortized over the remaining estimated useful life of the assets.
The Company’s long-lived assets are grouped with other assets and liabilities at the lowest level (asset groups) for which the identifiable cash flows are largely independent of the cash flows of other assets and liabilities. As described above, the evaluation of the recoverability of long-lived assets requires the Company to make significant estimates and assumptions. These estimates and assumptions primarily include, but are not limited to, the identification of the asset group at the lowest level of independent cash flows, the primary asset of the group and long-range forecasts of revenue and costs, reflecting management’s assessment of general economic and industry conditions, operating income, depreciation and amortization and working capital requirements.
Due to the inherent uncertainty involved in making estimates, actual results could differ from those estimates. In addition, changes in the underlying assumptions would have a significant impact on the conclusion that an asset group’s carrying value is recoverable, or the determination of any impairment charge if it was determined that the asset values were indeed impaired.
35
Based on current general economic conditions and trends within the semiconductor industry and the absence of any other triggering events, the Company has not been required to perform impairment testing for any of its asset groups. The Company will continue to monitor circumstances and events to determine whether asset impairment testing is warranted. It is possible that in the future the Company may no longer be able to conclude that there is no impairment of its long-lived assets, nor can the Company provide assurance that material impairment charges of long-lived assets will not occur in future periods.
Goodwill
The Company tests goodwill at least annually for impairment. Goodwill is also tested for impairment as changes in circumstances occur indicating that the carrying value may not be recoverable. Goodwill impairment testing requires a comparison of the fair value of each reporting unit to the carrying value. If the carrying value of the reporting unit exceeds fair value, goodwill is considered impaired. At December 31,
2015
, the Company had seven reporting units, four of which are assigned goodwill.
As of August 31, 2015, the Company’s annual testing date, the Company had four reporting units assigned goodwill. At that date, the estimated fair value of the reporting units assigned goodwill in prior years was in excess of their respective carrying values. While the Company believes the estimates and assumptions used in determining the fair value of its reporting units are reasonable, significant changes in estimates of future cash flows, such as those caused by unforeseen events or changes in market conditions, could materially impact the fair value of a reporting unit which could result in the recognition of a goodwill impairment charge.
Income Taxes
In the preparation of the Company’s financial statements, the income tax expense, deferred tax assets and liabilities, and reserves for unrecognized tax benefits reflect management’s best assessment of estimated current and future taxes to be paid. The Company is subject to income taxes in both the United States and numerous foreign jurisdictions. Significant judgments and estimates are required in determining consolidated income tax expense.
Deferred income taxes arise from temporary differences between the tax basis of assets and liabilities and their reported amounts in the financial statements, which will result in taxable or deductible amounts in the future. In evaluating the Company’s ability to recover its deferred tax assets within the jurisdiction from which they arise, management considers all available positive and negative evidence, including scheduled reversals of deferred tax liabilities, projected future taxable income, tax-planning strategies, and results of recent operations. In projecting future taxable income, the Company begins with historical results adjusted for the results of discontinued operations and incorporates assumptions about the amount of future state, federal and foreign pretax operating income adjusted for items that do not have tax consequences. The assumptions about future taxable income require significant judgment and are consistent with the plans and estimates management is using to manage the underlying business. In evaluating the objective evidence that historical results provide, the Company considers three years of cumulative operating income.
The Company has deferred tax assets related to certain federal and state credit carryforwards, and foreign net operating loss carryforwards of
$17.0 million
and
$15.3 million
as of December 31,
2015
and
2014
, respectively. Management believes it is more likely than not that the benefit from a portion of these carryforwards will not be realized. In recognition of this risk, the Company provided a valuation allowance of
$12.7 million
and
$11.1 million
as of December 31,
2015
and
2014
, respectively, relating to these carryforwards. If the Company’s assumptions change and it determines it will be able to realize these carryforwards, the tax benefits relating to any reversal of the valuation allowance on the deferred tax assets will be recognized as a reduction of income tax expense.
The calculation of tax liabilities involves dealing with uncertainties in the application of complex tax laws and regulations in a multitude of jurisdictions across our global operations. A tax benefit from an uncertain tax position may be recognized when it is more likely than not that the position will be sustained upon examination, including resolutions of any related appeals or litigation processes, on the basis of the technical merits. Resolution of these uncertainties in a manner inconsistent with management’s expectations could have a material impact on the Company’s financial condition and operating results.
Business Acquisitions
The Company accounts for acquired businesses using the acquisition method of accounting which requires that the assets acquired and liabilities assumed be recorded at the date of acquisition at their respective fair values. The judgments made in determining the estimated fair value assigned to each class of assets acquired and liabilities assumed, as well as asset lives, can materially impact net income. Accordingly, for significant items, the Company typically obtains assistance from a third-party valuation firm.
There are several methods that can be used to determine the fair value of assets acquired and liabilities assumed in a business combination. For intangible assets, the Company normally utilizes the “income method.” This method starts with a forecast of all of the expected future net cash flows attributable to the subject intangible asset. These cash flows are then adjusted to present value by applying an appropriate discount rate that reflects the risk factors associated with the cash flow streams. Some of the more significant estimates and assumptions inherent in the income method (or
36
other methods) include the projected future cash flows (including timing) and the discount rate reflecting the risks inherent in the future cash flows.
Estimating the useful life of an intangible asset also requires judgment. For example, different types of intangible assets will have different useful lives, influenced by the nature of the asset, competitive environment, and rate of change in the industry. Certain assets may even be considered to have indefinite useful lives. All of these judgments and estimates can significantly impact the determination of the amortization period of the intangible asset, and thus net income.
Results of Operations
Year ended December 31,
2015
compared to year ended December 31,
2014
The following table sets forth the results of operations and the relationship between various components of operations, stated as a percent of net sales, for the years ended December 31,
2015
and
2014
. The Company’s historical financial data was derived from its consolidated financial statements and related notes included elsewhere in this annual report.
|
(Dollars in thousands)
|
2015
|
2014
|
|||||||||||
|
|
% of net sales
|
|
% of net sales
|
||||||||||
|
Net sales
|
$
|
1,081,121
|
|
100.0
|
%
|
$
|
962,069
|
|
100.0
|
%
|
|||
|
Cost of sales
|
610,890
|
|
56.5
|
|
585,386
|
|
60.8
|
|
|||||
|
Gross profit
|
470,231
|
|
43.5
|
|
376,683
|
|
39.2
|
|
|||||
|
Selling, general and administrative expenses
|
198,914
|
|
18.4
|
|
231,833
|
|
24.1
|
|
|||||
|
Engineering, research and development expenses
|
105,900
|
|
9.8
|
|
87,711
|
|
9.1
|
|
|||||
|
Amortization of intangible assets
|
47,349
|
|
4.4
|
|
37,067
|
|
3.9
|
|
|||||
|
Contingent consideration fair value adjustment
|
—
|
|
—
|
|
(1,282
|
)
|
(0.1
|
)
|
|||||
|
Operating income
|
118,068
|
|
10.9
|
|
21,354
|
|
2.2
|
|
|||||
|
Interest expense
|
38,667
|
|
3.6
|
|
33,355
|
|
3.5
|
|
|||||
|
Interest income
|
(429
|
)
|
—
|
|
(1,336
|
)
|
(0.1
|
)
|
|||||
|
Other (income) expense, net
|
(12,355
|
)
|
(1.1
|
)
|
2,727
|
|
0.3
|
|
|||||
|
Income (loss) before income taxes and equity in net loss of affiliate
|
92,185
|
|
8.5
|
|
(13,392
|
)
|
(1.4
|
)
|
|||||
|
Income tax expense (benefit)
|
10,202
|
|
0.9
|
|
(21,572
|
)
|
(2.2
|
)
|
|||||
|
Equity in net loss of affiliates
|
1,687
|
|
0.2
|
|
293
|
|
—
|
|
|||||
|
Net income
|
$
|
80,296
|
|
7.4
|
|
$
|
7,887
|
|
0.8
|
|
|||
Net sales
For the year ended December 31,
2015
, net sales were
$1,081.1 million
, up
$119.1 million
, or
12%
, from sales for the year ended December 31,
2014
. An analysis of the factors underlying the increase in net sales is presented in the following table:
|
(In thousands)
|
|||
|
Net sales in 2014
|
$
|
962,069
|
|
|
Organic growth associated with volume and pricing
|
31,375
|
|
|
|
Decrease associated with effect of foreign currency translation
|
(32,665
|
)
|
|
|
Incremental sales associated with acquisition of ATMI, Inc
|
120,342
|
|
|
|
Net sales in 2015
|
$
|
1,081,121
|
|
The inclusion of incremental ATMI sales is the key factor underlying the increase. Partly offsetting this is an unfavorable foreign currency translation effects of
$32.7 million
related to the year-over-year weakening of most international currencies versus the U.S. dollar, most notably the Japanese yen, Taiwanese dollar, Korean won and Euro.
Exclusive of those factors, the Company's sales grew
3%
in
2015
when compared to
2014
, reflecting an increase in overall demand from the Company's semiconductor industry customers, particularly an increase in the sale of specialty materials products. The Company believes this sales increase was primarily volume driven and that the effect of selling price erosion was nominal. Overall demand from the semiconductor industry reflected the following factors: slightly improved demand from
37
device makers, as wafer starts and semiconductor unit production increased; higher industry fab utilization rates; and increased capital spending levels. Based on the information available, the Company believes sales of its products exceeded industry growth measures for
2015
.
On a geographic basis, total sales to North America were
23%
, Asia Pacific
55%
, Europe
10%
and Japan
12%
in
2015
. Total sales to North America were
25%
, Asia Pacific
51%
, Europe
11%
and Japan
13%
in
2014
. When comparing
2015
to
2014
, all regions experienced year-over-year sales increases, primarily reflecting the incremental ATMI sales. Net sales to customers in North America, Japan, and Asia Pacific increased
5%
,
8%
, and
20%
, respectively, and Europe decreased
3%
from
2014
to
2015
, generally due to the the inclusion of incremental sales from ATMI. Net sales for Japan were affected by unfavorable foreign currency translation effects of
$32.7 million
.
Demand drivers for the Company’s business primarily consist of semiconductor fab utilization and production (unit-driven) as well as capital spending for new or upgraded semiconductor fabrication equipment and facilities (capital-driven). The Company analyzes sales of its products by these two key drivers. Sales of unit-driven products represented
78%
of total sales and sales of capital-driven products represented
22%
of total sales in
2015
. This compares to a unit-driven to capital-driven ratio of
74%
:
26%
for
2014
. The shift toward unit-driven products reflects the inclusion of sales from ATMI, which are primarily unit-driven.
Gross profit
Gross profit for
2015
increased by
$93.5 million
, to
$470.2 million
, an increase of
25%
from
$376.7 million
for
2014
. The gross margin rate for
2015
was
43.5%
versus
39.2%
for
2014
. An analysis of the factors underlying the increase in gross profit is presented in the following table:
|
(In thousands)
|
|||
|
Gross profit in 2014
|
$
|
376,683
|
|
|
Charge for fair value mark-up of inventory sold in 2014
|
48,586
|
|
|
|
Increase associated with incremental ATMI net sales
|
59,854
|
|
|
|
Other
|
(14,892
|
)
|
|
|
Gross profit in 2015
|
$
|
470,231
|
|
The gross profit and gross margin improvements primarily reflect the inclusion of four additional months of sales from ATMI and the absence of the incremental cost of sales charges of $48.6 million recorded in the second and third quarters of
2014
associated with the sale of inventory acquired in the acquisition with ATMI. Excluding the latter item, the Company's gross margin in
2014
was
44.2%
. When compared to the adjusted gross margin for 2014, the 2015 gross margin decline relates to a slightly unfavorable sales mix, higher warranty costs, unfavorable foreign currency translation effects and lower levels of factory utilization, particularly in the latter half of the year, offset in part by the benefit of the Company's organic sales growth.
Selling, general and administrative expenses
Selling, general and administrative expense (SG&A) consists primarily of payroll and related expenses for the sales and administrative staff, professional fees (including accounting, legal and technology costs and expenses), and sales and marketing costs. Selling, general and administrative (SG&A) expenses for
2015
decreased
$32.9 million
, or
14%
, to
$198.9 million
from
$231.8 million
in
2014
. SG&A expenses, as a percent of net sales, decreased to
18.4%
from
24.1%
a year earlier, reflecting the significant decrease in SG&A expenditure levels due to the absence of ATMI merger costs and a reduction in integration expenditures.
An analysis of the factors underlying the decrease in SG&A is presented in the following table:
|
(In thousands)
|
|||
|
Selling, general and administrative expenses in 2014
|
$
|
231,833
|
|
|
Increase associated with ATMI infrastructure
|
15,383
|
|
|
|
Transaction-related costs incurred in 2014
|
(26,776
|
)
|
|
|
Deal costs incurred in 2014
|
(9,125
|
)
|
|
|
Decrease in integration costs
|
(6,985
|
)
|
|
|
Other decreases, net
|
(5,416
|
)
|
|
|
Selling, general and administrative expenses in 2015
|
$
|
198,914
|
|
Engineering, research and development expenses
Engineering, research and development (ER&D) expenses related to the support of current product lines and the development of new products and manufacturing technologies increased by
$18.2 million
, or
21%
, to
$105.9 million
in
2015
compared to
38
$87.7 million
in
2014
. ER&D expenses as a percent of net sales were
9.8%
compared to
9.1%
a year ago, reflecting the increase in ER&D expenditure levels, offset by the increase in net sales.
Incremental ER&D expenses of $12.7 million reflecting the inclusion of four additional months of operations at ATMI account for approximately 70% of the increase. The increase for the year December 31,
2015
also reflect higher legacy Entegris ER&D activity levels, including increased employee costs, and customer samples and supplies expense.
The Company’s overall ER&D efforts will continue to focus on the support or extension of current product lines, and the development of its technologies to create differentiated and high-value, unit-driven products for the most advanced and demanding semiconductor applications. The Company expects ER&D costs to stay relatively stable as a percentage of net sales.
Contingent consideration fair value adjustment
In the year ended December 31,
2014
, the Company recognized an acquisition-related contingent consideration adjustment of $1.3 million reflecting a change in the fair value of the contingent consideration liability associated with the Jetalon acquisition described in note 2 in the Company’s consolidated financial statements.
Amortization of intangible assets
Amortization of intangible assets was
$47.3 million
in
2015
compared to
$37.1 million
for
2014
. The increase reflects the additional amortization associated with the identifiable intangible assets acquired in the ATMI merger.
Interest expense
Interest expense was
$38.7 million
and
$33.4 million
in the years ended December 31,
2015
and
2014
. Interest expense includes interest associated with debt outstanding issued to help fund the acquisition of ATMI in 2014 and the amortization of debt issuance costs associated with such borrowings. In addition, bridge financing costs of $4.0 million related to the acquisition of ATMI were recorded in the second quarter of 2014.
The increase in
2015
reflects a full year's interest in 2015 compared to eight months' interest in 2014, offset in part by the absence of the aforementioned bridge financing costs included in
2014
.
Other (income) expense, net
Other income, net, was
$12.4 million
in
2015
compared to other expense, net, of
$2.7 million
in
2014
.
In
2015
, other income, net, included foreign currency transaction gains of $9.1 million and a gain of $3.4 million related to the sale of an equity investment.
In
2014
, other expense includes foreign currency transaction losses of $1.1 million and an impairment loss of $1.9 million recorded in connection with an equity investment, partially offset by $0.2 million in net realized gains on the sale of equity investments.
Income tax expense (benefit)
The Company recorded income tax expense of
$10.2 million
in
2015
compared to an income tax benefit of
$21.6 million
in
2014
. The Company’s effective tax expense rate was
11.1%
in
2015
, compared to an effective tax rate of
161.1%
in
2014
.
The change in the effective tax rate in
2015
from
2014
and the variance in both years from the U.S. statutory rate reflects several factors. The effective tax rates in both years reflects a greater concentration in the Company's geographic composition of income toward jurisdictions with lower tax rates. In addition, the
2014
effective tax rate reflects the benefit of a foreign dividend, net of the nondeductibility of certain acquisition-related expenditures.
Net income
Net income was
$80.3 million
, or
$0.57
per diluted share, in
2015
compared to net income of
$7.9 million
, or
$0.06
per diluted share, in
2014
. The significant improvement in operating results, described in greater detail above, mainly reflects the absence in
2015
of the significant costs recorded in connection with the acquisition of ATMI in
2014
.
Non-GAAP Measures Information
The Company’s consolidated financial statements are prepared in conformity with accounting principles generally accepted in the United States (GAAP). The Company also utilizes certain non-GAAP financial measures as a complement to financial measures provided in accordance with GAAP in order to better assess and reflect trends affecting the Company’s business and results of operations. See “Non-GAAP Information” included below in this section for additional detail, including the reconciliation of GAAP measures to the Company’s non-GAAP measures.
The Company’s non-GAAP financial measures are Adjusted EBITDA and Adjusted Operating Income, together with related measures thereof, and non-GAAP Earnings Per Share (EPS).
39
Adjusted EBITDA increased
12%
to
$232.4 million
in
2015
, compared to
$207.9 million
in
2014
. Adjusted EBITDA, as a percent of net sales, was
21.5%
in
2015
compared to
21.6%
in
2014
. Adjusted Operating Income increased
10%
to
$178.1 million
in
2015
, compared to
$161.3 million
in
2014
. Adjusted Operating Income, as a percent of net sales, was
16.5%
in
2015
compared to
16.8%
in
2014
. Non-GAAP Earnings Per Share increased
23%
to
$0.85
in
2015
, compared to
$0.69
in
2014
. The improvement in the Adjusted EBITDA and Adjusted Operating Income measures reflect the increase in net sales and related increase in gross profit. In addition, Non-GAAP Earnings Per Share was positively affected by a lower adjusted effective tax rate.
Segment Analysis
The Company reports its financial performance based on two reporting segments, Critical Materials Handling (CMH) and Electronic Materials (EM). The following is a discussion on the results of operations of these two business segments. See note 15 to the consolidated financial statements for additional information on the Company’s two segments.
The following table and discussion concern the results of operations of the Company’s two reportable segments for the years ended December 31,
2015
and
2014
.
|
(In thousands)
|
2015
|
2014
|
|||||
|
Critical Materials Handling
|
|||||||
|
Net sales
|
$
|
671,331
|
|
$
|
653,964
|
|
|
|
Segment profit
|
155,212
|
|
138,379
|
|
|||
|
Electronic Materials
|
|||||||
|
Net sales
|
$
|
409,790
|
|
$
|
308,105
|
|
|
|
Segment profit
|
94,653
|
|
90,121
|
|
|||
Critical Materials Handling (CMH)
For the year ended December 31,
2015
, CMH net sales increased
3%
to
$671.3 million
, from
$654.0 million
in
2014
. The increase primarily reflects the inclusion of incremental sales of $15.1 million from ATMI and an increase in sales of specialty materials products. Offsetting these factors were unfavorable foreign currency translation effects of approximately
$25.7 million
, related to the year-over-year weakening of most international currencies versus the U.S. dollar, and modest reductions in the sales of fluid management and liquid microcontamination control products.
CMH reported a segment profit of
$155.2 million
in
2015
, up
12%
from
$138.4 million
in
2014
. The increase in the CMH's profit in
2015
was due to higher sales and its associated slightly favorable sales mix and a
8%
decrease in operating expenses.
Electronic Materials (EM)
For the year ended December 31,
2015
, EM net sales increased to
$409.8 million
, up
33%
, from
$308.1 million
in the comparable period last year. The sales increase primarily reflects the inclusion of incremental sales of $105.3 million from ATMI. Offsetting the incremental ATMI sales were unfavorable foreign currency translation effects of approximately
$6.9 million
, related to the year-over-year weakening of most international currencies versus the U.S. dollar, and lightly lower sales of gas microcontamination control systems products.
EM reported a segment profit of
$94.7 million
for the year ended December 31,
2015
compared to a
$90.1 million
segment profit in the year-ago period. The increase in the EM's profit in
2015
reflects the incremental ATMI sales and related gross profit, offset by lower margins due to reduced plant utilization, particularly in the latter half of the year, and higher operating expenses.
Unallocated general and administrative expenses
Unallocated general and administrative expenses for the year ended December 31,
2015
totaled
$84.4 million
compared to
$122.8 million
for the year ended December 31,
2014
. The $38.3 million decline includes the absence of transaction-related costs of $26.8 million and deal costs of $9.1 million, as well as a decrease in integration expenses of $7.0 million. These items were offset by incremental ATMI infrastructure expenses of $6.4 million.
40
Results of Operations
Year ended December 31, 2014 compared to year ended December 31, 2013
The following table sets forth the results of operations and the relationship between various components of operations, stated as a percent of net sales, for the years ended December 31, 2014 and 2013. The Company’s historical financial data was derived from its consolidated financial statements and related notes included elsewhere in this annual report.
|
(Dollars in thousands)
|
2014
|
2013
|
|||||||||||
|
|
% of net sales
|
|
% of net sales
|
||||||||||
|
Net sales
|
$
|
962,069
|
|
100.0
|
%
|
$
|
693,459
|
|
100.0
|
%
|
|||
|
Cost of sales
|
585,386
|
|
60.8
|
|
399,245
|
|
57.6
|
|
|||||
|
Gross profit
|
376,683
|
|
39.2
|
|
294,214
|
|
42.4
|
|
|||||
|
Selling, general and administrative expenses
|
231,833
|
|
24.1
|
|
137,123
|
|
19.8
|
|
|||||
|
Engineering, research and development expenses
|
87,711
|
|
9.1
|
|
55,320
|
|
8.0
|
|
|||||
|
Amortization of intangible assets
|
37,067
|
|
3.9
|
|
9,347
|
|
1.3
|
|
|||||
|
Contingent consideration fair value adjustment
|
(1,282
|
)
|
(0.1
|
)
|
(1,813
|
)
|
(0.3
|
)
|
|||||
|
Operating income
|
21,354
|
|
2.2
|
|
94,237
|
|
13.6
|
|
|||||
|
Interest expense
|
33,355
|
|
3.5
|
|
153
|
|
—
|
|
|||||
|
Interest income
|
(1,336
|
)
|
(0.1
|
)
|
(317
|
)
|
—
|
|
|||||
|
Other (income) expense, net
|
2,727
|
|
0.3
|
|
(1,794
|
)
|
(0.3
|
)
|
|||||
|
Income (loss) before income tax (benefit) expense and equity in net loss of affiliates
|
(13,392
|
)
|
(1.4
|
)
|
96,195
|
|
13.9
|
|
|||||
|
Income tax (benefit) expense
|
(21,572
|
)
|
(2.2
|
)
|
21,669
|
|
3.1
|
|
|||||
|
Equity in net loss of affiliates
|
293
|
|
—
|
|
—
|
|
—
|
|
|||||
|
Net income
|
$
|
7,887
|
|
0.8
|
|
$
|
74,526
|
|
10.7
|
|
|||
Net sales
For the year ended December 31, 2014, net sales were $962.1 million, up $268.6 million, or 39%, from sales for the year ended December 31, 2013. An analysis of the factors underlying the increase in net sales is presented in the following table:
|
(In thousands)
|
2014
|
||
|
Net sales in 2013
|
$
|
693,459
|
|
|
Increase associated with legacy Entegris volume and pricing
|
30,733
|
|
|
|
Decrease associated with effect of foreign currency translation
|
(7.516
|
)
|
|
|
Increase associated with acquisition of ATMI
|
245,393
|
|
|
|
Net sales in 2014
|
$
|
962,069
|
|
The unfavorable foreign currency translation effects of $7.5 million related to the year-over-year weakening of most international currencies versus the U.S. dollar, most notably the Japanese yen and Taiwanese dollar, offset partly by a stronger Korean won.
Excluding the net sales of ATMI for the eight months subsequent to the ATMI merger and the unfavorable foreign currency translation effects, net sales rose approximately 4% in 2014 when compared to 2013. The Company believes this sales increase was primarily volume driven and that the effect of selling price erosion was nominal. Overall demand from the semiconductor industry reflected the following factors: improved demand from device makers, as wafer starts and semiconductor unit production increased; higher industry fab utilization rates; and increased capital spending levels. Based on the information available, the Company believes sales of its products trailed industry growth measures for 2014.
On a geographic basis, total sales to North America were 25%, Asia Pacific 51%, Europe 11% and Japan 13% in 2014. Total sales to North America were 29%, Asia Pacific 43%, Europe 13% and Japan 15% in 2013. When comparing 2014 to 2013, all regions experienced year-over-year sales increases, primarily reflecting the ATMI sales. Net sales to customers in North America, Japan, Asia Pacific and Europe increased 18%, 19%, 66% and 17%, respectively, from 2013 to 2014, generally due to the the inclusion of sales from ATMI. Net sales for Japan were affected by unfavorable foreign currency translation effects of $7.8 million.
41
Demand drivers for the Company’s business primarily consist of semiconductor fab utilization and production (unit-driven) as well as capital spending for new or upgraded semiconductor fabrication equipment and facilities (capital-driven). The Company analyzes sales of its products by these two key drivers. Sales of unit-driven products represented 74% of total sales and sales of capital-driven products represented 26% of total sales in 2014. This compares to a unit-driven to capital-driven ratio of 66%:34% for 2013. The shift toward unit-driven products reflects the inclusion of sales from ATMI, which are primarily unit-driven.
Gross profit
Gross profit for 2014 increased by $82.5 million, to $376.7 million, an increase of 28% from $294.2 million for 2013. The gross margin rate for 2014 was 39.2% versus 42.4% for 2013. An analysis of the factors underlying the increase in gross profit is presented in the following table:
|
(In thousands)
|
2014
|
||
|
Gross profit in 2013 (legacy Entegris only)
|
$
|
294,214
|
|
|
Incremental cost of sales associated with fair value step-up related to sale of inventory acquired in ATMI acquisition
|
(48,586
|
)
|
|
|
Increase associated with ATMI net sales
|
118,431
|
|
|
|
Increase associated with legacy Entegris volume and pricing
|
12,624
|
|
|
|
Gross profit in 2014
|
$
|
376,683
|
|
The increase in gross profit reflects the improvement in legacy Entegris sales and the inclusion of sales from ATMI. Despite the improvement in gross profit, the Company experienced a 39.2% gross margin rate compared to 42.4% in the comparable year-ago period. The gross margin percentage for 2014 was below the comparable year-ago figures primarily due to incremental cost of sales charge of $48.6 million associated with the sale of inventory acquired in the acquisition with ATMI. An inventory write-up of $48.6 million was recorded as part of the purchase price allocation and was amortized over the expected inventory turn of the acquired finished goods inventory. Excluding that charge, the Company's gross margin for the year ended December 31, 2014 was 44.2%. The adjusted gross margin rates exceeded the comparable year-ago figures mainly due to the increase in Company sales levels and, on average, higher margins for ATMI products.
Selling, general and administrative expenses
Selling, general and administrative expense (SG&A) consists primarily of payroll and related expenses for the sales and administrative staff, professional fees (including accounting, legal and technology costs and expenses), and sales and marketing costs. Selling, general and administrative (SG&A) expenses for 2014 increased $94.7 million, or 69%, to $231.8 million from $137.1 million in 2013. An analysis of the factors underlying the increase in SG&A is presented in the following table:
|
(In thousands)
|
2014
|
||
|
Selling, general and administrative expenses in 2013 (legacy Entegris only)
|
$
|
137,123
|
|
|
Increase associated with ATMI infrastructure
|
35,714
|
|
|
|
Increase in professional fees and other related to ATMI acquisition
|
8,152
|
|
|
|
Transaction-related expenses, including share-based compensation expense and related taxes associated with the unvested portion of ATMI share-based awards settled in cash
|
26,776
|
|
|
|
Integration expenditures
|
19,652
|
|
|
|
Other increases, net
|
4,416
|
|
|
|
Selling, general and administrative expenses in 2014
|
$
|
231,833
|
|
SG&A expenses, as a percent of net sales, increased to 24.1% from 19.8% a year earlier, reflecting the significant increase in SG&A expenditure levels primarily related ATMI merger and subsequent integration expenditures.
Expenses associated with ATMI, including certain merger-related expenses, amounted to $66.2 million, or about 70% of the increase. Included in these expenses were costs of $30.5 million related to the ATMI acquisition, specifically $21.3 million for share-based compensation expense and related taxes associated with the unvested portion of ATMI share-based awards settled in cash on the date of the acquisition, as well as integration costs of $9.2 million, consisting primarily of severance and retention costs. In addition, legacy Entegris incurred SG&A expenses of $24.5 million in merger-related expenses, including deal costs, severance and termination costs, and other costs associated with the integration of the two operations.
Engineering, research and development expenses
Engineering, research and development (ER&D) expenses related to the support of current product lines and the development of new products and manufacturing technologies increased by $32.4 million, or 59%, to $87.7 million in 2014 compared to $55.3 million in 2013. ER&D expenses as a percent of net sales were 9.1% compared to 8.0% a year ago, reflecting the
42
increase in ER&D expenditure levels, offset by the increase in net sales. In 2014, the Company continued to invest in its core membrane and coatings technologies to create differentiated and high-value, unit-driven products for the most advanced and demanding semiconductor applications.
ER&D expenses recorded by ATMI and included in the Company's consolidated financial statements amounted to $23.3 million, accounting for approximately 70% of the increase. The increase also reflect higher legacy Entegris ER&D activity levels, including increased employee costs, and customer samples and supplies expense of $6.0 million and $2.7 million for the year December 31, 2014.
Contingent consideration fair value adjustment
In the years ended December 31, 2014 and 2013, the Company recognized an acquisition-related contingent consideration adjustments of $1.3 million and $1.8 million, respectively, reflecting changes in the fair value of contingent consideration liability associated with the Jetalon acquisition described in note 2 in the Company’s consolidated financial statements. These adjustments to the contingent consideration liability reflect changes in Jetalon's revenue and gross profit forecasts for the three years ending December 31, 2015 and the estimated probability of achieving those projections.
Amortization of intangible assets
Amortization of intangible assets was $37.1 million in 2014 compared to $9.3 million for 2013. The increase reflected the additional amortization associated with the identifiable intangible assets acquired in the ATMI merger.
Interest expense
Interest expense was $33.4 million and $0.2 million in the years ended December 31, 2014 and 2013. The significant increase reflects the interest associated with the borrowings made by the Company in connection with the acquisition of ATMI as described in notes 2 and 7 to the Company's consolidated financial statements. Interest expense included interest on outstanding borrowings, the amortization of debt issuance costs associated with such borrowings and bridge financing costs of $4.0 million recorded in the second quarter.
Other expense (income), net
Other expense, net, was $2.7 million in 2014 compared to other income, net, of $1.8 million in 2013. In 2014, other expense includes foreign currency transaction losses of $1.1 million and an $1.9 million impairment loss recorded in connection with an equity investment, partially offset by $0.2 million in net realized gains on the sale of equity investments.
In 2013, other income includes foreign currency transaction gains of $2.3 million, partially offset by charges of $0.8 million associated with the realization of translation losses recorded upon the liquidation of certain of the Company's subsidiaries.
Income tax expense
The Company recorded an income tax benefit of $21.6 million in 2014 compared to an income tax expense of $21.7 million in 2013. The Company’s effective tax benefit rate was 161.1% in 2014, compared to an effective tax rate of 22.5% in 2013. The increase in the effective tax rate in 2014 from 2013 was primarily due to a change in the Company's geographic composition of income toward jurisdictions with lower tax rates and the benefit of a foreign dividend, reduced by the nondeductibility of certain acquisition-related expenditures incurred in connection with the ATMI acquisition.
In 2013, the Company’s effective tax rate was lower than the U.S. statutory rate of 35% primarily due to lower rates in various foreign jurisdictions compared to the U.S. statutory rate. The effective tax rate in 2013 included a $1.7 million benefit associated with the reinstatement of the U.S. federal credit for increasing research expenditures, as retroactively signed into law and recorded by the Company in the first quarter of 2013.
Net income
Net income was $7.9 million, or $0.06 per diluted share, in 2014 compared to net income of $74.5 million, or $0.53 per diluted share, in 2013. The significant decrease reflects the Company’s aforementioned operating results described in greater detail above, mainly reflecting the effect of the significant costs associated with the ATMI acquisition.
Non-GAAP measures information
The Company’s consolidated financial statements are prepared in conformity with accounting principles generally accepted in the United States (GAAP). The Company also utilizes certain non-GAAP financial measures as a complement to financial measures provided in accordance with GAAP in order to better assess and reflect trends affecting the Company’s business and results of operations. See “Non-GAAP Information” included below in this section for additional detail, including the reconciliation of GAAP measures to the Company’s non-GAAP measures.
The Company’s non-GAAP financial measures are Adjusted EBITDA and Adjusted Operating Income, together with related measures thereof, and non-GAAP Earnings Per Share (EPS).
Adjusted EBITDA increased 57% to $207.9 million in 2014, compared to $132.2 million in 2013. Adjusted EBITDA, as a percent of net sales, increased to 21.6% from 19.1% a year earlier. Adjusted Operating Income increased 57% to $161.3 million in 2014, compared to $102.7 million in 2013. Adjusted Operating Income, as a percent of net sales, increased to 16.8% from 14.8% a year earlier. Non-GAAP Earnings Per Share increased 19% to $0.69 in 2014, compared to $0.58 in 2013. The
43
improvement in the Adjusted EBITDA and Adjusted Operating Income measures reflect the increase in net sales and related increase in gross profit. In addition, Non-GAAP Earnings Per Share was positively affected by a lower adjusted effective tax rate.
Segment Analysis
In 2014, the Company changed its financial segment reporting to reflect management and organizational changes made by the Company. Under the new structure, the manager of two segments is accountable for results at the segment profit level and reports directly to the Company’s Chief Executive Officer, who is responsible for evaluating companywide performance and resource allocation decisions between the segments. Beginning in the second quarter of 2014, the Company reported its financial performance based on two reportable segments: Critical Materials Handling (CMH) and Electronic Materials (EM). See note 16 to the consolidated financial statements for additional information on the Company’s two segments.
The following table and discussion concern the results of operations of the Company’s two reportable segments for the years ended December 31, 2014 and 2013. See note 15 to the consolidated financial statements for additional information on the Company’s two segments.
|
(In thousands)
|
2014
|
2013
|
|||||
|
Critical Materials Handling
|
|||||||
|
Net sales
|
$
|
653,964
|
|
$
|
609,826
|
|
|
|
Segment profit
|
138,379
|
|
128,910
|
|
|||
|
Electronic Materials
|
|||||||
|
Net sales
|
$
|
308,105
|
|
$
|
83,633
|
|
|
|
Segment profit
|
90,121
|
|
20,034
|
|
|||
Critical Materials Handling (CMH)
For the year ended December 31, 2014, CMH net sales increased 7% to $654.0 million, from $609.8 million in 2013, and primarily reflects the inclusion of sales of $30.4 million from ATMI. CMH reported a segment profit of $138.4 million in 2014, up 7% from $128.9 million in 2013 also due to higher sales and a slightly favorable sales mix, partly offset by a 7% increase in operating expenses, mainly consisting of higher ER&D expenditures and costs associated with the ATMI infrastructure.
Electronic Materials (EM)
For the year ended December 31, 2014, EM net sales increased to $308.1 million, up 268%, from $83.6 million in the comparable period last year. The sales increase also reflects the inclusion of sales of $214.4 million from ATMI, while the remainder reflected improved sales of gas microcontamination control systems products. EM reported a segment profit of $90.1 million for the year ended December 31, 2014 compared to a $20.0 million segment profit in the year-ago period. The increase in the segment's profit is primarily associated with higher sales levels reflecting the sales of ATMI products and improved margins related to a more favorable sales mix, offset partly by costs associated with the ATMI infrastructure.
Unallocated general and administrative expenses
Unallocated general and administrative expenses for the year ended December 31, 2014 totaled $122.8 million compared to $47.2 million for the year ended December 31, 2013. The inclusion of unallocated general and administrative expenses of $45.7 million recorded by ATMI accounted for approximately 60% of the increase. Included in the ATMI expenses was $21.3 million for share-based compensation expense and related taxes associated with the unvested portion of ATMI share-based awards settled in cash on the date of the ATMI merger and integration costs of $9.2 million, consisting primarily of severance and retention costs.
In addition, the Company incurred expenses of $9.1 million in connection with the completion of the ATMI merger, as well as the costs of integration of $19.7 million incurred since the date of the ATMI Merger.
44
Quarterly Results of Operations
The following table presents selected data from the Company’s consolidated statements of operations for the eight quarters ended December 31,
2015
. This unaudited information has been prepared on the same basis as the audited consolidated financial statements appearing elsewhere in this annual report. All adjustments that management considers necessary for the fair presentation of the unaudited information have been included in the quarters presented.
|
|
2014
|
2015
|
|||||||||||||||||||||||||||||
|
|
Q1
|
Q2
|
Q3
|
Q4
|
Q1
|
Q2
|
Q3
|
Q4
|
|||||||||||||||||||||||
|
(In thousands)
|
|
|
|
|
|
|
|
|
|||||||||||||||||||||||
|
Net sales
|
$
|
165,804
|
|
$
|
251,578
|
|
$
|
273,054
|
|
$
|
271,633
|
|
$
|
263,373
|
|
$
|
280,709
|
|
$
|
270,253
|
|
$
|
266,786
|
|
|||||||
|
Gross profit
|
71,352
|
|
88,668
|
|
98,743
|
|
117,920
|
|
116,536
|
|
128,087
|
|
116,310
|
|
109,298
|
|
|||||||||||||||
|
Selling, general and administrative expenses
|
34,787
|
|
82,347
|
|
55,820
|
|
58,879
|
|
50,890
|
|
50,270
|
|
46,730
|
|
51,024
|
|
|||||||||||||||
|
Engineering, research and development expenses
|
15,690
|
|
21,581
|
|
24,427
|
|
26,013
|
|
25,800
|
|
26,542
|
|
26,841
|
|
26,717
|
|
|||||||||||||||
|
Amortization of intangible assets
|
2,336
|
|
9,390
|
|
13,128
|
|
12,213
|
|
12,307
|
|
11,928
|
|
11,673
|
|
11,441
|
|
|||||||||||||||
|
Contingent consideration fair value adjustment
|
—
|
|
(1,282
|
)
|
—
|
|
—
|
|
—
|
|
—
|
|
—
|
|
—
|
|
|||||||||||||||
|
Operating income
|
18,539
|
|
(23,368
|
)
|
5,368
|
|
20,815
|
|
27,539
|
|
39,347
|
|
31,066
|
|
20,116
|
|
|||||||||||||||
|
Net income
|
14,312
|
|
(14,669
|
)
|
(1,068
|
)
|
9,312
|
|
14,872
|
|
24,448
|
|
23,403
|
|
17,573
|
|
|||||||||||||||
|
|
Q1
|
Q2
|
Q3
|
Q4
|
Q1
|
Q2
|
Q3
|
Q4
|
|||||||||||||||||||||||
|
(Percent of net sales)
|
|
|
|
|
|
|
|
|
|||||||||||||||||||||||
|
Net sales
|
100.0
|
%
|
100.0
|
%
|
100.0
|
%
|
100.0
|
%
|
100.0
|
%
|
100.0
|
%
|
100.0
|
%
|
100.0
|
%
|
|||||||||||||||
|
Gross profit
|
43.0
|
|
35.2
|
|
36.2
|
|
43.4
|
|
44.2
|
|
45.6
|
|
43.0
|
|
41.0
|
|
|||||||||||||||
|
Selling, general and administrative expenses
|
21.0
|
|
32.7
|
|
20.4
|
|
21.7
|
|
19.3
|
|
17.9
|
|
17.3
|
|
19.1
|
|
|||||||||||||||
|
Engineering, research and development expenses
|
9.5
|
|
8.6
|
|
8.9
|
|
9.6
|
|
9.8
|
|
9.5
|
|
9.9
|
|
10.0
|
|
|||||||||||||||
|
Amortization of intangibles
|
1.4
|
|
3.7
|
|
4.8
|
|
4.5
|
|
4.7
|
|
4.2
|
|
4.3
|
|
4.3
|
|
|||||||||||||||
|
Contingent consideration fair value adjustment
|
—
|
|
(0.5
|
)
|
—
|
|
—
|
|
—
|
|
—
|
|
—
|
|
—
|
|
|||||||||||||||
|
Operating income
|
11.2
|
|
(9.3
|
)
|
2.0
|
|
7.7
|
|
10.5
|
|
14.0
|
|
11.5
|
|
7.5
|
|
|||||||||||||||
|
Net income
|
8.6
|
|
(5.8
|
)
|
(0.4
|
)
|
3.4
|
|
5.6
|
|
8.7
|
|
8.7
|
|
6.6
|
|
|||||||||||||||
The Company’s quarterly results of operations have been, and will likely continue to be, subject to significant fluctuations due to a myriad of factors, many of which are beyond the Company’s control. The variability in sales, and its corresponding effect on gross profit, and the effects of the ATMI acquisition as of April 30, 2014, are the most important factors underlying the changes in the Company’s operating income and net income over the past eight quarters.
Liquidity and Capital Resources
The Company has historically financed its operations and capital requirements through cash flow from its operating activities, long-term loans, lease financing and borrowings under domestic and international short-term lines of credit. In fiscal 2000 and 2009, the Company raised capital via public offerings of its common stock.
Operating activities
Net cash flow provided by operating activities totaled
$120.9 million
for the year ended December 31,
2015
. Cash generated by the Company’s operations included net income of
$80.3 million
, as adjusted for the impact of various non-cash charges, most notably depreciation and amortization of
$101.7 million
, and share-based compensation expense of
$11.0 million
. These operating cash flows were partly offset by changes in operating assets and liabilities, mainly due to an increase in inventories and a decrease in accounts payable and accrued liabilities.
Working capital was
$535.2 million
at December 31,
2015
, which included
$349.8 million
in cash and cash equivalents, an increase from
$503.1 million
as of December 31,
2014
, which included
$389.7 million
in cash and cash equivalents.
Accounts receivable decreased by
$12.6 million
during
2015
, or
$5.2 million
after accounting for the effect of foreign currency translation. The net increase reflects the slight year-over-year decline in fourth quarter sales of the Company’s products and
45
improved year end collections. The Company’s days sales outstanding measure (DSO) stood at
48
days at December 31,
2015
compared to
52
days at the beginning of the year.
Inventories at December 31,
2015
increased by
$10.1 million
from a year earlier, or
$26.7 million
after accounting for foreign currency translation and the provision for excess and obsolete inventory. The net increase reflects higher levels of the Company's raw materials and finished goods inventories, the former category including certain strategic purchases of critical raw materials.
Accounts payable and accrued liabilities were
$36.2 million
lower than a year ago, or
$28.7 million
lower after accounting for the effect of foreign currency translation. The decline reflects lower accrued bonuses in 2015, as well as a reduction in accrued severance costs, mainly related to the ATMI acquisition.
Investing activities
Cash flow used in investing activities totaled
$63.6 million
in
2015
.
Acquisition of property and equipment totaled
$72.0 million
, which primarily reflected investments in equipment and tooling. Capital expenditures in 2015 generally reflected more normalized capital spending levels. The Company expects its capital expenditures in 2016 to be approximately
$80 million
.
Financing activities
Cash flow used in financing activities totaled
$92.8 million
during
2015
. This primarily reflects the Company's payments of $100 million on its senior secured term loan facility. The Company received proceeds of
$4.3 million
in connection with common shares issued under the Company’s stock plans less
$2.5 million
paid for taxes related to the net share settlement of equity awards. Cash flow provided by financing activities also included
$5.5 million
related to excess tax benefits associated with such employee stock plan activity.
The Company has a senior secured asset-based revolving credit facility maturing April 30, 2019 that provides financing of $75 million, subject to a borrowing base. As of December 31,
2015
, the Company had no outstanding borrowings and $0.2 million undrawn on outstanding letters of credit under the senior secured asset-based revolving credit facility.
Through December 31,
2015
, the Company was in compliance with all applicable financial covenants included in the terms of its senior unsecured notes, senior secured term loan facility and senior secured asset-based revolving credit facility.
The Company also has a line of credit with two banks that provide for borrowings of Japanese yen for the Company’s Japanese subsidiary equivalent to an aggregate of approximately
$10.0 million
. There were no outstanding borrowings under these lines of credit at December 31,
2015
.
At December 31,
2015
, the Company’s shareholders’ equity stood at
$802.9 million
, up
7%
from
$748.4 million
at the beginning of the year. The increase in
2015
reflects net income of
$80.3 million
, additional paid-in capital of
$11.0 million
associated with the Company’s share-based compensation expense,
$1.8 million
received in connection with common shares issued under the Company’s stock option and employee stock purchase plans, and a tax benefit associated with employee stock plan activity of
$5.5 million
. These increases to shareholders’ equity were partly offset by unfavorable foreign currency translation effects of
$44.6 million
associated with the strengthening of the U.S. dollar versus most other currencies, primarily the Malaysian ringgit, Korean won, Taiwanese dollar and Euro.
As of December 31,
2015
, the Company’s sources of available funds were its cash and cash equivalents of
$349.8 million
, funds available under its senior secured asset-based revolving credit facility and international credit facilities and cash flow generated from operations. As of December 31,
2015
, the amount of cash and cash equivalents associated with indefinitely reinvested foreign earnings was
$206 million
. These amounts held by foreign subsidiaries are generally subject to U.S. income taxation on repatriation to the United States. Certain of these amounts are associated with indefinitely reinvested foreign earnings and are subject to U.S. income taxation on repatriation to the United States. The Company does not anticipate the need to repatriate funds associated with indefinitely reinvested foreign earnings to the United States to satisfy domestic liquidity needs arising in the ordinary course of business.
The Company believes its existing balances of domestic cash and cash equivalents, available cash and cash equivalents held by foreign subsidiaries not associated with indefinitely reinvested foreign earnings and operating cash flows will be sufficient to meet the Company’s domestic cash needs arising in the ordinary course of business for the next twelve months. If available liquidity is not sufficient to meet the Company’s operating and debt service obligations as they come due, management would need to pursue alternative arrangements through additional equity or debt financing in order to meet the Company’s cash requirements. There can be no assurance that any such financing would be available on commercially acceptable terms.
New Accounting Pronouncements
46
Recently adopted accounting pronouncements
Refer to Note 1 to the Company’s consolidated financial statements for a discussion of accounting pronouncements implemented in
2015
. Other than the adoption of ASU 2015-17, there were no recently issued accounting pronouncements adopted in
2015
.
Recently issued accounting pronouncements
Refer to Note 1 to the Company's condensed consolidated financial statements for a discussion of accounting pronouncements recently issued by not yet adopted.
Contractual Obligations
The following table summarizes the maturities of the Company’s significant financial obligations as of December 31,
2015
:
|
(In thousands)
|
Total
|
2016
|
2017
|
2018
|
2019
|
2020
|
Thereafter
|
||||||||||||||||||||
|
Long-term debt
|
$
|
667,286
|
|
$
|
—
|
|
$
|
—
|
|
$
|
—
|
|
$
|
—
|
|
$
|
—
|
|
$
|
667,286
|
|
||||||
|
Pension obligations
|
7,476
|
|
166
|
|
278
|
|
300
|
|
161
|
|
344
|
|
6,227
|
|
|||||||||||||
|
Capital purchase obligations
1
|
11,958
|
|
11,958
|
|
—
|
|
—
|
|
—
|
|
—
|
|
—
|
|
|||||||||||||
|
Operating leases
|
25,105
|
|
8,624
|
|
6,879
|
|
5,528
|
|
2,037
|
|
855
|
|
1,182
|
|
|||||||||||||
|
Total
|
$
|
711,825
|
|
$
|
20,748
|
|
$
|
7,157
|
|
$
|
5,828
|
|
$
|
2,198
|
|
$
|
1,199
|
|
$
|
674,695
|
|
||||||
|
Unrecognized tax benefits
2
|
|||||||||||||||||||||||||||
|
1.
|
Capital purchase obligations represent commitments for the construction or purchase of property, plant and equipment. They were not recorded as liabilities on the Company’s consolidated balance sheet as of December 31,
2015
, as the Company had not yet received the related goods or taken title to the property.
|
|
2.
|
The Company had
$7.6 million
of total gross unrecognized tax benefits at December 31,
2015
. The timing of any payments associated with these unrecognized tax benefits will depend on a number of factors. Accordingly, the Company cannot make reasonably reliable estimates of the amount and period of potential cash settlements, if any, with taxing authorities and are not included in the table above.
|
Non-GAAP Information
The Company’s consolidated financial statements are prepared in conformity with accounting principles generally accepted in the United States (GAAP).
The Company also provides certain non-GAAP financial measures as a complement to financial measures provided in accordance with GAAP in order to better assess and reflect trends affecting the Company’s business and results of operations. Regulation G, “
Conditions for Use of Non-GAAP Financial Measures
,” and other regulations under the Securities Exchange Act of 1934, as amended, define and prescribe the conditions for use of certain non-GAAP financial information. The Company provides non-GAAP financial measures of Adjusted EBITDA and Adjusted Operating Income together with related measures thereof, and non-GAAP Earnings Per Share (EPS).
Adjusted EBITDA, a non-GAAP term, is defined by the Company as net income before (1) equity in net loss of affiliates, (2) income tax expense (benefit), (3) interest expense (4) interest income (5) other (income) expense, net, (6) charge for the fair value write-up of acquired inventory sold, (7) transaction-related costs, (8) deal costs, (9) integration costs, (10) contingent consideration fair value adjustment, (11) amortization of intangible assets and (12) depreciation. Adjusted Operating Income, another non-GAAP term, is defined by the Company as Adjusted EBITDA exclusive of the depreciation addback noted above. The Company also utilizes non-GAAP measures whereby Adjusted EBITDA and Adjusted Operating Income are each divided by the Company’s net sales to derive Adjusted EBITDA Margin and Adjusted Operating Margin, respectively.
Non-GAAP EPS, a non-GAAP term, is defined by the Company as net income before (1) charge for fair value write-up of acquired inventory sold, (2) transaction-related costs, (3) deal costs, (4) integration costs, (5) contingent consideration fair value adjustment, (6) reclassification of cumulative translation adjustment associated with liquidated subsidiaries, (7) net (gain) loss on impairment/sale of short-term and equity investments, (8) amortization of intangible assets and (9) the tax effect of those adjustments to net income.
The charge for fair value write-up of acquired inventory sold, transaction-related costs, deal costs and integration costs
adjustments underlying Adjusted EBITDA and Non-GAAP EPS relate specifically to the ATMI acquisition.
The Company provides supplemental non-GAAP financial measures to better understand and manage its business and believes these measures provide investors and analysts additional and meaningful information for the assessment of the Company’s
47
ongoing results. Management also uses these non-GAAP measures to assist in the evaluation of the performance of its business segments and to make operating decisions.
Management believes the Company’s non-GAAP measures help indicate the Company’s baseline performance before certain gains, losses or other charges that may not be indicative of the Company’s business or future outlook and offer a useful view of business performance in that the measures provide a more consistent means of comparing performance. The Company believes the non-GAAP measures aid investors’ overall understanding of the Company’s results by providing a higher degree of transparency for such items and providing a level of disclosure that will help investors understand how management plans, measures and evaluates the Company’s business performance. Management believes that the inclusion of non-GAAP measures provides consistency in its financial reporting and facilitates investors’ understanding of the Company’s historical operating trends by providing an additional basis for comparisons to prior periods.
Management uses Adjusted EBITDA and Adjusted Operating Income to assist it in evaluations of the Company’s operating performance by excluding items that management does not consider as relevant in the results of its ongoing operations. Internally, these non-GAAP measures are used by management for planning and forecasting purposes, including the preparation of internal budgets; for allocating resources to enhance financial performance; for evaluating the effectiveness of operational strategies; and for evaluating the Company’s capacity to fund capital expenditures, secure financing and expand its business.
In addition, and as a consequence of the importance of these non-GAAP financial measures in managing its business, the Company’s Board of Directors uses non-GAAP financial measures in the evaluation process to determine management compensation.
The Company believes that certain analysts and investors use Adjusted EBITDA, Adjusted Operating Income and non-GAAP EPS as supplemental measures to evaluate the overall operating performance of firms in the Company’s industry. Additionally, lenders or potential lenders use Adjusted EBITDA measures to evaluate the Company’s creditworthiness.
The presentation of non-GAAP financial measures is not meant to be considered in isolation, as a substitute for, or superior to, financial measures or information provided in accordance with GAAP. Management strongly encourages investors to review the Company’s consolidated financial statements in their entirety and to not rely on any single financial measure.
Management notes that the use of non-GAAP measures has limitations:
First, non-GAAP financial measures are not standardized. Accordingly, the methodology used to produce the Company’s non-GAAP financial measures is not computed under GAAP and may differ notably from the methodology used by other companies. For example, the Company’s non-GAAP measure of Adjusted EBITDA may not be directly comparable to EBITDA or an adjusted EBITDA measure reported by other companies.
Second, the Company’s non-GAAP financial measures exclude items such as amortization and depreciation that are recurring. Amortization of intangibles and depreciation have been, and will continue to be for the foreseeable future, a significant recurring expense with an impact upon the Company’s results of operations, notwithstanding the lack of immediate impact upon cash flows.
Third, there is no assurance the Company will not have future restructuring activities, gains or losses on sale of equity investments, contingent consideration fair value adjustments or similar items and, therefore, may need to record additional charges (or credits) associated with such items, including the tax effects thereon. The exclusion of these items from the Company’s non-GAAP measures should not be construed as an implication that these costs are unusual, infrequent or non-recurring.
Management considers these limitations by providing specific information regarding the GAAP amounts excluded from these non-GAAP financial measures and evaluating these non-GAAP financial measures together with their most directly comparable financial measures calculated in accordance with GAAP. The calculations of Adjusted EBITDA, Adjusted operating income, and non-GAAP EPS, and reconciliations between these financial measures and their most directly comparable GAAP equivalents are presented below in the accompanying tables.
The reconciliation of GAAP measures to Adjusted Operating Income and Adjusted EBITDA for the years ended December 31,
2015
,
2014
and
2013
are presented below:
48
|
(Dollars in thousands)
|
2015
|
2014
|
2013
|
||||||||
|
Net sales
|
$
|
1,081,121
|
|
$
|
962,069
|
|
$
|
693,459
|
|
||
|
Net income
|
$
|
80,296
|
|
$
|
7,887
|
|
$
|
74,526
|
|
||
|
Adjustments to net income
|
|||||||||||
|
Equity in net loss of affiliates
|
1,687
|
|
293
|
|
—
|
|
|||||
|
Income tax expense (benefit)
|
10,202
|
|
(21,572
|
)
|
21,669
|
|
|||||
|
Interest expense
|
38,667
|
|
33,355
|
|
153
|
|
|||||
|
Interest income
|
(429
|
)
|
(1,336
|
)
|
(317
|
)
|
|||||
|
Other (income) expense, net
|
(12,355
|
)
|
2,727
|
|
(1,794
|
)
|
|||||
|
GAAP – Operating income
|
118,068
|
|
21,354
|
|
94,237
|
|
|||||
|
Charge for fair value write-up of acquired inventory sold
|
—
|
|
48,586
|
|
—
|
|
|||||
|
Transaction-related costs
|
—
|
|
26,776
|
|
—
|
|
|||||
|
Deal costs
|
—
|
|
9,125
|
|
973
|
|
|||||
|
Integration costs
|
12,667
|
|
19,652
|
|
—
|
|
|||||
|
Contingent consideration fair value adjustment
|
—
|
|
(1,282
|
)
|
(1,813
|
)
|
|||||
|
Amortization of intangible assets
|
47,349
|
|
37,067
|
|
9,347
|
|
|||||
|
Adjusted operating income
|
178,084
|
|
161,278
|
|
102,744
|
|
|||||
|
Depreciation
|
54,305
|
|
46,637
|
|
29,468
|
|
|||||
|
Adjusted EBITDA
|
$
|
232,389
|
|
$
|
207,915
|
|
$
|
132,212
|
|
||
|
Adjusted operating margin
|
16.5
|
%
|
16.8
|
%
|
14.8
|
%
|
|||||
|
Adjusted EBITDA – as a % of net sales
|
21.5
|
%
|
21.6
|
%
|
19.1
|
%
|
|||||
The reconciliation of GAAP measures to Non-GAAP Earnings per Share for the years ended December 31,
2015
,
2014
and
2013
are presented below:
|
(Dollars in thousands)
|
2015
|
2014
|
2013
|
||||||||
|
Net income
|
$
|
80,296
|
|
$
|
7,887
|
|
$
|
74,526
|
|
||
|
Adjustments to net income:
|
|||||||||||
|
Charge for fair value write-up of acquired inventory sold
|
—
|
|
48,586
|
|
—
|
|
|||||
|
Transaction-related costs
|
—
|
|
26,776
|
|
—
|
|
|||||
|
Deal costs
|
—
|
|
13,288
|
|
973
|
|
|||||
|
Integration costs
|
12,667
|
|
19,510
|
|
—
|
|
|||||
|
Contingent consideration fair value adjustment
|
—
|
|
(1,282
|
)
|
(1,813
|
)
|
|||||
|
Reclassification of cumulative translation adjustments adjustments associated with liquidated subsidiaries
|
—
|
|
—
|
|
787
|
|
|||||
|
Net (gain) loss on impairment/sale of short-term investment or equity investments
|
(1,449
|
)
|
1,710
|
|
—
|
|
|||||
|
Amortization of intangible assets
|
47,349
|
|
37,067
|
|
9,347
|
|
|||||
|
Tax effect of adjustments to net income attributable to Entegris
|
(18,248
|
)
|
(56,819
|
)
|
(3,044
|
)
|
|||||
|
Non-GAAP net income
|
$
|
120,615
|
|
$
|
96,723
|
|
$
|
80,776
|
|
||
|
Diluted earnings per common share
|
$
|
0.57
|
|
$
|
0.06
|
|
$
|
0.53
|
|
||
|
Effect of adjustments to net income
|
$
|
0.29
|
|
$
|
0.63
|
|
$
|
0.04
|
|
||
|
Diluted non-GAAP earnings per common share
|
$
|
0.85
|
|
$
|
0.69
|
|
$
|
0.58
|
|
||
Entegris’ principal financial market risks are sensitivities to interest rates and foreign currency exchange rates. The Company’s interest-bearing cash equivalents and short-term investments are subject to interest rate fluctuations. The Company’s cash equivalents are instruments with maturities of three months or less. A 100 basis point change in interest rates would potentially increase or decrease annual net income by approximately
$0.3 million
annually.
49
The cash flows and results of operations of the Company’s foreign-based operations are subject to fluctuations in foreign exchange rates. The Company occasionally uses derivative financial instruments to manage the foreign currency exchange rate risks associated with its foreign-based operations. At December 31,
2015
, the Company had no net exposure to any foreign currency forward contracts.
50
The information required by this item can be found under the subcaption “Quantitative and Qualitative Disclosure About Market Risks” of “Management’s Discussion and Analysis of Financial Condition and Results of Operations” in Item 7.
The information called for by this item is set forth in the Consolidated Financial Statements covered by the Report of Independent Registered Public Accounting Firm at the end of this report.
This item is not applicable.
DISCLOSURE CONTROLS AND PROCEDURES
Management evaluated the effectiveness of our disclosure controls and procedures (as defined in Rules 13a-15(e) and 15d-15(e) under the Securities Exchange Act of 1934, as amended, (the Exchange Act)), as of December 31,
2015
, the end of the fiscal period covered by this report on Form 10-K. The Securities and Exchange Commission, or SEC, rules define the term “disclosure controls and procedures” to mean a company’s controls and other procedures that are designed to ensure that information required to be disclosed in the reports it files or submits under the Exchange Act is recorded, processed, summarized and reported within the time period specified in the SEC’s rules and forms. Disclosure controls and procedures include, without limitation, controls and procedures designed to ensure that information required to be disclosed by a company in its reports filed under the Exchange Act is accumulated and communicated to the company’s management, including its principal executive and principal financial officers, or persons performing similar functions, as appropriate to allow timely decisions regarding required disclosure.
Based on the evaluation of the effectiveness of our disclosure controls and procedures by our management team with the participation of the Chief Executive Officer and the Chief Financial Officer, our Chief Executive Officer and our Chief Financial Officer have concluded that, as of the end of the period covered by this report, our disclosure controls and procedures were effective to provide reasonable assurance that information required to be disclosed in the reports that we file or submit under the Exchange Act is recorded, processed, summarized and reported, within the time periods specified in the SEC rules and forms and is accumulated and communicated to management, including the principal executive officer and principal financial officer, as appropriate, to allow timely decisions regarding required disclosure.
MANAGEMENT’S ANNUAL REPORT ON INTERNAL CONTROL OVER FINANCIAL REPORTING
Management is responsible for establishing and maintaining an adequate system of internal control over financial reporting of the Company. This system of internal financial reporting controls is designed to provide reasonable assurance that assets are safeguarded and transactions are properly recorded and executed in accordance with management’s authorization. The design, monitoring and revision of the system of internal financial reporting controls involves, among other things, management’s judgments with respect to the relative cost and expected benefits of specific control measures. The effectiveness of the control system is supported by the selection, retention and training of qualified personnel and an organizational structure that provides an appropriate division of responsibility and formalized procedures. The system of internal accounting controls is periodically reviewed and modified in response to changing conditions. Designated Company employees regularly monitor the adequacy and effectiveness of internal accounting controls.
Because of its inherent limitations, a system of internal control over financial reporting can provide only reasonable assurance and may not prevent or detect misstatements. Further, because of changes in conditions, the effectiveness of internal controls over financial reporting may vary over time. Our system contains control-monitoring mechanisms, and actions are taken to correct deficiencies as they are identified.
Management conducted an evaluation of the effectiveness of the system of internal control over financial reporting based on the framework in Internal Control—Integrated Framework issued by the Committee of Sponsoring Organizations of the Treadway Commission (COSO 2013). Based on this evaluation, management concluded that the Company’s system of internal control over financial reporting was effective as of December 31,
2015
.
KPMG LLP, the independent registered public accounting firm which audited the financial statements included in this annual report, has issued an attestation report on our internal control over financial reporting.
51
Report of Independent Registered Public Accounting Firm
The Board of Directors and Stockholders
Entegris, Inc.:
We have audited Entegris, Inc.’s internal control over financial reporting as of
December 31, 2015
, based on criteria established in
Internal Control - Integrated Framework (2013)
issued by the Committee of Sponsoring Organizations of the Treadway Commission (COSO). Entegris, Inc.’s management is responsible for maintaining effective internal control over financial reporting and for its assessment of the effectiveness of internal control over financial reporting, included in the accompanying “Management’s Report on Internal Control over Financial Reporting” appearing under Item 9A(a) of the Company’s
December 31, 2015
Annual Report on Form 10-K. Our responsibility is to express an opinion on the Company’s internal control over financial reporting based on our audit.
We conducted our audit in accordance with the standards of the Public Company Accounting Oversight Board (United States). Those standards require that we plan and perform the audit to obtain reasonable assurance about whether effective internal control over financial reporting was maintained in all material respects. Our audit included obtaining an understanding of internal control over financial reporting, assessing the risk that a material weakness exists, and testing and evaluating the design and operating effectiveness of internal control based on the assessed risk. Our audit also included performing such other procedures as we considered necessary in the circumstances. We believe that our audit provides a reasonable basis for our opinion.
A company’s internal control over financial reporting is a process designed to provide reasonable assurance regarding the reliability of financial reporting and the preparation of financial statements for external purposes in accordance with generally accepted accounting principles. A company’s internal control over financial reporting includes those policies and procedures that (1) pertain to the maintenance of records that, in reasonable detail, accurately and fairly reflect the transactions and dispositions of the assets of the company; (2) provide reasonable assurance that transactions are recorded as necessary to permit preparation of financial statements in accordance with generally accepted accounting principles, and that receipts and expenditures of the company are being made only in accordance with authorizations of management and directors of the company; and (3) provide reasonable assurance regarding prevention or timely detection of unauthorized acquisition, use, or disposition of the company’s assets that could have a material effect on the financial statements.
Because of its inherent limitations, internal control over financial reporting may not prevent or detect misstatements. Also, projections of any evaluation of effectiveness to future periods are subject to the risk that controls may become inadequate because of changes in conditions, or that the degree of compliance with the policies or procedures may deteriorate.
In our opinion, Entegris, Inc. maintained, in all material respects, effective internal control over financial reporting as of
December 31, 2015
, based on criteria established in
Internal Control - Integrated Framework
(2013)
issued by the Committee of Sponsoring Organizations of the Treadway Commission (COSO).
We also have audited, in accordance with the standards of the Public Company Accounting Oversight Board (United States), the consolidated balance sheets of Entegris, Inc. and subsidiaries as of
December 31, 2015
and
2014
, and the related consolidated statements of operations, comprehensive income (loss), equity, and cash flows for each of the years in the three-year period ended
December 31, 2015
, and our report dated
February 26, 2016
expressed an unqualified opinion on those consolidated financial statements.
/s/ KPMG LLP
Minneapolis, Minnesota
February 26, 2016
52
|
(b)
|
CHANGES IN INTERNAL CONTROL OVER FINANCIAL REPORTING
|
There was no change in the Company’s internal control over financial reporting during the most recently completed fiscal quarter that has materially affected, or is reasonably likely to materially affect, internal controls over financial reporting.
None.
53
Except as set forth below, the Information required by this Item 10 has been omitted from this report, and is incorporated by reference to the sections “Section 16(a) Beneficial Ownership Reporting Compliance,” “Election of Directors,” “Corporate Governance” in our definitive Proxy Statement for the Entegris, Inc. Annual Meeting of Stockholders to be held on May 17, 2016, and to be filed with the Securities and Exchange Commission pursuant to Regulation 14A within 120 days after the end of our
2015
fiscal year.
Information called for by this item with respect to registrant’s executive officers is set forth under “Executive Officers of the Registrant” in Item 1 of this report.
At their first meeting following the August 10, 2005 merger described under "Our History" in Part I above, our Board of Directors adopted a code of business ethics, The Entegris, Inc. Code of Business Ethics, applicable to all of our executives, directors and employees as well as a set of corporate governance guidelines. The Entegris, Inc. Code of Business Ethics was amended by the Entegris Board of Directors on July 30, 2014. The amended Entegris, Inc. Code of Business Ethics, the Corporate Governance Guidelines and the charters for our Audit & Finance Committee, Governance & Nominating Committee and our Management Development & Compensation Committee all appear on our website at http://www.Entegris.com under “Investors - Corporate Governance”. The Entegris Code of Business Ethics, Corporate Governance Guidelines and committee charters are also available in print to any shareholder that requests a copy. Copies may be obtained by contacting Peter W. Walcott, our Senior Vice President, Secretary and General Counsel through our corporate headquarters. The Company intends to comply with the requirements of Item 5.05 of Form 8-K with respect to any amendment to or waiver of the provisions of the Entegris, Inc. Code of Business Ethics applicable to the registrant’s Chief Executive Officer, Chief Financial Officer or Chief Accounting Officer by posting notice of any such amendment or waiver at the same location on our website.
The information required by this Item 11 has been omitted from this report, and is incorporated by reference to the sections entitled "Compensation of Executive Officers" and “Management Development & Compensation Committee Report”, respectively, in our definitive Proxy Statement for the Entegris, Inc. Annual Meeting of Stockholders to be held on May 17, 2016, and to be filed with the Securities and Exchange Commission pursuant to Regulation 14A within 120 days after the end of our
2015
fiscal year.
Securities Authorized for Issuance Under Equity Compensation Plans:
As of
December 31, 2015
, our equity compensation plan information is as follows:
Equity Compensation Plan Information
|
Number of securities to
be issued upon exercise
of outstanding options,
warrants and rights
|
Weighted-average
exercise price of
outstanding options,
warrants and rights (1)
|
Number of securities remaining
available for future issuance
under equity compensation
plans (excluding securities
reflected in column (a)) (2)
|
||||||||
|
Plan category
|
(a)
|
(b)
|
(c)
|
|||||||
|
Equity compensation plans approved by security holders
|
4,195,760
|
|
$
|
10.57
|
|
10,400,798
|
|
|||
|
Equity compensation plans not approved by security holders
|
—
|
|
—
|
|
—
|
|
||||
|
Total
|
4,195,760
|
|
$
|
10.57
|
|
10,400,798
|
|
|||
|
(1)
|
The weighted average exercise price does not take into account the shares issuable upon outstanding restricted stock unit vesting, which have no exercise price.
|
|
(2)
|
These shares are available under the 2010 Stock Plan for future issuance for stock options, restricted stock units, performance shares and stock awards in accordance with the terms of the 2010 Stock Plan.
|
54
The other information called for by this Item 12 has been omitted from this report, and is incorporated by reference to the section entitled “Ownership of Entegris Common Stock” in our definitive Proxy Statement for the Entegris, Inc. Annual Meeting of Stockholders to be held on May 17, 2016, and to be filed with the Securities and Exchange Commission pursuant to Regulation 14A within 120 days after the end of our 2015 fiscal year.
The information required by this Item 13 has been omitted from this report, and is incorporated by reference to the section entitled "Corporate Governance" in our definitive Proxy Statement for the Entegris, Inc. Annual Meeting of Stockholders to be held on May 17, 2016, and to be filed with the Securities and Exchange Commission pursuant to Regulation 14A within 120 days after the end of our
2015
fiscal year.
The information required by this Item 14 has been omitted from this report, and is incorporated by reference to the section entitled "Proposal 2 - Ratification of Selection of Independent Registered Public Accounting Firm for
2015
" in our definitive Proxy Statement for the Entegris, Inc. Annual Meeting of Stockholders to be held on May 17, 2016, and to be filed with the Securities and Exchange Commission pursuant to Regulation 14A within 120 days after the end of our
2015
fiscal year.
55
|
(a)
|
The following documents are filed as a part of this report:
|
|
1.
|
Financial Statements.
The Consolidated Financial Statements listed under Item 8 of this report and in the Index to Consolidated Financial Statements on page F-1 of this report are incorporated by reference herein.
|
|
2.
|
Exhibits.
|
|
A.
|
The following exhibits are incorporated by reference:
|
|
Reg. S-K
Item 601(b)
Reference
|
Document Incorporated
|
Referenced
Document on file
with the
Commission
|
||
|
(2)
|
Agreement and Plan of Merger, dated as of February 4, 2014, among Entegris, Inc., Atomic Merger Corporation and ATMI, Inc.
|
Exhibit 2.1 to Entegris, Inc Current Report on Form 8-K filed on February 4, 2014
|
||
|
(3)
|
By-Laws of Entegris, Inc., as amended December 17, 2008
|
Exhibit 3 to Entegris, Inc. Annual Report on Form 10-K for the fiscal year ended December 31, 2008
|
||
|
(3)
|
Amended and Restated Certificate of Incorporation of Entegris, Inc., as amended
|
Exhibit 3.1 to Entegris, Inc. Annual Report on Form 10-K for the fiscal year ended December 31, 2011
|
||
|
(4)
|
Form of certificate representing shares of Common Stock, $.01 par value per share
|
Exhibit 4.1 to Form S-4 Registration Statement of Entegris, Inc. and Eagle DE, Inc. (No. 333-124719)
|
||
|
(4)
|
Indenture, dated as of April 1, 2014, between Entegris, Inc., as Issuer and Wells Fargo Bank National Association, as Trustee, with respect to $360,000,000 6% Senior Unsecured Notes Due 2022, including the form of note representing the 2022 Senior Unsecured Notes
|
Exhibit 4.1 to Entegris, Inc. Current Report on Form 8-K filed with the Securities and Exchange Commission on April 2, 2014
|
||
|
(10)
|
Entegris, Inc. – 2010 Stock Plan, as amended*
|
Exhibit 10.1 to Entegris, Inc. Quarterly Report on Form 10-Q for the period ended July 3, 2010
|
||
|
(10)
|
Entegris, Inc. Outside Directors’ Stock Option Plan*
|
Exhibit 10.2 to Entegris, Inc. Registration Statement on Form S-1 (No. 333-33668)
|
||
|
(10)
|
Entegris, Inc. 2000 Employee Stock Purchase Plan*
|
Exhibit 10.3 to Entegris, Inc. Registration Statement on Form S-1 (No. 333-33668)
|
||
|
(10)
|
Amended and Restated Entegris Incentive Plan*
|
Exhibit 10.1 to Entegris, Inc. Quarterly Report on Form 10-Q for the period ended June 28, 2008
|
||
|
(10)
|
Lease Agreement, dated April 1, 2002 between Nortel Networks HPOCS Inc. and Mykrolis Corporation, relating to Executive office, R&D and manufacturing facility located at 129 Concord Road Billerica, MA
|
Exhibit 10.1.3 to Mykrolis Corporation’s Quarterly Report on Form 10-Q for the quarter ended March 31, 2002
|
||
|
(10)
|
Amendment of Lease between Entegris, Inc. and KBS Rivertech, LLC dated April 1, 2012
|
Exhibit 10.1 to Entegris, Inc. Quarterly Report on Form 10-Q for the period ended June 30, 2012
|
||
|
(10)
|
Fluoropolymer Purchase and Sale Agreement, by and between E.I. Du Pont De Nemours and Company and the Registrant, dated January 1, 2011, as amended
|
Exhibit 10.2 to Entegris, Inc. Quarterly Report on Form 10-Q for the quarter ended April 2, 2011
|
||
|
(10)
|
Form of Indemnification Agreement between Entegris, Inc. and each of its executive officers and Directors
|
Exhibit 10.30 to Entegris, Inc. Annual Report on Form 10-K for the fiscal year ended August 27, 2005
|
||
|
(10)
|
Form of Executive Change of Control Termination Agreement between Entegris, Inc. and certain of its executive officers*
|
Exhibit 10.31 to Entegris, Inc. Annual Report on Form 10-K for the fiscal year ended August 27, 2005
|
||
56
|
(10)
|
Severance Protection Agreement, dated May 13, 2011 between Entegris, Inc. and Gregory B. Graves*
|
Exhibit 10.2 to Entegris, Inc. Quarterly Report on Form 10-Q for the period ended July 2, 2011
|
||
|
(10)
|
Trust Agreement between Entegris, Inc. Fidelity Management Trust Company and Entegris Inc. 401(k) Savings and Profit Sharing Plan Trust, dated December 29, 2007.
|
Exhibit 10.3 to Entegris, Inc. Annual Report on Form 10-K for the fiscal year ended December 31, 2007
|
||
|
(10)
|
Entegris, Inc. 2007 Deferred Compensation Plan*
|
Exhibit 10.2 to Entegris, Inc. Quarterly Report on Form10-Q for the fiscal period ended June 30, 2007
|
||
|
(10)
|
Entegris, Inc. – Form of 2010 RSU Unit Award Agreement*
|
Exhibit 10.1 to Entegris, Inc. Quarterly Report on Form 10-Q for the fiscal period ended April 3, 2010
|
||
|
(10)
|
Entegris, Inc. – Form of 2010 Stock Option Award Agreement*
|
Exhibit 10.1 to Entegris, Inc. Quarterly Report on Form 10-Q for the fiscal period ended April 3, 2010
|
||
|
(10)
|
Amended and Restated Supplemental Executive Retirement Plan for Key Salaried Employees*
|
Exhibit 10.2 to Entegris, Inc. Annual Report on Form 10-K for the fiscal year ended December 31, 2008
|
||
|
(10)
|
Amendment to Amended and Restated SERP*
|
Exhibit 10.15 to Entegris, Inc. Annual Report on Form 10-K for the fiscal year ended December 31, 2009.
|
||
|
(10)
|
Entegris, Inc. 2012 RSU Unit Award Agreement*
|
Exhibit 10.2 to Entegris, Inc. Quarterly Report on Form 10-Q for the fiscal period ended March 31, 2012
|
||
|
(10)
|
Entegris, Inc. 2012 Stock Option Grant Agreement*
|
Exhibit 10.3 to Entegris, Inc. Quarterly Report on Form 10-Q for the fiscal period ended March 31, 2012
|
||
|
(10)
|
Entegris, Inc. 401(k) Savings and Profit Sharing Plan (2012 Restatement)*
|
Exhibit 10.2 to Entegris, Inc. Quarterly Report on Form 10-Q for the fiscal period ended March 31, 2012
|
||
|
(10)
|
Executive Employment Agreement, effective November 28, 2012, between the Registrant and Bertrand Loy*
|
Exhibit 10.1 to Entegris, Inc. Annual Report on Form 10-K for the fiscal year ended December 31, 2012
|
||
|
(10)
|
2011 RSU Unit Award Agreement*
|
Exhibit 10.2 to Entegris, Inc. Annual Report on Form 10-K for the fiscal year ended December 31, 2012
|
||
|
(10)
|
2011 Stock Option Award Agreement*
|
Exhibit 10.3 to Entegris, Inc. Annual Report on Form 10-K for the fiscal year ended December 31, 2012
|
||
|
(10)
|
Amendment No. 1, dated April 26, 2013, to Executive Change in Control Termination Agreement, between Entegris, Inc. and Bertrand Loy*
|
Exhibit 99.1 to Entegris, Inc. Periodic Report on Form 8-K filed with the Securities and Exchange Commission on April 26, 2013
|
||
|
(10)
|
Membrane Manufacture and Supply Transition Agreement, dated as of November 22, 2013, between Entegris, inc. and EMD Millipore Corporation
|
Exhibit 10.1 to Entegris, Inc. Annual Report on Form 10-K filed with the Securities and Exchange Commission on February 20, 2014
|
||
|
(10)
|
ABL Credit and Guaranty Agreement, dated as of April 30, 2014, among the Company, certain subsidiaries of the Company as guarantors, the lenders party thereto and Goldman Sachs Bank USA as administrative agent and collateral agent
|
Exhibit 10.1 to Entegris, Inc. Current Report on Form 8-K filed with the Securities and Exchange Commission on May 1, 2014
|
||
|
(10)
|
Term Loan Credit and Guaranty Agreement, dated as of April 30, 2014, among the Company, certain subsidiaries of the Company as guarantors, the lenders party thereto and Goldman Sachs Bank USA as administrative agent and collateral agent
|
Exhibit 10.2 to Entegris, Inc. Current Report on Form 8-K filed with the Securities and Exchange Commission on May 1, 2014
|
||
|
(10)
|
ABL Pledge and Security Agreement, dated as of April 30, 2014, among the Company, certain subsidiaries of the Company as guarantors, the lenders party thereto and Goldman Sachs Bank USA as collateral agent
|
Exhibit 10.3 to Entegris, Inc. Current Report on Form 8-K filed with the Securities and Exchange Commission on May 1, 2014
|
||
57
|
(10)
|
Term Loan Pledge and Security Agreement, dated as of April 30, 2014, among the Company, certain subsidiaries of the Company as guarantors, the lenders party thereto and Goldman Sachs Bank USA as collateral agent
|
Exhibit 10.4 to Entegris, Inc. Current Report on Form 8-K filed with the Securities and Exchange Commission on May 1, 2014
|
||
|
(10)
|
ABL Intercreditor Agreement, dated as of April 30, 2014, among Goldman Sachs Bank USA, as ABL Collateral Agent, Goldman Sachs Bank USA, as Term Collateral Agent, and acknowledged by the Company and its wholly owned domestic subsidiaries
|
Exhibit 10.5 to Entegris, Inc. Current Report on Form 8-K filed with the Securities and Exchange Commission on May 1, 2014
|
||
|
(10)
|
2014 Performance Award Agreement
|
Exhibit 10.1 to Entegris, Inc. Quarterly Report on Form 10-Q filed with the Securities and Exchange Commission on October 31, 2014
|
||
|
(10)
|
Entegris, Inc. 2013 RSU Unit Award Agreement*
|
Exhibit 10.1 to Entegris, Inc. Annual Report on Form 10-K filed with the Securities and Exchange Commission on February 26, 2015
|
||
|
(10)
|
Entegris, Inc. 2013 Stock Option Grant Agreement*
|
Exhibit 10.2 to Entegris, Inc. Annual Report on Form 10-K filed with the Securities and Exchange Commission on February 26, 2015
|
||
|
(10)
|
Entegris, Inc. 2014 RSU Unit Award Agreement*
|
Exhibit 10.3 to Entegris, Inc. Annual Report on Form 10-K filed with the Securities and Exchange Commission on February 26, 2015
|
||
|
(10)
|
Entegris, Inc. 2014 Stock Option Grant Agreement*
|
Exhibit 10.4 to Entegris, Inc. Annual Report on Form 10-K filed with the Securities and Exchange Commission on February 26, 2015
|
||
|
(10)
|
Letter Agreement, dated November 13, 2014, between Registrant and Gregory Morris*
|
Exhibit 10.5 to Entegris, Inc. Annual Report on Form 10-K filed with the Securities and Exchange Commission on February 26, 2015
|
||
* A “management contract or compensatory plan”
B.
The Company hereby files as exhibits to this Annual Report on Form 10-K the following documents:
Reg. S-K
58
|
Reference
|
Exhibit No.
|
Documents Filed Herewith
|
||
|
(10)
|
10.1
|
Form of Revised Executive Change of Control Termination Agreement between Entegris, Inc. and certain of its executive officers executed in 2015 (other than those executive officers who executed the form previously filed)*
|
||
|
(10)
|
10.2
|
Entegris, Inc. 2015 Performance Share Award Agreement*
|
||
|
(10)
|
10.3
|
Entegris, Inc. 2015 RSU Unit Award Agreement*
|
||
|
(10)
|
10.4
|
Entegris, Inc. 2015 Stock Option Grant Agreement*
|
||
|
(21)
|
21
|
Subsidiaries of Entegris, Inc.
|
||
|
(23)
|
23
|
Consent of Independent Registered Public Accounting Firm
|
||
|
(24)
|
24
|
Power of Attorney by the Directors of Entegris, Inc.
|
||
|
(31)
|
31.1
|
Certification required by Rule 13a-14(a) in accordance with Section 302 of the Sarbanes—Oxley Act of 2002.
|
||
|
(31)
|
31.2
|
Certification required by Rule 13a-14(a) in accordance with Section 302 of the Sarbanes—Oxley Act of 2002.
|
||
|
(32)
|
32.1
|
Certification required by Rule 13a-14(b) and 18 U.S.C. Section 1350, as adopted pursuant to Section 906 of the Sarbanes-Oxley Act of 2002.
|
||
|
(32)
|
32.2
|
Certification required by Rule 13a-14(b) and 18 U.S.C. Section 1350, as adopted pursuant to Section 906 of the Sarbanes-Oxley Act of 2002.
|
||
|
(101)
|
101.INS
|
XBRL Instance Document
|
||
|
(101)
|
101.SCH
|
XBRL Taxonomy Extension Schema Document
|
||
|
(101)
|
101.CAL
|
XBRL Taxonomy Extension Calculation Linkbase Document
|
||
|
(101)
|
101.DEF
|
XBRL Taxonomy Extension Definition Linkbase Document
|
||
|
(101)
|
101.LAB
|
XBRL Taxonomy Extension Label Linkbase Document
|
||
|
(101)
|
101.PRE
|
XBRL Taxonomy Extension Presentation Linkbase Document
|
||
* A “management contract or compensatory plan”
59
SIGNATURES
Pursuant to the requirements of Section 13 or 15(d) of the Securities Exchange Act of 1934, the Registrant has duly caused this report to be signed on its behalf by the undersigned thereunto duly authorized.
|
ENTEGRIS, INC.
|
|||
|
Date: February 26, 2016
|
By
|
|
/s/ B
ERTRAND
L
OY
|
|
|
Bertrand Loy
|
||
|
|
President & Chief Executive Officer
|
||
Pursuant to the requirements of the Securities Exchange Act of 1934, this report has been signed below by the following persons on behalf of the Registrant and in the capacities and on the dates indicated.
|
S
IGNATURE
|
T
ITLE
|
D
ATE
|
||
|
/s/ B
ERTRAND
L
OY
|
President, Chief Executive Officer and Director
(Principal executive officer)
|
February 26, 2016
|
||
|
Bertrand Loy
|
||||
|
/s/ G
REGORY
B. G
RAVES
|
Executive Vice President, Chief Financial Officer & Treasurer (Principal financial officer)
|
February 26, 2016
|
||
|
Gregory B. Graves
|
||||
|
/s/ M
ICHAEL
D. S
AUER
|
Vice President, Controller & Chief Accounting Officer (Principal accounting officer)
|
February 26, 2016
|
||
|
Michael D. Sauer
|
||||
|
P
AUL
L.H. O
LSON
*
|
Director, Chairman of the Board
|
February 26, 2016
|
||
|
Paul L.H. Olson
|
||||
|
M
ICHAEL
A. B
RADLEY
*
|
Director
|
February 26, 2016
|
||
|
Michael A. Bradley
|
||||
|
M
ARVIN
D. B
URKETT
*
|
Director
|
February 26, 2016
|
||
|
Marvin D. Burkett
|
||||
|
R. N
ICHOLAS
B
URNS
*
|
Director
|
February 26, 2016
|
||
|
R. Nicholas Burns
|
||||
|
D
ANIEL
W. C
HRISTMAN
*
|
Director
|
February 26, 2016
|
||
|
Daniel W. Christman
|
||||
|
JAMES F. GENTILCORE
*
|
Director
|
February 26, 2016
|
||
|
James F. Gentilcore
|
||||
|
JAMES P. LEDERER
*
|
Director
|
February 26, 2016
|
||
|
James P. Lederer
|
||||
|
B
RIAN
F. S
ULLIVAN
*
|
Director
|
February 26, 2016
|
||
|
Brian F. Sullivan
|
||||
|
*By
|
|
/s/ PETER W. WALCOTT
|
|
PETER W. WALCOTT
, A
TTORNEY
-
IN
-F
ACT
|
||
60
EXHIBIT INDEX
Reg. S-K Item 601(b)
|
Reference
|
Exhibit No.
|
Documents Filed Herewith
|
||
|
(10)
|
10.1
|
Form of Revised Executive Change of Control Termination Agreement between Entegris, Inc. and certain of its executive officers executed in 2015 (other than those executive officers who executed the form previously filed)*
|
||
|
(10)
|
10.2
|
Entegris, Inc. 2015 Performance Share Award Agreement*
|
||
|
(10)
|
10.3
|
Entegris, Inc. 2015 RSU Unit Award Agreement*
|
||
|
(10)
|
10.4
|
Entegris, Inc. 2015 Stock Option Grant Agreement*
|
||
|
(21)
|
21
|
Subsidiaries of Entegris, Inc.
|
||
|
(23)
|
23
|
Consent of Independent Registered Public Accounting Firm
|
||
|
(24)
|
24
|
Power of Attorney by the Directors of Entegris, Inc.
|
||
|
(31)
|
31.1
|
Certification required by Rule 13a-14(a) in accordance with Section 302 of the Sarbanes—Oxley Act of 2002.
|
||
|
(31)
|
31.2
|
Certification required by Rule 13a-14(a) in accordance with Section 302 of the Sarbanes—Oxley Act of 2002.
|
||
|
(32)
|
32.1
|
Certification required by Rule 13a-14(b) and 18 U.S.C. Section 1350, as adopted pursuant to Section 906 of the Sarbanes-Oxley Act of 2002.
|
||
|
(32)
|
32.2
|
Certification required by Rule 13a-14(b) and 18 U.S.C. Section 1350, as adopted pursuant to Section 906 of the Sarbanes-Oxley Act of 2002.
|
||
|
(101)
|
101.INS
|
XBRL Instance Document
|
||
|
(101)
|
101.SCH
|
XBRL Taxonomy Extension Schema Document
|
||
|
(101)
|
101.CAL
|
XBRL Taxonomy Extension Calculation Linkbase Document
|
||
|
(101)
|
101.DEF
|
XBRL Taxonomy Extension Definition Linkbase Document
|
||
|
(101)
|
101.LAB
|
XBRL Taxonomy Extension Label Linkbase Document
|
||
|
(101)
|
101.PRE
|
XBRL Taxonomy Extension Presentation Linkbase Document
|
||
* A “management contract or compensatory plan”
61
ENTEGRIS, INC.
INDEX TO FINANCIAL STATEMENTS
|
F-2
|
|
|
F-3
|
|
|
F-4
|
|
|
F-5
|
|
|
F-6
|
|
|
F-7
|
|
|
F-9
|
|
F-1
Report of Independent Registered Public Accounting Firm
The Board of Directors and Stockholders
Entegris, Inc.:
We have audited the accompanying consolidated balance sheets of Entegris, Inc. and subsidiaries as of
December 31, 2015
and
2014
, and the related consolidated statements of operations, comprehensive income (loss), equity, and cash flows for each of the years in the three‑year period ended
December 31, 2015
. These consolidated financial statements are the responsibility of the Company’s management. Our responsibility is to express an opinion on these consolidated financial statements based on our audits.
We conducted our audits in accordance with the standards of the Public Company Accounting Oversight Board (United States). Those standards require that we plan and perform the audit to obtain reasonable assurance about whether the financial statements are free of material misstatement. An audit includes examining, on a test basis, evidence supporting the amounts and disclosures in the financial statements. An audit also includes assessing the accounting principles used and significant estimates made by management, as well as evaluating the overall financial statement presentation. We believe that our audits provide a reasonable basis for our opinion.
In our opinion, the consolidated financial statements referred to above present fairly, in all material respects, the financial position of Entegris, Inc. and subsidiaries as of
December 31, 2015
and
2014
, and the results of their operations and their cash flows for each of the years in the three‑year period ended
December 31, 2015
, in conformity with U.S. generally accepted accounting principles.
We also have audited, in accordance with the standards of the Public Company Accounting Oversight Board (United States), Entegris, Inc.’s internal control over financial reporting as of
December 31, 2015
, based on criteria established in
Internal Control - Integrated Framework (2013)
issued by the Committee of Sponsoring Organizations of the Treadway Commission (COSO), and our report dated
February 26, 2016
expressed an unqualified opinion on the effectiveness of the Company’s internal control over financial reporting.
/s/ KPMG LLP
Minneapolis, Minnesota
February 26, 2016
F-2
ENTEGRIS, INC. AND SUBSIDIARIES
|
(In thousands, except share and per share data)
|
December 31, 2015
|
December 31, 2014
|
|||||
|
ASSETS
|
|||||||
|
Current assets:
|
|||||||
|
Cash and cash equivalents
|
$
|
349,825
|
|
$
|
389,699
|
|
|
|
Short-term investments
|
2,181
|
|
4,601
|
|
|||
|
Trade accounts and notes receivable, net
|
141,409
|
|
153,961
|
|
|||
|
Inventories, net
|
173,176
|
|
163,125
|
|
|||
|
Deferred tax assets, deferred tax charges and refundable income taxes
|
18,943
|
|
30,556
|
|
|||
|
Other current assets
|
25,228
|
|
23,713
|
|
|||
|
Total current assets
|
710,762
|
|
765,655
|
|
|||
|
Property, plant and equipment, net
|
321,301
|
|
313,569
|
|
|||
|
Other assets:
|
|||||||
|
Goodwill
|
342,111
|
|
340,743
|
|
|||
|
Intangible assets, net
|
258,942
|
|
308,554
|
|
|||
|
Deferred tax assets and other noncurrent tax assets
|
7,771
|
|
5,068
|
|
|||
|
Other
|
17,053
|
|
28,502
|
|
|||
|
Total assets
|
$
|
1,657,940
|
|
$
|
1,762,091
|
|
|
|
LIABILITIES AND EQUITY
|
|||||||
|
Current liabilities:
|
|||||||
|
Long-term debt, current maturities
|
$
|
50,000
|
|
$
|
100,000
|
|
|
|
Accounts payable
|
36,916
|
|
57,417
|
|
|||
|
Accrued payroll and related benefits
|
41,891
|
|
51,164
|
|
|||
|
Other accrued liabilities
|
33,968
|
|
40,387
|
|
|||
|
Deferred tax liabilities and income taxes payable
|
12,775
|
|
13,552
|
|
|||
|
Total current liabilities
|
175,550
|
|
262,520
|
|
|||
|
Long-term debt, excluding current maturities
|
617,287
|
|
666,796
|
|
|||
|
Pension benefit obligations and other liabilities
|
24,608
|
|
25,373
|
|
|||
|
Deferred tax liabilities and other noncurrent tax liabilities
|
37,612
|
|
58,961
|
|
|||
|
Commitments and contingent liabilities
|
—
|
|
—
|
|
|||
|
Equity:
|
|||||||
|
Preferred stock, par value $.01; 5,000,000 shares authorized; none issued and outstanding
|
—
|
|
—
|
|
|||
|
Common stock, par value $.01; 400,000,000 shares authorized; issued and outstanding shares: 140,716,420 and 139,792,583
|
1,407
|
|
1,398
|
|
|||
|
Additional paid-in capital
|
848,667
|
|
830,430
|
|
|||
|
Retained deficit
|
(416
|
)
|
(80,712
|
)
|
|||
|
Accumulated other comprehensive loss
|
(46,775
|
)
|
(2,675
|
)
|
|||
|
Total equity
|
802,883
|
|
748,441
|
|
|||
|
Total liabilities and equity
|
$
|
1,657,940
|
|
$
|
1,762,091
|
|
|
See the accompanying notes to consolidated financial statements.
F-3
ENTEGRIS, INC. AND SUBSIDIARIES
CONSOLIDATED STATEMENTS OF OPERATIONS
|
(In thousands, except per share data)
|
Year ended December 31, 2015
|
Year ended December 31, 2014
|
Year ended December 31, 2013
|
||||||||
|
Net sales
|
$
|
1,081,121
|
|
$
|
962,069
|
|
$
|
693,459
|
|
||
|
Cost of sales
|
610,890
|
|
585,386
|
|
399,245
|
|
|||||
|
Gross profit
|
470,231
|
|
376,683
|
|
294,214
|
|
|||||
|
Selling, general and administrative expenses
|
198,914
|
|
231,833
|
|
137,123
|
|
|||||
|
Engineering, research and development expenses
|
105,900
|
|
87,711
|
|
55,320
|
|
|||||
|
Amortization of intangible assets
|
47,349
|
|
37,067
|
|
9,347
|
|
|||||
|
Contingent consideration fair value adjustment
|
—
|
|
(1,282
|
)
|
(1,813
|
)
|
|||||
|
Operating income
|
118,068
|
|
21,354
|
|
94,237
|
|
|||||
|
Interest expense
|
38,667
|
|
33,355
|
|
153
|
|
|||||
|
Interest income
|
(429
|
)
|
(1,336
|
)
|
(317
|
)
|
|||||
|
Other (income) expense, net
|
(12,355
|
)
|
2,727
|
|
(1,794
|
)
|
|||||
|
Income (loss) before income tax expense (benefit) and equity in net loss of affiliates
|
92,185
|
|
(13,392
|
)
|
96,195
|
|
|||||
|
Income tax expense (benefit)
|
10,202
|
|
(21,572
|
)
|
21,669
|
|
|||||
|
Equity in net loss of affiliates
|
1,687
|
|
293
|
|
—
|
|
|||||
|
Net income
|
$
|
80,296
|
|
$
|
7,887
|
|
$
|
74,526
|
|
||
|
Basic net income per common share
|
$
|
0.57
|
|
$
|
0.06
|
|
$
|
0.54
|
|
||
|
Diluted net income per common share
|
$
|
0.57
|
|
$
|
0.06
|
|
$
|
0.53
|
|
||
|
Weighted shares outstanding
|
|||||||||||
|
Basic
|
140,353
|
|
139,311
|
|
138,950
|
|
|||||
|
Diluted
|
141,121
|
|
140,062
|
|
139,618
|
|
|||||
See the accompanying notes to consolidated financial statements.
F-4
ENTEGRIS, INC. AND SUBSIDIARIES
CONSOLIDATED STATEMENTS OF COMPREHENSIVE INCOME (LOSS)
|
(In thousands)
|
Year ended December 31, 2015
|
Year ended December 31, 2014
|
Year ended December 31, 2013
|
||||||||
|
Net income
|
$
|
80,296
|
|
$
|
7,887
|
|
$
|
74,526
|
|
||
|
Other comprehensive loss, net of tax
|
|||||||||||
|
Foreign currency translation adjustments
|
(44,569
|
)
|
(26,948
|
)
|
(17,504
|
)
|
|||||
|
Reclassification of cumulative translation adjustment associated with liquidated subsidiaries
|
—
|
|
—
|
|
787
|
|
|||||
|
Unrealized gain (loss) on available-for-sale investments
|
611
|
|
(1,884
|
)
|
—
|
|
|||||
|
Reclassification adjustment associated with unrealized loss realized upon the write-down of available-for-sale investments
|
—
|
|
1,884
|
|
—
|
|
|||||
|
Pension liability adjustments, net of income tax expense (benefit) of $45, $71, and $(37) for year ended December 31, 2015, 2014, and 2013
|
(142
|
)
|
(150
|
)
|
202
|
|
|||||
|
Other comprehensive loss
|
(44,100
|
)
|
(27,098
|
)
|
(16,515
|
)
|
|||||
|
Comprehensive income (loss)
|
$
|
36,196
|
|
$
|
(19,211
|
)
|
$
|
58,011
|
|
||
See the accompanying notes to consolidated financial statements
F-5
ENTEGRIS, INC. AND SUBSIDIARIES
CONSOLIDATED STATEMENTS OF EQUITY
|
(In thousands)
|
Common
shares
outstanding
|
Common
stock
|
Additional
paid-in
capital
|
Retained
deficit
|
Foreign currency translation adjustments
|
Available-for-sale investments - Change in net unrealized gains
|
Defined benefit pension adjustments
|
Total
|
||||||||||||||||||||||
|
Balance at December 31, 2012
|
138,458
|
|
$
|
1,385
|
|
$
|
809,514
|
|
$
|
(157,038
|
)
|
$
|
41,997
|
|
$
|
—
|
|
$
|
(1,059
|
)
|
$
|
694,799
|
|
|||||||
|
Shares issued under stock plans
|
1,882
|
|
18
|
|
7,667
|
|
—
|
|
—
|
|
—
|
|
—
|
|
7,685
|
|
||||||||||||||
|
Share-based compensation expense
|
—
|
|
—
|
|
7,928
|
|
—
|
|
—
|
|
—
|
|
—
|
|
7,928
|
|
||||||||||||||
|
Repurchase and retirement of common stock
|
(1,606
|
)
|
(16
|
)
|
(9,391
|
)
|
(6,087
|
)
|
—
|
|
—
|
|
—
|
|
(15,494
|
)
|
||||||||||||||
|
Tax benefit associated with stock plans
|
—
|
|
—
|
|
3,914
|
|
—
|
|
—
|
|
—
|
|
—
|
|
3,914
|
|
||||||||||||||
|
Pension liability adjustment
|
—
|
|
—
|
|
—
|
|
—
|
|
—
|
|
—
|
|
202
|
|
202
|
|
||||||||||||||
|
Reclassification of cumulative translation adjustment associated with liquidated subsidiaries
|
—
|
|
—
|
|
—
|
|
—
|
|
787
|
|
—
|
|
—
|
|
787
|
|
||||||||||||||
|
Foreign currency translation
|
—
|
|
—
|
|
—
|
|
—
|
|
(17,504
|
)
|
—
|
|
—
|
|
(17,504
|
)
|
||||||||||||||
|
Net income
|
—
|
|
—
|
|
—
|
|
74,526
|
|
—
|
|
—
|
|
—
|
|
74,526
|
|
||||||||||||||
|
Balance at December 31, 2013
|
138,734
|
|
1,387
|
|
819,632
|
|
(88,599
|
)
|
25,280
|
|
—
|
|
(857
|
)
|
756,843
|
|
||||||||||||||
|
Shares issued under stock plans
|
1,059
|
|
11
|
|
1,069
|
|
—
|
|
—
|
|
—
|
|
—
|
|
1,080
|
|
||||||||||||||
|
Share-based compensation expense
|
—
|
|
—
|
|
8,887
|
|
—
|
|
—
|
|
—
|
|
—
|
|
8,887
|
|
||||||||||||||
|
Tax benefit associated with stock plans
|
—
|
|
—
|
|
842
|
|
—
|
|
—
|
|
—
|
|
—
|
|
842
|
|
||||||||||||||
|
Pension liability adjustment
|
—
|
|
—
|
|
—
|
|
—
|
|
—
|
|
—
|
|
(150
|
)
|
(150
|
)
|
||||||||||||||
|
Foreign currency translation
|
—
|
|
—
|
|
—
|
|
—
|
|
(26,948
|
)
|
—
|
|
—
|
|
(26,948
|
)
|
||||||||||||||
|
Net income
|
—
|
|
—
|
|
—
|
|
7,887
|
|
—
|
|
—
|
|
—
|
|
7,887
|
|
||||||||||||||
|
Balance at December 31, 2014
|
139,793
|
|
1,398
|
|
830,430
|
|
(80,712
|
)
|
(1,668
|
)
|
—
|
|
(1,007
|
)
|
748,441
|
|
||||||||||||||
|
Shares issued under stock plans
|
923
|
|
9
|
|
1,747
|
|
—
|
|
—
|
|
—
|
|
—
|
|
1,756
|
|
||||||||||||||
|
Share-based compensation expense
|
—
|
|
—
|
|
11,033
|
|
—
|
|
—
|
|
—
|
|
—
|
|
11,033
|
|
||||||||||||||
|
Tax benefit associated with stock plans
|
—
|
|
—
|
|
5,457
|
|
—
|
|
—
|
|
—
|
|
—
|
|
5,457
|
|
||||||||||||||
|
Pension liability adjustment
|
—
|
|
—
|
|
—
|
|
—
|
|
—
|
|
—
|
|
(142
|
)
|
(142
|
)
|
||||||||||||||
|
Available-for-sale investments, change in net unrealized gains, net of taxes
|
—
|
|
—
|
|
—
|
|
—
|
|
—
|
|
611
|
|
—
|
|
611
|
|
||||||||||||||
|
Foreign currency translation
|
—
|
|
—
|
|
—
|
|
—
|
|
(44,569
|
)
|
—
|
|
—
|
|
(44,569
|
)
|
||||||||||||||
|
Net income
|
—
|
|
—
|
|
—
|
|
80,296
|
|
—
|
|
—
|
|
—
|
|
80,296
|
|
||||||||||||||
|
Balance at December 31, 2015
|
140,716
|
|
$
|
1,407
|
|
$
|
848,667
|
|
$
|
(416
|
)
|
$
|
(46,237
|
)
|
$
|
611
|
|
$
|
(1,149
|
)
|
$
|
802,883
|
|
|||||||
See the accompanying notes to consolidated financial statements.
F-6
ENTEGRIS, INC. AND SUBSIDIARIES
|
(In thousands)
|
Year ended December 31, 2015
|
Year ended December 31, 2014
|
Year ended December 31, 2013
|
||||||||
|
Operating activities:
|
|||||||||||
|
Net income
|
$
|
80,296
|
|
$
|
7,887
|
|
$
|
74,526
|
|
||
|
Adjustments to reconcile net income to net cash provided by operating activities:
|
|||||||||||
|
Depreciation
|
54,305
|
|
46,637
|
|
29,468
|
|
|||||
|
Amortization
|
47,349
|
|
37,067
|
|
9,347
|
|
|||||
|
Share-based compensation expense
|
11,033
|
|
8,887
|
|
7,928
|
|
|||||
|
Charge for fair value write-up of acquired inventory sold
|
—
|
|
48,586
|
|
—
|
|
|||||
|
Provision for deferred income taxes
|
(13,313
|
)
|
(44,716
|
)
|
8,232
|
|
|||||
|
Charge for excess and obsolete inventory
|
8,311
|
|
4,513
|
|
3,963
|
|
|||||
|
Excess tax benefit from share-based compensation plans
|
(5,457
|
)
|
(842
|
)
|
(3,914
|
)
|
|||||
|
Amortization of debt issuance costs
|
3,344
|
|
5,848
|
|
—
|
|
|||||
|
Other
|
(20,299
|
)
|
2,209
|
|
(765
|
)
|
|||||
|
Changes in operating assets and liabilities, net of effects of acquisitions:
|
|||||||||||
|
Trade accounts receivable and notes receivable
|
5,212
|
|
(4,845
|
)
|
(13,363
|
)
|
|||||
|
Inventories
|
(26,670
|
)
|
(11,608
|
)
|
(441
|
)
|
|||||
|
Accounts payable and other accrued liabilities
|
(28,686
|
)
|
14,348
|
|
(4,408
|
)
|
|||||
|
Other current assets
|
654
|
|
(1,699
|
)
|
(414
|
)
|
|||||
|
Income taxes payable and refundable income taxes
|
4,955
|
|
10,975
|
|
2,731
|
|
|||||
|
Other
|
(116
|
)
|
3,176
|
|
(3,488
|
)
|
|||||
|
Net cash provided by operating activities
|
120,918
|
|
126,423
|
|
109,402
|
|
|||||
|
Investing activities:
|
|||||||||||
|
Acquisition of property and equipment
|
(71,977
|
)
|
(57,733
|
)
|
(60,360
|
)
|
|||||
|
Acquisition of business, net of cash acquired
|
—
|
|
(809,390
|
)
|
(13,358
|
)
|
|||||
|
Proceeds from sale or maturities of short-term investments
|
7,692
|
|
13,778
|
|
20,000
|
|
|||||
|
Proceeds from sale of assets held for sale
|
—
|
|
—
|
|
6,500
|
|
|||||
|
Payments for non-compete agreements
|
—
|
|
(7,517
|
)
|
—
|
|
|||||
|
Other
|
647
|
|
567
|
|
189
|
|
|||||
|
Net cash used in investing activities
|
(63,638
|
)
|
(860,295
|
)
|
(47,029
|
)
|
|||||
|
Financing activities:
|
|||||||||||
|
Proceeds from long-term debt
|
—
|
|
855,200
|
|
—
|
|
|||||
|
Payments of long-term debt
|
(100,000
|
)
|
(88,650
|
)
|
—
|
|
|||||
|
Payments for debt issuance costs
|
—
|
|
(20,747
|
)
|
—
|
|
|||||
|
Issuance of common stock from employee stock plans
|
4,264
|
|
3,559
|
|
7,685
|
|
|||||
|
Taxes paid related to net share settlement of equity awards
|
(2,508
|
)
|
(2,479
|
)
|
—
|
|
|||||
|
Repurchase and retirement of common stock
|
—
|
|
—
|
|
(15,494
|
)
|
|||||
|
Other
|
5,457
|
|
765
|
|
3,914
|
|
|||||
|
Net cash (used in) provided by financing activities
|
(92,787
|
)
|
747,648
|
|
(3,895
|
)
|
|||||
|
Effect of exchange rate changes on cash and cash equivalents
|
(4,367
|
)
|
(8,503
|
)
|
(4,471
|
)
|
|||||
|
(Decrease) increase in cash and cash equivalents
|
(39,874
|
)
|
5,273
|
|
54,007
|
|
|||||
|
Cash and cash equivalents at beginning of year
|
389,699
|
|
384,426
|
|
330,419
|
|
|||||
|
Cash and cash equivalents at end of year
|
$
|
349,825
|
|
$
|
389,699
|
|
$
|
384,426
|
|
||
F-7
Supplemental Cash Flow Information
|
(In thousands)
|
Year ended December 31, 2015
|
Year ended December 31, 2014
|
Year ended December 31, 2013
|
||||||||
|
Non-cash transactions:
|
|||||||||||
|
Equipment purchases in accounts payable
|
$
|
3,757
|
|
$
|
3,702
|
|
$
|
6,950
|
|
||
|
Schedule of interest and income taxes paid:
|
|||||||||||
|
Interest paid
|
$
|
35,126
|
|
$
|
21,919
|
|
$
|
72
|
|
||
|
Income taxes, net of refunds received
|
16,060
|
|
12,274
|
|
10,208
|
|
|||||
See accompanying notes to consolidated financial statements.
F-8
ENTEGRIS, INC.
NOTES TO CONSOLIDATED FINANCIAL STATEMENTS
DECEMBER 31, 2015
(1) SUMMARY OF SIGNIFICANT ACCOUNTING POLICIES
Nature of Operations
Entegris, Inc. (Entegris or the Company) is a leading provider of yield-enhancing materials and solutions for advanced manufacturing processes in the semiconductor and other high-technology industries.
Principles of Consolidation
The consolidated financial statements include the accounts of the Company and its majority-owned subsidiaries. Intercompany profits, transactions and balances have been eliminated in consolidation.
Use of Estimates
and Basis of Presentation
The preparation of consolidated financial statements in conformity with accounting principles generally accepted in the United States requires management to make judgments, estimates and assumptions that affect the amounts reported in the consolidated financial statements and accompanying notes. On an ongoing basis, Entegris evaluates its estimates, including those related to receivables, inventories, property, plant and equipment, intangible assets, accrued liabilities, income taxes and share-based compensation, among others. Actual results could differ from those estimates.
Cash and Cash Equivalents
Cash and cash equivalents include cash on hand and highly liquid debt securities with original maturities of three months or less, which are valued at cost and approximates fair value.
Allowance for Doubtful Accounts
An allowance for uncollectible trade receivables is estimated based on a combination of write-off history, aging analysis and any specific, known troubled accounts. The Company maintains an allowance for doubtful accounts that management believes is adequate to cover expected losses on trade receivables.
Inventories
Inventories are stated at the lower of cost or market. Cost is determined by the first-in, first-out (FIFO) method.
Property, Plant, and Equipment
Property, plant and equipment are carried at cost and are depreciated on the straight-line method over the estimated useful lives of the assets. When assets are retired or disposed of, the cost and related accumulated depreciation are removed from the accounts, and gains or losses are recognized in the same period. Maintenance and repairs are expensed as incurred, while significant additions and improvements are capitalized. Long-lived assets, including property, plant and equipment, are reviewed for impairment whenever events or changes in circumstances indicate that the carrying amount of an asset or group of assets may not be recoverable based on estimated future undiscounted cash flows. The amount of impairment, if any, is measured as the difference between the net book value and the estimated fair value of the asset(s).
Investments
The Company’s nonmarketable investments are accounted for under either the cost or equity method of accounting, as appropriate. All nonmarketable investments are periodically reviewed to determine whether declines, if any, in fair value below cost basis are other-than-temporary. If the decline in fair value is determined to be other-than-temporary, an impairment loss is recorded and the investment is written down to a new cost basis.
Fair Value of Financial Instruments
The carrying value of cash equivalents, accounts receivable, accounts payable, accrued payroll and related benefits, and other accrued liabilities approximates fair value due to the short maturity of those instruments.
The fair value of long-term debt, including current maturities, based upon models utilizing market observable (Level 2) inputs and credit risk, was
$671 million
at December 31, 2015 compared to the carrying amount of long-term debt, including current maturities, of
$667 million
.
Goodwill and Intangible Assets
Goodwill represents the excess of acquisition costs over the fair value of the net assets of businesses acquired. Goodwill is not amortized, but instead tested at least annually for impairment. Goodwill is also tested for impairment as changes in circumstances occur indicating that the carrying value may not be recoverable. At August 31,
2015
, the Company's annual testing date, it was determined there was no impairment of its goodwill.
Amortizable intangible assets include, among other items, patented, unpatented and other developed technology and customer-based intangibles, and are amortized using the straight-line method over their respective estimated useful lives of
3
to
15
years. The Company reviews intangible assets, along with other long-lived assets - primarily property, plant and equipment - for impairment if changes in circumstances or the occurrence of events suggest the remaining value may not be recoverable. At December 31,
2015
, the Company concluded there was no impairment of its intangible assets.
Derivative Financial Instruments
The Company records derivatives as assets or liabilities on the balance sheet and measures such instruments at fair value. Changes in fair value of derivatives are recorded each period in the Company’s consolidated statements of operations.
F-9
The Company periodically enters into forward foreign currency contracts to reduce exposures relating to rate changes in certain foreign currencies. Certain exposures to credit losses related to counterparty nonperformance exist. However, the Company does not anticipate nonperformance by the counterparties since they are large, well-established financial institutions. None of these derivatives is accounted for as a hedge transaction. Accordingly, changes in the fair value of forward foreign currency contracts are recorded as other (income) expense, net, in the Company’s consolidated statements of operations. The fair values of the Company’s derivative financial instruments are based on prices quoted by financial institutions for these instruments.
Foreign Currency Translation
Assets and liabilities of certain foreign subsidiaries are translated from foreign currencies into U.S. dollars at period-end exchange rates, and the resulting gains and losses arising from translation of net assets located outside the U.S. are recorded as a cumulative translation adjustment, a component of accumulated other comprehensive income in the consolidated balance sheets. Income statement amounts are translated at the weighted average exchange rates for the year. Translation adjustments are not adjusted for income taxes, as substantially all translation adjustments relate to permanent investments in non-U.S. subsidiaries. Gains and losses resulting from foreign currency transactions are included in other(income) expense, net, in the Company's consolidated statements of operations.
Revenue Recognition
Revenue and the related cost of sales are generally recognized upon shipment of the products. Revenue for product sales is recognized upon delivery, when persuasive evidence of an arrangement exists, when title and risk of loss have been transferred to the customer, collectability is reasonably assured, and pricing is fixed or determinable. Shipping and handling fees related to sales transactions are billed to customers and are recorded as revenue.
The Company sells its products throughout the world primarily to companies in the microelectronics industry. The Company performs continuing credit evaluations of its customers and generally does not require collateral. Letters of credit may be required from its customers in certain circumstances. The Company provides for estimated returns based on historical and current trends in both sales and product returns.
The Company collects various sales and value-added taxes on certain product and service sales that are accounted for on a net basis.
Shipping and Handling Costs
Shipping and handling costs incurred are recorded in cost of sales in the Company's consolidated statements of operations.
Engineering, Research and Development Expenses
Engineering, research and development costs are expensed as incurred.
Share-based Compensation
The Company measures the cost of employee services received in exchange for the award of equity instruments based on the fair value of the award at the date of grant. Compensation expense is based on the grant date fair value. The cost is recognized using the straight-line attribution method to recognize share-based compensation over the service period of the award. Because share-based compensation expense recognized in the Company's consolidated statements of operations is based on awards ultimately expected to vest, it has been reduced for expected forfeitures, which are estimated at the time of grant with such estimates revised, if necessary, in subsequent periods if actual forfeitures differ from those estimates.
Income Taxes
The Company accounts for income taxes under the asset and liability method, which requires the recognition of deferred tax assets and liabilities for the expected future tax consequences of events that have been included in the financial statements. Under this method, deferred tax assets and liabilities are determined on the basis of the differences between the financial statements and tax basis of assets and liabilities using enacted tax rates in effect for the year in which the differences are expected to reverse. The effect of a change in tax rates on deferred tax assets and liabilities is recognized in income tax expense in the period that includes the enactment date.
The Company recognizes deferred tax assets to the extent that it believes these assets are more likely than not to be realized. A valuation allowance is recorded to reduce deferred tax assets when it is more likely than not that the Company would not be able to realize all or part of its deferred tax assets. In making such a determination, the Company considers all available positive and negative evidence, including future reversals of existing temporary differences, projected future taxable income, tax-planning strategies, and results of recent operations. If the Company determines that it would be able to realize its deferred tax assets in the future in excess of their net recorded amount, the Company would make an adjustment to the deferred tax asset valuation allowance, which would reduce the provision for income taxes.
The Company’s policy for recording interest and penalties associated with audits and unrecognized tax benefits is to record such items as a component of income before taxes. Penalties and interest to be paid or received are recorded in other expense (income), net, in the statement of operations.
F-10
Comprehensive Income
(Loss)
Comprehensive income (loss) represents the change in equity resulting from items other than shareholder investments and distributions. The Company’s foreign currency translation adjustments, unrealized gains and losses on available-for-sale investments, and minimum pension liability adjustments are included in accumulated other comprehensive loss. Comprehensive income (loss) and the components of accumulated other comprehensive loss are presented in the accompanying consolidated statements of equity and comprehensive income (loss).
Recent Accounting Pronouncements
In May 2014, the Financial Standards Accounting Board (FASB) issued Accounting Standards Update No. 2014-09,
Revenue from Contracts with Customers (Topic 606)
(ASU 2014-09). ASU 2014-09 outlines a new, single comprehensive model for entities to use in accounting for revenue arising from contracts with customers and supersedes most current revenue recognition guidance, including industry-specific guidance. This new revenue recognition model provides a five-step analysis in determining when and how revenue is recognized. The new model will require revenue recognition to depict the transfer of promised goods or services to customers in an amount that reflects the consideration a company expects to receive in exchange for those goods or services. ASU 2015-14,
Revenue from Contracts with Customers (Topic 606): Deferral of the Effective Date
, which was issued in August 2015, revised the effective date for this ASU to annual and interim periods beginning on or after December 15, 2017, with early adoption permitted, but not earlier than the original effective date of annual and interim periods beginning on or after December 15, 2016, for public entities. ASU 2014-09 is effective beginning January 1, 2018. The Company is currently assessing the impact that adopting this new accounting guidance will have on its consolidated financial statements and disclosures.
In April 2015, the FASB issued Accounting Standards Update No. 2015-03,
Simplifying the Presentation of Debt Issuance Costs
(ASU No. 2015-03) which requires an entity to present debt issuance costs as a direct deduction from the carrying amount of the related debt liability on the balance sheet. The update requires retrospective application and represents a change in accounting principle. The update becomes effective January 1, 2016. Based on the balances as of December 31, 2015, the adoption of ASU No. 2015-03 will require the Company to reclassify
$11.2 million
of unamortized debt issuance costs from other current assets and other noncurrent assets to long-term debt.
In November 2015, the FASB issued ASU 2015-17,
Balance Sheet Classification of Deferred Taxes
(ASU 2015-17), requiring all deferred tax assets and liabilities, and any related valuation allowance, to be classified as noncurrent on the balance sheet. The classification change for all deferred taxes as noncurrent simplifies entities’ processes as it eliminates the need to separately identify the net current and net noncurrent deferred tax asset or liability in each jurisdiction and allocate valuation allowances. We elected to prospectively adopt the accounting standard in the beginning of our fourth quarter of fiscal 2015. Prior periods in our Consolidated Financial Statements were not retrospectively adjusted.
(2) ACQUISITIONS
ATMI
On April 30, 2014, the Company acquired ATMI, Inc. (the Merger), a Delaware corporation (ATMI), for approximately
$1.1 billion
in cash pursuant to an Agreement and Plan of Merger (the Merger Agreement), dated as of February 4, 2014. As a result of the Merger, ATMI became a wholly-owned subsidiary of the Company. The Merger was accounted for under the acquisition method of accounting and the results of operations of ATMI are included in the Company's consolidated financial statements as of and since April 30, 2014. Direct costs of
$13.3 million
associated with the acquisition of ATMI, consisting of professional and consulting fees, and bridge financing costs, were expensed as incurred in the year ended December 31, 2014. These costs are included in selling, general and administrative expense and interest expense, respectively, in the Company's consolidated statements of operations.
ATMI was a leading supplier of high-performance materials, materials packaging and materials delivery systems used worldwide in the manufacture of microelectronic devices. These products consist of “front-end” semiconductor performance materials, sub-atmospheric pressure gas delivery systems for safe handling and delivery of toxic and hazardous gases, and high-purity materials packaging and dispensing systems that allow for the reliable introduction of low volatility liquids and solids to microelectronics processes. The acquisition was executed to expand the Company’s product offering base and technological base, and enhance the leverage of its selling and administrative functions. ATMI’s sales for the year ended December 31, 2013 were approximately
$361 million
.
The purchase price of ATMI consisted of the following:
F-11
|
(In thousands):
|
|||
|
Cash paid to ATMI shareholders
|
$
|
1,099,033
|
|
|
Cash paid in settlement of share-based compensation awards
|
31,451
|
|
|
|
Total purchase price
|
1,130,484
|
|
|
|
Less cash and cash equivalents acquired
|
321,094
|
|
|
|
Total purchase price, net of cash acquired
|
$
|
809,390
|
|
Under the terms of the Merger Agreement, the Company paid
$34
per share for all outstanding common shares of ATMI (excluding treasury shares). In addition, the Company settled all outstanding share-based compensation awards held by ATMI employees at the same per share price. The acquisition method of accounting requires the Company to include the amount associated with pre-combination service as consideration in the acquisition, reflected in the table immediately above, while the fair value of the unvested portion of the awards in the amount of
$21.3 million
is recorded as expense, classified as selling, general and administrative expense, in the Company's consolidated statement of operations.
The Merger was funded with existing cash balances as well as funds raised by the Company through the issuance of debt in the form of a senior secured term loan in an aggregate principal amount of
$460 million
and senior unsecured notes in an aggregate principal amount of
$360 million
as described in note 7 to the consolidated financial statements.
The following table summarizes the allocation of the purchase price to the fair values assigned to the assets acquired and liabilities assumed at the date of the ATMI acquisition:
|
(In thousands):
|
|||
|
Accounts receivable and other current assets
|
$
|
109,965
|
|
|
Inventory
|
114,200
|
|
|
|
Property, plant and equipment
|
124,025
|
|
|
|
Identifiable intangible assets
|
297,040
|
|
|
|
Other noncurrent assets
|
8,503
|
|
|
|
Current liabilities
|
(60,943
|
)
|
|
|
Deferred tax liabilities and other noncurrent liabilities
|
(120,495
|
)
|
|
|
Net assets acquired
|
472,295
|
|
|
|
Goodwill
|
337,095
|
|
|
|
Total purchase price, net of cash acquired
|
$
|
809,390
|
|
The final valuation of assets acquired and liabilities assumed was completed in the second quarter of 2015.
The fair value write-up of acquired finished goods inventory was
$48.6 million
. This amount was recorded as an incremental cost of sales charge, amortized over the expected turn of the acquired inventory, during the year ended December 31, 2014.
The fair value of acquired property, plant and equipment of
$124.0 million
is valued at its value-in-use.
The fair value of the acquired identifiable intangible assets is
$297.0 million
. The acquired intangible assets, all of which are finite-lived, have a weighted average useful life of approximately
8.3 years
and are being amortized on a straight-line basis. The intangible assets that comprise the amount include customer relationships of
$165.1 million
(
10
-year weighted average useful life), developed technology and related trade names of
$120.8 million
(
6
-year weighted average useful life), and other intangible assets of
$11.1 million
(
7.4
-year weighted average useful life).
The fair value of acquired identifiable intangible assets was determined using the “income approach” on an individual project basis. In performing these valuations, the key underlying probability-adjusted assumptions of the discounted cash flows were projected revenues, gross margin expectations and operating cost estimates. The valuations were based on the information that was available as of the acquisition date and the expectations and assumptions that have been deemed reasonable by the Company’s management. There are inherent uncertainties and management judgment required in these determinations. The fair value measurements of the assets acquired and liabilities assumed were based on valuations involving significant unobservable inputs, or Level 3 in the fair value hierarchy.
F-12
The purchase price of ATMI exceeded the net of the acquisition-date amounts of the identifiable assets acquired and the liabilities assumed by
$337.1 million
. Cash flows used to determine the purchase price included strategic and synergistic benefits (investment value) specific to the Company, which resulted in a purchase price in excess of the fair value of identifiable net assets. The purchase price also included the fair values of other assets that were not identifiable, not separately recognizable under accounting rules (e.g., assembled workforce) or of immaterial value in addition to a going-concern element that represents the Company's ability to earn a higher rate of return on the group of assets than would be expected on the separate assets as determined during the valuation process. This additional investment value resulted in goodwill. No amount of goodwill is expected to be deductible for income tax purposes.
Subsequent to the Merger, the Company agreed to make severance payments of
$7.5 million
to ATMI executives. Under the terms of various agreements, the executives are unable to compete with the Company for specified periods. Based on the Company's analysis, the payments associated with these noncompete clauses were capitalized as finite-lived intangible assets to be amortized over periods averaging
1.6 years
. The fair value of these noncompete clauses was determined using the “income approach” on an individual executive basis, following a methodology similar to the one described above for acquired identifiable intangible assets.
Pro Forma Results (Unaudited)
The following unaudited pro forma financial information presents the combined results of operations of the Company as if the acquisition of ATMI had occurred as of the beginning of the years presented. The unaudited pro forma financial information is not necessarily indicative of what the Company’s consolidated results of operations actually would have been had the acquisition occurred at the beginning of each year. In addition, the unaudited pro forma financial information does not attempt to project the future results of operations of the combined company.
|
Year ended
|
||||||
|
(In thousands, except per share data) (Unaudited)
|
December 31, 2014
|
December 31, 2013
|
||||
|
Net sales
|
$
|
1,076,334
|
|
$
|
1,051,175
|
|
|
Net income
|
68,279
|
|
60,324
|
|
||
|
Per share amounts:
|
||||||
|
Net income per common share - basic
|
$
|
0.49
|
|
$
|
0.43
|
|
|
Net income per common share - diluted
|
0.49
|
|
0.43
|
|
||
The unaudited pro forma financial information above gives effect to the following:
|
a.
|
The elimination of transactions between Entegris and ATMI, which upon completion of the merger would be considered intercompany. This reflects the elimination of intercompany sales and associated intercompany accounts.
|
|
b.
|
Incremental amortization and depreciation expense related to the estimated fair value of identifiable intangible assets and property, plant and equipment from the purchase price allocation.
|
|
c.
|
Removal of the operating results of ATMI's discontinued operations.
|
The unaudited pro forma financial information above for the year ended December 31, 2014 excludes the purchase accounting impact of the incremental charge reported in cost of sales
for the sale of acquired inventory that was written-up to fair value of
$48.6 million
.
The pro forma data does not include data for Jetalon Solutions, Inc. for the period prior to its acquisition due to the immaterial impact on the pro forma financial information for the year ended December 31, 2014.
Jetalon
On April 1, 2013, the Company acquired substantially all the operating assets and liabilities of Jetalon Solutions, Inc. (Jetalon), a California-based supplier of fluid metrology products. The transaction was accounted for under the acquisition method of accounting and the results of operations of the entity are included in the Company's consolidated financial statements as of and since April 1, 2013. The acquisition of Jetalon’s assets and liabilities did not constitute a material business combination.
F-13
The purchase price for Jetalon included cash consideration of
$13.4 million
, funded from the Company's then-existing cash on hand, and earnout-based contingent consideration of up to
$14.5 million
based on the operating performance of Jetalon in 2013, 2014 and 2015. Costs associated with the acquisition of Jetalon were not significant and were expensed as incurred.
Upon acquisition, the Company recorded a contingent consideration obligation of
$3.1 million
representing the fair value of the earnout-based contingent consideration. This amount was estimated through a valuation model that incorporates probability-adjusted assumptions relating to the achievement of possible operating results and the likelihood of the Company making payments. This fair value measurement is based upon significant inputs not observable in the market and therefore represents a Level 3 measurement.
The purchase price of Jetalon consisted of the following:
|
(In thousands):
|
|||
|
Cash paid at closing
|
$
|
13,358
|
|
|
Contingent consideration obligation
|
3,094
|
|
|
|
Total purchase price
|
$
|
16,452
|
|
The following table summarizes the allocation of the purchase price to the fair values assigned to the assets acquired and liabilities assumed at the date of the Jetalon acquisition:
|
(In thousands):
|
||||
|
Accounts receivable, inventory and other assets
|
$
|
944
|
|
|
|
Identifiable intangible assets
|
5,634
|
|
||
|
Current liabilities
|
(216
|
)
|
||
|
Net assets acquired
|
6,362
|
|
||
|
Goodwill
|
10,090
|
|
||
|
Total purchase price
|
$
|
16,452
|
|
|
The purchase price of Jetalon, including the Company's valuation of contingent consideration, exceeded the net of the acquisition-date amounts of the identifiable assets acquired and the liabilities assumed by
$10.1 million
. Cash flows used to determine the purchase price included strategic and synergistic benefits (investment value) specific to the Company, which resulted in a purchase price in excess of the fair value of identifiable net assets. The purchase price also included the fair values of other assets that were not identifiable, not separately recognizable under accounting rules (e.g., assembled workforce) or of immaterial value in addition to a going-concern element that represents the Company's ability to earn a higher rate of return on the group of assets than would be expected on the separate assets as determined during the valuation process. This additional investment value resulted in goodwill, which is expected to be deductible for income tax purposes. The goodwill has been assigned to the Company's Fluid Management Solutions reporting unit.
The Company completed its fair value determinations for all elements of the Jetalon acquisition in 2013. Intangible assets, consisting mostly of technology-related intellectual property, are being amortized on a straight-line basis over an estimated useful life of approximately
10 years
.
Subsequent changes in the fair value of the contingent consideration obligation have been recognized as adjustments to the contingent consideration obligation and reflected in the Company's consolidated statements of operations. During the years ended December 31, 2014 and 2013, the Company updated its assessment of the contingent consideration based on the valuation methodology described above and recorded gains of
$1.3 million
and
$1.8 million
in the Company's consolidated statements of operations, resulting in the complete reversal of the initial contingent consideration obligation.
As described above, the Company acquired businesses in 2014 and 2013. As part of the accounting for these transactions, the Company allocated the purchase price of the acquired entities based on the fair value of all the assets acquired and liabilities assumed. The valuation of the assets acquired and liabilities assumed, as well as the Company's contingent consideration obligation in the case of Jetalon was based on the information that was available as of the acquisition date and the expectations and assumptions that have been deemed reasonable by the Company's management.
In performing these valuations, the Company used independent appraisals, discounted cash flows and other factors as the best evidence of fair value. The key underlying assumptions of the discounted cash flows were projected revenues, gross margin expectations and operating cost estimates. There are inherent uncertainties and management judgment required in these
F-14
determinations. No assurance can be given that the underlying assumptions will occur as projected. The fair value measurements of the assets acquired and liabilities assumed were based on valuations involving significant unobservable inputs, or Level 3 in the fair value hierarchy.
(3) TRADE ACCOUNTS AND NOTES RECEIVABLE
Trade accounts and notes receivable from customers at December 31,
2015
and
2014
consist of the following:
|
(In thousands)
|
2015
|
2014
|
|||||
|
Accounts receivable
|
$
|
138,473
|
|
$
|
151,082
|
|
|
|
Notes receivable
|
4,254
|
|
4,706
|
|
|||
|
142,727
|
|
155,788
|
|
||||
|
Less allowance for doubtful accounts
|
1,318
|
|
1,827
|
|
|||
|
$
|
141,409
|
|
$
|
153,961
|
|
||
(4) INVENTORIES
Inventories at December 31,
2015
and
2014
consist of the following:
|
(In thousands)
|
2015
|
2014
|
|||||
|
Raw materials
|
$
|
51,063
|
|
$
|
41,015
|
|
|
|
Work-in-process
|
11,644
|
|
14,190
|
|
|||
|
Finished goods
(a)
|
110,469
|
|
107,920
|
|
|||
|
$
|
173,176
|
|
$
|
163,125
|
|
||
|
(a)
|
Includes consignment inventories held by customers for
$16.1 million
and
$11.0 million
at December 31,
2015
and
2014
, respectively.
|
(5) PROPERTY, PLANT AND EQUIPMENT
Property, plant, and equipment at December 31,
2015
and
2014
consists of the following:
|
(In thousands)
|
2015
|
2014
|
Estimated
useful lives in
years
|
||||||
|
Land
|
$
|
14,630
|
|
$
|
15,064
|
|
|||
|
Buildings and improvements
|
155,337
|
|
150,450
|
|
5-35
|
||||
|
Manufacturing equipment
|
233,473
|
|
214,509
|
|
5-10
|
||||
|
Canisters and cylinders
|
54,263
|
|
42,154
|
|
3-12
|
||||
|
Molds
|
82,019
|
|
80,532
|
|
3-5
|
||||
|
Office furniture and equipment
|
98,291
|
|
99,624
|
|
3-8
|
||||
|
Construction in progress
|
25,128
|
|
27,185
|
|
|||||
|
663,141
|
|
629,518
|
|
||||||
|
Less accumulated depreciation
|
341,840
|
|
315,949
|
|
|||||
|
$
|
321,301
|
|
$
|
313,569
|
|
||||
The table below sets forth the depreciation expense for the years ended December 31,
2015
,
2014
, and
2013
:
|
(In thousands)
|
2015
|
2014
|
2013
|
||||||||
|
Depreciation expense
|
$
|
54,305
|
|
$
|
46,637
|
|
$
|
29,468
|
|
||
(6) GOODWILL AND INTANGIBLE ASSETS
Goodwill activity for each of the Company's two reportable segments, Critical Materials Handling (CMH) and Electronic Materials (EM), for the years ended December 31,
2015
and
2014
is shown below:
F-15
|
(In thousands)
|
CMH
|
EM
|
Total
|
||||||||
|
December 31, 2013
|
$
|
12,274
|
|
$
|
—
|
|
$
|
12,274
|
|
||
|
Addition due to acquisition
|
35,329
|
|
296,795
|
|
332,124
|
|
|||||
|
Other, including foreign currency translation
|
(120
|
)
|
(3,535
|
)
|
(3,655
|
)
|
|||||
|
December 31, 2014
|
47,483
|
|
293,260
|
|
340,743
|
|
|||||
|
Addition due to purchase accounting adjustments
|
—
|
|
4,972
|
|
4,972
|
|
|||||
|
Other, including foreign currency translation
|
(72
|
)
|
(3,532
|
)
|
(3,604
|
)
|
|||||
|
December 31, 2015
|
$
|
47,411
|
|
$
|
294,700
|
|
$
|
342,111
|
|
||
As of December 31,
2015
, goodwill amounted to approximately
$342.1 million
, an increase of
$1.4 million
from the balance at December 31,
2014
. The increase in goodwill in 2015 relates to the final purchase accounting adjustments related to the acquisition of ATMI completed in April 2014 as described in note 2. The increase was partially offset by the foreign currency translation adjustments.
Identifiable intangible assets at December 31,
2015
and
2014
consist of the following:
|
2015
|
|||||||||||||
|
(In thousands)
|
Gross carrying
Amount
|
Accumulated
amortization
|
Net carrying
value
|
Weighted
average life in
years
|
|||||||||
|
Patents
|
$
|
1,315
|
|
$
|
900
|
|
$
|
415
|
|
9.8
|
|||
|
Developed technology
|
199,377
|
|
101,983
|
|
97,394
|
|
6.6
|
||||||
|
Trademarks and trade names
|
17,085
|
|
10,905
|
|
6,180
|
|
9.8
|
||||||
|
Customer relationships
|
218,283
|
|
72,948
|
|
145,335
|
|
10.3
|
||||||
|
Other
|
16,766
|
|
7,148
|
|
9,618
|
|
6.6
|
||||||
|
$
|
452,826
|
|
$
|
193,884
|
|
$
|
258,942
|
|
8.5
|
||||
|
2014
|
|||||||||||||
|
(In thousands)
|
Gross carrying
amount
|
Accumulated
amortization
|
Net carrying
value
|
Weighted
average life in
years
|
|||||||||
|
Patents
|
$
|
1,347
|
|
$
|
779
|
|
$
|
568
|
|
9.8
|
|||
|
Developed technology
|
199,402
|
|
78,785
|
|
120,617
|
|
6.6
|
||||||
|
Trademarks and trade names
|
17,152
|
|
8,883
|
|
8,269
|
|
9.8
|
||||||
|
Customer relationships
|
220,420
|
|
54,452
|
|
165,968
|
|
10.3
|
||||||
|
Other
|
16,768
|
|
3,636
|
|
13,132
|
|
6.6
|
||||||
|
$
|
455,089
|
|
$
|
146,535
|
|
$
|
308,554
|
|
8.5
|
||||
The table below sets forth the amortization expense for the years ended December 31,
2015
,
2014
, and
2013
:
|
(In thousands)
|
2015
|
2014
|
2013
|
||||||||
|
Amortization expense
|
$
|
47,349
|
|
$
|
37,067
|
|
$
|
9,347
|
|
||
The amortization expense for each of the five succeeding years and thereafter relating to intangible assets currently recorded in the Company's consolidated balance sheets is estimated to be the following at December 31,
2015
:
F-16
|
Fiscal year ending December 31
|
(In thousands)
|
||
|
2016
|
$
|
44,802
|
|
|
2017
|
43,936
|
|
|
|
2018
|
40,797
|
|
|
|
2019
|
38,557
|
|
|
|
2020
|
28,743
|
|
|
|
Thereafter
|
62,107
|
|
|
|
$
|
258,942
|
|
|
(7) DEBT
Long-term debt at December 31,
2015
consists of the following:
|
(In thousands)
|
December 31, 2015
|
December 31, 2014
|
|||||
|
Senior secured term loan facility due 2021
|
$
|
307,287
|
|
$
|
406,796
|
|
|
|
Senior unsecured notes due 2022
|
360,000
|
|
360,000
|
|
|||
|
Total long-term debt
|
667,287
|
|
766,796
|
|
|||
|
Less current maturities of long-term debt
|
50,000
|
|
100,000
|
|
|||
|
Long-term debt less current maturities
|
$
|
617,287
|
|
$
|
666,796
|
|
|
Annual maturities of long-term debt contractually due as of December 31,
2015
are as follows:
|
Fiscal year ending
|
(In thousands)
|
||
|
2016
|
$
|
—
|
|
|
2017
|
—
|
|
|
|
2018
|
—
|
|
|
|
2019
|
—
|
|
|
|
2020
|
—
|
|
|
|
Thereafter
|
667,287
|
|
|
|
$
|
667,287
|
|
|
During the year ended December 31, 2015, the Company made payments of
$100.0 million
on the Term Loan Facility. As of December 31, 2015, under the terms of the Term Loan Facility, the Company is not obligated to remit payments on the Term Loan Facility in 2016. However, based on management's plans and intent, the Company reflects
$50 million
as the current maturity of long-term debt in its consolidated balance sheet as of December 31, 2015.
As described in note 2 to the consolidated financial statements, the Company issued debt with a principal amount of
$820 million
to supply the funding required to complete its acquisition of ATMI. Debt issuance costs of
$2.3 million
paid directly to lending institutions are recorded as a debt discount, while debt issuance costs of
$20.7 million
paid to third parties are capitalized as debt issuance costs, and reflected within other current and other noncurrent assets. These debt issuance costs are being amortized as interest expense over the term of the debt instrument using the effective-interest method for the senior secured term loan facility and senior unsecured notes, and the straight-line method for the senior secured asset-based revolving credit facility. In the years ended December 31, 2015 and 2014, the Company expensed debt issuance costs of
$3.3 million
and
$5.8 million
, respectively, including
$4.0 million
for bridge financing fees paid for the availability of funding for the acquisition of ATMI in 2014. These amounts are included in interest expense in the Company's consolidated statements of operations.
Senior Secured Term Loan Facility and Security Agreement
On
April 30, 2014
, the Company entered into a term loan credit and guaranty agreement with Goldman Sachs Bank USA, as administrative agent, collateral agent, sole lead arranger, sole bookrunner and sole syndication agent (the Term Loan Facility), that provides senior secured financing of
$460 million
(which may be increased by up to
$225 million
in certain circumstances). Borrowings under the Term Loan Facility bear interest at a rate per annum equal to, at the Company’s option, a
F-17
base rate (such as prime rate or LIBOR) plus, an applicable margin. The Company's interest rate is
3.5%
at December 31, 2015. In addition to paying interest on outstanding principal under the Term Loan Facility, the Company is required to pay customary agency fees.
The credit agreement governing the Term Loan Facility requires the Company to prepay outstanding term loans, subject to certain exceptions, with (a) up to
50%
of the Company’s annual Excess Cash Flow (as defined in the credit agreement governing the Term Loan Facility) and (b)
100%
of the net cash proceeds of (i) certain asset sales and casualty and condemnation events, subject to reinvestment rights and certain other exceptions; and (ii) any incurrence or issuance of certain debt, other than debt permitted under the Term Loan Facility.
The Company may voluntarily prepay outstanding loans under the Term Loan Facility at any time without premium or penalty other than customary “breakage” costs with respect to LIBOR loans.
All obligations under the Term Loan Facility are unconditionally guaranteed by certain of the Company’s existing wholly owned domestic subsidiaries, and are secured, subject to certain exceptions, by substantially all of the Company’s assets and the assets of the Company's subsidiary guarantors.
The Term Loan Facility contains a number of negative covenants that, subject to certain exceptions, restrict the Company’s ability and each of the Company’s subsidiaries' ability to incur additional indebtedness; pay dividends on its capital stock or redeem, repurchase or retire its capital stock or its other indebtedness; make investments, loans and acquisitions; create restrictions on the payment of dividends or other amounts to the Company from the Company’s restricted subsidiaries; engage in transactions with its affiliates; sell assets, including capital stock of its subsidiaries; materially alter the business it conducts; consolidate or merge; incur liens; and engage in sale-leaseback transactions. The credit agreement governing the Term Loan Facility additionally contains certain customary representations and warranties, affirmative covenants and provisions relating to events of default. The Company is in compliance with all of the above covenants at December 31,
2015
.
2022 Senior Unsecured Notes
On
April 1, 2014
, the Company issued
$360 million
aggregate principal amount of
6%
senior unsecured notes due
April 1, 2022
(the 2022 Senior Unsecured Notes). The 2022 Senior Unsecured Notes were issued under an indenture dated as of April 1, 2014 (the 2022 Senior Unsecured Notes Indenture) by and among the Company and Wells Fargo Bank, National Association, as trustee (the 2022 Senior Unsecured Notes Trustee). Interest on the 2022 Senior Unsecured Notes is payable semi-annually in arrears on April 1 and October 1, commencing October 1, 2014.
The 2022 Senior Unsecured Notes are guaranteed, jointly and severally, fully and unconditionally, on an unsecured senior basis, by each of the Company’s domestic subsidiaries (the Guarantors) that guarantee indebtedness under the Company’s senior secured term loan facility and senior secured asset-based revolving credit facility (Senior Secured Credit Facilities).
As provided in the Senior Unsecured Notes Indenture, the Company may at its option on one or more occasions redeem all or a part of the 2022 Senior Unsecured Notes at a redemption price equal to (a)
100%
of the principal amount of the 2022 Senior Unsecured Notes redeemed plus
a make-whole premium if redeemed prior to
April 1, 2017
, or (b) a percentage of principal amount between a percentage from
100%
and
104.5%
of the aggregate principal amount of notes to be redeemed depending on the period of redemption, if redeemed on or after
April 1, 2017
, plus, in each case, accrued and unpaid interest thereto.
Upon a change in control, the Company is required to offer to purchase all of the 2022 Senior Unsecured Notes at a price in cash equal to
101%
of the aggregate principal amount thereof, plus accrued and unpaid interest, if any, to, but not including, the date of purchase.
If the Company or its subsidiaries engage in asset sales, the Company generally must either invest the net cash proceeds from such sales in its business within a period of time, prepay debt under the Senior Secured Credit Facilities or make an offer to purchase a principal amount of the 2022 Senior Unsecured Notes equal to the excess net cash proceeds, subject to certain exceptions.
The 2022 Senior Unsecured Notes Indenture contains covenants that, among other things, limit the Company’s ability and the ability of the Company’s restricted subsidiaries to pay dividends or distributions or redeem or repurchase equity; prepay subordinated debt or make certain investments, loans, advances and acquisitions; incur or guarantee additional debt, or issue certain disqualified stock and preferred stock; create liens; engage in a consolidation or merger, or sell, transfer or otherwise dispose of all or substantially all of their assets; enter into transactions with affiliates; and create restrictions on the payment of dividends or other amounts to the Company from its restricted subsidiaries. The Company is in compliance with all of the above covenants at December 31,
2015
.
F-18
The 2022 Senior Unsecured Notes Indenture also provides for events of default which, if certain of them occur, would permit the 2022 Senior Unsecured Notes Trustee or the holders of at least
25%
in aggregate principal amount of the then total outstanding 2022 Senior Unsecured Notes to declare the principal, premium, if any, interest and any other monetary obligations on all the then-outstanding 2022 Senior Unsecured Notes to be due and payable immediately.
Senior Secured Asset-Based Revolving Credit Facility and Security Agreement
On
April 30, 2014
, the Company entered into an asset-based credit agreement with Goldman Sachs Bank USA, as administrative agent, collateral agent, sole lead arranger, sole bookrunner and sole syndication agent (the ABL Facility), that provides senior secured financing of
$75 million
(which may be increased by up to
$35 million
in certain circumstances), subject to a borrowing base limitation. The borrowing base for the ABL Facility at any time equals the sum of certain percentages of various accounts and inventories and stood at
$64.9 million
at December 31,
2015
. The ABL Facility includes borrowing capacity in the form of letters of credit up to
$35 million
of the facility, and up to
$20 million
in U.S. dollars for borrowings on same-day notice, referred to as swingline loans.
Borrowings under the ABL Facility bear interest at a rate per annum equal to, at the Company’s option, a base rate (prime rate or LIBOR), plus an applicable margin. Swingline loans shall bear interest at a rate per annum equal to the base rate plus the applicable margin.
In addition to paying interest on outstanding principal under the ABL Facility, the Company is required to pay a commitment fee of
0.33%
per annum in respect of the unutilized commitments thereunder. The Company must also pay customary letter of credit fees and agency fees.
The Company may voluntarily reduce the unutilized portion of the commitment amount and repay outstanding loans at any time. Prepayments of the loans may be made without premium or penalty other than customary “breakage” costs with respect to LIBOR loans.
There is no scheduled amortization under the Company’s ABL Facility. The principal amount outstanding under the ABL Facility is due and payable in full on April 30, 2019. There is no outstanding balance under the ABL Facility at December 31,
2015
.
All obligations under the ABL Facility are unconditionally guaranteed by certain of the Company’s existing wholly owned domestic subsidiaries and are secured, subject to certain exceptions, by substantially all of the Company’s assets and the assets of the Company's subsidiaries that have guaranteed the ABL Facility.
The ABL Facility contains a number of negative covenants that, among other things, subject to certain exceptions, restrict the Company’s ability and the ability of each of the Company’s subsidiaries to incur additional indebtedness; pay dividends on its capital stock or redeem, repurchase or retire its capital stock or its other indebtedness; make investments, loans and acquisitions; create restrictions on the payment of dividends or other amounts to the Company from the Company’s restricted subsidiaries; engage in transactions with its affiliates; sell assets, including capital stock of its subsidiaries; materially alter the business it conducts; consolidate or merge; incur liens; and engage in sale-leaseback transactions.
The credit agreement governing the ABL Facility additionally contains certain customary representations and warranties, affirmative covenants and provisions relating to events of default. The Company is in compliance with all of the above covenants at December 31,
2015
.
Intercreditor Agreement
In connection with the closing of the ABL Facility and Term Loan Facility, on April 30, 2014, Goldman Sachs Bank USA, as collateral agent for the ABL Facility and as collateral agent for the Term Loan Facility, entered into an intercreditor agreement, acknowledged by the Company, which governs the relative priorities (and certain other rights) of the ABL Facility lenders and Term Loan Facility lenders pursuant the respective security agreements that each entered into with the Company and the guarantors.
(8) LEASE COMMITMENTS
As of December 31,
2015
, the Company was obligated under noncancellable operating lease agreements for certain sales offices and manufacturing facilities, manufacturing equipment, vehicles, information technology equipment and warehouse space. Future minimum lease payments for noncancellable operating leases with initial or remaining terms in excess of one year are as follows:
F-19
|
Fiscal year ending December 31
|
(In thousands)
|
||
|
2016
|
$
|
8,624
|
|
|
2017
|
6,879
|
|
|
|
2018
|
5,528
|
|
|
|
2019
|
2,037
|
|
|
|
2020
|
855
|
|
|
|
Thereafter
|
1,182
|
|
|
|
Total minimum lease payments
|
$
|
25,105
|
|
Total rental expense for all equipment and building operating leases for the years ended December 31,
2015
,
2014
, and
2013
, were
$13.8 million
,
$13.3 million
, and
$9.5 million
, respectively.
(9) ASSET RETIREMENT OBLIGATIONS
In connection with the acquisition of ATMI described in note 2, the Company assumed asset retirement obligations (AROs) related to environmental disposal obligations associated with cylinders used to supply customers with ATMI's products, and certain restoration obligations associated with its leased facilities. Prior to the acquisition, the Company also had AROs related certain restoration obligations associated with its leased facilities.
Changes in the carrying amounts of the Company’s AROs for the years ended December 31,
2015
and
2014
are shown below:
|
(In thousands)
|
|||
|
Balance at December 31, 2013
|
$
|
2,167
|
|
|
Liabilities assumed in ATMI acquisition
|
7,365
|
|
|
|
Liabilities settled
|
(128
|
)
|
|
|
Liabilities incurred
|
248
|
|
|
|
Accretion expense
|
195
|
|
|
|
Revision of estimate
|
103
|
|
|
|
Balance at December 31, 2014
|
9,950
|
|
|
|
Adjustment to liabilities assumed in ATMI acquisition
|
589
|
|
|
|
Liabilities settled
|
(698
|
)
|
|
|
Liabilities incurred
|
1,094
|
|
|
|
Accretion expense
|
196
|
|
|
|
Revision of estimate
|
203
|
|
|
|
Balance at December 31, 2015
|
$
|
11,334
|
|
ARO liabilities expected to be settled within twelve months are included in the consolidated balance sheets in other accrued liabilities, while all other ARO liabilities are included in pension benefit obligations and other liabilities in the consolidated balance sheets.
(10) INCOME TAXES
Income (loss) before income taxes for the years ended December 31,
2015
,
2014
and
2013
was derived from the following sources:
|
(In thousands)
|
2015
|
2014
|
2013
|
||||||||
|
Domestic
|
$
|
(16,751
|
)
|
$
|
(118,917
|
)
|
$
|
29,066
|
|
||
|
Foreign
|
108,936
|
|
105,525
|
|
67,129
|
|
|||||
|
Income (loss) before income tax expense (benefit) and equity in net loss of affiliates
|
$
|
92,185
|
|
$
|
(13,392
|
)
|
$
|
96,195
|
|
||
Income tax expense (benefit) for the years ended December 31,
2015
,
2014
, and
2013
is summarized as follows:
F-20
|
(In thousands)
|
2015
|
2014
|
2013
|
||||||||
|
Current:
|
|||||||||||
|
Federal
|
$
|
4,170
|
|
$
|
1,574
|
|
$
|
854
|
|
||
|
State
|
528
|
|
111
|
|
772
|
|
|||||
|
Foreign
|
18,817
|
|
21,459
|
|
12,937
|
|
|||||
|
23,515
|
|
23,144
|
|
14,563
|
|
||||||
|
Deferred (net of valuation allowance):
|
|||||||||||
|
Federal
|
(11,374
|
)
|
(41,484
|
)
|
6,003
|
|
|||||
|
State
|
(738
|
)
|
(1,545
|
)
|
(650
|
)
|
|||||
|
Foreign
|
(1,201
|
)
|
(1,687
|
)
|
1,753
|
|
|||||
|
(13,313
|
)
|
(44,716
|
)
|
7,106
|
|
||||||
|
Income tax expense (benefit)
|
$
|
10,202
|
|
$
|
(21,572
|
)
|
$
|
21,669
|
|
||
Income tax (benefit) expense differs from the expected amounts based upon the statutory federal tax rates for the years ended December 31,
2015
,
2014
, and
2013
as follows:
|
(In thousands)
|
2015
|
2014
|
2013
|
||||||||
|
Expected federal income tax at statutory rate
|
$
|
32,265
|
|
$
|
(4,687
|
)
|
$
|
33,668
|
|
||
|
State income taxes before valuation allowance, net of federal tax effect
|
(576
|
)
|
(2,115
|
)
|
(357
|
)
|
|||||
|
(Losses) income without tax (benefit) expense
|
(103
|
)
|
(72
|
)
|
22
|
|
|||||
|
Effect of foreign source income
|
(23,374
|
)
|
(19,996
|
)
|
(10,583
|
)
|
|||||
|
Tax contingencies
|
1,483
|
|
1,379
|
|
1,383
|
|
|||||
|
Valuation allowance
|
1,109
|
|
2,106
|
|
445
|
|
|||||
|
Non-deductible acquisition costs
|
363
|
|
2,176
|
|
—
|
|
|||||
|
U.S. federal research credit
|
(3,905
|
)
|
(2,085
|
)
|
(3,233
|
)
|
|||||
|
Other items, net
|
2,940
|
|
1,722
|
|
324
|
|
|||||
|
Income tax expense (benefit)
|
$
|
10,202
|
|
$
|
(21,572
|
)
|
$
|
21,669
|
|
||
As a result of commitments made by the Company related to investments in tangible property and equipment, the establishment of a research and development center in 2006 and certain employment commitments, income from certain manufacturing activities in Malaysia has been exempt from tax for years up through 2015. The income tax benefits attributable to the tax status of this subsidiary are estimated to be
$10.2 million
(
$0.07
cents per diluted share),
$8.0 million
(
$0.06
cents per diluted share), and
$5.4 million
(
$0.04
cents per diluted share) for the years ended December 31,
2015
,
2014
, and
2013
, respectively. The 2015 effective tax rate includes an additional benefit of
$4.4 million
, because the corporate tax rate in Malaysia is lower than the U.S. rate.
In 2012, ATMI's Korean subsidiary made commitments to produce a certain line of products. In return for this commitment, the Company has a tax holiday on income earned on sales of these products for five years and a partial holiday for two additional years. The income tax benefit attributable to this tax holiday are
$1.5 million
(
$0.01
per diluted share) and
$0.2 million
(
$0.00 cent
per diluted share) for the years ended December 31, 2015 and December 31, 2014, respectively. The 2015 effective tax rate includes an additional benefit of
$0.9 million
, because the corporate tax rate in Korea is lower than the U.S. rate.
The Company also has made employment and spending commitments to Singapore. In return for those commitments, the Company has been granted a partial tax holiday for five years and an additional partial tax holiday for an additional two years if the requirements are met. The income tax benefits attributable to the tax status are estimated to be
$1.7 million
(
$0.01
cents per diluted share),
$1.2 million
(
$0.01
cent per diluted share),
$0.5 million
(
$0.00
cent per diluted share) for the years ending December 31, 2015, 2014, and 2013, respectively. The 2015 effective tax rate includes an additional benefit of
$4.6 million
, because the corporate tax rate in Singapore is lower than the U.S. rate.
The 2014 effective tax rate reflects a
$2.6 million
benefit related to foreign tax credits.
F-21
The significant components of the Company’s deferred tax assets and deferred tax liabilities at December 31,
2015
and
2014
are as follows:
|
(In thousands)
|
2015
|
2014
|
|||||
|
Deferred tax assets attributable to:
|
|||||||
|
Accounts receivable
|
$
|
64
|
|
$
|
243
|
|
|
|
Inventory
|
5,491
|
|
5,663
|
|
|||
|
Accruals not currently deductible for tax purposes
|
6,661
|
|
9,915
|
|
|||
|
Net operating loss and credit carryforwards
|
12,247
|
|
12,183
|
|
|||
|
Capital loss carryforward
|
2,141
|
|
3,088
|
|
|||
|
Depreciation
|
21,834
|
|
10,498
|
|
|||
|
Equity compensation
|
4,673
|
|
3,662
|
|
|||
|
Asset impairments
|
1,751
|
|
732
|
|
|||
|
Other, net
|
3,578
|
|
5,549
|
|
|||
|
Gross deferred tax assets
|
58,440
|
|
51,533
|
|
|||
|
Valuation allowance
|
(12,724
|
)
|
(11,104
|
)
|
|||
|
Total deferred tax assets
|
45,716
|
|
40,429
|
|
|||
|
Deferred tax liabilities attributable to:
|
|||||||
|
Purchased intangible assets
|
(68,610
|
)
|
(77,149
|
)
|
|||
|
Total deferred tax liabilities
|
(68,610
|
)
|
(77,149
|
)
|
|||
|
Net deferred tax liabilities
|
$
|
(22,894
|
)
|
$
|
(36,720
|
)
|
|
Deferred tax assets are generally required to be reduced by a valuation allowance if, based on the weight of available positive and negative evidence, it is more likely than not that some portion or all of the deferred tax assets will not be realized.
As of December 31,
2015
and
2014
, the Company had a net U.S. deferred tax liability of
$12.6 million
and
$24.8 million
, respectively, which are composed of temporary differences and various tax credit carryforwards. Management believes that it is more likely than not that the benefit from certain state net operating loss carryforwards, state credits, and a federal capital loss carryforward will not be realized. In recognition of this risk, management has provided a valuation allowance of
$8.9 million
and
$10.6 million
as of December 31,
2015
and
2014
, respectively, on the related deferred tax assets. If the assumptions change and management determines the assets will be realized, the tax benefits relating to any reversal of the valuation allowance on deferred tax assets at December 31,
2015
will be recognized as a reduction of income tax expense.
As of December 31,
2015
and
2014
, the Company had a net non-U.S. deferred tax asset of
$2.4 million
and a net non-U.S. deferred tax liability of
$1.4 million
, respectively, for which management determined based upon the available evidence a valuation allowance of
$3.8 million
and
$0.5 million
as of December 31,
2015
and 2014, respectively, was required against the non-U.S. gross deferred tax assets. For other non-U.S. jurisdictions, management is relying upon projections of future taxable income to utilize deferred tax assets.
At December 31,
2015
, there were approximately
$674.0 million
of accumulated undistributed earnings of subsidiaries outside the United States, all of which are considered to be reinvested indefinitely. Management has considered its future cash needs and affirms its intention to indefinitely invest such earnings overseas to be utilized for working capital purposes, expansion of existing operations, possible acquisitions and other international items. No U.S. tax has been provided on such earnings. If they were remitted to the Company, applicable U.S. federal and foreign withholding taxes may be partially offset by available foreign tax credits. Management has concluded that it is impracticable to compute the full actual tax impact, but it estimates that
$15 million
of withholding taxes would be incurred if the
$674.0 million
were distributed.
At December 31,
2015
, the Company had state operating loss carryforwards of approximately
$5.6 million
, which begin to expire in
2019
; federal research and development credit carryforwards of approximately
$3.6 million
, which begin to expire in
2034
; and foreign operating loss carryforwards of
$12.9 million
, which begin to expire in
2017
. The Company will need approximately
$10.3 million
of certain types of domestic income by
2034
to fully utilize the credit carryforwards.
Benefits from tax positions should be recognized in the financial statements only when it is more likely than not that the tax positions will be sustained upon examination by the appropriate taxing authority that would have full knowledge of all relevant information. A tax position that meets the more-likely-than-not recognition threshold is measured at the largest amount of benefit that is greater than fifty percent likely of being realized upon ultimate settlement. Tax positions that fail to meet the more-likely-than-not recognition threshold should be recognized in the first subsequent financial reporting period in which that
F-22
threshold is met. Previously recognized tax positions that no longer meet the more-likely-than-not recognition threshold should be derecognized in the first subsequent financial reporting period in which that threshold is no longer met. The provisions also provide guidance on the accounting for and disclosure of unrecognized tax benefits, interest and penalties.
Reconciliations of the beginning and ending balances of the total amounts of gross unrecognized tax benefits for the years ended December 31,
2015
and
2014
are as follows:
|
(In thousands)
|
2015
|
2014
|
|||||
|
Gross unrecognized tax benefits at beginning of year
|
$
|
5,984
|
|
$
|
4,277
|
|
|
|
Increase from acquisition
|
—
|
|
2,431
|
|
|||
|
Decreases in tax positions for prior years
|
(51
|
)
|
(246
|
)
|
|||
|
Increases in tax positions for current year
|
2,067
|
|
2,409
|
|
|||
|
Settlements
|
(194
|
)
|
(1,385
|
)
|
|||
|
Lapse in statute of limitations
|
(185
|
)
|
(1,502
|
)
|
|||
|
Gross unrecognized tax benefits at end of year
|
$
|
7,621
|
|
$
|
5,984
|
|
|
The total amount of net unrecognized tax benefits that, if recognized, would affect the effective tax rate was
$5.7 million
at December 31,
2015
.
Penalties and interest paid or received are recorded in other income, net, in the consolidated statements of operations. For the years ended December 31,
2015
and
2014
, the Company has accrued interest and penalties related to unrecognized tax benefits of
$0.6 million
and
$0.5 million
, respectively. Benefits of
$0.1 million
,
$0.4 million
and
$0.1 million
were recognized as interest and penalties in the consolidated statements of operations for the years ended December 31,
2015
,
2014
and
2013
, respectively.
The Company files income tax returns in the U.S. and in various state, local and foreign jurisdictions. The statutes of limitations related to the consolidated Federal income tax return and state returns are closed for all years up to and including
2011
and
2011
, respectively. With respect to foreign jurisdictions, the statute of limitations varies from country to country, with the earliest open year for the Company’s major foreign subsidiaries being
2009
.
Due to the potential for resolution of a foreign examination and the expiration of various statutes of limitations, it is reasonably possible that the Company’s gross unrecognized tax benefit balance may decrease within the next twelve months by approximately
$1.3 million
.
(11) EQUITY
2010 Stock Plan
At December 31, 2009, the Company had outstanding stock awards under five stock incentive plans: the Entegris, Inc. 1999 Long-Term Incentive and Stock Option Plan; the Entegris, Inc. Outside Directors’ Option Plan and three former Mykrolis stock option plans assumed by the Company on August 10, 2005; the 2001 Equity Incentive Plan; the 2003 Employment Inducement and Acquisition Stock Option Plan; and the 2001 Non-Employee Director Stock Option Plan. On December 17, 2009, the Company’s Board of Directors approved the 2010 Stock Plan, subject to the approval of the Company’s stockholders. On May 5, 2010, the stockholders approved the 2010 Stock Plan. The 2010 Stock Plan replaced the above existing plans for future stock awards and stock option grants. Subsequent to the replacement of the prior plans on May 5, 2010, no awards were or will be made under the prior plans.
Subsequent to the acquisition of ATMI, the Company's Board of Directors approved the absorption of the ATMI, Inc. 2010 Stock Plan (ATMI Plan) into the Company's 2010 Stock Plan for the remainder of the term of the ATMI Plan.
5.7 million
additional shares became available for grant by the Company upon absorption of the ATMI Plan.
The 2010 Stock Plan provides for the issuance of stock options and other share-based awards to selected employees, directors, and other individuals or entities that provide services to the Company or its affiliates. The 2010 Stock Plan has a term of
ten
years. Under the 2010 Stock Plan, the Board of Directors or a committee selected by the Board of Directors will determine for each award, the term, price, number of shares, rate at which each award is exercisable and whether restrictions are imposed on the shares subject to the awards. The exercise price for option awards generally may not be less than the fair market value per share of the underlying common stock on the date granted. The 2010 Stock Plan allows that after December 31, 2009 any stock
F-23
awards that were awarded from the expired plans mentioned above that are forfeited, expired or otherwise terminated without issuance of such stock award again be available for issuance under the 2010 Stock Plan.
Stock Options
Stock option activity for the 2010 Stock Plan and predecessor plans for the years ended December 31,
2015
,
2014
and
2013
is summarized as follows:
|
|
2015
|
2014
|
2013
|
|||||||||||||||||
|
(Shares in thousands)
|
Number of
shares
|
Weighted
average
exercise
price
|
Number of
shares
|
Weighted
average
exercise
price
|
Number of
shares
|
Weighted
average
exercise
price
|
||||||||||||||
|
Options outstanding, beginning of year
|
2,034
|
|
$
|
9.67
|
|
1,961
|
|
$
|
8.20
|
|
2,565
|
|
$
|
8.20
|
|
|||||
|
Granted
|
411
|
|
13.49
|
|
651
|
|
11.71
|
|
553
|
|
9.88
|
|
||||||||
|
Exercised
|
(219
|
)
|
7.62
|
|
(546
|
)
|
6.56
|
|
(786
|
)
|
7.54
|
|
||||||||
|
Expired or Forfeited
|
(87
|
)
|
10.72
|
|
(32
|
)
|
14.06
|
|
(371
|
)
|
12.10
|
|
||||||||
|
Options outstanding, end of year
|
2,139
|
|
$
|
10.57
|
|
2,034
|
|
$
|
9.67
|
|
1,961
|
|
$
|
8.20
|
|
|||||
|
Options exercisable, end of year
|
961
|
|
$
|
9.07
|
|
728
|
|
$
|
7.92
|
|
1,001
|
|
$
|
6.92
|
|
|||||
Options outstanding for the Company’s stock plans at December 31,
2015
are summarized as follows:
|
(Shares in thousands)
|
Options outstanding
|
Options exercisable
|
|||||||||||||
|
Range of exercise prices
|
Number
outstanding
|
Weighted
average
remaining life
in years
|
Weighted-
average
exercise
price
|
Number
exercisable
|
Weighted
average
exercise
price |
||||||||||
|
$1.13 to $9.40
|
640
|
|
2.3 years
|
$
|
8.18
|
|
569
|
|
$
|
8.05
|
|
||||
|
$9.88 to $9.88
|
498
|
|
4.1 years
|
9.88
|
|
245
|
|
9.88
|
|
||||||
|
$11.71 to $11.71
|
590
|
|
5.1 years
|
11.71
|
|
147
|
|
11.71
|
|
||||||
|
$13.49 to $13.49
|
411
|
|
6.1 years
|
13.49
|
|
—
|
|
—
|
|
||||||
|
2,139
|
|
4.3 years
|
10.57
|
|
961
|
|
9.07
|
|
|||||||
The weighted average remaining contractual term for options outstanding and exercisable for all plans at December 31,
2015
was
4.3
years and
3.2
years, respectively.
For all plans, the Company had shares available for future grants of
10.4 million
shares,
11.6 million
shares, and
6.8 million
shares at December 31,
2015
,
2014
and
2013
, respectively.
For all plans, the total pre-tax intrinsic value of stock options exercised during the years ended December 31,
2015
and
2014
was
$1.4 million
and
$3.3 million
, respectively. The aggregate intrinsic value, which represents the total pre-tax intrinsic value based on the Company’s closing stock price of
$13.27
at December 31,
2015
, which theoretically could have been received by the option holders had all option holders exercised their options as of that date, was
$5.9 million
and
$4.0 million
for options outstanding and options exercisable, respectively.
Share-based payment awards in the form of stock option awards for
0.4 million
,
0.7 million
and
0.6 million
options were granted to employees during the years ended December 31,
2015
,
2014
, and
2013
. Compensation expense is based on the grant date fair value. The awards vest annually over a
three
-year or
four
-year period and have a contractual term of
7
years. The Company estimates the fair value of stock options using the Black-Scholes valuation model. The Company estimates the fair value of stock options using the Black-Scholes valuation model. Key inputs and assumptions used to estimate the fair value of stock options include the grant price of the award, the expected option term, volatility of the Company’s stock, the risk-free rate and the Company’s dividend yield. Estimates of fair value are not intended to predict actual future events or the value ultimately realized by employees who receive equity awards, and subsequent events are not indicative of reasonableness of the original estimates of fair value made by the Company.
The fair value of each stock option grant was estimated at the date of grant using a Black-Scholes option pricing model. The following table presents the weighted-average assumptions used in the valuation and the resulting weighted-average fair value per option granted for the years ended December 31,
2015
,
2014
and
2013
:
F-24
|
Employee stock options:
|
2015
|
2014
|
2013
|
||||||||
|
Volatility
|
34.6
|
%
|
43.3
|
%
|
51.7
|
%
|
|||||
|
Risk-free interest rate
|
1.3
|
%
|
1.1
|
%
|
0.7
|
%
|
|||||
|
Dividend yield
|
—
|
%
|
—
|
%
|
—
|
%
|
|||||
|
Expected life (years)
|
3.9
|
|
3.8
|
|
3.6
|
|
|||||
|
Weighted average fair value per option
|
$
|
3.86
|
|
$
|
3.99
|
|
$
|
3.80
|
|
||
A historical daily measurement of volatility is determined based on the expected life of the option granted. The risk-free interest rate is determined by reference to the yield on an outstanding U.S. Treasury note with a term equal to the expected life of the option granted. Expected life is determined by reference to the Company’s historical experience. The Company determines the dividend yield by dividing the expected annual dividend on the Company’s stock by the option exercise price.
Employee Stock Purchase Plan
The Company maintains the Entegris, Inc. Employee Stock Purchase Plan (ESPP). The ESPP allows employees to elect, at six-month intervals, to contribute up to
10%
of their compensation, subject to certain limitations, to purchase shares of common stock at a discount of
15%
from the fair market value on the first day or last day of each six-month period. The Company treats the ESPP as a compensatory plan. At December 31,
2015
,
0.6 million
shares remained available for issuance under the ESPP. Employees purchased
0.3 million
shares,
0.2 million
shares, and
0.2 million
shares, at a weighted-average price of
$11.21
,
$10.57
, and
$8.00
during the years ended December 31,
2015
,
2014
and
2013
, respectively.
The table below sets forth the amount of cash received by the Company from the exercise of stock options and employee contributions to the ESPP during the years ended December 31,
2015
,
2014
and
2013
:
|
(In thousands)
|
2015
|
2014
|
2013
|
||||||||
|
Exercise of stock options and employee contributions to the ESPP
|
$
|
4,049
|
|
$
|
3,117
|
|
$
|
7,685
|
|
||
Restricted Stock Awards
Restricted stock awards are awards of common stock made under the 2010 Stock Plan that are subject to restrictions on transfer and to a risk of forfeiture if the awardee terminates employment with the Company prior to the lapse of the restrictions. The value of such stock is determined using the market price on the grant date. Compensation expense for restricted stock awards is generally recognized using the straight-line single-option method. A summary of the Company’s restricted stock activity for the years ended December 31,
2015
,
2014
and
2013
is presented in the following table:
|
2015
|
2014
|
2013
|
||||||||||||||||||
|
(Shares in
thousands)
|
Number
of
shares
|
Weighted
average
grant date
fair value
|
Number
of
shares
|
Weighted
average
grant date
fair value
|
Number
of
shares
|
Weighted
average
grant date
fair value
|
||||||||||||||
|
Unvested, beginning of year
|
1,613
|
|
$
|
10.53
|
|
1,570
|
|
$
|
8.98
|
|
1,802
|
|
$
|
7.02
|
|
|||||
|
Granted
|
1,043
|
|
13.47
|
|
834
|
|
11.59
|
|
717
|
|
9.85
|
|
||||||||
|
Vested
|
(638
|
)
|
10.13
|
|
(686
|
)
|
8.32
|
|
(871
|
)
|
5.67
|
|
||||||||
|
Forfeited
|
(136
|
)
|
11.26
|
|
(105
|
)
|
10.14
|
|
(78
|
)
|
8.66
|
|
||||||||
|
Unvested, end of year
|
1,882
|
|
12.25
|
|
1,613
|
|
10.53
|
|
1,570
|
|
8.98
|
|
||||||||
The weighted average remaining contractual term for unvested restricted shares at December 31,
2015
and
2014
was
2.3
years and
2.3
years, respectively.
During the year ended December 31, 2015, Entegris, Inc. awarded performance stock for up to
0.2 million
shares to be issued upon the achievement of performance conditions (Performance shares) under the Company’s 2010 Stock Plan to certain officers and other key employees. Compensation expense is based on the grant date fair value. The awards vest on the third anniversary of the award date. The Company estimates the fair value of the Performance shares using a Monte Carlo simulation process.
As of December 31,
2015
, the total compensation cost related to unvested stock options and restricted stock awards not yet recognized was
$3.2 million
and
$17.6 million
, respectively, and is expected to be recognized over the next
2.5
years on a weighted-average basis.
F-25
Valuation and Expense Information
The Company recognizes compensation expense for all share-based payment awards made to employees and directors based on their estimated fair values on the date of grant. Share-based compensation expense is based on the value of the portion of share-based payment awards that is ultimately expected to vest during the period. The following table summarizes the allocation of share-based compensation expense related to employee stock options, restricted stock awards and grants under the employee stock purchase plan for the years ended December 31,
2015
,
2014
and
2013
:
|
(In thousands)
|
2015
|
2014
|
2013
|
||||||||
|
Cost of sales
|
$
|
1,317
|
|
$
|
809
|
|
$
|
690
|
|
||
|
Engineering, research and development expenses
|
1,000
|
|
705
|
|
502
|
|
|||||
|
Selling, general and administrative expenses
|
8,716
|
|
7,373
|
|
6,736
|
|
|||||
|
Share-based compensation expense
|
11,033
|
|
8,887
|
|
7,928
|
|
|||||
|
Tax benefit
|
3,362
|
|
2,746
|
|
2,643
|
|
|||||
|
Share-based compensation expense, net of tax
|
$
|
7,671
|
|
$
|
6,141
|
|
$
|
5,285
|
|
||
(12) BENEFIT PLANS
401(k) Plan
The Company maintains the Entegris, Inc. 401(k) Savings and Profit Sharing Plan (the 401(k) Plan) that qualifies as a deferred salary arrangement under Section 401(k) of the Internal Revenue Code. Under the Plan, eligible employees may defer a portion of their pre-tax wages, up to the Internal Revenue Service annual contribution limit. Entegris matches employees’ contributions to a maximum match of
4%
of the employee’s eligible wages. The employer matching contribution expense under the Plan was
$5.0 million
,
$4.4 million
and
$3.2 million
in the fiscal years ended December 31,
2015
,
2014
and
2013
, respectively.
Defined Benefit Plans
The employees of the Company’s subsidiaries in Japan, Taiwan and Germany are covered in defined benefit pension plans. The Company uses a December 31 measurement date for its pension plans.
The tables below set forth the Company’s estimated funded status as of December 31,
2015
and
2014
:
|
(In thousands)
|
2015
|
2014
|
|||||
|
Change in benefit obligation:
|
|||||||
|
Benefit obligation at beginning of year
|
$
|
8,482
|
|
$
|
9,855
|
|
|
|
Service cost
|
65
|
|
64
|
|
|||
|
Interest cost
|
119
|
|
111
|
|
|||
|
Actuarial loss
|
15
|
|
336
|
|
|||
|
Benefits paid
|
(1,165
|
)
|
(922
|
)
|
|||
|
Curtailments
|
(536
|
)
|
—
|
|
|||
|
Other
|
1,412
|
|
—
|
|
|||
|
Foreign exchange impact
|
(198
|
)
|
(962
|
)
|
|||
|
Benefit obligation at end of year
|
8,194
|
|
8,482
|
|
|||
|
Change in plan assets:
|
|||||||
|
Fair value of plan assets at beginning of year
|
380
|
|
384
|
|
|||
|
Return on plan assets
|
19
|
|
9
|
|
|||
|
Employer contributions
|
14
|
|
9
|
|
|||
|
Acquisitions
|
331
|
|
—
|
|
|||
|
Foreign exchange impact
|
(26
|
)
|
(22
|
)
|
|||
|
Fair value of plan assets at end of year
|
718
|
|
380
|
|
|||
|
Funded status:
|
|||||||
|
Plan assets less than benefit obligation - Net amount recognized
|
$
|
(7,476
|
)
|
$
|
(8,102
|
)
|
|
F-26
The curtailments noted above relate to revisions associated with the early termination of personnel in Taiwan.
Amounts recognized in the consolidated balance sheets consist of:
|
(In thousands)
|
2015
|
2014
|
|||||
|
Noncurrent liability
|
$
|
(7,476
|
)
|
$
|
(8,102
|
)
|
|
|
Accumulated other comprehensive loss, net of taxes
|
1,149
|
|
1,007
|
|
|||
Amounts recognized in accumulated other comprehensive loss, net of tax consist of:
|
(In thousands)
|
2015
|
2014
|
|||||
|
Net actuarial loss
|
$
|
435
|
|
$
|
1,043
|
|
|
|
Prior service cost
|
998
|
|
227
|
|
|||
|
Unrecognized transition obligation
|
—
|
|
(9
|
)
|
|||
|
Gross amount recognized
|
1,433
|
|
1,261
|
|
|||
|
Deferred income taxes
|
(284
|
)
|
(254
|
)
|
|||
|
Net amount recognized
|
$
|
1,149
|
|
$
|
1,007
|
|
|
Information for pension plans with an accumulated benefit obligation in excess of plan assets:
|
(In thousands)
|
2015
|
2014
|
|||||
|
Projected benefit obligation
|
$
|
8,194
|
|
$
|
8,482
|
|
|
|
Accumulated benefit obligation
|
6,948
|
|
7,180
|
|
|||
|
Fair value of plan assets
|
718
|
|
380
|
|
|||
The components of the net periodic benefit cost for the years ended December 31,
2015
,
2014
and
2013
were as follows:
|
(In thousands)
|
2015
|
2014
|
2013
|
||||||||
|
Pension benefits:
|
|||||||||||
|
Service cost
|
$
|
65
|
|
$
|
64
|
|
$
|
98
|
|
||
|
Interest cost
|
119
|
|
111
|
|
122
|
|
|||||
|
Expected return on plan assets
|
(17
|
)
|
(8
|
)
|
(7
|
)
|
|||||
|
Amortization of prior service cost
|
76
|
|
18
|
|
19
|
|
|||||
|
Amortization of net transition obligation
|
(1
|
)
|
(1
|
)
|
(1
|
)
|
|||||
|
Amortization of plan loss
|
28
|
|
22
|
|
219
|
|
|||||
|
Recognized actuarial net loss
|
14
|
|
7
|
|
8
|
|
|||||
|
Curtailments
|
160
|
|
—
|
|
—
|
|
|||||
|
Net periodic pension benefit cost
|
$
|
444
|
|
$
|
213
|
|
$
|
458
|
|
||
The estimated amount that will be amortized from accumulated other comprehensive income into net periodic benefit cost in
2016
is as follows:
|
(In thousands)
|
|
||
|
Prior service cost
|
$
|
63
|
|
|
Net actuarial loss
|
18
|
|
|
|
$
|
81
|
|
|
Assumptions used in determining the benefit obligation and net periodic benefit cost for the Company’s pension plans for the years ended December 31,
2015
,
2014
and
2013
are presented in the following table as weighted-averages:
F-27
|
2015
|
2014
|
2013
|
||||||
|
Benefit obligations:
|
||||||||
|
Discount rate
|
1.10
|
%
|
1.13
|
%
|
1.23
|
%
|
||
|
Rate of compensation increase
|
3.70
|
%
|
4.41
|
%
|
4.10
|
%
|
||
|
Net periodic benefit cost:
|
||||||||
|
Discount rate
|
1.94
|
%
|
1.83
|
%
|
1.41
|
%
|
||
|
Rate of compensation increase
|
4.41
|
%
|
3.38
|
%
|
2.01
|
%
|
||
|
Expected return on plan assets
|
1.76
|
%
|
1.35
|
%
|
0.70
|
%
|
||
The plans’ expected return on assets as shown above is based on management’s expectations of long-term average rates of return to be achieved by the underlying investment portfolios. In establishing this assumption, management considers historical and expected returns for the asset classes in which the plans are invested, as well as current economic and capital market conditions. The discount rate primarily used by the Company is based on market yields at the valuation date on government bonds as well as the estimated maturity of benefit payments.
Plan Assets
At December 31,
2015
and
2014
, the Company’s pension plan assets are deposited in Bank of Taiwan in the form of money market funds, where the Bank of Taiwan is the assigned funding vehicle for the statutory retirement benefit.
The fair value measurements of the Company’s pension plan assets at December 31,
2015
, by asset category are as follows:
|
(In thousands)
|
|
Quoted prices
in active
markets for
identical
assets
|
Significant
observable
inputs
|
Significant
unobservable
inputs
|
|||||||||
|
Asset category
|
Total
|
(Level 1)
|
(Level 2)
|
(Level 3)
|
|||||||||
|
Taiwan plan assets (a)
|
$
|
718
|
|
$
|
718
|
|
—
|
|
—
|
|
|||
|
$
|
718
|
|
$
|
718
|
|
—
|
|
—
|
|
||||
|
(a)
|
This category includes investments in the government of Taiwan’s pension fund. The government of Taiwan is responsible for the strategy and allocation of the investment contributions.
|
The fair value measurements of the Company’s pension plan assets at December 31,
2014
, by asset category are as follows:
|
(In thousands)
|
|
Quoted prices
in active
markets for
identical
assets
|
Significant
observable
inputs
|
Significant
unobservable
inputs
|
|||||||||
|
Asset category
|
Total
|
(Level 1)
|
(Level 2)
|
(Level 3)
|
|||||||||
|
Taiwan plan assets (a)
|
$
|
380
|
|
$
|
380
|
|
—
|
|
—
|
|
|||
|
$
|
380
|
|
$
|
380
|
|
—
|
|
—
|
|
||||
|
(a)
|
This category includes investments in the government of Taiwan’s pension fund. The government of Taiwan is responsible for the strategy and allocation of the investment contributions.
|
Cash Flows
The Company expects to make the following contributions and benefit payments:
F-28
|
(In thousands)
|
Contributions
|
Payments
|
|||||
|
2016
|
$
|
7
|
|
$
|
166
|
|
|
|
2017
|
—
|
|
278
|
|
|||
|
2018
|
—
|
|
300
|
|
|||
|
2019
|
—
|
|
161
|
|
|||
|
2020
|
—
|
|
344
|
|
|||
|
Years 2021-2025
|
—
|
|
2,514
|
|
|||
(13) FAIR VALUE MEASUREMENTS
Generally accepted accounting principles establish a fair value hierarchy that prioritizes the inputs used to measure fair value. The three levels of the fair value hierarchy are as follows:
Level 1—Quoted prices in active markets accessible at the reporting date for identical assets and liabilities.
Level 2—Quoted prices for similar assets or liabilities in active markets. Quoted prices for identical or similar assets and liabilities in markets that are not considered active or financial instruments for which all significant inputs are observable, either directly or indirectly.
Level 3—Prices or valuations that require inputs that are significant to the valuation and are unobservable.
A financial instrument’s level within the fair value hierarchy is based on the lowest level of any input that is significant to the fair value measurement.
Financial Assets Measured at Fair Value on a Recurring Basis
The following table presents the Company’s financial assets and liabilities that are measured at fair value on a recurring basis at December 31,
2015
and
2014
.
F-29
|
|
December 31, 2015
|
December 31, 2014
|
|||||||||||||||||||||||||||||
|
(In thousands)
|
Level 1
|
Level 2
|
Level 3
|
Total
|
Level 1
|
Level 2
|
Level 3
|
Total
|
|||||||||||||||||||||||
|
Assets:
|
|||||||||||||||||||||||||||||||
|
Short-term investments:
|
|||||||||||||||||||||||||||||||
|
Common stock
|
2,181
|
|
—
|
|
—
|
|
2,181
|
|
4,601
|
|
—
|
|
—
|
|
4,601
|
|
|||||||||||||||
|
Other current assets:
|
|||||||||||||||||||||||||||||||
|
Foreign exchange forward contracts asset
|
$
|
—
|
|
$
|
2,463
|
|
$
|
—
|
|
$
|
2,463
|
|
$
|
—
|
|
$
|
—
|
|
$
|
—
|
|
$
|
—
|
|
|||||||
|
Total assets measured and recorded at fair value
|
$
|
2,181
|
|
$
|
2,463
|
|
$
|
—
|
|
$
|
4,644
|
|
$
|
4,601
|
|
$
|
—
|
|
$
|
—
|
|
$
|
4,601
|
|
|||||||
|
Liabilities:
|
|||||||||||||||||||||||||||||||
|
Foreign exchange forward contracts liability
|
$
|
—
|
|
$
|
—
|
|
$
|
—
|
|
$
|
—
|
|
$
|
—
|
|
$
|
1,851
|
|
$
|
—
|
|
$
|
1,851
|
|
|||||||
|
Total liabilities measured and recorded at fair value
|
$
|
—
|
|
$
|
—
|
|
$
|
—
|
|
$
|
—
|
|
$
|
—
|
|
$
|
1,851
|
|
$
|
—
|
|
$
|
1,851
|
|
|||||||
The following table provides information about derivative positions held by the Company as of December 31,
2015
and
2014
:
|
December 31, 2015
|
December 31, 2014
|
||||||||||
|
(In thousands)
|
Gross
amounts of recognized assets |
Gross
amounts offset in the consolidated balance sheet |
Net amount
of assets in the consolidated balance sheet |
Gross
amounts of recognized liabilities |
Gross
amounts offset in the consolidated balance sheet |
Net amount of
liabilities in the consolidated balance sheet |
|||||
|
Foreign exchange forward contracts
|
$2,958
|
$495
|
$2,463
|
$4,336
|
$2,485
|
$1,851
|
|||||
Gains and losses associated with derivatives are recorded in other expense (income), net, in the consolidated statements of operations. Losses associated with derivative instruments not designated as hedging instruments for the years ended December 31,
2015
and
2014
were as follows:
|
(In thousands)
|
2015
|
2014
|
|
|
Losses on foreign currency forward contracts
|
$(10,787)
|
$(1,456)
|
|
In the years ended December 31, 2015 and 2014, the Company recorded an other-than-temporary impairment of
$0.5 million
and
$1.9 million
, respectively, related to an available-for-sale common stock investment classified in short-term investments in the consolidated balance sheet. The fair value of the investment after impairment was
$2.2 million
and
$4.6 million
at December 31, 2015 and 2014, respectively, and is classified as a Level 1 investment in the fair value hierarchy. The fair value measurement of the common stock investment was based on a quoted market price in an active market. The Company determined that it was an other-than-temporary impairment due to the significant decline in fair value compared to the acquisition cost for an extended period of time and the financial condition of the issuer.
(14) EARNINGS PER SHARE (EPS)
Basic EPS is computed by dividing net income attributable to Entegris, Inc. by the weighted average number of shares of common stock outstanding during each period. The following table presents a reconciliation of the share amounts used in the computation of basic and diluted earnings per share:
F-30
|
(In thousands)
|
2015
|
2014
|
2013
|
|||||
|
Basic earnings per share—Weighted common shares outstanding
|
140,353
|
|
139,311
|
|
138,950
|
|
||
|
Weighted common shares assumed upon exercise of options and vesting of restricted stock units
|
768
|
|
751
|
|
668
|
|
||
|
Diluted earnings per share—Weighted common shares outstanding
|
141,121
|
|
140,062
|
|
139,618
|
|
||
The Company excluded the following shares underlying stock-based awards from the calculations of diluted EPS because their inclusion would have been anti-dilutive for the years ended December 31,
2015
,
2014
and
2013
:
|
(In thousands)
|
2015
|
2014
|
2013
|
|||||
|
Shares excluded from calculations of diluted EPS
|
998
|
|
1,183
|
|
1,248
|
|
||
(15) SEGMENT INFORMATION
In 2014 the Company changed its financial segment reporting to reflect management and organizational changes made by the Company. Under the new structure, the manager of two primary segments is accountable for results at the segment profit level and reports directly to the Company’s Chief Executive Officer, who is responsible for evaluating companywide performance and resource allocation decisions between the segments, and is the chief operating decision maker. Accordingly, the Company will report its financial performance based on two reportable segments: Critical Materials Handling (CMH) and Electronic Materials (EM). The Company's two reportable segments are business divisions that provide unique products and services.
|
•
|
CMH
: provides a broad range of products that filter, handle, dispense, and protect critical materials used in the semiconductor manufacturing process and in other high-technology manufacturing. CMH’s products and subsystems include high-purity materials packaging, fluid handling and dispensing systems and liquid filters as well as microenvironment products that protect critical substrates such as wafers during shipping and manufacturing. CMH also provides specialized graphite components and specialty coatings for high-temperature applications.
|
|
•
|
EM
: provides high performance materials, materials packaging and materials delivery systems that enable high yield, cost effective semiconductor manufacturing. EM’s products consist of specialized chemistries and performance materials, gas microcontamination control systems and components, and sub-atmospheric pressure gas delivery systems for the safe and efficient handling of hazardous gases to semiconductor process equipment.
|
Inter-segment sales are not significant. Segment profit is defined as net sales less direct segment operating expenses, excluding certain unallocated expenses, consisting mainly of general and administrative costs for the Company’s human resources, finance and information technology functions as well as interest expense, amortization of intangible assets, charges for the fair value write-up of acquired inventory sold, contingent consideration fair value adjustments, income taxes and equity in net income of affiliates.
Corporate assets consist primarily of cash and cash equivalents, short-term investments, assets held for sale, investments, deferred tax assets and deferred tax charges.
Summarized financial information for the Company’s reportable segments is shown in the following tables.
F-31
|
(In thousands)
|
2015
|
2014
|
2013
|
||||||||
|
Net sales:
|
|||||||||||
|
CMH
|
$
|
671,331
|
|
$
|
653,964
|
|
$
|
609,826
|
|
||
|
EM
|
409,790
|
|
308,105
|
|
83,633
|
|
|||||
|
Total net sales
|
$
|
1,081,121
|
|
$
|
962,069
|
|
$
|
693,459
|
|
||
|
(
In thousands
)
|
2015
|
2014
|
2013
|
||||||||
|
Segment profit:
|
|||||||||||
|
CMH
|
$
|
155,212
|
|
$
|
138,379
|
|
$
|
128,910
|
|
||
|
EM
|
94,653
|
|
90,121
|
|
20,034
|
|
|||||
|
Total segment profit
|
$
|
249,865
|
|
$
|
228,500
|
|
$
|
148,944
|
|
||
|
(
In thousands
)
|
2015
|
2014
|
2013
|
||||||||
|
Total assets:
|
|||||||||||
|
CMH
|
$
|
489,433
|
|
$
|
500,575
|
|
$
|
395,291
|
|
||
|
EM
|
765,955
|
|
804,889
|
|
46,831
|
|
|||||
|
Corporate
|
402,552
|
|
456,627
|
|
433,172
|
|
|||||
|
Total assets
|
$
|
1,657,940
|
|
$
|
1,762,091
|
|
$
|
875,294
|
|
||
|
(In thousands)
|
2015
|
2014
|
2013
|
||||||||
|
Depreciation and amortization:
|
|||||||||||
|
CMH
|
$
|
37,521
|
|
$
|
37,455
|
|
$
|
32,797
|
|
||
|
EM
|
59,297
|
|
41,671
|
|
4,238
|
|
|||||
|
Corporate
|
4,836
|
|
4,578
|
|
1,780
|
|
|||||
|
Total depreciation and amortization
|
$
|
101,654
|
|
$
|
83,704
|
|
$
|
38,815
|
|
||
|
(In thousands)
|
2015
|
2014
|
2013
|
||||||||
|
Capital expenditures:
|
|||||||||||
|
CMH
|
$
|
43,646
|
|
$
|
33,619
|
|
$
|
49,893
|
|
||
|
EM
|
22,863
|
|
19,450
|
|
6,842
|
|
|||||
|
Corporate
|
5,468
|
|
4,664
|
|
3,625
|
|
|||||
|
Total capital expenditures
|
$
|
71,977
|
|
$
|
57,733
|
|
$
|
60,360
|
|
||
The following table reconciles total segment profit to income before income taxes and equity in net loss (income) of affiliates:
|
(In thousands)
|
2015
|
2014
|
2013
|
||||||||
|
Total segment profit
|
$
|
249,865
|
|
$
|
228,500
|
|
$
|
148,944
|
|
||
|
Less:
|
|||||||||||
|
Charge for fair value write-up of acquired inventory sold
|
—
|
|
48,586
|
|
—
|
|
|||||
|
Amortization of intangibles
|
47,349
|
|
37,067
|
|
9,347
|
|
|||||
|
Contingent consideration fair value adjustment
|
—
|
|
(1,282
|
)
|
(1,813
|
)
|
|||||
|
Unallocated general and administrative expenses
|
84,448
|
|
122,775
|
|
47,173
|
|
|||||
|
Operating income
|
118,068
|
|
21,354
|
|
94,237
|
|
|||||
|
Interest expense
|
38,667
|
|
33,355
|
|
153
|
|
|||||
|
Interest income
|
(429
|
)
|
(1,336
|
)
|
(317
|
)
|
|||||
|
Other (income) expense, net
|
(12,355
|
)
|
2,727
|
|
(1,794
|
)
|
|||||
|
Income (loss) before income tax expense (benefit) and equity in net loss of affiliates
|
$
|
92,185
|
|
$
|
(13,392
|
)
|
$
|
96,195
|
|
||
The following table presents amortization of intangibles for each of the Company’s segments for the years ended December 31,
2015
,
2014
and
2013
:
F-32
|
(In thousands)
|
2015
|
2014
|
2013
|
||||||||
|
Amortization of intangibles:
|
|||||||||||
|
CMH
|
$
|
9,651
|
|
$
|
10,180
|
|
$
|
8,620
|
|
||
|
EM
|
37,698
|
|
26,887
|
|
727
|
|
|||||
|
Total amortization of intangibles
|
$
|
47,349
|
|
$
|
37,067
|
|
$
|
9,347
|
|
||
The following table summarizes total net sales, based upon the country or region to which sales to external customers were made for the years ended December 31,
2015
,
2014
and
2013
:
|
(In thousands)
|
2015
|
2014
|
2013
|
||||||||
|
Net sales:
|
|||||||||||
|
United States
|
$
|
251,885
|
|
$
|
239,040
|
|
$
|
201,380
|
|
||
|
Japan
|
131,332
|
|
121,452
|
|
101,529
|
|
|||||
|
Europe
|
91,285
|
|
95,994
|
|
72,330
|
|
|||||
|
Taiwan
|
249,913
|
|
230,824
|
|
128,194
|
|
|||||
|
Singapore
|
55,409
|
|
46,051
|
|
30,942
|
|
|||||
|
South Korea
|
148,062
|
|
122,328
|
|
76,353
|
|
|||||
|
China
|
89,901
|
|
66,186
|
|
36,299
|
|
|||||
|
Other
|
63,334
|
|
40,194
|
|
46,432
|
|
|||||
|
$
|
1,081,121
|
|
$
|
962,069
|
|
$
|
693,459
|
|
|||
The following table summarizes property, plant and equipment, net, attributed to significant countries for the years ended December 31,
2015
,
2014
and
2013
:
|
(In thousands)
|
2015
|
2014
|
2013
|
||||||||
|
Property, plant and equipment:
|
|||||||||||
|
United States
|
$
|
229,558
|
|
$
|
222,125
|
|
$
|
123,846
|
|
||
|
Korea
|
32,400
|
|
32,163
|
|
4,422
|
|
|||||
|
Japan
|
23,619
|
|
22,261
|
|
24,007
|
|
|||||
|
Malaysia
|
19,878
|
|
20,607
|
|
23,801
|
|
|||||
|
Other
|
15,846
|
|
16,413
|
|
10,364
|
|
|||||
|
$
|
321,301
|
|
$
|
313,569
|
|
$
|
186,440
|
|
|||
In the years ended December 31,
2015
and 2014, one individual customer accounted for
12.4%
and
13.6%
of net sales, respectively, which includes sales from both of the Company's segments. In the year ended December 31,
2013
, no single customer accounted for ten percent or more of net sales.
(16) COMMITMENTS AND CONTINGENT LIABILITIES
The Company is subject to various claims, legal actions, and complaints arising in the ordinary course of business. The Company believes the final outcome of these matters will not have a material adverse effect on its consolidated financial statements. The Company expenses legal costs as incurred.
(17) QUARTERLY INFORMATION-UNAUDITED
|
|
Fiscal quarter ended
|
||||||||||||||
|
(In thousands, except per share data)
|
March 28, 2015
|
June 27, 2015
|
September 26, 2015
|
December 31, 2015
|
|||||||||||
|
Net sales
|
$
|
263,373
|
|
$
|
280,709
|
|
$
|
270,253
|
|
$
|
266,786
|
|
|||
|
Gross profit
|
116,536
|
|
128,087
|
|
116,310
|
|
109,298
|
|
|||||||
|
Net income
|
14,872
|
|
24,448
|
|
23,403
|
|
17,573
|
|
|||||||
|
Basic net income per common share
|
0.11
|
|
0.17
|
|
0.17
|
|
0.13
|
|
|||||||
|
Diluted net income per common share
|
0.11
|
|
0.17
|
|
0.17
|
|
0.12
|
|
|||||||
F-33
|
|
Fiscal quarter ended
|
||||||||||||||
|
(In thousands, except per share data)
|
March 29, 2014
|
June 28, 2014
|
September 27, 2014
|
December 31, 2014
|
|||||||||||
|
Net sales
|
$
|
165,804
|
|
$
|
251,578
|
|
$
|
273,054
|
|
$
|
271,633
|
|
|||
|
Gross profit
|
71,352
|
|
88,668
|
|
98,743
|
|
117,920
|
|
|||||||
|
Net income (loss)
|
14,312
|
|
(14,669
|
)
|
(1,068
|
)
|
9,312
|
|
|||||||
|
Basic net income (loss) per common share
|
0.10
|
|
(0.11
|
)
|
(0.01
|
)
|
0.07
|
|
|||||||
|
Diluted net income (loss) per common share
|
0.10
|
|
(0.11
|
)
|
(0.01
|
)
|
0.07
|
|
|||||||
(18) SUBSEQUENT EVENT
On February 5, 2016, the Company’s Board of Directors authorized a repurchase program covering up to an aggregate of
$100 million
of the Company’s common stock in open market transactions and in accordance with one or more pre-arranged stock trading plans to be established in accordance with Rule 10b5-1 under the Securities Exchange Act of 1934, as amended. The authorization expires February 17, 2017.
F-34
TABLE OF CONTENTS
Part IItem 1. BusinessItem 1A. Risk FactorsItem 1B. Unresolved Staff CommentsItem 2. PropertiesItem 3. Legal ProceedingsItem 4. Mine Safety DisclosuresPart IIItem 5. Market For Registrant S Common Equity, Related Stockholder Matters and Issuer Purchases Of Equity SecuritiesItem 6. Selected Financial DataItem 7. Management S Discussion and Analysis Of Financial Condition and Results Of OperationsItem 7A. Quantitative and Qualitative Disclosure About Market RisksItem 7A. Quantitative and Qualitative Disclosures About Market RiskItem 8. Financial Statements and Supplementary DataItem 9. Changes in and Disagreements with Accountants on Accounting and Financial DisclosureItem 9A. Controls and ProceduresItem 9B. Other InformationPart IIIItem 10. Directors, Executive Officers and Corporate GovernanceItem 11. Executive CompensationItem 12. Security Ownership Of Certain Beneficial Owners and Management and Related Stockholder MattersItem 13. Certain Relationships and Related Transactions, and Director IndependenceItem 14. Principal Accountant Fees and ServicesPart IVItem 15. Exhibits and Financial Statement SchedulesItem 601(b)