EPAM SYSTEMS, INC.
10-Ks and 10-Qs
|
|
|
|
|
|
|
|
|
|
|
|
|
|
|
|
|
|
|
|
|
|
|
|
|
|
|
|
|
|
|
|
|
|
|
|
|
|
|
|
|
|
|
|
|
|
|
UNITED STATES
SECURITIES AND EXCHANGE COMMISSION
Washington, D.C. 20549
FORM 10-K
x
ANNUAL REPORT PURSUANT TO SECTION 13 OR 15(d) OF THE SECURITIES EXCHANGE
ACT OF 1934
For the Fiscal Year Ended December 31, 2013
OR
¨
TRANSITION REPORT PURSUANT TO SECTION 13 OR 15(d) OF THE SECURITIES
EXCHANGE ACT OF 1934
Commission file number: 001-35418
EPAM SYSTEMS, INC.
(Exact Name of Registrant as Specified in its Charter)
|
Delaware
|
|
223536104
|
|
(State or other jurisdiction of incorporation or organization)
|
|
(I.R.S. Employer
Identification No.)
|
EPAM Systems, Inc.
41 University Drive,
Suite 202
Newtown, Pennsylvania 18940
(Address of principal executive offices, including zip code)
267-759-9000
(Registrant’s telephone number, including area code)
Securities registered pursuant to Section 12(b) of the Act:
|
Title of Each Class
|
|
Name of Each Exchange on Which Registered
|
|
Common Stock, par value $0.001 per share
|
|
New York Stock Exchange
|
Securities registered pursuant to Section 12(g) of the Act: None.
Indicate by check mark if the registrant is a well-known seasoned issuer, as defined in Rule 405 of the Securities Act. Yes
¨
No
x
Indicate by check mark if the registrant is not required to file reports pursuant to Section 13 or Section 15(d) of the Act. Yes
¨
No
x
Indicate by check mark whether the registrant (1) has filed all reports required to be filed by Section 13 or 15(d) of the Securities Exchange Act of 1934 during the preceding 12 months (or for such shorter period that the registrant was required to file such reports), and (2) has been subject to such filing requirements for the past 90 days. Yes
x
No
¨
Indicate by check mark whether the registrant has submitted electronically and posted on its corporate Web site, if any, every Interactive Data File required to be submitted and posted pursuant to Rule 405 of Regulation S-T during the preceding 12 months (or for such shorter period that the registrant was required to submit and post such files). Yes
x
No
¨
Indicate by check mark if disclosure of delinquent filers pursuant to Item 405 of Regulation S-K is not contained herein and will not be contained, to the best of registrant’s knowledge, in definitive proxy or information statements incorporated by reference in Part III of this Form 10-K or any amendment to this Form 10-K.
o
Indicate by check mark whether the registrant is a large accelerated filer, an accelerated filer, a non-accelerated filer, or a smaller reporting company. See the definitions of “large accelerated filer,” “accelerated filer” and “smaller reporting company” in Rule 12b-2 of the Exchange Act. (Check one):
|
Large accelerated filer
|
¨
|
Accelerated filer
|
x
|
|
Non-accelerated filer
|
¨
(Do not check if a smaller reporting company)
|
Smaller reporting company
|
¨
|
Indicate by check mark whether the registrant is a shell company (as defined in Rule 12b-2 of the Exchange Act). Yes
¨
No
x
As of June 30, 2013 the aggregate market value of the registrant’s common stock held by non-affiliates of the registrant was approximately $653.3 million based on the closing sale price as reported on the New York Stock Exchange.
The number of shares of common stock, $0.001par value, of the registrant outstanding as of March 1, 2014 was 46,848,703 shares.
DOCUMENTS INCORPORATED BY REFERENCE
The registrant intends to file a definitive Proxy Statement for its 2014 annual meeting of stockholders pursuant to Regulation 14A within 120 days of the end of the fiscal year ended December 31, 2013. Portions of the registrant’s Proxy Statement are incorporated by reference into Part III of this Form 10-K. With the exception of the portions of the Proxy Statement expressly incorporated by reference, such document shall not be deemed filed with this Form 10-K.
FORM 10-K
FOR THE YEAR ENDED DECEMBER 31, 2013
TABLE OF CONTENTS
|
|
|
|
|
|
||
|
|
||
|
|
||
|
|
||
In this annual report, “EPAM,” “EPAM Systems, Inc.,” the “Company,” “we,” “us” and “our” refer to EPAM Systems, Inc. and its consolidated subsidiaries.
“EPAM” is a trademark of EPAM Systems, Inc. “CMMI” is a trademark of the Software Engineering Institute of Carnegie Mellon University. “ISO 9001:2000” and “ISO 27001:2005” are trademarks of the International Organization for Standardization. All other trademarks and servicemarks used herein are the property of their respective owners.
Unless otherwise indicated, information contained in this annual report concerning our industry and the markets in which we operate, including our general expectations and market position, market opportunity and market share, is based on information from various sources (including industry publications, surveys and forecasts and our internal research), on assumptions that we have made, which we believe are reasonable, based on those data and other similar sources and on our knowledge of the markets for our services. The projections, assumptions and estimates of our future performance and the future performance of the industry in which we operate are necessarily subject to a high degree of uncertainty and risk due to a variety of factors, including those described under “Item 1A. Risk Factors” and elsewhere in this annual report. These and other factors could cause results to differ materially from those expressed in the estimates included in this annual report.
i
SPECIAL NOTE REGARDING FORWARD-LOOKING STATEMENTS
This annual report on Form 10-K contains estimates and forward-looking statements, principally in “Item 1. Business,” “Item 1A. Risk Factors” and “Item 7. Management’s Discussion and Analysis of Financial Condition and Results of Operations.” Our estimates and forward-looking statements are mainly based on our current expectations and estimates of future events and trends, which affect or may affect our businesses and operations. Although we believe that these estimates and forward-looking statements are based upon reasonable assumptions, they are subject to several risks and uncertainties and are made in light of information currently available to us. Important factors, in addition to the factors described in this annual report, may adversely affect our results as indicated in forward-looking statements. You should read this annual report and the documents that we have filed as exhibits hereto completely and with the understanding that our actual future results may be materially different from what we expect.
The words “may,” “will,” “should,” “could,” “expect,” “plan,” “anticipate,” “believe,” “estimate,” “predict,” “intend,” “potential,” “might,” “would,” “continue” or the negative of these terms or other comparable terminology and similar words are intended to identify estimates and forward-looking statements. Estimates and forward-looking statements speak only as of the date they were made, and, except to the extent required by law, we undertake no obligation to update, to revise or to review any estimate and/or forward-looking statement because of new information, future events or other factors. Estimates and forward-looking statements involve risks and uncertainties and are not guarantees of future performance. As a result of the risks and uncertainties described above, the estimates and forward-looking statements discussed in this annual report might not occur and our future results, level of activity, performance or achievements may differ materially from those expressed in these forward-looking statements due to, including, but not limited to, the factors mentioned above, and the differences may be material and adverse. Because of these uncertainties, you should not place undue reliance on these forward-looking statements. We undertake no obligation to update or revise any forward-looking statements, whether as a result of new information, future events, or otherwise, except as may be required under applicable law.
EMERGING GROWTH COMPANY STATUS
In April 2012, several weeks after our initial public offering in February 2012, President Obama signed into law the Jumpstart Our Business Startups Act of 2012 (the “JOBS Act”). The JOBS Act contains provisions that relax certain requirements for “emerging growth companies” that otherwise apply to larger public companies. For as long as a company retains emerging growth company status, which may be until the fiscal year-end after the fifth anniversary of its initial public offering, it will not be required to (1) provide an auditor’s attestation report on its management’s assessment of the effectiveness of its internal control over financial reporting, otherwise required by Section 404(b) of the Sarbanes-Oxley Act of 2002, (2) comply with any new or revised financial accounting standard applicable to public companies until such standard is also applicable to private companies, (3) comply with certain new requirements adopted by the Public Company Accounting Oversight Board, (4) provide certain disclosure regarding executive compensation required of larger public companies or (5) hold shareholder advisory votes on matters relating to executive compensation.
We are classified as an emerging growth company, under the JOBS Act and are eligible to take advantage of the accommodations described above for as long as we retain this status. However, we have elected not to take advantage of the transition period described in (2) above, which is the exemption provided in Section 7(a)(2)(B) of the Securities Act of 1933 and Section 13(a) of the Securities Exchange Act of 1934 (in each case as amended by the JOBS Act) for complying with new or revised financial accounting standards. We will therefore comply with new or revised financial accounting standards to the same extent that a non-emerging growth company is required to comply with such standards.
1
Overview
We are a leading provider of complex software engineering solutions and technology services with delivery capacity distributed across Central and Eastern Europe. Our clients rely on us to deliver a broad range of software engineering and IT services, with a significant share of proactive, domain-led, high-value services aimed at improving the client’s ability to innovate and cut time to market. We draw on our extensive vertical, technology and process/methodology expertise and leverage industry standard technology, tools, platforms as well a portfolio of internally and externally developed assets in our delivery. We primarily focus on building long-term partnerships with clients in industries that demand technologically advanced skills and solutions, such as independent software vendors, or ISVs and Technology, Banking and Finance, Business Information and Media, and Travel and Consumer. We deliver services to clients located primarily in North America, Western Europe, and Central and Eastern Europe, or CEE.
Since our inception in 1993, we have been serving ISVs and Technology companies. These companies produce advanced software and technology products that demand sophisticated software engineering talent, tools, methodologies and infrastructure to deliver solutions that support functionality and configurability to sustain multiple generations of platform innovation. The foundation we have built serving ISVs and technology companies has enabled us to differentiate ourselves in the market for software engineering skills and technology capabilities. Our work with these clients exposes us to their customers’ challenges across a variety of industry verticals. This has enabled us to develop vertical-specific domain expertise and grow our business in multiple industry verticals, including Banking and Financial Services, Business Information and Media, and Travel and Consumer.
Our historical core competency is full lifecycle software development and product engineering services including design and prototyping, product development and testing, component design and integration, product deployment, performance tuning, porting and cross-platform migration. We have developed extensive experience in each of these areas by working collaboratively with leading ISVs and technology companies, creating an unparalleled foundation for the evolution of our other offerings, which include custom application development, application testing, enterprise application platforms, application maintenance and support, and infrastructure management.
We believe the quality of our employees underpins our success and serves as a key point of differentiation in how we deliver a superior value proposition to our clients. Our delivery centers in Belarus, Ukraine, Russia, Hungary, Kazakhstan and Poland are strategically located in centers of software engineering talent and educational excellence across CEE, and the Commonwealth of Independent States, or the CIS. CEE includes Albania, Belarus, Bosnia and Herzegovina, Bulgaria, Croatia, Czech Republic, Estonia, Hungary, Latvia, Lithuania, Poland, Republic of Macedonia, Romania, Russia, Serbia and Montenegro, Slovakia, Slovenia, the former Yugoslav Republic of Macedonia, Turkey and Ukraine. The CIS is comprised of constituents of the former U.S.S.R., including Armenia, Azerbaijan, Belarus, Georgia, Kazakhstan, Kyrgyzstan, Moldova, Russia, Tajikistan, Turkmenistan, Ukraine and Uzbekistan. Our highly-skilled information technology, or IT, professionals, combined with our extensive experience in delivering custom solutions that meet our clients’ pressing business needs, has allowed us to develop a deep culture of software engineering excellence. We believe this culture enables us to attract, train and retain talented IT professionals.
We employ highly-educated IT professionals, nearly all of whom hold a master’s equivalent university degree in math, science or engineering and are proficient in English. To ensure we attract the best candidates from this deep talent pool, we have developed close relationships with leading universities across CEE, whereby we actively support curriculum development and engage students to identify their talents and interests. We continue to expand these efforts throughout the major talent hubs within CEE.
Since inception, we have invested significant resources into developing a proprietary suite of internal applications and tools to manage all aspects of our delivery process. These applications and tools are effective in reducing risks, such as security breaches and cost overruns, while providing control and visibility across all project lifecycle stages to both our clients and us. In addition, these applications and tools enable us to provide solutions using the optimal software product development methodologies, including iterative methodologies such as Agile development. Our applications, tools, methodologies and infrastructure allow us to seamlessly deliver services and solutions from our delivery centers to global clients, thereby further strengthening our relationships with them.
We believe we are the only
ISAE 3402 Type 2 certified IT services provider with multiple delivery centers in CEE, based on our analysis of publicly available information of IT services providers. This certification is a widely recognized auditing standard developed by the American Institute of Certified Public Accountants, or AICPA, and it serves as additional assurance to our clients that are required to validate the controls in place to protect the security of their sensitive data. Furthermore, this is an important certification for firms in data and information-intensive industries, as well as any organization that is subject to the internal controls certification requirements of the Sarbanes-Oxley Act of 2002, as amended, or the Sarbanes-Oxley Act. Our ISAE 3402 Type 2 certification, in addition to our multiple ISO/IEC 27001:2005 and ISO 9001:2008 attestations, underscores our focus on establishing stringent security standards and internal controls.
2
Our clients primarily consist of
Forbes Global 2000
corporations located in North America, Europe and the CIS. We maintain a geographically diverse client base with 50.8% of our 2013 revenues from clients located in North America, 36.1% from clients in Europe and 11.7% from clients in the CIS. Our focus on delivering quality to our clients is reflected by an average of 93.9% and 78.4% of our revenues in 2013 coming from clients that had used our services for at least one and two years, respectively. In addition, we have significantly grown the size of existing accounts. For example, from 2008 to 2013, the number of clients accounting for over $5.0 million in annual revenues increased from 7 to 22, and those accounting for $1.0 million or more in revenues increased from 42 to 95.
Our Approach
Since our inception, we have focused on software product development services, which we have refined through repeat, multi-year engagements with major ISVs. Unlike custom application development, which is usually tailored to very specific business requirements, software products of ISVs must be designed with a high level of product configurability and operational performance to address the needs of a diverse set of end-users working in multiple industries and operating in a variety of deployment environments. This demands a strong focus on upfront design and architecture, strict software engineering practices, and extensive testing procedures.
Our focus on software product development services for ISVs and technology companies requires high-quality software engineering talent, advanced knowledge of up-to-date methodologies and productivity tools, and strong project management practices. As a result, we have developed a culture focused on innovation, technology leadership and process excellence, which helps us maintain a strong reputation with our clients for technical expertise and high-quality project delivery.
Our work with ISVs and technology companies, including both global leaders in enterprise software platforms and emerging, innovative technology companies focusing on new trends, exposes us to their customers’ business and strategic challenges, allowing us to develop vertical-specific domain expertise. In-depth understanding of how vertically-oriented ISVs and technology companies solve their clients’ challenges allows us to focus and grow our business in multiple industries, including Banking and Financial Services, Business Information and Media, and Travel and Consumer.
Our Services
Our service offerings cover the full software and product development lifecycle from digital strategy and customer experience design to enterprise application platforms implementation and program management services and from complex software development services to maintenance, support, custom application development, application testing, and infrastructure management. Our key service offerings include:
Software Product Development Services
We provide a comprehensive set of software product development services including product research, customer experience design and prototyping, program management, component design and integration, full lifecycle software testing, product deployment and end-user customization, performance tuning, product support and maintenance, managed services, as well as porting and cross-platform migration. We focus on software products covering a wide range of business applications as well as product development for multiple mobile platforms and embedded software product services.
Custom Application Development Services
We offer complete custom application development services to meet the requirements of businesses with sophisticated application development needs not adequately supported by packaged applications or by existing custom solutions. Our custom application development services leverage our experience in software product development as well as our industry expertise, prebuilt application solution frameworks and specific software product assets. Our range of services includes business and technical requirements analysis, user experience design, solution architecture creation and validation, development, component design and integration, quality assurance and testing, deployment, performance tuning, support and maintenance, legacy applications re-engineering/refactoring, porting and cross-platform migration and documentation.
Application Testing Services
We maintain a dedicated group of testing and quality assurance professionals with experience across a wide range of technology platforms and industry verticals. Our Quality Management System complies with global quality standards such as ISO 9001:2008 and we employ industry-recognized and proprietary defect tracking tools to deliver a comprehensive range of testing services. Our application testing services include: (i) software application testing, including test automation tools and frameworks; (ii) testing for enterprise IT, including test management, automation, functional and non-functional testing, as well as defect management; and (iii) consulting services focused on helping clients improve their existing software testing and quality assurance practices.
3
Enterprise Application Platforms
As a proven provider of software product development services to major ISVs, we have participated in the development of industry standard technology and business application platforms and their components in such specific areas as customer relationship management and sales automation, enterprise resource planning, enterprise content management, business intelligence, e-commerce, mobile, Software-as-a-Service and cloud deployment. Our experience in such areas allows us to offer services around Enterprise Application Platforms, which include requirements analysis and platform selection, deep and complex customization, cross-platform migration, implementation and integration, as well as support and maintenance. We use our experience, custom tools and specialized knowledge to integrate our clients’ chosen application platforms with their internal systems and processes and to create custom solutions filling the gaps in their platforms’ functionality necessary to address the needs of the clients’ users and customers.
Application Maintenance and Support
We deliver application maintenance and support services through a dedicated team of IT professionals. Our application maintenance and support offerings meet rigorous CMMI and ISAE 3402 Type 2 requirements. Our clients benefit from our proprietary distributed project management processes and tools, which reduce the time and costs related to maintenance, enhancement and support activities. Our services include incident management, fault investigation diagnosis, work-around provision, application bug fixes, release management, application enhancements and third-party maintenance.
Infrastructure Management Services
Given the increased need for tighter enterprise integration between software development, testing and maintenance with private, public and mobile infrastructures, our service offerings also cover infrastructure management services. We have significant expertise in implementing large infrastructure monitoring solutions, providing real-time notification and control from the low-level infrastructure up to and including applications. Our ISAE 3402 Type 2, ISO/IEC 27001:2005 and ISO 9001:2008 certifications provide our clients with third-party verification of our information security policies. Our solutions cover the full lifecycle of infrastructure management including application, database, network, server, storage and systems operations management, as well as incident notification and resolution.
Our Verticals
Strong vertical-specific domain knowledge backed by extensive experience merging technology with the business processes of our clients allows us to deliver tailored solutions to the following industry verticals:
•
ISVs and Technology;
•
Banking and Financial Services;
•
Business Information and Media; and
•
Travel and Consumer.
We also serve the diverse technology needs of clients in the energy, telecommunications, automotive, manufacturing, insurance and life sciences industries and the government.
The following table sets forth our revenues by vertical by amount and as a percentage of our revenues for the periods presented:
|
|
Year Ended December 31,
|
|||||||||||||||||||||||
|
|
2013
|
2012
|
2011
|
|||||||||||||||||||||
|
|
(in thousands, except percent)
|
|||||||||||||||||||||||
|
Banking and Financial Services
|
$
|
156,340
|
28.2
|
%
|
$
|
111,941
|
25.8
|
%
|
$
|
76,645
|
22.9
|
%
|
||||||||||||
|
ISVs and Technology
|
134,970
|
24.3
|
106,852
|
24.6
|
84,246
|
25.2
|
||||||||||||||||||
|
Travel and Consumer
|
117,248
|
21.1
|
95,965
|
22.1
|
71,488
|
21.4
|
||||||||||||||||||
|
Business Information and Media
|
75,677
|
13.6
|
62,398
|
14.4
|
63,988
|
19.1
|
||||||||||||||||||
|
Other verticals
|
63,256
|
11.4
|
50,226
|
11.6
|
31,985
|
9.6
|
||||||||||||||||||
|
Reimbursable expenses and other revenues
|
7,626
|
1.4
|
6,417
|
1.5
|
6,176
|
1.8
|
||||||||||||||||||
|
Revenues
|
$
|
555,117
|
100.0
|
%
|
$
|
433,799
|
100.0
|
%
|
$
|
334,528
|
100.0
|
%
|
||||||||||||
ISVs and Technology.
ISVs and technology companies have a constant need for innovation and rapid time-to-market. Since inception, we have focused on providing complex software product development services to leading global ISVs and technology companies to meet these demands. Through our experience with many industry leaders, we have developed rigorous standards for software product development, as well as proprietary internal processes, methodologies and IT infrastructure. Our services span the complete software development lifecycle for software product development, testing and performance tuning, deployment and maintenance and support. We offer a comprehensive set of software development methodologies, depending on client requirements, from linear or sequential methodologies such as waterfall, to iterative methodologies such as Agile. In addition, we are establishing
4
close partner relationships with many of our ISV and technology company clients and are offering distributed professional services around their product offerings directly to our corporate clients.
Banking and Financial Services.
We established our Banking and Financial Services vertical in 2006 and have significant experience working with global retail and investment banks, investment firms, depositories, corporate treasuries, pension funds and market data providers. We offer a broad portfolio of services in asset and wealth management, corporate and retail banking, cards and payments, investment banking and brokerage, research and analysis, as well as governance, risk and compliance. We have also established a Capital Markets Competency Center, which facilitates knowledge exchange, education and collaboration across our organization and develops new software products, frameworks and components to further enhance our industry-specific solutions and services.
Business Information and Media.
We have established long term relationships with leading business information and media companies, which enable us to bring sustainable value creation and enhanced return-on-content for organizations within this vertical. Our solutions help clients develop new revenue sources, accelerate the creation, collection, packaging and management of content and reach broader audiences. We serve clients in a range of business information and media sub-sectors, including entertainment media, news providers, broadcasting companies, financial information providers, content distributors and advertising networks. Our Business Information Competency Center enables us to provide our clients with solutions that help them overcome challenges related to operating legacy systems, manage varied content formats, rationalize their online assets and lower their cost of delivery. In addition, we provide knowledge discovery platform services through our InfoNgen business, which combines custom taxonomy development with web crawling, internal file and e-mail classification, newsletter and feed publication and content trend analysis.
Travel and Consumer.
We have extensive experience in designing, implementing and supporting solutions for the travel and hospitality industry. This has led to the development of a substantial repository of knowledge components and solutions, such as our Loyalty, Marketing and Booking Engine frameworks, which results in accelerated development and implementation of solutions, while ensuring enterprise-class reliability. Our capabilities span a range of platforms, applications and solutions that businesses in travel and hospitality use to serve their customers, capture management efficiencies, control operating expenses and grow revenues.
We also work closely with leading companies in the retail and consumer industry to enable our clients to better leverage technology and address simultaneous pressures of driving value for the consumer and offering a more engaging experience. Our expertise allows us to integrate our services with our clients’ existing enterprise resource planning, billing fulfillment and customer relationship management solutions. Our digital strategy and experience design practice, EPAM Empathy Lab, provides strategy, design, creative, and program management services for clients looking to improve their customer experience. We also offer deep expertise across several domains including business-to-business and business-to-consumer e-commerce, customer/partners self-service, employee portals, online merchandising and sales, web content management, mobile solutions and billing.
Our Delivery Model
We have delivery centers located in Belarus, Ukraine, Russia, Hungary, Kazakhstan and Poland. We have client management locations in the United States, Canada, United Kingdom, Germany, Sweden, Switzerland, Netherlands, Russia, Kazakhstan, Singapore, Hong Kong and Australia. We believe the development of a robust global delivery model creates a key competitive advantage, enabling us to better understand and meet our client’s diverse needs and provide a compelling value proposition.
Our primary delivery centers are located in Belarus with 3,474 IT professionals as of December 31, 2013, the majority of which are located in Minsk, the capital of Belarus, which is a major educational and industrial center in CEE. It is well-suited to serve as a prime IT outsourcing destination given its strong industrial base, good educational infrastructure and legacy as the center of computer science for the former Soviet Union. Furthermore, the IT industry in Belarus has been strongly supported by the government, which has taken steps to encourage investment in the IT sector through long-term tax incentives.
Our delivery centers in Ukraine have 2,572 IT professionals as of December 31, 2013. Ukraine promotes the growth of a domestic IT outsourcing export industry that is supported by regulation, intellectual property protection and a favorable investment climate.
Our delivery centers in Russia have 1,294 IT professionals as of December 31, 2013. Our locations in Ukraine and Russia offer many of the same benefits as Belarus, including educational infrastructure, availability of qualified software engineers and government sponsorship of the IT industry. We believe our locations in Ukraine and Russia, along with our delivery centers in Belarus, offer a strong and diversified delivery platform across CEE.
Our delivery centers in Hungary have 848 IT professionals as of December 31, 2013, and serve as the center for our nearshore delivery capabilities to European clients. Hungary’s geographic proximity, cultural affinity and similar time zones with our clients in Europe enables increased interaction that creates closer client relationships, increased responsiveness and more efficient delivery of our solutions.
5
Our client management locations maintain account management and production personnel with significant project management capabilities, which enable us to work seamlessly with our clients and delivery centers. Our onsite and offshore delivery teams are linked together through common processes, collaboration applications and tools, and a communications infrastructure that features a secure and redundant environment enabling global collaboration.
Quality and Process Management
We have built complex proprietary applications and tools to manage quality, security and transparency of the delivery process in a distributed environment. Our proprietary ISO 9001:2008 and CMMI-certified Quality Management System has been documented, implemented and maintained to ensure the timely delivery of software development services to our clients. We have also developed sophisticated project management techniques facilitated through our Project Management Center, a web-based collaborative environment for software development, which we consider critical to meeting or exceeding the service levels required by our clients.
Our Quality Management System ensures that we provide timely delivery of software development services to enhance client satisfaction by enabling:
| • | objective valuation of the performed process, work products and services against the client’s process descriptions, standards and procedures; |
| • | identification, documentation and timely resolution of noncompliance issues; |
| • | feedback to the client’s project staff and managers on the results of quality assurance activities; |
| • | monitoring and improvement of the software development process to ensure adopted standards and procedures are implemented and flaws are detected and resolved in a timely manner; and |
| • | execution of planned and systematic problem prevention activities. |
Our proprietary Project Management Center supports our software development delivery model. Our Project Management Center is effective in reducing risks and providing control and visibility across all project lifecycle stages based on the following features:
| • | multi-site, multi-project capabilities; |
| • | activity-based software development lifecycle, which fully tracks the software development activities through the project documentation; |
| • | project, role-based access control, which can be available to us, clients and third parties; |
| • | fully configurable workflow engine with built-in notification and messaging; |
| • | extensive reporting capabilities and tracking of key performance indicators; and |
| • | integration with Microsoft Project and Outlook. |
The transparency and visibility into software development project deliverables, resource management, team messaging and project-related documents and files provided by our Project Management Center promotes collaboration and strengthens our relationships with our clients. Improved traceability enables significant time savings and cost reductions for business users and IT management during change management for the software development lifecycle. The combination of our Project Management Center with our other proprietary internal applications enhances our offering by reducing errors, increasing quality and improving maintenance time. Combining applications can lead to more efficient communications and oversight for both clients and our staff.
Sales and Marketing
Our sales and marketing strategy seeks to increase our revenues from new and existing clients through our account managers, sales and business development managers, vertical specialists, technical specialists and subject-matter experts. Given our focus on complex application development and the needs of our clients, we believe our IT professionals play an integral role in engaging with clients on potential business opportunities. For example, account managers are organized vertically and maintain direct client relationships. In addition, they are responsible for handling inbound requests and referrals, identifying new business opportunities and responding to requests-for-proposals, or RFPs. Account managers typically engage technical and other specialists in responding to RFPs and pursuing opportunities. This sales model has been effective in promoting repeated business and growth from within our existing client base.
In addition to effective client management, we believe that our reputation as a premium provider of software product development services drives additional business from inbound requests, referrals and RFPs. We enjoy published recognition from other third-party industry observers, such as Forrester Research, Everest Group, Zinnov, Information Week, and Software Magazine.
We also maintain a dedicated sales force as well as a marketing team, which coordinates corporate-level branding efforts that range from sponsorship of programming competitions to participation in and hosting of industry conferences and events.
6
Clients
Our clients primarily consist of
Forbes Global 2000
corporations. One customer, Thomson Reuters, accounted for over 10% of our revenues in 2011. No customer accounted for over 10% of our revenues in 2013 or 2012.
The following table sets forth the percentage of our revenues for the periods presented by client location:
|
|
% of Revenues for Year Ended December 31,
|
|||||||||||
|
Client location
|
2013
|
2012
|
2011
|
|||||||||
|
North America
|
50.8
|
%
|
47.7
|
%
|
49.4
|
%
|
||||||
|
Europe
|
36.1
|
35.8
|
32.0
|
|||||||||
|
CIS
|
11.7
|
15.0
|
16.8
|
|||||||||
|
Reimbursable expenses and other revenues
|
1.4
|
1.5
|
1.8
|
|||||||||
|
Revenues
|
100.0
|
%
|
100.0
|
%
|
100.0
|
%
|
||||||
Revenues by client location above differ from the segment information. Our operations consist of four reportable segments: North America, Europe, Russia and Other. This determination is based on the unique business practices and market specifics of each region and that each region engages in business activities from which it earns revenues and incurs expenses. Our reportable segments are based on managerial responsibility for a particular client. Because managerial responsibility for a particular client relationship generally correlates with the client’s geographic location, there is a high degree of similarity between client locations and the geographic boundaries of our reportable segments. In some specific cases, however, managerial responsibility for a particular client is assigned to a management team in another region, usually based on the strength of the relationship between client executives and particular members of our senior management team. In a case like this, the client’s activity would be reported through the reportable segment. Information about our segments is presented below:
|
|
% of Segment Revenues for Year Ended December 31,
|
|||||||||||
|
Segment
|
2013
|
2012
|
2011
|
|||||||||
|
North America
|
51.3
|
%
|
45.5
|
%
|
45.5
|
%
|
||||||
|
Europe
|
36.8
|
38.9
|
36.9
|
|||||||||
|
Russia
|
10.0
|
11.7
|
13.8
|
|||||||||
|
Other
|
1.9
|
3.9
|
3.8
|
|||||||||
|
Segment Revenues
|
100.0
|
%
|
100.0
|
%
|
100.0
|
%
|
||||||
The following table sets forth the percentage of our revenues by client vertical for the periods presented:
|
|
% of Revenues for Year Ended December 31,
|
|||||||||||
|
Vertical
|
2013
|
2012
|
2011
|
|||||||||
|
Banking and Financial Services
|
28.2
|
%
|
25.8
|
%
|
22.9
|
%
|
||||||
|
ISVs and Technology
|
24.3
|
24.6
|
25.2
|
|||||||||
|
Travel and Consumer
|
21.1
|
22.1
|
21.4
|
|||||||||
|
Business Information and Media
|
13.6
|
14.4
|
19.1
|
|||||||||
|
Other verticals
|
11.4
|
11.6
|
9.6
|
|||||||||
|
Reimbursable expenses and other revenues
|
1.4
|
1.5
|
1.8
|
|||||||||
|
Revenues
|
100.0
|
%
|
100.0
|
%
|
100.0
|
%
|
||||||
The following table shows the distribution of our clients by revenues for the periods presented:
|
|
Year Ended December 31,
|
|||||||||||
|
Revenues Greater Than or Equal To
|
2013
|
2012
|
2011
|
|||||||||
|
$0.1 million
|
263
|
216
|
176
|
|||||||||
|
$0.5 million
|
147
|
114
|
98
|
|||||||||
|
$1.0 million
|
95
|
81
|
54
|
|||||||||
|
$5.0 million
|
22
|
16
|
15
|
|||||||||
|
$10.0 million
|
12
|
7
|
8
|
|||||||||
|
$20.0 million
|
4
|
4
|
3
|
|||||||||
7
The following table sets forth our revenues by service offering as a percentage of our revenues for the periods presented:
|
|
% of Revenues for Year Ended December 31,
|
|||||||||||
|
Service Offering
|
2013
|
2012
|
2011
|
|||||||||
|
Software development
|
67.4
|
%
|
66.8
|
%
|
65.5
|
%
|
||||||
|
Application testing services
|
19.7
|
19.8
|
20.3
|
|||||||||
|
Application maintenance and support
|
8.3
|
8.3
|
8.8
|
|||||||||
|
Infrastructure services
|
2.6
|
2.9
|
2.5
|
|||||||||
|
Licensing
|
0.6
|
0.7
|
1.1
|
|||||||||
|
Reimbursable expenses and other revenues
|
1.4
|
1.5
|
1.8
|
|||||||||
|
Revenues
|
100.0
|
%
|
100.0
|
%
|
100.0
|
%
|
||||||
See Note 18 of our consolidated financial statements in Part IV, “Item 15. Exhibits, Financial Statement Schedules — Audited Consolidated Financial Statements,” for further information regarding our operating segments.
We typically enter into master services agreements with our clients, which provide a framework for services that is then supplemented by statements of work, which specify the particulars of each individual engagement, including the services to be performed, pricing terms and performance criteria.
For example, we have entered into a master services agreement with Thomson Reuters. Under this master services agreement, we may not use subcontractors to perform the services without Thomson Reuters’ prior written consent. Our personnel must comply with Thomson Reuters’ security policies. The intellectual property rights to deliverables we make in the course of, or enabling the, performance of the services we provide to Thomson Reuters are owned by Thomson Reuters. Deliverables and services are subject to acceptance testing, and liquidated damages are prescribed for late delivery. Service credits are prescribed for service-level failures and charges are subject to adjustment for deficiencies in services that are not measured by service levels. The master services agreement provides step-in rights, benchmarking, monitoring rights and audit rights. The master services agreement is not a commitment to purchase our services, and may be terminated for various reasons including a time-limited right of termination upon a change-of-control event or without cause upon six months’ notice.
Competition
The markets in which we compete are changing rapidly and we face competition from both global IT services providers as well as those based in CEE. We believe that the principal competitive factors in our business include technical expertise and industry knowledge, end-to-end solution offerings, reputation and track record for high-quality and on-time delivery of work, effective employee recruiting, training and retention, responsiveness to clients’ business needs, scale, financial stability and price.
We face competition primarily from:
| • | India-based technology outsourcing IT services providers, such as Cognizant Technology Solutions (NASDAQ:CTSH), Luxoft Holding, Inc. (NYSE:LXFT), GlobalLogic, HCL Technologies, Infosys Technologies (NASDAQ:INFY), Mindtree, Sapient (NASDAQ:SAPE), Symphony Technology Group, Tata Consultancy Services and Wipro (NASDAQ:WIT); |
| • | Local CEE technology outsourcing IT services providers; |
| • | Large global consulting and outsourcing firms, such as Accenture, Atos Origin, Capgemini, CSC and IBM; |
| • | China-based technology outsourcing IT services providers such as Camelot Information Services, and Pactera; and |
| • | In-house IT departments of our clients and potential clients. |
We are a leading global IT services provider of complex software product development and software engineering services in CEE. We believe that our focus on complex software product development solutions, our technical employee base, and the development and continuous improvement in process methodologies, applications and tools position us well to compete effectively in the future. However, we face competition from offshore IT services providers in other outsourcing destinations with low wage costs, such as India and China, and from IT services providers that have more locations or that are based in countries more stable than some CIS and CEE countries. Our present and potential competitors may also have substantially greater financial, marketing or technical resources; may also be able to respond more quickly to new technologies or processes and changes in client demands; may be able to devote greater resources towards the development, promotion and sale of their services than we can; and may also make strategic acquisitions or establish cooperative relationships among themselves or with third parties that increase their ability to address the needs of our clients.
8
Human Capital
Our people are critical to the success of our business. Attracting and retaining employees is a key factor in our ability to grow our revenues and meet our clients’ needs. At December 31, 2013, 2012 and 2011, we employed 11,056, 10,043 and 8,125 professionals, respectively. Of these employees, approximately 91.0% were located in the CIS and CEE, 3.0% were located in Western Europe (excluding Hungary) and 6.0% were located in North America at December 31, 2013. We believe that we maintain a good working relationship with our employees and we have not experienced any labor disputes. Our employees have not entered into any collective bargaining agreements.
Recruitment and Retention
We believe our company culture and reputation as a leading global IT services provider of complex software product development and software engineering services in CEE enhances our ability to recruit and retain highly sought-after employees. We have dedicated full-time employees that oversee all aspects of our human capital management process. Through our proprietary internal tools, we effectively plan our short-term and long-term recruitment needs and deploy the necessary personnel and processes to optimize utilization and to quickly satisfy the demands of our clients.
We have developed our base of IT professionals by hiring highly-qualified, experienced IT professionals from this region and by recruiting students from leading universities in CEE. We have strong relationships with the leading institutions in CEE, such as the Belarusian State University, Belarusian State University of Informatics and Radioelectronics, the Saint Petersburg State University of Information Technologies, Mechanics and Optics, the Moscow State University, the Moscow Institute of Physics & Technology, the Moscow State University of Instrument Engineering and Computer Sciences and the National Technical University of Ukraine, and we have established EPAM delivery centers near many of these campuses. The quality and academic prestige of the CEE educational system is renowned world-wide. For instance, in the 2012 ACM International Collegiate Programming Contest (“ICPC,”) five out of 10 top ranked finishers were from CEE, and two Belarus universities made it in the top 12. Our ongoing involvement with these universities includes supporting EPAM-branded research labs, developing training courses, providing teaching equipment, actively supporting curriculum development and engaging students to identify their talents and interests. Our relationships with these technical institutions provide us access to a highly-qualified talent pool of programmers, and allow us to consistently attract highly-skilled students from these institutions. We also conduct lateral hiring through a dedicated IT professional talent acquisition team whose objective is to locate and attract qualified and experienced IT professionals within the region.
To attract, retain and motivate our IT professionals, we seek to provide an environment and culture that rewards entrepreneurial initiative and performance. In addition, we offer a challenging work environment, ongoing skills development initiatives and attractive career advancement and promotion opportunities.
Training and Development
We dedicate significant resources to the training and development of our IT professionals. We believe in the importance of supporting educational initiatives and we sponsor employees’ participation in internal and external training and certifications. Furthermore, we actively pursue partner engagements with technical institutions in CEE.
We provide training, continuing education and career development programs for both entry-level and experienced IT professionals. Entry-level IT professionals undergo a rigorous training program that consists of approximately three to six months of classroom training, as well as numerous hours of hands-on training through actual engagements. This comprehensive program results in employees who are highly proficient and possess deep technical expertise that enables them to immediately serve our clients’ needs. For our mid-level and senior IT professionals, we offer continuing education programs aimed at helping them advance in their careers. We also provide mentoring opportunities, management and soft skills training, intensive workshops and management and technical advancement programs. We are committed to systematically identifying and nurturing the development of middle and senior management through formal leadership training, evaluation, development and promotion.
Intellectual Property
Our intellectual property rights are important to our business. We rely on a combination of intellectual property laws, trade secrets, confidentiality procedures and contractual provisions to protect our intellectual property. We require our employees, independent contractors, vendors and clients to enter into written confidentiality agreements upon the commencement of their relationships with us. These agreements generally provide that any confidential or proprietary information disclosed or otherwise made available by us be kept confidential.
We customarily enter into non-disclosure agreements with our clients with respect to the use of their software systems and platforms. Our clients usually own the intellectual property in the software or systems we develop for them. Furthermore, we usually grant a perpetual, worldwide, royalty-free, nonexclusive, transferable and non-revocable license to our clients to use our preexisting intellectual property, but only to the extent necessary in order to use the software or systems we developed for them.
9
Protecting our intellectual property rights is critical to our business. We have invested, and will continue to invest, in research and development to enhance our domain knowledge and create complex, specialized solutions for our clients.
Long-lived Assets
The table below sets forth the locations of our long-lived assets:
|
|
December 31,
2013
|
December 31,
2012
|
||||||
|
|
(in thousands)
|
|||||||
|
Belarus(1)
|
$
|
38,697
|
$
|
40,095
|
||||
|
Ukraine
|
5,525
|
5,357
|
||||||
|
Russia
|
3,414
|
3,234
|
||||||
|
United States
|
2,217
|
2,048
|
||||||
|
Hungary
|
2,644
|
1,744
|
||||||
|
Other
|
818
|
657
|
||||||
|
Total
|
$
|
53,315
|
$
|
53,135
|
||||
|
|
|
|
(1)
|
At December 31, 2013 and 2012, the amounts included $15.1 million and $15.4 million, respectively, related to our building, and $15.7 million and $15.6 million, respectively, of capitalized construction costs related to our corporate facilities in Minsk, Belarus.
|
Acquisitions
We have acquired a number of companies in order to expand our vertical-specific domain expertise, geographic footprint, service portfolio, client base and management expertise.
In May 2012, we completed the acquisition of Thoughtcorp, a Canadian company with a 17-year history of successfully delivering high-value IT solutions and complex software applications to some of Canada’s most prominent companies within the telecommunications, financial and retail sectors. With the Thoughtcorp acquisition, we have strengthened our Banking and Financial Services, and Travel and Consumer verticals, and have gained significant telecommunications expertise with a highly skilled and experienced employee base of approximately 50 IT professionals. The acquisition also expands our North American geographic footprint and complements our global delivery capabilities with expertise in areas important for us, such as Agile Development, Enterprise Mobility and Business Intelligence.
In December 2012, we completed the acquisition of Empathy Lab, LLC, a U.S.-based digital strategy and multi-channel experience design firm with approximately 85 IT professionals. The acquisition has enhanced our strong capabilities in global delivery of software engineering services with Empathy Lab’s proven expertise in two important growth areas - development and execution of enterprise-wide eCommerce initiatives and transformation of media consumption and distribution channels. In addition to strengthening our Travel and Consumer and Business Information and Media verticals, Empathy Lab brings significant expertise in digital marketing strategy consulting and program management.
Regulations
Due to the industry and geographic diversity of our operations and services, our operations are subject to a variety of rules and regulations, and several Belarusian, Russian, Ukrainian, Hungarian, Kazakhstan and U.S. federal and state agencies regulate various aspects of our business. See “Item 1A. Risk Factors — Risks Relating to Our Business — Our global operations expose us to numerous and sometimes conflicting legal and regulatory requirements, and violations or unfavorable interpretation by authorities of these regulations could harm our business.” and “Item 1A. Risk Factors — Risks Relating to Our Business — We are subject to laws and regulations in the United States and other countries in which we operate concerning our operations, including export restrictions, U.S. economic sanctions and the Foreign Corrupt Practices Act, or FCPA, and similar anti-bribery laws. If we are not in compliance with applicable legal requirements, we may be subject to civil or criminal penalties and other remedial measures.”
We benefit from certain tax incentives promulgated by the Belarusian and Hungarian governments. See “Item 7. Management’s Discussion and Analysis of Financial Condition and Results of Operations — Provision for Income Taxes.”
Corporate Information
EPAM Systems, Inc. was incorporated in the State of Delaware on December 18, 2002. Our predecessor entity was founded in 1993. Our principal executive offices are located at 41 University Drive, Suite 202, Newtown, Pennsylvania 18940 and our telephone number is 267-759-9000. We maintain a website at
http://www.epam.com.
Our website and the information accessible through our website are not incorporated into this annual report.
10
We make certain filings with the Securities and Exchange Commission (“SEC”), including our annual report on Form 10-K, quarterly reports on Form 10-Q, current reports on Form 8-K, and all amendments and exhibits to those reports. We make such filings available free of charge through the Investor Relations section of our website,
http://investors.epam.com
, as soon as reasonably practicable after they are filed with the SEC. The filings are also available through the SEC at the SEC’s Public Reference Room at 100 F Street, N.E., Washington, D.C. 20549 or by calling 1-800-SEC-0330. In addition, these filings are available on the internet at
http://www.sec.gov
. Our press releases and recent analyst presentations are also available on our website. The information on our website does not constitute a part of this annual report.
Executive Officers of the Registrant
The following table sets forth the names, ages and positions of our executive officers as of March 1, 2014:
|
Name
|
Age
|
Position
|
|
Arkadiy Dobkin
|
53
|
Director, President and Chief Executive Officer
|
|
Karl Robb
|
51
|
Director, President of EU Operations and Executive Vice President
|
|
Balazs Fejes
|
38
|
Senior Vice President, Global Head of Banking and Financial Services Business Unit
|
|
Anthony J. Conte
|
42
|
Vice President, Chief Financial Officer and Treasurer
|
|
Ginger Mosier
|
49
|
Vice President, General Counsel and Corporate Secretary
|
Executive officers are appointed by the Board. A brief biography for each of our other executive officers follows.
Arkadiy Dobkin
, 53, has served as Chairman of the Board, Chief Executive Officer and President since December 2002 and is one of our co-founders. After earning a MS in Electrical Engineering from the Byelorussian National Technical University, Mr. Dobkin began his career in Minsk, Belarus, where he worked for several emerging software development companies. After immigrating to the United States, he held thought and technical leadership positions at Colgate-Palmolive and SAP Labs. Our Board believes Mr. Dobkin’s experience as an IT professional and executive in the IT services industry coupled with his in-depth understanding of our global delivery model provide him with the necessary skills to serve as a member of our Board and will enable him to provide valuable insight to the board and our management team regarding operational, strategic and management issues as well as general industry trends.
Karl Robb
, 51, has served as a director of our Board since 2004 and as our President of EU Operations and Executive Vice President since April 2013. From March 2004 to April 2013, Mr. Robb served as our President of EU Operations and Executive Vice President of Global Operations. Mr. Robb joined us when Fathom Technology, a Hungarian software development outsourcing company he co-founded, merged with EPAM. Mr. Robb is a 30-year veteran of the global software engineering and IT solutions industries, having worked ten years in Europe, nine years in the United States and 11 years in Eastern Europe. Mr. Robb has been employed as a consultant by Landmark Business Development Limited, or Landmark, a consulting firm, since 1986. Our Board believes that Mr. Robb’s extensive experience as an executive in the IT services industry and his knowledge of the IT services industry in North America, Europe and Central and Eastern Europe, as well as his experience working with global IT services companies and successfully starting two software companies and his extensive service and responsibilities at EPAM, provide him with the necessary skills to serve as a member of our Board and will enable him to provide valuable insight to the Board regarding strategy, business development, sales, operational and management issues, as well as general industry trends.
Balazs Fejes
, 38, has served as our Senior Vice President, Global Head of Banking and Financial Services business unit since August 2012. From March 2004 to August 2012, Mr. Fejes served as EPAM’s Chief Technology Officer. Mr. Fejes joined us when Fathom Technology, a Hungarian software engineering firm, which he co-founded and for which he served as Chief Technology Officer, merged with us. Prior to co-founding Fathom Technology, Mr. Fejes was a chief software architect/line manager with Microsoft Great Plains (Microsoft Business Solutions). He also served as a chief software architect of Scala Business Solutions. Mr. Fejes has been employed as a consultant by Redlodge Holdings Limited, a consulting firm, since July 2007.
Anthony J. Conte
, 42, became our Chief Financial Officer in November 2013. Previously, he served as Vice President — Finance, where he was instrumental in our initial public offering; and as Controller when he joined EPAM in 2006. Mr. Conte is a CPA with over 20 years of experience in finance, accounting, audit, international operations and strategic planning. Prior to joining EPAM, Mr. Conte spent five years in several senior finance roles within the McGraw Hill organization, last serving as Controller of its Platts business unit, a leading global provider of energy, petrochemicals, metals and agriculture information. Mr. Conte was also the finance manager for John Hancock’s International Operations, overseeing various established Asian subsidiaries and working to successfully launch a new Chinese subsidiary for the company. Mr. Conte started his career at Coopers and Lybrand in Boston and holds a B.S. in Accounting and an M.B.A. from Northeastern University.
11
Ginger Mosier
, 49, has served as our Vice President and General Counsel since March 2010 and as our Corporate Secretary since January 2012. Ms. Mosier also served as our Assistant Corporate Secretary from May 2010 to January 2012. Prior to joining EPAM, Ms. Mosier spent approximately eight years in a variety of legal positions with Hewlett-Packard Company. In her last position, she served as senior counsel advising on global IT outsourcing deals and related services transactions. Prior to that, she advised a number of HP Software divisions as corporate counsel and was the legal representative for the HP Software Integration Office created for implementing the acquisition and integration of several software companies. Immediately prior to Hewlett-Packard, Ms. Mosier practiced corporate law at Drinker, Biddle & Reath. Ms. Mosier began her legal career at Baker & Daniels. Ms. Mosier holds a J.D., magna cum laude, from Indiana University School of Law at Indianapolis where she was a member of the Indiana Law Review and a B.A. from Indiana University-Purdue University at Indianapolis.
Risk factors, which could cause actual results to differ from our expectations and which could negatively impact our financial condition and results of operations, are discussed below and elsewhere in this annual report. The risks and uncertainties described below are not the only ones we face. If any of the risks or uncertainties described below or any additional risks and uncertainties actually occur, our business, results of operations and financial condition could be materially and adversely affected. In particular, forward-looking statements are inherently subject to risks and uncertainties, some of which cannot be predicted or quantified. See “Special Note Regarding Forward-Looking Statements.”
Risks Relating to Our Business
We may be unable to effectively manage our rapid growth or achieve anticipated growth, which could place significant strain on our management personnel, systems and resources.
We have experienced rapid growth and significantly expanded our business over the past several years. Our revenues grew from $160.6 million in 2008 to $555.1 million in 2013. We have also supplemented our organic growth with strategic acquisitions. As of December 31, 2013, we had 9,340 IT professionals, as compared to 2,890 IT professionals as of December 31, 2007. We intend to continue our expansion in the foreseeable future to pursue existing and potential market opportunities.
Our rapid growth has placed and will continue to place significant demands on our management and our administrative, operational and financial infrastructure. Continued expansion increases the challenges we face in:
•
recruiting, training and retaining sufficiently skilled IT professionals and management personnel;
•
adhering to and further improving our high-quality and process execution standards and maintaining high levels of client
satisfaction;
•
managing a larger number of clients in a greater number of industries and locations;
•
maintaining effective oversight of personnel and delivery centers;
•
preserving our culture, values and entrepreneurial environment; and
•
developing and improving our internal administrative infrastructure, particularly our financial, operational,
communications and other internal systems.
As a result of these problems associated with expansion, our business, financial condition and results of operations could be materially adversely affected.
Moreover, we intend to continue our expansion in the foreseeable future to pursue existing and potential market opportunities. As we introduce new services or enter into new markets, we may face new market, technological and operational risks and challenges with which we are unfamiliar, and we may not be able to mitigate these risks and challenges to successfully grow those services or markets. We may not be able to achieve our anticipated growth, which could materially adversely affect our business and prospects.
If we fail to attract and retain highly skilled IT professionals, we may not have the necessary resources to properly staff projects, and failure to successfully compete for such IT professionals could materially adversely affect our ability to provide high quality services to our clients.
Our success depends largely on the contributions of our IT professionals and our ability to attract and retain qualified IT professionals. Competition for IT professionals in the markets in which we operate can be intense and, accordingly, we may not be able to retain or hire all of the IT professionals necessary to meet our ongoing and future business needs. Any reductions in headcount for economic or business reasons, however temporary, could negatively affect our reputation as an employer and our ability to hire IT professionals to meet our business requirements.
12
The total attrition rates among our IT professionals who have worked for us for at least six months were 13.1%, 10.7% and 9.1% for 2013, 2012 and 2011, respectively. We may encounter higher attrition rates in the future. A significant increase in the attrition rate among IT professionals with specialized skills could decrease our operating efficiency and productivity and could lead to a decline in demand for our services. The competition for highly-skilled IT professionals may require us to increase salaries, and we may be unable to pass on these increased costs to our clients.
In addition, our ability to maintain and renew existing engagements and obtain new business will depend, in large part, on our ability to attract, train and retain skilled IT professionals, including experienced management IT professionals, which enables us to keep pace with growing demands for outsourcing, evolving industry standards and changing client preferences. If we are unable to attract and retain the highly-skilled IT professionals we need, we may have to forgo projects for lack of resources or be unable to staff projects optimally. Our failure to attract, train and retain IT professionals with the qualifications necessary to fulfill the needs of our existing and future clients or to assimilate new IT professionals successfully could materially adversely affect our ability to provide high quality services to our clients.
Increases in wages and other compensation expense for our IT professionals could prevent us from sustaining our competitive advantage.
Wage costs for IT professionals in CIS and CEE countries are lower than comparable wage costs in more developed countries. However, wage costs in the CIS and CEE IT services industry may increase at a faster rate than in the past, which ultimately may make us less competitive unless we are able to increase the efficiency and productivity of our IT professionals as well as the prices we can charge for our services. Increases in wage costs may reduce our profitability.
Additionally, we have granted certain options under our stock incentive plans and entered into certain other stock-based compensation arrangements in the past, as a result of which we have recorded $13.2 million, $6.8 million and $2.9 million as stock-based compensation expenses for the years ended December 31, 2013, 2012 and 2011, respectively.
Generally Accepted Accounting Principles in the United States (“GAAP”) prescribe how we account for stock-based compensation, which could adversely or negatively impact our results of operations or the price of our common stock. GAAP requires us to recognize stock-based compensation as compensation expense in the statement of operations generally based on the fair value of equity awards on the date of the grant, with compensation expense recognized over the period in which the recipient is required to provide service in exchange for the equity award. The expenses associated with stock-based compensation may reduce the attractiveness of issuing equity awards under our equity incentive plan. However, if we do not grant equity awards, or if we reduce the number of equity awards we grant, we may not be able to attract and retain key personnel. If we grant more equity awards to attract and retain key personnel, the expenses associated with such additional equity awards could materially adversely affect our results of operations. The issuance of equity-based compensation to our IT professionals would also result in additional dilution to our stockholders.
Our success depends substantially on the continuing efforts of our senior executives and other key personnel, and our business may be severely disrupted if we lose their services.
Our future success heavily depends upon the continued services of our senior executives and other key employees. We currently do not maintain key man life insurance for any of the senior members of our management team or other key personnel. If one or more of our senior executives or key employees are unable or unwilling to continue in their present positions, it could disrupt our business operations, and we may not be able to replace them easily or at all. In addition, competition for senior executives and key personnel in our industry is intense, and we may be unable to retain our senior executives and key personnel or attract and retain new senior executives and key personnel in the future, in which case our business may be severely disrupted.
If any of our senior executives or key personnel joins a competitor or forms a competing company, we may lose clients, suppliers, know-how and key IT professionals and staff members to them. Also, if any of our business development managers, who generally keep a close relationship with our clients, joins a competitor or forms a competing company, we may lose clients, and our revenues may be materially adversely affected. Additionally, there could be unauthorized disclosure or use of our technical knowledge, practices or procedures by such personnel. If any dispute arises between our senior executives or key personnel and us, any non-competition, non-solicitation and non-disclosure agreements we have with our senior executives or key personnel might not provide effective protection to us, especially in CIS and CEE countries where some of our senior executives and most of our key employees reside, in light of uncertainties with legal systems in CIS and CEE countries.
13
Emerging markets such as the CIS and CEE countries are subject to greater risks than more developed markets, including significant legal, economic, tax and political risks.
We have significant operations in CIS and CEE countries which are generally considered to be emerging markets. CEE includes Albania, Belarus, Bosnia and Herzegovina, Bulgaria, Croatia, Czech Republic, Estonia, Hungary, Latvia, Lithuania, Poland, Republic of Macedonia, Romania, Russia, Serbia and Montenegro, Slovakia, Slovenia, the former Yugoslav Republic of Macedonia, Turkey and Ukraine. The CIS is comprised of constituents of the former U.S.S.R., including Armenia, Azerbaijan, Belarus, Georgia, Kazakhstan, Kyrgyzstan, Moldova, Russia, Tajikistan, Turkmenistan, Ukraine and Uzbekistan. Investors in emerging markets should be aware that these markets are vulnerable to market downturns and economic slowdowns elsewhere in the world and are subject to greater risks than more developed markets, including complying with foreign laws and regulations and the potential imposition of trade or foreign exchange restrictions or sanctions, tax increases, fluctuations in exchange rates, inflation and unstable political and military situations, and labor issues. Investors should also note that emerging economies such as the economies of Belarus, Russia, Ukraine, Kazakhstan and Hungary are subject to rapid change and that the information set forth in this annual report may become outdated relatively quickly. Accordingly, investors should exercise particular care in evaluating the risks involved and must decide for themselves whether, in light of those risks, an investment in our common stock is appropriate.
Our Ukrainian and Russian operations may be adversely affected by ongoing developments in the Ukraine.
Ukraine has been undergoing heightened political turmoil since the removal of President Yanukovych from power by the Ukrainian parliament in late February 2014, which was followed by reports of Russian military activity in the Crimean region. The situation in the Ukraine is rapidly developing, and we cannot predict the outcome of developments there or the reaction to such developments by U.S., European, U.N. or other international authorities.
We have delivery centers in the Ukraine employing approximately 2,600 engineers, none of which are located in Crimea. We also have delivery centers in Russia, employing approximately 1,300 personnel located in various cities including Moscow and St. Petersburg. At present we have not experienced any interruption in our office infrastructure, utility supply or Internet connectivity. All EPAM offices remain open and fully functional, including those we use in the Ukraine and Russia to support our clients. We continue to monitor the situation closely. Our contingency plans include relocating work or personnel to other locations and adding new locations, as appropriate. We have no way to predict the progress or outcome of the situation, as the political and civil unrest and reported military activities are fluid and beyond our control. Prolonged unrest, military activities, or broad-based sanctions, should they be implemented, could have a material adverse effect on our operations.
We generate a significant portion of our revenues from a small number of clients, and any loss of business from these clients could materially reduce our revenues.
Our ability to maintain close relationships with our major clients is essential to the growth and profitability of our business. However, the volume of work performed for a specific client is likely to vary from year to year, especially since we generally are not our clients’ exclusive IT services provider and we do not have long-term commitments from any clients to purchase our services.
A major client in one year may not provide the same level of revenues for us in any subsequent year. The IT services we provide to our clients, and the revenues and net income from those services, may decline or vary as the type and quantity of IT services we provide change over time. Furthermore, our reliance on any individual client for a significant portion of our revenues may give that client a certain degree of pricing leverage against us when negotiating contracts and terms of service.
In addition, a number of factors other than our performance could cause the loss of or reduction in business or revenues from a client, and these factors are not predictable. For example, a client may decide to reduce spending on technology services or sourcing from us due to a challenging economic environment or other factors, both internal and external, relating to its business. These factors, among others, may include corporate restructuring, pricing pressure, changes to its outsourcing strategy, switching to another IT services provider or returning work in-house.
The loss of any of our major clients, or a significant decrease in the volume of work they outsource to us or the price at which we sell our services to them, could materially adversely affect our revenues and thus our results of operations.
Our revenues, operating results and profitability may experience significant variability and, as a result, it may be difficult to make accurate financial forecasts.
Our revenues, operating results and profitability have varied in the past and are likely to vary in the future, which could make it difficult to make accurate financial forecasts. Factors that are likely to cause these variations include:
•
the number, timing, scope and contractual terms of IT projects in which we are engaged;
•
delays in project commencement or staffing delays due to difficulty in assigning appropriately skilled or experienced IT
professionals;
14
•
the accuracy of estimates of resources, time and fees required to complete fixed-price projects and costs incurred in the
performance of each project;
•
changes in pricing in response to client demand and competitive pressures;
•
changes in the allocation of onsite and offshore staffing;
•
the business decisions of our clients regarding the use of our services;
•
the ability to further grow revenues from existing clients;
•
the available leadership and senior technical resources compared to junior engineering resources staffed on each project;
•
seasonal trends, primarily our hiring cycle and the budget and work cycles of our clients;
•
delays or difficulties in expanding our operational facilities or infrastructure;
•
the ratio of fixed-price contracts to time-and-materials contracts in process;
•
employee wage levels and increases in compensation costs, including timing of promotions and annual pay increases;
•
unexpected changes in the utilization rate of our IT professionals;
•
unanticipated contract or project terminations;
•
the timing of collection of accounts receivable;
•
the continuing financial stability of our clients; and
•
general economic conditions.
If we are unable to make accurate financial forecasts, it could materially adversely affect our business, financial condition and results of operations.
We do not have long-term commitments from our clients, and our clients may terminate contracts before completion or choose not to renew contracts.
Our clients are generally not obligated for any long-term commitments to us. Although a substantial majority of our revenues are generated from repeated business, which we define as revenues from a client who also contributed to our revenues during the prior year, our engagements with our clients are typically for projects that are singular in nature. In addition, our clients can terminate many of our master services agreements and work orders with or without cause, and in most cases without any cancellation charge. Therefore, we must seek to obtain new engagements when our current engagements are successfully completed or are terminated as well as maintain relationships with existing clients and secure new clients to expand our business.
There are a number of factors relating to our clients that are outside of our control which might lead them to terminate a contract or project with us, including:
•
financial difficulties for the client;
•
a change in strategic priorities, resulting in elimination of the impetus for the project or a reduced level of technology
spending;
•
a change in outsourcing strategy resulting in moving more work to the client’s in-house technology departments or to our
competitors;
•
the replacement by our clients of existing software with packaged software supported by licensors; and
•
mergers and acquisitions or significant corporate restructurings.
Failure to perform or observe any contractual obligations could result in cancellation or non-renewal of a contract, which could cause us to experience a higher than expected number of unassigned employees and an increase in our cost of revenues as a percentage of revenues, until we are able to reduce or reallocate our headcount. The ability of our clients to terminate agreements makes our future revenues uncertain. We may not be able to replace any client that elects to terminate or not renew its contract with us, which could materially adversely affect our revenues and thus our results of operations.
In addition, some of our agreements specify that if a change of control of our company occurs during the term of the agreement, the client has the right to terminate the agreement. If any future event triggers any change-of-control provision in our client contracts, these master services agreements may be terminated, which would result in loss of revenues.
15
Our revenues are highly dependent on clients primarily located in the United States and Europe. Worsening economic conditions or factors that negatively affect the economic health of the United States or Europe could reduce our revenues and thus adversely affect our results of operations.
The recent crisis in the financial and credit markets in North America, Europe and Asia led to a global economic slowdown, with the economies of those regions showing significant signs of weakness. The IT services industry is particularly sensitive to the economic environment, and tends to decline during general economic downturns. We derive a significant portion of our revenues from clients in North America and Europe. If the North American or European economies further weaken or slow, pricing for our services may be depressed and our clients may reduce or postpone their technology spending significantly, which may in turn lower the demand for our services and negatively affect our revenues and profitability.
If we are unable to successfully anticipate changing economic and political conditions affecting the markets in which we operate, we may be unable to effectively plan for or respond to those changes, and our results of operations could be adversely affected.
Our profitability will suffer if we are not able to maintain our resource utilization levels and productivity levels.
Our profitability is significantly impacted by our utilization levels of fixed-cost resources, including human resources as well as other resources such as computers and office space, and our ability to increase our productivity levels. We have expanded our operations significantly in recent years through organic growth and strategic acquisitions, which has resulted in a significant increase in our headcount and fixed overhead costs.
Some of our IT professionals are specially trained to work for specific clients or on specific projects and some of our offshore development centers are dedicated to specific clients or specific projects. Our ability to manage our utilization levels depends significantly on our ability to hire and train high-performing IT professionals and to staff projects appropriately and on the general economy and its effect on our clients and their business decisions regarding the use of our services. If we experience a slowdown or stoppage of work for any client or on any project for which we have dedicated IT professionals or facilities, we may not be able to efficiently reallocate these IT professionals and facilities to other clients and projects to keep their utilization and productivity levels high. If we are not able to maintain optimal resource utilization levels without corresponding cost reductions or price increases, our profitability will suffer.
We face intense competition from onshore and offshore IT services companies, and increased competition, our inability to compete successfully against competitors, pricing pressures or loss of market share could materially adversely affect our business.
The market for IT services is highly competitive, and we expect competition to persist and intensify. We believe that the principal competitive factors in our markets are reputation and track record, industry expertise, breadth and depth of service offerings, quality of the services offered, language, marketing and selling skills, scalability of infrastructure, ability to address clients’ timing requirements and price.
We face competition from offshore IT services providers in other outsourcing destinations with low wage costs such as India and China, as well as competition from large, global consulting and outsourcing firms and in-house IT departments of large corporations. Clients tend to engage multiple IT services providers instead of using an exclusive IT services provider, which could reduce our revenues to the extent that clients obtain services from other competing IT services providers. Clients may prefer IT services providers that have more locations or that are based in countries more cost-competitive or more stable than some CIS and CEE countries.
Our ability to compete successfully also depends in part on a number of factors beyond our control, including the ability of our competitors to recruit, train, develop and retain highly-skilled IT professionals, the price at which our competitors offer comparable services and our competitors’ responsiveness to client needs. Some of our present and potential competitors may have substantially greater financial, marketing or technical resources. Our current and potential competitors may also be able to respond more quickly to new technologies or processes and changes in client demands; may be able to devote greater resources towards the development, promotion and sale of their services than we can; and may also make strategic acquisitions or establish cooperative relationships among themselves or with third parties that increase their ability to address the needs of our clients. Client buying patterns can change if clients become more price sensitive and accepting of low-cost suppliers. Therefore, we cannot assure you that we will be able to retain our clients while competing against such competitors. Increased competition, our inability to compete successfully, pricing pressures or loss of market share could materially adversely affect our business.
16
We are investing substantial cash in new facilities and physical infrastructure, and our profitability could be reduced if our business does not grow proportionately.
We have made and continue to make significant contractual commitments related to capital expenditures on construction or expansion of our delivery centers, such as in Minsk, Belarus. We may encounter cost overruns or project delays in connection with new facilities. These expansions will likely increase our fixed costs and if we are unable to grow our business and revenues proportionately, our profitability may be reduced.
Our revenues are highly dependent on a limited number of industries, and any decrease in demand for outsourced services in these industries could reduce our revenues and adversely affect our results of operations.
A substantial portion of our clients is concentrated in four specific industry verticals: Banking and Financial Services, ISVs and Technology, Business Information and Media, and Travel and Consumer. Clients in Banking and Financial Services accounted for 28.2%, 25.8%, and 22.9% of our revenues in 2013, 2012 and 2011, respectively. Clients in ISVs and Technology accounted for 24.3%, 24.6%, and 25.2% of our revenues in 2013, 2012 and 2011, respectively. Our business growth largely depends on continued demand for our services from clients in these four industry verticals and other industries that we may target in the future, as well as on trends in these industries to outsource IT services.
A downturn in any of our targeted industries, a slowdown or reversal of the trend to outsource IT services in any of these industries or the introduction of regulations that restrict or discourage companies from outsourcing could result in a decrease in the demand for our services and materially adversely affect our business, financial condition and results of operations. For example, a worsening of economic conditions in the financial services industry and significant consolidation in that industry may reduce the demand for our services and negatively affect our revenues and profitability.
Other developments in the industries in which we operate may also lead to a decline in the demand for our services in these industries, and we may not be able to successfully anticipate and prepare for any such changes. For example, consolidation in any of these industries or acquisitions, particularly involving our clients, may decrease the potential number of buyers of our services. Our clients may experience rapid changes in their prospects, substantial price competition and pressure on their profitability. This, in turn, may result in increasing pressure on us from clients in these key industries to lower our prices, which could adversely affect our results of operations.
If we are not successful in managing increasingly large and complex projects, we may not achieve our financial goals and our results of operations could be adversely affected.
To successfully market our service offerings and obtain larger and more complex projects, we need to establish close relationships with our clients and develop a thorough understanding of their operations. In addition, we may face a number of challenges managing larger and more complex projects, including:
•
maintaining high-quality control and process execution standards;
•
maintaining planned resource utilization rates on a consistent basis;
•
maintaining productivity levels and implementing necessary process improvements;
•
controlling costs;
•
maintaining close client contact and high levels of client satisfaction; and
•
maintaining effective client relationships.
Our ability to successfully manage large and complex projects depends significantly on the skills of our management personnel and IT professionals, some of whom do not have experience managing large-scale or complex projects. In addition, large and complex projects may involve multiple engagements or stages, and there is a risk that a client may choose not to retain us for additional stages or may cancel or delay additional planned engagements. Such cancellations or delays may make it difficult to plan our project resource requirements. If we fail to successfully obtain engagements for large and complex projects, we may not achieve our revenue growth and other financial goals. Even if we are successful in obtaining such engagements, a failure by us to effectively manage these large and complex projects could damage our reputation, cause us to lose business, impact our margins and adversely affect our business and results of operations.
17
If we are unable to adapt to rapidly changing technologies, methodologies and evolving industry standards we may lose clients and our business could be materially adversely affected.
Rapidly changing technologies, methodologies and evolving industry standards characterize the market for our services. Our future success will depend in part upon our ability to anticipate developments in IT services, enhance our existing services and to develop and introduce new services to keep pace with such changes and developments and to meet changing client needs. The process of developing our client solutions is extremely complex and is expected to become increasingly complex and expensive in the future due to the introduction of new platforms, operating systems, technologies and methodologies. Our ability to keep up with technology, methodology and business changes is subject to a number of risks, including that:
•
we may find it difficult or costly to update our services, applications, tools and software and to develop new services
quickly enough to meet our clients’ needs;
•
we may find it difficult or costly to make some features of our software work effectively and securely over the Internet or
with new or changed operating systems;
•
we may find it difficult or costly to update our software and services to keep pace with business, evolving industry
standards, methodologies, regulatory and other developments in the industries where our clients operate; and
•
we may find it difficult to maintain a high level of quality in implementing new technologies and methodologies.
We may not be successful in anticipating or responding to these developments in a timely manner, or if we do respond, the services, technologies or methodologies we develop or implement may not be successful in the marketplace. Further, services, technologies or methodologies that are developed by our competitors may render our services non-competitive or obsolete. Our failure to enhance our existing services and to develop and introduce new services to promptly address the needs of our clients could cause us to lose clients and materially adversely affect our business.
We face risks associated with having a long selling and implementation cycle for our services that require us to make significant resource commitments prior to realizing revenues for those services.
We have a long selling cycle for our IT services, which requires significant investment of human resources and time by both our clients and us. Before committing to use our services, potential clients require us to expend substantial time and resources educating them on the value of our services and our ability to meet their requirements. Therefore, our selling cycle is subject to many risks and delays over which we have little or no control, including our clients’ decision to choose alternatives to our services (such as other IT services providers or in-house resources) and the timing of our clients’ budget cycles and approval processes. If our sales cycle unexpectedly lengthens for one or more large projects, it would negatively affect the timing of our revenues and hinder our revenue growth. For certain clients, we may begin work and incur costs prior to concluding the contract. A delay in our ability to obtain a signed agreement or other persuasive evidence of an arrangement, or to complete certain contract requirements in a particular quarter, could reduce our revenues in that quarter.
Implementing our services also involves a significant commitment of resources over an extended period of time from both our clients and us. Our clients may experience delays in obtaining internal approvals or delays associated with technology, thereby further delaying the implementation process. Our current and future clients may not be willing or able to invest the time and resources necessary to implement our services, and we may fail to close sales with potential clients to whom we have devoted significant time and resources. Any significant failure to generate revenues or delays in recognizing revenues after incurring costs related to our sales or services process could materially adversely affect our business.
We may not be able to recognize revenues in the period in which our services are performed, which may cause our margins to fluctuate.
Our services are performed under both time-and-material and fixed-price contract arrangements. All revenues are recognized pursuant to applicable accounting standards. We recognize revenues when realized or realizable and earned, which is when the following criteria are met: persuasive evidence of an arrangement exists, delivery has occurred, the sales price is fixed or determinable and collectability is reasonably assured. If there is an uncertainty about the project completion or receipt of payment for the services, revenues are deferred until the uncertainty is sufficiently resolved.
Additionally, we recognize revenues from fixed-price contracts based on the proportional performance method. In instances where final acceptance of the system or solution is specified by the client, revenues are deferred until all acceptance criteria have been met. In absence of a sufficient basis to measure progress towards completion, revenues are recognized upon receipt of final acceptance from the client. Our failure to meet all the acceptance criteria, or otherwise meet a client’s expectations, may result in our having to record the cost related to the performance of services in the period that services were rendered, but delay the timing of revenue recognition to a future period in which all acceptance criteria have been met.
18
If our pricing structures are based on inaccurate expectations and assumptions regarding the cost and complexity of performing our work, then our contracts could be unprofitable.
We negotiate pricing terms with our clients utilizing a range of pricing structures and conditions. Our pricing is highly dependent on our internal forecasts and predictions about our projects and the marketplace, which might be based on limited data and could turn out to be inaccurate. If we do not accurately estimate the costs and timing for completing projects, our contracts could prove unprofitable for us. We face a number of risks when pricing our contracts, as many of our projects entail the coordination of operations and personnel in multiple locations with different skill sets and competencies. Our pricing and cost estimates for the work that we perform sometimes include anticipated long-term cost savings from transformational and other initiatives that we expect to achieve and sustain over the life of the contract. There is a risk that we will underprice our projects, particularly with fixed-price contracts, fail to accurately estimate the costs of performing the work or fail to accurately assess the risks associated with potential contracts. In particular, any increased or unexpected costs, delays or failures to achieve anticipated cost savings, or unexpected risks we encounter in connection with the performance of this work, including those caused by factors outside our control, could make these contracts less profitable or unprofitable.
In addition, a number of our contracts contain pricing terms that condition a portion of the payment of fees by the client on our ability to meet defined performance goals, service levels and completion schedules set forth in the contracts. Our failure to meet such performance goals, service levels or completion schedules or our failure to meet client expectations in such contracts may result in less profitable or unprofitable engagements.
Our profitability could suffer if we are not able to maintain favorable pricing rates.
Our profitability and operating results are dependent on the rates we are able to charge for our services. Our rates are affected by a number of factors, including:
•
our clients’ perception of our ability to add value through our services;
•
our competitors’ pricing policies;
•
bid practices of clients and their use of third-party vendors;
•
the mix of onsite and offshore staffing;
•
employee wage levels and increases in compensation costs, including timing of promotions and annual pay increases;
•
our ability to charge premium prices when justified by market demand or the type of service; and
•
general economic conditions.
If we are not able to maintain favorable pricing for our services, our profitability could suffer.
If we are unable to collect our receivables from, or bill our unbilled services to, our clients, our results of operations and cash flows could be materially adversely affected.
Our business depends on our ability to successfully obtain payment from our clients of the amounts they owe us for work performed. We usually bill and collect on relatively short cycles. We maintain allowances against receivables. Actual losses on client balances could differ from those that we currently anticipate and, as a result, we might need to adjust our allowances. There is no guarantee that we will accurately assess the creditworthiness of our clients. Weak macroeconomic conditions and related turmoil in the global financial system could also result in financial difficulties, including limited access to the credit markets, insolvency, or bankruptcy for our clients, and, as a result, could cause clients to delay payments to us, request modifications to their payment arrangements that could increase our receivables balance, or default on their payment obligations to us. Timely collection of client balances also depends on our ability to complete our contractual commitments and bill and collect our contracted revenues. If we are unable to meet our contractual requirements, we might experience delays in collection of and/or be unable to collect our client balances, and if this occurs, our results of operations and cash flows could be materially adversely affected. Moreover, in the event of delays in payment from our governmental and quasi-governmental clients, we may have difficulty collecting on receivables owed. In addition, if we experience an increase in the time to bill and collect for our services, our cash flows could be materially adversely affected.
Our ability to generate and retain business depends on our reputation in the marketplace.
Our services are marketed to clients and prospective clients based on a number of factors. Since many of our specific client engagements involve unique services and solutions, our corporate reputation is a significant factor in our clients’ evaluation of whether to engage our services. We believe the EPAM brand name and our reputation are important corporate assets that help distinguish our services from those of our competitors and also contribute to our efforts to recruit and retain talented employees.
19
However, our corporate reputation is potentially susceptible to damage by actions or statements made by current or former clients, competitors, vendors, adversaries in legal proceedings, government regulators, as well as members of the investment community and the media. There is a risk that negative information about our company, even if based on false rumor or misunderstanding, could adversely affect our business. In particular, damage to our reputation could be difficult and time-consuming to repair, could make potential or existing clients reluctant to select us for new engagements, resulting in a loss of business, and could adversely affect our recruitment and retention efforts. Damage to our reputation could also reduce the value and effectiveness of the EPAM brand name and could reduce investor confidence in us.
Our effective tax rate could be materially adversely affected by several factors.
We conduct business globally and file income tax returns in multiple jurisdictions. Our effective tax rate could be materially adversely affected by several factors, including changes in the amount of income taxed by or allocated to the various jurisdictions in which we operate that have differing statutory tax rates; changing tax laws, regulations and interpretations of such tax laws in multiple jurisdictions; and the resolution of issues arising from tax audits or examinations and any related interest or penalties.
We report our results of operations based on our determination of the amount of taxes owed in the various jurisdictions in which we operate. We have transfer pricing arrangements among our subsidiaries in relation to various aspects of our business, including operations, marketing, sales and delivery functions. U.S. transfer pricing regulations, as well as regulations applicable in CIS and CEE countries in which we operate, require that any international transaction involving associated enterprises be on arm’s-length terms. We consider the transactions among our subsidiaries to be on arm’s-length terms. The determination of our consolidated provision for income taxes and other tax liabilities requires estimation, judgment and calculations where the ultimate tax determination may not be certain. Our determination of tax liability is always subject to review or examination by authorities in various jurisdictions.
If a tax authority in any jurisdiction reviews any of our tax returns and proposes an adjustment, including as a result of a determination that the transfer prices and terms we have applied are not appropriate, such an adjustment could have a negative impact on our business.
Our earnings could be adversely affected if we change our intent not to repatriate earnings in the CIS and CEE or such earnings become subject to U.S. tax on a current basis.
We do not accrue incremental U.S. taxes on all CIS and CEE earnings as these earnings (as well as other foreign earnings for all periods) are considered to be indefinitely reinvested outside of the United States. While we have no plans to do so, events may occur in the future that could effectively force us to change our intent not to repatriate our foreign earnings. If we change our intent and repatriate such earnings, we will have to accrue the applicable amount of taxes associated with such earnings and pay taxes at a substantially higher rate than our effective income tax rate in 2013. These increased taxes could materially adversely affect our financial condition and results of operations.
Our operating results may be negatively impacted by the loss of certain tax benefits provided by the governments of Belarus, Hungary and Russia to companies in our industry.
Our subsidiary in Belarus is a member of the Belarus Hi-Tech Park, in which member technology companies are exempt or levied at a reduced rate on a variety of taxes, including a 100% exemption from Belarusian income tax (which as of the date of this annual report was 18% and an exemption from the value added tax, for a period of 15 consecutive years effective July 1, 2006). In addition, our subsidiary in Hungary benefits from a tax credit of 10% of qualified salaries, taken over a four-year period, for up to 70% of the total tax due for that period. We have been able to take the full 70% credit for 2007 to 2012. The Hungarian tax authorities repealed the tax credit beginning with 2012. Credits earned in years prior to 2012, however, will be allowed through 2014. We anticipate full utilization up to the 70% limit until 2014, with full phase out in 2015. Our subsidiary in Russia benefits from a substantially reduced rate on social contributions and an exemption on value added tax in certain circumstances, which is a benefit to qualified IT companies in Russia. If the tax holiday relating to our Belarusian subsidiary, the tax incentives relating to our Hungarian subsidiary or the lower tax rates and social contributions relating to our Russian subsidiary are changed, terminated, not extended or comparable new tax incentives are not introduced, we expect that our effective income tax rate and/or our operating expenses would increase significantly, which could materially adversely affect our financial condition and results of operations. See “Item 7. Management’s Discussion and Analysis of Financial Condition and Results of Operations —Provision for Income Taxes.”
Changes in, or interpretations of, accounting principles could have a significant impact on our financial position and results of operations
We prepare our Consolidated Financial Statements in accordance with Generally Accepted Accounting Principles in the United States (“GAAP”). These principles are subject to interpretation by the Securities and Exchange Commission (“SEC”) and various bodies formed to interpret and create appropriate accounting principles. A change in these principles can have a significant effect on our reported results and may even retroactively affect previously reported transactions.
20
For example, the U.S.-based Financial Accounting Standards Board (“FASB”) is currently working together with the International Accounting Standards Board (“IASB”) on several projects to further align accounting principles and facilitate more comparable financial reporting between companies who are required to follow GAAP under SEC regulations and those who are required to follow International Financial Reporting Standards outside of the U.S. These efforts by the FASB and IASB may result in different accounting principles under GAAP that may result in materially different financial results for us in areas including, but not limited to, principles for recognizing revenue and lease accounting.
Our agreement with one of our largest clients gives it the option to assume the operations of one of our offshore development centers, and the exercise of that option could result in a loss of future revenues and adversely affect our results of operations.
During the four-year term of our agreement with one of our largest clients, which ends in December 2014 unless extended by the client, the client is entitled to request us to transfer to it or its designees all of the operating relationships, including employment relationships with the employees dedicated to the offshore development center and contracts with subcontractors, at a pre-determined transfer price dependent on the experience level of the transferred employee and the duration such employee worked on projects for the client. We are required to transfer assets that have already been financed by the client under our agreement, such as our offshore development center dedicated to the client, at a de minimis pre-agreed price. Since our client has already financed such assets, the carrying value of such assets is de minimis. In addition to the above amounts, the client is also required to pay a negotiated value or book value for the assets to be transferred that have not already been financed by the client. This client accounted for 9.6%, 9.2% and 6.3% of our revenues in 2013, 2012 and 2011, respectively. In addition, under our agreement, the client has the right to step in and take over all or part of the offshore development center in certain instances, including if we are in material default under certain provisions of our agreement, such as those related to the level or quality of our services, or the client has determined it is otherwise obliged to do so in emergencies or for regulatory reasons. In the event the client takes over any services we provide under our agreement, it will not be obligated to pay us for the provision of those services. If the client exercises these rights, we would lose future revenues related to the services we provide to the client, as well as lose some of our assets and key employees, and our losses may not be fully covered by the contractual payment, which could adversely affect our results of operations.
Undetected software design defects, errors or failures may result in loss of or delay in market acceptance of our services or in liabilities that could materially adversely affect our business.
Our software development solutions involve a high degree of technological complexity, have unique specifications and could contain design defects or software errors that are difficult to detect and correct. Errors or defects may result in the loss of current clients and loss of, or delay in, revenues, loss of market share, loss of client data, a failure to attract new clients or achieve market acceptance, diversion of development resources and increased support or service costs. We cannot provide assurance that, despite testing by our clients and us, errors will not be found in new software product development solutions, which could result in litigation and other claims for damages against us and thus could materially adversely affect our business.
Disruptions in internet infrastructure, telecommunications or significant failure in our IT systems could harm our service model, which could result in a reduction of our revenue.
Part of our service model is to maintain active voice and data communications, financial control, accounting, customer service and other data processing systems between our clients’ offices, our delivery centers and our client management locations (including our headquarters in Newtown, PA). Our business activities may be materially disrupted in the event of a partial or complete failure of any of these internet, IT or communication systems, which could be caused by, among other things, software malfunction, computer virus attacks, conversion errors due to system upgrading, damage from fire, earthquake, power loss, telecommunications failure, unauthorized entry, demands placed on internet infrastructure by growing numbers of users and time spent online or increased bandwidth requirements or other events beyond our control. Loss of all or part of the infrastructure or systems for a period of time could hinder our performance or our ability to complete client projects on time which, in turn, could lead to a reduction of our revenue or otherwise materially adversely affect our business and business reputation.
Our computer networks may be vulnerable to security risks that could disrupt our services and cause us to incur losses or liabilities that could adversely affect our business.
Our computer networks may be vulnerable to unauthorized access, computer hackers, computer viruses, worms, malicious applications and other security problems caused by unauthorized access to, or improper use of, systems by third parties or employees. A hacker who circumvents security measures could misappropriate proprietary information, including personally identifiable information, or cause interruptions or malfunctions in our operations. Although we intend to continue to implement security measures, computer attacks or disruptions may jeopardize the security of information stored in and transmitted through our computer systems. Actual or perceived concerns that our systems may be vulnerable to such attacks or disruptions may deter our clients from using our solutions or services. As a result, we may be required to expend significant resources to protect against the threat of these security breaches or to alleviate problems caused by these breaches.
21
Data networks are also vulnerable to attacks, unauthorized access and disruptions. For example, in a number of public networks, hackers have bypassed firewalls and misappropriated confidential information, including personally identifiable information. It is possible that, despite existing safeguards, an employee could misappropriate our clients’ proprietary information or data, exposing us to a risk of loss or litigation and possible liability. Losses or liabilities that are incurred as a result of any of the foregoing could adversely affect our business.
If we cause disruptions to our clients’ businesses or provide inadequate service, our clients may have claims for substantial damages against us, which could cause us to lose clients, have a negative effect on our reputation and adversely affect our results of operations.
If our IT professionals make errors in the course of delivering services to our clients or fail to consistently meet service requirements of a client, these errors or failures could disrupt the client’s business, which could result in a reduction in our revenues or a claim for substantial damages against us. In addition, a failure or inability to meet a contractual requirement could seriously damage our reputation and affect our ability to attract new business.
The services we provide are often critical to our clients’ businesses. Certain of our client contracts require us to comply with security obligations including maintaining network security and backup data, ensuring our network is virus-free, maintaining business continuity planning procedures, and verifying the integrity of employees that work with our clients by conducting background checks. Any failure in a client’s system or breach of security relating to the services we provide to the client could damage our reputation or result in a claim for substantial damages against us. Any significant failure of our equipment or systems, or any major disruption to basic infrastructure like power and telecommunications in the locations in which we operate, could impede our ability to provide services to our clients, have a negative impact on our reputation, cause us to lose clients, and adversely affect our results of operations.
Under our contracts with our clients, our liability for breach of our obligations is in some cases limited pursuant to the terms of the contract. Such limitations may be unenforceable or otherwise may not protect us from liability for damages. In addition, certain liabilities, such as claims of third parties for which we may be required to indemnify our clients, are generally not limited under our contracts. The successful assertion of one or more large claims against us in amounts greater than those covered by our current insurance policies could materially adversely affect our business, financial condition and results of operations. Even if such assertions against us are unsuccessful, we may incur reputational harm and substantial legal fees.
Our subcontracting practices may expose us to technical uncertainties, potential liabilities and reputational harm.
In order to meet our personnel needs, increase workforce flexibility, and improve pricing competitiveness, we use subcontractors and freelancers primarily to perform short-term assignments in certain specialty areas or on other projects where it is impractical to use our employees, or where we need to supplement our resources. We also use subcontractors for internal assignments, such as assisting in development of internal systems, recruiting, training, human resources consulting and administration, and other similar support functions. Despite certain advantages of subcontracting, such arrangements also give rise to a number of risks.
Although we try to source competent and credible third parties as our subcontractors, they may not be able to deliver the level of service that our clients expect us to deliver. Furthermore, we enter into confidentiality agreements with our subcontractors, but we cannot guarantee that they will not breach the confidentiality of us or our clients and misappropriate our or our clients’ proprietary information and technology in the course of providing service. We, as the party to the contract with the client, are directly responsible for the losses our subcontractors cause our clients. Under the subcontracting agreements we enter into, our subcontractors generally promise to indemnify us for damages caused by their breach, but we may be unable to collect under these agreements. Moreover, their breaches may damage our reputation, cause us to lose existing business and adversely affect our ability to acquire new business in the future.
Our employee loans expose us to lending risks
At December 31, 2013, we had $6.4 million, or 1.5%, of our total assets, of loans issued to employees. These loans expose us to a risk of non-payment and loss. Repayment of these loans is primarily dependent on personal income of borrowers obtained though their employment with EPAM and may be adversely affected by changes in macroeconomic situations, such as higher unemployment levels, foreign currency devaluation and inflation. Additionally, continuing financial stability of the borrower may be adversely affected by job loss, divorce, illness or personal bankruptcy. We also face the risk that the collateral will be insufficient to compensate us for loan losses, if any, and costs of foreclosure. Decreases in real estate values could adversely affect the value of property used as collateral, and we may be unsuccessful in recovering the remaining balance from either the borrower and/or guarantors. See Note 5 of our consolidated financial statements in Part IV, “Item 15. Exhibits, Financial Statement Schedules — Audited Consolidated Financial Statements,” for further information regarding these loans.
22
There may be adverse tax and employment law consequences if the independent contractor status of our IT professionals or the exempt status of our employees is successfully challenged.
Some of our IT professionals are retained as independent contractors. Although we believe that we have properly classified these individuals as independent contractors, there is nevertheless a risk that the IRS or another federal, state, provincial or foreign authority will take a different view. Furthermore, the tests governing the determination of whether an individual is considered to be an independent contractor or an employee are typically fact sensitive and vary from jurisdiction to jurisdiction. Laws and regulations that govern the status and misclassification of independent contractors are subject to change or interpretation by various authorities. If a federal, state, provincial or foreign authority or court enacts legislation or adopts regulations that change the manner in which employees and independent contractors are classified or makes any adverse determination with respect to some or all of our independent contractors, we could incur significant costs under such laws and regulations, including for prior periods, in respect of tax withholding, social security taxes or payments, workers’ compensation and unemployment contributions, and recordkeeping, or we may be required to modify our business model, any of which could materially adversely affect our business, financial condition and results of operations. There is also a risk that we may be subject to significant monetary liabilities arising from fines or judgments as a result of any such actual or alleged non-compliance with federal, state, provincial or foreign tax laws. Further, if it were determined that any of our independent contractors should be treated as employees, we could possibly incur additional liabilities under our applicable employee benefit plans.
In addition, we have classified all of our U.S. employees as “exempt” under the Federal Labor Standards Act, or the FLSA. If it were determined that any of our U.S. employees should be classified as “non-exempt” under the FLSA, we may incur costs and liabilities for back wages, unpaid overtime, fines or penalties and/or be subject to employee litigation.
Our insurance coverage may be inadequate to protect us against losses.
Although we maintain some insurance coverage, including professional liability insurance, property insurance coverage for certain of our facilities and equipment and business interruption insurance coverage for certain of our operations, we do not insure for all risks in our operations. If any claims for injury are brought against us, or if we experience any business disruption, litigation or natural disaster, we might incur substantial costs and diversion of resources.
Most of the agreements we have entered into with our clients require us to purchase and maintain specified insurance coverage during the terms of the agreements, including commercial general insurance or public liability insurance, umbrella insurance, product liability insurance, and workers’ compensation insurance. Some of these types of insurance are not available on reasonable terms or at all in CIS and CEE countries. Although to date no client has brought any claims against us for such failure, our clients have the right to terminate these agreements as a result of such failure.
Our business could be negatively affected if we incur legal liability, including with respect to our indemnification obligations, in connection with providing our solutions and services.
If we fail to meet our contractual obligations or otherwise breach obligations to our clients, we could be subject to legal liability. We may enter into non-standard agreements because we perceive an important economic opportunity or because our personnel did not adequately adhere to our guidelines. In addition, the contracting practices of our competitors may cause contract terms and conditions that are unfavorable to us to become standard in the marketplace. If we cannot or do not perform our obligations, we could face legal liability and our contracts might not always protect us adequately through limitations on the scope and/or amount of our potential liability. If we cannot, or do not, meet our contractual obligations to provide solutions and services, and if our exposure is not adequately limited through the terms of our agreements, we might face significant legal liability and our financial condition and results of operations could be materially adversely affected.
In the normal course of business and in conjunction with certain client engagements, we have entered into contractual arrangements through which we may be obligated to indemnify clients or other parties with whom we conduct business with respect to certain matters. These arrangements can include provisions whereby we agree to defend and hold the indemnified party and certain of their affiliates harmless with respect to claims related to matters including our breach of certain representations, warranties or covenants, or out of our intellectual property infringement, our gross negligence or willful misconduct, and certain other claims. Payments by us under any of these arrangements are generally conditioned on the client making a claim and providing us with full control over the defense and settlement of such claim. It is not possible to determine the maximum potential amount under these indemnification agreements due to the unique facts and circumstances involved in each particular agreement, and any claims under these agreements may not be subject to liability limits or exclusion of consequential, indirect or punitive damages. Historically, we have not made payments under these indemnification agreements so they have not had any impact on our operating results, financial position, or cash flows. However, if events arise requiring us to make payment for indemnification claims under our indemnification obligations in contracts we have entered, such payments could have a material impact on our financial condition and results of operations.
23
We may be liable to our clients for damages caused by a violation of intellectual property rights, the disclosure of other confidential information, including personally identifiable information, system failures, errors or unsatisfactory performance of services, and our insurance policies may not be sufficient to cover these damages.
We often have access to, and are required to collect and store, sensitive or confidential client information, including personally identifiable information. Some of our client agreements do not limit our potential liability for breaches of confidentiality, infringement indemnity and certain other matters. Furthermore, breaches of confidentiality may entitle the aggrieved party to equitable remedies, including injunctive relief. If any person, including any of our employees, penetrates our network security or misappropriates sensitive or confidential client information, including personally identifiable information, we could be subject to significant liability from our clients or from our clients’ customers for breaching contractual confidentiality provisions or privacy laws. The protection of the intellectual property rights and other confidential information or personally identifiable information of our clients is particularly important for us since our operations are mainly based in CIS and CEE countries. CIS and CEE countries have not traditionally enforced intellectual property protection to the same extent as countries such as the United States. Despite measures we take to protect the intellectual property and other confidential information or personally identifiable information of our clients, unauthorized parties, including our employees and subcontractors, may attempt to misappropriate certain intellectual property rights that are proprietary to our clients or otherwise breach our clients’ confidences. Unauthorized disclosure of sensitive or confidential client information, including personally identifiable information, or a violation of intellectual property rights, whether through employee misconduct, breach of our computer systems, systems failure or otherwise, may subject us to liabilities, damage our reputation and cause us to lose clients.
Many of our contracts involve projects that are critical to the operations of our clients’ businesses and provide benefits to our clients that may be difficult to quantify. Any failure in a client’s system or any breach of security could result in a claim for substantial damages against us, regardless of our responsibility for such failure. Furthermore, any errors by our employees in the performance of services for a client, or poor execution of such services, could result in a client terminating our engagement and seeking damages from us.
Although we attempt to limit our contractual liability for consequential damages in rendering our services, these limitations on liability may not apply in all circumstances, may be unenforceable in some cases, or may be insufficient to protect us from liability for damages. There may be instances when liabilities for damages are greater than the insurance coverage we hold and we will have to internalize those losses, damages and liabilities not covered by our insurance.
We may not be able to prevent unauthorized use of our intellectual property, and our intellectual property rights may not be adequate to protect our business and competitive position.
We rely on a combination of copyright, trademark, unfair competition and trade secret laws, as well as confidentiality agreements and other methods to protect our intellectual property rights. Implementation of intellectual property-related laws in CIS and CEE countries has historically been lacking, primarily because of ambiguities in the laws and difficulties in enforcement. Accordingly, protection of intellectual property rights and confidentiality in CIS and CEE countries may not be as effective as that in the United States or other countries.
To protect our and our clients’ proprietary information and other intellectual property, we require our employees, independent contractors, vendors and clients to enter into written confidentiality agreements with us. These agreements may not provide meaningful protection for trade secrets, know-how or other proprietary information in the event of any unauthorized use, misappropriation or disclosure of such trade secrets, know-how or other proprietary information. Policing unauthorized use of proprietary technology is difficult and expensive. The steps we have taken may be inadequate to prevent the misappropriation of our and our clients’ proprietary technology. Reverse engineering, unauthorized copying or other misappropriation of our and our clients’ proprietary technologies, tools and applications could enable third parties to benefit from our or our clients’ technologies, tools and applications without paying us for doing so, and our clients may hold us liable for that act and seek damages and compensation from us, which could harm our business and competitive position.
We rely on our trademarks, trade names, service marks and brand names to distinguish our services and solutions from the services of our competitors, and have registered or applied to register several of these trademarks. We cannot assure you that our trademark applications will be approved. Third parties may oppose our trademark applications, or otherwise challenge our use of our trademarks. For instance, in 2005, we entered into a Consent of Use and Settlement Agreement that allowed a third party to use the mark “ePAM” (as capitalized in the foregoing) and restricted our ability to do so. In the event that our trademarks are successfully challenged, we could be forced to rebrand our services and solutions, which could result in loss of brand recognition, and could require us to devote resources to advertising and marketing new brands. Further, we cannot assure you that competitors will not infringe our trademarks, or that we will have adequate resources to enforce our trademarks.
24
We may need to enforce our intellectual property rights through litigation. Litigation relating to our intellectual property may not prove successful and might result in substantial costs and diversion of resources and management attention.
In addition, we rely on certain third-party software to conduct our business. If we lose the licenses which permit us to use such software, they may be difficult to replace and it may be costly to do so.
We may face intellectual property infringement claims that could be time-consuming and costly to defend. If we fail to defend ourselves against such claims, we may lose significant intellectual property rights and may be unable to continue providing our existing services.
Our success largely depends on our ability to use and develop our technology, tools, code, methodologies and services without infringing the intellectual property rights of third parties, including patents, copyrights, trade secrets and trademarks. We may be subject to litigation involving claims of patent infringement or violation of other intellectual property rights of third parties. We typically indemnify clients who purchase our services and solutions against potential infringement of intellectual property rights, which subjects us to the risk of indemnification claims. These claims may require us to initiate or defend protracted and costly litigation on behalf of our clients, regardless of the merits of these claims and are often not subject to liability limits or exclusion of consequential, indirect or punitive damages. If any of these claims succeed, we may be forced to pay damages on behalf of our clients, redesign or cease offering our allegedly infringing services or solutions, or obtain licenses for the intellectual property such services or solutions allegedly infringe. If we cannot obtain all necessary licenses on commercially reasonable terms, our clients may be forced to stop using our services or solutions.
The holders of patents and other intellectual property rights potentially relevant to our service offerings may make it difficult for us to acquire a license on commercially acceptable terms. In addition, we may be unaware of intellectual property registrations or applications relating to our services that may give rise to potential infringement claims against us. There may also be technologies licensed to and relied on by us that are subject to infringement or other corresponding allegations or claims by third parties which may damage our ability to rely on such technologies.
Further, our current and former employees and/or subcontractors could challenge our exclusive rights in the software they have developed in the course of their employment. In Russia and certain other countries in which we operate, an employer is deemed to own the copyright in works created by its employees during the course, and within the scope, of their employment, but the employer may be required to satisfy additional legal requirements in order to make further use and dispose of such works. While we believe that we have complied with all such requirements, and have fulfilled all requirements necessary to acquire all rights in software developed by our independent contractors and/or subcontractors, these requirements are often ambiguously defined and enforced. As a result, we cannot assure that we would be successful in defending against any claim by our current or former employees, independent contractors and/or subcontractors challenging our exclusive rights over the use and transfer of works those employees, independent contractors and/or subcontractors created or requesting additional compensation for such works.
We are subject to additional risks as a result of our recent and possible future acquisitions and the hiring of new employees who may misappropriate intellectual property from their former employers. The developers of the technology that we have acquired or may acquire may not have appropriately created, maintained or enforced intellectual property rights in such technology. Indemnification and other rights under acquisition documents may be limited in term and scope and may therefore provide little or no protection from these risks. Parties making infringement claims may be able to obtain an injunction to prevent us from delivering our services or using technology involving the allegedly infringing intellectual property. Intellectual property litigation is expensive and time-consuming and could divert management’s attention from our business. A successful infringement claim against us, whether with or without merit, could, among others things, require us to pay substantial damages, develop non-infringing technology, or rebrand our name or enter into royalty or license agreements that may not be available on acceptable terms, if at all, and would require us to cease making, licensing or using products that have infringed a third party’s intellectual property rights. Protracted litigation could also result in existing or potential clients deferring or limiting their purchase or use of our software product development services or solutions until resolution of such litigation, or could require us to indemnify our clients against infringement claims in certain instances. Any intellectual property claim or litigation in this area, whether we ultimately win or lose, could damage our reputation and materially adversely affect our business, financial condition and results of operations.
Our global operations expose us to numerous and sometimes conflicting legal and regulatory requirements, and violations or unfavorable interpretation by authorities of these regulations could harm our business.
Because we provide IT services to clients throughout the world, we are subject to numerous, and sometimes conflicting, legal rules on matters as diverse as import/export controls, content requirements, trade restrictions, tariffs, taxation, sanctions, government affairs, internal and disclosure control obligations, data privacy and labor relations, particularly in the CIS and CEE countries in which we operate. Our systems and operations are located almost entirely in the CIS and CEE and laws and regulations that are applicable to us, but not to our competitors, may impede our ability to develop and offer services that compete effectively with those offered by our non-CIS or -CEE based competitors and generally available worldwide. Violations of these laws or regulations in the conduct of our
25
business could result in fines, criminal sanctions against us or our officers, prohibitions on doing business, damage to our reputation and other unintended consequences such as liability for monetary damages, fines and/or criminal prosecution, unfavorable publicity, restrictions on our ability to process information and allegations by our clients that we have not performed our contractual obligations. Due to the varying degrees of development of the legal systems of the countries in which we operate, local laws might be insufficient to protect our rights. Our failure to comply with applicable legal and regulatory requirements could materially adversely affect our business.
We are subject to laws and regulations in the United States and other countries in which we operate concerning our operations, including export restrictions, U.S. economic sanctions and the Foreign Corrupt Practices Act, or FCPA, and similar anti-bribery laws. If we are not in compliance with applicable legal requirements, we may be subject to civil or criminal penalties and other remedial measures.
Our operations are subject to laws and regulations restricting our operations, including activities involving restricted countries, organizations, entities and persons that have been identified as unlawful actors or that are subject to U.S. sanctions imposed by the Office of Foreign Assets Control, or OFAC, or other international economic sanctions that prohibit us from engaging in trade or financial transactions with certain countries, businesses, organizations and individuals. We are subject to the FCPA, which prohibits U.S. companies and their intermediaries from bribing foreign officials for the purpose of obtaining or keeping business or otherwise obtaining favorable treatment, and other laws concerning our international operations. The FCPA’s foreign counterparts contain similar prohibitions, although varying in both scope and jurisdiction. We operate in many parts of the world that have experienced governmental corruption to some degree, and, in certain circumstances, strict compliance with anti-bribery laws may conflict with local customs and practices.
We have recently developed and are in the process of implementing formal controls and procedures to ensure that we are in compliance with the FCPA, OFAC sanctions, and similar sanctions, laws and regulations. The implementation of such procedures may be time consuming and expensive, and could result in the discovery of issues or violations with respect to the foregoing by us or our employees, independent contractors, subcontractors or agents of which we were previously unaware.
Any violations of these laws, regulations and procedures by our employees, independent contractors, subcontractors and agents could expose us to administrative, civil or criminal penalties, fines or restrictions on export activities (including other U.S. laws and regulations as well as foreign and local laws) and would adversely affect our reputation and the market for shares of our common stock and may require certain of our investors to disclose their investment in our company under certain state laws. If we are not in compliance with export restrictions, U.S. or international economic sanctions or other laws and regulations that apply to our operations, we may be subject to civil or criminal penalties and other remedial measures.
Anti-outsourcing legislation and restrictions on immigration, if adopted, may affect our ability to compete for and provide services to clients in the United States or other countries, which could hamper our growth and cause our revenues to decline.
The vast majority of our employees are nationals of CIS and CEE countries. Some of our projects require a portion of the work to be undertaken at our clients’ facilities which are sometimes located outside the CIS and CEE. The ability of our employees to work in the United States, Europe, the CIS and CEE, and other countries outside the CIS and CEE depends on their ability to obtain the necessary visas and work permits. Historically, the process for obtaining visas for nationals of CIS and CEE countries to certain countries, including the United States and Europe, has been lengthy and cumbersome. Immigration laws in the United States and in other countries are subject to legislative change, as well as to variations in standards of application and enforcement due to political forces and economic conditions.
In addition, the issue of companies outsourcing services to organizations operating in other countries is a topic of political discussion in many countries, including the United States, which is our largest source of revenues.
Many organizations and public figures in the United States and Europe have publicly expressed concern about a perceived association between offshore outsourcing IT services providers and the loss of jobs in their home countries. For example, measures aimed at limiting or restricting outsourcing by U.S. companies are currently under consideration in Congress and in numerous state legislatures to address concerns over the perceived association between offshore outsourcing and the loss of jobs in the United States. In particular, it is possible that pending legislation in the United States may impose restrictions on our ability to deploy employees holding U.S. work visas to client locations, which could adversely impact our ability to do business in the jurisdictions in which we have clients. It is generally difficult to predict the political and economic events that could affect immigration laws, or the restrictive impact they could have on obtaining or maintaining business visas for our employees. However, if enacted, such measures may broaden restrictions on outsourcing by federal and state government agencies and on government contracts with firms that outsource services directly or indirectly, impact private industry with measures such as tax disincentives or intellectual property transfer restrictions, and/or restrict the use of certain work visas. Our reliance on visas for a number of employees makes us vulnerable to such changes and variations as it affects our ability to staff projects with employees who are not citizens of the country where the work is to be performed. We may not be able to obtain a sufficient number of visas for our employees or we may encounter delays or additional
26
costs in obtaining or maintaining such visas, in which case we may not be able to provide services to our clients on a timely and cost-effective basis or manage our sales and delivery centers as efficiently as we otherwise could, any of which could hamper our growth and cause our revenues to decline.
Similarly, legislation enacted in certain European jurisdictions and any future legislation in European jurisdictions or any other country in which we have clients restricting the performance of services from an offshore location could also materially adversely affect our business, financial condition and results of operations. For example, legislation enacted in the United Kingdom, based on the 1977 EC Acquired Rights Directive, has been adopted in some form by many European Union countries, and provides that if a company outsources all or part of its business to an IT services provider or changes its current IT services provider, the affected employees of the company or of the previous IT services provider are entitled to become employees of the new IT services provider, generally on the same terms and conditions as their original employment. In addition, dismissals of employees who were employed by the company or the previous IT services provider immediately prior to that transfer are automatically considered unfair dismissals that entitle such employees to compensation. As a result, in order to avoid unfair dismissal claims, we may have to offer, and become liable for, voluntary redundancy payments to the employees of our clients who outsource business to us in the United Kingdom and other European Union countries who have adopted similar laws. This legislation could materially affect our ability to obtain new business from companies in the United Kingdom and European Union and to provide outsourced services to companies in the United Kingdom and European Union in a cost-effective manner.
In addition, from time to time, there has been publicity about negative experiences associated with offshore outsourcing, such as theft and misappropriation of sensitive client data. Current or prospective clients may elect to perform certain services themselves or may be discouraged from transferring services from onshore to offshore IT services providers to avoid negative perceptions that may be associated with using an offshore IT services provider. Any slowdown or reversal of the existing industry trends toward offshore outsourcing would seriously harm our ability to compete effectively with competitors that provide services from within the country in which our clients operate.
Our international sales and operations are subject to many uncertainties.
Revenues from clients outside North America represented 47.8%, 50.8% and 48.8% of our revenues excluding reimbursable expenses for 2013, 2012 and 2011, respectively. We anticipate that clients outside North America will continue to account for a material portion of our revenues in the foreseeable future and may increase as we expand our international presence, particularly in Europe and the CIS. In addition, the majority of our employees, along with our development and delivery centers, are located in the CIS and CEE. As a result, we may be subject to risks inherently associated with international operations, including risks associated with foreign currency exchange rate fluctuations, which may cause volatility in our reported income, and risks associated with the application and imposition of protective legislation and regulations relating to import or export or otherwise resulting from foreign policy or the variability of foreign economic conditions.
Additional risks associated with international operations include difficulties in enforcing intellectual property and/or contractual rights, the burdens of complying with a wide variety of foreign laws, potentially adverse tax consequences, tariffs, quotas and other barriers and potential difficulties in collecting accounts receivable. In addition, we may face competition in other countries from companies that may have more experience with operations in such countries or with international operations. Additionally, such companies may have long-standing or well-established relationships with desired clients, which may put us at a competitive disadvantage. We may also face difficulties integrating new facilities in different countries into our existing operations, as well as integrating employees that we hire in different countries into our existing corporate culture. Our international expansion plans may not be successful and we may not be able to compete effectively in other countries. There can be no assurance that these and other factors will not impede the success of our international expansion plans or limit our ability to compete effectively in other countries.
If we fail to integrate or manage acquired companies efficiently, or if the acquired companies are difficult to integrate, divert management resources or do not perform to our expectations, we may not be able to realize the benefits envisioned for such acquisitions, and our overall profitability and growth plans could be materially adversely affected.
On occasion we have expanded our service capabilities and gained new clients through selective acquisitions. Our ability to successfully integrate an acquired entity and realize the benefits of an acquisition requires, among other things, successful integration of technologies, operations and personnel. Challenges we face in the acquisition and integration process include:
•
integrating operations, services and personnel in a timely and efficient manner;
•
diverting significant management attention and financial resources from our other operations and disrupting our ongoing
business;
•
unforeseen or undisclosed liabilities and integration costs;
•
incurring liabilities from the acquired businesses for infringement of intellectual property rights or other claims for which
we may not be successful in seeking indemnification;
27
•
incurring debt, amortization expenses related to intangible assets, large and immediate write-offs, assuming unforeseen or
undisclosed liabilities, or issuing common stock that would dilute our existing stockholders’ ownership;
•
generating sufficient revenues and net income to offset acquisition costs;
•
potential loss of, or harm to, employee or client relationships;
•
properly structuring our acquisition consideration and any related post-acquisition earn-outs and successfully monitoring
any earn-out calculations and payments;
•
failing to realize the potential cost savings or other financial benefits and/or the strategic benefits of the acquisition;
•
retaining key senior management and key sales and marketing and research and development personnel, particularly those
of the acquired operations;
•
potential incompatibility of solutions, services and technology or corporate cultures;
•
consolidating and rationalizing corporate, information technology and administrative infrastructures;
•
integrating and documenting processes and controls;
•
entry into unfamiliar markets; and
•
increased complexity from potentially operating additional geographically dispersed sites, particularly if we acquire a
company or business with facilities or operations outside of the countries in which we currently have operations.
In addition, the primary value of many potential acquisition targets in the IT services industry lies in their skilled IT professionals and established client relationships. Transitioning these types of assets to our business can be particularly difficult due to different corporate cultures and values, geographic distance and other intangible factors. For example, some newly acquired employees may decide not to work with us or to leave shortly after their move to our company and some acquired clients may decide to discontinue their commercial relationships with us. These challenges could disrupt our ongoing business, distract our management and employees and increase our expenses, including causing us to incur significant one-time expenses and write-offs, and make it more difficult and complex for our management to effectively manage our operations. If we are not able to successfully integrate an acquired entity and its operations and to realize the benefits envisioned for such acquisition, our overall growth and profitability plans may be adversely affected.
International hostilities, terrorist activities, other violence or war, natural disasters, pandemics and infrastructure disruptions could delay or reduce the number of new service orders we receive and impair our ability to service our clients.
Hostilities and acts of terrorism, violence or war, natural disasters, global health risks or pandemics or the threat or perceived potential for these events could materially adversely affect our operations and our ability to provide services to our clients. We may be unable to protect our people, facilities and systems against any such occurrences. Such events may cause clients to delay their decisions on spending for IT services and give rise to sudden significant changes in regional and global economic conditions and cycles. These events also pose significant risks to our people and to physical facilities and operations around the world, whether the facilities are ours or those of our clients, which could materially adversely affect our financial results. By disrupting communications and travel, giving rise to travel restrictions, and increasing the difficulty of obtaining and retaining highly-skilled and qualified IT professionals, these events could make it difficult or impossible for us to deliver services to some or all of our clients. Travel restrictions could cause us to incur additional unexpected labor costs and expenses or could restrain our ability to retain the skilled IT professionals we need for our operations. In addition, any extended disruptions of electricity, other public utilities or network services at our facilities, as well as system failures at, or security breaches in, our facilities or systems, could also adversely affect our ability to serve our clients.
We may need additional capital, and a failure by us to raise additional capital on terms favorable to us, or at all, could limit our ability to grow our business and develop or enhance our service offerings to respond to market demand or competitive challenges.
We believe that our current cash, cash flow from operations and revolving line of credit should be sufficient to meet our anticipated cash needs for at least the next 12 months. We may, however, require additional cash resources due to changed business conditions or other future developments, including any investments or acquisitions we may decide to pursue. If these resources are insufficient to satisfy our cash requirements, we may seek to sell additional equity or debt securities or obtain another credit facility.
The sale of additional equity securities could result in dilution to our stockholders. The incurrence of indebtedness would result in increased debt service obligations and could require us to agree to operating and financing covenants that would restrict our operations. Our ability to obtain additional capital on acceptable terms is subject to a variety of uncertainties, including:
•
investors’ perception of, and demand for, securities of IT services companies;
•
conditions of the United States and other capital markets in which we may seek to raise funds;
28
•
our future results of operations and financial condition;
•
government regulation of foreign investment in the CIS and CEE; and
•
economic, political and other conditions in the CIS and CEE.
Existing stockholders have substantial control over us and could limit your ability to influence the outcome of key transactions, including a change of control.
As of March 1, 2014, to our knowledge, our greater than 5% stockholders, directors and executive officers and entities affiliated with them own approximately 46.3% of the outstanding shares of our common stock, which includes approximately 16.7% of the outstanding shares of our common stock owned by affiliates of Siguler Guff & Company. As a result, these stockholders, if acting together, would be able to influence or control matters requiring approval by our stockholders, including the election of directors, the approval of merger, consolidation or sale of all or substantially all of our assets and other significant business or corporate transactions. They may also have interests that differ from yours and may vote in a way with which you disagree and which may be adverse to your interests. The concentration of ownership may have the effect of delaying, preventing or deterring a change of control of our company, could deprive our stockholders of an opportunity to receive a premium for their common stock as part of a sale of our company and might ultimately affect the market price of our common stock.
Companies doing business in emerging markets, such as CIS and CEE countries, are subject to significant economic risks.
CIS and CEE countries are generally considered to be emerging markets. Investors in emerging markets should be aware that these markets are subject to greater risks than more developed markets, including significant economic risks. The economies of CIS and CEE countries, like other emerging economies, are vulnerable to market downturns and economic slowdowns elsewhere in the world. The economies of Belarus, Russia, Ukraine, Hungary and other CIS and CEE countries where we operate have experienced periods of considerable instability and have been subject to abrupt downturns. As has happened in the past, financial problems or an increase in the perceived risks associated with investing in emerging economies such as in the CIS and CEE could dampen foreign investment in these markets and materially adversely affect their economies. In addition, deterioration in macroeconomic conditions, such as the recent debt crisis in Europe, could require us to reassess the value of goodwill for potential impairment. This goodwill is subject to impairment tests on an ongoing basis. Weakening macroeconomic conditions in the countries in which we operate and/or a significant difference between the performance of an acquired company and the business case assumed at the time of acquisition could require us to write down the value of the goodwill or a portion of such value. These risks may be compounded by incomplete, unreliable or unavailable economic and statistical data on CIS and CEE countries, including elements of the information provided in this annual report. Similar statistics may be obtainable from other non-official sources, although the underlying assumptions and methodology, and consequently the resulting data, may vary from source to source. Economic instability in CIS or CEE countries where we operate and any future deterioration in the international economic situation could materially adversely affect our business, financial condition and results of operations.
Fluctuations in currency exchange rates could materially adversely affect our financial condition and results of operations.
We have significant international operations, and we earn our revenues and incur our expenses in multiple currencies. Doing business in different foreign currencies exposes us to foreign currency risks, including risks related to revenues and receivables, compensation of our personnel, purchases and capital expenditures. The majority of our revenues are in U.S. dollars, British pounds, Russian rubles and euros, and the majority of our expenses, particularly salaries of IT professionals, are denominated in U.S. dollars but payable in Belarusian rubles or in other local currencies at the exchange rate in effect at the time. To the extent that we increase our business and revenues which are denominated in Belarusian rubles, Ukrainian hryvnia, Hungarian forints or other local currencies, we will also increase our receivables denominated in those currencies and therefore also increase our exposure to fluctuations in their exchange rates against the U.S. dollar, our reporting currency. Similarly, any capital expenditures, such as for computer equipment, which are payable in the local currency of the countries in which we operate but are imported to such countries, and any deposits we hold in local currencies, can be materially affected by depreciation of the local currency against the U.S. dollar and the effect of such depreciation on the local economy. Due to the increasing size of our international operations, fluctuations in foreign currency exchange rates could materially impact our results. See “Item 7A. Quantitative and Qualitative Disclosures About Market Risk.”
29
The banking and financial systems in the CIS remain less developed than those in some more developed markets, and a banking crisis could place liquidity constraints on our business and materially adversely affect our business and financial condition.
Banking and other financial systems in the CIS are less developed and regulated than in some more developed markets, and legislation relating to banks and bank accounts is subject to varying interpretations and inconsistent application. Banks in the CIS generally do not meet the banking standards of more developed markets, and the transparency of the banking sector lags behind international standards. Furthermore, in Russia, Belarus and other CIS countries, bank deposits made by corporate entities generally are not insured. As a result, the banking sector remains subject to periodic instability. Another banking crisis, or the bankruptcy or insolvency of banks through which we receive or with which we hold funds, particularly in Belarus, may result in the loss of our deposits or adversely affect our ability to complete banking transactions in the CIS, which could materially adversely affect our business and financial condition.
The legal systems in CIS countries can create an uncertain environment for business activity, which could materially adversely affect our business and operations in the CIS.
The legal framework to support a market economy remains new and in flux in Belarus, Russia, Ukraine and other CIS countries and, as a result, these legal systems can be characterized by:
•
inconsistencies between and among laws and governmental, ministerial and local regulations, orders, decisions,
resolutions and other acts;
•
gaps in the regulatory structure resulting from the delay in adoption or absence of implementing regulations;
•
selective enforcement of laws or regulations, sometimes in ways that have been perceived as being motivated by political
or financial considerations;
•
limited judicial and administrative guidance on interpreting legislation;
•
relatively limited experience of judges and courts in interpreting recent commercial legislation;
•
a perceived lack of judicial and prosecutorial independence from political, social and commercial forces;
•
inadequate court system resources;
•
a high degree of discretion on the part of the judiciary and governmental authorities; and
•
underdeveloped bankruptcy procedures that are subject to abuse.
In addition, as is true of civil law systems generally, judicial precedents generally have no binding effect on subsequent decisions. Not all legislation and court decisions in CIS countries are readily available to the public or organized in a manner that facilitates understanding. Enforcement of court orders can in practice be very difficult. All of these factors make judicial decisions difficult to predict and effective redress uncertain. Additionally, court claims and governmental prosecutions may be used in furtherance of what some perceive to be political aims.
The untested nature of much of recent legislation in the countries in which we operate and the rapid evolution of their legal systems may result in ambiguities, inconsistencies and anomalies in the application and interpretation of laws and regulations. Any of these factors may affect our ability to enforce our rights under our contracts or to defend ourselves against claims by others, or result in our being subject to unpredictable requirements, and could materially adversely affect our business, financial condition and results of operations.
These uncertainties also extend to property rights. For example, during the transformation of Russia, Belarus, Ukraine and other CIS countries from centrally planned economies to market economies, legislation has generally been enacted in each of these countries to protect private property against uncompensated expropriation and nationalization. However, there is a risk that due to the lack of experience in enforcing these provisions and due to political factors, these protections would not be enforced in the event of an attempted expropriation or nationalization. Expropriation or nationalization of any of our entities, their assets or portions thereof, potentially without adequate compensation, could materially adversely affect our business, financial condition and results of operations.
Our CIS subsidiaries can be forced into liquidation on the basis of formal noncompliance with certain legal requirements.
We operate in CIS countries primarily through locally organized subsidiaries. Certain provisions of Russian law and the laws of other CIS countries may allow a court to order liquidation of a locally organized legal entity on the basis of its formal noncompliance with certain requirements during formation, reorganization or during its operations.
30
For example, in Russian corporate law, if the net assets of a Russian joint stock company calculated on the basis of Russian accounting standards are lower than its charter capital as at the end of its third or any subsequent financial year, the company must either decrease its charter capital or liquidate. If the company fails to comply with these requirements, governmental or local authorities can seek the involuntary liquidation of such company in court, and the company’s creditors will have the right to accelerate their claims or demand early performance of the company’s obligations as well as demand compensation of any damages.
Similarly, there have also been cases in CIS countries in which formal deficiencies in the establishment process of a legal entity or noncompliance with provisions of law have been used by courts as a basis for liquidation of a legal entity. Weaknesses in the legal systems of CIS countries create an uncertain legal environment, which makes the decisions of a court or a governmental authority difficult, if not impossible, to predict. If involuntary liquidation of any of our subsidiaries were to occur, such liquidation could materially adversely affect our financial condition and results of operations.
Any U.S. or other foreign judgments that may be obtained against us may be difficult to enforce in Belarus, Russia, Ukraine and other CIS countries.
Although we are a Delaware corporation, subject to suit in the United States and other courts, many of our assets are located in Belarus, Russia, Ukraine and other CIS countries, and one of our directors and his assets are located outside the United States. Although arbitration awards are generally enforceable in CIS countries, judgments obtained in the United States or in other foreign courts, including those with respect to U.S. federal securities law claims, may not be enforceable in many CIS countries, including Belarus, Russia and Ukraine. There is no mutual recognition treaty between the United States and Belarus, Russia or Ukraine. Therefore, it may be difficult to enforce any U.S. or other foreign court judgment obtained against any of our operating subsidiaries in CIS countries.
Our stock price is volatile.
Our common stock has at times experienced substantial price volatility as a result of variations between our actual and anticipated financial results, announcements by our competitors and us, projections or speculation about our business or that of our competitors by the media or investment analysts or uncertainty about current global economic conditions. The stock market, as a whole, also has experienced extreme price and volume fluctuations that have affected the market price of many technology companies in ways that may have been unrelated to these companies’ operating performance. Furthermore, we believe our stock price should reflect future growth and profitability expectations and, if we fail to meet these expectations, our stock price may significantly decline.
Compliance with changing regulation of corporate governance and public disclosure may result in additional expense and affect our operations.
Changing laws, regulations and standards relating to corporate governance and public disclosure, including the Dodd-Frank Wall Street Reform and Consumer Protection Act, SEC regulations and New York Stock Exchange, or NYSE, rules, are creating uncertainty for companies such as ours. These new or changed laws, regulations and standards are subject to varying interpretations in many cases due to their lack of specificity, and as a result, their application in practice may evolve over time as new guidance is provided by regulatory and governing bodies, which could result in continuing uncertainty regarding compliance matters and higher costs necessitated by ongoing revisions to disclosure and corporate governance practices. As a result, our efforts to comply with evolving laws, regulations and standards have resulted in, and are likely to continue to result in, increased general and administrative expenses and a diversion of management time and attention from revenue-generating activities to compliance activities. If our efforts to comply with new or changed laws, regulations and standards differ from the activities intended by regulatory or governing bodies due to ambiguities related to practice, our reputation may be harmed.
Not applicable.
We are incorporated in Delaware with headquarters in Newtown, PA, with multiple delivery centers located in Belarus, Ukraine, Russia, Hungary, Kazakhstan and Poland, and client management locations in the United States, Canada, the United Kingdom, Germany, Sweden, Switzerland, Russia and Kazakhstan.
31
The table below sets forth our principal properties:
|
Location
|
Square Meters
Leased
|
Square Meters
Owned
|
Total Square
Meters
|
|||||||||
|
Delivery Centers and Client Management Locations:
|
|
|
|
|||||||||
|
Belarus
|
26,909
|
7,655
|
34,564
|
|||||||||
|
Ukraine
|
27,783
|
—
|
27,783
|
|||||||||
|
Russia
|
14,906
|
—
|
14,906
|
|||||||||
|
Hungary
|
9,851
|
—
|
9,851
|
|||||||||
|
Kazakhstan
|
3,119
|
—
|
3,119
|
|||||||||
|
United States
|
2,982
|
—
|
2,982
|
|||||||||
|
Canada
|
810
|
—
|
810
|
|||||||||
|
United Kingdom
|
365
|
—
|
365
|
|||||||||
|
Sweden
|
220
|
—
|
220
|
|||||||||
|
Switzerland
|
122
|
—
|
122
|
|||||||||
|
Poland
|
86
|
—
|
86
|
|||||||||
|
Germany
|
—
|
—
|
—
|
|||||||||
|
Total
|
87,153
|
7,655
|
94,808
|
|||||||||
|
Executive Office:
|
||||||||||||
|
Newtown, PA, United States
|
932
|
—
|
932
|
|||||||||
Our facilities are used interchangeably amongst all of our segments. We believe that our existing facilities are adequate to meet our current requirements, and that suitable additional or substitute space will be available, if necessary.
Although we may, from time to time, be involved in litigation and claims arising out of our operations in the normal course of business, we are not currently a party to any material legal proceeding. In addition, we are not aware of any material legal or governmental proceedings against us, or contemplated to be brought against us.
Not applicable.
Item 5
.
Market for Registrant’s Common Equity, Related Stockholder Matters and Issuer Purchases of Equity Securities
Market Information
Our common stock is traded on the New York Stock Exchange, or the NYSE, under the symbol “EPAM.”
Our shares have been publicly traded since February 8, 2012. The following table shows the per share range of high and low sales prices for shares of our common stock, as listed for quotation on the NYSE, and the quarterly cash dividends paid per share for the quarterly periods indicated.
|
2013
|
|
|
||||||
|
Quarter Ended
|
High
|
Low
|
||||||
|
December 31
|
$
|
39.00
|
$
|
32.55
|
||||
|
September 30
|
$
|
35.13
|
$
|
25.36
|
||||
|
June 30
|
$
|
27.52
|
$
|
20.97
|
||||
|
March 31
|
$
|
23.68
|
$
|
18.98
|
||||
|
2012
|
|
|
||||||
|
Quarter Ended
|
High
|
Low
|
||||||
|
December 31
|
$
|
20.99
|
$
|
17.32
|
||||
|
September 30
|
$
|
19.64
|
$
|
13.94
|
||||
|
June 30
|
$
|
23.62
|
$
|
14.72
|
||||
|
March 31
|
$
|
21.25
|
$
|
13.25
|
||||
32
As of March 1, 2014, we had approximately 38 stockholders of record of our common stock. The number of record holders does not include holders of shares in “street names” or persons, partnerships, associations, corporations or other entities identified in security position listings maintained by depositories.
Dividend Policy
We have not declared or paid any cash dividends on our common stock and currently do not anticipate paying any cash dividends in the foreseeable future. Instead, we intend to retain all available funds and any future earnings for use in the operation and expansion of our business. Any future determination relating to dividend policy will be made at the discretion of our board of directors and will depend on our future earnings, capital requirements, financial condition, future prospects, applicable Delaware law, which provides that dividends are only payable out of surplus or current net profits, and other factors that our board of directors deems relevant. In addition, our credit facility restricts our ability to pay dividends.
Performance Graph
The following graph compares the cumulative total stockholder return on our common stock with the cumulative total return on the S&P 500 Index and a Peer Group Index (capitalization weighted) for the period beginning February 8, 2012, which is the date of our initial public offering, and ending on the last day of our last completed fiscal year. The stock performance shown on the graph below is not indicative of future price performance. The following performance graph and related information shall not be deemed “soliciting material” or to be “filed” with the SEC, nor shall information be incorporated by reference into any future filing under the Securities Act of 1933 or Securities Exchange Act of 1934, each as amended, except to the extent that we specifically incorporate it by reference into such filing.
COMPARISON OF CUMULATIVE TOTAL RETURN(1)(2)
Among EPAM, the S&P 500 Index and a Peer Group Index(3) (Capitalization Weighted)
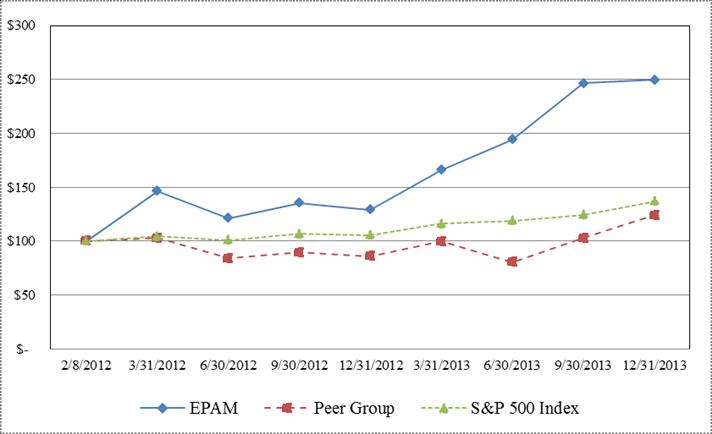
33
|
|
Company / Index
|
|||||||||||
|
Base Period
|
EPAM Systems,
Inc.
|
S&P 500
Index
|
Peer Group
Index
|
|||||||||
|
12/31/2013
|
$
|
249.57
|
$
|
136.92
|
$
|
124.18
|
||||||
|
9/30/2013
|
$
|
246.43
|
$
|
124.56
|
$
|
103.03
|
||||||
|
6/30/2013
|
$
|
194.14
|
$
|
118.99
|
$
|
80.39
|
||||||
|
3/31/2013
|
$
|
165.93
|
$
|
116.24
|
$
|
99.89
|
||||||
|
12/31/2012
|
$
|
129.29
|
$
|
105.65
|
$
|
85.86
|
||||||
|
9/30/2012
|
$
|
135.29
|
$
|
106.72
|
$
|
89.48
|
||||||
|
6/30/2012
|
$
|
121.36
|
$
|
100.90
|
$
|
83.91
|
||||||
|
3/31/2012
|
$
|
146.57
|
$
|
104.33
|
$
|
102.94
|
||||||
|
2/8/2012
|
$
|
100
|
$
|
100
|
$
|
100
|
||||||
|
|
||||||||||||
———
| (1) | Graph assumes $100 invested on February 8, 2012, in our common stock, the S&P 500 Index, and the Peer Group Index (capitalization weighted). |
| (2) | Cumulative total return assumes reinvestment of dividends. |
| (3) | We have constructed a Peer Group Index of other information technology consulting firms consisting of Virtusa Corporation (NASDAQ:VRTU), Cognizant Technology Solutions Corp. (NASDAQ:CTSH), Infosys Ltd ADR (NYSE:INFY), Sapient Corporation (NASDAQ:SAPE), Syntel, Inc. (NASDAQ:SYNT) and Wipro Ltd. (ADR) (NYSE:WIT). |
Equity Compensation Plan Information
The following table sets forth information about awards outstanding as of December 31, 2013 and securities remaining available for issuance under our 2012 Long-Term Incentive Plan (the “2012 Plan”), the 2006 Stock Option Plan (the “2006 Plan”) and the 2012 Non-Employee Directors Compensation Plan (the “2012 Directors Plan”) as of December 31, 2013.
|
Plan Category
|
Number of securities
to be issued upon
exercise of outstanding options, warrants
and rights
|
Weighted average
exercise price of
outstanding options,
warrants and rights
|
Number of securities
remaining available for
future issuance under
equity compensation
plans (excluding
securities reflected in
column (a))
|
|||||||||
|
Equity compensation plans approved by security holders(1)
|
5,823,536
|
(2) |
$
|
13.99
|
(3) |
7,609,671
|
(4) | |||||
|
Equity compensation plans not approved by security holders
|
—
|
—
|
—
|
|||||||||
|
Total
|
5,823,536
|
$
|
13.99
|
7,609,671
|
||||||||
|
|
|
|
(1)
|
This table includes the following stockholder approved plans: the 2012 Plan, the 2006 Plan and the 2012 Directors Plan. Restricted stock grant made to Mr. Robb on January 16, 2012 is not included.
|
|
(2)
|
Represents the number of underlying shares of common stock associated with outstanding options under our stockholder approved plans and is comprised of 3,176,415 shares underlying options granted under our 2012 Plan and 2,647,121 shares underlying options granted under our 2006 Plan.
|
|
(3)
(4)
|
Represents weighted-average exercise price of stock options outstanding under the 2012 Plan and the 2006 Plan.
Represents the number of shares available for future issuances under our stockholder approved equity compensation plans and is comprised of 7,042,568 shares available for future issuance under the 2012 Plan (including (i) any shares that were available for issuance under the 2006 Plan as of its discontinuance date and that became available for issuance under the 2012 Plan and (ii) any shares that were subject to outstanding awards under the 2006 Plan and have expired or terminated or were cancelled between the discontinuance date of the 2006 Plan and December 31, 2013 and therefore became available for issuance under the 2012 Plan) and 567,103 shares available for future issuances under the 2012 Directors Plan. Does not include 2,647,121 shares that are subject to outstanding awards as of December 31, 2013 under the 2006 Plan and that will be available for awards to be granted under the 2012 Plan if they expire or terminate for any reason prior to exercise or if they would otherwise return to the 2012 Plan's share reserve.
|
Unregistered Sales of Securities
There were no unregistered sales of securities during the quarterly period ended December 31, 2013.
Purchases of Equity Securities by the Issuer and Affiliated Purchasers
There were no purchases of equity securities by the issuer and affiliated purchasers during the quarterly period ended December 31, 2013.
34
We have derived the selected consolidated statements of income data for the years ended December 31, 2013, 2012 and 2011 and selected consolidated balance sheet data as of December 31, 2013, 2012 and 2011from our audited consolidated financial statements and related notes included in this annual report. We have derived the selected consolidated statements of income data for the years ended December 31, 2009 and the selected consolidated balance sheet data as of December 31, 2010 and 2009 from our audited consolidated financial statements not included in this annual report. Our historical results are not necessarily indicative of the results to be expected for any future period. The following selected financial data should be read in conjunction with “Item 7. Management’s Discussion and Analysis of Financial Condition and Results of Operations” and our audited consolidated financial statements and related notes included elsewhere in this annual report.
|
|
Year Ended December 31
,
|
|||||||||||||||||||
|
|
2013
|
2012
|
2011
|
2010
|
2009
|
|||||||||||||||
|
|
(in
thousands, except per share data)
|
|||||||||||||||||||
|
Consolidated Statements of Income Data:
|
|
|
|
|
|
|||||||||||||||
|
Revenues
|
$
|
555,117
|
$
|
433,799
|
$
|
334,528
|
$
|
221,824
|
$
|
149,939
|
||||||||||
|
Operating expenses:
|
||||||||||||||||||||
|
Cost of revenues (exclusive of depreciation and amortization)
|
347,650
|
270,361
|
205,336
|
132,528
|
88,027
|
|||||||||||||||
|
Selling, general and administrative expenses
|
116,497
|
85,868
|
64,930
|
47,635
|
39,248
|
|||||||||||||||
|
Depreciation and amortization expense
|
15,120
|
10,882
|
7,538
|
6,242
|
5,618
|
|||||||||||||||
|
Goodwill impairment loss
|
—
|
—
|
1,697
|
—
|
—
|
|||||||||||||||
|
Other operating (income)/ expenses, net
|
(643
|
)
|
682
|
19
|
2,629
|
1,064
|
||||||||||||||
|
Income from operations
|
76,493
|
66,006
|
55,008
|
32,790
|
15,982
|
|||||||||||||||
|
Interest and other income, net
|
3,077
|
1,941
|
1,422
|
486
|
42
|
|||||||||||||||
|
Foreign exchange loss
|
(2,800
|
)
|
(2,084
|
)
|
(3,638
|
)
|
(2,181
|
)
|
(1,617
|
)
|
||||||||||
|
Income before provision for income taxes
|
76,770
|
65,863
|
52,792
|
31,095
|
14,407
|
|||||||||||||||
|
Provision for income taxes
|
14,776
|
11,379
|
8,439
|
2,787
|
879
|
|||||||||||||||
|
Net income
|
$
|
61,994
|
$
|
54,484
|
$
|
44,353
|
$
|
28,308
|
$
|
13,528
|
||||||||||
|
|
||||||||||||||||||||
|
Net income per share of common stock(1):
|
||||||||||||||||||||
|
Basic (common)
|
$
|
1.35
|
$
|
1.27
|
$
|
0.69
|
$
|
0.84
|
$
|
0.23
|
||||||||||
|
Basic (puttable common)
|
$
|
—
|
$
|
—
|
$
|
1.42
|
$
|
0.84
|
$
|
0.23
|
||||||||||
|
Diluted (common)
|
$
|
1.28
|
$
|
1.17
|
$
|
0.63
|
$
|
0.79
|
$
|
0.22
|
||||||||||
|
Diluted (puttable common)
|
$
|
—
|
$
|
—
|
$
|
0.77
|
$
|
0.79
|
$
|
0.22
|
||||||||||
|
Shares used in calculation of net income per share of common stock:
|
||||||||||||||||||||
|
Basic (common)
|
45,754
|
40,190
|
17,094
|
17,056
|
16,719
|
|||||||||||||||
|
Basic (puttable common)
|
—
|
—
|
18
|
141
|
153
|
|||||||||||||||
|
Diluted (common)
|
48,358
|
43,821
|
20,473
|
19,314
|
18,474
|
|||||||||||||||
|
Diluted (puttable common)
|
—
|
—
|
18
|
141
|
153
|
|||||||||||||||
|
|
|
|
(1)
|
In connection with the completion of our initial public offering, we effected an 8-for-1 common stock split as of January 19, 2012. All historical common stock and per share information has been changed to reflect the common stock split.
|
35
|
|
As of December 31
,
|
|||||||||||||||||||
|
|
2013
|
2012
|
2011
|
2010
|
2009
|
|||||||||||||||
|
|
(in
thousands)
|
|||||||||||||||||||
|
Consolidated Balance Sheet Data:
|
|
|
|
|
|
|||||||||||||||
|
Cash and cash equivalents
|
$
|
169,207
|
$
|
118,112
|
$
|
88,796
|
$
|
54,004
|
$
|
52,927
|
||||||||||
|
Accounts receivable, net
|
95,431
|
78,906
|
59,472
|
41,488
|
27,450
|
|||||||||||||||
|
Unbilled revenues
|
43,108
|
33,414
|
24,475
|
23,883
|
13,952
|
|||||||||||||||
|
Property and equipment, net
|
53,315
|
53,135
|
35,482
|
25,338
|
23,053
|
|||||||||||||||
|
Total assets
|
432,877
|
350,814
|
235,613
|
170,858
|
135,407
|
|||||||||||||||
|
Accrued expenses and other liabilities
|
20,175
|
19,814
|
24,782
|
15,031
|
4,928
|
|||||||||||||||
|
Deferred revenue
|
5,076
|
7,632
|
6,949
|
5,151
|
4,417
|
|||||||||||||||
|
Revolving line of credit
|
—
|
—
|
—
|
—
|
7,000
|
|||||||||||||||
|
Total liabilities
|
56,776
|
64,534
|
54,614
|
35,900
|
30,196
|
|||||||||||||||
|
Preferred stock; Series A-1 convertible redeemable preferred stock and Series A-2 convertible redeemable preferred stock
|
—
|
—
|
85,940
|
68,377
|
87,413
|
|||||||||||||||
|
Total stockholders’ equity
|
376,101
|
286,280
|
95,059
|
66,249
|
16,534
|
|||||||||||||||
36
You should read the following discussion and analysis of our financial condition and results of operations together with our audited consolidated financial statements and the related notes included elsewhere in this annual report. In addition to historical information, this discussion contains forward-looking statements that involve risks, uncertainties and assumptions that could cause actual results to differ materially from management’s expectations. Factors that could cause such differences are discussed in the sections entitled “Special Note Regarding Forward-Looking Statements” and “Item 7A. Risk Factors.” We assume no obligation to update any of these forward-looking statements. Please note that we effected an 8-for-1 common stock split on January 19, 2012, and all historical common stock and per share information has been changed to reflect the common stock split.
Executive Summary
We are a leading global IT services provider focused on complex software product development services, software engineering and vertically-oriented custom development solutions. Since our inception in 1993, we have been serving independent software vendors, or ISVs, and technology companies. The foundation we have built serving ISVs and technology companies has enabled us to differentiate ourselves in the market for software engineering skills and technology capabilities. Our work with these clients exposes us to their customers’ challenges across a variety of industry “verticals.” This has enabled us to develop vertical-specific domain expertise and grow our business in multiple industry verticals, including Banking and Financial Services, Business Information and Media, and Travel and Consumer.
We have client management locations in the United States, Canada, the United Kingdom, Germany, Sweden, Russia, Switzerland, Netherlands, Kazakhstan, Singapore, Hong Kong and Australia. Our clients primarily consist of Forbes Global 2000 corporations located in North America, Europe and the Commonwealth of Independent States (the “CIS”). Our delivery centers in Belarus, Ukraine, Russia, Hungary, Kazakhstan and Poland are strategically located in centers of software engineering talent and educational excellence across the CEE and CIS. The majority of our employees are located in these delivery centers with compensation and benefits related to this pool of resources being the primary component of our operating expenses. Additionally, our global delivery model and centralized support functions, combined with the benefits of scale from the shared use of fixed-cost resources, such as computers and office space, enhance our productivity levels and enable us to better manage efficiency of our global operations by maintaining adequate resource utilization levels and implementing company-wide cost-management programs. As a result, we have managed to create a relatively homogeneous delivery base whereby our applications, tools, methodologies and infrastructure allow us to seamlessly deliver services and solutions from our delivery centers to global clients across all geographies, thereby further strengthening our relationships with them.
Our focus on delivering quality to our clients is reflected by an average of 93.9% and 78.4% of our revenues in 2013 coming from clients that had used our services for at least one and two years, respectively.
Overview of 2013
During the year ended December 31, 2013, total revenues grew by approximately 28.0% compared to 2012, powered by growth in North America and Europe. Our performance remained strong in Banking and Financial Services and ISVs and Technology verticals, which increased 39.7% and 26.3%, respectively, over the corresponding period in 2012.
During 2013, we also managed to reverse a negative growth trend in the Business Information and Media vertical caused by declining revenues from one of our major customers, Thomson Reuters. Revenues from our Business Information and Media vertical increased 21.3% in 2013 as compared to 2012 and, excluding the impact of declining revenues from Thomson Reuters, our Business Information and Media vertical revenues increased 55.6% in 2013 as compared to 2012.
Fiscal 2013 was also the year that showcased success of our strategic acquisitions of Thoughtcorp, Inc. (“Thoughtcorp”) and Empathy Lab, LLC (“Empathy Lab”), which we completed in 2012. Both acquisitions proved to be a natural fit into all of our core verticals and strengthened our value proposition in the North American market. Over a short period, we have managed to realize a number of expected synergies, including acquisition of a major customer within Travel and Consumer vertical, which has been on EPAM’s “top ten” list since the second quarter of 2013.
We remain committed to maintaining and improving a well-balanced portfolio of clients and seek to grow revenues from our clients by continually expanding the scope and size of our engagements, as well as by growing our key client base through both internal business development efforts and strategic acquisitions. During 2013, revenues from our top five and top ten customers accounted for 30.6% and 42.3%, respectively, which represents a decrease in customer concentration for the latter of approximately 2.1% as compared to 2012.
37
Change in Presentation of Certain Financial Information
As part of our discussion and analysis, we analyze revenues by vertical. The composition and organization of our verticals is fluid and the structure changes regularly in response to overall growth, new business acquisitions and changes in reporting structure. Prior to the third quarter of 2012, certain individually insignificant customers pertaining to acquired operations were aggregated for the purposes of presenting revenue by vertical. Effective third quarter of 2012, we have individually reassigned these customers to corresponding verticals. We believe this change is preferable as it allows us to more effectively analyze our verticals by aligning presentation of existing and acquired customers using a standardized approach. These changes do not result in any adjustments to our previously issued financial statements and were applied retrospectively beginning on January 1, 2010. In addition, we have revised our disclosures to present Travel and Hospitality and Retail and Consumer verticals as a single Travel and Consumer vertical. Changes for the year ended December 31, 2011 are presented in the table below.
|
|
Year Ended December 31, 2011
|
|||||||||||||||
|
|
As Previously Reported
|
After Reclassification
|
||||||||||||||
|
|
(in thousands, except percent)
|
|||||||||||||||
|
ISVs and Technology
|
$
|
87,369
|
26.2
|
%
|
$
|
84,246
|
25.2
|
%
|
||||||||
|
Banking and Financial Services
|
76,419
|
22.8
|
76,645
|
22.9
|
||||||||||||
|
Travel and Consumer
|
71,706
|
21.4
|
71,488
|
21.4
|
||||||||||||
|
Business Information and Media
|
62,350
|
18.6
|
63,988
|
19.1
|
||||||||||||
|
Other verticals
|
30,508
|
9.2
|
31,985
|
9.6
|
||||||||||||
|
Reimbursable expenses and other revenues
|
6,176
|
1.8
|
6,176
|
1.8
|
||||||||||||
|
Revenues
|
$
|
334,528
|
100.0
|
%
|
$
|
334,528
|
100.0
|
%
|
||||||||
Summary of Results of Operations and Non-GAAP Financial Measures
The following tables present a summary of our results of operations, by amount and as a percentage of revenues, for the years ended December 31, 2013, 2012 and 2011:
|
|
Year Ended December 31,
|
|||||||||||||||||||||||
|
|
2013
|
2012
|
2011
|
|||||||||||||||||||||
|
|
(in millions, except percent)
|
|||||||||||||||||||||||
|
Revenues
|
$
|
555.1
|
100.0
|
%
|
$
|
433.8
|
100.0
|
%
|
$
|
334.5
|
100.0
|
%
|
||||||||||||
|
Income from operations
|
76.5
|
13.8
|
66.0
|
15.2
|
55.0
|
16.4
|
||||||||||||||||||
|
Net income
|
62.0
|
11.2
|
54.5
|
12.6
|
44.4
|
13.3
|
||||||||||||||||||
For 2013, we reported results of operations consistent with the continued execution of our strategy. In 2013, our operating expenses increased in line with increase in revenues. We continue to invest in our people, processes and infrastructure to support our goal to deliver high-quality offerings that meet the needs of our customers, differentiate our value proposition from that of our competition, and drive scale and growth across all geographies and verticals.
Key highlights of our consolidated results in 2013 as compared to 2012 were as follows:
| • | Broad-based revenue growth from clients in our key verticals, and in particular within Banking and Financial Services and ISVs and Technology, which grew $44.4 million and $28.1 million, respectively, over 2012; |
| • | Higher growth rate as compared to 2012 demonstrated by our Business Information and Media, which increased revenues by 21.3% in 2013, compared to a decline in revenues of 2.5% in 2012 over 2011; |
| • | Continued penetration to the European market, where we experienced revenue growth of $45.0 million, or 29.0%, over 2012; |
| • | Income from operations was 13.8% of revenues in 2013 and increased by 15.9% compared to 2012. In addition to higher costs associated with compensation and benefits driven by increased headcount, included in income from operations in 2013 included $6.3 million of additional stock-based compensation expense and $0.8 million of social security taxes related to stock option exercises by our employees; and |
| • | During 2013, net income increased by 13.8% to 11.2% of revenues as compared to 12.6% in 2012. In addition to the factors affecting our operating expenses, our 2013 results were adversely affected by an increase in the effective tax rate by 1.9% to 19.2% from 17.3% in 2012, which was mainly driven by the changes in geographical distribution of our profits when compared to 2012. |
The operating results in any period are not necessarily indicative of the results that may be expected for any future period.
38
In our quarterly earnings press releases and conference calls, we discuss the following key measures that are not calculated according to the generally accepted accounting principles (“GAAP”):
|
•
|
Income from operations, as reported on our consolidated and condensed statements of income and comprehensive income, excluding certain expenses and benefits, which we refer to as “non-GAAP income from operations”.
|
|
•
|
The second measure calculates non-GAAP income from operations as a percentage of reported revenues, which we refer to as “non-GAAP operating margin”.
|
We believe that these non-GAAP measures help illustrate underlying trends in our business, and we use these measures to establish budgets and operational goals (communicated internally and externally), manage our business, and evaluate our performance. We also believe these measures help investors compare our operating performance with our results in prior periods and compare our operating results with those of similar companies. We exclude certain expenses and benefits from non-GAAP income from operations that we believe are not reflective of these underlying business trends and are not useful measures in determining our operational performance and overall business strategy. Because our reported non-GAAP financial measures are not calculated according to GAAP, these measures are not comparable to GAAP and may not be comparable to similarly described non-GAAP measures reported by other companies within our industry. Consequently, our non-GAAP financial measures should not be evaluated in isolation from or supplant comparable GAAP measures, but, rather, should be considered together with our consolidated and condensed financial statements, which are prepared according to GAAP. The following table presents a reconciliation of income from operations as reported on our condensed consolidated statements of income and comprehensive income to non-GAAP income from operations and non-GAAP operating margin for the years ended December 31, 2013, 2012 and 2011:
|
|
Year Ended December 31,
|
|||||||||||
|
|
2013
|
2012
|
2011
|
|||||||||
|
|
(in thousands, except percent)
|
|||||||||||
|
GAAP Income from operations
|
$
|
76,493
|
$
|
66,006
|
$
|
55,008
|
||||||
|
Stock-based compensation
|
13,150
|
6,826
|
2,866
|
|||||||||
|
One-time charges
|
(807
|
)
|
584
|
—
|
||||||||
|
Goodwill impairment
|
—
|
—
|
1,697
|
|||||||||
|
Amortization of purchased intangible assets
|
2,785
|
1,024
|
779
|
|||||||||
|
Acquisition-related costs
|
218
|
500
|
527
|
|||||||||
|
Non-GAAP Income from operations
|
$
|
91,839
|
$
|
74,940
|
$
|
60,877
|
||||||
|
|
||||||||||||
|
GAAP Operating margin
|
13.8
|
%
|
15.2
|
%
|
16.4
|
%
|
||||||
|
Effect of the adjustments detailed above
|
2.7
|
2.1
|
1.8
|
|||||||||
|
Non-GAAP Operating margin
|
16.5
|
%
|
17.3
|
%
|
18.2
|
%
|
||||||
From time to time, we acquire businesses and incur operating expenses, which we would not otherwise have incurred. Such expenses include acquisition-related costs and amortization of acquired intangible assets. These costs are dependent on a number of factors and are generally inconsistent in amount and frequency, as well as significantly impacted by the timing and size of related acquisitions. Additionally, the size, complexity and volume of past acquisitions, which often drives the magnitude of acquisition-related costs, may not be indicative of the size, complexity and volume of future transactions. Amortization of purchased intangible assets is excluded from our non-GAAP measures to allow management to evaluate our operating results as if these assets have been developed internally rather than acquired in a business combination. We believe this approach provides a supplemental measure of performance in which the acquired intangible assets are treated in a manner comparable to the internally developed assets.
Stock-based compensation expense is excluded from our non-GAAP measures because we believe such exclusion allows for a more accurate comparison of our operating results among the periods, as well as enhances comparability with operating results of peer companies.
We also exclude certain other expenses and one-time charges because we believe they are not indicative of what we consider to be organic, continuing operations. Such items include goodwill impairment write-offs, legal settlement expenses, and certain other non-cash one-time charges.
See our “Results of Operations” section below for a more detailed discussion and analysis of these charges.
We have significant international operations, and we earn revenues and incur expenses in multiple currencies. When important to management’s analysis, operating results are compared in “constant currency terms”, a non-GAAP financial measure that excludes the effect of foreign currency exchange rate fluctuations. The effect of rate fluctuations is excluded by translating the current period’s revenues and expenses into U.S. dollars at the weighted average exchange rates of the prior period of comparison. See Item 7A, “Quantitative and Qualitative Disclosures About Market Risk” of this report for a discussion of our exposure to exchange rates.
39
Effects of Inflation
Economies in CIS countries such as Belarus, Russia and Ukraine have periodically experienced high rates of inflation. In particular, over a three-year period ended December 31, 2013, significant inflation has been reported in Belarus. The National Statistical Committee of Belarus estimated that inflation was approximately
118.3%
in 2013, 109.7% in 2012 and 153.2% in 2011. In 2013, 2012 and 2011 we had 0.3%, 0.5% and 0.8% of our revenues, respectively, denominated in Belarusian rubles.
The measures currently used by the Belarusian government to control this recent inflation include monetary policy and pricing instruments, including increasing interest rates and the use of anti-monopoly laws to prevent the increase in pricing of goods, as well as privatization and using foreign borrowings to replenish the budget and stabilize local currency. Inflation, government actions to combat inflation and public speculation about possible additional actions have also contributed materially to economic uncertainty in Belarus. Belarus may experience high levels of inflation in the future. The Russian and Ukrainian governments have historically implemented similar measures as Belarus to fight inflation.
Periods of higher inflation may slow economic growth in those countries. Inflation also is likely to increase some of our costs and expenses, which we may not be able to pass on to our clients and, as a result, may reduce our profitability. Inflationary pressures could also affect our ability to access financial markets and lead to counter-inflationary measures that may harm our financial condition, results of operations or adversely affect the market price of our securities.
Results of Operations
The following table sets forth a summary of our consolidated results of operations by amount and as a percentage of our revenues for the periods indicated. This information should be read together with our audited consolidated financial statements and related notes included elsewhere in this annual report. The operating results in any period are not necessarily indicative of the results that may be expected for any future period.
|
|
Year Ended December 31,
|
|||||||||||||||||||||||
|
|
2013
|
2012
|
2011
|
|||||||||||||||||||||
|
|
(in thousands, except percent)
|
|||||||||||||||||||||||
|
Revenues
|
$
|
555,117
|
100.0
|
%
|
$
|
433,799
|
100.0
|
%
|
$
|
334,528
|
100.0
|
%
|
||||||||||||
|
Operating expenses:
|
||||||||||||||||||||||||
|
Cost of revenues (exclusive of depreciation and amortization)(1)
|
347,650
|
62.6
|
270,361
|
62.3
|
205,336
|
61.4
|
||||||||||||||||||
|
Selling, general and administrative expenses(2)
|
116,497
|
21.0
|
85,868
|
19.8
|
64,930
|
19.4
|
||||||||||||||||||
|
Depreciation and amortization expense
|
15,120
|
2.7
|
10,882
|
2.5
|
7,538
|
2.3
|
||||||||||||||||||
|
Goodwill impairment loss
|
—
|
—
|
—
|
—
|
1,697
|
0.5
|
||||||||||||||||||
|
Other operating (income)/ expenses, net
|
(643
|
)
|
-0.1
|
682
|
0.2
|
19
|
0.0
|
|||||||||||||||||
|
Income from operations
|
76,493
|
13.8
|
66,006
|
15.2
|
55,008
|
16.4
|
||||||||||||||||||
|
Interest and other income, net
|
3,077
|
0.5
|
1,941
|
0.5
|
1,422
|
0.4
|
||||||||||||||||||
|
Foreign exchange loss
|
(2,800
|
)
|
-0.5
|
(2,084
|
)
|
-0.5
|
(3,638
|
)
|
-1.1
|
|||||||||||||||
|
Income before provision for income taxes
|
76,770
|
13.8
|
65,863
|
15.2
|
52,792
|
15.7
|
||||||||||||||||||
|
Provision for income taxes
|
14,776
|
2.6
|
11,379
|
2.6
|
8,439
|
2.5
|
||||||||||||||||||
|
Net income
|
$
|
61,994
|
11.2
|
%
|
$
|
54,484
|
12.6
|
%
|
$
|
44,353
|
13.2
|
%
|
||||||||||||
|
|
|
|
(1)
|
Includes stock-based compensation expense of $4,823, $2,809 and $1,365 for the years ended December 31, 2013, 2012 and 2011, respectively.
|
|
(2)
|
Includes stock-based compensation expense of $8,327, $4,017 and $1,501 for the years ended December 31, 2013, 2012 and 2011, respectively
|
Revenues
Revenues are derived primarily from providing software development services to our clients. We discuss below the breakdown of our revenues by service offering, vertical, client location, contract type and client concentration. Revenues consist of IT services revenues and reimbursable expenses and other revenues, which primarily include travel and entertainment costs that are chargeable to clients.
40
Revenues by Service Offering
Software development includes software product development, custom application development services and enterprise application platforms services, and has historically represented, and we expect to continue to represent, the substantial majority of our business. The following table sets forth revenues by service offering by amount and as a percentage of our revenues for the periods indicated:
|
|
Year Ended December 31,
|
|||||||||||||||||||||||
|
|
2013
|
2012
|
2011
|
|||||||||||||||||||||
|
|
(in thousands, except percent)
|
|||||||||||||||||||||||
|
Software development
|
$
|
374,426
|
67.4
|
%
|
$
|
290,139
|
66.8
|
%
|
$
|
219,211
|
65.5
|
%
|
||||||||||||
|
Application testing services
|
109,222
|
19.7
|
85,849
|
19.8
|
67,840
|
20.3
|
||||||||||||||||||
|
Application maintenance and support
|
45,971
|
8.3
|
36,056
|
8.3
|
29,287
|
8.8
|
||||||||||||||||||
|
Infrastructure services
|
14,433
|
2.6
|
12,424
|
2.9
|
8,488
|
2.5
|
||||||||||||||||||
|
Licensing
|
3,439
|
0.6
|
2,914
|
0.7
|
3,526
|
1.1
|
||||||||||||||||||
|
Reimbursable expenses and other revenues
|
7,626
|
1.4
|
6,417
|
1.5
|
6,176
|
1.8
|
||||||||||||||||||
|
Revenues
|
$
|
555,117
|
100.0
|
%
|
$
|
433,799
|
100.0
|
%
|
$
|
334,528
|
100.0
|
%
|
||||||||||||
Revenues by Vertical
The foundation we have built with ISVs and technology companies has enabled us to leverage our strong domain knowledge and industry-specific knowledge capabilities to become a premier IT services provider to a range of additional verticals such as Banking and Financial Services, Business Information and Media, and Travel and Consumer. Additionally, we have substantial expertise in other industries such as Oil and Gas, Telecommunications, Healthcare and several others, which are currently reported in aggregate under Other verticals. The following table sets forth revenues by vertical by amount and as a percentage of our revenues for the periods indicated:
|
|
Year Ended December 31,
|
|||||||||||||||||||||||
|
|
2013
|
2012
|
2011
|
|||||||||||||||||||||
|
|
(in thousands, except percent)
|
|||||||||||||||||||||||
|
Banking and Financial Services
|
$
|
156,340
|
28.2
|
%
|
$
|
111,941
|
25.8
|
%
|
$
|
76,645
|
22.9
|
%
|
||||||||||||
|
ISVs and Technology
|
134,970
|
24.3
|
106,852
|
24.6
|
84,246
|
25.2
|
||||||||||||||||||
|
Travel and Consumer
|
117,248
|
21.1
|
95,965
|
22.1
|
71,488
|
21.4
|
||||||||||||||||||
|
Business Information and Media
|
75,677
|
13.6
|
62,398
|
14.4
|
63,988
|
19.1
|
||||||||||||||||||
|
Other verticals
|
63,256
|
11.4
|
50,226
|
11.6
|
31,985
|
9.6
|
||||||||||||||||||
|
Reimbursable expenses and other revenues
|
7,626
|
1.4
|
6,417
|
1.5
|
6,176
|
1.8
|
||||||||||||||||||
|
Revenues
|
$
|
555,117
|
100.0
|
%
|
$
|
433,799
|
100.0
|
%
|
$
|
334,528
|
100.0
|
%
|
||||||||||||
Revenues by Client Location
Our revenues are sourced from three geographic markets: North America, Europe and the CIS. We present and discuss our revenues by client location based on the location of the specific client site that we serve, irrespective of the location of the headquarters of the client or the location of the delivery center where the work is performed. As such, revenues by client location differ from the segment information in our audited consolidated financial statements included elsewhere in this annual report, which is not solely based on the geographic location of the clients but rather is based on managerial responsibility for a particular client regardless of client location. The following table sets forth revenues by client location by amount and as a percentage of our revenues for the periods indicated:
41
|
|
Year Ended December 31,
|
|||||||||||||||||||||||
|
|
2013
|
2012
|
2011
|
|||||||||||||||||||||
|
|
(in thousands, except percent)
|
|||||||||||||||||||||||
|
North America
|
$
|
281,738
|
50.8
|
%
|
$
|
206,901
|
47.7
|
%
|
$
|
165,126
|
49.4
|
%
|
||||||||||||
|
Europe
|
200,137
|
36.1
|
155,168
|
35.8
|
107,041
|
32.0
|
||||||||||||||||||
|
United Kingdom
|
108,892
|
19.6
|
98,346
|
22.7
|
70,989
|
21.2
|
||||||||||||||||||
|
Other
|
91,245
|
16.5
|
56,822
|
13.1
|
36,052
|
10.8
|
||||||||||||||||||
|
CIS
|
65,616
|
11.7
|
65,313
|
15.0
|
56,185
|
16.8
|
||||||||||||||||||
|
Russia
|
53,328
|
9.6
|
47,536
|
11.0
|
43,799
|
13.1
|
||||||||||||||||||
|
Other
|
12,288
|
2.1
|
17,777
|
4.0
|
12,386
|
3.7
|
||||||||||||||||||
|
Reimbursable expenses and other revenues
|
7,626
|
1.4
|
6,417
|
1.5
|
6,176
|
1.8
|
||||||||||||||||||
|
Revenues
|
$
|
555,117
|
100.0
|
%
|
$
|
433,799
|
100.0
|
%
|
$
|
334,528
|
100
|
%
|
||||||||||||
Revenues by Contract Type
Our services are performed under both time-and-material and fixed-price arrangements. Our engagement models depend on the type of services provided to a client, the mix and locations of professionals involved and the business outcomes our clients are looking to achieve. Historically, the majority of our revenues have been generated under time-and-material contracts. Under time-and-material contracts, we are compensated for actual time incurred by our IT professionals at negotiated hourly, daily or monthly rates. Fixed-price contracts require us to perform services throughout the contractual period and we are paid in installments on pre-agreed intervals. We expect time-and-material arrangements to continue to comprise the majority of our revenues in the future.
The following table sets forth revenues by contract type by amount and as a percentage of our revenues for the periods indicated:
|
|
Year Ended December 31,
|
|||||||||||||||||||||||
|
|
2013
|
2012
|
2011
|
|||||||||||||||||||||
|
|
(in thousands, except percent)
|
|||||||||||||||||||||||
|
Time-and-material
|
$
|
456,938
|
82.3
|
%
|
$
|
364,853
|
84.1
|
%
|
$
|
287,965
|
86.1
|
%
|
||||||||||||
|
Fixed-price
|
87,114
|
15.7
|
59,615
|
13.7
|
36,861
|
11.0
|
||||||||||||||||||
|
Licensing
|
3,439
|
0.6
|
2,914
|
0.7
|
3,526
|
1.1
|
||||||||||||||||||
|
Reimbursable expenses and other revenues
|
7,626
|
1.4
|
6,417
|
1.5
|
6,176
|
1.8
|
||||||||||||||||||
|
Revenues
|
$
|
555,117
|
100.0
|
%
|
$
|
433,799
|
100.0
|
%
|
$
|
334,528
|
100.0
|
%
|
||||||||||||
Revenues by Client Concentration
We have grown our revenues from our clients by continually expanding the scope and size of our engagements, and we have grown our key client base through internal business development efforts and several strategic acquisitions.
Our focus on delivering quality to our clients is reflected by an average of 93.9% and 78.4% of our revenues in 2013 coming from clients that had used our services for at least one and two years, respectively. In addition, we have significantly grown the size of existing accounts. The number of clients that accounted for over $5.0 million in annual revenues increased to 22 in 2013 from 10 in 2010, and the number of clients that generated at least $0.5 million in revenues increased to 147 in 2013 from 72 in 2010.
The following table sets forth revenues contributed by our top five and top ten clients by amount and as a percentage of our revenues for the periods indicated:
|
|
Year Ended December 31,
|
|||||||||||||||||||||||
|
|
2013
|
2012
|
2011
|
|||||||||||||||||||||
|
|
(in thousands, except percent)
|
|
||||||||||||||||||||||
|
Top client
|
$
|
53,136
|
9.6
|
%
|
$
|
39,854
|
9.2
|
%
|
$
|
35,903
|
10.7
|
%
|
||||||||||||
|
Top five clients
|
169,987
|
30.6
|
134,484
|
31.0
|
107,171
|
32.0
|
||||||||||||||||||
|
Top ten clients
|
234,955
|
42.3
|
192,426
|
44.4
|
149,094
|
44.6
|
||||||||||||||||||
One customer, Thomson Reuters, accounted for over 10% of our revenues in 2011. There were no customers with revenues in excess of 10% in either 2013, or 2012. The volume of work we perform for specific clients is likely to vary from year to year, as we are typically not any client’s exclusive external IT services provider, and a major client in one year may not contribute the same amount or percentage of our revenues in any subsequent year.
42
Operating Expenses
Cost of Revenues (Exclusive of Depreciation and Amortization)
The principal components of our cost of revenues (exclusive of depreciation and amortization) are salaries, employee benefits and stock compensation expense, travel costs and subcontractor fees. Salaries and other compensation expenses of our IT professionals are allocated to cost of revenues regardless of whether they are actually performing services during a given period.
In addition, cost of revenues is dependent on utilization levels. Some of our IT professionals are specially trained to work for specific clients or on specific projects, and some of our offshore development centers are dedicated to specific clients or specific projects. Our ability to manage our utilization levels depends significantly on our ability to hire and train high-performing IT professionals and to staff projects appropriately, and on the general economy and its effect on our clients and their business decisions regarding the use of our services.
Selling, General and Administrative Expenses
Selling, general and administrative expenses represent expenses associated with promoting and selling our services and include such items as senior management, administrative personnel and sales and marketing personnel salaries, stock compensation expense and related fringe benefits, legal and audit expenses, commissions, insurance, operating lease expenses, travel costs and the cost of advertising and other promotional activities. In addition, we pay a membership fee of 1% of revenues collected in Belarus to the administrative organization of the Belarus Hi-Tech Park.
Our selling, general and administrative expenses have increased primarily as a result of our expanding operations, acquisitions, and the hiring of a number of senior managers to support our growth. We expect our selling, general and administrative expenses to continue to increase in absolute terms as our business expands but will generally remain steady or slightly decrease as a percentage of our revenues.
Provision for Income Taxes
Determining the consolidated provision for income tax expense, deferred income tax assets and liabilities and related valuation allowance, if any, involves judgment. As a global company, we are required to calculate and provide for income taxes in each of the jurisdictions in which we operate. During 2013, 2012 and 2011, we had $69.8 million, $56.6 million and $49.9 million, respectively, in income before provision for income taxes attributed to our foreign jurisdictions. The statutory tax rate in our foreign jurisdictions is lower than the statutory U.S. tax rate. Additionally, we have secured special tax benefits in Belarus and Hungary as described below. As a result, our provision for income taxes is low in comparison to income before taxes due to the benefit received from increased income earned in low tax jurisdictions. The foreign tax rate differential represents this significant reduction. Changes in the geographic mix or estimated level of annual pre-tax income can also affect our overall effective income tax rate.
Our provision for income taxes also includes the impact of provisions established for uncertain income tax positions, as well as the related net interest. Tax exposures can involve complex issues and may require an extended period to resolve. Although we believe we have adequately reserved for our uncertain tax positions, we cannot assure you that the final tax outcome of these matters will not be different from our current estimates. We adjust these reserves in light of changing facts and circumstances, such as the closing of a tax audit, statute of limitation lapse or the refinement of an estimate. To the extent that the final tax outcome of these matters differs from the amounts recorded, such differences will impact the provision for income taxes in the period in which such determination is made.
Our subsidiary in Belarus is a member of the Belarus Hi-Tech Park, in which member technology companies are 100% exempt from the current Belarusian income tax rate of 18%. The “On High-Technologies Park” Decree, which created the Belarus Hi-Tech Park, is in effect for a period of 15 years from July 1, 2006.
Our subsidiary in Hungary benefits from a tax credit of 10% of annual qualified salaries, taken over a four-year period, for up to 70% of the total tax due for that period. We have been able to take the full 70% credit for 2007 to 2012. The Hungarian tax authorities repealed the tax credit beginning with 2012. Credits earned in years prior to 2012, however, will be allowed through 2014. We anticipate full utilization up to the 70% limit until 2014, with full phase out in 2015.
Our domestic income before provision for income taxes differs from the North America segment income before provision for income taxes because segment operating profit is a management reporting measure, which does not take into account most corporate expenses, as well as the majority of non-operating costs and stock compensation expenses. We do not hold our segment managers accountable for these expenses, as they cannot influence these costs within the scope of their operating authority, nor do we believe it is practical to allocate these costs to specific segments, as they are not directly attributable to any specific segment. All our segments are treated consistently with respect to such expenses when determining segment operating profit.
43
2013 Compared to 2012
Revenues
Revenues were $555.1million and $433.8 million in 2013 and 2012, respectively, representing an increase of 28.0%. The increase was attributable to a combination of factors, including higher sales to existing and acquisition of new customers, which contributed $98.4 million and $21.7 million, respectively, to consolidated revenue growth. In addition, total revenues in 2013 and 2012 included $7.6 million and $6.4 million of reimbursable expenses and other revenues, respectively, which increased by 18.8% in 2013 as compared to 2012, but remained relatively flat as a percentage of revenues.
During the year ended December 31, 2013, North America, our largest geography, grew $74.8 million, or 36.2%, as compared with the year ended December 31, 2012. As a percentage of revenues, our North American geography accounted for 50.8% in 2013, which represented an increase of 3.1% over 2012. The growth in North America was driven by many realized opportunities in virtually every vertical. In particular, our ISVs and Technology vertical grew 30.0% as compared to 2012, primarily driven by an expansion of existing client relationships, which accounted for $25.9 million, or 91.6%, of the growth of this vertical over 2012. Solid performance of our North American geography was also a reflection of additional revenue streams created by our 2012 acquisitions. This was especially noticeable in the Business Information and Media vertical, which grew 8.9% in 2013 as compared to 2012 despite a significant decrease in revenues from one of our largest customers, Thomson Reuters. Without the impact of declining revenues from this customer, the Business Information and Media vertical increased $11.6 million, or 43.6% in 2013 over the corresponding periods of 2012. Additionally, our Travel and Consumer vertical grew $18.7 million, or 55.1%, in 2013 as compared to 2012 and accounted for 25.0% of total growth in our North American geography in 2013. Most of this increase was attributable to revenues from one of our strategic customers acquired in 2012, which had been on our “top ten” customer list since the second quarter of 2013. During the year ended December 31, 2013, revenues from this customer accounted for 20.7% of total revenue growth in North America, respectively.
During the year ended December 31, 2013, the Banking and Financial Services vertical remained our dominant vertical in Europe and accounted for 78.9% of total revenue growth in this geography. In 2013, revenues from Banking and Financial Services vertical increased $35.5 million, or 49.8%, over 2012. It was also our largest and fastest growing vertical on a consolidated basis. Strong performance of this vertical can be attributed to an increased demand for our services and ongoing relationship with existing customers located in Europe. In particular, 29.5% of total revenue growth during 2013 over the 2012 results was attributable to increased business from certain of our largest Banking and Financial Services customers located in the United Kingdom and Switzerland. Additionally, over the course of the year ended December 31, 2013, our Business Information and Media vertical grew significantly into the European markets. During the year ended December 31, 2013, this vertical increased $7.3 million, or 86.5%, over 2012, and accounted for 16.2% of the total growth in the European geography.
Revenues in the CIS geography increased $0.3 million, or 0.5%, in 2013 as compared to 2012. A slower growth rate as compared with the performance of other geographies in 2013 was due to a combination of factors. Following the addition of a number of new customers in the fourth quarter of 2012, revenues from our Travel and Consumer vertical increased $2.7 million, or 49.1%, in 2013 as compared with 2012. However, that growth in the Travel and Consumer vertical was more than offset by a lower growth rate in the Banking and Financial Services vertical, the largest vertical in this geography, which increased $2.6 million, or 8.1%, in 2013 over 2012. In addition, included in 2012 results were $4.0 million of revenues recognized upon completion of a fixed-priced project that did not recur in 2013.
Cost of Revenues (Exclusive of Depreciation and Amortization)
During the years ended December 31, 2013 and 2012, cost of revenues (exclusive of depreciation and amortization) was $347.7 million and $270.4 million, respectively, representing an increase of 28.6% in 2013 over the corresponding period of 2012.
The increase in cost of revenues (exclusive of depreciation and amortization) in 2013 as compared to 2012 was primarily driven by a net increase of 845 IT professionals, from 8,495 as of December 31, 2012, to 9,340 as of December 31, 2013, to support the growth in demand for our services. As a percentage of revenues, cost of revenues (exclusive of depreciation and amortization) increased by 0.3% in 2013, as compared to the corresponding period of 2012, primarily as a result of higher compensation and benefits of our IT professionals.
Selling, General and Administrative Expenses
During the year ended December 31, 2013, selling, general and administrative expenses were $116.5 million, representing an increase of 35.7% from $85.9 million in the corresponding period of 2012. As a percentage of revenues, selling, general and administrative expenses increased to 21.0% in 2013, or 1.2%, compared to 2012. Most of this increase was attributable to higher compensation and benefits of our non-production staff in 2013 as compared to 2012 as we continued to invest into key areas, including sales, industry expertise, and other functions supporting global operations. In addition, selling, general and administrative expenses included $3.3 million of additional stock-based compensation expense related to our 2012 acquisitions, which caused our
44
selling, general, and administrative expenses to increase by 0.5% as a percentage of revenues in 2013 over 2012.
Depreciation and Amortization Expense
Depreciation and amortization expense was $15.1 million in 2013, representing an increase of $4.2 million over 2012. The increase was driven by additional capital expenditures to support headcount growth. As a percentage of revenues, depreciation and amortization expense increased to 2.7% in 2013 from 2.5% in 2012 primarily as a result of $1.9 million of additional expenses related to amortization of purchased intangible assets acquired in 2012.
Other Operating (Income)/ Expenses, Net
Net other operating income was $0.6 million in 2013 as compared to $0.7 million of expenses recorded in the corresponding period of 2012. Net other operating expenses recorded in 2012 were primarily attributable to the issuance of 53,336 shares of common stock to Instant Information Inc., a 2010 asset acquisition, upon the completion of our initial public offering in the first quarter of 2012, which did not recur in 2013. Additionally, during 2013 we received $0.8 million in connection with prior-year write-offs of other assets.
Interest and Other Income, Net
Net interest and other income was $3.1 million in 2013, representing an increase of 58.5% from $1.9 million received in 2012. The increase was largely driven by an increase in interest income earned on cash accounts in Belarus and, to a lesser extent, interest earned on employee housing loans in 2013 which accounted for $0.3 million.
Provision for Income Taxes
Our worldwide effective tax rate was 19.2% and 17.3% in 2013 and 2012, respectively. The increase in the worldwide effective tax rate in 2013, as compared to the corresponding period of 2012, was primarily due to (a) a higher portion of pre-tax profits attributable to our North American tax jurisdiction as a result of an acquisition completed in the second half of 2012; and (b) a relative shift in offshore services performed in Belarus, where we currently entitled to a 100% exemption from Belarusian income tax, to Ukraine, and, to a lesser extent, Russia, both of which have higher income tax rates.
2012 Compared to 2011
Revenues
Revenues for the year ended December 31, 2012 increased by $99.3 million, or 29.7%, as compared to the year ended December 31, 2011. This increase is attributable to a $71.3 million increase from deeper penetration into existing customers, a $20.3 million increase from new customers and a $7.7 million increase from acquisitions.
Revenues in our North American and European geographies grew $41.8 million, or 25.3%, and $48.1 million, or 45.0%, respectively, primarily as a result of strong revenue growth in our core service verticals.
Growth in Banking and Financial Services was the driving force behind our revenue growth in Europe and accounted for 63.8% of total revenue growth in this geography. During 2012, Banking and Financial Services continued to outperform other verticals growing $35.3 million, or 46.1%, over the prior year results. Strong performance of this vertical can be attributed to an increased demand for our services and ongoing relationships with existing customers located in Europe. In particular, 30.3% of the consolidated revenue growth in 2012 can be attributed to increased business from certain of our largest Banking and Financial Services customers located in the United Kingdom and Switzerland.
Growth in our North American geography in 2012 was primarily attributable to performance of our ISVs and Technology vertical, which grew $23.6 million, or 33.5%, in 2012 as compared to 2011, and, to a lesser extent, our 2012 acquisitions, which added $7.7 million in revenues and approximately 59 new customers primarily within Business Information and Media, and Travel and Consumer verticals. These growth trends were in part offset by a decrease in revenues in Business Information and Media, which declined $2.4 million, or 4.3%, in 2012 as compared to 2011. This decrease was almost entirely attributable to a $9.8 million decrease in revenue from one of our largest customers, Thomson Reuters.
Revenues in the CIS region increased $9.1 million, or 16.2%, compared to the prior year which was almost entirely attributable to incremental revenues from the completion of a long-term fixed-priced project, as well as the addition of a number of new customers within our Travel and Consumer vertical during the fourth quarter of 2012.
Cost of Revenues (Exclusive of Depreciation and Amortization)
Cost of revenues (exclusive of depreciation and amortization) was $270.4 million during the year ended December 31, 2012, representing an increase of 31.7% over 2011. As a percentage of revenues, cost of revenues (exclusive of depreciation
45
and amortization) increased by 0.9% during the same period. An increase in stock-based compensation expense contributed 0.2% as a percentage of revenues for the year ended December 31, 2012.
The remaining increase was mainly due to growth in compensation and benefits of our IT professionals during that period. The number of IT professionals increased from 6,968 at December 31, 2011 to 8,495 at December 31, 2012, which represented an average growth of 21.9% supporting a 30.2% increase in IT services revenue.
Selling, General and Administrative Expenses
Selling, general and administrative expenses were $85.9 million during the year ended December 31, 2012, representing an increase of 32.2% over 2011. The growth was primarily attributable to increased overhead costs and non-production staff required to support the growth in our business. Non-production headcount increased by 391, or 33.8%, from 1,157 at December 31, 2011 to 1,548 at December 31, 2012. Stock compensation expense increased by $2.5 million, or 0.5% as a percentage of revenues during the same period, of which $1.2 million was related to the acquisitions completed in 2012. Excluding stock compensation, selling, general and administrative expenses declined slightly as a percentage of revenues.
Depreciation and Amortization Expense
Depreciation and amortization expense was $10.9 million during the year ended December 31, 2012, representing an increase of 44.4% over 2011. The increase was primarily attributable to additional capital expenditures of IT equipment to support the growth in headcount, as well as amortization of intangible assets acquired through the purchase of Thoughtcorp in the second quarter of 2012. As a percentage of revenues, depreciation and amortization expense was 2.5% compared to 2.3% in 2011.
Other Operating Expenses, Net
During the year ended December 31, 2012, we reported $0.7 million of other expenses in our consolidated statements of income and comprehensive income. This was almost entirely attributable to the issuance of 53,336 shares of common stock to Instant Information Inc., a 2010 asset acquisition, upon the completion of our initial public offering in the first quarter of 2012.
Interest and Other Income, Net
Net interest and other income was $1.9 million during the year ended December 31, 2012, compared to $1.4 million in 2011. The increase was primarily attributable to the interest received on cash which increased 67.5% to an average balance of $111.6 million during 2012 from $66.6 million in 2011.
Foreign Exchange Loss
Foreign exchange loss incurred during the year ended December 31, 2012 was $2.1 million representing a decrease of foreign exchange loss by $1.6 million. Higher losses in 2011 were primarily driven by the movement of the Russian ruble, Belarusian ruble and the euro against the U.S. dollar in respective periods.
Provision for Income Taxes
Provision for income taxes was $11.4 million in 2012, increasing from $8.4 million in 2011. The increase was primarily attributable to significant growth in consolidated pre-tax income, an increase in our clients’ need for onsite resources in the North American geography, which increased our consolidated effective tax rate, a relative shift in offshore services performed in Belarus, where we are currently entitled to a 100% exemption from Belarusian income tax, to Ukraine and, to a lesser extent, Russia, both of which have significantly higher tax rates. In 2012, our effective tax rate was 17.3 % as compared to our effective tax rate of 16.0% in 2011.
Results by Business Segment
Our operations consist of four reportable segments: North America, Europe, Russia and Other. The segments represent components of EPAM for which separate financial information is available that is used on a regular basis by our chief executive officer, who is also our chief operating decision maker, in determining how to allocate resources and evaluate performance. This determination is based on the unique business practices and market specifics of each region and that each region engages in business activities from which it earns revenues and incurs expenses. Our reportable segments are based on managerial responsibility for a particular client. Because managerial responsibility for a particular client relationship generally correlates with the client’s geographic location, there is a high degree of similarity between client locations and the geographic boundaries of our reportable segments. In some specific cases, however, managerial responsibility for a particular client is assigned to a management team in another region, usually based on the strength of the relationship between client executives and particular members of our senior management team.
In a case like this, the client’s activity would be reported through the reportable segment. Our chief operating decision maker evaluates the Company’s performance and allocates resources based on segment revenues and operating profit.
46
Segment operating profit is defined as income from operations before unallocated costs. Generally, operating expenses for each operating segment have similar characteristics and are subject to similar factors, pressures and challenges. Expenses included in segment operating profit consist principally of direct selling and delivery costs as well as an allocation of certain shared services expenses. We use globally integrated support organizations to realize economies of scale and efficient use of resources. As a result, a majority of our expenses is shared by all segments. These shared expenses include Delivery, Recruitment and Development, Sales and Marketing, and support functions such as IT, Finance, Legal, and Human Resources. Generally, shared expenses are allocated based on measurable drivers of expense, e.g., recorded hours or headcount. However, certain expenses are not specifically allocated to specific segments, as management does not believe it is practical to allocate such costs to individual segments because they are not directly attributable to any specific segment. Further, stock based compensation expense is not allocated to individual segments in internal management reports used by the chief operating decision maker. Accordingly, these expenses are separately disclosed as “unallocated” and adjusted only against our total income from operations.
Revenues from external clients and segment operating profit, before unallocated expenses, for the North America, Europe, Russia and Other reportable segments were as follows for the years ended December 31:
|
|
Year Ended December 31,
|
|||||||||||
|
|
2013
|
2012
|
2011
|
|||||||||
|
|
(in thousands)
|
|||||||||||
|
Total segment revenues:
|
|
|
|
|||||||||
|
North America
|
$
|
284,636
|
$
|
197,271
|
$
|
151,707
|
||||||
|
Europe
|
204,150
|
168,913
|
123,510
|
|||||||||
|
Russia
|
55,764
|
50,552
|
46,219
|
|||||||||
|
Other
|
10,493
|
16,986
|
12,851
|
|||||||||
|
Total segment revenues
|
$
|
555,043
|
$
|
433,722
|
$
|
334,287
|
||||||
|
Segment operating profit:
|
||||||||||||
|
North America
|
$
|
66,814
|
$
|
38,671
|
$
|
33,744
|
||||||
|
Europe
|
34,573
|
32,750
|
25,098
|
|||||||||
|
Russia
|
7,077
|
9,049
|
10,445
|
|||||||||
|
Other
|
844
|
6,985
|
2,416
|
|||||||||
|
Total segment operating profit
|
$
|
109,308
|
$
|
87,455
|
$
|
71,703
|
||||||
2013 Compared to 2012
North America Segment
During the years ended December 31, 2013 and 2012, revenues from the North America segment were 51.3% and 45.5% of total segment revenues, respectively, representing an increase of $87.4 million, or 44.3%, in 2013 over the 2012 results. The North America segment's operating profits increased by $28.1 million, or 72.8%, as compared to the corresponding period of 2012, to $66.8 million net profit from the segment’s operations.
The increase in revenues during year ended December 31, 2013, was primarily driven by continued expansion of existing client relationships, as well as by revenues contributed by new clients, including through the acquisitions of Thoughtcorp and Empathy Lab completed in 2012. Within the segment, revenue from our ISVs and Technology vertical increased $29.0 million, or 32.3%, in 2013 as compared to the corresponding period of 2012, representing 33.2% of the overall segment growth. Our Travel and Consumer vertical was the fastest growing vertical in 2013 with revenues increasing by $26.5 million, or 94.6%, in 2013 as compared to the corresponding period in 2012. The increase in the segment’s operating profit in 2013 as compared to 2012 was primarily driven by increased revenues and improved profitability, partially offset by an increase in compensation and benefits of our IT professionals primarily as a result of added headcount to support our revenue growth and continued demand for onsite resources.
Europe Segment
During the years ended December 31, 2013 and 2012, revenues from Europe segment were 36.8% and 38.9% of total segment revenues, respectively, representing an increase of $35.2 million, or 20.9%, in 2013 over the 2012 results. During 2013, the Europe segment’s operating profits increased by $1.8 million, or 5.6%, as compared to the corresponding period of 2012, to $34.6 million net profit from the segment’s operations.
Europe continues to be a rapidly growing segment in our portfolio, given our nearshore delivery capabilities, and our value proposition in delivering quality software engineering solutions and services is continuing to gain considerable traction with European-based clients. Within the segment, growth was the strongest in our Banking and Financial Services vertical, with 2013 revenues increasing by approximately $36.9 million, or 52.0%, over the corresponding period of 2012. The decrease in the segment’s operating profit as a percentage of the European segment’s revenues in 2013 as compared to 2012, was primarily due to an increase in compensation expense relative to recognized service revenues in 2013 as compared to 2012.
47
Russia Segment
During the years ended December 31, 2013 and 2012, revenues from our Russia segment were 10.0% and 11.7% of total segment revenues, respectively. In 2013, revenues from the Russia segment were $55.8 million, representing an increase of $5.2 million, or 10.3%, over the 2012 results. During 2013, our Russia segment's operating profits decreased by $2.0 million, or 21.8%, as compared to the corresponding period of 2012, to $7.1 million net profit from the segment’s operations.
Within the segment, 2013 revenues from the Banking and Financial Services and Travel and Consumer verticals increased $2.4 million and $2.8 million, respectively, accounting for most of the segment's growth in the period indicated. The decrease in operating profits of the Russia segment in 2013 when compared to 2012 was primarily attributable to revenue recognition delays related to fixed-price projects. Revenue recognition on such projects is susceptible to timing delays. As a result, there may be instances where we record the cost related to the performance of services with no associated revenue recognized in the period that services were rendered. In particular, we estimate a total of $2.5 million of revenues remained unrecognized as of December 31, 2013 in the Russia segment, with related costs reflected in the segment's operating results for the year then ended. Similarly, we may record revenue in a period where the underlying expenses have been recorded in a previous period, which would significantly improve the operating margin of the Russia segment in the period of recognition. Consequently, a higher concentration of fixed-price projects in the Russia segment affects the period-over-period comparability of the segment’s operating results.
Other Segment
During the year ended December 31, 2013, revenues from the Other segment were $10.5 million, or 1.9% of total segment revenues, representing a decrease of $6.5 million, or 38.2%, from the 2012 results. During 2013, our Other segment's operating profits decreased by $6.1 million, as compared to the corresponding period of 2012, to $0.8 million.
The decrease in revenues and operating profits of the Other segment in 2013, as compared to 2012, was primarily attributable to a completion of a large fixed-priced project in 2012 with $4.6 million revenues and $2.5 million operating profit recognized in 2012 that did not recur in 2013. In addition, the fourth quarter of 2012 benefited significantly from fixed-priced project with one of our largest customers in that segment that did not recur in 2013.
2012 Compared to 2011
North America Segment
Our North America segment accounted for 45.5% of total segment revenues in both 2012 and 2011. North America revenues increased by $45.6 million, or 30.0%, from $151.7 million in 2011 to $197.3 million in 2012. The increase in revenues was primarily driven by continued expansion of existing client relationships as well as revenues contributed by new clients. Additionally, two acquisitions completed in 2012 contributed approximately $7.7 million, or 16.7%, to the overall segment growth during the period. Within the segment, revenue from our ISVs and Technology and Travel and Consumer verticals increased by approximately $22.8 million and $10.8 million, respectively, as compared to 2011, representing 73.7% of the overall segment growth.
Segment operating profit increased by $4.9 million, or 14.6%, from $33.7 million in 2011 to $38.7 million in 2012. The increase in segment operating profit was attributable primarily to increased revenues, partially offset by an increase in compensation and benefit costs resulting primarily from additional headcount to support our revenue growth and continued demand for onsite resources.
Europe Segment
Our Europe segment accounted for 38.9% and 36.9% of total segment revenues in 2012 and 2011, respectively. Europe continues to be a rapidly growing segment in our portfolio, given our nearshore delivery capabilities, and our value proposition in delivering quality software engineering solutions and services is continuing to gain considerable traction with European-based clients. As a result, revenue increased $45.4 million, or 36.8%, from $123.5 million during 2011 to $168.9 million in 2012. Within the segment, growth was the strongest in our Banking and Financial Services and Travel and Consumer verticals, where revenue increased by approximately $30.2 million and $11.2 million, respectively, in 2012 as compared to 2011.
Segment operating profit increased by $7.7 million, or 30.5%, from $25.1 million during 2011 to $32.8 million during 2012. The increase in Europe segment operating profit was mainly attributable to increased revenues, partially offset by an increase in compensation and benefit costs primarily driven by additional headcount to support our revenue growth and continued demand for increase in onsite resources.
48
Russia Segment
Our Russia segment comprised 11.7% of total segment revenues in 2012, compared to 13.8% in 2011 with revenues increasing by $4.3 million, or 9.4%, from $46.2 million in 2011 to $50.6 million in 2012. Within the segment, revenue from Travel and Consumer and ISVs and Technology verticals increased by $3.2 million and $0.8 million, respectively, representing 93.0% of the overall segment growth in 2012.
Segment operating profit decreased by $1.4 million, or 13.4%, from $10.4 million in 2011 to $9.0 million in 2012. The decrease in Russia’s operating profit was attributable to a combination of factors, including higher compensation and benefits of our IT professionals in 2012, as compared to 2011, subcontractor costs incurred in connection with initial implementation work on a long-term project with one of Russia’s leading consumer-electronic retail chains, and reduced utilization levels resulting from fluctuations in service volumes.
Other Segment
Revenues from Other segment comprised 3.9% of total segment revenues, compared to 3.8% in 2011 with the majority of revenues derived from clients located in Kazakhstan and Ukraine. Other segment revenues increased by $4.1 million, or 32.2%, from $12.9 million in 2011 to $17.0 million in 2012. The growth was primarily attributable to the successful completion and delivery of a large World Bank sponsored fixed fee project in Ukraine with $3.8 million of incremental revenues recognized in 2012.
Segment operating profit increased by $4.6 million, or 189.1%, from $2.4 million in 2011 to $7.0 million in 2012. The increase in segment operating profit was primarily attributable to the same project noted above.
Liquidity and Capital Resources
Capital Resources
At December 31, 2013, our principal sources of liquidity were cash and cash equivalents totaling $169.2 million and $40.0 million of available borrowings under our revolving line of credit. As of that date, $143.5 million of our total cash and cash equivalents was held outside the United States, including $72.5 million held in U.S. dollar denominated accounts in Belarus, including deposits that accrued interest at an average interest rate of 4.3% during 2013.
We have a revolving line of credit with PNC Bank, National Association (the “Bank”). Effective January 15, 2013, we entered into a new agreement with the Bank (the “2013 Credit Facility”) which increased our borrowing capacity under the revolving line of credit from $30.0 million to $40.0 million and extended maturity of the new facility to January 15, 2015. Advances under the new line of credit accrue interest at an annual rate equal to the London Interbank Offer Rate, or LIBOR, plus 1.25%. The 2013 Credit Facility is secured by all of our domestic tangible and intangible assets, as well as by 100% of the stock of our domestic subsidiaries and 65% of the stock of certain of our foreign subsidiaries. The line of credit also contains customary financial and reporting covenants and limitations. We are currently in compliance with all covenants contained in our revolving line of credit and believe that our revolving line of credit provides sufficient flexibility such that we will remain in compliance with its terms in the foreseeable future. At December 31, 2013, we had no borrowings outstanding under the line of credit.
The cash and cash equivalents held at locations outside of the United States are for future operating expenses and we have no intention of repatriating those funds. We are not, however, restricted in repatriating those funds back to the United States, if necessary. If we decide to remit funds to the United States in the form of dividends, $143.2 million would be subject to foreign withholding taxes, of which $125.2 million would also be subject to U.S. corporate income tax. We believe that our available cash and cash equivalents held in the United States and cash flow to be generated from domestic operations will be adequate to satisfy our domestic liquidity needs in the foreseeable future. Our ability to expand and grow our business in accordance with current plans and to meet our long-term capital requirements will depend on many factors, including the rate, if any, at which our cash flows increase, our continued intent not to repatriate earnings from outside the U.S. and the availability of public and private debt and equity financing.
To the extent we pursue one or more significant strategic acquisitions, we may incur debt or sell additional equity to finance those acquisitions.
49
Cash Flows
The following table summarizes our cash flows for the periods indicated:
|
|
Year Ended December 31,
|
|||||||||||
|
|
2013
|
2012
|
2011
|
|||||||||
|
|
(in thousands)
|
|||||||||||
|
Consolidated Statements of Cash Flows Data:
|
|
|
|
|||||||||
|
Net cash provided by operating activities
|
$
|
58,225
|
$
|
48,499
|
$
|
54,520
|
||||||
|
Net cash used in investing activities
|
(21,820
|
)
|
(59,627
|
)
|
(17,408
|
)
|
||||||
|
Net cash provided by/(used in) financing activities
|
15,501
|
38,847
|
(1,558
|
)
|
||||||||
|
Effect of exchange-rate changes on cash and cash equivalents
|
(811
|
)
|
1,597
|
(762
|
)
|
|||||||
|
Net increase in cash and cash equivalents
|
$
|
51,095
|
$
|
29,316
|
$
|
34,792
|
||||||
|
Cash and cash equivalents, beginning of period
|
118,112
|
88,796
|
54,004
|
|||||||||
|
Cash and cash equivalents, end of period
|
$
|
169,207
|
$
|
118,112
|
$
|
88,796
|
||||||
Operating Activities
Net cash provided by operations increased by $9.7 million to $58.2 million in 2013 from $48.5 million net cash provided by operations in 2012. For 2013, net cash provided by operations was primarily comprised of net income of $22.3 million before accounting for non-cash items such as stock-based compensation, depreciation and amortization, bad debt expense, and other items aggregating to $14.8 million. Net increase in operating assets and liabilities in 2013 as compared to 2012, was primarily related to a reduction in prepaid and other assets by approximately $1.9 million as a result of non-recurring purchases made in 2012 coupled with a net increase in accrued expenses and trade payables of $2.0 million mainly due to a decrease in third party contractor expenses. This increase in operating cash flows was partially offset by higher billed and unbilled receivables of $7.6 million, which was mainly driven by increased volumes and higher ratio of fixed-priced projects in 2013 as compared to 2012, and a $6.1 million decrease in other net liabilities. The decrease in other net liabilities includes the effects of a higher portion of December salaries and related taxes released before the year-end in 2013 when compared to 2012; and a reduction in warranty revenues of $1.6 million related to several large non-recurring projects completed in prior periods.
Net cash provided by operations decreased by $6.0 million to $48.5 million during the year ended December 31, 2012 from $54.5 million net cash provided by operations during the same period in 2011. The increase in net income of $11.0 million before accounting for non-cash items in 2012 was more than offset by a decrease in accrued compensation of $15.3 million, primarily as a result of higher bonus payments relating to 2011 performance made in 2012 compared to such payments made in 2011.
Investing Activities
Net cash used in investing activities during the year ended December 31, 2013 decreased by $37.8 million to $21.8 million, as compared to $59.6 million of net cash used in investing activities in 2012. The decrease in cash spent on investing activities in 2013 as compared to 2012, was primarily attributable to a $11.1 million decrease in payments made in connection with the construction of corporate facilities in Belarus combined with a $32.9 million decrease in payments made in connection with our 2012 acquisitions. The decrease was partly offset by net payments of $5.8 million made by us in relation to employee loans issued under the Employee Housing Program.
Net cash of $59.6 million was used in investing activities during the year ended December 31, 2012 as compared to $17.4 million of net cash used in investing activities during the same period in 2011. Capital expenditures decreased by $2.2 million in 2012, as compared to 2011, however, this decrease was more than offset by an increase of $12.2 million spent on construction of facilities in Belarus. Additionally, 2012 investing cash flows were impacted by a total of $33.0 million of net cash paid to acquire operations of Thoughtcorp and Empathy Lab. See Note 2 of our consolidated financial statements in Part IV, “Item 15. Exhibits, Financial Statement Schedules — Audited Consolidated Financial Statements,” for further information regarding these acquisitions.
Financing Activities
Net cash provided by financing activities in 2013 decreased by $23.3 million to $15.5 million, as compared to $38.8 million provided by financing activities in 2012. This was primarily due to a net $30.6 million received in connection with our initial public offering of common stock in the first quarter of 2012 that did not recur in 2013, partially offset by an increase of $7.3 million in proceeds received by us in 2013 as a result of stock option exercises and associated tax benefits.
Net cash provided by financing activities during the year ended December 31, 2012 increased by $40.4 million as compared to $1.6 million of net cash outflow from financing activities for the same period in 2011. This was primarily due to net $30.6 million
50
received in connection with the initial public offering of our common stock in the first quarter of 2012 compared to a $1.6 million cash outflow related to offering issuance costs in the same period in 2011. Additionally, 2012 financing cash flows improved by $8.3 million compared to the same period in 2011 as a result of proceeds received by us from stock option exercises and associated tax benefits.
Contractual Obligations and Future Capital Requirements
Contractual Obligations
Set forth below is information concerning our fixed and determinable contractual obligations as of December 31, 2013.
|
Total
|
Less than 1
Year
|
1-3 Years
|
3-5 Years
|
More than 5
Years
|
||||||||||||||||
|
(in thousands)
|
||||||||||||||||||||
|
Operating lease obligations
|
$
|
31,279
|
$
|
13,924
|
$
|
12,354
|
$
|
4,521
|
$
|
480
|
||||||||||
|
1,890
|
1,890
|
—
|
—
|
—
|
||||||||||||||||
|
Employee Housing Program (2)
|
35
|
35
|
—
|
—
|
—
|
|||||||||||||||
|
Total
|
$
|
33,204
|
$
|
15,849
|
$
|
12,354
|
$
|
4,521
|
$
|
480
|
||||||||||
|
|
|
|
(1)
|
On December 7, 2011, we entered into an agreement with IDEAB Project Eesti AS for the construction of a 14,071 square meter office building within the High Technologies Park in Minsk, Belarus. The building is expected to be operational in the first half of 2014. As of December 31, 2013, our total outstanding commitment was $1.9 million. |
|
(2)
|
In the third quarter of 2012, our Board of Directors approved the Employee Housing Program, which assists employees in purchasing housing in Belarus. As part of the program, we will extend financing to employees up to an aggregate amount of $10.0 million. |
Future Capital Requirements
We believe that our existing cash and cash equivalents combined with our expected cash flow from operations will be sufficient to meet our projected operating and capital expenditure requirements for at least the next twelve months and that we possess the financial flexibility to execute our strategic objectives, including the ability to make acquisitions and strategic investments in the foreseeable future. Our ability to generate cash, however, is subject to our performance, general economic conditions, industry trends and other factors. To the extent that existing cash and cash equivalents and operating cash flow are insufficient to fund our future activities and requirements, we may need to raise additional funds through public or private equity or debt financing. If we issue equity securities in order to raise additional funds, substantial dilution to existing stockholders may occur. If we raise cash through the issuance of additional indebtedness, we may be subject to additional contractual restrictions on our business. There is no assurance that we would be able to raise additional funds on favorable terms or at all.
Off-Balance Sheet Commitments and Arrangements
We do not have any obligations under guarantee contracts or other contractual arrangements within the scope of FASB ASC paragraph 460-10-15-4 (Guarantees Topic) other than as disclosed in Note 16 of our consolidated financial statements in Part IV, “Item 15. Exhibits, Financial Statement Schedules — Audited Consolidated Financial Statements;” nor do we have any investments in special purpose entities or undisclosed borrowings or debt. Accordingly, our results of operations, financial condition and cash flows are not subject to material off-balance sheet risks.
Critical Accounting Policies
We prepare our audited consolidated financial statements in accordance with U.S. generally accepted accounting principles (GAAP), which require us to make judgments, estimates and assumptions that affect: (i) the reported amounts of assets and liabilities, (ii) disclosure of contingent assets and liabilities at the end of each reporting period and (iii) the reported amounts of revenues and expenses during each reporting period. We evaluate these estimates and assumptions based on historical experience, knowledge and assessment of current business and other conditions, and expectations regarding the future based on available information and reasonable assumptions, which together form a basis for making judgments about matters not readily apparent from other sources. Since the use of estimates is an integral component of the financial reporting process, actual results could differ from those estimates. Some of our accounting policies require higher degrees of judgment than others in their application. When reviewing our audited consolidated financial statements, you should consider (i) our selection of critical accounting policies, (ii) the judgment and other uncertainties affecting the application of such policies and (iii) the sensitivity of reported results to changes in conditions and assumptions. We consider the policies discussed below to be critical to an understanding of our audited consolidated financial statements as their application places significant demands on the judgment of our management.
51
An accounting policy is considered to be critical if it requires an accounting estimate to be made based on assumptions about matters that are highly uncertain at the time the estimate is made, and if different estimates that reasonably could have been used, or changes in the accounting estimates that are reasonably likely to occur periodically, could materially impact the audited consolidated financial statements. We believe that the following critical accounting policies are the most sensitive and require more significant estimates and assumptions used in the preparation of our audited consolidated financial statements. You should read the following descriptions of critical accounting policies, judgments and estimates in conjunction with our audited consolidated financial statements and other disclosures included in this annual report.
Revenue Recognition
We recognize revenue when realized or realizable and earned, which is when the following criteria are met: persuasive evidence of an arrangement exists; delivery has occurred; the sales price is fixed or determinable; and collectability is reasonably assured. Determining whether and when some of these criteria have been satisfied often involves assumptions and judgments that can have a significant impact on the timing and amount of revenue we report. If there is an uncertainty about the project completion or receipt of payment for the consulting services, revenues are deferred until the uncertainty is sufficiently resolved. At the time revenues are recognized, we provide for any contractual deductions and reduce revenues accordingly. We defer amounts billed to our clients for revenues not yet earned. Such amounts are anticipated to be recorded as revenues as services are performed in subsequent periods. Unbilled revenues represent services provided which are billed subsequent to the period end in accordance with the contract terms.
We derive our revenues from a variety of service offerings which represent specific competencies of our IT professionals. Contracts for these services have different terms and conditions based on the scope, deliverables, and complexity of the engagement which require management to make judgments and estimates in determining appropriate revenue recognition pattern. Fees for these contracts may be in the form of time-and-materials or fixed-price arrangements.
The majority of our revenues (82.3% of revenues in 2013, 84.1% in 2012 and 86.1% in 2011) is generated under time-and-material contracts whereby revenues are recognized as services are performed with the corresponding cost of providing those services reflected as cost of revenues when incurred. The majority of such revenues are billed on an hourly, daily or monthly basis whereby actual time is charged directly to the client.
Revenues from fixed-price contracts (15.7% of revenues in 2013, 13.7% in 2012 and 11.0% in 2011) are determined using the proportional performance method. In instances where final acceptance of the product, system, or solution is specified by the client, revenues are deferred until all acceptance criteria have been met. In absence of a sufficient basis to measure progress towards completion, revenue is recognized upon receipt of final acceptance from the client. In order to estimate the amount of revenue for the period under the proportional performance method, we determine the percentage of actual labor hours incurred as compared to estimated total labor hours and apply that percentage to the consideration allocated to the deliverable. The complexity of the estimation process and factors relating to the assumptions, risks and uncertainties inherent with the application of the proportional performance method of accounting affects the amounts of revenues and related expenses reported in our consolidated financial statements. A number of internal and external factors can affect such estimates, including labor hours and specification and testing requirement changes. The cumulative impact of any revision in estimates is reflected in the financial reporting period in which the change in estimate becomes known. No significant revisions occurred in each of the three years ended December 31, 2013, 2012 and 2011. Our fixed price contracts are generally recognized over a period of 12 months or less.
From time to time, we enter into multiple element arrangements with our customers. In the vast majority of cases such multiple-element arrangements represent fixed-priced arrangements to develop a customized IT solution to meet the customer’s needs combined with warranty support over a specified period of time in the future, to which we refer to as the “warranty period.” Our customers retain full intellectual property (IP) rights to the results of our services, and the software element created in lieu of such services is no more than incidental to any of the service deliverables, as defined in accordance with ASC 985-605-15-13. For such arrangements we follow the guidance set forth in ASC 605-25, Revenue Recognition – Multiple Element Arrangements, as to whether multiple deliverables exist, how the arrangement should be separated, and how the consideration should be allocated. We recognize revenue related to the delivered products only if all revenue recognition criteria are met and the delivered element has a standalone value to the customer and allocate total consideration among the deliverables based on their relative selling prices. Revenue related to the software development services is recognized under the proportional performance method, as described above, while warranty support services are recognized on a straight-line basis over the warranty period. The warranty period is generally three months to two years.
We report gross reimbursable “out-of-pocket” expenses incurred as both revenues and cost of revenues in the consolidated statements of income.
52
Goodwill and Other Intangible Assets
We account for our business combinations using the acquisition accounting method, which requires us to determine the fair value of net assets acquired and the related goodwill and other intangible assets. Determining the fair value of assets acquired and liabilities assumed requires management’s judgment and involves the use of significant estimates, including projections of future cash inflows and outflows, discount rates, asset lives and market multiples. Our acquisitions usually do not have significant amounts of tangible assets, as the principal assets we typically acquire are customer relationships, trade names, non-competition agreements, and workforce. As a result, a substantial portion of the purchase price is allocated to goodwill and other intangible assets.
Goodwill and intangible assets that have indefinite useful lives are not amortized but are tested annually for impairment. Events or circumstances that might require impairment testing of goodwill and other intangible assets include the loss of a significant client, the identification of other impaired assets within a reporting unit, loss of key personnel, the disposition of a significant portion of a reporting unit, significant decline in stock price or a significant adverse change in business climate or regulations. Intangible assets that have finite useful lives are amortized over their estimated useful lives on a straight-line basis.
As of December 31, 2013 and 2012, all of our intangible assets had finite lives and we did not incur any impairment losses in respect of our intangible assets during the years ended December 31, 2013, 2012 or 2011.
Effective in the fourth quarter of 2013, we changed the annual goodwill impairment assessment date for all of our reporting units from December 31
st
to October 31
st
, which represented a voluntary change in the annual goodwill impairment testing date. We are also required to assess the goodwill of our reporting units for impairment between annual assessment dates when events or circumstances dictate. This change does not delay, accelerate or avoid an impairment charge and is preferable as additional resources for the preparation, review, and conclusion of the annual goodwill impairment test are available at this time. Further, this timing more closely aligns with our annual budgeting and planning process. Information prepared during the annual budgeting and planning process is used extensively in our impairment assessment. We evaluate the recoverability of goodwill at a reporting unit level and we had three reporting units that were subject to the annual impairment testing in 2013. Our annual impairment review as of October 31, 2013 and December 31, 2012 did not result in an impairment charge for any of these reporting units. It was impracticable to apply this change retrospectively, as we are unable to objectively determine significant estimates and assumptions that would have been used in those earlier periods without the use of hindsight.
For our annual impairment test, we compare the respective fair value of our reporting units to their respective carrying values in order to determine if impairment is indicated. If so, the implied fair value of the reporting unit’s goodwill is compared to its carrying amount, and the impairment loss is measured by the excess of the carrying value over fair value. The fair values are estimated using a combination of the income approach, which incorporates the use of the discounted cash flow method, and the market approach, which incorporates the use of earnings multiples based on market data. These valuations are considered Level 3 measurements under FASB ASC Topic 820. We utilize estimates to determine the fair value of the reporting units such as future cash flows, growth rates, capital requirements, effective tax rates and projected margins, among other factors. Estimates utilized in the future evaluations of goodwill for impairment could differ from estimates used in the current period calculations.
When facts and circumstances indicate potential impairment of amortizable intangible assets, we evaluate the recoverability of the asset’s carrying value, using estimates of undiscounted future cash flows that utilize a discount rate determined by our management to be commensurate with the risk inherent in our business model over the remaining asset life. The estimates of future cash flows attributable to intangible assets require significant judgment based on our historical and anticipated results. Any impairment loss is measured by the excess of carrying value over fair value.
Income Taxes
The provision for income taxes includes federal, state, local and foreign taxes. Deferred tax assets and liabilities are recognized for the estimated future tax consequences of temporary differences between the audited consolidated financial statement carrying amounts and their respective tax bases. Deferred tax assets and liabilities are measured using enacted tax rates expected to apply to taxable income in the year in which the temporary differences are expected to be reversed. Changes to enacted tax rates would result in either increases or decreases in the provision for income taxes in the period of changes. We evaluate the realizability of deferred tax assets and recognize a valuation allowance when it is more likely than not that all or a portion of deferred tax assets will not be realized.
The realization of deferred tax assets is primarily dependent on future earnings. Any reduction in estimated forecasted results may require that we record valuation allowances against deferred tax assets. Once a valuation allowance has been established, it will be maintained until there is sufficient positive evidence to conclude that it is more likely than not that the deferred tax assets will be
53
realized. A pattern of sustained profitability will generally be considered as sufficient positive evidence to reverse a valuation allowance. If the allowance is reversed in a future period, the income tax provision will be correspondingly reduced. Accordingly, the increase and decrease of valuation allowances could have a significant negative or positive impact on future earnings.
Changes in tax laws and rates may affect recorded deferred tax assets and liabilities and our effective tax rate in the future. The American Taxpayer Relief Act of 2012 (the “Act”) was signed into law on January 2, 2013. Because a change in tax law is accounted for in the period of enactment, certain provisions of the Act benefiting our 2012 U.S. federal taxes, including the Subpart F controlled foreign corporation look-through exception were not recognized in our 2012 financial results and instead were reflected in our 2013 financial results.
Accounting for Stock-Based Employee Compensation Plans
Stock-based compensation expense for awards of equity instruments to employees and non-employee directors is determined based on the grant-date fair value of the awards ultimately expected to vest. We recognize these compensation costs on a straight-line basis over the requisite service period of the award, which is generally the option vesting term of four years.
We estimate forfeitures at the time of grant and revise our estimates, if necessary, in subsequent periods if actual forfeitures or vesting differ from those estimates. Such revisions could have a material effect on our operating results. The assumptions used in the valuation model are based on subjective future expectations combined with management judgment. If any of the assumptions used in the valuation model change significantly, stock-based compensation for future awards may differ materially compared to the awards previously granted.
Fair Value of Employee Housing Loans
We issue loans to our employees under the Employee Housing Program (“housing loans”). Housing loans are issued in U.S. Dollars with a 5-year term and carry an interest rate of 7.5%. The program was designed to be a retention mechanism for our employees in Belarus.
Although permitted by authoritative guidance, we did not elect a fair value option for these financial instruments. These housing loans are measured at fair value upon initial recognition and subsequently carried at amortized cost less allowance for loan losses. Any difference between the carrying value and the fair value of a loan upon initial recognition (“day-one” recognition) is charged to expense.
The housing loans were classified as Level 3 measurements within the fair value hierarchy because they were valued using significant unobservable inputs. The estimated fair value of these housing loans upon initial recognition was computed by projecting the future contractual cash flows to be received from the loans and discounting those projected net cash flows to a present value, which is the estimated fair value (the “Income Approach”). In applying the Income Approach, we analyzed similar loans offered by third-party financial institutions in Belarusian Rubles (“BYR”) and adjusted the interest rates charged on such loans to exclude the effects of underlying economic factors, such as inflation and currency devaluation. We also assessed the probability of future defaults and associated cash flows impact. In addition, we separately analyzed the rate of return that market participants in Belarus would require when investing in unsecured USD-denominated government bonds with similar maturities (a “risk-free rate”) and evaluated a risk premium component to compensate the market participants for the credit and liquidity risks inherent in the loans’ cash flows, as described in the following paragraph. As a result of the analysis performed, we determined the carrying values of the housing loans issued during the year ended December 31, 2013 approximated their fair values upon initial recognition. We also estimated the fair values of the housing loans that were outstanding as of December 31, 2013 using the inputs noted above and determined their fair values approximated the carrying values as of that date.
Repayment of housing loans is primarily dependent on personal income of borrowers obtained through employment with EPAM, which income is set in U.S. dollars and is not closely correlated with common macroeconomic risks existing in Belarus, such as inflation, local currency devaluation and decrease in the purchasing power of the borrowers’ income. Given a large demand for the program among our employees and its advantages as compared to alternative methods of financing available on the market, we expect the borrowers to fulfill their obligations, and we estimate the probability of voluntary termination of employment among the borrowers as de minimis. Additionally, housing loans are capped at $50 thousand per loan and secured by real estate financed through the program. We establish a maximum loan-to-value ratio of 70% and expect a decrease in the ratio over the life of a housing loan due to on-going payments by employees.
Recent Accounting Pronouncements
See Note 1 to the audited consolidated financial statements included in Part IV, “Item 15. Exhibits, Financial Statement Schedules — Audited Consolidated Financial Statements,” regarding the impact of certain recent accounting pronouncements on our audited consolidated financial statements.
54
We are exposed to certain market risks in the ordinary course of our business. These risks result primarily from changes in foreign currency exchange rates and interest rates, and concentration of credit risks. In addition, our international operations are subject to risks related to differing economic conditions, changes in political climate, differing tax structures, and other regulations and restrictions.
Concentration of Credit and Other Risk
Financial instruments that potentially subject us to significant concentrations of credit risk consist primarily of employee loans, cash and cash equivalents, trade accounts receivable and unbilled revenues.
At December 31, 2013 loans issued to employees were $6.4 million, or 1.5%, of our total assets. These loans expose us to a risk of non-payment and loss. Repayment of these loans is primarily dependent on personal income of borrowers obtained through their employment with EPAM and may be adversely affected by changes in macroeconomic situations, such as higher unemployment levels, currency devaluation and inflation. Additionally, continuing financial stability of a borrower may be adversely affected by job loss, divorce, illness or personal bankruptcy. We also face the risk that the collateral will be insufficient to compensate us for loan losses, if any, and costs of foreclosure. Decreases in real estate values could adversely affect the value of property used as collateral, and we may be unsuccessful in recovering the remaining balance from either the borrower and/or guarantors.
We maintain our cash and cash equivalents and short-term investments with financial institutions. We believe that our credit policies reflect normal industry terms and business risk. We do not anticipate non-performance by the counterparties. As of December 31, 2013, $103.1 million of total cash was held in CIS countries, with $73.9 million of that in Belarus. Banking and other financial systems in the CIS are less developed and regulated than in some more developed markets, and legislation relating to banks and bank accounts is subject to varying interpretations and inconsistent application. Banks in the CIS generally do not meet the banking standards of more developed markets, and the transparency of the banking sector lags behind international standards. Furthermore, bank deposits made by corporate entities in CIS are not insured. As a result, the banking sector remains subject to periodic instability. Another banking crisis, or the bankruptcy or insolvency of banks through which we receive or with which we hold funds, particularly in Belarus, may result in the loss of our deposits or adversely affect our ability to complete banking transactions in the CIS, which could materially adversely affect our business and financial condition.
Trade accounts receivable and unbilled revenues are generally dispersed across our clients in proportion to their revenues. As of December 31, 2013, unbilled revenues from two customers individually exceeded 10% of total unbilled revenues and jointly accounted for 33.3% of total unbilled revenues as of that date; and one customer accounted for over 10% of total accounts receivable as of that date.
During the years ended December 31, 2013 and 2012, our top five customers accounted for 30.6% and 31.0% of our total revenues, and our top ten customers accounted for 42.3% and 44.4% of our total revenues, respectively. No customer accounted for over 10% of total revenues in 2013 or 2012.
Credit losses and write-offs of trade accounts receivable balances have historically not been material to our audited consolidated financial statements.
55
Interest Rate Risk
Our exposure to market risk for changes in interest rates relates primarily to our cash and cash equivalents and our revolving line of credit bearing interest at LIBOR plus 1.25% rate. We do not use derivative financial instruments to hedge our risk of interest rate volatility.
We also do not believe that employee loans issued by us under the Employee Housing Program expose us to significant interest rate risks. These loans are designed to be a retention mechanism for our employees in Belarus and are financed with available funds of our Belarusian subsidiary.
We have not been exposed to material risks due to changes in market interest rates. However, our future interest expense may increase and interest income may fall due to changes in market interest rates.
Foreign Exchange Risk
Our consolidated financial statements are reported in U.S. dollars. Our international operations expose us to foreign currency exchange rate changes that could impact translations of foreign denominated assets and liabilities into U.S. dollars and future earnings and cash flows from transactions denominated in different currencies. Our exposure to currency exchange rate changes is diversified due to the number of different countries in which we conduct business. We operate outside the United States primarily through wholly owned subsidiaries in Canada, Europe, and the CIS and CEE regions and generate a significant portion of our revenues in certain non-U.S. dollar currencies, principally, euros, British pounds and Russian rubles. We incur expenditures in non-U.S. dollar currencies, principally in Hungarian forints, euros and Russian rubles associated with our delivery centers located in CEE. We are exposed to fluctuations in foreign currency exchange rates primarily on accounts receivable and unbilled revenues from sales in these foreign currencies and cash flows for expenditures in foreign currencies. We do not use derivative financial instruments to hedge the risk of foreign exchange volatility. Our results of operations can be affected if the euro, the British pound, Hungarian forint and/or Russian ruble appreciate or depreciate against the U.S. dollar. Our exchange rate risk primarily arises from our foreign currency revenues and expenses. Based on our results of operations for the year ended December 31, 2013, a 1.0% appreciation / (depreciation) of either the euro, or the British pound against the U.S. dollar would result in an estimated increase / (decrease) of approximately $0.3 million in net income, and a 1.0% appreciation / (depreciation) of the Hungarian forint against the U.S. dollar would result in an estimated increase / (decrease) of approximately $0.4 million in net income. Based on our results of operations for the year ended December 31, 2013, a 1.0% appreciation/ (depreciation) of all applicable foreign currencies against the U.S. dollar would result in an estimated increase/ (decrease) of approximately $0.1 million in net income.
To the extent that we need to convert U.S. dollars into foreign currencies for our operations, appreciation of such foreign currencies against the U.S. dollar would adversely affect the amount of such foreign currencies we receive from the conversion. Sensitivity analysis is used as a primary tool in evaluating the effects of changes in foreign currency exchange rates, interest rates and commodity prices on our business operations. The analysis quantifies the impact of potential changes in these rates and prices on our earnings, cash flows and fair values of assets and liabilities during the forecast period, most commonly within a one-year period. The ranges of changes used for the purpose of this analysis reflect our view of changes that are reasonably possible during the forecast period. Fair values are the present value of projected future cash flows based on market rates and chosen prices. Changes in the currency exchange rates resulted in our reporting a net transactional foreign currency exchange losses of $2.5 million and $1.8 million during the years ended December 31, 2013 and 2012, respectively. These losses are included in the consolidated statements of income and comprehensive income.
Additionally, foreign currency translation adjustments from translating financial statements of our foreign subsidiaries from functional currency to the U.S. dollars are recorded as a separate component of stockholders’ equity or included in the consolidated statements of income and comprehensive income if local currencies of our foreign subsidiaries differ from their functional currencies. As of December 31, 2013, approximately 21.6% of our total net assets were subject to foreign currency translation exposure, as compared to 21.1% as of December 31, 2012; and 29.6% of our net income in 2013 was generated by subsidiaries for which the functional currency is not U.S. dollars, as compared to 32.3% in 2012. During the years ended December 31, 2013 and 2012, we recorded translation losses of $0.3 million within our consolidated income in both periods, and $0.8 million of translation losses and $2.5 million of translation gains within our consolidated accumulated other comprehensive income during the years ended December 31, 2013 and 2012, respectively.
The information required is included in this annual report as set forth in Part IV, “Item 15. Exhibits, Financial Statement Schedules — Audited Consolidated Financial Statements.”
56
None.
Conclusion Regarding the Effectiveness of Disclosure Controls and Procedures
As of December 31, 2013, we carried out an evaluation under the supervision and with the participation of our management, including our Chief Executive Officer and Chief Financial Officer, as to the effectiveness, design and operation of our disclosure controls and procedures. The term “disclosure controls and procedures,” as defined in Rules 13a-15(e) and 15d-15(e) under the Securities Exchange Act of 1934, as amended, or the Exchange Act, means controls and other procedures of a company that are designed to ensure that information required to be disclosed by a company in the reports that it files or submits under the Exchange Act is recorded, processed, summarized and reported, within the time periods specified in the SEC’s rules and forms. Disclosure controls and procedures include, without limitation, controls and procedures designed to ensure that information required to be disclosed by a company in the reports that it files or submits under the Exchange Act is accumulated and communicated to the company’s management, including its principal executive and principal financial officers, as appropriate to allow timely decisions regarding required disclosure. Our management, including our Chief Executive Officer and Chief Financial Officer, does not expect that our disclosure controls and procedures or our internal controls will prevent and/or detect all errors and all fraud. A control system, no matter how well conceived and operated, can provide only reasonable, not absolute, assurance that the objectives of the control system are met. Further, the design of a control system must reflect the fact that there are resource constraints, and the benefit of controls must be considered relative to their costs. Because of the inherent limitation in all control systems, no evaluation of controls can provide absolute assurance that all control issues and instances of fraud, if any, within our company have been detected. Our disclosure controls and procedures are designed to provide reasonable assurance of achieving their objectives and our Chief Executive Officer and Chief Financial Officer concluded that our disclosure controls and procedures (as defined in the Exchange Act Rules 13a- 15(e) and 15d-15(e)) were effective as of December 31, 2013.
Management’s Report on Internal Control Over Financial Reporting
Our management is responsible for establishing and maintaining adequate internal control over financial reporting as defined in Rules 13a-15(f) and 15d-15(f) under the Securities Exchange Act of 1934, as amended. Our internal control over financial reporting is a process designed to provide reasonable assurance regarding the reliability of financial reporting and the preparation of the financial statements for external purposes in accordance with U.S. generally accepted accounting principles. Because of its inherent limitations, a system of internal control over financial reporting can provide only reasonable assurance and may not prevent or detect misstatements. In addition, projections of any evaluation of effectiveness to future periods are subject to the risk that internal controls may become inadequate because of changes in conditions, or that the degree of compliance with the policies or procedures may deteriorate.
Under the supervision and with the participation of our management, including our principal executive officer and principal financial officer, we conducted an evaluation of the effectiveness of our internal control over financial reporting based on the framework set forth in Internal Control — Integrated Framework issued by the Committee of Sponsoring Organizations of the Treadway Commission.
Based on this assessment, management concluded that our internal control over financial reporting was effective at December 31, 2013.
This annual report does not include an attestation report of our registered public accounting firm regarding internal control over financial reporting. Management’s report was not subject to attestation by the our independent registered public accounting firm pursuant to the rules of the Securities Exchange Commission that permit us to provide only management’s report in this annual report.
Changes in Internal Control Over Financial Reporting
There has been no change in our internal control over financial reporting during the quarter ended December 31, 2013, that has materially affected, or is reasonably likely to materially affect, our internal control over financial reporting.
None.
57
The information required by this item is set forth under the sections “Election of Directors,” “Our Executive Officers,” “Section 16(a) Beneficial Ownership Reporting Compliance” and “Corporate Governance” in in our definitive Proxy Statement (the “2014 Proxy Statement”) for our annual general meeting of stockholders to be held on June 13, 2014, which sections are incorporated herein by reference.
Information required by this item is set forth under the sections “Executive Compensation Tables” and “Compensation Committee Interlocks and Insider Participation” in the 2014 Proxy Statement, which sections are incorporated herein by reference.
Item 12
.
Security Ownership of Certain Beneficial Owners and Management and Related Stockholder Matter
s
Information required by this item is set forth under the section “Security Ownership of Certain Beneficial Owners and Management” in the 2014 Proxy Statement, which section is incorporated herein by reference.
Information required by this item is set forth under the section “Certain Relationships and Related Transactions and Director Independence” in the 2014 Proxy Statement, which section is incorporated herein by reference.
Information required by this item is set forth under the section “Independent Registered Public Accounting Firm Fees and Other Matters” in the 2014 Proxy Statement, which section is incorporated herein by reference.
58
(a)
We have filed the following documents as part of this annual report:
1.
Audited Consolidated Financial Statements
|
|
Page
|
|
Report of Independent Registered Public Accounting Firm
|
F-2
|
|
Consolidated Balance Sheets as of December 31, 2013 and 2012
|
F-3
|
|
Consolidated Statements of Income and Comprehensive Income for Years Ended December 31, 2013, 2012 and 2011
|
F-4
|
|
Consolidated Statements of Changes in Redeemable Preferred Stock and Stockholders’ Equity for Years Ended December 31, 2013, 2012 and 2011
|
F-5
|
|
Consolidated Statements of Cash Flows for Years Ended December 31, 2013, 2012 and 2011
|
F-7
|
|
Notes to Consolidated Financial Statements for Years Ended December 31, 2013, 2012 and 2011
|
F-8
|
2.
Financial Statement Schedules
Financial statement schedules are omitted because they are not applicable or the required information is shown in the financial statements or the notes thereto.
3.
Exhibits
A list of exhibits required to be filed as part of this annual report is set forth in the Exhibit Index, which immediately precedes such exhibits and is incorporated herein by reference.
59
Pursuant to the requirements of Section 13 or 15(d) of the Securities Exchange Act of 1934, the registrant has duly caused this report to be signed on its behalf by the undersigned, thereunto duly authorized, on the 10
th
day of March, 2014.
|
|
EPAM SYSTEMS, INC.
|
||
|
|
|
|
|
|
|
By:
|
/s/ Arkadiy Dobkin
|
|
|
|
|
Name:
|
Arkadiy Dobkin
|
|
|
|
Title:
|
Chairman, Chief Executive Officer and President
|
Pursuant to the requirements of the Securities Exchange Act of 1934, this report has been signed below by the following persons on behalf of the registrant and in the capacities and on the dates indicated.
|
Signature
|
|
Title
|
|
Date
|
|
|
|
|
|
|
|
/s/ Arkadiy Dobkin
|
|
Chairman, Chief Executive Officer and President
(principal executive officer)
|
|
March 10, 2014
|
|
Arkadiy Dobkin
|
||||
|
|
|
|
|
|
|
/s/ Anthony J. Conte
|
|
Vice President, Chief Financial Officer and Treasurer
(principal financial officer and principal accounting officer)
|
|
March 10, 2014
|
|
Anthony J. Conte
|
||||
|
|
|
|
|
|
|
/s/ Karl Robb
|
|
Director
|
|
March 10, 2014
|
|
Karl Robb
|
||||
|
|
||||
|
|
|
|
|
|
|
/s/ Andrew J. Guff
|
|
Director
|
|
March 10, 2014
|
|
Andrew J. Guff
|
||||
|
|
||||
|
|
|
|
|
|
|
/s/ Donald P. Spencer
|
|
Director
|
|
March 10, 2014
|
|
Donald P. Spencer
|
||||
|
|
||||
|
|
|
|
|
|
|
/s/ Richard Michael Mayoras
|
|
Director
|
|
March 10, 2014
|
|
Richard Michael Mayoras
|
||||
|
|
||||
|
|
|
|
|
|
|
/s/ Robert E. Segert
|
|
Director
|
|
March 10, 2014
|
|
Robert E. Segert
|
||||
|
|
||||
|
|
|
|
|
|
|
/s/ Ronald Vargo
|
|
Director
|
|
March 10, 2014
|
|
Ronald Vargo
|
||||
|
|
60
|
|
Exhibit Number
|
|
Description
|
|
|
3.1
|
|
Certificate of incorporation (incorporated herein by reference to Exhibit 3.1 to the Company’s Form 10-K for the fiscal year ended December 31, 2011, SEC File No. 001-35418, filed March 30, 2012 (the “2011 Form 10-K”))
|
|
|
3.2
|
|
Bylaws (incorporated herein by reference to Exhibit 3.2 to the 2011 Form 10-K)
|
|
|
4.1
|
|
Form of Common Stock Certificate (incorporated herein by reference to Exhibit 4.1 to Amendment No. 6 to Form S-1, SEC File No. 333-174827, filed January 23, 2012 (“Amendment No. 6”))
|
|
|
4.2
|
|
Amended and Restated Registration Rights Agreement dated February 19, 2008 (incorporated herein by reference to Exhibit 4.2 to Form S-1, SEC File No. 333-174827, filed June 10, 2011 (the “Registration Statement”))
|
|
|
4.3
|
|
Registration Rights Agreement dated April 26, 2010 (incorporated herein by reference to Exhibit 4.3 to the Registration Statement)
|
|
|
10.1
|
|
Revolving line of credit between EPAM Systems, Inc. and PNC Bank, National Association dated November 22, 2006 (incorporated herein by reference to Exhibit 10.1 to the Registration Statement)
|
|
|
10.2
|
|
Security Agreement between EPAM Systems, Inc. and PNC Bank, National Association dated November 22, 2006 (incorporated herein by reference to Exhibit 10.2 to the Registration Statement)
|
|
|
10.3
|
|
Borrowing Base Rider between EPAM Systems, Inc. and PNC Bank, National Association dated November 22, 2006 (incorporated herein by reference to Exhibit 10.3 to the Registration Statement)
|
|
|
10.4
|
|
First Amendment to loan documents between EPAM Systems, Inc. and PNC Bank, National Association dated September 30, 2010 (incorporated herein by reference to Exhibit 10.4 to the Registration Statement)
|
|
|
10.5
|
|
Amended and Restated Committed Line of Credit Note dated September 30, 2010 (incorporated herein by reference to Exhibit 10.5 to the Registration Statement)
|
|
|
10.6†
|
|
EPAM Systems, Inc. Amended and Restated 2006 Stock Option Plan (incorporated herein by reference to Exhibit 10.6 to Amendment No. 6)
|
|
|
10.7†
|
|
Form of EPAM Systems, Inc. 2006 Stock Option Plan Award Agreement (under the EPAM Systems, Inc. Amended and Restated 2006 Stock Option Plan) (incorporated herein by reference to Exhibit 10.7 to Amendment No. 6)
|
|
|
10.8
|
|
Second Amendment to loan documents between EPAM Systems, Inc. and PNC Bank, National Association dated July 25, 2011 (incorporated by reference to Exhibit 10.11 to Amendment No. 3 to Form S-1, SEC File No. 333-17482, filed September 26, 2011(“Amendment No. 3”))
|
|
|
10.9
|
|
Second Amended and Restated Committed Line of Credit Note dated July 25, 2011 (incorporated by reference to Exhibit 10.12 to Amendment No. 3)
|
|
|
10.10†
|
|
EPAM Systems, Inc. 2012 Long Term Incentive Plan (incorporated herein by reference to Exhibit 10.12 to Amendment No. 6)
|
|
|
10.11†
|
|
Form of Senior Management Non-Qualified Stock Option Award Agreement (under the EPAM Systems, Inc. 2012 Long Term Incentive Plan) (incorporated herein by reference to Exhibit 10.13 to Amendment No. 6)
|
|
|
10.12†
|
|
Restricted Stock Award Agreement by and between Karl Robb and EPAM Systems, Inc. dated January 16, 2012 (incorporated herein by reference to Exhibit 10.14 to Amendment No. 6)
|
|
|
10.13†
|
|
EPAM Systems, Inc. 2012 Non-Employee Directors Compensation Plan (incorporated herein by reference to Exhibit 10.15 to Amendment No. 6 to Form S-1 SEC File No. 333-174827, filed January 23, 2012)
|
|
|
10.14†
|
|
Form of Non-Employee Director Restricted Stock Award Agreement (under the EPAM Systems, Inc. 2012 Non-Employee Directors Compensation Plan) (incorporated herein by reference to Exhibit 10.16 to Amendment No. 6)
|
|
|
10.15†
|
|
EPAM Systems, Inc. Non-Employee Director Compensation Policy (incorporated herein by reference to Exhibit 10.17 to Amendment No. 6)
|
|
|
10.16†
|
|
Form of Director Offer Letter (incorporated herein by reference to Exhibit 10.18 to Amendment No. 6)
|
|
|
10.17†
|
|
Executive Employment Agreement by and between Arkadiy Dobkin and EPAM Systems, Inc. dated January 20, 2006 (expired except with respect to Section 8) (incorporated herein by reference to Exhibit 10.19 to Amendment No. 6)
|
|
|
10.18†
|
|
Offer Letter by and between Ginger Mosier and EPAM Systems, Inc. dated February 24, 2010 (incorporated herein by reference to Exhibit 10.20 to Amendment No. 6)
|
|
|
10.19†
|
|
Employment Contract by and between Balazs Fejes and EPAM Systems (Switzerland) GmbH. dated June 15, 2009 (incorporated herein by reference to Exhibit 10.21 to Amendment No. 6)
|
|
|
10.20†
|
|
Consultancy Agreement by and between Landmark Business Development Limited, Balazs Fejes and EPAM Systems, Inc. dated January 20, 2006 (expired except with respect to Section 8) (incorporated herein by reference to Exhibit 10.22 to Amendment No. 6)
|
|
|
10.21†
|
|
Consultancy Agreement by and between Landmark Business Development Limited, Karl Robb and EPAM Systems, Inc. dated January 20, 2006 (expired except with respect to Section 8) (incorporated herein by reference to Exhibit 10.23 to Amendment No. 6)
|
|
|
10.22†
|
|
Form of nondisclosure, noncompete and nonsolicitation agreement (incorporated herein by reference to Exhibit 10.24 to Amendment No. 6)
|
|
|
10.23†
|
|
Form of Indemnification Agreement (incorporated herein by reference to Exhibit 10.25 to Amendment No. 6)
|
61
|
|
Exhibit Number
|
|
Description
|
||||
|
|
10.24
|
|
English translation of Agreement with IDEAB Project Eesti AS (incorporated herein by reference to Exhibit 10.26 to Amendment No. 6)
|
||||
|
|
10.25
|
|
Credit Agreement by and among EPAM Systems, Inc., as Borrower, The Guarantors Parties Hereto, and PNC Bank, National Association, as Lender dated January 15, 2013 (incorporated herein by reference to Exhibit 10.25 to the Company’s Form 10-K for the fiscal year ended December 31, 2012, SEC File No. 001-35418, filed March 11, 2013 (the “2012 Form 10-K”))
|
||||
|
|
10.26
|
|
Guaranty and Suretyship Agreement between EPAM Systems LLC, a New Jersey limited liability company, and Vested Development, Inc., a Delaware corporation, and PNC Bank, National Association dated January 15, 2013 (incorporated herein by reference to Exhibit 10.26 to the 2012 Form 10-K)
|
||||
|
|
10.27
|
|
Security Agreement between EPAM Systems, Inc., a Delaware corporation, EPAM Systems LLC, a New Jersey limited liability company, and Vested Development, Inc., a Delaware corporation, and PNC Bank, National Association dated January 15, 2013 (incorporated herein by reference to Exhibit 10.27 to the 2012 Form 10-K)
|
||||
|
|
10.28
|
|
Pledge Agreement to loan documents between EPAM Systems, Inc. a Delaware corporation, EPAM Systems LLC, a New Jersey limited liability company, and Vested Development, Inc., a Delaware corporation, and PNC Bank, National Association dated January 15, 2013 (incorporated herein by reference to Exhibit 10.28 to the 2012 Form 10-K)
|
||||
| 18.1* | Letter re Changes in Accounting Principles | ||||||
|
|
|||||||
|
|
|||||||
|
|
|||||||
|
|
|||||||
|
|
|||||||
|
|
|||||||
|
|
101.INS**
|
|
XBRL Instance Document
|
||||
|
|
101.SCH**
|
|
XBRL Taxonomy Extension Schema Document
|
||||
|
|
101.CAL**
|
|
XBRL Taxonomy Extension Calculation Linkbase Document
|
||||
|
|
101.DEF**
|
|
XBRL Taxonomy Extension Definition Linkbase Document
|
||||
|
|
101.LAB**
|
|
XBRL Taxonomy Extension Label Linkbase Document
|
||||
|
|
101.PRE**
|
|
XBRL Taxonomy Extension Presentation Linkbase Document
|
||||
|
|
|
|
|
||||
|
|
†
|
Indicates management contracts or compensatory plans or arrangements
|
|||||
|
|
*
|
Exhibits filed herewith
|
|||||
|
|
**
|
As provided in Rule 406T of Regulation S-T, this information is furnished and not filed for purposes of Section 11 and 12 of the Securities Act of 1933, as amended, and Section 18 of the Securities Exchange Act of 1934, as amended.
|
|||||
62
|
|
Page
|
|
Audited Consolidated Financial Statements
|
|
F-1
To the Board of Directors and Stockholders of
EPAM Systems, Inc.
Newtown, PA
We have audited the accompanying consolidated balance sheets of EPAM Systems, Inc. and subsidiaries (the “Company”) as of December 31, 2013 and 2012, and the related consolidated statements of income and comprehensive income, changes in redeemable preferred stock and stockholders’ equity, and cash flows for each of the three years in the period ended December 31, 2013. These financial statements are the responsibility of the Company’s management. Our responsibility is to express an opinion on these financial statements based on our audits.
We conducted our audits in accordance with the standards of the Public Company Accounting Oversight Board (United States). Those standards require that we plan and perform the audit to obtain reasonable assurance about whether the financial statements are free of material misstatement. The Company is not required to have, nor were we engaged to perform, an audit of its internal control over financial reporting. Our audits included consideration of internal control over financial reporting as a basis for designing audit procedures that are appropriate in the circumstances, but not for the purpose of expressing an opinion on the effectiveness of the Company’s internal control over financial reporting. Accordingly, we express no such opinion. An audit also includes examining, on a test basis, evidence supporting the amounts and disclosures in the financial statements, assessing the accounting principles used and significant estimates made by management, as well as evaluating the overall financial statement presentation. We believe that our audits provide a reasonable basis for our opinion.
In our opinion, such consolidated financial statements present fairly, in all material respects, the financial position of EPAM Systems, Inc. and subsidiaries as of December 31, 2013 and 2012, and the results of their operations and their cash flows for each of the three years in the period ended December 31, 2013, in conformity with accounting principles generally accepted in the United States of America.
/s/ DELOITTE & TOUCHE LLP
Philadelphia, PA
March 10, 2014
F-2
CONSOLIDATED BALANCE SHEETS
(US Dollars in
thousands, except share and per share data)
|
|
As of
December 31, 2013
|
As of
December 31, 2012
|
||||||
|
Assets
|
|
|
||||||
|
Current assets
|
|
|
||||||
|
Cash and cash equivalents
|
$
|
169,207
|
$
|
118,112
|
||||
|
Accounts receivable, net of allowance of $1,800 and $2,203 respectively
|
95,431
|
78,906
|
||||||
|
Unbilled revenues
|
43,108
|
33,414
|
||||||
|
Prepaid and other current assets
|
14,355
|
11,835
|
||||||
|
Employee loans, net of allowance for loan losses of $0 and $0, respectively, current
|
1,989
|
429
|
||||||
|
Time deposits
|
1,188
|
1,006
|
||||||
|
Restricted cash, current
|
298
|
660
|
||||||
|
Deferred tax assets, current
|
5,392
|
6,593
|
||||||
|
Total current assets
|
330,968
|
250,955
|
||||||
|
Property and equipment, net
|
53,315
|
53,135
|
||||||
|
Restricted cash, long-term
|
225
|
467
|
||||||
|
Employee loans, net of allowance for loan losses of $0 and $0, respectively, long-term
|
4,401
|
— | ||||||
|
Intangible assets, net
|
13,734
|
16,834
|
||||||
|
Goodwill
|
22,268
|
22,698
|
||||||
|
Deferred tax assets, long-term
|
4,557
|
6,093
|
||||||
|
Other long-term assets
|
3,409
|
632
|
||||||
|
Total assets
|
$
|
432,877
|
$
|
350,814
|
||||
|
|
||||||||
|
Liabilities
|
||||||||
|
Current liabilities
|
||||||||
|
Accounts payable
|
$
|
2,835
|
$
|
6,095
|
||||
|
Accrued expenses and other liabilities
|
20,175
|
19,814
|
||||||
|
Deferred revenues, current
|
4,543
|
6,369
|
||||||
|
Due to employees
|
12,665
|
12,026
|
||||||
|
Taxes payable
|
14,171
|
14,557
|
||||||
|
Deferred tax liabilities, current
|
275
|
491
|
||||||
|
Total current liabilities
|
54,664
|
59,352
|
||||||
|
Deferred revenues, long-term
|
533
|
1,263
|
||||||
|
Taxes payable, long-term
|
1,228
|
1,228
|
||||||
|
Deferred tax liabilities, long-term
|
351
|
2,691
|
||||||
|
Total liabilities
|
56,776
|
64,534
|
||||||
|
Commitments and contingencies (See Note 16)
|
||||||||
|
|
||||||||
|
Stockholders’ equity
|
||||||||
|
Common stock, $0.001 par value; 160,000,000 authorized; 47,569,463 and 45,398,523 shares issued, 46,614,916 and 44,442,494 shares outstanding at December 31, 2013 and December 31, 2012, respectively
|
46
|
44
|
||||||
|
Additional paid-in capital
|
195,585
|
166,962
|
||||||
|
Retained earnings
|
190,986
|
128,992
|
||||||
|
Treasury stock
|
(8,684
|
)
|
(8,697
|
)
|
||||
|
Accumulated other comprehensive loss
|
(1,832
|
)
|
(1,021
|
)
|
||||
|
Total stockholders’ equity
|
376,101
|
286,280
|
||||||
|
Total liabilities and stockholders’ equity
|
$
|
432,877
|
$
|
350,814
|
||||
The accompanying notes are an integral part of the consolidated financial statements
F-3
CONSOLIDATED STATEMENTS OF INCOME AND COMPREHENSIVE INCOME
(US Dollars in
thousands, except share and per share data)
|
|
For the Years Ended December 31,
|
|||||||||||
|
|
2013
|
2012
|
2011
|
|||||||||
|
Revenues
|
$
|
555,117
|
$
|
433,799
|
$
|
334,528
|
||||||
|
Operating expenses:
|
||||||||||||
|
Cost of revenues (exclusive of depreciation and amortization)
|
347,650
|
270,361
|
205,336
|
|||||||||
|
Selling, general and administrative expenses
|
116,497
|
85,868
|
64,930
|
|||||||||
|
Depreciation and amortization expense
|
15,120
|
10,882
|
7,538
|
|||||||||
|
Goodwill impairment loss
|
—
|
—
|
1,697
|
|||||||||
|
Other operating (income)/ expenses, net
|
(643
|
)
|
682
|
19
|
||||||||
|
Income from operations
|
76,493
|
66,006
|
55,008
|
|||||||||
|
Interest and other income, net
|
3,077
|
1,941
|
1,422
|
|||||||||
|
Foreign exchange loss
|
(2,800
|
)
|
(2,084
|
)
|
(3,638
|
)
|
||||||
|
Income before provision for income taxes
|
76,770
|
65,863
|
52,792
|
|||||||||
|
Provision for income taxes
|
14,776
|
11,379
|
8,439
|
|||||||||
|
Net income
|
$
|
61,994
|
$
|
54,484
|
$
|
44,353
|
||||||
|
Cumulative translation adjustment
|
(811
|
)
|
2,493
|
(1,250
|
)
|
|||||||
|
Comprehensive income
|
$
|
61,183
|
$
|
56,977
|
$
|
43,103
|
||||||
|
Accretion of preferred stock
|
—
|
—
|
(17,563
|
)
|
||||||||
|
Net income allocated to participating securities
|
—
|
(3,341
|
)
|
(15,025
|
)
|
|||||||
|
Net income available for common stockholders
|
$
|
61,994
|
$
|
51,143
|
$
|
11,765
|
||||||
|
|
||||||||||||
|
Net income per share of common stock:
|
||||||||||||
|
Basic (common)
|
$
|
1.35
|
$
|
1.27
|
$
|
0.69
|
||||||
|
Basic (puttable common)
|
$
|
—
|
$
|
—
|
$
|
1.42
|
||||||
|
Diluted (common)
|
$
|
1.28
|
$
|
1.17
|
$
|
0.63
|
||||||
|
Diluted (puttable common)
|
$
|
—
|
$
|
—
|
$
|
0.77
|
||||||
|
Shares used in calculation of net income per share of common stock:
|
||||||||||||
|
Basic (common)
|
45,754
|
40,190
|
17,094
|
|||||||||
|
Basic (puttable common)
|
—
|
—
|
18
|
|||||||||
|
Diluted (common)
|
48,358
|
43,821
|
20,473
|
|||||||||
|
Diluted (puttable common)
|
—
|
—
|
18
|
|||||||||
The accompanying notes are an integral part of the consolidated financial statements
F-4
CONSOLIDATED STATEMENTS OF CHANGES IN
REDEEMABLE PREFERRED STOCK AND STOCKHOLDERS’ EQUITY
|
|
For the Years Ended December 31, 2013, 2012 and 2011
(US Dollars in thousands, except share data)
|
|||||||||||||||||||||||||||||||||||||||||||||||||||
|
|
Series A-1 and A-2, Convertible Redeemable Preferred Stock
|
Puttable Common
Stock
|
Common
Stock
|
Series A-3 Convertible
Preferred Stock
|
Additional Paid-in Capital
|
Retained
Earnings
|
Treasury
Stock
|
Accumulated Other Comprehensive Income
|
Total Stockholders’ Equity
|
|||||||||||||||||||||||||||||||||||||||||||
|
|
Shares |
Amount
|
Shares
|
Amount
|
Shares
|
Amount
|
Shares
|
Amount
|
|
|
|
|
|
|||||||||||||||||||||||||||||||||||||||
|
Balance, December 31, 2010
|
2,439,
739
|
$ |
68,377
|
56,896
|
$ |
332
|
17,054,408
|
$ |
17
|
290,277
|
$ |
—
|
$ |
36,750
|
$ |
47,718
|
$ |
(15,972
|
)
|
$ |
(2,264
|
)
|
$ |
66,249
|
||||||||||||||||||||||||||||
|
Accretion of A-2 preferred stock to redemption value
|
—
|
17,563
|
—
|
—
|
—
|
—
|
—
|
—
|
(17,563
|
)
|
—
|
—
|
(17,563
|
)
|
||||||||||||||||||||||||||||||||||||||
|
Stock-based compensation expense
|
— |
—
|
—
|
—
|
—
|
—
|
—
|
—
|
2,866
|
—
|
—
|
—
|
2,866
|
|||||||||||||||||||||||||||||||||||||||
|
Proceeds from stock options exercises
|
— |
—
|
—
|
—
|
47,600
|
—
|
—
|
—
|
72
|
—
|
—
|
—
|
72
|
|||||||||||||||||||||||||||||||||||||||
|
Put option expiry
|
— |
—
|
(56,896
|
)
|
(332
|
)
|
56,896
|
—
|
—
|
—
|
332
|
—
|
—
|
—
|
332
|
|||||||||||||||||||||||||||||||||||||
|
Currency translation adjustment
|
— |
—
|
—
|
—
|
—
|
—
|
—
|
—
|
—
|
—
|
—
|
(1,250
|
)
|
(1,250
|
)
|
|||||||||||||||||||||||||||||||||||||
|
Net income
|
— |
—
|
—
|
—
|
—
|
—
|
—
|
—
|
—
|
44,353
|
—
|
—
|
44,353
|
|||||||||||||||||||||||||||||||||||||||
|
Balance, December 31, 2011
|
2,439,739
|
|
85,940
|
—
|
|
—
|
17,158,904
|
|
17
|
290,277
|
|
—
|
|
40,020
|
|
74,508
|
|
(15,972
|
)
|
|
(3,514
|
)
|
|
95,059
|
||||||||||||||||||||||||||||
|
Conversion to common stock
|
(2,439,739 | ) |
(85,940
|
)
|
—
|
—
|
21,840,128
|
22
|
(290,277
|
)
|
—
|
85,918
|
—
|
—
|
—
|
85,940
|
||||||||||||||||||||||||||||||||||||
|
Initial public offering of common stock
|
— |
—
|
—
|
—
|
2,900,000
|
3
|
—
|
—
|
32,361
|
—
|
—
|
—
|
32,364
|
|||||||||||||||||||||||||||||||||||||||
|
Offering issuance costs
|
— |
—
|
—
|
—
|
—
|
—
|
—
|
—
|
(3,395
|
)
|
—
|
—
|
—
|
(3,395
|
)
|
|||||||||||||||||||||||||||||||||||||
|
Issuance of restricted stock
|
— |
—
|
—
|
—
|
213,656
|
—
|
—
|
—
|
—
|
—
|
—
|
—
|
—
|
|||||||||||||||||||||||||||||||||||||||
|
Stock issued in connection with acquisition of Instant Information
|
— |
—
|
—
|
—
|
53,336
|
—
|
—
|
—
|
640
|
—
|
—
|
—
|
640
|
|||||||||||||||||||||||||||||||||||||||
|
Stock issued in connection with acquisition of Thoughtcorp, Inc. (Note 2)
|
— |
—
|
—
|
—
|
434,546
|
—
|
—
|
—
|
(346
|
)
|
—
|
3,953
|
—
|
3,607
|
||||||||||||||||||||||||||||||||||||||
|
Stock issued in connection with acquisition of Empathy Lab, LLC (Note 2)
|
— |
—
|
—
|
—
|
326,344
|
—
|
—
|
—
|
(2,969
|
)
|
—
|
2,969
|
—
|
—
|
||||||||||||||||||||||||||||||||||||||
|
Stock-based compensation expense
|
— |
—
|
—
|
—
|
—
|
—
|
—
|
—
|
6,826
|
—
|
—
|
—
|
6,826
|
|||||||||||||||||||||||||||||||||||||||
|
Proceeds from stock options exercises
|
— |
—
|
—
|
—
|
1,515,580
|
2
|
—
|
—
|
4,963
|
—
|
—
|
—
|
4,965
|
|||||||||||||||||||||||||||||||||||||||
|
Treasury stock retirement
|
— |
—
|
—
|
—
|
—
|
—
|
—
|
—
|
(353
|
)
|
—
|
353
|
—
|
—
|
||||||||||||||||||||||||||||||||||||||
|
Excess tax benefits
|
— |
—
|
—
|
—
|
—
|
—
|
—
|
—
|
3,297
|
—
|
—
|
—
|
3,297
|
|||||||||||||||||||||||||||||||||||||||
|
Currency translation adjustment
|
— |
—
|
—
|
—
|
—
|
—
|
—
|
—
|
—
|
—
|
—
|
2,493
|
2,493
|
|||||||||||||||||||||||||||||||||||||||
|
Net income
|
— |
—
|
—
|
—
|
—
|
—
|
—
|
—
|
—
|
54,484
|
—
|
—
|
54,484
|
|||||||||||||||||||||||||||||||||||||||
|
Balance, December 31, 2012
|
— |
$
|
—
|
—
|
$
|
—
|
44,442,494
|
$
|
44
|
—
|
$
|
—
|
$
|
166,962
|
$
|
128,992
|
$
|
(8,697
|
)
|
$
|
(1,021
|
)
|
$
|
286,280
|
||||||||||||||||||||||||||||
F-5
EPAM SYSTEMS, INC. AND SUBSIDIARIES
CONSOLIDATED STATEMENTS OF CHANGES IN
REDEEMABLE PREFERRED STOCK AND STOCKHOLDERS’ EQUITY (CONT’D)
|
|
For the Years Ended December 31, 2013, 2012 and 2011
(US Dollars in thousands, except share data)
|
|||||||||||||||||||||||||||
|
|
Common Stock
|
Additional Paid-in Capital
|
Retained Earnings
|
Treasury Stock
|
Accumulated Other Comprehensive Income
|
Total Stockholders’
Equity
|
||||||||||||||||||||||
|
|
Shares
|
Amount
|
|
|
|
|
|
|||||||||||||||||||||
|
|
|
|||||||||||||||||||||||||||
|
Balance, December 31, 2012
|
44,442,494
|
$
|
44
|
$
|
166,962
|
$
|
128,992
|
$
|
(8,697
|
)
|
$
|
(1,021
|
)
|
$
|
286,280
|
|||||||||||||
|
Stock issued under the 2012 Non-Employee Directors Compensation Plan (Note 14)
|
14,041
|
—
|
—
|
—
|
—
|
—
|
—
|
|||||||||||||||||||||
|
Stock issued in connection with acquisition of Empathy Lab, LLC (Note 14)
|
1,483
|
—
|
(13
|
)
|
—
|
13
|
—
|
—
|
||||||||||||||||||||
|
Stock-based compensation expense
|
—
|
—
|
13,150
|
—
|
—
|
—
|
13,150
|
|||||||||||||||||||||
|
Proceeds from stock options exercises
|
2,156,898
|
2
|
9,285
|
—
|
—
|
—
|
9,287
|
|||||||||||||||||||||
|
Excess tax benefits
|
—
|
—
|
6,201
|
—
|
—
|
—
|
6,201
|
|||||||||||||||||||||
|
Currency translation adjustment
|
—
|
—
|
—
|
—
|
—
|
(811
|
)
|
(811
|
)
|
|||||||||||||||||||
|
Net income
|
—
|
—
|
—
|
61,994
|
—
|
—
|
61,994
|
|||||||||||||||||||||
|
Balance, December 31, 2013
|
46,614,916
|
$
|
46
|
$
|
195,585
|
$
|
190,986
|
$
|
(8,684
|
)
|
$
|
(1,832
|
)
|
$
|
376,101
|
|||||||||||||
(Concluded)
The accompanying notes are an integral part of the consolidated financial statements
F-6
CONSOLIDATED STATEMENTS OF CASH FLOWS
(US Dollars in thousands)
|
|
For the Years Ended December 31,
|
|||||||||||
|
|
2013
|
2012
|
2011
|
|||||||||
|
Cash flows from operating activities:
|
|
|
|
|||||||||
|
Net Income
|
$
|
61,994
|
$
|
54,484
|
$
|
44,353
|
||||||
|
Adjustments to reconcile net income to net cash provided by operating activities:
|
||||||||||||
|
Depreciation and amortization
|
15,120
|
10,882
|
7,538
|
|||||||||
|
Bad debt expense
|
335
|
662
|
727
|
|||||||||
|
Deferred taxes
|
41
|
(3,933
|
)
|
497
|
||||||||
|
Stock-based compensation expense
|
13,150
|
6,826
|
2,866
|
|||||||||
|
Excess tax benefits on stock-based compensation plans
|
(6,201
|
)
|
(3,297
|
)
|
—
|
|||||||
|
Non-cash stock charge
|
—
|
640
|
—
|
|||||||||
|
Goodwill impairment loss
|
—
|
—
|
1,697
|
|||||||||
|
Other
|
1,199
|
(66
|
)
|
777
|
||||||||
|
Change in operating assets and liabilities (net of effects of acquisitions):
|
||||||||||||
|
(Increase)/ decrease in operating assets:
|
||||||||||||
|
Accounts receivable
|
(17,302
|
)
|
(12,664
|
)
|
(19,030
|
)
|
||||||
|
Unbilled revenues
|
(9,833
|
)
|
(6,905
|
)
|
(1,004
|
)
|
||||||
|
Prepaid expenses and other assets
|
587
|
(1,339
|
)
|
(1,694
|
)
|
|||||||
|
Increase/ (decrease) in operating liabilities:
|
||||||||||||
|
Accounts payable
|
(2,900
|
)
|
1,407
|
254
|
||||||||
|
Accrued expenses and other liabilities
|
501
|
(5,825
|
)
|
9,474
|
||||||||
|
Deferred revenues
|
(2,325
|
)
|
(767
|
)
|
1,843
|
|||||||
|
Due to employees
|
785
|
2,896
|
2,796
|
|||||||||
|
Taxes payable
|
3,074
|
5,498
|
3,426
|
|||||||||
|
Net cash provided by operating activities
|
58,225
|
48,499
|
54,520
|
|||||||||
|
Cash flows from investing activities:
|
||||||||||||
|
Purchases of property and equipment
|
(13,360
|
)
|
(13,376
|
)
|
(15,548
|
)
|
||||||
|
Payments for construction of corporate facilities
|
(2,560
|
)
|
(13,701
|
)
|
(1,545
|
)
|
||||||
|
Issuance of employee housing loans
|
(7,982
|
)
|
—
|
—
|
||||||||
|
Proceeds from repayments of employee housing loans
|
2,189
|
—
|
—
|
|||||||||
|
Decrease/(increase) in restricted cash, net (Note 6)
|
429
|
470
|
(144
|
)
|
||||||||
|
Increase in other long-term assets, net
|
(516
|
)
|
(69
|
)
|
(171
|
)
|
||||||
|
Acquisition of businesses, net of cash acquired (Note 2)
|
(20
|
)
|
(32,951
|
)
|
—
|
|||||||
|
Net cash used in investing activities
|
(21,820
|
)
|
(59,627
|
)
|
(17,408
|
)
|
||||||
|
Cash flows from financing activities:
|
||||||||||||
|
Proceeds related to stock options exercises
|
9,300
|
4,951
|
72
|
|||||||||
|
Excess tax benefits on stock-based compensation plans
|
6,201
|
3,297
|
—
|
|||||||||
|
Net proceeds from issuance of common stock in initial public offering
|
—
|
32,364
|
—
|
|||||||||
|
Costs related to stock issue
|
—
|
(1,765
|
)
|
(1,630
|
)
|
|||||||
|
Proceeds related to line of credit
|
—
|
—
|
5,000
|
|||||||||
|
Repayment related to line of credit
|
—
|
—
|
(5,000
|
)
|
||||||||
|
Net cash provided by/ (used in) financing activities
|
15,501
|
38,847
|
(1,558
|
)
|
||||||||
|
Effect of exchange-rate changes on cash and cash equivalents
|
(811
|
)
|
1,597
|
(762
|
)
|
|||||||
|
Net increase in cash and cash equivalents
|
51,095
|
29,316
|
34,792
|
|||||||||
|
Cash and cash equivalents, beginning of year-January 1
|
118,112
|
88,796
|
54,004
|
|||||||||
|
Cash and cash equivalents, end of year
|
$
|
169,207
|
$
|
118,112
|
$
|
88,796
|
||||||
|
Supplemental disclosures of cash flow information:
|
||||||||||||
|
Cash paid during the year for:
|
||||||||||||
|
Income taxes
|
$
|
10,207
|
$
|
13,065
|
$
|
7,007
|
||||||
|
Bank interest
|
26
|
14
|
37
|
|||||||||
Summary of non-cash investing and financing transactions:
| • | Accretion of Series A-2 convertible redeemable preferred stock was $0 in 2013, $0 in 2012, and $17,563 in 2011. |
| • | Total incurred but not paid costs related to stock issue were $0 in 2013, $0 in 2012 and $470 in 2011. |
| • | Total incurred but not paid costs related to acquisition of businesses were $0 in 2013, and $96 in 2012 and $0 in 2011. |
The accompanying notes are an integral part of the consolidated financial statements.
F-7
NOTES TO CONSOLIDATED FINANCIAL STATEMENTS
AS OF DECEMBER 31, 2013 AND 2012
AND FOR THE YEARS ENDED DECEMBER 31, 2013, 2012 AND 2011
(US Dollars in thousands, except per share data)
| 1. | NATURE OF BUSINESS AND SIGNIFICANT ACCOUNTING POLICIES |
EPAM Systems, Inc. (the “Company” or “EPAM”) is a leading provider of complex software engineering solutions and a leader in Central and Eastern European IT services delivery. The Company provides these solutions primarily to Fortune Global 2000 companies in multiple verticals, including Independent Software Vendors (“ISVs”) and Technology, Banking and Financial services, Business Information and Media, and Travel and Consumer.
Since EPAM’s inception in 1993, the Company has focused on providing software product development services, software engineering and vertically-oriented custom development solutions through its global delivery model. This has served as a foundation for the Company’s other solutions, including custom application development, application testing, platform-based solutions, application maintenance and support, and infrastructure management.
The Company is incorporated in Delaware with headquarters in Newtown, PA, with multiple delivery centers located in Belarus, Ukraine, Russia, Hungary, Kazakhstan and Poland, and client management locations in the United States, Canada, the United Kingdom, Germany, Sweden, Switzerland, Netherlands, Russia, Kazakhstan, Singapore, Hong Kong and Australia.
Emerging growth company status
— In April 2012, several weeks after EPAM’s initial public offering in February 2012, President Obama signed into law the Jumpstart Our Business Startups Act of 2012 (the “JOBS Act”). The JOBS Act contains provisions that relax certain requirements for “emerging growth companies” that otherwise apply to larger public companies. For as long as a company retains emerging growth company status, which may be until the fiscal year-end after the fifth anniversary of its initial public offering, it will not be required to (1) provide an auditor’s attestation report on its management’s assessment of the effectiveness of its internal control over financial reporting, otherwise required by Section 404(b) of the Sarbanes-Oxley Act of 2002, (2) comply with any new or revised financial accounting standard applicable to public companies until such standard is also applicable to private companies, (3) comply with certain new requirements adopted by the Public Company Accounting Oversight Board, (4) provide certain disclosure regarding executive compensation required of larger public companies or (5) hold shareholder advisory votes on matters relating to executive compensation.
EPAM is classified as an emerging growth company under the JOBS Act and is eligible to take advantage of the accommodations described above for as long as it retains this status. However, EPAM has elected not to take advantage of the transition period described in (2) above, which is the exemption provided in Section 7(a)(2)(B) of the Securities Act of 1933 and Section 13(a) of the Securities Exchange Act of 1934 (in each case as amended by the JOBS Act) for complying with new or revised financial accounting standards. EPAM will therefore comply with new or revised financial accounting standards to the same extent that a non-emerging growth company is required to comply with such standards.
Principles of Consolidation
— The consolidated financial statements include the financial statements of EPAM Systems, Inc. and its subsidiaries. All intercompany balances and transactions have been eliminated.
Reclassifications
— The Company reclassified certain prior period amounts to conform to the current period presentation. Such reclassifications had no effect on the Company’s results of operations or total stockholders’ equity.
Use of Estimates
— The preparation of financial statements in conformity with accounting principles generally accepted in the United States requires management to make estimates and assumptions. These estimates and assumptions affect reported amounts of assets and liabilities and the disclosure of contingent assets and liabilities at the date of the consolidated financial statements, as well as revenues and expenses during the reporting period. The Company bases its estimates and judgments on historical experience, knowledge of current conditions and its beliefs of what could occur in the future, given available information. Actual results could differ from those estimates, and such differences may be material to the financial statements.
Business Combinations
— The Company allocates the total cost of an acquisition to the underlying net assets based on their respective estimated fair values. As part of this allocation process, the Company identifies and attributes values and estimated lives to the intangible assets acquired. These determinations involve significant estimates and assumptions about several highly subjective variables, including future cash flows, discount rates, and asset lives. There are also different valuation models for each component, the selection of which requires considerable judgment. These determinations will affect the amount of amortization expense recognized in future periods. The Company bases its fair value estimates on assumptions it believes are reasonable, but recognizes that the assumptions are inherently uncertain. Depending on the size of the purchase price of a particular acquisition and the mix of
F-8
intangible assets acquired, the purchase price allocation could be materially impacted by applying a different set of assumptions and estimates.
Revenue Recognition
— The Company recognizes revenue when realized or realizable and earned, which is when the following criteria are met: persuasive evidence of an arrangement exists; delivery has occurred; the sales price is fixed or determinable; and collectability is reasonably assured. Determining whether and when some of these criteria have been satisfied often involves assumptions and judgments that can have a significant impact on the timing and amount of revenue the Company reports. If there is an uncertainty about the project completion or receipt of payment for the consulting services, revenues are deferred until the uncertainty is sufficiently resolved. At the time revenues are recognized, the Company provides for any contractual deductions and reduces revenues accordingly. The Company defers amounts billed to its clients for revenues not yet earned. Such amounts are anticipated to be recorded as revenues as services are performed in subsequent periods. Unbilled revenues represent services provided which are billed subsequent to the period end in accordance with the contract terms.
The Company derives its revenues from a variety of service offerings which represent specific competencies of its IT professionals. Contracts for these services have different terms and conditions based on the scope, deliverables, and complexity of the engagement which require management to make judgments and estimates in determining appropriate revenue recognition pattern. Fees for these contracts may be in the form of time-and-materials or fixed-price arrangements.
The majority of the Company’s revenues (82.3% of revenues in 2013, 84.1% in 2012 and 86.1% in 2011) is generated under time-and-material contracts whereby revenues are recognized as services are performed with the corresponding cost of providing those services reflected as cost of revenues when incurred. The majority of such revenues are billed on an hourly, daily or monthly basis whereby actual time is charged directly to the client.
Revenues from fixed-price contracts (15.7% of revenues in 2013, 13.7% in 2012 and 11.0% in 2011) are determined using the proportional performance method. In instances where final acceptance of the product, system, or solution is specified by the client, revenues are deferred until all acceptance criteria have been met. In absence of a sufficient basis to measure progress towards completion, revenue is recognized upon receipt of final acceptance from the client. In order to estimate the amount of revenue for the period under the proportional performance method, the Company determines the percentage of actual labor hours incurred as compared to estimated total labor hours and applies that percentage to the consideration allocated to the deliverable. The complexity of the estimation process and factors relating to the assumptions, risks and uncertainties inherent with the application of the proportional performance method of accounting affects the amounts of revenues and related expenses reported in the Company’s consolidated financial statements. A number of internal and external factors can affect such estimates, including labor hours and specification and testing requirement changes. The cumulative impact of any revision in estimates is reflected in the financial reporting period in which the change in estimate becomes known. No significant revisions occurred in each of the three years ended December 31, 2013, 2012 and 2011. The Company’s fixed price contracts are generally recognized over a period of 12 months or less.
From time to time, the Company enters into multiple element arrangements with its customers. In vast majority of cases such multiple-element arrangements represent fixed-priced arrangements to develop a customized IT solution to meet the customer’s needs combined with warranty support over a specified period of time in the future, to which the Company refers to as the “warranty period.” The Company’s customers retain full intellectual property (IP) rights to the results of the Company’s services, and the software element created in lieu of such services is no more than incidental to any of the service deliverables, as defined in accordance with ASC 985-605-15-13. For such arrangements, the Company follows the guidance set forth in ASC 605-25, Revenue Recognition – Multiple Element Arrangements, as to whether multiple deliverables exist, how the arrangement should be separated, and how the consideration should be allocated. The Company recognizes revenue related to the delivered products only if all revenue recognition criteria are met and the delivered element has a standalone value to the customer and allocates total consideration among the deliverables based on their relative selling prices. Revenue related to the software development services is recognized under the proportional performance method, as described above, while warranty support services are recognized on a straight-line basis over the warranty period. The warranty period is generally three months to two years.
The Company reports gross reimbursable “out-of-pocket” expenses incurred as both revenues and cost of revenues in the consolidated statements of income.
Cost of Revenues (Exclusive of Depreciation and Amortization)
— Consists principally of salaries, employee benefits and stock compensation expense, reimbursable and non-reimbursable travel costs and subcontractor fees.
Selling, General and Administrative Expenses
— Consist of expenses associated with promoting and selling the Company’s services and include such items as sales and marketing personnel salaries, stock compensation expense and related fringe benefits, commissions, travel, and the cost of advertising and other promotional activities. General and administrative expenses include other operating items such as officers’ and administrative personnel salaries, marketing personnel salaries, stock compensation expense and related fringe benefits, legal and audit expenses, insurance, provision for doubtful accounts, and operating lease expenses.
F-9
Fair Value of Financial Instruments
— The Company makes significant assumptions about fair values of its financial instruments. Fair value is determined based on the assumptions that market participants would use in pricing the asset or liability. The Company utilizes the following fair value hierarchy in determining fair values:
Level 1 — Quoted prices for identical assets or liabilities in active markets.
Level 2 — Inputs other than quoted prices within Level 1 that are observable either directly or indirectly, including quoted prices in markets that are not active, quoted prices in active markets for similar assets or liabilities, and observable inputs other than quoted prices such as interest rates or yield curves.
Level 3 — Unobservable inputs reflecting our view about the assumptions that market participants would use in pricing the asset or liability.
Where the fair values of financial assets and liabilities recorded in the consolidated balance sheet cannot be derived from an active market, they are determined using a variety of valuation techniques. These valuation techniques include a net present value technique, comparison to similar instruments with market observable inputs, options pricing models and other relevant valuation models. Inputs into these models are taken from observable market data whenever possible, but in instances where it is not feasible, a degree of judgment is required to establish fair values. The Company had no assets or liabilities measured at fair value on a recurring basis as of December 31, 2013 or 2012.
The Company's financial assets and liabilities, with the exceptions of employee loans described further herein, are all short term in nature; therefore, the carrying value of these items approximates their fair value.
Employee Housing Loans
— The Company issues loans to its employees under the Employee Housing Program (“housing loans”). Housing loans are issued in U.S. Dollars with a 5-year term and carry an interest rate of 7.5%. The program was designed to be a retention mechanism for the Company’s employees in Belarus.
Although permitted by authoritative guidance, the Company did not elect a fair value option for these financial instruments. These housing loans are measured at fair value upon initial recognition and subsequently carried at amortized cost less allowance for loan losses. Any difference between the carrying value and the fair value of a loan upon initial recognition (“day-one” recognition) is charged to expense.
The housing loans were classified as Level 3 measurements within the fair value hierarchy because they were valued using significant unobservable inputs. The estimated fair value of these housing loans upon initial recognition was computed by projecting the future contractual cash flows to be received from the loans and discounting those projected net cash flows to a present value, which is the estimated fair value (the “Income Approach”). In applying the Income Approach, the Company analyzed similar loans offered by third-party financial institutions in Belarusian Rubles (“BYR”) and adjusted the interest rates charged on such loans to exclude the effects of underlying economic factors, such as inflation and currency devaluation. The Company also assessed the probability of future defaults and associated cash flows impact. In addition, the Company separately analyzed the rate of return that market participants in Belarus would require when investing in unsecured USD-denominated government bonds with similar maturities (a “risk-free rate”) and evaluated a risk premium component to compensate the market participants for the credit and liquidity risks inherent in the loans’ cash flows, as described in the following paragraph. As a result of the analysis performed, the Company determined the carrying values of the housing loans issued during the year ended December 31, 2013 approximated their fair values upon initial recognition. The Company also estimated the fair values of the housing loans that were outstanding as of December 31, 2013 using the inputs noted above and determined their fair values approximated the carrying values as of that date.
Repayment of housing loans is primarily dependent on personal income of borrowers obtained through employment with the Company, which income is set in U.S. dollars and is not closely correlated with common macroeconomic risks existing in Belarus, such as inflation, local currency devaluation and decrease in the purchasing power of the borrowers’ income. Given a large demand for the program among the Company’s employees and its advantages as compared to alternative methods of financing available on the market, the Company expects the borrowers to fulfill their obligations, and the Company estimates the probability of voluntary termination of employment among the borrowers as de minimis. Additionally, housing loans are capped at $50 per loan and secured by real estate financed through the program. The Company establishes a maximum loan-to-value ratio of 70% and expects a decrease in the ratio over the life of a housing loan due to on-going payments by employees.
Employee loans, other
— The Company also issues short-term non-interest bearing relocation loans and other employee loans. These loans are considered Level 3 measurements. The Company’s Level 3, unobservable inputs reflect its assumptions about the factors that market participants use in pricing similar receivables, and are based on the best information available in the circumstances. Due to the short-term nature of employee loans (i.e., the relatively short time between the origination of the instrument and its expected realization), the carrying amount is a reasonable estimate of fair value. As of December 31, 2013, the carrying values of these employee loans approximated their fair values.
F-10
Cash and Cash Equivalents
— Cash equivalents are short-term, highly liquid investments that are readily convertible into cash, with maturities of three months or less at the date acquired. As of December 31, 2013 and 2012 all amounts were in cash.
Restricted Cash
— Restricted cash represents cash that is restricted by agreements with third parties for special purposes (see Note 6).
Accounts Receivable
— Accounts receivable are recorded at net realizable value. The Company maintains an allowance for doubtful accounts for estimated losses resulting from the inability of its clients to make required payments. The allowance for doubtful accounts is determined by evaluating the relative creditworthiness of each client, historical collections experience and other information, including the aging of the receivables.
Recoveries of losses from accounts receivable written off in prior years are presented within income from operations on the Company’s consolidated statements of income. There were no collections in respect of prior year write-offs during the years ended December 31, 2013, 2012 or 2011.
The table below summarizes movements in qualifying accounts for the years ended December 31, 2013, 2012 and 2011:
|
|
Balance at
Beginning of
Period
|
Charged to Costs
and Expenses
|
Deductions/
Other
|
Balance at End
of Year
|
||||||||||||
|
Allowance for Doubtful Accounts (Billed and Unbilled):
|
|
|
|
|
||||||||||||
|
Fiscal Year 2011
|
$
|
1,671
|
$
|
1,234
|
$
|
(655
|
)
|
$
|
2,250
|
|||||||
|
Fiscal Year 2012
|
2,250
|
1,244
|
(1,291
|
)
|
2,203
|
|||||||||||
|
Fiscal Year 2013
|
2,203
|
619
|
(1,022
|
)
|
1,800
|
|||||||||||
Employee Loans
— Loans are initially recorded at their fair value, and subsequently measured at their amortized cost, less allowance for loan losses, if any. The Company intends to hold all employee loans until their maturity. Interest income is reported using the effective interest method. Where applicable, loan origination fees, net of direct origination costs, are deferred and recognized in interest income over the life of the loan.
Generally, loans are placed on non-accrual status at 90 days past due. The entire balance of a loan is considered delinquent if the minimum payment contractually required to be made is not received by the specified due date. All interest accrued but not collected for loans that are placed on non-accrual is reversed against interest income. Subsequent payments on non-accrual loans are recorded as a reduction of principal, and interest income is recorded only after principal recovery is reasonably assured. Non-accrual loans are returned to accrual status when, in the opinion of management, the financial position of the borrower indicates there is no longer any reasonable doubt as to the timely collection of interest or principal. Interest income on loans individually classified as impaired is recognized on a cash basis after all past due and current principal payments have been made.
Allowance for Loan Losses
—
The Company periodically evaluates loans that exhibit probable or observed credit weaknesses are subject to individual review. Where appropriate, amounts of allowances are allocated to individual loans based on management’s estimate of the borrower’s ability to repay the loan given the availability of collateral, other sources of cash flow and legal options available to the Company. The allowance for loan losses is established when losses are deemed to have occurred through a provision for loan losses charged to income and represents management’s estimate of probable credit losses inherent in the loan portfolio. Write-offs of unrecoverable loans are charged against the allowance when management believes the uncollectability of a loan balance and any interest due thereon is confirmed. Subsequent recoveries, if any, are credited to the provision for bad debts.
F-11
Property and Equipment
— Property and equipment acquired in the ordinary course of the Company’s operations are stated at cost, net of accumulated depreciation. Depreciation is calculated on the straight-line basis over the estimated useful lives of the assets generally ranging from 3 to 50 years. Leasehold improvements are amortized on a straight-line basis over the shorter of the term of the lease or the estimated useful life of the improvement. Maintenance and repairs are expensed as incurred, while renewals and betterments are capitalized.
Goodwill and Other Intangible Assets
— The Company accounts for its business combinations using the acquisition accounting method, which requires it to determine the fair value of net assets acquired and the related goodwill and other intangible assets. Determining the fair value of assets acquired and liabilities assumed requires management’s judgment and involves the use of significant estimates, including projections of future cash inflows and outflows, discount rates, asset lives and market multiples. The Company’s acquisitions usually do not have significant amounts of tangible assets, as the principal assets it typically acquires are customer relationships, trade names, non-competition agreements, and workforce. As a result, a substantial portion of the purchase price is allocated to goodwill and other intangible assets.
Goodwill and intangible assets that have indefinite useful lives are not amortized but are tested annually for impairment. Events or circumstances that might require impairment testing of goodwill and other intangible assets include the loss of a significant client, the identification of other impaired assets within a reporting unit, loss of key personnel, the disposition of a significant portion of a reporting unit, significant decline in stock price or a significant adverse change in business climate or regulations. Intangible assets that have finite useful lives are amortized over their estimated useful lives on a straight-line basis.
As of December 31, 2013 and 2012, all of the Company’s intangible assets had finite lives and the Company did not incur any impairment losses in respect of its intangible assets during the years ended December 31, 2013, 2012 or 2011.
Effective in the fourth quarter of 2013, the Company changed the annual goodwill impairment assessment date for all of its reporting units from December 31
st
to October 31
st
, which represented a voluntary change in the annual goodwill impairment testing date. The Company is also required to assess the goodwill of its reporting units for impairment between annual assessment dates when events or circumstances dictate. This change does not delay, accelerate or avoid an impairment charge and is preferable as additional resources for the preparation, review, and conclusion of the annual goodwill impairment test are available at this time. Further, this timing more closely aligns with the Company’s annual budgeting and planning process. Information prepared during the annual budgeting and planning process is used extensively in the Company’s impairment assessment. The Company evaluates the recoverability of goodwill at a reporting unit level and it had three reporting units that were subject to the annual impairment testing in 2013. The Company’s annual impairment review as of October 31, 2013 and December 31, 2012 did not result in an impairment charge for any of these reporting units. It was impracticable to apply this change retrospectively, as the Company is unable to objectively determine significant estimates and assumptions that would have been used in those earlier periods without the use of hindsight.
For the Company’s annual impairment test, it compares the respective fair value of its reporting units to their respective carrying values in order to determine if impairment is indicated. If so, the implied fair value of the reporting unit’s goodwill is compared to its carrying amount, and the impairment loss is measured by the excess of the carrying value over fair value. The fair values are estimated using a combination of the income approach, which incorporates the use of the discounted cash flow method, and the market approach, which incorporates the use of earnings multiples based on market data. These valuations are considered Level 3 measurements under FASB ASC Topic 820. The Company utilizes estimates to determine the fair value of the reporting units such as future cash flows, growth rates, capital requirements, effective tax rates and projected margins, among other factors. Estimates utilized in the future evaluations of goodwill for impairment could differ from estimates used in the current period calculations.
When facts and circumstances indicate potential impairment of amortizable intangible assets, the Company evaluates the recoverability of the asset’s carrying value, using estimates of undiscounted future cash flows that utilize a discount rate determined by its management to be commensurate with the risk inherent in the Company’s business model over the remaining asset life. The estimates of future cash flows attributable to intangible assets require significant judgment based on the Company’s historical and anticipated results. Any impairment loss is measured by the excess of carrying value over fair value.
Impairment of Long-Lived Assets
— Long-lived assets, such as property and equipment are reviewed for impairment whenever events or changes in circumstances indicate that the carrying amount of an asset may not be recoverable. The assessment for potential impairment is based primarily on the Company’s ability to recover the carrying value of its long-lived assets from expected future cash flows from its operations on an undiscounted basis at each reporting date. If such assets are determined to be impaired, the impairment recognized is the amount by which the carrying value of the assets exceeds the fair value of the assets. Property and equipment to be disposed of by sale is carried at the lower of the then current carrying value or fair value less estimated costs to sell. The Company did not incur any impairment of long-lived assets for 2013, 2012, or 2011.
Income Taxes
— The provision for income taxes includes federal, state, local and foreign taxes. Deferred tax assets and liabilities are recognized for the estimated future tax consequences of temporary differences between the financial statement carrying amounts and their respective tax bases. Deferred tax assets and liabilities are measured using enacted tax rates expected to apply to
F-12
taxable income in the year in which the temporary differences are expected to be reversed. Changes to enacted tax rates would result in either increases or decreases in the provision for income taxes in the period of changes. The Company evaluates the realizability of deferred tax assets and recognizes a valuation allowance when it is more likely than not that all, or a portion of, deferred tax assets will not be realized.
The realization of deferred tax assets is primarily dependent on future earnings. Any reduction in estimated forecasted results may require that we record valuation allowances against deferred tax assets. Once a valuation allowance has been established, it will be maintained until there is sufficient positive evidence to conclude that it is more likely than not that the deferred tax assets will be realized. A pattern of sustained profitability will generally be considered as sufficient positive evidence to reverse a valuation allowance. If the allowance is reversed in a future period, the income tax provision will be correspondingly reduced. Accordingly, the increase and decrease of valuation allowances could have a significant negative or positive impact on future earnings. See
Note
10
to
the consolidated financial statements for further information.
Changes in tax laws and rates may affect recorded deferred tax assets and liabilities and our effective tax rate in the future. The American Taxpayer Relief Act of 2012 (the “Act”) was signed into law on January 2, 2013. Because a change in tax law is accounted for in the period of enactment, certain provisions of the Act benefiting the Company’s 2012 U.S. federal taxes, including the Subpart F controlled foreign corporation look-through exception were not recognized in the Company’s 2012 financial results and instead were reflected in the Company’s 2013 financial results.
Earnings per Share (“EPS”) —
Basic EPS is computed by dividing the net income applicable to common stockholders for the period by the weighted average number of shares of common stock outstanding during the same period. The Company’s Series A-1 Preferred, Series A-2 Preferred, and Series A-3 Preferred Stock, that had been outstanding and convertible into common stock until February 13, 2012 (the date of the Company’s initial public offering), and our puttable common stock were considered participating securities since these securities had non-forfeitable rights to dividends or dividend equivalents during the contractual period and thus required the two-class method of computing EPS. When calculating diluted EPS, the numerator is computed by adding back the undistributed earnings allocated to the participating securities in arriving at the basic EPS and then reallocating such undistributed earnings among our common stock, participating securities and the potential common shares that result from the assumed exercise of all dilutive options. The denominator is increased to include the number of additional common shares that would have been outstanding had the options been issued.
Accounting for Stock-Based Employee Compensation Plans
— Stock-based compensation expense for awards of equity instruments to employees and non-employee directors is determined based on the grant-date fair value of the awards ultimately expected to vest. The Company recognizes these compensation costs on a straight-line basis over the requisite service period of the award, which is generally the option vesting term of four years (See Note14.)
The Company estimates forfeitures at the time of grant and revises its estimates, if necessary, in subsequent periods if actual forfeitures or vesting differ from those estimates. Such revisions could have a material effect on the Company’s operating results. The assumptions used in the valuation model are based on subjective future expectations combined with management judgment. If any of the assumptions used in the valuation model changes significantly, stock-based compensation for future awards may differ materially compared to the awards previously granted.
Off-Balance Sheet Financial Instruments
— Off-balance sheet financial instruments include credit instruments, such as commitments to make employee loans and related guarantees, standby letters of credit and guarantees issued under customer contracts. The face amount for these items represents the exposure to loss, before considering available collateral or the borrower’s ability to repay. Such financial instruments are recorded when they are funded. Loss contingencies arising from off-balance sheet credit exposures are recorded as liabilities when the likelihood of loss is probable and an amount or range of loss can be reasonably estimated. The Company does not believe there are such matters that will have a material effect on the consolidated financial statements.
Foreign Currency Translation
— Assets and liabilities of consolidated foreign subsidiaries, whose functional currency is the local currency, are translated to U.S. dollars at period end exchange rates. Revenues and expenses are translated to U.S. dollars at daily exchange rates. The adjustment resulting from translating the financial statements of such foreign subsidiaries to U.S. dollars is reflected as a cumulative translation adjustment and reported as a component of accumulated other comprehensive income.
The Company reports the effect of exchange rate changes on cash balances held in foreign currencies as a separate item in the reconciliation of the changes in cash and cash equivalents during the period. Transaction gains and losses are included in the period in which they occur.
Risks and Uncertainties
— Principally all of the Company’s IT delivery centers and a majority of its employees is located in Central and Eastern Europe. As a result, the Company may be subject to certain risks associated with international operations, risks associated with the application and imposition of protective legislation and regulations relating to import and export, or otherwise resulting from foreign policy or the variability of foreign economic or political conditions. Additional risks associated with
F-13
international operations include difficulties in enforcing intellectual property rights, the burdens of complying with a wide variety of foreign laws, potential geopolitical and other risks associated with potentially adverse tax consequences, tariffs, quotas and other barriers.
Concentration of Credit
— Financial instruments that potentially subject us to significant concentrations of credit risk consist primarily of employee loans, cash and cash equivalents, trade accounts receivable and unbilled revenues.
At December 31, 2013, loans issued to employees were $6,390, or 1.5%, of our total assets. These loans expose the Company to a risk of non-payment and loss. Repayment of these loans is primarily dependent on personal income of borrowers obtained through their employment with EPAM and may be adversely affected by changes in macroeconomic situations, such as higher unemployment levels, currency devaluation and inflation. Additionally, continuing financial stability of a borrower may be adversely affected by job loss, divorce, illness or personal bankruptcy. The Company also faces the risk that the collateral will be insufficient to compensate it for loan losses, if any, and costs of foreclosure. Decreases in real estate values could adversely affect the value of property used as collateral, and the Company may be unsuccessful in recovering the remaining balance from either the borrower and/or guarantors.
The Company maintains its cash with financial institutions. As of December 31, 2013, $103.1 million of total cash was held in CIS countries, with $73.9 million of that in Belarus. Banking and other financial systems in the CIS are less developed and regulated than in some more developed markets, and legislation relating to banks and bank accounts is subject to varying interpretations and inconsistent application. Banks in the CIS generally do not meet the banking standards of more developed markets, and the transparency of the banking sector lags behind international standards. Furthermore, bank deposits made by corporate entities in CIS are not insured. As a result, the banking sector remains subject to periodic instability. Another banking crisis, or the bankruptcy or insolvency of banks through which the Company receives or with which it holds funds, particularly in Belarus, may result in the loss of its deposits or adversely affect its ability to complete banking transactions in the CIS, which could materially adversely affect the Company’s business and financial condition.
Trade accounts receivable and unbilled revenues are generally dispersed across EPAM’s customers in proportion to their revenues. During the years ended December 31, 2013, 2012 and 2011, revenues from top five customers were $169,987, $ 134,484, and $107,171, respectively, representing 30.6%, 31.0% and 32.0%, respectively, of total revenues in the corresponding periods. Revenues from the Company’s top ten customers were $234,955, $192,426 and $149,094 in 2013, 2012 and 2011, respectively, representing 42.3%, 44.4%, and 44.6%, respectively, of total revenues in corresponding periods. No customer accounted for over 10% of total revenues in 2013 or 2012. As of December 31, 2013, unbilled revenues from two customers individually exceeded 10% of total unbilled revenues and jointly accounted for 33.3% of total unbilled revenues as of that date; and one customer accounted for over 10% of total accounts receivable as of that date.
During the years ended December 31, 2013, 2012 and 2011 the Company incurred subcontractor costs of $2,078, $3,535 and $4,545, respectively, to a vendor for staffing, consulting, training, recruiting and other logistical / support services provided for the Company’s delivery and development operations in Eastern Europe. Such costs are included in cost of revenues and sales, general and administrative expenses, as appropriate, in the accompanying consolidated statements of income and comprehensive income.
Foreign currency risk
— The Company generates revenues in various global markets based on client contracts obtained in non-U.S. dollar currencies, principally, Euros, British pounds and Russian Rubles. The Company incurs expenditures in non-U.S. dollar currencies, principally in Hungarian Forints, Euros, and Russian Rubles associated with the IT delivery centers located in CEE. The Company is exposed to fluctuations in foreign currency exchange rates primarily on accounts receivable and unbilled revenues from sales in these foreign currencies, and cash flows for expenditures in foreign currencies. The Company does not use derivative financial instruments to hedge the risk of foreign exchange volatility.
Interest rate risk
— The Company’s exposure to market risk for changes in interest rates relates primarily to the Company’s cash and cash equivalents and the LIBOR plus 1.25% rate long-term credit facility (see Note 12). The Company does not use derivative financial instruments to hedge the risk of interest rate volatility.
Recent Accounting Pronouncements
— In January 2013, the FASB issued Accounting Standards Update (“ASU”) 2013-01, “Clarifying the Scope of Disclosures about Offsetting Assets and Liabilities.” The ASU clarifies that ordinary trade receivables and receivables are not in the scope of ASU 2012-11, “Disclosures about Offsetting Assets and Liabilities.” ASU 2012-11 applies only to derivatives, repurchase agreements and reverse purchase agreements, and securities borrowing and securities lending transactions that are either offset in accordance with specific criteria contained in the Codification or subject to a master netting arrangement or similar agreement. The ASU is effective for fiscal years beginning on or after January 1, 2013, and interim periods within those annual periods and requires retrospective application for all comparative periods presented. The Company adopted the ASU effective January 1, 2013. The adoption of this standard did not have any effect on the Company’s financial condition, results of operations and cash flows.
F-14
In February 2013, the FASB issued ASU 2013-02, “Reporting of Amounts Reclassified Out of Accumulated Other Comprehensive Income,” which adds new disclosure requirements for items reclassified out of accumulated other comprehensive income (“AOCI”.) The ASU is intended to help entities improve the transparency of changes in other comprehensive income (OCI) and items reclassified out of AOCI in their financial statements. It does not amend any existing requirements for reporting net income or OCI in the financial statements. New disclosure requirements are effective for fiscal periods beginning after December 15, 2012 and are applied prospectively. The Company adopted the ASU effective January 1, 2013. The adoption of this standard did not have any effect on the Company’s financial reporting because the only item that had historically affected AOCI and therefore included in cumulative AOCI was currency translation adjustments.
In March 2013, the FASB issued ASU 2013-05, “Parent’s Accounting for the Cumulative Translation Adjustment upon Derecognition of Certain Subsidiaries or Groups of Assets within a Foreign Entity or of an Investment in a Foreign Entity.” ASU 2013-05 updates accounting guidance related to the application of consolidation guidance and foreign currency matters. This guidance resolves the diversity in practice about what guidance applies to the release of the cumulative translation adjustment into net income. This guidance is effective for interim and annual periods beginning after December 15, 2013. The Company does not expect the adoption of this pronouncement to have a material effect on its financial condition, results of operations and cash flows.
In July 2013, the FASB issued ASU 2013-11, “Presentation of an Unrecognized Tax Benefit When a Net Operating Loss Carryforward, a Similar Tax Loss, or a Tax Credit Carryforward Exists.” ASU 2013-11 is a new accounting standard on the financial statement presentation of unrecognized tax benefits. The new standard provides that a liability related to an unrecognized tax benefit would be presented as a reduction of a deferred tax asset for a net operating loss carryforward, a similar tax loss or a tax credit carryforward if such settlement is required or expected in the event the uncertain tax position is disallowed. The new standard becomes effective for the periods commencing January 1, 2014, and it should be applied prospectively to unrecognized tax benefits that exist at the effective date with retrospective application permitted. The Company is currently assessing the impacts of this new standard on its financial conditions, results of operating and cash flows.
| 2. | ACQUISITIONS |
Empathy Lab, LLC —
On December 18, 2012, the Company completed its acquisition of substantially all of the assets and assumed certain liabilities of Empathy Lab, LLC (“Empathy Lab”), a U.S.-based digital strategy and multi-channel experience design firm. The acquisition has enhanced the Company’s strong capabilities in global delivery of software engineering services with the proven expertise in two important growth areas-development and execution of enterprise-wide eCommerce initiatives and transformation of media consumption and distribution channels. In addition to strengthening our Travel and Consumer and Business Information and Media verticals, Empathy Lab brings significant expertise in digital marketing strategy consulting and program management.
The total preliminary purchase price of $27,257 was allocated to net tangible and intangible assets based on their estimated fair values as of December 18, 2012. During the second quarter of 2013, the Company finalized the fair values of the assets acquired and liabilities assumed. As a result, total consideration transferred was set at $27,172, as presented in the following table. The purchase price was paid in cash, of which approximately 10% was placed in escrow for a period of 18 months as a security for the indemnification obligations of the sellers under the asset purchase agreement.
The purchase price was allocated to the assets acquired based on their related fair values, as follows:
|
|
Amount
|
|||
|
Cash and cash equivalents
|
$
|
1,191
|
||
|
Trade receivables and other current assets
|
5,983
|
|||
|
Property and equipment
|
186
|
|||
|
Deferred tax asset
|
30
|
|||
|
Acquired intangible assets
|
11,200
|
|||
|
Goodwill
|
11,359
|
|||
|
Total assets acquired
|
29,949
|
|||
|
Accounts payable and accrued expenses
|
1,113
|
|||
|
Deferred revenue and other liabilities
|
1,664
|
|||
|
Total liabilities assumed
|
2,777
|
|||
|
Net assets acquired
|
$
|
27,172
|
||
In addition, the Company issued to the sellers a total of 327,827 shares of non-vested (“restricted”) common stock contingent on their continued employment with the Company (Note 14), including 1,483 shares issued on July 11, 2013, to settle the difference between the initial number of shares issued upon acquisition and the total number of shares due in connection with this transaction. Of these shares, 65,500 shares were placed in escrow for a period of 18 months as a security for the indemnification obligations of the sellers under the asset purchase agreement. The restricted stock had an estimated value of $6,797 at the time of grant and will be
F-15
recorded as a stock-based compensation expense over an associated service period of three years.
The Company also agreed to issue stock options to certain employees acquired through the Empathy Lab acquisition. The stock options were issued in the amount by which the acquiree’s revenue exceeded the target revenue for the first half of 2013, as defined by the purchase agreement, and were issued under the Company’s current long-term incentive plan. The stock options are subject to all vesting restrictions and other terms and conditions customary for the Company.
The Company performed a valuation analysis to determine the fair values of certain intangible assets of Empathy Lab as of the acquisition date. As part of the valuation process, the excess earnings method was used to determine the value of customer relationships. Fair values of trade name and non-competition agreements were determined using the relief from royalty and discounted earnings methods, respectively. The Company expects approximately $11,470 of tax goodwill amortizable over a 15-year period.
The following table presents the estimated fair values and useful lives of intangible assets acquired as of December 18, 2012:
|
|
Weighted Average
Useful Life
(in years)
|
Amount
|
||||||
|
Customer relationships
|
10
|
$
|
6,900
|
|||||
|
Trade names
|
5
|
3,900
|
||||||
|
Non-competition agreements
|
4
|
400
|
||||||
|
Total
|
$
|
11,200
|
||||||
Included in consolidated statements of income and comprehensive income for the year ended December 31, 2012 were $545 of revenues and $104 of net income of the acquiree, respectively.
Total acquisition-related post-combination compensation expense recognized for the year ended December 31, 2012 was $79 and is presented within selling, general and administrative expenses. Total acquisition-related costs were $81 and are presented within selling, general and administrative expenses for the year ended December 31, 2012, respectively.
Pro forma results of operations for the Empathy Lab acquisition completed during the year ended December 31, 2012 have not been presented because the effects of the acquisition were not material, individually and in aggregate with other acquisitions completed by the Company during 2012, to the Company’s consolidated results of operations.
Thoughtcorp, Inc. —
On May 23, 2012, the Company acquired substantially all of the assets and assumed certain liabilities of Thoughtcorp, Inc., a Toronto-based software solutions provider (“Thoughtcorp”). The acquisition is intended to expand the Company’s geographic footprint within North America, and complement its global delivery capabilities with expertise in areas such as agile development, enterprise mobility and business intelligence. In addition, Thoughtcorp brings significant telecommunications expertise, and expands and enhances the Company’s offering within the Banking and Financial Services and Travel and Consumer verticals.
The purchase price was comprised of $7,497 paid in cash and 217,274 shares of common stock with a fair value of $3,607 at the acquisition date. Half of these shares were placed in escrow for a period of 18 months as a security for the indemnification obligations of the sellers under the asset purchase agreement. Additionally, the Company issued to the sellers 217,272 shares of non-vested (“restricted”) common stock contingent on their continued employment with the Company (Note 14). These shares have an estimated value of $3,607 and will be recorded as stock-based compensation expense over an associated service period of two years. A deferred tax asset has been recognized for the tax effect of the fair value of the portion of the shares that were placed in escrow.
The purchase price was allocated to the assets acquired based on their related fair values, as follows:
|
|
Amount
|
|||
|
Cash and cash equivalents
|
$
|
1,111
|
||
|
Trade receivables and other current assets
|
2,484
|
|||
|
Property and equipment
|
92
|
|||
|
Deferred tax asset
|
1,348
|
|||
|
Acquired intangible assets
|
5,296
|
|||
|
Goodwill
|
2,935
|
|||
|
Total assets acquired
|
13,266
|
|||
|
Accounts payable and accrued expenses
|
461
|
|||
|
Assumed shareholder and director loans
|
1,290
|
|||
|
Deferred revenue and other liabilities
|
411
|
|||
|
Total liabilities assumed
|
2,162
|
|||
|
Net assets acquired
|
$
|
11,104
|
||
F-16
The Company performed a valuation analysis to determine the fair values of certain intangible assets of Thoughtcorp as of the acquisition date. As part of the valuation process, the excess earnings method was used to determine the value of customer relationships. Fair values of trade name and non-competition agreements were determined using the relief from royalty and discounted earnings methods, respectively. The Company expects approximately $8,310 of tax goodwill, of which 75% is deductible at 7% per annum on a declining basis.
The following table presents the fair values and useful lives of intangible assets acquired as of May 23, 2012:
|
|
Weighted Average
Useful Life
(in years)
|
Amount
|
||||||
|
Customer relationships
|
10
|
$
|
2,810
|
|||||
|
Trade names
|
5
|
2,014
|
||||||
|
Non-competition agreements
|
5
|
472
|
||||||
|
Total
|
$
|
5,296
|
||||||
Included in consolidated statements of income for the year ended December 31, 2012 were $7,184 of revenues and $206 of net losses of the acquiree, respectively.
Total acquisition-related post-combination compensation expense recognized for the year ended December 31, 2012 was $1,252 and is presented within selling, general and administrative expenses. Total acquisition-related costs were $420 and are presented within selling, general and administrative expenses for the year ended December 31, 2012, respectively.
Pro forma results of operations for the Thoughtcorp acquisition completed during the year ended December 31, 2012 have not been presented because the effects of the acquisition, individually and in aggregate with other acquisitions completed by the Company during 2012, were not material to the Company’s consolidated results of operations.
| 3. | GOODWILL AND INTANGIBLE ASSETS — NET |
Goodwill by reportable segment was as follows:
|
|
North America
|
EU
|
Russia
|
Other
|
Total
|
|||||||||||||||
|
Balance as of January 1, 2012
|
$
|
2,286
|
$
|
2,864
|
$
|
3,019
|
$
|
—
|
$
|
8,169
|
||||||||||
|
Acquisition of Thoughtcorp (Note 2)
|
2,935
|
—
|
—
|
—
|
2,935
|
|||||||||||||||
|
Acquisition of Empathy Lab (Note 2)
|
11,359
|
—
|
—
|
—
|
11,359
|
|||||||||||||||
|
Effect of net foreign currency exchange rate changes
|
63
|
—
|
172
|
—
|
235
|
|||||||||||||||
|
Balance as of December 31, 2012
|
16,643
|
2,864
|
3,191
|
—
|
22,698
|
|||||||||||||||
|
Effect of net foreign currency exchange rate changes
|
(205
|
)
|
—
|
(225
|
)
|
—
|
(430
|
)
|
||||||||||||
|
Balance as of December 31, 2013
|
$
|
16,438
|
$
|
2,864
|
$
|
2,966
|
$
|
—
|
$
|
22,268
|
||||||||||
As a result of an operating loss in the Other reporting unit for the three months ended June 30, 2011, the Company performed a goodwill impairment test. In assessing impairment in accordance with Accounting Standards Codification, (“ASC”) No. 350, “Intangibles-Goodwill and Other,” the Company determined that the fair value of the Other reporting unit, based on the total of the expected future discounted cash flows directly related to the reporting unit, was below the carrying value of the reporting unit. The Company completed the second step of the goodwill impairment test, resulting in an impairment charge of $1,697. The
re were no accumulated impairments losses in any of the North America, Europe or Russia segments as of December 31, 2013, 2012 or 2011.
As part of the Thoughtcorp acquisition, substantially all of the employees of the acquiree accepted employment with the Company. The Company believes the amount of goodwill resulting from the allocation of purchase price to acquire Thoughtcorp is attributable to the workforce of the acquired business. All of the goodwill was allocated to the Company’s Canadian operations and is presented within North America.
As part of the Empathy Lab acquisition, substantially all of the employees of the acquiree accepted employment with the Company. The Company believes the amount of goodwill resulting from the allocation of purchase price to acquire Empathy Lab is attributable to the workforce of the acquired business. All of the goodwill was allocated to the Company’s U.S. operations and is presented within North America.
F-17
Components of intangible assets were as follows:
|
|
2013
|
|||||||||||||||
|
|
Weighted average
life at acquisition
(in years)
|
Gross
carrying
amount
|
Accumulated
amortization
|
Net carrying
amount
|
||||||||||||
|
Client relationships
|
9
|
$
|
13,432
|
$
|
(4,885
|
)
|
$
|
8,547
|
||||||||
|
Trade name
|
5
|
6,232
|
(1,643
|
)
|
4,589
|
|||||||||||
|
Non-competition agreements
|
5
|
848
|
(250
|
)
|
598
|
|||||||||||
|
Total
|
$
|
20,512
|
$
|
(6,778
|
)
|
$
|
13,734
|
|||||||||
|
|
2012
|
|||||||||||||||
|
|
Weighted average
life at acquisition
(in years)
|
Gross
carrying
amount
|
Accumulated
amortization
|
Net carrying
amount
|
||||||||||||
|
Client relationships
|
9
|
$
|
13,724
|
$
|
(3,640
|
)
|
$
|
10,084
|
||||||||
|
Trade name
|
5
|
6,372
|
(439
|
)
|
5,933
|
|||||||||||
|
Non-competition agreements
|
5
|
881
|
(64
|
)
|
817
|
|||||||||||
|
Total
|
$
|
20,977
|
$
|
(4,143
|
)
|
$
|
16,834
|
|||||||||
All of the intangible assets have finite lives and as such are subject to amortization. Amortization of intangibles for the years ended December 31 is presented in the table below:
|
|
Year Ended December 31,
|
|||||||||||
|
|
2013
|
2012
|
2011
|
|||||||||
|
Client relationships
|
$
|
1,373
|
$
|
627
|
$
|
720
|
||||||
|
Trade name
|
1,222
|
333
|
59
|
|||||||||
|
Non-competition agreements
|
190
|
64
|
—
|
|||||||||
|
Total
|
$
|
2,785
|
$
|
1,024
|
$
|
779
|
||||||
Estimated amortization expenses of the Company’s existing intangible assets for the next five years ending December 31, were as follows:
|
|
Amount
|
|||
|
2014
|
$
|
2,503
|
||
|
2015
|
2,376
|
|||
|
2016
|
2,341
|
|||
|
2017
|
1,865
|
|||
|
2018
|
977
|
|||
|
Thereafter
|
3,672
|
|||
|
Total
|
$
|
13,734
|
||
4
.
PREPAID AND OTHER CURRENT ASSETS
Prepaid and other current assets consisted of the following:
|
|
December 31,
2013
|
December 31,
2012
|
||||||
|
Taxes receivable
|
$
|
7,295
|
$
|
4,522
|
||||
|
Prepaid expenses
|
3,399
|
3,825
|
||||||
|
Security deposits under operating leases
|
1,005
|
837
|
||||||
|
Prepaid equipment
|
986
|
1,695
|
||||||
|
Unamortized software licenses and subscriptions
|
981
|
616
|
||||||
|
Due from employees
|
218
|
104
|
||||||
|
Other
|
471
|
236
|
||||||
|
Total
|
$
|
14,355
|
$
|
11,835
|
||||
F-18
5
.
EMPLOYEE LOANS AND ALLOWANCE FOR LOAN LOSSES
In the third quarter of 2012, the Board of Directors of the Company approved the Employee Housing Program (“the Housing Program”), which assists employees in purchasing housing in Belarus. The Housing Program was designed to be a retention mechanism for the Company’s employees in Belarus and is available to full-time employees who have been with the Company for at least three years. As part of the Housing Program, the Company will extend financing to employees up to an aggregate amount of $10,000. The Company does not bear any market risk in connection with the Housing Program, as the housing will be sold directly to employees by independent third parties. In addition to the housing loans, the Company issues relocation loans in connection with intra-company transfers, as well as certain other individual loans.
During the year ended December 31, 2013, loans issued by the Company under the Housing Program were denominated in U.S. Dollars with a five-year term and carried an interest rate of 7.5%.
At December 31, 2013 and December 31, 2012, categories of employee loans included in the loan portfolio were as follows:
|
|
December 31,
2013
|
December 31,
2012
|
||||||
|
Housing loans
|
$
|
5,896
|
$
|
—
|
||||
|
Relocation and other loans
|
494
|
429
|
||||||
|
Total employee loans
|
6,390
|
429
|
||||||
|
Less:
|
||||||||
|
Allowance for loan losses
|
—
|
—
|
||||||
|
Total loans, net of allowance for loan losses
|
$
|
6,390
|
$
|
429
|
||||
There were no loans issued to principal officers, directors, and their affiliates during the years ended December 31, 2013, 2012 and 2011.
On a quarterly basis, the Company reviews the aging of its loan portfolio to evaluate information about the ability of employees to service their debt, including historical payment experience, reasons for payment delays and shortfalls, if any, as well as probability of collecting scheduled principal and interest payments based on the knowledge of individual borrowers, among other factors.
As of December 31, 2013 and December 31, 2012, there were no material past due or non-accrual employee loans. The Company determined no allowance for loan losses was required regarding its employee loans as of December 31, 2013 and December 31, 2012, and there were no movements in provision for loan losses during the years ended December 31, 2013, 2012 and 2011.
6.
RESTRICTED CASH AND TIME DEPOSITS
Restricted cash and time deposits consisted of the following:
|
|
December 31,
2013
|
December 31,
2012
|
||||||
|
Time deposits
|
$
|
1,188
|
$
|
1,006
|
||||
|
Short-term security deposits under customer contracts
|
298
|
660
|
||||||
|
Long-term deposits under employee loan programs
|
225
|
360
|
||||||
|
Long-term deposits under operating leases
|
—
|
107
|
||||||
|
Total
|
$
|
1,711
|
$
|
2,133
|
||||
Included in time deposits as of December 31, 2013, was a bank deposit of $1,188. The deposit matures on October 15, 2014 and earns interest at the rate of 2.05%. The Company does not intend to withdraw the deposit prior to its maturity.
Included in time deposits as of December 31, 2012, was a bank deposit of $1,006, which earned interest at the rate of 2.95%. The deposit matured in September 2013.
At December 31, 2013 and 2012 short-term security deposits under customer contracts included fixed amounts placed in connection with bank guarantees to secure appropriate performance by the Company. The Company estimates the probability of non-performance under these contracts as remote therefore, no provision for losses has been recognized in respect of these amounts as of December 31, 2013 and 2012.
Also included in restricted cash as of December 31, 2013 and 2012 were deposits of $225 and $360, respectively, placed in connection with certain employee loan programs (See Note 16).
F-19
7.
PROPERTY AND EQUIPMENT — NET
Property and equipment consisted of the following:
|
|
Useful Life
(in years)
|
December 31,
2013
|
December 31,
2012
|
|||||||||
|
Computer hardware
|
3
|
$
|
29,884
|
$
|
24,239
|
|||||||
|
Leasehold improvements
|
lease term
|
5,903
|
5,527
|
|||||||||
|
Furniture and fixtures
|
7
|
5,688
|
4,351
|
|||||||||
|
Purchased computer software
|
3
|
5,042
|
4,452
|
|||||||||
|
Office equipment
|
7
|
4,679
|
4,325
|
|||||||||
|
Building
|
50
|
16,534
|
16,534
|
|||||||||
|
Construction in progress (Note 16)
|
n/a
|
|
15,749
|
15,561
|
||||||||
|
|
83,479
|
74,989
|
||||||||||
|
Less accumulated depreciation and amortization
|
(30,164
|
)
|
(21,854
|
)
|
||||||||
|
Total
|
$
|
53,315
|
$
|
53,135
|
||||||||
Depreciation and amortization expense related to property and equipment was $12,335, $9,858 and $6,759 for the years ended December 31, 2013, 2012 and 2011, respectively.
| 8. | ACCRUED EXPENSES AND OTHER LIABILITIES |
Accrued expenses consisted of the following:
|
|
December 31,
2013
|
December 31,
2012
|
||||||
|
Compensation
|
$
|
13,674
|
$
|
15,450
|
||||
|
Subcontractor costs
|
2,933
|
1,915
|
||||||
|
Professional fees
|
947
|
544
|
||||||
|
Facilities costs
|
334
|
297
|
||||||
|
Other
|
2,287
|
1,608
|
||||||
|
Total
|
$
|
20,175
|
$
|
19,814
|
||||
| 9 . | TAXES PAYABLE |
Current taxes payable consisted of the following:
|
|
December 31,
2013
|
December 31,
2012
|
||||||
|
Corporate profit tax
|
$
|
3,717
|
$
|
3,315
|
||||
|
Value added taxes
|
5,975
|
6,274
|
||||||
|
Payroll, social security, and other taxes
|
4,479
|
4,968
|
||||||
|
Total
|
$
|
14,171
|
$
|
14,557
|
||||
As of December 31, 2013 and 2012, long-term taxes payable included amounts in respect of unrecognized tax benefits and related interest.
10
.
INCOME TAXES
Income before provision for income taxes shown below was based on the geographic location to which such income was attributed as follows:
|
|
Year Ended December 31,
|
|||||||||||
|
|
2013
|
2012
|
2011
|
|||||||||
|
Income before income tax expense:
|
|
|
|
|||||||||
|
Domestic
|
$
|
7,001
|
$
|
9,291
|
$
|
2,872
|
||||||
|
Foreign
|
69,769
|
56,572
|
49,920
|
|||||||||
|
Total
|
$
|
76,770
|
65,863
|
$
|
52,792
|
|||||||
F-20
|
|
Year Ended December 31,
|
|||||||||||
|
|
2013
|
2012
|
2011
|
|||||||||
|
Income tax expense/ (benefit) consists of:
|
|
|
|
|||||||||
|
Current
|
|
|
|
|||||||||
|
Federal
|
$
|
6,150
|
$
|
6,881
|
$
|
4,878
|
||||||
|
State
|
310
|
319
|
389
|
|||||||||
|
Foreign
|
8,275
|
7,969
|
2,483
|
|||||||||
|
Deferred
|
||||||||||||
|
Federal
|
(668
|
)
|
(625
|
)
|
(1,629
|
)
|
||||||
|
State
|
14
|
24
|
(72
|
)
|
||||||||
|
Foreign
|
695
|
(3,189
|
)
|
2,390
|
||||||||
|
Total
|
$
|
14,776
|
$
|
11,379
|
$
|
8,439
|
||||||
Deferred tax assets and liabilities are provided for the effects of temporary differences between the tax basis of an asset and liability and its reported amount in the consolidated balance sheets. These temporary differences result in taxable or deductible amounts in future years.
The components of the Company’s deferred tax assets and liabilities were as follows:
|
|
December 31,
2013
|
December 31,
2012
|
||||||
|
Deferred tax assets:
|
|
|
||||||
|
Fixed assets
|
$
|
732
|
$
|
703
|
||||
|
Intangible assets
|
4,532
|
4,737
|
||||||
|
Accrued expenses
|
3,488
|
4,042
|
||||||
|
Deferred revenue
|
2,050
|
1,583
|
||||||
|
Stock-based compensation
|
407
|
413
|
||||||
|
Valuation allowance
|
—
|
(489
|
)
|
|||||
|
Restricted stock options
|
1,336
|
1,616
|
||||||
|
Other assets
|
680
|
1,214
|
||||||
|
Deferred tax assets
|
13,225
|
13,819
|
||||||
|
Deferred tax liabilities:
|
||||||||
|
Fixed assets
|
804
|
742
|
||||||
|
Accrued revenue and expenses
|
846
|
737
|
||||||
|
Deferred intercompany gain
|
405
|
405
|
||||||
|
Equity compensation
|
1,593
|
2,431
|
||||||
|
Other liabilities
|
254
|
—
|
||||||
|
Deferred tax liability
|
3,902
|
4,315
|
||||||
|
Net deferred tax asset
|
$
|
9,323
|
$
|
9,504
|
||||
At December 31, 2013, the Company had current and non-current deferred tax assets of $5,392 and $4,557, respectively, and current and non-current tax liabilities of $275 and $351, respectively. At December 31, 2012, the Company had current and non-current deferred tax assets of $6,593 and $6,093, respectively and current and non-current tax liabilities of $491 and $2,691, respectively.
Management assesses the available positive and negative evidence to estimate if sufficient future taxable income will be generated to use the existing deferred tax assets. A significant piece of objective negative evidence evaluated was the amount of tax holiday the company can use in Hungary before the credit expires in that jurisdiction in 2015. Such objective evidence limits the ability to consider other subjective evidence such as our projections for future growth.
On the basis of this evaluation, as of December 31, 2013, no valuation allowance is required to record the portion of the deferred tax asset that is more likely than not to be realized. The amount of the deferred tax asset considered realizable, however, could be adjusted if estimates of future taxable income during the carryforward period are reduced or increased or if objective negative evidence in the form of cumulative losses is no longer present and additional weight may be given to subjective evidence such as our projections for growth.
At December 31, 2013, the Company had utilized all of its federal net operating losses. No provision has been made for U.S. or non-U.S. income taxes on the undistributed earnings of subsidiaries or for unrecognized deferred tax liabilities for temporary differences related to basis differences in investments in subsidiaries, as such earnings are expected to be permanently reinvested, the
F-21
investments are essentially permanent in duration, or the Company has concluded that no additional tax liability will arise as a result of the distribution of such earnings. As of December 31, 2013, certain subsidiaries had approximately $249.6 million of undistributed earnings that we intend to permanently reinvest. A liability could arise if our intention to permanently reinvest such earnings were to change and amounts are distributed by such subsidiaries or if such subsidiaries are ultimately disposed. It is not practicable to estimate the additional income taxes related to permanently reinvested earnings or the basis differences related to investments in subsidiaries.
The provision for income taxes differs from the amount of income tax determined by applying the applicable US statutory federal income tax rate to pretax income as follows:
|
|
Year Ended December 31,
|
|||||||||||
|
|
2013
|
2012
|
2011
|
|||||||||
|
Statutory federal tax
|
$
|
26,102
|
$
|
22,393
|
$
|
18,482
|
||||||
|
Increase/ (decrease) in taxes resulting from:
|
||||||||||||
|
State taxes, net of federal benefit
|
368
|
280
|
266
|
|||||||||
|
Provision adjustment for current year uncertain tax position
|
—
|
—
|
178
|
|||||||||
|
Effect of permanent differences
|
2,524
|
2,177
|
2,816
|
|||||||||
|
Stock-based compensation
|
1,948
|
1,165
|
—
|
|||||||||
|
Rate differential between U.S. and foreign
|
(17,279
|
)
|
(14,472
|
)
|
(13,297
|
)
|
||||||
|
Change in foreign tax rate
|
(59
|
)
|
148
|
(22
|
)
|
|||||||
|
Change in valuation allowance
|
489
|
(489
|
)
|
—
|
||||||||
|
Other
|
683
|
177
|
16
|
|||||||||
|
Income tax expense
|
$
|
14,776
|
$
|
11,379
|
$
|
8,439
|
||||||
The growth in the permanent differences in the year ended December 31, 2012 related to goodwill impairment loss and increases in non-deductible expenses incurred by foreign subsidiaries.
On September 22, 2005, the president of Belarus signed the decree “On the High-Technologies Park” (the “Decree”). The Decree is aimed at boosting the country’s high-technology sector. The Decree stipulates that member technology companies have a 100% exemption from Belarusian income tax of 18% effective July 1, 2006. The Decree is in effect for a period of 15 years from date of signing.
The Company’s subsidiary in Hungary benefits from a tax credit of 10% of annual qualified salaries, taken over a four-year period, for up to 70% of the total tax due for that period. The Company has been able to take the full 70% credit for 2008 - 2013. The Hungarian tax authorities repealed the tax credit beginning with 2012. Credits earned in years prior to 2012, will be allowed until fully utilized. The Company anticipates full utilization up to the 70% limit until 2014, with full phase out in 2015.
The aggregate dollar benefits derived from these tax holidays approximated $9.7 million, $8.5 million and $21.0 million for the years ended December 31, 2013, 2012 and 2011, respectively. The decrease in aggregate dollar benefits derived from these tax holidays in 2013, as compared to 2012, was primarily due to a decrease in statutory tax rate in Belarus. The benefit the tax holiday had on diluted net income per share approximated $0.20, $0.19 and $0.49 for the years ended December 31, 2013, 2012 and 2011, respectively.
The liability for unrecognized tax benefits is included in income tax liability within the consolidated balance sheets at December 31, 2013 and 2012. At December 31, 2013 and 2012, the total amount of gross unrecognized tax benefits (excluding the federal benefit received from state tax positions) was $1,271 and $1,271, respectively, (excluding penalties and interest of $189 and $125, respectively). Of this total, $1,328 and $1,354, respectively, (net of the federal benefit on state tax issues) represents the amount of unrecognized tax benefits that, if recognized, would favorably affect the effective tax rate in future periods.
The Company’s policy is to recognize interest and penalties related to uncertain tax positions as a component of its provision for income taxes. The total amount of accrued interest and penalties resulting from such unrecognized tax benefits was $189, $125 and $55 at December 31, 2013, 2012 and 2011, respectively.
The beginning to ending reconciliation of the gross unrecognized tax benefits were as follows:
|
|
2013
|
2012
|
2011
|
|||||||||
|
Gross Balance at January 1
|
$
|
1,271
|
$
|
1,271
|
$
|
56
|
||||||
|
Increases in tax positions in current year
|
—
|
—
|
178
|
|||||||||
|
Increases in tax positions in prior year
|
—
|
—
|
1,093
|
|||||||||
|
Decreases due to settlement
|
—
|
—
|
(56
|
)
|
||||||||
|
Balance at December 31
|
$
|
1,271
|
$
|
1,271
|
$
|
1,271
|
||||||
F-22
There were no tax positions for which it was reasonably possible that unrecognized tax benefits will significantly increase or decrease within 12 months of the reporting date.
The Company files income tax returns in the United States and in various states, local and foreign jurisdictions. The Company’s significant tax jurisdictions are the U.S. Federal, Pennsylvania, Canada, Russia, Denmark, Germany, Ukraine, the United Kingdom, Hungary, Switzerland and Kazakhstan. The tax years subsequent to 2009 remain open to examination by the Internal Revenue Service. Generally, the tax years subsequent to 2009 remain open to examination by various state and local taxing authorities and various foreign taxing authorities.
11.
EMPLOYEE BENEFITS
The Company has established a 401(k) retirement plan, which is a tax-qualified self-funded retirement plan covering substantially all of the Company’s U.S. employees. Under this plan, employees may elect to defer their current compensation by up to the statutory limit. Effective January 1, 2013, the Company provides discretionary matching contributions to the plan up to a maximum of 2.0% of the employee’s eligible compensation. Employer contributions charged to expense for the year ended December 31, 2013 were $404. The Company does not maintain any defined benefit pension plans or any nonqualified deferred compensation plans.
12.
LONG-TERM DEBT
Revolving Line of Credit
— In November 2006, the Company entered into a revolving loan agreement (the “Credit Facility”) with PNC Bank, National Association (the “Bank”). The Credit Facility was comprised of a five-year revolving line of credit pursuant to which the Company could borrow up to $7,000 at any point in time based on borrowing availability at an annual rate equal to the London Interbank Offer Rate, or LIBOR, plus 1.25%. The borrowing availability under the Credit Facility was based upon a percentage of eligible accounts receivable and US cash. On July 25, 2011, the Company and the Bank agreed to amend the Credit Facility to increase the maximum borrowing capacity to $30,000.
On January 15, 2013, the Company entered into a new revolving loan agreement (the “2013 Credit Facility”) with the Bank, which expires on January 15, 2015. Under the new agreement, the Company’s maximum borrowing capacity was set at $40,000. Advances under the new line of credit accrue interest at an annual rate equal to the LIBOR, plus 1.25%. The 2013 Credit Facility is collateralized with: (a) all tangible and intangible assets of the Company, and its U.S.-based subsidiaries including all accounts, general intangibles, intellectual property rights, equipment; and (b) all of the outstanding shares of capital stock and other equity interests in U.S.-based subsidiaries of the Company, and 65.0% of the outstanding shares of capital stock and other equity interests in certain of the Company’s foreign subsidiaries.
As of December 31, 2013, the borrowing capacity of the Company under the 2013 Credit Facility was $40,000.
The 2013 Credit Facility contains customary affirmative and negative covenants, including financial and coverage ratios. As of December 31, 2013, the Company was in compliance with all debt covenants as of that date.
As of December 31, 2013 and 2012, the Company had no outstanding borrowing.
13.
COMMON AND PREFERRED STOCK
On January 19, 2012, the Company effected an 8-for-1 stock split of the Company’s common stock, on which date the number of authorized common and preferred stock was increased to 160,000,000 and 40,000,000 shares, respectively. All shares of common stock, options to purchase common stock and per share information presented in the consolidated financial statements have been adjusted to reflect the stock split on a retroactive basis for all periods presented. There was no change in the par value of the Company’s common stock. The ratio by which the then outstanding shares of Series A-1 Preferred, Series A-2 Preferred and Series A-3 Preferred Stock were convertible into shares of common stock was adjusted to reflect the effects of the common stock split, such that each share of preferred stock was convertible into eight shares of common stock.
In February 2012, the Company completed an initial public offering of 6,900,000 shares of its common stock, which included 900,000 shares of common stock sold by the Company pursuant to an over-allotment option granted to the underwriters, which were sold at a price to the public of $12.00 per share. The offering commenced on February 7, 2012 and closed on February 13, 2012. Of the 6,900,000 shares of common stock sold, the Company issued and sold 2,900,000 shares of common stock and its selling stockholders sold 4,000,000 shares of common stock, resulting in gross proceeds to the Company of $34,800 and $28,969 in net proceeds after deducting underwriting discounts and commissions of $2,436 and offering expenses of $3,395. The Company did not receive any proceeds from the sale of common stock by the selling stockholders.
F-23
On August 20, 2010, the Company entered into an agreement with Instant Information Inc. to issue shares of common stock to Instant Information Inc. as consideration for the acquisition of the assets of Instant Information Inc. subject to achievement of certain financial milestones or upon completion of an initial public offering by the Company. A total of 53,336 shares of common stock were issued to Instant Information Inc. upon completion of the Company’s initial public offering for an aggregate value of $640, which was expensed during the first quarter of 2012.
Upon the closing of the initial public offering, all outstanding Series-A1 and Series-A2 convertible redeemable preferred stock, and Series A3 convertible preferred stock were converted into a total of 21,840,128 shares of common stock, as shown in the table below.
|
|
Conversion Shares
|
|||
|
Series A-1 Convertible Redeemable Preferred Stock
|
16,439,480
|
|||
|
Series A-2 Convertible Redeemable Preferred Stock
|
3,078,432
|
|||
|
Series A-3 Convertible Preferred Stock
|
2,322,216
|
|||
|
Total
|
21,840,128
|
|||
Series A-1 Convertible Redeemable Preferred Stock (“Series A-
1
Preferred”)
— On January 20, 2006, Siguler Guff LLC, a New York based private equity investment firm, acting through its affiliated investment funds Russia Partners II LP (“RPII”) and Russia Partners EPAM Fund LP (“RPE”), purchased 657,354 shares of Series A-1 Preferred at $12.17 per share or $8,000. At the same time, RPII and RPE also acquired 11,180,648 shares of the Company’s common stock from existing holders, and the Company enabled RPII and RPE to convert such shares into 1,397,581 shares of Series A-1 Preferred. The difference between the share price of the Series A-1 Preferred ($12.17 per share) and the common stock ($1.13 per share) exchanged of $6,803 has been recorded as a deemed dividend. The Company accreted the 12.5% compounded annual rate of return through April 15, 2010, in accordance with the redemption provision as detailed below. There was no accretion for the years ended December 31, 2013, 2012 and 2011. The ending redemption value was $41,245 at December 31, 2011.
The terms of the Series A-1 Preferred were as follows:
Dividends
— No dividends will be paid on the Series A-1 Preferred unless dividends are paid on common stock.
Liquidation
— Before any payment to the common stockholders, the Series A-1 Preferred will receive their purchase price of the Series A-1 Preferred ($12.17 per share) plus a 12.5% compounded annual rate of return on the purchase price.
If the assets distributable to the holders of the Series A Preferred upon a liquidation are insufficient to pay the full Series A-1, A-2 and A-3 Preferred liquidation amounts, then such assets or the proceeds shall be distributed among the holders of the Series A-1, A-2 and A-3 Preferred ratably in proportion to the respective amount to which they otherwise would be entitled.
The liquidation amount is equal to the carrying value for all periods presented.
Redemption
— At any time after January 1, 2011, if the Company has not affected a qualified public offering, as defined, the holders of at least a majority of the then outstanding shares of Series A-1 Preferred, voting together as a separate class, may by written request, require the Company to redeem all or any number of shares of the Series A-1 Preferred in four equal semi-annual installments beginning thirty calendar days from the date of the redemption election and ending on the date one and one-half years after such date. The Company shall affect such redemptions on the applicable redemption date by paying in cash in exchange for each share of Series A-1 Preferred to be redeemed then outstanding an amount equal to the Series A-1 Preferred liquidation amount ($12.17 per share plus a 12.5% compounded annual rate of return) on such redemption date.
Pursuant to section 6.8 of the Series A-3 convertible preferred stock purchase agreement, the 12.5% compounded annual return related to the Series A-1 Preferred, which has been part of the Series A-1 liquidation amount, ceases after the date of issuance of the Series A-3 Preferred. EPAM terminated the accretion related to this liquidation amount on or about April 15, 2010.
Voting
— Each holder of a share of Series A-1 Preferred shall be entitled to voting rights and powers equal to the voting rights and powers of the common stock (except as otherwise expressly provided or as required by law) voting together with the common stock as a single class on an as-converted to common stock basis. Each share of Series A-1 Preferred (including fractional shares) shall be entitled to one vote for each whole share of common stock that would be issuable upon conversion of such shares on the record date for determining eligibility to participate in the action being taken.
Conversion Rights
— Any holder of Series A-1 Preferred may convert any share of Series A-1 Preferred held by such holder into a number of shares of common stock determined by dividing (i) the Series A-1 Preferred purchase price ($12.17 per share) by (ii) the Series A-1 conversion price then in effect. The initial conversion price for the Series A-1 Preferred (the “Series A-1 Conversion Price”) shall be equal to the purchase price ($12.17 per share). The Series A-1 Conversion Price from time to time in effect is subject
F-24
to adjustment, as defined. Each share of Series A-1 Preferred shall automatically be converted into shares of common stock at the then effective applicable Series A-1 Conversion Price upon the earliest of (i) the date specified by vote or written consent or agreement of holders of at least a majority of the shares of Series A-1 Preferred then outstanding, (ii) effective immediately before a qualified public offering, as defined, or (iii) effective upon the closing of a liquidation or a reorganization event, as defined, that results in the receipt of a per share amount of cash proceeds or non-cash property valued equal to or greater than the Series A-1 Preferred liquidation amount, as defined.
Series A-
2
Convertible Redeemable Preferred Stock (“Series A-
2
Preferred”)
— On February 19, 2008, the Company completed a private placement and raised net proceeds of $47,601 ($50,000 gross less $2,399 costs) from the sale of 675,081 shares of Series A-2 Preferred at a sale price of $74.07 per share. Annual accretion was $0, $0 and $17,563 for the years ended December 31, 2013, 2012 and 2011, respectively. The ending carrying value was $0, $0 and $44,695 at December 31, 2013, 2012 and 2011, respectively.
In connection with this private placement, the Company designated the Series A-2 Preferred as a new series of preferred stock and renamed the existing series of shares of Series A preferred stock as Series A-1 Preferred.
On January 19, 2010, the Company entered into a stock repurchase agreement with certain stockholders to repurchase 290,277 of Series A-2 Convertible Redeemable Preferred Stock at a per share price of $51.85 for a total consideration of $15,050. On November 10, 2010, Board of Directors of the Company voted to retire these shares.
The Series A-2 Preferred shares had the following rights and preferences:
Dividends
— No dividends will be paid on the Series A-2 Preferred unless dividends are paid on common stock.
Liquidation
— Before any payment to the common stockholders, the Series A-2 Preferred holders will receive their liquidation preference.
In the event of any liquidation that values 100% of the equity securities of the Company on a fully-diluted basis at an amount that is less than the Series A-2 post-money valuation, as defined, the holders of shares of Series A-2 Preferred shall be entitled to receive either their per share purchase price of the Series A-2 Preferred ($74.07) plus a 12.5% compounded annual rate of return if the purchase price is less than the percentage ceiling amount, defined for purposes of liquidation as 17.1% of cash proceeds or non-cash property received by the Company in the event of any liquidation, or the greater of (1) $74.07 per share and (2) the percentage ceiling amount.
In the event of liquidation that values 100% of the equity securities of the Company on a fully-diluted basis at an amount that is equal to or greater than the Series A-2 post-money valuation, as defined, the holders of shares of Series A-2 Preferred shall be entitled to receive either their per share purchase price of the Series A-2 Preferred ($74.07) plus a 12.5% to 18% compounded annual rate of return on the purchase price, if greater than the percentage ceiling amount, or the percentage ceiling amount.
If the assets distributable to the holders of the Series A Preferred upon a liquidation are insufficient to pay the full Series A-1, A-2 and A-3 Preferred liquidation amounts, then such assets or the proceeds shall be distributed among the holders of the Series A-1, A-2 and A-3 Preferred ratably in proportion to the respective amount to which they otherwise would be entitled.
Redemption
— At any time before January 1, 2011, if the Company has not effected a qualified public offering, as defined, the holders of at least a majority of the then outstanding shares of Series A-2 Preferred, may, by written request, require the Company to redeem all or any number of shares of the Series A-2 Preferred in three equal installments payable no later than the 12th, 18th and 24th month following the date of the redemption election. The Company shall effect such redemptions on the applicable redemption date by paying in cash in exchange for each shares of Series A-2 Preferred to be redeemed then outstanding, a per share amount equal to the lesser of (x) an amount that would provide a compounded annual return of 12.5% from the date of initial issuance date and (y) the percentage ceiling amount. At any time on or after January 1, 2011, the redemption per share amount is equal to the lesser of (x) the hurdle amount, an amount that would provide an annual IRR, as defined, from the initial issuance date of such share of at least 17%, provided, however, that the hurdle amount, as defined, shall cease to compound after December 31, 2010 and (y) the percentage ceiling amount, as defined. The percentage ceiling amount means, initially, 17.1% and thereafter adjusted pro rata for any changes in the percentage of capital stock of the Company owned by the holders of shares of Series A-2 Preferred (on a fully diluted basis) multiplied by the aggregate value of all Common Stock (assuming conversion of the Series A Preferred) as reasonably determined by the Board in good faith.
Voting
— Each holder of a Series A-2 Preferred shall be entitled to voting rights and powers equal to the voting rights and powers of common stock (except as otherwise expressly provided or as required by law) voting together with the common stock as a single class on an as-converted to common stock basis. Each share of Series A-2 Preferred (including fractional shares) shall be entitled to one vote for each whole share of common stock that would be issuable upon conversion of such shares on the record date for determining eligibility to participate in the action being taken.
F-25
Conversion rights
— Any holder of Series A-2 Preferred may convert any share of Series A-2 Preferred held by such holder into a number of shares of common stock determined by dividing (i) the Series A-2 Preferred purchase price ($74.07 per share) by (ii) the Series A-2 conversion price then in effect. The initial conversion price for the Series A-2 Preferred (the “Series A-2 Conversion Price”) shall be equal to the purchase price ($74.07 per share). The Series A-2 Conversion Price from time in effect is subject to adjustment, as defined. Each share of Series A-2 Preferred shall automatically be converted into shares of common stock at the then effective applicable Series A-2 Conversion Price upon the earliest of (i) the date specified by vote or written consent or agreement of holders of at least a majority of the shares of Series A-2 Preferred then outstanding, (ii) effective immediately before a qualified public offering, as defined. or (iii) effective upon the closing of a liquidation or a reorganization event, as defined, that results in the receipt per share of amount of cash proceeds or non-cash property valued equal to or greater than, the lesser of (x) their purchase price of the Series A-2 Preferred ($74.07 per share) plus a 12.5% compounded annual rate of return on the purchase price and (y) the percentage ceiling amount, as defined.
Registration Rights
— The holders of at least majority of the Series A-2 Preferred holders, may, by written request, require the Company to file a registration statement with certain limitations.
Series A-
3
Convertible Preferred Stock (“Series A-
3
Preferred”) —
On April 15, 2010, the Company created and issued 290,277 shares of Series A-3 Preferred at $51.85 per share, for a total consideration of $14,971, net of costs.
The Series A-3 Preferred had the following rights and preferences:
Dividends
— No dividends will be paid on the Series A-3 Preferred unless dividends are paid on common stock.
Liquidation
— Before any payment to the common stockholders, the Series A-3 Preferred holders will receive their liquidation preference.
In the event of liquidation that values 100% of the equity securities of the Company on a fully-diluted basis at an amount that is equal to or greater than the Series A-3 liquidation amount, as defined, the holders of shares of Series A-3 Preferred shall be entitled to receive their pro rata portion based on the per share amount available to common stockholders.
If the assets distributable to the holders of the Series A Preferred upon a liquidation are insufficient to pay the full Series A-1,
A-2 and A-3 Preferred liquidation amounts, then such assets or the proceeds shall be distributed among the holders of the Series A-1, A-2 and A-3 Preferred ratably in proportion to the respective amount to which they otherwise would be entitled.
The liquidation amount is equal to the carrying value for all periods presented.
Voting
— Each holder of a Series A-3 Preferred shall be entitled to voting rights and powers equal to the voting rights and powers of common stock (except as otherwise expressly provided or as required by law) voting together with the common stock as a single class on an as-converted to common stock basis. Each share of Series A-3 Preferred (including fractional shares) shall be entitled to one vote for each whole share of common stock that would be issuable upon conversion of such shares on the record date for determining eligibility to participate in the action being taken.
Conversion rights
— Any holder of Series A-3 Preferred may convert any share of Series A-3 Preferred held by such holder into a number of shares of common stock determined by dividing (i) the Series A-3 Preferred purchase price ($51.85 per share) by (ii) the Series A-3 conversion price then in effect. The initial conversion price for the Series A-3 Preferred (the “Series A-3 Conversion Price”) shall be equal to the purchase price ($51.85 per share). The Series A-3 Conversion Price from time in effect is subject to adjustment, as defined. Each share of Series A-3 Preferred shall automatically be converted into shares of common stock at the then effective applicable Series A-3 Conversion Price upon the earliest of (i) the date specified by vote or written consent or agreement of holders of at least a majority of the shares of Series A-3 Preferred then outstanding, (ii) effective immediately before a qualified public offering, as defined, or (iii) effective upon the closing of a liquidation or a reorganization event, as defined.
Registration Rights
— The holders of at least a majority of the Series A-3 Preferred holders, may, by written request, require the Company to file a registration statement with certain limitations.
Puttable Stock
— As part of consideration paid in business combinations, the Company issued common stock to certain stockholders of the acquired companies. The shares had an attached Put Option that provided the holders with the right to put the shares at the original per share value in the event the Company did not have a qualified public offering or reorganization event within a specified period from the acquisition date. During 2011, put options in respect of 56,896 of puttable common stock expired unexecuted.
Treasury Stock
— During the years ended December 31, 2013 and 2012, the Company issued treasury stock in connections with acquisitions completed in 2012 (See Note 2). In addition, in May 2012, Board of Directors of the Company voted to retire 38,792 shares of its treasury stock.
F-26
14.
STOCK COMPENSATION
The following costs related to the Company’s stock compensation plans were included in the consolidated statements of income and comprehensive income:
|
|
|
Year Ended December 31,
|
||||||||||
|
|
|
2013
|
|
2012
|
|
2011
|
||||||
|
Cost of revenues
|
$
|
4,823
|
$
|
2,809
|
$
|
1,365
|
||||||
|
Selling, general and administrative
|
8,327
|
4,017
|
1,501
|
|||||||||
|
Total
|
$
|
13,150
|
$
|
6,826
|
$
|
2,866
|
||||||
During the second quarter of 2013, the Company finalized the fair values of the net assets acquired from Empathy Lab (See Note 2). As a result, the Company issued an additional 1,483 shares of non-vested (“restricted”) common stock to the sellers of Empathy Lab on July 11, 2013 to settle the difference between the initial number of shares issued upon acquisition and the total number of shares due in connection with this transaction. The shares vest 33.33% on each of the first, second and third anniversaries of the closing date. Upon termination of the recipient’s services with the Company with Cause or without Good Reason (in each case, as defined in the escrow agreement), any unvested shares will be forfeited. The fair value of the restricted shares at the time of grant was $42.
2012 Non-Employee Directors Compensation Plan
—On January 11, 2012, the Company approved the 2012 Non-Employee Directors Compensation Plan (“2012 Directors Plan”), which will be used to issue equity grants to its non-employee directors. The Company authorized 600,000 shares of common stock to be reserved for issuance under the plan. The 2012 Directors Plan will expire after ten years and will be administered by the Company’s Board of Directors.
On January 8, 2013, the Company issued 5,257 shares of non-vested (“restricted”) common stock to its new non-employee director under the 2012 Directors Plan. The shares will vest and become unforfeitable 25% on each of the first, second, third and fourth anniversaries of the grant date. Upon termination of service from the Board at any time, a portion of these shares shall vest as of the date of such termination on a pro rata basis determined by the number of days that the participant served on the Board from the grant date through the date of such termination. The fair value of the restricted shares at the time of grant was $101.
On June 13, 2013, the Company issued 8,784 shares of non-vested (“restricted”) common stock to its non-employee directors under the 2012 Non-Employee Directors Compensation Plan. The shares will vest and become unforfeitable on the first anniversary of the grant date. Upon termination of service from the Board at any time, a portion of these shares shall vest as of the date of such termination on a pro rata basis determined by the number of days that the participant served on the Board from the grant date through the date of such termination. The fair value of the restricted shares at the time of grant was $225.
2012 Long-Term Incentive Plan
— On January 11, 2012, the Company approved the 2012 Long-Term Incentive Plan (“2012 Plan”), which will be used to issue equity grants to employees. As of December 31, 2013, 7,042,568 shares of common stock remained available for issuance under the 2012 Plan. This includes (i) any shares that were available for issuance under the 2006 Plan (as defined below) as of its discontinuance date and that became available for issuance under the 2012 Plan and (ii) any shares that were subject to outstanding awards under the 2006 Plan and have expired or terminated or were cancelled between the discontinuance date of the 2006 Plan and December 31, 2013 and therefore became available for issuance under the 2012 Plan. In addition, up to 2,647,121 shares that are subject to outstanding awards as of December 31, 2013 under the 2006 Plan and that expire or terminate for any reason prior to exercise or that would otherwise have returned to the 2006 Plan’s share reserve under the terms of the 2006 Plan will be available for awards to be granted under the 2012 Plan.
During the year ended December 31, 2013, the Company issued a total of 1,987,952 shares underlying stock options under the 2012 Plan with an aggregate grant-date fair value of $19,473.
2006 Stock Option Plan
— Effective May 31, 2006, the Board of Directors of the Company adopted the 2006 Stock Option Plan (the “2006 Plan”). The Company’s stock option plan permitted the granting of options to directors, employees, and certain independent contractors. The Compensation Committee of the Board of Directors generally had the authority to select individuals who were to receive options and to specify the terms and conditions of each option so granted, including the number of shares covered by the option, the exercise price, vesting provisions, and the overall option term. In January 2012, the 2006 Plan was discontinued; however, outstanding awards remain subject to the terms of the 2006 Plan and any shares that are subject to an option that was previously granted under the 2006 Plan and that will expire or terminate for any reason prior to exercise will become again available for issuance under the 2012 Plan. All of the options issued pursuant to the 2006 Plan expire ten years from the date of grant.
F-27
Stock option activity under the Company’s plans is set forth below:
|
|
Number of
Options
|
Weighted
Average
Exercise Price
|
Aggregate
Intrinsic
Value
|
|||||||||
|
Options outstanding at January 1, 2011
|
6,378,584
|
$
|
3.79
|
$
|
19,708
|
|||||||
|
Options granted
|
600,000
|
14.00
|
1,200
|
|||||||||
|
Options exercised
|
(47,600
|
)
|
1.52
|
(499
|
)
|
|||||||
|
Options forfeited/cancelled
|
(335,848
|
)
|
5.30
|
(2,250
|
)
|
|||||||
|
Options outstanding at December 31, 2011
|
6,595,136
|
$
|
4.65
|
$
|
48,447
|
|||||||
|
Options granted
|
1,443,810
|
16.80
|
1,877
|
|||||||||
|
Options exercised
|
(1,552,742
|
)
|
3.53
|
(22,623
|
)
|
|||||||
|
Options forfeited/cancelled
|
(189,495
|
)
|
11.35
|
(1,279
|
)
|
|||||||
|
Options outstanding at December 31, 2012
|
6,296,709
|
$
|
7.51
|
$
|
66,682
|
|||||||
|
Options granted
|
1,987,952
|
23.60
|
22,543
|
|||||||||
|
Options exercised
|
(2,156,898
|
)
|
4.31
|
(66,066
|
)
|
|||||||
|
Options forfeited/cancelled
|
(304,227
|
)
|
11.50
|
(7,131
|
)
|
|||||||
|
Options outstanding at December 31, 2013
|
5,823,536
|
$
|
13.99
|
$
|
122,003
|
|||||||
|
|
||||||||||||
|
Options vested and exercisable at December 31, 2013
|
2,555,245
|
$
|
5.89
|
$
|
74,230
|
|||||||
|
Options expected to vest
|
3,010,762
|
$
|
20.19
|
$
|
44,409
|
|||||||
The fair value of each option award is estimated on the date of grant using the Black-Scholes option valuation model. The Company recognizes the fair value of each option as compensation expense ratably using the straight-line method over the service period (generally the vesting period). The Black-Scholes model incorporates the following assumptions:
a.
Expected volatility
— the Company estimated the volatility of its common stock at the date of grant using historical volatility of peer public companies for the year ended December 31, 2011. In order to compare volatilities for different interval lengths, the Company expresses volatility in annual terms. The Company applied the same approach regarding the stock options issued in 2013 and 2012 due to insufficiency of historical volatility data of its stock prices at the time of grant. The expected volatility was 46% in both years ended December 31, 2013 and 2012, and 43% in the year ended December 31, 2011.
b.
Expected term
— the Company estimates the expected term of options granted using the simplified method of determining expected term as outlined in SEC Staff Accounting Bulletin 107 as used for grants. The expected term was 6.24 years in 2013, and 6.25 years in both 2012 and 2011.
c.
Risk-free interest rate
— the Company estimates the risk-free interest rate using the U.S. Treasury yield curve for periods equal to the expected term of the options in effect at the time of grant. The risk-free rate was approximately 1.41%, 1.13% and 2.05% in 2013, 2012 and 2011, respectively.
d.
Dividends
— the Company uses an expected dividend yield of zero since it has never declared or paid any dividends on its common stock. The Company intends to retain any earnings to fund future growth and the operation of its business and, therefore, does not anticipate paying any cash dividends in the foreseeable future.
Additionally, the Company estimates forfeitures at the time of grant and revises those estimates in subsequent periods if actual forfeitures differ from those estimates. It uses a combination of historical data and other factors to estimate pre-vesting option forfeitures and record share-based compensation expense only for those awards that are expected to vest.
As of December 31, 2013, there was $28,921 of total unrecognized compensation cost related to non-vested share-based compensation awards. That cost is expected to be recognized over the next two years using the weighted average method.
F-28
Summary of restricted stock activity is presented below:
|
|
Number of
Shares
|
|
Weighted Average
Grant Date Fair
Value Per Share
|
|||||
|
Unvested restricted stock outstanding at January 1, 2011
|
—
|
|
$ | — | ||||
|
Restricted stock granted
|
—
|
|
— | |||||
|
Restricted stock vested
|
—
|
|
— | |||||
|
Unvested restricted stock outstanding at December 31, 2011
|
—
|
$
|
—
|
|||||
|
Restricted stock granted
|
757,272
|
17.15
|
||||||
|
Restricted stock vested
|
(97,400
|
)
|
12.00
|
|||||
|
Unvested restricted stock outstanding at December 31, 2012
|
659,872
|
$
|
17.92
|
|||||
|
Restricted stock granted
|
15,524
|
23.69
|
||||||
|
Restricted stock vested
|
(330,468
|
)
|
17.33
|
|||||
|
Unvested restricted stock outstanding at December 31, 2013
|
344,928
|
$
|
18.74
|
|||||
15.
EARNINGS PER SHARE
Basic EPS is computed by dividing the net income applicable to common stockholders for the period by the weighted average number of shares of common stock outstanding during the same period. Our Series A-1 Preferred, Series A-2 Preferred, Series A-3 Preferred, restricted stock units and puttable common stock were considered participating securities since these securities had non-forfeitable rights to dividends or dividend equivalents during the contractual period of the award and thus required the two-class method of computing EPS. When calculating diluted EPS, the numerator is computed by adding back the undistributed earnings allocated to the participating securities in arriving at the basic EPS and then reallocating such undistributed earnings among the company’s common stock, participating securities and the potential common shares that result from the assumed exercise of all dilutive options. The denominator is increased to include the number of additional common shares that would have been outstanding had the options been issued.
The following table sets forth the computation of basic and diluted earnings per share as follows:
|
|
Year Ended December 31,
|
|||||||||||
|
|
2013
|
2012
|
2011
|
|||||||||
|
Numerator for common earnings per share:
|
|
|
|
|||||||||
|
Net income
|
$
|
61,994
|
$
|
54,484
|
$
|
44,353
|
||||||
|
Accretion of preferred stock
|
—
|
—
|
(17,563
|
)
|
||||||||
|
Net income allocated to participating securities
|
—
|
(3,341
|
)
|
(15,025
|
)
|
|||||||
|
Effect on income available from redemption of preferred stock
|
—
|
—
|
—
|
|||||||||
|
Numerator for basic/ (common) earnings per share
|
61,994
|
51,143
|
11,765
|
|||||||||
|
Effect on income available from reallocation of options
|
—
|
261
|
1,185
|
|||||||||
|
Numerator for diluted/ (common) earnings per share
|
$
|
61,994
|
$
|
51,404
|
$
|
12,950
|
||||||
|
Numerator for (puttable common) earnings per share:
|
||||||||||||
|
Net income allocated to basic (puttable common)
|
—
|
—
|
26
|
|||||||||
|
Effect on income available from reallocation of options
|
—
|
—
|
(12
|
)
|
||||||||
|
Numerator for diluted (puttable common) earnings per share
|
—
|
—
|
14
|
|||||||||
|
Denominator for basic (common) earnings per share:
|
||||||||||||
|
Weighted average common shares outstanding
|
45,754
|
40,190
|
17,094
|
|||||||||
|
Effect of dilutive securities:
|
||||||||||||
|
Stock options
|
2,604
|
3,631
|
3,379
|
|||||||||
|
Denominator for diluted (common) earnings per share
|
48,358
|
43,821
|
20,473
|
|||||||||
|
Denominator for basic and diluted (puttable common) earnings per share:
|
||||||||||||
|
Weighted average puttable common shares outstanding
|
—
|
—
|
18
|
|||||||||
|
Earnings per share:
|
||||||||||||
|
Basic (common)
|
$
|
1.35
|
$
|
1.27
|
$
|
0.69
|
||||||
|
Basic (puttable common)
|
$
|
—
|
$
|
—
|
$
|
1.42
|
||||||
|
Diluted (common)
|
$
|
1.28
|
$
|
1.17
|
$
|
0.63
|
||||||
|
Diluted (puttable common)
|
$
|
—
|
$
|
—
|
$
|
0.77
|
||||||
F-29
For the years ended December 31, 2013, 2012 and 2011, options to purchase approximately 1,080, 1,534, and 572 shares of common stock, respectively, were not included in the calculation of the diluted earnings per share in corresponding periods because the effect would have been anti-dilutive.
16.
COMMITMENTS, CONTINGENCIES AND GUARANTEES
The Company leases office space under operating leases, which expire at various dates through 2019. Certain leases contain renewal provisions and generally require the Company to pay utilities, insurance, taxes, and other operating expenses. Rent expense under operating lease agreements for the years ended December 31, 2013, 2012 and 2011 was $15,664, $11,594, and $8,522 respectively. Future minimum rental payments under operating leases that have initial or remaining lease terms in excess of one year as of December 31, 2013 were as follows:
|
Year Ending December 31,
|
Operating Leases
|
|||
|
2014
|
$
|
13,924
|
||
|
2015
|
8,218
|
|||
|
2016
|
4,136
|
|||
|
2017
|
2,504
|
|||
|
2018
|
2,017
|
|||
|
Thereafter
|
480
|
|||
|
Total minimum lease payments
|
$
|
31,279
|
||
Employee Loan Program
— Beginning in third quarter of 2006, the Company started to guarantee bank loans for certain of its key employees. Under the conditions of the guarantees, the Company is required to maintain a security deposit (See Note 6). While the program has been discontinued, total commitment of the Company under these guarantees remains at $233 as of December 31, 2013. The Company estimates a probability of material losses under the program as remote, therefore, no provision for losses was recognized for the years ended December 31, 2013, 2012 and 2011.
Construction in progress
— On December 7, 2011, the Company entered into an agreement with IDEAB Project Eesti AS for the construction of an office building within the High Technologies Park in Minsk, Belarus. The building is expected to be operational in the first half of 2014. As of December 31, 2013, total outstanding commitment of the Company was $1,890.
Employee Housing Program
— In the third quarter of 2012, the Board of Directors of the Company approved the Employee Housing Program (“the Housing Program”), which assists employees in purchasing housing in Belarus (See Note 5). As of December 31, 2013, the Company’s total outstanding commitment under the Housing Program was $35.
The Company estimates a probability of material losses under the program as remote, therefore, no provision for losses was recognized for the year ended December 31, 2013.
Indemnifications
—
In the normal course of business, the Company is a party to a variety of agreements under which it may be obligated to indemnify the other party for certain matters. These obligations typically arise in contracts where the Company customarily agrees to hold the other party harmless against losses arising from a breach of representations or covenants for certain matters such as title to assets and intellectual property rights associated with the sale of products. The duration of these indemnifications varies, and in certain cases, is indefinite.
The Company is unable to reasonably estimate the maximum potential amount of future payments under these or similar agreements due to the unique facts and circumstances of each agreement and the fact that certain indemnifications provide for no limitation to the maximum potential future payments under the indemnification. Management is not aware of any such matters that historically had or would have a material effect on the consolidated financial statements of the Company.
Litigation
— From time to time, the Company is involved with litigation, claims or other contingencies. Management is not aware of any such matters that would have a material effect on the consolidated financial statements of the Company.
17.
FAIR VALUE MEASUREMENTS
The Company accounts for certain assets and liabilities at fair value. The authoritative guidance defines fair value as the exit price, or the amount that would be received to sell an asset or paid to transfer a liability in an orderly transaction between market participants as of the measurement date. The authoritative guidance also establishes a fair value hierarchy that is intended to increase consistency and comparability in fair value measurements and related disclosures. The fair value hierarchy is based on inputs to valuation techniques that are used to measure fair value that are either observable or unobservable. Observable inputs reflect assumptions market participants would use in pricing an asset or liability based on market data obtained from independent sources while unobservable inputs reflect a reporting entity’s pricing based upon their own market assumptions.
F-30
The following table represents the Company’s fair value hierarchy for its financial assets and liabilities as of December 31 2013, and 2012.
|
|
Fair Value Measurements at December 31, 2013 Using
|
|||||||||||
|
|
Level 1
|
Level 2
|
Level 3
|
|||||||||
|
Cash and cash equivalents
|
$
|
169,207
|
$
|
—
|
$
|
—
|
||||||
|
Time deposits and restricted cash
|
—
|
1,711
|
—
|
|||||||||
|
Employee loans
|
—
|
—
|
6,390
|
|||||||||
|
Total
|
$
|
169,207
|
$
|
1,711
|
$
|
6,390
|
||||||
|
|
Fair Value Measurements at December 31, 2012 Using
|
|||||||||||
|
|
Level 1
|
Level 2
|
Level 3
|
|||||||||
|
Cash and cash equivalents
|
$
|
118,112
|
$
|
—
|
$
|
—
|
||||||
|
Time deposits and restricted cash
|
—
|
2,133
|
—
|
|||||||||
|
Employee loans
|
—
|
—
|
429
|
|||||||||
|
Total
|
$
|
118,112
|
$
|
2,133
|
$
|
429
|
||||||
During the years ended December 31, 2013 and 2012, the Company issued a total of $8,963 and $566 of loans to its employees, respectively, and received $3,088 and $640 in loan repayments during the same periods, respectively.
During the years ended December 31, 2013 and 2012, there were no transfers amongst Level 1, Level 2, or Level 3 financial assets and liabilities.
18.
OPERATING SEGMENTS
The Company reports segment information based on the managerial responsibility for its client base. Because managerial responsibility for a particular client relationship generally correlates with the client’s geographic location, there is a high degree of similarity between client locations and the geographic boundaries of the Company’s reportable segments. In some specific cases, however, managerial responsibility for a particular client is assigned to a management team in another region, usually based on the strength of the relationship between client executives and particular members of EPAM’s senior management team. In a case like this, the client’s activity would be reported through the management team’s reportable segment.
The Company’s reportable segments are North America, Europe, Russia and Other. The Company’s Chief Operating Decision Maker (“CODM”) evaluates its performance and allocates resources based on segment revenues and operating profit. Segment operating profit is defined as income from operations before unallocated costs. Generally, operating expenses for each operating segment have similar characteristics and are subject to similar factors, pressures and challenges. Expenses included in segment operating profit consist principally of direct selling and delivery costs as well as an allocation of certain shared services expenses. Certain expenses are not allocated to specific segments, as management does not believe it is practical to allocate such costs to individual segments because they are not directly attributable to any specific segment. Further, stock-based compensation expense is not allocated to individual segments in internal management reports used by the CODM. Accordingly, these expenses are separately disclosed as “unallocated” and adjusted only against the Company’s total income from operations.
Revenues from external clients and segment operating profit, before unallocated expenses, for the North America, Europe, Russia and Other reportable segments were as follows:
|
|
Year Ended December 31,
|
|||||||||||
|
|
2013
|
2012
|
2011
|
|||||||||
|
Total segment revenues:
|
|
|
|
|||||||||
|
North America
|
$
|
284,636
|
$
|
197,271
|
$
|
151,707
|
||||||
|
Europe
|
204,150
|
168,913
|
123,510
|
|||||||||
|
Russia
|
55,764
|
50,552
|
46,219
|
|||||||||
|
Other
|
10,493
|
16,986
|
12,851
|
|||||||||
|
Total segment revenues
|
$
|
555,043
|
$
|
433,722
|
$
|
334,287
|
||||||
|
Segment operating profit:
|
||||||||||||
|
North America
|
$
|
66,814
|
$
|
38,671
|
$
|
33,744
|
||||||
|
Europe
|
34,573
|
32,750
|
25,098
|
|||||||||
|
Russia
|
7,077
|
9,049
|
10,445
|
|||||||||
|
Other
|
844
|
6,985
|
2,416
|
|||||||||
|
Total segment operating profit
|
$
|
109,308
|
$
|
87,455
|
$
|
71,703
|
||||||
F-31
During the years ended December 31, 2013 and 2012, there were no customers that represented at least 10% of total revenues. During the year ended December 31, 2011, revenues from one customer, Thomson Reuters, accounted for 10.7% of total revenues, or $35,903, and were included within our North America segment.
Intersegment transactions were excluded from the above on the basis they are neither included into the measure of a segment’s profit and loss by the chief operating decision maker, nor provided to the chief operating decision maker on a regular basis.
Reconciliation of reportable segment revenues and operating profit to the consolidated income before provision for income taxes is presented below:
|
|
Year Ended December 31,
|
|||||||||||
|
|
2013
|
2012
|
2011
|
|||||||||
|
Total segment revenues
|
$
|
555,043
|
$
|
433,722
|
$
|
334,287
|
||||||
|
Unallocated revenue
|
74
|
77
|
241
|
|||||||||
|
Revenues
|
$
|
555,117
|
$
|
433,799
|
$
|
334,528
|
||||||
|
|
||||||||||||
|
Total segment operating profit
|
$
|
109,308
|
$
|
87,455
|
$
|
71,703
|
||||||
|
Unallocated Amounts:
|
||||||||||||
|
Other revenue
|
74
|
77
|
241
|
|||||||||
|
Stock-based compensation expense
|
(13,150
|
)
|
(6,826
|
)
|
(2,866
|
)
|
||||||
|
Non-corporate taxes
|
(3,201
|
)
|
(2,346
|
)
|
(2,722
|
)
|
||||||
|
Professional fees
|
(3,651
|
)
|
(2,850
|
)
|
(2,802
|
)
|
||||||
|
Depreciation and amortization
|
(2,829
|
)
|
(1,100
|
)
|
(810
|
)
|
||||||
|
Bank charges
|
(1,194
|
)
|
(1,136
|
)
|
(793
|
)
|
||||||
|
Goodwill impairment loss (Note 3)
|
—
|
—
|
(1,697
|
)
|
||||||||
|
Stock charge
|
—
|
(640
|
)
|
—
|
||||||||
|
Provision for bad debts
|
(36
|
)
|
—
|
—
|
||||||||
|
Other corporate expenses
|
(8,828
|
)
|
(6,628
|
)
|
(5,246
|
)
|
||||||
|
Income from operations
|
76,493
|
66,006
|
55,008
|
|||||||||
|
Interest and other income, net
|
3,077
|
1,941
|
1,422
|
|||||||||
|
Foreign exchange loss
|
(2,800
|
)
|
(2,084
|
)
|
(3,638
|
)
|
||||||
|
Income before provision for income taxes
|
$
|
76,770
|
$
|
65,863
|
$
|
52,792
|
||||||
Geographic Area Information
Management has determined that it is not practical to allocate identifiable assets by segment since such assets are used interchangeably amongst the segments. Geographical information about the Company’s long-lived assets based on physical location of the assets follows:
|
|
December 31,
2013
|
December 31,
2012
|
||||||
|
Belarus
|
$
|
38,697
|
$
|
40,095
|
||||
|
Ukraine
|
5,525
|
5,357
|
||||||
|
Russia
|
3,414
|
3,234
|
||||||
|
United States
|
2,217
|
2,048
|
||||||
|
Hungary
|
2,644
|
1,744
|
||||||
|
Other
|
818
|
657
|
||||||
|
Total
|
$
|
53,315
|
$
|
53,135
|
||||
Long-lived assets included property and equipment, net of accumulated depreciation and amortization.
F-32
Information about the Company’s revenues by client location is presented below:
|
|
Year Ended December 31,
|
|||||||||||
|
|
2013
|
2012
|
2011
|
|||||||||
|
United States
|
$
|
247,979
|
$
|
197,593
|
$
|
163,068
|
||||||
|
United Kingdom
|
108,892
|
98,346
|
70,989
|
|||||||||
|
Russia
|
53,328
|
47,507
|
43,799
|
|||||||||
|
Switzerland
|
51,941
|
30,120
|
15,870
|
|||||||||
|
Canada
|
33,759
|
9,256
|
2,058
|
|||||||||
|
Germany
|
20,261
|
16,391
|
7,909
|
|||||||||
|
Kazakhstan
|
9,886
|
11,352
|
8,845
|
|||||||||
|
Netherlands
|
7,719
|
3,127
|
4,031
|
|||||||||
|
Sweden
|
5,742
|
4,913
|
5,292
|
|||||||||
|
Spain
|
1,957
|
1,710
|
1,893
|
|||||||||
|
Ukraine
|
681
|
4,733
|
891
|
|||||||||
|
Other locations
|
5,346
|
2,334
|
3,707
|
|||||||||
|
Reimbursable expenses and other revenues
|
7,626
|
6,417
|
6,176
|
|||||||||
|
Revenues
|
$
|
555,117
|
$
|
433,799
|
$
|
334,528
|
||||||
Service Offering Information
Information about the Company’s revenues by service offering is presented below:
|
|
Year Ended December 31,
|
|||||||||||
|
|
2013
|
2012
|
2011
|
|||||||||
|
Software development
|
$
|
374,426
|
$
|
290,139
|
$
|
219,211
|
||||||
|
Application testing services
|
109,222
|
85,849
|
67,840
|
|||||||||
|
Application maintenance and support
|
45,971
|
36,056
|
29,287
|
|||||||||
|
Infrastructure services
|
14,433
|
12,424
|
8,488
|
|||||||||
|
Licensing
|
3,439
|
2,914
|
3,526
|
|||||||||
|
Reimbursable expenses and other revenues
|
7,626
|
6,417
|
6,176
|
|||||||||
|
Revenues
|
$
|
555,117
|
$
|
433,799
|
$
|
334,528
|
||||||
19.
QUARTERLY FINANCIAL DATA (UNAUDITED)
Summarized quarterly results for the two years ended December 31, 2013 and 2012 were as follows:
|
|
Three Months Ended
|
|||||||||||||||||||
|
2013
|
March 31
|
June 30
|
September 30
|
December 31
|
Full Year
|
|||||||||||||||
|
Revenues
|
$
|
124,198
|
$
|
133,184
|
$
|
140,150
|
$
|
157,585
|
$
|
555,117
|
||||||||||
|
Operating expenses:
|
||||||||||||||||||||
|
Cost of revenues (exclusive of depreciation and amortization)
|
77,937
|
83,547
|
88,539
|
97,627
|
347,650
|
|||||||||||||||
|
Selling, general and administrative expenses
|
27,083
|
28,541
|
27,893
|
32,980
|
116,497
|
|||||||||||||||
|
Depreciation and amortization expense
|
3,617
|
3,854
|
3,906
|
3,743
|
15,120
|
|||||||||||||||
|
Other operating (income)/ expenses, net
|
25
|
(293
|
)
|
(418
|
)
|
43
|
(643
|
)
|
||||||||||||
|
Income from operations
|
15,536
|
17,535
|
20,230
|
23,192
|
76,493
|
|||||||||||||||
|
Interest and other income, net
|
630
|
769
|
846
|
832
|
3,077
|
|||||||||||||||
|
Foreign exchange loss
|
(499
|
)
|
(869
|
)
|
(720
|
)
|
(712
|
)
|
(2,800
|
)
|
||||||||||
|
Income before provision for income taxes
|
15,667
|
17,435
|
20,356
|
23,312
|
76,770
|
|||||||||||||||
|
Provision for income taxes
|
2,987
|
3,317
|
3,919
|
4,553
|
14,776
|
|||||||||||||||
|
Net income
|
$
|
12,680
|
$
|
14,118
|
$
|
16,437
|
$
|
18,759
|
$
|
61,994
|
||||||||||
|
Comprehensive income
|
$
|
10,337
|
$
|
13,073
|
$
|
19,412
|
$
|
18,361
|
$
|
61,183
|
||||||||||
|
Basic net income per share(1)
|
$
|
0.28
|
$
|
0.31
|
$
|
0.36
|
$
|
0.40
|
$
|
1.35
|
||||||||||
|
Diluted net income per share(1)
|
$
|
0.27
|
$
|
0.29
|
$
|
0.34
|
$
|
0.38
|
$
|
1.28
|
||||||||||
|
|
|
|
(1)
|
Earnings per share amounts for each quarter may not necessarily total to the yearly earnings per share due to the weighting of shares outstanding on a quarterly and year to date basis.
|
F-33
|
|
Three Months Ended
|
|||||||||||||||||||
|
2012
|
March 31
|
June 30
|
September 30
|
December 31
|
Full Year
|
|||||||||||||||
|
Revenues
|
$
|
94,383
|
$
|
103,800
|
$
|
110,078
|
$
|
125,538
|
$
|
433,799
|
||||||||||
|
Operating expenses:
|
||||||||||||||||||||
|
Cost of revenues (exclusive of depreciation and amortization)
|
60,175
|
63,803
|
69,099
|
77,284
|
270,361
|
|||||||||||||||
|
Selling, general and administrative expenses
|
17,627
|
20,711
|
21,153
|
26,377
|
85,868
|
|||||||||||||||
|
Depreciation and amortization expense
|
2,211
|
2,423
|
3,040
|
3,208
|
10,882
|
|||||||||||||||
|
Other operating expenses, net
|
586
|
33
|
50
|
13
|
682
|
|||||||||||||||
|
Income from operations
|
13,784
|
16,830
|
16,736
|
18,656
|
66,006
|
|||||||||||||||
|
Interest and other income, net
|
476
|
460
|
486
|
519
|
1,941
|
|||||||||||||||
|
Foreign exchange gain/ (loss)
|
80
|
(1,394
|
)
|
(635
|
)
|
(135
|
)
|
(2,084
|
)
|
|||||||||||
|
Income before provision for income taxes
|
14,340
|
15,896
|
16,587
|
19,040
|
65,863
|
|||||||||||||||
|
Provision for income taxes
|
2,241
|
2,575
|
2,522
|
4,041
|
11,379
|
|||||||||||||||
|
Net income
|
$
|
12,099
|
$
|
13,321
|
$
|
14,065
|
$
|
14,999
|
$
|
54,484
|
||||||||||
|
Comprehensive income
|
$
|
13,711
|
$
|
10,857
|
$
|
16,769
|
$
|
15,640
|
$
|
56,977
|
||||||||||
|
Basic net income per share(1)
|
$
|
0.30
|
$
|
0.31
|
$
|
0.33
|
$
|
0.35
|
$
|
1.27
|
||||||||||
|
Diluted net income per share(1)
|
$
|
0.27
|
$
|
0.29
|
$
|
0.30
|
$
|
0.32
|
$
|
1.17
|
||||||||||
|
|
|
|
(1)
|
Earnings per share amounts for each quarter may not necessarily total to the yearly earnings per share due to the weighting of shares outstanding on a quarterly and year to date basis.
|
| 20. | SUBSEQUENT EVENTS |
On March 5, 2014, the Company entered into an agreement to acquire substantially all assets and certain specified liabilities of Netsoft Holdings LLC, a U.S.-based information technology services company with a focus on healthcare industry. In connection with this transaction, the Company also acquired substantially all assets of an Armenian-based company Ozsoft LLC. According to the purchase agreement, the aggregate purchase price, including any additional earn-out payments, will not exceed $6,000.
F-34
TABLE OF CONTENTS
Part IItem 1. BusinessItem 1B. Unresolved Staff CommentsItem 2. PropertiesItem 3. Legal ProceedingsItem 4. Mine Safety DisclosuresPart IIItem 5. Market For Registrant S Common Equity, Related Stockholder Matters and Issuer Purchases Of Equity SecuritiesItem 6. Selected Financial DataItem 7. Management S Discussion and Analysis Of Financial Condition and Results Of OperationsItem 7A. Quantitative and Qualitative Disclosures About Market RiskItem 8. Financial Statements and Supplementary DataItem 9. Changes in and Disagreements with Accountants on Accounting and Financial DisclosureItem 9A. Controls and ProceduresItem 9B. Other InformationPart IIIItem 10. Directors, Executive Officers and Corporate GovernanceItem 11. Executive CompensationItem 12. Security Ownership Of Certain Beneficial Owners and Management and Related Stockholder MattersItem 13. Certain Relationships and Related Transactions, and Director IndependenceItem 14. Principal Accountant Fees and ServicesPart IVItem 15. Exhibits, Financial Statement Schedules