EVOLUTION PETROLEUM CORP
10-Ks and 10-Qs
|
|
|
|
|
|
|
|
|
|
|
|
|
|
|
|
|
|
|
|
|
|
|
|
|
|
|
|
|
|
|
|
|
|
|
|
|
|
|
|
|
|
|
|
|
|
|
|
|
|
|
|
|
|
|
|
UNITED STATES
SECURITIES AND EXCHANGE COMMISSION
Washington, D.C. 20549
FORM 10-K
|
ý
|
ANNUAL REPORT PURSUANT TO SECTION 13 OR 15(d) OF THE SECURITIES EXCHANGE ACT OF 1934
|
|
For the fiscal year ended
June 30, 2018
|
o
|
TRANSITION REPORT PURSUANT TO SECTION 13 OR 15(d) OF THE SECURITIES EXCHANGE ACT OF 1934
|
|
For the transition period from to
Commission File Number 001-32942
EVOLUTION PETROLEUM CORPORATION
(Exact name of registrant as specified in its charter)
|
Nevada
(State or other jurisdiction of
incorporation or organization)
|
|
41-1781991
(IRS Employer
Identification No.)
|
|
1155 Dairy Ashford Road, Suite 425, Houston, Texas 77079
(Address of principal executive offices and zip code)
|
||
|
(713) 935-0122
(Registrant's telephone number, including area code)
|
||
Securities registered pursuant to Section 12(b) of the Act:
|
Title of Each Class
|
|
Name of Each Exchange On Which Registered
|
||
|
Common Stock, $0.001 par value
|
|
NYSE American
|
||
|
8.5% Series A Cumulative Preferred Stock, $0.001 par value
|
|
NYSE American
|
||
Securities registered pursuant to Section 12(g) of the Act:
None
(Title of Class)
Indicate by check mark if the registrant is a well-known seasoned issuer, as defined in Rule 405 of the Securities Act. Yes:
o
No:
ý
Indicate by check mark if the registrant is not required to file reports pursuant to Section 13 or Section 15(d) of the Act. Yes:
o
No:
ý
Indicate by check mark whether the registrant (1) has filed all reports required to be filed by Section 13 or 15(d) of the Securities Exchange Act of 1934 during the preceding 12 months (or for such shorter period that the registrant was required to file such reports), and (2) has been subject to such filing requirements for the past 90 days. Yes:
ý
No:
o
Indicate by check mark whether the registrant has submitted electronically and posted on its corporate Web site, if any, every Interactive Data File required to be submitted and posted pursuant to Rule 405 of Regulation S-T (§ 232.405 of this chapter) during the preceding 12 months (or for such shorter period that the registrant was required to submit and post such files). Yes:
ý
No:
o
Indicate by check mark if disclosure of delinquent filers pursuant to Item 405 of Regulation S-K (§ 229.405 of this chapter) is not contained herein, and will not be contained, to the best of registrant's knowledge, in definitive proxy or information statements incorporated by reference in Part III of this Form 10-K or any amendment to this Form 10-K.
o
Indicate by check mark whether the registrant is a large accelerated filer, an accelerated filer, a non-accelerated filer, smaller reporting company, or an emerging growth company. See the definition of "large accelerated filer", "accelerated filer", "smaller reporting company" and "emerging growth company" in Rule 12b-2 of the Exchange Act.
|
Large accelerated filer
o
|
|
Accelerated filer
ý
|
|
Non-accelerated filer
o
|
(Do not check if a smaller reporting company)
|
Smaller reporting company
o
|
|
Emerging growth company
o
|
|
|
If an emerging growth company, indicate by check mark if the registrant has elected not to use the extended transition period for complying with any new or revised financial accounting standards provided pursuant to Section 13(a) of the Exchange Act.
o
Indicate by check mark whether the registrant is a shell company (as defined in Rule 12b-2 of the Exchange Act.). Yes:
o
No:
ý
The aggregate market value of the voting and non-voting common equity held by non-affiliates on December 31, 2017, the last business day of the registrant’s most recently completed second fiscal quarter, based on the closing price on that date of $6.85 on the NYSE American was
$127,161,941
.
The number of shares outstanding of the registrant's common stock, par value $0.001, as of
September 4, 2018
, was
33,171,514
.
DOCUMENTS INCORPORATED BY REFERENCE
Portions of the proxy statement related to the registrant's
2018
Annual Meeting of Stockholders to be filed within 120 days of the end of the fiscal year covered by this report are incorporated by reference into Part III of this report.
EVOLUTION PETROLEUM CORPORATION AND SUBSIDIARIES
2018
ANNUAL REPORT ON FORM 10-K
TABLE OF CONTENTS
|
|
|
Page
|
||
|
|
||||
|
Item 1
.
|
||||
This Form 10-K and the information referenced herein contain forward-looking statements within the meaning of the Private Securities Litigations Reform Act of 1995, Section 27A of the Securities Act of 1933 and Section 21E of the Securities Exchange Act of 1934. The words "plan," "expect," "project," "estimate," "assume," "believe," "anticipate," "intend," "budget," "forecast," "predict" and other similar expressions are intended to identify forward-looking statements. These statements appear in a number of places and include statements regarding our plans, beliefs or current expectations, including the plans, beliefs and expectations of our officers and directors. When considering any forward-looking statement, you should keep in mind the risk factors that could cause our actual results to differ materially from those contained in any forward-looking statement. Important factors that could cause actual results to differ materially from those in the forward-looking statements herein include the timing and extent of changes in commodity prices for oil and natural gas, operating risks and other risk factors as described in this Annual Report on Form 10-K as filed with the Securities and Exchange Commission ("SEC"). Furthermore, the assumptions that support our forward-looking statements are based upon information that is currently available and is subject to change. We specifically disclaim all responsibility to publicly update any information contained in a forward-looking statement or any forward-looking statement in its entirety and therefore disclaim any resulting liability for potentially related damages. All forward-looking statements attributable to Evolution Petroleum Corporation are expressly qualified in their entirety by this cautionary statement.
We use the terms, "EPM," "Company," "we," "us" and "our" to refer to Evolution Petroleum Corporation, and unless the context otherwise requires, its wholly-owned subsidiaries.
Item 1. Business
Note: See Glossary of Selected Petroleum Industry Terms at the back of this document - refer to Table of Contents
General
Evolution Petroleum Corporation is an oil and gas company focused on delivering a sustainable dividend yield to its shareholders through the ownership, management and development of producing oil and gas properties. The Company's long-term goal is to build a diversified portfolio of oil and gas assets primarily through acquisition, while seeking opportunities to maintain and increase production through selective development, production enhancement and other exploitation efforts on its properties. Our largest active investment is our interest in a CO
2
enhanced oil recovery project in Louisiana's Delhi field.
Our operations began in September 2003. In May 2004, our predecessor, Natural Gas Systems, Inc., merged into a wholly-owned subsidiary of Reality Interactive, Inc., an inactive public company, which was renamed Natural Gas Systems, Inc. ("NGS"). In connection with the listing of NGS shares on the American Stock Exchange (currently the NYSE American) in July 2006, NGS was renamed Evolution Petroleum Corporation. Our principal executive offices are located at 1155 Dairy Ashford Road, Suite 425, Houston, Texas 77079, and our telephone number is (713) 935-0122. We maintain a website at www.evolutionpetroleum.com, but information contained on our website does not constitute part of this document. Our common stock is traded on the NYSE American under the ticker symbol "EPM".
At June 30,
2018
, we had four full-time employees, not including contract personnel and outsourced service providers. None of the Company’s employees are currently represented by a union, and the Company believes that it has excellent relations with its employees. Our team is broadly experienced in oil and gas operations, development, acquisitions and financing. We follow a strategy of outsourcing most of our property accounting, human resources, administrative and other non-core functions. As a result of the retirement of Randy Keys, President and Chief Executive Officer on May 31, 2018, the Board of Directors immediately moved to name Robert Herlin to act as Interim Chief Executive Officer and to commence a search for a permanent Chief Executive Officer. Additionally, the Board of Directors created a temporary Transition Services Committee, consisting solely of Director William Dozier, to aid and assist management in primarily evaluating potential property acquisitions and operational matters. Both of these appointments are deemed temporary while the ongoing search for a permanent Chief Executive Officer is resolved.
Business Strategy
Evolution Petroleum Corporation is an oil and gas company focused on delivering a sustainable dividend yield to its shareholders through the ownership, management and development of producing oil and gas properties. The Company's long-term goal is to build a diversified portfolio of oil and gas assets primarily through acquisition, while seeking opportunities to maintain and increase production through selective development, production enhancement and other exploitation efforts on its properties. Our largest current asset is our interest in a CO
2
enhanced oil recovery project in Louisiana's Delhi field.
Delhi Field - Enhanced Oil Recovery
- Onshore Louisiana
Our working and royalty interests in the Delhi Holt-Bryant Unit in the Delhi field (the "Unit"), located in Northeast Louisiana, are currently our sole producing assets. The Unit is approximately 13,636 acres in size and has had a prolific production history totaling approximately 195 million bbls of oil through primary and limited secondary recovery operations since its discovery in the mid-1940s. At the time of our purchase of the field in 2003, the Unit had minimal production. We conveyed our working interest in the field to a subsidiary of Denbury Resources, Inc. in May 2006 for $50 million for the purpose of installing an enhanced oil recovery ("EOR") project in the field. We retained a 23.9% reversionary working interest
1
upon payout of the project, as defined in the purchase and sale agreements. Since EOR production began in March 2010, the Unit has produced over 17 million bbls of oil.
We own two types of interests in the Unit:
|
•
|
7.2% of overriding royalty interests that are in effect for the life of the Unit and mineral royalty interests, free of all operating and capital cost burdens; and
|
|
•
|
A 23.9% working interest with an associated 19.0% net revenue interest. The working interest reverted to us effective November 1, 2014. Upon the occurrence of this contractual payout, we began bearing 23.9% of all operating expenses and capital expenditures.
|
|
•
|
The above interests are separate and give us a combined net revenue interest of 26.2%.
|
Our independent reservoir engineers, DeGolyer & MacNaughton, assigned the following estimated reserves net to our interests at Delhi as of June 30,
2018
. Equivalent oil reserves are defined as six MCF of gas and 42 gallons of natural gas liquids to one barrel of oil conversion ratio.
|
•
|
9.4 million bbls of proved oil equivalent reserves, with a Standardized Measure of Discounted Future Net Cash Flows ("Standardized Measure") of $119 million, and PV-10* of $146 million
|
|
•
|
4.5 million bbls of probable** oil equivalent reserves
|
|
•
|
4.6 million bbls of possible** oil equivalent reserves
|
_______________________________________________________________________________
|
*
|
PV-10 of Proved reserves is a non-GAAP measure, reconciled to the Standardized Measure at "Estimated Oil and Natural Gas Reserves and Estimated Future Net Revenues" under
Item 2. Properties
of this Form 10-K. Both the Standardized Measure and PV-10 are based on the average first day of the month net commodity prices received at the Delhi field in the twelve months ending June 30, 2018, which were $57.50 per barrel of oil and $38.97 per barrel of natural gas liquids ("NGL"). Probable and possible reserves are not recognized under GAAP nor is there a comparable GAAP measure for probable and possible reserves.
|
|
**
|
With respect to the above reserve numbers,
and references to Probable and Possible reserves throughout this document,
estimates of Probable and Possible reserves are inherently imprecise. When producing an estimate of the amount of oil and natural gas that is recoverable from a particular reservoir, Probable reserves are those additional reserves that are less certain to be recovered than Proved reserves and there must be at least a 50% probability that the actual quantities recovered will equal or exceed the Proved plus Probable reserve estimates. Possible reserves are even less certain and there must be at least a 10% probability that the actual quantities recovered will equal or exceed the sum of Proved, Probable and Possible reserve estimates. All categories of reserves are continually subject to revisions based on production history, results of additional exploration and development, price changes and other factors. Estimates of Probable and Possible reserves are by their nature much more speculative than estimates of Proved reserves and are subject to greater uncertainties, and accordingly the likelihood of recovering those reserves is subject to substantially greater risk. These three reserve categories have not been adjusted to different levels of recovery risk among these categories and are therefore not comparable and are not meaningfully combined.
|
The operator originally planned six primary phases for the installation of the CO
2
flood in the Delhi field. Four of these phases have been completed as of June 30, 2017 and two remain undeveloped. One of the remaining two phases (Phase V) is reflected as proved undeveloped in our current reserves report and the other was removed from proved reserves (Phase VI) as it was not deemed economic under current pricing guidelines for SEC purposes.
Phase I began CO
2
injection in November 2009. First oil production response occurred in March 2010 and production in the field increased to approximately 1,000 gross barrels of oil per day by December 2010.
Implementation of Phase II, which was more than double the size of Phase I, commenced with incremental CO
2
injection at the end of December 2010. First oil production response from Phase II occurred during March 2011, and field gross production increased to more than 4,000 barrels of oil per day by June 2011.
Phase III was installed during calendar 2011, and was expanded twice during calendar 2011. Production subsequently increased to more than 5,000 gross barrels of oil per day.
Phase IV was substantially installed during the first six months of calendar 2012. During early calendar 2013, the operator intensified development in the previously redeveloped western side of the field based on production results and new geological mapping that included the results of seismic data acquired over the last few years. Gross field production increased to more than 7,500 gross barrels of oil per day.
2
In June 2013, following a fluid release event that consisted of the uncontrolled release of CO
2,
water, natural gas and a small amount of oil from a previously plugged well in the southwest part of the field, the operator temporarily suspended CO
2
injection in most of the southwestern tip of the field. The operator has fully remediated the affected area, but has isolated that part of the field with a water curtain, thus removing that area from the CO
2
flood.
This fluid release event, along with other contractual disputes, caused the Company to file suit against the operator in December 2013. In June 2016, we reached a settlement with the operator as described in Note 21 – Delhi Field Litigation Settlement.
Subsequent to the reversion of our working interest to us in November 2014, the operator initiated work on the Phase V expansion of the CO
2
flood in the undeveloped eastern part of the field. This project is sometimes referred to as Test Site 5. These operations were suspended shortly after reversion when the operator made significant cuts in its capital budget as a result of declining oil prices. Resumption of this work has been electively delayed due to prevailing oil prices and the partners' allocation of capital to other Delhi projects, primarily the large investment in the NGL plant discussed below. It was further electively delayed based on the conclusion that the economics of the project would be improved if it were implemented after completion of the NGL plant, which has now occurred. We believe that the Phase V expansion of the CO
2
flood has favorable economics, particularly in the current oil price environment, and we expect this project to expand the CO
2
flood to resume within the next year.
In February 2015, we began construction of an NGL recovery plant in the Delhi Field, which was completed and operational in December 2016. Our net cost for the NGL plant totaled $27 million, which included $0.3 million in September 2017 for capital upgrades to the inlet of recycle plant to bring output capacity up to its expected level.
The NGL plant extracts methane and NGL's from the CO
2
recycle stream. The methane and part of the ethane produced by the NGL plant are used to generate electrical power in the field. The extracted NGL's are sold at the field to a purchaser who transports them by truck to a plant for further processing. In addition to the value of these hydrocarbon products, the increased purity of the CO
2
stream re-injected into the field should result in operational benefits to the CO
2
flood.
In March 2018, the operator began a planned twelve-well infill drilling program in the Delhi field. This program, which has an expected net cost to the Company of approximately $4.7 million, targets productive oil zones in the developed areas of the field that are not being swept effectively by the current CO
2
flood. This infill program is expected to both add production and increase ultimate recoveries above the current proved producing oil reserves. Evolution's forecast for the remaining net cost to the Company for this project is approximately $1.9 million.
In conjunction with the infill drilling program, the operator plans to drill the last two wells of a six-well water injection program on the eastern edge of the planned Phase V expansion of the Delhi field. The Company expects all of these projects to be completed by the end of calendar year 2018. In addition to the planned capital spending discussed above, the Company continues to identify and execute successful capital workover projects to improve conformance and production in the field. These projects are not individually material and are unlikely to have a significant impact on capital spending going forward. The operator has further identified other areas in the Delhi field for potential expansion of the CO
2
flood, but the Company has not yet quantified any reserves with respect to such areas.
Artificial Lift Technology (GARP
®
)
We previously owned artificial lift technology registered as GARP
®
(Gas Assisted Rod Pump) that was developed internally by our former Senior Vice President of Operations. Its design is intended to increase production and extend the life of horizontal and vertical wells with gas, oil or associated water production with the expectation of recovering additional reserves at an economically attractive cost per BOE. We received a patent on our GARP
®
technology on August 30, 2011, which provides U.S. patent protection for the technology through early 2028. We have further filed for a continuation in part to our patent for recent improvements in the technology, including a concentric design which allows the technology to work in narrower diameter casing.
Subsequent to receiving our patent, we entered into demonstration joint venture projects and commercialization projects with industry operators between 2012 and early 2015. Most of these projects were successful in establishing or restoring commercial rates of production. However, with the severe decline in oil prices that began in late 2014, a significant portion of these projects were not sufficiently profitable to justify continuation.
As a result of the declining commodity price environment and reduced capital spending by the industry overall, the timing for commercial success of this technology was slower than previously anticipated. Based on a strategic review of these operations, we undertook the separation and transfer of these operations to a new entity controlled by the inventor of the technology and certain former employees of the Company, effective December 31, 2015. We invested $108,750 in common and preferred stock and retained a minority interest in the new entity, Well Lift Inc., together with a 5% royalty on all future gross
3
revenues derived from the technology. We have the option to convert our preferred stock investment in Well Lift Inc, into a larger, non-controlling equity stake in the new entity. Consequently, we have retained upside for our shareholders from the potential future commercial success of the technology, while eliminating approximately $1.0 million of annual overhead expenses. We have also retained the right to use the technology in our current wells and any future wells we develop or acquire.
Other Projects
Mississippi Lime
—Kay County, Oklahoma
In 2012, we acquired a 45% interest in a joint venture with Orion Exploration, a private company based in Tulsa, Oklahoma. The joint venture was operated by Orion and engaged in the horizontal development of the Mississippi Lime reservoir in Kay County, Oklahoma. Our leasehold position, totaling approximately 6,600 acres, was located in the eastern, more oil-prone side of the play. We drilled one gross salt water disposal well and reached total depth on two horizontally drilled wells in the Mississippi Lime formation. While both wells produced at the fluid rates expected, the quantities of oil and gas were far less than expected. We subsequently reworked both wells to test the role of structure in production, and determined that this play is a structural play requiring substantial geophysical and geological work and expertise in order to be successful, as opposed to a resource play in which engineering is the primary requirement. Accordingly, we elected in fiscal 2013 to reduce our joint venture interest in undeveloped leases to 33.9%, resulting in a $1.2 million reduction in both our net property and accounts payable. In October 2014, we completed the sale of all of our leasehold interests and wells and any associated assets and abandonment liabilities in the Mississippi Lime reservoir to the operator.
Markets and Customers
We market our production to third parties in a manner consistent with industry practices. In the U.S. market where we operate, crude oil and natural gas liquids are readily transportable and marketable. We do not currently market our share of crude oil production from Delhi separately from the operator's share of production. Although we have the right to take our working interest production in-kind, we are currently selling our oil under the Delhi operator's agreement with Plains Marketing L.P. pursuant to the delivery and pricing terms thereunder. The oil from Delhi is currently transported from the field by pipeline, which results in better net pricing than the alternative of transportation by truck. Delhi crude oil production sells at Louisiana Light Sweet ("LLS") pricing which generally trades at a premium to West Texas Intermediate ("WTI") crude oil pricing. The positive LLS Gulf Coast average price differential over WTI, as quoted daily on the New York Mercantile Exchange ("NYMEX"), was approximately $3.82 per barrel during our fiscal year ended June 30, 2018. The differential has increased from the prior year and we expect that a positive LLS price differential will continue, at least in the near future. Our overall average net oil price, including the LLS premium and after all adjustments for transportation, marketing and other price differentials, was $0.30 per barrel more than the average WTI NYMEX price for fiscal 2018.
Upon completion of the NGL plant in late 2016, we began selling natural gas liquids from the Delhi field to American Midstream Gas Solutions, L.P. Title to these products is transferred to the purchaser at the field and they are transported by truck to the purchaser's processing facility. We receive market prices, less transportation, processing and quality differential fees for the net yield of the individual natural gas liquid components, consisting of propane, butanes, and C5+ (pentanes and heavier components). There is a small component of residual ethane, but the overall yield of products is a higher value mix than is typical for natural gas liquids.
The following table sets forth purchasers of our oil and natural gas production for the years indicated:
|
|
Year Ended June 30,
|
|||||||
|
Customer
|
2018
|
2017
|
2016
|
|||||
|
Plains Marketing L.P. (Oil sales from Delhi)
|
92
|
%
|
97
|
%
|
99
|
%
|
||
|
American Midstream Gas Solutions (NGL sales from Delhi)
|
8
|
%
|
3
|
%
|
—
|
%
|
||
|
All others
|
—
|
%
|
—
|
%
|
1
|
%
|
||
|
Total
|
100
|
%
|
100
|
%
|
100
|
%
|
||
The loss of our purchaser at the Delhi field or disruption to pipeline transportation from the field could adversely affect our net realized pricing and potentially our near-term production levels. The loss of any of our other purchasers would not be expected to have a material adverse effect on our operations.
Market Conditions
Marketing of crude oil, natural gas, and natural gas liquids and the prices we receive are influenced by many factors that are beyond our control, the exact effect of which is difficult to predict. These factors include changes in supply and demand, market prices, government regulation and actions of major foreign producers.
4
Over the past 30 years, crude oil price fluctuations have been extremely volatile, with crude oil prices varying from less than $10 to over $140 per barrel. More recently, the price of oil per barrel dropped dramatically, starting in the fourth quarter of 2014 and continuing into 2017 before recovering somewhat in 2018. Worldwide factors such as geopolitical, macroeconomic, supply and demand, refining capacity, petrochemical production and derivatives trading, among others, influence prices for crude oil. Local factors also influence prices for crude oil and include increasing or decreasing production trends, quality differences, regulation and transportation issues unique to certain producing regions and reservoirs.
Also over the past 30 years, domestic natural gas prices have been extremely volatile, ranging from $1 to $15 per MMBTU. The spot market for natural gas, changes in supply and demand, derivatives trading, pipeline availability, BTU content of the natural gas and weather patterns, among others, cause natural gas prices to be subject to significant fluctuations. Due to the practical difficulties in transporting natural gas, local and regional factors tend to influence product prices more for natural gas than for crude oil.
Competition
The oil and natural gas industry is highly competitive for prospects, acreage and capital. Our competitors include major integrated crude oil and natural gas companies and numerous independent crude oil and natural gas companies, individuals and drilling and income programs. Many of our competitors are large, well-established companies with substantially larger operating staffs and greater capital resources than ours. Competitors are national, regional or local in scope and compete on the basis of financial resources, technical prowess or local knowledge. The principal competitive factors in our industry are expertise in given geographical and geological areas and the abilities to efficiently conduct operations, achieve technological advantages, identify, acquire economically producible reserves and obtain capital at rates which allow economic investments.
Seasonality
For a discussion of seasonal changes that affect our business, see Item 7. Management's Discussion and Analysis of Financial Condition and Results of Operations - Other Economic Factors - Seasonality in this Form 10-K.
Government Regulation
Numerous federal and state laws and regulations govern the oil and gas industry. These laws and regulations are often changed in response to changes in the political or economic environment. Compliance with this evolving regulatory burden is often difficult and costly, and substantial penalties may be incurred for noncompliance. To the best of our knowledge, we are in compliance with all laws and regulations applicable to our operations and we believe that continued compliance with existing requirements will not have a material adverse impact on us. The future annual capital cost of complying with the regulations applicable to our operations is uncertain and will be governed by several factors, including future changes to regulatory requirements which are unpredictable. However, we do not currently anticipate that future compliance with existing laws and regulations will have a materially adverse effect on our consolidated financial position or results of operations.
See "Government regulation and liability for environmental matters that may adversely affect our business and results of operations" under Item 1A. Risk Factors of this Form 10-K, for additional information regarding government regulation.
Insurance
We maintain insurance on our operated and non-operated properties and operations for risks and in amounts customary in the industry. Such insurance includes general liability, excess liability, control of well, operators extra expense, casualty, fraud and directors & officer's liability coverage. Not all losses are insured, and we retain certain risks of loss through deductibles, limits and self-retentions. We do not carry lost profits coverage and we do not have coverage for consequential damages.
Additional Information
We file Annual Reports on Form 10-K, Quarterly Reports on Form 10-Q, Current Reports on Form 8-K and other reports with the Securities and Exchange Commission ("SEC") . Our reports filed with the SEC are available free of charge to the general public through our website at www.evolutionpetroleum.com. These reports are accessible on our website as soon as reasonably practicable after being filed with, or furnished to, the SEC. This Annual Report on Form 10-K and our other filings can also be obtained by contacting: Corporate Secretary, 1155 Dairy Ashford Road, Suite 425, Houston, Texas 77079, or calling (713) 935-0122. These reports are also available at the SEC Public Reference Room at 450 Fifth Street, N.W., Washington, D.C. 20549. The public may obtain information on the operation of the Public Reference Room by calling the SEC at 1-800-SEC-0330. The SEC also maintains a website at www.sec.gov that contains reports, proxy and information statements and other information regarding issuers that file electronically with the SEC.
5
Our business involves a high degree of risk. If any of the following risks, or any risk described elsewhere in this Annual Report on Form 10-K, actually occurs, our business, financial condition or results of operations could suffer. The risks described below are not the only ones facing us. Additional risks not presently known to us or which we currently consider to be immaterial also may adversely affect us.
Risks related to the oil and gas industry and our Company
A substantial or extended decline in oil prices may adversely affect our business, financial condition or results of operations and our ability to meet our capital expenditure obligations and financial commitments.
The price we receive for our oil significantly influences our revenue, profitability, access to capital and future rate of growth. Oil is a commodity and its price is subject to wide fluctuations in response to relatively minor changes in supply and demand. For example, average daily prices for WTI crude oil ranged from a high of $74 per barrel to a low of $27 per barrel over the past three fiscal years ending June 30, 2018. Historically, the markets for oil and natural gas liquids have been volatile and these markets will likely continue to be volatile in the future. The prices we receive for our production depend on numerous factors beyond our control, including, but not limited to the following:
|
•
|
worldwide and regional economic conditions impacting the global supply and demand for oil and gas;
|
|
•
|
actions of OPEC or other groups of oil producing nations;
|
|
•
|
the price and quantity of imports of foreign oil and natural gas;
|
|
•
|
political conditions in or affecting other oil-producing and natural gas-producing countries;
|
|
•
|
the level of global oil and natural gas exploration and production;
|
|
•
|
the level of global oil and natural gas inventories;
|
|
•
|
localized supply and demand fundamentals of regional, domestic and international transportation availability;
|
|
•
|
weather conditions and natural disasters;
|
|
•
|
domestic and foreign governmental regulations;
|
|
•
|
speculation as to the future price of oil and the speculative trading of oil and natural gas futures contracts;
|
|
•
|
price and availability of competitors' supplies of oil and natural gas;
|
|
•
|
technological advances effecting energy consumption; and
|
|
•
|
the price and availability of alternative fuels.
|
Substantially all of our production is sold to purchasers under short-term (less than twelve-month) contracts at market-based prices. A decline in oil and natural gas liquids prices will reduce our cash flows, borrowing ability, the present value of our reserves and our ability to develop future reserves. We may be unable to obtain needed capital or financing on satisfactory terms. Low oil and natural gas liquids prices may also reduce the amount of oil and natural gas liquids that we can produce economically, which could lead to a decline in our oil and natural gas liquids reserves. Because approximately 86% of our proved reserves at June 30, 2018 are crude oil reserves and 14% are natural gas liquids reserves, we are heavily impacted by movements in crude oil prices, which also influence natural gas liquids prices. To the extent that we have not hedged our production with derivative contracts or fixed-price contracts, any significant and extended decline in oil and natural gas liquids prices may adversely affect our financial position.
Our revenues are concentrated in one asset and related declines in production or other events beyond our control could have a material adverse effect on our results of operations and financial results.
Substantially all of our revenues come from our royalty, mineral and working interests in the Delhi field in Louisiana and thus our current revenues are highly concentrated in this field. Any significant downturn in production, oil and gas prices, or other events beyond our control which impact the Delhi field could have a material adverse effect on our results of operations and financial results. We are not the operator of the Delhi field, and our revenues and future growth are heavily dependent on the success of operations, which we do not control.
Operating results from oil and natural gas production may decline; we may be unable to acquire and develop the additional oil and natural gas reserves that are required in order to sustain our business operations.
In general, the volumes of production from crude oil and natural gas properties decline as reserves are depleted, with the rate of decline depending on reservoir characteristics. Except to the extent we acquire additional properties containing proved reserves or conduct successful development activities, or both, our proved reserves will decline. Our production is heavily dependent on our interests in EOR production that began during March 2010 in the Delhi field. Environmental or operating problems or lack of future investment at Delhi could cause our net production of oil and natural gas liquids to decline significantly over time, which could have a material adverse effect on our financial condition.
6
We have limited control over the activities on properties we do not operate.
Substantially all of our property interests are not operated by the Company and also involve other third-party working interest owners. As a result, we have limited ability to influence or control the operation or future development of such properties, including compliance with environmental, safety and other regulations, or the amount of capital expenditures that we will be required to fund with respect to such properties. Operators of these properties may act in ways that are not in our best interest. Moreover, we are dependent on the other working interest owners of such projects to fund their contractual share of the capital expenditures of such projects. These limitations and our dependence on the operator and other working interest owners for these projects could cause us to incur unexpected future costs, result in lower production and materially and adversely affect our financial conditions and results of operations.
We are materially dependent upon our operator with respect to the successful operation of our principal asset, which consists of our interests the Delhi field. A materially negative change in our operator’s financial condition could negatively affect operations (or timing thereof) in the Delhi field, and consequently our income (or timing thereof) from the field as well as the value of our interests in the Delhi field.
Our royalty, mineral and working interests in the Delhi field, located in Northeast Louisiana, currently represent our sole producing asset. Over 99% of our revenues come from these interests and thus our current revenues are highly concentrated in this field. Any significant downturn in production or other events beyond our control which impact the Delhi field could have a material adverse effect on our results of operations and financial results (or timing thereof). We are not the operator of the Delhi field. It is operated by a subsidiary of Denbury Resources Inc. (“DNR”). Our revenues and future growth are thus heavily dependent on the success of operations which we do not control.
Further, our CO
2
- Enhanced Oil Recovery (“CO
2
-EOR”) project in the Delhi field requires significant amounts of CO
2
reserves and technical expertise, the sources of which have been committed by the operator. Additional capital remains to be invested to fully develop this project, further increase production and maximize the value of this asset. The operator's failure to manage these and other technical, environmental, operating, strategic, financial and logistical matters could cause ultimate enhanced recoveries from the planned CO
2
- EOR project to fall short of our expectations in volume and/or timing. Such occurrences could have a material adverse effect on us, and our results of operations and financial condition.
Our economic success is thus materially dependent upon the Delhi field operator's ability to: (i) deliver sufficient quantities of CO
2
from its reserves in the Jackson Dome source, (ii) secure its share of capital necessary to fund development and operating commitments with respect to the field and (iii) successfully manage related technical, operating, environmental, strategic and logistical risks, among other things.
We are aware that DNR, which is publicly traded, has disclosed in its public SEC filings certain risks related to its current level of indebtedness and the related financial covenants. They have stated, for example, that their level of indebtedness could have important consequences, including, among others, requiring dedication of a substantial portion of DNR’s cash flow from operations to servicing their indebtedness. They noted that their ability to meet their obligations under their debt instruments will depend in part upon prevailing economic conditions and commodity prices. DNR also noted that it has from time to time deferred development spending for certain projects.
Given the current stress in the global commodity markets and oil and gas in particular, our operator could be materially negatively impacted, which could in turn negatively affect the operator’s ability to operate the Delhi field as well as its financial commitment to the CO
2
-EOR project in the field, and thus our interests in the Delhi field could be materially negatively impacted.
The types of resources we focus on have substantial operational risks.
Our business plan focuses on the acquisition and development of known resources in partially depleted reservoirs, naturally fractured or low permeability reservoirs, or relatively shallow reservoirs. Shallower reservoirs usually have lower pressure, which generally translates into lower reserve volumes in place. Low permeability reservoirs require more wells and substantial stimulation for development of commercial production. Naturally fractured reservoirs require penetration of sufficient undepleted fractures to establish commercial production. Depleted reservoirs require successful application of newer technology to unlock incremental reserves.
Our CO
2
-EOR project in the Delhi field, operated by a subsidiary of Denbury Resources Inc., requires significant amounts of CO
2
reserves, development capital and technical expertise, the sources of which to date have been committed by the operator. Although initial CO
2
injection began at Delhi in November 2009, initial oil production response began in March 2010 and a large part of the capital budget has already been expended, additional capital remains to be invested to fully develop the EOR project, further increase production and maximize the value of the asset. The operator's failure to manage these and other technical, environmental, operating, strategic, financial and logistical risks may cause ultimate enhanced recoveries from the
7
planned CO
2
-EOR project to fall short of our expectations in volume and/or timing. Such occurrences would have a material adverse effect on the Company, its results of operations and financial condition.
Crude oil and natural gas development, re-completion of wells from one reservoir to another reservoir, restoring wells to production and drilling and completing new wells are speculative activities and involve numerous risks and substantial uncertain costs.
Our growth will be materially dependent upon the success of our future development program. Drilling for crude oil and natural gas and re-working existing wells involve numerous risks, including the risk that no commercially productive crude oil or natural gas reservoirs will be encountered. The cost of drilling, completing and operating wells is substantial and uncertain, and drilling operations may be curtailed, delayed or canceled as a result of a variety of factors beyond our control, including, but not limited to:
|
•
|
unexpected drilling conditions;
|
|
•
|
pressure fluctuations or irregularities in formations;
|
|
•
|
equipment failures or accidents;
|
|
•
|
environmental events;
|
|
•
|
inability to obtain or maintain leases on economic terms, where applicable;
|
|
•
|
adverse weather conditions;
|
|
•
|
adverse weather conditions;compliance with governmental requirements; and
|
|
•
|
shortages or delays in the availability of drilling rigs or crews and the delivery of equipment.
|
Drilling or re-working is a highly speculative activity. Even when fully and correctly utilized, modern well completion techniques such as horizontal drilling or CO
2
injection or other injectants do not guarantee that we will find and produce crude oil and/or natural gas in our wells in economic quantities. Our future drilling activities may not be successful and, if unsuccessful, such failure would have an adverse effect on our future results of operations and financial condition. We cannot assure you that our overall drilling success rate or our drilling success rate for activities within a particular geographic area will not decline.
We may also identify and develop prospects through a number of methods, some of which do not include horizontal drilling or tertiary injectants, and some of which may be unproven. The drilling and results for these prospects may be particularly uncertain. We cannot assure you that these projects can be successfully developed or that the wells discussed will, if drilled, encounter reservoirs of commercially productive crude oil or natural gas.
The loss of a large single purchaser of our oil and natural gas could reduce the competition of our production.
For the year ended June 30, 2018, one purchaser accounted for 92% of our oil and natural gas liquid revenues. We do not currently market our share of crude oil production from the Delhi field. Although we have the right to take our working interest production in-kind, we are currently accepting terms under the Delhi operator's agreement with Plains Marketing L.P. for the delivery and pricing of our oil at the field. The loss of such large single purchaser for our oil and natural gas production could negatively impact the revenue we receive. We cannot assure you we could readily find other purchasers for our oil and natural gas production. In addition, the crude oil production from the Delhi field is transported by pipeline and if this pipeline transportation were disrupted and we were forced to use alternative transportation methods, our net realized pricing and potentially our near-term production levels could be adversely affected.
Our crude oil and natural gas reserves are only estimates and may prove to be inaccurate.
There are numerous uncertainties inherent in estimating crude oil and natural gas reserves and their estimated values. Our reserves are only estimates that may prove to be inaccurate because of these uncertainties. Reservoir engineering is a subjective and inexact process of estimating underground accumulations of crude oil and natural gas that cannot be measured in an exact manner. Estimates of economically recoverable crude oil and natural gas reserves depend upon a number of variable factors, such as historical production from the area compared with production from other producing areas and assumptions concerning effects of regulations by governmental agencies, future crude oil and natural gas product prices, future operating costs, severance and excise taxes, development costs and work-over and remedial costs. Some or all of these assumptions may vary considerably from actual results. For these reasons, estimates of the economically recoverable quantities of crude oil and natural gas attributable to any particular group of properties, classifications of such reserves based on risk of recovery, and estimates of the future net cash flows expected therefrom prepared by different engineers or by the same engineers but at different times, may vary substantially.
Accordingly, reserve estimates may be subject to downward or upward adjustment. Actual production, revenue and expenditures with respect to our reserves will likely vary from estimates, and such variances may be material. The information regarding discounted future net cash flows included in this report should not be considered as the current market value of the
8
estimated crude oil and natural gas reserves attributable to our properties. The estimated discounted future net cash flows from proved reserves are based on the 12-month average price, calculated as the unweighted arithmetic average of the first-day-of-the-month price for each month within the 12-month period prior to the end of the reporting period, and costs as of the date of the estimate, while actual future prices and costs may be materially higher or lower. Actual future net cash flows also will be affected by factors such as the amount and timing of actual production, supply and demand for crude oil and natural gas, increases or decreases in consumption, and changes in governmental regulations or taxation. In addition, the 10% discount factor, which is required by the SEC to be used in calculating discounted future net cash flows for reporting purposes, is not necessarily the most appropriate discount factor based on interest rates in effect from time to time and risks associated with us or the crude oil and natural gas industry in general. The Standardized Measure and PV-10 do not necessarily correspond to market value.
Regulatory and accounting requirements may require substantial reductions in reporting proven reserves.
We review on a periodic basis the carrying value of our crude oil and natural gas properties under the applicable rules of the various regulatory agencies, including the SEC. Under the full cost method of accounting that we use, the after-tax carrying value of our oil and natural gas properties may not exceed the present value of estimated future net after-tax cash flows from proved reserves, discounted at 10%. Application of this "ceiling" test requires pricing future revenues at the previous 12-month average beginning-of-month price and requires a write down of the carrying value for accounting purposes if the ceiling is exceeded. We may in the future be required to write down the carrying value of our crude oil and natural gas properties when crude oil and natural gas prices are depressed or unusually volatile. Whether we will be required to take such a charge will depend in part on the prices for crude oil and natural gas during the previous period and the effect of reserve additions or revisions and capital expenditures during such period. If a write down is required, it would result in a current charge to our earnings but would not impact our current cash flow from operating activities. A large write-down could adversely affect our compliance with the current financial covenants under our credit facility and could limit our access to future borrowings under that facility or require repayment of any amounts that might be outstanding at the time.
Our derivative activities could result in financial losses or could reduce our income.
To achieve more predictable cash flows and to reduce our exposure to adverse fluctuations in the prices of oil and natural gas liquids, we have, and may in the future, enter into derivative arrangements for a portion of our oil and natural gas liquids production, including costless collars and fixed-price swaps. We have not designated any of our derivative instruments as hedges for accounting purposes and record all derivative instruments on our balance sheet at fair value. Changes in the fair value of our derivative instruments are recognized in earnings. Accordingly, our earnings may fluctuate significantly as a result of changes in the fair value of our derivative instruments. Derivative arrangements also expose us to the risk of financial loss in some circumstances, including, but not limited to, if:
|
•
|
production is less than the volume covered by the derivative instruments;
|
|
•
|
the counterparty to the derivative instrument defaults on its contract obligations; or
|
|
•
|
there is a change in the expected differential between the underlying price in the derivative instrument and actual price received.
|
In addition, some of these types of derivative arrangements limit the benefit we would receive from increases in the prices for oil and natural gas liquids and may expose us to cash margin requirements.
We may have difficulty managing future growth and the related demands on our resources and may have difficulty in achieving future growth.
Although we hope to experience growth through acquisitions and development activity, any such growth may place a significant strain on our financial, technical, operational and administrative resources. Our ability to grow will depend upon a number of factors, including, but not limited to the following:
|
•
|
our ability to identify and acquire new development or acquisition projects;
|
|
•
|
our ability to develop existing properties;
|
|
•
|
our ability to continue to retain and attract skilled personnel;
|
|
•
|
the results of our development program and acquisition efforts;
|
|
•
|
the success of our technologies;
|
|
•
|
hydrocarbon prices;
|
|
•
|
drilling, completion and equipment prices;
|
|
•
|
our ability to successfully integrate new properties;
|
|
•
|
our access to capital; and
|
|
•
|
the Delhi field operator's ability to: (i) deliver sufficient quantities of CO
2
from its reserves in the Jackson Dome, secure all of the development capital necessary to fund its and our cost interests, (ii)
|
9
successfully manage technical, operating, environmental, strategic and logistical development and operating risks, and (iii) maintain its own financial stability, among other things.
We cannot assure you that we will be able to successfully grow or manage any such growth.
Our operations may require significant amounts of capital and additional financing may be necessary in order for us to continue our exploitation activities, including meeting potential future drilling obligations.
Our cash flow from our reserves may not be sufficient to fund our ongoing activities at all times. From time to time, we may require additional financing in order to carry out our oil and gas acquisitions, exploitation and development activities. Certain of our undeveloped leasehold acreage may be subject to leases that will expire unless production is established. If our revenues from our reserves decrease as a result of lower oil and natural gas prices or otherwise, it will affect our ability to expend the necessary capital to replace our reserves or to maintain our current production. If our cash flow from operations is not sufficient to satisfy our capital expenditure requirements, there can be no assurance that additional debt or equity financing will be available to meet these requirements or available to us on favorable terms.
We may be subject to risks in connection with acquisitions because of uncertainties in evaluating recoverable reserves, well performance and potential liabilities, as well as uncertainties in forecasting oil and gas prices and future development, production and marketing costs, and the integration of significant acquisitions may be difficult.
We periodically evaluate acquisitions of reserves, properties, prospects and leaseholds and other strategic transactions that appear to fit within our overall business strategy. The successful acquisition of producing properties requires an assessment of several factors, including, but not limited to:
|
•
|
recoverable reserves
|
|
•
|
future oil and natural gas prices and their appropriate differentials;
|
|
•
|
development and operating costs;
|
|
•
|
potential for future drilling and production;
|
|
•
|
validity of the seller's title to properties, which may be less than expected at closing; and
|
|
•
|
potential environmental issues, litigation and other liabilities.
|
The accuracy of these assessments is inherently uncertain. In connection with these assessments, we perform a review of the subject properties that we believe to be generally consistent with industry practices. Our review will not reveal all existing or potential problems nor will it permit us to become sufficiently familiar with the properties to fully assess their deficiencies and potential recoverable reserves. Inspections may not always be performed on every well, and environmental problems are not necessarily observable even when an inspection is undertaken. Even when problems are identified, the seller may be unwilling or unable to provide effective contractual protection against all or part of the problems. Moreover, in the event of such an acquisition, there is a risk that we could ultimately be liable for unknown obligations related to acquisitions, which could materially adversely affect our financial condition, results of operations or cash flows.
Significant acquisitions and other strategic transactions may involve other risks, including, but not limited to:
|
•
|
our lean management team's capacity could be challenged by the demands of evaluating, negotiating and integrating significant acquisitions and strategic transactions in concert with the Company's on going business demands;
|
|
•
|
the challenge and cost of integrating acquired operations, information management and other technology systems and business cultures with those of our operations while carrying on our ongoing business;
|
|
•
|
difficulty associated with coordinating geographically separate organizations;
|
|
•
|
an inability to secure, on acceptable terms, sufficient financing that my be required in connection with expanded operations and unknown liabilities; and
|
|
•
|
the challenge of attracting and retaining personnel associated with acquired operations.
|
The process of integrating assets could cause an interruption of, or loss of momentum in, the activities of our business. Members of our senior management may be required to devote considerable amounts of time to this integration process, which will decrease the time they will have to manage our business. If our senior management is not able to effectively manage the integration process, or if any significant business activities are interrupted as a result of the integration process, our business could suffer. In addition, even if we successfully integrate the assets acquired in an acquisition, it may not be possible to realize the full benefits we may expect in estimated proved reserves, production volumes, cost savings from operating synergies or other benefits anticipated from an acquisition or realize these benefits within the expected time frame.
10
Government regulation and liability for environmental matters may adversely affect our business and results of operations.
Crude oil and natural gas operations are subject to extensive federal, state and local government regulations, which may be changed from time to time. Matters subject to regulation include discharge permits for drilling operations, drilling bonds, reports concerning operations, the spacing of wells, unitization and pooling of properties and taxation. From time to time, regulatory agencies have imposed price controls and limitations on production by restricting the rate of flow of crude oil and natural gas wells below actual production capacity in order to conserve supplies of crude oil and natural gas. There are federal, state and local laws and regulations primarily relating to protection of human health and the environment applicable to the development, production, handling, storage, transportation and disposal of crude oil and natural gas, by-products thereof, the emission of CO
2
or other greenhouse gases, and other substances and materials produced or used in connection with crude oil and natural gas operations. In addition, we may inherit liability for environmental damages, whether actual or not, caused by previous owners of property we purchase or lease or nearby properties. As a result, we may incur substantial liabilities to third parties or governmental entities. We are also subject to changing and extensive tax laws, the effects of which cannot be predicted. The implementation of new, or the modification of existing, laws or regulations could have a material adverse effect on us, such as diminishing the demand for our products through legislative enactment of proposed new penalties, fines and/or taxes on carbon that could have the effect of raising prices to the end user.
Our insurance may not protect us against all of the operating risks to which our business is exposed.
The crude oil and natural gas business involves numerous operating hazards such as well blowouts, mechanical failures, explosions, uncontrollable flows of crude oil, natural gas or well fluids, fires, formations with abnormal pressures, hurricanes, flooding, pollution, releases of toxic gas and other environmental hazards and risks, which can result in (i) damage to or destruction of wells and/or production facilities, (ii) damage to or destruction of formations, (iii) injury to persons, (iv) loss of life, or (v) damage to property, the environment or natural resources. While we carry general liability, control of well, and operator's extra expense coverage typical in our industry, we are not fully insured against all risks incidental to our business. Environmental events similar to that experienced in the Delhi field in June 2013 could defer revenue, increase operating costs and/or increase maintenance and repair capital expenditures.
The loss of key personnel could adversely affect us.
We depend to a large extent on the services of certain key management personnel, including our executive officers, the loss of any of whom could have a material adverse effect on our operations. In particular, our future success is dependent upon the abilities of Robert S. Herlin, our Chairman of the Board and Interim Chief Executive Officer, R. Steven Hicks, our Senior Vice President of Engineering and Business Development, and David Joe, Senior Vice President, Chief Financial Officer and Treasurer, to source, evaluate and close deals, raise capital, and oversee our development activities and operations. Presently, the Company is not a beneficiary of any key man life insurance.
Oil field service and materials' prices may increase, and the availability of such services and materials may be inadequate to meet our needs.
Our business plan to develop or redevelop crude oil and natural gas resources requires third party oilfield service vendors and various material providers, which we do not control. We also rely on third-party carriers for the transportation and distribution of our production. As our production increases, so does our need for such services and materials. Generally, we do not have long-term agreements with our service and materials providers. Accordingly, there is a risk that any of our service providers could discontinue servicing our crude oil and natural gas fields for any reason or we may not be able to source the materials we need. Any delay in locating, establishing relationships, and training our sources could result in production shortages and maintenance problems, with a resulting loss of revenue to us. In addition, if costs for such services and materials increase, it may render certain or all of our projects uneconomic, as compared to the earlier prices we may have assumed when deciding to redevelop newly purchased or existing properties. Further adverse economic outcomes may result from the long lead times often necessary to execute and complete our redevelop plans.
We cannot market the crude oil and natural gas that we produce without the assistance of third parties.
The marketability of the crude oil and natural gas that we produce depends upon the proximity of our reserves to, and the capacity of, facilities and third-party services, including crude oil and natural gas gathering systems, pipelines, trucking or terminal facilities, and processing facilities necessary to make the products marketable for end use. The unavailability or lack of capacity of such services and facilities could result in the shut-in of producing wells or the delay or discontinuance of development plans for properties. A shut-in or delay or discontinuance could adversely affect our financial condition.
11
We face strong competition from larger oil and gas companies.
Our competitors include major integrated crude oil and natural gas companies and numerous independent crude oil and natural gas companies, individuals and drilling and income programs. Many of our competitors are large, well-established companies with substantially larger operating staffs and greater capital resources than ours. We may not be able to successfully conduct our operations, evaluate and select suitable properties and consummate transactions in this highly competitive environment. Specifically, these larger competitors may be able to pay more for development projects and productive crude oil and natural gas properties and may be able to define, evaluate, bid for and purchase a greater number of properties and prospects than our financial or human resources permit. In addition, such companies may be able to expend greater resources on hiring contract service providers, obtaining oilfield equipment and acquiring the existing and changing technologies that we believe are and will be increasingly important to attaining success in our industry.
We have been, and in the future may become, involved in legal proceedings related to our Delhi interest or other properties or operations and, as a result, may incur substantial costs in connection with those proceedings.
From time to time we may be a defendant or plaintiff in various lawsuits. The nature of our operations exposes us to further possible litigation claims in the future. There is risk that any matter in litigation could be decided unfavorably against us regardless of our belief, opinion, and position, which could have a material adverse effect on our financial condition, results of operations, and cash flow. Litigation can be very costly, and the costs associated with defending litigation could also have a material adverse effect on our financial condition. Adverse litigation decisions or rulings may damage our business reputation.
Ownership of our oil, gas and mineral production depends on good title to our property.
Good and clear title to our oil, gas and mineral properties is important to our business. Although title reviews will generally be conducted prior to the purchase of most oil, gas and mineral producing properties or the commencement of drilling wells, such reviews do not assure that an unforeseen defect in the chain of title will not arise to defeat our claim which could result in a reduction or elimination of the revenue received by us from such properties.
Poor general economic, business, or industry conditions may have a material adverse effect on our results of operations, liquidity, and financial condition.
During the last few years, concerns over inflation, energy costs, declining oil and gas prices, geopolitical issues, the availability and cost of credit, the U.S. mortgage market, uncertainties with regard to European sovereign debt, the slowdown in economic growth in large emerging and developing markets, such as China, regional or worldwide increases in tariffs or other trade restrictions, and other issues have contributed to increased economic uncertainty and diminished expectations for the global economy. Concerns about global economic conditions have had a significant adverse impact on domestic and international financial markets and commodity prices. If uncertain or poor economic, business or industry conditions in the United States or abroad remain prolonged, demand for petroleum products could diminish or stagnate, production costs could increase, any of which could impact the price at which we can sell our oil, natural gas, and NGLs, affect our vendors', suppliers' and customers' ability to continue operations, and ultimately adversely impact our results of operations, liquidity, and financial condition.
Risks Associated with Our Stock
Our stock price has been and may continue to be volatile.
Our common stock has relatively low trading volume and the market price has been, and is likely to continue to be, volatile. For example, during the fiscal year ending June 30, 2018, our stock price as traded on the NYSE American ranged from $6.35 to $10.50. The variance in our stock price makes it difficult to forecast with certainty the stock price at which an investor may be able to buy or sell shares of our common stock. The market price for our common stock could be subject to fluctuations as a result of factors that are out of our control, such as:
|
•
|
actual or anticipated variations in our results of operations;
|
|
•
|
naked short selling of our common stock and stock price manipulation;
|
|
•
|
changes or fluctuations in the commodity prices of crude oil and natural gas;
|
|
•
|
general conditions and trends in the crude oil and natural gas industry;
|
|
•
|
redemption demands on institutional funds that hold our stock; and
|
|
•
|
general economic, political and market conditions.
|
12
Our executive officers, directors and affiliates may be able to control the election of our directors and all other matters submitted to our stockholders for approval.
As of June 30, 2018 our executive officers and directors, in the aggregate, beneficially owned approximately 2.6 million shares, or approximately 7.9% of our beneficial common stock base. JVL Advisors LLC controlled approximately 3.6 million shares or approximately 10.1% of our outstanding common stock. ArrowMark Colorado Holdings LLC controlled approximately 2.3 million shares, or approximately 6.9% of our outstanding common stock. Advisory Research, Inc. controlled approximately 2.5 million shares, or approximately 7.5% of our outstanding common stock and Blackrock Fund Advisors controlled approximately 2.2 million shares, or approximately 6.5% of our outstanding common stock. As a result, any of these holders could potentially exercise significant influence over matters submitted to our stockholders for approval (including the election and removal of directors and any merger, consolidation or sale of all or substantially all of our assets). This concentration of ownership may have the effect of delaying, deferring or preventing a change in control of our company, impede a merger, consolidation, takeover or other business combination involving our company or discourage a potential acquirer from making a tender offer or otherwise attempting to obtain control of our company, which in turn could have an adverse effect on the market price of our common stock.
The market for our common stock is limited and may not provide adequate liquidity.
Our common stock trades on the NYSE American. Our trading volume decreased in fiscal 2018 compared to fiscal 2017. Trading volume in our common stock is relatively low compared to larger companies. During the fiscal year ended June 30, 2018, the daily trading volume in our common stock ranged from a low of 20,600 shares to a high of 807,500 shares, with average daily trading volume of 112,015 shares compared to average daily volume of 127,419 in fiscal 2017. Our holders may find it more difficult to sell their shares, should they desire to do so, based on the trading volume and price of our stock at that time relative to the quantity of shares to be sold.
If securities or industry analysts do not publish research reports about our business, or if they downgrade our stock, the price of our common stock could decline.
Small, relatively unknown companies can achieve visibility in the trading market through research and reports that industry or securities analysts publish. To our knowledge there are four independent analysts that cover our company. The limited number of published reports by independent securities analysts could limit the interest in our common stock and negatively affect our stock price. We do not have any control over the research and reports these analysts publish or whether they will be published at all. If any analyst who does cover us downgrades our stock, our stock price could decline. If any analyst ceases coverage of our company or fails to regularly publish reports on us, we could lose visibility in the financial markets, which in turn could cause our stock price to decline.
The issuance of additional common stock and preferred stock could dilute existing stockholders.
We currently have in place a registration statement which allows the Company to publicly issue up to $500 million of additional securities, including debt, common stock, preferred stock, and warrants. At any time we may make private offerings of our securities. The shelf registration is intended to provide greater flexibility to the company in financing growth or changing our capital structure. We are authorized to issue up to 100,000,000 shares of common stock. To the extent of such authorization, our board of directors has the ability, without seeking stockholder approval, to issue additional shares of common stock in the future for such consideration as our board may consider sufficient. The issuance of additional common stock in the future would reduce the proportionate ownership and voting power of the common stock now outstanding. We are also authorized to issue up to 5,000,000 shares of preferred stock, the rights and preferences of which may be designated in series by our board of directors. Such designation of any new series of preferred stock may be made without stockholder approval, and could create additional securities which would have dividend and liquidation preferences over the common stock now outstanding. Preferred stockholders could adversely affect the rights of holders of common stock by:
|
•
|
exercising voting, redemption and conversion rights to the detriment of the holders of common stock;
|
|
•
|
receiving preferences over the holders of common stock regarding our surplus funds in the event of our dissolution, liquidation or the payment of dividends to preferred stockholders;
|
|
•
|
delaying, deferring or preventing a change in control of our company; and
|
|
•
|
discouraging bids for our common stock.
|
13
Continued payment of dividends on our common stock could be impacted.
Our Board of Directors declared cash dividends on our common stock for the first time in December 2013 and we have declared and paid quarterly cash dividends since that time. However, there is no certainty that dividends will be declared by the Board of Directors in the future. Any payment of cash dividends on our common stock in the future will be dependent upon the amount of funds legally available, our earnings, if any, our financial condition and business plan, restrictions contained in current or future debt instruments, contractual covenants or arrangements we may enter into, our anticipated capital requirements and other factors that our board of directors may think are relevant. Accordingly, there is no guarantee that we will be able or choose to continue to pay cash dividends on our common stock.
None.
Item 2. Properties
Certain parts of the information required by Item 2. is contained in Item 1. Business
Oil & Gas Properties
Additional detailed information describing the types of properties we own can be found in "Business Strategy" under
Item 1. Business
of this Form 10-K.
Estimated Oil and Natural Gas Reserves and Estimated Future Net Revenues
The SEC sets rules related to reserve estimation and disclosure requirements for oil and natural gas companies. These rules require disclosure of oil and gas proved reserves by significant geographic area, using the trailing 12-month average price, calculated as the unweighted arithmetic average of the first-day-of-the-month price for each month within the 12-month period prior to the end of the reporting period, rather than year-end prices, and allows the use of new technologies in the determination of proved reserves if those technologies have been demonstrated empirically to lead to reliable conclusions about reserve volumes. Subject to limited exceptions, the rules also require that proved undeveloped reserves may only be classified as such if a development plan has been adopted indicating that they are scheduled to be drilled within five years.
There are numerous uncertainties inherent in estimating quantities of proved reserves and estimates of reserves quantities and values must be viewed as being subject to significant change as more data about the properties becomes available.
Estimates of Probable and Possible reserves are inherently imprecise. When producing an estimate of the amount of oil and natural gas liquids that is recoverable from a particular reservoir, Probable reserves are those additional reserves that are less certain to be recovered than Proved reserves but which, together with Proved reserves, are as likely as not to be recovered, generally described as having a 50% probability of recovery of that amount or more. Possible reserves are even less certain and generally require only a 10% or greater probability of that amount or more being recovered. All categories of reserves are continually subject to revisions based on production history, results of additional exploration and development, price changes and other factors. Estimates of Probable and Possible reserves are by their nature much more speculative than estimates of Proved reserves and are subject to greater uncertainties, and accordingly the likelihood of recovering those reserves is subject to substantially greater risk. These three reserve categories have not been adjusted to different levels of recovery risk among these categories and are therefore not comparable and are not meaningfully combined.
Information About the Standardized Measure of Discounted Future Net Cash Flows ("Standardized Measure") and pre-tax PV-10 of Proved Reserves
Estimated pre-tax future net revenues from the production of Proved reserves discounted at 10%, or PV-10, is a financial measure that is not recognized by GAAP. We believe that the presentation of the non-GAAP financial measure of PV-10 provides useful information to investors because it is widely used by analysts and investors in evaluating oil and natural gas companies, and that it is relevant and useful for evaluating the relative monetary significance of oil and natural gas properties. Further, analysts and investors may utilize the measure as a basis for comparison of the relative size and value of our reserves to other companies' reserves. We also use this pre-tax measure when assessing the potential return on investment related to oil and natural gas properties and in evaluating acquisition opportunities. Because there are many unique factors that can impact an individual company when estimating the amount of future income taxes to be paid, we believe the use of a pre-tax measure is valuable for evaluating our Company. PV-10 is not a measure of financial or operating performance under GAAP, nor is it intended to represent the current market value of our estimated oil and natural gas reserves. PV-10 should not be considered in isolation or as a substitute for the Standardized Measure as defined under GAAP, and reconciled herein
this Item 2. Properties
.
14
Summary of Oil & Gas Reserves for Fiscal Year Ended
2018
Our proved, probable and possible reserves at
June 30, 2018
, denominated in equivalent barrels using six MCF of gas and 42 gallons of natural gas liquids to one barrel of oil conversion ratio, were estimated by our independent petroleum engineer, DeGolyer and MacNaughton ("D&M"). D&M was selected to estimate reserves for our interests in the Delhi field due to their expertise in CO
2
-EOR projects and to ensure consistency with the operator. The scope and results of their procedures are summarized in a letter from the firm, which is included as exhibit 99.1 to this Annual Report on Form 10-K.
The following table sets forth our estimated proved, probable and possible reserves as of
June 30, 2018
. For additional reserve information see Note 23 – Supplemental Disclosures about Oil and Natural Gas Producing Properties (Unaudited) of the consolidated financial statements. The NYMEX previous 12-month unweighted arithmetic average first-day-of-the-month price used to calculate estimated revenues was $57.50 per barrel of crude oil. The net price per barrel of natural gas liquids was $38.97, which does not have any single comparable reference index price. The NGL price was based on historical prices received. For periods for which no historical price information was available, we used comparable pricing in the area. Pricing differentials were applied based on quality, processing, transportation, location and other pricing aspects for each individual property and product.
Reserves as of June 30,
2018
|
Reserve Category
|
Oil
(MBbls)
|
NGLs
(MBbls)
|
Total Reserves
(MBOE)*
|
|||||
|
PROVED
|
|
|
|
|||||
|
Developed (78% of Proved)
|
6,292
|
|
994
|
|
7,286
|
|
||
|
Undeveloped (22% of Proved)
|
1,798
|
|
284
|
|
2,082
|
|
||
|
TOTAL PROVED
|
8,090
|
|
1,278
|
|
9,368
|
|
||
|
Product Mix
|
86
|
%
|
14
|
%
|
100
|
%
|
||
|
PROBABLE
|
|
|
|
|||||
|
Developed (80% of Probable)
|
3,123
|
|
493
|
|
3,616
|
|
||
|
Undeveloped (20% of Probable)
|
757
|
|
120
|
|
877
|
|
||
|
TOTAL PROBABLE
|
3,880
|
|
613
|
|
4,493
|
|
||
|
Product Mix
|
86
|
%
|
14
|
%
|
100
|
%
|
||
|
POSSIBLE
|
||||||||
|
Developed (88% of Possible)
|
3,458
|
|
546
|
|
4,004
|
|
||
|
Undeveloped (12% of Possible)
|
488
|
|
77
|
|
565
|
|
||
|
TOTAL POSSIBLE
|
3,946
|
|
623
|
|
4,569
|
|
||
|
Product Mix
|
86
|
%
|
14
|
%
|
100
|
%
|
||
*BOE computed on units of production using a six to one conversion ratio of MCF's to barrels.
15
The following tables present a reconciliation of changes in our proved, probable and possible reserves by major property, on the basis of equivalent MBOE quantities.
Reconciliation of Changes in Proved Reserves by Major Property
|
Delhi Field Proved
Total
|
||
|
Proved reserves, MBOE
|
MBOE
|
|
|
June 30, 2017
|
10,058.4
|
|
|
Production
|
(745.3
|
)
|
|
Revisions
|
54.9
|
|
|
Sales of minerals in place
|
—
|
|
|
Improved recovery, extensions and discoveries
|
—
|
|
|
June 30, 2018
|
9,368.0
|
|
Reconciliation of Changes in Probable Reserves by Major Property
|
Delhi Field Probable
Total
|
||
|
Probable reserves, MBOE
|
MBOE
|
|
|
June 30, 2017
|
5,268.0
|
|
|
Revisions
|
(775.0
|
)
|
|
Sales of minerals in place
|
—
|
|
|
Improved recovery, extensions and discoveries
|
—
|
|
|
June 30, 2018
|
4,493.0
|
|
Reconciliation of Changes in Possible Reserves by Major Property
|
Delhi Field Possible
Total
|
||
|
Possible reserves, MBOE
|
MBOE
|
|
|
June 30, 2017
|
3,216.2
|
|
|
Revisions
|
1,353.3
|
|
|
Sales of minerals in place
|
—
|
|
|
Improved recovery, extensions, and discoveries
|
—
|
|
|
June 30, 2018
|
4,569.5
|
|
Reconciliation of PV-10 to the Standardized Measure of Discounted Future Net Cash Flows
The following table provides a reconciliation of PV-10 of our proved properties to the Standardized Measure as shown in Note 23 – Supplemental Disclosures about Oil and Natural Gas Producing Properties (Unaudited) of the consolidated financial statements.
|
|
For the Years Ended June 30,
|
||||||
|
|
2018
|
2017
|
|||||
|
Estimated future net revenues
|
$
|
270,842,377
|
|
$
|
189,347,437
|
|
|
|
10% annual discount for estimated timing of future cash flows
|
124,798,505
|
|
78,452,886
|
|
|||
|
Estimated future net revenues discounted at 10% (PV-10)
|
146,043,872
|
|
110,894,551
|
|
|||
|
Estimated future income tax expenses discounted at 10%
|
(27,085,458
|
)
|
(27,956,998
|
)
|
|||
|
Standardized Measure
|
$
|
118,958,414
|
|
$
|
82,937,553
|
|
|
Our sole producing assets as of June 30, 2018 and 2017 were our interests in the Delhi field. Additional information about the properties we own can be found in
Item 1. Business
.
16
Internal Controls Over Reserves Estimation Process and Qualifications of Technical Persons with Oversight for the Company's Overall Reserve Estimation Process
Our policies regarding internal controls over reserves estimates require such estimates to be prepared by an independent engineering firm under the supervision of our Chairman of the Board and interim Chief Executive Officer and Senior Vice President of Engineering and Business Development, a professional petroleum engineer. Such reserves estimates are to be in compliance with generally accepted petroleum engineering and evaluation principles and definitions and guidelines established by the SEC. Our Chairman of the Board and interim Chief Executive Officer holds B.S. and M.E. degrees from Rice University in chemical engineering and earned an M.B.A. from Harvard University. He has over 30 years of experience in engineering, energy transactions, operations and finance with small independents, larger independents and major integrated oil companies. Our Senior Vice President of Engineering and Business Development received Bachelor of Science degree in petroleum engineering from the University of Oklahoma in 1979 and has over 39 years of experience in the energy industry with upstream oil and gas companies. Our outside consultant who assisted the Company in preparing its reserves estimates is a licensed professional engineer with over 30 years of experience in oil and gas operations and petroleum reservoir engineering and holds a Bachelor of Science in Petroleum Engineering from Texas A&M University.
The reserves information in this filing is based on estimates prepared by DeGolyer and MacNaughton, our independent engineering firm. The person responsible for preparing the reserves report with D&M is a Registered Professional Engineer in the State of Texas and a Senior Vice President of the firm. He received a Bachelor of Science degree in petroleum engineering from the University of Texas in 1984, has over 35 years of experience in the energy industry and is a member of the Society of Petroleum Engineers and the Society of Petroleum Evaluation Engineers.
We provide our engineering firm with property interests, production, current operating costs, current production prices and other information. This information is reviewed by our Senior Vice President of Engineering and Business Development and outside consultant to ensure accuracy and completeness of the data prior to submission to our independent engineering firm. The scope and results of our independent engineering firm's procedures, as well as their professional qualifications, are summarized in the letter included as exhibit 99.1 to this Annual Report on Form 10-K.
Proved Undeveloped Reserves
Our proved undeveloped reserves were 2,082 MBOE at June 30, 2018, with associated future development costs of approximately $12.8 million. Our proved undeveloped reserves are comprised of (a) 1,545 MBOE of reserves and $10.9 million of future development costs associated with the Phase V development in the eastern portion of the field and (b) 537 MBOE of reserves and $1.9 million of future development costs associated with a proposed twelve-well infill drilling program to increase production and recover reserves which are not believed to be effectively producible with the existing well configuration. The infill project has aspects of both acceleration of production and an increase in ultimate reserves recovery and is being treated as a proved undeveloped project.
During the year ended June 30, 2018 our proved undeveloped reserves changed as follows:
|
Oil
(MBbls)
|
NGLs
(MBbls)
|
Total Reserves
(MBOE)
|
|||||||||
|
June 30, 2017
|
1,755
|
|
353
|
|
|
2,108
|
|
||||
|
Revisions to previous estimates
|
43
|
|
(69
|
)
|
|
(26
|
)
|
||||
|
Conversion to proved developed reserves
|
—
|
|
—
|
|
|
—
|
|
||||
|
June 30, 2018
|
1,798
|
|
284
|
|
2,082
|
|
|||||
NGL reserves were revised downward 69 MBOE reflecting lower than originally expected plant production partially offset by 43 MBOE of oil reserves due to better performance.
During fiscal 2018 we spent $2.8 million on development of the twelve-well infill project, which during the year had been expanded from its original eight-well program, and $1.1 million on infrastructure for Test Site 5, or Phase V, primarily for water facilities and water curtain wells and related infrastructure. The twelve-well infill program consists of eight producer wells and four CO
2
injection wells. Three producer wells and one CO
2
injection well went online at the end of our fourth quarter, and the remaining five producer wells and three CO
2
injection wells are expected to be completed and brought online by the end of October 2018.
The initial assignment of proved undeveloped reserves in the Delhi field was made on June 30, 2010, which encompassed a large scale CO
2
enhanced oil recovery project. The operator’s development plans for the field have remained essentially unchanged and were originally scheduled to be completed by June 30, 2015, within five years from the initial recording of such
17
proved reserves. Developed reserves are approximately 78% of total proved reserves as of June 30, 2018. However, as a result of the adverse fluid release event in the field in June 2013 and the resulting delay in reversion of our working interest, development of the field has not proceeded as originally scheduled. Expansion of the CO
2
flood to the remaining undeveloped eastern portion of the field commenced subsequent to reversion of our working interest in late calendar 2014. We incurred $3.8 million of capital expenditures before the operator electively deferred this project as a result of a reduction in its cash flows and capital spending from the significant drop in oil prices. This project was further electively deferred as we began work on the NGL recovery plant in the Delhi field in February 2015. It was determined that the economics of development of the remaining eastern portion of the field would be significantly improved after the NGL plant was completed.
During the year ended June 30, 2015, we authorized the NGL plant project and from late in that fiscal year until January 2017 when production of NGL began, we incurred $26.0 million of related capital expenditures. The NGL plant was completed in December 2016 and we converted approximately 1,377 MBOE of proved undeveloped reserves to proved developed reserves during the year ended June 30, 2017.
As of June 30, 2018, we had estimated future net capital expenditures of $10.9 million remaining for development of the eastern part of the field. This work was suspended in late 2014 and further deferred until the NGL recovery plant was complete. We believe this project is economic in the current oil price environment and we expect it to be completed within the next two fiscal years. This would be nine years after the initial recording of proved reserves. During this period, we have been continuously developing the Delhi field and have spent over $35 million subsequent to reversion of our working interest in November 2014. Within the first half of fiscal 2019, we will incur an additional $1.9 million to complete the infill project and an additional $1.7 million of infrastructure for Test Site 5 as described above. Given the long-term nature of CO
2
EOR development projects, we believe that the remaining undeveloped reserves in the Delhi field satisfy the conditions to continue to be treated as proved undeveloped reserves because (1) we initially established the development plan for the Delhi field in 2010 and continue to follow that plan, as adjusted to incorporate the completion of the NGL plant in late 2016 and delays relating to the 2013 fluid release event; (2) we have had significant ongoing development activities at this project that, as budgeted and currently being expended, reflect a significant and sufficient portion of remaining capital expenditures to convert proved undeveloped reserves to proved developed reserves; and (3) the operator has a historical record of completing the development of comparable long-term projects.
As of June 30, 2018, no proved, probable or possible reserves were attributed to (a) the suspended southwestern tip area of the field, (b) the area beneath the inhabited portion of the Town of Delhi in the northeast and (c) the farthest east of the two remaining undeveloped sites in the eastern portion of field (Phase VI) due to the current economics and other technical aspects of our future development plans. In addition, no probable reserves are currently attributed to three smaller reservoirs within the Unit in similar formations with similar production history due to the lower oil price utilized in our reserves calculation. We also do not have proved or probable reserves associated with the Mengel Sand, a separate interval within the Unit that is not currently producing, which was received in the litigation settlement in June 2016.
Sales Volumes, Average Sales Prices and Average Production Costs
The following table shows the Company's sales volumes and average sales prices received for crude oil, natural gas liquids, and natural gas for the periods indicated:
|
|
Year Ended
June 30, 2018 |
Year Ended
June 30, 2017 |
Year Ended
June 30, 2016 |
||||||||||||||||||||
|
Product
|
Volume
|
Price
|
Volume
|
Price
|
Volume
|
Price
|
|||||||||||||||||
|
Crude oil (Bbls)
|
651,931
|
|
$
|
58.52
|
|
724,523
|
|
$
|
46.31
|
|
658,041
|
|
$
|
39.71
|
|
||||||||
|
Natural gas liquids (Bbls)
|
93,366
|
|
$
|
33.50
|
|
43,907
|
|
$
|
21.28
|
|
491
|
|
$
|
16.06
|
|
||||||||
|
Natural gas (Mcf)
|
—
|
|
$
|
—
|
|
16
|
|
$
|
(0.25
|
)
|
1,620
|
|
$
|
1.79
|
|
||||||||
|
Average price per BOE*
|
745,297
|
|
$
|
55.39
|
|
768,433
|
|
$
|
44.88
|
|
658,802
|
|
$
|
39.68
|
|
||||||||
|
Production costs
|
Amount
|
per BOE
|
Amount
|
per BOE
|
Amount
|
per BOE
|
|||||||||||||||||
|
Production costs, excluding ad valorem and production taxes
|
$
|
12,005,444
|
|
$
|
16.11
|
|
$
|
10,621,256
|
|
$
|
13.82
|
|
$
|
8,767,490
|
|
$
|
13.31
|
|
|||||
|
Total production costs, including ad valorem and production taxes
|
$
|
12,193,502
|
|
$
|
16.36
|
|
$
|
10,835,809
|
|
$
|
14.10
|
|
$
|
9,062,179
|
|
$
|
13.76
|
|
|||||
* BOE computed on units of production using a six to one conversion ratio of MCF's to barrels.
18
Drilling Activity
Our productive drilling activity during the past three fiscal years ended
June 30, 2018
, was limited to five (1.2 net) producer wells completed in fiscal 2018. We completed one (.239 net) CO
2
injection well during fiscal 2018 and had no completions in the previous two fiscal years. In connection with establishing a water curtain in advance of Phase V site development, we completed one (.239 net) well in fiscal 2018 and one (.239 net) well in fiscal 2017, the initial well of the program. No dry wells were drilled in the past three fiscal year
s.
Present Activities
As of June 30, 2018, the Company had commenced drilling of one (.239 net) producer well, two (.48 net) CO
2
injection wells and two (.48 net) wells in the water curtain program. Additional on-going development activities also include related flowlines and other infrastructure.
For further discussion, see
"
Highlights for our fiscal year 2018" and "Capital Budget" under
Item 7. Management's Discussion and Analysis of Financial Condition and Results of Operations
of this Form 10-K.
Delivery Commitments
As of
June 30, 2018
, we were neither committed to provide a fixed and determinable quantity of oil, NGLs or gas under existing agreements, nor do we currently intend to enter into any such agreements.
Productive Wells
The following table sets forth the number of productive oil and gas wells in which we owned a working interest as of
June 30, 2018
.
|
|
Company Operated
|
Non-Operated
|
Total
|
||||||||||||||
|
Gross
|
Net
|
Gross
|
Net
|
Gross
|
Net
|
||||||||||||
|
Crude oil
|
—
|
|
—
|
|
102
|
|
24.3
|
|
102
|
|
24.3
|
|
|||||
|
Natural gas
|
—
|
|
—
|
|
—
|
|
—
|
|
—
|
|
—
|
|
|||||
|
Total
|
—
|
|
—
|
|
102
|
|
24.3
|
|
102
|
|
24.3
|
|
|||||
Acreage Data
The following table sets forth certain information regarding our developed and undeveloped lease acreage as of
June 30, 2018
. Developed acreage refers to acreage on which wells have been drilled or completed to a point that would permit production of oil and gas in commercial quantities. Undeveloped acreage refers to acreage on which wells have not been drilled or completed to a point that would permit production of oil and gas in commercial quantities whether or not the acreage contains proved reserves.
|
Field
|
Developed Acreage
|
Undeveloped Acreage
|
Total
|
||||||||||||||
|
Gross
|
Net
|
Gross
|
Net
|
Gross
|
Net
|
||||||||||||
|
Delhi Field, Louisiana*
|
9,126
|
|
2,180
|
|
4,510
|
|
1,077
|
|
13,636
|
|
3,257
|
|
|||||
When the Company acquired the Delhi field in 2003, the field had been fully developed through primary and secondary recovery and all of such acreage was reflected as developed acreage. With the addition of a CO
2
-EOR project in the field, certain acreage is now reflected as undeveloped using tertiary recovery operations. We estimate that our developed acreage currently includes 9,126 gross (2,180 net) acres in the Delhi field, with approximately 4,510 gross (1,077 net) acres attributable to the remaining undeveloped areas in the eastern part of the field. We own a 23.9% working interest in the field, along with certain mineral and royalty interests. We are not the operator of the EOR project.
Our interests include all depths from the surface of the earth to the top of the Massive Anhydride, including the Delhi Holt Bryant Unit, which is currently under CO
2
flood, and the Mengel Sand Interval, which is within the boundary of the field, but is currently not producing. As the Delhi field is unitized, all acreage, including any undeveloped, nonproductive or undrilled acreage is held by existing production as long as continuous production is maintained in the unit.
* This table excludes acreage attributable to small overriding royalty interests retained in various formations in the Giddings Field area. None of such acreage is currently producing and our interests are subject to expiration if leases are not maintained by others or commercial production is not established. It does not currently appear likely that we will obtain any significant value from these interests.
19
For more complete information regarding current year activities, including crude oil and natural gas production, refer to
Item 7. Management's Discussion and Analysis of Financial Condition and Results of Operations
of this Form 10-K.
See Note 16 – Commitments and Contingencies under
Item 8. Financial Statements
for a description of legal proceedings, which is incorporated herein by reference.
Not Applicable.
20
Common Stock
Our common stock is currently traded on the NYSE American under the ticker symbol "EPM". The following table shows, for each quarter of the fiscal years ended June 30, 2018 and 2017, the high and low sales prices for EPM as reported by the NYSE American.
NYSE American: EPM
|
2018:
|
High
|
Low
|
|||||
|
Fourth quarter ended June 30, 2018
|
$
|
10.50
|
|
$
|
7.75
|
|
|
|
Third quarter ended March 31, 2018
|
$
|
8.30
|
|
$
|
6.70
|
|
|
|
Second quarter ended December 31, 2017
|
$
|
7.63
|
|
$
|
6.35
|
|
|
|
First quarter ended September 30, 2017
|
$
|
8.70
|
|
$
|
6.35
|
|
|
|
2017:
|
High
|
Low
|
|||||
|
Fourth quarter ended June 30, 2017
|
$
|
8.45
|
|
$
|
6.75
|
|
|
|
Third quarter ended March 31, 2017
|
$
|
10.20
|
|
$
|
7.20
|
|
|
|
Second quarter ended December 31, 2016
|
$
|
10.20
|
|
$
|
6.35
|
|
|
|
First quarter ended September 30, 2016
|
$
|
6.85
|
|
$
|
5.12
|
|
|
Shares Outstanding and Holders
As of
June 30, 2018
, there were
33,080,543
shares of common stock issued and outstanding, held by approximately 250 holders of record. We estimate there are approximately 2,000 individuals and institutions that hold our stock through nominees.
Dividends
We began paying cash quarterly dividends on our common stock in December 2013, at a rate of $0.10 per share and adjusted the rate to $0.05 per share in March 2015. Subsequently, we made a series of dividend rate increases effective in their respective initial months of payment: $ 0.065 per share in December 2016, $0.07 per share in March 2017, $0.075 per share in September 2017, and $0.10 per share in March 2018. As of
June 30, 2018
, we had paid twenty consecutive quarterly dividends on our common stock. In August 2018, the Company declared a $0.10 per share dividend payable on September 28, 2018. All dividends on our Series "A" Perpetual Preferred stock were timely declared and paid monthly prior to the November 2016 redemption of such preferred stock. Any future determination with regard to the payment of dividends will be at the discretion of the Board of Directors and will be dependent upon our future earnings, financial condition, applicable dividend restrictions and capital requirements and other factors deemed relevant by the Board of Directors. Under our current revolving credit facility, our ability to continue to pay common stock dividends is dependent on compliance with certain financial covenants related to debt service coverage, as defined in the agreement.
Performance Graph
The following graph presents a comparison of the yearly percentage change in the cumulative total return on our Common Stock over the period from June 30, 2013 to
June 30, 2018
with the cumulative total return of the S&P 500 Index and the S&P Oil & Gas Exploration and Production Index of publicly traded companies over the same period. The graph assumes that $100 was invested on June 30, 2013 in our common stock at the closing market price at the beginning of this period and in each of the other two indices and the reinvestment of all dividends, if any. The graph is presented in accordance with requirements of the SEC. Shareholders are cautioned against drawing any conclusions from the data contained therein, as past results are not necessarily indicative of future financial performance.
21
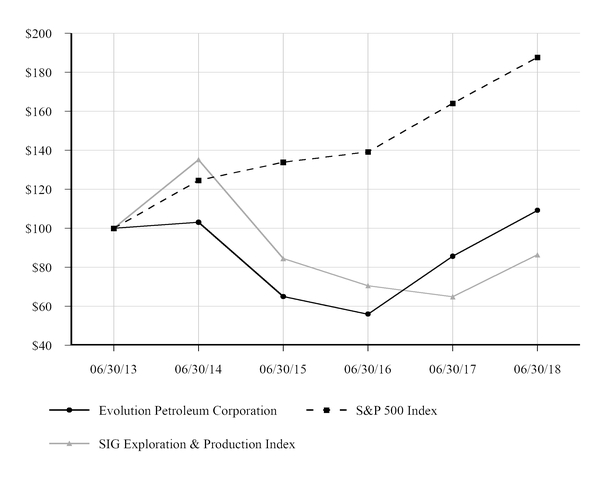
Securities Authorized For Issuance Under Equity Compensation Plans
|
Plan category
|
Number of
securities to
be issued
upon exercise
of outstanding
options,
warrants and
rights
(a)
|
|
Weighted-average
exercise
price of
outstanding
Options, warrants
and rights
(b)
|
Number of securities
remaining
available for future
issuance under
equity compensation
plans (excluding
securities reflected
in column (a))(1)
|
|||||||
|
Equity compensation plans approved by security holders:
|
|||||||||||
|
Outstanding options
|
—
|
|
(1)
|
$
|
—
|
|
|||||
|
Outstanding contingent rights to shares
|
28,562
|
|
(1)
|
—
|
|
||||||
|
Total
|
28,562
|
|
$
|
—
|
|
963,093
|
|
||||
|
Equity compensation plans not approved by security holders
|
—
|
|
—
|
|
—
|
|
|||||
|
Total
|
28,562
|
|
|
$
|
—
|
|
963,093
|
|
|||
|
(1)
|
As of
June 30, 2018
, all stock options had been exercised and no shares of common stock were issuable related to outstanding stock options. The Amended and Restated 2004 Stock Plan (the "Plan") provided for the issuance of a total of 6,500,000 common shares. Under the Plan as of
June 30, 2018
, 3,939,365 common shares had been issued upon the exercise of stock options, 2,382,843 shares of restricted common stock had been issued (of which 89,545 were unvested as of
June 30, 2018
), contingent restricted stock grants of 145,646 shares had been reserved (of which 28,562 were unvested as of
June 30, 2018
) and 32,146 remaining reserved shares were released in December 2016 to the Company's authorized but unissued and unreserved shares. The Plan was terminated upon the adoption of 2016 Equity Incentive Plan (the "2016 Plan"), which authorized the issuance of 1,100,000 shares of common stock. During fiscal 2018,
136,907
awards were made under the 2016 Plan and
963,093
shares of common stock remain available for future grants at
June 30, 2018
.
|
22
Issuer Purchases of Equity Securities
|
Period
|
(a) Total Number of
Shares (or Units)
Purchased (1) (2)
|
(b) Average Price
Paid per Share (or
Units)
|
(c) Total Number of Shares
(or Units) Purchased as Part
of Publicly Announced Plans
or Programs
|
(d) Maximum Number (or
Approximate Dollar Value)
of Shares (or Units) that
May Yet Be Purchased
Under the Plans or
Programs
|
|||||
|
April 1, 2018 to April 30, 2018
|
None
|
Not applicable
|
Not applicable
|
$3.4 million
|
|||||
|
May 1, 2018 to May 31, 2018
|
18,190
|
$
|
9.65
|
|
Not applicable
|
$3.4 million
|
|||
|
June 1, 2018 to June 30, 2018
|
None
|
Not applicable
|
Not applicable
|
$3.4 million
|
|||||
During the fourth quarter ended
June 30, 2018
, the Company received shares of common stock from certain of its employees which were surrendered in exchange for their payroll tax liabilities arising from vestings of restricted stock and contingent restricted stock. The acquisition cost per share reflects the weighted-average market price of the Company's shares on the dates vested.
(1)
On May 12, 2015, the Board of Directors approved a share repurchase program covering up to $5 million of the Company's common stock. Under the program's terms, shares may be repurchased only on the open market and in accordance with the requirements of the Securities and Exchange Commission. The timing and amount of repurchases will depend upon several factors, including financial resources and market and business conditions. There is no fixed termination date for this repurchase program, and the repurchase program may be suspended or discontinued at any time. Such shares are initially recorded as treasury stock, then subsequently canceled. The Company has not repurchased any shares under this program since December 2015.
23
The selected consolidated financial data, set forth below should be read in conjunction with
Item 7. "Management's Discussion and Analysis of Financial Condition and Results of Operations"
and with the consolidated financial statements and notes to those consolidated financial statements included elsewhere in this report.
|
|
June 30,
|
||||||||||||||||||
|
|
2018
|
2017
|
2016
|
2015
|
2014
|
||||||||||||||
|
Income Statement Data
|
|
|
|
|
|
||||||||||||||
|
Revenues
|
$
|
41,281,212
|
|
$
|
34,484,896
|
|
$
|
26,349,502
|
|
$
|
27,841,265
|
|
$
|
17,673,508
|
|
||||
|
Cost of revenues
|
12,193,502
|
|
10,835,809
|
|
9,133,111
|
|
9,355,613
|
|
1,193,573
|
|
|||||||||
|
Depreciation, depletion, and amortization
|
6,011,998
|
|
5,719,405
|
|
5,165,120
|
|
3,615,737
|
|
1,228,685
|
|
|||||||||
|
Accretion expense
|
90,290
|
|
59,664
|
|
49,054
|
|
34,866
|
|
41,626
|
|
|||||||||
|
General and administrative expense
|
6,773,781
|
|
4,985,408
|
|
9,079,597
|
|
6,256,783
|
|
8,388,291
|
|
|||||||||
|
Restructuring charges
|
—
|
|
4,488
|
|
1,257,433
|
|
(5,431
|
)
|
1,293,186
|
|
|||||||||
|
Income from operations
|
16,211,641
|
|
12,880,122
|
|
|
1,665,187
|
|
8,583,697
|
|
5,528,147
|
|
||||||||
|
Other income (expense)
|
(25,126
|
)
|
4,855
|
|
32,565,954
|
|
(147,619
|
)
|
(38,836
|
)
|
|||||||||
|
Income tax provision (benefit)
|
(3,431,969
|
)
|
4,840,664
|
|
9,570,779
|
|
3,444,221
|
|
1,891,998
|
|
|||||||||
|
Net income attributable to the Company
|
$
|
19,618,484
|
|
$
|
8,044,313
|
|
|
$
|
24,660,362
|
|
$
|
4,991,857
|
|
$
|
3,597,313
|
|
|||
|
Dividends on preferred stock
|
—
|
|
250,990
|
|
674,302
|
|
674,302
|
|
674,302
|
|
|||||||||
|
Deemed dividend on preferred shares called for redemption
|
—
|
|
1,002,440
|
|
—
|
|
—
|
|
—
|
|
|||||||||
|
Net income attributable to common shareholders
|
$
|
19,618,484
|
|
$
|
6,790,883
|
|
|
$
|
23,986,060
|
|
$
|
4,317,555
|
|
$
|
2,923,011
|
|
|||
|
Earnings per common share:
|
|
|
|||||||||||||||||
|
Basic
|
$
|
0.59
|
|
$
|
0.21
|
|
$
|
0.73
|
|
$
|
0.13
|
|
$
|
0.09
|
|
||||
|
Diluted
|
$
|
0.59
|
|
$
|
0.21
|
|
$
|
0.73
|
|
$
|
0.13
|
|
$
|
0.09
|
|
||||
|
June 30, 2018
|
June 30, 2017
|
June 30, 2016
|
June 30, 2015
|
June 30, 2014
|
|||||||||||||||
|
Balance Sheet Data
|
|
|
|
|
|
||||||||||||||
|
Total current assets
|
$
|
32,147,556
|
|
$
|
26,142,527
|
|
$
|
37,086,450
|
|
$
|
23,693,048
|
|
$
|
26,304,803
|
|
||||
|
Total assets
|
93,662,544
|
|
88,268,668
|
|
97,451,051
|
|
69,882,727
|
|
65,015,752
|
|
|||||||||
|
Total current liabilities
|
4,430,214
|
|
2,718,894
|
|
8,528,908
|
|
9,329,257
|
|
2,999,726
|
|
|||||||||
|
Total liabilities
|
16,373,065
|
|
19,798,813
|
|
21,129,901
|
|
21,306,150
|
|
13,138,230
|
|
|||||||||
|
Stockholders' equity
|
77,289,479
|
|
68,469,855
|
|
76,321,150
|
|
48,576,577
|
|
51,877,522
|
|
|||||||||
|
Number of common shares outstanding
|
33,080,543
|
|
33,087,308
|
|
32,907,863
|
|
32,845,205
|
|
32,615,646
|
|
|||||||||
|
Working capital, net
|
27,717,342
|
|
23,423,633
|
|
28,557,542
|
|
14,363,791
|
|
23,305,077
|
|
|||||||||
|
Cash dividends to common stockholders
|
11,594,541
|
|
8,432,435
|
|
6,565,823
|
|
9,833,642
|
|
9,723,833
|
|
|||||||||
24
The following discussion and analysis should be read in conjunction with our Consolidated Financial Statements and Notes thereto included in Item 8, Financial Statements and Supplementary Data. Our discussion and analysis includes forward-looking information that involves risks and uncertainties and should be read in conjunction with Risk Factors under Item 1A of this Form 10-K, together with the statement of Forward-Looking Information at the beginning of this report for discussion of the risks and uncertainties that could cause our actual results to be materially different from our forward-looking statements. Certain dollar amounts and percentages in this Management’s Discussion and Analysis of Financial Condition and Results of Operations and other parts of this Annual Report on Form 10-K have been rounded for presentation, and certain amounts may not sum due to rounding.
Executive Overview
General
Evolution Petroleum Corporation is an oil and gas company focused on delivering a sustainable dividend yield to its shareholders through the ownership, management and development of producing oil and gas properties. The Company's long-term goal is to build a diversified portfolio of oil and gas assets primarily through acquisition, while seeking opportunities to maintain and increase production through selective development, production enhancement and other exploitation efforts on its properties. Our largest active investment is our interest in a CO
2
enhanced oil recovery project in Louisiana's Delhi field.
By policy, every employee and director maintains a beneficial ownership position in our common stock. We believe this ownership helps ensure that the interests of our employees and directors are aligned with our shareholders.
As a result of the retirement of Randy Keys, President and Chief Executive Officer on May 31, 2018, the Board of Directors immediately moved to name Robert Herlin to act as Interim Chief Executive Officer and to commence a search for a permanent Chief Executive Officer. Additionally, the Board of Directors created a temporary Transition Services Committee, consisting solely of Director William Dozier, to aid and assist management in primarily evaluating potential property acquisitions and operational matters. Both of these appointments are deemed temporary while the ongoing search for a permanent Chief Executive Officer is resolved.
We expect to fund our fiscal
2019
capital program from working capital and net cash flows from our properties.
Highlights for our fiscal year
2018
|
•
|
Our fiscal year 2018 net income was $19.6 million, or $0.59 per share, our seventh consecutive year of reporting net income.
|
|
•
|
We funded all operations, including $5.4 million of capital spending, from internal resources and remained debt free.
All of our capital expenditures and dividends were funded solely by cash flow from operations and working capital and we ended our fiscal year with no funded debt.
|
|
•
|
We returned $11.6 million to common shareholders in the form of cash dividends during fiscal 2018.
The annual dividend rate of $0.40 per share is an increase of 43% from a year ago. We remain committed to our dividend policy and rewarding our long-term shareholders.
|
|
•
|
We extended the maturity date of our senior secured bank credit facility to April 2021.
Our elected borrowing base is $40 million, and there are no outstanding borrowings as of September 1, 2018.
|
|
•
|
Oil and NGL revenues increased by $6.8 million, or 20%, in fiscal 2018, principally driven by 23% higher realized commodity prices, offset in part by a 3% decrease in production volumes.
Production was adversely impacted by factors including unusually cold weather and temporary reductions in CO
2
injections to support our infill drilling program.
|
|
•
|
The Delhi twelve-well infill drilling program is largely completed and only a few completions remain outstanding as of September 1, 2018.
We expect the remainder of the project to be completed by October 2018, and we expect to see an uplift in oil volumes in fiscal 2019.
|
Oil & Gas Reserves (based on SEC oil price of $57.50 per barrel in effect as at June 30, 2018)
|
•
|
Delhi proved oil equivalent reserves at June 30, 2018 were 9.4 MMBOE
, a 7% decline from the previous year. The Standardized Measure for proved reserves increased 43% to $119 million, reflecting a rise in commodity price from
|
25
$44.88 to $55.39 per BOE. Proved reserves are 86% oil and 14% natural gas liquids, and 78% of these reserves are developed and producing.
|
•
|
Delhi probable reserves at June 30, 2018 were 4.5 MMBOE
, a 15% decrease over the previous year. 80% of these reserves are classified as developed and producing as such are incremental reserves associated with existing developed and producing locations.
|
|
•
|
Delhi possible reserves at June 30, 2018 were 4.6 MMBOE
, a 42% increase over the previous year. 88% of these reserves are classified as developed and producing as such are incremental reserves associated with existing developed and producing locations.
|
The following table is a summary of our proved, probable and possible reserves for fiscal year 2018 and 2017:
|
|
Proved
|
|
Probable
|
|
Possible
|
|
||||||||||||||||||||||
|
|
2018
|
2017
|
Change
|
2018
|
2017
|
Change
|
2018
|
2017
|
Change
|
|||||||||||||||||||
|
Reserves MMBOE
|
9.4
|
|
10.1
|
|
(7
|
)%
|
4.5
|
|
5.3
|
|
(15
|
)%
|
4.6
|
|
3.2
|
|
42
|
%
|
||||||||||
|
% Developed
|
78
|
%
|
79
|
%
|
(1
|
)%
|
80
|
%
|
82
|
%
|
(2
|
)%
|
88
|
%
|
89
|
%
|
(1
|
)%
|
||||||||||
|
Liquids %
|
100
|
%
|
100
|
%
|
—
|
%
|
100
|
%
|
100
|
%
|
—
|
%
|
100
|
%
|
100
|
%
|
—
|
%
|
||||||||||
|
Standardized Measure ($MM)
|
$
|
119
|
|
$
|
83
|
|
43
|
%
|
||||||||||||||||||||
|
PV-10* ($MM)
|
$
|
146
|
|
$
|
111
|
|
32
|
%
|
|
|
|
|
||||||||||||||||
____________________________________________________________________________
|
*
|
PV-10 of Proved reserves is a pre-tax non-GAAP measure. We have included a reconciliation of PV-10 to the unaudited after-tax Standardized Measure of Discounted Future Net Cash Flows ("Standardized Measure"), which is the most directly comparable financial measure calculated in accordance with GAAP, in
|
Additional property and project information is included under
Item 1. Business, Item 2. Properties, Item 8. Financial Statements - Notes to the Financial Statements
and
Exhibit 99.4
of this Form 10-K.
Delhi Field—Enhanced Oil Recovery Project
Our interests in the Delhi field consist of a 23.9% working interest (with associated 19.0% net revenue interest) and separate overriding royalty and mineral interests of 7.2%. This yields a total net revenue interest of 26.2%. The Delhi field is operated by Denbury Onshore, LLC, and subsidiary 100% owned by Denbury Resources, Inc. (the "operator").
Proved reserves volumes totaled 9.4 MMBOE with a Standardized Measure of $119 million and a PV-10* value of $146 million compared to the prior year's 10.1 MMBOE with a Standardized Measure of $83 million and a PV-10* value of $111 million. Transfers from probable oil reserves led to a 0.4 MMBO (4%) positive revision in proved oil reserves. Performance from the NGL plant was below our expectations, resulting in a 0.3 MMBO (19%) negative revision to NGL reserves. Combined, these revisions had a slight positive effect on equivalent reserves volumes. However, with NGL prices 67% the level of oil prices, the overall impact on value was more positive. Probable reserve volumes at Delhi were 4.5 MMBOE, a decrease of 15% compared to 5.3 MMBOE in the prior year. Possible reserves volumes at Delhi were 4.6 MMBOE, an increase of 42% compared to 3.2 MMBOE in the prior year.
Gross production at Delhi in the fourth quarter of fiscal 2018 was
7,545
BOEPD, a 5% increase compared to
7,187
BOEPD in the third fiscal quarter. Oil production was
6,530
barrels of oil per day (“BOPD”), a
2%
increase from the third
26
fiscal quarter’s
6,427
BOPD. NGL production in the fourth quarter was
1,015
BOEPD,
34%
higher than prior quarter production of
760
BOEPD. Production during the quarter was impacted by reduced volumes of CO
2
injected into the field due primarily to warmer temperatures, compressor downtime for repairs and reduced CO
2
injections near wells being drilled as part of the infill drilling program. July production is also expected to be similarly impacted. Production only included a small volume from the first three wells of the twelve infill well drilling program initiated in March 2018; the wells are expected to gradually begin materially impacting production over the next two to three quarters. The twelve-well infill program consists of eight producer wells and four CO
2
injection wells. Three producer wells and one CO
2
injection well went online at the end of the fourth quarter, and the remaining five producers and three CO
2
injection wells are expected to be completed and brought online by the end of October 2018. The infill program targets productive oil zones in the developed area of the field that the operator believes are not being swept effectively by the current CO
2
flood. This program is expected to both add production and increase ultimate recoveries above the current proved producing oil reserves.
The average oil price realized by Evolution during the fourth quarter of fiscal 2018 was $67.41 compared to $63.56 during the previous quarter. The average NGL price realized by Evolution during the fourth quarter of fiscal 2018 was $38.39 per barrel compared to $34.05 during the previous quarter. Evolution continues to benefit from the premium that Delhi field oil receives selling under Louisiana Light Sweet ("LLS") pricing, as compared to the more widely known West Texas Intermediate ("WTI") price, and the oil is shipped to market directly by pipeline, the most efficient means of transportation from the field.
Our overall lifting costs for the year were
$16.36
per BOE increased
16%
from
$14.10
per BOE in the prior year. Our cost of purchased CO
2
in the Delhi field, the largest single component of operating costs, is directly tied to the price of oil sold from the field. This major operating cost increased
5.6%
due to the higher price of crude, partially offset by lower purchased volumes. Gross CO
2
injection rates for the year ended June 30, 2018 averaged
65.0
MMcf per day, a decline of
11%
compared to the 73.1 MMcf per day during fiscal 2017. Other lease operating expenses for the fiscal 2018 increased
17.4%
compared to the prior year , primarily due to workover expenses and the cost of the NGL plant, which commenced operations in December 2016, midway through our fiscal year 2017.
For fiscal 2018, our gross NGL production was
976
BOEPD, which sold at an average price of
$33.50
per barrel compared to prior year gross production of
459
BOEPD for which we realized
$21.28
per barrel. Production from the NGL plant is transported by truck to a processing plant in East Texas, and therefore bears a material transportation charge. Plant efficiencies have improved from the prior year and the higher realized price reflects both the impact of higher oil prices and improvements in meeting the purchaser's specification requirements. Under the operator's marketing contract, we receive market index pricing for each NGL component, based on the processed yield, less transportation, processing fees and other deductions. Our current mix of products contains a large percentage (~70%) of higher value NGL's, such as pentanes and butane, and almost no lower value ethane. Market pricing for our NGL's during the fourth quarter was favorable, with net realized NGL prices averaging approximately 57% of WTI prices (net realized price is after deduction of transportation and fractionation charges). NGL demand often has a seasonal pattern and prices tend to be higher during the cooler months of October through March. Accordingly, the relationship between NGL prices and WTI has fluctuated over time and we expect such volatility to continue.
The NGL plant includes an electric turbine to convert methane and part of the ethane processed by the plant to electricity. This turbine is generating power for the NGL plant and supplies excess power to the CO
2
recycle facility, contributing to an 11% decline in electricity expense year over year. The NGL plant is accomplishing its primary objective of removing the lighter hydrocarbons (i.e. methane and ethane), thereby increasing the purity of the CO
2
recycle stream and improving the efficiency of the flood. Over time, it is expected to increase the recovery of crude oil in the field. The plant is also providing feedstock to power the electric turbine and producing significant quantities of higher value NGL's for sale.
Remaining estimated capital expenditures for our proved undeveloped reserves amount to approximately $6.15 per BOE for the remainder of the infill drilling project and Phase V. No remaining capital expenditures are required to develop our probable or possible reserves as these reserves reflect incremental quantities associated with a greater percentage recovery of hydrocarbons in place than the recovery quantities assumed for proved reserves. Looking forward, the timing of plans for continued development of the eastern part of the Delhi field is dependent on the operator’s plans for capital allocation within their portfolio. Development of unquantified volumes is dependent upon the timing of excess capacity within the processing plant and oil price. We continue to believe that this high quality and economically viable project will be executed as planned, subject to oil price volatility.
2017 Tax Cuts and Jobs Act
On December 22, 2017, the U.S. government enacted comprehensive tax legislation under the title of the Tax Cuts and Jobs Act ("Tax Act"). The Tax Act includes a permanent reduction in our federal corporate income tax rate from 34% to 21%. It also provides more favorable tax deductions associated with capital investments and other significant changes to tax law. The
27
Tax Act became effective upon passage, so our statutory rate for the current fiscal year ended June 30, 2018 is a blended rate of 27.55%. The permanent reduction in the federal corporate income tax rate resulted in a one-time non-cash income tax benefit of approximately
$6.1 million
related to the adjustment of our liability for deferred income taxes to the lower rate in the Tax Act. This benefit was recognized in the quarter ended December 31, 2017. The accounting for the effects of the rate change on the Company’s deferred tax balances was complete as of December 31, 2017 and no provisional amounts were recorded.
|
June 30,
|
|||||||||||
|
|
2018
|
2017
|
2016
|
||||||||
|
Income before income taxes
|
$
|
16,186,515
|
|
$
|
12,884,977
|
|
$
|
34,231,141
|
|
||
|
Income tax (benefit) provision
|
(3,431,969
|
)
|
(a)
|
4,840,664
|
|
9,570,779
|
|
||||
|
Effective tax rate
|
(21
|
)%
|
(b)
|
38
|
%
|
28
|
%
|
||||
(a) The income tax provision for the ended
June 30, 2018
includes a one-time non-cash benefit of approximately
$6.1 million
for the adjustment of our liability for deferred income taxes to the lower rate in the Tax Act. This discrete adjustment results in a negative tax rate (benefit) for this period.
(b) Income taxes are recorded in our financial statements based on our estimated annual effective income tax rate together with any discrete items. For the year ended
June 30, 2018
, the effective rate used in the calculation of our income tax expense was approximately
16%
. Applying this rate together with the
$6.1 million
discrete revaluation benefit resulted in the negative tax rate (benefit) of
(21)%
.
Compared to the year ended June 30, 2017, the effective tax rate for the year ended June 30, 2018, excluding the impact of the
$6.1 million
deferred tax adjustment, was lower than the prior year tax rate due principally to increased depletion in excess of basis.
Liquidity and Capital Resources
We had
$27.7 million
and
$23.4 million
of working capital at
June 30, 2018
and
June 30, 2017
, respectively.
In addition, we have a senior secured reserve-based credit facility (the "Facility") with a maximum borrowing capacity of $50.0 million. The Facility had $40.0 million of undrawn borrowing base availability on June 30, 2018. There have been no borrowings under the Facility, which is secured by substantially all of the Company’s assets. In February 2018, we elected to increase the borrowing base from $10.0 million to $40.0 million. Additionally, on May 28, 2018, we entered into the third amendment to our credit agreement governing the revolving credit facility to, among other things, extend the maturity date to April 11, 2021 and amend certain financial covenants.
The borrowing base is subject to periodic redeterminations and further adjustments from time to time. The borrowing base will be redetermined semi-annually on May 15 and November 15 of each year. The borrowing base will also be reduced in certain circumstances such as the sale or disposition of certain oil and gas properties of the Company or its subsidiaries and changes to certain hedging positions. With volatility in commodity prices, our borrowing base and related commitments under the Facility could be reduced in the future. Any future borrowings bear interest, at the Company's option, at either LIBOR plus 2.75% or the Prime Rate, as defined in the Facility agreement, plus 1.0%. The Facility contains covenants that require the maintenance of (i) a total leverage ratio of not more than 3.0 to 1.0, (ii) a debt service coverage ratio of not less than 1.1 to 1.0 and (iii) a consolidated tangible net worth of not less than $50.0 million, each as defined in the Facility agreement.
As of June 30, 2018, the Company was in compliance with all covenants under the Facility, and no amounts were outstanding under the Facility.
During our fiscal year ended
June 30, 2018
, we funded our operations and cash dividends with cash generated from operations; our cash balance and working capital increased
$1.9 million
and
$4.3 million
, respectively, from June 30, 2017.
We have historically funded our operations through cash from operations and working capital. Our primary source of cash is the sale of oil and natural gas liquids production. A portion of these cash flows are used to fund our capital expenditures. While we expect to continue to expend capital to further develop the Delhi field, we and the operator have flexibility as to when this capital is spent. The Company expects to manage future development activities in the Delhi field within the boundaries of its operating cash flow and existing working capital.
We may choose to evaluate and pursue new growth opportunities through acquisitions or other transactions. In addition to our cash on hand, we have access to at least $40 million of availability under our senior secured credit facility. In addition we have an effective shelf registration statement with Securities and Exchange Commission under which we may issue up to $500 million of new debt or equity securities. If we choose to pursue new growth opportunities, we would expect to use our internal
28
resources of cash, working capital and borrowing capacity under our credit facility. It may also be advantageous for us to consider issuing additional equity as part of any potential transaction, but we have no specific plans to do so at this time.
Our other significant use of cash is our on-going dividend program. The Board of Directors instituted a cash dividend on our common stock in December 2013 and we have since paid twentieth consecutive quarterly dividends. Distribution of free cash flow in excess of our operating and capital requirements through cash dividends and potential repurchases of our common stock remains a priority of our financial strategy, and it is our long term goal to increase our dividends over time as appropriate. In February 2018, the Board declared an increase in the quarterly common stock dividend from $0.075 per share to $0.10 per share, effective with the dividend payment in March 2018. In August 2018, the Board declared a $0.10 per share dividend payable on September 28, 2018. The amount of future dividends paid to Evolution Petroleum common stockholders is determined by the Board on a quarterly basis and is based on the Company’s earnings, financial condition, capital requirements, the effect a dividend payment would have on the Company’s compliance with relevant financial covenants, and other factors deemed relevant by the Board.
Cash Flows from Operating Activities
For the year ended
June 30, 2018
, cash flows provided by operating activities were
$20.5 million
, reflecting
$21.9 million
provided by operations before $1.4 million used by other working capital changes. Of the
$21.9 million
provided before working capital changes, approximately
$19.6 million
resulted from net income and
$2.3 million
was attributable to non-cash expenses and gains.
For the year ended June 30, 2017, cash flows provided by operating activities were $16.5 million, reflecting $19.0 million provided by operations before $2.5 million used by other working capital changes. Of the $19.0 million provided before working capital changes, approximately $8.0 million resulted from net income and $10.9 million was attributable to non-cash expenses and gains.
For the year ended June 30, 2016, cash flows provided by operating activities were $30.7 million, reflecting $28.9 million provided by operations before $1.8 million provided by other working capital changes. Of the $28.9 million provided before working capital changes, approximately $24.7 million resulted from net income and $4.2 million was attributable to non-cash expenses and gains.
Cash Flows from Investing Activities
For the year ended
June 30, 2018
, investing activities used
$3.7 million
of cash, consisting primarily of capital expenditures of approximately
$3.7 million
for the Delhi field.
For the year ended June 30, 2017, investing activities used $10.5 million of cash, consisting primarily of cash capital expenditures of approximately $10.2 million for the Delhi field, partially offset by $0.3 million of derivative settlements paid.
For the year ended June 30, 2016, investing activities used $17.6 million of cash, consisting primarily of cash capital expenditures of approximately $21.1 million for the Delhi field, partially offset by $3.6 million of derivative settlement payments received.
Oil and gas capital expenditures incurred, which includes accrued expenditures and other noncash items, were
$5.4 million
,
$7.6 million
, and
$19.7 million
, respectively, for the years ended
June 30, 2018
,
2017
, and
2016
. These amounts can be reconciled to cash capital expenditures on their respective cash flow statements by adjusting them for related non-cash items presented at Note 12 – Supplemental Cash Flow Information.
Cash Flows from Financing Activities
For the year ended June 30, 2018, financing activities used
$12.2 million
of cash, comprised of
$11.6 million
of common stock cash dividends, and
$0.6 million
of treasury stock acquired through the surrender of shares in satisfaction of payroll liabilities related to vestings of stock-based compensation awards.
For the year ended June 30, 2017, financing activities used $17.1 million of cash, comprised of $8.4 million of common stock cash dividends, $0.3 million of preferred dividends, $7.9 million for redemption of preferred stock in November 2016 and $0.5 million of treasury stock acquired through the surrender of shares in satisfaction of payroll liabilities related to vestings of stock-based compensation awards.
For the year ended June 30, 2016, financing activities provided $0.9 million of cash from $9.6 million of tax benefits related to stock-based compensation partially offset by $7.2 million of dividend payments to common and preferred shareholders and $1.4 million of treasury stock acquisitions, primarily attributable to the Company's share buyback program.
29
The tax benefits included a $1.5 million cash refund received from the State of Louisiana for carryback of stock-based compensation deductions to previously filed returns.
Capital Budget
During the year ended
June 30, 2018
, we incurred $5.4 million of capital expenditures at Delhi. This spending included $0.4 million for capital upgrades to the recycle plant, $1.1 million for CO
2
conformance projects and capital maintenance, $1.1 million for Test Site 5 infrastructure (i.e. water curtain wells) in the eastern portion of the field, and $2.8 million for the infill drilling program.
The twelve-well infill drilling program in the Delhi field commenced March 2018 and all twelve wells are expected to be drilled and completed by the end of September and on budget. The total project had an estimated net cost of $4.7 million, with approximately sixty percent of those costs incurred in fiscal year 2018, with the balance to be incurred in fiscal first quarter of 2019. All twelve wells are expected to be in operation by the end of October 2018 and the operator anticipates an uplift in oil volumes to be reported over the next few quarters. The program consists of four new CO
2
injection wells and eight new production wells and targeted productive oil zones which we believe were not being swept effectively by the current CO
2
flood, thereby adding incremental production.
We previously approved additional net capital expenditures totaling $2.8 million for water injection, flowlines and other infrastructure projects in preparation for the Test Site 5 development. Such development requires participation by both the operator and Evolution, and the operator has not yet finalized its capital expenditure budget for 2019. Approximately $1.1 million of these preparation costs have been incurred as of
June 30, 2018
. In addition, we expect to continue to perform conformance workover projects and will likely incur additional maintenance capital expenditures. Such amounts cannot be estimated accurately at this time, but are not expected to be material to our financial position.
Funding for our anticipated capital expenditures at Delhi over the next two fiscal years is expected to be met from cash flows from operations and current working capital.
Liquidity Outlook
Our current liquidity position remains strong, with
$27.7 million
of working capital, which is significantly in excess of our expected capital needs at Delhi. We also expect positive cash flow in the future. Our future liquidity is dependent on the realized prices we receive for the oil and natural gas liquids we produce. Commodity prices are market driven and historically volatile, and they are likely to continue to be volatile. The Company may utilize derivative instruments to reduce its exposure to short term oil price volatility with the goal of achieving a more predictable level of cash flows to support the Company’s capital expenditure and dividend programs. From time to time, the Company has used both fixed price swap agreements and costless collars to manage its exposure to crude oil price risk. We have no derivative commitments at June 30, 2018. While the use of derivative instruments limits the downside risk of adverse price movements, they may also limit future revenues from favorable price movements. Our future revenues, cash flow, profitability, access to capital and future rate of growth will be significantly impacted by the prices we receive for our production.
Funding for our anticipated capital expenditures over the next two fiscal years is expected to be met from cash flows from operations and current working capital. Our preference is to remain debt free under our current operating plans, but we have access to at least $40 million of availability under a senior secured credit facility if required. In addition, we have a maximum of $500 million authorized under an effective shelf registration statement with Securities and Exchange Commission under which we may sell new securities from time to time in one or more offerings. We may choose to evaluate and pursue new growth opportunities through acquisitions or other transactions. In that event, we would expect to use our internal resources of cash, working capital and borrowing capacity under our credit facility. It may also be advantageous for us to consider issuing additional equity as part of any potential transaction, but we have no specific plans to do so at this time.
The Board of Directors instituted a cash dividend on our common stock in December 2013 and have since paid twenty consecutive quarterly dividends and have declared the twenty-first dividend for payment on September 28, 2018. The amount of future dividends paid to Evolution common stockholders is determined by the Board on a quarterly basis and is based on the Company’s earnings, financial condition, capital requirements, the effect a dividend payment would have on the Company’s compliance with relevant financial covenants, and other factors deemed relevant by the Board.
In May 2015, we established a stock repurchase plan to allow us to acquire up to $5.0 million of our common stock over time. We have repurchased $1.6 million of common stock under the plan, but made no stock repurchases during fiscal 2017 or fiscal 2018. The timing and amount of repurchases will depend upon several factors, including financial resources and market conditions. In general, our share repurchase program is limited to discretionary funds and is of lesser importance than our primary objectives related to our development capital spending at Delhi and our common stock dividend program. There is no fixed termination date for the repurchase program, and the repurchase program may be suspended or discontinued at any time.
30
Results of Operations
The following table sets forth certain financial information with respect to our oil and natural gas operations:
|
|
Year Ended June 30,
|
||||||||||
|
|
2018
|
2017
|
2016
|
||||||||
|
Oil and gas production:
|
|||||||||||
|
Crude oil revenues
|
$
|
38,153,417
|
|
$
|
33,550,698
|
|
$
|
26,130,762
|
|
||
|
NGL revenues
|
3,127,795
|
|
934,202
|
|
7,885
|
|
|||||
|
Natural gas revenues
|
—
|
|
(4
|
)
|
2,895
|
|
|||||
|
Total revenues
|
$
|
41,281,212
|
|
$
|
34,484,896
|
|
$
|
26,141,542
|
|
||
|
|
|
||||||||||
|
Crude oil volumes (Bbl)
|
651,931
|
|
724,523
|
|
658,041
|
|
|||||
|
NGL volumes (Bbl)
|
93,366
|
|
43,907
|
|
491
|
|
|||||
|
Natural gas volumes (Mcf)
|
—
|
|
16
|
|
1,620
|
|
|||||
|
Equivalent volumes (BOE)
|
745,297
|
|
768,433
|
|
658,802
|
|
|||||
|
Crude oil (BOPD, net)
|
1,786
|
|
1,985
|
|
1,798
|
|
|||||
|
NGLs (BOEPD, net)
|
256
|
|
120
|
|
1
|
|
|||||
|
Natural gas (BOEPD, net)
|
—
|
|
—
|
|
1
|
|
|||||
|
Equivalent volumes (BOEPD, net)
|
2,042
|
|
2,105
|
|
1,800
|
|
|||||
|
Crude oil price per Bbl
|
$
|
58.52
|
|
$
|
46.31
|
|
$
|
39.71
|
|
||
|
NGL price per Bbl
|
33.50
|
|
21.28
|
|
16.06
|
|
|||||
|
Natural gas price per Mcf
|
—
|
|
(0.25
|
)
|
1.79
|
|
|||||
|
Equivalent price per BOE
|
$
|
55.39
|
|
$
|
44.88
|
|
$
|
39.68
|
|
||
|
CO
2
costs
|
$
|
4,729,506
|
|
$
|
4,477,866
|
|
$
|
4,090,938
|
|
||
|
All other lease operating expenses (a)
|
7,463,996
|
|
6,357,943
|
|
4,971,241
|
|
|||||
|
Production costs
|
$
|
12,193,502
|
|
$
|
10,835,809
|
|
$
|
9,062,179
|
|
||
|
Production costs per BOE
|
$
|
16.36
|
|
$
|
14.10
|
|
$
|
13.76
|
|
||
|
CO
2
volumes (MMcf per day, gross)
|
65.0
|
|
73.1
|
|
73.8
|
|
|||||
|
Oil and gas DD&A (b)
|
$
|
5,980,307
|
|
$
|
5,687,903
|
|
$
|
4,906,123
|
|
||
|
Oil and gas DD&A per BOE
|
$
|
8.02
|
|
$
|
7.40
|
|
$
|
7.45
|
|
||
|
Artificial lift technology services:
|
|||||||||||
|
Services revenues
|
$
|
—
|
|
$
|
—
|
|
$
|
207,960
|
|
||
|
Cost of service
|
—
|
|
—
|
|
70,932
|
|
|||||
|
Depreciation and amortization expense
|
$
|
—
|
|
$
|
—
|
|
$
|
238,475
|
|
||
(a) Includes ad valorem and production taxes of
$188,058
,
$214,553
, and
$294,689
for the years ended
June 30, 2018
,
2017
, and
2016
, respectively.
(b) Excludes depreciation and amortization expense of artificial lift technology services below and excludes non-operating asset depreciation of
$31,691
,
$31,502
, and
$20,522
for the years ended
June 30, 2018
,
2017
, and
2016
, respectively.
31
Year ended June 30, 2018 compared with the Year ended June 30, 2017
Net Income Attributable to Common Shareholders.
For the year ended June 30, 2018, we generated net income of
$19.6 million
, or
$0.59
per diluted share, on total revenues of
$41.3 million
. This compares to net income of
$6.8 million
, or
$0.21
per diluted share, on total revenues of
$34.5 million
for the corresponding year-ago period. The
$12.8 million
earnings increase reflects
$6.8 million
of higher revenue, a
$8.3 million
income tax decrease attributable to the 2017 Tax Cuts and Jobs Act and a $1.2 million decrease in earnings allocated to preferred stock because of its redemption, partially offset by
$3.5 million
of higher operating expenses, primarily production costs and general and administrative expense.
Oil and Gas Production.
Revenues increased
20%
to
$41.3 million
primarily due to a
23%
increase in realized prices from
$44.88
per equivalent barrel to
$55.39
per equivalent barrel on lower
(3.0)%
in equivalent barrels. All of our revenues in the current fiscal year came from the Delhi field, as did all of our revenues from the prior year. Net Delhi oil production volumes of
1,786
BOPD at an average price of
$58.52
decreased
199
BOPD from the prior year period primarily due to the abnormal sub-freezing temperatures that disrupted operations in January, plant scheduled maintenance later in our third quarter and reduced CO
2
injections in the fourth quarter due to compressor maintenance and infill drilling activities. Net NGL production averaged
256
BOEPD, at an average price of
$33.50
per barrel, an increase of
136
BOEPD compared to the year-ago period as NGL plant production began in January 2017, representing only a partial year of production.
Production Costs
. Production costs for the year ended June 30, 2018 were
$12.2 million
, a
13%
increase from the prior year primarily due to higher CO
2
costs and the incremental operating costs of the NGL plant that commenced operations in January 2017. CO
2
costs increased
$0.3 million
, or
6%
, due to higher purchased CO
2
costs per Mcf, which correlates to the
26%
increase in realized oil price from the prior year, partially offset by a
11.0%
decrease in purchase volumes. Average gross purchased CO
2
volumes decreased from
73.1
MMcf per day in the year-ago period to
65.0
MMcf per day for the current year. Other production costs, which include incremental costs of the NGL plant, power, chemicals, workovers, repairs and maintenance, labor and overhead, increased $1.1 million, or 17%, from the year-ago period. Approximately $0.9 million of this increase were due to higher NGL plant-related expenses. Total production costs per equivalent barrel in the current period were
$16.36
per BOE on total production volumes, compared to
$14.10
in the prior year period.
General and Administrative Expenses (“G&A”).
G&A expenses increased
$1.8 million
, or
36%
, from the prior year, to
$6.8 million
for the year ended June 30, 2018. The expense increase reflected increases of $0.4 million of litigation and non-recurring settlement expenses, $0.2 million of non-cash stock-based compensation expense, $0.2 million of severance, $0.2 million of board expenses, and $0.7 million of due diligence costs associated with property acquisitions evaluations. In early fiscal 2019, we received a $1.1 million break-up fee related to our Enduro stalking horse bid thereby recovering $0.4 million of acquisition expenses incurred in fiscal 2018. See Note 3 – Enduro Purchase and Sale Agreement and Related Subsequent Events.
Depreciation, Depletion & Amortization Expense (“DD&A”).
DD&A increased
$0.3 million
, or
5%
, to
$6 million
for the year ended June 30, 2018 compared to the prior year, primarily due to increased full cost amortization from a higher amortization rate of
$8.02
per BOE compared to
$7.40
per BOE in the year ago period, partially offset by the
3.0%
decrease in production volumes. The higher rate was principally due to increased development costs at Delhi field.
Year ended June 30, 2017 ("Fiscal 2017") compared with the Year ended June 30, 2016 ("Previous Year")
Net Income Attributable to Common Shareholders.
For the year ended June 30, 2017, we generated net income of $6.8 million, or $0.21 per diluted share, on total revenues of $34.5 million. This compares to net income of $24.0 million, or $0.73 per diluted share, on total revenues of $26.1 million for the previous year. The $17.2 million earnings decrease principally resulted from a decrease of $32.6 million in other income, reflecting a $28.1 million previous year litigation settlement, a $3.4 million decrease in derivative instrument gains, and a $1.1 million prior year insurance settlement together with a $0.6 million increase in allocated net income to holders of called preferred shares, partially offset by $8.1 million of higher revenue, $3.1 million of decreased operating costs, and $4.7 million of lower income taxes.
Oil and Gas Production.
Revenues increased 31.9% to $34.5 million primarily as a result of a 16.6% increase in production volumes from the previous year together with a 13.1% increase in realized prices from $39.68 per equivalent barrel to $44.88 per barrel in Fiscal 2017. Delhi production and revenues comprise virtually all of our revenues. Net Delhi oil production of 1,985 BOPD was 10.4% higher compared to the Previous Year as a result of production enhancement and conformance operations in the field. In addition $0.9 million of initial plant NGL sales commenced at the beginning of our third fiscal quarter and averaged 120 BOEPD over the entire fiscal year.
Production Costs
. Production costs for the year ended June 30, 2017 were $10.8 million, a 19.6% increase from the previous year. CO
2
costs for the Fiscal 2017 year were $4.5 million, or 9.5% higher than the Previous Year, due to a higher CO
2
price partially offset by a 1.2% decrease in purchase volumes as a result of operational efficiencies. The Fiscal 2017 year average
32
gross CO
2
injection rate was 73.1 MMcf per day, compared to 73.8 MMcf per day in the Previous Year. For the Fiscal 2017 year, production costs were $14.10 per barrel on total production volumes, compared to $13.76 per BOE in the Previous Year. Calculated solely on our Delhi working interest volumes, production costs were $19.01 per barrel of which $8.03 per barrel was CO
2
cost. These latter production costs per barrel exclude production volumes from our royalty interests in the Delhi field as they bear only certain allocated NGL production costs, and are therefore higher than the rates per barrel on our total production volumes.
General and Administrative Expenses (“G&A”).
G&A expenses decreased $4.1 million, or 45%, from the previous year, to $5.0 million for the year ended June 30, 2017, primarily due to a $2.6 million decrease in litigation costs, a $0.6 million decrease in stock-based compensation, $0.5 million of lower bonus expense, and $0.5 million of lower salary and benefit expenses.
Other Income and Expenses
. For the year ended June 30, 2017, aggregate other items decreased $32.6 million from the previous year due to the $28.1 million Delhi field litigation settlement in the previous year, a $3.4 million decrease in derivative gains and a $1.1 million insurance recovery in the previous year.
Depreciation, Depletion & Amortization Expense (“DD&A”).
DD&A increased $0.6 million, or 11%, to $5.7 million for the year ended June 30, 2017 compared to the previous year, due to an increase of $0.8 million in full cost pool depletion, partially offset by a $0.2 million decrease in fixed asset depreciation, which was impacted by the previous year impairment of artificial lift equipment. Compared to the previous year, the increase in full cost pool amortization reflects a 16.6% production increase to 0.8 million BOE, partially offset by a small 0.7% decrease in the amortization rate to $7.40 per BOE.
Other Economic Factors
Inflation
. Although the general inflation rate in the United States, as measured by the Consumer Price Index and the Producer Price Index, has been relatively low in recent years, the oil and gas industry has experienced unusually volatile price movements in commodity prices, vendor goods and oilfield services. Prices for drilling and oilfield services, oilfield equipment, tubulars, labor, expertise and other services impact our lease operating expenses and our capital expenditures. During fiscal 2018 to date, we have seen a firming of prices for operating and capital costs as a result of improving demand and a closer balance with the supply of goods and services in the industry. Product prices, operating costs and development costs may not always move in tandem.
Known Trends and Uncertainties
. General worldwide economic conditions, as well as economic conditions for the oil and gas industry specifically, continue to be uncertain and volatile. Regional and worldwide market factors, such as tariffs or trade restrictions, may also increase production costs. Concerns over uncertain future economic growth are affecting numerous industries and companies, as well as consumers, which impact demand for crude oil and natural gas. If the supply of crude oil and natural gas exceeds demand in the future, it may put downward pressure on crude oil and natural gas prices, thereby lowering our revenues, profits, cash flow and working capital going forward. While we realized higher average oil prices in the current quarter than any period since the quarter ended December 31, 2014, there can be no assurance that such prices will continue to prevail or trend upward.
Seasonality
. Our business is generally not directly seasonal, except for instances when weather conditions may adversely affect access to our properties or delivery of our petroleum products. Although we do not generally modify our production for changes in market demand, we do occasionally experience seasonality in the product prices we receive, driven by summer cooling and driving, winter heating, and extremes in seasonal weather, including hurricanes. We have also experienced adverse impacts on our production from very high summer temperatures and extremely cold winter weather.
33
Contractual Obligations and Other Commitments
The table below provides estimates of the timing of future payments that, as of
June 30, 2018
, we are obligated to make under our contractual obligations and commitments. We expect to fund these contractual obligations with cash on hand and cash generated from operations.
|
|
Payments Due by Period
|
||||||||||||||||||
|
|
Total
|
Less than
1 Year
|
1 - 3 Years
|
3 - 5 Years
|
More than 5 Years
|
||||||||||||||
|
Contractual Obligations
|
|
|
|
|
|
||||||||||||||
|
Purchase commitments in connection with joint interest agreement
|
$
|
2,879,545
|
|
$
|
2,879,545
|
|
$
|
—
|
|
$
|
—
|
|
$
|
—
|
|
||||
|
Operating lease
|
66,984
|
|
66,984
|
|
—
|
|
—
|
|
—
|
|
|||||||||
|
Other Obligations
|
|
|
|
|
|
||||||||||||||
|
Asset retirement obligations
|
1,422,955
|
|
35,539
|
|
—
|
|
—
|
|
1,387,416
|
|
|||||||||
|
Total obligations
|
$
|
4,369,484
|
|
$
|
2,982,068
|
|
$
|
—
|
|
$
|
—
|
|
$
|
1,387,416
|
|
||||
Critical Accounting Policies and Estimates
The preparation of financial statements in accordance with accounting principles generally accepted in the United States of America requires that we select certain accounting policies and make estimates and assumptions that affect the reported amounts of the assets and liabilities and disclosures of contingent assets and liabilities as of the date of the balance sheet as well as the reported amounts of revenues and expenses during the reporting period. These policies, together with our estimates have a significant effect on our consolidated financial statements. Our significant accounting policies are included in Note 2 – Summary of Significant Accounting Policies of the consolidated financial statements. Following is a discussion of our most critical accounting estimates, judgments and uncertainties that are inherent in the preparation of our consolidated financial statements.
Oil and Natural Gas Properties
. Companies engaged in the production of oil and natural gas are required to follow accounting rules that are unique to the oil and gas industry. We apply the full cost accounting method for our oil and natural gas properties as prescribed by SEC Regulation S-X Rule 4-10. Under this method of accounting, the costs of unsuccessful, as well as successful, exploration and development activities are capitalized as properties and equipment. This includes any internal costs that are directly related to property acquisition, exploration and development activities but does not include any costs related to production, general corporate overhead or similar activities. Gain or loss on the sale or other disposition of oil and gas properties is not recognized, unless the gain or loss would significantly alter the relationship between capitalized costs and proved reserves. Oil and natural gas properties include costs that are excluded from costs being depleted or amortized. Oil and natural gas property costs excluded represent investments in unevaluated properties and include non-producing leasehold, geological and geophysical costs associated with leasehold or drilling interests and exploration drilling costs. We exclude these costs until the property has been evaluated. Costs are transferred to the full cost pool as the properties are evaluated. As of June 30, 2018, we had no unevaluated properties costs.
Estimates of Proved Reserves.
The estimated quantities of proved oil and natural gas reserves have a significant impact on the underlying financial statements. The estimated quantities of proved reserves are used to calculate depletion expense, and the estimated future net cash flows associated with those proved reserves is the basis in determining impairment under the quarterly ceiling test calculation. The process of estimating oil and natural gas reserves is very complex, requiring significant decisions in the evaluation of all available geological, geophysical, engineering and economic data. Estimated reserves are often subject to future revisions, which could be substantial, based on the availability of additional information, including reservoir performance, additional development activity, new geological and geophysical data, additional drilling, technological advancements, price changes and other economic factors. As a result, material revisions to existing reserve estimates may occur from time to time. Although every reasonable effort is made to ensure that the reported reserve estimates represent the most accurate assessments possible, including the hiring of independent engineers to prepare our reserve estimates, the subjective decisions and variances in available data for the properties make these estimates generally less precise than other estimates included in our financial statements. Material revisions to reserve estimates and/or significant changes in commodity prices could substantially affect our estimated future net cash flows of our proved reserves, affecting our quarterly ceiling test calculation and could significantly affect our depletion rate. A 10% decrease in commodity prices used to determine our proved reserves as of June 30, 2018 would not have resulted in an impairment of our oil and natural gas properties. Holding all other factors constant, a reduction in the Company's proved reserve estimates at June 30, 2018 of 5%, 10% and 15% would affect depreciation, depletion and amortization expense by approximately $306,000, $646,000 and $1,026,000, respectively.
34
On December 31, 2008, the SEC issued its final rule on the modernization of reporting oil and gas reserves. The rule allows consideration of new technologies in evaluating reserves, generally limits the designation of proved reserves to those projects forecast to be commenced within five years of the end of the period, allows companies to disclose their probable and possible reserves to investors, requires reporting of oil and gas reserves using an average price based on the previous 12-month unweighted arithmetic average first-day-of-the-month price rather than year-end prices, revises the disclosure requirements for oil and gas operations, and revises accounting for the limitation on capitalized costs for full cost companies.
Valuation of Deferred Tax Assets.
We make certain estimates and judgments in determining our income tax expense for financial reporting purposes. These estimates and judgments occur in the calculation of certain tax assets and liabilities that arise from differences in the timing and recognition of revenue and expense for tax and financial reporting purposes. Our federal and state income tax returns are generally not prepared or filed before the consolidated financial statements are prepared or filed; therefore, we estimate the tax basis of our assets and liabilities at the end of each period as well as the effects of tax rate changes, tax credits, and net operating loss carry backs and carry forwards. Adjustments related to these estimates are recorded in our tax provision in the period in which we file our income tax returns. Further, we must assess the likelihood that we will be able to recover or utilize our deferred tax assets (primarily our net operating loss). If recovery is not likely, we must record a valuation allowance against such deferred tax assets for the amount we would not expect to recover, which would result in an increase to our income tax expense. As of June 30, 2018, we have recorded a valuation allowance for the portion of our net operating loss that is limited by IRS Section 382.
Management considers the scheduled reversal of deferred tax liabilities, projected future taxable income, and tax planning strategies in making the assessment of the ultimate realization of deferred tax assets. Based upon the level of historical taxable income and projections for future taxable income over the periods for which the deferred tax assets are deductible, as of end of the current fiscal year, we believe that it is more likely than not that the Company will realize the benefits of its net deferred tax assets. If our estimates and judgments change regarding our ability to utilize our deferred tax assets, our tax provision would increase in the period it is determined that recovery is not probable.
Stock-based Compensation
. The fair value and expected vesting period of the Company's market-based awards were determined using a Monte Carlo simulation based on the historical volatility of our total common stock return compared to the historical volatilities of the other companies in the index. Vesting of market-based awards is based on the Company's total common stock return compared to a peer group of other companies in our industry with comparable market capitalizations. We estimate the fair value of stock option awards on the date of grant using the Black-Scholes option pricing model. This valuation method requires the input of certain assumptions, including expected stock price volatility, expected term of the award, the expected risk-free interest rate, and the expected dividend yield of the Company's stock. The risk-free interest rate used is the U.S. Treasury yield for bonds matching the expected term of the option on the date of grant. Because of our limited trading experience of our common stock and limited exercise history of our stock option awards, estimating the volatility and expected term is very subjective. We base our estimate of our expected future volatility on peer companies whose common stock has been trading longer than ours, along with our own limited trading history while operating as an oil and natural gas producer. Future estimates of our stock volatility could be substantially different from our current estimate, which could significantly affect the amount of expense we recognize for our stock-based compensation awards.
Recent Accounting Pronouncements. See Note 2 – Summary of Significant Accounting Policies to our Consolidated Financial Statements for discussion of the recent accounting pronouncements issued by the Financial Accounting Standards Board.
Off Balance Sheet Arrangements
The Company has no off-balance sheet arrangements as of
June 30, 2018
.
Interest Rate Risk
We are exposed to changes in interest rates. Changes in interest rates affect the interest earned on our cash and cash equivalents. Under our current policies, we do not use interest rate derivative instruments to manage exposure to interest rate changes.
Commodity Price Risk
Our most significant market risk is the pricing for crude oil, natural gas and NGL's. We expect energy prices to remain volatile and unpredictable. If energy prices decline significantly, revenues and cash flow would significantly decline. In addition, a non-cash write-down of our oil and gas properties could be required under full cost accounting rules if future oil and gas commodity prices sustained a significant decline. Prices also affect the amount of cash flow available for capital
35
expenditures and our ability to borrow and raise additional capital, as, if and when needed. We use derivative instruments to manage our exposure to commodity price risk from time to time based on our assessment of such risk. We primarily utilize swaps and costless collars to reduce the effect of price changes on a portion of our future oil production. We do not enter into derivative instruments for trading purposes. The Company had no positions in derivative instruments at June 30, 2018.
36
Index to Consolidated Financial Statements
37
REPORT OF INDEPENDENT REGISTERED PUBLIC ACCOUNTING FIRM
To the Board of Directors and Stockholders
Evolution Petroleum Corporation
Opinion on the Financial Statements
We have audited the accompanying consolidated balance sheet of Evolution Petroleum Corporation and Subsidiaries (the “Company”) as of June 30, 2018, the related consolidated statements of operations, cash flows and changes in stockholders’ equity for the year ended June 30, 2018, and the related notes (collectively referred to as the “consolidated financial statements”). In our opinion, the consolidated financial statements present fairly, in all material respects, the consolidated financial position of the Company as of June 30, 2018, and the consolidated results of its operations and its cash flows for the year ended June 30, 2018, in conformity with accounting principles generally accepted in the United States of America.
We also have audited, in accordance with the standards of the Public Company Accounting Oversight Board (United States) (“PCAOB”), the Company’s internal control over financial reporting as of June 30, 2018, based on criteria established in
Internal Control - Integrated Framework 2013
issued by the Committee of Sponsoring Organizations of the Treadway Commission and our report dated
September 10, 2018
expressed an unqualified opinion on the Company’s internal control over financial reporting.
Basis for Opinion
These consolidated
financial statements are the responsibility of the Company’s management. Our responsibility is to express an opinion on the Company’s consolidated financial statements based on our audit. We are a public accounting firm registered with the PCAOB and are required to be independent with respect to the Company in accordance with the U.S. federal securities laws and the applicable rules and regulations of the Securities and Exchange Commission and the PCAOB.
We conducted our audit in accordance with the standards of the PCAOB. Those standards require that we plan and perform the audit to obtain reasonable assurance about whether the consolidated financial statements are free of material misstatement, whether due to error or fraud. Our audit included performing procedures to assess the risks of material misstatement of the consolidated
financial statements, whether due to error or fraud, and performing procedures to respond to those risks. Such procedures included examining, on a test basis, evidence regarding the amounts and disclosures in the consolidated
financial statements. Our audit also included evaluating the accounting principles used and significant estimates made by management, as well as evaluating the overall presentation of the consolidated financial statements. We believe that our audit provides a reasonable basis for our opinion.
/s/
Moss Adams LLP
Houston, Texas
September 10, 2018
We have served as the Company’s auditor since 2017.
38
REPORT OF INDEPENDENT REGISTERED PUBLIC ACCOUNTING FIRM
To the Board of Directors and Stockholders
Evolution Petroleum Corporation
We have audited the accompanying consolidated balance sheet of Evolution Petroleum Corporation and subsidiaries (the “Company”) as of June 30, 2017, and the related consolidated statements of operations, cash flows, and changes in stockholders' equity for each of the two years in the period ended June 30, 2017. These consolidated financial statements are the responsibility of the Company's management. Our responsibility is to express an opinion on these consolidated financial statements based on our audits.
We conducted our audits in accordance with the standards of the Public Company Accounting Oversight Board (United States). Those standards require that we plan and perform the audits to obtain reasonable assurance about whether the financial statements are free of material misstatement. An audit includes examining, on a test basis, evidence supporting the amounts and disclosures in the financial statements. An audit also includes assessing the accounting principles used and significant estimates made by management, as well as evaluating the overall financial statement presentation. We believe that our audits provide a reasonable basis for our opinion.
In our opinion, the consolidated financial statements referred to above present fairly, in all material respects, the consolidated financial position of Evolution Petroleum Corporation and subsidiaries as of June 30, 2017, and the results of their operations and their cash flows for each of the two years in the period ended June 30, 2017, in conformity with U.S. generally accepted accounting principles.
/s/ Hein & Associates LLP
Houston, Texas
September 15, 2017
39
REPORT OF INDEPENDENT REGISTERED PUBLIC ACCOUNTING FIRM
To the Board of Directors and Stockholders
Evolution Petroleum Corporation
Opinion on Internal Control over Financial Reporting
We have audited Evolution Petroleum Corporation and Subsidiaries’ (the “Company”) internal control over financial reporting as of June 30, 2018, based on criteria established in
Internal Control - Integrated Framework
2013 issued by the Committee of Sponsoring Organizations of the Treadway Commission (“COSO”). In our opinion, the Company maintained, in all material respects, effective control over financial reporting as of June 30, 2018, based on criteria established in
Internal Control - Integrated Framework
2013 issued by COSO.
We also have audited, in accordance with the standards of the Public Company Accounting Oversight Board (United States) (“PCAOB”), the consolidated
balance sheet of Evolution Petroleum Corporation
and Subsidiaries
as of June 30, 2018, the related consolidated statements of operations, cash flows and changes in stockholders’ equity for the year ended June 30, 2018, and the related notes (collectively referred to as the “consolidated financial statements”) and our report dated
September 10, 2018
expressed an unqualified opinion on those consolidated financial statements.
Basis for Opinion
The Company’s management is responsible for maintaining effective internal control over financial reporting and for its assessment of the effectiveness of internal control over financial reporting, included in the accompanying Management’s Report on Internal Control over Financial Reporting included in Item 9A. Our responsibility is to express an opinion on the Company’s internal control over financial reporting based on our audit. We are a public accounting firm registered with the PCAOB and are required to be independent with respect to the Company in accordance with the U.S. federal securities laws and the applicable rules and regulations of the Securities and Exchange Commission and the PCAOB.
We conducted our audit in accordance with the standards of the PCAOB. Those standards require that we plan and perform the audit to obtain reasonable assurance about whether effective internal control over financial reporting was maintained in all material respects. Our audit included obtaining an understanding of internal control over financial reporting, assessing the risk that a material weakness exists, and testing and evaluating the design and operating effectiveness of internal control based on the assessed risk. Our audit also included performing such other procedures as we considered necessary in the circumstances. We believe that our audit provides a reasonable basis for our opinion.
Definition and Limitations of Internal Control Over Financial Reporting
A company’s internal control over financial reporting is a process designed to provide reasonable assurance regarding the reliability of financial reporting and the preparation of financial statements for external purposes in accordance with generally accepted accounting principles. A company’s internal control over financial reporting includes those policies and procedures that (1) pertain to the maintenance of records that, in reasonable detail, accurately and fairly reflect the transactions and dispositions of the assets of the company; (2) provide reasonable assurance that transactions are recorded as necessary to permit preparation of financial statements in accordance with generally accepted accounting principles, and that receipts and expenditures of the company are being made only in accordance with authorizations of management and directors of the company; and (3) provide reasonable assurance regarding prevention or timely detection of unauthorized acquisition, use, or disposition of the company’s assets that could have a material effect on the financial statements.
Because of its inherent limitations, internal control over financial reporting may not prevent or detect misstatements. Also, projections of any evaluation of effectiveness to future periods are subject to the risk that controls may become inadequate because of changes in conditions, or that the degree of compliance with the policies or procedures may deteriorate.
/s/ Moss Adams LLP
Houston, Texas
September 10, 2018
40
Evolution Petroleum Corporation and Subsidiaries
|
June 30, 2018
|
June 30, 2017
|
||||||
|
Assets
|
|
|
|||||
|
Current assets
|
|
|
|||||
|
Cash and cash equivalents
|
$
|
24,929,844
|
|
$
|
23,028,153
|
|
|
|
Restricted cash
|
2,751,289
|
|
—
|
|
|||
|
Receivables
|
3,941,916
|
|
2,726,702
|
|
|||
|
Prepaid expenses and other current assets
|
524,507
|
|
387,672
|
|
|||
|
Total current assets
|
32,147,556
|
|
26,142,527
|
|
|||
|
Property and equipment, net of depreciation, depletion, and amortization
|
|
|
|||||
|
Oil and natural gas properties—full-cost method of accounting, of which none were excluded from amortization
|
61,239,746
|
|
61,790,068
|
|
|||
|
Other property and equipment, net
|
30,407
|
|
40,689
|
|
|||
|
Total property and equipment, net
|
61,270,153
|
|
61,830,757
|
|
|||
|
Other assets, net
|
244,835
|
|
295,384
|
|
|||
|
Total assets
|
$
|
93,662,544
|
|
$
|
88,268,668
|
|
|
|
Liabilities and Stockholders' Equity
|
|
|
|||||
|
Current liabilities
|
|
|
|||||
|
Accounts payable
|
$
|
3,432,568
|
|
$
|
1,994,255
|
|
|
|
Accrued liabilities and other
|
874,886
|
|
724,639
|
|
|||
|
State and federal taxes payable
|
122,760
|
|
—
|
|
|||
|
Total current liabilities
|
4,430,214
|
|
2,718,894
|
|
|||
|
Long term liabilities
|
|
|
|||||
|
Deferred income taxes
|
10,555,435
|
|
15,826,291
|
|
|||
|
Asset retirement obligations
|
1,387,416
|
|
1,253,628
|
|
|||
|
Total liabilities
|
16,373,065
|
|
19,798,813
|
|
|||
|
Commitments and contingencies (Note 16)
|
|
|
|||||
|
Stockholders' equity
|
|
|
|||||
|
Common stock; par value $0.001; 100,000,000 shares authorized: issued and outstanding 33,080,543 and 33,087,308 shares as of June 30, 2018 and 2017, respectively
|
33,080
|
|
33,087
|
|
|||
|
Additional paid-in capital
|
41,757,645
|
|
40,961,957
|
|
|||
|
Retained earnings
|
35,498,754
|
|
27,474,811
|
|
|||
|
Total stockholders' equity
|
77,289,479
|
|
68,469,855
|
|
|||
|
Total liabilities and stockholders' equity
|
$
|
93,662,544
|
|
$
|
88,268,668
|
|
|
See accompanying notes to consolidated financial statements.
41
Evolution Petroleum Corporation and Subsidiaries
|
|
Years Ended June 30,
|
||||||||||
|
|
2018
|
2017
|
2016
|
||||||||
|
Revenues
|
|||||||||||
|
Crude oil
|
$
|
38,153,417
|
|
$
|
33,550,698
|
|
$
|
26,130,762
|
|
||
|
Natural gas liquids
|
3,127,795
|
|
934,202
|
|
7,885
|
|
|||||
|
Natural gas
|
—
|
|
(4
|
)
|
2,895
|
|
|||||
|
Artificial lift technology services
|
—
|
|
—
|
|
207,960
|
|
|||||
|
Total revenues
|
41,281,212
|
|
34,484,896
|
|
26,349,502
|
|
|||||
|
Operating costs
|
|
|
|
||||||||
|
Production costs
|
12,193,502
|
|
10,835,809
|
|
9,062,179
|
|
|||||
|
Cost of artificial lift technology services
|
—
|
|
—
|
|
70,932
|
|
|||||
|
Depreciation, depletion and amortization
|
6,011,998
|
|
5,719,405
|
|
5,165,120
|
|
|||||
|
Accretion of discount on asset retirement obligations
|
90,290
|
|
59,664
|
|
49,054
|
|
|||||
|
General and administrative expenses*
|
6,773,781
|
|
4,985,408
|
|
9,079,597
|
|
|||||
|
Restructuring charges
|
—
|
|
4,488
|
|
1,257,433
|
|
|||||
|
Total operating costs
|
25,069,571
|
|
21,604,774
|
|
24,684,315
|
|
|||||
|
Income from operations
|
16,211,641
|
|
12,880,122
|
|
1,665,187
|
|
|||||
|
Other
|
|
|
|
||||||||
|
Gain on settled derivative instruments, net
|
—
|
|
43,890
|
|
3,315,123
|
|
|||||
|
Gain (loss) on unsettled derivative instruments, net
|
—
|
|
(14,132
|
)
|
124,106
|
|
|||||
|
Delhi field litigation settlement
|
—
|
|
—
|
|
28,096,500
|
|
|||||
|
Delhi field insurance recovery related to pre-reversion event
|
—
|
|
—
|
|
1,074,957
|
|
|||||
|
Interest and other income
|
85,654
|
|
56,855
|
|
26,211
|
|
|||||
|
Interest (expense)
|
(110,780
|
)
|
(81,758
|
)
|
(70,943
|
)
|
|||||
|
Income before income tax provision
|
16,186,515
|
|
12,884,977
|
|
34,231,141
|
|
|||||
|
Income tax provision (benefit)
|
(3,431,969
|
)
|
4,840,664
|
|
9,570,779
|
|
|||||
|
Net income attributable to the Company
|
19,618,484
|
|
8,044,313
|
|
24,660,362
|
|
|||||
|
Dividends on preferred stock
|
—
|
|
250,990
|
|
674,302
|
|
|||||
|
Deemed dividend on redeemed preferred shares
|
—
|
|
1,002,440
|
|
—
|
|
|||||
|
Net income attributable to common shareholders
|
$
|
19,618,484
|
|
$
|
6,790,883
|
|
$
|
23,986,060
|
|
||
|
Earnings per common share
|
|
|
|
||||||||
|
Basic
|
$
|
0.59
|
|
$
|
0.21
|
|
$
|
0.73
|
|
||
|
Diluted
|
$
|
0.59
|
|
$
|
0.21
|
|
$
|
0.73
|
|
||
|
Weighted average number of common shares outstanding
|
|
|
|
||||||||
|
Basic
|
33,126,469
|
|
33,034,480
|
|
32,810,375
|
|
|||||
|
Diluted
|
33,178,535
|
|
33,110,560
|
|
32,861,231
|
|
|||||
_______________________________________________________________________________
|
*
|
General and administrative expenses for the years ended June 30, 2018, 2017 and 2016 included non-cash stock-based compensation expense of
$1,366,764
,
$1,180,618
, and
$1,750,209
, respectively.
|
See accompanying notes to consolidated financial statements.
42
Evolution Petroleum Corporation and Subsidiaries
|
|
Years Ended June 30,
|
||||||||||
|
|
2018
|
2017
|
2016
|
||||||||
|
Cash flows from operating activities
|
|
|
|
||||||||
|
Net income attributable to the Company
|
$
|
19,618,484
|
|
$
|
8,044,313
|
|
$
|
24,660,362
|
|
||
|
Adjustments to reconcile net income to net cash provided by operating activities:
|
|
|
|
||||||||
|
Depreciation, depletion and amortization
|
6,068,265
|
|
5,775,946
|
|
5,211,494
|
|
|||||
|
Impairments included in restructuring charge
|
—
|
|
—
|
|
569,228
|
|
|||||
|
Stock-based compensation
|
1,366,764
|
|
1,180,618
|
|
1,809,548
|
|
|||||
|
Accretion of discount on asset retirement obligations
|
90,290
|
|
59,664
|
|
49,054
|
|
|||||
|
Settlement of asset retirement obligations
|
—
|
|
(157,910
|
)
|
—
|
|
|||||
|
Deferred income taxes
|
(5,270,856
|
)
|
4,090,919
|
|
575,235
|
|
|||||
|
Gain on derivative instruments, net
|
—
|
|
(29,758
|
)
|
(3,439,229
|
)
|
|||||
|
Noncash gain on Delhi field litigation settlement
|
—
|
|
—
|
|
(596,500
|
)
|
|||||
|
Write-off of deferred loan costs
|
—
|
|
—
|
|
50,414
|
|
|||||
|
Changes in operating assets and liabilities:
|
|
|
|
||||||||
|
Receivables
|
(1,215,214
|
)
|
(88,514
|
)
|
484,285
|
|
|||||
|
Prepaid expenses and other current assets
|
(136,835
|
)
|
(135,923
|
)
|
24,754
|
|
|||||
|
Accounts payable and accrued expenses
|
(107,081
|
)
|
(1,626,648
|
)
|
822,730
|
|
|||||
|
Income taxes payable
|
122,760
|
|
(621,850
|
)
|
431,818
|
|
|||||
|
Net cash provided by operating activities
|
20,536,577
|
|
16,490,857
|
|
30,653,193
|
|
|||||
|
Cash flows from investing activities
|
|
|
|
||||||||
|
Derivative settlements received (paid)
|
—
|
|
(272,318
|
)
|
3,633,831
|
|
|||||
|
Development of oil and natural gas properties
|
(3,690,845
|
)
|
(10,158,960
|
)
|
(21,095,901
|
)
|
|||||
|
Capital expenditures for other property and equipment
|
(7,846
|
)
|
(32,260
|
)
|
(6,883
|
)
|
|||||
|
Other assets
|
(19,282
|
)
|
—
|
|
(161,345
|
)
|
|||||
|
Net cash used by investing activities
|
(3,717,973
|
)
|
(10,463,538
|
)
|
(17,630,298
|
)
|
|||||
|
Cash flows from financing activities
|
|
|
|
||||||||
|
Proceeds from the exercise of stock options
|
—
|
|
—
|
|
51,000
|
|
|||||
|
Common share repurchases, including shares surrendered for tax withholding
|
(571,083
|
)
|
(459,858
|
)
|
(1,357,185
|
)
|
|||||
|
Common stock dividends paid
|
(11,594,541
|
)
|
(8,432,435
|
)
|
(6,565,823
|
)
|
|||||
|
Preferred stock dividends paid
|
—
|
|
(250,990
|
)
|
(674,302
|
)
|
|||||
|
Redemption of preferred shares
|
—
|
|
(7,932,975
|
)
|
—
|
|
|||||
|
Deferred loan costs
|
—
|
|
—
|
|
(168,972
|
)
|
|||||
|
Tax benefits related to stock-based compensation
|
—
|
|
—
|
|
9,650,657
|
|
|||||
|
Other
|
—
|
|
32
|
|
33
|
|
|||||
|
Net cash provided (used) by financing activities
|
(12,165,624
|
)
|
(17,076,226
|
)
|
935,408
|
|
|||||
|
Net increase (decrease) in cash, cash equivalents and restricted cash
|
4,652,980
|
|
(11,048,907
|
)
|
13,958,303
|
|
|||||
|
Cash, cash equivalents and restricted cash, beginning of year
|
23,028,153
|
|
34,077,060
|
|
20,118,757
|
|
|||||
|
Cash, cash equivalents and restricted cash, end of year
|
$
|
27,681,133
|
|
$
|
23,028,153
|
|
$
|
34,077,060
|
|
||
The following table provides a reconciliation of cash, cash equivalents and restricted cash reported within the statements of financial position that sum to the totals of the such amounts shown in the statements of cash flows.
|
Years Ended June 30,
|
|||||||||||
|
2018
|
2017
|
2016
|
|||||||||
|
Cash and cash equivalents
|
$
|
24,929,844
|
|
$
|
23,028,153
|
|
$
|
34,077,060
|
|
||
|
Restricted cash included in current assets
|
2,751,289
|
|
—
|
|
—
|
|
|||||
|
Total cash, cash equivalents and restricted cash shown in the statements of cash flows
|
$
|
27,681,133
|
|
$
|
23,028,153
|
|
$
|
34,077,060
|
|
||
See accompanying notes to consolidated financial statements.
43
Evolution Petroleum Corporation and Subsidiaries
Consolidated Statements of Changes in Stockholders' Equity
For the Years Ended
June 30, 2018
,
2017
and
2016
|
|
Preferred
|
Common Stock
|
|
|
|
|
|||||||||||||||||||||||
|
|
Additional
Paid-in
Capital
|
Retained
Earnings
|
Treasury
Stock
|
Total
Stockholders'
Equity
|
|||||||||||||||||||||||||
|
|
Shares
|
Par Value
|
Shares
|
Par Value
|
|||||||||||||||||||||||||
|
Balance, June 30, 2015
|
317,319
|
|
$
|
317
|
|
32,845,205
|
|
$
|
32,845
|
|
$
|
36,847,289
|
|
$
|
11,696,126
|
|
$
|
—
|
|
$
|
48,576,577
|
|
|||||||
|
Issuance of restricted common stock
|
—
|
|
—
|
|
272,098
|
|
272
|
|
(239
|
)
|
—
|
|
—
|
|
33
|
|
|||||||||||||
|
Exercise of stock options
|
—
|
|
—
|
|
50,000
|
|
50
|
|
127,450
|
|
—
|
|
—
|
|
127,500
|
|
|||||||||||||
|
Forfeitures of restricted stock
|
—
|
|
—
|
|
(40,758
|
)
|
(41
|
)
|
41
|
|
—
|
|
—
|
|
—
|
|
|||||||||||||
|
Common share repurchases, including shares surrendered for tax withholding
|
—
|
|
—
|
|
(218,682
|
)
|
—
|
|
—
|
|
—
|
|
(1,263,402
|
)
|
(1,263,402
|
)
|
|||||||||||||
|
Retirements of treasury stock
|
—
|
|
—
|
|
—
|
|
(219
|
)
|
(1,263,183
|
)
|
—
|
|
1,263,402
|
|
—
|
|
|||||||||||||
|
Stock-based compensation
|
—
|
|
—
|
|
—
|
|
—
|
|
1,809,548
|
|
—
|
|
—
|
|
1,809,548
|
|
|||||||||||||
|
Tax benefits related to stock-based compensation
|
—
|
|
—
|
|
—
|
|
—
|
|
9,650,657
|
|
—
|
|
—
|
|
9,650,657
|
|
|||||||||||||
|
Net income attributable to the Company
|
—
|
|
—
|
|
—
|
|
—
|
|
—
|
|
24,660,362
|
|
—
|
|
24,660,362
|
|
|||||||||||||
|
Common stock cash dividends
|
—
|
|
—
|
|
—
|
|
—
|
|
—
|
|
(6,565,823
|
)
|
—
|
|
(6,565,823
|
)
|
|||||||||||||
|
Preferred stock cash dividends
|
—
|
|
—
|
|
—
|
|
—
|
|
—
|
|
(674,302
|
)
|
—
|
|
(674,302
|
)
|
|||||||||||||
|
Balance, June 30, 2016
|
317,319
|
|
317
|
|
32,907,863
|
|
32,907
|
|
47,171,563
|
|
29,116,363
|
|
—
|
|
76,321,150
|
|
|||||||||||||
|
Issuance of restricted common stock
|
—
|
|
—
|
|
227,889
|
|
228
|
|
(196
|
)
|
—
|
|
—
|
|
32
|
|
|||||||||||||
|
Exercise of stock options
|
—
|
|
—
|
|
35,231
|
|
35
|
|
77,121
|
|
—
|
|
—
|
|
77,156
|
|
|||||||||||||
|
Common share repurchases, including shares surrendered for tax withholding
|
—
|
|
—
|
|
(83,675
|
)
|
—
|
|
—
|
|
—
|
|
(537,014
|
)
|
(537,014
|
)
|
|||||||||||||
|
Retirements of treasury stock
|
—
|
|
—
|
|
—
|
|
(83
|
)
|
(536,931
|
)
|
—
|
|
537,014
|
|
—
|
|
|||||||||||||
|
Stock-based compensation
|
—
|
|
—
|
|
—
|
|
—
|
|
1,180,618
|
|
—
|
|
—
|
|
1,180,618
|
|
|||||||||||||
|
Redemption of preferred shares
|
(317,319
|
)
|
(317
|
)
|
—
|
|
—
|
|
(6,930,218
|
)
|
(1,002,440
|
)
|
—
|
|
(7,932,975
|
)
|
|||||||||||||
|
Net income attributable to the Company
|
—
|
|
—
|
|
—
|
|
—
|
|
—
|
|
8,044,313
|
|
—
|
|
8,044,313
|
|
|||||||||||||
|
Common stock cash dividends
|
—
|
|
—
|
|
—
|
|
—
|
|
—
|
|
(8,432,435
|
)
|
—
|
|
(8,432,435
|
)
|
|||||||||||||
|
Preferred stock cash dividends
|
—
|
|
—
|
|
—
|
|
—
|
|
—
|
|
(250,990
|
)
|
—
|
|
(250,990
|
)
|
|||||||||||||
|
Balance, June 30, 2017
|
—
|
|
—
|
|
33,087,308
|
|
33,087
|
|
40,961,957
|
|
27,474,811
|
|
—
|
|
68,469,855
|
|
|||||||||||||
|
Issuance of restricted common stock
|
—
|
|
—
|
|
183,537
|
|
183
|
|
(183
|
)
|
—
|
|
—
|
|
—
|
|
|||||||||||||
|
Forfeitures of restricted stock
|
—
|
|
—
|
|
(117,094
|
)
|
(117
|
)
|
117
|
|
—
|
|
—
|
|
—
|
|
|||||||||||||
|
Common share repurchases, including shares surrendered for tax withholding
|
—
|
|
—
|
|
(73,208
|
)
|
—
|
|
—
|
|
—
|
|
(571,083
|
)
|
(571,083
|
)
|
|||||||||||||
|
Retirements of treasury stock
|
—
|
|
—
|
|
—
|
|
(73
|
)
|
(571,010
|
)
|
—
|
|
571,083
|
|
—
|
|
|||||||||||||
|
Stock-based compensation
|
—
|
|
—
|
|
—
|
|
—
|
|
1,366,764
|
|
—
|
|
—
|
|
1,366,764
|
|
|||||||||||||
|
Net income attributable to the Company
|
—
|
|
—
|
|
—
|
|
—
|
|
—
|
|
19,618,484
|
|
—
|
|
19,618,484
|
|
|||||||||||||
|
Common stock cash dividends
|
—
|
|
—
|
|
—
|
|
—
|
|
—
|
|
(11,594,541
|
)
|
—
|
|
(11,594,541
|
)
|
|||||||||||||
|
Balance, June 30, 2018
|
—
|
|
$
|
—
|
|
33,080,543
|
|
$
|
33,080
|
|
$
|
41,757,645
|
|
$
|
35,498,754
|
|
$
|
—
|
|
$
|
77,289,479
|
|
|||||||
See accompanying notes to consolidated financial statements.
44
EVOLUTION PETROLEUM CORPORATION AND SUBSIDIARIES
NOTES TO CONSOLIDATED FINANCIAL STATEMENTS
Nature of Operations.
Evolution Petroleum Corporation is an oil and gas company focused on delivering a sustainable dividend yield to its shareholders through the ownership, management and development of producing oil and gas properties. The Company's long-term goal is to build a diversified portfolio of oil and gas assets primarily through acquisition, while seeking opportunities to maintain and increase production through selective development, production enhancement and other exploitation efforts on its properties. Our largest active investment is our interest in a CO
2
enhanced oil recovery project in Louisiana's Delhi field.
Principles of Consolidation and Reporting.
Our consolidated financial statements include the accounts of EPM and its wholly-owned subsidiaries. All significant intercompany transactions have been eliminated in consolidation. The consolidated financial statements of prior periods include certain reclassifications that were made to conform to the current presentation. Such reclassifications have no impact on previously reported net income or stockholders' equity.
Use of Estimates.
The preparation of financial statements in conformity with GAAP requires us to make estimates and assumptions that affect the reported amounts of assets and liabilities at the dates of the financial statements and the reported amounts of revenues and expenses during the reporting periods. Significant estimates include (a) reserve quantities and estimated future cash flows associated with proved reserves, which significantly impact depletion expense and potential impairments of oil and natural gas properties, (b) asset retirement obligations, (c) stock-based compensation, (d) fair values of derivative assets and liabilities, (e) income taxes and the valuation of deferred tax assets and (f) commitments and contingencies. We analyze our estimates based on historical experience and various other assumptions that we believe to be reasonable. While we believe that our estimates and assumptions used in preparation of the consolidated financial statements are appropriate, actual results could differ from those estimates.
Cash and Cash Equivalents.
We consider all highly liquid investments, with original maturities of 90 days or less when purchased, to be cash and cash equivalents.
Restricted Cash.
Funds legally designated for a specified purpose are classified as restricted cash. Such a balance is classified on the statement of financial position as either current or non-current depending on its expected use.
Accounts Receivable and Allowance for Doubtful Accounts.
Accounts receivable consist accrued revenues due under normal trade terms, generally requiring payment within 30 days of production, and other miscellaneous receivables. No interest is charged on past-due balances. Payments made on accounts receivable are applied to the earliest unpaid items. We establish provisions for losses on accounts receivable if it is determined that collection of all or a part of an outstanding balance is not probable. Collectibility is reviewed regularly and an allowance is established or adjusted, as necessary, using the specific identification method. As of
June 30,
2018
and
2017
, no allowance for doubtful accounts was considered necessary.
Oil and Natural Gas Properties.
We use the full-cost method of accounting for our investments in oil and natural gas properties. Under this method of accounting, all costs incurred in the acquisition, exploration and development of oil and natural gas properties, including unproductive wells, are capitalized. This includes any internal costs that are directly related to property acquisition, exploration and development activities but does not include any costs related to production, general corporate overhead or similar activities. Gain or loss on the sale or other disposition of oil and natural gas properties is not recognized, unless the gain or loss would significantly alter the relationship between capitalized costs and proved reserves.
Oil and natural gas properties include costs that are excluded from costs being depleted or amortized. Excluded costs represent investments in unproved and unevaluated properties and include non-producing leasehold, geological and geophysical costs associated with leasehold or drilling interests and exploration drilling costs. We exclude these costs until the project is evaluated and proved reserves are established or impairment is determined. Excluded costs are reviewed at least quarterly to determine if impairment has occurred. The amount of any evaluated or impaired oil and natural gas properties is transferred to capitalized costs being amortized.
Limitation on Capitalized Costs.
Under the full-cost method of accounting, we are required, at the end of each fiscal quarter, to perform a test to determine the limit on the book value of our oil and natural gas properties (the "Ceiling Test"). If the capitalized costs of our oil and natural gas properties, net of accumulated amortization and related deferred income taxes,
45
EVOLUTION PETROLEUM CORPORATION AND SUBSIDIARIES
NOTES TO CONSOLIDATED FINANCIAL STATEMENTS (Continued)
exceed the "Ceiling", this excess or impairment is charged to expense and reflected as additional accumulated depreciation, depletion and amortization or as a credit to oil and natural gas properties. The expense may not be reversed in future periods, even though higher oil and natural gas prices may subsequently increase the Ceiling. The Ceiling is defined as the sum of: (a) the present value, discounted at
10 percent
, and assuming continuation of existing economic conditions, of 1) estimated future gross revenues from proved reserves, which is computed using oil and natural gas prices determined as the unweighted arithmetic average of the first-day-of-the-month price for each month within the
12
-month period prior to the end of the reporting period (with consideration of price changes only to the extent provided by contractual arrangements including hedging arrangements pursuant to SAB 103), less 2) estimated future expenditures (based on current costs) to be incurred in developing and producing the proved reserves; plus (b) the cost of properties not being amortized (pursuant to Reg. S-X Rule 4-10 (c)(3)(ii)); plus (c) the lower of cost or estimated fair value of unproven properties included in the costs being amortized; and net of (d) the related tax effects related to the difference between the book and tax basis of our oil and natural gas properties. Our Ceiling Tests did not result in an impairment of our oil and natural gas properties during the years ended
June 30, 2018
,
2017
or
2016
.
Other Property and Equipment.
Other property and equipment includes building leasehold improvements, data processing and telecommunications equipment, office furniture and office equipment. These items are recorded at cost and depreciated over expected lives of the individual assets or group of assets, which range from
three
to
seven years
. The assets are depreciated using the straight-line method. Realization of the carrying value of other property and equipment is reviewed for possible impairment whenever events or changes in circumstances indicate that the carrying amount may not be recoverable. Assets are determined to be impaired if a forecast of undiscounted estimated future net operating cash flows directly related to the asset, including disposal value, if any, is less than the carrying amount of the asset. If any asset is determined to be impaired, the loss is measured as the amount by which the carrying amount of the asset exceeds its fair value. Repairs and maintenance costs are expensed in the period incurred.
Deferred Financing Costs.
The Company capitalizes costs incurred in connection with obtaining financing. These costs are included in other assets on the Company's consolidated balance sheet and are amortized over the term of the related financing using the straight-line method, which approximates the effective interest method.
Asset Retirement Obligations.
An asset retirement obligation associated with the retirement of a tangible long-lived asset is recognized as a liability in the period incurred, with an associated increase in the carrying amount of the related long-lived asset, our oil and natural gas properties. The cost of the tangible asset, including the asset retirement cost, is depleted over the useful life of the asset. The initial recognition or subsequent revision of asset retirement cost is considered a level 3 fair value measurement. The asset retirement obligation is recorded at its estimated fair value, measured by reference to the expected future cash outflows required to satisfy the retirement obligation discounted at our credit-adjusted risk-free interest rate. Accretion expense is recognized over time as the discounted liability is accreted to its expected settlement value. If the estimated future cost of the asset retirement obligation changes, an adjustment is recorded to both the asset retirement obligation and the long-lived asset. Revisions to estimated asset retirement obligations can result from changes in retirement cost estimates, revisions to estimated inflation rates and changes in the estimated timing of abandonment.
Fair Value of Financial Instruments.
Our financial instruments consist of cash and cash equivalents, restricted cash, accounts receivable, accounts payable and derivative instruments. Except for derivatives, the carrying amounts of these approximate fair value due to the highly liquid nature of these short-term instruments. The fair values of the Company’s derivative assets and liabilities are based on a third-party industry-standard pricing model that uses market data obtained from third-party sources, including quoted forward prices for oil and gas, discount rates and volatility factors.
Stock-based Compensation.
We estimate the fair value of stock-based compensation awards on the grant date to provide the basis for future compensation expense. Service-based and performance-based Restricted Stock and Contingent Restricted Stock awards are valued using the market price of our common stock on the grant date. Market-based awards are valued using a Monte Carlo simulation based on the historical volatility of the Company's total stock return compared to the historical volatilities of other companies or indices to which we compare our performance. This Monte Carlo simulation also provides an expected vesting period. We use the Black-Scholes option-pricing model to determine grant date fair value of any Stock Option or Incentive Warrant awards. For service-based awards, stock-based compensation is recognized ratably over the service period. For performance-based awards, stock based compensation is recognized ratably over the expected vesting period when it is deemed probable, for accounting purposes, that the performance goal will be achieved. The expected vesting period may be shorter than the remaining term. For market-based awards, stock-based compensation expense is recognized ratably over the expected vesting period, so long as the award holder remains an employee of the Company. Total compensation expense is independent of vesting or expiration of the awards, except for termination of service.
46
EVOLUTION PETROLEUM CORPORATION AND SUBSIDIARIES
NOTES TO CONSOLIDATED FINANCIAL STATEMENTS (Continued)
Revenue Recognition - Oil and Gas.
We recognize oil and natural gas revenue from our interests in producing wells at the time that title passes to the purchaser. As a result, we accrue revenues related to production sold for which we have not received payment.
Revenue Recognition - Artificial Lift Technology.
Our artificial lift technology operations have generated revenues under contractual arrangements. Under these contracts, we were required to bear part or all of the incremental installation and capital costs for the technology. We evaluated the substance of each contractual arrangement and recognized revenues over the life of the contract as the earnings process is determined to be complete. We likewise charge our costs, including both capital expenditures and operating expenses, to operating costs in a manner which either matches these costs to the timing of expected revenues, where appropriate, or charges these costs to the accounting period in which they were incurred where it is not appropriate to capitalize or defer them to match with revenues.
Derivative Instruments.
The Company has used and may continue to use derivative transactions to reduce its exposure to oil, natural gas or NGL price volatility. All derivative instruments are recorded on the consolidated balance sheet as either an asset or liability measured at fair value. The Company nets its fair value amounts for derivative instruments executed with the same counterparty, where such transactions are covered by an ISDA master agreement that provides for net settlement over the term of the contract and in the event of default or termination of the contract. Although the derivative instruments are intended to provide an economic hedge of the Company’s exposure to commodity price volatility, the Company has not attempted to qualify its derivative instruments for hedge accounting treatment. As a result, changes in the fair value of derivative instruments are recognized as gains or losses in the consolidated statements of operations in the period in which the changes occur. The net cash flows resulting from the payments to and receipts from counterparties as a result of derivative settlements are classified as cash flows from investing activities rather than operating activities. The Company does not intend to enter into derivative instruments for speculative or trading purposes.
Depreciation, Depletion and Amortization ("DD&A").
The depreciable base for oil and natural gas properties includes the sum of all capitalized costs net of DD&A, estimated future development costs and asset retirement costs (net of salvage values) not included in oil and natural gas properties, less costs excluded from amortization. The depreciable base of oil and natural gas properties is amortized using the unit-of-production method over total proved reserves. Other property, consisting of leasehold building improvements, office and computer equipment is depreciated as described above in Other Property and Equipment.
Income Taxes.
We recognize deferred tax assets and liabilities based on the differences between the tax basis of assets and liabilities and their reported amounts in the financial statements that may result in taxable or deductible amounts in future years. The measurement of deferred tax assets may be reduced by a valuation allowance based upon management's assessment of available evidence if it is deemed more likely than not some or all of the deferred tax assets will not be realizable. We recognize a tax benefit from an uncertain position when it is more likely than not that the position will be sustained upon examination, based on the technical merits of the position and will record the largest amount of tax benefit that is greater than 50% likely of being realized upon settlement with a taxing authority. The Company classifies any interest and penalties associated with income taxes as income tax expense.
Earnings (Loss) Per Share.
Basic earnings (loss) per share ("EPS") is computed by dividing earnings or loss available to common stockholders by the weighted-average number of common shares outstanding during the period. The computation of diluted EPS is similar to the computation of basic EPS, except that the denominator is increased to include the number of additional common shares that would have been outstanding if potentially dilutive common shares had been issued. Potentially dilutive common shares are our outstanding stock options and contingent restricted common stock. We use the treasury stock method to determine the effect of potentially dilutive common shares on diluted EPS, unless the effect would be anti-dilutive. Under this method, exercise of stock options and, under certain conditions, contingent restricted common stock is assumed to have occurred at the beginning of the period (or at time of issuance, if later) and common shares are assumed to have been issued. The proceeds from exercise of stock options and unamortized stock compensation expense related to restricted common stock are assumed to be used to repurchase common stock at the average market price during the period. The incremental shares (the difference between the number of shares assumed issued and the number of shares assumed repurchased) are included in the denominator of the diluted EPS computation. Contingent restricted stock is included in the computation of diluted shares, if dilutive, when the underlying performance conditions either (i) were satisfied as of the end of the reporting period or (ii) would be considered satisfied if the end of the reporting period were the end of the related contingency period.
47
EVOLUTION PETROLEUM CORPORATION AND SUBSIDIARIES
NOTES TO CONSOLIDATED FINANCIAL STATEMENTS (Continued)
Recently Adopted Accounting Pronouncements.
In November 2016, the FASB issued ASU 2016-18, Statement of Cash Flows (Topic 230) (“ASU 2016-18”). ASU 2016-18 addresses the diversity that exists in the classification and presentation of changes in restricted cash on the statement of cash flows, and requires that a statement of cash flows explain the change in total cash, cash equivalents, and amounts generally described as restricted cash or restricted cash equivalents. Therefore, entities will no longer present transfers between cash and cash equivalents and restricted cash and restricted cash equivalents in the statement of cash flows. This guidance is effective for fiscal years beginning after December 15, 2017, including interim periods within the year of adoption, with early adoption permitted. The Company retrospectively early adopted this guidance on April 1, 2018. ASU 2016-18 had no impact on the consolidated statements of cash flows for the previously reported interim periods of our current fiscal year and for prior fiscal year consolidated statements of cash flows presented in this annual report on Form 10-K.
New Accounting Pronouncements Not Yet Adopted.
In May 2014, the FASB issued ASU No. 2014-09, Revenue from Contracts with Customers (Topic 606), which will supersede most of the existing revenue recognition standards and will require entities to recognize revenue at an amount that reflects the consideration to which it expects to be entitled in exchange for transferring goods or services to a customer. The new standard also requires disclosures that are sufficient to enable users to understand an entity’s nature, amount, timing, and uncertainty of revenue and cash flows arising from contracts with customers.
In March 2016, the FASB issued ASU 2016-08, Revenue from Contracts with Customers (Topic 606): Principal versus Agent Considerations (Reporting Revenue Gross versus Net). This update provides clarifications in the assessment of principal versus agent considerations in the new revenue standard. In May 2016, the FASB issued ASU 2016-12, Revenue from Contracts with Customers (Topic 606): Narrow Scope Improvements and Practical Expedients. The update reduces the potential for diversity in practice at initial application of Topic 606 and the cost and complexity of applying Topic 606. In December 2016, the FASB issued ASU 2016-20, Technical Corrections and Improvements to Topic 606, Revenue from Contracts with Customers. The update was issued to increase stakeholders’ awareness of the proposals for technical corrections and to expedite improvements.
The Company will adopt these updates effective July 1, 2018, using the full retrospective approach, meaning any cumulative effect of initially applying the standard is recognized in the earliest period presented in the financial statements. The Company has finalized the detailed analysis of its contracts and of the impact of the standard on its contracts and found that there was no significant impact on its financial position or results of operations. Upon adoption of this standard, the Company will not be required to record a cumulative effect adjustment as the new standard does not have a quantitative impact on net income compared to existing generally accepted accounting principles. Also, upon adoption of the standard, the Company will not be required to alter its existing information technology and internal controls outside of ongoing contract review processes to identify impacts of future revenue contracts entered into by the Company. The Company does not anticipate the disclosure requirements under the new updates will have a material change on how it presents information regarding its revenue streams as compared to existing generally accepted accounting principles although certain revenue streams under the new standard will be presented on a net rather than gross basis.
In January 2016, the FASB issued ASU 2016-01, Financial Instruments - Overall: Recognition and Measurement of Financial Assets and Financial Liabilities ("ASU 2016-01"). The pronouncement requires equity investments (except those accounted for under the equity method of accounting, or those that result in consolidation of the investees) to be measured at fair value with changes in fair value recognized in net income, requires public business entities to use the exit price notion when measuring the fair value of financial instruments for disclosure purposes, requires separate presentation of financial assets and financial liabilities by measurement category and form of financial asset, and eliminates the requirement for public business entities to disclose the method(s) and significant assumptions used to estimate the fair value that is required to be disclosed for financial instruments measured at amortized cost. These changes become effective for fiscal years beginning after December 15, 2018. The expected adoption method of ASU 2016-01 is being evaluated by the Company and the adoption is not expected to have a significant impact on the Company’s consolidated financial position or results of operations.
In February 2016, the FASB issued ASU 2016-02, Leases (Topic 842) (“ASU 2016-02”), which relates to the accounting for leasing transactions. This standard requires a lessee to record on the balance sheet the assets and liabilities for the rights and obligations created by leases with lease terms of more than twelve months. In addition, this standard requires both lessees and lessors to disclose certain key information about lease transactions. This standard will be effective for fiscal years beginning after December 15, 2018, including interim periods within those fiscal years. We are evaluating the impact the adoption of ASU 2016-02 will have on our consolidated financial statements.
48
EVOLUTION PETROLEUM CORPORATION AND SUBSIDIARIES
NOTES TO CONSOLIDATED FINANCIAL STATEMENTS (Continued)
In August 2016, the FASB issued ASU No. 2016-15, Statement of Cash Flows (Topic 230): Classification of Certain Cash Receipts and Cash Payments (“ASU 2016-15”), which is intended to reduce diversity in practice in how certain transactions are classified in the statement of cash flows. The guidance addresses eight specific cash flow issues for which current GAAP is either unclear or does not include specific guidance. The Company will retrospectively adopt ASU 2016-15 on July 1, 2018, and does not expect its adoption to have a material effect on its consolidated statements of cash flows.
In January 2017, the FASB issued ASU No. 2017-01, Business Combinations (Topic 805): Clarifying the Definition of a Business (“ASU 2017-01”), which clarifies the definition of a business to assist entities with evaluating whether transactions should be accounted for as acquisitions (or disposals) of assets or businesses. The Company will adopt ASU 2017-01 effective July 1, 2018 on a prospective basis.
As previously disclosed, the Company entered into a Purchase and Sale Agreement ("PSA") on May 15, 2018, to acquire, as the "stalking horse" bidder, certain oil and gas assets from an affiliate of Enduro Resource Partners LLC ("Enduro") for a purchase price of
$27.5 million
, subject to the outcome of Enduro's Chapter 11 process. Contemporaneous with executing the PSA, the Company made a
$2.75 million
deposit to an acquisition escrow account which is reflected in restricted cash together with earned interest on the Company's
June 30, 2018
statement of financial position. On July 20, 2018, the Company was repaid its deposit together with related earned interest as a higher bidder emerged in the Chapter 11 bidding process.
The Company's initial and subsequent bids represented offers under Section 363 of the U.S. Bankruptcy Code in connection with the Chapter 11 filing of Enduro and certain of its affiliates. Such offers are commonly referred to as “stalking horse” bids and are subject to higher bids, in accordance with the bidding procedures approved by the Bankruptcy Court. The PSA provided the Company with certain important protections in this process, including return of the escrowed deposit and payment to the Company of a
$1.1 million
break-up fee upon the closing of a higher bidder's purchase transaction. In connection with the PSA, the Company incurred third party due diligence expenses of
$0.4 million
, which were reflected in the Company's consolidated statement of operations for the year ended June 30, 2018. The full amount of the break-up fee was paid in late August 2018.
As of
June 30, 2018
and
June 30, 2017
our receivables consisted of the following:
|
June 30,
2018 |
June 30,
2017 |
||||||
|
Receivables from oil and gas sales
|
$
|
3,940,998
|
|
$
|
2,722,880
|
|
|
|
Other
|
918
|
|
3,822
|
|
|||
|
Total receivables
|
$
|
3,941,916
|
|
$
|
2,726,702
|
|
|
There were no losses from uncollectible accounts receivable, nor any allowance for doubtful accounts in any of the periods presented in these financial statements.
As of
June 30, 2018
and
June 30, 2017
our prepaid expenses and other current assets consisted of the following:
|
|
June 30,
2018 |
June 30,
2017 |
|||||
|
Prepaid insurance
|
$
|
198,558
|
|
$
|
169,416
|
|
|
|
Prepaid federal and state income taxes
|
231,920
|
|
121,232
|
|
|||
|
Retainers and deposits
|
11,089
|
|
7,553
|
|
|||
|
Other prepaid expenses
|
82,940
|
|
89,471
|
|
|||
|
Prepaid expenses and other current assets
|
$
|
524,507
|
|
$
|
387,672
|
|
|
49
EVOLUTION PETROLEUM CORPORATION AND SUBSIDIARIES
NOTES TO CONSOLIDATED FINANCIAL STATEMENTS (Continued)
As of
June 30, 2018
and
June 30, 2017
, our oil and natural gas properties and other property and equipment consisted of the following:
|
June 30,
2018 |
June 30,
2017 |
||||||
|
Oil and natural gas properties:
|
|
|
|||||
|
Property costs subject to amortization
|
$
|
90,392,918
|
|
$
|
84,962,933
|
|
|
|
Less: Accumulated depreciation, depletion, and amortization
|
(29,153,172
|
)
|
(23,172,865
|
)
|
|||
|
Unproved properties not subject to amortization
|
—
|
|
—
|
|
|||
|
Oil and natural gas properties, net
|
61,239,746
|
|
61,790,068
|
|
|||
|
Other property and equipment:
|
|
|
|||||
|
Furniture, fixtures and office equipment, at cost
|
143,223
|
|
135,377
|
|
|||
|
Less: Accumulated depreciation
|
(112,816
|
)
|
(94,688
|
)
|
|||
|
Other property and equipment, net
|
$
|
30,407
|
|
$
|
40,689
|
|
|
As of
June 30, 2018
and
2017
, all oil and gas property costs were being amortized.
During the years ended
June 30, 2018
and
2017
, the Company incurred capital expenditures of
$5.4 million
and
$7.1 million
, respectively, in the Delhi field.
Note 7
–
Other Assets
As of
June 30, 2018
and
June 30, 2017
our other assets consisted of the following:
|
|
June 30,
2018 |
June 30,
2017 |
|||||
|
Royalty rights
|
108,512
|
|
108,512
|
|
|||
|
Less: Accumulated amortization of royalty rights
|
(33,910
|
)
|
(20,346
|
)
|
|||
|
Investment in Well Lift Inc., at cost
|
108,750
|
|
108,750
|
|
|||
|
Deferred loan costs
|
168,972
|
|
168,972
|
|
|||
|
Less: Accumulated amortization of deferred loan costs
|
(126,771
|
)
|
(70,504
|
)
|
|||
|
Software license
|
20,662
|
|
—
|
|
|||
|
Less: Accumulated amortization of software license
|
(1,380
|
)
|
—
|
|
|||
|
Other assets, net
|
$
|
244,835
|
|
$
|
295,384
|
|
|
Our royalty rights and investment in Well Lift, Inc. ("WLI") resulted from the separation of our artificial lift technology operations in December 2015. We conveyed our patents and other intellectual property to WLI and retained a
5%
royalty on future gross revenues associated the technology. We own
17.5%
of the common stock of WLI and account for our investment under the cost method. Any dividends paid are recorded as income and any return of capital reduces our cost basis in the investment. Our investment in WLI is evaluated for impairment at least quarterly or when management identifies any events or changes in circumstances that might have a significant adverse effect on the fair value of the investment. There is no published market value for this private investment, so it is not practicable to value it at fair market value on a periodic basis. The Company has no contractual exposure to losses of WLI, nor does it have any obligation or agreement to provide additional funding or support to WLI if it is needed.
50
EVOLUTION PETROLEUM CORPORATION AND SUBSIDIARIES
NOTES TO CONSOLIDATED FINANCIAL STATEMENTS (Continued)
Note 8
–
Accrued Liabilities and Other
As of
June 30, 2018
and
June 30, 2017
our accrued liabilities and other consisted of the following:
|
|
June 30,
2018 |
June 30,
2017 |
|||||
|
Accrued incentive and other compensation
|
$
|
415,182
|
|
$
|
413,113
|
|
|
|
Accrued severance (for two former employees)
|
160,089
|
|
—
|
|
|||
|
Asset retirement obligations due within one year
|
35,539
|
|
35,115
|
|
|||
|
Accrued royalties, including suspended accounts
|
11,498
|
|
17,708
|
|
|||
|
Accrued franchise taxes
|
162,805
|
|
150,062
|
|
|||
|
Accrued ad valorem taxes
|
89,773
|
|
108,641
|
|
|||
|
Accrued liabilities and other
|
$
|
874,886
|
|
$
|
724,639
|
|
|
Our asset retirement obligations represent the estimated present value of the amount we will incur to plug, abandon and remediate our producing properties at the end of their productive lives in accordance with applicable laws. The following is a reconciliation of the beginning and ending asset retirement obligations for the years ended
June 30, 2018
and
2017
:
|
|
Years Ended
|
||||||
|
|
2018
|
2017
|
|||||
|
Asset retirement obligations — beginning of period
|
$
|
1,288,743
|
|
$
|
962,196
|
|
|
|
Liabilities incurred
|
44,700
|
|
52,792
|
|
|||
|
Liabilities settled
|
—
|
|
(157,164
|
)
|
|||
|
Liabilities sold
|
—
|
|
(47,817
|
)
|
|||
|
Accretion of discount
|
90,290
|
|
59,664
|
|
|||
|
Revisions to previous estimates
|
(778
|
)
|
419,072
|
|
|||
|
Asset retirement obligations — end of period
|
1,422,955
|
|
1,288,743
|
|
|||
|
Less: current asset retirement obligations
|
(35,539
|
)
|
(35,115
|
)
|
|||
|
Long-term portion of asset retirement obligations
|
$
|
1,387,416
|
|
$
|
1,253,628
|
|
|
51
EVOLUTION PETROLEUM CORPORATION AND SUBSIDIARIES
NOTES TO CONSOLIDATED FINANCIAL STATEMENTS (Continued)
Common Stock
As of
June 30, 2018
, we had
33,080,543
shares of common stock outstanding.
The Company began paying quarterly cash dividends on common stock in December 2013. We paid dividends of
$11,594,541
,
$8,432,435
and
$6,565,823
from retained earnings to our common shareholders during the years ended
June 30, 2018
,
2017
and
2016
, respectively. The following table reflects the dividends paid per common share in each quarter within the respective three fiscal years:
|
Fiscal Year
|
|||||||||||
|
2018
|
2017
|
2016
|
|||||||||
|
Fourth quarter ended June 30,
|
$
|
0.100
|
|
$
|
0.070
|
|
$
|
0.050
|
|
||
|
Third quarter ended March 31,
|
$
|
0.100
|
|
$
|
0.070
|
|
$
|
0.050
|
|
||
|
Second quarter ended December 31,
|
$
|
0.075
|
|
$
|
0.065
|
|
$
|
0.050
|
|
||
|
First quarter ended September 30,
|
$
|
0.075
|
|
$
|
0.050
|
|
$
|
0.050
|
|
||
Repurchases of common shares are initially recorded as treasury stock, then subsequently canceled. On May 12, 2015, the Board of Directors approved a share repurchase program covering up to
$5 million
of the Company's common stock. Since commencement in June 2015, we have repurchased
265,762
shares at an average price of
$6.05
per share, for total cost of
$1,609,008
. The timing and amount of repurchases depends upon several factors, including financial resources and market and business conditions. There is no fixed termination date for this repurchase program, and it may be suspended or discontinued at any time. We have not repurchased any shares since December 2015. The Company has also acquired treasury stock from holders of newly vested stock-based awards to fund the recipients' payroll tax withholding obligations. The following summarizes all treasury stock purchases by fiscal year:
|
Fiscal Year
|
|||||||||||
|
2018
|
2017
|
2016
|
|||||||||
|
Number of treasury shares acquired
|
73,208
|
|
83,675
|
|
218,682
|
|
|||||
|
Average cost per share
|
$
|
7.80
|
|
$
|
6.42
|
|
$
|
5.78
|
|
||
|
Total cost of treasury shares acquired
|
$
|
571,083
|
|
$
|
537,014
|
|
$
|
1,263,402
|
|
||
Series A Cumulative Perpetual Preferred Stock
In September 2016, the Company announced the decision to redeem all
317,319
outstanding shares of its
8.5%
Series A Cumulative Preferred Stock. The redemption occurred in November 2016 at the stated value of
$25.00
per share plus all accumulated and unpaid distributions, for an aggregate redemption cost of
$7,932,975
.
On September 30, 2016, in connection with the planned redemption, the Company recorded a deemed dividend of
$1,002,440
, representing the difference between the redemption consideration paid and the historical net issuance proceeds of the preferred shares. Accordingly, net income was adjusted for this deemed dividend to determine net income attributable to common shareholders and earnings per common share.
Dividends on the Series A Cumulative Preferred Stock were paid at a fixed rate of
8.5%
per annum on the
$25.00
per share liquidation preference, payable monthly. During the year ended
June 30, 2017
, we paid cash dividends of
$250,990
to holders of our Series A Preferred Stock prior to the November 2016 redemption date. During the year ended
June 30, 2016
, we paid cash dividends of
$674,302
.
Tax Treatment of Dividends to Recipients
Based on our current projections for the fiscal year ending
June 30, 2018
, we expect
all
common dividends for this fiscal year will be treated for tax purposes as qualified dividend income to the recipients. For the fiscal year ended
June 30, 2017
,
all
preferred and common dividends for that fiscal year were treated for tax purposes as qualified dividend income to the recipients.
52
EVOLUTION PETROLEUM CORPORATION AND SUBSIDIARIES
NOTES TO CONSOLIDATED FINANCIAL STATEMENTS (Continued)
At the December 8, 2016 annual meeting, the stockholders approved the adoption of the Evolution Petroleum Corporation 2016 Equity Incentive Plan (the “2016 Plan”), which replaced the Evolution Petroleum Corporation Amended and Restated 2004 Stock Plan (the "2004 Plan"). The 2016 Plan authorizes the issuance of
1,100,000
shares of common stock prior to its expiration on December 8, 2026. Incentives under the 2016 Plan may be granted to employees, directors and consultants of the Company in any one or a combination of the following forms: incentive stock options and non-statutory stock options, stock appreciation rights, restricted stock awards and restricted stock unit awards, performance share awards, performance cash awards, and other forms of incentives valued in whole or in part by reference to, or otherwise based on, our common stock, including its appreciation in value. As of
June 30, 2018
,
963,093
shares remained available for grant under the 2016 Plan.
At December 8, 2016, there were no shares available for future grants under the 2004 Plan. All outstanding awards granted under the 2004 Plan continue to be subject to the terms and conditions as set forth in the agreements evidencing such awards and the terms of the 2004 Plan. Under these agreements, we have outstanding grants of restricted common stock awards ("Restricted Stock") and contingent restricted common stock awards ("Contingent Restricted Stock") to employees and directors of the Company. No stock option awards that had been granted in past fiscal years remained outstanding at December 8, 2016.
Stock Options
No Stock Options have been granted since August 2008 and all compensation costs attributable to Stock Options have been recognized in prior periods.
No
stock options vested during the years ended
June 30, 2018
,
2017
, and
2016
. There were
no
unexercised Stock Options as of June 30, 2017 and
no
Stock Options vested during the years ended
June 30, 2018
,
2017
, and
2016
.
For the year ended June 30, 2017, there were
35,231
Stock Options exercised with an aggregate intrinsic value of
$188,821
.
Restricted Stock and Contingent Restricted Stock
The Company may award grants of both Restricted Stock and Contingent Restricted Stock as part of its long-term incentive plan. Such grants, which expire after a maximum of
four years
if unvested, contain service-based, performance-based and market-based vesting provisions. The common shares underlying the Restricted Stock grants are issued on the date of grant. Contingent Restricted Stock grants vest only upon the attainment of higher performance-based or market-based vesting thresholds and are issued only upon vesting. Shares underlying Contingent Restricted Stock awards are reserved from the Plan under which they were granted under.
Service-based awards vest with continuous employment by the Company, generally in annual installments over a
four
-year period. Certain awards may contain other vesting periods, including quarterly installments and
one
-year vesting. Restricted Stock grants which vest based on service are valued at the fair market value on the date of grant and amortized over the service period. During the year ended
June 30, 2018
, we granted
136,907
service-based Restricted Stock awards, including
69,963
awards to employees and
66,944
awards to directors, most of which have a
one
-year vesting period. We did not grant any performance-based or market-based awards, nor any Contingent Restricted Stock awards, during this period.
Performance-based grants vest upon the attainment of earnings, revenue and other operational goals and require that the recipient remain an employee or director of the Company through the vesting date. The Company recognizes compensation expense for performance-based awards ratably over the expected vesting period based on the grant date fair value when it is deemed probable, for accounting purposes, that the performance criteria will be achieved. The expected vesting period may be deemed to be shorter than the
four
-year term. As of
June 30, 2018
, certain contingent performance-based awards were not considered probable of vesting for accounting purposes and no compensation expense has been recognized with regard to these awards. If these awards are later determined to be probable of vesting, cumulative compensation expense would be recorded at that time and amortization would continue over the remaining expected vesting period.
Market-based awards vest if the
three
-year trailing total return on the Company’s common stock exceeds the corresponding total returns of various quartiles of indices consisting of peer company groups as designated from time to time by the Compensation Committee of the Board of Directors. The fair values and expected vesting periods of these awards are determined using a Monte Carlo simulation based on the historical volatility of the Company's total return compared to the historical volatilities of the other companies in the index. The range of assumptions used in the Monte Carlo simulation
53
EVOLUTION PETROLEUM CORPORATION AND SUBSIDIARIES
NOTES TO CONSOLIDATED FINANCIAL STATEMENTS (Continued)
valuations for the years ended June 30, 2017 and 2016 were as follows:
|
Years Ended June 30
|
|||||||
|
2017
|
2016
|
||||||
|
Weighted average fair value of market-based awards granted
|
$
|
4.97
|
|
$
|
5.50
|
|
|
|
Risk-free interest rate
|
1.03
|
%
|
1.46
|
%
|
|||
|
Expected life in years
|
2.83
|
|
3.83
|
|
|||
|
Expected volatility
|
37.8
|
%
|
34.9
|
%
|
|||
|
Dividend yield
|
3.5
|
%
|
3.3
|
%
|
|||
Compensation expense for market-based awards is recognized over the expected vesting period using the straight-line method, so long as the award holder remains an employee of the Company. Total compensation expense is based on the fair value of the awards at the date of grant and is independent of vesting or expiration of the awards, except for termination of service.
Unvested Restricted Stock awards at
June 30, 2018
consisted of the following:
|
Award Type
|
Number of
Restricted Shares |
Weighted
Average Grant-Date Fair Value |
||||
|
Service-based awards
|
157,906
|
|
$
|
7.16
|
|
|
|
Performance-based awards
|
21,259
|
|
5.67
|
|
||
|
Market-based awards
|
20,312
|
|
5.44
|
|
||
|
Unvested at June 30, 2018
|
199,477
|
|
$
|
6.83
|
|
|
The following table sets forth the Restricted Stock transactions for the year ended
June 30, 2018
:
|
Number of
Restricted
Shares
|
Weighted
Average
Grant-Date
Fair Value
|
Unamortized Compensation Expense at June 30, 2018
|
Weighted Average Remaining Amortization Period (Years)
|
|||||||||
|
Unvested at July 1, 2017
|
391,624
|
|
$
|
6.22
|
|
$
|
—
|
|
||||
|
Service-based awards granted
|
136,907
|
|
7.53
|
|
||||||||
|
Vested
|
(211,960
|
)
|
6.73
|
|
||||||||
|
Forfeited
|
(117,094
|
)
|
5.78
|
|
||||||||
|
Unvested at June 30, 2018
|
199,477
|
|
$
|
6.83
|
|
$
|
747,204
|
|
2.0
|
|||
The following is a summary of Restricted Stock vestings for the last three fiscal years:
|
Year Ended June 30,
|
|||||||||||
|
2018
|
2017
|
2016
|
|||||||||
|
Vesting-date intrinsic value of Restricted Stock
|
$
|
1,622,937
|
|
$
|
1,478,478
|
|
$
|
485,580
|
|
||
|
Grant-date fair value of vested Restricted Stock
|
$
|
1,427,498
|
|
$
|
1,520,569
|
|
$
|
757,229
|
|
||
54
EVOLUTION PETROLEUM CORPORATION AND SUBSIDIARIES
NOTES TO CONSOLIDATED FINANCIAL STATEMENTS (Continued)
Unvested Contingent Restricted Stock awards at
June 30, 2018
consisted of the following:
|
Award Type
|
Number of
Contingent Restricted Shares |
Weighted
Average Grant-Date Fair Value |
|||||
|
Performance-based awards
|
18,406
|
|
$
|
7.52
|
|
||
|
Market-based awards
|
10,156
|
|
3.42
|
|
|||
|
Unvested at June 30, 2018
|
28,562
|
|
$
|
6.06
|
|
||
The following table summarizes Contingent Restricted Stock activity for fiscal 2018:
|
|
Number of
Restricted Stock Units |
Weighted
Average Grant-Date Fair Value |
Unamortized Compensation Expense at June 30, 2018 (1)
|
Weighted Average Remaining Amortization Period (Years)
|
||||||||
|
Unvested at July 1, 2017
|
113,270
|
|
$
|
4.64
|
|
|||||||
|
Forfeited
|
(38,078
|
)
|
5.17
|
|
||||||||
|
Vested
|
(46,630
|
)
|
3.34
|
|
||||||||
|
Unvested at June 30, 2018
|
28,562
|
|
$
|
6.06
|
|
$
|
12,251
|
|
1.0
|
|||
(1) Excludes
$78,159
of potential future compensation expense for performance-based awards for which vesting is not considered probable at this time for accounting purposes.
The following is a summary of Contingent Restricted Stock vestings for the last three fiscal years:
|
Year Ended June 30,
|
|||||||||||
|
2018
|
2017
|
2016
|
|||||||||
|
Vest-date intrinsic value of Contingent Restricted Stock
|
$
|
347,852
|
|
$
|
183,572
|
|
$
|
—
|
|
||
|
Grant-date fair value of vested Contingent Restricted Stock
|
$
|
155,744
|
|
$
|
197,170
|
|
$
|
—
|
|
||
Stock-based Compensation Expense
For the years ended
June 30, 2018
,
2017
, and
2016
, we recognized stock-based compensation expense related to Restricted Stock and Contingent Restricted Stock grants of
$1,366,764
,
$1,180,618
, and
$1,809,548
, respectively. Expense for the year ended June 30, 2016 includes
$59,339
of stock-based compensation that was incurred in a restructuring.
55
EVOLUTION PETROLEUM CORPORATION AND SUBSIDIARIES
NOTES TO CONSOLIDATED FINANCIAL STATEMENTS (Continued)
Our supplemental disclosures of cash flow information for the years ended
June 30,
2018
,
2017
, and
2016
are as follows:
|
|
June 30,
|
||||||||||
|
|
2018
|
2017
|
2016
|
||||||||
|
Income taxes paid
|
$
|
1,826,754
|
|
$
|
1,495,377
|
|
$
|
540,000
|
|
||
|
Income tax refunds
|
—
|
|
—
|
|
1,556,999
|
|
|||||
|
Non-cash transactions:
|
|
|
|
||||||||
|
Increase (decrease) in accrued purchases of property and equipment
|
1,695,218
|
|
(3,076,245
|
)
|
(2,250,048
|
)
|
|||||
|
Deferred loan costs charged to oil and gas property costs
|
—
|
|
—
|
|
107,196
|
|
|||||
|
Oil and natural gas property costs attributable to the recognition of asset retirement obligations
|
43,922
|
|
471,864
|
|
140,151
|
|
|||||
|
Mengel working interest acquired in Delhi Field litigation settlement
|
—
|
|
—
|
|
596,500
|
|
|||||
|
Royalty rights acquired through non-monetary exchange of patent and trademark assets
|
—
|
|
—
|
|
108,512
|
|
|||||
|
Previously acquired Company shares swapped by holders to pay stock option exercise price
|
—
|
|
77,156
|
|
76,500
|
|
|||||
|
Accrued purchases of treasury stock
|
—
|
|
—
|
|
(170,283
|
)
|
|||||
We file a consolidated federal income tax return in the United States and various combined and separate filings in several state and local jurisdictions.
There were
no
unrecognized tax benefits nor any accrued interest or penalties associated with unrecognized tax benefits during the years ended
June 30, 2018
,
2017
and
2016
. We believe that we have appropriate support for the income tax positions taken and to be taken on the Company's tax returns and that the accruals for tax liabilities are adequate for all open years based on our assessment of many factors including past experience and interpretations of tax law applied to the facts of each matter. The Company's tax returns are open to audit under the statute of limitations for the years ending June 30, 2015 through June 30, 2017 for federal tax purposes and for the years ended June 30, 2014 through June 30, 2017 for state tax purposes.
The components of our income tax provision (benefit) are as follows:
|
June 30, 2018
|
June 30, 2017
|
June 30, 2016
|
|||||||||
|
Current:
|
|
|
|
||||||||
|
Federal
|
$
|
1,186,649
|
|
$
|
168,152
|
|
$
|
8,731,290
|
|
||
|
State
|
652,238
|
|
581,593
|
|
264,254
|
|
|||||
|
Total current income tax provision
|
1,838,887
|
|
749,745
|
|
8,995,544
|
|
|||||
|
Deferred:
|
|
|
|
||||||||
|
Federal
|
(5,498,890
|
)
|
3,880,522
|
|
541,891
|
|
|||||
|
State
|
228,034
|
|
210,397
|
|
33,344
|
|
|||||
|
Total deferred income tax provision
|
(5,270,856
|
)
|
4,090,919
|
|
575,235
|
|
|||||
|
$
|
(3,431,969
|
)
|
$
|
4,840,664
|
|
$
|
9,570,779
|
|
|||
The following table presents the reconciliation of our income taxes calculated at the statutory federal tax rate to the income tax provision (benefit) in our financial statements. The rate for 2018 is
27.55%
due to our fiscal tax year. This is a result of the transition from the previously enacted
34%
federal statutory rate to the new federal tax rate of
21%
,, enacted December 31, 2017. Going forward, the federal statutory rate that will be applied is
21%
. Our federal statutory rate for fiscal 2017 and 2016 was
34%
. The effective tax rates for annual income tax provision (benefit) were approximately
(21)%
,
38%
and
28%
year ended
June 30, 2018
,
2017
and
2016
, respectively. Excluding the permanent adjustment of
$6.1 million
benefit
56
EVOLUTION PETROLEUM CORPORATION AND SUBSIDIARIES
NOTES TO CONSOLIDATED FINANCIAL STATEMENTS (Continued)
from the revaluation of our deferred income tax liabilities and valuation allowance at December 31, 2017, the effective rate for the year ended
June 30, 2018
, would have been
16%
of income before income taxes.
Our effective tax rate for fiscal 2018 is less than the statutory rate primarily as a result of the reduction in federal tax rate from newly enacted tax legislation as well as the benefit derived from statutory depletion in excess of tax basis partly offset by the state of Louisiana income taxes. Our effective tax rate for 2017 exceeded the statutory rate primarily as a result of state of Louisiana income taxes, partly offset by depletion in excess of basis. The effective tax rate for 2016 is less than the statutory rate primarily due to the benefit derived from statutory depletion in excess of tax basis and relatively lower state income taxes because a significant legal settlement and derivative gains were not taxable in Louisiana.
|
June 30, 2018
|
% of Income Before Income Taxes
|
June 30, 2017
|
% of Income Before Income Taxes
|
June 30, 2016
|
% of Income Before Income Taxes
|
|||||||||||||||
|
Income tax provision computed at the statutory federal rate:
|
$
|
4,459,940
|
|
27.6
|
%
|
$
|
4,380,892
|
|
34.0
|
%
|
$
|
11,638,588
|
|
34.0
|
%
|
|||||
|
Reconciling items:
|
|
|
|
|||||||||||||||||
|
Adjustment of deferred income liability for lower statutory federal tax rate
|
(5,949,389
|
)
|
(36.8
|
)%
|
—
|
|
—
|
%
|
—
|
|
—
|
%
|
||||||||
|
Change in valuation allowance due to newly enacted tax legislation
|
(111,818
|
)
|
(0.7
|
)%
|
—
|
|
—
|
%
|
—
|
|
—
|
%
|
||||||||
|
Depletion in excess of tax basis
|
(2,433,530
|
)
|
(14.9
|
)%
|
(92,196
|
)
|
(0.7
|
)%
|
(2,242,620
|
)
|
(6.6
|
)%
|
||||||||
|
State income taxes, net of federal tax benefit
|
718,337
|
|
4.4
|
%
|
522,713
|
|
4.1
|
%
|
196,415
|
|
0.6
|
%
|
||||||||
|
Permanent differences related to stock-based compensation
|
(139,333
|
)
|
(0.9
|
)%
|
27,884
|
|
0.2
|
%
|
—
|
|
—
|
%
|
||||||||
|
Other
|
23,824
|
|
0.1
|
%
|
1,371
|
|
—
|
%
|
(21,604
|
)
|
(0.1
|
)%
|
||||||||
|
Income tax (benefit) provision
|
$
|
(3,431,969
|
)
|
(21.2
|
)%
|
$
|
4,840,664
|
|
37.6
|
%
|
$
|
9,570,779
|
|
28.0
|
%
|
|||||
57
EVOLUTION PETROLEUM CORPORATION AND SUBSIDIARIES
NOTES TO CONSOLIDATED FINANCIAL STATEMENTS (Continued)
Deferred income taxes primarily represent the net tax effect of temporary differences between the carrying amounts of assets and liabilities for financial reporting purposes and the amounts used for income tax purposes. Prior to 2017, deferred tax assets and liabilities are classified as either current or noncurrent on the balance sheet based on the classification of the related asset or liability for financial reporting purposes. Also prior to 2017, deferred tax assets and liabilities not related to specific assets or liabilities on the financial statements are classified according to the expected reversal date of the temporary difference or the expected utilization date for tax attribute carryforwards. Beginning in 2017, all deferred tax assets and liabilities are classified as noncurrent. See note below on ASU 2015-17.
|
Asset (Liability)
|
|||||||||||
|
June 30, 2018
|
June 30, 2017
|
June 30, 2016
|
|||||||||
|
Deferred tax assets:
|
|
|
|
||||||||
|
Non-qualified stock-based compensation
|
$
|
144,956
|
|
$
|
367,159
|
|
$
|
553,182
|
|
||
|
Net operating loss carry-forwards
|
680,186
|
|
852,477
|
|
386,808
|
|
|||||
|
AMT credit carry-forward
|
—
|
|
110,564
|
|
—
|
|
|||||
|
Other
|
24,207
|
|
18,581
|
|
130,947
|
|
|||||
|
Gross deferred tax assets
|
849,349
|
|
1,348,781
|
|
1,070,937
|
|
|||||
|
Valuation allowance
|
(180,628
|
)
|
(292,446
|
)
|
(292,446
|
)
|
|||||
|
Total deferred tax assets
|
668,721
|
|
1,056,335
|
|
778,491
|
|
|||||
|
Deferred tax liability:
|
|
|
|
||||||||
|
Oil and natural gas properties
|
(11,224,156
|
)
|
(16,882,626
|
)
|
(12,513,863
|
)
|
|||||
|
Total deferred tax liability
|
(11,224,156
|
)
|
(16,882,626
|
)
|
(12,513,863
|
)
|
|||||
|
Net deferred tax liability
|
$
|
(10,555,435
|
)
|
$
|
(15,826,291
|
)
|
$
|
(11,735,372
|
)
|
||
The above assets and liabilities are present on the balance sheet as follows:
|
June 30, 2018
|
June 30, 2017
|
June 30, 2016
|
|||||||||
|
Current deferred tax asset
|
$
|
—
|
|
$
|
—
|
|
$
|
105,321
|
|
||
|
Non-current deferred tax liability
|
10,555,435
|
|
15,826,291
|
|
11,840,693
|
|
|||||
|
Net liability
|
10,555,435
|
|
15,826,291
|
|
|
11,735,372
|
|
||||
As the result of prospectively adopting ASU No. 2015-17, Balance Sheet Classification of Deferred Taxes on July 1, 2016, current deferred tax assets have been subsequently netted together with noncurrent deferred income tax liabilities.
As of
June 30, 2018
, we had a federal tax loss carryforward of approximately
$1.2 million
that we acquired through the reverse merger in May 2004. The majority of the tax loss carryforwards from the reverse merger expired without being utilized. We will be able to utilize a maximum of
$0.3 million
of these carryforwards in equal annual amounts of
$39,648
through 2023 and the balance is not able to be utilized based on the provisions of IRC Section 382. We have recorded a valuation allowance for the portion of our net operating loss that is limited by IRC Section 382.
During fiscal 2016 we utilized the remaining amount of
$25.3 million
of net operating losses ("NOL's") created primarily from tax deductions in excess of book deductions related to the exercise of non-qualified stock options and incentive warrants in fiscal 2014. NOL's related to such stock-based awards had not affected our future tax provision for financial reporting purposes, nor had it been recognized as a deferred tax asset for these future benefits. In fiscal 2016, we recognized a tax benefit for utilization of these NOL's to offset cash taxes that would otherwise have been payable as an increase in additional paid in capital of
$9,650,657
.
In addition, as of June 30, 2018, the Company has an estimated carryforward of percentage depletion in excess of basis of approximately
$1.1 million
. These future deductions are limited to
65%
of taxable income in any period.
58
EVOLUTION PETROLEUM CORPORATION AND SUBSIDIARIES
NOTES TO CONSOLIDATED FINANCIAL STATEMENTS (Continued)
The following table sets forth the computation of basic and diluted net income per share:
|
|
June 30,
|
||||||||||
|
|
2018
|
2017
|
2016
|
||||||||
|
Numerator
|
|
|
|
||||||||
|
Net income attributable to common shareholders
|
$
|
19,618,484
|
|
$
|
6,790,883
|
|
$
|
23,986,060
|
|
||
|
Denominator
|
|
|
|
||||||||
|
Weighted average number of common shares – Basic
|
33,126,469
|
|
33,034,480
|
|
32,810,375
|
|
|||||
|
Effect of dilutive securities:
|
|
|
|
||||||||
|
Contingent restricted stock grants
|
52,066
|
|
53,546
|
|
9,378
|
|
|||||
|
Stock Options
|
—
|
|
22,534
|
|
41,478
|
|
|||||
|
Total weighted average dilutive securities
|
52,066
|
|
76,080
|
|
50,856
|
|
|||||
|
Weighted average number of common shares and dilutive potential common shares used in diluted EPS
|
33,178,535
|
|
33,110,560
|
|
32,861,231
|
|
|||||
|
Net income per common share – Basic
|
$
|
0.59
|
|
$
|
0.21
|
|
$
|
0.73
|
|
||
|
Net income per common share – Diluted
|
$
|
0.59
|
|
$
|
0.21
|
|
$
|
0.73
|
|
||
The following were reflected in the calculation of diluted earnings per share in their respective fiscal years:
|
Outstanding Potential Dilutive Securities
|
Weighted
Average
Exercise Price
|
Outstanding at
June 30, 2018 |
||||
|
Contingent Restricted Stock grants
|
$
|
—
|
|
28,562
|
|
|
|
Outstanding Potential Dilutive Securities
|
Weighted
Average
Exercise Price
|
Outstanding at
June 30, 2017 |
||||
|
Contingent Restricted Stock grants
|
$
|
—
|
|
113,270
|
|
|
|
Outstanding Potential Dilutive Securities
|
Weighted
Average
Exercise Price
|
Outstanding at
June 30, 2016 |
||||
|
Contingent Restricted Stock grants
|
$
|
—
|
|
91,172
|
|
|
|
Stock Options
|
2.19
|
|
35,231
|
|
||
|
Total
|
$
|
0.61
|
|
126,403
|
|
|
59
EVOLUTION PETROLEUM CORPORATION AND SUBSIDIARIES
NOTES TO CONSOLIDATED FINANCIAL STATEMENTS (Continued)
Senior Secured Credit Agreement
On April 11, 2016, the Company entered into a new
three
-year, senior secured reserve-based credit facility ("Facility") in an amount up to
$50 million
. The Facility replaces the Company's previous unsecured credit facility which was set to expire on April 29, 2016 and was terminated in early April. The initial borrowing base under the Facility was set at
$10 million
and was subsequently increased to
$40 million
effective February 1, 2018. On May 25, 2018, we entered into the third amendment to our credit agreement governing the revolving credit facility to, among other things, extend the maturity date to April 11, 2021 and to increase the consolidated tangible net worth covenant discussed below.
As of June 30, 2018, the Company was in compliance with all financial covenants contained in the Facility, and no amounts were outstanding under the Facility.
Borrowings from the Facility may be used for the acquisition and development of oil and gas properties and for letters of credit and other general corporate purposes. Availability of borrowings under the Facility is subject to semi-annual borrowing base redeterminations.
The Facility included a placement fee of
0.50%
on the initial borrowing base, amounting to
$50,000
, and carries a commitment fee of
0.25%
per annum on the undrawn portion of the borrowing base. Any borrowings under the Facility will bear interest, at the Company’s option, at either Libor plus
2.75%
or the Prime Rate, as defined, plus
1.00%
. The Facility contains financial covenants including a requirement that the Company maintain, as of the last day of each fiscal quarter, (a) a maximum total leverage ratio of not more than
3.00
to
1.00
, (b) a debt service coverage ratio of not less than
1.10
to
1.00
, and (c) a consolidated tangible net worth of not less than
$50 million
, all as defined under the Facility.
In connection with this agreement, the Company incurred
$168,972
of debt issuance costs. Such costs were capitalized in Other Assets and are being amortized to expense. The unamortized balance in debt issuance costs related to the Facility was
$42,201
as of June 30, 2018.
We are subject to various claims and contingencies in the normal course of business. In addition, from time to time, we receive communications from government or regulatory agencies concerning investigations or allegations of noncompliance with laws or regulations in jurisdictions in which we operate. At a minimum, we disclose such matters if we believe it is reasonably possible that a future event or events will confirm a loss through impairment of an asset or the incurrence of a liability. We accrue a loss if we believe it is probable that a future event or events will confirm a loss and we can reasonably estimate such loss and we do not accrue future legal costs related to that loss. Furthermore, we will disclose any matter that is unasserted if we consider it probable that a claim will be asserted and there is a reasonable possibility that the outcome will be unfavorable. We expense legal defense costs as they are incurred.
On December 3, 2013, our wholly owned subsidiary, NGS Sub Corp., was served with a lawsuit filed in the 8th Judicial District Court of Winn Parish, Louisiana by Cecil M. Brooks and Brandon Hawkins, residents of Louisiana, alleging that in 2006 a former subsidiary of NGS Sub Corp. improperly disposed of water from an off-lease well into a well located on the plaintiffs’ lands in Winn Parish. The plaintiffs requested monetary damages and other relief. We vigorously defended the claims. Based on our assessment of the continuing costs of defending the Company in this litigation, we entered into a confidential settlement agreement and obtained a full release and dismissal of all claims asserted in this matter. Although the agreement is confidential, the amount of the settlement payment, which was recorded in general and administrative expense as of March 31, 2018 and paid by the Company in April, is not material to the financial position or operations of the Company.
Lease Commitments.
We have a non-cancelable office space with a
three
year term ending on May 31, 2019. Future minimum lease commitments as of
June 30, 2018
under this operating lease is as follows:
|
For the fiscal year ended June 30,
|
|
||
|
2019
|
$
|
66,984
|
|
Rent expense for the years ended
June 30, 2018
,
2017
, and
2016
was
$76,666
,
$80,472
, and
$182,626
, respectively.
60
EVOLUTION PETROLEUM CORPORATION AND SUBSIDIARIES
NOTES TO CONSOLIDATED FINANCIAL STATEMENTS (Continued)
Major Customers.
We market all of our oil and natural gas production from the properties we operate. We do not currently market our share of crude oil production from Delhi. Although we have the right to take our working interest production at Delhi in-kind, we are currently selling our oil under the Delhi operator's agreement with Plains Marketing L.P. for the delivery of our oil to a pipeline at the field. The majority of our operated gas, oil and condensate production is sold to purchasers under short-term (less than 12 months) contracts at market-based prices. The following table identifies customers from whom we derived 10 percent or more of our net oil and natural gas revenues during the years ended
June 30, 2018
,
2017
, and
2016
. The loss of our purchaser at the Delhi field or disruption to pipeline transportation from the field could adversely affect our net realized pricing and potentially our near-term production levels. The loss of any of our other purchasers would not be expected to have a material adverse effect on our operations.
|
|
Year Ended June 30,
|
|||||||
|
Customer
|
2018
|
2017
|
2016
|
|||||
|
Plains Marketing L.P. (Oil sales from Delhi)
|
92
|
%
|
97
|
%
|
99
|
%
|
||
|
American Midstream Gas Solutions (NGL sales from Delhi)
|
8
|
%
|
3
|
%
|
—
|
%
|
||
|
All others
|
—
|
%
|
—
|
%
|
1
|
%
|
||
|
Total
|
100
|
%
|
100
|
%
|
100
|
%
|
||
Accounts Receivable.
Substantially all of our accounts receivable result from oil and natural gas sales to third parties in the oil and natural gas industry. Our concentration of customers in this industry may impact our overall credit risk.
Cash and Cash Equivalents.
We are subject to concentrations of credit risk with respect to our cash and cash equivalents, which we attempt to minimize by maintaining our cash and cash equivalents in high quality money market funds. At times, cash balances may exceed limits federally insured by the Federal Deposit Insurance Corporation ("FDIC").
We have a Company sponsored 401(k) Retirement Plan ("Plan") which covers all full-time employees. We currently match
100%
of employees' contributions to the Plan, to a maximum of the first
6%
of each participant's eligible compensation, with Company contributions fully vested when made. Our matching contributions to the Plan totaled
$43,134
,
$53,113
, and
$88,348
for the years ended
June 30, 2018
,
2017
, and
2016
, respectively.
In early June 2015, the Company began using derivative instruments to reduce its exposure to crude oil price volatility for a substantial portion of its near-term forecasted production. The Company's objectives for this program were to achieve a more predictable level of cash flows to support the Company’s capital expenditure program and to provide better financial visibility for the payment of dividends on common stock. The Company uses both fixed price swap agreements and costless collars to manage its exposure to crude oil price risk. While these derivative instruments are intended to limit the downside risk of adverse price movements, they may also limit future revenues from favorable price movements. The Company does not intend to enter into derivative instruments for speculative or trading purposes.
The Company accounts for derivatives under the provisions of ASC 815 Derivatives and Hedging ("ASC 815") under which the Company records the fair value of the instruments on the balance sheet at each reporting date, with changes in fair value recognized in income. Given cost and complexity considerations, the Company did not elect to use cash flow hedge accounting provided under ASC 815. Under cash flow hedge accounting, the effective portion of the change in fair value of the derivative instruments would be deferred in other comprehensive income and not recognized in earnings until the underlying hedged item impacts earnings.
These derivative instruments can result in both fair value asset and liability positions held with each counterparty. These positions are offset to a single net fair value asset or liability at the end of each reporting period. The Company nets its fair value amounts of derivative instruments executed with the same counterparty pursuant to ISDA master agreements, which provide for net settlement over the term of the contract and in the event of default or termination of the contract. At June 30, 2018 and 2017 the Company had
no
derivative asset or liability positions. At June 30, 2016, the Company held a derivative instrument net asset
61
EVOLUTION PETROLEUM CORPORATION AND SUBSIDIARIES
NOTES TO CONSOLIDATED FINANCIAL STATEMENTS (Continued)
position with its counterparty that had a fair value of
$14,132
.
The Company monitors the credit rating of its counterparties and believes it does not have significant credit risk. Accordingly, we do not currently require our counterparties to post collateral to support the net asset positions of our derivative instruments. As such, the Company is exposed to credit risk to the extent of nonperformance by the counterparties to its derivative instruments.
For the year ended June 30, 2017, the Company recorded in the consolidated statement of operations a gain on derivative instruments of
$29,758
consisting of a realized gain of
$43,890
on settled derivatives and an unrealized loss of
$14,132
on unsettled derivatives. For the year ended June 30, 2016, the Company recorded in the consolidated statement of operations a gain on derivative instruments of
$3,439,229
consisting of a realized gain of
$3,315,123
on settled derivatives and an unrealized gain of
$124,106
on unsettled derivatives.
Accounting guidelines for measuring fair value establish a three-level valuation hierarchy for disclosure of fair value measurements. The valuation hierarchy categorizes assets and liabilities measured at fair value into one of three different levels depending on the observability of the inputs employed in the measurement.
The three levels are defined as follows:
Level 1—Observable inputs such as quoted prices in active markets at the measurement date for identical, unrestricted assets or liabilities.
Level 2—Other inputs that are observable directly or indirectly such as quoted prices in markets that are not active, or inputs which are observable, either directly or indirectly, for substantially the full term of the asset or liability.
Level 3—Unobservable inputs for which there is little or no market data and which the Company makes its own assumptions about how market participants would price the assets and liabilities.
Fair Value of Financial Instruments.
The Company's other financial instruments consist of cash, cash equivalents, and restricted cash, receivables and payables. The carrying amounts of cash and cash equivalents, receivables and payables approximate fair value due to the highly liquid or short-term nature of these instruments.
Other Fair Value Measurements.
The initial measurement and any subsequent revision of asset retirement obligations at fair value are calculated using discounted future cash flows of internally estimated costs. Significant Level 3 inputs used in the calculation of asset retirement obligations include the costs of plugging and abandoning wells, surface restoration and reserve lives. Subsequent to initial recognition, revisions to estimated asset retirement obligations are made when changes occur for input values.
On June 24, 2016, we entered into a settlement agreement with Denbury Resources, Inc., operator of the Delhi field, to resolve all outstanding disputes and claims between the parties, including litigation between Evolution and Denbury with respect to the Delhi field in northeastern Louisiana. The litigation between the parties has been dismissed by the Court with prejudice. In connection with this settlement, the Company recognized a
$28.1 million
settlement gain consisting of a
$27.5 million
cash payment made by Denbury to Evolution, together with its conveyance to Evolution of a
23.9%
working interest in the Mengel Sand Interval, a separate interval within the boundaries of the Delhi field which is not currently producing and for which we estimated a Level 2 fair value of
$596,500
. As part of the settlement, Evolution conveyed a
0.2226%
(.002226) overriding royalty interest in the Delhi field to Denbury.
During the quarter ended December 31, 2015, we consummated a plan to separate and transfer our GARP® artificial lift technology operations to a new entity controlled by the inventor of the technology, our former Senior Vice President of Operations, and certain former employees of the Company. At December 31, 2015, we recorded a
$1,257,433
restructuring charge which included
$59,339
of stock-based compensation,
$628,866
of accrued separation and benefits expense and
$569,228
for asset impairments discussed below. The non-impairment portion of the restructuring charge was based on agreements with the separated employees covering salary and benefit continuation and an acceleration of vesting of equity
62
EVOLUTION PETROLEUM CORPORATION AND SUBSIDIARIES
NOTES TO CONSOLIDATED FINANCIAL STATEMENTS (Continued)
awards in exchange for release from liabilities and other provisions including agreements not to compete. All of such accrued separation and benefits costs had been settled as of June 30, 2017, and an adjustment of
$4,488
was recorded in that fiscal year to reflect the difference between the original accrual and actual expenditures.
In connection with the plan, we invested
$108,750
in common and preferred stock of the new entity, Well Lift, Inc. ("WLI"). We own
17.5%
of WLI and our former employees that previously had primary responsibility for our GARP® operations own the balance of the common stock. Our preferred stock is convertible at our option into common stock which would result in our ownership of
42.5%
of WLI, based on the current capital structure of WLI.
As part of the above restructuring plan, we transferred our technology assets, including our patents and trademarks, to WLI in exchange for a perpetual royalty of
5%
on all future gross revenues associated with the GARP
®
technology. We reduced the carrying value of these exchanged technology assets to our estimate of their expected discounted net present value, which was
$108,512
. This estimate was based on the recent financial results from our artificial lift technology operations and the depressed state of the oil and gas industry and the potential upside outcomes were assigned relatively low probabilities for accounting purposes. The resulting impairment on the technology assets transferred together with impairments of less significant, non-technology assets that had no value to our remaining operations totaled
$569,228
.
Costs incurred for oil and natural gas property acquisition, exploration and development activities
The following table summarizes costs incurred and capitalized in oil and natural gas property acquisition, exploration and development activities. Property acquisition costs are those costs incurred to lease property, including both undeveloped leasehold and the purchase of reserves in place. Exploration costs include costs of identifying areas that may warrant examination and examining specific areas that are considered to have prospects containing oil and natural gas reserves, including costs of drilling exploratory wells, geological and geophysical costs and carrying costs on undeveloped properties. Development costs are incurred to obtain access to proved reserves, including the cost of drilling. Exploration and development costs also include amounts incurred due to the recognition of asset retirement obligations of
$43,922
,
$471,864
and
$140,151
during the years ended
June 30, 2018
,
2017
, and
2016
, respectively.
|
|
For the Years Ended June 30,
|
||||||||||
|
|
2018
|
|
2017
|
2016
|
|||||||
|
Oil and Natural Gas Activities
|
|
|
|
|
|||||||
|
Property acquisition costs:
|
|
|
|
|
|||||||
|
Proved property
|
$
|
—
|
|
|
$
|
—
|
|
$
|
—
|
|
|
|
Unproved property (a)
|
—
|
|
—
|
|
596,500
|
|
|||||
|
Exploration costs
|
—
|
|
|
—
|
|
—
|
|
||||
|
Development costs
|
5,429,985
|
|
|
7,554,579
|
|
19,093,200
|
|
||||
|
Total costs incurred for oil and natural gas activities
|
$
|
5,429,985
|
|
|
$
|
7,554,579
|
|
$
|
19,689,700
|
|
|
(a) In connection with the June 2016 Delhi Field Litigation Settlement, we received a
23.9%
working interest in the non-producing Mengel Interval with an estimated fair value of
$596,500
. This cost is included in properties subject to amortization.
Estimated Net Quantities of Proved Oil and Natural Gas Reserves
The following estimates of the net proved oil and natural gas reserves of our oil and gas properties located entirely within the United States of America are based on evaluations prepared by third-party reservoir engineers. Reserve volumes and values were determined under the method prescribed by the SEC for our fiscal years ended
June 30, 2018
,
2017
, and
2016
, which requires the application of the previous
12 months
unweighted arithmetic average first-day-of-the-month price, and current costs held constant throughout the projected reserve life, when estimating whether reserve quantities are economical to produce.
Proved oil and natural gas reserves are estimated quantities of crude oil, natural gas and natural gas liquids that geological and engineering data demonstrate with reasonable certainty to be recoverable in future years from known reservoirs under existing economic and operating conditions. Proved developed oil and natural gas reserves are reserves that can be expected to be recovered through existing wells with existing equipment and operating methods. There are uncertainties inherent in
63
EVOLUTION PETROLEUM CORPORATION AND SUBSIDIARIES
NOTES TO CONSOLIDATED FINANCIAL STATEMENTS (Continued)
estimating quantities of proved oil and natural gas reserves, projecting future production rates, and timing of development expenditures. Accordingly, reserve estimates often differ from the quantities of oil and natural gas that are ultimately recovered.
Estimated quantities of proved oil and natural gas reserves and changes in quantities of proved developed and undeveloped reserves for each of the periods indicated were as follows:
|
Crude Oil
(Bbls)
|
Natural Gas
Liquids
(Bbls)
|
Natural Gas
(Mcf)
|
BOE
|
||||||||
|
Proved developed and undeveloped reserves:
|
|
|
|
|
|||||||
|
June 30, 2015
|
10,011,976
|
|
2,433,595
|
|
4,939
|
|
12,446,394
|
|
|||
|
Revisions of previous estimates (a)
|
(765,385
|
)
|
(198,233
|
)
|
(3,319
|
)
|
(964,171
|
)
|
|||
|
Improved recovery, extensions and discoveries
|
—
|
|
—
|
|
—
|
|
—
|
|
|||
|
Sales of minerals in place
|
—
|
|
—
|
|
—
|
|
—
|
|
|||
|
Production (sales volumes)
|
(658,041
|
)
|
(491
|
)
|
(1,620
|
)
|
(658,802
|
)
|
|||
|
June 30, 2016
|
8,588,550
|
|
2,234,871
|
|
—
|
|
10,823,421
|
|
|||
|
Revisions of previous estimates (b)
|
508,123
|
|
(504,733
|
)
|
16
|
|
3,390
|
|
|||
|
Improved recovery, extensions and discoveries
|
—
|
|
—
|
|
—
|
|
—
|
|
|||
|
Sales of minerals in place
|
—
|
|
—
|
|
—
|
|
—
|
|
|||
|
Production (sales volumes)
|
(724,523
|
)
|
(43,910
|
)
|
(16
|
)
|
(768,433
|
)
|
|||
|
June 30, 2017
|
8,372,150
|
|
1,686,228
|
|
—
|
|
10,058,378
|
|
|||
|
Revisions of previous estimates (c)
|
369,971
|
|
(315,090
|
)
|
—
|
|
54,881
|
|
|||
|
Improved recovery, extensions and discoveries
|
—
|
|
—
|
|
—
|
|
—
|
|
|||
|
Sales of minerals in place
|
—
|
|
—
|
|
—
|
|
—
|
|
|||
|
Production (sales volumes)
|
(651,931
|
)
|
(93,366
|
)
|
—
|
|
(745,297
|
)
|
|||
|
June 30, 2018
|
8,090,190
|
|
1,277,772
|
|
—
|
|
9,367,962
|
|
|||
|
Proved developed reserves:
|
|
|
|
|
|||||||
|
June 30, 2015
|
7,347,231
|
|
1,572
|
|
4,939
|
|
7,349,626
|
|
|||
|
June 30, 2016
|
7,168,249
|
|
—
|
|
—
|
|
7,168,249
|
|
|||
|
June 30, 2017
|
6,617,389
|
|
1,332,803
|
|
—
|
|
7,950,192
|
|
|||
|
June 30, 2018
|
6,291,850
|
|
993,741
|
|
—
|
|
7,285,591
|
|
|||
|
Proved undeveloped reserves:
|
|||||||||||
|
June 30, 2015
|
2,664,745
|
|
2,432,023
|
|
—
|
|
5,096,768
|
|
|||
|
June 30, 2016
|
1,420,301
|
|
2,234,871
|
|
—
|
|
3,655,172
|
|
|||
|
June 30, 2017
|
1,754,761
|
|
353,425
|
|
—
|
|
2,108,186
|
|
|||
|
June 30, 2018
|
1,798,340
|
|
284,031
|
|
—
|
|
2,082,371
|
|
|||
(a) The negative revision results primarily from the removal of proved undeveloped reserves in the far eastern part of the Delhi field, referred to as Test Site 6, which were deemed uneconomic under the lower SEC price case utilized at the end of the period.
(b) The positive crude oil revision resulted from better production performance during fiscal 2017 and the expectation of greater ultimate recoveries of oil from the Delhi field. The negative NGL revision results primarily from lower expectations for ultimate NGL recoveries from the plant based on production data after the plant commenced production.
(c) The positive crude oil revision resulted from better production performance during fiscal 2018. The negative NGL revision results primarily from lower expectations for ultimate NGL recoveries from the plant based on production data subsequent to the commencement of plant production.
64
EVOLUTION PETROLEUM CORPORATION AND SUBSIDIARIES
NOTES TO CONSOLIDATED FINANCIAL STATEMENTS (Continued)
Standardized Measure of Discounted Future Net Cash Flows
Future oil and natural gas sales and production and development costs have been estimated using prices and costs in effect at the end of the years indicated, as required by ASC 932,
Extractive Activities - Oil and Gas
("ASC 932"). ASC 932 requires that net cash flow amounts be discounted at 10%. Future production and development costs are computed by estimating the expenditures to be incurred in developing and producing our proved oil and natural gas reserves and asset retirement obligations assuming continuation of existing economic conditions. Future income tax expenses are computed by applying the appropriate period-end statutory tax rates to the future pretax net cash flow relating to our proved oil and natural gas reserves, less the tax basis of the related properties. The future income tax expenses do not give effect to tax credits, allowances, or the impact of general and administrative costs of ongoing operations relating to the Company's proved oil and natural gas reserves. Changes in the demand for oil and natural gas, inflation, and other factors make such estimates inherently imprecise and subject to substantial revision. The table below should not be construed to be an estimate of the current market value of our proved reserves.
The standardized measure of discounted future net cash flows related to proved oil and natural gas reserves as of
June 30, 2018
,
2017
, and
2016
are as follows:
|
|
For the Years Ended June 30,
|
||||||||||
|
|
2018
|
2017
|
2016
|
||||||||
|
Future cash inflows
|
$
|
521,533,765
|
|
$
|
425,094,736
|
|
$
|
383,491,193
|
|
||
|
Future production costs and severance taxes
|
(228,478,119
|
)
|
(213,115,443
|
)
|
(179,182,565
|
)
|
|||||
|
Future development costs
|
(22,213,269
|
)
|
(22,631,856
|
)
|
(16,595,047
|
)
|
|||||
|
Future income tax expenses
|
(50,810,883
|
)
|
(47,055,551
|
)
|
(45,713,438
|
)
|
|||||
|
Future net cash flows
|
220,031,494
|
|
142,291,886
|
|
142,000,143
|
|
|||||
|
10% annual discount for estimated timing of cash flows
|
(101,073,080
|
)
|
(59,354,333
|
)
|
(64,042,824
|
)
|
|||||
|
Standardized measure of discounted future net cash flows
|
$
|
118,958,414
|
|
$
|
82,937,553
|
|
$
|
77,957,319
|
|
||
Future cash inflows represent expected revenues from production of period-end quantities of proved reserves based on the previous
12 months
unweighted arithmetic average first-day-of-the-month commodity prices for each year and reflect adjustments for lease quality, transportation fees, energy content and regional price differentials.
|
|
For the Years Ended June 30,
|
||||||||||||||||
|
|
2018
|
2017
|
2016
|
||||||||||||||
|
|
Oil
(Bbl)
|
Gas
(MMBtu)
|
Oil
(Bbl)
|
Gas
(MMBtu)
|
Oil
(Bbl)
|
Gas
(MMBtu)
|
|||||||||||
|
NYMEX prices used in determining future cash flows
|
$
|
57.50
|
|
n/a
|
$
|
48.85
|
|
n/a
|
$
|
42.91
|
|
n/a
|
|||||
There were
no
natural gas reserves in 2018, 2017 and 2016. The NGL prices utilized for future cash inflows were based on historical prices received, where available. For the Delhi NGL plant, we utilized historical prices for the expected mix and net pricing of natural gas liquid products projected to be produced by the plant.
A summary of the changes in the standardized measure of discounted future net cash flows applicable to proved crude oil, natural gas liquids, and natural gas reserves is as follows:
65
EVOLUTION PETROLEUM CORPORATION AND SUBSIDIARIES
NOTES TO CONSOLIDATED FINANCIAL STATEMENTS (Continued)
|
|
For the Years Ended June 30,
|
||||||||||
|
|
2018
|
2017
|
2016
|
||||||||
|
Balance, beginning of year
|
$
|
82,937,553
|
|
$
|
77,957,319
|
|
$
|
159,196,539
|
|
||
|
Net changes in sales prices and production costs related to future production
|
62,011,112
|
|
19,821,288
|
|
(120,832,747
|
)
|
|||||
|
Changes in estimated future development costs
|
267,547
|
|
(1,626,833
|
)
|
74,991
|
|
|||||
|
Sales of oil and gas produced during the period, net of production costs
|
(29,087,710
|
)
|
(23,649,087
|
)
|
(17,079,363
|
)
|
|||||
|
Net change due to extensions, discoveries, and improved recovery
|
—
|
|
—
|
|
—
|
|
|||||
|
Net change due to revisions in quantity estimates
|
888,896
|
|
(2,206,287
|
)
|
(18,821,014
|
)
|
|||||
|
Net change due to sales of minerals in place
|
—
|
|
—
|
|
—
|
|
|||||
|
Development costs incurred during the period
|
—
|
|
2,632,547
|
|
16,327,883
|
|
|||||
|
Accretion of discount
|
11,089,455
|
|
10,086,904
|
|
21,870,650
|
|
|||||
|
Net change in discounted income taxes
|
871,540
|
|
(5,045,279
|
)
|
36,598,239
|
|
|||||
|
Net changes in timing of production and other
|
(10,019,979
|
)
|
4,966,981
|
|
622,141
|
|
|||||
|
Balance, end of year
|
$
|
118,958,414
|
|
$
|
82,937,553
|
|
$
|
77,957,319
|
|
||
The following table presents summarized quarterly financial information for the fiscal years ended
June 30, 2018
and
2017
:
|
2018
|
First
|
Second
|
Third
|
Fourth
|
|||||||||||
|
Revenues
|
$
|
8,537,871
|
|
$
|
11,066,911
|
|
$
|
10,249,566
|
|
$
|
11,426,864
|
|
|||
|
Operating income
|
2,536,459
|
|
4,829,252
|
|
3,663,267
|
|
5,182,663
|
|
|||||||
|
Net income available to common shareholders
|
$
|
2,140,532
|
|
$
|
9,876,848
|
|
$
|
3,068,354
|
|
$
|
4,532,750
|
|
|||
|
Basic net income per share
|
$
|
0.06
|
|
$
|
0.30
|
|
$
|
0.09
|
|
$
|
0.14
|
|
|||
|
Diluted net income per share
|
$
|
0.06
|
|
$
|
0.30
|
|
$
|
0.09
|
|
$
|
0.14
|
|
|||
|
2017
|
First
|
Second
|
Third
|
Fourth
|
|||||||||||
|
Revenues
|
$
|
7,593,940
|
|
$
|
8,529,817
|
|
$
|
9,525,437
|
|
$
|
8,835,702
|
|
|||
|
Operating income
|
2,727,593
|
|
3,675,381
|
|
3,893,236
|
|
2,583,912
|
|
|||||||
|
Net income available to common shareholders
|
$
|
563,345
|
|
$
|
2,307,634
|
|
$
|
2,419,143
|
|
$
|
1,500,761
|
|
|||
|
Basic net income per share
|
$
|
0.02
|
|
$
|
0.07
|
|
$
|
0.07
|
|
$
|
0.05
|
|
|||
|
Diluted net income per share
|
$
|
0.05
|
|
$
|
0.07
|
|
$
|
0.07
|
|
$
|
0.07
|
|
|||
66
None.
Disclosure Controls and Procedures
We maintain disclosure controls and procedures that are designed to ensure that information required to be disclosed in our Exchange Act reports is recorded, processed, summarized and reported within the time periods specified in the Securities and Exchange Commission's rules and forms and that such information is accumulated and communicated to this Company's management, including our interim Chief Executive Officer and Chief Financial Officer, as appropriate to allow for timely decisions regarding required disclosure.
As required by Securities and Exchange Commission Rule 13a-15(b), we carried out an evaluation, under the supervision and with the participation of the Company's management, including our interim Chief Executive Officer and Chief Financial Officer, of the effectiveness of the design and operation of our disclosure controls and procedures as of the end of the period covered by this report. Based on this evaluation, our interim Chief Executive Officer and Chief Financial Officer concluded that our disclosure controls and procedures are effective in ensuring that the information required to be disclosed in our reports filed or submitted under the Exchange Act is recorded, processed, summarized and reported within the time periods specified in the Securities and Exchange Commission rules and forms.
Management's Report on Internal Control Over Financial Reporting
The Company's management is responsible for establishing and maintaining adequate internal control over financial reporting (as defined in Rules 13a-15(f) and 15d-15(f) of the Exchange Act) as a process designed by, or under the supervision of, the company's principal executive and principal financial officers and effected by the Company's board of directors, management and other personnel, to provide reasonable assurance regarding the reliability of financial reporting and the preparation of financial statements for external purposes in accordance with accounting principles generally accepted in the United States of America and includes those policies and procedures that:
|
•
|
Pertain to the maintenance of records that in reasonable detail accurately and fairly reflect the transactions and dispositions of the assets of the company;
|
|
•
|
Provide reasonable assurance that transactions are recorded as necessary to permit preparation of financial statements in accordance with accounting principles generally accepted in the United States of America and that receipts and expenditures of the company are being made only in accordance with authorizations of management and directors of the company; and
|
|
•
|
Provide reasonable assurance regarding prevention or timely detection of unauthorized acquisition, use or disposition of the company's assets that could have a material effect on the financial statements.
|
Because of its inherent limitations, internal control over financial reporting may not prevent or detect misstatements. Therefore, even those systems determined to be effective can provide only reasonable assurance with respect to financial statement preparation and presentation. Also, projections of any evaluation of effectiveness to future periods are subject to risk that controls may become inadequate because of changes in conditions, or that the degree of compliance with the policies or procedures may deteriorate. Under the supervision and with the participation of management, including the interim Chief Executive Officer and the Chief Financial Officer, an evaluation was conducted on the effectiveness of the Company's internal control over financial reporting based on criteria established in the
Internal Control-Integrated Framework
issued by the Committee of Sponsoring Organizations of the Treadway Commission in 2013. Management concluded that the Company maintained effective internal control over financial reporting as of June 30, 2018.
The effectiveness of our internal control over financial reporting at June 30, 2018 has been audited by Moss Adams LLP, the independent registered public accounting firm that also audited our financial statements. Their report is included in
Item 8. "Financial Statements"
of this Annual Report on form 10-K under the heading Report of Independent Registered Public Accounting Firm on internal control over financial reporting.
67
Changes in Internal Control Over Financial Reporting
There has been no change in the Company's internal control over financial reporting during the fourth quarter ended June 30, 2018 that has materially affected, or is reasonably likely to materially affect, the Company's internal control over financial reporting.
None.
68
Incorporated by reference to the Company's Proxy Statement to be filed with the Commission pursuant to Regulation 14A within 120 days of the end of the Company's 2018 fiscal year.
Incorporated by reference to the Company's Proxy Statement to be filed with the Commission pursuant to Regulation 14A within 120 days of the end of the Company's 2018 fiscal year.
Incorporated by reference to the Company's Proxy Statement to be filed with the Commission pursuant to Regulation 14A within 120 days of the end of the Company's 2018 fiscal year.
Incorporated by reference to the Company's Proxy Statement to be filed with the Commission pursuant to Regulation 14A within 120 days of the end of the Company's 2018 fiscal year.
Incorporated by reference to the Company's Proxy Statement to be filed with the Commission pursuant to Regulation 14A within 120 days of the end of the Company's 2018 fiscal year.
69
The following documents are filed as part of this report:
1. Financial Statements.
Our consolidated financial statements are included in Part II, Item 8 of this report:
Reports of Independent Registered Public Accounting Firms
Consolidated Balance Sheets
Consolidated Statements of Operations
Consolidated Statements of Cash Flows
Consolidated Statements of Stockholders' Equity
Notes to the Consolidated Financial Statements
2. Financial Statements Schedules and supplementary information required to be submitted:
None.
3. Exhibits
A list of the exhibits filed or furnished with this report on Form 10-K (or incorporated by reference to exhibits previously filed or furnished by us) is provided in the Exhibit Index of this report. Those exhibits incorporated by reference herein are indicated as such by the information supplied in the parenthetical thereafter. Otherwise, the exhibits are filed herewith.
None.
GLOSSARY OF SELECTED PETROLEUM TERMS
The following abbreviations and definitions are terms commonly used in the crude oil and natural gas industry and throughout this form 10-K:
"BBL." A standard measure of volume for crude oil and liquid petroleum products; one barrel equals 42 U.S. gallons.
"BCF." Billion Cubic Feet of natural gas at standard temperature and pressure.
"BOE." Barrels of oil equivalent. BOE is calculated by converting 6 MCF of natural gas to 1 BBL of oil.
"BOPD." Barrels of oil per day.
"BTU" or "British Thermal Unit." The standard unit of measure of energy equal to the amount of heat required to raise the temperature of one pound of water 1 degree Fahrenheit. One Bbl of crude is typically 5.8 MMBTU, and one standard MCF is typically one MMBTU.
"CO
2
." Carbon dioxide, a gas that can be found in naturally occurring reservoirs, typically associated with ancient volcanoes, and also is a major byproduct from manufacturing and power production also utilized in enhanced oil recovery through injection into an oil reservoir.
"Developed Reserves." Reserves of any category that can be expected to be recovered (i) through existing wells with existing equipment and operating methods or in which the cost of the required equipment is relatively minor compared to the cost of a new well; and (ii) through installed extraction equipment and infrastructure operational at the time of the reserves estimate if the extraction is by means not involving a well.
70
"EOR." Enhanced Oil Recovery projects involve injection of heat, miscible or immiscible gas, or chemicals into oil reservoirs, typically following full primary and secondary waterflood recovery efforts, in order to gain incremental recovery of oil from the reservoir.
"Field." An area consisting of a single reservoir or multiple reservoirs all grouped on or related to the same individual geologic structural feature and/or stratigraphic feature.*
"Farmout." Sale or transfer of all or part of the operating rights from the working interest owner (the assignor or farm-out party), to an assignee (the farm-in party) who assumes all or some of the burden of development, in return for an interest in the property. The assignor may retain an overriding royalty or any other type of interest. For Federal tax purposes, a farm-out may be structured as a sale or lease, depending on the specific rights and carved out interests retained by the assignor.
"Gross Acres or Gross Wells." The total acres or number of wells participated in, regardless of the amount of working interest owned.
"Horizontal Drilling." Involves drilling horizontally out from a vertical well bore, thereby potentially increasing the area and reach of the well bore that is in contact with the reservoir.
"Hydraulic Fracturing." Involves pumping a fluid with or without particulates into a formation at high pressure, thereby creating fractures in the rock and leaving the particulates in the fractures to ensure that the fractures remain open, thereby potentially increasing the ability of the reservoir to produce oil or gas.
"LOE." Means lease operating expense(s), a current period expense incurred to operate a well.
"MBO." One thousand barrels of oil
"MBOE." One thousand barrels of oil equivalent.
"MCF." One thousand cubic feet of natural gas at standard conditions, being approximately sea level pressure and 60 degrees Fahrenheit temperature. Standard pressure in the state of Louisiana is deemed to be 15.025 psi by regulation, but varies in other states.
"MMBOE." One million barrels of oil equivalent.
"MMBTU." One million British thermal units.
"MMCF." One million cubic feet of natural gas at standard temperature and pressure.
"Mineral Royalty Interest." A royalty interest that is retained by the owner of the minerals underlying a lease. See "Royalty Interest".
"Net Acres or Net Wells." The sum of the fractional working interests owned in gross acres or gross wells.
"NGL." Natural gas liquids, being the combination of ethane, propane, butane and natural gasoline that can be removed from natural gas through processing, typically through refrigeration plants that utilize low temperatures, or through J-T plants that utilize compression, temperature reduction and expansion to a lower pressure.
"NYMEX." New York Mercantile Exchange.
"OOIP." Original Oil in Place. An estimate of the barrels originally contained in a reservoir before any production therefrom.
"Operator." An oil and gas joint venture participant that manages the joint venture, pays venture costs and bills the venture's non-operators for their share of venture costs. The operator is also responsible to market all oil and gas production, except for those non-operators who take their production in-kind.
"Overriding Royalty Interest or ORRI." A royalty interest that is created out of the operating or working interest. Unlike a royalty interest, an overriding royalty interest terminates with the operating interest from which it was created or carved out of. See "Royalty Interest".
"Permeability." The measure of ease with which a fluid can move through a reservoir. The unit of measure is a darcy, or any metric derivation thereof, such as a millidarcy, where one darcy equals 1,000 millidarcys. Extremely low permeability of 10 millidarcys, or less, are often associated with source rocks, such as shale, making extraction of hydrocarbons more difficult, than say sandstone traps, where permeability can be one to two darcys or more.
71
"Porosity." (of sand or sandstone). The relative volume of the pore space (or open area) compared to the total bulk volume of the reservoir, stated in percent. Higher porosity rocks provide more storage space for hydrocarbon accumulations than lower porosity rocks in a given cubic volume of reservoir.
“Possible Reserves.” Additional unproved reserves that analysis of geological and engineering data suggests are less likely to be recoverable than Probable Reserves, but have at least a ten percent probability of being recovered.*
"Probable Developed Producing Reserves." Probable Reserves that are Developed and Producing.*
"Probable Reserves." Additional reserves that are less certain to be recovered than Proved Reserves but which, together with Proved Reserves, are as likely as not to be recovered.*
"Producing Reserves." Any category of reserves that have been developed and production has been initiated.*
"Proved Developed Reserves." Proved Reserves that can be expected to be recovered (i) through existing wells with existing equipment and operating methods or in which the cost of the required equipment is relatively minor compared to the cost of a new well; and (ii) through installed extraction equipment and infrastructure operational at the time of the reserves estimate if the extraction is by means not involving a well.
"Proved Developed Nonproducing Reserves ("PDNP")." Proved Reserves that have been developed and no material amount of capital expenditures are required to bring on production, but production has not yet been initiated due to timing, markets, or lack of third party completed connection to a gas sales pipeline.*
"Proved Developed Producing Reserves ("PDP")." Proved Reserves that have been developed and production has been initiated.*
"Proved Reserves." Estimated quantities of crude oil, natural gas, and natural gas liquids which geological and engineering data demonstrate with reasonable certainty to be recoverable in future years from known reservoirs under existing economic, operating methods, and government regulations prior to the time at which contracts providing the right to operate expire, unless evidence indicates that renewal is reasonably certain, regardless of whether deterministic or probabilistic methods are used for the estimation. The project to extract the hydrocarbons must have commenced or the operator must be reasonably certain that it will commence the project within a reasonable time.*
"Proved Undeveloped Reserves ("PUD")." Proved Reserves that are expected to be recovered from new wells on undrilled acreage, or from existing wells where a relatively major expenditure is required for recompletion.*
(i) Reserves on undrilled acreage shall be limited to those directly offsetting development spacing areas that are reasonably certain of production when drilled, unless evidence using reliable technology exists that establishes reasonable certainty of economic producibility at greater distances.
(ii) Undrilled locations can be classified as having undeveloped reserves only if a development plan has been adopted indicating that they are scheduled to be drilled within five years, unless the specific circumstances, justify a longer time.
(iii) Under no circumstances shall estimates for undeveloped reserves be attributable to any acreage for which an application of fluid injection or other improved recovery technique is contemplated, unless such techniques have been proved effective by actual projects in the same reservoir or an analogous reservoir or by other evidence using reliable technology establishing reasonable certainty.
"PSI," or pounds per square inch, a measure of pressure. Pressure is typically measured as "psig", or the pressure in excess of standard atmospheric pressure.
"Present Value." When used with respect to oil and gas reserves, present value means the estimated future net revenues computed by applying current prices of oil and gas reserves (with consideration of price changes only to the extent provided by contractual arrangements) to estimated future production of proved oil and gas reserves as of the date of the latest balance sheet presented, less estimated future expenditures (based on current costs to be incurred in developing and producing the proved reserves) computed using a discount factor and assuming continuation of existing economic conditions.
"Productive Well." A well that is producing oil or gas or that is capable of production.
"PV-10." Means the present value, discounted at 10% per annum, of future net revenues (estimated future gross revenues less estimated future costs of production, development, and asset retirement costs) associated with reserves and is not necessarily the same as market value. PV-10 does not include estimated future income taxes. Unless otherwise noted, PV-10 is calculated using the pricing scheme as required by the Securities and Exchange Commission ("SEC"). PV-10 of
72
proved reserves is calculated the same as the standardized measure of discounted future net cash flows, except that the standardized measure of discounted future net cash flows includes future estimated income taxes discounted at 10% per annum. See the definition of standardized measure of discounted future net cash flows.
"Royalty" or "Royalty Interest." 1) The mineral owner's share of oil or gas production (typically between
1
/
8
and
1
/
4
), free of costs, but subject to severance taxes unless the lessor is a government. In certain circumstances, the royalty owner bears a proportionate share of the costs of making the natural gas saleable, such as processing, compression and gathering. 2) When a royalty interest is coterminous with and carved out of an operating or working interest, it is an "Overriding Royalty Interest," which also may generically be referred to as a Royalty.
"Shut-in Well." A well that is not on production, but has not yet been plugged and abandoned. Wells may be shut-in in anticipation of future utility as a producing well, plugging and abandonment or other use.
"Standardized Measure." The standardized measure of discounted future net cash flows (the "Standardized Measure") is an estimate of future net cash flows associated with proved reserves, discounted at 10% per annum. Future net cash flows is calculated by reducing future net revenues by estimated future income tax expenses and discounting at 10% per annum. The Standardized Measure and the PV-10 of proved reserves is calculated in the same exact fashion, except that the Standardized Measure includes future estimated income taxes discounted at 10% per annum. The Standardized Measure is in accordance with accounting standards generally accepted in the United States of America ("GAAP").
"SWIW." Salt water injection well.
"Undeveloped Reserves." Reserves of any category that are expected to be recovered from new wells on undrilled acreage, or from existing wells where a relatively major expenditure is required for recompletion.*
"Working Interest." The interest in the oil and gas in place which is burdened with the cost of development and operation of the property. Also called the operating interest.
"Workover." A remedial operation on a completed well to restore, maintain or improve the well's production.
______________________________________________________________________________
* This definition may be an abbreviated version of the complete definition as defined by the SEC in Rule 4-10(a) of Regulation S-X.
73
SIGNATURES
In accordance with Section 13 or 15(d) of the Securities Exchange Act of 1934, the registrant caused this report to be signed on its behalf by the undersigned, thereunto duly authorized in the City of Houston, Texas, on the date indicated.
|
|
|
Evolution Petroleum Corporation
|
||
|
|
|
By:
|
|
/s/ ROBERT S. HERLIN
Chairman of the Board and Interim Chief Executive Officer
(Principal Executive Officer)
|
|
Date: September 10, 2018
|
|
|
|
|
In accordance with the Securities Exchange Act of 1934, this report has been signed below by the following persons on behalf of the registrant and in the capacities and on the dates indicated.
|
Date
|
|
Signature
|
|
Title
|
|
|
|
|
|
|
|
September 10, 2018
|
|
/s/ ROBERT S. HERLIN
Robert S. Herlin
|
|
Chairman of the Board and Interim Chief Executive Officer
|
|
September 10, 2018
|
|
/s/ DAVID JOE
David Joe |
|
Senior Vice President, Chief Financial Officer and Treasurer (Principal Financial Officer)
|
|
September 10, 2018
|
/s/ R. STEVE HICKS
R. Steven Hicks |
Senior Vice President, Engineering and Business Development
|
||
|
September 10, 2018
|
/s/ RODERICK SCHULTZ
Roderick Schultz |
Vice President, Chief Accounting Officer (Principal Accounting Officer)
|
||
|
September 10, 2018
|
|
/s/ EDWARD J. DIPAOLO
Edward J. DiPaolo
|
|
Lead Director
|
|
September 10, 2018
|
|
/s/ WILLIAM DOZIER
William Dozier
|
|
Director
|
|
September 10, 2018
|
|
/s/ KELLY W. LOYD
Kelly W. Loyd
|
|
Director
|
|
September 10, 2018
|
|
/s/ MARRAN J. OGILVIE
Marran J. Ogilvie
|
|
Director
|
74
INDEX OF EXHIBITS
MASTER EXHIBIT INDEX
|
EXHIBIT
NUMBER
|
DESCRIPTION
|
||
|
3.1
|
|
||
|
3.2
|
|
||
|
3.3
|
|
||
|
3.4
|
|
||
|
3.5
|
|
||
|
3.6
|
|
||
|
4.1
|
|
||
|
4.2
|
|
||
|
4.3
|
|
||
|
4.4
|
|
||
|
4.5
|
|
||
|
4.6
|
|
||
|
4.7
|
|
||
|
4.8
|
|
||
|
4.9
|
|
||
|
4.1
|
|
||
|
4.11
|
|
||
|
4.12
|
|
||
|
10.1
|
|
||
|
10.2
|
|
||
|
10.3
|
|
||
|
10.4
|
|
||
|
10.5
|
|
||
|
10.6
|
|
||
|
10.7
|
|
||
|
10.8
|
|
||
|
10.9
|
|
||
75
|
EXHIBIT
NUMBER
|
DESCRIPTION
|
||
|
10.10
|
|
||
|
14.1
|
|
||
|
21.1
|
|
||
|
23.1
|
|
||
|
23.2
|
|
||
|
23.3
|
|
||
|
31.1
|
|
||
|
31.2
|
|
||
|
32.1
|
|
||
|
32.2
|
|
||
|
99.1
|
|
||
|
101.INS
|
|
XBRL Instance Document
|
|
|
101.SCH
|
|
XBRL Taxonomy Extension Schema Document
|
|
|
101.CAL
|
|
XBRL Taxonomy Extension Calculation Linkbase Document
|
|
|
101.DEF
|
|
XBRL Taxonomy Extension Definition Linkbase Document
|
|
|
101.LAB
|
|
XBRL Taxonomy Extension Label Linkbase Document
|
|
|
101.PRE
|
|
XBRL Taxonomy Extension Presentation Linkbase Document
|
|
76
TABLE OF CONTENTS
Part IItem 1. BusinessItem 2. PropertiesItem 1A. Risk FactorsItem 1B. Unresolved Staff CommentsItem 7. Management's Discussion and Analysis Of Financial Condition and Results Of OperationsItem 3. Legal ProceedingsItem 8. Financial StatementsItem 4. Mine Safety DisclosuresPart IIItem 5. Market For Registrant's Common Equity, Related Stockholder Matters and Issuer Purchases Of Equity SecuritiesItem 6. Selected Financial DataItem 7. "management's Discussion and Analysis Of Financial Condition and Results Of Operations"Item 2. "properties."Item 1. Business, Item 2. Properties, Item 8. Financial Statements - Notes To The Financial StatementsItem 7A. Quantitative and Qualitative Disclosures About Market RisksNote 1 Organization and Basis Of PreparationNote 2 Summary Of Significant Accounting PoliciesNote 3 Enduro Purchase and Sale Agreement and Related Subsequent EventsNote 4 ReceivablesNote 5 Prepaid Expenses and Other Current AssetsNote 6 Property and EquipmentNote 7 Other AssetsNote 8 Accrued Liabilities and OtherNote 9 Asset Retirement ObligationsNote 10 Stockholders' EquityNote 11 Stock-based Incentive PlanNote 12 Supplemental Disclosure Of Cash Flow InformationNote 13 Income TaxesNote 14 Net Income Per ShareNote 15 Credit AgreementsNote 16 Commitments and ContingenciesNote 17 Concentrations Of Credit RiskNote 18 Retirement PlanNote 19 DerivativesNote 20 Fair Value MeasurementNote 21 Delhi Field Litigation SettlementNote 22 RestructuringNote 23 Supplemental Disclosures About Oil and Natural Gas Producing Properties (unaudited)Note 24 Selected Quarterly Financial Data (unaudited)Item 9. Changes in and Disagreements with Accountants on Accounting and Financial DisclosureItem 9A. Controls and ProceduresItem 8. "financial Statements"Item 9B. Other InformationPart IIIItem 10. Directors, Executive Officers and Corporate GovernanceItem 11. Executive CompensationItem 12. Security Ownership Of Certain Beneficial Owners and Management and Related Stockholder MattersItem 13. Certain Relationships and Related Transactions, Director IndependenceItem 14. Principal Accountant Fees and ServicesPart IVItem 15. Exhibits and Financial Statement SchedulesItem 16. Form 10-k Summary