EPR PROPERTIES
10-Ks and 10-Qs
|
|
|
|
|
|
|
|
|
|
|
|
|
|
|
|
|
|
|
|
|
|
|
|
|
|
|
|
|
|
|
|
|
|
|
|
|
|
|
|
|
|
|
|
|
|
|
|
|
|
|
|
|
|
|
|
UNITED STATES
SECURITIES AND EXCHANGE COMMISSION
Washington, D.C. 20549
FORM 10-K
|
ý
|
ANNUAL REPORT PURSUANT TO SECTION 13 OR 15(d) OF THE SECURITIES EXCHANGE ACT OF 1934
|
For the fiscal year ended
December 31, 2016
or
|
o
|
TRANSITION REPORT PURSUANT TO SECTION 13 OR 15(d) OF THE SECURITIES EXCHANGE ACT OF 1934
|
For the transition period from
to
Commission file number: 001-13561
EPR PROPERTIES
(Exact name of registrant as specified in its charter)
|
Maryland
|
|
43-1790877
|
|
(State or other jurisdiction of
incorporation or organization)
|
|
(I.R.S. Employer
Identification No.)
|
|
909 Walnut Street, Suite 200
Kansas City, Missouri
|
|
64106
|
|
(Address of principal executive offices)
|
|
(Zip Code)
|
Registrant’s telephone number, including area code: (816) 472-1700
Securities registered pursuant to Section 12(b) of the Act:
|
Title of each class
|
|
Name of each exchange on which registered
|
|
Common shares of beneficial interest, par value $.01 per share
|
|
New York Stock Exchange
|
|
5.75% Series C cumulative convertible preferred shares of beneficial interest, par value $.01 per share
|
|
New York Stock Exchange
|
|
9.00% Series E cumulative convertible preferred shares of beneficial interest, par value $.01 per share
|
|
New York Stock Exchange
|
|
6.625% Series F cumulative redeemable preferred shares of beneficial interest, par value $.01 per share
|
|
New York Stock Exchange
|
Securities registered pursuant to Section 12(g) of the Act:
None.
Indicate by check mark if the registrant is a well-known seasoned issuer, as defined in Rule 405 of the Securities Act. Yes
ý
No
¨
Indicate by check mark if the registrant is not required to file reports pursuant to Section 13 or 15(d) of the Act. Yes
¨
No
ý
Indicate by check mark whether the registrant (1) has filed all reports required to be filed by Section 13 or 15(d) of the Securities Exchange Act of 1934 during the preceding 12 months (or for such shorter period that the registrant was required to file such reports), and (2) has been subject to such filing requirements for the past 90 days. Yes
ý
No
¨
Indicate by check mark whether the registrant has submitted electronically and posted on its corporate Web site, if any, every Interactive Data File required to be submitted and posted pursuant to Rule 405 of Regulation S-T (§232.405 of this chapter) during the preceding 12 months (or for such shorter period that the registrant was required to submit and post such files). Yes
ý
No
¨
Indicate by check mark if disclosure of delinquent filers pursuant to Item 405 of Regulation S-K (§229.405 of this chapter) is not contained herein, and will not be contained, to the best of registrant’s knowledge, in definitive proxy or information statements incorporated by reference in Part III of this Form 10-K or any amendment to this Form 10-K.
ý
Indicate by check mark whether the registrant is a large accelerated filer, an accelerated filer, a non-accelerated filer or a smaller reporting company. See the definitions of “large accelerated filer”, “accelerated filer” and “smaller reporting company” in Rule 12b-2 of the Exchange Act.
|
Large accelerated filer
|
|
ý
|
|
Accelerated filer
|
|
¨
|
|
Non-accelerated filer
|
|
¨
(Do not check if a smaller reporting company)
|
|
Smaller reporting company
|
|
¨
|
Indicate by check mark whether the registrant is a shell company (as defined in Rule 12b-2 of the Act). Yes
¨
No
ý
The aggregate market value of the common shares of beneficial interest (“common shares”) of the registrant held by non-affiliates, based on the closing price on the last business day of the registrant’s most recently completed second fiscal quarter, as reported on the New York Stock Exchange, was
$5,172,059,171
.
At
February 27, 2017
, there were
64,105,840
common shares outstanding.
DOCUMENTS INCORPORATED BY REFERENCE
Portions of the registrant’s definitive Proxy Statement for the 2017 Annual Meeting of Shareholders to be filed with the Commission pursuant to Regulation 14A are incorporated by reference in Part III of this Annual Report on Form 10-K.
CAUTIONARY STATEMENT CONCERNING FORWARD-LOOKING STATEMENTS
With the exception of historical information, certain statements contained or incorporated by reference herein may contain forward-looking statements within the meaning of Section 27A of the Securities Act of 1933, as amended (the “Securities Act”), and Section 21E of the Securities Exchange Act of 1934, as amended (the “Exchange Act”), such as those pertaining to our acquisition or disposition of properties, our capital resources, future expenditures for development projects, and our results of operations and financial condition. Forward-looking statements involve numerous risks and uncertainties and you should not rely on them as predictions of actual events. There is no assurance the events or circumstances reflected in the forward-looking statements will occur. You can identify forward-looking statements by use of words such as “will be,” “intend,” “continue,” “believe,” “may,” “expect,” “hope,” “anticipate,” “goal,” “forecast,” “pipeline,” “estimates,” “offers,” “plans,” “would,” or other similar expressions or other comparable terms or discussions of strategy, plans or intentions in this Annual Report on Form 10-K. In addition, references to our budgeted amounts and guidance are forward-looking statements.
Factors that could materially and adversely affect us include, but are not limited to, the factors listed below:
|
•
|
The proposed transaction with CNL Lifestyle Properties, Inc. presents certain risks to our business, financial condition, results of operations and cash flows;
|
|
•
|
Global economic uncertainty and disruptions in financial markets;
|
|
•
|
Reduction in discretionary spending by consumers;
|
|
•
|
Adverse changes in our credit ratings;
|
|
•
|
Fluctuations in interest rates;
|
|
•
|
The duration or outcome of litigation, or other factors outside of litigation such as project financing, relating to our significant investment in a planned casino and resort development which may cause the development to be indefinitely delayed or cancelled;
|
|
•
|
Unsuccessful development, operation, financing or compliance with licensing requirements of the planned casino and resort development by the third-party lessee;
|
|
•
|
Risks related to overruns for the construction of common infrastructure at our planned casino and resort development for which we would be responsible;
|
|
•
|
Defaults in the performance of lease terms by our tenants;
|
|
•
|
Defaults by our customers and counterparties on their obligations owed to us;
|
|
•
|
A borrower's bankruptcy or default;
|
|
•
|
Our ability to renew maturing leases with theatre tenants on terms comparable to prior leases and/or our ability to lease any re-claimed space from some of our larger theatres at economically favorable terms;
|
|
•
|
Risks of operating in the entertainment industry;
|
|
•
|
Our ability to compete effectively;
|
|
•
|
Risks associated with a single tenant representing a substantial portion of our lease revenues;
|
|
•
|
The ability of our public charter school tenants to comply with their charters and continue to receive funding from local, state and federal governments, the approval by applicable governing authorities of substitute operators to assume control of any failed public charter schools and our ability to negotiate the terms of new leases with such substitute tenants on acceptable terms, and our ability to complete collateral substitutions as applicable;
|
|
•
|
Risks relating to our tenants' exercise of purchase options or borrowers' exercise of prepayment options related to our education properties;
|
|
•
|
Risks associated with use of leverage to acquire properties;
|
|
•
|
Financing arrangements that require lump-sum payments;
|
|
•
|
Our ability to raise capital;
|
|
•
|
Covenants in our debt instruments that limit our ability to take certain actions;
|
|
•
|
The concentration and lack of diversification of our investment portfolio;
|
|
•
|
Our continued qualification as a real estate investment trust for U.S. federal income tax purposes;
|
|
•
|
The ability of our subsidiaries to satisfy their obligations;
|
|
•
|
Financing arrangements that expose us to funding or purchase risks;
|
|
•
|
Our reliance on a limited number of employees, the loss of which could harm operations;
|
|
•
|
Risks associated with security breaches and other disruptions;
|
i
|
•
|
Changes in accounting standards that may adversely affect our financial statements;
|
|
•
|
Fluctuations in the value of real estate income and investments;
|
|
•
|
Risks relating to real estate ownership, leasing and development, including local conditions such as an oversupply of space or a reduction in demand for real estate in the area, competition from other available space, whether tenants and users such as customers of our tenants consider a property attractive, changes in real estate taxes and other expenses, changes in market rental rates, the timing and costs associated with property improvements and rentals, changes in taxation or zoning laws or other governmental regulation, whether we are able to pass some or all of any increased operating costs through to tenants, and how well we manage our properties;
|
|
•
|
Our ability to secure adequate insurance and risk of potential uninsured losses, including from natural disasters;
|
|
•
|
Risks involved in joint ventures;
|
|
•
|
Risks in leasing multi-tenant properties;
|
|
•
|
A failure to comply with the Americans with Disabilities Act or other laws;
|
|
•
|
Risks of environmental liability;
|
|
•
|
Risks associated with the relatively illiquid nature of our real estate investments;
|
|
•
|
Risks with owning assets in foreign countries;
|
|
•
|
Risks associated with owning, operating or financing properties for which the tenants', mortgagors' or our operations may be impacted by weather conditions and climate change;
|
|
•
|
Risks associated with the development, redevelopment and expansion of properties and the acquisition of other real estate related companies;
|
|
•
|
Our ability to pay dividends in cash or at current rates;
|
|
•
|
Fluctuations in the market prices for our shares;
|
|
•
|
Certain limits on changes in control imposed under law and by our Declaration of Trust and Bylaws;
|
|
•
|
Policy changes obtained without the approval of our shareholders;
|
|
•
|
Equity issuances that could dilute the value of our shares;
|
|
•
|
Future offerings of debt or equity securities, which may rank senior to our common shares;
|
|
•
|
Risks associated with changes in the Canadian exchange rate; and
|
|
•
|
Changes in laws and regulations, including tax laws and regulations.
|
Our forward-looking statements represent our intentions, plans, expectations and beliefs and are subject to numerous assumptions, risks and uncertainties. Many of the factors that will determine these items are beyond our ability to control or predict. For further discussion of these factors see Item 1A - "Risk Factors" in this Annual Report on Form 10-K.
For these statements, we claim the protection of the safe harbor for forward-looking statements contained in the Private Securities Litigation Reform Act of 1995. You are cautioned not to place undue reliance on our forward-looking statements, which speak only as of the date of this Annual Report on Form 10-K or the date of any document incorporated by reference herein. All subsequent written and oral forward-looking statements attributable to us or any person acting on our behalf are expressly qualified in their entirety by the cautionary statements contained or referred to in this section. Except as required by law, we do not undertake any obligation to release publicly any revisions to our forward-looking statements to reflect events or circumstances after the date of this Annual Report on Form 10-K.
ii
TABLE OF CONTENTS
|
|
|
Page
|
||
|
Item 1.
|
||||
|
Item 1A.
|
||||
|
Item 1B.
|
||||
|
Item 2.
|
||||
|
Item 3.
|
||||
|
Item 4.
|
||||
|
Item 5.
|
||||
|
Item 6.
|
||||
|
Item 7.
|
||||
|
Item 7A.
|
||||
|
Item 8.
|
||||
|
Item 9.
|
||||
|
Item 9A.
|
||||
|
Item 9B.
|
||||
|
Item 10.
|
||||
|
Item 11.
|
||||
|
Item 12.
|
||||
|
Item 13.
|
||||
|
Item 14.
|
||||
|
Item 15.
|
||||
|
Item 16.
|
||||
iii
General
EPR Properties (“we,” “us,” “our,” “EPR” or the “Company”) was formed on August 22, 1997 as a Maryland real estate investment trust (“REIT”), and an initial public offering of our common shares of beneficial interest (“common shares”) was completed on November 18, 1997. Since that time, the Company has grown into a leading specialty REIT with an investment portfolio that includes primarily entertainment, education and recreation properties. The underwriting of our investments is centered on key industry and property cash flow criteria. As further explained under “Growth Strategies” below, our investments are also guided by a focus on inflection opportunities that are associated with or support enduring uses, excellent executions, attractive economics and an advantageous market position.
We are a self-administered REIT. As of
December 31, 2016
, our total assets were approximately
$4.9 billion
(after accumulated depreciation of approximately
$0.6 billion
). Our investments are generally structured as long-term triple-net leases that require the tenants to pay substantially all expenses associated with the operation and maintenance of the property, or as long-term mortgages with economics similar to our triple-net lease structure.
Our total investments (a non-GAAP financial measure) were approximately $5.3 billion at
December 31, 2016
. See "Non-GAAP Financial Measures" for the calculation of total investments and reconciliation of total investments to "Total assets" in the consolidated balance sheet at
December 31, 2016 and 2015
. For financial reporting purposes, we group our investments into four reportable operating segments: Entertainment, Education, Recreation and Other. Our total investments at
December 31, 2016
consisted of interests in the following:
|
•
|
$2.7 billion
or 50% related to entertainment properties, which includes megaplex theatres, entertainment retail centers (centers typically anchored by an entertainment component such as a megaplex theatre and containing other entertainment-related or retail properties), family entertainment centers and other retail parcels;
|
|
•
|
$1.3 billion
or 25% related to education properties, which consists of investments in public charter schools, early education centers and K-12 private schools;
|
|
•
|
$1.1 billion
or 22% related to recreation properties, which includes ski areas, waterparks, golf entertainment complexes and other recreation; and
|
|
•
|
$178.2 million
or 3% related to other properties, which consists of the Adelaar casino and resort project in Sullivan County, New York (excluding $9.7 million related to the Adelaar indoor waterpark project included in recreation).
|
We believe entertainment, education and recreation are highly enduring sectors of the real estate industry and that, as a result of our focus on properties in these sectors, industry relationships and the knowledge of our management, we have a competitive advantage in providing capital to operators of these types of properties. We believe this focused niche approach offers the potential for higher growth and better yields.
We believe our management’s knowledge and industry relationships have facilitated favorable opportunities for us to acquire, finance and lease properties. Historically, our primary challenges have been locating suitable properties, negotiating favorable lease or financing terms, and managing our real estate portfolio as we have continued to grow. We are particularly focused on property categories which allow us to use our experience to mitigate some of the risks inherent in the current economic environment. We cannot provide any assurance that any such potential investment or acquisition opportunities will arise in the near future, or that we will actively pursue any such opportunities.
Although we are primarily a long-term investor, we may also sell assets if we believe that it is in the best interest of our shareholders.
1
Entertainment
As of
December 31, 2016
, our Entertainment segment consisted of investments in megaplex theatres, entertainment retail centers, family entertainment centers and other retail parcels totaling approximately
$2.7 billion
with interests in:
|
•
|
141
megaplex theatres located in 34 states;
|
|
•
|
eight
enterta
inment retail centers (which includ
e
eight
a
dditional megaplex theatres) located in Colorado, New York, California, Virginia, and Ontario, Canada;
|
|
•
|
eight
fa
mily entertainment centers located in Georgia, Illinois, Indiana and Florida;
|
|
•
|
land parcels leased to restaurant and retail operators adjacent to several of our theatre properties;
|
|
•
|
$87.7 million in construction in progress primarily for real estate development and redevelopment of megaplex theatres as well as other retail redevelopment projects; and
|
|
•
|
$4.5 million in undeveloped land inventory.
|
As of
December 31, 2016
, our owned real estate portfolio of megaplex theatres consisted of approximately 10.6 million square feet and was
100%
leased and our remaining owned entertainment real estate portfolio consisted of 1.9 million square feet and was 95% leased. The combined owned entertainment real estate portfolio consisted of
12.5 million
square feet and was
99%
leased. Our owned theatre properties are leased to 15 different leading theatre operators. A significant portion of our total revenue was derived from rental payments by American Multi-Cinema, Inc. ("AMC"). On December 21, 2016, AMC announced that it closed its acquisition of Carmike Cinemas Inc. ("Carmike"). For the year ended December 31, 2016, approximately
$90.0 million
or
18.2%
of the Company's total revenues were derived from rental payments by AMC and approximately
$21.7 million
or
4.4%
of the Company's total revenues were derived from rental payments by Carmike.
A significant portion of our entertainment assets consist of modern megaplex theatres. The modern megaplex theatre provides a significantly enhanced audio and visual experience for the patrons versus other formats. A significant trend currently exists among national and local exhibitors to further enhance the customer experience. These enhancements include reserved, luxury seating and expanded food and beverage offerings, including the addition of alcohol and more efficient point of sale systems. The evolution of the theatre industry over the last 20 years from the sloped floor theatre to the megaplex stadium theatre to the expanded amenity theatre has demonstrated that exhibitors and their landlords are willing to make investments in their theatres to take the customer experience to the next level.
As exhibitors improve the customer experience with more spacious and comfortable seating options, they are required to make physical changes to the existing seating configurations that typically result in a significant loss of existing seats. It was once a concern that such seat loss would be a negative to theatres that thrive on opening weekend business of new movie releases; however, customers have responded favorably to these changes. Exhibitors are learning that enhanced amenities are changing the patrons’ movie-going habits resulting in significantly increased seat utilization and increased food and beverage revenue.
As exhibitors pursue the renovation of theatres with enhanced amenities, we are working with our tenants generally toward the end of their primary lease terms to extend the terms of their leases beyond the initial option periods, finance improvements where applicable and to recapture land where seat count reductions alleviate parking requirements. In conjunction with these changes, we may also make changes to the rental rates to better reflect the existing market demands and additional capital invested. In addition to positioning expiring theatre assets for continued success, the renovation of these assets creates an opportunity to diversify the Company's tenant base into other entertainment or retail uses adjacent to a movie theatre.
The theatre box office had another record year in 2016 with revenues of approximately $11.4 billion per Box Office Mojo, an increase of over 2% versus the prior year. We expect the development of new megaplex theatres and the conversion or partial conversion of existing theatres to enhanced amenity formats to continue in the United States and abroad over the long-term. As a result of the significant capital commitment involved in building new megaplex theatres
2
and redeveloping existing theatres, as well as the experience and industry relationships of our management, we believe we will continue to have opportunities to provide capital to exhibition businesses in the future.
We also continue to seek opportunities for the development of additional restaurant, retail and other entertainment venues around our existing portfolio. The opportunity to capitalize on the traffic generation of our market-dominant theatres to create entertainment retail centers (“ERCs”) not only strengthens the execution of the megaplex theatre but adds diversity to our tenant and asset base. We have and will continue to evaluate our existing portfolio for additional development of retail and entertainment density, and we will also continue to evaluate the purchase or financing of existing ERCs that have demonstrated strong financial performance and meet our quality standards. The leasing and property management requirements of our ERCs are generally met through the use of third-party professional service providers.
Our family entertainment center operators offer a variety of entertainment options including bowling, bocce ball, and karting as well as an observation deck on the 94th floor of the John Hancock building in downtown Chicago, Illinois.
We will continue to seek opportunities for the development of, or acquisition of, other entertainment related properties that leverage our expertise in this area.
Education
As of
December 31, 2016
, our Education segment consisted of investments in public charter schools, early education centers and K-12 private schools totaling approximately
$1.3 billion
with interests in:
|
•
|
67
public charter schools located in 19 states and the District of Columbia;
|
|
•
|
41
early education centers located in 15 states;
|
|
•
|
12
private schools located in eight states; and
|
|
•
|
$105.4 million in construction in progress for real estate development or expansions of public charter schools, early education centers and private schools.
|
As of
December 31, 2016
, our owned education real estate portfolio consisted of approximately
4.3 million
square feet and was
100%
leased. We have
45
different operators for our owned public charter schools.
Public charter schools are tuition-free, independent schools that are publicly funded by local, state and federal tax dollars based on enrollment. Driven by the need to improve the quality of public education and provide more school choices in the U.S., public charter schools are one of the fastest growing segments of the multi-billion dollar educational facilities sector, and we believe a critical need exists for the financing of new and refurbished educational facilities. To meet this need, we have established relationships with public charter school operators, authorizers and developers across the country and expect to continue to develop our leadership position in providing real estate financing in this area. Public charter schools are operated pursuant to charters granted by various state or other regulatory authorities and are dependent upon funding from local, state and federal tax dollars. Like public schools, public charter schools are required to meet both state and federal academic standards.
Various government bodies that provide educational funding have pressure to reduce their spending budgets and have reduced educational funding in some cases and may continue to reduce educational funding in the future. This can impact our tenants' operations and potentially their ability to pay our scheduled rent. However, these reductions differ state by state and have historically been more significant at the post-secondary education level than at the K-12 level that our tenants serve. Furthermore, while there can be no assurance as to the level of these cuts, we analyze each state's fiscal situation and commitment to the charter school movement before providing financing in a new state, and also factor in anticipated reductions (as applicable) in the states in which we do decide to do business.
As with public charter schools, the Company's expansion into both early childhood education centers and private schools is supported by strong unmet demand, and we expect to increase our investment in both of these areas.
3
Early childhood education centers continue to see demand due to the proliferation of dual income families and the increasing emphasis on early childhood education, beyond traditional daycare. There is increased demand for curriculum-based, child-centered learning. Within this property type, larger centers with more amenities are emerging and enjoying enhanced economies of scale. We believe this property type is a logical extension of our education platform and allows us to increase our diversity and geographical reach with these assets.
Within private schools, we believe K-12 private education has significant growth potential for schools that have differentiated, high quality offerings. Many private schools in large urban and suburban areas are at capacity and have large waiting lists making admission more difficult. The demand for nonsectarian private education has increased in recent years as parents and students become more focused on the comprehensive impact of a strong school environment.
We will continue to seek opportunities for the development of, or acquisition of, other education related properties that leverage our expertise in this area.
Many of our education lease and mortgage agreements contain purchase or prepayment options whereby the tenant or borrower can acquire the property or prepay the mortgage loan for a premium over the total development cost at certain points during the terms of the agreements. If these properties meet certain criteria, the tenants may be able to obtain bond or other financing at lower rates and therefore be motivated to exercise these options. We do not anticipate that all of these options will be exercised but cannot determine at this time the amount or timing of such option exercises. In accordance with GAAP, prepayment penalties related to mortgage agreements are included in mortgage and other financing income and are included in FFO as adjusted (See Item 7 – “Management’s Discussion and Analysis of Financial Condition and Results of Operations - Funds From Operations” for a discussion of FFO and FFO as adjusted, which are non-GAAP measures). However, if a tenant exercises the option to purchase a property under lease, GAAP requires that a gain on sale be recognized for the amount of cash received over the carrying value of the property and gains on sale are typically excluded from FFO as adjusted. Accordingly, for consistency in presentation and with the wording and intent of the lease provisions, we treat the premium over the total development cost (i.e. the undepreciated cost) as a termination fee and include such fees in FFO as adjusted, and only the difference between the total development cost and the carrying value is treated as gain on sale and excluded from FFO as adjusted.
During the year ended December 31, 2016, we received prepayment of $19.3 million on one mortgage note receivable that was secured by a public charter school located in Washington D.C. and we received a prepayment fee of $3.6 million. In addition, pursuant to tenant purchase options, we completed the sale of two public charter schools located in Colorado for net proceeds totaling $16.6 million. In connection with these sales, we recognized gains on sale of $2.8 million. In December 2016, we also extended the tenant purchase option for a public charter school located in Arizona. In connection with this extension, we received a fee of $1.6 million, which is included in Other income in the accompanying consolidated statements of income for the year ended December 31, 2016 in this Annual Report on Form 10-K.
As of
December 31, 2016
, the number of education properties potentially impacted by option exercises, the total development cost and the total estimated amount of the prepayment penalties or lease termination fees in the first option period by year are as follows (dollars in thousands):
|
Year Option First Exercisable
|
Number of Education Properties
|
Total Development Cost
|
Total Estimated Termination Fees/Prepayment Penalties in First Option Period
|
||||||||
|
2017
|
7
|
$
|
71,050
|
|
$
|
16,145
|
|
||||
|
2018
|
10
|
96,914
|
|
17,309
|
|
||||||
|
2019
|
12
|
131,894
|
|
22,906
|
|
||||||
|
2020
|
9
|
71,101
|
|
12,830
|
|
||||||
|
2021
|
10
|
88,362
|
|
15,605
|
|
||||||
|
Thereafter
|
5
|
158,386
|
|
22,357
|
|
||||||
4
Recreation
As of
December 31, 2016
, our Recreation segment consisted of investments in ski areas, waterparks, golf entertainment complexes and other recreation totaling approximately
$1.1 billion
with interests in:
|
•
|
11
ski areas located in Ohio, Maryland, New York, Pennsylvania, Vermont and Virginia;
|
|
•
|
five
waterparks located in Kansas, Texas and Pennsylvania;
|
|
•
|
25
golf entertainment complexes in 14 states; and
|
|
•
|
$98.4 million in construction in progress for golf entertainment complexes, the development of an indoor waterpark hotel at the Adelaar casino and resort project located in Sullivan County, New York and a waterpark located in North Carolina.
|
As of
December 31, 2016
, our owned recreation real estate portfolio was
100%
leased. Our ski areas are leased to, or we have mortgages receivable from, four different operators.
Our daily attendance ski parks provide a sustainable advantage for the value conscious consumer, providing outdoor entertainment during the winter. All of the ski areas that serve as collateral for our mortgage notes in this area, as well as our three owned properties, offer snowmaking capabilities and provide a variety of terrains and vertical drop options. We believe that the primary appeal of our ski areas lies in the convenient, low cost and reliable experience consumers can expect. Given that all of our ski areas are located near major metropolitan areas, they offer skiing and snowboarding without the expense, travel, or lengthy preparations of remote ski resorts. Furthermore, advanced snowmaking capabilities increase the reliability of the experience versus other ski areas that do not have such capabilities. We expect to continue to pursue opportunities in this area.
Our three waterparks located in Kansas and Texas offer innovative attractions that draw a diverse segment of customers. These waterparks serve as collateral for our mortgage notes and are operated by Schlitterbahn Waterparks and Resorts, an industry leader. Our other two waterparks, located in Pennsylvania, are leased to the operator of Camelback Mountain Ski Resort and include an indoor waterpark hotel and an outdoor waterpark as well as an adventure park. We also have an indoor waterpark hotel in process at the Adelaar project in Sullivan County, New York, for which we have committed to fund approximately $155.0 million over the next three years. As many waterparks are growing from single-day attendance to a destination getaway, we believe indoor waterpark hotels increase the four-season appeal at many resorts. We expect to continue to pursue opportunities in this area.
Our golf entertainment complexes are leased to, or under mortgage with, Topgolf, which combines golf with entertainment, competition and food and beverage service. By combining an interactive entertainment and food and beverage experience with a long-lived recreational activity, we believe Topgolf provides an innovative, enjoyable and repeatable customer experience. We expect to continue to pursue opportunities related to golf entertainment complexes.
On November 2, 2016, the Company and Ski Resort Holdings LLC ("SRH"), an entity owned by funds affiliated with Och-Ziff Real Estate, entered into a definitive Purchase and Sale Agreement with CNL Lifestyle Properties, Inc. ("CNL") and certain of its affiliates. The agreement provides for our acquisition of the Northstar California Ski Resort, 15 attraction properties (waterparks and amusement parks) and five small family entertainment centers for aggregate consideration valued at approximately $456.0 million. Additionally, we have agreed to provide approximately $244.0 million of five year secured debt financing to SRH for the purchase of 14 CNL ski properties valued at approximately $374.0 million. Our aggregate investment in this transaction is projected to be valued at approximately $700.0 million and is expected to be funded with approximately $647.0 million of EPR common shares and $53.0 million of cash before prorations, transaction costs and closing adjustments, a portion of which is expected to be included in the secured debt financing to SRH. Additionally, we have also agreed to fund 65% of pre-approved, future property improvements with such advances capped at $52.0 million. All SRH financing will bear interest at 8.5%. For further information on this transaction, see Item 7 - "Management's Discussion and Analysis of Financial Condition and Results of Operations - Recent Developments".
5
We will continue to seek opportunities for the development of, or acquisition of, other recreation related properties that leverage our expertise in this area.
Other
As of
December 31, 2016
, our Other segment consisted primarily of land under ground lease, property under development and land held for development totaling approximately
$178.2 million
related to the Adelaar casino and resort project in Sullivan County, New York.
Business Objectives and Strategies
Our vision is to become the leading specialty REIT by focusing our unique knowledge and resources on select underserved real estate segments which provide the potential for outsized returns.
Our long-term primary business objective is to enhance shareholder value by achieving predictable and increasing Funds From Operations (“FFO”) and dividends per share (See Item 7 – “Management’s Discussion and Analysis of Financial Condition and Results of Operations - Funds From Operations” for a discussion of FFO, which is a non-GAAP measure). Our prevailing strategy is to focus on long-term investments in a limited number of categories in which we maintain a depth of knowledge and relationships, and which we believe offer sustained performance throughout all economic cycles. We intend to achieve this objective by continuing to execute the Growth Strategies, Operating Strategies and Capitalization Strategies described below.
Growth Strategies
Central to our growth is remaining focused on acquiring or developing properties in our primary investment segments: Entertainment, Education and Recreation. We may also pursue opportunities to provide mortgage financing for these investment segments in certain situations where this structure is more advantageous than owning the underlying real estate.
Our segment focus is consistent with our strategic organizational design which is structured around building centers of knowledge and strong operating competencies in each of our primary segments. Retention and building of this knowledge depth creates a competitive advantage allowing us to more quickly identify key market trends.
To this end, we will deliberately apply information and our ingenuity to identify properties which represent potential logical extensions within each of our segments, or potential future investment segments. As part of our strategic planning and portfolio management process we assess new opportunities against the following five key underwriting principles:
Inflection Opportunity
|
•
|
Specialty versus commodity real estate
|
|
•
|
New or emerging generation of real estate as a result of age, technology or change in consumer lifestyle or habits
|
Enduring Value
|
•
|
Underlying activity long-lived
|
|
•
|
Real estate that supports commercially successful activities
|
|
•
|
Outlook for business stable or growing
|
Excellent Execution
|
•
|
Best-of-class executions that create market-dominant properties
|
|
•
|
Sustainable customer demand within the category despite a potential change in tenancy
|
|
•
|
Tenants with a reliable track record of customer service and satisfaction
|
Attractive Economics
|
•
|
Initially accretive with escalating yield over time
|
6
|
•
|
Rent participation features which allow for participation in financial performance
|
|
•
|
Scalable depth of opportunity
|
|
•
|
Strong, stable rent coverage and the potential for cross default features
|
Advantageous Position
|
•
|
First mover advantage and/or dominant player in real estate ownership or financing
|
|
•
|
Preferred tenant or borrower relationship that provides access to sites and development projects
|
|
•
|
Data available to assess and monitor performance
|
Operating Strategies
Lease Risk Minimization
To avoid initial lease-up risks and produce a predictable income stream, we typically acquire or develop single-tenant properties that are leased under long-term leases. We believe our willingness to make long-term investments in properties offers our tenants financial flexibility and allows tenants to allocate capital to their core businesses. Although we will continue to emphasize single-tenant properties, we have acquired or developed, and may continue to acquire or develop, multi-tenant properties we believe add shareholder value.
Lease Structure
We have structured our leasing arrangements to achieve a positive spread between our cost of capital and the rents paid by our tenants. We typically structure leases on a triple-net basis under which the tenants bear the principal portion of the financial and operational responsibility for the properties. During each lease term and any renewal periods, the leases typically provide for periodic increases in rent and/or percentage rent based upon a percentage of the tenant’s gross sales over a pre-determined level. In our multi-tenant property leases and some of our theatre leases, we generally require the tenant to pay a common area maintenance (“CAM”) charge to defray its pro rata share of insurance, taxes and maintenance costs.
Mortgage Structure
We have structured our mortgages to achieve economics similar to our triple-net lease structure with a positive spread between our cost of capital and the interest paid by our tenants. During each mortgage term and any renewal periods, the notes typically provide for periodic increases in interest and/or participating features based upon a percentage of the tenant’s gross sales over a pre-determined level.
Development and Redevelopment
We intend to continue developing properties and redeveloping existing properties that meet our guiding principles. We generally do not begin development of a single-tenant property without a signed lease providing for rental payments during the development period that are commensurate with our level of capital investment. In the case of a multi-tenant development, we generally require a significant amount of the development to be pre-leased prior to construction to minimize lease-up risks. In addition, to minimize overhead costs and to provide the greatest amount of flexibility, we generally outsource construction management to third-party firms.
We believe our build-to-suit development program is a competitive advantage. First, we believe our strong relationships with our tenants and developers drive new investment opportunities that are often exclusive to us, rather than bid broadly, and with our deep knowledge of their businesses, we believe we are a value-added partner in the underwriting of each new investment. Second, we offer financing from start to finish for a build-to-suit project such that there is no need for a tenant to seek separate construction and permanent financing, which we believe makes us a more attractive partner. Third, we are actively developing strong relationships with tenants in our select segments leading to multiple investments without strict investment portfolio allocations. Finally, multiple investments with the same tenant allows us in most cases to include cross-default provisions in our lease or financing contracts, meaning a default in an obligation to us at one location is a default under all obligations with that tenant.
We will also investigate opportunities to redevelop certain of our existing properties. We may redevelop properties in conjunction with a lease renewal or new tenant, or we may redevelop properties that have more earnings potential due
7
to the redevelopment. Additionally, certain of our properties have excess land where we will proactively seek opportunities to further develop.
Tenant and Customer Relationships
We intend to continue developing and maintaining long-term working relationships with entertainment, education, recreation and other specialty business operators and developers by providing capital for multiple properties on an international, national or regional basis, thereby creating efficiency and value for both the operators and the Company.
Portfolio Diversification
We will endeavor to further diversify our asset base by property type, geographic location and tenant or customer. In pursuing this diversification strategy, we will target entertainment, education, recreation and other specialty business operators that we view as leaders in their market segments and have the ability to compete effectively and perform under their agreements with the Company.
Dispositions
We will consider property dispositions for reasons such as creating price awareness of a certain property type, opportunistically taking advantage of an above market offer or reducing exposure related to a certain tenant, property type or geographic area.
Capitalization Strategies
Debt and Equity Financing
Our ratio of net debt to adjusted EBITDA, a non-GAAP measure (see "Non-GAAP Financial Measures" for definitions and reconciliations), is our primary measure to evaluate our capital structure and the magnitude of our debt against our operating performance. In prior periods, we primarily utilized the ratio of debt to gross assets, but we believe this metric is less commonly used by investors and lenders than net debt to adjusted EBITDA and is therefore less meaningful to them in performing their evaluations. We expect to maintain our net debt to adjusted EBITDA ratio between 4.6x to 5.6x. See Item 7 – “Management’s Discussion and Analysis of Financial Condition and Results of Operations - Liquidity and Capital Resources” for a further discussion of this ratio.
We rely primarily on an unsecured debt structure and expect to continue to pay off our existing secured debt. In the future, while we may obtain secured debt from time to time or assume secured debt financing obligations in acquisitions, we intend to issue primarily unsecured debt securities to satisfy our debt financing needs. We believe this strategy increases our access to capital and permits us to more efficiently match available debt and equity financing to our ongoing capital requirements.
Our sources of equity financing consist of the issuance of common shares as well as the issuance of preferred shares (including convertible preferred shares). In addition to larger underwritten registered public offerings of both common and preferred shares, we have also offered shares pursuant to registered public offerings through the direct share purchase component of our Dividend Reinvestment and Direct Share Purchase Plan (“DSP Plan”). While such offerings are generally smaller than a typical underwritten public offering, issuing common shares under the direct share purchase component of our DSP Plan allows us to access capital on a more frequent basis in a cost-effective manner. We expect to opportunistically access the equity markets in the future and, depending primarily on the size and timing of our equity capital needs, may continue to issue shares under the direct share purchase component of our DSP Plan. Furthermore, we may issue shares in connection with acquisitions in the future. See Item 7 - "Management's Discussion and Analysis of Financial Condition and Results of Operations - Recent Developments" for a discussion of our proposed transaction with CNL.
Joint Ventures
We will examine and may pursue potential additional joint venture opportunities with institutional investors or developers if the investments to which they relate meet our guiding principles discussed above. We may employ higher leverage in joint ventures.
8
Payment of Regular Dividends
We began paying dividend distributions to our common shareholders on a monthly basis (as opposed to a quarterly basis) in the second quarter of 2013 and expect to continue to do so in the future. We expect to continue to pay dividend distributions to our preferred shareholders on a quarterly basis. Our Series C cumulative convertible preferred shares (“Series C preferred shares”) have a dividend rate of 5.75%, our Series E cumulative convertible preferred shares (“Series E preferred shares”) have a dividend rate of 9.00% and our Series F cumulative redeemable preferred shares ("Series F preferred shares") have a dividend rate of 6.625%. Among the factors the Company’s board of trustees (“Board of Trustees”) considers in setting the common share dividend rate are the applicable REIT tax rules and regulations that apply to dividends, the Company’s results of operations, including FFO and FFO as adjusted per share, and the Company’s Cash Available for Distribution (defined as net cash flow available for distribution after payment of operating expenses, debt service, preferred dividends and other obligations).
Competition
We compete for real estate financing opportunities with other companies that invest in real estate, as well as traditional financial sources such as banks and insurance companies. REITs have financed, and may continue to seek to finance, entertainment, education, recreation and other specialty properties as new properties are developed or become available for acquisition.
Employees
As of
December 31, 2016
, we had 57 full-time employees.
Principal Executive Offices
The Company’s principal executive offices are located at 909 Walnut Street, Suite 200, Kansas City, Missouri 64106; telephone (816) 472-1700.
Materials Available on Our Website
Our internet website address is www.eprkc.com. We make available, free of charge, through our website copies of our Annual Report on Form 10-K, Quarterly Reports on Form 10-Q, Current Reports on Form 8-K, and amendments to those reports filed or furnished pursuant to Section 13(a) or 15(d) of the Exchange Act as soon as reasonably practicable after we electronically file such material with, or furnish it to, the Securities and Exchange Commission (the “Commission” or “SEC”). You may also view our Code of Business Conduct and Ethics, Company Governance Guidelines, Independence Standards for Trustees and the charters of our Audit, Nominating/Company Governance, Finance and Compensation and Human Capital Committees on our website. Copies of these documents are also available in print to any person who requests them. We do not intend for information contained in our website to be part of this Annual Report on Form 10-K.
There are many risks and uncertainties that can affect our current or future business, operating results, financial performance or share price. The following discussion describes important factors which could adversely affect our current or future business, operating results, financial condition or share price. This discussion includes a number of forward-looking statements. See “Cautionary Statement Concerning Forward-Looking Statements.”
Risks That May Impact Our Financial Condition or Performance
The proposed transaction with CNL presents certain risks to our business, financial condition, results of operations and cash flows.
On November 2, 2016, the Company and SRH, an entity owned by funds affiliated with Och-Ziff Real Estate, entered into a Purchase and Sale Agreement with CNL, CLP Partners, LP, CNL's operating partnership, and certain CNL subsidiaries. The agreement provides for our acquisition of the Northstar California Ski Resort, 15 attraction properties
9
(waterparks and amusement parks) and five small family entertainment centers for aggregate consideration valued at approximately $456.0 million. Additionally, we have agreed to provide approximately $244.0 million of five-year secured debt financing to SRH for the purchase of 14 CNL properties valued at approximately $374.0 million, including 14 ski and mountain lifestyle assets located in the United States and Canada. Our aggregate investment in this transaction is projected to be valued at approximately $700.0 million and is expected to be funded with approximately $647.0 million of our common shares (subject to a collar mechanism described below) and $53.0 million of cash before pro-rations, transaction costs and closing adjustments, a portion of which is expected to be included in the secured debt financing to SRH. The transaction is subject to customary closing conditions, including the approval of the transaction by stockholders holding a majority of the outstanding shares of common stock of CNL and various third party consents and governmental permits. It is anticipated that this transaction will close in early second quarter of 2017; however, there can be no assurances as to the actual closing or the timing of the closing.
Prior to closing, the transaction may present certain risks to our business, financial condition, results of operations and cash flows, including among other things, that:
|
•
|
if the transaction does not occur, we may incur significant payment obligations to CNL in certain circumstances,
|
|
•
|
failure to complete the transaction could negatively impact the market value of our common shares, preferred shares and debt securities, and our future business, financial condition, results of operations, cash flows and prospects, and could cause securities and industry analysts and others who follow our Company to lower their expectations regarding our future performance and prospects,
|
|
•
|
CNL may not obtain stockholder approval or other closing conditions may not be satisfied or waived, or such stockholder approval or the satisfaction or waiver of such other closing conditions may be delayed,
|
|
•
|
consummation of the transaction may result in a substantial diversion of time and resources of both our management and other employees and may limit the time available to them to focus on other aspects of our business, including, without limitation, identifying other investments, acquisitions and strategic opportunities,
|
|
•
|
due to covenants in the Purchase and Sale Agreement, we may be unable to pursue certain strategic transactions or financing transactions or pursue other actions that we might consider beneficial,
|
|
•
|
we have incurred substantial expenses and expect to incur additional substantial expenses related to the transaction, including legal, accounting, financial advisory, filing, printing and mailing expenses, and
|
|
•
|
our common share consideration for the transaction is subject to a two-way collar between the average of our common share prices (calculated using a 10-day volume weighted average price) (the "Average EPR Share Price") of $68.25 and $82.63. If our common share price increases between the signing of the Purchase and Sale Agreement and the closing, CNL will receive fewer shares until the Average EPR Share Price reaches $82.63, at which point the number of shares will be fixed at approximately 7.8 million. Conversely, if our common share price decreases between signing of the Purchase and Sale Agreement and closing, CNL will receive more shares until the Average EPR Share Price reaches $68.25, at which point the number of shares will be fixed at approximately 9.5 million. Post transaction, CNL will be issued between approximately 11% and 13% of our pro forma common shares outstanding before distributing the shares to the CNL stockholders (based upon our issued and outstanding common shares as of December 31, 2016). A change in share price between the date of signing and the closing may significantly impact the number of our common shares to be issued in the transaction.
|
In addition, if the CNL transaction closes, we will face certain additional risks to our business, financial condition, results of operations and cash flows, including among other things, that:
10
|
•
|
we may encounter difficulties and incur substantial expenses in integrating the acquired properties into our operations and systems and, in any event, the integration may require a substantial amount of time on the part of both our management and employees and therefore divert their attention from other aspects of our business,
|
|
•
|
CNL will distribute our common shares to CNL's stockholders who are expected to own between 11% and 13% of our issued and outstanding common shares after the transaction (based upon our issued and outstanding common shares as of December 31, 2016), and they may decide to sell those common shares, which could result in additional pressure on the price of our common shares,
|
|
•
|
our future business, financial condition, results of operations and cash flow will suffer if we do not effectively manage our expanded portfolio,
|
|
•
|
the market price of our common shares, preferred shares and debt securities may decline, particularly if we do not achieve the perceived benefits of the transaction as rapidly or to the extent anticipated by securities or industry analysts or if the effect of the transaction on our financial condition, results of operations and cash flows is not consistent with the expectations of these analysts,
|
|
•
|
we may incur unanticipated capital expenditures in order to maintain or improve the properties acquired in the transaction,
|
|
•
|
we may encounter difficulties in managing a substantially larger and more complex portfolio of recreation properties in new geographic areas,
|
|
•
|
we may incur adverse tax consequences if the Company following the transaction closing fails to qualify as a REIT for U.S. federal income tax purposes,
|
|
•
|
we will be subject to risks associated with providing mortgage financing to SRH in connection with the transaction, including any default under such mortgage financing,
|
|
•
|
tenants of the properties that we acquire in the transaction may default on the terms of their respective leases,
|
|
•
|
we may face litigation or other claims in connection with, or as a result of, the transaction, including claims from terminated employees, tenants, former stockholders or other third parties, and
|
|
•
|
we may encounter unanticipated or unknown liabilities relating to the acquired properties.
|
As a result of the foregoing, we cannot assure you that our estimates of benefits and accretion from the transaction with CNL will not be overstated. Furthermore, the occurrence of any of the risks described above could have a material adverse effect on our business, financial condition, results of operations and cash flows. Certain of the above risks are described in more detail under the heading "Risk Factors" in the prospectus (Registration No. 333-215099), which was filed with the SEC by the Company on January 25, 2017.
Global economic uncertainty and disruptions in the financial markets may impair our ability to refinance existing obligations or obtain new financing for acquisition or development of properties.
There continues to be global economic uncertainty. Increased uncertainty in the wake of the "Brexit" referendum in the United Kingdom in June 2016, in which the majority of voters voted in favor of an exit from the European Union, as well as political changes in the U.S and abroad, have contributed to volatility in the global financial markets. Although the U.S. economy is improving, there can be no assurances that the U.S. economy will continue to improve or that a future recession will not occur. We rely in part on debt financing to finance our investments and development. To the extent that turmoil in the financial markets returns or intensifies, it has the potential to adversely affect our ability to refinance our existing obligations as they mature or obtain new financing for acquisition or development of properties and adversely affect the value of our investments. If we are unable to refinance existing indebtedness on attractive terms at its maturity, we may be forced to dispose of some of our assets. Uncertain economic conditions and disruptions
11
in the financial markets could also result in a substantial decrease in the value of our investments, which could also make it more difficult to refinance existing obligations or obtain new financing.
Many of our customers, consisting of tenants and borrowers, operate in market segments that depend upon discretionary spending by consumers. Any reduction in discretionary spending by consumers within the market segments in which our customers or potential customers operate could adversely affect such customers' operations and, in turn, reduce the demand for our properties or financing solutions.
Most of our portfolio is leased to or financed with customers operating service or retail businesses on our property locations. Movie theatres, entertainment retail centers, recreation and entertainment venues, early childhood education centers, private K-12 schools, ski areas and attractions represent some of the largest market investments in our portfolio; and AMC, Regal Cinemas, Inc., Cinemark USA, Inc. and Topgolf represented our largest customers for the year ended December 31, 2016. The success of most of these businesses depends on the willingness or ability of consumers to use their discretionary income to purchase our customers' products or services. The success of the properties that we have proposed to acquire in the CNL transaction is similarly dependent upon such discretionary spending. A downturn in the economy could cause consumers to reduce their discretionary spending within the market segments in which our customers or potential customers operate, which could adversely affect such customers' operations and, in turn, reduce the demand for our properties or financing solutions.
Adverse changes in our credit ratings could impair our ability to obtain additional debt and equity financing on favorable terms, if at all, and negatively impact the market price of our securities, including our common shares.
The credit ratings of our senior unsecured debt and preferred equity securities are based on our operating performance, liquidity and leverage ratios, overall financial position and other factors employed by the credit rating agencies in their rating analyses of us. Our credit ratings can affect the amount and type of capital we can access, as well as the terms of any financings we may obtain. There can be no assurance that we will be able to maintain our current credit ratings and in the event that our current credit ratings deteriorate, we would likely incur a higher cost of capital and it may be more difficult or expensive to obtain additional financing or refinance existing obligations and commitments. Also, a downgrade in our credit ratings would trigger additional costs or other potentially negative consequences under our current and future credit facilities and debt instruments.
An increase in interest rates could increase interest cost on new debt, and could materially adversely impact our ability to refinance existing debt, sell assets and limit our acquisition and development activities.
The U.S. Federal Reserve recently increased its benchmark interest rate and signaled that rates could continue to rise more quickly than previously expected. If interest rates continue to increase, so could our interest costs for any new debt. This increased cost could make the financing of any acquisition and development activity more costly. Rising interest rates could limit our ability to refinance existing debt when it matures, or cause us to pay higher interest rates upon refinancing and increase interest expense on refinanced indebtedness. In addition, an increase in interest rates could decrease the amount third parties are willing to pay for our assets, thereby limiting our ability to reposition our portfolio promptly in response to changes in economic or other conditions.
We previously made a significant investment in a planned casino and resort development (the “Adelaar Project”), which is now the subject of ongoing litigation. We cannot predict the duration or outcome of this litigation. Prolonged litigation or an unfavorable outcome could have a material adverse effect on the Adelaar Project or our financial condition and results of operations.
Prior proposed casino and resort developers Concord Associates, L.P., Concord Resort, LLC and Concord Kiamesha LLC, which are affiliates of Louis Cappelli and from whom we acquired the Adelaar resort property (the "Cappelli Group"), commenced litigation against the Company beginning in 2011 regarding matters relating to the acquisition of that property and our relationship with Empire Resorts, Inc. ("Empire Resorts") and certain of its subsidiaries (together with Empire Resorts, collectively, the "Empire Project Parties"). This litigation involves three separate cases filed in state and federal court. Two of the cases, a state and the federal case, are closed and resulted in no liability to the Company.
The remaining case was filed on October 20, 2011 by the Cappelli Group against the Company and two of its affiliates in the Supreme Court of the State of New York, County of Westchester (the "Westchester Action"), asserting a claim for breach of contract and the implied covenant of good faith, and seeking damages of at least $800 million, based on
12
allegations that the Company had breached an agreement (the "Casino Development Agreement"), dated June 18, 2010. We moved to dismiss the complaint in the Westchester Action based on a decision issued by the Sullivan County Supreme Court (one of the two closed cases discussed above) on June 30, 2014, as affirmed by the Appellate Division, Third Department (the "Sullivan Action"). On January 26, 2016, the Westchester County Supreme Court denied the our motion to dismiss but ordered the Cappelli Group to amend its pleading and remove all claims and allegations previously determined by the Sullivan Action. On February 18, 2016, the Cappelli Group filed an amended complaint asserting a single cause of action for breach of the covenant of good faith and fair dealing based upon allegations the Company had interfered with plaintiffs’ ability to obtain financing which complied with the Casino Development Agreement. On March 23, 2016, the Company filed a motion to dismiss the Cappelli Group’s revised amended complaint. On January 5, 2017, the Westchester County Supreme Court denied the Company’s second motion to dismiss. Discovery is ongoing.
We believe we have meritorious defenses to this litigation and intend to defend it vigorously. There can be no assurances, however, as to the duration or ultimate outcome of this litigation, nor can there be any assurances as to the costs we may incur in defending against or resolving this litigation. In addition, if the outcome of the litigation is unfavorable to us, it could result in a material adverse effect on our financial condition and results of operations.
The success of the Adelaar Project is largely dependent upon the successful development and operation of the Montreign Resort Casino, which requires the Empire Project Parties to comply with the terms of a gaming license, including investing or causing the investment of no less than approximately $854 million in the initial phase of the Adelaar Project and timely construction of the casino and related properties. If Empire Resorts is unsuccessful in its efforts to satisfy the conditions of the gaming license, the Adelaar Project and Montreign Resort Casino may be indefinitely delayed or canceled, and if we are unable to identify suitable alternative uses for the property, this could lead to a material adverse effect on our financial condition and results of operations.
On December 21, 2015, Montreign Operating Company, LLC (“Montreign”), a subsidiary of Empire Resorts, was awarded a license (a “Gaming Facility License”) by the New York State Gaming Commission to operate the Montreign Resort Casino, a key component of the Adelaar Project. The Gaming Facility License is subject to a number of conditions, including the requirement that Montreign invest, or cause to be invested, no less than $854 million in the initial phase of the Adelaar Project. On January 24, 2017, Montreign announced it had secured $500 million in secured debt financing for the project, which together with additional financing commitments will be used for such investment.
There can be no assurance that Empire Resorts will fully comply with the financial or other conditions of the Gaming Facility License. In the event that Empire Resorts fails to comply with the conditions of the Gaming Facility License, the Adelaar Project and Montreign Resort Casino may be indefinitely delayed or canceled, and there can be no assurance that a suitable alternate use for the property, whether involving gaming or otherwise, will be identified, which could result in a material adverse effect on our investment and on our financial condition and results of operations.
We expect to finance the cost of construction of common infrastructure at the Adelaar Project primarily through the issuance of tax-exempt public infrastructure bonds, and we could overrun budgeted costs for such infrastructure construction, which could significantly exceed the proceeds from the issuance of such bonds.
We are responsible for the construction of the Adelaar Project common infrastructure, which is expected to be financed primarily through the issuance of tax-exempt public infrastructure bonds. The debt service of these bonds is expected to be paid primarily through special assessments levied against the property held by the benefited users. In June 2016, the Sullivan County Infrastructure Local Development Corporation issued $110.0 million of Series 2016 Revenue Bonds, which is expected to fund a substantial portion of such construction costs. We received an initial reimbursement of $43.4 million of construction costs and expect to receive an additional $44.9 million of reimbursements over the balance of the construction period, which is expected to be completed in 2018. There can be no assurance that the cost of construction of common infrastructure for the Adelaar Project will not exceed our budgeted amounts of approximately $90.0 million, subject to budget adjustments and related approvals. If so, such excess may not be funded by the tax-exempt public infrastructure bonds and, to the extent they exceed certain negotiated caps, or are allocated to land held by us for development, may not be proportionately recovered from our tenants.
We depend on leasing space to tenants on economically favorable terms and collecting rent from our tenants, who may not be able to pay.
13
At any time, a tenant may experience a downturn in its business that may weaken its financial condition. Similarly, a general decline in the economy may result in a decline in demand for space at our commercial properties. Our financial results depend significantly on leasing space at our properties to tenants on economically favorable terms. In addition, because a majority of our income comes from leasing real property, our income, funds available to pay indebtedness and funds available for distribution to our shareholders will decrease if a significant number of our tenants cannot pay their rent or if we are not able to maintain our levels of occupancy on favorable terms. If our tenants cannot pay their rent or we are not able to maintain our levels of occupancy on favorable terms, there is also a risk that the fair value of the underlying property will be considered less than its carrying value and we may have to take a charge against earnings. In addition, if a tenant does not pay its rent, we might not be able to enforce our rights as landlord without significant delays and substantial legal costs.
If a tenant becomes bankrupt or insolvent, that could diminish or eliminate the income we expect from that tenant's leases. If a tenant becomes insolvent or bankrupt, we cannot be sure that we could recover the premises from the tenant promptly or from a trustee or debtor-in-possession in a bankruptcy proceeding relating to the tenant. On the other hand, a bankruptcy court might authorize the tenant to terminate its leases with us. If that happens, our claim against the bankrupt tenant for unpaid future rent would be subject to statutory limitations that might be substantially less than the remaining rent owed under the leases. In addition, any claim we have for unpaid past rent would likely not be paid in full and we would also have to take a charge against earnings for any accrued straight-line rent receivable related to the leases.
We are exposed to the credit risk of our customers and counterparties and their failure to meet their financial obligations could adversely affect our business.
Our business is subject to credit risk. There is a risk that a customer or counterparty will fail to meet its obligations when due. Customers and counterparties that owe us money may default on their obligations to us due to bankruptcy, lack of liquidity, operational failure or other reasons. Although we have procedures for reviewing credit exposures to specific customers and counterparties to address present credit concerns, default risk may arise from events or circumstances that are difficult to detect or foresee. Some of our risk management methods depend upon the evaluation of information regarding markets, clients or other matters that are publicly available or otherwise accessible by us. That information may not, in all cases, be accurate, complete, up-to-date or properly evaluated. In addition, concerns about, or a default by, one customer or counterparty could lead to significant liquidity problems, losses or defaults by other customers or counterparties, which in turn could adversely affect us. We may be materially and adversely affected in the event of a significant default by our customers and counterparties.
We could be adversely affected by a borrower's bankruptcy or default.
If a borrower becomes bankrupt or insolvent or defaults under its loan, that could force us to declare a default and foreclose on any available collateral. As a result, future interest income recognition related to the applicable note receivable could be significantly reduced or eliminated. There is also a risk that the fair value of the collateral, if any, will be less than the carrying value of the note and accrued interest receivable at the time of a foreclosure and we may have to take a charge against earnings. If a property serves as collateral for a note, we may experience costs and delays in recovering the property in foreclosure or finding a substitute operator for the property. If a mortgage we hold is subordinated to senior financing secured by the property, our recovery would be limited to any amount remaining after satisfaction of all amounts due to the holder of the senior financing. In addition, to protect our subordinated investment, we may desire to refinance any senior financing. However, there is no assurance that such refinancing would be available or, if it were to be available, that the terms would be attractive.
The base term of some of our theatre leases are expiring and there is no assurance that such leases will be renewed at existing lease terms or that we can lease any re-claimed space from some of our larger theatres at economically favorable terms.
The base term of some of our theatre leases are expiring. For theatres that are not performing as well as they did in the past, the tenants have and may continue to seek rent or other concessions or not renew at all. Furthermore, some tenants of our larger megaplex theatres desire to down-size the theatres they lease to respond to market trends. As a result, these tenants have and may continue to seek rent or other concessions from us, including requiring us to down-size the theatres or otherwise modify the properties in order to renew their leases. Furthermore, while any such screen reductions
14
would likely create opportunities to reclaim a portion of the former theatres for conversion to other uses, there is no guarantee that we can re-lease such space or that such leases would be at economically favorable terms.
Operating risks in the entertainment industry may affect the ability of our tenants to perform under their leases.
The ability of our tenants to operate successfully in the entertainment industry and remain current on their lease obligations depends on a number of factors, including the availability and popularity of motion pictures, the performance of those pictures in tenants' markets, the allocation of popular pictures to tenants, the release window (represents the time that elapses from the date of a picture's theatrical release to the date it is available on other mediums) and the terms on which the pictures are licensed. Neither we nor our tenants control the operations of motion picture distributors. There can be no assurances that motion picture distributors will continue to rely on theatres as the primary means of distributing first-run films, and motion picture distributors may in the future consider alternative film delivery methods. The success of “out-of-home” entertainment venues such as megaplex theatres, entertainment retail centers and recreational properties also depends on general economic conditions and the willingness of consumers to spend time and money on out-of-home entertainment.
In addition, some of our theatre tenants have disclosed that they are subject to pending anti-trust investigations by the U.S. Department of Justice and several states regarding such tenants' alleged anticompetitive practices, including seeking agreements with motion picture distributors for exclusive rights to releases in certain markets. There can be no assurances as to the outcome of such investigations or whether such investigations will materially adversely affect such tenants' operations and, in turn, their ability to perform under their leases.
Real estate is a competitive business.
Our business operates in highly competitive environments. We compete with a large number of real estate property owners and developers, some of which may be willing to accept lower returns on their investments. Principal factors of competition are rent or interest charged, attractiveness of location, the quality of the property and breadth and quality of services provided. If our competitors offer space at rental rates below the rental rates we are currently charging our tenants, we may lose potential tenants, and we may be pressured to reduce our rental rates below those we currently charge in order to retain tenants when our tenants' leases expire. Our success depends upon, among other factors, trends of the national and local economies, financial condition and operating results of current and prospective tenants and customers, availability and cost of capital, construction and renovation costs, taxes, governmental regulations, legislation and population trends.
A single tenant represents a substantial portion of our lease revenues.
AMC theatres, one of the nation's largest movie exhibition companies, is the lessee of a substantial number of our megaplex theatre properties. On December 21, 2016, AMC announced that it closed its acquisition of Carmike cinemas. For the year ended December 31, 2016, approximately
$90.0 million
or
18.2%
of our total revenues were derived from rental payments by AMC and approximately
$21.7 million
or
4.4%
of our total revenues were derived from rental payments by Carmike. AMC Entertainment, Inc. (“AMCE”) has guaranteed AMC's performance under substantially all of their leases. In addition, AMC will now be responsible for Carmike's performance under its leases. Although AMC has agreed to divest certain theatre properties in connection with obtaining antitrust approval for the acquisition of Carmike, such divestitures are expected to be immaterial and, therefore, the acquisition will result in increased revenue concentration risk. We have diversified and expect to continue to diversify our real estate portfolio by entering into lease transactions with a number of other leading operators or by acquiring or seeking to acquire other properties, such as pursuant to the CNL transaction. Nevertheless, our revenues and our continuing ability to service our debt and pay shareholder dividends are currently substantially dependent on AMC's performance under its leases, including the leases acquired in the Carmike acquisition, and AMCE's performance under its guarantee.
We believe AMC occupies a strong position in the industry and we intend to continue acquiring and leasing back or developing new AMC theatres. However, AMC and AMCE are susceptible to the same risks as our other tenants described herein. If for any reason AMC failed to perform under its lease obligations, including the leases acquired in the Carmike acquisition, and AMCE did not perform under its guarantee, we could be required to reduce or suspend our shareholder dividends and may not have sufficient funds to support operations or service our debt until substitute tenants are obtained. If that happened, we cannot predict when or whether we could obtain substitute quality tenants on acceptable terms.
15
Public charter schools are operated pursuant to charters granted by various state or other regulatory authorities and are dependent upon compliance with the terms of such charters in order to obtain funding from local, state and federal governments. We could be adversely affected by a public charter school's failure to comply with its charter, non-renewal of a charter upon expiration or by its reduction or loss of funding.
Our public charter school properties operate pursuant to charters granted by various state or other regulatory authorities, which are generally shorter than our lease terms, and most of the schools have undergone or expect to undergo compliance audits or reviews by such regulatory authorities. Such audits and reviews examine the financial as well as the academic performance of the school. Adverse audit or review findings could result in non-renewal or revocation of a public charter school's charter, or in some cases, a reduction in the amount of state funding, repayment of previously received state funding or other economic sanctions. Our public charter school tenants are also dependent upon funding from local, state and federal governments, which are currently experiencing budgetary constraints, and any reduction or loss of such funding could adversely affect a public charter school's ability to comply with its charter and/or pay its obligations.
Our master lease agreement with Imagine Schools, Inc. ("Imagine") provides certain contractual protections designed to mitigate risk, such as risk arising from the revocation of a charter of one or more Imagine schools. Subject to our approval and certain other terms and conditions, the master lease agreement also allows Imagine to repurchase from us the public charter school properties that are causing technical defaults. Imagine may, in substitution for such properties, sell to us public charter school properties that would otherwise comply with the lease agreement. However, there is no guarantee that acceptable schools will be available for substitutions or that such substitutions or repurchases will be completed. In addition, while governing authorities may approve substitute operators for failed public charter schools to ensure continuity for students, we cannot predict when or whether applicable governing authorities would approve such substitute operators, nor can we predict whether we could reach lease agreements with such substitute tenants on acceptable terms. In addition, Imagine has in certain previous sales of properties to third parties agreed to pay us the difference between our carrying value and the sales price. Imagine also has a mortgage note obligation to us as a result of sales of certain properties to Imagine. If Imagine or any other operator is unable to provide adequate substitute collateral under its lease with us, and/or is unable to pay its obligations, we may be required to record an impairment loss or sell schools for less than their net book value.
We are subject to risks relating to provisions included in some of our leases or financing arrangements with operators of our education properties pursuant to which such operators have the option to purchase leased properties or prepay notes relating to financed education properties.
Some of our leases or financing arrangements with education operators include provisions pursuant to which tenant operators may purchase leased properties and mortgagor operators may prepay notes relating to financed education properties, in each case, subject to option exercise payments or prepayment penalties. Some of these tenant or mortgagor operators may be able to obtain alternative financing on more economically favorable terms, in which case, such operators may choose to exercise their purchase option or prepayment right. If such operators exercise their purchase options or prepayment rights, we cannot provide any assurances that we would be able to redeploy the capital associated with these properties in other investments or that such investments would provide comparable returns, which could reduce our earnings going forward.
There are risks inherent in having indebtedness and the use of such indebtedness to fund acquisitions.
We currently use debt to fund portions of our operations and acquisitions. In a rising interest rate environment, the cost of our existing variable rate debt and any new debt will increase. We have used leverage to acquire properties and expect to continue to do so in the future. Although the use of leverage is common in the real estate industry, our use of debt exposes us to some risks. If a significant number of our tenants fail to make their lease payments and we don't have sufficient cash to pay principal and interest on the debt, we could default on our debt obligations. A substantial amount of our debt financing is secured by mortgages on our properties. If we fail to meet our mortgage payments, the lenders could declare a default and foreclose on those properties.
Most of our debt instruments contain balloon payments which may adversely impact our financial performance and our ability to pay dividends.
16
Most of our financing arrangements require us to make a lump-sum or "balloon" payment at maturity. There can be no assurance that we will be able to refinance such debt on favorable terms or at all. To the extent we cannot refinance such debt on favorable terms or at all, we may be forced to dispose of properties on disadvantageous terms or pay higher interest rates, either of which would have an adverse impact on our financial performance and ability to pay dividends to our shareholders.
We must obtain new financing in order to grow.
As a REIT, we are required to distribute at least 90% of our taxable net income to shareholders in the form of dividends. Other than deciding to make these dividends in our common shares, we are limited in our ability to use internal capital to acquire properties and must continually raise new capital in order to continue to grow and diversify our investment portfolio. Our ability to raise new capital depends in part on factors beyond our control, including conditions in equity and credit markets, conditions in the industries in which our tenants are engaged and the performance of real estate investment trusts generally. We continually consider and evaluate a variety of potential transactions to raise additional capital, but we cannot assure that attractive alternatives will always be available to us, nor that our share price will increase or remain at a level that will permit us to continue to raise equity capital publicly or privately.
Covenants in our debt instruments could adversely affect our financial condition and our acquisitions and development activities.
Some of our properties are subject to mortgages that contain customary covenants such as those that limit our ability, without the prior consent of the lender, to further mortgage the applicable property or to discontinue insurance coverage. Our unsecured revolving credit facility, term loan facility, senior notes and other loans that we may obtain in the future contain certain cross-default provisions as well as customary restrictions, requirements and other limitations on our ability to incur indebtedness, including covenants that limit our ability to incur debt based upon the level of our ratio of total debt to total assets, our ratio of secured debt to total assets, our ratio of EBITDA to interest expense and fixed charges. Our ability to borrow under our unsecured revolving credit facility and our term loan facility is also subject to compliance with certain other covenants. We also have senior notes issued in a private placement transaction that are subject to certain covenants. In addition, failure to comply with our covenants could cause a default under the applicable debt instrument, and we may then be required to repay such debt with capital from other sources. Under those circumstances, other sources of capital may not be available to us, or be available only on unattractive terms. Additionally, our ability to satisfy current or prospective lenders' insurance requirements may be adversely affected if lenders generally insist upon greater insurance coverage against acts of terrorism than is available to us in the marketplace or on commercially reasonable terms.
We rely on debt financing, including borrowings under our unsecured revolving credit facility, term loan facility, issuances of debt securities and debt secured by individual properties, to finance our acquisition and development activities and for working capital. If we are unable to obtain financing from these or other sources, or to refinance existing indebtedness upon maturity, our financial condition and results of operations would likely be adversely affected.
Our real estate investments are concentrated in entertainment, education and recreation properties and a significant portion of those investments are in megaplex theatre properties, making us more vulnerable economically than if our investments were more diversified.
We acquire, develop or finance entertainment, education and recreation properties. A significant portion of our investments are in megaplex theatre properties. Although we are subject to the general risks inherent in concentrating investments in real estate, the risks resulting from a lack of diversification become even greater as a result of investing primarily in entertainment, education and recreation properties. These risks are further heightened by the fact that a significant portion of our investments are in megaplex theatre properties. Although a downturn in the real estate industry could significantly adversely affect the value of our properties, a downturn in the entertainment, education and recreation industries could compound this adverse effect. These adverse effects could be more pronounced than if we diversified our investments to a greater degree outside of entertainment, education and recreation properties or, more particularly, outside of megaplex theatre properties.
If we fail to qualify as a REIT, we would be taxed as a corporation, which would substantially reduce funds available for payment of dividends to our shareholders.
17
If we fail to qualify as a REIT for federal income tax purposes, we will be taxed as a corporation. We are organized and believe we qualify as a REIT, and intend to operate in a manner that will allow us to continue to qualify as a REIT. However, we cannot provide any assurance that we have always qualified and will remain qualified in the future. This is because qualification as a REIT involves the application of highly technical and complex provisions of the Internal Revenue Code of 1986, as amended, on which there are only limited judicial and administrative interpretations, and depends on facts and circumstances not entirely within our control. In addition, future legislation, new regulations, administrative interpretations or court decisions may significantly change the tax laws, the application of the tax laws to our qualification as a REIT or the federal income tax consequences of that qualification. Furthermore, the results of the November 8, 2016, U.S. Presidential election create uncertainty regarding future potential tax law reform.
If we were to fail to qualify as a REIT in any taxable year (including any prior taxable year for which the statute of limitations remains open), we would face tax consequences that could substantially reduce the funds available for the service of our debt and payment of dividends:
|
•
|
we would not be allowed a deduction for dividends paid to shareholders in computing our taxable income and would be subject to federal income tax at regular corporate rates;
|
|
•
|
we could be subject to the federal alternative minimum tax and possibly increased state and local taxes;
|
|
•
|
unless we are entitled to relief under statutory provisions, we could not elect to be treated as a REIT for four taxable years following the year in which we were disqualified; and
|
|
•
|
we could be subject to tax penalties and interest.
|
In addition, if we fail to qualify as a REIT, we will no longer be required to pay dividends. As a result of these factors, our failure to qualify as a REIT could adversely affect the market price for our shares.
We will depend on distributions from our direct and indirect subsidiaries to service our debt and pay dividends to our shareholders. The creditors of these subsidiaries, and our direct creditors, are entitled to amounts payable to them before we pay any dividends to our shareholders.
Substantially all of our assets are held through our subsidiaries. We depend on these subsidiaries for substantially all of our cash flow. The creditors of each of our direct and indirect subsidiaries are entitled to payment of that subsidiary's obligations to them, when due and payable, before distributions may be made by that subsidiary to us. In addition, our creditors, whether secured or unsecured, are entitled to amounts payable to them before we may pay any dividends to our shareholders. Thus, our ability to service our debt obligations and pay dividends to holders of our common and preferred shares depends on our subsidiaries' ability first to satisfy their obligations to their creditors and then to pay distributions to us and our ability to satisfy our obligations to our direct creditors. Our subsidiaries are separate and distinct legal entities and have no obligations, other than guaranties of our debt, to make funds available to us.
Our development financing arrangements expose us to funding and completion risks.
Our ability to meet our construction financing obligations which we have undertaken or may enter into in the future depends on our ability to obtain equity or debt financing in the required amounts. There is no assurance we can obtain this financing or that the financing rates available will ensure a spread between our cost of capital and the rent or interest payable to us under the related leases or mortgage notes receivable. As a result, we could fail to meet our construction financing obligations or decide to cease such funding which, in turn, could result in failed projects and penalties, each of which could have a material adverse impact on our results of operations and business.
We have a limited number of employees and loss of personnel could harm our operations and adversely affect the value of our shares.
We had 57 full-time employees as of December 31, 2016 and, therefore, the impact we may feel from the loss of an employee may be greater than the impact such a loss would have on a larger organization. We are dependent on the efforts of the following individuals: Gregory K. Silvers, our President and Chief Executive Officer; Mark A. Peterson, our Executive Vice President and Chief Financial Officer; Morgan G. Earnest, our Senior Vice President and Chief Investment Officer; Craig L. Evans, our Senior Vice President, General Counsel and Secretary; Thomas B. Wright, III,
18
our Senior Vice President - Human Resources and Administration; Michael L. Hirons, our Senior Vice President - Strategy & Asset Management; and Tonya L. Mater, our Vice President and Chief Accounting Officer. While we believe that we could find replacements for our personnel, the loss of their services could harm our operations and adversely affect the value of our shares.
Security breaches and other disruptions could compromise our information and expose us to liability, which would cause our business and reputation to suffer. Our service providers and our tenants and their business partners are exposed to similar risks.
In the ordinary course of our business, we collect and store sensitive data, including our proprietary business information and that of our tenants and clients and personally identifiable information of our employees, in our facility and on our network. Despite our security measures, our information technology and infrastructure may be vulnerable to attacks by hackers or breached due to employee error, malfeasance or other disruptions. Any such breach could compromise our network and the information stored there could be accessed, publicly disclosed, lost or stolen. Any such access, disclosure or other loss of information could result in legal claims or proceedings, disrupt our operations, damage our reputation, and cause a loss of confidence, which could adversely affect our business. Our service providers and our tenants and their business partners are exposed to similar risks and the occurrence of a security breach or other disruption with respect to their information technology and infrastructure could, in turn, have a material adverse impact on our results of operations and business.
Changes in accounting standards issued by the Financial Accounting Standards Board ("FASB") or other standard-setting bodies may adversely affect our financial statements.
Our financial statements are subject to the application of U.S. GAAP, which is periodically revised and/or expanded. From time to time, we are required to adopt new or revised accounting standards issued by recognized authoritative bodies, including the FASB and the SEC. It is possible that future accounting standards we are required to adopt, such as the amended guidance for revenue recognition, leases and share-based payments, may require changes to the current accounting treatment that we apply to our consolidated financial statements and may require us to make significant changes to our systems. Such changes could result in a material adverse impact on our business, financial condition and results of operations.
Risks That Apply to Our Real Estate Business
Real estate income and the value of real estate investments fluctuate due to various factors.
The value of real estate fluctuates depending on conditions in the general economy and the real estate business. These conditions may also limit our revenues and available cash. The rents and interest we receive and the occupancy levels at our properties may decline as a result of adverse changes in any of the factors that affect the value of our real estate. If our revenues decline, we generally would expect to have less cash available to pay our indebtedness and distribute to our shareholders. In addition, some of our unreimbursed costs of owning real estate may not decline when the related rents decline.
The factors that affect the value of our real estate include, among other things:
|
•
|
international, national, regional and local economic conditions;
|
|
•
|
consequences of any armed conflict involving, or terrorist attack against, the United States or Canada;
|
|
•
|
the threat of domestic terrorism or pandemic outbreaks, which could cause customers of our tenants to avoid public places where large crowds are in attendance, such as megaplex theatres or recreational properties operated by our tenants;
|
|
•
|
our ability to secure adequate insurance;
|
|
•
|
natural disasters, such as earthquakes, hurricanes and floods, which could exceed the aggregate limits of insurance coverage;
|
19
|
•
|
local conditions such as an oversupply of space or a reduction in demand for real estate in the area;
|
|
•
|
competition from other available space;
|
|
•
|
whether tenants and users such as customers of our tenants consider a property attractive;
|
|
•
|
the financial condition of our tenants, including the extent of tenant bankruptcies or defaults;
|
|
•
|
whether we are able to pass some or all of any increased operating costs through to tenants;
|
|
•
|
how well we manage our properties;
|
|
•
|
fluctuations in interest rates;
|
|
•
|
changes in real estate taxes and other expenses;
|
|
•
|
changes in market rental rates;
|
|
•
|
the timing and costs associated with property improvements and rentals;
|
|
•
|
changes in taxation or zoning laws;
|
|
•
|
government regulation;
|
|
•
|
availability of financing on acceptable terms or at all;
|
|
•
|
potential liability under environmental or other laws or regulations; and
|
|
•
|
general competitive factors.
|
The rents and interest we receive and the occupancy levels at our properties may decline as a result of adverse changes in any of these factors. If our revenues decline, we generally would expect to have less cash available to pay our indebtedness and distribute to our shareholders. In addition, some of our unreimbursed costs of owning real estate may not decline when the related rents decline.
There are risks associated with owning and leasing real estate.
Although our lease terms obligate the tenants to bear substantially all of the costs of operating the properties, investing in real estate involves a number of risks, including:
|
•
|
the risk that tenants will not perform under their leases, reducing our income from the leases or requiring us to assume the cost of performing obligations (such as taxes, insurance and maintenance) that are the tenant's responsibility under the lease;
|
|
•
|
we may not always be able to lease properties at favorable rates or certain tenants may require significant capital expenditures by us to conform existing properties to their requirements;
|
|
•
|
we may not always be able to sell a property when we desire to do so at a favorable price; and
|
|
•
|
changes in tax, zoning or other laws could make properties less attractive or less profitable.
|
If a tenant fails to perform on its lease covenants, that would not excuse us from meeting any debt obligation secured by the property and could require us to fund reserves in favor of our lenders, thereby reducing funds available for payment of dividends. We cannot be assured that tenants will elect to renew their leases when the terms expire. If a tenant does not renew its lease or if a tenant defaults on its lease obligations, there is no assurance we could obtain a
20
substitute tenant on acceptable terms. If we cannot obtain another quality tenant, we may be required to modify the property for a different use, which may involve a significant capital expenditure and a delay in re-leasing the property.
Some potential losses are not covered by insurance.
Our leases require the tenants to carry comprehensive liability, casualty, workers' compensation, extended coverage and rental loss insurance on our properties. We believe the required coverage is of the type, and amount, customarily obtained by an owner of similar properties. We believe all of our properties are adequately insured. However, there are some types of losses, such as catastrophic acts of nature, acts of war or riots, for which we or our tenants cannot obtain insurance at an acceptable cost. If there is an uninsured loss or a loss in excess of insurance limits, we could lose both the revenues generated by the affected property and the capital we have invested in the property. We would, however, remain obligated to repay any mortgage indebtedness or other obligations related to the property. Since September 11, 2001, the cost of insurance protection against terrorist acts has risen dramatically. There can be no assurance our tenants will be able to obtain terrorism insurance coverage, or that any coverage they do obtain will adequately protect our properties against loss from terrorist attack.
Joint ventures may limit flexibility with jointly owned investments.
We may continue to acquire or develop properties in joint ventures with third parties when those transactions appear desirable. We would not own the entire interest in any property acquired by a joint venture. Major decisions regarding a joint venture property may require the consent of our partner. If we have a dispute with a joint venture partner, we may feel it necessary or become obligated to acquire the partner's interest in the venture. However, we cannot ensure that the price we would have to pay or the timing of the acquisition would be favorable to us. If we own less than a 50% interest in any joint venture, or if the venture is jointly controlled, the assets and financial results of the joint venture may not be reportable by us on a consolidated basis. To the extent we have commitments to, or on behalf of, or are dependent on, any such “off-balance sheet” arrangements, or if those arrangements or their properties or leases are subject to material contingencies, our liquidity, financial condition and operating results could be adversely affected by those commitments or off-balance sheet arrangements.
Our multi-tenant properties expose us to additional risks.
Our entertainment retail centers in Colorado, New York, California, Virginia, and Ontario, Canada, and similar properties we may seek to acquire or develop in the future, involve risks not typically encountered in the purchase and lease-back of real estate properties which are operated by a single tenant. The ownership or development of multi-tenant retail centers could expose us to the risk that a sufficient number of suitable tenants may not be found to enable the centers to operate profitably and provide a return to us. This risk may be compounded by the failure of existing tenants to satisfy their obligations due to various factors, including the current economic crisis. These risks, in turn, could cause a material adverse impact to our results of operations and business.
Retail centers are also subject to tenant turnover and fluctuations in occupancy rates, which could affect our operating results. Multi-tenant retail centers also expose us to the risk of potential “CAM slippage,” which may occur when the actual cost of taxes, insurance and maintenance at the property exceeds the CAM fees paid by tenants.
Failure to comply with the Americans with Disabilities Act and other laws could result in substantial costs.
Most of our properties must comply with the Americans with Disabilities Act (“ADA”). The ADA requires that public accommodations reasonably accommodate individuals with disabilities and that new construction or alterations be made to commercial facilities to conform to accessibility guidelines. Failure to comply with the ADA can result in injunctions, fines, damage awards to private parties and additional capital expenditures to remedy noncompliance. Our leases require the tenants to comply with the ADA.
Our properties are also subject to various other federal, state and local regulatory requirements. We do not know whether existing requirements will change or whether compliance with future requirements will involve significant unanticipated expenditures. Although these expenditures would be the responsibility of our tenants, if tenants fail to perform these obligations, we may be required to do so.
Potential liability for environmental contamination could result in substantial costs.
21
Under federal, state and local environmental laws, we may be required to investigate and clean up any release of hazardous or toxic substances or petroleum products at our properties, regardless of our knowledge or actual responsibility, simply because of our current or past ownership of the real estate. If unidentified environmental problems arise, we may have to make substantial payments, which could adversely affect our cash flow and our ability to service our debt and pay dividends to our shareholders. This is because:
|
•
|
as owner, we may have to pay for property damage and for investigation and clean-up costs incurred in connection with the contamination;
|
|
•
|
the law may impose clean-up responsibility and liability regardless of whether the owner or operator knew of or caused the contamination;
|
|
•
|
even if more than one person is responsible for the contamination, each person who shares legal liability under environmental laws may be held responsible for all of the clean-up costs; and
|
|
•
|
governmental entities and third parties may sue the owner or operator of a contaminated site for damages and costs.
|
These costs could be substantial and in extreme cases could exceed the value of the contaminated property. The presence of hazardous substances or petroleum products or the failure to properly remediate contamination may adversely affect our ability to borrow against, sell or lease an affected property. In addition, some environmental laws create liens on contaminated sites in favor of the government for damages and costs it incurs in connection with a contamination. Most of our loan agreements require the Company or a subsidiary to indemnify the lender against environmental liabilities. Our leases require the tenants to operate the properties in compliance with environmental laws and to indemnify us against environmental liability arising from the operation of the properties. We believe all of our properties are in material compliance with environmental laws. However, we could be subject to strict liability under environmental laws because we own the properties. There is also a risk that tenants may not satisfy their environmental compliance and indemnification obligations under the leases. Any of these events could substantially increase our cost of operations, require us to fund environmental indemnities in favor of our lenders, limit the amount we could borrow under our unsecured revolving credit facility and term loan facility and reduce our ability to service our debt and pay dividends to shareholders.
Real estate investments are relatively illiquid.
We have previously disclosed our intent to undertake certain asset dispositions. In addition, we may desire to sell other properties in the future because of changes in market conditions, poor tenant performance or default of any mortgage we hold, or to avail ourselves of other opportunities. We may also be required to sell a property in the future to meet debt obligations or avoid a default. Specialty real estate projects such as we have cannot always be sold quickly, and we cannot assure you that we could always obtain a favorable price. In addition, the Internal Revenue Code limits our ability to sell our properties. We may be required to invest in the restoration or modification of a property before we can sell it. The inability to respond promptly to changes in the performance of our property portfolio could adversely affect our financial condition and ability to service our debt and pay dividends to our shareholders.
There are risks in owning assets outside the United States.
Our properties in Canada are subject to the risks normally associated with international operations. The rentals under our Canadian leases are payable in Canadian dollars, which could expose us to losses resulting from fluctuations in exchange rates to the extent we have not hedged our position. Canadian real estate and tax laws are complex and subject to change, and we cannot assure you we will always be in compliance with those laws or that compliance will not expose us to additional expense. We may also be subject to fluctuations in Canadian real estate values or markets or the Canadian economy as a whole, which may adversely affect our Canadian investments.
Additionally, we have made investments in projects located in China and may enter other international markets, which may have similar risks as described above as well as unique risks associated with a specific country.
22
There are risks in owning or financing properties for which the tenant's, mortgagor's or our operations may be impacted by weather conditions and climate change.
We have acquired and financed ski areas and expect to do so in the future. The operators of these properties, our tenants or mortgagors, are dependent upon the operations of the properties to pay their rents and service their loans. The ski area operator's ability to attract visitors is influenced by weather conditions and climate change in general, each of which may impact the amount of snowfall during the ski season. Adverse weather conditions may discourage visitors from participating in outdoor activities. In addition, unseasonably warm weather may result in inadequate natural snowfall, which increases the cost of snowmaking, and could render snowmaking wholly or partially ineffective in maintaining quality skiing conditions and attracting visitors. Excessive natural snowfall may materially increase the costs incurred for grooming trails and may also make it difficult for visitors to obtain access to the ski area. We also own and finance waterparks and we have proposed to acquire and finance a significant number of additional waterparks, amusement parks and ski areas pursuant to the CNL transaction, which would also be subject to risks relating to weather conditions such as in the case of waterparks and amusement parks, excessive rainfall or unseasonable temperatures, and in the case of ski areas, the risks described above. Prolonged periods of adverse weather conditions, or the occurrence of such conditions during peak visitation periods, could have a material adverse effect on the operator's financial results and could impair the ability of the operator to make rental payments or service our loans.
We face risks associated with the development, redevelopment and expansion of properties and the acquisition of other real estate related companies.
We may develop, redevelop or expand new or existing properties or acquire other real estate related companies, and these activities are subject to various risks. We may not be successful in pursuing such development or acquisition opportunities. In addition, newly developed or redeveloped/expanded properties or newly acquired companies may not perform as well as expected. We are subject to other risks in connection with any such development or acquisition activities, including the following:
|
•
|
we may not succeed in in completing developments or consummating desired acquisitions on time;
|
|
•
|
we may face competition in pursuing development or acquisition opportunities, which could increase our costs;
|
|
•
|
we may face difficulties in integrating acquisitions, which may prove costly or time-consuming and could divert management's attention;
|
|
•
|
we may undertake developments or acquisitions in new markets or industries where we do not have the same level of market knowledge, which may expose us to unanticipated risks in those markets and industries to which we are unable to effectively respond, such as an inability to attract qualified personnel with knowledge of such markets and industries;
|
|
•
|
we may incur construction costs in connection with developments, which may be higher than projected, potentially making the project unfeasible or unprofitable;
|
|
•
|
we may be unable to obtain zoning, occupancy or other governmental approvals;
|
|
•
|
we may experience delays in receiving rental payments for developments that are not completed on time;
|
|
•
|
our developments or acquisitions may not be profitable;
|
|
•
|
we may need the consent of third parties such as anchor tenants, mortgage lenders and joint venture partners, and those consents may be withheld;
|
|
•
|
we may issue shares in connection with acquisitions resulting in dilution to our existing shareholders; and
|
|
•
|
we may assume debt or other liabilities in connection with acquisitions.
|
23
In addition, there is no assurance that planned third-party financing related to development and acquisition opportunities will be provided on a timely basis or at all, thus increasing the risk that such opportunities are delayed or fail to be completed as originally contemplated. We may also abandon development or acquisition opportunities that we have begun pursuing and consequently fail to recover expenses already incurred and have devoted management time to a matter not consummated. In some cases, we may agree to lease or other financing terms for a development project in advance of completing and funding the project, in which case we are exposed to the risk of an increase in our cost of capital during the interim period leading up to the funding, which can reduce, eliminate or result in a negative spread between our cost of capital and the payments we expect to receive from the project. Furthermore, our acquisitions of new properties or companies will expose us to the liabilities of those properties or companies, some of which we may not be aware at the time of acquisition. In addition, development of our existing properties presents similar risks. If a development or acquisition is unsuccessful, either because it is not meeting our expectations or was not completed according to our plans, we could lose our investment in the development or acquisition.
Risks That May Affect the Market Price of Our Shares
We cannot assure you we will continue paying cash dividends at current rates.
Our dividend policy is determined by our Board of Trustees. Our ability to continue paying dividends on our common shares, to pay dividends on our preferred shares at their stated rates or to increase our common share dividend rate will depend on a number of factors, including our liquidity, our financial condition and results of future operations, the performance of lease and mortgage terms by our tenants and customers, our ability to acquire, finance and lease additional properties at attractive rates, and provisions in our loan covenants. If we do not maintain or increase our common share dividend rate, that could have an adverse effect on the market price of our common shares and possibly our preferred shares. Furthermore, if the Board of Trustees decides to pay dividends on our common shares partially or substantially all in common shares, that could have an adverse effect on the market price of our common shares and possibly our preferred shares.
Market interest rates may have an effect on the value of our shares.
One of the factors that investors may consider in deciding whether to buy or sell our common shares or preferred shares is our dividend rate as a percentage of our share price, relative to market interest rates, which have increased in the past year. If market interest rates continue to increase, prospective investors may desire a higher dividend rate on our common shares or seek securities paying higher dividends or interest.
Market prices for our shares may be affected by perceptions about the financial health or share value of our tenants and mortgagors or the performance of REIT stocks generally.
To the extent any of our tenants or customers, or their competition, report losses or slower earnings growth, take charges against earnings or enter bankruptcy proceedings, the market price for our shares could be adversely affected. The market price for our shares could also be affected by any weakness in the performance of REIT stocks generally or weakness in any of the sectors in which our tenants and customers operate.
Limits on changes in control may discourage takeover attempts which may be beneficial to our shareholders.
There are a number of provisions in our Declaration of Trust, Bylaws, Maryland law and agreements we have with others which could make it more difficult for a party to make a tender offer for our shares or complete a takeover of the Company which is not approved by our Board of Trustees. These include:
|
•
|
a staggered Board of Trustees that can be increased in number without shareholder approval;
|
|
•
|
a limit on beneficial ownership of our shares, which acts as a defense against a hostile takeover or acquisition of a significant or controlling interest, in addition to preserving our REIT status;
|
|
•
|
the ability of the Board of Trustees to issue preferred or common shares, to reclassify preferred or common shares, and to increase the amount of our authorized preferred or common shares, without shareholder approval;
|
|
•
|
limits on the ability of shareholders to remove trustees without cause;
|
24
|
•
|
requirements for advance notice of shareholder proposals at shareholder meetings;
|
|
•
|
provisions of Maryland law restricting business combinations and control share acquisitions not approved by the Board of Trustees;
|
|
•
|
provisions of Maryland law protecting corporations (and by extension REITs) against unsolicited takeovers by limiting the duties of the trustees in unsolicited takeover situations;
|
|
•
|
provisions in Maryland law providing that the trustees are not subject to any higher duty or greater scrutiny than that applied to any other director under Maryland law in transactions relating to the acquisition or potential acquisition of control;
|
|
•
|
provisions of Maryland law creating a statutory presumption that an act of the trustees satisfies the applicable standards of conduct for trustees under Maryland law;
|
|
•
|
provisions in loan or joint venture agreements putting the Company in default upon a change in control; and
|
|
•
|
provisions of employment agreements and other compensation arrangements with our employees calling for severance compensation and vesting of equity compensation upon termination of employment upon a change in control or certain events of the officers' termination of service.
|
Any or all of these provisions could delay or prevent a change in control of the Company, even if the change was in our shareholders' interest or offered a greater return to our shareholders.
We may change our policies without obtaining the approval of our shareholders.
Our operating and financial policies, including our policies with respect to acquiring or financing real estate or other companies, growth, operations, indebtedness, capitalization and dividends, are exclusively determined by our Board of Trustees. Accordingly, our shareholders do not control these policies.
Dilution could affect the value of our shares.
Our future growth will depend in part on our ability to raise additional capital. If we raise additional capital through the issuance of equity securities, the interests of holders of our common shares could be diluted. Likewise, our Board of Trustees is authorized to cause us to issue preferred shares in one or more series, the holders of which would be entitled to dividends and voting and other rights as our Board of Trustees determines, and which could be senior to or convertible into our common shares. Accordingly, an issuance by us of preferred shares could be dilutive to or otherwise adversely affect the interests of holders of our common shares. As of December 31, 2016, our Series C preferred shares are convertible, at each of the holder's option, into our common shares at a conversion rate of 0.3785 common shares per $25.00 liquidation preference, which is equivalent to a conversion price of approximately $66.05 per common share (subject to adjustment in certain events). Additionally, as of December 31, 2016, our Series E preferred shares are convertible, at each of the holder's option, into our common shares at a conversion rate of 0.4569 common shares per $25.00 liquidation preference, which is equivalent to a conversion price of approximately $54.72 per common share (subject to adjustment in certain events). Under certain circumstances in connection with a change in control of our Company, holders of our Series F preferred shares may elect to convert some or all of their Series F preferred shares into a number of our common shares per Series F preferred share equal to the lesser of (a) the $25.00 per share liquidation preference, plus accrued and unpaid dividends divided by the market value of our common shares or (b) 1.1008 shares. Depending upon the number of Series C, Series E and Series F preferred shares being converted at one time, a conversion of Series C, Series E and Series F preferred shares could be dilutive to or otherwise adversely affect the interests of holders of our common shares. In addition, we may issue a significant amount of equity securities in connection with acquisitions or investments, such as in connection with the CNL transaction, with or without seeking shareholder approval, which could result in significant dilution to our existing shareholders.
Future offerings of debt or equity securities, which may rank senior to our common shares, may adversely affect the market price of our common shares.
25
If we decide to issue debt securities in the future, which would rank senior to our common shares, it is likely that they will be governed by an indenture or other instrument containing covenants restricting our operating flexibility. Additionally, any equity securities or convertible or exchangeable securities that we issue in the future may have rights, preferences and privileges more favorable than those of our common shares and may result in dilution to owners of our common shares. We and, indirectly, our shareholders, will bear the cost of issuing and servicing such securities. Because our decision to issue debt or equity securities in any future offering will depend on market conditions and other factors beyond our control, we cannot predict or estimate the amount, timing or nature of our future offerings. Thus, holders of our common shares will bear the risk of our future offerings reducing the market price of our common shares and diluting the value of their shareholdings in us.
Changes in foreign currency exchange rates may have an impact on the value of our shares.
The functional currency for our Canadian operations is the Canadian dollar. As a result, our future operating results could be affected by fluctuations in the exchange rate between U.S. and Canadian dollars, which in turn could affect our share price. We have attempted to mitigate our exposure to Canadian currency exchange risk by entering into foreign currency exchange contracts to hedge in part our exposure to exchange rate fluctuations. Foreign currency derivatives are subject to future risk of loss. We do not engage in purchasing foreign exchange contracts for speculative purposes.
Additionally, we have made investments in China and may enter other international markets which pose similar currency fluctuation risks as described above.
We may be subject to adverse legislative or regulatory tax changes that could reduce the market price of our shares.
At any time, the U.S. federal income tax laws or regulations governing REITs or the administrative interpretations of those laws or regulations may be changed, possibly with retroactive effect. In addition, there have been a number of proposals in Congress for major revision of the federal income tax laws, including proposals to adopt a flat tax or replace the income tax system with a national sales tax or value-added tax. Furthermore, the results of the November 8, 2016 U.S. Presidential election create uncertainty regarding future potential tax law reform. We cannot predict if or when any new U.S. federal income tax law, regulation or administrative interpretation, or any amendment to any existing U.S. federal income tax law, regulation or administrative interpretation, will be adopted, promulgated or become effective or whether any such law, regulation or interpretation may take effect retroactively. We and our shareholders could be adversely affected by any such change in, or any new, U.S. federal income tax law, regulation or administrative interpretation. Furthermore, any proposals seeking broader reform of U.S. federal income tax laws, if enacted, could change the federal income tax laws applicable to REITs, subject us to federal tax or reduce or eliminate the current deduction for dividends paid to our shareholders, any of which could negatively affect the market for our shares.
There are no unresolved comments from the staff of the SEC required to be disclosed herein as of the date of this Annual Report on Form 10-K.
26
As of
December 31, 2016
, our real estate portfolio (including properties securing our mortgage notes) consisted of investments in each of our four operating segments. The Entertainment segment included investments in
141
megaplex theatre properties,
eight
entertainment retail centers (which include
eight
additional megaplex theatre properties) and
eight
family entertainment centers. The Education segment included investments in
67
public charter school properties,
41
early education centers and
12
private school properties. The Recreation segment included investments in
11
ski areas,
five
waterparks,
25
golf entertainment complexes and one other recreation property. The Other segment consisted primarily of the land under ground lease, property under development and land held for development related to the Adelaar casino and resort project in Sullivan County, New York. Our properties are located in 40 states, the District of Columbia and Ontario, Canada. Except as otherwise noted, all of the real estate investments listed below are owned or ground leased directly by us. The following table lists our owned properties (excludes properties under development, land held for development and properties securing our mortgage notes) listed by segment, their locations, acquisition dates, number of theatre screens (if applicable), number of seats (if applicable), gross square footage, and the tenant.
27
|
Location
|
Acquisition
date
|
Screens
|
Seats
|
Building
(gross sq. ft)
|
Tenant
|
||||||||
|
Entertainment Properties:
|
|||||||||||||
|
San Antonio, TX
|
11/97
|
14
|
|
2,576
|
|
53,583
|
|
Regal
|
|||||
|
Dallas, TX
|
11/97
|
14
|
|
2,962
|
|
56,430
|
|
Studio Movie Grill
|
|||||
|
Sugar Land, TX (1) (8)
|
11/97
|
23
|
|
4,145
|
|
107,690
|
|
AMC
|
|||||
|
Leawood, KS (9)
|
11/97
|
20
|
|
962
|
|
75,224
|
|
AMC
|
|||||
|
Omaha, NE
|
11/97
|
24
|
|
4,668
|
|
107,402
|
|
AMC
|
|||||
|
Columbus, OH (1)
|
11/97
|
24
|
|
4,461
|
|
98,261
|
|
AMC
|
|||||
|
San Diego, CA (1)
|
11/97
|
20
|
|
4,173
|
|
84,352
|
|
AMC
|
|||||
|
Ontario, CA
|
11/97
|
19
|
|
3,411
|
|
131,534
|
|
AMC
|
|||||
|
Houston, TX
|
11/97
|
30
|
|
4,925
|
|
136,154
|
|
AMC
|
|||||
|
Creve Coeur, MO
|
11/97
|
16
|
|
1,029
|
|
60,418
|
|
AMC
|
|||||
|
San Antonio, TX
|
11/97
|
—
|
|
—
|
|
27,485
|
|
Altitude Trampoline Park
|
|||||
|
Houston, TX (2)
|
2/98
|
30
|
|
5,701
|
|
130,891
|
|
AMC
|
|||||
|
South Barrington, IL
|
3/98
|
21
|
|
2,069
|
|
130,757
|
|
AMC
|
|||||
|
Mesquite, TX (2)
|
4/98
|
30
|
|
3,095
|
|
130,891
|
|
AMC
|
|||||
|
Hampton, VA
|
6/98
|
24
|
|
4,673
|
|
107,396
|
|
AMC
|
|||||
|
Raleigh, NC
|
8/98
|
16
|
|
2,596
|
|
51,450
|
|
Cinemark
|
|||||
|
Davie, FL
|
11/98
|
24
|
|
4,180
|
|
96,497
|
|
Cinemark
|
|||||
|
Pompano Beach, FL
|
11/98
|
18
|
|
3,424
|
|
73,637
|
|
AMC
|
|||||
|
Aliso Viejo, CA
|
12/98
|
20
|
|
4,238
|
|
98,557
|
|
Regal
|
|||||
|
Boise, ID (1)
|
12/98
|
22
|
|
4,883
|
|
140,300
|
|
Regal
|
|||||
|
Mesquite, TX
|
1/99
|
—
|
|
—
|
|
6,200
|
|
Various
|
|||||
|
Woodridge, IL (2)
|
6/99
|
18
|
|
4,397
|
|
82,000
|
|
AMC
|
|||||
|
Tampa, FL
|
6/99
|
20
|
|
3,928
|
|
84,000
|
|
AMC
|
|||||
|
Westminster, CO
|
6/99
|
24
|
|
4,693
|
|
89,260
|
|
AMC
|
|||||
|
Cary, NC
|
12/99
|
20
|
|
3,883
|
|
77,475
|
|
Regal
|
|||||
|
San Diego, CA
|
2/00
|
24
|
|
3,192
|
|
88,610
|
|
AMC
|
|||||
|
Houston, TX
|
5/00
|
—
|
|
—
|
|
7,808
|
|
Various
|
|||||
|
Westminster, CO
|
12/01
|
—
|
|
—
|
|
134,226
|
|
Various
|
|||||
|
Metairie, LA (1)
|
3/02
|
12
|
|
2,424
|
|
70,000
|
|
AMC
|
|||||
|
Harahan, LA
|
3/02
|
20
|
|
4,334
|
|
90,391
|
|
AMC
|
|||||
|
Hammond, LA
|
3/02
|
10
|
|
1,530
|
|
39,850
|
|
AMC
|
|||||
|
Houma, LA
|
3/02
|
10
|
|
1,766
|
|
44,450
|
|
AMC
|
|||||
|
Harvey, LA
|
3/02
|
16
|
|
3,053
|
|
71,607
|
|
AMC
|
|||||
|
Greenville, SC
|
6/02
|
16
|
|
2,814
|
|
52,830
|
|
Regal
|
|||||
|
Sterling Heights, MI
|
6/02
|
30
|
|
4,925
|
|
107,712
|
|
AMC
|
|||||
|
Olathe, KS
|
6/02
|
28
|
|
4,191
|
|
100,251
|
|
AMC
|
|||||
|
Greenville, SC
|
6/02
|
—
|
|
—
|
|
10,000
|
|
Various
|
|||||
|
Livonia, MI
|
8/02
|
20
|
|
3,604
|
|
75,106
|
|
AMC
|
|||||
|
Alexandria, VA (1)
|
10/02
|
21
|
|
3,443
|
|
132,903
|
|
AMC
|
|||||
|
Little Rock, AR
|
12/02
|
18
|
|
3,997
|
|
79,330
|
|
Cinemark
|
|||||
|
Macon, GA
|
3/03
|
16
|
|
2,950
|
|
66,400
|
|
Southern
|
|||||
|
Southfield, MI
|
5/03
|
20
|
|
5,962
|
|
112,119
|
|
AMC
|
|||||
|
Southfield, MI
|
5/03
|
—
|
|
—
|
|
19,852
|
|
Various
|
|||||
|
Lawrence, KS (7)
|
6/03
|
12
|
|
2,386
|
|
42,497
|
|
Regal
|
|||||
|
New Rochelle, NY
|
10/03
|
18
|
|
4,893
|
|
102,267
|
|
Regal
|
|||||
|
New Rochelle, NY
|
10/03
|
—
|
|
—
|
|
343,809
|
|
Various
|
|||||
|
Columbia, SC
|
11/03
|
14
|
|
2,938
|
|
56,705
|
|
Regal
|
|||||
|
Suffolk, VA
|
11/03
|
16
|
|
3,036
|
|
61,500
|
|
Regal
|
|||||
|
Suffolk, VA
|
11/03
|
—
|
|
—
|
|
96,624
|
|
Various
|
|||||
|
Hialeah, FL
|
12/03
|
18
|
|
4,900
|
|
77,400
|
|
Cobb
|
|||||
|
Phoenix, AZ
|
3/04
|
10
|
|
1,908
|
|
113,768
|
|
AMC
|
|||||
|
Mesa, AZ
|
3/04
|
14
|
|
1,257
|
|
94,774
|
|
AMC
|
|||||
|
Hamilton, NJ
|
3/04
|
24
|
|
4,183
|
|
95,466
|
|
AMC
|
|||||
|
Mississagua, ON (17)
|
3/04
|
16
|
|
3,856
|
|
92,971
|
|
Cineplex
|
|||||
|
Kanata, ON (17)
|
3/04
|
24
|
|
4,764
|
|
89,290
|
|
Landmark Cinemas
|
|||||
|
Whitby, ON (17)
|
3/04
|
24
|
|
4,688
|
|
89,290
|
|
Landmark Cinemas
|
|||||
|
Oakville, ON (17)
|
3/04
|
24
|
|
4,772
|
|
89,290
|
|
Cineplex
|
|||||
|
Subtotal Entertainment Properties, carried over to next page
|
966
|
|
176,838
|
|
4,986,940
|
|
|||||||
28
|
Location
|
Acquisition
date
|
Screens
|
Seats
|
Building
(gross sq. ft)
|
Tenant
|
||||||||
|
Entertainment Properties:
|
|||||||||||||
|
Subtotal from previous page
|
n/a
|
966
|
|
176,838
|
|
4,986,940
|
|
||||||
|
Mississagua, ON (17)
|
3/04
|
—
|
|
—
|
|
115,934
|
|
Various
|
|||||
|
Kanata, ON (17)
|
3/04
|
—
|
|
—
|
|
384,373
|
|
Various
|
|||||
|
Whitby, ON (17)
|
3/04
|
—
|
|
—
|
|
149,487
|
|
Various
|
|||||
|
Oakville, ON (17)
|
3/04
|
—
|
|
—
|
|
140,830
|
|
Various
|
|||||
|
Lafayette, LA (1)
|
7/04
|
16
|
|
2,744
|
|
61,579
|
|
Southern
|
|||||
|
Peoria, IL
|
7/04
|
18
|
|
4,063
|
|
82,330
|
|
AMC
|
|||||
|
Warrenville, IL
|
7/04
|
—
|
|
—
|
|
7,500
|
|
Various
|
|||||
|
Hurst, TX
|
11/04
|
18
|
|
3,914
|
|
98,250
|
|
Cinemark
|
|||||
|
D'Iberville, MS (3)
|
12/04
|
18
|
|
2,802
|
|
59,533
|
|
Southern
|
|||||
|
Melbourne, FL
|
12/04
|
16
|
|
3,600
|
|
75,850
|
|
AMC
|
|||||
|
Wilmington, NC
|
2/05
|
16
|
|
2,907
|
|
57,338
|
|
Regal
|
|||||
|
Chattanooga, TN (10)
|
3/05
|
18
|
|
4,133
|
|
82,330
|
|
AMC
|
|||||
|
Burbank, CA
|
3/05
|
16
|
|
3,749
|
|
86,551
|
|
AMC
|
|||||
|
Burbank, CA
|
3/05
|
—
|
|
—
|
|
34,818
|
|
Various
|
|||||
|
Conroe, TX
|
6/05
|
14
|
|
2,403
|
|
45,000
|
|
Southern
|
|||||
|
Indianapolis, IN (5)
|
6/05
|
12
|
|
2,070
|
|
45,700
|
|
AMC
|
|||||
|
Hattiesurg, MS (6)
|
9/05
|
18
|
|
2,542
|
|
57,367
|
|
Southern
|
|||||
|
Arroyo Grande, CA
|
12/05
|
10
|
|
1,714
|
|
35,760
|
|
Regal
|
|||||
|
Auburn, CA
|
12/05
|
10
|
|
1,563
|
|
35,089
|
|
Regal
|
|||||
|
Fresno, CA (4)
|
12/05
|
16
|
|
3,866
|
|
80,600
|
|
Regal
|
|||||
|
Modesto, CA (1)
|
12/05
|
10
|
|
1,889
|
|
38,873
|
|
Regal
|
|||||
|
Columbia, MD (1)
|
3/06
|
14
|
|
2,459
|
|
63,306
|
|
AMC
|
|||||
|
Garland, TX (11)
|
3/06
|
17
|
|
3,028
|
|
75,252
|
|
AMC
|
|||||
|
Garner, NC
|
4/06
|
14
|
|
2,619
|
|
50,810
|
|
Regal
|
|||||
|
Winston Salem, NC (1)
|
7/06
|
18
|
|
3,496
|
|
75,605
|
|
Southern
|
|||||
|
Huntsville, AL
|
8/06
|
18
|
|
4,150
|
|
90,200
|
|
AMC
|
|||||
|
Kalamazoo, MI
|
11/06
|
10
|
|
1,007
|
|
65,525
|
|
Alamo Draft House Cinemas
|
|||||
|
Slidell, LA (1) (12)
|
12/06
|
16
|
|
2,695
|
|
62,300
|
|
Southern
|
|||||
|
Pensacola, FL
|
12/06
|
15
|
|
3,361
|
|
74,400
|
|
AMC
|
|||||
|
Panama City Beach, FL
|
5/07
|
16
|
|
3,636
|
|
75,605
|
|
Southern
|
|||||
|
Austell, GA
|
7/07
|
—
|
|
—
|
|
—
|
|
Various
|
|||||
|
Kalispell, MT
|
8/07
|
14
|
|
2,088
|
|
44,650
|
|
Cinemark
|
|||||
|
Greensboro, NC (1)
|
11/07
|
18
|
|
3,320
|
|
74,517
|
|
Southern
|
|||||
|
Glendora, CA (1)
|
10/08
|
12
|
|
2,186
|
|
50,710
|
|
AMC
|
|||||
|
Suffolk, VA
|
6/09
|
—
|
|
—
|
|
21,406
|
|
Various
|
|||||
|
Ypsilanti, MI
|
12/09
|
20
|
|
5,602
|
|
131,098
|
|
Cinemark
|
|||||
|
Manchester, CT
|
12/09
|
18
|
|
4,317
|
|
87,700
|
|
Cinemark
|
|||||
|
Centreville, VA
|
12/09
|
12
|
|
3,094
|
|
73,500
|
|
Cinemark
|
|||||
|
Davenport, IA
|
12/09
|
18
|
|
3,772
|
|
93,755
|
|
Cinemark
|
|||||
|
Fairfax, VA
|
12/09
|
14
|
|
3,544
|
|
74,689
|
|
Cinemark
|
|||||
|
Flint, MI
|
12/09
|
14
|
|
3,493
|
|
85,911
|
|
Cinemark
|
|||||
|
Hazlet, NJ
|
12/09
|
12
|
|
3,000
|
|
58,300
|
|
Cinemark
|
|||||
|
Huber Heights, OH
|
12/09
|
16
|
|
1,624
|
|
95,830
|
|
Cinemark
|
|||||
|
North Haven, CT
|
12/09
|
14
|
|
1,329
|
|
57,202
|
|
Cinemark
|
|||||
|
Okolona, KY
|
12/09
|
16
|
|
3,264
|
|
79,453
|
|
Cinemark
|
|||||
|
Voorhees, NJ
|
12/09
|
16
|
|
3,098
|
|
62,658
|
|
AMC
|
|||||
|
Louisville, KY
|
12/09
|
20
|
|
3,194
|
|
84,202
|
|
AMC
|
|||||
|
Beaver Creek, OH
|
12/09
|
14
|
|
3,211
|
|
73,634
|
|
Cinemark
|
|||||
|
West Springfield, MA
|
12/09
|
15
|
|
3,775
|
|
111,166
|
|
Cinemark
|
|||||
|
Cincinnati, OH
|
12/09
|
14
|
|
3,152
|
|
63,829
|
|
Cinemark
|
|||||
|
Beaumont, TX
|
6/10
|
15
|
|
2,805
|
|
63,352
|
|
Cinemark
|
|||||
|
Colorado Springs, CO
|
6/10
|
20
|
|
4,597
|
|
109,986
|
|
Cinemark
|
|||||
|
El Paso, TX
|
6/10
|
20
|
|
4,742
|
|
109,030
|
|
Cinemark
|
|||||
|
Subtotal Entertainment Properties, carried over to next page
|
1,662
|
|
316,455
|
|
9,101,613
|
|
|||||||
29
|
Location
|
Acquisition
date
|
Screens
|
Seats
|
Building
(gross sq. ft)
|
Tenant
|
||||||||
|
Entertainment Properties:
|
|||||||||||||
|
Subtotal from previous page
|
n/a
|
1,662
|
|
316,455
|
|
9,101,613
|
|
||||||
|
Grand Prairie, TX
|
6/10
|
15
|
|
2,654
|
|
53,880
|
|
Cinemark
|
|||||
|
Houston, TX
|
6/10
|
16
|
|
4,369
|
|
100,656
|
|
Cinemark
|
|||||
|
McKinney, TX
|
6/10
|
14
|
|
2,603
|
|
56,088
|
|
Cinemark
|
|||||
|
Mishawaka, IN
|
6/10
|
14
|
|
2,999
|
|
62,088
|
|
Cinemark
|
|||||
|
Pasadena, TX
|
6/10
|
20
|
|
3,156
|
|
77,324
|
|
Cinemark
|
|||||
|
Pflugerville, TX
|
6/10
|
20
|
|
4,654
|
|
103,250
|
|
Cinemark
|
|||||
|
Plano, TX
|
6/10
|
10
|
|
1,612
|
|
34,046
|
|
Cinemark
|
|||||
|
Pueblo, CO
|
6/10
|
14
|
|
2,649
|
|
55,231
|
|
Cinemark
|
|||||
|
Redding, CA
|
6/10
|
14
|
|
2,101
|
|
46,793
|
|
Cinemark
|
|||||
|
Virginia Beach, VA (1)
|
12/10
|
7
|
|
640
|
|
20,745
|
|
Beach Cinema Bistro Group, Inc.
|
|||||
|
Dallas, TX
|
12/10
|
—
|
|
—
|
|
33,250
|
|
GMBG
|
|||||
|
Merrimack, NH (14)
|
3/11
|
12
|
|
1,810
|
|
42,400
|
|
Cinemagic
|
|||||
|
Hooksett, NH
|
3/11
|
15
|
|
2,248
|
|
55,000
|
|
Cinemagic
|
|||||
|
Saco, ME
|
3/11
|
13
|
|
2,256
|
|
54,000
|
|
Cinemagic
|
|||||
|
Westbrook, ME
|
3/11
|
16
|
|
2,292
|
|
53,000
|
|
Cinemagic
|
|||||
|
Twin Falls, ID (1)
|
4/11
|
13
|
|
2,100
|
|
38,736
|
|
Cinema West
|
|||||
|
Northbrook, IL (1)
|
7/11
|
—
|
|
—
|
|
39,289
|
|
Pinstripes
|
|||||
|
Jacksonville, FL
|
2/12
|
—
|
|
—
|
|
46,000
|
|
Main Event
|
|||||
|
Indianapolis, IN
|
2/12
|
—
|
|
—
|
|
65,000
|
|
Main Event
|
|||||
|
Dallas, TX (1)
|
3/12
|
11
|
|
1,672
|
|
62,684
|
|
LOOK Cinemas
|
|||||
|
Oakbrook, IL (1)
|
3/12
|
—
|
|
—
|
|
66,442
|
|
Pinstripes
|
|||||
|
Southern Pines, NC
|
6/12
|
10
|
|
1,696
|
|
36,180
|
|
Frank Theatres, LLC
|
|||||
|
Albuquerque, NM (1)
|
6/12
|
16
|
|
3,033
|
|
71,297
|
|
Regal
|
|||||
|
Austin, TX
|
9/12
|
10
|
|
946
|
|
36,000
|
|
Alamo Draft House Cinemas
|
|||||
|
Champaign, IL (1)
|
9/12
|
13
|
|
2,896
|
|
55,063
|
|
AMC
|
|||||
|
Gainesville, VA (1)
|
2/13
|
10
|
|
2,906
|
|
57,943
|
|
Regal
|
|||||
|
Lafayette, LA (1) (13)
|
8/13
|
14
|
|
2,267
|
|
52,957
|
|
Southern
|
|||||
|
New Iberia, LA (1) (13)
|
8/13
|
10
|
|
1,384
|
|
32,760
|
|
Southern
|
|||||
|
San Francisco, CA
|
8/13
|
5
|
|
537
|
|
19,237
|
|
Alamo Draft House Cinemas
|
|||||
|
Tuscaloosa, AL (1)
|
9/13
|
16
|
|
2,912
|
|
65,442
|
|
Cobb
|
|||||
|
Warrenville, IL (2)
|
10/13
|
17
|
|
3,866
|
|
70,000
|
|
Regal
|
|||||
|
Tampa, FL
|
10/13
|
11
|
|
762
|
|
94,774
|
|
AMC
|
|||||
|
Warrenville, IL
|
10/13
|
—
|
|
—
|
|
35,000
|
|
Main Event
|
|||||
|
Opelika, AL
|
11/12
|
13
|
|
2,896
|
|
55,063
|
|
AMC
|
|||||
|
Bedford, IN (15)
|
4/14
|
7
|
|
1,009
|
|
22,152
|
|
Regal
|
|||||
|
Seymour, IN (15)
|
4/14
|
8
|
|
1,216
|
|
24,905
|
|
Regal
|
|||||
|
Wilder, KY (15)
|
4/14
|
14
|
|
991
|
|
54,645
|
|
Regal
|
|||||
|
Bowling Green, KY (15)
|
4/14
|
12
|
|
1,803
|
|
48,658
|
|
Regal
|
|||||
|
New Albany, IN (15)
|
4/14
|
16
|
|
2,824
|
|
68,575
|
|
Regal
|
|||||
|
Clarksville, TN (15)
|
4/14
|
16
|
|
2,824
|
|
73,208
|
|
Regal
|
|||||
|
Williamsport, PA (15)
|
4/14
|
12
|
|
1,872
|
|
44,608
|
|
Regal
|
|||||
|
Noblesville, IN (15)
|
4/14
|
10
|
|
1,303
|
|
33,892
|
|
Regal
|
|||||
|
Moline, IL (15)
|
4/14
|
14
|
|
2,270
|
|
54,817
|
|
Regal
|
|||||
|
O'Fallon, MO (15)
|
4/14
|
14
|
|
2,114
|
|
51,958
|
|
Regal
|
|||||
|
McDonough, GA (15)
|
4/14
|
16
|
|
2,602
|
|
57,941
|
|
Regal
|
|||||
|
Sterling Heights, MI
|
12/14
|
—
|
|
—
|
|
—
|
|
MJR Digital Cinemas
|
|||||
|
Virginia Beach, VA
|
2/15
|
12
|
|
1,200
|
|
43,764
|
|
Regal
|
|||||
|
Yulee, FL
|
2/15
|
10
|
|
1,796
|
|
36,200
|
|
AMC
|
|||||
|
Schaumburg, IL
|
4/15
|
—
|
|
—
|
|
25,052
|
|
PBS Schaumburg, LLC
|
|||||
|
Jacksonville, FL
|
5/15
|
24
|
|
1,951
|
|
82,064
|
|
AMC
|
|||||
|
Denham Springs, LA (1)
|
5/15
|
14
|
|
2,200
|
|
46,360
|
|
Southern
|
|||||
|
Crystal Lake, IL
|
7/15
|
16
|
|
1,173
|
|
73,000
|
|
Regal
|
|||||
|
Laredo, TX
|
12/15
|
7
|
|
816
|
|
31,800
|
|
Alamo Draft House Cinemas
|
|||||
|
Marietta, GA
|
2/16
|
—
|
|
—
|
|
105,470
|
|
Andretti Indoor Karting & Games
|
|||||
|
Delmont, PA
|
6/16
|
12
|
|
1,720
|
|
45,319
|
|
AMC
|
|||||
|
Subtotal Entertainment Properties, carried over to next page
|
2,265
|
|
414,055
|
|
11,973,619
|
|
|||||||
30
|
Location
|
Acquisition
date
|
Screens
|
Seats
|
Building
(gross sq. ft)
|
Tenant
|
||||||||
|
Entertainment Properties:
|
|||||||||||||
|
Subtotal from previous page
|
n/a
|
2,265
|
|
414,055
|
|
11,973,619
|
|
||||||
|
Kennewick, WA
|
6/16
|
12
|
|
1,722
|
|
47,004
|
|
AMC
|
|||||
|
Franklin, TN
|
6/16
|
20
|
|
3,300
|
|
109,956
|
|
AMC
|
|||||
|
Mobile, AL
|
6/16
|
16
|
|
1,885
|
|
60,471
|
|
AMC
|
|||||
|
El Paso, TX
|
6/16
|
16
|
|
1,792
|
|
60,283
|
|
AMC
|
|||||
|
Edinburg, TX
|
6/16
|
20
|
|
2,500
|
|
87,539
|
|
AMC
|
|||||
|
Hendersonville, TN
|
7/16
|
16
|
|
3,027
|
|
65,966
|
|
Regal
|
|||||
|
Detroit, MI
|
11/16
|
9
|
|
1,026
|
|
56,804
|
|
Emagine Entertainment
|
|||||
|
Subtotal Entertainment Properties
|
2,374
|
|
429,307
|
|
12,461,642
|
|
|||||||
|
Education Properties:
|
|||||||||||||
|
Columbus, OH
|
9/07
|
—
|
|
—
|
|
71,949
|
|
Imagine Schools, Inc.
|
|||||
|
Mesa, AZ
|
9/07
|
—
|
|
—
|
|
45,214
|
|
Imagine Schools, Inc.
|
|||||
|
Surprise, AZ
|
9/07
|
—
|
|
—
|
|
45,578
|
|
Imagine Schools, Inc.
|
|||||
|
Las Vegas, NV
|
10/07
|
—
|
|
—
|
|
59,060
|
|
Imagine Schools, Inc.
|
|||||
|
Groveport, OH
|
10/07
|
—
|
|
—
|
|
78,000
|
|
Imagine Schools, Inc.
|
|||||
|
Cleveland, OH
|
10/07
|
—
|
|
—
|
|
57,652
|
|
Harvard Avenue Community School
|
|||||
|
Washington, DC
|
10/07
|
—
|
|
—
|
|
34,962
|
|
Imagine Schools, Inc.
|
|||||
|
Phoenix, AZ
|
10/07
|
—
|
|
—
|
|
47,186
|
|
Imagine Schools, Inc.
|
|||||
|
Groveport, OH
|
1/10
|
—
|
|
—
|
|
72,346
|
|
Imagine Schools, Inc.
|
|||||
|
Baton Rouge, LA
|
3/11
|
—
|
|
—
|
|
54,975
|
|
CSDC
|
|||||
|
Goodyear, AZ
|
4/11
|
—
|
|
—
|
|
37,502
|
|
Bradley Project Development
|
|||||
|
Gilbert, AZ
|
6/11
|
—
|
|
—
|
|
61,149
|
|
PCI ALA Gilbert LLC
|
|||||
|
Phoenix, AZ
|
6/11
|
—
|
|
—
|
|
24,582
|
|
Phoenix Charter Properties
|
|||||
|
Broomfield, CO
|
8/11
|
—
|
|
—
|
|
60,818
|
|
Prospect Ridge Acad Project Development
|
|||||
|
Phoenix, AZ
|
11/11
|
—
|
|
—
|
|
56,724
|
|
Skyline Schools Project Development
|
|||||
|
Salt Lake City, UT
|
3/12
|
—
|
|
—
|
|
45,125
|
|
Pacific Heritage Acad Project Development
|
|||||
|
Hurricane, UT
|
3/12
|
—
|
|
—
|
|
25,324
|
|
Valley Acad Project Development
|
|||||
|
Buckeye, AZ
|
4/12
|
—
|
|
—
|
|
85,154
|
|
Schoolhouse Buckeye LLC
|
|||||
|
Gilbert, AZ
|
5/12
|
—
|
|
—
|
|
211,440
|
|
Schoolhouse Queen Creek LLC
|
|||||
|
Tarboro, NC
|
7/12
|
—
|
|
—
|
|
110,000
|
|
NE Carolina Prep Acad Project Development
|
|||||
|
Chester Upland, PA
|
3/13
|
—
|
|
—
|
|
25,200
|
|
CSMI
|
|||||
|
Hollywood, SC
|
3/13
|
—
|
|
—
|
|
59,181
|
|
Lowcountry Leadership Project Development
|
|||||
|
Lake Pleasant, AZ
|
3/13
|
—
|
|
—
|
|
15,309
|
|
CLA Properties
|
|||||
|
Camden, NJ
|
4/13
|
—
|
|
—
|
|
59,024
|
|
CSMI
|
|||||
|
Vista, CA
|
5/13
|
—
|
|
—
|
|
26,454
|
|
Bella Mente Project Development
|
|||||
|
Columbus, OH
|
5/13
|
—
|
|
—
|
|
41,575
|
|
Imagine Schools, Inc.
|
|||||
|
Dayton, OH
|
5/13
|
—
|
|
—
|
|
52,112
|
|
Imagine Schools, Inc.
|
|||||
|
Toledo, OH
|
5/13
|
—
|
|
—
|
|
48,375
|
|
Imagine Schools, Inc.
|
|||||
|
Gilbert, AZ
|
5/13
|
—
|
|
—
|
|
52,723
|
|
CAFA Gilbert Investments
|
|||||
|
Chicago, IL
|
5/13
|
—
|
|
—
|
|
62,900
|
|
Concept Schools
|
|||||
|
Colorado Springs, CO
|
6/13
|
—
|
|
—
|
|
110,000
|
|
GVA CS Project Development
|
|||||
|
Chandler, AZ
|
7/13
|
—
|
|
—
|
|
70,000
|
|
Skyline Chandler Project Development
|
|||||
|
Columbus, OH
|
11/13
|
—
|
|
—
|
|
67,043
|
|
Imagine Schools, Inc.
|
|||||
|
Goodyear, AZ
|
6/13
|
—
|
|
—
|
|
20,746
|
|
CLA Properties
|
|||||
|
Salt Lake City, UT
|
7/13
|
—
|
|
—
|
|
160,000
|
|
Schoolhouse Galleria LLC
|
|||||
|
Oklahoma City, OK
|
8/13
|
—
|
|
—
|
|
25,737
|
|
CLA Properties
|
|||||
|
Las Vegas, NV
|
9/13
|
—
|
|
—
|
|
16,534
|
|
CLA Properties
|
|||||
|
Coppell, TX
|
9/13
|
—
|
|
—
|
|
25,737
|
|
CLA Properties
|
|||||
|
Las Vegas, NV
|
9/13
|
—
|
|
—
|
|
25,737
|
|
CLA Properties
|
|||||
|
Palm Beach, FL
|
10/13
|
—
|
|
—
|
|
80,000
|
|
Discovery Schools
|
|||||
|
Mesa, AZ
|
12/13
|
—
|
|
—
|
|
34,647
|
|
iLEAD Lancaster Project Development
|
|||||
|
Kernersville, NC
|
12/13
|
—
|
|
—
|
|
38,448
|
|
NC Leadership Project Development
|
|||||
|
San Jose, CA
|
12/13
|
—
|
|
—
|
|
80,604
|
|
Highmark Independent LLC
|
|||||
|
Brooklyn, NY (1)
|
12/13
|
—
|
|
—
|
|
89,556
|
|
Highmark Independent LLC
|
|||||
|
Subtotal Education Properties, carried over to next page
|
—
|
|
—
|
|
2,572,382
|
|
|||||||
31
|
Location
|
Acquisition
date
|
Screens
|
Seats
|
Building
(gross sq. ft)
|
Tenant
|
||||||||
|
Education Properties:
|
|||||||||||||
|
Subtotal from previous page
|
n/a
|
—
|
|
—
|
|
2,572,382
|
|
||||||
|
Mesa, AZ
|
1/14
|
—
|
|
—
|
|
25,744
|
|
CLA Properties
|
|||||
|
Fort Collins, CO
|
2/14
|
—
|
|
—
|
|
51,180
|
|
GVA FC Project Development
|
|||||
|
Chicago, IL
|
2/14
|
—
|
|
—
|
|
102,000
|
|
British Schools of America
|
|||||
|
Wilson, NC
|
3/14
|
—
|
|
—
|
|
29,000
|
|
Wilson Prep Project Development
|
|||||
|
Gilbert, AZ
|
3/14
|
—
|
|
—
|
|
25,737
|
|
CLA Properties
|
|||||
|
Baker, LA
|
4/14
|
—
|
|
—
|
|
34,033
|
|
ICE Project Development LLC
|
|||||
|
Charlotte, NC
|
5/14
|
—
|
|
—
|
|
38,607
|
|
Bradford Charter Holdings LLC
|
|||||
|
Chicago, IL
|
5/14
|
—
|
|
—
|
|
65,885
|
|
Concept Schools
|
|||||
|
Cedar Park, TX
|
7/14
|
—
|
|
—
|
|
25,737
|
|
CLA Properties
|
|||||
|
High Point, NC
|
7/14
|
—
|
|
—
|
|
39,000
|
|
Phoenix Academy Project Development
|
|||||
|
Thornton, CO
|
7/14
|
—
|
|
—
|
|
25,737
|
|
CLA Properties
|
|||||
|
Chicago, IL
|
7/14
|
—
|
|
—
|
|
16,000
|
|
TGS Holdings, LLC
|
|||||
|
Chandler, AZ
|
8/14
|
—
|
|
—
|
|
31,240
|
|
American Charter Development
|
|||||
|
Centennial, CO
|
8/14
|
—
|
|
—
|
|
25,737
|
|
CLA Properties
|
|||||
|
Port Royal, SC
|
9/14
|
—
|
|
—
|
|
28,070
|
|
Lowcountry Charter Holdings LLC
|
|||||
|
McKinney, TX
|
11/14
|
—
|
|
—
|
|
33,237
|
|
CLA Properties
|
|||||
|
Parker, CO
|
1/15
|
—
|
|
—
|
|
37,180
|
|
Global Village Academy
|
|||||
|
Parker, CO
|
1/15
|
—
|
|
—
|
|
6,260
|
|
Global Village International
|
|||||
|
Littleton, CO
|
1/15
|
—
|
|
—
|
|
8,777
|
|
Global Village International
|
|||||
|
Lakewood, CO
|
1/15
|
—
|
|
—
|
|
4,995
|
|
Global Village International
|
|||||
|
Castle Rock, CO
|
1/15
|
—
|
|
—
|
|
8,580
|
|
Global Village International
|
|||||
|
Arvada, CO
|
1/15
|
—
|
|
—
|
|
4,995
|
|
Global Village International
|
|||||
|
Memphis, TN
|
2/15
|
—
|
|
—
|
|
135,959
|
|
DuBois Lanier Project Development LLC
|
|||||
|
Macon, GA
|
2/15
|
—
|
|
—
|
|
64,362
|
|
Macon Charter Academy
|
|||||
|
Palm Bay, FL
|
3/15
|
—
|
|
—
|
|
47,895
|
|
Pineapple Cove Classical Academy
|
|||||
|
Emeryville, CA
|
3/15
|
—
|
|
—
|
|
8,520
|
|
LePort Educational Institute, Inc.
|
|||||
|
Rock Hill, SC
|
4/15
|
—
|
|
—
|
|
50,000
|
|
Riverwalk Academy
|
|||||
|
Lafayette, CO
|
4/15
|
—
|
|
—
|
|
4,950
|
|
Global Village International
|
|||||
|
East Point, GA
|
5/15
|
—
|
|
—
|
|
40,000
|
|
Fulton Leadership Academy
|
|||||
|
High Point, NC
|
6/15
|
—
|
|
—
|
|
60,000
|
|
Phoenix Academy Project Development
|
|||||
|
McLean, VA
|
6/15
|
—
|
|
—
|
|
215,275
|
|
BASIS Independent
|
|||||
|
Maple Grove, MN
|
8/15
|
—
|
|
—
|
|
33,237
|
|
CLA Properties
|
|||||
|
Memphis, TN
|
9/15
|
—
|
|
—
|
|
37,310
|
|
Du Bois Consortium
|
|||||
|
Carmel, IN
|
9/15
|
—
|
|
—
|
|
33,237
|
|
CLA Properties
|
|||||
|
Bridgeton, NJ
|
9/15
|
—
|
|
—
|
|
20,000
|
|
Bridgeton Project Development LLC
|
|||||
|
Atlanta, GA
|
10/15
|
—
|
|
—
|
|
13,797
|
|
Nobel Learning Communities Inc
|
|||||
|
Atlanta, GA
|
10/15
|
—
|
|
—
|
|
13,930
|
|
Nobel Learning Communities Inc
|
|||||
|
Macon, GA
|
11/15
|
—
|
|
—
|
|
45,045
|
|
Cirrus Education Group, Inc.
|
|||||
|
Galloway, NJ
|
12/15
|
—
|
|
—
|
|
26,872
|
|
CSMI, LLC
|
|||||
|
Bronx, NY
|
1/16
|
—
|
|
—
|
|
20,000
|
|
Family Life Academy Charter School
|
|||||
|
Parker, CO
|
4/16
|
—
|
|
—
|
|
52,183
|
|
Parker Performing Arts School
|
|||||
|
Holland, OH
|
4/16
|
—
|
|
—
|
|
30,120
|
|
iLead Schools Development
|
|||||
|
Louisville, KY
|
8/16
|
—
|
|
—
|
|
8,983
|
|
Cadence Education
|
|||||
|
Louisville, KY
|
8/16
|
—
|
|
—
|
|
6,319
|
|
Cadence Education
|
|||||
|
Mission Viejo, CA
|
9/16
|
—
|
|
—
|
|
21,286
|
|
Stratford Schools
|
|||||
|
Louisville, KY
|
12/16
|
—
|
|
—
|
|
15,936
|
|
Cadence Education
|
|||||
|
Bala Cynwyd, PA
|
12/16
|
—
|
|
—
|
|
20,881
|
|
Cadence Education
|
|||||
|
Subtotal Education Properties
|
—
|
|
—
|
|
4,266,210
|
|
|||||||
|
Recreation Properties:
|
|||||||||||||
|
Bellfontaine, OH (1) (16)
|
11/05
|
—
|
|
—
|
|
48,427
|
|
Peak Resorts, Inc.
|
|||||
|
Allen, TX (1)
|
2/12
|
—
|
|
—
|
|
63,242
|
|
Topgolf USA
|
|||||
|
Dallas, TX (1)
|
2/12
|
—
|
|
—
|
|
46,400
|
|
Topgolf USA
|
|||||
|
Houston, TX (1)
|
9/12
|
—
|
|
—
|
|
65,000
|
|
Topgolf USA
|
|||||
|
McHenry, MD (1) (18)
|
12/12
|
—
|
|
—
|
|
113,135
|
|
Everbright Pacific, LLC
|
|||||
|
Subtotal Recreation Properties, carried over to next page
|
—
|
|
—
|
|
336,204
|
|
|||||||
32
|
Location
|
Acquisition
date
|
Screens
|
Seats
|
Building
(gross sq. ft)
|
Tenant
|
||||||||
|
Recreation Properties:
|
|||||||||||||
|
Subtotal from previous page
|
n/a
|
—
|
|
—
|
|
336,204
|
|
||||||
|
Colony, TX
|
12/12
|
—
|
|
—
|
|
64,100
|
|
Topgolf USA
|
|||||
|
Tannersville, PA (19)
|
9/13
|
—
|
|
—
|
|
155,669
|
|
CBK
|
|||||
|
Alpharetta, GA
|
5/13
|
—
|
|
—
|
|
64,232
|
|
Topgolf USA
|
|||||
|
Scottsdale, AZ (1)
|
6/13
|
—
|
|
—
|
|
59,850
|
|
Topgolf USA
|
|||||
|
Spring, TX
|
7/13
|
—
|
|
—
|
|
64,232
|
|
Topgolf USA
|
|||||
|
San Antonio, TX (1)
|
12/13
|
—
|
|
—
|
|
64,232
|
|
Topgolf USA
|
|||||
|
Tampa, FL (1)
|
2/14
|
—
|
|
—
|
|
64,232
|
|
Topgolf USA
|
|||||
|
Gilbert, AZ
|
2/14
|
—
|
|
—
|
|
64,232
|
|
Topgolf USA
|
|||||
|
Overland Park, KS
|
5/14
|
—
|
|
—
|
|
65,000
|
|
Topgolf USA
|
|||||
|
Ashburn, VA (1)
|
6/14
|
—
|
|
—
|
|
64,232
|
|
Topgolf USA
|
|||||
|
Atlanta, GA
|
6/14
|
—
|
|
—
|
|
65,000
|
|
Topgolf USA
|
|||||
|
Centennial, CO
|
6/14
|
—
|
|
—
|
|
64,232
|
|
Topgolf USA
|
|||||
|
Naperville, IL
|
8/14
|
—
|
|
—
|
|
64,232
|
|
Topgolf USA
|
|||||
|
Oklahoma City, OK
|
9/14
|
—
|
|
—
|
|
65,000
|
|
Topgolf USA
|
|||||
|
Webster, TX
|
11/14
|
—
|
|
—
|
|
64,232
|
|
Topgolf USA
|
|||||
|
Virginia Beach, VA
|
12/14
|
—
|
|
—
|
|
64,232
|
|
Topgolf USA
|
|||||
|
Wintergreen, VA (1) (20)
|
2/15
|
—
|
|
—
|
|
164,612
|
|
Pacific Group Resorts Inc.
|
|||||
|
Edison, NJ (1)
|
4/15
|
—
|
|
—
|
|
65,000
|
|
Topgolf USA
|
|||||
|
Tannersville, PA (1)
|
5/15
|
—
|
|
—
|
|
580,527
|
|
CBK Lodge & CBH20
|
|||||
|
Jacksonville, FL
|
9/15
|
—
|
|
—
|
|
65,000
|
|
Topgolf USA
|
|||||
|
Roseville, CA
|
10/15
|
—
|
|
—
|
|
64,232
|
|
Topgolf USA
|
|||||
|
Portland, OR (1)
|
11/15
|
—
|
|
—
|
|
64,232
|
|
Topgolf USA
|
|||||
|
Subtotal Recreation Properties
|
—
|
|
—
|
|
2,456,746
|
|
|||||||
|
Other Properties:
|
|||||||||||||
|
Kiamesha Lake, NY (21)
|
07/10
|
—
|
|
—
|
|
—
|
|
Montreign Operating Company, LLC
|
|||||
|
Subtotal Other Properties
|
—
|
|
|
—
|
|
—
|
|
||||||
|
Total
|
2,374
|
|
429,307
|
|
19,184,598
|
|
|||||||
|
(1)
|
Third-party ground leased property. Although we are the tenant under a ground lease and have assumed responsibility for performing the obligations thereunder, pursuant to the lease, the tenant is responsible for performing our obligations under the ground lease.
|
|
(2)
|
In addition to the theatre property itself, we have acquired land parcels adjacent to the theatre property, which we have or intend to lease or sell to restaurant or other entertainment themed operators.
|
|
(3)
|
Property is included as security for a $8.6 million mortgage note payable.
|
|
(4)
|
Property is included as security for a $9.3 million mortgage note payable.
|
|
(5)
|
Property is included as security for a $4.0 million mortgage note payable.
|
|
(6)
|
Property is included as security for a $8.2 million mortgage note payable.
|
|
(7)
|
Property is included as security for a $3.8 million mortgage note payable.
|
|
(8)
|
Property is included as security for a $14.5 million mortgage note payable.
|
|
(9)
|
Property is included as security for a $12.1 million mortgage note payable.
|
|
(10)
|
Property is included as security for a $10.0 million mortgage note payable.
|
|
(11)
|
Property is included as security for a $12.5 million mortgage note payable.
|
|
(12)
|
Property is included as security for $10.6 million bond payable.
|
|
(13)
|
Property is included as security for a $14.4 million bond payable.
|
|
(14)
|
Property in included as security for a $3.3 million mortgage note payable.
|
|
(15)
|
Property is included as security for a $88.6 million mortgage note payable.
|
|
(16)
|
Property includes approximately 60 skiable acres.
|
|
(17)
|
Property is located in Ontario, Canada.
|
|
(18)
|
Property includes 690 skiable acres.
|
|
(19)
|
Property includes 160 skiable acres.
|
|
(20)
|
Property includes 129 skiable acres.
|
|
(21)
|
Property includes 1,735 acres.
|
33
As of
December 31, 2016
, our owned portfolio of entertainment properties consisted of
12.5 million
square feet and was 99% leased, including
10.5 million
square feet of owned megaplex theatre properties that were
100%
leased. The following table sets forth lease expirations regarding EPR’s owned megaplex theatre portfolio as of
December 31, 2016
(dollars in thousands).
|
Megaplex Theatre Portfolio
|
||||||||||||||
|
Year
|
Number of
Properties
|
Square
Footage
|
Revenue for the Year
Ended December 31, 2016 (1)
|
% of Company's Total
Revenue
|
||||||||||
|
2017
|
3
|
|
320,060
|
|
$
|
8,409
|
|
1.7
|
%
|
|||||
|
2018
|
15
|
|
1,288,401
|
|
25,493
|
|
5.1
|
%
|
||||||
|
2019
|
3
|
|
286,486
|
|
7,877
|
|
1.6
|
%
|
||||||
|
2020
|
4
|
|
275,122
|
|
7,517
|
|
1.5
|
%
|
||||||
|
2021
|
8
|
|
566,379
|
|
10,898
|
|
2.2
|
%
|
||||||
|
2022
|
13
|
|
956,935
|
|
24,086
|
|
4.9
|
%
|
||||||
|
2023
|
6
|
|
563,841
|
|
11,631
|
|
2.4
|
%
|
||||||
|
2024
|
13
|
|
1,064,337
|
|
25,837
|
|
5.2
|
%
|
||||||
|
2025
|
5
|
|
309,815
|
|
10,920
|
|
2.2
|
%
|
||||||
|
2026
|
8
|
|
468,174
|
|
12,580
|
|
2.6
|
%
|
||||||
|
2027
|
15
|
|
(2)
|
812,186
|
|
19,006
|
|
3.9
|
%
|
|||||
|
2028
|
5
|
|
303,851
|
|
7,447
|
|
1.5
|
%
|
||||||
|
2029
|
19
|
|
(3)
|
1,548,496
|
|
23,543
|
|
4.8
|
%
|
|||||
|
2030
|
5
|
|
344,574
|
|
8,462
|
|
1.7
|
%
|
||||||
|
2031
|
11
|
|
(4)
|
738,229
|
|
13,514
|
|
2.7
|
%
|
|||||
|
2032
|
3
|
|
119,566
|
|
2,097
|
|
0.4
|
%
|
||||||
|
2033
|
6
|
|
313,641
|
|
4,370
|
|
0.9
|
%
|
||||||
|
2034
|
2
|
|
111,493
|
|
1,977
|
|
0.4
|
%
|
||||||
|
2035
|
2
|
|
51,037
|
|
2,297
|
|
0.5
|
%
|
||||||
|
2036
|
2
|
|
103,164
|
|
850
|
|
0.2
|
%
|
||||||
|
Thereafter
|
—
|
|
—
|
|
—
|
|
—
|
%
|
||||||
|
148
|
|
10,545,787
|
|
$
|
228,811
|
|
46.4
|
%
|
||||||
|
(1)
|
Consists of rental revenue and tenant reimbursements.
|
|
(2)
|
Eleven of these properties are leased under a master lease.
|
|
(3)
|
Fifteen of these theatre properties are leased under a master lease.
|
|
(4)
|
Four of these theatre properties are leased under a master lease and five of these theatre properties are leased under a separate master lease.
|
34
As of
December 31, 2016
, our owned portfolio of education properties consisted of
4.3 million
square feet and was
100%
leased. The following table sets forth lease expirations regarding EPR’s owned education portfolio as of
December 31, 2016
(dollars in thousands).
|
Education Portfolio
|
||||||||||||||
|
Year
|
Number of
Properties
|
Square
Footage
|
Revenue for the Year
Ended December 31, 2016
|
% of Company's Total
Revenue
|
||||||||||
|
2017
|
1
|
|
59,024
|
|
$
|
1,810
|
|
0.4
|
%
|
|||||
|
2018
|
1
|
|
26,872
|
|
190
|
|
—
|
%
|
||||||
|
2019
|
—
|
|
—
|
|
—
|
|
—
|
%
|
||||||
|
2020
|
—
|
|
—
|
|
—
|
|
—
|
%
|
||||||
|
2021
|
—
|
|
—
|
|
—
|
|
—
|
%
|
||||||
|
2022
|
—
|
|
—
|
|
—
|
|
—
|
%
|
||||||
|
2023
|
—
|
|
—
|
|
—
|
|
—
|
%
|
||||||
|
2024
|
—
|
|
—
|
|
—
|
|
—
|
%
|
||||||
|
2025
|
—
|
|
—
|
|
—
|
|
—
|
%
|
||||||
|
2026
|
—
|
|
—
|
|
—
|
|
—
|
%
|
||||||
|
2027
|
—
|
|
—
|
|
—
|
|
—
|
%
|
||||||
|
2028
|
—
|
|
—
|
|
—
|
|
—
|
%
|
||||||
|
2029
|
—
|
|
—
|
|
—
|
|
—
|
%
|
||||||
|
2030
|
—
|
|
—
|
|
—
|
|
—
|
%
|
||||||
|
2031
|
12
|
|
(1)
|
374,256
|
|
7,206
|
|
1.5
|
%
|
|||||
|
2032
|
12
|
|
(2)
|
874,942
|
|
16,875
|
|
3.4
|
%
|
|||||
|
2033
|
10
|
|
(3)
|
553,560
|
|
9,420
|
|
1.9
|
%
|
|||||
|
2034
|
14
|
|
773,650
|
|
24,175
|
|
4.9
|
%
|
||||||
|
2035
|
24
|
|
(4)
|
891,245
|
|
20,425
|
|
4.1
|
%
|
|||||
|
2036
|
14
|
|
630,187
|
|
9,814
|
|
2.0
|
%
|
||||||
|
Thereafter
|
3
|
|
82,474
|
|
992
|
|
0.2
|
%
|
||||||
|
91
|
|
4,266,210
|
|
$
|
90,907
|
|
18.4
|
%
|
||||||
|
(1)
|
Four of these education properties are leased under a master lease to Imagine.
|
|
(2)
|
Four of these education properties are leased under a master lease to Imagine.
|
|
(3)
|
Three of these education properties are leased under a master lease to Imagine.
|
|
(4)
|
One of these education properties are leased under a master lease to Imagine.
|
35
As of
December 31, 2016
, our owned portfolio of recreation properties consisted of approximately
2.5 million
square feet of buildings and 1,239 acres of land, and was 100% leased. The following table sets forth lease expirations regarding EPR’s owned recreation portfolio as of
December 31, 2016
(dollars in thousands).
|
Recreation Portfolio
|
||||||||||||||
|
Year
|
Number of
Properties
|
Square
Footage
|
Revenue for the Year
Ended December 31, 2016
|
% of Company's Total
Revenue
|
||||||||||
|
2017
|
—
|
|
—
|
|
$
|
—
|
|
—
|
%
|
|||||
|
2018
|
—
|
|
—
|
|
—
|
|
—
|
%
|
||||||
|
2019
|
—
|
|
—
|
|
—
|
|
—
|
%
|
||||||
|
2020
|
—
|
|
—
|
|
—
|
|
—
|
%
|
||||||
|
2021
|
—
|
|
—
|
|
—
|
|
—
|
%
|
||||||
|
2022
|
—
|
|
—
|
|
—
|
|
—
|
%
|
||||||
|
2023
|
—
|
|
—
|
|
—
|
|
—
|
%
|
||||||
|
2024
|
—
|
|
—
|
|
—
|
|
—
|
%
|
||||||
|
2025
|
—
|
|
—
|
|
—
|
|
—
|
%
|
||||||
|
2026
|
—
|
|
—
|
|
—
|
|
—
|
%
|
||||||
|
2027
|
1
|
|
113,135
|
|
2,896
|
|
0.6
|
%
|
||||||
|
2028
|
—
|
|
—
|
|
—
|
|
—
|
%
|
||||||
|
2029
|
—
|
|
—
|
|
—
|
|
—
|
%
|
||||||
|
2030
|
—
|
|
—
|
|
—
|
|
—
|
%
|
||||||
|
2031
|
—
|
|
—
|
|
—
|
|
—
|
%
|
||||||
|
2032
|
3
|
|
174,642
|
|
4,506
|
|
0.9
|
%
|
||||||
|
2033
|
1
|
|
64,100
|
|
1,676
|
|
0.3
|
%
|
||||||
|
2034
|
6
|
|
365,205
|
|
15,342
|
|
3.1
|
%
|
||||||
|
2035
|
11
|
|
1,481,200
|
|
40,160
|
|
8.2
|
%
|
||||||
|
2036
|
4
|
|
258,464
|
|
2,110
|
|
0.4
|
%
|
||||||
|
Thereafter
|
—
|
|
—
|
|
—
|
|
—
|
%
|
||||||
|
26
|
|
2,456,746
|
|
$
|
66,690
|
|
13.5
|
%
|
||||||
36
Our properties are located in 40 states, the District of Columbia and in the Canadian province of Ontario. The following table sets forth certain state-by-state and Ontario, Canada information regarding our owned real estate portfolio as of
December 31, 2016
(dollars in thousands). This data does not include the public charter schools recorded as a direct financing lease.
|
Location
|
Building (gross
sq. ft)
|
Rental revenue for the year ended
December 31, 2016 (1)
|
% of
Rental
Revenue
|
|||||||
|
Texas
|
2,300,965
|
|
$
|
51,625
|
|
12.4
|
%
|
|||
|
Virginia
|
1,198,821
|
|
22,135
|
|
5.3
|
%
|
||||
|
Ontario, Canada
|
1,151,465
|
|
31,856
|
|
7.7
|
%
|
||||
|
Florida
|
1,073,554
|
|
24,312
|
|
5.9
|
%
|
||||
|
California
|
1,067,227
|
|
36,434
|
|
8.8
|
%
|
||||
|
Arizona
|
1,050,674
|
|
23,974
|
|
5.8
|
%
|
||||
|
Illinois
|
1,032,267
|
|
25,677
|
|
6.2
|
%
|
||||
|
Colorado
|
854,327
|
|
17,704
|
|
4.3
|
%
|
||||
|
Pennsylvania
|
872,204
|
|
20,691
|
|
5.0
|
%
|
||||
|
North Carolina
|
738,430
|
|
15,755
|
|
3.8
|
%
|
||||
|
Louisiana
|
661,262
|
|
12,880
|
|
3.1
|
%
|
||||
|
Michigan
|
654,127
|
|
12,183
|
|
2.9
|
%
|
||||
|
Georgia
|
560,925
|
|
10,334
|
|
2.5
|
%
|
||||
|
New York
|
555,632
|
|
25,712
|
|
6.2
|
%
|
||||
|
Tennessee
|
504,729
|
|
7,227
|
|
1.7
|
%
|
||||
|
Ohio
|
410,101
|
|
6,199
|
|
1.5
|
%
|
||||
|
New Jersey
|
387,320
|
|
7,319
|
|
1.8
|
%
|
||||
|
Indiana
|
355,549
|
|
4,813
|
|
1.1
|
%
|
||||
|
Kentucky
|
298,196
|
|
4,956
|
|
1.2
|
%
|
||||
|
Kansas
|
282,972
|
|
7,106
|
|
1.7
|
%
|
||||
|
Alabama
|
271,176
|
|
5,271
|
|
1.3
|
%
|
||||
|
South Carolina
|
256,786
|
|
4,278
|
|
1.0
|
%
|
||||
|
Utah
|
230,449
|
|
3,638
|
|
0.9
|
%
|
||||
|
Idaho
|
179,036
|
|
2,714
|
|
0.6
|
%
|
||||
|
Maryland
|
176,441
|
|
4,151
|
|
1.0
|
%
|
||||
|
Connecticut
|
144,902
|
|
2,789
|
|
0.7
|
%
|
||||
|
Mississippi
|
116,900
|
|
3,121
|
|
0.8
|
%
|
||||
|
Missouri
|
112,376
|
|
1,970
|
|
0.5
|
%
|
||||
|
Massachusetts
|
111,166
|
|
766
|
|
0.2
|
%
|
||||
|
Nebraska
|
107,402
|
|
1,836
|
|
0.4
|
%
|
||||
|
Maine
|
107,000
|
|
1,842
|
|
0.4
|
%
|
||||
|
New Hampshire
|
97,400
|
|
2,245
|
|
0.5
|
%
|
||||
|
Iowa
|
93,755
|
|
1,155
|
|
0.3
|
%
|
||||
|
Oklahoma
|
90,737
|
|
3,023
|
|
0.7
|
%
|
||||
|
Arkansas
|
79,330
|
|
1,586
|
|
0.4
|
%
|
||||
|
New Mexico
|
71,297
|
|
1,251
|
|
0.3
|
%
|
||||
|
Oregon
|
64,232
|
|
776
|
|
0.2
|
%
|
||||
|
Washington
|
47,004
|
|
377
|
|
0.1
|
%
|
||||
|
Montana
|
44,650
|
|
960
|
|
0.2
|
%
|
||||
|
Nevada
|
42,271
|
|
1,841
|
|
0.4
|
%
|
||||
|
Minnesota
|
33,237
|
|
702
|
|
0.2
|
%
|
||||
|
18,488,294
|
|
$
|
415,184
|
|
100.0
|
%
|
||||
|
(1)
|
Consists of rental revenue and tenant reimbursements.
|
37
Office Location
Our executive office is located in Kansas City, Missouri and is leased from a third-party landlord. The office occupies approximately 55 thousand square feet with projected 2017 annual rent of approximately
$856 thousand
. The lease is scheduled to expire on September 30, 2026, with two separate five-year extension options available.
Tenants and Leases
Our existing leases on rental property (on a consolidated basis - excluding unconsolidated joint venture properties) provide for aggregate annual minimum rentals of approximately
$398.9 million
(not including periodic rent escalations, percentage rent or straight-line rent). Our entertainment portfolio has an average remaining base term life of approximately nine years, our education portfolio has an average remaining base term life of approximately 17 years and our recreation portfolio has an average remaining base term life of approximately 18 years. These leases may be extended for predetermined extension terms at the option of the tenant. Our leases are typically triple-net leases that require the tenant to pay substantially all expenses associated with the operation of the properties, including taxes, other governmental charges, insurance, utilities, service, maintenance and any ground lease payments.
Property Acquisitions and Developments in 2016
Our property acquisitions and developments in 2016 consisted primarily of spending in each of our primary segments of Entertainment, Education and Recreation. The percentage of total investment spending related to build-to-suit projects, including investment spending for mortgage notes, decreased to approximately 72% in 2016 from approximately 81% in 2015. While build-to-suit projects remain a significant component of our investment spending, we expect this percentage to decrease in 2017 as well due to our proposed transaction with CNL as discussed in Item 7 - "Management's Discussion and Analysis of Financial Condition and Results of Operations - Recent Developments". Many of our build-to-suit opportunities come to us from our existing strong relationships with property operators and developers and we expect to continue to pursue these opportunities.
Prior proposed casino and resort developers Concord Associates, L.P., Concord Resort, LLC and Concord Kiamesha LLC, which are affiliates of Louis Cappelli and from whom the Company acquired the Adelaar resort property (the "Cappelli Group"), commenced litigation against the Company beginning in 2011 regarding matters relating to the acquisition of that property and our relationship with Empire Resorts, Inc. and certain of its subsidiaries. This litigation involves three separate cases filed in state and federal court. Two of the cases, a state and the federal case, are closed and resulted in no liability to the Company.
The remaining case was filed on October 20, 2011 by the Cappelli Group against the Company and two of its affiliates in the Supreme Court of the State of New York, County of Westchester (the "Westchester Action"), asserting a claim for breach of contract and the implied covenant of good faith, and seeking damages of at least $800 million, based on allegations that the Company had breached an agreement (the "Casino Development Agreement"), dated June 18, 2010. The Company moved to dismiss the complaint in the Westchester Action based on a decision issued by the Sullivan County Supreme Court (one of the two closed cases discussed above) on June 30, 2014, as affirmed by the Appellate Division, Third Department (the "Sullivan Action"). On January 26, 2016, the Westchester County Supreme Court denied the Company's motion to dismiss but ordered the Cappelli Group to amend its pleading and remove all claims and allegations previously determined by the Sullivan Action. On February 18, 2016, the Cappelli Group filed an amended complaint asserting a single cause of action for breach of the covenant of good faith and fair dealing based upon allegations the Company had interfered with plaintiffs’ ability to obtain financing which complied with the Casino Development Agreement. On March 23, 2016, the Company filed a motion to dismiss the Cappelli Group’s revised amended complaint. On January 5, 2017, the Westchester County Supreme Court denied the Company’s second motion to dismiss. Discovery is ongoing.
The Company has not determined that losses related to the remaining Westchester Action are probable. In light of the inherent difficulty of predicting the outcome of litigation generally, the Company does not have sufficient information to determine the amount or range of reasonably possible loss with respect to these matters. The Company’s assessments are based on estimates and assumptions that have been deemed reasonable by management, but that may prove to be incomplete or inaccurate, and unanticipated events and circumstances may occur that might cause the Company to change those estimates
38
and assumptions. The Company intends to vigorously defend the claims asserted against the Company and certain of its subsidiaries by the Cappelli Group and its affiliates, for which the Company believes it has meritorious defenses, but there can be no assurances as to the outcome of the claims and related litigation.
Not applicable.
Market Information and Dividends
The following table sets forth, for the quarterly periods indicated, the high and low sales prices per share for our common shares on the New York Stock Exchange (“NYSE”) under the trading symbol “EPR” and the dividends declared.
|
High
|
Low
|
Dividend
|
|||||||||
|
2016:
|
|||||||||||
|
Fourth quarter
|
$
|
78.67
|
|
$
|
65.50
|
|
$
|
0.960
|
|
||
|
Third quarter
|
84.67
|
|
74.93
|
|
$
|
0.960
|
|
||||
|
Second quarter
|
80.69
|
|
64.00
|
|
$
|
0.960
|
|
||||
|
First quarter
|
66.71
|
|
53.00
|
|
$
|
0.960
|
|
||||
|
2015:
|
|||||||||||
|
Fourth quarter
|
$
|
59.42
|
|
$
|
50.85
|
|
$
|
0.908
|
|
||
|
Third quarter
|
57.79
|
|
49.24
|
|
0.908
|
|
|||||
|
Second quarter
|
61.70
|
|
54.70
|
|
0.908
|
|
|||||
|
First quarter
|
65.76
|
|
56.64
|
|
0.908
|
|
|||||
We declared dividends to common shareholders aggregating $3.84 and $3.63 per common share in 2016 and 2015, respectively.
While we intend to continue paying regular dividends, future dividend declarations will be at the discretion of the Board of Trustees and will depend on our actual cash flow, our financial condition, capital requirements, the annual distribution requirements under the REIT provisions of the Code, debt covenants and other factors the Board of Trustees deems relevant. We pay dividends to our common shareholders on a monthly basis and expect to continue to pay such dividends monthly. Additionally, we pay dividends to our preferred shareholders on a quarterly basis and expect to continue to pay such dividends quarterly. The actual cash flow available to pay dividends may be affected by a number of factors, including the revenues received from rental properties and mortgage notes, our operating expenses, debt service on our borrowings, the ability of tenants and customers to meet their obligations to us and any unanticipated capital expenditures. Our Series C convertible preferred shares have a fixed dividend rate of 5.75%, our Series E convertible preferred shares have a fixed dividend rate of 9.00% and our Series F redeemable preferred shares have a fixed dividend rate of 6.625%.
During the year ended
December 31, 2016
, the Company did not sell any unregistered equity securities.
On
February 27, 2017
, there were approximately 1,030 holders of record of our outstanding common shares.
39
Issuer Purchases of Equity Securities
|
Period
|
Total Number of Shares Purchased
|
Average Price Paid Per Share
|
Total Number of Shares Purchased as Part of Publicly Announced Plans or Programs
|
Maximum Number (or Approximate Dollar Value) of Shares that May Yet Be Purchased Under the Plans or Programs
|
|||||||||||
|
October 1 through October 31, 2016 common stock
|
—
|
|
$
|
—
|
|
—
|
|
$
|
—
|
|
|||||
|
November 1 through November 30, 2016 common stock
|
6,681
|
|
(1)
|
69.40
|
|
—
|
|
—
|
|
||||||
|
December 1 through December 31, 2016 common stock
|
1,382
|
|
(1)
|
71.32
|
|
—
|
|
—
|
|
||||||
|
Total
|
8,063
|
|
$
|
69.73
|
|
—
|
|
$
|
—
|
|
|||||
(1)
The repurchases of equity securities during November and December of 2016 were completed in conjunction with employee stock option exercises. These repurchases were not made pursuant to a publicly announced plan or program.
40
Share Performance Graph
The following graph compares the cumulative return on our common shares during the five year period ended
December 31, 2016
, to the cumulative return on the MSCI U.S. REIT Index, the Russell 2000 Index and the Russell 1000 Index for the same period. During the year ended December 31, 2016, the Company was added to the Russell 1000 Index, which includes 1,000 of the largest securities based on market capitalization and current index membership. The Company was previously a member of the Russell 2000 Index. The comparisons assume an initial investment of $100 and the reinvestment of all dividends during the comparison period. Performance during the comparison period is not necessarily indicative of future performance.
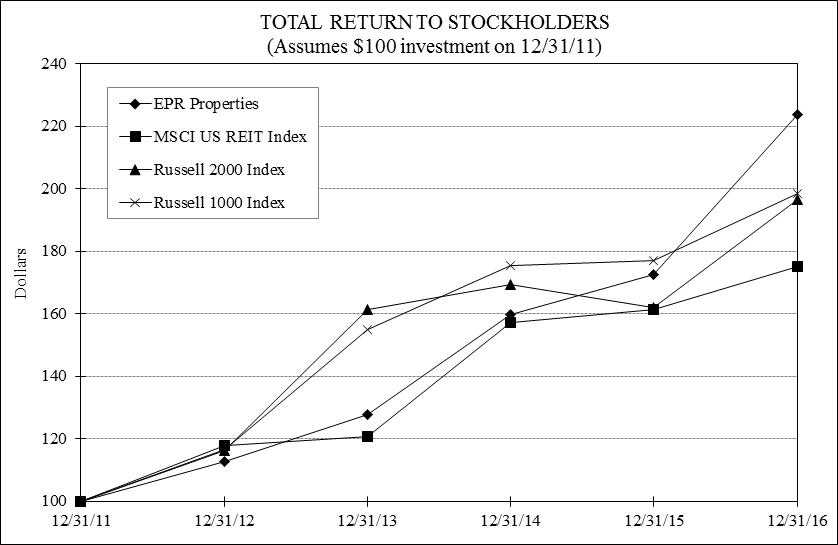
|
Total Return Analysis
|
|
|
|
|
|
|
|||||||||||||||||
|
|
12/31/2011
|
12/31/2012
|
12/31/2013
|
12/31/2014
|
12/31/2015
|
12/31/2016
|
|||||||||||||||||
|
EPR Properties
|
$
|
100.00
|
|
$
|
112.82
|
|
$
|
127.90
|
|
$
|
159.69
|
|
$
|
172.52
|
|
$
|
223.67
|
|
|||||
|
MSCI US REIT Index
|
$
|
100.00
|
|
$
|
117.77
|
|
$
|
120.68
|
|
$
|
157.34
|
|
$
|
161.30
|
|
$
|
175.17
|
|
|||||
|
Russell 2000 Index
|
$
|
100.00
|
|
$
|
116.35
|
|
$
|
161.52
|
|
$
|
169.43
|
|
$
|
161.95
|
|
$
|
196.45
|
|
|||||
|
Russell 1000 Index
|
$
|
100.00
|
|
$
|
116.42
|
|
$
|
154.97
|
|
$
|
175.49
|
|
$
|
177.10
|
|
$
|
198.44
|
|
|||||
Source: SNL Financial
The performance graph and related text are being furnished to and not filed with the SEC, and will not be deemed "soliciting material" or subject to Regulation 14A or 14C under the Exchange Act or to the liabilities of Section 18 of the Exchange Act, and will not be deemed to be incorporated by reference into any filing under the Securities Act or the Exchange Act, except to the extent we specifically incorporate such information by reference into such a filing.
41
Operating statement data
(Dollars in thousands except per share data)
|
|
Year Ended December 31,
|
||||||||||||||||||
|
|
2016
|
2015
|
2014 (1)
|
2013
|
2012
|
||||||||||||||
|
Rental revenue
|
$
|
399,589
|
|
$
|
330,886
|
|
$
|
286,673
|
|
$
|
248,709
|
|
$
|
234,517
|
|
||||
|
Tenant reimbursements
|
15,595
|
|
16,320
|
|
17,663
|
|
18,401
|
|
18,575
|
|
|||||||||
|
Other income
|
9,039
|
|
3,629
|
|
1,009
|
|
1,682
|
|
738
|
|
|||||||||
|
Mortgage and other financing income
|
69,019
|
|
70,182
|
|
79,706
|
|
74,272
|
|
63,977
|
|
|||||||||
|
Total revenue
|
493,242
|
|
421,017
|
|
385,051
|
|
343,064
|
|
317,807
|
|
|||||||||
|
Property operating expense
|
22,602
|
|
23,433
|
|
24,897
|
|
26,016
|
|
24,915
|
|
|||||||||
|
Other expense
|
5
|
|
648
|
|
771
|
|
658
|
|
1,382
|
|
|||||||||
|
General and administrative expense
|
37,543
|
|
31,021
|
|
27,566
|
|
25,613
|
|
23,170
|
|
|||||||||
|
Retirement severance expense
|
—
|
|
18,578
|
|
—
|
|
—
|
|
—
|
|
|||||||||
|
Costs associated with loan refinancing or payoff, net
|
905
|
|
270
|
|
301
|
|
6,166
|
|
627
|
|
|||||||||
|
Gain on early extinguishment of debt
|
—
|
|
—
|
|
—
|
|
(4,539
|
)
|
—
|
|
|||||||||
|
Interest expense, net
|
97,144
|
|
79,915
|
|
81,270
|
|
81,056
|
|
76,656
|
|
|||||||||
|
Transaction costs
|
7,869
|
|
7,518
|
|
2,452
|
|
1,955
|
|
404
|
|
|||||||||
|
Provision for loan losses
|
—
|
|
—
|
|
3,777
|
|
—
|
|
—
|
|
|||||||||
|
Impairment charges
|
—
|
|
—
|
|
—
|
|
—
|
|
3,074
|
|
|||||||||
|
Depreciation and amortization
|
107,573
|
|
89,617
|
|
66,739
|
|
53,946
|
|
46,698
|
|
|||||||||
|
Income before equity in income from joint ventures and other items
|
219,601
|
|
170,017
|
|
177,278
|
|
152,193
|
|
140,881
|
|
|||||||||
|
Equity in income from joint ventures
|
619
|
|
969
|
|
1,273
|
|
1,398
|
|
1,025
|
|
|||||||||
|
Gain on sale of real estate
|
5,315
|
|
23,829
|
|
1,209
|
|
3,017
|
|
—
|
|
|||||||||
|
Gain on sale of investment in a direct financing lease
|
—
|
|
—
|
|
220
|
|
—
|
|
—
|
|
|||||||||
|
Gain on previously held equity interest
|
—
|
|
—
|
|
—
|
|
4,853
|
|
—
|
|
|||||||||
|
Income before income taxes
|
225,535
|
|
194,815
|
|
179,980
|
|
161,461
|
|
141,906
|
|
|||||||||
|
Income tax benefit (expense)
|
(553
|
)
|
(482
|
)
|
(4,228
|
)
|
14,176
|
|
—
|
|
|||||||||
|
Income from continuing operations
|
$
|
224,982
|
|
$
|
194,333
|
|
$
|
175,752
|
|
$
|
175,637
|
|
$
|
141,906
|
|
||||
|
Discontinued operations:
|
|||||||||||||||||||
|
Income from discontinued operations
|
—
|
|
199
|
|
505
|
|
333
|
|
620
|
|
|||||||||
|
Transaction (costs) benefit
|
—
|
|
—
|
|
3,376
|
|
—
|
|
—
|
|
|||||||||
|
Impairment charges
|
—
|
|
—
|
|
—
|
|
—
|
|
(20,835
|
)
|
|||||||||
|
Gain (loss) on sale, net from discontinued operations
|
—
|
|
—
|
|
—
|
|
4,256
|
|
(27
|
)
|
|||||||||
|
Net income
|
224,982
|
|
194,532
|
|
179,633
|
|
180,226
|
|
121,664
|
|
|||||||||
|
Add: Net income attributable to noncontrolling interests
|
—
|
|
—
|
|
—
|
|
—
|
|
(108
|
)
|
|||||||||
|
Net income attributable to EPR Properties
|
224,982
|
|
194,532
|
|
179,633
|
|
180,226
|
|
121,556
|
|
|||||||||
|
Preferred dividend requirements
|
(23,806
|
)
|
(23,806
|
)
|
(23,807
|
)
|
(23,806
|
)
|
(24,508
|
)
|
|||||||||
|
Preferred share redemption costs
|
—
|
|
—
|
|
—
|
|
—
|
|
(3,888
|
)
|
|||||||||
|
Net income available to common shareholders of EPR Properties
|
$
|
201,176
|
|
$
|
170,726
|
|
$
|
155,826
|
|
$
|
156,420
|
|
$
|
93,160
|
|
||||
|
Per share data attributable to EPR Properties shareholders:
|
|||||||||||||||||||
|
Basic earnings per share data:
|
|||||||||||||||||||
|
Income from continuing operations
|
$
|
3.17
|
|
$
|
2.93
|
|
$
|
2.80
|
|
$
|
3.16
|
|
$
|
2.42
|
|
||||
|
Income (loss) from discontinued operations
|
—
|
|
0.01
|
|
0.07
|
|
0.10
|
|
(0.43
|
)
|
|||||||||
|
Net income available to common shareholders
|
$
|
3.17
|
|
$
|
2.94
|
|
$
|
2.87
|
|
$
|
3.26
|
|
$
|
1.99
|
|
||||
|
Diluted earnings per share data:
|
|||||||||||||||||||
|
Income from continuing operations
|
$
|
3.17
|
|
$
|
2.92
|
|
$
|
2.79
|
|
$
|
3.15
|
|
$
|
2.41
|
|
||||
|
Income (loss) from discontinued operations
|
—
|
|
0.01
|
|
0.07
|
|
0.09
|
|
(0.43
|
)
|
|||||||||
|
Net income available to common shareholders
|
$
|
3.17
|
|
$
|
2.93
|
|
$
|
2.86
|
|
$
|
3.24
|
|
$
|
1.98
|
|
||||
|
Shares used for computation (in thousands):
|
|||||||||||||||||||
|
Basic
|
63,381
|
|
58,138
|
|
54,244
|
|
48,028
|
|
46,798
|
|
|||||||||
|
Diluted
|
63,474
|
|
58,328
|
|
54,444
|
|
48,214
|
|
47,049
|
|
|||||||||
|
Cash dividends declared per common share
|
$
|
3.84
|
|
$
|
3.63
|
|
$
|
3.42
|
|
$
|
3.16
|
|
$
|
3.00
|
|
||||
(1)
The Company adopted FASB Accounting Standards Update (ASU) No. 2014-08,
Reporting Discontinued Operations and Disclosures of Disposals of Components of an Entity,
in 2014.
42
Balance sheet data
(Dollars in thousands)
|
|
December 31,
|
||||||||||||||||||
|
|
2016
|
2015
|
2014
|
2013
|
2012
|
||||||||||||||
|
Net real estate investments
|
$
|
3,915,402
|
|
$
|
3,427,729
|
|
$
|
2,839,333
|
|
$
|
2,394,966
|
|
$
|
2,113,434
|
|
||||
|
Mortgage notes and related accrued interest receivable, net
|
613,978
|
|
423,780
|
|
507,955
|
|
486,337
|
|
455,752
|
|
|||||||||
|
Investment in a direct financing lease, net
|
102,698
|
|
190,880
|
|
199,332
|
|
242,212
|
|
234,089
|
|
|||||||||
|
Total assets
|
4,865,022
|
|
4,217,270
|
|
3,686,275
|
|
3,254,372
|
|
2,931,827
|
|
|||||||||
|
Dividends payable
|
26,318
|
|
24,352
|
|
22,233
|
|
19,552
|
|
41,186
|
|
|||||||||
|
Debt
|
2,485,625
|
|
1,981,920
|
|
1,629,750
|
|
1,457,432
|
|
1,353,929
|
|
|||||||||
|
Total liabilities
|
2,679,121
|
|
2,143,402
|
|
1,759,786
|
|
1,566,358
|
|
1,471,929
|
|
|||||||||
|
Equity
|
2,185,901
|
|
2,073,868
|
|
1,926,489
|
|
1,688,014
|
|
1,459,898
|
|
|||||||||
43
The following discussion should be read in conjunction with the Consolidated Financial Statements and Notes thereto included in this Annual Report on Form 10-K. The forward-looking statements included in this discussion and elsewhere in this Annual Report on Form 10-K involve risks and uncertainties, including anticipated financial performance, business prospects, industry trends, shareholder returns, performance of leases by tenants, performance on loans to customers and other matters, which reflect management’s best judgment based on factors currently known. See “Cautionary Statement Concerning Forward-Looking Statements.” Actual results and experience could differ materially from the anticipated results and other expectations expressed in our forward-looking statements as a result of a number of factors, including but not limited to those discussed in this Item and in Item 1A - “Risk Factors.”
Overview
Business
Our principal business objective is to enhance shareholder value by achieving predictable and increasing FFO and dividends per share. Our prevailing strategy is to focus on long-term investments in a limited number of categories in which we maintain a depth of knowledge and relationships, and which we believe offer sustained performance throughout all economic cycles. Our investment portfolio includes ownership of and long-term mortgages on entertainment, education and recreation properties. Substantially all of our owned single-tenant properties are leased pursuant to long-term, triple-net leases, under which the tenants typically pay all operating expenses of the property. Tenants at our owned multi-tenant properties are typically required to pay common area maintenance charges to reimburse us for their pro-rata portion of these costs.
It has been our strategy to structure leases and financings to ensure a positive spread between our cost of capital and the rentals or interest paid by our tenants. We have primarily acquired or developed new properties that are pre-leased to a single tenant or multi-tenant properties that have a high occupancy rate. We have also entered into certain joint ventures and we have provided mortgage note financing. We intend to continue entering into some or all of these types of arrangements in the foreseeable future.
Historically, our primary challenges have been locating suitable properties, negotiating favorable lease or financing terms (on new or existing properties), and managing our portfolio as we have continued to grow. We believe our management’s knowledge and industry relationships have facilitated opportunities for us to acquire, finance and lease properties. Our business is subject to a number of risks and uncertainties, including those described in “Risk Factors” in Item 1A of this report.
As of
December 31, 2016
, our total assets were approximately
$4.9 billion
(after accumulated depreciation of approximately
$0.6 billion
) which included investments in each of our four operating segments with properties located in 40 states, the District of Columbia and Ontario, Canada.
|
•
|
Our Entertainment segment included investments in
141
megaplex theatres,
eight
entertainment retail centers (which include
eight
additional megaplex theatres) and
eight
family entertainment centers. Our portfolio of owned entertainment properties consisted of
12.5 million
square feet and was
99%
leased, including megaplex theatres that were
100%
leased.
|
|
•
|
Our Education segment included investments in
67
public charter schools,
41
early education centers and
12
private schools. Our portfolio of owned education properties consisted of
4.3 million
square feet and was
100%
leased.
|
|
•
|
Our Recreation segment included investments in
11
ski areas,
five
waterparks and
25
golf entertainment complexes. Our portfolio of owned recreation properties was
100%
leased.
|
|
•
|
Our Other segment consisted primarily of land under ground lease, property under development and land held for development related to the Adelaar casino and resort project in Sullivan County, New York.
|
The combined owned portfolio consisted of 19.2 million square feet and was 99.5% leased. As of
December 31, 2016
, we also had invested approximately
$297.1 million
in property under development.
44
Operating Results
Our total revenue, net income available to common shareholders and Funds From Operations As Adjusted ("FFOAA") per diluted share are detailed below for the
years ended December 31, 2016 and 2015
(in millions, except per share information):
|
Year ended December 31,
|
||||||||||
|
2016
|
2015
|
Increase
|
||||||||
|
Total revenue (1)
|
$
|
493.2
|
|
$
|
421.0
|
|
17
|
%
|
||
|
Net income available to common shareholders per diluted share (2)
|
3.17
|
|
2.93
|
|
8
|
%
|
||||
|
FFOAA per diluted share (3)
|
4.82
|
|
4.44
|
|
9
|
%
|
||||
(1) Total revenue for the year ended December 31, 2016, versus the year ended December 31, 2015, was favorably impacted by the effect of acquisitions and build-to-suit projects completed during 2016 and 2015 as well as $4.7 million in gains from insurance claims and a $3.6 million prepayment fee from the early payoff of a mortgage note secured by a public charter school property.
(2) Net income available to common shareholders per diluted share for the year ended December 31, 2016, versus the year ended December 31, 2015, was favorably impacted by the items impacting total revenue described above, as well as $18.6 million in retirement severance expense recognized in 2015 related to the retirement of our former Chief Executive Officer.
Net income available to common shareholders per diluted share for the year ended December 31, 2016 versus the year ended December 31, 2015, was unfavorably impacted b
y an increase in interest expense (including less capitalization) and general and administrative expense, lower gains on sales in 2016 due to a larger theatre sale that occurred in 2015, and an increase in common shares outstanding.
(3) FFOAA per diluted share for the year ended December 31, 2016, versus the year ended December 31, 2015, was favorably impacted by the results of investment spending in 2015 and 2016, a $3.6 million prepayment fee from the early payoff of a mortgage note secured by a public charter school property and $2.8 million in termination fees recognized with the exercise of tenant purchase options on two of our public charter school properties. FFOAA per diluted share for the year ended December 31, 2016, versus the year ended December 31, 2015, was unfavorably impacted by an increase in interest expense (including less capitalization), an increase in general and administrative expense and an increase in common shares outstanding.
FFOAA is a non-GAAP financial measure. For the definitions and further details on the calculations of FFOAA and certain other non-GAAP financial measures, see the section below titled "Funds From Operations (FFO), Funds From Operations As Adjusted (FFOAA) and Adjusted Funds from Operations (AFFO)."
Investment Spending Overview
During 2016, our total investment spending was
$805.0 million
compared to $632.0 million in the prior year with increases in our Entertainment and Education segments, offset by a decrease in our Recreation and Other segments.
During 2016, our investment spending in our Entertainment segment was
$266.1 million
compared to $106.1 million in the prior year. The current year included an acquisition of a six theatre portfolio as well as the acquisition of two megaplex theatres and a family entertainment center for a total of $148.4 million. We continued to have build-to-suit opportunities available for megaplex theatres and family entertainment centers at attractive terms with both existing and new tenants. Additionally, many megaplex theatre operators are pursuing the renovation of theatres to include enhanced amenities such as luxury seating and expanded food and beverage offerings. This trend has provided us with redevelopment opportunities and is expected to continue to provide redevelopment and build-to-suit opportunities for us in the future.
During 2016, our investment spending in our Education segment was
$338.7 million
compared to $272.9 million in the prior year, and primarily included build-to-suit development of public charter schools, early childhood education centers and private schools. The current year also included an investment of $100.0 million in mortgage notes secured
45
by 20 early education centers and private schools. Additionally, in the current year, we acquired four early education centers and a private school. During 2016, we increased our investments in education and expect to continue to do so in the future. We also continued to significantly diversify our tenant base in public charter schools and early education centers, and as of year-end, we had
45
different public charter school operators and seven different early education operators. We expect to continue to expand our education tenant base in 2017.
During 2016, our investment spending in our Recreation segment was
$198.3 million
compared to $241.2 million in the prior year, and primarily related to spending on build-to-suit golf entertainment complexes. Additionally, we invested in a mortgage note secured by a ski area and redevelopment of one of our ski areas. As discussed in "Recent Developments," we anticipate the proposed transaction with CNL Lifestyle Properties, Inc. will increase our investments in this segment in 2017.
During 2016, our investment spending in our Other segment was $1.9 million compared to $11.8 million in prior year, and related to the Adelaar casino and resort project in Sullivan County, New York.
Critical Accounting Policies
The preparation of financial statements in conformity with accounting principles generally accepted in the United States (“GAAP”) requires management to make estimates and assumptions in certain circumstances that affect amounts reported in the accompanying consolidated financial statements and related notes. In preparing these financial statements, management has made its best estimates and assumptions that affect the reported assets and liabilities. The most significant assumptions and estimates relate to consolidation, revenue recognition, depreciable lives of the real estate, the valuation of real estate, accounting for real estate acquisitions, estimating reserves for uncollectible receivables and the accounting for mortgage and other notes receivable. Application of these assumptions requires the exercise of judgment as to future uncertainties and, as a result, actual results could differ from these estimates.
Consolidation
We consolidate certain entities if we are deemed to be the primary beneficiary in a variable interest entity ("VIE") in which we have a controlling financial interest in accordance with the consolidation guidance of the Financial Accounting Standards Board ("FASB") Accounting Standards Codification ("ASC") Topic on Consolidation.
Revenue Recognition
Rents that are fixed and determinable are recognized on a straight-line basis over the expected terms of the leases. Base rent escalation in other leases is dependent upon increases in the Consumer Price Index (“CPI”) and accordingly, management does not include any future base rent escalation amounts on these leases in current revenue. Most of our leases provide for percentage rents based upon the level of sales achieved by the tenant. These percentage rents are recognized once the required sales level is achieved. Lease termination fees are recognized when the related leases are canceled and we have no continuing obligation to provide services to such former tenants.
Direct financing lease income is recognized on the effective interest method to produce a level yield on funds not yet recovered. Estimated unguaranteed residual values at the date of lease inception represent management’s initial estimates of fair value of the leased assets at the expiration of the lease, not to exceed original cost. Significant assumptions used in estimating residual values include estimated net cash flows over the remaining lease term and expected future real estate values. The estimated unguaranteed residual value is reviewed on an annual basis or more frequently if necessary. We evaluate the collectibility of our direct financing lease receivable to determine whether it is impaired. A direct financing lease receivable is considered to be impaired when, based on current information and events, it is probable that we will be unable to collect all amounts due according to the existing contractual terms. When a direct financing lease receivable is considered to be impaired, the amount of loss is calculated by comparing the recorded investment to the value determined by discounting the expected future cash flows at the direct financing lease receivable’s effective interest rate or to the value of the underlying collateral, less costs to sell, if such receivable is collateralized.
Real Estate Useful Lives
We are required to make subjective assessments as to the useful lives of our properties for the purpose of determining the amount of depreciation to reflect on an annual basis with respect to those properties. These assessments have a
46
direct impact on our net income. Depreciation and amortization are provided on the straight-line method over the useful lives of the assets, as follows:
|
Buildings
|
|
30 to 40 years
|
|
Tenant improvements
|
|
Base term of lease or useful life, whichever is shorter
|
|
Furniture, fixtures and equipment
|
|
3 to 25 years
|
Impairment of Real Estate Values
We are required to make subjective assessments as to whether there are impairments in the value of our rental properties. These estimates of impairment may have a direct impact on our consolidated financial statements.
We assess the carrying value of our rental properties whenever events or changes in circumstances indicate that the carrying amount of a property may not be recoverable. Certain factors that may occur and indicate that impairments may exist include, but are not limited to: underperformance relative to projected future operating results, tenant difficulties and significant adverse industry or market economic trends. If an indicator of possible impairment exists, a property that is held and used by the Company is evaluated for impairment by comparing the carrying amount of the property to the estimated undiscounted future cash flows expected to be generated by the property. If the carrying amount of a property exceeds its estimated future cash flows on an undiscounted basis, an impairment charge is recognized in the amount by which the carrying amount of the property exceeds the fair value of the property. For assets and asset groups that are held for sale, an impairment loss is measured by comparing the fair value of the property, less costs to sell, to the asset (group) carrying value. Management estimates fair value of our rental properties utilizing independent appraisals and/or based on projected discounted cash flows using a discount rate determined by management to be commensurate with the risk inherent in the Company.
Real Estate Acquisitions
Upon acquisition of real estate properties, we determine if the acquisition meets the criteria to be accounted for as a business combination. Accordingly, we typically account for (1) acquired vacant properties, (2) acquired single tenant properties when a new lease or leases are signed at the time of acquisition, and (3) acquired single tenant properties that have an existing long-term triple-net lease or leases (greater than 7 years) as asset acquisitions. Acquisitions of properties with shorter-term leases or properties with multiple tenants that require business related activities to manage and maintain the properties (i.e. those properties that involve a process) are treated as business combinations.
Costs incurred for asset acquisitions and development properties, including transaction costs, are capitalized. For asset acquisitions, we allocate the purchase price and other related costs incurred to the real estate assets acquired based on recent independent appraisals or methods similar to those used by independent appraisers and management judgment.
If the acquisition is determined to be a business combination, we record the fair value of acquired tangible assets (consisting of land, building, tenant improvements, and furniture, fixtures and equipment) and identified intangible assets and liabilities (consisting of above and below market leases, in-place leases, tenant relationships and assumed financing that is determined to be above or below market terms) as well as any noncontrolling interest. In addition, acquisition-related costs in connection with business combinations are expensed as incurred.
Allowance for Doubtful Accounts
Management makes quarterly estimates of the collectibility of its accounts receivable related to base rents, tenant escalations (straight-line rents), reimbursements and other revenue or income. Management specifically analyzes trends in accounts receivable, historical bad debts, customer credit worthiness, current economic trends and changes in customer payment terms when evaluating the adequacy of its allowance for doubtful accounts. In addition, when customers are in bankruptcy, management makes estimates of the expected recovery of pre-petition administrative and damage claims. These estimates have a direct impact on our net income.
Mortgage Notes and Other Notes Receivable
Mortgage notes and other notes receivable, including related accrued interest receivable, consist of loans that we originated and the related accrued and unpaid interest income as of the balance sheet date. Mortgage notes and other
47
notes receivable are initially recorded at the amount advanced to the borrower and we defer certain loan origination and commitment fees, net of certain origination costs, and amortize them over the term of the related loan. Interest income on performing loans is accrued as earned. We evaluate the collectibility of both interest and principal for each loan to determine whether it is impaired. A loan is considered to be impaired when, based on current information and events, we determine it is probable that we will be unable to collect all amounts due according to the existing contractual terms. When a loan is considered to be impaired, the amount of loss is calculated by comparing the recorded investment to the value determined by discounting the expected future cash flows at the loan’s effective interest rate or to the fair value of the underlying collateral, less costs to sell, if the loan is collateral dependent. For impaired loans, interest income is recognized on a cash basis, unless we determine based on the loan to estimated fair value ratio the loan should be on the cost recovery method, and any cash payments received would then be reflected as a reduction of principal. Interest income recognition is recommenced if and when the impaired loan becomes contractually current and performance is demonstrated to be resumed.
Recent Developments
Debt Financing
On February 18, 2016, we prepaid in full a mortgage note payable of $4.6 million which was secured by one theatre property. In connection with this note payoff, we paid $472 thousand in additional costs included in costs associated with loan refinancing or payoff.
On April 21, 2016, we paid in full an unsecured note payable of
$1.9 million
. Additionally, on May 2, 2016, we prepaid in full
two
mortgage notes payable totaling
$24.5 million
, which were secured by
two
theatre properties.
On August 8, 2016, we prepaid in full
three
mortgage notes payable totaling
$16.4 million
, which were secured by
three
theatre properties. Additionally, on September 1, 2016, we prepaid in full
four
mortgage notes payable totaling
$21.7 million
, which were secured by
four
theatre properties.
On August 22, 2016, we issued $340.0 million of senior unsecured notes in a private placement transaction. The notes were issued in two tranches with $148.0 million bearing interest at 4.35% and due August 22, 2024, and $192.0 million bearing interest at 4.56% and due August 22, 2026. The notes are guaranteed by our subsidiaries that guarantee our unsecured credit facilities and existing senior unsecured notes. We used the net proceeds from the note offering to pay down our unsecured revolving credit facility and for general business purposes.
On December 14, 2016, we issued $450.0 million of senior unsecured notes due on December 15, 2026 pursuant to an underwritten public offering. The notes bear interest at an annual rate of 4.75% and interest is payable semi-annually. The notes were issued at 98.429% of their face value and are guaranteed by our subsidiaries that guarantee our unsecured credit facilities and existing senior unsecured notes. We used the net proceeds from the note offering to pay down our unsecured revolving credit facility, invest in mortgage notes secured by education properties and for general business purposes.
Subsequent to December 31, 2016, we prepaid in full two mortgage notes payable totaling $17.9 million with a weighted average annual interest rate of 6.07%, which were secured by two theatre properties.
Issuance of Common Shares
On January 21, 2016, we issued
2,250,000
common shares in a registered public offering for a total net proceeds, after the underwriting discount and offering expenses, of approximately
$125.0 million
. The net proceeds from the public offering were used to pay down our unsecured revolving credit facility.
During the
year ended December 31, 2016
, we issued an aggregate of
258,263
common shares under the direct share purchase component of our Dividend Reinvestment and Direct Share Purchase Plan ("DSPP") for total net proceeds of
$16.9 million
. These proceeds were used to pay down a portion of our unsecured revolving credit facility. Subsequent to December 31, 2016, we issued an aggregate of 548,288 common shares under our DSPP for net proceeds of $40.8 million.
48
Investment Spending
Our investment spending during the
year ended December 31, 2016
totaled
$805.0 million
, and included investments in each of our four operating segments.
Entertainment investment spending during the
year ended December 31, 2016
totaled
$266.1 million
, including spending on build-to-suit development and redevelopment of megaplex theatres, entertainment retail centers and family entertainment centers, as well as $148.4 million in acquisitions of eight megaplex theatres and a family entertainment center.
Education investment spending during the
year ended December 31, 2016
totaled
$338.7 million
, including spending on build-to-suit development and redevelopment of public charter schools, early education centers and private schools, as well as $16.5 million in acquisitions of four early education centers and a private school. Additionally, education investment spending included $100.0 million in mortgage notes secured by 20 early education and private school properties. Subsequent to December 31, 2016, we funded an additional
$42.9 million
in mortgage notes secured by
eight
early education and private school properties.
Recreation investment spending during the
year ended December 31, 2016
totaled
$198.3 million
, including spending on build-to-suit development of golf entertainment complexes, build-to-suit development and redevelopment of ski areas and waterparks, as well as a $21.0 million mortgage note secured by a ski area.
Other investment spending during the
year ended December 31, 2016
totaled $1.9 million and was related to the Adelaar casino and resort project in Sullivan County, New York.
The following details our investment spending during the
years ended December 31, 2016 and 2015
(in thousands):
|
For the Year Ended December 31, 2016
|
||||||||||||||||||||
|
Operating Segment
|
Total Investment Spending
|
New Development
|
Re-development
|
Asset Acquisition
|
Investment in Mortgage Notes and Notes Receivable
|
|||||||||||||||
|
Entertainment
|
$
|
266,101
|
|
$
|
37,265
|
|
$
|
56,820
|
|
$
|
148,398
|
|
$
|
23,618
|
|
|||||
|
Education
|
338,659
|
|
208,288
|
|
—
|
|
16,456
|
|
113,915
|
|
||||||||||
|
Recreation
|
198,345
|
|
134,195
|
|
7,598
|
|
—
|
|
56,552
|
|
||||||||||
|
Other
|
1,903
|
|
1,903
|
|
—
|
|
—
|
|
—
|
|
||||||||||
|
Total Investment Spending
|
$
|
805,008
|
|
$
|
381,651
|
|
$
|
64,418
|
|
$
|
164,854
|
|
$
|
194,085
|
|
|||||
|
For the Year Ended December 31, 2015
|
||||||||||||||||||||
|
Operating Segment
|
Total Investment Spending
|
New Development
|
Re-development
|
Asset Acquisition
|
Investment in Mortgage Notes
|
|||||||||||||||
|
Entertainment
|
$
|
106,105
|
|
$
|
21,570
|
|
$
|
20,844
|
|
$
|
63,691
|
|
$
|
—
|
|
|||||
|
Education
|
272,920
|
|
253,072
|
|
—
|
|
15,990
|
|
3,858
|
|
||||||||||
|
Recreation
|
241,178
|
|
149,016
|
|
240
|
|
21,865
|
|
70,057
|
|
||||||||||
|
Other
|
11,818
|
|
11,818
|
|
—
|
|
—
|
|
—
|
|
||||||||||
|
Total Investment Spending
|
$
|
632,021
|
|
$
|
435,476
|
|
$
|
21,084
|
|
$
|
101,546
|
|
$
|
73,915
|
|
|||||
The above amounts include $192 thousand and $171 thousand in capitalized payroll, $10.7 million and $18.5 million in capitalized interest and $5.1 million and $2.3 million in capitalized other general and administrative direct project costs for the
years ended December 31, 2016 and 2015
, respectively. In addition, we had $5.0 million and $2.9 million of maintenance capital expenditures for the
years ended December 31, 2016 and 2015
, respectively.
49
Property Dispositions
On February 26, 2016, we completed the sale of a land parcel at Adelaar for net proceeds of
$1.5 million
and
no
gain or loss was recognized.
On April 6, 2016, pursuant to a tenant purchase option, we completed the sale of a public charter school located in Colorado for net proceeds of
$11.2 million
and we recognized a gain on sale of
$2.3 million
. In addition, on August 18, 2016, pursuant to a tenant purchase option, we completed the sale of a public charter school located in Colorado for net proceeds of
$5.4 million
and we recognized a gain on sale of
$0.5 million
. These gains represent the premium charged to the tenant over the total development cost for early termination in accordance with the purchase options in the leases. These termination fees totaling $2.8 million have been included in FFO as adjusted, similar to how other lease termination fees and fees received for early prepayment of mortgage notes receivable are reflected when applicable.
During the year ended December 31, 2016, we completed the sale of three retail parcels located in Texas for total net proceeds of $5.3 million and recognized gains on sale totaling $2.5 million.
During the year ended December 31, 2016, we completed the sale of nine public charter school properties previously leased to affiliates of Imagine Schools, Inc. ("Imagine") as part of a master lease. Seven of these schools were sold to Imagine and two were sold to other third parties. These properties are located in Georgia, Indiana, Ohio, Missouri, and South Carolina and had a total net carrying value of $91.3 million when sold. We received net cash proceeds totaling $21.0 million (a portion of which was funded through the liquidation of the letter of credit and escrow reserve previously provided by Imagine pursuant to the master lease) and a mortgage note receivable from Imagine for $70.3 million. This note is due on December 20, 2021, bears interest at 7% and requires monthly principal and interest payments of
$608 thousand
and additional principal pay downs if certain events occur including property sales. The note is secured by 11 public charter schools as of December 31, 2016. There were no gains or losses recognized on these sales. As of December 31, 2016, 12 schools operated by Imagine remain subject to the master lease.
Mortgage Notes Receivable
On January 5, 2016, we received prepayment of
$19.3 million
on one mortgage note receivable that was secured by a public charter school located in Washington D.C. In connection with the full payoff of this note, we received a prepayment fee of
$3.6 million
which is included in mortgage and other financing income. Additionally,
$80 thousand
of prepaid mortgage fees were expensed and are included in costs associated with loan refinancing or payoff.
On April 22, 2016, we received prepayment in full on one mortgage note receivable of $44.3 million that was secured by an entertainment retail center located in North Carolina. In conjunction with this payoff, we wrote off $335 thousand of prepaid mortgage fees to costs associated with loan refinancing or payoff.
Proposed CNL Lifestyle Properties, Inc. Transaction
On November 2, 2016, the Company and Ski Resort Holdings LLC ("SRH"), an entity owned by funds affiliated with Och-Ziff Real Estate, entered into a Purchase and Sale Agreement with CNL Lifestyle Properties, Inc. ("CNL"), CLP Partners, LP, CNL's operating partnership, and certain CNL subsidiaries. The agreement provides for our acquisition of the Northstar California Ski Resort, 15 attraction properties (waterparks and amusement parks) and five small family entertainment centers for aggregate consideration valued at approximately $456.0 million. We anticipate earning an average initial cash yield of 9.35% on our purchase of the Northstar California Ski Resort and the attraction properties, based on leases currently in place or expected to be in place at the time of closing. Additionally, we have agreed to provide approximately $244.0 million of five-year secured debt financing to SRH for the purchase of 14 CNL ski properties valued at approximately $374.0 million. This debt financing will be secured by mortgages on all of the assets being acquired by SRH.
Our aggregate investment in this transaction is projected to be valued at approximately $700.0 million and is expected to be funded with approximately $647.0 million of our common shares and $53.0 million of cash before pro-rations, transaction costs and closing adjustments, a portion of which is expected to be included in the secured debt financing to SRH. We expect to borrow an estimated $62.0 million (the estimated $53.0 million cash purchase price plus an estimated $9.0 million in transaction costs) under our unsecured revolving credit facility at closing. Additionally, we
50
have also agreed to fund 65% of pre-approved, future property improvements with such advances capped at $52.0 million. All SRH financing will bear interest at 8.5%.
The Company's common share consideration is subject to a two-way collar between $68.25 and $82.63 per share. If the Company's volume weighted average share price over the ten trading days ending on the second trading day prior to close (the "Average EPR Share Price") increases between the signing of the agreement and the closing, CNL will receive fewer shares until the Average EPR Share Price reaches $82.63, at which point the number of shares will be fixed at approximately 7.8 million. Conversely, if the Company's share price decreases between signing and closing, CNL will receive more shares until the Average EPR Share Price reaches $68.25, at which point the number of shares will be fixed at approximately 9.5 million. Post-transaction, CNL will own between approximately 11% and 13% of the Company's pro forma common shares outstanding before distributing the shares to the CNL stockholders (based upon the Company's issued and outstanding common shares as of December 31, 2016).
The CNL transaction is subject to customary closing conditions, including the approval of the transaction by stockholders holding a majority of the outstanding shares of common stock of CNL and various third party consents and governmental permits. It is anticipated that this transaction will close in the second quarter of 2017; however, there can be no assurances as to the actual closing or the timing of the closing.
In addition, the Company and SRH, on a joint and several basis, will be required to pay a reverse termination fee of $60.0 million plus reimbursement of expenses incurred after June 10, 2016 (up to $10.0 million) to CNL if the Purchase and Sale Agreement is terminated because the Company and SRH fail to close the transaction as required under the agreement after the conditions to the obligations to close have been satisfied or waived.
Results of Operations
Year ended
December 31, 2016
compared to year ended
December 31, 2015
Rental revenue was
$399.6 million
for the
year ended December 31, 2016
compared to
$330.9 million
for the
year ended December 31, 2015
. Rental revenue increased $68.7 million from the prior period, of which
$65.3 million
was related to property acquisitions and developments completed in 2016 and 2015, as well as an increase of $3.4 million in rental revenue on existing properties, partially offset by the impact of a weaker Canadian exchange rate and property dispositions. Percentage rents of $4.7 million and $3.0 million were recognized during the
years ended December 31, 2016 and 2015
, respectively. Straight-line rents of $17.0 million and $12.2 million were recognized during the
years ended December 31, 2016 and 2015
, respectively.
During the
year ended December 31, 2016
, we experienced a decrease of approximately 0.5% in rental rates on approximately 1.3 million square feet with respect to 17 lease renewals. Additionally, we have funded or have agreed to fund a weighted average of $31.42 per square foot in tenant improvements. There were no leasing commissions related to these renewals.
Tenant reimbursements totaled
$15.6 million
for the
year ended December 31, 2016
compared to
$16.3 million
for the
year ended December 31, 2015
. These tenant reimbursements related to the operations of our entertainment retail centers. The $0.7 million decrease was primarily due a decrease in tenant reimbursements due to vacancy at our retail centers in Ontario, Canada as well as the impact of a weaker Canadian exchange rate.
Other income was
$9.0 million
for the
year ended December 31, 2016
compared to
$3.6 million
for the
year ended December 31, 2015
. The $5.4 million increase was primarily due to the recognition of gains of $4.7 million from insurance claims during the year ended December 31, 2016, as well as an increase in fee income due to a $1.6 million extension fee recorded in 2016 in conjunction with an extension of a tenant purchase option.
Mortgage and other financing income for the
year ended December 31, 2016
was
$69.0 million
compared to
$70.2 million
for the year ended
year ended December 31, 2015
. The $1.2 million decrease was due primarily to the conversion of the mortgage note for Camelback Mountain Resort to a lease agreement during the year ended December 31, 2015 and the payoff of certain mortgage notes in the first half of 2016. Additionally, participating interest income decreased
51
to $0.8 million during the year ended December 31, 2016 from $1.5 million for the year ended December 31, 2015. These decreases were partially offset by a $3.6 million prepayment fee we received in conjunction with the full repayment of one mortgage note receivable and by increased real estate lending activities related to our other mortgage loan agreements.
Our property operating expense totaled
$22.6 million
for the
year ended December 31, 2016
compared to
$23.4 million
for the
year ended December 31, 2015
. These property operating expenses arise from the operations of our retail centers and other specialty properties. The $0.8 million decrease resulted primarily from a decrease in bad debt expense as well as a weaker Canadian exchange rate partially offset by higher property operating expenses at certain properties.
Other expense totaled
$5 thousand
for the
year ended December 31, 2016
compared to
$648 thousand
for the
year ended December 31, 2015
. The $643 thousand decrease was due to golf course expenses related to a golf course on the Adelaar resort property which closed during the year ended December 31, 2016.
Our general and administrative expense totaled
$37.5 million
for the
year ended December 31, 2016
compared to
$31.0 million
for the
year ended December 31, 2015
. The increase of $6.5 million was primarily due to an increase in payroll and benefits costs including share based compensation, as well as certain professional fees.
Retirement severance expense was $18.6 million for the year ended December 31, 2015 and related to the retirement of our former President and Chief Executive Officer. See Note 13 to the consolidated financial statements included in this Annual Report Form 10-K for further detail. There was no retirement severance expense for the year ended December 31, 2016.
Costs associated with loan refinancing or payoff for the
year ended December 31, 2016
was
$0.9 million
and related to fees associated with the repayment of a secured fixed rate mortgage note payable and the write off of prepaid mortgage fees in conjunction with our borrowers' prepayments of two mortgage notes receivable. Costs associated with loan refinancing or payoff totaled
$0.3 million
for the
year ended December 31, 2015
and related to the amendment and restatement of our unsecured credit facilities on April 24, 2015 as well as the prepayment of seven mortgages notes payable during the year ended December 31, 2015.
Our net interest expense increased by $17.2 million to
$97.1 million
for the
year ended December 31, 2016
from
$79.9 million
for the
year ended December 31, 2015
. This increase resulted from an increase in average borrowings as well as a decrease in interest cost capitalized primarily related to the Adelaar project, which was $1.8 million for the year ended December 31, 2016 compared to $8.7 million for the year ended December 31, 2015. Additionally, the hedged rate on $300.0 million of our unsecured term loan facility increased to an average of 3.61% from an average of 2.60% and will return to an average of 2.94% in July 2017. These increases were partially offset by a decrease in the weighted average interest rate used to finance our real estate acquisitions and fund our mortgage notes receivable.
Depreciation and amortization expense totaled
$107.6 million
for the
year ended December 31, 2016
compared to
$89.6 million
for the
year ended December 31, 2015
. The $18.0 million increase resulted primarily from asset acquisitions completed in 2016 and 2015 as well as the acceleration of depreciation on certain existing assets, and was partially offset by dispositions.
Equity in income from joint ventures was
$0.6 million
for the
year ended December 31, 2016
compared to
$1.0 million
for the
year ended December 31, 2015
. The $0.4 million decrease resulted from a decrease in income from our joint venture projects located in China.
Gain on sale of real estate was
$5.3 million
for the
year ended December 31, 2016
and related to a gain on sale of $2.5 million from the sale of three retail parcels in Texas and a gain on sale of $2.8 million from the sale of two public charter schools in connection with the exercise of tenant purchase options. Gain on sale of real estate was
$23.8 million
for the
year ended December 31, 2015
and related to a gain on sale of $23.7 million from a theatre located in Los Angeles, California and a gain on sale of $0.2 million from a parcel of land adjacent to one of our public charter school investments. The gain was partially offset by a loss on sale of $0.1 million from a parcel of land adjacent to one of our megaplex theatre properties.
52
Year ended
December 31, 2015
compared to year ended
December 31, 2014
Rental revenue was
$330.9 million
for the
year ended December 31, 2015
compared to
$286.7 million
for the
year ended December 31, 2014
. Rental revenue increased $44.2 million from the prior period, of which $50.7 million was related to acquisitions or build-to-suit projects completed in 2015 and 2014 and was partially offset by a net decrease of $6.5 million in rental revenue on existing and sold properties and by the impact of a weaker Canadian exchange rate. Percentage rents of $3.0 million and $2.0 million were recognized during the
years ended December 31, 2015 and 2014
, respectively. Straight-line rents of $12.2 million and $8.7 million were recognized during the
years ended December 31, 2015 and 2014
, respectively.
During the
year ended December 31, 2015
, we experienced an increase of approximately 4.8% in rental rates on approximately 431,000 square feet with respect to five lease renewals. Additionally, we have funded or have agreed to fund a weighted average of $16.47 per square foot in tenant improvements. There were no leasing commissions related to these renewals.
Tenant reimbursements totaled
$16.3 million
for the
year ended December 31, 2015
compared to
$17.7 million
for the
year ended December 31, 2014
. These tenant reimbursements related to the operations of our entertainment retail centers. The $1.4 million decrease was primarily due to the impact of a weaker Canadian exchange rate.
Other income was
$3.6 million
for the
year ended December 31, 2015
compared to
$1.0 million
for the
year ended December 31, 2014
. The $2.6 million increase was due to an increase of $1.7 million in income recognized upon settlement of foreign currency swap contracts as well as $1.0 million recognized in fee income during the year ended December 31, 2015.
Mortgage and other financing income for the
year ended December 31, 2015
was
$70.2 million
compared to
$79.7 million
for the year ended
year ended December 31, 2014
. The $9.5 million decrease was due primarily to a $5.0 million prepayment fee we received on December 2, 2014 in conjunction with the full and partial repayment of four mortgage notes receivable and the sale of four public charter school properties in April of 2014 which were classified as a direct financing lease. This amount was partially offset by increased real estate lending activities. Additionally, we recognized participating interest income of $1.5 million and $2.2 million for the years ended December 31, 2015 and 2014, respectively.
Our property operating expense totaled
$23.4 million
for the
year ended December 31, 2015
compared to
$24.9 million
for the
year ended December 31, 2014
. These property operating expenses arise from the operations of our retail centers and other specialty properties. The $1.5 million decrease resulted primarily from the impact of a weaker Canadian exchange rate and a decrease in other non-recoverable expenses at these properties. This amount was partially offset by an increase in bad debt expense.
Our general and administrative expense totaled
$31.0 million
for the
year ended December 31, 2015
compared to
$27.6 million
for the
year ended December 31, 2014
. The increase of $3.4 million was primarily due to an increase in payroll and benefits costs, as well as certain professional fees.
Retirement severance expense was
$18.6 million
for the
year ended December 31, 2015
and related to the retirement of our former President and Chief Executive Officer. See Note 13 to the consolidated financial statements included in this Annual Report Form 10-K for further detail. There was no retirement severance expense for the
year ended December 31, 2014
.
Our net interest expense decreased by $1.4 million to
$79.9 million
for the
year ended December 31, 2015
from
$81.3 million
for the
year ended December 31, 2014
. This decrease resulted from an increase in interest cost capitalized primarily related to the Adelaar casino and resort project which was $8.7 million for the year ended December 31, 2015 compared to $0 for the year ended December 31, 2014, as well as a decrease in the weighted average interest rate used to finance our real estate acquisitions and fund our mortgage notes receivable. These decreases were partially offset by an increase in average borrowings.
53
Transaction costs totaled
$7.5 million
for the
year ended December 31, 2015
compared to
$2.5 million
for the
year ended December 31, 2014
. The increase of $5.0 million was due to an increase in potential and terminated transactions.
Provision for loan loss was
$3.8 million
for the year ended December 31, 2014 and related to one note receivable. There was no provision for loan loss for the year ended December 31, 2015.
Depreciation and amortization expense totaled
$89.6 million
for the
year ended December 31, 2015
compared to
$66.7 million
for the
year ended December 31, 2014
. The $22.9 million increase resulted primarily from asset acquisitions completed in 2015 and 2014 as well as the acceleration of depreciation on certain existing assets.
Equity in income from joint ventures was
$1.0 million
for the
year ended December 31, 2015
compared to
$1.3 million
for the
year ended December 31, 2014
. The $0.3 million decrease resulted from a decrease in income from our joint venture projects located in China.
Gain on sale of real estate was
$23.8 million
for the
year ended December 31, 2015
and related to a gain on sale of $23.7 million from a theatre located in Los Angeles, California and a gain on sale of $0.2 million from a parcel of land adjacent to one of our public charter school investments. The gain was partially offset by a loss on sale of $0.1 million from a parcel of land adjacent to one of our megaplex theatre properties. Gain on sale of real estate was
$1.2 million
for the
year ended December 31, 2014
and related to the sale of one winery, one vineyard and three parcels of land.
Gain on sale of investment in a direct financing lease was $0.2 million for the year ended December 31, 2014 and related to the sale of four public charter school properties located in Florida. There was no gain on sale of investment in a direct financing lease for the year ended December 31, 2015.
Income tax expense was
$0.5 million
for the
year ended December 31, 2015
compared to
$4.2 million
for the
year ended December 31, 2014
and related primarily to Canadian income taxes on our Canadian trust as well as state income taxes and withholding tax for distributions related to our unconsolidated joint venture projects located in China. The $3.7 million decrease related primarily to lower income tax expense on our Canadian trust and the impact of a weaker Canadian exchange rate.
Income from discontinued operations was
$0.2 million
for the
year ended December 31, 2015
and related to post closing items related to the Toronto Dundas Square property. Income from discontinued operations was $3.9 million for the
year ended December 31, 2014
and related primarily to the reversal of liabilities that related to the acquisition or ownership of Toronto Dundas Square.
Liquidity and Capital Resources
Cash and cash equivalents were
$19.3 million
at
December 31, 2016
. In addition, we had restricted cash of
$9.7 million
at
December 31, 2016
. Of the restricted cash at
December 31, 2016
, $6.8 million relates to cash held for our borrowers’ debt service reserves for mortgage notes receivable or tenants' off-season rent reserve and $1.8 million relates to escrow deposits held related to potential acquisitions and redevelopments. The remaining $1.1 million is required in connection with our debt service, payment of real estate taxes and capital improvements.
As of
December 31, 2016
, we had total debt outstanding of
$2.5 billion
of which $174.9 million was fixed rate mortgage debt secured by a portion of our rental properties. The fixed rate mortgage debt had a weighted average interest rate of approximately 4.95% at
December 31, 2016
.
At
December 31, 2016
, we had outstanding $1.6 billion in aggregate principal amount of unsecured senior notes (excluding the private placement notes discussed below) ranging in interest rates from 4.50% to 7.75%. All of these notes are guaranteed by our subsidiaries that guarantee our unsecured credit facilities and existing senior unsecured notes. The notes contain various covenants, including: (i) a limitation on incurrence of any debt that would cause the ratio of our debt to adjusted total assets to exceed 60%; (ii) a limitation on incurrence of any secured debt which would
54
cause the ratio of secured debt to adjusted total assets to exceed 40%; (iii) a limitation on incurrence of any debt which would cause our debt service coverage ratio to be less than 1.5 times; and (iv) the maintenance at all times of our total unencumbered assets such that they are not less than 150% of our outstanding unsecured debt.
At
December 31, 2016
, we had no outstanding balance under our unsecured revolving credit facility, with $650.0 million of availability and with interest at a floating rate of LIBOR plus 125 basis points, which was 2.02% at
December 31, 2016
. The amount that we are able to borrow on our unsecured revolving credit facility is a function of the values and advance rates, as defined by the credit agreement, assigned to the assets included in the borrowing base less outstanding letters of credit and less other liabilities.
At
December 31, 2016
, the unsecured term loan facility had a balance of $350.0 million with interest at a floating rate of LIBOR plus 140 basis points, which was
2.17%
at
December 31, 2016
, and $300.0 million of this LIBOR-based debt has been fixed with interest rate swaps at a blended rate of 3.09% through April 5, 2019. The loan matures on April 24, 2020.
On August 22, 2016, we issued $340.0 million of senior unsecured notes in a private placement transaction. The private placement notes were issued in two tranches with $148.0 million bearing interest at 4.35% and due August 22, 2024, and $192.0 million bearing interest 4.56% and due August 22, 2026. The private placement notes are guaranteed by our subsidiaries that guarantee our unsecured credit facilities and existing senior unsecured notes discussed above.
Our unsecured credit facilities and the private placement notes contain financial covenants or restrictions that limit our levels of consolidated debt, secured debt, investment levels outside certain categories and dividend distributions, and require us to maintain a minimum consolidated tangible net worth and meet certain coverage levels for fixed charges and debt service. Additionally, these debt instruments contain cross-default provisions if we default under other indebtedness exceeding certain amounts. Those cross-default thresholds vary from $25.0 million to, in the case of the note purchase agreement governing the private placement notes, $75.0 million. We were in compliance with all financial covenants under our debt instruments at
December 31, 2016
.
Our principal investing activities are acquiring, developing and financing entertainment, education and recreation properties. These investing activities have generally been financed with senior unsecured notes and mortgage debt, as well as the proceeds from equity offerings. Our unsecured revolving credit facility is also used to finance the acquisition or development of properties, and to provide mortgage financing. We have and expect to continue to issue debt securities in public or private offerings. We have and may in the future assume mortgage debt in connection with property acquisitions. We may also issue equity securities in connection with acquisitions. Continued growth of our rental property and mortgage financing portfolios will depend in part on our continued ability to access funds through additional borrowings and securities offerings, and, to a lesser extent, our ability to assume debt in connection with property acquisitions. We may also fund investments with the proceeds from asset dispositions.
Certain of our other long-term debt agreements contain customary restrictive covenants related to financial and operating performance as well as certain cross-default provisions. We were in compliance with all financial covenants at
December 31, 2016
.
During the
year ended December 31, 2016
, we issued
258,263
common shares under our DSPP for net proceeds of
$16.9 million
. Additionally, on January 21, 2016, we issued
2,250,000
common shares in a registered public offering for a total net proceeds, after the underwriting discount and offering expenses of approximately
$125.0 million
. The net proceeds from these issuances were used to pay down our unsecured revolving credit facility.
55
Liquidity Requirements
Short-term liquidity requirements consist primarily of normal recurring corporate operating expenses, debt service requirements and dividends to shareholders. We meet these requirements primarily through cash provided by operating activities. Net cash provided by operating activities was
$306.2 million
,
$278.5 million
and
$250.3 million
for the years ended
December 31, 2016, 2015 and 2014
, respectively. Net cash used by investing activities was
$662.1 million
,
$568.5 million
and
$376.2 million
for the years ended
December 31, 2016, 2015 and 2014
, respectively. Net cash provided by financing activities was
$371.1 million
,
$292.0 million
and
$121.6 million
for the years ended
December 31, 2016, 2015 and 2014
, respectively. We anticipate that our cash on hand, cash from operations, and funds available under our unsecured revolving credit facility will provide adequate liquidity to fund our operations, make interest and principal payments on our debt, and allow dividends to be paid to our shareholders and avoid corporate level federal income or excise tax in accordance with REIT Internal Revenue Code requirements.
Liquidity requirements at
December 31, 2016
consisted primarily of maturities of debt. Contractual obligations as of
December 31, 2016
are as follows (in thousands):
|
|
Year ended December 31,
|
||||||||||||||||||||||||||
|
Contractual Obligations
|
2017
|
2018
|
2019
|
2020
|
2021
|
Thereafter
|
Total
|
||||||||||||||||||||
|
Long Term Debt Obligations
|
$
|
163,266
|
|
$
|
11,684
|
|
$
|
—
|
|
$
|
600,000
|
|
$
|
—
|
|
$
|
1,739,995
|
|
$
|
2,514,945
|
|
||||||
|
Interest on Long Term Debt Obligations
|
119,928
|
|
114,210
|
|
112,357
|
|
97,688
|
|
84,821
|
|
245,375
|
|
774,379
|
|
|||||||||||||
|
Operating Lease Obligations
|
856
|
|
856
|
|
856
|
|
856
|
|
884
|
|
4,592
|
|
8,900
|
|
|||||||||||||
|
Total
|
$
|
284,050
|
|
$
|
126,750
|
|
$
|
113,213
|
|
$
|
698,544
|
|
$
|
85,705
|
|
$
|
1,989,962
|
|
$
|
3,298,224
|
|
||||||
Commitments
As of
December 31, 2016
, we had an aggregate of approximately
$313.7 million
of commitments to fund development projects including
20
entertainment development projects for which we have commitments to fund approximately
$82.3 million
,
20
education development projects for which we have commitments to fund approximately
$126.1 million
of additional improvements and
seven
recreation development projects for which we have commitments to fund approximately
$105.3 million
. Of these amounts, approximately $263.2 million is expected to be funded in 2017. Development costs are advanced by us in periodic draws. If we determine that construction is not being completed in accordance with the terms of the development agreements, we can discontinue funding construction draws. We have agreed to lease the properties to the operators at pre-determined rates upon completion of construction.
Additionally, as of
December 31, 2016
, we had a commitment to fund approximately
$155.0 million
over the next three years, of which
$1.7 million
has been funded, to complete an indoor waterpark hotel and adventure park at our casino and resort project in Sullivan County, New York. We are also responsible for the construction of this project's common infrastructure. In June 2016, the Sullivan County Infrastructure Local Development Corporation issued
$110.0 million
of Series 2016 Revenue Bonds, which is expected to fund a substantial portion of such construction costs. We received an initial reimbursement of
$43.4 million
of construction costs and expect to receive an additional
$44.9 million
of reimbursements over the balance of the construction period. Construction of infrastructure improvements is expected to be completed in 2018.
We have certain commitments related to our mortgage note investments that we may be required to fund in the future. We are generally obligated to fund these commitments at the request of the borrower or upon the occurrence of events outside of our direct control. As of
December 31, 2016
, we had
four
mortgage notes receivable with commitments totaling approximately
$14.2 million
, of which $11.6 million is expected to be funded in 2017. If commitments are funded in the future, interest will be charged at rates consistent with the existing investments.
We have provided guarantees of the payment of certain economic development revenue bonds totaling
$24.9 million
related to
two
theatres in Louisiana for which we earn fees at annual rates of
2.88%
to
4.00%
over the
30
year terms of the bonds. We have recorded
$10.6 million
as a deferred asset included in other assets and
$10.6 million
included
56
in other liabilities in the accompanying consolidated balance sheet included in this Annual Report on Form 10-K as of
December 31, 2016
related to these guarantees.
No
amounts have been accrued as a loss contingency related to this guarantee because payment by us is not probable.
In connection with construction of our development projects and related infrastructure, certain public agencies require posting of surety bonds to guarantee that the Company's obligations are satisfied. These bonds expire upon the completion of the improvements or infrastructure. As of
December 31, 2016
. the Company had
six
surety bonds outstanding totaling
$24.3 million
.
During the year ended December 31, 2016,we posted
two
letters of credit totaling
$5.0 million
in connection with a performance guarantee to complete certain site improvements at
two
theatres. The letters of credit expire on June 1, 2018.
Additionally, on November 2, 2016, we entered into a Purchase and Sale Agreement with CNL and SRH to acquire and finance certain ski areas, attractions and family entertainment centers. See "Recent Developments" for further description of this proposed transaction and related commitments.
Liquidity Analysis
In analyzing our liquidity, we generally expect that our cash provided by operating activities will meet our normal recurring operating expenses, recurring debt service requirements and dividends to shareholders.
We have $158.2 million in debt balloon payments coming due in 2017. Our sources of liquidity as of
December 31, 2016
to pay the 2017 commitments described above include the amount available under our unsecured revolving credit facility of approximately $650.0 million and unrestricted cash on hand of
$19.3 million
. Accordingly, while there can be no assurance, we expect that our sources of cash will exceed our existing commitments over the remainder of 2017.
We also believe that we will be able to repay, extend, refinance or otherwise settle our debt obligations for 2018 and thereafter as the debt comes due, and that we will be able to fund our remaining commitments as necessary. However, there can be no assurance that additional financing or capital will be available, or that terms will be acceptable or advantageous to us.
Our primary use of cash after paying operating expenses, debt service, dividends to shareholders and funding existing commitments is in growing our investment portfolio through the acquisition, development and financing of additional properties. We expect to finance these investments with borrowings under our unsecured revolving credit facility, as well as debt and equity financing alternatives and proceeds from asset dispositions. The availability and terms of any such financing or sales will depend upon market and other conditions. If we borrow the maximum amount available under our unsecured revolving credit facility, there can be no assurance that we will be able to obtain additional investment financing (See Item 1A - “Risk Factors”). We may also assume mortgage debt in connection with property acquisitions.
Capital Structure
We believe that our shareholders are best served by a conservative capital structure. Therefore, we seek to maintain a conservative debt level on our balance sheet as measured primarily by our net debt to adjusted EBITDA ratio (see "Non-GAAP Financial Measures" for definitions). We also seek to maintain conservative interest, fixed charge, debt service coverage and net debt to gross asset ratios.
We expect to maintain our net debt to adjusted EBITDA ratio between 4.6x to 5.6x. Our net debt to adjusted EBITDA ratio was
5.48
x as of
December 31, 2016
(see "Non-GAAP Financial Measures" for calculation). Because adjusted EBITDA as defined does not include the annualization of adjustments for projects put in service during the quarter and other items, and net debt includes the debt provided for build-to-suit projects under development that do not have any current EBITDA, we also look at a ratio adjusted for these items. The level of this additional ratio, along with the timing and size of our equity and debt offerings, may cause us to temporarily operate outside our stated range for the net debt to adjusted EBITDA ratio of 4.6x to 5.6x. At December 31, 2016, our net debt to adjusted EBITDA ratio was at the
57
higher end of the range as we anticipate issuing a substantial amount of equity in 2017 in connection with the proposed transaction with CNL and SRH which would have the effect of reducing this ratio.
Our net debt (see "Non-GAAP Financial Measures" for definition) to gross assets ratio (i.e. net debt to total assets plus accumulated depreciation less cash and cash equivalents) was 45% as of
December 31, 2016
. Our net debt as a percentage of our total market capitalization at
December 31, 2016
was 34%. We calculate our total market capitalization of $7.4 billion by aggregating the following at
December 31, 2016
:
|
•
|
Common shares outstanding of 63,647,081 multiplied by the last reported sales price of our common shares on the NYSE of $71.77 per share, or $4.6 billion;
|
|
•
|
Aggregate liquidation value of our Series C convertible preferred shares of $135.0 million;
|
|
•
|
Aggregate liquidation value of our Series E convertible preferred shares of $86.3 million;
|
|
•
|
Aggregate liquidation value of our Series F redeemable preferred shares of $125.0 million; and
|
|
•
|
Net debt of
$2.5 billion
.
|
58
Non-GAAP Financial Measures
Funds From Operations (FFO), Funds From Operations As Adjusted (FFOAA) and Adjusted Funds from Operations (AFFO)
The National Association of Real Estate Investment Trusts (“NAREIT”) developed FFO as a relative non-GAAP financial measure of performance of an equity REIT in order to recognize that income-producing real estate historically has not depreciated on the basis determined under GAAP. Pursuant to the definition of FFO by the Board of Governors of NAREIT, we calculate FFO as net income available to common shareholders, computed in accordance with GAAP, excluding gains and losses from sales [or acquisitions] of depreciable operating properties and impairment losses of depreciable real estate, plus real estate related depreciation and amortization, and after adjustments for unconsolidated partnerships, joint ventures and other affiliates. Adjustments for unconsolidated partnerships, joint ventures and other affiliates are calculated to reflect FFO on the same basis. We have calculated FFO for all periods presented in accordance with this definition.
In addition to FFO, we present FFOAA and AFFO. FFOAA is presented by adding to FFO costs (gain) associated with loan refinancing or payoff, net, transaction costs (benefit), retirement severance expense, preferred share redemption costs, termination fees associated with tenants' exercises of education properties buy-out options and provision for loan losses, and subtracting gain on early extinguishment of debt, gain (loss) on sale of land, gain on insurance recovery and deferred income tax benefit (expense). AFFO is presented by adding to FFOAA non-real estate depreciation and amortization, deferred financing fees amortization, share-based compensation expense to management and Trustees and amortization of above market leases, net; and subtracting maintenance capital expenditures (including second generation tenant improvements and leasing commissions), straight-lined rental revenue, and the non-cash portion of mortgage and other financing income.
FFO, FFOAA and AFFO are widely used measures of the operating performance of real estate companies and are provided here as a supplemental measure to GAAP net income available to common shareholders and earnings per share, and management provides FFO, FFOAA and AFFO herein because it believes this information is useful to investors in this regard. FFO, FFOAA and AFFO are non-GAAP financial measures. FFO, FFOAA and AFFO do not represent cash flows from operations as defined by GAAP and are not indicative that cash flows are adequate to fund all cash needs and are not to be considered alternatives to net income or any other GAAP measure as a measurement of the results of our operations or our cash flows or liquidity as defined by GAAP. It should also be noted that not all REITs calculate FFO, FFOAA and AFFO the same way so comparisons with other REITs may not be meaningful.
The following table summarizes our FFO, FFOAA and AFFO including per share amounts for FFO and FFOAA, for the years ended
December 31, 2016, 2015 and 2014
and reconciles such measures to net income available to common shareholders, the most directly comparable GAAP measure (unaudited, in thousands, except per share information):
59
|
|
Year ended December 31,
|
||||||||||
|
|
2016
|
2015
|
2014
|
||||||||
|
FFO:
|
|||||||||||
|
Net income available to common shareholders of EPR Properties
|
$
|
201,176
|
|
$
|
170,726
|
|
$
|
155,826
|
|
||
|
Gain on sale of real estate (excluding land sale)
|
(2,819
|
)
|
(23,748
|
)
|
(879
|
)
|
|||||
|
Gain on sale of investment in a direct financing lease
|
—
|
|
—
|
|
(220
|
)
|
|||||
|
Real estate depreciation and amortization
|
106,049
|
|
87,965
|
|
65,501
|
|
|||||
|
Allocated share of joint venture depreciation
|
229
|
|
255
|
|
225
|
|
|||||
|
FFO available to common shareholders of EPR Properties
|
$
|
304,635
|
|
$
|
235,198
|
|
$
|
220,453
|
|
||
|
FFO available to common shareholders of EPR Properties
|
$
|
304,635
|
|
$
|
235,198
|
|
$
|
220,453
|
|
||
|
Add: Preferred dividends for Series C preferred shares
|
7,764
|
|
7,763
|
|
7,763
|
|
|||||
|
Diluted FFO available to common shareholders of EPR Properties
|
$
|
312,399
|
|
$
|
242,961
|
|
$
|
228,216
|
|
||
|
FFOAA:
|
|||||||||||
|
FFO available to common shareholders of EPR Properties
|
$
|
304,635
|
|
$
|
235,198
|
|
$
|
220,453
|
|
||
|
Costs associated with loan refinancing or payoff
|
905
|
|
270
|
|
301
|
|
|||||
|
Gain on insurance recovery (included in other income)
|
(4,684
|
)
|
—
|
|
—
|
|
|||||
|
Termination fee included in gain on sale
|
2,819
|
|
—
|
|
—
|
|
|||||
|
Transaction costs (benefit)
|
7,869
|
|
7,518
|
|
(924
|
)
|
|||||
|
Provision for loan losses
|
—
|
|
—
|
|
3,777
|
|
|||||
|
Retirement severance expense
|
—
|
|
18,578
|
|
—
|
|
|||||
|
Gain on sale of land
|
(2,496
|
)
|
(81
|
)
|
(330
|
)
|
|||||
|
Deferred income tax expense (benefit)
|
(1,065
|
)
|
(1,136
|
)
|
1,796
|
|
|||||
|
FFOAA available to common shareholders of EPR Properties
|
$
|
307,983
|
|
$
|
260,347
|
|
$
|
225,073
|
|
||
|
FFOAA available to common shareholders of EPR Properties
|
$
|
307,983
|
|
$
|
260,347
|
|
$
|
225,073
|
|
||
|
Add: Preferred dividends for Series C preferred shares
|
7,764
|
|
7,763
|
|
7,763
|
|
|||||
|
Diluted FFOAA available to common shareholders of EPR Properties
|
$
|
315,747
|
|
$
|
268,110
|
|
$
|
232,836
|
|
||
|
AFFO:
|
|||||||||||
|
FFOAA available to common shareholders of EPR Properties
|
$
|
307,983
|
|
$
|
260,347
|
|
$
|
225,073
|
|
||
|
Non-real estate depreciation and amortization
|
1,524
|
|
1,653
|
|
1,238
|
|
|||||
|
Deferred financing fees amortization
|
4,787
|
|
4,588
|
|
4,248
|
|
|||||
|
Share-based compensation expense to management and trustees
|
11,164
|
|
8,508
|
|
8,902
|
|
|||||
|
Maintenance capital expenditures (1)
|
(6,214
|
)
|
(3,856
|
)
|
(7,681
|
)
|
|||||
|
Straight-lined rental revenue
|
(17,012
|
)
|
(12,159
|
)
|
(8,665
|
)
|
|||||
|
Non-cash portion of mortgage and other financing income
|
(3,769
|
)
|
(9,435
|
)
|
(6,358
|
)
|
|||||
|
Amortization of above/below market leases, net and tenant improvements
|
183
|
|
192
|
|
192
|
|
|||||
|
AFFO available to common shareholders of EPR Properties
|
$
|
298,646
|
|
$
|
249,838
|
|
$
|
216,949
|
|
||
|
FFO per common share attributable to EPR Properties:
|
|||||||||||
|
Basic
|
$
|
4.81
|
|
$
|
4.05
|
|
$
|
4.06
|
|
||
|
Diluted
|
4.77
|
|
4.03
|
|
4.04
|
|
|||||
|
FFOAA per common share attributable to EPR Properties:
|
|||||||||||
|
Basic
|
$
|
4.86
|
|
$
|
4.48
|
|
$
|
4.15
|
|
||
|
Diluted
|
4.82
|
|
4.44
|
|
4.13
|
|
|||||
|
Shares used for computation (in thousands):
|
|||||||||||
|
Basic
|
63,381
|
|
58,138
|
|
54,244
|
|
|||||
|
Diluted
|
63,474
|
|
58,328
|
|
54,444
|
|
|||||
|
Weighted average shares outstanding-diluted EPS
|
63,474
|
|
58,328
|
|
54,444
|
|
|||||
|
Effect of dilutive Series C preferred shares
|
2,032
|
|
2,017
|
|
1,989
|
|
|||||
|
Adjusted weighted average shares outsanding-diluted
|
65,506
|
|
60,345
|
|
56,433
|
|
|||||
|
Other financial information:
|
|||||||||||
|
Dividends per common share
|
$
|
3.84
|
|
$
|
3.63
|
|
$
|
3.42
|
|
||
|
(1)
|
Includes maintenance capital expenditures and certain second generation tenant improvements and leasing commissions.
|
60
The conversion of the 5.75% Series C cumulative convertible preferred shares would be dilutive to FFO per share and to FFOAA per share for the years ended December 31, 2016, 2015 and 2014. Therefore, the additional 2.0 million shares that would result from the conversion and the corresponding add-back of the preferred dividends declared on those shares are included in the calculation of diluted FFO and diluted FFOAA per share for these periods. The effect of the conversion of our 9.0% Series E cumulative convertible preferred shares do not result in more dilution to per share results and are therefore not included in the calculation of diluted per share data for the years ended December 31, 2016, 2015 and 2014.
Net Debt
Net Debt represents debt (reported in accordance with GAAP) adjusted to exclude deferred financing costs, net and reduced for cash and cash equivalents. By excluding deferred financing costs, net and reducing debt for cash and cash equivalents on hand, the result provides an estimate of the contractual amount of borrowed capital to be repaid, net of cash available to repay it. We believe this calculation constitutes a beneficial supplemental non-GAAP financial disclosure to investors in understanding our financial condition. Our method of calculating Net Debt may be different from methods used by other REITs and, accordingly, may not be comparable to such other REITs.
Adjusted EBITDA
Management uses Adjusted EBITDA in its analysis of the performance of the business and operations of the Company. Management believes Adjusted EBITDA is useful to investors because it excludes various items that management believes are not indicative of operating performance, and that it is an informative measure to use in computing various financial ratios to evaluate the Company. We define Adjusted EBITDA as net income available to common shareholders excluding costs associated with loan refinancing or payoff, interest expense (net), depreciation and amortization, equity in (income) loss from joint ventures, gain (loss) on the sale of real estate, gain on insurance recovery, income tax expense (benefit), preferred dividend requirements, the effect of non-cash impairment charges, retirement severance expense, the provision for loan losses and transaction costs (benefit), and which is then multiplied by four to get an annual amount.
Our method of calculating Adjusted EBITDA may be different from methods used by other REITs and, accordingly, may not be comparable to such other REITs. Adjusted EBITDA is not a measure of performance under GAAP, does not represent cash generated from operations as defined by GAAP and is not indicative of cash available to fund all cash needs, including distributions. This measure should not be considered as an alternative to net income for the purpose of evaluating the Company's performance or to cash flows as a measure of liquidity.
Net Debt to Adjusted EBITDA Ratio
Net Debt to Adjusted EBITDA Ratio is a supplemental measure derived from non-GAAP financial measures that we use to evaluate our capital structure and the magnitude of our debt against our operating performance. We believe that investors commonly use versions of this ratio in a similar manner. In addition, financial institutions use versions of this ratio in connection with debt agreements to set pricing and covenant limitations. Our method of calculating Net Debt to Adjusted EBITDA may be different from methods used by other REITs and, accordingly, may not be comparable to such other REITs.
Reconciliations of debt and net income available to common shareholders (both reported in accordance with GAAP) to Net Debt, Adjusted EBITDA and Net Debt to Adjusted EBITDA Ratio (each of which is a non-GAAP financial measure) are included in the following tables (unaudited, in thousands):
61
|
December 31,
|
|||||||
|
2016
|
2015
|
||||||
|
Net Debt:
|
|||||||
|
Debt
|
$
|
2,485,625
|
|
$
|
1,981,920
|
|
|
|
Deferred financing costs, net
|
29,320
|
|
18,289
|
|
|||
|
Cash and cash equivalents
|
(19,335
|
)
|
(4,283
|
)
|
|||
|
Net Debt
|
$
|
2,495,610
|
|
$
|
1,995,926
|
|
|
|
Three Months Ended December 31,
|
|||||||
|
2016
|
2015
|
||||||
|
Adjusted EBITDA:
|
|||||||
|
Net income available to common shareholders of EPR Properties
|
$
|
52,190
|
|
$
|
46,799
|
|
|
|
Costs associated with loan refinancing or payoff
|
—
|
|
9
|
|
|||
|
Interest expense, net
|
26,834
|
|
20,792
|
|
|||
|
Transaction costs
|
2,988
|
|
700
|
|
|||
|
Depreciation and amortization
|
28,351
|
|
24,915
|
|
|||
|
Equity in income from joint ventures
|
(118
|
)
|
(268
|
)
|
|||
|
Gain on sale of real estate
|
(1,430
|
)
|
—
|
|
|||
|
Income tax benefit (1)
|
(84
|
)
|
(936
|
)
|
|||
|
Preferred dividend requirements
|
5,951
|
|
5,951
|
|
|||
|
Gain on insurance recovery (2)
|
(847
|
)
|
—
|
|
|||
|
Adjusted EBITDA (for the quarter)
|
$
|
113,835
|
|
$
|
97,962
|
|
|
|
Adjusted EBITDA (3)
|
$
|
455,340
|
|
$
|
391,848
|
|
|
|
Net Debt/Adjusted EBITDA Ratio
|
5.48
|
|
5.09
|
|
|||
|
(1) Includes discontinued operations
|
|||||||
|
(2) Included in other income in the accompanying consolidated statements of income. Other income includes the following:
|
|||||||
|
Three Months Ended December 31,
|
|||||||
|
2016
|
2015
|
||||||
|
Income from settlement of foreign currency swap contracts
|
$
|
705
|
|
$
|
705
|
|
|
|
Fee income
|
1,588
|
|
—
|
|
|||
|
Gain on insurance recovery
|
847
|
|
—
|
|
|||
|
Miscellaneous income
|
87
|
|
508
|
|
|||
|
Other income
|
$
|
3,227
|
|
$
|
1,213
|
|
|
(3) Adjusted EBITDA for the quarter is multiplied by four to calculate an annual amount.
Total Investments
Total investments is a non-GAAP financial measure defined as the sum of the carrying values of rental properties (before accumulated depreciation), rental properties held for sale (before accumulated depreciation), land held for development, property under development, mortgage notes receivable (including related accrued interest receivable), investment in a direct financing lease, net, investment in joint ventures, intangible assets, gross (included in other assets) and notes receivable and related accrued interest receivable, net (included in other assets). Total investments is a useful measure for management and investors as it illustrates across which asset categories the Company's funds have been invested. Our method of calculating total investments may be different from methods used by other REITs and, accordingly, may not be comparable to such other REITs. A reconciliation of total investments to total assets (computed in accordance with GAAP) is included in the following table (unaudited, in thousands):
62
|
December 31, 2016
|
December 31, 2015
|
||||||
|
Total Investments:
|
|||||||
|
Rental properties, net of accumulated depreciation
|
$
|
3,595,762
|
|
$
|
3,025,199
|
|
|
|
Add back accumulated depreciation on rental properties
|
635,535
|
|
534,303
|
|
|||
|
Land held for development
|
22,530
|
|
23,610
|
|
|||
|
Property under development
|
297,110
|
|
378,920
|
|
|||
|
Mortgage notes and related accrued interest receivable
|
613,978
|
|
423,780
|
|
|||
|
Investment in a direct financing lease, net
|
102,698
|
|
190,880
|
|
|||
|
Investment in joint ventures
|
5,972
|
|
6,168
|
|
|||
|
Intangible assets, gross
(1)
|
28,787
|
|
20,715
|
|
|||
|
Notes receivable and related accrued interest receivable, net
(1)
|
4,765
|
|
2,228
|
|
|||
|
Total investments
|
$
|
5,307,137
|
|
$
|
4,605,803
|
|
|
|
Total investments
|
$
|
5,307,137
|
|
$
|
4,605,803
|
|
|
|
Cash and cash equivalents
|
19,335
|
|
4,283
|
|
|||
|
Restricted cash
|
9,744
|
|
10,578
|
|
|||
|
Account receivable, net
|
98,939
|
|
59,101
|
|
|||
|
Less: accumulated depreciation on rental properties
|
(635,535
|
)
|
(534,303
|
)
|
|||
|
Less: accumulated amortization on intangible assets
|
(14,008
|
)
|
(12,079
|
)
|
|||
|
Prepaid expenses and other current assets
|
79,410
|
|
83,887
|
|
|||
|
Total assets
|
$
|
4,865,022
|
|
$
|
4,217,270
|
|
|
|
(1)
Included in other assets in the accompanying consolidated balance sheet. Other assets includes the following:
|
|||||||
|
December 31, 2016
|
December 31, 2015
|
||||||
|
Intangible assets, gross
|
$
|
28,787
|
|
$
|
20,715
|
|
|
|
Less: accumulated amortization on intangible assets
|
(14,008
|
)
|
(12,079
|
)
|
|||
|
Notes receivable and related accrued interest receivable, net
|
4,765
|
|
2,228
|
|
|||
|
Prepaid expenses and other current assets
|
79,410
|
|
83,887
|
|
|||
|
Total other assets
|
$
|
98,954
|
|
$
|
94,751
|
|
|
Impact of Recently Issued Accounting Standards
See Note 2 to the consolidated financial statements included in this Form 10-K for additional information on the impact of recently issued accounting standards on our business.
Inflation
Investments by EPR are financed with a combination of equity and debt. During inflationary periods, which are generally accompanied by rising interest rates, our ability to grow may be adversely affected because the yield on new investments may increase at a slower rate than new borrowing costs.
Substantially all of our megaplex theatre leases as well as other leases provide for base and participating rent features. In addition, certain of our mortgage notes receivable similarly provide for base and participating interest. To the extent inflation causes tenant or borrower revenues at our properties to increase over baseline amounts, we would participate in those revenue increases through our right to receive annual percentage rent and/or participating interest.
Our leases and mortgage notes receivable also generally provide for escalation in base rents or interest in the event of increases in the Consumer Price Index, with generally a limit of 2% per annum, or fixed periodic increases. Alternatively, during deflationary periods, the escalations in base rents or interest that are dependent on increases in the Consumer Price Index in our leases and mortgage notes receivable may be adversely affected.
63
Our leases are generally triple-net leases requiring the tenants to pay substantially all expenses associated with the operation of the properties, thereby minimizing our exposure to increases in costs and operating expenses resulting from inflation. A portion of our megaplex theatre, retail and restaurant leases are non-triple-net leases. These leases represent approximately 15% of our total real estate square footage. To the extent any of those leases contain fixed expense reimbursement provisions or limitations, we may be subject to increases in costs resulting from inflation that are not fully passed through to tenants.
We are exposed to market risks, primarily relating to potential losses due to changes in interest rates and foreign currency exchange rates. We seek to mitigate the effects of fluctuations in interest rates by matching the term of new investments with new fixed rate borrowings whenever possible. As of
December 31, 2016
, we had a $650.0 million unsecured revolving credit facility with no outstanding balance and $25.0 million in bonds, all of which bear interest at a floating rate. We also had a $350.0 million unsecured term loan facility that bears interest at a floating rate and $300.0 million of this LIBOR-based debt has been fixed with interest rate swaps at a blended rate of 3.09% through April 5, 2019.
We are subject to risks associated with debt financing, including the risk that existing indebtedness may not be refinanced or that the terms of such refinancing may not be as favorable as the terms of current indebtedness. The majority of our borrowings are subject to contractual agreements or mortgages which limit the amount of indebtedness we may incur. Accordingly, if we are unable to raise additional equity or borrow money due to these limitations, our ability to make additional real estate investments may be limited.
The following table presents the principal amounts, weighted average interest rates, and other terms required by year of expected maturity to evaluate the expected cash flows and sensitivity to interest rate changes as of December 31 (including the impact of the interest rate swap agreements described below):
Expected Maturities (in millions)
|
2017
|
2018
|
2019
|
2020
|
2021
|
Thereafter
|
Total
|
Estimated
Fair Value
|
||||||||||||||||||||||||
|
December 31, 2016:
|
|||||||||||||||||||||||||||||||
|
Fixed rate debt
|
$
|
163.3
|
|
$
|
11.7
|
|
$
|
—
|
|
$
|
550.0
|
|
$
|
—
|
|
$
|
1,715.0
|
|
$
|
2,440.0
|
|
$
|
2,507.8
|
|
|||||||
|
Average interest rate
|
4.9
|
%
|
6.2
|
%
|
—
|
%
|
5.5
|
%
|
—
|
%
|
4.9
|
%
|
5.1
|
%
|
4.2
|
%
|
|||||||||||||||
|
Variable rate debt
|
$
|
—
|
|
$
|
—
|
|
$
|
—
|
|
$
|
50.0
|
|
$
|
—
|
|
$
|
25.0
|
|
$
|
75.0
|
|
$
|
75.0
|
|
|||||||
|
Average interest rate (as of December 31, 2016)
|
—
|
%
|
—
|
%
|
—
|
%
|
2.2
|
%
|
—
|
%
|
0.8
|
%
|
1.7
|
%
|
1.7
|
%
|
|||||||||||||||
|
2016
|
2017
|
2018
|
2019
|
2020
|
Thereafter
|
Total
|
Estimated
Fair Value
|
||||||||||||||||||||||||
|
December 31, 2015:
|
|||||||||||||||||||||||||||||||
|
Fixed rate debt
|
$
|
75.5
|
|
$
|
165.3
|
|
$
|
13.4
|
|
$
|
—
|
|
$
|
550.0
|
|
$
|
925.0
|
|
$
|
1,729.2
|
|
$
|
1,829.0
|
|
|||||||
|
Average interest rate
|
6.0
|
%
|
4.9
|
%
|
6.3
|
%
|
—
|
%
|
5.0
|
%
|
5.2
|
%
|
5.2
|
%
|
4.3
|
%
|
|||||||||||||||
|
Variable rate debt
|
$
|
—
|
|
$
|
—
|
|
$
|
—
|
|
$
|
196.0
|
|
$
|
50.0
|
|
$
|
25.0
|
|
$
|
271.0
|
|
$
|
271.0
|
|
|||||||
|
Average interest rate (as of December 31, 2015)
|
—
|
%
|
—
|
%
|
—
|
%
|
1.6
|
%
|
1.8
|
%
|
0.1
|
%
|
1.5
|
%
|
1.5
|
%
|
|||||||||||||||
The fair value of our debt as of
December 31, 2016 and 2015
is estimated by discounting the future cash flows of each instrument using current market rates including current market spreads.
We are exposed to foreign currency risk against our functional currency, the U.S. dollar, on our four Canadian properties and the rents received from tenants of the properties are payable in CAD. To mitigate our foreign currency risk in future periods on these Canadian properties, we entered into cross currency swaps with a fixed original notional value of $100.0 million CAD and $98.1 million U.S. The net effect of these swaps is to lock in an exchange rate of $1.05 CAD per U.S. dollar on approximately $13.5 million of annual CAD denominated cash flows on the properties through June 2018. There is no initial or final exchange of the notional amounts on these swaps. These foreign currency derivatives should hedge a significant portion of our expected CAD denominated FFO of these four Canadian properties through
64
June 2018 as their impact on our reported FFO when settled should move in the opposite direction of the exchange rates used to translate revenues and expenses of these properties.
In order to also hedge our net investment on the four Canadian properties, we entered into a forward contract with a fixed notional value of $100.0 million CAD and $94.3 million U.S. with a July 2018 settlement date. The exchange rate of this forward contract is approximately $1.06 CAD per U.S dollar. Additionally, on February 28, 2014, the Company entered into a forward contract with a fixed notional value of $100.0 million CAD and $88.1 million U.S. with a July 2018 settlement date. The exchange rate of this forward contract is approximately $1.13 CAD per U.S. dollar. These forward contracts should hedge a significant portion of our CAD denominated net investment in these four centers through July 2018 as the impact on accumulated other comprehensive income from marking the derivative to market should move in the opposite direction of the translation adjustment on the net assets of our four Canadian properties.
See Note 9 to the consolidated financial statements in this Annual Report on Form 10-K for additional information on our derivative financial instruments and hedging activities.
65
Item 8.
Financial Statements and Supplementary Data
EPR Properties
Contents
|
Report of Independent Registered Public Accounting Firm
|
|
|
Audited Financial Statements
|
|
|
Consolidated Balance Sheets
|
|
|
Consolidated Statements of Income
|
|
|
Consolidated Statements of Comprehensive Income
|
|
|
Consolidated Statements of Changes in Equity
|
|
|
Consolidated Statements of Cash Flows
|
|
|
Notes to Consolidated Financial Statements
|
|
|
Financial Statement Schedules
|
|
|
Schedule II – Valuation and Qualifying Accounts
|
|
|
Schedule III - Real Estate and Accumulated Depreciation
|
|
66
Report of Independent Registered Public Accounting Firm
The Board of Trustees and Shareholders
EPR Properties:
We have audited the accompanying consolidated balance sheets of EPR Properties and subsidiaries as of December 31, 2016 and 2015, and the related consolidated statements of income, comprehensive income, changes in equity, and cash flows for each of the years in the three‑year period ended December 31, 2016. In connection with our audits of the consolidated financial statements, we have also audited the accompanying financial statement schedules listed in Item 15 (2) of this Form 10-K. These consolidated financial statements and financial statement schedules are the responsibility of the Company’s management. Our responsibility is to express an opinion on these consolidated financial statements and financial statement schedules based on our audits.
We conducted our audits in accordance with the standards of the Public Company Accounting Oversight Board (United States). Those standards require that we plan and perform the audit to obtain reasonable assurance about whether the financial statements are free of material misstatement. An audit includes examining, on a test basis, evidence supporting the amounts and disclosures in the financial statements. An audit also includes assessing the accounting principles used and significant estimates made by management, as well as evaluating the overall financial statement presentation. We believe that our audits provide a reasonable basis for our opinion.
In our opinion, the consolidated financial statements referred to above present fairly, in all material respects, the financial position of EPR Properties and subsidiaries as of December 31, 2016 and 2015, and the results of their operations and their cash flows for each of the years in the three‑year period ended December 31, 2016, in conformity with U.S. generally accepted accounting principles. Also in our opinion, the related financial statement schedules, when considered in relation to the basic consolidated financial statements taken as a whole, present fairly, in all material respects, the information set forth therein.
We also have audited, in accordance with the standards of the Public Company Accounting Oversight Board (United States), EPR Properties’ internal control over financial reporting as of December 31, 2016, based on criteria established in
Internal Control - Integrated Framework
(2013) issued by the Committee of Sponsoring Organizations of the Treadway Commission (COSO), and our report dated
February 28, 2017
expressed an unqualified opinion on the effectiveness of the Company’s internal control over financial reporting.
/s/ KPMG LLP
|
Kansas City, Missouri
|
|
February 28, 2017
|
67
|
EPR PROPERTIES
(Dollars in thousands except share data)
|
|||||||
|
|
December 31,
|
||||||
|
|
2016
|
2015
|
|||||
|
Assets
|
|||||||
|
Rental properties, net of accumulated depreciation of $635,535 and $534,303 at December 31, 2016 and 2015, respectively
|
$
|
3,595,762
|
|
$
|
3,025,199
|
|
|
|
Land held for development
|
22,530
|
|
23,610
|
|
|||
|
Property under development
|
297,110
|
|
378,920
|
|
|||
|
Mortgage notes and related accrued interest receivable, net
|
613,978
|
|
423,780
|
|
|||
|
Investment in a direct financing lease, net
|
102,698
|
|
190,880
|
|
|||
|
Investment in joint ventures
|
5,972
|
|
6,168
|
|
|||
|
Cash and cash equivalents
|
19,335
|
|
4,283
|
|
|||
|
Restricted cash
|
9,744
|
|
10,578
|
|
|||
|
Accounts receivable, net
|
98,939
|
|
59,101
|
|
|||
|
Other assets
|
98,954
|
|
94,751
|
|
|||
|
Total assets
|
$
|
4,865,022
|
|
$
|
4,217,270
|
|
|
|
Liabilities and Equity
|
|||||||
|
Liabilities:
|
|||||||
|
Accounts payable and accrued liabilities
|
$
|
119,758
|
|
$
|
92,178
|
|
|
|
Common dividends payable
|
20,367
|
|
18,401
|
|
|||
|
Preferred dividends payable
|
5,951
|
|
5,951
|
|
|||
|
Unearned rents and interest
|
47,420
|
|
44,952
|
|
|||
|
Debt
|
2,485,625
|
|
1,981,920
|
|
|||
|
Total liabilities
|
2,679,121
|
|
2,143,402
|
|
|||
|
Equity:
|
|||||||
|
Common Shares, $.01 par value; 100,000,000 shares authorized; and 66,263,487 and 63,195,182 shares issued at December 31, 2016 and 2015, respectively
|
663
|
|
632
|
|
|||
|
Preferred Shares, $.01 par value; 25,000,000 shares authorized:
|
|||||||
|
5,399,050 and 5,400,000 Series C convertible shares issued at December 31, 2016 and 2015; liquidation preference of $134,976,250
|
54
|
|
54
|
|
|||
|
3,450,000 Series E convertible shares issued at December 31, 2016 and 2015; liquidation preference of $86,250,000
|
35
|
|
35
|
|
|||
|
5,000,000 Series F shares issued at December 31, 2016 and 2015; liquidation preference of $125,000,000
|
50
|
|
50
|
|
|||
|
Additional paid-in-capital
|
2,677,046
|
|
2,508,445
|
|
|||
|
Treasury shares at cost: 2,616,406 and 2,371,198 common shares at December 31, 2016 and 2015, respectively
|
(113,172
|
)
|
(97,328
|
)
|
|||
|
Accumulated other comprehensive income
|
7,734
|
|
5,622
|
|
|||
|
Distributions in excess of net income
|
(386,509
|
)
|
(343,642
|
)
|
|||
|
Total equity
|
$
|
2,185,901
|
|
$
|
2,073,868
|
|
|
|
Total liabilities and equity
|
$
|
4,865,022
|
|
$
|
4,217,270
|
|
|
See accompanying notes to consolidated financial statements.
68
|
EPR PROPERTIES
(Dollars in thousands except per share data)
|
|||||||||||
|
|
Year Ended December 31,
|
||||||||||
|
|
2016
|
2015
|
2014
|
||||||||
|
Rental revenue
|
$
|
399,589
|
|
$
|
330,886
|
|
$
|
286,673
|
|
||
|
Tenant reimbursements
|
15,595
|
|
16,320
|
|
17,663
|
|
|||||
|
Other income
|
9,039
|
|
3,629
|
|
1,009
|
|
|||||
|
Mortgage and other financing income
|
69,019
|
|
70,182
|
|
79,706
|
|
|||||
|
Total revenue
|
493,242
|
|
421,017
|
|
385,051
|
|
|||||
|
Property operating expense
|
22,602
|
|
23,433
|
|
24,897
|
|
|||||
|
Other expense
|
5
|
|
648
|
|
771
|
|
|||||
|
General and administrative expense
|
37,543
|
|
31,021
|
|
27,566
|
|
|||||
|
Retirement severance expense
|
—
|
|
18,578
|
|
—
|
|
|||||
|
Costs associated with loan refinancing or payoff
|
905
|
|
270
|
|
301
|
|
|||||
|
Interest expense, net
|
97,144
|
|
79,915
|
|
81,270
|
|
|||||
|
Transaction costs
|
7,869
|
|
7,518
|
|
2,452
|
|
|||||
|
Provision for loan losses
|
—
|
|
—
|
|
3,777
|
|
|||||
|
Depreciation and amortization
|
107,573
|
|
89,617
|
|
66,739
|
|
|||||
|
Income before equity in income from joint ventures and other items
|
219,601
|
|
170,017
|
|
177,278
|
|
|||||
|
Equity in income from joint ventures
|
619
|
|
969
|
|
1,273
|
|
|||||
|
Gain on sale of real estate
|
5,315
|
|
23,829
|
|
1,209
|
|
|||||
|
Gain on sale of investment in a direct financing lease
|
—
|
|
—
|
|
220
|
|
|||||
|
Income before income taxes
|
225,535
|
|
194,815
|
|
179,980
|
|
|||||
|
Income tax expense
|
(553
|
)
|
(482
|
)
|
(4,228
|
)
|
|||||
|
Income from continuing operations
|
$
|
224,982
|
|
$
|
194,333
|
|
$
|
175,752
|
|
||
|
Discontinued operations:
|
|||||||||||
|
Income from discontinued operations
|
—
|
|
199
|
|
505
|
|
|||||
|
Transaction (costs) benefit
|
—
|
|
—
|
|
3,376
|
|
|||||
|
Net income attributable to EPR Properties
|
224,982
|
|
194,532
|
|
179,633
|
|
|||||
|
Preferred dividend requirements
|
(23,806
|
)
|
(23,806
|
)
|
(23,807
|
)
|
|||||
|
Net income available to common shareholders of EPR Properties
|
$
|
201,176
|
|
$
|
170,726
|
|
$
|
155,826
|
|
||
|
Per share data attributable to EPR Properties common shareholders:
|
|||||||||||
|
Basic earnings per share data:
|
|||||||||||
|
Income from continuing operations
|
$
|
3.17
|
|
$
|
2.93
|
|
$
|
2.80
|
|
||
|
Income from discontinued operations
|
—
|
|
0.01
|
|
0.07
|
|
|||||
|
Net income available to common shareholders
|
$
|
3.17
|
|
$
|
2.94
|
|
$
|
2.87
|
|
||
|
Diluted earnings per share data:
|
|||||||||||
|
Income from continuing operations
|
$
|
3.17
|
|
$
|
2.92
|
|
$
|
2.79
|
|
||
|
Income from discontinued operations
|
—
|
|
0.01
|
|
0.07
|
|
|||||
|
Net income available to common shareholders
|
$
|
3.17
|
|
$
|
2.93
|
|
$
|
2.86
|
|
||
|
Shares used for computation (in thousands):
|
|||||||||||
|
Basic
|
63,381
|
|
58,138
|
|
54,244
|
|
|||||
|
Diluted
|
63,474
|
|
58,328
|
|
54,444
|
|
|||||
69
|
EPR PROPERTIES
Consolidated Statements of Comprehensive Income
(Dollars in thousands)
|
|||||||||||
|
|
Year Ended December 31,
|
||||||||||
|
|
2016
|
2015
|
2014
|
||||||||
|
Net income
|
$
|
224,982
|
|
$
|
194,532
|
|
$
|
179,633
|
|
||
|
Other comprehensive income (loss):
|
|||||||||||
|
Foreign currency translation adjustment
|
5,142
|
|
(33,710
|
)
|
(18,464
|
)
|
|||||
|
Change in unrealized gain (loss) on derivatives
|
(3,030
|
)
|
26,766
|
|
13,837
|
|
|||||
|
Comprehensive income attributable to EPR Properties
|
$
|
227,094
|
|
$
|
187,588
|
|
$
|
175,006
|
|
||
See accompanying notes to consolidated financial statements.
70
|
EPR PROPERTIES
Consolidated Statements of Changes in Equity
Years Ended December 31, 2016, 2015 and 2014
(Dollars in thousands)
|
|||||||||||||||||||||||||||||||||||||
|
|
EPR Properties Shareholders’ Equity
|
|
|
||||||||||||||||||||||||||||||||||
|
|
Common Stock
|
Preferred Stock
|
Additional
paid-in capital
|
Treasury
shares
|
Accumulated
other
comprehensive
income (loss)
|
Distributions
in excess of
net income
|
Noncontrolling
interests
|
Total
|
|||||||||||||||||||||||||||||
|
|
Shares
|
Par
|
Shares
|
Par
|
|||||||||||||||||||||||||||||||||
|
Balance at December 31, 2013
|
53,361,261
|
|
$
|
534
|
|
13,850,000
|
|
$
|
139
|
|
$
|
2,003,863
|
|
$
|
(62,177
|
)
|
$
|
17,193
|
|
$
|
(271,915
|
)
|
$
|
377
|
|
$
|
1,688,014
|
|
|||||||||
|
Restricted share units issued to Trustees
|
19,685
|
|
—
|
|
—
|
|
—
|
|
1,054
|
|
—
|
|
—
|
|
—
|
|
—
|
|
1,054
|
|
|||||||||||||||||
|
Issuance of nonvested shares,net
|
280,193
|
|
3
|
|
—
|
|
—
|
|
4,866
|
|
(4,186
|
)
|
—
|
|
—
|
|
—
|
|
683
|
|
|||||||||||||||||
|
Amortization of nonvested shares and restricted share units
|
—
|
|
—
|
|
—
|
|
—
|
|
6,482
|
|
—
|
|
—
|
|
—
|
|
—
|
|
6,482
|
|
|||||||||||||||||
|
Share option expense
|
—
|
|
—
|
|
—
|
|
—
|
|
1,359
|
|
—
|
|
—
|
|
—
|
|
—
|
|
1,359
|
|
|||||||||||||||||
|
Foreign currency translation adjustment
|
—
|
|
—
|
|
—
|
|
—
|
|
—
|
|
—
|
|
(18,464
|
)
|
—
|
|
—
|
|
(18,464
|
)
|
|||||||||||||||||
|
Change in unrealized gain (loss) on derivatives
|
—
|
|
—
|
|
—
|
|
—
|
|
—
|
|
—
|
|
13,837
|
|
—
|
|
—
|
|
13,837
|
|
|||||||||||||||||
|
Net income
|
—
|
|
—
|
|
—
|
|
—
|
|
—
|
|
—
|
|
—
|
|
179,633
|
|
—
|
|
179,633
|
|
|||||||||||||||||
|
Issuances of common shares
|
5,255,302
|
|
52
|
|
—
|
|
—
|
|
264,283
|
|
—
|
|
—
|
|
—
|
|
—
|
|
264,335
|
|
|||||||||||||||||
|
Stock option exercises, net
|
35,963
|
|
—
|
|
—
|
|
—
|
|
1,533
|
|
(1,483
|
)
|
—
|
|
—
|
|
—
|
|
50
|
|
|||||||||||||||||
|
Dividends to common and preferred shareholders
|
—
|
|
—
|
|
—
|
|
—
|
|
—
|
|
—
|
|
—
|
|
(210,494
|
)
|
—
|
|
(210,494
|
)
|
|||||||||||||||||
|
Balance at December 31, 2014
|
58,952,404
|
|
$
|
589
|
|
13,850,000
|
|
$
|
139
|
|
$
|
2,283,440
|
|
$
|
(67,846
|
)
|
$
|
12,566
|
|
$
|
(302,776
|
)
|
$
|
377
|
|
$
|
1,926,489
|
|
|||||||||
|
Restricted share units issued to Trustees
|
18,036
|
|
—
|
|
—
|
|
—
|
|
—
|
|
—
|
|
—
|
|
—
|
|
—
|
|
—
|
|
|||||||||||||||||
|
Issuance of nonvested shares, net
|
218,285
|
|
2
|
|
—
|
|
—
|
|
1,941
|
|
(36
|
)
|
—
|
|
—
|
|
—
|
|
1,907
|
|
|||||||||||||||||
|
Purchase of common shares for vesting
|
—
|
|
—
|
|
—
|
|
—
|
|
—
|
|
(8,222
|
)
|
—
|
|
—
|
|
—
|
|
(8,222
|
)
|
|||||||||||||||||
|
Amortization of nonvested shares and restricted share units
|
—
|
|
—
|
|
—
|
|
—
|
|
7,038
|
|
—
|
|
—
|
|
—
|
|
—
|
|
7,038
|
|
|||||||||||||||||
|
Share option expense
|
—
|
|
—
|
|
—
|
|
—
|
|
1,119
|
|
—
|
|
—
|
|
—
|
|
—
|
|
1,119
|
|
|||||||||||||||||
|
Share-based compensation included in retirement severance expense
|
—
|
|
—
|
|
—
|
|
—
|
|
6,377
|
|
—
|
|
—
|
|
—
|
|
—
|
|
6,377
|
|
|||||||||||||||||
|
Foreign currency translation adjustment
|
—
|
|
—
|
|
—
|
|
—
|
|
—
|
|
—
|
|
(33,710
|
)
|
—
|
|
—
|
|
(33,710
|
)
|
|||||||||||||||||
|
Change in unrealized gain (loss) on derivatives
|
—
|
|
—
|
|
—
|
|
—
|
|
—
|
|
—
|
|
26,766
|
|
—
|
|
—
|
|
26,766
|
|
|||||||||||||||||
|
Net income
|
—
|
|
—
|
|
—
|
|
—
|
|
—
|
|
—
|
|
—
|
|
194,532
|
|
—
|
|
194,532
|
|
|||||||||||||||||
|
Issuances of common shares
|
3,530,057
|
|
36
|
|
—
|
|
—
|
|
190,329
|
|
—
|
|
—
|
|
—
|
|
—
|
|
190,365
|
|
|||||||||||||||||
|
Stock option exercises, net
|
476,400
|
|
5
|
|
—
|
|
—
|
|
17,824
|
|
(21,224
|
)
|
—
|
|
—
|
|
—
|
|
(3,395
|
)
|
|||||||||||||||||
|
Dividends to common and preferred shareholders
|
—
|
|
—
|
|
—
|
|
—
|
|
—
|
|
—
|
|
—
|
|
(235,398
|
)
|
—
|
|
(235,398
|
)
|
|||||||||||||||||
|
Forfeiture of noncontrolling interest
|
—
|
|
—
|
|
—
|
|
—
|
|
377
|
|
—
|
|
—
|
|
—
|
|
(377
|
)
|
—
|
|
|||||||||||||||||
|
Balance at December 31, 2015
|
63,195,182
|
|
$
|
632
|
|
13,850,000
|
|
$
|
139
|
|
$
|
2,508,445
|
|
$
|
(97,328
|
)
|
$
|
5,622
|
|
$
|
(343,642
|
)
|
$
|
—
|
|
$
|
2,073,868
|
|
|||||||||
|
Continued on next page.
|
|||||||||||||||||||||||||||||||||||||
71
|
EPR PROPERTIES
Consolidated Statements of Changes in Equity
Years Ended December 31, 2016, 2015 and 2014
(Dollars in thousands) (continued)
|
|||||||||||||||||||||||||||||||||||||
|
|
EPR Properties Shareholders’ Equity
|
|
|
||||||||||||||||||||||||||||||||||
|
|
Common Stock
|
Preferred Stock
|
Additional
paid-in capital
|
Treasury
shares
|
Accumulated
other
comprehensive
income (loss)
|
Distributions
in excess of
net income
|
Noncontrolling
interests
|
Total
|
|||||||||||||||||||||||||||||
|
|
Shares
|
Par
|
Shares
|
Par
|
|||||||||||||||||||||||||||||||||
|
Continued from previous page.
|
|
|
|||||||||||||||||||||||||||||||||||
|
Balance at December 31, 2015
|
63,195,182
|
|
$
|
632
|
|
13,850,000
|
|
$
|
139
|
|
$
|
2,508,445
|
|
$
|
(97,328
|
)
|
$
|
5,622
|
|
$
|
(343,642
|
)
|
$
|
—
|
|
$
|
2,073,868
|
|
|||||||||
|
Restricted share units issued to Trustees
|
15,805
|
|
—
|
|
—
|
|
—
|
|
—
|
|
—
|
|
—
|
|
—
|
|
—
|
|
—
|
|
|||||||||||||||||
|
Issuance of nonvested shares, net
|
300,752
|
|
3
|
|
—
|
|
—
|
|
4,472
|
|
—
|
|
—
|
|
—
|
|
—
|
|
4,475
|
|
|||||||||||||||||
|
Purchase of common shares for vesting
|
—
|
|
—
|
|
—
|
|
—
|
|
—
|
|
(4,211
|
)
|
—
|
|
—
|
|
—
|
|
(4,211
|
)
|
|||||||||||||||||
|
Amortization of nonvested shares and restricted share units
|
—
|
|
—
|
|
—
|
|
—
|
|
10,255
|
|
—
|
|
—
|
|
—
|
|
—
|
|
10,255
|
|
|||||||||||||||||
|
Share option expense
|
—
|
|
—
|
|
—
|
|
—
|
|
909
|
|
—
|
|
—
|
|
—
|
|
—
|
|
909
|
|
|||||||||||||||||
|
Foreign currency translation adjustment
|
—
|
|
—
|
|
—
|
|
—
|
|
—
|
|
—
|
|
5,142
|
|
—
|
|
—
|
|
5,142
|
|
|||||||||||||||||
|
Change in unrealized gain (loss) on derivatives
|
—
|
|
—
|
|
—
|
|
—
|
|
—
|
|
—
|
|
(3,030
|
)
|
—
|
|
—
|
|
(3,030
|
)
|
|||||||||||||||||
|
Net income
|
—
|
|
—
|
|
—
|
|
—
|
|
—
|
|
—
|
|
—
|
|
224,982
|
|
—
|
|
224,982
|
|
|||||||||||||||||
|
Issuances of common shares
|
2,521,071
|
|
26
|
|
—
|
|
—
|
|
142,822
|
|
—
|
|
—
|
|
—
|
|
—
|
|
142,848
|
|
|||||||||||||||||
|
Conversion of Series C Convertible Preferred shares to common shares
|
358
|
|
—
|
|
(950
|
)
|
—
|
|
—
|
|
—
|
|
—
|
|
—
|
|
—
|
|
—
|
|
|||||||||||||||||
|
Stock option exercises, net
|
230,319
|
|
2
|
|
—
|
|
—
|
|
10,143
|
|
(11,633
|
)
|
—
|
|
—
|
|
—
|
|
(1,488
|
)
|
|||||||||||||||||
|
Dividends to common and preferred shareholders
|
—
|
|
—
|
|
—
|
|
—
|
|
—
|
|
—
|
|
—
|
|
(267,849
|
)
|
—
|
|
(267,849
|
)
|
|||||||||||||||||
|
Balance at December 31, 2016
|
66,263,487
|
|
$
|
663
|
|
13,849,050
|
|
$
|
139
|
|
$
|
2,677,046
|
|
$
|
(113,172
|
)
|
$
|
7,734
|
|
$
|
(386,509
|
)
|
$
|
—
|
|
$
|
2,185,901
|
|
|||||||||
See accompanying notes to consolidated financial statements.
72
|
EPR PROPERTIES
(Dollars in thousands)
|
|||||||||||
|
|
Year Ended December 31,
|
||||||||||
|
|
2016
|
2015
|
2014
|
||||||||
|
Operating activities:
|
|||||||||||
|
Net income attributable to EPR Properties
|
$
|
224,982
|
|
$
|
194,532
|
|
$
|
179,633
|
|
||
|
Adjustments to reconcile net income to net cash provided by operating activities:
|
|||||||||||
|
Gain on sale of real estate
|
(5,315
|
)
|
(23,829
|
)
|
(1,209
|
)
|
|||||
|
Gain on insurance recovery
|
(4,684
|
)
|
—
|
|
—
|
|
|||||
|
Deferred income tax (benefit) expense
|
(1,065
|
)
|
(1,136
|
)
|
1,796
|
|
|||||
|
Provision for loan losses
|
—
|
|
—
|
|
3,777
|
|
|||||
|
Non-cash fee income
|
(1,588
|
)
|
—
|
|
—
|
|
|||||
|
Income from discontinued operations
|
—
|
|
(199
|
)
|
(3,881
|
)
|
|||||
|
Gain on sale of investment in a direct financing lease
|
—
|
|
—
|
|
(220
|
)
|
|||||
|
Costs associated with loan refinancing or payoff
|
905
|
|
270
|
|
301
|
|
|||||
|
Equity in income from joint ventures
|
(619
|
)
|
(969
|
)
|
(1,273
|
)
|
|||||
|
Distributions from joint ventures
|
816
|
|
540
|
|
810
|
|
|||||
|
Depreciation and amortization
|
107,573
|
|
89,617
|
|
66,739
|
|
|||||
|
Amortization of deferred financing costs
|
4,787
|
|
4,588
|
|
4,248
|
|
|||||
|
Amortization of above/below market leases and tenant improvements
|
183
|
|
192
|
|
192
|
|
|||||
|
Share-based compensation expense to management and trustees
|
11,164
|
|
8,508
|
|
8,902
|
|
|||||
|
Share-based compensation expense included in retirement severance expense
|
—
|
|
6,377
|
|
—
|
|
|||||
|
(Increase) decrease in restricted cash
|
(1,619
|
)
|
2,017
|
|
(8
|
)
|
|||||
|
Decrease (increase) in mortgage notes accrued interest receivable
|
572
|
|
(4,133
|
)
|
(3,997
|
)
|
|||||
|
Increase in accounts receivable, net
|
(37,627
|
)
|
(11,623
|
)
|
(5,214
|
)
|
|||||
|
Increase in direct financing lease receivable
|
(3,255
|
)
|
(3,559
|
)
|
(2,993
|
)
|
|||||
|
(Increase) decrease in other assets
|
(3,320
|
)
|
343
|
|
(3,360
|
)
|
|||||
|
Increase in accounts payable and accrued liabilities
|
17,025
|
|
5,711
|
|
4,586
|
|
|||||
|
(Decrease) increase in unearned rents and interest
|
(2,713
|
)
|
10,705
|
|
1,323
|
|
|||||
|
Net operating cash provided by continuing operations
|
306,202
|
|
277,952
|
|
250,152
|
|
|||||
|
Net operating cash provided by discontinued operations
|
—
|
|
508
|
|
143
|
|
|||||
|
Net cash provided by operating activities
|
306,202
|
|
278,460
|
|
250,295
|
|
|||||
|
Investing activities:
|
|||||||||||
|
Acquisition of and investments in rental properties and other assets
|
(219,169
|
)
|
(179,820
|
)
|
(85,205
|
)
|
|||||
|
Proceeds from sale of real estate
|
23,860
|
|
46,718
|
|
12,055
|
|
|||||
|
Proceeds from settlement of derivative
|
—
|
|
—
|
|
5,725
|
|
|||||
|
Investment in mortgage notes receivable
|
(192,539
|
)
|
(72,698
|
)
|
(93,877
|
)
|
|||||
|
Proceeds from mortgage note receivable paydown
|
72,072
|
|
40,956
|
|
76,256
|
|
|||||
|
Investment in promissory notes receivable
|
(1,546
|
)
|
—
|
|
(4,387
|
)
|
|||||
|
Proceeds from promissory note receivable paydown
|
—
|
|
—
|
|
1,750
|
|
|||||
|
Proceeds from sale of infrastructure related to issuance of revenue bonds
|
43,462
|
|
—
|
|
—
|
|
|||||
|
Proceeds from insurance recovery
|
4,610
|
|
—
|
|
—
|
|
|||||
|
Proceeds from sale of investment in a direct financing lease, net
|
20,951
|
|
4,741
|
|
46,092
|
|
|||||
|
Additions to properties under development
|
(413,848
|
)
|
(408,436
|
)
|
(334,635
|
)
|
|||||
|
Net cash used by investing activities
|
(662,147
|
)
|
(568,539
|
)
|
(376,226
|
)
|
|||||
|
Financing activities:
|
|||||||||||
|
Proceeds from long-term debt facilities and senior unsecured notes
|
1,380,000
|
|
856,914
|
|
379,000
|
|
|||||
|
Principal payments on debt
|
(865,266
|
)
|
(503,314
|
)
|
(310,253
|
)
|
|||||
|
Deferred financing fees paid
|
(14,385
|
)
|
(7,047
|
)
|
(814
|
)
|
|||||
|
Costs associated with loan refinancing or payoff (cash portion)
|
(482
|
)
|
—
|
|
(25
|
)
|
|||||
|
Net proceeds from issuance of common shares
|
142,628
|
|
190,158
|
|
264,158
|
|
|||||
|
Impact of stock option exercises, net
|
(1,488
|
)
|
(3,394
|
)
|
50
|
|
|||||
|
Purchase of common shares for treasury for vesting
|
(4,211
|
)
|
(8,222
|
)
|
(2,892
|
)
|
|||||
|
Dividends paid to shareholders
|
(265,662
|
)
|
(233,073
|
)
|
(207,637
|
)
|
|||||
|
Net cash provided by financing activities
|
371,134
|
|
292,022
|
|
121,587
|
|
|||||
|
Effect of exchange rate changes on cash
|
(137
|
)
|
(996
|
)
|
(278
|
)
|
|||||
|
Net increase (decrease) in cash and cash equivalents
|
15,052
|
|
947
|
|
(4,622
|
)
|
|||||
|
Cash and cash equivalents at beginning of the year
|
4,283
|
|
3,336
|
|
7,958
|
|
|||||
|
Cash and cash equivalents at end of the year
|
$
|
19,335
|
|
$
|
4,283
|
|
$
|
3,336
|
|
||
|
Supplemental information continued on next page.
|
|||||||||||
73
|
EPR PROPERTIES
Consolidated Statements of Cash Flows
(Dollars in thousands)
Continued from previous page.
|
|||||||||||
|
|
Year Ended December 31,
|
||||||||||
|
|
2016
|
2015
|
2014
|
||||||||
|
Supplemental schedule of non-cash activity:
|
|||||||||||
|
Transfer of property under development to rental property
|
$
|
454,922
|
|
$
|
392,786
|
|
$
|
236,428
|
|
||
|
Transfer of land held for development to property under development
|
$
|
—
|
|
$
|
167,600
|
|
$
|
—
|
|
||
|
Acquisiton of real estate in exchange for assumption of debt at fair value
|
$
|
—
|
|
$
|
—
|
|
$
|
101,441
|
|
||
|
Issuance of nonvested shares and restricted share units at fair value, including nonvested shares issued for payment of bonuses
|
$
|
19,626
|
|
$
|
14,285
|
|
$
|
15,525
|
|
||
|
Conversion of mortgage note receivable to rental property
|
$
|
—
|
|
$
|
120,051
|
|
$
|
—
|
|
||
|
Adjustment of noncontrolling interest to additional paid in capital
|
$
|
—
|
|
$
|
377
|
|
$
|
—
|
|
||
|
Sale of investment in a direct financing lease, net in exchange for mortgage note receivable
|
$
|
70,304
|
|
$
|
—
|
|
$
|
—
|
|
||
|
Supplemental disclosure of cash flow information:
|
|||||||||||
|
Cash paid during the year for interest
|
$
|
96,410
|
|
$
|
90,850
|
|
$
|
85,290
|
|
||
|
Cash paid during the year for income taxes
|
$
|
1,684
|
|
$
|
1,956
|
|
$
|
710
|
|
||
|
Interest cost capitalized
|
$
|
10,697
|
|
$
|
18,546
|
|
$
|
7,525
|
|
||
|
Increase in accrued capital expenditures
|
$
|
6,035
|
|
$
|
417
|
|
$
|
7,053
|
|
||
See accompanying notes to consolidated financial statements.
74
EPR PROPERTIES
Notes to Consolidated Financial Statements
December 31, 2016, 2015 and 2014
1. Organization
Description of Business
EPR Properties (the Company) is a specialty real estate investment trust (REIT) organized on August 29, 1997 in Maryland. The Company develops, owns, leases and finances properties in select market segments primarily related to Entertainment, Education and Recreation. The Company’s properties are located in the United States and Canada.
2. Summary of Significant Accounting Policies
Principles of Consolidation
The consolidated financial statements include the accounts of EPR Properties and its subsidiaries, all of which are wholly owned.
The Company consolidates certain entities when it is deemed to be the primary beneficiary in a variable interest entity (VIE) in which it has a controlling financial interest in accordance with the consolidation guidance of the Financial Accounting Standards Board (FASB) Accounting Standards Codification (ASC).
Use of Estimates
Management of the Company has made a number of estimates and assumptions relating to the reporting of assets and liabilities and the disclosure of contingent assets and liabilities to prepare these consolidated financial statements in conformity with accounting principles generally accepted in the United States of America. Actual results could differ from those estimates.
Rental Properties
Rental properties are carried at cost less accumulated depreciation. Costs incurred for the acquisition and development of the properties are capitalized. Depreciation is computed using the straight-line method over the estimated useful lives of the assets, which generally are estimated to be
30
to
40
years for buildings and
3
to
25
years for furniture, fixtures and equipment. Tenant improvements, including allowances, are depreciated over the shorter of the base term of the lease or the estimated useful life. Expenditures for ordinary maintenance and repairs are charged to operations in the period incurred. Significant renovations and improvements, which improve or extend the useful life of the asset, are capitalized and depreciated over their estimated useful life.
Management reviews a property for impairment whenever events or changes in circumstances indicate that the carrying value of a property may not be recoverable. The review of recoverability is based on an estimate of undiscounted future cash flows expected to result from its use and eventual disposition. If impairment exists due to the inability to recover the carrying value of the property, an impairment loss is recorded to the extent that the carrying value of the property exceeds its estimated fair value.
The Company evaluates the held-for-sale classification of its real estate as of the end of each quarter. Assets that are classified as held for sale are recorded at the lower of their carrying amount or fair value less costs to sell. Assets are generally classified as held for sale once management has initiated an active program to market them for sale and has received a firm purchase commitment that is expected to close within one year. On occasion, the Company will receive unsolicited offers from third parties to buy individual Company properties. Under these circumstances, the Company will classify the properties as held for sale when a sales contract is executed with no contingencies and the prospective buyer has funds at risk to ensure performance.
Accounting for Acquisitions
Upon acquisition of real estate properties, the Company determines if the acquisition meets the criteria to be accounted for as a business combination. Accordingly, the Company typically accounts for (1) acquired vacant properties, (2) acquired single tenant properties when a new lease or leases are signed at the time of acquisition, and (3) acquired single tenant properties that have an existing long-term triple-net lease or leases (greater than
seven
years) as asset acquisitions. Acquisitions of properties that include a process such as those with shorter-term leases or properties with
75
EPR PROPERTIES
Notes to Consolidated Financial Statements
December 31, 2016, 2015 and 2014
multiple tenants that require business related activities to manage and maintain the properties are treated as business combinations.
Costs incurred for asset acquisitions and development properties, including transaction costs, are capitalized. For asset acquisitions, the Company allocates the purchase price and other related costs incurred to the real estate assets acquired based on recent independent appraisals or methods similar to those used by independent appraisers and management judgment.
If the acquisition is determined to be a business combination, the Company records the fair value of acquired tangible assets (consisting of land, building, tenant improvements, and furniture, fixtures and equipment) and identified intangible assets and liabilities (consisting of above and below market leases, in-place leases, tenant relationships and assumed financing that is determined to be above or below market terms) as well as any noncontrolling interest. In addition, acquisition-related costs in connection with business combinations are expensed as incurred. Costs related to such transactions, as well as costs associated with terminated transactions, are included in the accompanying Consolidated Statements of Income as transaction costs. Transaction costs expensed totaled
$7.9 million
,
$7.5 million
and
$2.5 million
for the years ended
December 31, 2016, 2015 and 2014
, respectively.
For rental property acquisitions (asset acquisitions or business combinations) involving in-place leases, the fair value of the tangible assets is determined by valuing the property as if it were vacant based on management’s determination of the relative fair values of the assets. Management determines the “as if vacant” fair value of a property using recent independent appraisals or methods similar to those used by independent appraisers. The aggregate value of intangible assets or liabilities is measured based on the difference between the stated price plus capitalized costs and the property as if vacant.
Most of the Company’s rental property acquisitions do not involve in-place leases. Because the Company typically executes these leases simultaneously with the purchase of the real estate, no value is ascribed to in-place leases in these transactions.
In determining the fair value of acquired in-place leases, the Company considers many factors. On a lease-by-lease basis, management considers the present value of the difference between the contractual amounts to be paid pursuant to the leases and management’s estimate of fair market lease rates. For above market leases, management considers such differences over the remaining non-cancelable lease terms and for below market leases, management considers such differences over the remaining initial lease terms plus any fixed rate renewal periods. The capitalized above-market lease values are amortized as a reduction of rental income over the remaining non-cancelable terms of the respective leases. The capitalized below market lease values are amortized as an increase to rental income over the remaining initial lease terms plus any fixed rate renewal periods. Management considers several factors in determining the discount rate used in the present value calculations, including the credit risks associated with the respective tenants. If debt is assumed in the acquisition, the determination of whether it is above or below market is based upon a comparison of similar financing terms for similar rental properties at the time of the acquisition.
The fair value of acquired in-place leases also includes management’s estimate, on a lease-by-lease basis, of the present value of the following amounts: (i) the value associated with avoiding the cost of originating the acquired in-place leases (i.e. the market cost to execute the leases, including leasing commissions, legal and other related costs); (ii) the value associated with lost revenue related to tenant reimbursable operating costs estimated to be incurred during the assumed re-leasing period, (i.e. real estate taxes, insurance and other operating expenses); (iii) the value associated with lost rental revenue from existing leases during the assumed re-leasing period; and (iv) the value associated with avoided tenant improvement costs or other inducements to secure a tenant lease. These values are amortized over the remaining initial lease term of the respective leases.
The Company also determines the value, if any, associated with customer relationships considering factors such as the nature and extent of the Company’s existing business relationship with the tenants, growth prospects for developing new business with the tenants and expectation of lease renewals. The value of customer relationship intangibles is amortized over the remaining initial lease terms plus any renewal periods.
76
EPR PROPERTIES
Notes to Consolidated Financial Statements
December 31, 2016, 2015 and 2014
Management of the Company reviews the carrying value of intangible assets for impairment on an annual basis.
Intangible assets (included in Other Assets in the accompanying consolidated balance sheets) consist of the following at December 31 (in thousands):
|
2016
|
2015
|
||||||
|
In-place leases, net of accumulated amortization of $13.4 million and $11.6 million, respectively
|
$
|
13,716
|
|
$
|
7,273
|
|
|
|
Above market lease, net of accumulated amortization of $0.6 million and $0.4 million, respectively
|
479
|
|
670
|
|
|||
|
Below market lease, net of accumulated amortization of $12 thousand
|
(109
|
)
|
—
|
|
|||
|
Goodwill
|
693
|
|
693
|
|
|||
|
Total intangible assets, net
|
$
|
14,779
|
|
$
|
8,636
|
|
|
In-place leases, net at
December 31, 2016 and 2015
of approximately
$13.7 million
and
$7.3 million
, respectively, relate to
24
theatre properties and
two
early education centers. Amortization expense related to in-place leases is computed using the straight-line method and was
$1.4 million
for the years ended
December 31, 2016, 2015 and 2014
. The weighted average life for these in-place leases at
December 31, 2016
is
11.2
years.
Above market lease, net at
December 31, 2016 and 2015
relates to
one
theatre property. Amortization expense related to the above market lease is computed using the straight-line method and was
$192 thousand
for the years ended
December 31, 2016, 2015 and 2014
. The life for the above market lease at
December 31, 2016
is
2.5
years.
Below market lease, net at
December 31, 2016
relates to
one
theatre property. Amortization expense related to below market lease is computed using the straight-line method and was
$12 thousand
for the year ended
December 31, 2016
. The life for the below market lease at
December 31, 2016
is
4.7
years.
Goodwill at
December 31, 2016 and 2015
relates solely to the acquisition of New Roc that was acquired on October 27, 2003.
Future amortization of in-place leases, net, above market lease, net, and below market lease, net at
December 31, 2016
is as follows (in thousands):
|
In place leases
|
Above market lease
|
Below market lease
|
|||||||||
|
Year:
|
|||||||||||
|
2017
|
$
|
1,667
|
|
$
|
192
|
|
$
|
(23
|
)
|
||
|
2018
|
1,655
|
|
192
|
|
(23
|
)
|
|||||
|
2019
|
1,416
|
|
95
|
|
(23
|
)
|
|||||
|
2020
|
1,177
|
|
—
|
|
(23
|
)
|
|||||
|
2021
|
1,100
|
|
—
|
|
(17
|
)
|
|||||
|
Thereafter
|
6,701
|
|
—
|
|
—
|
|
|||||
|
Total
|
$
|
13,716
|
|
$
|
479
|
|
$
|
(109
|
)
|
||
Deferred Financing Costs
Deferred financing costs are amortized over the terms of the related debt obligations or mortgage note receivable as applicable. The Company early adopted the FASB issued Accounting Standards Update (ASU) No. 2015-03, Simplifying the Presentation of Debt Issue Costs, during 2015 and applied the guidance retrospectively. Deferred financing costs of
$29.3 million
and
$18.3 million
as of
December 31, 2016 and 2015
, respectively are shown as a reduction of debt. The deferred financing costs related to the unsecured revolving credit facility are included in other assets.
77
EPR PROPERTIES
Notes to Consolidated Financial Statements
December 31, 2016, 2015 and 2014
Capitalized Development Costs
The Company capitalizes certain costs that relate to property under development including interest and a portion of internal legal personnel costs.
Operating Segments
For financial reporting purposes, the Company groups its investments into
four
reportable operating segments: Entertainment, Education, Recreation and Other. See Note 19 for financial information related to these operating segments.
Revenue Recognition
Rents that are fixed and determinable are recognized on a straight-line basis over the minimum terms of the leases. Base rent escalation on leases that are dependent upon increases in the Consumer Price Index (CPI) is recognized when known. In addition, most of the Company's tenants are subject to additional rents if gross revenues of the properties exceed certain thresholds defined in the lease agreements (percentage rents). Percentage rents as well as participating interest for those mortgage agreements that contain similar such clauses are recognized at the time when specific triggering events occur as provided by the lease or mortgage agreements. Rental revenue included percentage rents of
$4.7 million
,
$3.0 million
and
$2.0 million
for the years ended
December 31, 2016, 2015 and 2014
, respectively. Mortgage and other financing income included participating interest income of
$0.8 million
,
$1.5 million
and
$2.2 million
for the years ended
December 31, 2016, 2015 and 2014
, respectively. For the years ended December 31, 2016 and 2014, mortgage and other financing income also included
$3.6 million
and
$5.0 million
in prepayment fees, respectively, related to mortgage notes that were paid either fully or partially in advance of their maturity dates. There was
no
prepayment fee included in mortgage and other financing income for the year ended December 31, 2015.
Direct financing lease income is recognized on the effective interest method to produce a level yield on funds not yet recovered. Estimated unguaranteed residual values at the date of lease inception represent management's initial estimates of fair value of the leased assets at the expiration of the lease, not to exceed original cost. Significant assumptions used in estimating residual values include estimated net cash flows over the remaining lease term and expected future real estate values. The Company evaluates on an annual basis (or more frequently if necessary) the collectability of its direct financing lease receivable and unguaranteed residual value to determine whether they are impaired. A direct financing lease receivable is considered to be impaired when, based on current information and events, it is probable that the Company will be unable to collect all amounts due according to the existing contractual terms. When a direct financing lease receivable is considered to be impaired, the amount of loss is calculated by comparing the recorded investment to the value determined by discounting the expected future cash flows at the direct financing lease receivable's effective interest rate or to the fair value of the underlying collateral, less costs to sell, if such receivable is collateralized.
Discontinued Operations
The Company evaluates each sale or disposal transaction to determine if it meets the criteria to qualify as discontinued operations. A discontinued operation is a component of an entity or group of components that have been disposed of or are classified as held for sale and represent a strategic shift that has or will have a major effect on the Company's operations and financial results, or an acquired business that is classified as held for sale on the acquisition date. If the sale or disposal transaction does not meet the criteria, the operations and related gain or loss on sale is included in income from continuing operations. The Company adopted the FASB issued ASU No. 2014-08, Reporting Discontinued Operations and Disclosures of Disposals of Components of an Entity, during 2014 and applied the guidance prospectively.
Allowance for Doubtful Accounts
Accounts receivable is reduced by an allowance for amounts where collection is not probable. The Company’s accounts receivable balance is comprised primarily of rents and operating cost recoveries due from tenants as well as accrued rental rate increases to be received over the life of the existing leases. The Company regularly evaluates the adequacy of its allowance for doubtful accounts. The evaluation primarily consists of reviewing past due account balances and considering such factors as the credit quality of the Company’s tenants, historical trends of the tenant and/or other debtor, current economic conditions and changes in customer payment terms. Additionally, with respect to tenants in bankruptcy, the Company estimates the expected recovery through bankruptcy claims and increases the allowance for
78
EPR PROPERTIES
Notes to Consolidated Financial Statements
December 31, 2016, 2015 and 2014
amounts deemed uncollectible. The allowance for doubtful accounts was
$0.9 million
and
$3.2 million
at
December 31, 2016 and 2015
, respectively.
Mortgage Notes and Other Notes Receivable
Mortgage notes and other notes receivable, including related accrued interest receivable, consist of loans originated by the Company and the related accrued and unpaid interest income as of the balance sheet date. Mortgage notes and other notes receivable are initially recorded at the amount advanced to the borrower and the Company defers certain loan origination and commitment fees, net of certain origination costs, and amortizes them over the term of the related loan. Interest income on performing loans is accrued as earned. The Company evaluates the collectability of both interest and principal of each of its loans to determine whether it is impaired. A loan is considered to be impaired when, based on current information and events, the Company determines that it is probable that it will be unable to collect all amounts due according to the existing contractual terms. An insignificant delay or shortfall in amounts of payments does not necessarily result in the loan being identified as impaired. When a loan is considered to be impaired, the amount of loss, if any, is calculated by comparing the recorded investment to the value determined by discounting the expected future cash flows at the loan’s effective interest rate or to the fair value of the Company’s interest in the underlying collateral, less costs to sell, if the loan is collateral dependent. For impaired loans, interest income is recognized on a cash basis, unless the Company determines based on the loan to estimated fair value ratio the loan should be on the cost recovery method, and any cash payments received would then be reflected as a reduction of principal. Interest income recognition is recommenced if and when the impaired loan becomes contractually current and performance is demonstrated to be resumed. The Company had
one
note receivable totaling
$3.8 million
(including
$0.1 million
in accrued interest) at December 31, 2014 that was impaired due to the inability of the borrower to meet its contractual obligations. There were no impaired loans at December 31, 2016 and 2015. Interest income of
$84 thousand
was recognized on this note for the year ended December 31, 2014 and related to the period before the note was impaired. Management of the Company evaluated the fair value of the underlying collateral of the note and concluded that a loan loss reserve for its full value of
$3.8 million
was necessary at December 31, 2014. During the year ended December 31, 2015, the Company wrote off
$3.8 million
of this previously impaired and fully reserved note receivable.
Income Taxes
The Company qualifies as a REIT under the Internal Revenue Code (the Code). A REIT that distributes at least
90%
of its taxable income to its shareholders each year and which meets certain other conditions is not taxed on that portion of its taxable income which is distributed to its shareholders. The Company intends to continue to qualify as a REIT and distribute substantially all of its taxable income to its shareholders.
The Company owns certain real estate assets which are subject to income tax in Canada. At December 31, 2016, the net Canadian deferred tax assets totaled
$12.0 million
and the temporary differences between income for financial reporting purposes and taxable income for the Canadian operations relate primarily to depreciation, capital improvements and straight line rents.
The Company has certain taxable REIT subsidiaries, as permitted under the Code, through which it conducts certain business activities and are subject to federal and state income taxes on their net taxable income. One of the taxable REIT subsidiaries holds
four
unconsolidated joint ventures located in China. The Company records these investments using the equity method; therefore the income reported by the Company is net of income tax paid to the Chinese taxing authorities. In addition, the company is liable for withholding taxes associated with the current and future repatriation of earnings of the China joint ventures. At December 31, 2016, the amount of this future liability was approximately
$161 thousand
and represented withholding taxes on 2016 and 2015 earnings. Additionally, the Company paid
$82 thousand
in withholding taxes during the year ended December 31, 2016 that related to 2014 and 2015 earnings repatriated during 2016. In addition to historical net operating loss carryovers, temporary differences between income for financial reporting purposes and taxable income for the taxable REIT subsidiaries relate primarily to timing differences from when the foreign income is recognized.
As of
December 31, 2016 and 2015
, respectively, the Canadian operations and the taxable REIT subsidiaries had deferred tax assets totaling approximately
$17.0 million
and
$14.7 million
and deferred tax liabilities totaling approximately
$4.7 million
and
$3.8 million
. Prior to January 1, 2016, a full valuation allowance had been recorded on the net taxable REIT subsidiaries deferred tax assets as it was not more-likely-than not that the TRS operations
79
EPR PROPERTIES
Notes to Consolidated Financial Statements
December 31, 2016, 2015 and 2014
would generate sufficient taxable income to utilize deferred tax assets in the future. For the year ended December 31, 2016, the Company reassessed the need for a valuation allowance and reversed its valuation allowance associated with the net TRS deferred tax assets. The Company’s consolidated deferred tax position is summarized as follows:
|
2016
|
2015
|
||||||
|
Fixed assets
|
$
|
16,022
|
|
$
|
13,791
|
|
|
|
Net operating losses
|
578
|
|
2,249
|
|
|||
|
Other
|
381
|
|
412
|
|
|||
|
Less Valuation allowance
|
—
|
|
(1,779
|
)
|
|||
|
Total deferred tax assets
|
$
|
16,981
|
|
$
|
14,673
|
|
|
|
Capital improvements
|
(1,716
|
)
|
(224
|
)
|
|||
|
Straight line receivable
|
$
|
(2,177
|
)
|
$
|
(2,731
|
)
|
|
|
Other
|
(830
|
)
|
(848
|
)
|
|||
|
Total deferred tax liabilities
|
$
|
(4,723
|
)
|
$
|
(3,803
|
)
|
|
|
Net deferred tax asset
|
$
|
12,258
|
|
$
|
10,870
|
|
|
Additionally, during the years ended
December 31, 2016 and 2015
, the Company recognized current income and withholding tax expense of
$1.7 million
and
$1.6 million
, respectively, primarily related to certain state income taxes and foreign withholding tax. The table below details the current and deferred income tax benefit (expense) for the years ended
December 31, 2016, 2015 and 2014
(in thousands):
|
2016
|
2015
|
2014
|
|||||||||
|
Current TRS income tax
|
$
|
(36
|
)
|
$
|
—
|
|
$
|
—
|
|
||
|
Current state income tax expense
|
(414
|
)
|
(899
|
)
|
(579
|
)
|
|||||
|
Current foreign income tax
|
(77
|
)
|
431
|
|
(493
|
)
|
|||||
|
Current foreign withholding tax
|
(1,130
|
)
|
(1,107
|
)
|
(1,040
|
)
|
|||||
|
Deferred TRS income tax
|
273
|
|
—
|
|
—
|
|
|||||
|
Deferred foreign withholding tax
|
39
|
|
(43
|
)
|
(320
|
)
|
|||||
|
Deferred income tax benefit (expense)
|
792
|
|
1,136
|
|
(1,796
|
)
|
|||||
|
Income tax expense
|
$
|
(553
|
)
|
$
|
(482
|
)
|
$
|
(4,228
|
)
|
||
The Company's effective tax rate for both the years ended
December 31, 2016 and 2015
was
0.2%
. The differences between the income tax expense calculated at the statutory U.S. federal income tax rates of
35%
and the actual income tax expense recorded for continuing operations is mostly attributable to the dividends paid deduction available for REITs.
Furthermore, the Company qualified as a REIT and distributed the necessary amount of taxable income such that
no
current U.S. federal income taxes were due for the years ended
December 31, 2016, 2015 and 2014
. Accordingly,
no
provision for current U.S. federal income taxes was recorded for any of those years. If the Company fails to qualify as a REIT in any taxable year, without the benefit of certain provisions, it will be subject to federal and state income taxes at regular corporate rates (including any applicable alternative minimum tax) and may not be able to qualify as a REIT for four subsequent taxable years. Even if the Company qualifies for taxation as a REIT, the Company is subject to certain state and local taxes on its income and property, and federal income and excise taxes on its undistributed taxable income. Tax years 2013 through 2016 remain generally open to examination for U.S. federal income tax and state tax purposes and from 2012 through 2016 for Canadian income tax purposes.
The Company’s policy is to recognize interest and penalties as general and administrative expense. The Company did not recognize any interest and penalties in 2016. In 2015, approximately
$65 thousand
in interest and penalties related
80
EPR PROPERTIES
Notes to Consolidated Financial Statements
December 31, 2016, 2015 and 2014
to a state audit were recognized. In 2014, the Company did not recognize any expense related to interest and penalties. The Company did not have any accrued interest and penalties at December 31, 2016 or December 31, 2015. Additionally, the Company did not have any unrecorded tax benefits as of December 31, 2016 and December 31, 2015
.
Concentrations of Risk
On December 21, 2016, American Multi-Cinema, Inc. (AMC) announced that it closed its acquisition of Carmike Cinemas Inc. (Carmike). Including the effects of this acquisition, AMC was the lessee of a substantial portion (
36%
) of the megaplex theatre rental properties held by the Company at
December 31, 2016
. For the year ended December 31, 2016, approximately
$90.0 million
or
18.2%
of the Company's total revenues were derived from rental payments by AMC and approximately
$21.7 million
or
4.4%
of the Company's total revenues were derived from rental payments by Carmike. For the years ended December 31, 2015 and 2014, approximately
$86.1 million
or
20%
and
$87.4 million
or
23%
, respectively, of the Company's total revenues were derived from rental payments by AMC. These rental payments are from AMC under the leases, or from its parent, AMC Entertainment, Inc. (AMCE), as the guarantor of AMC’s obligations under the leases. AMCE is wholly owned by AMC Entertainment Holdings, Inc. (AMCEH). AMCEH is a publicly held company (NYSE: AMC) and its consolidated financial information is publicly available as www.sec.gov.
Cash Equivalents
Cash equivalents include bank demand deposits and shares of highly liquid institutional money market mutual funds for which cost approximates market value.
Restricted Cash
Restricted cash represents cash held for a borrower’s debt service reserve for mortgage notes receivable, deposits required in connection with debt service, and payment of real estate taxes and capital improvements.
Share-Based Compensation
Share-based compensation to employees of the Company is granted pursuant to the Company's Annual Incentive Program and Long-Term Incentive Plan. Share-based compensation to non-employee Trustees of the Company is granted pursuant to the Company's Trustee compensation program. Prior to May 12, 2016, share-based compensation granted to employees and non-employee Trustees were issued under the 2007 Equity Incentive Plan. The 2016 Equity Incentive Plan was approved by shareholders at the May 11, 2016 annual shareholder meeting and this plan replaces the 2007 Equity Incentive Plan. Accordingly, all share-based compensation granted on or after May 12, 2016 has been issued under the 2016 Equity Incentive Plan.
Share based compensation expense consists of share option expense and amortization of nonvested share grants issued to employees, and amortization of share units issued to non-employee Trustees for payment of their annual retainers. Share based compensation is included in general and administrative expense in the accompanying consolidated statements of income, and totaled
$11.2 million
,
$8.5 million
and
$8.9 million
for the years ended
December 31, 2016, 2015 and 2014
, respectively. Share-based compensation included in retirement severance expense in the accompanying consolidated statements of income totaled
$6.4 million
for the year ended December 31, 2015 and related to the retirement of the Company's former President and Chief Executive Officer.
Share Options
Share options are granted to employees pursuant to the Long-Term Incentive Plan. The fair value of share options granted is estimated at the date of grant using the Black-Scholes option pricing model. Share options granted to employees vest over a period of
four
years and share option expense for these options is recognized on a straight-line basis over the vesting period. Expense recognized related to share options and included in general and administrative expense in the accompanying consolidated statements of income was
$0.9 million
,
$1.1 million
and
$1.4 million
for the years ended
December 31, 2016, 2015 and 2014
, respectively. Expense recognized related to share options and included in retirement severance expense in the accompanying consolidated statements of income was
$1.4 million
for the year ended December 31, 2015 and related to the retirement of the Company's former President and Chief Executive Officer.
81
EPR PROPERTIES
Notes to Consolidated Financial Statements
December 31, 2016, 2015 and 2014
Nonvested Shares Issued to Employees
The Company grants nonvested shares to employees pursuant to both the Annual Incentive Program and the Long-Term Incentive Plan. The Company amortizes the expense related to the nonvested shares awarded to employees under the Long-Term Incentive Plan and the premium awarded under the nonvested share alternative of the Annual Incentive Program on a straight-line basis over the future vesting period (
three
to
four
years). Expense recognized related to nonvested shares and included in general and administrative expense in the accompanying consolidated statements of income was
$9.2 million
,
$6.3 million
and
$6.5 million
for the years ended
December 31, 2016, 2015 and 2014
, respectively. Expense related to nonvested shares and included in retirement severance expense in the accompanying consolidated statements of income was
$5.0 million
for the year ended December 31, 2015 and related to the retirement of the Company's former President and Chief Executive Officer.
Restricted Share Units Issued to Non-Employee Trustees
The Company issues restricted share units to non-employee Trustees for payment of their annual retainers under the Company's Trustee compensation program. The fair value of the share units granted was based on the share price at the date of grant. The share units vest upon the earlier of the day preceding the next annual meeting of shareholders or a change of control. The settlement date for the shares is selected by the non-employee Trustee, and ranges from one year from the grant date to upon termination of service. This expense is amortized by the Company on a straight-line basis over the year of service by the non-employee Trustees. Total expense recognized related to shares issued to non-employee Trustees was
$1.1 million
,
$1.0 million
and
$1.1 million
for the years ended
December 31, 2016, 2015 and 2014
, respectively.
Foreign Currency Translation
The Company accounts for the operations of its Canadian properties in Canadian dollars. The assets and liabilities related to the Company’s Canadian properties and mortgage note are translated into U.S. dollars using the spot rates at the respective balance sheet dates; revenues and expenses are translated at average exchange rates. Resulting translation adjustments are recorded as a separate component of comprehensive income.
Derivative Instruments
The Company has acquired certain derivative instruments to reduce exposure to fluctuations in foreign currency exchange rates and variable interest rates. The Company has established policies and procedures for risk assessment and the approval, reporting and monitoring of derivative financial instrument activities. These derivatives consist of foreign currency forward contracts, cross currency swaps and interest rate swaps.
The Company records all derivatives on the balance sheet at fair value. The accounting for changes in the fair value of derivatives depends on the intended use of the derivative, whether the Company has elected to designate a derivative in a hedging relationship and apply hedge accounting and whether the hedging relationship has satisfied the criteria necessary to apply hedge accounting. Derivatives designated and qualifying as a hedge of the exposure to changes in the fair value of an asset, liability, or firm commitment attributable to a particular risk, such as interest rate risk, are considered fair value hedges. Derivatives designated and qualifying as a hedge of the exposure to variability in expected future cash flows, or other types of forecasted transactions, are considered cash flow hedges. Derivatives may also be designated as hedges of the foreign currency exposure of a net investment in a foreign operation. Hedge accounting generally provides for the matching of the timing of gain or loss recognition on the hedging instrument with the recognition of the changes in the fair value of the hedged asset or liability that are attributable to the hedged risk in a fair value hedge or the earnings effect of the hedged forecasted transactions in a cash flow hedge. The Company may enter into derivative contracts that are intended to economically hedge certain of its risk, even though hedge accounting does not apply or the Company elects not to apply hedge accounting.
The Company's policy is to measure the credit risk of its derivative financial instruments that are subject to master netting agreements on a net basis by counterparty portfolio.
Impact of Recently Issued Accounting Standards
In May 2014, the FASB issued ASU No. 2014-09,
Revenue from Contracts with Customers
, which requires an entity to recognize the amount of revenue to which it expects to be entitled for the transfer of promised goods or services to customers. The ASU will replace most existing revenue recognition guidance in U.S. GAAP when it becomes effective.
82
EPR PROPERTIES
Notes to Consolidated Financial Statements
December 31, 2016, 2015 and 2014
In April 2015, the FASB voted for a one-year deferral of the effective date of the new revenue recognition standard which was approved in July 2015. The new standard will become effective for the Company beginning with the first quarter 2018. The ASU does not apply to revenue recognition for lease contracts. A majority of the Company’s tenant-related revenue is recognized pursuant to lease contracts. This standard will apply to reimbursed tenant costs and revenues generated from the Company providing certain services at its multi-tenant properties after ASU 2016-02,
Leases
, is adopted. Additionally, it may apply to certain other transactions such as the sale of real estate. The standard permits the use of either the full retrospective method or the modified retrospective method. The Company anticipates it will use the modified retrospective method for transition, in which case the cumulative effect of applying the standard, if any, would be recognized at the date of initial application. The Company is beginning the process for implementing this guidance, including performing a preliminary review of all revenue streams to identify any differences in the timing, measurement or presentation of revenue recognition. The Company is continuing to evaluate the effect that ASU 2014-09 will have on its consolidated financial statements and related disclosures.
In February 2016, the FASB issued ASU No. 2016-02,
Leases,
which amends existing accounting standards for lease accounting and is intended to improve financial reporting related to lease transactions. The ASU will require lessees to recognize on the balance sheet the assets and liabilities for the rights and obligations created by those leases. Lessor accounting will remain largely unchanged from current U.S. GAAP. However, ASU 2016-02 is expected to impact the Company’s consolidated financial statements as the Company has certain operating land lease and other arrangements for which it is the lessee. The ASU will become effective for the Company for interim and annual reporting periods in fiscal years beginning after December 15, 2018. The Company expects to adopt the new standard on its effective date. A modified retrospective transition approach is required for leases existing at, or entered into after, the beginning of the earliest comparative period presented in the financial statements, with certain practical expedients available. The Company is currently evaluating the impact that ASU 2016-02 will have on its consolidated financial statements and related disclosures. The Company does not expect a significant change in its leasing activity between now and adoption. The Company believes substantially all of its leases will continue to be classified as operating leases under the new standard. Subsequent to the adoption of the new standard, common area maintenance provided in lease contracts will be accounted for as a non-lease component within the scope of the new revenue standard. As a result, the Company will be required to recognize revenues associated with leases separately from revenues associated with common area maintenance. The Company is continuing to evaluate whether the variable payment provisions in the new lease standard or the allocation and recognition provisions of the new revenue standard will affect the timing of recognition of lease and non-lease revenue.
In March 2016, the FASB issued ASU No. 2016-09,
Improvements to Employee Share-Based Payment Accounting,
which amends ASC Topic 718,
Compensation - Stock Compensation.
The objective of this amendment is part of the FASB's Simplification Initiative as it applies to several aspects of the accounting for share-based payment transactions, including income tax consequences, classification of awards as either equity or liabilities, and classification of cash flows. The effective date of the amendment is for fiscal years beginning after December 15, 2016. The Company does not expect that the adoption of this ASU will have a material impact on its consolidated financial statements due to the nontaxable status of the Company as a REIT.
In June 2016, the FASB issued ASU No. 2016-13,
Measurement of Credit Losses on Financial Instruments,
which amends ASC Topic 326,
Financial Instruments - Credit Losses.
The standard changes the methodology for measuring credit losses on financial instruments and timing of when such losses are recorded. ASU 2016-13 is effective for fiscal years, and interim periods within those years, beginning after December 15, 2019. The Company is currently evaluating the impact that the standard will have on its consolidated financial statements and related disclosures.
In August 2016, the FASB issued ASU No. 2016-15,
Classification of Certain Cash Receipts and Cash Payments,
which amends ASC Topic 230,
Statement of Cash Flows.
The standard clarifies the treatment of several cash flow issues with the objective of reducing diversity in practice. ASU 2016-15 is effective for fiscal years beginning after December 15, 2017. The Company is currently reviewing the ASU to assess the potential impact on its consolidated financial statements and related disclosures but does not anticipate that this ASU will have a material impact.
83
EPR PROPERTIES
Notes to Consolidated Financial Statements
December 31, 2016, 2015 and 2014
In November 2016, the FASB issued ASU No. 2016-18,
Statement of Cash Flows
, which amends ASC Topic 230,
Statement of Cash Flows.
The standard requires that the statement of cash flows explain the change during the period in the total of cash, cash equivalents, and amounts generally described as restricted cash or restricted cash equivalents. Entities will also be required to reconcile such total to amounts on the balance sheet and disclose the nature of the restrictions. ASU 2016-18 is effective for fiscal years beginning after December 15, 2017. The Company is currently reviewing the ASU to assess the potential impact on its consolidated financial statements and related disclosures but does not anticipate that this ASU will have a material impact.
3. Rental Properties
The following table summarizes the carrying amounts of rental properties as of
December 31, 2016 and 2015
(in thousands):
|
2016
|
2015
|
||||||
|
Buildings and improvements
|
$
|
3,272,865
|
|
$
|
2,837,611
|
|
|
|
Furniture, fixtures & equipment
|
40,684
|
|
34,423
|
|
|||
|
Land
|
917,748
|
|
687,468
|
|
|||
|
4,231,297
|
|
3,559,502
|
|
||||
|
Accumulated depreciation
|
(635,535
|
)
|
(534,303
|
)
|
|||
|
Total
|
$
|
3,595,762
|
|
$
|
3,025,199
|
|
|
Depreciation expense on rental properties was
$103.9 million
,
$85.9 million
and
$63.0 million
for the years ended
December 31, 2016, 2015 and 2014
, respectively.
On August 1, 2015, per the terms of the mortgage note agreement, the borrower for Camelback Mountain Resort exercised its option to convert the mortgage note agreement to a lease agreement. As a result, the Company recorded the carrying value of its investment into rental property, which approximated the fair value of the property on the conversion date. There was
no
gain or loss recognized on this transaction. The property is leased pursuant to a triple net lease with a
20
-year term.
During the year ended
December 31, 2015
, the Company completed the sale of a theatre located in Los Angeles, California for net proceeds of
$42.7 million
and recognized a gain on sale of
$23.7 million
. In addition, during the year ended December 31, 2015, the Company sold
three
land parcels for net proceeds of
$4.0 million
and recognized a net gain of
$0.1 million
. The results of operations of these properties have not been classified within discontinued operations.
On June 27, 2016, the Company completed the acquisition of
six
theatre properties from Carmike for a net purchase price of
$94.1 million
. The theatres are located in
five
states.
Five
of the theatre properties are leased on a triple net basis under a master lease agreement to Carmike with the tenant responsible for all taxes, costs and expenses arising from the use or operation of the properties. The remaining initial lease term is approximately
15
years. The theatre located in Pennslyvania is leased under a separate triple net lease with the remaining initial lease term of approximately
five
years.
During the year ended
December 31, 2016
, pursuant to tenant purchase options, the Company completed the sale of
two
public charter schools located in Colorado for net proceeds totaling
$16.6 million
and recognized gains on sale totaling
$2.8 million
. In addition, during the year ended
December 31, 2016
, the Company completed the sale of
three
retail parcels located in Texas for total net proceeds of
$5.3 million
and recognized gains on sale totaling
$2.5 million
. The Company also completed the sale of a land parcel at Adelaar for net proceeds of
$1.5 million
and
no
gain or loss was recognized. The results of operations of these properties have not been classified within discontinued operations.
During the year ended December 31, 2016, the Company recognized a gain on insurance recovery of
$4.5 million
. This gain is included in other income in the accompanying consolidated statements of income. The gain on insurance recovery related to insurance proceeds received for damage from a fire at one of the Company's ski areas located in Ohio.
84
EPR PROPERTIES
Notes to Consolidated Financial Statements
December 31, 2016, 2015 and 2014
4. Accounts Receivable, Net
The following table summarizes the carrying amounts of accounts receivable, net as of
December 31, 2016 and 2015
(in thousands):
|
2016
|
2015
|
||||||
|
Receivable from tenants
|
$
|
7,564
|
|
$
|
9,999
|
|
|
|
Receivable from non-tenants
|
497
|
|
353
|
|
|||
|
Receivable from insurance proceeds
|
1,967
|
|
—
|
|
|||
|
Receivable from Sullivan County Infrastructure Revenue Bonds
|
22,164
|
|
—
|
|
|||
|
Straight-line rent receivable
|
67,618
|
|
52,336
|
|
|||
|
Allowance for doubtful accounts
|
(871
|
)
|
(3,587
|
)
|
|||
|
Total
|
$
|
98,939
|
|
$
|
59,101
|
|
|
85
EPR PROPERTIES
Notes to Consolidated Financial Statements
December 31, 2016, 2015 and 2014
5. Investment in Mortgage Notes
Investment in mortgage notes, including related accrued interest receivable, at
December 31, 2016 and 2015
consists of the following (in thousands):
|
2016
|
2015
|
|||||||
|
(1)
|
Mortgage note and related accrued interest receivable, 9.50%, paid in full January 5, 2016
|
—
|
|
19,944
|
|
|||
|
(2)
|
Mortgage note and related accrued interest receivable, 9.75%, paid in full April 22, 2016
|
—
|
|
22,188
|
|
|||
|
(3)
|
Mortgage note, 5.50%, paid in full October 11, 2016
|
—
|
|
2,500
|
|
|||
|
(4)
|
Mortgage note and related accrued interest receivable, 9.00%, due March 11, 2017
|
1,454
|
|
1,454
|
|
|||
|
(5)
|
Mortgage note and related accrued interest receivable, 9.00%, due July 31, 2017
|
1,375
|
|
1,257
|
|
|||
|
(6)
|
Mortgage note and related accrued interest receivable, 7.00%, due October 19, 2018
|
1,637
|
|
—
|
|
|||
|
(7)
|
Mortgage notes, 7.00% and 10.00%, due May 1, 2019
|
164,743
|
|
164,543
|
|
|||
|
(8)
|
Mortgage note, 7.00%, due December 20, 2021
|
70,304
|
|
—
|
|
|||
|
(9)
|
Mortgage note and related accrued interest receivable, 7.85%, due December 28, 2026
|
5,635
|
|
—
|
|
|||
|
(10)
|
Mortgage note and related accrued interest receivable, 10.65%, due June 28, 2032
|
36,032
|
|
36,032
|
|
|||
|
(11)
|
Mortgage note and related accrued interest receivable, 9.00%, due December 31, 2032
|
5,327
|
|
5,469
|
|
|||
|
(12)
|
Mortgage notes and related accrued interest receivable, 9.50%, due April 30, 2033
|
30,849
|
|
30,680
|
|
|||
|
(13)
|
Mortgage note and related accrued interest receivable, 10.25%, due June 30, 2033
|
3,508
|
|
3,488
|
|
|||
|
(14)
|
Mortgage note, 11.31%, due July 1, 2033
|
12,530
|
|
12,781
|
|
|||
|
(15)
|
Mortgage note and related accrued interest receivable, 8.71%, due June 30, 2034
|
7,230
|
|
4,900
|
|
|||
|
(16)
|
Mortgage note and related accrued interest receivable, 9.50%, due August 31, 2034
|
12,473
|
|
12,392
|
|
|||
|
(17)
|
Mortgage note and related accrued interest receivable, 11.10%, due December 1, 2034
|
51,250
|
|
51,450
|
|
|||
|
(18)
|
Mortgage notes, 10.28%, due December 1, 2034
|
37,562
|
|
37,562
|
|
|||
|
(19)
|
Mortgage note, 10.72%, due December 1, 2034
|
4,550
|
|
4,550
|
|
|||
|
(20)
|
Mortgage note, 8.00%, due January 5, 2036
|
21,000
|
|
—
|
|
|||
|
(21)
|
Mortgage note, 10.25%, due May 31, 2036
|
17,505
|
|
9,147
|
|
|||
|
(22)
|
Mortgage note and related accrued interest receivable, 9.75%, due July 28, 2036
|
18,219
|
|
3,443
|
|
|||
|
(23)
|
Mortgage note and related accrued interest receivable, 9.75%, due July 31, 2036
|
6,083
|
|
—
|
|
|||
|
(24)
|
Mortgage note, 9.75%, due December 31, 2036
|
4,712
|
|
—
|
|
|||
|
(25)
|
Mortgage notes, 7.25%, due November 30, 2041
|
100,000
|
|
—
|
|
|||
|
Total mortgage notes and related accrued interest receivable
|
$
|
613,978
|
|
$
|
423,780
|
|
||
(1) The Company's first mortgage loan agreement with Basis Schools, Inc. that was secured by a public charter school and the underlying land located in Washington D.C. was paid on January 5, 2016. In connection with the full payoff of this note, the Company received a prepayment fee of
$3.6 million
, included in mortgage and other financing income.
86
EPR PROPERTIES
Notes to Consolidated Financial Statements
December 31, 2016, 2015 and 2014
(2) The Company's first mortgage loan agreement with Fiber Mills, LLC and Music Factory Condominiums, LLC that was secured by the North Carolina Music Factory located in Charlotte, North Carolina was amended and restated during the year ended December 31, 2016. In conjunction with the amendment, the Company funded an additional
$21.8 million
. On April 22, 2016, the note was paid in full. In conjunction with this payoff, the Company wrote off
$335 thousand
of prepaid mortgage fees to costs associated with loan refinancing or payoff.
(3) The Company's mortgage loan agreement with Alko Ranch, LLC that was secured by approximately
159
acres of land and a winery facility was paid in full on October 11, 2016.
(4) The Company's first mortgage loan agreement with LBE Investments, Ltd. is secured by approximately
12
acres of land located in Queen Creek, Arizona. The note requires accrued interest and principal to be paid at maturity.
(5) The Company's first mortgage loan agreement with HighMark Land, LLC is secured by approximately
20
acres of land located in Lincoln, California. The note requires accrued interest and principal to be paid at maturity.
(6) The Company's first mortgage loan agreement with Miramesa Star LLC, is secured by a theatre development project on approximately
seven
acres of land located in Cypress, Texas. The note requires monthly interest payments and matures the earlier of the date of substantial completion or October 19, 2018.
(7) The Company’s mortgage loan agreements with SVVI, LLC (SVVI) are secured by
one
waterpark and adjacent land in Kansas City, Kansas as well as
two
other waterparks located in New Braunfels and South Padre Island, Texas. The mortgage notes have cross-default and cross-collateral provisions. Pursuant to the mortgage on the Texas properties, only a seasonal line of credit secured by the Texas parks totaling not more than
$9.0 million
at any time ranks superior to the Company’s collateral position. The note accrues monthly interest payments and SVVI is required to fund a debt service reserve for off-season interest payments (those due from September to May). The reserve is to be funded by equal monthly installments during the months of June, July and August. Monthly interest payments are transferred to the Company from this debt service reserve.
The mortgage loan agreements also contain certain participating interest and note pay-down provisions. During the years ended
December 31, 2016, 2015 and 2014
, the Company recognized
$0.8 million
,
$1.5 million
and
$1.4 million
of participating interest income, respectively. SVVI is a VIE, but it was determined that the Company was not the primary beneficiary of this VIE. The Company’s maximum exposure to loss associated with SVVI is limited to the Company’s outstanding mortgage note and related accrued interest receivable. On October 13, 2015, the Company received a partial pay-down of
$45.0 million
.
(8) The Company's first mortgage loan agreement with Imagine Schools Non-Profit, Inc. and affiliates (Imagine) is secured by
11
charter school properties located in Georgia, Indiana, Ohio, South Carolina, and Pennsylvania. This note requires monthly principal and interest payments of
$608 thousand
and additional principal pay downs if certain events occur including property sales. See Note 6 for further discussion.
(9) The Company's first mortgage loan agreement with Genesis Health Clubs of Omaha, Sports West LLC, is secured by a health club facility located in Omaha, Nebraska. This note requires monthly interest payments.
(10) The Company's first mortgage loan agreement with Montparnasse 56 USA is secured by the observation deck of the John Hancock building in Chicago, Illinois. This note requires monthly interest payments. On December 22, 2016, the Company entered into an amendment to the loan agreement with the borrower which eliminated the full prepayment option with penalty in 2017 per the original agreement and replaced it with partial prepayment options in 2017 and 2027 with penalty. The amended note bears interest at
9.25%
beginning July 1, 2017.
(11) The Company's first mortgage loan agreement with LBE Investments, Ltd. is secured by a charter school property located in Queen Creek, Arizona. The note is fully amortizing and requires monthly principal and interest payments of
$52 thousand
.
(12) The Company's first mortgage loan agreements with LBE Investments, Ltd. are secured by
three
charter school properties located in Gilbert and Queen Creek, Arizona. The notes bear interest beginning at
9.50%
with increases of
87
EPR PROPERTIES
Notes to Consolidated Financial Statements
December 31, 2016, 2015 and 2014
0.50%
every
five
years. The notes are fully amortizing and require monthly payments of principal and interest. The notes have an effective interest rate of approximately
9.50%
, which is net of a
2%
servicer fee to HighMark.
(13) The Company's first mortgage loan agreement with UME Preparatory Academy is secured by approximately
28
acres of land and a public charter school property located in Dallas, Texas. The note bears interest beginning at
10.25%
with increases of
0.50%
every
five
years and requires monthly interest payments. The note has an effective interest rate of approximately
9.90%
, which is net of a
2%
servicer fee to HighMark.
(14) The Company's first mortgage loan agreement with Topgolf USA Austin is secured by a golf entertainment complex located in Austin, Texas. The note is fully amortizing and requires monthly principal and interest payments of
$141 thousand
.
(15) The Company's first mortgage loan agreement with 169 Jenks is secured by a public charter school property located in St. Paul, Minnesota. The note bears interest beginning at
8.50%
which increases annually based on a formula of the rate multiplied by
1.025%
. At December 31, 2016, the rate was
8.71%
. The note requires monthly interest payments.
(16) The Company's first mortgage loan agreement with Beloved Community Charter School, Inc. is secured by a charter school property located in Jersey City, New Jersey. The note bears interest beginning at
9.50%
with increases of
0.50%
every five years and requires monthly interest payments. The note has an effective interest rate of approximately
9.50%
, which is net of a
2%
servicer fee to HighMark.
(17) The Company's first mortgage loan agreement with Peak Resorts, Inc. (Peak) is secured by
one
ski area located in Vermont. Mount Snow is approximately
588
acres and is located in both West Dover and Wilmington, Vermont. The note requires monthly interest payments and Peak is required to fund a debt service reserve for off-season interest payments (those due from April to December). The reserve is to be funded by equal monthly installments during the months of January, February and March. Monthly interest payments are transferred to the Company from this debt service reserve.
Annually, this interest rate increases based on a formula dependent in part on increases in the CPI.
(18) The Company's first mortgage loan agreements with Peak are secured by
four
ski areas located in Ohio and Pennsylvania with a total of approximately
510
acres. The notes require monthly interest payments and Peak is required to fund a debt service reserve for off-season interest payments (those due from April to December). The reserve is to be funded by equal monthly installments during the months of January, February and March. Monthly interest payments are transferred to the Company from this debt service reserve.
Annually, this interest rate increases based on a formula dependent in part on increases in the CPI.
(19) The Company's first mortgage loan agreement with Peak is secured by a ski area located in Chesterland, Ohio with approximately
135
acres. The note requires monthly interest payments and Peak is required to fund a debt service reserve for off-season interest payments (those due from April to December). The reserve is to be funded by equal monthly installments during the months of January, February and March. Monthly interest payments are transferred to the Company from this debt service reserve.
Annually, this interest rate increases based on a formula dependent in part on increases in the CPI.
(20) The Company's first mortgage loan agreement with Peak is secured by a ski area located in Hunter, New York with approximately
240
acres. The note requires monthly interest payments and Peak is required to fund a debt service reserve for off-season interest payments (those due from April to December). The reserve is to be funded by equal monthly installments during the months of January, February and March. Monthly interest payments are transferred to the Company from this debt service reserve.
Annually, this interest rate increases based on a formula dependent in part on increases in the CPI.
(21) The Company's first mortgage loan agreement with Topgolf USA Midvale, LLC is secured by a golf entertainment complex located in Midvale, Utah. On November 1, 2016, this note was amended and restated to change the maturity date to May 31, 2036. The note requires monthly interest payments.
88
EPR PROPERTIES
Notes to Consolidated Financial Statements
December 31, 2016, 2015 and 2014
(22) The Company's first mortgage loan agreement with Topgolf USA West Chester, LLC is secured by a golf entertainment complex located in West Chester, Ohio. The note requires monthly interest payments.
(23) The Company's first mortgage loan agreement with Friends of Millville Public Charter School is secured by a public charter school property located in Millville, New Jersey. The note requires monthly interest payments.
(24) The Company's first mortgage loan agreement with Friends of Vineland Public Charter School is secured by a public charter school property located in Vineland, New Jersey. The note requires monthly interest payments upon completion of construction.
(25) The Company's first mortgage loan agreements with Endeavor Schools are secured by
20
education facilities including both early education and private school properties located California, Florida, Georgia, Minnesota, Nevada, North Carolina, Ohio and Texas. The notes bear interest beginning at
7.25%
with increases every three years by a multiple of
1.0625
and require monthly interest payments. The notes contain prepayment provisions which allow the borrower to prepay with a premium based on a multiple of the remaining loan balance. In addition, the notes contain a loan to lease conversion option in which the borrower has the right to put the underlying real estate assets to the Company and become the tenant under a lease structure. Interest income on the notes is being recognized using the effective interest method without the fixed interest rate increases due to these prepayment and conversion options. Subsequent to December 31, 2016, the Company funded an additional
$42.9 million
for first mortgage loan agreements secured by
eight
early education and private school properties located in Minnesota and Ohio. These loan agreements have the same terms as the notes funded in 2016.
Principal payments and related accrued interest due on mortgage notes receivable subsequent to
December 31, 2016
are as follows (in thousands):
|
|
Amount
|
||
|
Year:
|
|||
|
2017
|
$
|
5,084
|
|
|
2018
|
2,546
|
|
|
|
2019
|
163,874
|
|
|
|
2020
|
1,143
|
|
|
|
2021
|
71,569
|
|
|
|
Thereafter
|
369,762
|
|
|
|
Total
|
$
|
613,978
|
|
6. Investment in a Direct Financing Lease
The Company’s investment in a direct financing lease relates to the Company’s master lease of
12
public charter school properties as of
December 31, 2016
and
21
public charter school properties as of
December 31, 2015
, with Imagine. Investment in a direct financing lease, net represents estimated unguaranteed residual values of leased assets and net unpaid rentals, less related deferred income. The following table summarizes the carrying amounts of investment in a direct financing lease, net as of
December 31, 2016 and 2015
(in thousands):
|
2016
|
2015
|
||||||
|
Total minimum lease payments receivable
|
$
|
215,753
|
|
$
|
439,646
|
|
|
|
Estimated unguaranteed residual value of leased assets
|
85,247
|
|
162,669
|
|
|||
|
Less deferred income
(1)
|
(198,302
|
)
|
(411,435
|
)
|
|||
|
Investment in a direct financing lease, net
|
$
|
102,698
|
|
$
|
190,880
|
|
|
(1)
Deferred income is net of
$1.3 million
and
$1.4 million
of initial direct costs at
December 31, 2016 and 2015
, respectively.
89
EPR PROPERTIES
Notes to Consolidated Financial Statements
December 31, 2016, 2015 and 2014
Additionally, the Company has determined that
no
allowance for losses on the investment in a direct financing lease was necessary at
December 31, 2016 and 2015
.
During 2014, the Company completed the sale of
four
public charter school properties located in Florida and previously leased to Imagine with a carrying value of
$45.9 million
. A gain of
$0.2 million
was recognized on this sale.
During 2015, the Company completed the sale of
one
public charter school property located in Pennsylvania and previously leased to Imagine with a carrying value of
$4.7 million
. There was
no
gain or loss recognized on this sale. Additionally, during 2015, the Company terminated a portion of its master lease with Imagine related to
one
public charter school property located in Ohio. The property was subsequently leased to another operator pursuant to a long-term triple net lease agreement that is classified as an operating lease. There was
no
gain or loss recognized on this lease termination.
During 2016, the Company completed the sale of
nine
public charter school properties previously leased to Imagine as part of a master lease.
Seven
of these schools were sold to Imagine and
two
were sold to third parties. These properties are located in Georgia, Indiana, Ohio, Missouri and South Carolina and had a total net carrying value of
$91.3 million
when sold. The Company received net cash proceeds totaling
$21.0 million
(a portion of which was funded through the liquidation of the letter of credit and escrow reserve previously provided by Imagine pursuant to the master lease) and a mortgage note receivable from Imagine for
$70.3 million
. The note is secured by
11
public charter schools as of December 31, 2016. See Note 5 for more detail on this mortgage note receivable. There were
no
gains or losses recognized on these sales. As of December 31, 2016,
12
schools operated by Imagine remain subject to the master lease.
The Company’s direct financing lease has expiration dates ranging from approximately
15
to
18
years. Future minimum rentals receivable on this direct financing lease at
December 31, 2016
are as follows (in thousands):
|
|
Amount
|
||
|
Year:
|
|||
|
2017
|
$
|
10,856
|
|
|
2018
|
11,182
|
|
|
|
2019
|
11,518
|
|
|
|
2020
|
11,863
|
|
|
|
2021
|
12,219
|
|
|
|
Thereafter
|
158,115
|
|
|
|
Total
|
$
|
215,753
|
|
90
EPR PROPERTIES
Notes to Consolidated Financial Statements
December 31, 2016, 2015 and 2014
7. Debt
Debt at
December 31, 2016 and 2015
consists of the following (in thousands):
|
2016
|
2015
|
|||||||
|
(1)
|
Mortgage note payable, 7.37%, paid in full on February 18, 2016
|
$
|
—
|
|
$
|
4,813
|
|
|
|
(2)
|
Note payable, 2.50%, paid in full on April 21, 2016
|
—
|
|
1,850
|
|
|||
|
(3)
|
Mortgage notes payable, 6.37%, paid in full on May 2, 2016
|
—
|
|
24,754
|
|
|||
|
(4)
|
Mortgage notes payable, 6.02%, paid in full on August 8, 2016
|
—
|
|
16,738
|
|
|||
|
(5)
|
Mortgage notes payable, 6.10%, paid in full on September 1, 2016
|
—
|
|
22,235
|
|
|||
|
(6)
|
Mortgage note payable, 6.06%, due March 1, 2017
|
8,615
|
|
9,381
|
|
|||
|
(7)
|
Mortgage note payable, 6.07%, due April 6, 2017
|
9,331
|
|
9,667
|
|
|||
|
(8)
|
Mortgage notes payable, 5.73%-5.95%, due May 1, 2017
|
30,486
|
|
31,603
|
|
|||
|
(9)
|
Mortgage notes payable, 4.00%, due July 6, 2017
|
88,629
|
|
93,616
|
|
|||
|
(10)
|
Mortgage note payable, 5.29%, due July 8, 2017
|
3,298
|
|
3,455
|
|
|||
|
(11)
|
Mortgage notes payable, 5.86% due August 1, 2017
|
22,139
|
|
22,931
|
|
|||
|
(12)
|
Mortgage note payable, 6.19%, due February 1, 2018
|
12,452
|
|
13,171
|
|
|||
|
(13)
|
Unsecured revolving variable rate credit facility, LIBOR + 1.25%, due April 24, 2019
|
—
|
|
196,000
|
|
|||
|
(14)
|
Unsecured term loan payable, LIBOR + 1.40%, $300,000 fixed through interest rate swaps at a blended rate of 3.09% through April 5, 2019, due April 24, 2020
|
350,000
|
|
350,000
|
|
|||
|
(15)
|
Senior unsecured notes payable, 7.75%, due July 15, 2020
|
250,000
|
|
250,000
|
|
|||
|
(16)
|
Senior unsecured notes payable, 5.75%, due August 15, 2022
|
350,000
|
|
350,000
|
|
|||
|
(17)
|
Senior unsecured notes payable, 5.25%, due July 15, 2023
|
275,000
|
|
275,000
|
|
|||
|
(18)
|
Senior unsecured notes payable, 4.35%, due August 22, 2024
|
148,000
|
|
—
|
|
|||
|
(19)
|
Senior unsecured notes payable, 4.50%, due April 1, 2025
|
300,000
|
|
300,000
|
|
|||
|
(20)
|
Senior unsecured notes payable, 4.56%, due August 22, 2026
|
192,000
|
|
—
|
|
|||
|
(21)
|
Senior unsecured notes payable, 4.75%, due December 15, 2026
|
450,000
|
|
—
|
|
|||
|
(22)
|
Bonds payable, variable rate, due October 1, 2037
|
24,995
|
|
24,995
|
|
|||
|
Less: deferred financing costs, net
|
(29,320
|
)
|
(18,289
|
)
|
||||
|
Total
|
$
|
2,485,625
|
|
$
|
1,981,920
|
|
||
(1) The Company’s mortgage note payable was prepaid in full on February 18, 2016 prior to its maturity date of July 15, 2018. The note was secured by
one
theatre property. In connection with this note payoff, the Company paid
$472 thousand
in additional costs included in costs associated with loan refinancing or payoff.
(2) The Company’s note payable was paid in full on April 21, 2016.
(3) The Company’s mortgage notes payable were paid in full on May 2, 2016 prior to their maturity date of June 1, 2016. This notes were secured by
two
theatre properties.
(4) The Company’s mortgage notes payable were paid in full on August 8, 2016 prior to their maturity date of October 6, 2016. The notes were secured by
three
theatre properties.
(5) The Company’s mortgage notes payable were paid in full on September 1, 2016 prior to their maturity date of October 1, 2016. The notes were secured by
four
theatre properties.
91
EPR PROPERTIES
Notes to Consolidated Financial Statements
December 31, 2016, 2015 and 2014
(6) The Company’s mortgage note payable is secured by
one
theatre property, which had a net book value of approximately
$8.2 million
at
December 31, 2016
. The note had an initial balance of
$11.6 million
and the monthly payments are based on a
25
-year amortization schedule. The note requires monthly principal and interest payments of approximately
$75 thousand
with a final principal payment at maturity of approximately
$8.6 million
. On February 1, 2017, this loan was prepaid in full.
(7) The Company’s mortgage note payable is secured by
one
theatre property, which had a net book value of approximately
$8.0 million
at
December 31, 2016
. The note had an initial balance of
$11.9 million
and the monthly payments are based on a
30
-year amortization schedule. The note requires monthly principal and interest payments of approximately
$77 thousand
with a final principal payment at maturity of approximately
$9.2 million
. On January 6, 2017, this loan was prepaid in full.
(8) The Company’s mortgage notes payable are secured by
four
theatre properties, which had a net book value of approximately
$32.4 million
at
December 31, 2016
. The notes had initial balances totaling
$38.9 million
and the monthly payments are based on a
25
-year amortization schedule. The notes require monthly principal and interest payments totaling approximately
$247 thousand
with a final principal payment at maturity totaling approximately
$30.0 million
. The weighted average interest rate on these notes is
5.85%
.
(9) On April 21, 2014, the Company assumed a mortgage note payable of
$90.3 million
in conjunction with the acquisition of
11
theatre properties. The mortgage note was recorded at fair value upon acquisition which was estimated to be
$99.6 million
. The fair value of this mortgage note was determined by discounting the future cash flows of the mortgage note using an estimated acquisition date market rate of
4.00%
. The mortgage note is secured by
11
theatre properties, which had a net book value of approximately
$118.2 million
at
December 31, 2016
. The monthly payments are based on a
10
-year amortization schedule and the mortgage note requires monthly principal and interest payments of approximately
$635 thousand
with a final principal payment at maturity of approximately
$85.1 million
.
(10) On March 3, 2011, the Company assumed a mortgage note payable of
$3.8 million
in conjunction with the acquisition of a theatre property. The note was recorded at fair value upon acquisition which was estimated to be
$4.1 million
. The fair value of the note was determined by discounting the future cash flows of the note using an estimated acquisition date market rate of
5.29%
. The note is secured by
one
theatre property, which had a net book value of approximately
$8.0 million
at
December 31, 2016
. The monthly payments are based on a
25
-year amortization schedule and the note requires monthly principal and interest payments of approximately
$28 thousand
with a final principal payment at maturity of approximately
$3.2 million
.
(11) The Company’s mortgage notes payable due
August 1, 2017
are secured by
two
theatre properties, which had a net book value of approximately
$24.8 million
at
December 31, 2016
. The notes had initial balances totaling
$28.0 million
and the monthly payments are based on a
25
-year amortization schedule. The notes require monthly principal and interest payments totaling approximately
$178 thousand
with a final principal payment at maturity totaling approximately
$21.7 million
.
(12) The Company’s mortgage note payable due
February 1, 2018
is secured by
one
theatre property which had a net book value of approximately
$18.9 million
at
December 31, 2016
. The mortgage loan had an initial balance of
$17.5 million
and the monthly payments are based on a
20
-year amortization schedule. The note requires monthly principal and interest payments of approximately
$127 thousand
with a final principal payment at maturity of approximately
$11.6 million
.
(13) The Company's unsecured revolving credit facility (the facility) bears interest at LIBOR plus
1.25%
, which was
2.02%
on
December 31, 2016
. Interest is payable monthly. On April 24, 2015, the Company amended, restated and combined its unsecured revolving credit and term loan facilities. The amendments to the unsecured revolving portion of the new credit facility, among other things, (i) increased the initial amount from
$535.0 million
to
$650.0 million
, (ii) extended the maturity date from July 23, 2017, to April 24, 2019 (with the Company having the same right as before to extend the loan for one additional year, subject to certain terms and conditions) and (iii) lowered the interest rate and facility fee pricing based on a grid related to the Company's senior unsecured credit ratings which at closing was LIBOR plus
1.25%
and
0.25%
, respectively. In connection with the amendment,
$243 thousand
of deferred financing
92
EPR PROPERTIES
Notes to Consolidated Financial Statements
December 31, 2016, 2015 and 2014
costs (net of accumulated amortization) were written off during the year ended December 31, 2015. As of
December 31, 2016
, the Company had
no
outstanding balance under the facility and total availability under the revolving credit facility was
$650.0 million
. In addition, there is a
$1.0 billion
accordion feature on the combined unsecured revolving credit and term loan facility that increases the maximum borrowing amount available under the combined facility, subject to lender approval, from
$1.0 billion
to
$2.0 billion
. The facility contains financial covenants or restrictions that limit the Company's levels of consolidated debt, secured debt, investment levels outside certain categories and dividend distributions, and require the Company to maintain a minimum consolidated tangible net worth and meet certain coverage levels for fixed charges and debt service.
(14) The Company's unsecured term loan payable bears interest at LIBOR plus
1.40%
, which was
2.17%
on
December 31, 2016
. Interest is payable monthly. On April 24, 2015, the Company amended, restated and combined its unsecured revolving credit and term loan facilities. The amendments to the unsecured term loan portion of the new facility, among other things, (i) increased the initial amount from
$285.0 million
to
$350.0 million
, (ii) extended the maturity date from July 23, 2018 to April 24, 2020 and (iii) lowered the interest rate at all senior unsecured credit rating tiers which was LIBOR plus
1.40%
at closing. In addition, there is a
$1.0 billion
accordion feature on the combined unsecured revolving credit and term loan facility that increases the maximum borrowing amount available under the combined facility, subject to lender approval, from
$1.0 billion
to
$2.0 billion
.
(15) On June 30, 2010, the Company issued
$250.0 million
in senior unsecured notes due on
July 15, 2020
. The notes bear interest at
7.75%
. Interest is payable on July 15 and January 15 of each year beginning on January 15, 2011 until the stated maturity date of
July 15, 2020
. The notes were issued at
98.29%
of their principal amount and are guaranteed by certain of the Company’s subsidiaries. The notes contain various covenants, including: (i) a limitation on incurrence of any debt that would cause the ratio of the Company’s debt to adjusted total assets to exceed
60%
; (ii) a limitation on incurrence of any secured debt which would cause the ratio of the Company’s secured debt to adjusted total assets to exceed
40%
; (iii) a limitation on incurrence of any debt which would cause the Company’s debt service coverage ratio to be less than
1.5
times; and (iv) the maintenance at all times of total unencumbered assets not less than
150%
of the Company’s outstanding unsecured debt.
(16) On August 8, 2012, the Company issued
$350.0 million
in senior unsecured notes due on
August 15, 2022
. The notes bear interest at
5.75%
. Interest is payable on February 15 and August 15 of each year beginning on February 15, 2013 until the stated maturity date of
August 15, 2022
. The notes were issued at
99.998%
of their principal amount and are guaranteed by certain of the Company’s subsidiaries. The notes contain various covenants, including: (i) a limitation on incurrence of any debt that would cause the ratio of the Company’s debt to adjusted total assets to exceed
60%
; (ii) a limitation on incurrence of any secured debt which would cause the ratio of the Company’s secured debt to adjusted total assets to exceed
40%
; (iii) a limitation on incurrence of any debt which would cause the Company’s debt service coverage ratio to be less than
1.5
times; and (iv) the maintenance at all times of total unencumbered assets not less than
150%
of the Company’s outstanding unsecured debt.
(17) On June 18, 2013, the Company issued
$275.0 million
in senior unsecured notes due on
July 15, 2023
. The notes bear interest at
5.25%
. Interest is payable on January 15 and July 15 of each year beginning on January 15, 2014 until the stated maturity date of July 15, 2023. The notes were issued at
99.546%
of their principal amount and are guaranteed by certain of the Company’s subsidiaries. The notes contain various covenants, including: (i) a limitation on incurrence of any debt that would cause the ratio of the Company’s debt to adjusted total assets to exceed
60%
; (ii) a limitation on incurrence of any secured debt which would cause the ratio of the Company’s secured debt to adjusted total assets to exceed
40%
; (iii) a limitation on incurrence of any debt which would cause the Company’s debt service coverage ratio to be less than
1.5
times and (iv) the maintenance at all times of the Company's total unencumbered assets such that they are not less than
150%
of the Company’s outstanding unsecured debt.
(18) On August 22, 2016, the Company issued
$148.0 million
of senior unsecured notes in a private placement transaction. The notes bear interest at an annual rate of
4.35%
and are due August 22, 2024. The notes are guaranteed by the Company's subsidiaries that guarantee the Company's unsecured credit facilities and existing senior unsecured notes. The notes contain covenants similar to those found in the Company's unsecured revolving credit facility.
93
EPR PROPERTIES
Notes to Consolidated Financial Statements
December 31, 2016, 2015 and 2014
(19) On March 16, 2015, the Company issued
$300.0 million
in aggregate principal amount of senior notes due on April 1, 2025 pursuant to an underwritten public offering. The notes bear interest at an annual rate of
4.50%
. Interest is payable on April 1 and October 1 of each year beginning on October 1, 2015 until the stated maturity date of April 1, 2025. The notes were issued at
99.638%
of their face value and are unsecured and guaranteed by certain of the Company’s subsidiaries. The notes contain various covenants, including: (i) a limitation on incurrence of any debt which would cause the ratio of the Company’s debt to adjusted total assets to exceed
60%
; (ii) a limitation on incurrence of any secured debt which would cause the ratio of the Company’s secured debt to adjusted total assets to exceed
40%
; (iii) a limitation on incurrence of any debt which would cause the Company’s debt service coverage ratio to be less than
1.5
times and (iv) the maintenance at all times of the Company's total unencumbered assets such that they are not less than
150%
of the Company’s outstanding unsecured debt.
(20) On August 22, 2016, the Company issued
$192.0 million
of senior unsecured notes in a private placement transaction. The notes bear interest at an annual rate of
4.56%
and are due August 22, 2026. The notes are guaranteed by the Company's subsidiaries that guarantee the Company's unsecured credit facilities and existing senior unsecured notes. The notes contain covenants similar to those found in the Company's unsecured revolving credit facility.
(21) On December 14, 2016, the Company issued
$450.0 million
in aggregate principal amount of senior notes due on December 14, 2026 pursuant to an underwritten public offering. The notes bear interest at an annual rate of
4.75%
. Interest is payable on June 15 and December 15 of each year beginning on June 15, 2017, until the stated maturity date of December 15, 2026. The notes were issued at
98.429%
of their face value and are unsecured and guaranteed by certain of the Company’s subsidiaries. The notes contain various covenants, including: (i) a limitation on incurrence of any debt which would cause the ratio of the Company’s debt to adjusted total assets to exceed
60%
; (ii) a limitation on incurrence of any secured debt which would cause the ratio of the Company’s secured debt to adjusted total assets to exceed
40%
; (iii) a limitation on incurrence of any debt which would cause the Company’s debt service coverage ratio to be less than
1.5
times and (iv) the maintenance at all times of the Company's total unencumbered assets such that they are not less than
150%
of the Company’s outstanding unsecured debt.
(22) The Company’s bonds payable due
October 1, 2037
are secured by
three
theatres, which had a net book value of approximately
$21.8 million
at
December 31, 2016
, and bear interest at a variable rate which resets on a weekly basis and was
0.76%
at
December 31, 2016
. The bonds requires monthly interest only payments with principal due at maturity.
Certain of the Company’s debt agreements contain customary restrictive covenants related to financial and operating performance as well as certain cross-default provisions. The Company was in compliance with all financial covenants at
December 31, 2016
.
Principal payments due on long-term debt obligations subsequent to
December 31, 2016
(without consideration of any extensions) are as follows (in thousands):
|
|
Amount
|
||
|
Year:
|
|
||
|
2017
|
$
|
163,266
|
|
|
2018
|
11,684
|
|
|
|
2019
|
—
|
|
|
|
2020
|
600,000
|
|
|
|
2021
|
—
|
|
|
|
Thereafter
|
1,739,995
|
|
|
|
Less: deferred financing costs, net
|
(29,320
|
)
|
|
|
Total
|
$
|
2,485,625
|
|
94
EPR PROPERTIES
Notes to Consolidated Financial Statements
December 31, 2016, 2015 and 2014
The Company capitalizes a portion of interest costs as a component of property under development. The following is a summary of interest expense, net for the years ended
December 31, 2016, 2015 and 2014
(in thousands):
|
2016
|
2015
|
2014
|
|||||||||
|
Interest on loans
|
$
|
101,181
|
|
$
|
92,140
|
|
$
|
82,839
|
|
||
|
Amortization of deferred financing costs
|
4,787
|
|
4,588
|
|
4,248
|
|
|||||
|
Credit facility and letter of credit fees
|
1,873
|
|
1,759
|
|
1,735
|
|
|||||
|
Interest cost capitalized
|
(10,697
|
)
|
(18,547
|
)
|
(7,525
|
)
|
|||||
|
Interest income
|
—
|
|
(25
|
)
|
(27
|
)
|
|||||
|
Interest expense, net
|
$
|
97,144
|
|
$
|
79,915
|
|
$
|
81,270
|
|
||
8. Variable Interest Entities
The Company’s variable interest in VIEs currently are in the form of equity ownership and loans provided by the Company to a VIE or other partner. The Company examines specific criteria and uses its judgment when determining if the Company is the primary beneficiary of a VIE. Factors considered in determining whether the Company is the primary beneficiary include risk and reward sharing, experience and financial condition of other partner(s), voting rights, involvement in day-to-day capital and operating decisions, representation on a VIE’s executive committee, existence of unilateral kick-out rights or voting rights, and level of economic disproportionality between the Company and the other partner(s).
Consolidated VIEs
As of
December 31, 2016
, the Company had invested approximately
$8.0 million
in
one
real estate project which is a VIE. This entity does not have any other significant assets or liabilities at
December 31, 2016
and was established to facilitate the development of a theatre project.
Unconsolidated VIE
At
December 31, 2016
, the Company’s recorded investment in SVVI, a VIE that is unconsolidated, was
$164.7 million
. The Company’s maximum exposure to loss associated with SVVI is limited to the Company’s outstanding mortgage note of
$164.7 million
. While this entity is a VIE, the Company has determined that the power to direct the activities of the VIE that most significantly impact the VIE’s economic performance is not held by the Company. For further discussion of this mortgage note, see Note 5.
9. Derivative Instruments
All derivatives are recognized at fair value in the consolidated balance sheets within the line items "Other assets" and "Accounts payable and accrued liabilities" as applicable. The Company's derivatives are subject to a master netting arrangement and the Company has elected not to offset its derivative position for purposes of balance sheet presentation and disclosure. The Company had derivative liabilities of
$2.5 million
and
$5.7 million
recorded in “Accounts payable and accrued liabilities” and derivative assets of
$35.9 million
and
$42.2 million
recorded in “Other assets” in the consolidated balance sheet at
December 31, 2016 and 2015
, respectively. Had the Company elected to offset derivatives in the consolidated balance sheets, the Company would have had derivative assets of approximately
$35.9 million
and derivative assets of
$42.2 million
that would have been offset against the respective derivative liabilities of
$2.5 million
and liabilities of
$5.7 million
, resulting in a net derivative asset of
$33.4 million
and
$36.5 million
(with no derivative liability) at
December 31, 2016 and 2015
, respectively. The Company has not posted or received collateral with its derivative counterparties as of
December 31, 2016 and 2015
. See Note 10 for disclosures relating to the fair value of the derivative instruments as of
December 31, 2016 and 2015
.
Risk Management Objective of Using Derivatives
The Company is exposed to the effect of changes in foreign currency exchange rates and interest rates on its LIBOR based borrowings. The Company limits this risk by following established risk management policies and procedures including the use of derivatives. The Company’s objective in using derivatives is to add stability to reported earnings
95
EPR PROPERTIES
Notes to Consolidated Financial Statements
December 31, 2016, 2015 and 2014
and to manage its exposure to foreign exchange and interest rate movements or other identified risks. To accomplish this objective, the Company primarily uses interest rate swaps, cross currency swaps and foreign currency forwards.
Cash Flow Hedges of Interest Rate Risk
The Company’s objectives in using interest rate derivatives are to add stability to interest expense and to manage its exposure to interest rate movements on its LIBOR based borrowings. To accomplish this objective, the Company currently uses interest rate swaps as its interest rate risk management strategy. Interest rate swaps designated as cash flow hedges involve the receipt of variable-rate amounts from a counterparty in exchange for the Company making fixed-rate payments over the life of the agreements without exchange of the underlying notional amount.
As of
December 31, 2016
, the Company had
three
interest rate swap agreements to fix the interest rate on
$240.0 million
of the unsecured term loan facility at
3.78%
from January 5, 2016 to July 5, 2017. Additionally as of
December 31, 2016
, the Company had
two
interest rate swap agreements to fix the interest rate at
2.94%
on an additional
$60.0 million
of the unsecured term loan facility from September 8, 2015 to July 5, 2017 and on
$300.0 million
of the unsecured term loan facility from July 6, 2017 to April 5, 2019.
The effective portion of changes in the fair value of interest rate derivatives designated and that qualify as cash flow hedges is recorded in accumulated other comprehensive income (AOCI) and is subsequently reclassified into earnings in the period that the hedged forecasted transaction affects earnings. During the years ended
December 31, 2016, 2015 and 2014
, such derivatives were used to hedge the variable cash flows associated with existing variable-rate debt. The ineffective portion of the change in fair value of the derivatives is recognized directly in earnings.
No
hedge ineffectiveness on cash flow hedges was recognized during the years ended
December 31, 2016, 2015 and 2014
.
Amounts reported in AOCI related to derivatives will be reclassified to interest expense as interest payments are made on the Company’s variable-rate debt. As of
December 31, 2016
, the Company estimates that during the twelve months ending December 31, 2017,
$2.8 million
will be reclassified from AOCI to interest expense.
Cash Flow Hedges of Foreign Exchange Risk
The Company is exposed to foreign currency exchange risk against its functional currency, the U.S. dollar, on its
four
Canadian properties. The Company uses cross currency swaps and foreign currency forwards to mitigate its exposure to fluctuations in the Canadian Dollar (CAD) to U.S. dollar exchange rate on its Canadian properties. These foreign currency derivatives should hedge a significant portion of the Company's expected CAD denominated cash flow of the Canadian properties as their impact on the Company's cash flow when settled should move in the opposite direction of the exchange rates utilized to translate revenues and expenses of these properties.
At
December 31, 2016
, the Company’s cross-currency swaps had a fixed original notional value of
$100.0 million
CAD and
$98.1 million
U.S. The net effect of these swaps is to lock in an exchange rate of
$1.05
CAD per U.S. dollar on approximately
$13.5 million
of annual CAD denominated cash flows on the properties through June 2018.
The effective portion of changes in the fair value of foreign currency derivatives designated and that qualify as cash flow hedges of foreign exchange risk is recorded in AOCI and subsequently reclassified into earnings in the period that the hedged forecasted transaction affects earnings. The ineffective portion of the change in fair value of the derivative, as well as amounts excluded from the assessment of hedge effectiveness, is recognized directly in earnings.
No
hedge ineffectiveness on foreign currency derivatives has been recognized for the years ended
December 31, 2016, 2015 and 2014
. As of
December 31, 2016
, the Company estimates that during the twelve months ending December 31, 2017,
$2.8 million
will be reclassified from AOCI to other income.
Net Investment Hedges
As discussed above, the Company is exposed to fluctuations in foreign exchange rates on its
four
Canadian properties. As such, the Company uses currency forward agreements to hedge its exposure to changes in foreign exchange rates. Currency forward agreements involve fixing the CAD to U.S. dollar exchange rate for delivery of a specified amount of foreign currency on a specified date. The currency forward agreements are typically cash settled in U.S. dollars for their fair value at or close to their settlement date. In order to hedge the net investment in
four
of the Canadian properties, the Company entered into a forward contract with a fixed notional value of
$100.0 million
CAD and
$94.3 million
96
EPR PROPERTIES
Notes to Consolidated Financial Statements
December 31, 2016, 2015 and 2014
U.S. with a July 2018 settlement date. The exchange rate of this forward contract is approximately
$1.06
CAD per U.S. dollar. Additionally, on February 28, 2014, the Company entered into a forward contract with a fixed notional value of
$100.0 million
CAD and
$88.1 million
U.S. with a July 2018 settlement date. The exchange rate of this forward contract is approximately
$1.13
CAD per U.S. dollar. These forward contracts should hedge a significant portion of the Company’s CAD denominated net investment in these
four
properties through July 2018 as the impact on AOCI from marking the derivative to market should move in the opposite direction of the translation adjustment on the net assets of these
four
Canadian properties.
For foreign currency derivatives designated as net investment hedges, the effective portion of changes in the fair value of the derivatives are reported in AOCI as part of the cumulative translation adjustment. The ineffective portion of the change in fair value of the derivatives is recognized directly in earnings.
No
hedge ineffectiveness on net investment hedges has been recognized for the years ended
December 31, 2016, 2015 and 2014
. Amounts are reclassified out of AOCI into earnings when the hedged net investment is either sold or substantially liquidated.
Below is a summary of the effect of derivative instruments on the consolidated statements of changes in equity and income for the years ended
December 31, 2016, 2015 and 2014
:
|
Effect of Derivative Instruments on the Consolidated Statements of Changes in Equity and Income for the Years Ended December 31, 2016, 2015 and 2014
(Dollars in thousands)
|
|||||||||||
|
|
Year Ended December 31,
|
||||||||||
|
Description
|
2016
|
2015
|
2014
|
||||||||
|
Interest Rate Swaps
|
|||||||||||
|
Amount of Loss Recognized in AOCI on Derivative (Effective Portion)
|
$
|
(2,044
|
)
|
$
|
(2,581
|
)
|
$
|
(2,458
|
)
|
||
|
Amount of Expense Reclassified from AOCI into Earnings (Effective Portion) (1)
|
(5,235
|
)
|
(2,004
|
)
|
(1,833
|
)
|
|||||
|
Cross Currency Swaps
|
|||||||||||
|
Amount of (Loss) Gain Recognized in AOCI on Derivative (Effective Portion)
|
(754
|
)
|
5,380
|
|
3,560
|
|
|||||
|
Amount of Income Reclassified from AOCI into Earnings (Effective Portion) (2)
|
2,663
|
|
2,396
|
|
698
|
|
|||||
|
Currency Forward Agreements
|
|||||||||||
|
Amount of (Loss) Gain Recognized in AOCI on Derivative (Effective Portion)
|
(2,804
|
)
|
24,359
|
|
11,600
|
|
|||||
|
Amount of Income Reclassified from AOCI into Earnings (Effective Portion) (2)
|
—
|
|
—
|
|
—
|
|
|||||
|
Total
|
|||||||||||
|
Amount of (Loss) Gain Recognized in AOCI on Derivative (Effective Portion)
|
$
|
(5,602
|
)
|
$
|
27,158
|
|
$
|
12,702
|
|
||
|
Amount of (Expense) Gain Reclassified from AOCI into Earnings (Effective Portion)
|
(2,572
|
)
|
392
|
|
(1,135
|
)
|
|||||
|
(1)
|
Included in “Interest expense, net” in accompanying consolidated statements of income.
|
|
(2)
|
Included in “Other expense” or "Other income" in the accompanying consolidated statements of income.
|
Credit-risk-related Contingent Features
The Company has agreements with each of its interest rate derivative counterparties that contain a provision where if the Company defaults on any of its obligations for borrowed money or credit in an amount exceeding
$25.0 million
and such default is not waived or cured within a specified period of time, including default where repayment of the indebtedness has not been accelerated by the lender, then the Company could also be declared in default on its interest rate derivative obligations.
97
EPR PROPERTIES
Notes to Consolidated Financial Statements
December 31, 2016, 2015 and 2014
As of
December 31, 2016
, the fair value of the Company’s derivatives in a liability position related to these agreements was
$2.5 million
. If the Company breached any of the contractual provisions of the derivative contracts, it would be required to settle its obligations under the agreements at their termination value, after considering the right of offset, of
$448 thousand
.
10. Fair Value Disclosures
The Company has certain financial instruments that are required to be measured under the FASB’s Fair Value Measurement guidance. The Company currently does not have any non-financial assets and non-financial liabilities that are required to be measured at fair value on a recurring basis.
As a basis for considering market participant assumptions in fair value measurements, the FASB’s Fair Value Measurement guidance establishes a fair value hierarchy that distinguishes between market participant assumptions based on market data obtained from sources independent of the reporting entity (observable inputs that are classified within Levels 1 and 2 of the hierarchy) and the reporting entity’s own assumptions about market participant assumptions (unobservable inputs classified within Level 3 of the hierarchy). Level 1 inputs use quoted prices (unadjusted) in active markets for identical assets or liabilities that the Company has the ability to access. Level 2 inputs are inputs other than quoted prices included in Level 1 that are observable for the asset or liability, either directly or indirectly. Level 3 inputs are unobservable inputs for the asset or liability, which are typically based on an entity’s own assumptions, as there is little, if any, related market activity. In instances where the determination of the fair value measurement is based on inputs from different levels of the fair value hierarchy, the level in the fair value hierarchy within which the entire fair value measurement falls is based on the lowest level input that is significant to the fair value measurement in its entirety. The Company’s assessment of the significance of a particular input to the fair value measurement in its entirety requires judgment, and considers factors specific to the asset or liability.
Derivative Financial Instruments
The Company uses interest rate swaps, foreign currency forwards and cross currency swaps to manage its interest rate and foreign currency risk. The valuation of these instruments is determined using widely accepted valuation techniques including discounted cash flow analysis on the expected cash flows of each derivative. This analysis reflects the contractual terms of the derivatives, including the period to maturity, and uses observable market-based inputs, including interest rate curves, foreign exchange rates, and implied volatilities. The fair values of interest rate swaps are determined using the market standard methodology of netting the discounted future fixed cash receipts and the discounted expected variable cash payments. The variable cash payments are based on an expectation of future interest rates (forward curves) derived from observable market interest rate curves. The Company incorporates credit valuation adjustments to appropriately reflect both its own nonperformance risk and the respective counterparty’s nonperformance risk in the fair value measurements. In adjusting the fair value of its derivative contracts for the effect of nonperformance risk, the Company has considered the impact of netting and any applicable credit enhancements, such as collateral postings, thresholds, mutual puts, and guarantees. In conjunction with the FASB's fair value measurement guidance, the Company made an accounting policy election to measure the credit risk of its derivative financial instruments that are subject to master netting agreements on a net basis by counterparty portfolio.
Although the Company has determined that the majority of the inputs used to value its derivatives fall within Level 2 of the fair value hierarchy, the credit valuation adjustments associated with its derivatives also use Level 3 inputs, such as estimates of current credit spreads, to evaluate the likelihood of default by itself and its counterparties. As of
December 31, 2016
, the Company has assessed the significance of the impact of the credit valuation adjustments on the overall valuation of its derivative positions and has determined that the credit valuation adjustments are not significant to the overall valuation of its derivatives and therefore, has classified its derivatives as Level 2 within the fair value reporting hierarchy.
98
EPR PROPERTIES
Notes to Consolidated Financial Statements
December 31, 2016, 2015 and 2014
The table below presents the Company’s assets and liabilities measured at fair value on a recurring basis as of
December 31, 2016 and 2015
, aggregated by the level in the fair value hierarchy within which those measurements are classified and by derivative type.
|
Assets and Liabilities Measured at Fair Value on a Recurring Basis at December 31, 2016 and 2015
(Dollars in thousands)
|
|||||||||||||||
|
Description
|
Quoted Prices in
Active Markets for Identical Assets (Level I) |
Significant
Other Observable Inputs (Level 2) |
Significant
Unobservable Inputs (Level 3) |
Balance at
December 31, |
|||||||||||
|
2016:
|
|||||||||||||||
|
Cross Currency Swaps*
|
$
|
—
|
|
$
|
4,158
|
|
$
|
—
|
|
$
|
4,158
|
|
|||
|
Currency Forward Agreements*
|
$
|
—
|
|
$
|
31,782
|
|
$
|
—
|
|
$
|
31,782
|
|
|||
|
Interest Rate Swap Agreements**
|
$
|
—
|
|
$
|
(2,482
|
)
|
$
|
—
|
|
$
|
(2,482
|
)
|
|||
|
2015:
|
|||||||||||||||
|
Cross Currency Swaps*
|
$
|
—
|
|
$
|
7,575
|
|
$
|
—
|
|
$
|
7,575
|
|
|||
|
Currency Forward Agreements*
|
$
|
—
|
|
$
|
34,587
|
|
$
|
—
|
|
$
|
34,587
|
|
|||
|
Interest Rate Swap Agreements**
|
$
|
—
|
|
$
|
(5,674
|
)
|
$
|
—
|
|
$
|
(5,674
|
)
|
|||
*Included in "Other assets" in the accompanying consolidated balance sheet.
**Included in "Accounts payable and accrued liabilities" in the accompanying consolidated balance sheet.
Non-recurring fair value measurements
There were no non-recurring measurements during the years ended
December 31, 2016 and 2015
.
Fair Value of Financial Instruments
The following methods and assumptions were used by the Company to estimate the fair value of each class of financial instruments at
December 31, 2016 and 2015
:
Mortgage notes receivable and related accrued interest receivable:
The fair value of the Company’s mortgage notes and related accrued interest receivable is estimated by discounting the future cash flows of each instrument using current market rates. At
December 31, 2016
, the Company had a carrying value of
$614.0 million
in fixed rate mortgage notes receivable outstanding, including related accrued interest, with a weighted average interest rate of approximately
8.77%
. The fixed rate mortgage notes bear interest at rates of
7.00%
to
11.31%
. Discounting the future cash flows for fixed rate mortgage notes receivable using rates of
7.00%
to
12.00%
, management estimates the fair value of the fixed rate mortgage notes receivable to be
$648.5 million
with an estimated weighted average market rate of
8.48%
at
December 31, 2016
.
At
December 31, 2015
, the Company had a carrying value of
$423.8 million
in fixed rate mortgage notes receivable outstanding, including related accrued interest, with a weighted average interest rate of approximately
9.36%
. The fixed rate mortgage notes bear interest at rates of
5.50%
to
11.31%
. Discounting the future cash flows for fixed rate mortgage notes receivable using rates of
8.50%
to
11.31%
, management estimates the fair value of the fixed rate mortgage notes receivable to be approximately
$415.7 million
with an estimated weighted average market rate of
10.05%
at
December 31, 2015
.
Investment in a direct financing lease, net:
The fair value of the Company’s investment in a direct financing lease as of
December 31, 2016 and 2015
is estimated by discounting the future cash flows of the instrument using current market rates. At
December 31, 2016 and 2015
, the Company had an investment in a direct financing lease with a carrying value of
$102.7 million
and
$190.9 million
, respectively, and weighted average effective interest rate of
12.00%
. At December 31, 2016 and 2015, the investment in direct financing lease bears interest at effective interest rates of
11.79%
to
12.38%
and
11.74%
to
12.38%
, respectively. The carrying value of the investment in a direct financing lease approximates the fair market value at
December 31, 2016 and 2015
.
99
EPR PROPERTIES
Notes to Consolidated Financial Statements
December 31, 2016, 2015 and 2014
Derivative instruments:
Derivative instruments are carried at their fair market value.
Debt instruments:
The fair value of the Company's debt as of
December 31, 2016 and 2015
is estimated by discounting the future cash flows of each instrument using current market rates. At
December 31, 2016
, the Company had a carrying value of
$375.0 million
in variable rate debt outstanding with an average weighted interest rate of approximately
3.23%
. The carrying value of the variable rate debt outstanding approximates the fair market value at
December 31, 2016
.
At
December 31, 2015
, the Company had a carrying value of
$571.0 million
in variable rate debt outstanding with an average weighted interest rate of approximately
1.65%
. The carrying value of the variable rate debt outstanding approximates the fair market value at
December 31, 2015
.
As described in Note 9, at
December 31, 2016 and 2015
,
$300.0 million
of variable rate debt outstanding under the Company's unsecured term loan facility had been effectively converted to a fixed rate through April 5, 2019 by interest rate swap agreements.
At
December 31, 2016
, the Company had a carrying value of
$2.14 billion
in fixed rate debt outstanding with an average weighted interest rate of approximately
5.27%
. Discounting the future cash flows for fixed rate debt using December 31, 2016 market rates of
2.97%
to
4.75%
, management estimates the fair value of the fixed rate debt to be approximately
$2.21 billion
with an estimated weighted average market rate of
4.26%
at
December 31, 2016
.
At
December 31, 2015
, the Company had a carrying value of
$1.43 billion
in fixed rate debt outstanding with an average weighted interest rate of approximately
5.66%
. Discounting the future cash flows for fixed rate debt using December 31, 2015 market rates of
3.33%
to
4.94%
, management estimates the fair value of the fixed rate debt to be approximately
$1.55 billion
with an estimated weighted average market rate of
4.28%
at
December 31, 2015
.
11. Common and Preferred Shares
Common Shares
The Board of Trustees declared cash dividends totaling
$3.84
and
$3.63
per common share for the years ended
December 31, 2016 and 2015
, respectively.
Of the total distributions calculated for tax purposes, the amounts characterized as ordinary income, return of capital and long-term capital gain for cash distributions paid per common share for the
years ended December 31, 2016 and 2015
are as follows:
|
Cash Distributions Per Share
|
|||||||
|
2016
|
2015
|
||||||
|
Taxable ordinary income
|
$
|
3.1659
|
|
$
|
3.0674
|
|
|
|
Return of capital
|
0.2489
|
|
0.5451
|
|
|||
|
Long-term capital gain (1)
|
0.4077
|
|
—
|
|
|||
|
Totals
|
$
|
3.8225
|
|
$
|
3.6125
|
|
|
(1) Of the long-term capital gain at December 31, 2016,
$0.1060
is unrecaptured section 1250 gain.
100
EPR PROPERTIES
Notes to Consolidated Financial Statements
December 31, 2016, 2015 and 2014
During the year ended
December 31, 2015
, the Company issued an aggregate of
3,530,058
common shares under the direct share purchase component of its Dividend Reinvestment and Direct Share Purchase Plan (DSPP) for total net proceeds of
$190.3 million
.
During the year ended
December 31, 2016
, the Company issued an aggregate of
258,263
common shares under its DSPP for net proceeds of
$16.9 million
.
Subsequent to December 31, 2016, the Company issued an aggregate of
548,288
common shares under its DSPP for net proceeds of
$40.8 million
.
On January 21, 2016, the Company issued
2,250,000
common shares in a registered public offering for a total net proceeds, after the underwriting discount and offering expenses of approximately
$125.0 million
. The net proceeds from the public offering were used to pay down the Company's unsecured revolving credit facility.
Series C Convertible Preferred Shares
The Company has outstanding
5.4 million
5.75%
Series C cumulative convertible preferred shares (Series C preferred shares). The Company will pay cumulative dividends on the Series C preferred shares from the date of original issuance in the amount of
$1.4375
per share each year, which is equivalent to
5.75%
of the
$25
liquidation preference per share. Dividends on the Series C preferred shares are payable quarterly in arrears. The Company does not have the right to redeem the Series C preferred shares except in limited circumstances to preserve the Company’s REIT status. The Series C preferred shares have no stated maturity and will not be subject to any sinking fund or mandatory redemption. As of
December 31, 2016
, the Series C preferred shares are convertible, at the holder’s option, into the Company’s common shares at a conversion rate of
0.3785
common shares per Series C preferred share, which is equivalent to a conversion price of
$66.05
per common share. This conversion ratio may increase over time upon certain specified triggering events including if the Company’s common dividends per share exceeds a quarterly threshold of
$0.6875
.
Upon the occurrence of certain fundamental changes, the Company will under certain circumstances increase the conversion rate by a number of additional common shares or, in lieu thereof, may in certain circumstances elect to adjust the conversion rate upon the Series C preferred shares becoming convertible into shares of the public acquiring or surviving company.
The Company may, at its option, cause the Series C preferred shares to be automatically converted into that number of common shares that are issuable at the then prevailing conversion rate. The Company may exercise its conversion right only if, at certain times, the closing price of the Company’s common shares equals or exceeds
135%
of the then prevailing conversion price of the Series C preferred shares.
Owners of the Series C preferred shares generally have no voting rights, except under certain dividend defaults. Upon conversion, the Company may choose to deliver the conversion value to the owners in cash, common shares, or a combination of cash and common shares.
The Board of Trustees declared cash dividends totaling
$1.4375
per Series C preferred share for each of the years ended
December 31, 2016 and 2015
, respectively. For the year ended December 31, 2016, there were non-cash distributions associated with conversion adjustments of
$0.4394
per Series C preferred share. The conversion adjustment provision entitles the shareholders of the Series C preferred shares, upon certain quarterly common share dividend thresholds being met, to receive additional common shares of the Company upon a conversion of the preferred shares into common shares. The increase in common shares to be received upon a conversion is a deemed distribution for federal income tax purposes.
For tax purposes, the amounts characterized as ordinary income, return of capital and long-term capital gain for cash distributions paid and non-cash deemed distributions per Series C preferred share for the
years ended December 31, 2016 and 2015
are as follows:
101
EPR PROPERTIES
Notes to Consolidated Financial Statements
December 31, 2016, 2015 and 2014
|
Cash Distributions per Share
|
|||||||
|
2016
|
2015
|
||||||
|
Taxable ordinary income
|
$
|
1.2735
|
|
$
|
1.4375
|
|
|
|
Return of capital
|
—
|
|
—
|
|
|||
|
Long-term capital gain (1)
|
0.1640
|
|
—
|
|
|||
|
Totals
|
$
|
1.4375
|
|
$
|
1.4375
|
|
|
(1) Of the long-term capital gain at December 31, 2016,
$0.0426
is unrecaptured section 1250 gain.
|
Non-cash Distributions per Share
|
|||||||
|
2016
|
2015
|
||||||
|
Taxable ordinary income
|
$
|
0.2850
|
|
$
|
—
|
|
|
|
Return of capital
|
0.1177
|
|
—
|
|
|||
|
Long-term capital gain (2)
|
0.0367
|
|
—
|
|
|||
|
Totals
|
$
|
0.4394
|
|
$
|
—
|
|
|
(2) Of the long-term capital gain at December 31, 2016,
$0.0095
is unrecaptured section 1250 gain.
Series E Convertible Preferred Shares
The Company has outstanding
3.5 million
9.00%
Series E cumulative convertible preferred shares (Series E preferred shares). The Company will pay cumulative dividends on the Series E preferred shares from the date of original issuance in the amount of
$2.25
per share each year, which is equivalent to
9.00%
of the
$25
liquidation preference per share. Dividends on the Series E preferred shares are payable quarterly in arrears. The Company does not have the right to redeem the Series E preferred shares except in limited circumstances to preserve the Company’s REIT status. The Series E preferred shares have no stated maturity and will not be subject to any sinking fund or mandatory redemption. As of
December 31, 2016
, the Series E preferred shares are convertible, at the holder’s option, into the Company’s common shares at a conversion rate of
0.4569
common shares per Series E preferred share, which is equivalent to a conversion price of
$54.72
per common share. This conversion ratio may increase over time upon certain specified triggering events including if the Company’s common dividends per share exceeds a quarterly threshold of
$0.84
.
Upon the occurrence of certain fundamental changes, the Company will under certain circumstances increase the conversion rate by a number of additional common shares or, in lieu thereof, may in certain circumstances elect to adjust the conversion rate upon the Series E preferred shares becoming convertible into shares of the public acquiring or surviving company.
The Company may, at its option, cause the Series E preferred shares to be automatically converted into that number of common shares that are issuable at the then prevailing conversion rate. The Company may exercise its conversion right only if, at certain times, the closing price of the Company’s common shares equals or exceeds
150%
of the then prevailing conversion price of the Series E preferred shares.
Owners of the Series E preferred shares generally have no voting rights, except under certain dividend defaults. Upon conversion, the Company may choose to deliver the conversion value to the owners in cash, common shares, or a combination of cash and common shares.
The Board of Trustees declared cash dividends totaling
$2.25
per Series E preferred share for the years ended
December 31, 2016 and 2015
. For the year ended December 31, 2016, there were non-cash distributions associated with conversion adjustments of
$0.2139
per Series E preferred share. The conversion adjustment provision entitles the shareholders of the Series E preferred shares, upon certain quarterly common share dividend thresholds being met, to receive additional common shares of the Company upon a conversion of the preferred shares into common shares. The increase in common shares to be received upon a conversion is a deemed distribution for federal income tax purposes.
102
EPR PROPERTIES
Notes to Consolidated Financial Statements
December 31, 2016, 2015 and 2014
For tax purposes, the amounts characterized as ordinary income, return of capital and long-term capital gain for cash distributions paid and non-cash deemed distributions per Series E preferred share for the
years ended December 31, 2016 and 2015
are as follows:
|
Cash Distributions per Share
|
|||||||
|
2016
|
2015
|
||||||
|
Taxable ordinary income
|
$
|
1.9933
|
|
$
|
2.2500
|
|
|
|
Return of capital
|
—
|
|
—
|
|
|||
|
Long-term capital gain (1)
|
0.2567
|
|
—
|
|
|||
|
Totals
|
$
|
2.2500
|
|
$
|
2.2500
|
|
|
(1) Of the long-term capital gain at December 31, 2016,
$0.0668
is unrecaptured section 1250 gain.
|
Non-cash Distributions per Share
|
|||||||
|
2016
|
2015
|
||||||
|
Taxable ordinary income
|
$
|
0.0883
|
|
$
|
—
|
|
|
|
Return of capital
|
0.1142
|
|
—
|
|
|||
|
Long-term capital gain (2)
|
0.0114
|
|
—
|
|
|||
|
Totals
|
$
|
0.2139
|
|
$
|
—
|
|
|
(2) Of the long-term capital gain at December 31, 2016,
$0.0030
is unrecaptured section 1250 gain.
Series F Preferred Shares
The Company has outstanding
5.0 million
shares of
6.625%
Series F cumulative redeemable preferred shares (Series F preferred shares). The Company will pay cumulative dividends on the Series F preferred shares from the date of original issuance in the amount of
$1.65625
per share each year, which is equivalent to
6.625%
of the
$25.00
liquidation preference per share. Dividends on the Series F preferred shares are payable quarterly in arrears. The Company may not redeem the Series F preferred shares before October 12, 2017, except in limited circumstances to preserve the Company’s REIT status or in connection with a change of control. On or after October 12, 2017, the Company may, at its option, redeem the Series F preferred shares in whole at any time or in part from time to time by paying
$25.00
per share, plus any accrued and unpaid dividends up to and including the date of redemption. The Series F preferred shares have no stated maturity and will not be subject to any sinking fund or mandatory redemption. The Series F preferred shares are not convertible into any of the Company's securities, except under certain circumstances in connection with a change of control. Owners of the Series F preferred shares generally have no voting rights except under certain dividend defaults.
The Board of Trustees declared cash dividends totaling
$1.65625
per Series F preferred share for the years ended
December 31, 2016 and 2015
. For tax purposes, the amounts characterized as ordinary income, return of capital and long-term capital gain for cash distributions paid per Series F preferred share for the
years ended December 31, 2016 and 2015
are as follows:
|
Cash Distributions per Share
|
|||||||
|
2016
|
2015
|
||||||
|
Taxable ordinary income
|
$
|
1.4673
|
|
$
|
1.6563
|
|
|
|
Return of capital
|
—
|
|
—
|
|
|||
|
Long-term capital gain (1)
|
0.1889
|
|
—
|
|
|||
|
Totals
|
$
|
1.6562
|
|
$
|
1.6563
|
|
|
(1) Of the long-term capital gain at December 31, 2016,
$0.04914
is unrecaptured section 1250 gain.
103
EPR PROPERTIES
Notes to Consolidated Financial Statements
December 31, 2016, 2015 and 2014
12. Earnings Per Share
The following table summarizes the Company’s computation of basic and diluted earnings per share (EPS) for the years ended
December 31, 2016, 2015 and 2014
(amounts in thousands except per share information):
|
|
Year Ended December 31, 2016
|
|||||||||
|
|
Income
(numerator)
|
Shares
(denominator)
|
Per Share
Amount
|
|||||||
|
Basic EPS:
|
||||||||||
|
Income from continuing operations
|
$
|
224,982
|
|
|||||||
|
Less: preferred dividend requirements
|
(23,806
|
)
|
||||||||
|
Net income available to common shareholders
|
$
|
201,176
|
|
63,381
|
|
$
|
3.17
|
|
||
|
Diluted EPS:
|
||||||||||
|
Net income available to common shareholders
|
$
|
201,176
|
|
63,381
|
|
|||||
|
Effect of dilutive securities:
|
||||||||||
|
Share options
|
—
|
|
93
|
|
||||||
|
Net income available to common shareholders
|
$
|
201,176
|
|
63,474
|
|
$
|
3.17
|
|
||
|
|
Year Ended December 31, 2015
|
|||||||||
|
|
Income
(numerator)
|
Shares
(denominator)
|
Per Share
Amount
|
|||||||
|
Basic EPS:
|
||||||||||
|
Income from continuing operations
|
$
|
194,333
|
|
|||||||
|
Less: preferred dividend requirements
|
(23,806
|
)
|
||||||||
|
Income from continuing operations available to common shareholders
|
$
|
170,527
|
|
58,138
|
|
$
|
2.93
|
|
||
|
Income from discontinued operations available to common shareholders
|
$
|
199
|
|
58,138
|
|
$
|
0.01
|
|
||
|
Net income available to common shareholders
|
$
|
170,726
|
|
58,138
|
|
$
|
2.94
|
|
||
|
Diluted EPS:
|
||||||||||
|
Income from continuing operations available to common shareholders
|
$
|
170,527
|
|
58,138
|
|
|||||
|
Effect of dilutive securities:
|
||||||||||
|
Share options
|
—
|
|
190
|
|
||||||
|
Income from continuing operations available to common shareholders
|
$
|
170,527
|
|
58,328
|
|
$
|
2.92
|
|
||
|
Income from discontinued operations available to common shareholders
|
$
|
199
|
|
58,328
|
|
$
|
0.01
|
|
||
|
Net income available to common shareholders
|
$
|
170,726
|
|
58,328
|
|
$
|
2.93
|
|
||
104
EPR PROPERTIES
Notes to Consolidated Financial Statements
December 31, 2016, 2015 and 2014
|
|
Year Ended December 31, 2014
|
|||||||||
|
|
Income
(numerator)
|
Shares
(denominator)
|
Per Share
Amount
|
|||||||
|
Basic EPS:
|
||||||||||
|
Income from continuing operations
|
$
|
175,752
|
|
|||||||
|
Less: preferred dividend requirements and redemption costs
|
(23,807
|
)
|
||||||||
|
Income from continuing operations available to common shareholders
|
$
|
151,945
|
|
54,244
|
|
$
|
2.80
|
|
||
|
Loss from discontinued operations available to common shareholders
|
$
|
3,881
|
|
54,244
|
|
$
|
0.07
|
|
||
|
Net income available to common shareholders
|
$
|
155,826
|
|
54,244
|
|
$
|
2.87
|
|
||
|
Diluted EPS:
|
||||||||||
|
Income from continuing operations available to common shareholders
|
$
|
151,945
|
|
54,244
|
|
|||||
|
Effect of dilutive securities:
|
||||||||||
|
Share options
|
—
|
|
200
|
|
||||||
|
Income from continuing operations available to common shareholders
|
$
|
151,945
|
|
54,444
|
|
$
|
2.79
|
|
||
|
Loss from discontinued operations available to common shareholders
|
$
|
3,881
|
|
54,444
|
|
$
|
0.07
|
|
||
|
Net income available to common shareholders
|
$
|
155,826
|
|
54,444
|
|
$
|
2.86
|
|
||
The additional
2.0 million
common shares that would result from the conversion of the Company’s
5.75%
Series C cumulative convertible preferred shares and the additional
1.6 million
common shares that would result from the conversion of the Company’s
9.0%
Series E cumulative convertible preferred shares and the corresponding add-back of the preferred dividends declared on those shares are not included in the calculation of diluted earnings per share for the years ended
December 31, 2016, 2015 and 2014
because the effect is anti-dilutive.
The dilutive effect of potential common shares from the exercise of share options is included in diluted earnings per share for the years ended
December 31, 2016, 2015 and 2014
. However, options to purchase
72 thousand
,
236 thousand
and
338 thousand
shares of common shares at per share prices of
$61.79
, ranging from
$51.64
to
$65.50
and ranging from
$46.86
to
$65.50
, were outstanding at the end of 2016, 2015 and 2014, respectively, but were not included in the computation of diluted earnings per share because they were anti-dilutive.
13. Chief Executive Officer Retirement
On February 24, 2015, the Company announced that David Brain, its then President and Chief Executive Officer, was retiring from the Company. In connection with his retirement, Mr. Brain and the Company entered into a Retirement Agreement pursuant to which he agreed to retire on March 31, 2015 in consideration for certain retirement severance benefits substantially equal to those benefits that would be payable to him under his employment agreement if he were terminated without cause. As a result, the Company recorded retirement severance expense (including share-based compensation costs) during the year ended December 31, 2015 of
$18.6 million
. Retirement severance expense includes a cash payment of
$11.8 million
,
$5.0 million
for the accelerated vesting of
113,900
nonvested shares,
$1.4 million
for the accelerated vesting of
101,640
share options and
$0.4 million
of related taxes and other expenses.
14. Equity Incentive Plan
All grants of common shares and options to purchase common shares were issued under the Company's 2007 Equity Incentive Plan prior to May 12, 2016 and under the 2016 Equity Incentive Plan on and after May 12, 2016. Under the 2016 Equity Incentive Plan, an aggregate of
1,950,000
common shares, options to purchase common shares and restricted share units, subject to adjustment in the event of certain capital events, may be granted. At
December 31, 2016
, there were
1,950,000
shares available for grant under the 2016 Equity Incentive Plan.
105
EPR PROPERTIES
Notes to Consolidated Financial Statements
December 31, 2016, 2015 and 2014
Share Options
Share options granted under the 2007 Equity Incentive Plan and the 2016 Equity Incentive Plan have exercise prices equal to the fair market value of a common share at the date of grant. The options may be granted for any reasonable term, not to exceed
10
years, and for employees typically become exercisable at a rate of
25%
per year over a
four
-year period. The Company generally issues new common shares upon option exercise. A summary of the Company’s share option activity and related information is as follows:
|
|
Number of
shares
|
Option price
per share
|
Weighted avg.
exercise price
|
||||||||||||||
|
Outstanding at December 31, 2013
|
840,665
|
|
$
|
18.18
|
|
—
|
|
$
|
65.50
|
|
$
|
40.85
|
|
||||
|
Exercised
|
(35,963
|
)
|
32.50
|
|
—
|
|
52.72
|
|
42.63
|
|
|||||||
|
Granted
|
172,178
|
|
51.64
|
|
—
|
|
51.64
|
|
51.64
|
|
|||||||
|
Forfeited
|
(26,666
|
)
|
45.20
|
|
—
|
|
51.64
|
|
50.11
|
|
|||||||
|
Outstanding at December 31, 2014
|
950,214
|
|
$
|
18.18
|
|
—
|
|
$
|
65.50
|
|
$
|
42.48
|
|
||||
|
Exercised
|
(476,400
|
)
|
18.18
|
|
—
|
|
61.53
|
|
37.42
|
|
|||||||
|
Granted
|
121,546
|
|
61.79
|
|
—
|
|
61.79
|
|
61.79
|
|
|||||||
|
Forfeited
|
(79,055
|
)
|
45.20
|
|
—
|
|
65.50
|
|
63.88
|
|
|||||||
|
Outstanding at December 31, 2015
|
516,305
|
|
$
|
19.02
|
|
—
|
|
$
|
65.50
|
|
$
|
48.42
|
|
||||
|
Exercised
|
(230,319
|
)
|
19.41
|
|
—
|
|
65.50
|
|
44.05
|
|
|||||||
|
Outstanding at December 31, 2016
|
285,986
|
|
$
|
19.02
|
|
—
|
|
$
|
61.79
|
|
$
|
51.93
|
|
||||
The weighted average fair value of options granted was
$16.35
and
$13.87
during 2015 and 2014, respectively. There were no options granted during 2016. The intrinsic value of stock options exercised was
$5.2 million
,
$7.3 million
, and
$0.4 million
during the years ended
December 31, 2016, 2015 and 2014
, respectively. Additionally, the Company repurchased
173,191
shares into treasury shares in conjunction with the stock options exercised during the year ended
December 31, 2016
with a total value of
$11.6 million
.
The expense related to share options included in the determination of net income for the years ended
December 31, 2016, 2015 and 2014
was
$0.9 million
,
$2.5 million
(including
$1.4 million
included in retirement severance expense in the accompanying consolidated statement of income), and
$1.4 million
, respectively. The following assumptions were used in applying the Black-Scholes option pricing model at the grant dates: risk-free interest rate of
1.9%
and
2.2%
in 2015 and 2014, respectively, dividend yield of
5.9%
and
6.4%
in 2015 and 2014, respectively, volatility factors in the expected market price of the Company’s common shares of
48.0%
and
50.3%
in 2015 and 2014, respectively,
0.78%
and
0.28%
expected forfeiture rates for 2015 and 2014, and an expected life of approximately
six
years for 2015 and 2014. The Company uses historical data to estimate the expected life of the option and the risk-free interest rate is based on the U.S. Treasury yield curve in effect at the time of grant. Additionally, expected volatility is computed based on the average historical volatility of the Company’s publicly traded shares.
At
December 31, 2016
, stock-option expense to be recognized in future periods was as follows (in thousands):
|
|
Amount
|
||
|
Year:
|
|||
|
2017
|
$
|
692
|
|
|
2018
|
287
|
|
|
|
2019
|
—
|
|
|
|
2020
|
—
|
|
|
|
Total
|
$
|
979
|
|
106
EPR PROPERTIES
Notes to Consolidated Financial Statements
December 31, 2016, 2015 and 2014
The following table summarizes outstanding options at
December 31, 2016
:
|
Exercise price range
|
Options
outstanding
|
Weighted avg.
life remaining
|
Weighted avg.
exercise price
|
Aggregate intrinsic
value (in thousands)
|
|||||||||
|
$ 19.02 - 19.99
|
11,097
|
|
2.4
|
|
|||||||||
|
20.00 - 29.99
|
—
|
|
—
|
|
|||||||||
|
30.00 - 39.99
|
1,428
|
|
3.0
|
|
|||||||||
|
40.00 - 49.99
|
96,122
|
|
4.7
|
|
|||||||||
|
50.00 - 59.99
|
84,934
|
|
6.6
|
|
|||||||||
|
60.00 - 61.79
|
92,405
|
|
7.6
|
|
|||||||||
|
285,986
|
|
6.1
|
|
$
|
51.93
|
|
$
|
5,673
|
|
||||
The following table summarizes exercisable options at
December 31, 2016
:
|
Exercise price range
|
Options
outstanding
|
Weighted avg.
life remaining
|
Weighted avg.
exercise price
|
Aggregate intrinsic
value (in thousands)
|
|||||||||
|
$ 19.02 - 19.99
|
11,097
|
|
2.4
|
|
|||||||||
|
20.00 - 29.99
|
—
|
|
—
|
|
|||||||||
|
30.00 - 39.99
|
1,428
|
|
3.0
|
|
|||||||||
|
40.00 - 49.99
|
81,842
|
|
4.5
|
|
|||||||||
|
50.00 - 59.99
|
32,793
|
|
6.1
|
|
|||||||||
|
60.00 - 61.79
|
26,420
|
|
6.3
|
|
|||||||||
|
153,580
|
|
5.0
|
|
$
|
48.17
|
|
$
|
3,625
|
|
||||
Nonvested Shares
A summary of the Company’s nonvested share activity and related information is as follows:
|
Number of
shares
|
Weighted avg.
grant date
fair value
|
Weighted avg.
life remaining
|
||||||
|
Outstanding at December 31, 2015
|
390,441
|
|
$
|
54.84
|
|
|||
|
Granted
|
300,752
|
|
61.53
|
|
||||
|
Vested
|
(156,876
|
)
|
52.74
|
|
||||
|
Outstanding at December 31, 2016
|
534,317
|
|
$
|
59.22
|
|
1.01
|
||
The holders of nonvested shares have voting rights and receive dividends from the date of grant. These shares vest ratably over a period of
three
to
four
years. The fair value of the nonvested shares that vested was
$9.2 million
,
$17.1 million
(including
$6.7 million
in retirement severance expense in the accompanying consolidated statement of income), and
$7.3 million
for the years ended
December 31, 2016, 2015 and 2014
, respectively. At
December 31, 2016
, unamortized share-based compensation expense related to nonvested shares was
$16.2 million
and will be recognized in future periods as follows (in thousands):
|
|
Amount
|
||
|
Year:
|
|||
|
2017
|
$
|
7,602
|
|
|
2018
|
5,806
|
|
|
|
2019
|
2,814
|
|
|
|
Total
|
$
|
16,222
|
|
107
EPR PROPERTIES
Notes to Consolidated Financial Statements
December 31, 2016, 2015 and 2014
Restricted Share Units
A summary of the Company’s restricted share unit activity and related information is as follows:
|
Number of
Shares
|
Weighted
Average
Grant Date
Fair Value
|
Weighted
Average
Life
Remaining
|
||||||
|
Outstanding at December 31, 2015
|
18,036
|
|
$
|
57.57
|
|
|||
|
Granted
|
15,805
|
|
70.93
|
|
||||
|
Vested
|
(18,036
|
)
|
57.57
|
|
||||
|
Outstanding at December 31, 2016
|
15,805
|
|
$
|
70.93
|
|
0.36
|
||
The holders of restricted share units have voting rights and receive dividends from the date of grant. The share units vest upon the earlier of the day preceding the next annual meeting of shareholders or a change of control. The settlement date for the shares is selected by the non-employee trustee, and ranges from one year from the grant date to upon termination of service. At
December 31, 2016
, unamortized share-based compensation expense related to restricted share units was
$374 thousand
which will be recognized in 2017.
15. Operating Leases
Most of the Company’s rental properties are leased under operating leases with expiration dates ranging from
1
to
33
years. Future minimum rentals on non-cancelable tenant operating leases at
December 31, 2016
are as follows (in thousands):
|
|
Amount
|
||
|
Year:
|
|||
|
2017
|
$
|
398,938
|
|
|
2018
|
382,923
|
|
|
|
2019
|
360,745
|
|
|
|
2020
|
340,521
|
|
|
|
2021
|
326,276
|
|
|
|
Thereafter
|
2,989,155
|
|
|
|
Total
|
$
|
4,798,558
|
|
The Company leases its executive office from an unrelated landlord. Rental expense totaled approximately
$681 thousand
,
$556 thousand
and
$521 thousand
for the years ended
December 31, 2016, 2015 and 2014
, respectively, and is included as a component of general and administrative expense in the accompanying consolidated statements of income. Future minimum lease payments under this lease at
December 31, 2016
are as follows (in thousands):
|
|
Amount
|
||
|
Year:
|
|||
|
2017
|
$
|
856
|
|
|
2018
|
856
|
|
|
|
2019
|
856
|
|
|
|
2020
|
856
|
|
|
|
2021
|
884
|
|
|
|
Thereafter
|
4,592
|
|
|
|
Total
|
$
|
8,900
|
|
108
EPR PROPERTIES
Notes to Consolidated Financial Statements
December 31, 2016, 2015 and 2014
16. Quarterly Financial Information (unaudited)
Summarized quarterly financial data for the years ended
December 31, 2016 and 2015
are as follows (in thousands, except per share data):
|
March 31
|
June 30
|
September 30
|
December 31
|
||||||||||||
|
2016:
|
|||||||||||||||
|
Total revenue
|
$
|
118,768
|
|
$
|
118,033
|
|
$
|
125,610
|
|
$
|
130,831
|
|
|||
|
Net income attributable to EPR Properties
|
54,180
|
|
55,135
|
|
57,526
|
|
58,141
|
|
|||||||
|
Net income available to common shareholders of EPR Properties
|
48,228
|
|
49,183
|
|
51,575
|
|
52,190
|
|
|||||||
|
Basic net income per common share
|
0.77
|
|
0.77
|
|
0.81
|
|
0.82
|
|
|||||||
|
Diluted net income per common share
|
0.77
|
|
0.77
|
|
0.81
|
|
0.82
|
|
|||||||
|
March 31
|
June 30
|
September 30
|
December 31
|
||||||||||||
|
2015:
|
|||||||||||||||
|
Total revenue
|
$
|
99,436
|
|
$
|
101,258
|
|
$
|
108,335
|
|
$
|
111,988
|
|
|||
|
Net income attributable to EPR Properties
|
42,821
|
|
48,766
|
|
50,195
|
|
52,750
|
|
|||||||
|
Net income available to common shareholders of EPR Properties
|
36,869
|
|
42,814
|
|
44,244
|
|
46,799
|
|
|||||||
|
Basic net income per common share
|
0.65
|
|
0.75
|
|
0.76
|
|
0.78
|
|
|||||||
|
Diluted net income per common share
|
0.64
|
|
0.75
|
|
0.76
|
|
0.78
|
|
|||||||
17. Discontinued Operations
Included in discontinued operations for the year ended December 31, 2015 were certain post-closing items related to the Toronto Dundas Square property. Included in discontinued operations for the year ended December 31, 2014 is the reversal of liabilities totaling
$3.9 million
that related to the acquisition of Toronto Dundas Square. These liabilities were reversed as the related payments are not expected to occur. There were no discontinued operations for the year ended December 31, 2016.
The operating results relating to discontinued operations are as follows (in thousands):
|
|
Year ended December 31,
|
||||||
|
|
2015
|
2014
|
|||||
|
Rental revenue
|
$
|
—
|
|
$
|
3
|
|
|
|
Tenant reimbursements
|
68
|
|
—
|
|
|||
|
Other income
|
172
|
|
—
|
|
|||
|
Total revenue
|
240
|
|
3
|
|
|||
|
Property operating expense (income)
|
12
|
|
(484
|
)
|
|||
|
Other expense (income)
|
—
|
|
(18
|
)
|
|||
|
Transaction costs (benefit)
|
—
|
|
(3,376
|
)
|
|||
|
Income before income taxes
|
228
|
|
3,881
|
|
|||
|
Income tax expense
|
29
|
|
—
|
|
|||
|
Net income
|
$
|
199
|
|
$
|
3,881
|
|
|
18. Other Commitments and Contingencies
As of
December 31, 2016
, the Company had an aggregate of approximately
$313.7 million
of commitments to fund development projects including
20
entertainment development projects for which it has commitments to fund approximately
$82.3 million
,
20
education development projects for which it has commitments to fund approximately
109
EPR PROPERTIES
Notes to Consolidated Financial Statements
December 31, 2016, 2015 and 2014
$126.1 million
, and
seven
recreation development projects for which it has commitments to fund approximately
$105.3 million
. Development costs are advanced by the Company in periodic draws. If the Company determines that construction is not being completed in accordance with the terms of the development agreements, it can discontinue funding construction draws. The Company has agreed to lease the properties to the operators at pre-determined rates upon completion of construction.
Additionally as of December 31, 2016, the Company had a commitment to fund approximately
$155.0 million
over the next three years, of which
$1.7 million
has been funded, to complete an indoor waterpark hotel and adventure park at its casino and resort project in Sullivan County, New York. The Company is also responsible for the construction of this project's common infrastructure. In June 2016, the Sullivan County Infrastructure Local Development Corporation issued
$110.0 million
of Series 2016 Revenue Bonds, which is expected to fund a substantial portion of such construction costs. The Company received an initial reimbursement of
$43.4 million
of construction costs and expects to receive an additional
$44.9 million
of reimbursements over the balance of the construction period. As future costs are incurred, they will be classified in accounts receivable until reimbursement is received. Construction of infrastructure improvements is expected to be completed in 2018.
The Company has certain commitments related to its mortgage note investments that it may be required to fund in the future. The Company is generally obligated to fund these commitments at the request of the borrower or upon the occurrence of events outside of its direct control. As of
December 31, 2016
, the Company had
four
mortgage notes receivable with commitments totaling approximately
$14.2 million
. If commitments are funded in the future, interest
will be charged at rates consistent with the existing investments.
The Company has provided guarantees of the payment of certain economic development revenue bonds totaling
$24.9 million
related to
two
theatres in Louisiana for which the Company earns a fee at an annual rate of
2.88%
to
4.00%
over the
30
year terms of the related bonds. The Company has recorded
$10.6 million
as a deferred asset included in other assets and
$10.6 million
included in other liabilities in the accompanying consolidated balance sheet as of
December 31, 2016
related to these guarantees.
No
amounts have been accrued as a loss contingency related to these guarantees because payment by the Company is not probable.
In connection with construction of its development projects and related infrastructure, certain public agencies require posting of surety bonds to guarantee that the Company's obligations are satisfied. These bonds expire upon the completion of the improvements or infrastructure. As of
December 31, 2016
. the Company had
six
surety bonds outstanding totaling
$24.3 million
.
During the year ended December 31, 2016, the Company posted
two
letters of credit totaling
$5.0 million
in connection with a performance guarantee to complete certain site improvements at
two
theatres. The letters of credit expire on June 1, 2018.
Prior proposed casino and resort developers Concord Associates, L.P., Concord Resort, LLC and Concord Kiamesha LLC, which are affiliates of Louis Cappelli and from whom the Company acquired the Adelaar resort property (the Cappelli Group), commenced litigation against the Company beginning in 2011 regarding matters relating to the acquisition of that property and the Company's relationship with the Empire Resorts, Inc. and certain of its subsidiaries. This litigation involves
three
separate cases filed in state and federal court.
Two
of the cases, a state and the federal case, are closed and resulted in no liability by the Company.
The remaining case was filed on October 20, 2011 by the Cappelli Group against the Company and two of its affiliates in the Supreme Court of the State of New York, County of Westchester (the Westchester Action), asserting a claim for breach of contract and the implied covenant of good faith, and seeking damages of at least
$800 million
, based on allegations that the Company had breached an agreement (the Casino Development Agreement), dated June 18, 2010. The Company moved to dismiss the complaint in the Westchester Action based on a decision issued by the Sullivan County Supreme Court (
one
of the
two
closed cases discussed above) on June 30, 2014, as affirmed by the Appellate Division, Third Department (the Sullivan Action). On January 26, 2016, the Westchester County Supreme Court denied the Company's motion to dismiss but ordered the Cappelli Group to amend its pleading and remove all claims and allegations previously determined by the Sullivan Action. On February 18, 2016, the Cappelli Group filed an amended
110
EPR PROPERTIES
Notes to Consolidated Financial Statements
December 31, 2016, 2015 and 2014
complaint asserting a single cause of action for breach of the covenant of good faith and fair dealing based upon allegations the Company had interfered with plaintiffs’ ability to obtain financing which complied with the Casino Development Agreement. On March 23, 2016, the Company filed a motion to dismiss the Cappelli Group’s revised amended complaint. On January 5, 2017, the Westchester County Supreme Court denied the Company’s second motion to dismiss. Discovery is ongoing.
The Company has not determined that losses related to the remaining Westchester Action are probable. In light of the inherent difficulty of predicting the outcome of litigation generally, the Company does not have sufficient information to determine the amount or range of reasonably possible loss with respect to these matters. The Company’s assessments are based on estimates and assumptions that have been deemed reasonable by management, but that may prove to be incomplete or inaccurate, and unanticipated events and circumstances may occur that might cause the Company to change those estimates and assumptions. The Company intends to vigorously defend the claims asserted against the Company and certain of its subsidiaries by the Cappelli Group and its affiliates, for which the Company believes it has meritorious defenses, but there can be no assurances as to the outcome of the claims and related litigation.
On November 2, 2016, the Company and Ski Resort Holdings LLC (SRH), an entity owned by funds affiliated with Och-Ziff Real Estate, entered into a Purchase and Sale Agreement with CNL Lifestyle Properties, Inc. (CNL), CLP Partners, LP, CNL's operating partnership, and certain CNL subsidiaries. The agreement provides for the Company's acquisition of the Northstar California Ski Resort,
15
attraction properties (waterparks and amusement parks) and
five
small family entertainment centers for aggregate consideration valued at approximately
$456.0 million
. Additionally, the Company has agreed to provide approximately
$244.0 million
of
five
-year secured debt financing to SRH for the purchase of
14
CNL ski properties valued at approximately
$374.0 million
. This debt financing will be secured by mortgages on all of the assets being acquired by SRH.
The Company's aggregate investment in this transaction is projected to be valued at approximately
$700.0 million
and is expected to be funded with approximately
$647.0 million
of the Company's common shares and
$53.0 million
of cash before pro-rations, transaction costs and closing adjustments, a portion of which is expected to be included in the secured debt financing to SRH. The Company expects to borrow an estimated
$62.0 million
(the estimated
$53.0 million
cash purchase price plus an estimated
$9.0 million
in transaction costs) under its unsecured revolving credit facility at closing. Additionally, the Company has also agreed to fund
65%
of pre-approved, future property improvements with such advances capped at
$52.0 million
. All SRH financing will bear interest at
8.5%
.
The Company's common share consideration is subject to a two-way collar between
$68.25
and
$82.63
per share. If the Company's volume weighted average share price over the
ten
trading days ending on the second trading day prior to close (the Average EPR Share Price) increases between the signing of the agreement and the closing, CNL will receive fewer shares until the Average EPR Share Price reaches
$82.63
, at which point the number of shares will be fixed at approximately
7.8 million
. Conversely, if the Company's share price decreases between signing and closing, CNL will receive more shares until the Average EPR Share Price reaches
$68.25
, at which point the number of shares will be fixed at approximately
9.5 million
. Post-transaction, CNL will own between approximately
11%
and
13%
of the Company's pro forma common shares outstanding before distributing the shares to the CNL stockholders (based upon the Company's issued and outstanding common shares as of December 31, 2016).
The CNL transaction is subject to customary closing conditions, including the approval of the transaction by stockholders holding a majority of the outstanding shares of common stock of CNL and various third party consents and governmental permits. It is anticipated that this transaction will close in the second quarter of 2017; however, there can be no assurances as to the actual closing or the timing of the closing.
In addition, the Company and SRH, on a joint and several basis, will be required to pay a reverse termination fee of
$60.0 million
plus reimbursement of expenses incurred after June 10, 2016 (up to
$10.0 million
) to CNL if the Purchase and Sale Agreement is terminated because the Company and SRH fail to close the transaction as required under the agreement after the conditions to the obligations to close have been satisfied or waived.
111
EPR PROPERTIES
Notes to Consolidated Financial Statements
December 31, 2016, 2015 and 2014
19. Segment Information
The Company has
four
reportable operating segments: Entertainment, Education, Recreation and Other. The financial information summarized below is presented by reportable operating segment:
|
Balance Sheet Data:
|
|||||||||||||||||||
|
As of December 31, 2016
|
|||||||||||||||||||
|
Entertainment
|
Education
|
Recreation
|
Other
|
Corporate/Unallocated
|
Consolidated
|
||||||||||||||
|
Total Assets
|
$
|
2,168,669
|
|
$
|
1,308,288
|
|
$
|
1,120,498
|
|
$
|
202,394
|
|
$
|
65,173
|
|
$
|
4,865,022
|
|
|
|
As of December 31, 2015
|
|||||||||||||||||||
|
Entertainment
|
Education
|
Recreation
|
Other
|
Corporate/Unallocated
|
Consolidated
|
||||||||||||||
|
Total Assets
|
$
|
2,006,926
|
|
$
|
1,013,930
|
|
$
|
935,266
|
|
$
|
203,757
|
|
$
|
57,391
|
|
$
|
4,217,270
|
|
|
|
Operating Data:
|
|||||||||||||||||||
|
For the Year Ended December 31, 2016
|
|||||||||||||||||||
|
Entertainment
|
Education
|
Recreation
|
Other
|
Corporate/Unallocated
|
Consolidated
|
||||||||||||||
|
Rental revenue
|
$
|
250,659
|
|
$
|
77,768
|
|
$
|
62,527
|
|
$
|
8,635
|
|
$
|
—
|
|
$
|
399,589
|
|
|
|
Tenant reimbursements
|
15,588
|
|
7
|
|
—
|
|
—
|
|
—
|
|
15,595
|
|
|||||||
|
Other income
|
249
|
|
1,648
|
|
4,482
|
|
—
|
|
2,660
|
|
9,039
|
|
|||||||
|
Mortgage and other financing income
|
6,187
|
|
32,539
|
|
30,190
|
|
103
|
|
—
|
|
69,019
|
|
|||||||
|
Total revenue
|
272,683
|
|
111,962
|
|
97,199
|
|
8,738
|
|
2,660
|
|
493,242
|
|
|||||||
|
Property operating expense
|
21,303
|
|
—
|
|
8
|
|
662
|
|
629
|
|
22,602
|
|
|||||||
|
Other expense
|
—
|
|
—
|
|
—
|
|
5
|
|
—
|
|
5
|
|
|||||||
|
Total investment expenses
|
21,303
|
|
—
|
|
8
|
|
667
|
|
629
|
|
22,607
|
|
|||||||
|
Net operating income - before unallocated items
|
251,380
|
|
111,962
|
|
97,191
|
|
8,071
|
|
2,031
|
|
470,635
|
|
|||||||
|
Reconciliation to Consolidated Statements of Income:
|
|||||||||||||||||||
|
General and administrative expense
|
(37,543
|
)
|
|||||||||||||||||
|
Costs associated with loan refinancing or payoff
|
(905
|
)
|
|||||||||||||||||
|
Interest expense, net
|
(97,144
|
)
|
|||||||||||||||||
|
Transaction costs
|
(7,869
|
)
|
|||||||||||||||||
|
Depreciation and amortization
|
(107,573
|
)
|
|||||||||||||||||
|
Equity in income from joint ventures
|
619
|
|
|||||||||||||||||
|
Gain on sale of real estate
|
5,315
|
|
|||||||||||||||||
|
Income tax expense
|
(553
|
)
|
|||||||||||||||||
|
Net income attributable to EPR Properties
|
224,982
|
|
|||||||||||||||||
|
Preferred dividend requirements
|
(23,806
|
)
|
|||||||||||||||||
|
Net income available to common shareholders of EPR Properties
|
$
|
201,176
|
|
||||||||||||||||
112
EPR PROPERTIES
Notes to Consolidated Financial Statements
December 31, 2016, 2015 and 2014
|
For the Year Ended December 31, 2015
|
|||||||||||||||||||
|
Entertainment
|
Education
|
Recreation
|
Other
|
Corporate/Unallocated
|
Consolidated
|
||||||||||||||
|
Rental revenue
|
$
|
238,896
|
|
$
|
51,439
|
|
$
|
40,551
|
|
$
|
—
|
|
$
|
—
|
|
$
|
330,886
|
|
|
|
Tenant reimbursements
|
16,343
|
|
—
|
|
—
|
|
(23
|
)
|
—
|
|
16,320
|
|
|||||||
|
Other income
|
512
|
|
—
|
|
—
|
|
119
|
|
2,998
|
|
3,629
|
|
|||||||
|
Mortgage and other financing income
|
7,127
|
|
30,622
|
|
32,080
|
|
353
|
|
—
|
|
70,182
|
|
|||||||
|
Total revenue
|
262,878
|
|
82,061
|
|
72,631
|
|
449
|
|
2,998
|
|
421,017
|
|
|||||||
|
Property operating expense
|
23,120
|
|
—
|
|
—
|
|
313
|
|
—
|
|
23,433
|
|
|||||||
|
Other expense
|
—
|
|
—
|
|
—
|
|
648
|
|
—
|
|
648
|
|
|||||||
|
Total investment expenses
|
23,120
|
|
—
|
|
—
|
|
961
|
|
—
|
|
24,081
|
|
|||||||
|
Net operating income - before unallocated items
|
239,758
|
|
82,061
|
|
72,631
|
|
(512
|
)
|
2,998
|
|
396,936
|
|
|||||||
|
Reconciliation to Consolidated Statements of Income:
|
|||||||||||||||||||
|
General and administrative expense
|
(31,021
|
)
|
|||||||||||||||||
|
Retirement severance expense
|
(18,578
|
)
|
|||||||||||||||||
|
Costs associated with loan refinancing or payoff
|
(270
|
)
|
|||||||||||||||||
|
Interest expense, net
|
(79,915
|
)
|
|||||||||||||||||
|
Transaction costs
|
(7,518
|
)
|
|||||||||||||||||
|
Depreciation and amortization
|
(89,617
|
)
|
|||||||||||||||||
|
Equity in income from joint ventures
|
969
|
|
|||||||||||||||||
|
Gain on sale of real estate
|
23,829
|
|
|||||||||||||||||
|
Income tax expense
|
(482
|
)
|
|||||||||||||||||
|
Discontinued operations:
|
|||||||||||||||||||
|
Income from discontinued operations
|
199
|
|
|||||||||||||||||
|
Net income attributable to EPR Properties
|
194,532
|
|
|||||||||||||||||
|
Preferred dividend requirements
|
(23,806
|
)
|
|||||||||||||||||
|
Net income available to common shareholders of EPR Properties
|
$
|
170,726
|
|
||||||||||||||||
113
EPR PROPERTIES
Notes to Consolidated Financial Statements
December 31, 2016, 2015 and 2014
|
For the Year Ended December 31, 2014
|
|||||||||||||||||||
|
Entertainment
|
Education
|
Recreation
|
Other
|
Corporate/Unallocated
|
Consolidated
|
||||||||||||||
|
Rental revenue
|
$
|
237,429
|
|
$
|
27,874
|
|
$
|
20,368
|
|
$
|
1,002
|
|
$
|
—
|
|
$
|
286,673
|
|
|
|
Tenant reimbursements
|
17,640
|
|
—
|
|
—
|
|
23
|
|
—
|
|
17,663
|
|
|||||||
|
Other income (loss)
|
(6
|
)
|
—
|
|
—
|
|
315
|
|
700
|
|
1,009
|
|
|||||||
|
Mortgage and other financing income
|
7,056
|
|
31,488
|
|
40,775
|
|
387
|
|
—
|
|
79,706
|
|
|||||||
|
Total revenue
|
262,119
|
|
59,362
|
|
61,143
|
|
1,727
|
|
700
|
|
385,051
|
|
|||||||
|
Property operating expense
|
24,143
|
|
—
|
|
—
|
|
754
|
|
—
|
|
24,897
|
|
|||||||
|
Other expense
|
—
|
|
—
|
|
—
|
|
771
|
|
—
|
|
771
|
|
|||||||
|
Total investment expenses
|
24,143
|
|
—
|
|
—
|
|
1,525
|
|
—
|
|
25,668
|
|
|||||||
|
Net operating income - before unallocated items
|
237,976
|
|
59,362
|
|
61,143
|
|
202
|
|
700
|
|
359,383
|
|
|||||||
|
Reconciliation to Consolidated Statements of Income:
|
|||||||||||||||||||
|
General and administrative expense
|
(27,566
|
)
|
|||||||||||||||||
|
Costs associated with loan refinancing or payoff
|
(301
|
)
|
|||||||||||||||||
|
Interest expense, net
|
(81,270
|
)
|
|||||||||||||||||
|
Transaction costs
|
(2,452
|
)
|
|||||||||||||||||
|
Provision for loan losses
|
(3,777
|
)
|
|||||||||||||||||
|
Depreciation and amortization
|
(66,739
|
)
|
|||||||||||||||||
|
Equity in income from joint ventures
|
1,273
|
|
|||||||||||||||||
|
Gain on sale of real estate
|
1,209
|
|
|||||||||||||||||
|
Gain on sale of investment in a direct financing lease
|
220
|
|
|||||||||||||||||
|
Income tax expense
|
(4,228
|
)
|
|||||||||||||||||
|
Discontinued operations:
|
|||||||||||||||||||
|
Income from discontinued operations
|
505
|
|
|||||||||||||||||
|
Transaction (costs) benefit
|
3,376
|
|
|||||||||||||||||
|
Net income attributable to EPR Properties
|
179,633
|
|
|||||||||||||||||
|
Preferred dividend requirements
|
(23,807
|
)
|
|||||||||||||||||
|
Net income available to common shareholders of EPR Properties
|
$
|
155,826
|
|
||||||||||||||||
114
EPR PROPERTIES
Notes to Consolidated Financial Statements
December 31, 2016, 2015 and 2014
20. Condensed Consolidating Financial Statements
A portion of our subsidiaries have guaranteed the Company’s indebtedness under the Company's unsecured credit facilities and existing senior unsecured notes. The guarantees are joint and several, full and unconditional and subject to customary release provisions. The following summarizes the Company’s condensed consolidating information as of
December 31, 2016 and 2015
and for the years ended
December 31, 2016, 2015 and 2014
(in thousands):
|
Condensed Consolidating Balance Sheet
As of December 31, 2016
|
|||||||||||||||||||
|
EPR
Properties
(Issuer)
|
Wholly Owned
Subsidiary
Guarantors
|
Non-
Guarantor
Subsidiaries
|
Consolidated
Elimination
|
Consolidated
|
|||||||||||||||
|
Assets
|
|||||||||||||||||||
|
Rental properties, net
|
$
|
—
|
|
$
|
3,164,622
|
|
$
|
431,140
|
|
$
|
—
|
|
$
|
3,595,762
|
|
||||
|
Land held for development
|
—
|
|
1,258
|
|
21,272
|
|
—
|
|
22,530
|
|
|||||||||
|
Property under development
|
1,010
|
|
247,239
|
|
48,861
|
|
—
|
|
297,110
|
|
|||||||||
|
Mortgage notes and related accrued interest receivable, net
|
—
|
|
612,141
|
|
1,837
|
|
—
|
|
613,978
|
|
|||||||||
|
Investment in a direct financing lease, net
|
—
|
|
102,698
|
|
—
|
|
—
|
|
102,698
|
|
|||||||||
|
Investment in joint ventures
|
—
|
|
—
|
|
5,972
|
|
—
|
|
5,972
|
|
|||||||||
|
Cash and cash equivalents
|
16,586
|
|
1,157
|
|
1,592
|
|
—
|
|
19,335
|
|
|||||||||
|
Restricted cash
|
365
|
|
8,352
|
|
1,027
|
|
—
|
|
9,744
|
|
|||||||||
|
Accounts receivable, net
|
556
|
|
89,145
|
|
9,238
|
|
—
|
|
98,939
|
|
|||||||||
|
Intercompany notes receivable
|
—
|
|
179,589
|
|
—
|
|
(179,589
|
)
|
—
|
|
|||||||||
|
Investments in subsidiaries
|
4,521,095
|
|
—
|
|
—
|
|
(4,521,095
|
)
|
—
|
|
|||||||||
|
Other assets
|
21,768
|
|
23,068
|
|
54,118
|
|
—
|
|
98,954
|
|
|||||||||
|
Total assets
|
$
|
4,561,380
|
|
$
|
4,429,269
|
|
$
|
575,057
|
|
$
|
(4,700,684
|
)
|
$
|
4,865,022
|
|
||||
|
Liabilities and Equity
|
|||||||||||||||||||
|
Liabilities:
|
|||||||||||||||||||
|
Accounts payable and accrued liabilities
|
$
|
63,431
|
|
$
|
52,061
|
|
$
|
4,266
|
|
$
|
—
|
|
$
|
119,758
|
|
||||
|
Dividends payable
|
26,318
|
|
—
|
|
—
|
|
—
|
|
26,318
|
|
|||||||||
|
Unearned rents and interest
|
—
|
|
46,647
|
|
773
|
|
—
|
|
47,420
|
|
|||||||||
|
Intercompany notes payable
|
—
|
|
—
|
|
179,589
|
|
(179,589
|
)
|
—
|
|
|||||||||
|
Debt
|
2,285,730
|
|
—
|
|
199,895
|
|
—
|
|
2,485,625
|
|
|||||||||
|
Total liabilities
|
2,375,479
|
|
98,708
|
|
384,523
|
|
(179,589
|
)
|
2,679,121
|
|
|||||||||
|
Equity
|
2,185,901
|
|
4,330,561
|
|
190,534
|
|
(4,521,095
|
)
|
2,185,901
|
|
|||||||||
|
Total liabilities and equity
|
$
|
4,561,380
|
|
$
|
4,429,269
|
|
$
|
575,057
|
|
$
|
(4,700,684
|
)
|
$
|
4,865,022
|
|
||||
115
EPR PROPERTIES
Notes to Consolidated Financial Statements
December 31, 2016, 2015 and 2014
|
Condensed Consolidating Balance Sheet
As of December 31, 2015
|
|||||||||||||||||||
|
EPR
Properties
(Issuer)
|
Wholly Owned
Subsidiary
Guarantors
|
Non-
Guarantor
Subsidiaries
|
Consolidated
Elimination
|
Consolidated
|
|||||||||||||||
|
Assets
|
|||||||||||||||||||
|
Rental properties, net
|
$
|
—
|
|
$
|
2,590,158
|
|
$
|
435,041
|
|
$
|
—
|
|
$
|
3,025,199
|
|
||||
|
Land held for development
|
—
|
|
1,258
|
|
22,352
|
|
—
|
|
23,610
|
|
|||||||||
|
Property under development
|
—
|
|
324,360
|
|
54,560
|
|
—
|
|
378,920
|
|
|||||||||
|
Mortgage notes and related accrued interest receivable, net
|
—
|
|
400,935
|
|
22,845
|
|
—
|
|
423,780
|
|
|||||||||
|
Investment in a direct financing lease, net
|
—
|
|
190,880
|
|
—
|
|
—
|
|
190,880
|
|
|||||||||
|
Investment in joint ventures
|
—
|
|
—
|
|
6,168
|
|
—
|
|
6,168
|
|
|||||||||
|
Cash and cash equivalents
|
1,089
|
|
1,289
|
|
1,905
|
|
—
|
|
4,283
|
|
|||||||||
|
Restricted cash
|
475
|
|
9,059
|
|
1,044
|
|
—
|
|
10,578
|
|
|||||||||
|
Accounts receivable, net
|
285
|
|
49,237
|
|
9,579
|
|
—
|
|
59,101
|
|
|||||||||
|
Intercompany notes receivable
|
—
|
|
177,526
|
|
—
|
|
(177,526
|
)
|
—
|
|
|||||||||
|
Investments in subsidiaries
|
3,825,897
|
|
—
|
|
—
|
|
(3,825,897
|
)
|
—
|
|
|||||||||
|
Other assets
|
23,053
|
|
10,589
|
|
61,109
|
|
—
|
|
94,751
|
|
|||||||||
|
Total assets
|
$
|
3,850,799
|
|
$
|
3,755,291
|
|
$
|
614,603
|
|
$
|
(4,003,423
|
)
|
$
|
4,217,270
|
|
||||
|
Liabilities and Equity
|
|||||||||||||||||||
|
Liabilities:
|
|||||||||||||||||||
|
Accounts payable and accrued liabilities
|
$
|
49,671
|
|
$
|
39,228
|
|
$
|
3,279
|
|
$
|
—
|
|
$
|
92,178
|
|
||||
|
Dividends payable
|
24,352
|
|
—
|
|
—
|
|
—
|
|
24,352
|
|
|||||||||
|
Unearned rents and interest
|
—
|
|
44,012
|
|
940
|
|
—
|
|
44,952
|
|
|||||||||
|
Intercompany notes payable
|
—
|
|
—
|
|
177,526
|
|
(177,526
|
)
|
—
|
|
|||||||||
|
Debt
|
1,702,908
|
|
63,682
|
|
215,330
|
|
—
|
|
1,981,920
|
|
|||||||||
|
Total liabilities
|
1,776,931
|
|
146,922
|
|
397,075
|
|
(177,526
|
)
|
2,143,402
|
|
|||||||||
|
Equity
|
$
|
2,073,868
|
|
$
|
3,608,369
|
|
$
|
217,528
|
|
$
|
(3,825,897
|
)
|
$
|
2,073,868
|
|
||||
|
Total liabilities and equity
|
$
|
3,850,799
|
|
$
|
3,755,291
|
|
$
|
614,603
|
|
$
|
(4,003,423
|
)
|
$
|
4,217,270
|
|
||||
116
EPR PROPERTIES
Notes to Consolidated Financial Statements
December 31, 2016, 2015 and 2014
|
Condensed Consolidating Statement of Income
For the Year Ended December 31, 2016
|
|||||||||||||||||||
|
EPR
Properties
(Issuer)
|
Wholly Owned
Subsidiary
Guarantors
|
Non-
Guarantors
Subsidiaries
|
Consolidated
Elimination
|
Consolidated
|
|||||||||||||||
|
Rental revenue
|
$
|
—
|
|
$
|
345,945
|
|
$
|
53,644
|
|
$
|
—
|
|
$
|
399,589
|
|
||||
|
Tenant reimbursements
|
—
|
|
5,455
|
|
10,140
|
|
—
|
|
15,595
|
|
|||||||||
|
Other income
|
—
|
|
6,168
|
|
2,871
|
|
—
|
|
9,039
|
|
|||||||||
|
Mortgage and other financing income
|
942
|
|
64,231
|
|
3,846
|
|
—
|
|
69,019
|
|
|||||||||
|
Intercompany fee income
|
2,684
|
|
—
|
|
—
|
|
(2,684
|
)
|
—
|
|
|||||||||
|
Interest income on intercompany notes receivable
|
—
|
|
9,700
|
|
—
|
|
(9,700
|
)
|
—
|
|
|||||||||
|
Total revenue
|
3,626
|
|
431,499
|
|
70,501
|
|
(12,384
|
)
|
493,242
|
|
|||||||||
|
Equity in subsidiaries’ earnings
|
328,328
|
|
—
|
|
—
|
|
(328,328
|
)
|
—
|
|
|||||||||
|
Property operating expense
|
—
|
|
10,905
|
|
11,697
|
|
—
|
|
22,602
|
|
|||||||||
|
Intercompany fee expense
|
—
|
|
—
|
|
2,684
|
|
(2,684
|
)
|
—
|
|
|||||||||
|
Other expense
|
—
|
|
—
|
|
5
|
|
—
|
|
5
|
|
|||||||||
|
General and administrative expense
|
—
|
|
32,250
|
|
5,293
|
|
—
|
|
37,543
|
|
|||||||||
|
Costs associated with loan refinancing or payoff
|
—
|
|
353
|
|
552
|
|
—
|
|
905
|
|
|||||||||
|
Interest expense, net
|
96,239
|
|
(8,189
|
)
|
9,094
|
|
—
|
|
97,144
|
|
|||||||||
|
Interest expense on intercompany notes payable
|
—
|
|
—
|
|
9,700
|
|
(9,700
|
)
|
—
|
|
|||||||||
|
Transaction costs
|
7,766
|
|
—
|
|
103
|
|
—
|
|
7,869
|
|
|||||||||
|
Depreciation and amortization
|
1,504
|
|
92,310
|
|
13,759
|
|
—
|
|
107,573
|
|
|||||||||
|
Income before equity in income from joint ventures and other items
|
226,445
|
|
303,870
|
|
17,614
|
|
(328,328
|
)
|
219,601
|
|
|||||||||
|
Equity in income from joint ventures
|
—
|
|
—
|
|
619
|
|
—
|
|
619
|
|
|||||||||
|
Gain on sale of real estate
|
—
|
|
5,315
|
|
—
|
|
—
|
|
5,315
|
|
|||||||||
|
Income before income taxes
|
226,445
|
|
309,185
|
|
18,233
|
|
(328,328
|
)
|
225,535
|
|
|||||||||
|
Income tax benefit (expense)
|
(1,463
|
)
|
—
|
|
910
|
|
—
|
|
(553
|
)
|
|||||||||
|
Net income attributable to EPR Properties
|
224,982
|
|
309,185
|
|
19,143
|
|
(328,328
|
)
|
224,982
|
|
|||||||||
|
Preferred dividend requirements
|
(23,806
|
)
|
—
|
|
—
|
|
—
|
|
(23,806
|
)
|
|||||||||
|
Net income available to common shareholders of EPR Properties
|
$
|
201,176
|
|
$
|
309,185
|
|
$
|
19,143
|
|
$
|
(328,328
|
)
|
$
|
201,176
|
|
||||
|
Comprehensive income attributable to EPR Properties
|
$
|
227,094
|
|
$
|
309,185
|
|
$
|
18,063
|
|
$
|
(327,248
|
)
|
$
|
227,094
|
|
||||
117
EPR PROPERTIES
Notes to Consolidated Financial Statements
December 31, 2016, 2015 and 2014
|
Condensed Consolidating Statement of Income
For the Year Ended December 31, 2015
|
|||||||||||||||||||
|
EPR
Properties
(Issuer)
|
Wholly Owned
Subsidiary
Guarantors
|
Non-
Guarantor
Subsidiaries
|
Consolidated
Elimination
|
Consolidated
|
|||||||||||||||
|
Rental revenue
|
$
|
—
|
|
$
|
275,105
|
|
$
|
55,781
|
|
$
|
—
|
|
$
|
330,886
|
|
||||
|
Tenant reimbursements
|
—
|
|
5,243
|
|
11,077
|
|
—
|
|
16,320
|
|
|||||||||
|
Other income
|
—
|
|
3
|
|
3,626
|
|
—
|
|
3,629
|
|
|||||||||
|
Mortgage and other financing income
|
848
|
|
61,900
|
|
7,434
|
|
—
|
|
70,182
|
|
|||||||||
|
Intercompany fee income
|
2,717
|
|
—
|
|
—
|
|
(2,717
|
)
|
—
|
|
|||||||||
|
Interest income on intercompany notes receivable
|
111
|
|
9,787
|
|
—
|
|
(9,898
|
)
|
—
|
|
|||||||||
|
Total revenue
|
3,676
|
|
352,038
|
|
77,918
|
|
(12,615
|
)
|
421,017
|
|
|||||||||
|
Equity in subsidiaries’ earnings
|
298,657
|
|
—
|
|
—
|
|
(298,657
|
)
|
—
|
|
|||||||||
|
Property operating expense
|
—
|
|
11,280
|
|
12,153
|
|
—
|
|
23,433
|
|
|||||||||
|
Intercompany fee expense
|
—
|
|
—
|
|
2,717
|
|
(2,717
|
)
|
—
|
|
|||||||||
|
Other expense
|
—
|
|
—
|
|
648
|
|
—
|
|
648
|
|
|||||||||
|
General and administrative expense
|
—
|
|
25,315
|
|
5,706
|
|
—
|
|
31,021
|
|
|||||||||
|
Retirement severance expense
|
18,578
|
|
—
|
|
—
|
|
—
|
|
18,578
|
|
|||||||||
|
Costs associated with loan refinancing or payoff
|
243
|
|
27
|
|
—
|
|
—
|
|
270
|
|
|||||||||
|
Interest expense, net
|
78,217
|
|
(8,115
|
)
|
9,813
|
|
—
|
|
79,915
|
|
|||||||||
|
Interest expense on intercompany notes payable
|
—
|
|
—
|
|
9,898
|
|
(9,898
|
)
|
—
|
|
|||||||||
|
Transaction costs
|
7,182
|
|
—
|
|
336
|
|
—
|
|
7,518
|
|
|||||||||
|
Depreciation and amortization
|
1,629
|
|
74,430
|
|
13,558
|
|
—
|
|
89,617
|
|
|||||||||
|
Income before equity in income from joint ventures and other items
|
196,484
|
|
249,101
|
|
23,089
|
|
(298,657
|
)
|
170,017
|
|
|||||||||
|
Equity in income from joint ventures
|
—
|
|
—
|
|
969
|
|
—
|
|
969
|
|
|||||||||
|
Gain on sale of real estate
|
—
|
|
23,653
|
|
176
|
|
—
|
|
23,829
|
|
|||||||||
|
Income before income taxes
|
196,484
|
|
272,754
|
|
24,234
|
|
(298,657
|
)
|
194,815
|
|
|||||||||
|
Income tax benefit (expense)
|
(1,952
|
)
|
—
|
|
1,470
|
|
—
|
|
(482
|
)
|
|||||||||
|
Income from continuing operations
|
194,532
|
|
272,754
|
|
25,704
|
|
(298,657
|
)
|
194,333
|
|
|||||||||
|
Discontinued operations:
|
|||||||||||||||||||
|
Income from discontinued operations
|
—
|
|
199
|
|
—
|
|
—
|
|
199
|
|
|||||||||
|
Net income attributable to EPR Properties
|
194,532
|
|
272,953
|
|
25,704
|
|
(298,657
|
)
|
194,532
|
|
|||||||||
|
Preferred dividend requirements
|
(23,806
|
)
|
—
|
|
—
|
|
—
|
|
(23,806
|
)
|
|||||||||
|
Net income available to common shareholders of EPR Properties
|
$
|
170,726
|
|
$
|
272,953
|
|
$
|
25,704
|
|
$
|
(298,657
|
)
|
$
|
170,726
|
|
||||
|
Comprehensive income attributable to EPR Properties
|
$
|
187,588
|
|
$
|
272,730
|
|
$
|
19,559
|
|
$
|
(292,289
|
)
|
$
|
187,588
|
|
||||
118
EPR PROPERTIES
Notes to Consolidated Financial Statements
December 31, 2016, 2015 and 2014
|
Condensed Consolidating Statement of Income
For the Year Ended December 31, 2014
|
|||||||||||||||||||
|
EPR
Properties
(Issuer)
|
Wholly Owned
Subsidiary
Guarantors
|
Non-
Guarantor
Subsidiaries
|
Consolidated
Elimination
|
Consolidated
|
|||||||||||||||
|
Rental revenue
|
$
|
—
|
|
$
|
228,847
|
|
$
|
57,826
|
|
$
|
—
|
|
$
|
286,673
|
|
||||
|
Tenant reimbursements
|
—
|
|
5,103
|
|
12,560
|
|
—
|
|
17,663
|
|
|||||||||
|
Other income
|
—
|
|
1
|
|
1,008
|
|
—
|
|
1,009
|
|
|||||||||
|
Mortgage and other financing income
|
765
|
|
71,535
|
|
7,406
|
|
—
|
|
79,706
|
|
|||||||||
|
Intercompany fee income
|
3,124
|
|
—
|
|
—
|
|
(3,124
|
)
|
—
|
|
|||||||||
|
Interest income on intercompany notes receivable
|
—
|
|
—
|
|
23,509
|
|
(23,509
|
)
|
—
|
|
|||||||||
|
Total revenue
|
3,889
|
|
305,486
|
|
102,309
|
|
(26,633
|
)
|
385,051
|
|
|||||||||
|
Equity in subsidiaries’ earnings
|
241,921
|
|
—
|
|
—
|
|
(241,921
|
)
|
—
|
|
|||||||||
|
Property operating expense
|
—
|
|
11,422
|
|
13,475
|
|
—
|
|
24,897
|
|
|||||||||
|
Intercompany fee expense
|
—
|
|
—
|
|
3,124
|
|
(3,124
|
)
|
—
|
|
|||||||||
|
Other expense
|
—
|
|
—
|
|
771
|
|
—
|
|
771
|
|
|||||||||
|
General and administrative expense
|
—
|
|
20,545
|
|
7,021
|
|
—
|
|
27,566
|
|
|||||||||
|
Costs associated with loan refinancing or payoff
|
—
|
|
285
|
|
16
|
|
—
|
|
301
|
|
|||||||||
|
Interest expense, net
|
63,056
|
|
9,132
|
|
9,082
|
|
—
|
|
81,270
|
|
|||||||||
|
Interest expense on intercompany notes payable
|
—
|
|
—
|
|
23,509
|
|
(23,509
|
)
|
—
|
|
|||||||||
|
Transaction costs
|
1,319
|
|
54
|
|
1,079
|
|
—
|
|
2,452
|
|
|||||||||
|
Provision for loan losses
|
—
|
|
—
|
|
3,777
|
|
—
|
|
3,777
|
|
|||||||||
|
Depreciation and amortization
|
1,224
|
|
51,271
|
|
14,244
|
|
—
|
|
66,739
|
|
|||||||||
|
Income before equity in income from joint ventures and other items
|
180,211
|
|
212,777
|
|
26,211
|
|
(241,921
|
)
|
177,278
|
|
|||||||||
|
Equity in income from joint ventures
|
—
|
|
—
|
|
1,273
|
|
—
|
|
1,273
|
|
|||||||||
|
Gain on sale of real estate
|
—
|
|
—
|
|
1,209
|
|
—
|
|
1,209
|
|
|||||||||
|
Gain on sale of investment in a direct financing lease
|
—
|
|
220
|
|
—
|
|
—
|
|
220
|
|
|||||||||
|
Income before income taxes
|
$
|
180,211
|
|
$
|
212,997
|
|
$
|
28,693
|
|
$
|
(241,921
|
)
|
$
|
179,980
|
|
||||
|
Income tax expense
|
(578
|
)
|
—
|
|
(3,650
|
)
|
—
|
|
(4,228
|
)
|
|||||||||
|
Income from continuing operations
|
179,633
|
|
212,997
|
|
25,043
|
|
(241,921
|
)
|
175,752
|
|
|||||||||
|
Discontinued operations:
|
|||||||||||||||||||
|
Income from discontinued operations
|
—
|
|
487
|
|
18
|
|
—
|
|
505
|
|
|||||||||
|
Transaction (costs) benefit
|
—
|
|
3,376
|
|
—
|
|
—
|
|
3,376
|
|
|||||||||
|
Net income attributable to EPR Properties
|
179,633
|
|
216,860
|
|
25,061
|
|
(241,921
|
)
|
179,633
|
|
|||||||||
|
Preferred dividend requirements
|
(23,807
|
)
|
—
|
|
—
|
|
—
|
|
(23,807
|
)
|
|||||||||
|
Net income available to common shareholders of EPR Properties
|
$
|
155,826
|
|
$
|
216,860
|
|
$
|
25,061
|
|
$
|
(241,921
|
)
|
$
|
155,826
|
|
||||
|
Comprehensive income attributable to EPR Properties
|
$
|
175,006
|
|
$
|
217,000
|
|
$
|
20,919
|
|
$
|
(237,919
|
)
|
$
|
175,006
|
|
||||
119
EPR PROPERTIES
Notes to Consolidated Financial Statements
December 31, 2016, 2015 and 2014
|
Condensed Consolidating Statement of Cash Flows
For the Year Ended December 31, 2016
|
|||||||||||||||
|
EPR
Properties
(Issuer)
|
Wholly Owned
Subsidiary
Guarantors
|
Non-Guarantor
Subsidiaries
|
Consolidated
|
||||||||||||
|
Intercompany fee income (expense)
|
$
|
2,684
|
|
$
|
—
|
|
$
|
(2,684
|
)
|
$
|
—
|
|
|||
|
Interest income (expense) on intercompany receivable/payable
|
—
|
|
9,700
|
|
(9,700
|
)
|
—
|
|
|||||||
|
Net cash (used) provided by other operating activities
|
(79,945
|
)
|
338,267
|
|
47,880
|
|
306,202
|
|
|||||||
|
Net cash (used) provided by operating activities
|
(77,261
|
)
|
347,967
|
|
35,496
|
|
306,202
|
|
|||||||
|
Investing activities:
|
|
||||||||||||||
|
Acquisition of and investments in rental properties and other assets
|
(357
|
)
|
(216,245
|
)
|
(2,567
|
)
|
(219,169
|
)
|
|||||||
|
Proceeds from sale of real estate
|
—
|
|
22,383
|
|
1,477
|
|
23,860
|
|
|||||||
|
Investment in mortgage notes receivable
|
—
|
|
(190,922
|
)
|
(1,617
|
)
|
(192,539
|
)
|
|||||||
|
Proceeds from mortgage note receivable paydown
|
—
|
|
50,252
|
|
21,820
|
|
72,072
|
|
|||||||
|
Investment in promissory notes receivable
|
—
|
|
(1,546
|
)
|
—
|
|
(1,546
|
)
|
|||||||
|
Proceeds from sale of infrastructure related to issuance of revenue bonds
|
—
|
|
43,462
|
|
—
|
|
43,462
|
|
|||||||
|
Proceeds from insurance recovery
|
—
|
|
4,209
|
|
401
|
|
4,610
|
|
|||||||
|
Proceeds from sale of investment in a direct financing lease, net
|
—
|
|
20,951
|
|
—
|
|
20,951
|
|
|||||||
|
Additions to property under development
|
(1,010
|
)
|
(399,452
|
)
|
(13,386
|
)
|
(413,848
|
)
|
|||||||
|
Investment in intercompany notes payable
|
—
|
|
(2,063
|
)
|
2,063
|
|
—
|
|
|||||||
|
Advances to subsidiaries, net
|
(356,784
|
)
|
384,599
|
|
(27,815
|
)
|
—
|
|
|||||||
|
Net cash used by investing activities
|
(358,151
|
)
|
(284,372
|
)
|
(19,624
|
)
|
(662,147
|
)
|
|||||||
|
Financing activities:
|
|||||||||||||||
|
Proceeds from long-term debt facilities and senior unsecured notes
|
1,380,000
|
|
—
|
|
—
|
|
1,380,000
|
|
|||||||
|
Principal payments on debt
|
(786,000
|
)
|
(63,727
|
)
|
(15,539
|
)
|
(865,266
|
)
|
|||||||
|
Deferred financing fees paid
|
(14,358
|
)
|
—
|
|
(27
|
)
|
(14,385
|
)
|
|||||||
|
Costs associated with loan refinancing or payoff (cash portion)
|
—
|
|
—
|
|
(482
|
)
|
(482
|
)
|
|||||||
|
Net proceeds from issuance of common shares
|
142,628
|
|
—
|
|
—
|
|
142,628
|
|
|||||||
|
Impact of stock option exercises, net
|
(1,488
|
)
|
—
|
|
—
|
|
(1,488
|
)
|
|||||||
|
Purchase of common shares for treasury for vesting
|
(4,211
|
)
|
—
|
|
—
|
|
(4,211
|
)
|
|||||||
|
Dividends paid to shareholders
|
(265,662
|
)
|
—
|
|
—
|
|
(265,662
|
)
|
|||||||
|
Net cash provided (used) by financing activities
|
450,909
|
|
(63,727
|
)
|
(16,048
|
)
|
371,134
|
|
|||||||
|
Effect of exchange rate changes on cash
|
—
|
|
—
|
|
(137
|
)
|
(137
|
)
|
|||||||
|
Net increase (decrease) in cash and cash equivalents
|
15,497
|
|
(132
|
)
|
(313
|
)
|
15,052
|
|
|||||||
|
Cash and cash equivalents at beginning of the period
|
1,089
|
|
1,289
|
|
1,905
|
|
4,283
|
|
|||||||
|
Cash and cash equivalents at end of the period
|
$
|
16,586
|
|
$
|
1,157
|
|
$
|
1,592
|
|
$
|
19,335
|
|
|||
120
EPR PROPERTIES
Notes to Consolidated Financial Statements
December 31, 2016, 2015 and 2014
|
Condensed Consolidating Statement of Cash Flows
For the Year Ended December 31, 2015
|
|||||||||||||||
|
EPR
Properties
(Issuer)
|
Wholly Owned
Subsidiary
Guarantors
|
Non-Guarantor
Subsidiaries
|
Consolidated
|
||||||||||||
|
Intercompany fee income (expense)
|
$
|
2,717
|
|
$
|
—
|
|
$
|
(2,717
|
)
|
$
|
—
|
|
|||
|
Interest income (expense) on intercompany receivable/payable
|
111
|
|
9,787
|
|
(9,898
|
)
|
—
|
|
|||||||
|
Net cash (used) provided by other operating activities
|
(91,731
|
)
|
324,760
|
|
44,923
|
|
277,952
|
|
|||||||
|
Net cash (used) provided by operating activities of continuing operations
|
(88,903
|
)
|
334,547
|
|
32,308
|
|
277,952
|
|
|||||||
|
Net cash provided by operating activities of discontinued operations
|
—
|
|
508
|
|
—
|
|
508
|
|
|||||||
|
Net cash (used) provided by operating activities
|
(88,903
|
)
|
335,055
|
|
32,308
|
|
278,460
|
|
|||||||
|
Investing activities:
|
|
||||||||||||||
|
Acquisition of rental properties and other assets
|
(618
|
)
|
(178,964
|
)
|
(238
|
)
|
(179,820
|
)
|
|||||||
|
Proceeds from sale of real estate
|
—
|
|
45,637
|
|
1,081
|
|
46,718
|
|
|||||||
|
Investment in mortgage note receivable
|
—
|
|
(27,835
|
)
|
(44,863
|
)
|
(72,698
|
)
|
|||||||
|
Proceeds from mortgage note receivable paydown
|
—
|
|
38,456
|
|
2,500
|
|
40,956
|
|
|||||||
|
Proceeds from sale of investment in a direct financing lease, net
|
—
|
|
4,741
|
|
—
|
|
4,741
|
|
|||||||
|
Additions to property under development
|
(112
|
)
|
(404,289
|
)
|
(4,035
|
)
|
(408,436
|
)
|
|||||||
|
Investment in intercompany notes payable
|
—
|
|
(1,769
|
)
|
1,769
|
|
—
|
|
|||||||
|
Advances to subsidiaries, net
|
(406,389
|
)
|
386,222
|
|
20,167
|
|
—
|
|
|||||||
|
Net cash used in investing activities
|
(407,119
|
)
|
(137,801
|
)
|
(23,619
|
)
|
(568,539
|
)
|
|||||||
|
Financing activities:
|
|||||||||||||||
|
Proceeds from debt facilities
|
701,914
|
|
155,000
|
|
—
|
|
856,914
|
|
|||||||
|
Principal payments on debt
|
(142,000
|
)
|
(353,024
|
)
|
(8,290
|
)
|
(503,314
|
)
|
|||||||
|
Deferred financing fees paid
|
(7,038
|
)
|
(9
|
)
|
—
|
|
(7,047
|
)
|
|||||||
|
Net proceeds from issuance of common shares
|
190,158
|
|
—
|
|
—
|
|
190,158
|
|
|||||||
|
Impact of stock option exercises, net
|
(3,394
|
)
|
—
|
|
—
|
|
(3,394
|
)
|
|||||||
|
Purchase of common shares for treasury
|
(8,222
|
)
|
—
|
|
—
|
|
(8,222
|
)
|
|||||||
|
Dividends paid to shareholders
|
(233,073
|
)
|
—
|
|
—
|
|
(233,073
|
)
|
|||||||
|
Net cash provided (used) by financing activities
|
498,345
|
|
(198,033
|
)
|
(8,290
|
)
|
292,022
|
|
|||||||
|
Effect of exchange rate changes on cash
|
—
|
|
(6
|
)
|
(990
|
)
|
(996
|
)
|
|||||||
|
Net increase (decrease) in cash and cash equivalents
|
2,323
|
|
(785
|
)
|
(591
|
)
|
947
|
|
|||||||
|
Cash and cash equivalents at beginning of the period
|
(1,234
|
)
|
2,074
|
|
2,496
|
|
3,336
|
|
|||||||
|
Cash and cash equivalents at end of the period
|
$
|
1,089
|
|
$
|
1,289
|
|
$
|
1,905
|
|
$
|
4,283
|
|
|||
121
EPR PROPERTIES
Notes to Consolidated Financial Statements
December 31, 2016, 2015 and 2014
|
Condensed Consolidating Statement of Cash Flows
For the Year Ended December 31, 2014
|
|||||||||||||||
|
EPR
Properties
(Issuer)
|
Wholly Owned
Subsidiary
Guarantors
|
Non-Guarantor
Subsidiaries
|
Consolidated
|
||||||||||||
|
Intercompany fee income (expense)
|
$
|
3,124
|
|
$
|
—
|
|
$
|
(3,124
|
)
|
$
|
—
|
|
|||
|
Interest income (expense) on intercompany receivable/payable
|
—
|
|
—
|
|
—
|
|
—
|
|
|||||||
|
Net cash (used) provided by other operating activities
|
(60,684
|
)
|
262,860
|
|
47,976
|
|
250,152
|
|
|||||||
|
Net cash (used) provided by operating activities of continuing operations
|
(57,560
|
)
|
262,860
|
|
44,852
|
|
250,152
|
|
|||||||
|
Net cash provided by operating activities of discontinued operations
|
—
|
|
47
|
|
96
|
|
143
|
|
|||||||
|
Net cash (used) provided by operating activities
|
(57,560
|
)
|
262,907
|
|
44,948
|
|
250,295
|
|
|||||||
|
Investing activities:
|
|
||||||||||||||
|
Acquisition of rental properties and other assets
|
(438
|
)
|
(58,918
|
)
|
(25,849
|
)
|
(85,205
|
)
|
|||||||
|
Proceeds from sale of real estate
|
—
|
|
—
|
|
12,055
|
|
12,055
|
|
|||||||
|
Proceeds from settlement of derivative
|
—
|
|
—
|
|
5,725
|
|
5,725
|
|
|||||||
|
Investment in mortgage notes receivable
|
—
|
|
(26,716
|
)
|
(67,161
|
)
|
(93,877
|
)
|
|||||||
|
Proceeds from mortgage note receivable paydown
|
—
|
|
52,834
|
|
23,422
|
|
76,256
|
|
|||||||
|
Investment in promissory notes receivable
|
—
|
|
(721
|
)
|
(3,666
|
)
|
(4,387
|
)
|
|||||||
|
Proceeds from promissory note receivable paydown
|
—
|
|
—
|
|
1,750
|
|
1,750
|
|
|||||||
|
Proceeds from sale of investment in a direct financing lease, net
|
—
|
|
46,092
|
|
—
|
|
46,092
|
|
|||||||
|
Additions to property under development
|
(821
|
)
|
(325,624
|
)
|
(8,190
|
)
|
(334,635
|
)
|
|||||||
|
Advances to subsidiaries, net
|
(16,206
|
)
|
(7,078
|
)
|
23,284
|
|
—
|
|
|||||||
|
Net cash used by investing activities
|
(17,465
|
)
|
(320,131
|
)
|
(38,630
|
)
|
(376,226
|
)
|
|||||||
|
Financing activities:
|
|||||||||||||||
|
Proceeds from debt facilities
|
20,000
|
|
359,000
|
|
—
|
|
379,000
|
|
|||||||
|
Principal payments on debt
|
—
|
|
(303,544
|
)
|
(6,709
|
)
|
(310,253
|
)
|
|||||||
|
Deferred financing fees paid
|
(337
|
)
|
(279
|
)
|
(198
|
)
|
(814
|
)
|
|||||||
|
Costs associated with loan refinancing or payoff (cash portion)
|
—
|
|
(25
|
)
|
—
|
|
(25
|
)
|
|||||||
|
Net proceeds from issuance of common shares
|
264,158
|
|
—
|
|
—
|
|
264,158
|
|
|||||||
|
Impact of stock option exercises, net
|
50
|
|
—
|
|
—
|
|
50
|
|
|||||||
|
Purchase of common shares for treasury
|
(2,892
|
)
|
—
|
|
—
|
|
(2,892
|
)
|
|||||||
|
Dividends paid to shareholders
|
(207,637
|
)
|
—
|
|
—
|
|
(207,637
|
)
|
|||||||
|
Net cash provided (used) by financing activities
|
73,342
|
|
55,152
|
|
(6,907
|
)
|
121,587
|
|
|||||||
|
Effect of exchange rate changes on cash
|
—
|
|
39
|
|
(317
|
)
|
(278
|
)
|
|||||||
|
Net decrease in cash and cash equivalents
|
(1,683
|
)
|
(2,033
|
)
|
(906
|
)
|
(4,622
|
)
|
|||||||
|
Cash and cash equivalents at beginning of the period
|
449
|
|
4,107
|
|
3,402
|
|
7,958
|
|
|||||||
|
Cash and cash equivalents at end of the period
|
$
|
(1,234
|
)
|
$
|
2,074
|
|
$
|
2,496
|
|
$
|
3,336
|
|
|||
122
|
EPR Properties
|
|
Schedule II - Valuation and Qualifying Accounts
|
|
December 31, 2016
|
|
Description
|
Balance at
December 31, 2015
|
Additions
During 2016
|
Deductions
During 2016
|
Balance at
December 31, 2016
|
|||||||||||
|
Reserve for Doubtful Accounts
|
$
|
3,210,000
|
|
$
|
—
|
|
$
|
(2,339,000
|
)
|
$
|
871,000
|
|
|||
|
Allowance for Loan Losses
|
—
|
|
—
|
|
—
|
|
—
|
|
|||||||
See accompanying report of independent registered public accounting firm.
|
EPR Properties
|
|
Schedule II - Valuation and Qualifying Accounts
|
|
December 31, 2015
|
|
Description
|
Balance at
December 31, 2014
|
Additions
During 2015
|
Deductions
During 2015
|
Balance at
December 31, 2015
|
|||||||||||
|
Reserve for Doubtful Accounts
|
$
|
1,554,000
|
|
$
|
1,829,000
|
|
$
|
(173,000
|
)
|
$
|
3,210,000
|
|
|||
|
Allowance for Loan Losses
|
3,777,000
|
|
—
|
|
(3,777,000
|
)
|
—
|
|
|||||||
See accompanying report of independent registered public accounting firm.
|
EPR Properties
|
|
Schedule II - Valuation and Qualifying Accounts
|
|
December 31, 2014
|
|
Description
|
Balance at
December 31, 2013
|
Additions
During 2014
|
Deductions
During 2014
|
Balance at
December 31, 2014
|
|||||||||||
|
Reserve for Doubtful Accounts
|
$
|
2,989,000
|
|
$
|
1,417,000
|
|
$
|
(2,852,000
|
)
|
$
|
1,554,000
|
|
|||
|
Allowance for Loan Losses
|
—
|
|
3,777,000
|
|
—
|
|
3,777,000
|
|
|||||||
See accompanying report of independent registered public accounting firm.
123
|
EPR Properties
Schedule III - Real Estate and Accumulated Depreciation
December 31, 2016
(Dollars in thousands)
|
||||||||||||||||||||||||||||||||||||
|
|
|
Initial cost
|
Additions (Dispositions) (Impairments) Subsequent to acquisition
|
Gross Amount at December 31, 2016
|
|
|
|
|||||||||||||||||||||||||||||
|
Location
|
Debt
|
Land
|
Buildings,
Equipment &
improvements
|
Land
|
Buildings,
Equipment &
Improvements
|
Total
|
Accumulated
depreciation
|
Date
acquired
|
Depreciation
life
|
|||||||||||||||||||||||||||
|
Megaplex Theatres
|
||||||||||||||||||||||||||||||||||||
|
Omaha, NE
|
—
|
|
5,215
|
|
16,700
|
|
59
|
|
5,215
|
|
16,759
|
|
21,974
|
|
(7,960
|
)
|
11/97
|
40 years
|
||||||||||||||||||
|
Sugar Land, TX
|
14,513
|
|
—
|
|
19,100
|
|
67
|
|
—
|
|
19,167
|
|
19,167
|
|
(9,104
|
)
|
11/97
|
40 years
|
||||||||||||||||||
|
San Antonio, TX
|
—
|
|
3,006
|
|
13,662
|
|
5,832
|
|
3,006
|
|
19,494
|
|
22,500
|
|
(6,976
|
)
|
11/97
|
40 years
|
||||||||||||||||||
|
Columbus, OH
|
—
|
|
—
|
|
12,685
|
|
—
|
|
—
|
|
12,685
|
|
12,685
|
|
(5,867
|
)
|
11/97
|
40 years
|
||||||||||||||||||
|
San Diego, CA
|
—
|
|
—
|
|
16,028
|
|
—
|
|
—
|
|
16,028
|
|
16,028
|
|
(7,413
|
)
|
11/97
|
40 years
|
||||||||||||||||||
|
Ontario, CA
|
—
|
|
5,521
|
|
19,449
|
|
—
|
|
5,521
|
|
19,449
|
|
24,970
|
|
(8,995
|
)
|
11/97
|
40 years
|
||||||||||||||||||
|
Houston, TX
|
—
|
|
6,023
|
|
20,037
|
|
—
|
|
6,023
|
|
20,037
|
|
26,060
|
|
(9,267
|
)
|
11/97
|
40 years
|
||||||||||||||||||
|
Creve Coeur, MO
|
—
|
|
4,985
|
|
12,601
|
|
4,075
|
|
4,985
|
|
16,676
|
|
21,661
|
|
(6,399
|
)
|
11/97
|
40 years
|
||||||||||||||||||
|
Leawood, KS
|
12,137
|
|
3,714
|
|
12,086
|
|
4,110
|
|
3,714
|
|
16,196
|
|
19,910
|
|
(5,981
|
)
|
11/97
|
40 years
|
||||||||||||||||||
|
Houston, TX
|
—
|
|
4,304
|
|
21,496
|
|
76
|
|
4,304
|
|
21,572
|
|
25,876
|
|
(10,202
|
)
|
02/98
|
40 years
|
||||||||||||||||||
|
South Barrington, IL
|
—
|
|
6,577
|
|
27,723
|
|
4,618
|
|
6,577
|
|
32,341
|
|
38,918
|
|
(13,212
|
)
|
03/98
|
40 years
|
||||||||||||||||||
|
Mesquite, TX
|
—
|
|
2,912
|
|
20,288
|
|
4,885
|
|
2,912
|
|
25,173
|
|
28,085
|
|
(9,991
|
)
|
04/98
|
40 years
|
||||||||||||||||||
|
Hampton, VA
|
—
|
|
3,822
|
|
24,678
|
|
4,510
|
|
3,822
|
|
29,188
|
|
33,010
|
|
(11,586
|
)
|
06/98
|
40 years
|
||||||||||||||||||
|
Pompano Beach, FL
|
—
|
|
6,771
|
|
9,899
|
|
3,845
|
|
6,771
|
|
13,744
|
|
20,515
|
|
(6,773
|
)
|
08/98
|
40 years
|
||||||||||||||||||
|
Raleigh, NC
|
—
|
|
2,919
|
|
5,559
|
|
3,492
|
|
2,919
|
|
9,051
|
|
11,970
|
|
(2,803
|
)
|
08/98
|
40 years
|
||||||||||||||||||
|
Davie, FL
|
—
|
|
2,000
|
|
13,000
|
|
8,512
|
|
2,000
|
|
21,512
|
|
23,512
|
|
(9,591
|
)
|
11/98
|
40 years
|
||||||||||||||||||
|
Aliso Viejo, CA
|
—
|
|
8,000
|
|
14,000
|
|
—
|
|
8,000
|
|
14,000
|
|
22,000
|
|
(6,300
|
)
|
12/98
|
40 years
|
||||||||||||||||||
|
Boise, ID
|
—
|
|
—
|
|
16,003
|
|
—
|
|
—
|
|
16,003
|
|
16,003
|
|
(7,201
|
)
|
12/98
|
40 years
|
||||||||||||||||||
|
Woodridge, IL
|
—
|
|
9,926
|
|
8,968
|
|
—
|
|
9,926
|
|
8,968
|
|
18,894
|
|
(8,096
|
)
|
06/99
|
40 years
|
||||||||||||||||||
|
Cary, NC
|
—
|
|
3,352
|
|
11,653
|
|
155
|
|
3,352
|
|
11,808
|
|
15,160
|
|
(5,019
|
)
|
12/99
|
40 years
|
||||||||||||||||||
|
Tampa, FL
|
—
|
|
6,000
|
|
12,809
|
|
1,452
|
|
6,000
|
|
14,261
|
|
20,261
|
|
(6,445
|
)
|
06/99
|
40 years
|
||||||||||||||||||
|
San Diego, CA
|
—
|
|
7,500
|
|
17,750
|
|
—
|
|
7,500
|
|
17,750
|
|
25,250
|
|
(7,507
|
)
|
02/00
|
40 years
|
||||||||||||||||||
|
Metairie, LA
|
—
|
|
—
|
|
11,740
|
|
—
|
|
—
|
|
11,740
|
|
11,740
|
|
(4,354
|
)
|
03/02
|
40 years
|
||||||||||||||||||
|
Harahan, LA
|
—
|
|
5,264
|
|
14,820
|
|
—
|
|
5,264
|
|
14,820
|
|
20,084
|
|
(5,496
|
)
|
03/02
|
40 years
|
||||||||||||||||||
|
Hammond, LA
|
—
|
|
2,404
|
|
6,780
|
|
(565
|
)
|
1,839
|
|
6,780
|
|
8,619
|
|
(2,514
|
)
|
03/02
|
40 years
|
||||||||||||||||||
|
Houma, LA
|
—
|
|
2,404
|
|
6,780
|
|
—
|
|
2,404
|
|
6,780
|
|
9,184
|
|
(2,514
|
)
|
03/02
|
40 years
|
||||||||||||||||||
|
Harvey, LA
|
—
|
|
4,378
|
|
12,330
|
|
(112
|
)
|
4,266
|
|
12,330
|
|
16,596
|
|
(4,572
|
)
|
03/02
|
40 years
|
||||||||||||||||||
|
Greenville, SC
|
—
|
|
1,660
|
|
7,570
|
|
206
|
|
1,660
|
|
7,776
|
|
9,436
|
|
(2,801
|
)
|
06/02
|
40 years
|
||||||||||||||||||
|
Sterling Heights, MI
|
—
|
|
5,975
|
|
17,956
|
|
3,400
|
|
5,975
|
|
21,356
|
|
27,331
|
|
(9,320
|
)
|
06/02
|
40 years
|
||||||||||||||||||
|
Olathe, KS
|
—
|
|
4,000
|
|
15,935
|
|
3,014
|
|
4,000
|
|
18,949
|
|
22,949
|
|
(6,661
|
)
|
06/02
|
40 years
|
||||||||||||||||||
|
Livonia, MI
|
—
|
|
4,500
|
|
17,525
|
|
—
|
|
4,500
|
|
17,525
|
|
22,025
|
|
(6,316
|
)
|
08/02
|
40 years
|
||||||||||||||||||
|
Alexandria, VA
|
—
|
|
—
|
|
22,035
|
|
—
|
|
—
|
|
22,035
|
|
22,035
|
|
(7,850
|
)
|
10/02
|
40 years
|
||||||||||||||||||
|
Little Rock, AR
|
—
|
|
3,858
|
|
7,990
|
|
—
|
|
3,858
|
|
7,990
|
|
11,848
|
|
(2,813
|
)
|
12/02
|
40 years
|
||||||||||||||||||
|
Macon, GA
|
—
|
|
1,982
|
|
5,056
|
|
—
|
|
1,982
|
|
5,056
|
|
7,038
|
|
(1,738
|
)
|
03/03
|
40 years
|
||||||||||||||||||
|
Lawrence, KS
|
3,772
|
|
1,500
|
|
3,526
|
|
2,017
|
|
1,500
|
|
5,543
|
|
7,043
|
|
(1,216
|
)
|
06/03
|
40 years
|
||||||||||||||||||
|
Columbia, SC
|
—
|
|
1,000
|
|
10,534
|
|
(2,447
|
)
|
1,000
|
|
8,087
|
|
9,087
|
|
(2,715
|
)
|
11/03
|
40 years
|
||||||||||||||||||
|
Hialeah, FL
|
—
|
|
7,985
|
|
—
|
|
—
|
|
7,985
|
|
—
|
|
7,985
|
|
—
|
|
12/03
|
n/a
|
||||||||||||||||||
|
Phoenix, AZ
|
—
|
|
4,276
|
|
15,934
|
|
—
|
|
4,276
|
|
15,934
|
|
20,210
|
|
(5,079
|
)
|
03/04
|
40 years
|
||||||||||||||||||
|
Hamilton, NJ
|
—
|
|
4,869
|
|
18,143
|
|
—
|
|
4,869
|
|
18,143
|
|
23,012
|
|
(5,783
|
)
|
03/04
|
40 years
|
||||||||||||||||||
|
Mesa, AZ
|
—
|
|
4,446
|
|
16,565
|
|
3,263
|
|
4,446
|
|
19,828
|
|
24,274
|
|
(5,310
|
)
|
03/04
|
40 years
|
||||||||||||||||||
|
Peoria, IL
|
—
|
|
2,948
|
|
11,177
|
|
—
|
|
2,948
|
|
11,177
|
|
14,125
|
|
(3,470
|
)
|
07/04
|
40 years
|
||||||||||||||||||
|
Lafayette, LA
|
—
|
|
—
|
|
10,318
|
|
—
|
|
—
|
|
10,318
|
|
10,318
|
|
(3,219
|
)
|
07/04
|
40 years
|
||||||||||||||||||
|
Hurst, TX
|
—
|
|
5,000
|
|
11,729
|
|
1,015
|
|
5,000
|
|
12,744
|
|
17,744
|
|
(3,861
|
)
|
11/04
|
40 years
|
||||||||||||||||||
|
Melbourne, FL
|
—
|
|
3,817
|
|
8,830
|
|
320
|
|
3,817
|
|
9,150
|
|
12,967
|
|
(2,745
|
)
|
12/04
|
40 years
|
||||||||||||||||||
124
|
EPR Properties
Schedule III - Real Estate and Accumulated Depreciation
December 31, 2016
(Dollars in thousands)
|
||||||||||||||||||||||||||||||||||||
|
|
|
Initial cost
|
Additions (Dispositions) (Impairments) Subsequent to acquisition
|
Gross Amount at December 31, 2016
|
|
|
|
|||||||||||||||||||||||||||||
|
Location
|
Debt
|
Land
|
Buildings,
Equipment &
improvements
|
Land
|
Buildings,
Equipment &
Improvements
|
Total
|
Accumulated
depreciation
|
Date
acquired
|
Depreciation
life
|
|||||||||||||||||||||||||||
|
D'Iberville, MS
|
8,615
|
|
2,001
|
|
8,043
|
|
1,239
|
|
808
|
|
10,475
|
|
11,283
|
|
(3,043
|
)
|
12/04
|
40 years
|
||||||||||||||||||
|
Wilmington, NC
|
—
|
|
1,650
|
|
7,047
|
|
—
|
|
1,650
|
|
7,047
|
|
8,697
|
|
(2,100
|
)
|
02/05
|
40 years
|
||||||||||||||||||
|
Chattanooga, TN
|
10,002
|
|
2,799
|
|
11,467
|
|
—
|
|
2,799
|
|
11,467
|
|
14,266
|
|
(3,392
|
)
|
03/05
|
40 years
|
||||||||||||||||||
|
Conroe, TX
|
—
|
|
1,836
|
|
8,230
|
|
—
|
|
1,836
|
|
8,230
|
|
10,066
|
|
(2,365
|
)
|
06/05
|
40 years
|
||||||||||||||||||
|
Indianapolis, IN
|
4,027
|
|
1,481
|
|
4,565
|
|
2,375
|
|
1,481
|
|
6,940
|
|
8,421
|
|
(1,319
|
)
|
06/05
|
40 years
|
||||||||||||||||||
|
Hattiesurg, MS
|
8,174
|
|
1,978
|
|
7,733
|
|
2,432
|
|
1,978
|
|
10,165
|
|
12,143
|
|
(2,783
|
)
|
09/05
|
40 years
|
||||||||||||||||||
|
Arroyo Grande, CA
|
—
|
|
2,641
|
|
3,810
|
|
—
|
|
2,641
|
|
3,810
|
|
6,451
|
|
(1,056
|
)
|
12/05
|
40 years
|
||||||||||||||||||
|
Auburn, CA
|
—
|
|
2,178
|
|
6,185
|
|
—
|
|
2,178
|
|
6,185
|
|
8,363
|
|
(1,714
|
)
|
12/05
|
40 years
|
||||||||||||||||||
|
Fresno, CA
|
9,331
|
|
7,600
|
|
11,613
|
|
—
|
|
7,600
|
|
11,613
|
|
19,213
|
|
(3,626
|
)
|
12/05
|
40 years
|
||||||||||||||||||
|
Modesto, CA
|
—
|
|
2,542
|
|
3,910
|
|
—
|
|
2,542
|
|
3,910
|
|
6,452
|
|
(1,083
|
)
|
12/05
|
40 years
|
||||||||||||||||||
|
Columbia, MD
|
—
|
|
—
|
|
12,204
|
|
—
|
|
—
|
|
12,204
|
|
12,204
|
|
(3,280
|
)
|
03/06
|
40 years
|
||||||||||||||||||
|
Garland, TX
|
12,452
|
|
8,028
|
|
14,825
|
|
—
|
|
8,028
|
|
14,825
|
|
22,853
|
|
(3,984
|
)
|
03/06
|
40 years
|
||||||||||||||||||
|
Garner, NC
|
—
|
|
1,305
|
|
6,899
|
|
—
|
|
1,305
|
|
6,899
|
|
8,204
|
|
(1,840
|
)
|
04/06
|
40 years
|
||||||||||||||||||
|
Winston Salem, NC
|
—
|
|
—
|
|
12,153
|
|
1,925
|
|
—
|
|
14,078
|
|
14,078
|
|
(3,695
|
)
|
07/06
|
40 years
|
||||||||||||||||||
|
Huntsville, AL
|
—
|
|
3,508
|
|
14,802
|
|
—
|
|
3,508
|
|
14,802
|
|
18,310
|
|
(3,824
|
)
|
08/06
|
40 years
|
||||||||||||||||||
|
Kalamazoo, MI
|
—
|
|
5,125
|
|
12,216
|
|
2,308
|
|
5,125
|
|
14,524
|
|
19,649
|
|
(6,788
|
)
|
11/06
|
40 years
|
||||||||||||||||||
|
Pensacola, FL
|
—
|
|
5,316
|
|
15,099
|
|
—
|
|
5,316
|
|
15,099
|
|
20,415
|
|
(3,775
|
)
|
12/06
|
40 years
|
||||||||||||||||||
|
Slidell, LA
|
10,635
|
|
—
|
|
11,499
|
|
—
|
|
—
|
|
11,499
|
|
11,499
|
|
(2,875
|
)
|
12/06
|
40 years
|
||||||||||||||||||
|
Panama City Beach, FL
|
—
|
|
6,486
|
|
11,156
|
|
—
|
|
6,486
|
|
11,156
|
|
17,642
|
|
(2,673
|
)
|
05/07
|
40 years
|
||||||||||||||||||
|
Kalispell, MT
|
—
|
|
2,505
|
|
7,323
|
|
—
|
|
2,505
|
|
7,323
|
|
9,828
|
|
(1,709
|
)
|
08/07
|
40 years
|
||||||||||||||||||
|
Greensboro, NC
|
—
|
|
—
|
|
12,606
|
|
914
|
|
—
|
|
13,520
|
|
13,520
|
|
(3,031
|
)
|
11/07
|
40 years
|
||||||||||||||||||
|
Glendora, CA
|
—
|
|
—
|
|
10,588
|
|
—
|
|
—
|
|
10,588
|
|
10,588
|
|
(2,162
|
)
|
10/08
|
40 years
|
||||||||||||||||||
|
Ypsilanti, MI
|
—
|
|
4,716
|
|
227
|
|
—
|
|
4,716
|
|
227
|
|
4,943
|
|
(40
|
)
|
12/09
|
40 years
|
||||||||||||||||||
|
Manchester, CT
|
—
|
|
3,628
|
|
11,474
|
|
—
|
|
3,628
|
|
11,474
|
|
15,102
|
|
(2,008
|
)
|
12/09
|
40 years
|
||||||||||||||||||
|
Centreville, VA
|
—
|
|
3,628
|
|
1,769
|
|
—
|
|
3,628
|
|
1,769
|
|
5,397
|
|
(310
|
)
|
12/09
|
40 years
|
||||||||||||||||||
|
Davenport, IA
|
—
|
|
3,599
|
|
6,068
|
|
(35
|
)
|
3,564
|
|
6,068
|
|
9,632
|
|
(1,062
|
)
|
12/09
|
40 years
|
||||||||||||||||||
|
Fairfax, VA
|
—
|
|
2,630
|
|
11,791
|
|
—
|
|
2,630
|
|
11,791
|
|
14,421
|
|
(2,063
|
)
|
12/09
|
40 years
|
||||||||||||||||||
|
Flint, MI
|
—
|
|
1,270
|
|
1,723
|
|
—
|
|
1,270
|
|
1,723
|
|
2,993
|
|
(302
|
)
|
12/09
|
40 years
|
||||||||||||||||||
|
Hazlet, NJ
|
—
|
|
3,719
|
|
4,716
|
|
—
|
|
3,719
|
|
4,716
|
|
8,435
|
|
(825
|
)
|
12/09
|
40 years
|
||||||||||||||||||
|
Huber Heights, OH
|
—
|
|
970
|
|
3,891
|
|
—
|
|
970
|
|
3,891
|
|
4,861
|
|
(681
|
)
|
12/09
|
40 years
|
||||||||||||||||||
|
North Haven, CT
|
—
|
|
5,442
|
|
1,061
|
|
2,000
|
|
3,458
|
|
5,045
|
|
8,503
|
|
(1,162
|
)
|
12/09
|
40 years
|
||||||||||||||||||
|
Okolona, KY
|
—
|
|
5,379
|
|
3,311
|
|
—
|
|
5,379
|
|
3,311
|
|
8,690
|
|
(579
|
)
|
12/09
|
40 years
|
||||||||||||||||||
|
Voorhees, NJ
|
—
|
|
1,723
|
|
9,614
|
|
—
|
|
1,723
|
|
9,614
|
|
11,337
|
|
(1,682
|
)
|
12/09
|
40 years
|
||||||||||||||||||
|
Louisville, KY
|
—
|
|
4,979
|
|
6,567
|
|
—
|
|
4,979
|
|
6,567
|
|
11,546
|
|
(1,149
|
)
|
12/09
|
40 years
|
||||||||||||||||||
|
Beaver Creek, OH
|
—
|
|
1,578
|
|
6,630
|
|
—
|
|
1,578
|
|
6,630
|
|
8,208
|
|
(1,160
|
)
|
12/09
|
40 years
|
||||||||||||||||||
|
West Springfield, MA
|
—
|
|
2,540
|
|
3,755
|
|
—
|
|
2,540
|
|
3,755
|
|
6,295
|
|
(657
|
)
|
12/09
|
40 years
|
||||||||||||||||||
|
Cincinnati, OH
|
—
|
|
1,361
|
|
1,741
|
|
—
|
|
635
|
|
2,467
|
|
3,102
|
|
(326
|
)
|
12/09
|
40 years
|
||||||||||||||||||
|
Pasadena, TX
|
—
|
|
2,951
|
|
10,684
|
|
—
|
|
2,951
|
|
10,684
|
|
13,635
|
|
(1,736
|
)
|
06/10
|
40 years
|
||||||||||||||||||
|
Plano, TX
|
—
|
|
1,052
|
|
1,968
|
|
—
|
|
1,052
|
|
1,968
|
|
3,020
|
|
(320
|
)
|
06/10
|
40 years
|
||||||||||||||||||
|
McKinney, TX
|
—
|
|
1,917
|
|
3,319
|
|
—
|
|
1,917
|
|
3,319
|
|
5,236
|
|
(539
|
)
|
06/10
|
40 years
|
||||||||||||||||||
|
Mishawaka, IN
|
—
|
|
2,399
|
|
5,454
|
|
1,383
|
|
2,399
|
|
6,837
|
|
9,236
|
|
(913
|
)
|
06/10
|
40 years
|
||||||||||||||||||
|
Grand Prairie, TX
|
—
|
|
1,873
|
|
3,245
|
|
2,104
|
|
1,873
|
|
5,349
|
|
7,222
|
|
(622
|
)
|
06/10
|
40 years
|
||||||||||||||||||
|
Redding, CA
|
—
|
|
2,044
|
|
4,500
|
|
—
|
|
2,044
|
|
4,500
|
|
6,544
|
|
(731
|
)
|
06/10
|
40 years
|
||||||||||||||||||
|
Pueblo, CO
|
—
|
|
2,238
|
|
5,162
|
|
—
|
|
2,238
|
|
5,162
|
|
7,400
|
|
(839
|
)
|
06/10
|
40 years
|
||||||||||||||||||
|
Beaumont, TX
|
—
|
|
1,065
|
|
11,669
|
|
—
|
|
1,065
|
|
11,669
|
|
12,734
|
|
(1,896
|
)
|
06/10
|
40 years
|
||||||||||||||||||
125
|
EPR Properties
Schedule III - Real Estate and Accumulated Depreciation
December 31, 2016
(Dollars in thousands)
|
||||||||||||||||||||||||||||||||||||
|
|
|
Initial cost
|
Additions (Dispositions) (Impairments) Subsequent to acquisition
|
Gross Amount at December 31, 2016
|
|
|
|
|||||||||||||||||||||||||||||
|
Location
|
Debt
|
Land
|
Buildings,
Equipment &
improvements
|
Land
|
Buildings,
Equipment &
Improvements
|
Total
|
Accumulated
depreciation
|
Date
acquired
|
Depreciation
life
|
|||||||||||||||||||||||||||
|
Pflugerville, TX
|
—
|
|
4,356
|
|
11,533
|
|
—
|
|
4,356
|
|
11,533
|
|
15,889
|
|
(1,874
|
)
|
06/10
|
40 years
|
||||||||||||||||||
|
Houston, TX
|
—
|
|
4,109
|
|
9,739
|
|
—
|
|
4,109
|
|
9,739
|
|
13,848
|
|
(1,583
|
)
|
06/10
|
40 years
|
||||||||||||||||||
|
El Paso, TX
|
—
|
|
4,598
|
|
13,207
|
|
—
|
|
4,598
|
|
13,207
|
|
17,805
|
|
(2,146
|
)
|
06/10
|
40 years
|
||||||||||||||||||
|
Colorado Springs, CO
|
—
|
|
4,134
|
|
11,220
|
|
(1,196
|
)
|
2,938
|
|
11,220
|
|
14,158
|
|
(1,823
|
)
|
06/10
|
40 years
|
||||||||||||||||||
|
Virginia Beach, VA
|
—
|
|
—
|
|
1,736
|
|
—
|
|
—
|
|
1,736
|
|
1,736
|
|
(969
|
)
|
12/10
|
40 years
|
||||||||||||||||||
|
Hooksett, NH
|
—
|
|
2,639
|
|
11,605
|
|
—
|
|
2,639
|
|
11,605
|
|
14,244
|
|
(1,692
|
)
|
03/11
|
40 years
|
||||||||||||||||||
|
Saco, ME
|
—
|
|
1,508
|
|
3,826
|
|
—
|
|
1,508
|
|
3,826
|
|
5,334
|
|
(558
|
)
|
03/11
|
40 years
|
||||||||||||||||||
|
Merrimack, NH
|
3,298
|
|
3,160
|
|
5,642
|
|
—
|
|
3,160
|
|
5,642
|
|
8,802
|
|
(823
|
)
|
03/11
|
40 years
|
||||||||||||||||||
|
Westbrook, ME
|
—
|
|
2,273
|
|
7,119
|
|
—
|
|
2,273
|
|
7,119
|
|
9,392
|
|
(1,038
|
)
|
03/11
|
40 years
|
||||||||||||||||||
|
Twin Falls, ID
|
—
|
|
—
|
|
4,783
|
|
—
|
|
—
|
|
4,783
|
|
4,783
|
|
(548
|
)
|
04/11
|
40 years
|
||||||||||||||||||
|
Dallas, TX
|
—
|
|
—
|
|
12,146
|
|
750
|
|
—
|
|
12,896
|
|
12,896
|
|
(1,242
|
)
|
03/12
|
40 years
|
||||||||||||||||||
|
Albuquerque, NM
|
—
|
|
—
|
|
13,733
|
|
—
|
|
—
|
|
13,733
|
|
13,733
|
|
(1,059
|
)
|
06/12
|
40 years
|
||||||||||||||||||
|
Southern Pines, NC
|
—
|
|
1,709
|
|
4,747
|
|
—
|
|
1,709
|
|
4,747
|
|
6,456
|
|
(534
|
)
|
06/12
|
40 years
|
||||||||||||||||||
|
Austin, TX
|
—
|
|
2,608
|
|
6,373
|
|
—
|
|
2,608
|
|
6,373
|
|
8,981
|
|
(544
|
)
|
09/12
|
40 years
|
||||||||||||||||||
|
Champaign, IL
|
—
|
|
—
|
|
9,381
|
|
125
|
|
—
|
|
9,506
|
|
9,506
|
|
(733
|
)
|
09/12
|
40 years
|
||||||||||||||||||
|
Gainesville, VA
|
—
|
|
—
|
|
10,846
|
|
—
|
|
—
|
|
10,846
|
|
10,846
|
|
(836
|
)
|
02/13
|
40 years
|
||||||||||||||||||
|
Lafayette, LA
|
14,360
|
|
—
|
|
12,728
|
|
—
|
|
—
|
|
12,728
|
|
12,728
|
|
(1,034
|
)
|
08/13
|
40 years
|
||||||||||||||||||
|
New Iberia, LA
|
—
|
|
—
|
|
1,630
|
|
—
|
|
—
|
|
1,630
|
|
1,630
|
|
(133
|
)
|
08/13
|
40 years
|
||||||||||||||||||
|
Tuscaloosa, AL
|
—
|
|
—
|
|
11,287
|
|
—
|
|
1,815
|
|
9,472
|
|
11,287
|
|
(770
|
)
|
09/13
|
40 years
|
||||||||||||||||||
|
Tampa, FL
|
—
|
|
1,700
|
|
23,483
|
|
3,769
|
|
1,700
|
|
27,252
|
|
28,952
|
|
(2,568
|
)
|
10/13
|
40 years
|
||||||||||||||||||
|
Warrenville, IL
|
—
|
|
14,000
|
|
17,318
|
|
—
|
|
14,000
|
|
17,318
|
|
31,318
|
|
(2,211
|
)
|
10/13
|
40 years
|
||||||||||||||||||
|
San Francisco, CA
|
—
|
|
2,077
|
|
12,914
|
|
—
|
|
2,077
|
|
12,914
|
|
14,991
|
|
(323
|
)
|
08/13
|
40 years
|
||||||||||||||||||
|
Opelika, AL
|
—
|
|
1,314
|
|
8,951
|
|
—
|
|
1,314
|
|
8,951
|
|
10,265
|
|
(559
|
)
|
11/12
|
40 years
|
||||||||||||||||||
|
Bedford, IN
|
1,371
|
|
349
|
|
1,594
|
|
—
|
|
349
|
|
1,594
|
|
1,943
|
|
(122
|
)
|
04/14
|
40 years
|
||||||||||||||||||
|
Seymour, IN
|
2,341
|
|
1,028
|
|
2,291
|
|
—
|
|
1,028
|
|
2,291
|
|
3,319
|
|
(164
|
)
|
04/14
|
40 years
|
||||||||||||||||||
|
Wilder, KY
|
10,032
|
|
983
|
|
11,233
|
|
2,004
|
|
983
|
|
13,237
|
|
14,220
|
|
(796
|
)
|
04/14
|
40 years
|
||||||||||||||||||
|
Bowling Green, KY
|
8,087
|
|
1,241
|
|
10,222
|
|
—
|
|
1,241
|
|
10,222
|
|
11,463
|
|
(725
|
)
|
04/14
|
40 years
|
||||||||||||||||||
|
New Albany, IN
|
12,183
|
|
2,461
|
|
14,807
|
|
—
|
|
2,461
|
|
14,807
|
|
17,268
|
|
(1,030
|
)
|
04/14
|
40 years
|
||||||||||||||||||
|
Clarksville, TN
|
14,487
|
|
3,764
|
|
16,769
|
|
—
|
|
3,764
|
|
16,769
|
|
20,533
|
|
(1,170
|
)
|
04/14
|
40 years
|
||||||||||||||||||
|
Williamsport, PA
|
6,299
|
|
2,243
|
|
6,684
|
|
—
|
|
2,243
|
|
6,684
|
|
8,927
|
|
(490
|
)
|
04/14
|
40 years
|
||||||||||||||||||
|
Noblesville, IN
|
5,883
|
|
886
|
|
7,453
|
|
—
|
|
886
|
|
7,453
|
|
8,339
|
|
(527
|
)
|
04/14
|
40 years
|
||||||||||||||||||
|
Moline, IL
|
8,570
|
|
1,963
|
|
10,183
|
|
—
|
|
1,963
|
|
10,183
|
|
12,146
|
|
(717
|
)
|
04/14
|
40 years
|
||||||||||||||||||
|
O'Fallon, MO
|
5,917
|
|
1,046
|
|
7,342
|
|
—
|
|
1,046
|
|
7,342
|
|
8,388
|
|
(514
|
)
|
04/14
|
40 years
|
||||||||||||||||||
|
McDonough, GA
|
13,459
|
|
2,235
|
|
16,842
|
|
—
|
|
2,235
|
|
16,842
|
|
19,077
|
|
(1,182
|
)
|
04/14
|
40 years
|
||||||||||||||||||
|
Sterling Heights, MI
|
—
|
|
10,849
|
|
—
|
|
70
|
|
10,919
|
|
—
|
|
10,919
|
|
—
|
|
12/14
|
n/a
|
||||||||||||||||||
|
Virginia Beach, VA
|
—
|
|
2,544
|
|
6,478
|
|
—
|
|
2,544
|
|
6,478
|
|
9,022
|
|
(297
|
)
|
02/15
|
40 years
|
||||||||||||||||||
|
Yulee, FL
|
—
|
|
1,036
|
|
6,934
|
|
—
|
|
1,036
|
|
6,934
|
|
7,970
|
|
(318
|
)
|
02/15
|
40 years
|
||||||||||||||||||
|
Jacksonville, FL
|
—
|
|
5,080
|
|
22,064
|
|
—
|
|
5,080
|
|
22,064
|
|
27,144
|
|
(1,386
|
)
|
05/15
|
25 years
|
||||||||||||||||||
|
Denham Springs, LA
|
—
|
|
—
|
|
5,093
|
|
—
|
|
—
|
|
5,093
|
|
5,093
|
|
(95
|
)
|
05/15
|
40 years
|
||||||||||||||||||
|
Crystal Lake, IL
|
—
|
|
2,980
|
|
13,521
|
|
568
|
|
2,980
|
|
14,089
|
|
17,069
|
|
(814
|
)
|
07/15
|
25 years
|
||||||||||||||||||
|
Laredo, TX
|
—
|
|
1,353
|
|
7,886
|
|
—
|
|
1,353
|
|
7,886
|
|
9,239
|
|
(197
|
)
|
12/15
|
40 years
|
||||||||||||||||||
|
Delmont, PA
|
—
|
|
673
|
|
621
|
|
—
|
|
673
|
|
621
|
|
1,294
|
|
(15
|
)
|
06/16
|
25 years
|
||||||||||||||||||
|
Kennewick, WA
|
—
|
|
2,484
|
|
4,901
|
|
—
|
|
2,484
|
|
4,901
|
|
7,385
|
|
(110
|
)
|
06/16
|
25 years
|
||||||||||||||||||
|
Franklin, TN
|
—
|
|
10,158
|
|
17,549
|
|
—
|
|
10,158
|
|
17,549
|
|
27,707
|
|
(392
|
)
|
06/16
|
25 years
|
||||||||||||||||||
|
Mobile, AL
|
—
|
|
2,116
|
|
16,657
|
|
—
|
|
2,116
|
|
16,657
|
|
18,773
|
|
(354
|
)
|
06/16
|
25 years
|
||||||||||||||||||
126
|
EPR Properties
Schedule III - Real Estate and Accumulated Depreciation
December 31, 2016
(Dollars in thousands)
|
||||||||||||||||||||||||||||||||||||
|
|
|
Initial cost
|
Additions (Dispositions) (Impairments) Subsequent to acquisition
|
Gross Amount at December 31, 2016
|
|
|
|
|||||||||||||||||||||||||||||
|
Location
|
Debt
|
Land
|
Buildings,
Equipment &
improvements
|
Land
|
Buildings,
Equipment &
Improvements
|
Total
|
Accumulated
depreciation
|
Date
acquired
|
Depreciation
life
|
|||||||||||||||||||||||||||
|
El Paso, TX
|
—
|
|
2,957
|
|
10,961
|
|
—
|
|
2,957
|
|
10,961
|
|
13,918
|
|
(240
|
)
|
06/16
|
25 years
|
||||||||||||||||||
|
Edinburg, TX
|
—
|
|
1,982
|
|
16,964
|
|
—
|
|
1,982
|
|
16,964
|
|
18,946
|
|
(356
|
)
|
06/16
|
25 years
|
||||||||||||||||||
|
Hendersonville, TN
|
—
|
|
2,784
|
|
8,034
|
|
—
|
|
2,784
|
|
8,034
|
|
10,818
|
|
(112
|
)
|
07/16
|
30 years
|
||||||||||||||||||
|
Detroit, MI
|
—
|
|
4,299
|
|
13,810
|
|
—
|
|
4,299
|
|
13,810
|
|
18,109
|
|
(77
|
)
|
11/16
|
30 years
|
||||||||||||||||||
|
ERC's/Retail
|
||||||||||||||||||||||||||||||||||||
|
Dallas, TX
|
—
|
|
3,060
|
|
15,281
|
|
18,862
|
|
3,060
|
|
34,143
|
|
37,203
|
|
(14,425
|
)
|
11/97
|
40 years
|
||||||||||||||||||
|
Mesquite, TX
|
—
|
|
3,119
|
|
990
|
|
(2,440
|
)
|
319
|
|
1,350
|
|
1,669
|
|
(348
|
)
|
01/99
|
40 years
|
||||||||||||||||||
|
Westminster, CO
|
—
|
|
6,205
|
|
12,600
|
|
9,509
|
|
6,205
|
|
22,109
|
|
28,314
|
|
(17,330
|
)
|
12/01
|
40 years
|
||||||||||||||||||
|
Westminster, CO
|
—
|
|
5,850
|
|
17,314
|
|
—
|
|
5,850
|
|
17,314
|
|
23,164
|
|
(6,529
|
)
|
06/99
|
40 years
|
||||||||||||||||||
|
Houston, TX
|
—
|
|
3,653
|
|
1,365
|
|
(1,531
|
)
|
3,408
|
|
79
|
|
3,487
|
|
(3
|
)
|
05/00
|
40 years
|
||||||||||||||||||
|
Southfield, MI
|
—
|
|
8,000
|
|
20,518
|
|
6,230
|
|
8,000
|
|
26,748
|
|
34,748
|
|
(20,945
|
)
|
05/03
|
15 years
|
||||||||||||||||||
|
New Rochelle, NY
|
—
|
|
6,100
|
|
97,696
|
|
6,924
|
|
6,100
|
|
104,620
|
|
110,720
|
|
(35,390
|
)
|
10/03
|
40 years
|
||||||||||||||||||
|
Suffolk, VA
|
—
|
|
3,382
|
|
9,971
|
|
6,858
|
|
4,471
|
|
15,740
|
|
20,211
|
|
(4,046
|
)
|
11/03
|
40 years
|
||||||||||||||||||
|
Kanata, ON
|
—
|
|
9,384
|
|
34,224
|
|
27,312
|
|
9,384
|
|
61,536
|
|
70,920
|
|
(18,627
|
)
|
03/04
|
40 years
|
||||||||||||||||||
|
Mississagua, ON
|
—
|
|
8,615
|
|
16,438
|
|
15,405
|
|
11,330
|
|
29,128
|
|
40,458
|
|
(8,395
|
)
|
03/04
|
40 years
|
||||||||||||||||||
|
Oakville, ON
|
—
|
|
9,384
|
|
22,093
|
|
4,067
|
|
9,384
|
|
26,160
|
|
35,544
|
|
(9,465
|
)
|
03/04
|
40 years
|
||||||||||||||||||
|
Whitby, ON
|
—
|
|
9,532
|
|
20,518
|
|
21,865
|
|
12,243
|
|
39,672
|
|
51,915
|
|
(12,433
|
)
|
03/04
|
40 years
|
||||||||||||||||||
|
Warrenville, IL
|
—
|
|
3,919
|
|
900
|
|
(1,936
|
)
|
1,983
|
|
900
|
|
2,883
|
|
(735
|
)
|
07/04
|
15 years
|
||||||||||||||||||
|
Burbank, CA
|
—
|
|
16,584
|
|
35,016
|
|
7,097
|
|
16,584
|
|
42,113
|
|
58,697
|
|
(11,668
|
)
|
03/05
|
40 years
|
||||||||||||||||||
|
Austell, GA
|
—
|
|
1,596
|
|
—
|
|
—
|
|
1,596
|
|
—
|
|
1,596
|
|
—
|
|
07/07
|
n/a
|
||||||||||||||||||
|
Suffolk, VA
|
—
|
|
3,256
|
|
9,206
|
|
5,193
|
|
3,298
|
|
14,357
|
|
17,655
|
|
(3,792
|
)
|
06/09
|
40 years
|
||||||||||||||||||
|
Other Entertainment
|
||||||||||||||||||||||||||||||||||||
|
Northbrook, IL
|
—
|
|
—
|
|
7,025
|
|
586
|
|
—
|
|
7,611
|
|
7,611
|
|
(961
|
)
|
07/11
|
40 years
|
||||||||||||||||||
|
Oakbrook, IL
|
—
|
|
—
|
|
8,068
|
|
536
|
|
—
|
|
8,604
|
|
8,604
|
|
(866
|
)
|
03/12
|
40 years
|
||||||||||||||||||
|
Jacksonville, FL
|
—
|
|
4,510
|
|
5,061
|
|
1,979
|
|
4,510
|
|
7,040
|
|
11,550
|
|
(1,115
|
)
|
02/12
|
30 years
|
||||||||||||||||||
|
Indianapolis, IN
|
—
|
|
4,298
|
|
6,321
|
|
2,921
|
|
4,377
|
|
9,163
|
|
13,540
|
|
(874
|
)
|
02/12
|
40 years
|
||||||||||||||||||
|
Warrenville, IL
|
—
|
|
—
|
|
6,469
|
|
2,216
|
|
—
|
|
8,685
|
|
8,685
|
|
(743
|
)
|
10/13
|
40 years
|
||||||||||||||||||
|
Schaumburg, IL
|
—
|
|
598
|
|
5,372
|
|
—
|
|
598
|
|
5,372
|
|
5,970
|
|
(179
|
)
|
04/15
|
30 years
|
||||||||||||||||||
|
Marietta, GA
|
—
|
|
3,116
|
|
11,872
|
|
—
|
|
3,116
|
|
11,872
|
|
14,988
|
|
(423
|
)
|
02/16
|
35 years
|
||||||||||||||||||
|
Public Charter Schools
|
||||||||||||||||||||||||||||||||||||
|
Cleveland, OH
|
—
|
|
640
|
|
5,613
|
|
—
|
|
640
|
|
5,613
|
|
6,253
|
|
(281
|
)
|
10/04
|
30 years
|
||||||||||||||||||
|
Gilbert, AZ
|
—
|
|
2,580
|
|
6,418
|
|
2,509
|
|
2,580
|
|
8,927
|
|
11,507
|
|
(1,011
|
)
|
06/11
|
40 years
|
||||||||||||||||||
|
Baton Rouge, LA
|
—
|
|
996
|
|
5,638
|
|
—
|
|
996
|
|
5,638
|
|
6,634
|
|
(785
|
)
|
03/11
|
40 years
|
||||||||||||||||||
|
Goodyear, AZ
|
—
|
|
766
|
|
6,517
|
|
—
|
|
766
|
|
6,517
|
|
7,283
|
|
(935
|
)
|
04/11
|
30 years
|
||||||||||||||||||
|
Phoenix, AZ
|
—
|
|
1,253
|
|
4,834
|
|
—
|
|
1,253
|
|
4,834
|
|
6,087
|
|
(634
|
)
|
06/11
|
40 years
|
||||||||||||||||||
|
Broomfield, CO
|
—
|
|
1,084
|
|
9,659
|
|
(169
|
)
|
1,084
|
|
9,490
|
|
10,574
|
|
(1,164
|
)
|
08/11
|
40 years
|
||||||||||||||||||
|
Phoenix, AZ
|
—
|
|
1,060
|
|
8,140
|
|
—
|
|
1,060
|
|
8,140
|
|
9,200
|
|
(1,250
|
)
|
11/11
|
40 years
|
||||||||||||||||||
|
Salt Lake City, UT
|
—
|
|
897
|
|
4,488
|
|
(55
|
)
|
897
|
|
4,433
|
|
5,330
|
|
(505
|
)
|
03/12
|
40 years
|
||||||||||||||||||
|
Hurricane, UT
|
—
|
|
475
|
|
4,939
|
|
—
|
|
475
|
|
4,939
|
|
5,414
|
|
(775
|
)
|
03/12
|
40 years
|
||||||||||||||||||
|
Buckeye, AZ
|
—
|
|
914
|
|
9,715
|
|
14,484
|
|
914
|
|
24,199
|
|
25,113
|
|
(1,793
|
)
|
04/12
|
40 years
|
||||||||||||||||||
|
Queen Creek, AZ
|
—
|
|
1,887
|
|
14,543
|
|
11,117
|
|
1,887
|
|
25,660
|
|
27,547
|
|
(2,669
|
)
|
05/12
|
40 years
|
||||||||||||||||||
|
Tarboro, NC
|
—
|
|
350
|
|
12,560
|
|
3,037
|
|
350
|
|
15,597
|
|
15,947
|
|
(1,633
|
)
|
07/12
|
40 years
|
||||||||||||||||||
127
|
EPR Properties
Schedule III - Real Estate and Accumulated Depreciation
December 31, 2016
(Dollars in thousands)
|
||||||||||||||||||||||||||||||||||||
|
|
|
Initial cost
|
Additions (Dispositions) (Impairments) Subsequent to acquisition
|
Gross Amount at December 31, 2016
|
|
|
|
|||||||||||||||||||||||||||||
|
Location
|
Debt
|
Land
|
Buildings,
Equipment &
improvements
|
Land
|
Buildings,
Equipment &
Improvements
|
Total
|
Accumulated
depreciation
|
Date
acquired
|
Depreciation
life
|
|||||||||||||||||||||||||||
|
Chester Upland, PA
|
—
|
|
518
|
|
5,900
|
|
—
|
|
518
|
|
5,900
|
|
6,418
|
|
(632
|
)
|
03/13
|
30 years
|
||||||||||||||||||
|
Hollywood, SC
|
—
|
|
806
|
|
5,776
|
|
1,805
|
|
806
|
|
7,581
|
|
8,387
|
|
(598
|
)
|
03/13
|
40 years
|
||||||||||||||||||
|
Camden, NJ
|
—
|
|
548
|
|
10,569
|
|
7,271
|
|
548
|
|
17,840
|
|
18,388
|
|
(1,729
|
)
|
04/13
|
30 years
|
||||||||||||||||||
|
Queen Creek, AZ
|
—
|
|
2,612
|
|
—
|
|
(1,845
|
)
|
767
|
|
—
|
|
767
|
|
—
|
|
04/13
|
n/a
|
||||||||||||||||||
|
Chicago, IL
|
—
|
|
509
|
|
5,895
|
|
4,614
|
|
509
|
|
10,509
|
|
11,018
|
|
(682
|
)
|
05/13
|
40 years
|
||||||||||||||||||
|
Gilbert, AZ
|
—
|
|
1,336
|
|
6,593
|
|
—
|
|
1,336
|
|
6,593
|
|
7,929
|
|
(536
|
)
|
05/13
|
40 years
|
||||||||||||||||||
|
Vista, CA
|
—
|
|
1,283
|
|
3,354
|
|
6,056
|
|
1,283
|
|
9,410
|
|
10,693
|
|
(446
|
)
|
05/13
|
40 years
|
||||||||||||||||||
|
Colorado Springs, CO
|
—
|
|
1,205
|
|
6,350
|
|
(194
|
)
|
1,205
|
|
6,156
|
|
7,361
|
|
(563
|
)
|
06/13
|
40 years
|
||||||||||||||||||
|
Chandler, AZ
|
—
|
|
1,039
|
|
9,590
|
|
—
|
|
1,039
|
|
9,590
|
|
10,629
|
|
(1,074
|
)
|
07/13
|
40 years
|
||||||||||||||||||
|
Salt Lake City, UT
|
—
|
|
8,173
|
|
10,982
|
|
1,928
|
|
8,173
|
|
12,910
|
|
21,083
|
|
(742
|
)
|
07/13
|
40 years
|
||||||||||||||||||
|
Palm Beach, FL
|
—
|
|
3,323
|
|
15,824
|
|
(81
|
)
|
3,323
|
|
15,743
|
|
19,066
|
|
(1,056
|
)
|
10/13
|
30 years
|
||||||||||||||||||
|
Mesa, AZ
|
—
|
|
2,109
|
|
6,032
|
|
166
|
|
2,109
|
|
6,198
|
|
8,307
|
|
(425
|
)
|
12/13
|
30 years
|
||||||||||||||||||
|
Kernersville, NC
|
—
|
|
1,362
|
|
8,182
|
|
(244
|
)
|
1,362
|
|
7,938
|
|
9,300
|
|
(665
|
)
|
12/13
|
40 years
|
||||||||||||||||||
|
Fort Collins, CO
|
—
|
|
618
|
|
5,031
|
|
5,134
|
|
618
|
|
10,165
|
|
10,783
|
|
(620
|
)
|
02/14
|
40 years
|
||||||||||||||||||
|
Wilson, NC
|
—
|
|
424
|
|
5,342
|
|
(71
|
)
|
449
|
|
5,246
|
|
5,695
|
|
(352
|
)
|
03/14
|
30 years
|
||||||||||||||||||
|
Baker, LA
|
—
|
|
190
|
|
6,563
|
|
203
|
|
190
|
|
6,766
|
|
6,956
|
|
(349
|
)
|
04/14
|
40 years
|
||||||||||||||||||
|
Charlotte, NC
|
—
|
|
1,559
|
|
1,477
|
|
8,651
|
|
1,559
|
|
10,128
|
|
11,687
|
|
(350
|
)
|
05/14
|
30 years
|
||||||||||||||||||
|
Chicago, IL
|
—
|
|
1,544
|
|
6,074
|
|
4,239
|
|
1,544
|
|
10,313
|
|
11,857
|
|
(477
|
)
|
05/14
|
40 years
|
||||||||||||||||||
|
High Point, NC
|
—
|
|
1,298
|
|
7,322
|
|
(38
|
)
|
1,298
|
|
7,284
|
|
8,582
|
|
(345
|
)
|
07/14
|
40 years
|
||||||||||||||||||
|
Chandler, AZ
|
—
|
|
1,530
|
|
6,877
|
|
144
|
|
1,530
|
|
7,021
|
|
8,551
|
|
(261
|
)
|
08/14
|
40 years
|
||||||||||||||||||
|
Port Royal, SC
|
—
|
|
387
|
|
4,383
|
|
1,259
|
|
387
|
|
5,642
|
|
6,029
|
|
(178
|
)
|
09/14
|
40 years
|
||||||||||||||||||
|
Macon, GA
|
—
|
|
401
|
|
7,883
|
|
—
|
|
401
|
|
7,883
|
|
8,284
|
|
(433
|
)
|
02/15
|
40 years
|
||||||||||||||||||
|
Memphis, TN
|
—
|
|
1,535
|
|
4,089
|
|
2,646
|
|
1,535
|
|
6,735
|
|
8,270
|
|
(273
|
)
|
02/15
|
30 years
|
||||||||||||||||||
|
Parker, CO
|
—
|
|
2,190
|
|
6,815
|
|
111
|
|
2,190
|
|
6,926
|
|
9,116
|
|
(341
|
)
|
01/15
|
40 years
|
||||||||||||||||||
|
Rock Hill, SC
|
—
|
|
2,046
|
|
8,024
|
|
—
|
|
2,046
|
|
8,024
|
|
10,070
|
|
(158
|
)
|
04/15
|
30 years
|
||||||||||||||||||
|
Palm Bay, FL
|
—
|
|
782
|
|
6,212
|
|
2,250
|
|
782
|
|
8,462
|
|
9,244
|
|
(310
|
)
|
03/15
|
40 years
|
||||||||||||||||||
|
East Point, GA
|
—
|
|
553
|
|
5,938
|
|
—
|
|
553
|
|
5,938
|
|
6,491
|
|
(125
|
)
|
05/15
|
30 years
|
||||||||||||||||||
|
High Point, NC
|
—
|
|
1,180
|
|
9,393
|
|
—
|
|
1,180
|
|
9,393
|
|
10,573
|
|
(470
|
)
|
06/15
|
30 years
|
||||||||||||||||||
|
Bridgeton, NJ
|
—
|
|
153
|
|
2,392
|
|
—
|
|
153
|
|
2,392
|
|
2,545
|
|
(77
|
)
|
09/15
|
40 years
|
||||||||||||||||||
|
Memphis, TN
|
—
|
|
910
|
|
7,927
|
|
—
|
|
910
|
|
7,927
|
|
8,837
|
|
(49
|
)
|
09/15
|
40 years
|
||||||||||||||||||
|
Macon, GA
|
—
|
|
351
|
|
7,460
|
|
—
|
|
351
|
|
7,460
|
|
7,811
|
|
(151
|
)
|
11/15
|
30 years
|
||||||||||||||||||
|
Galloway, NJ
|
—
|
|
575
|
|
3,692
|
|
—
|
|
575
|
|
3,692
|
|
4,267
|
|
(62
|
)
|
12/15
|
30 years
|
||||||||||||||||||
|
Bronx, NY
|
—
|
|
1,232
|
|
8,472
|
|
—
|
|
1,232
|
|
8,472
|
|
9,704
|
|
(88
|
)
|
01/16
|
40 years
|
||||||||||||||||||
|
Parker, CO
|
—
|
|
1,248
|
|
12,892
|
|
—
|
|
1,248
|
|
12,892
|
|
14,140
|
|
(83
|
)
|
04/16
|
40 years
|
||||||||||||||||||
|
Holland, OH
|
—
|
|
549
|
|
4,642
|
|
—
|
|
549
|
|
4,642
|
|
5,191
|
|
(45
|
)
|
04/16
|
40 years
|
||||||||||||||||||
|
Early Childhood Education
|
||||||||||||||||||||||||||||||||||||
|
Lake Pleasant, AZ
|
—
|
|
986
|
|
3,524
|
|
—
|
|
986
|
|
3,524
|
|
4,510
|
|
(450
|
)
|
03/13
|
30 years
|
||||||||||||||||||
|
Goodyear, AZ
|
—
|
|
1,308
|
|
7,275
|
|
11
|
|
1,308
|
|
7,286
|
|
8,594
|
|
(739
|
)
|
06/13
|
30 years
|
||||||||||||||||||
|
Oklahoma City, OK
|
—
|
|
1,149
|
|
9,839
|
|
385
|
|
1,149
|
|
10,224
|
|
11,373
|
|
(807
|
)
|
08/13
|
40 years
|
||||||||||||||||||
|
Coppell, TX
|
—
|
|
1,547
|
|
10,168
|
|
—
|
|
1,547
|
|
10,168
|
|
11,715
|
|
(615
|
)
|
09/13
|
30 years
|
||||||||||||||||||
|
Las Vegas, NV
|
—
|
|
944
|
|
9,191
|
|
—
|
|
944
|
|
9,191
|
|
10,135
|
|
(828
|
)
|
09/13
|
30 years
|
||||||||||||||||||
|
Las Vegas, NV
|
—
|
|
985
|
|
6,721
|
|
145
|
|
985
|
|
6,866
|
|
7,851
|
|
(616
|
)
|
09/13
|
30 years
|
||||||||||||||||||
|
Mesa, AZ
|
—
|
|
762
|
|
6,987
|
|
—
|
|
762
|
|
6,987
|
|
7,749
|
|
(882
|
)
|
01/14
|
30 years
|
||||||||||||||||||
128
|
EPR Properties
Schedule III - Real Estate and Accumulated Depreciation
December 31, 2016
(Dollars in thousands)
|
||||||||||||||||||||||||||||||||||||
|
|
|
Initial cost
|
Additions (Dispositions) (Impairments) Subsequent to acquisition
|
Gross Amount at December 31, 2016
|
|
|
|
|||||||||||||||||||||||||||||
|
Location
|
Debt
|
Land
|
Buildings,
Equipment &
improvements
|
Land
|
Buildings,
Equipment &
Improvements
|
Total
|
Accumulated
depreciation
|
Date
acquired
|
Depreciation
life
|
|||||||||||||||||||||||||||
|
Gilbert, AZ
|
—
|
|
1,295
|
|
9,192
|
|
—
|
|
1,295
|
|
9,192
|
|
10,487
|
|
(673
|
)
|
03/14
|
30 years
|
||||||||||||||||||
|
Cedar Park, TX
|
—
|
|
1,520
|
|
10,500
|
|
(402
|
)
|
1,278
|
|
10,340
|
|
11,618
|
|
(506
|
)
|
07/14
|
30 years
|
||||||||||||||||||
|
Thornton, CO
|
—
|
|
1,384
|
|
10,542
|
|
—
|
|
1,384
|
|
10,542
|
|
11,926
|
|
(308
|
)
|
07/14
|
30 years
|
||||||||||||||||||
|
Chicago, IL
|
—
|
|
1,294
|
|
4,375
|
|
—
|
|
1,294
|
|
4,375
|
|
5,669
|
|
(24
|
)
|
07/14
|
30 years
|
||||||||||||||||||
|
Centennial, CO
|
—
|
|
1,249
|
|
10,771
|
|
534
|
|
1,249
|
|
11,305
|
|
12,554
|
|
(514
|
)
|
08/14
|
30 years
|
||||||||||||||||||
|
McKinney, TX
|
—
|
|
1,812
|
|
12,419
|
|
—
|
|
1,812
|
|
12,419
|
|
14,231
|
|
(473
|
)
|
11/14
|
30 years
|
||||||||||||||||||
|
Parker, CO
|
—
|
|
279
|
|
1,017
|
|
—
|
|
279
|
|
1,017
|
|
1,296
|
|
(71
|
)
|
01/15
|
30 years
|
||||||||||||||||||
|
Littleton, CO
|
—
|
|
467
|
|
1,248
|
|
—
|
|
467
|
|
1,248
|
|
1,715
|
|
(80
|
)
|
01/15
|
30 years
|
||||||||||||||||||
|
Lakewood, CO
|
—
|
|
291
|
|
823
|
|
—
|
|
291
|
|
823
|
|
1,114
|
|
(52
|
)
|
01/15
|
30 years
|
||||||||||||||||||
|
Castle Rock, CO
|
—
|
|
250
|
|
1,646
|
|
—
|
|
250
|
|
1,646
|
|
1,896
|
|
(101
|
)
|
01/15
|
30 years
|
||||||||||||||||||
|
Arvada, CO
|
—
|
|
224
|
|
788
|
|
—
|
|
224
|
|
788
|
|
1,012
|
|
(50
|
)
|
01/15
|
30 years
|
||||||||||||||||||
|
Emeryville, CA
|
—
|
|
1,814
|
|
5,780
|
|
—
|
|
1,814
|
|
5,780
|
|
7,594
|
|
(161
|
)
|
03/15
|
30 years
|
||||||||||||||||||
|
Lafayette, CO
|
—
|
|
293
|
|
663
|
|
47
|
|
293
|
|
710
|
|
1,003
|
|
(46
|
)
|
04/15
|
30 years
|
||||||||||||||||||
|
Maple Grove, MN
|
—
|
|
3,743
|
|
14,927
|
|
—
|
|
3,743
|
|
14,927
|
|
18,670
|
|
(282
|
)
|
08/15
|
30 years
|
||||||||||||||||||
|
Carmel, IN
|
—
|
|
1,567
|
|
12,854
|
|
—
|
|
1,567
|
|
12,854
|
|
14,421
|
|
(87
|
)
|
09/15
|
30 years
|
||||||||||||||||||
|
Atlanta, GA
|
—
|
|
956
|
|
1,850
|
|
—
|
|
956
|
|
1,850
|
|
2,806
|
|
(77
|
)
|
10/15
|
30 years
|
||||||||||||||||||
|
Atlanta, GA
|
—
|
|
1,262
|
|
2,038
|
|
—
|
|
1,262
|
|
2,038
|
|
3,300
|
|
(85
|
)
|
10/15
|
30 years
|
||||||||||||||||||
|
Louisville, KY
|
—
|
|
377
|
|
1,526
|
|
—
|
|
377
|
|
1,526
|
|
1,903
|
|
(21
|
)
|
08/16
|
30 years
|
||||||||||||||||||
|
Louisville, KY
|
—
|
|
216
|
|
1,006
|
|
—
|
|
216
|
|
1,006
|
|
1,222
|
|
(14
|
)
|
08/16
|
30 years
|
||||||||||||||||||
|
Louisville, KY
|
—
|
|
481
|
|
2,050
|
|
—
|
|
481
|
|
2,050
|
|
2,531
|
|
(6
|
)
|
12/16
|
30 years
|
||||||||||||||||||
|
Bala Cynwyd, PA
|
—
|
|
1,785
|
|
3,759
|
|
—
|
|
1,785
|
|
3,759
|
|
5,544
|
|
(10
|
)
|
12/16
|
30 years
|
||||||||||||||||||
|
Private Schools
|
||||||||||||||||||||||||||||||||||||
|
San Jose, CA
|
—
|
|
9,966
|
|
25,535
|
|
—
|
|
9,966
|
|
25,535
|
|
35,501
|
|
(1,922
|
)
|
12/13
|
40 years
|
||||||||||||||||||
|
Brooklyn, NY
|
—
|
|
—
|
|
46,440
|
|
417
|
|
—
|
|
46,857
|
|
46,857
|
|
(2,077
|
)
|
12/13
|
40 years
|
||||||||||||||||||
|
Chicago, IL
|
—
|
|
3,057
|
|
46,784
|
|
—
|
|
3,057
|
|
46,784
|
|
49,841
|
|
(1,754
|
)
|
02/14
|
40 years
|
||||||||||||||||||
|
McLean, VA
|
—
|
|
12,792
|
|
43,472
|
|
—
|
|
12,792
|
|
43,472
|
|
56,264
|
|
(364
|
)
|
06/15
|
40 years
|
||||||||||||||||||
|
Mission Viejo, CA
|
—
|
|
1,378
|
|
3,687
|
|
—
|
|
1,378
|
|
3,687
|
|
5,065
|
|
(41
|
)
|
09/16
|
30 years
|
||||||||||||||||||
|
|
|
|
|
|
|
|
|
|
||||||||||||||||||||||||||||
|
Ski Areas
|
||||||||||||||||||||||||||||||||||||
|
Bellfontaine, OH
|
—
|
|
5,108
|
|
5,994
|
|
8,441
|
|
5,251
|
|
14,292
|
|
19,543
|
|
(2,975
|
)
|
11/05
|
40 years
|
||||||||||||||||||
|
Tannersville, PA
|
—
|
|
34,940
|
|
34,629
|
|
913
|
|
34,940
|
|
35,542
|
|
70,482
|
|
(8,754
|
)
|
09/13
|
40 years
|
||||||||||||||||||
|
McHenry, MD
|
—
|
|
8,394
|
|
15,910
|
|
3,207
|
|
9,708
|
|
17,803
|
|
27,511
|
|
(4,465
|
)
|
12/12
|
40 years
|
||||||||||||||||||
|
Wintergreen, VA
|
—
|
|
5,739
|
|
16,126
|
|
—
|
|
5,739
|
|
16,126
|
|
21,865
|
|
(1,747
|
)
|
02/15
|
40 years
|
||||||||||||||||||
|
Waterparks
|
||||||||||||||||||||||||||||||||||||
|
Tannersville, PA
|
—
|
|
—
|
|
120,354
|
|
—
|
|
—
|
|
120,354
|
|
120,354
|
|
(4,263
|
)
|
05/15
|
40 years
|
||||||||||||||||||
|
Golf Entertainment Complexes
|
||||||||||||||||||||||||||||||||||||
|
Colony, TX
|
—
|
|
4,004
|
|
13,665
|
|
(240
|
)
|
4,004
|
|
13,425
|
|
17,429
|
|
(1,007
|
)
|
12/12
|
40 years
|
||||||||||||||||||
|
Allen, TX
|
—
|
|
—
|
|
10,007
|
|
1,151
|
|
—
|
|
11,158
|
|
11,158
|
|
(1,776
|
)
|
02/12
|
29 years
|
||||||||||||||||||
129
|
EPR Properties
Schedule III - Real Estate and Accumulated Depreciation
December 31, 2016
(Dollars in thousands)
|
||||||||||||||||||||||||||||||||||||
|
|
|
Initial cost
|
Additions (Dispositions) (Impairments) Subsequent to acquisition
|
Gross Amount at December 31, 2016
|
|
|
|
|||||||||||||||||||||||||||||
|
Location
|
Debt
|
Land
|
Buildings,
Equipment &
improvements
|
Land
|
Buildings,
Equipment &
Improvements
|
Total
|
Accumulated
depreciation
|
Date
acquired
|
Depreciation
life
|
|||||||||||||||||||||||||||
|
Dallas, TX
|
—
|
|
—
|
|
10,007
|
|
1,771
|
|
—
|
|
11,778
|
|
11,778
|
|
(1,778
|
)
|
02/12
|
30 years
|
||||||||||||||||||
|
Houston, TX
|
—
|
|
—
|
|
12,403
|
|
394
|
|
—
|
|
12,797
|
|
12,797
|
|
(1,334
|
)
|
09/12
|
40 years
|
||||||||||||||||||
|
Alpharetta, GA
|
—
|
|
5,608
|
|
16,616
|
|
—
|
|
5,608
|
|
16,616
|
|
22,224
|
|
(1,038
|
)
|
05/13
|
40 years
|
||||||||||||||||||
|
Scottsdale, AZ
|
—
|
|
—
|
|
16,942
|
|
—
|
|
—
|
|
16,942
|
|
16,942
|
|
(1,059
|
)
|
06/13
|
40 years
|
||||||||||||||||||
|
Spring, TX
|
—
|
|
4,928
|
|
14,522
|
|
—
|
|
4,928
|
|
14,522
|
|
19,450
|
|
(968
|
)
|
07/13
|
40 years
|
||||||||||||||||||
|
San Antonio, TX
|
—
|
|
—
|
|
15,976
|
|
—
|
|
—
|
|
15,976
|
|
15,976
|
|
(732
|
)
|
12/13
|
40 years
|
||||||||||||||||||
|
Tampa, FL
|
—
|
|
—
|
|
15,726
|
|
(67
|
)
|
—
|
|
15,659
|
|
15,659
|
|
(824
|
)
|
02/14
|
40 years
|
||||||||||||||||||
|
Gilbert, AZ
|
—
|
|
4,735
|
|
16,130
|
|
(267
|
)
|
4,735
|
|
15,863
|
|
20,598
|
|
(793
|
)
|
02/14
|
40 years
|
||||||||||||||||||
|
Overland Park, KS
|
—
|
|
5,519
|
|
17,330
|
|
—
|
|
5,519
|
|
17,330
|
|
22,849
|
|
(642
|
)
|
05/14
|
40 years
|
||||||||||||||||||
|
Centennial, CO
|
—
|
|
3,013
|
|
19,106
|
|
403
|
|
3,013
|
|
19,509
|
|
22,522
|
|
(645
|
)
|
06/14
|
40 years
|
||||||||||||||||||
|
Atlanta, GA
|
—
|
|
8,143
|
|
17,289
|
|
—
|
|
8,143
|
|
17,289
|
|
25,432
|
|
(612
|
)
|
06/14
|
40 years
|
||||||||||||||||||
|
Ashburn VA
|
—
|
|
—
|
|
16,873
|
|
—
|
|
—
|
|
16,873
|
|
16,873
|
|
(562
|
)
|
06/14
|
40 years
|
||||||||||||||||||
|
Naperville, IL
|
—
|
|
8,824
|
|
20,279
|
|
(665
|
)
|
8,824
|
|
19,614
|
|
28,438
|
|
(654
|
)
|
08/14
|
40 years
|
||||||||||||||||||
|
Oklahoma City, OK
|
—
|
|
3,086
|
|
16,421
|
|
(252
|
)
|
3,086
|
|
16,169
|
|
19,255
|
|
(606
|
)
|
09/14
|
40 years
|
||||||||||||||||||
|
Webster, TX
|
—
|
|
5,631
|
|
17,732
|
|
1,220
|
|
5,631
|
|
18,952
|
|
24,583
|
|
(530
|
)
|
11/14
|
40 years
|
||||||||||||||||||
|
Virginia Beach, VA
|
—
|
|
6,948
|
|
18,715
|
|
296
|
|
6,948
|
|
19,011
|
|
25,959
|
|
(472
|
)
|
12/14
|
40 years
|
||||||||||||||||||
|
Edison, NJ
|
—
|
|
—
|
|
22,792
|
|
—
|
|
—
|
|
22,792
|
|
22,792
|
|
—
|
|
04/15
|
40 years
|
||||||||||||||||||
|
Jacksonville, FL
|
—
|
|
6,732
|
|
21,823
|
|
—
|
|
6,732
|
|
21,823
|
|
28,555
|
|
(129
|
)
|
09/15
|
40 years
|
||||||||||||||||||
|
Roseville, CA
|
—
|
|
6,868
|
|
23,959
|
|
—
|
|
6,868
|
|
23,959
|
|
30,827
|
|
(176
|
)
|
10/15
|
30 years
|
||||||||||||||||||
|
Portland, OR
|
—
|
|
—
|
|
23,466
|
|
—
|
|
—
|
|
23,466
|
|
23,466
|
|
(232
|
)
|
11/15
|
40 years
|
||||||||||||||||||
|
|
|
|
|
|||||||||||||||||||||||||||||||||
|
Other
|
||||||||||||||||||||||||||||||||||||
|
Kiamesha Lake, NY
|
—
|
|
155,658
|
|
—
|
|
—
|
|
155,658
|
|
—
|
|
155,658
|
|
—
|
|
07/10
|
n/a
|
||||||||||||||||||
|
Property under development
|
—
|
|
297,110
|
|
—
|
|
—
|
|
297,110
|
|
—
|
|
297,110
|
|
—
|
|
n/a
|
n/a
|
||||||||||||||||||
|
Land held for development
|
—
|
|
22,530
|
|
—
|
|
—
|
|
22,530
|
|
—
|
|
22,530
|
|
—
|
|
n/a
|
n/a
|
||||||||||||||||||
|
Senior unsecured notes payable and term loan
|
2,315,000
|
|
—
|
|
—
|
|
—
|
|
—
|
|
—
|
|
—
|
|
—
|
|
n/a
|
n/a
|
||||||||||||||||||
|
Less: deferred financing costs, net
|
(29,320
|
)
|
—
|
|
—
|
|
—
|
|
—
|
|
—
|
|
—
|
|
—
|
|
||||||||||||||||||||
|
Total
|
$
|
2,485,625
|
|
$
|
1,240,264
|
|
$
|
3,008,117
|
|
$
|
302,556
|
|
$
|
1,237,388
|
|
$
|
3,313,549
|
|
$
|
4,550,937
|
|
$
|
(635,535
|
)
|
||||||||||||
|
|
|
|
|
|||||||||||||||||||||||||||||||||
130
|
EPR Properties
Schedule III - Real Estate and Accumulated Depreciation (continued)
Reconciliation
(Dollars in thousands)
December 31, 2016
|
|||
|
Real Estate:
|
|||
|
Reconciliation:
|
|||
|
Balance at beginning of the year
|
$
|
3,962,032
|
|
|
Acquisition and development of rental properties during the year
|
613,311
|
|
|
|
Disposition of rental properties during the year
|
(24,406
|
)
|
|
|
Balance at close of year
|
$
|
4,550,937
|
|
|
Accumulated Depreciation
|
|||
|
Reconciliation:
|
|||
|
Balance at beginning of the year
|
$
|
534,303
|
|
|
Depreciation during the year
|
105,121
|
|
|
|
Disposition of rental properties during the year
|
(3,889
|
)
|
|
|
Balance at close of year
|
$
|
635,535
|
|
See accompanying report of independent registered public accounting firm.
131
Item 9.
Changes in and Disagreements with Accountants on Accounting and Financial Disclosure
Not applicable.
Item 9A.
Controls and Procedures
As of the end of the period covered by this report, we carried out an evaluation, under the supervision and with the participation of our management, including our Chief Executive Officer and Chief Financial Officer, of the effectiveness of the design and operation of our disclosure controls and procedures, as such term is defined in Rules 13a-15(e) and 15d-15(e) of the Exchange Act. Based upon that evaluation, our Chief Executive Officer and Chief Financial Officer concluded that as of the end of the period covered by this report our disclosure controls and procedures were effective to ensure that information required to be disclosed by us in reports we file or submit under the Exchange Act is (1) recorded, processed, summarized and reported within the time periods specified in Securities and Exchange Commission rules and forms, and (2) accumulated and communicated to our management, including our Chief Executive Officer and Chief Financial Officer, to allow timely decisions regarding required disclosure.
Our disclosure controls were designed to provide reasonable assurance that the controls and procedures would meet their objectives. Our management, including the Chief Executive Officer and Chief Financial Officer, does not expect that our disclosure controls will prevent all errors and fraud. A control system, no matter how well designed and operated, can provide only reasonable assurance of achieving the designed control objectives and management is required to apply its judgment in evaluating the cost-benefit relationship of possible controls and procedures. Because of the inherent limitations in all control systems, no evaluation of controls can provide absolute assurance that all control issues and instances of fraud, if any, within the Company have been detected. These inherent limitations include the realities that judgments in decision-making can be faulty, and that breakdowns can occur because of simple error or mistake. Additionally, controls can be circumvented by the individual acts of some persons, by collusions of two or more people, or by management override of the control. Because of the inherent limitations in a cost-effective, maturing control system, misstatements due to error or fraud may occur and not be detected.
There have not been any changes in the Company’s internal control over financial reporting (as defined in Rule 13a-15(f) and 15d-15(f) under the Exchange Act) during the fourth quarter of the fiscal year to which this report relates that have materially affected, or are reasonably likely to materially affect, the Company’s internal control over financial reporting.
Management’s Report on Internal Control Over Financial Reporting
Our management is responsible for establishing and maintaining adequate internal control over financial reporting, as such term is defined in Rules 13a-15(f) and 15d-15(f) of the Exchange Act. Under the supervision and with the participation of our management, including our Chief Executive Officer and Chief Financial Officer, we conducted an evaluation of the effectiveness of our internal control over financial reporting based on the framework in
Internal Control – Integrated Framework (2013)
issued by the Committee of Sponsoring Organizations of the Treadway Commission. Based on our evaluation under the framework in
Internal Control–Integrated Framework (2013)
, our management concluded that our internal control over financial reporting was effective as of December 31, 2016. KPMG LLP, the independent registered public accounting firm that audited the consolidated financial statements included in this Annual Report on Form 10-K, has issued a report on the effectiveness of our internal control over financial reporting.
Because of its inherent limitations, internal control over financial reporting may not prevent or detect misstatements, errors or fraud. Also, projections of any evaluation of effectiveness to future periods are subject to the risk that controls may become inadequate because of changes in conditions, or that the degree of or compliance with the policies or procedures may deteriorate.
132
Report of Independent Registered Public Accounting Firm
The Board of Trustees and Shareholders
EPR Properties:
We have audited EPR Properties’ internal control over financial reporting as of December 31, 2016, based on criteria established in
Internal Control - Integrated Framework
(2013) issued by the Committee of Sponsoring Organizations of the Treadway Commission (COSO). EPR Properties’ management is responsible for maintaining effective internal control over financial reporting and for its assessment of the effectiveness of internal control over financial reporting, included in the accompanying Management’s Report on Internal Control Over Financial Reporting. Our responsibility is to express an opinion on the Company’s internal control over financial reporting based on our audit.
We conducted our audit in accordance with the standards of the Public Company Accounting Oversight Board (United States). Those standards require that we plan and perform the audit to obtain reasonable assurance about whether effective internal control over financial reporting was maintained in all material respects. Our audit included obtaining an understanding of internal control over financial reporting, assessing the risk that a material weakness exists, and testing and evaluating the design and operating effectiveness of internal control based on the assessed risk. Our audit also included performing such other procedures as we considered necessary in the circumstances. We believe that our audit provides a reasonable basis for our opinion.
A company’s internal control over financial reporting is a process designed to provide reasonable assurance regarding the reliability of financial reporting and the preparation of financial statements for external purposes in accordance with generally accepted accounting principles. A company’s internal control over financial reporting includes those policies and procedures that (1) pertain to the maintenance of records that, in reasonable detail, accurately and fairly reflect the transactions and dispositions of the assets of the company; (2) provide reasonable assurance that transactions are recorded as necessary to permit preparation of financial statements in accordance with generally accepted accounting principles, and that receipts and expenditures of the company are being made only in accordance with authorizations of management and directors of the company; and (3) provide reasonable assurance regarding prevention or timely detection of unauthorized acquisition, use, or disposition of the company’s assets that could have a material effect on the financial statements.
Because of its inherent limitations, internal control over financial reporting may not prevent or detect misstatements. Also, projections of any evaluation of effectiveness to future periods are subject to the risk that controls may become inadequate because of changes in conditions, or that the degree of compliance with the policies or procedures may deteriorate.
In our opinion, EPR Properties maintained, in all material respects, effective internal control over financial reporting as of December 31, 2016, based on criteria established in
Internal Control - Integrated Framework
(2013) issued by the Committee of Sponsoring Organizations of the Treadway Commission (COSO).
We also have audited, in accordance with the standards of the Public Company Accounting Oversight Board (United States), the consolidated balance sheets of EPR Properties and subsidiaries as of December 31, 2016 and 2015, and the related consolidated statements of income, comprehensive income, changes in equity, and cash flows for each of the years in the three-year period ended December 31, 2016, and our report dated
February 28, 2017
expressed an unqualified opinion on those consolidated financial statements.
/s/ KPMG LLP
|
Kansas City, Missouri
|
|
February 28, 2017
|
133
Not applicable.
The Company’s definitive Proxy Statement for its Annual Meeting of Shareholders to be held on May 31, 2017 (the “Proxy Statement”), contains under the captions “Election of Trustees”, “Company Governance”, “Executive Officers”, and “Section 16(a) Beneficial Ownership Reporting Compliance” the information required by Item 10 of this Annual Report on Form 10-K, which information is incorporated herein by this reference.
We have adopted a Code of Business Conduct and Ethics that applies to our Chief Executive Officer, Chief Financial Officer, and all other officers, employees and trustees. The Code of Business Conduct and Ethics may be viewed on our website at www.eprkc.com. Changes to and waivers granted with respect to the Code of Business Conduct and Ethics required to be disclosed pursuant to applicable rules and regulations will be posted on our website.
Item 11.
Executive Compensation
The Proxy Statement contains under the captions “Election of Trustees”, “Executive Compensation”, and “Compensation Committee Report”, the information required by Item 11 of this Annual Report on Form 10-K, which information is incorporated herein by this reference.
Item 12.
Security Ownership of Certain Beneficial Owners and Management and Related Stockholder Matters
The Proxy Statement contains under the captions “Share Ownership” and “Equity Compensation Plan Information” the information required by Item 12 of this Annual Report on Form 10-K, which information is incorporated herein by this reference.
Item 13.
Certain Relationships and Related Transactions, and Director Independence
The Proxy Statement contains under the caption “Transactions Between the Company and Trustees, Officers or their Affiliates” the information required by Item 13 of this Annual Report on Form 10-K, which information is incorporated herein by this reference.
Item 14.
Principal Accounting Fees and Services
The Proxy Statement contains under the caption “Ratification of Appointment of Independent Registered Public Accounting Firm” the information required by Item 14 of this Annual Report on Form 10-K, which information is incorporated herein by this reference.
134
Item 15.
Exhibits and Financial Statement Schedules
(1)
Financial Statements: See Part II, Item 8 hereof
Report of Independent Registered Public Accounting Firm
Consolidated Balance Sheets as of
December 31, 2016 and 2015
Consolidated Statements of Income for the years ended
December 31, 2016, 2015 and 2014
Consolidated Statements of Comprehensive Income for the years ended
December 31, 2016, 2015 and 2014
Consolidated Statements of Changes in Equity for the years ended
December 31, 2016, 2015 and 2014
Consolidated Statements of Cash Flows for the years ended
December 31, 2016, 2015 and 2014
Notes to Consolidated Financial Statements
|
(2)
|
Financial Statement Schedules
:
See Part II, Item 8 hereof
|
Schedule II – Valuation and Qualifying Accounts
Schedule III – Real Estate and Accumulated Depreciation
|
(3)
|
Exhibits
|
The exhibits listed in the Exhibit Index immediately preceding the exhibits are filed as part of this Annual Report on Form 10-K or incorporated by reference as indicated below.
Item 16.
Form 10-K Summary
None.
135
SIGNATURES
Pursuant to the requirements of Section 13 or 15(d) of the Securities Exchange Act of 1934, the registrant has duly caused this report to be signed on its behalf by the undersigned, thereunto duly authorized.
|
EPR Properties
|
||||
|
Dated:
|
February 28, 2017
|
By
|
|
/s/ Gregory K. Silvers
|
|
|
Gregory K. Silvers, President and Chief Executive
Officer (Principal Executive Officer)
|
|||
Pursuant to the requirements of the Securities Exchange Act of 1934, this report has been signed below by the following persons on behalf of the registrant and in the capacities and on the dates indicated.
|
Signature and Title
|
|
Date
|
|
/s/ Robert J. Druten
|
February 28, 2017
|
|
|
Robert J. Druten, Chairman of the Board
|
||
|
/s/ Gregory K. Silvers
|
February 28, 2017
|
|
|
Gregory K. Silvers, President, Chief Executive Officer
(Principal Executive Officer) and Trustee
|
||
|
/s/ Mark A. Peterson
|
February 28, 2017
|
|
|
Mark A. Peterson, Executive Vice President, Chief Financial Officer and Treasurer (Principal Financial Officer)
|
||
|
/s/ Tonya L. Mater
|
February 28, 2017
|
|
|
Tonya L. Mater, Vice President and Chief Accounting Officer (Principal Accounting Officer)
|
||
|
/s/ Thomas M. Bloch
|
February 28, 2017
|
|
|
Thomas M. Bloch, Trustee
|
||
|
/s/ Barrett Brady
|
February 28, 2017
|
|
|
Barrett Brady, Trustee
|
||
|
/s/ Peter Brown
|
February 28, 2017
|
|
|
Peter Brown, Trustee
|
|
|
|
/s/ Jack A. Newman, Jr.
|
February 28, 2017
|
|
|
Jack A. Newman, Jr., Trustee
|
||
|
/s/ Robin P. Sterneck
|
February 28, 2017
|
|
|
Robin P. Sterneck, Trustee
|
|
|
136
Exhibit Index
The Company has incorporated by reference certain exhibits as specified below pursuant to Rule 12b-32 under the Exchange Act.
|
2.1
|
|
Purchase and Sale Agreement by and among the Company, CNL Lifestyle Properties, Inc., CLP Partners LP, Ski Resort Holdings LLC and the other Sellers named therein, dated as of November 2, 2016, which is attached as Exhibit 2.1 to the Company's Form 8-K (Commission File No. 001-13561) filed on November 3, 2016, is hereby incorporated by reference as Exhibit 2.1
|
|
3.1
|
|
Composite of Amended and Restated Declaration of Trust of the Company, as amended (inclusive of all amendments through May 12, 2016), which is attached as Exhibit 3.1 to the Company’s Form 10-Q (Commission File No. 001-13561) filed on August 4, 2016, is hereby incorporated by reference as Exhibit 3.1
|
|
3.2
|
|
Articles Supplementary designating the powers, preferences and rights of the 9.50% Series A Cumulative Redeemable Preferred Shares, which is attached as Exhibit 4.4 to the Company's Form 8-A12B (Commission File No. 001-13561) filed on May 24, 2002, is hereby incorporated by reference as Exhibit 3.2
|
|
3.3
|
|
Articles Supplementary designating the powers, preferences and rights of the 7.75% Series B Cumulative Redeemable Preferred Shares, which is attached as Exhibit 4.6 to the Company's Form 8-A12BA (Commission File No. 001-13561) filed on January 14, 2005, and to the Company's Form 8-K filed on January 14, 2005, is hereby incorporated by reference as Exhibit 3.3
|
|
3.4
|
|
Articles Supplementary designating the powers, preferences and rights of the 5.75% Series C Cumulative Convertible Preferred Shares, which is attached as Exhibit 3.2 to the Company's Form 8-K (Commission File No. 001-13561) filed on December 21, 2006, is hereby incorporated by reference as Exhibit 3.4
|
|
3.5
|
|
Articles Supplementary designating the powers, preferences and rights of the 7.375% Series D Cumulative Redeemable Preferred Shares, which is attached as Exhibit 3.2 to the Company's Form 8-K (Commission File No. 001-13561) filed on May 4, 2007, is hereby incorporated by reference as Exhibit 3.5
|
|
3.6
|
|
Articles Supplementary designating powers, preferences and rights of the 9.0% Series E Cumulative Convertible Preferred Shares, which is attached as Exhibit 3.1 to the Company's Form 8-K (Commission File No. 001-13561) filed on April 2, 2008, is hereby incorporated by reference as Exhibit 3.6
|
|
3.7
|
Articles Supplementary designating the powers, preferences and rights of the 6.625% Series F Cumulative Redeemable Preferred Shares, which is attached as Exhibit 3.1 to the Company's Form 8-K (Commission File No. 001-13561) filed on October 12, 2012, is hereby incorporated by reference as Exhibit 3.7
|
|
|
3.8
|
|
Amended and Restated Bylaws of the Company (inclusive of all amendments through December 5, 2014), which is attached as Exhibit 3.8 to the Company's Form 10-K (Commission File No. 001-13561) filed on February 25, 2015, is hereby incorporated by reference as Exhibit 3.8
|
|
4.1
|
|
Form of share certificate for common shares of beneficial interest of the Company, which is attached as Exhibit 4.3 to the Company's Registration Statement on Form S-3ASR (Registration No. 333-35281), filed on June 3, 2013, is hereby incorporated by reference as Exhibit 4.1
|
|
4.2
|
|
Form of 9.50% Series A Cumulative Redeemable Preferred Share Certificate, which is attached as Exhibit 4.5 to the Company's Form 8-A12B (Commission File No. 001-13561) filed on May 24, 2002, is hereby incorporated by reference as Exhibit 4.2
|
|
4.3
|
|
Form of 7.75% Series B Cumulative Redeemable Preferred Share Certificate, which is attached as Exhibit 4.7 to the Company's Form 8-A12B (Commission File No. 001-13561) filed on January 12, 2005, is hereby incorporated by reference as Exhibit 4.3
|
|
4.4
|
|
Form of 5.75% Series C Cumulative Convertible Preferred Shares Certificate, which is attached as Exhibit 4.1 to the Company's Form 8-K (Commission File No. 001-13561) filed on December 21, 2006, is hereby incorporated by reference as Exhibit 4.4
|
|
4.5
|
|
Form of 7.375% Series D Cumulative Redeemable Preferred Shares Certificate, which is attached as Exhibit 4.1 to the Company's Form 8-K (Commission File No. 001-13561) filed on May 4, 2007, is hereby incorporated by reference as Exhibit 4.5
|
|
4.6
|
|
Form of 9.00% Series E Cumulative Convertible Preferred Shares, which is attached as Exhibit 4.1 to the Company's Form 8-K (Commission File No. 001-13561) filed on April 2, 2008, is hereby incorporated by reference as Exhibit 4.6.
|
137
|
4.7
|
Form of 6.625% Series F Cumulative Redeemable Preferred Shares Certificate, which is attached as Exhibit 4.1 to the Company's Form 8-K (Commission File No. 001-13561) filed on October 12, 2012, is hereby incorporated by reference as Exhibit 4.7
|
|
|
4.8
|
|
Agreement Regarding Ownership Limit Waiver between the Company and Cohen & Steers Capital Management, Inc., which is attached as Exhibit 4.7 to the Company's Form 8-K (Commission File No. 001-13561) filed on January 19, 2005, is hereby incorporated by reference as Exhibit 4.8
|
|
4.9
|
|
Agreement Regarding Ownership Limit Waiver between the Company and ING Clarion Real Estate Securities, which is attached as Exhibit 4.1 to the Company's Form 8-K (Commission File No. 001-13561) filed on May 14, 2007, is hereby incorporated by reference as Exhibit 4.9
|
|
4.10
|
|
Agreement Regarding Ownership Limit Waiver between the Company and Blackrock, Inc. and its subsidiaries, which is attached as Exhibit 4.10 to the Company's Form 10-K (Commission File No. 001-13561) filed on March 1, 2010, is hereby incorporated as Exhibit 4.10
|
|
4.11
|
Agreement Regarding Ownership Limit Waiver between the Company and CBRE Clarion Securities LLC, which is attached as Exhibit 4.3 to the Company's Form 8-K (Commission File No. 001-13561) filed on October 11, 2012, is hereby incorporated as Exhibit 4.11
|
|
|
4.12
|
Ownership Limit Waiver Agreement, dated October 31, 2014, between the Company and Cohen & Steers Capital Management, Inc., which is attached as Exhibit 4.1 to the Company's Form 8-K (Commission File No. 001-13561) filed on November 6, 2014, is hereby incorporated by reference as Exhibit 4.12
|
|
|
4.13
|
Ownership Limit Waiver Agreement, dated as of July 8, 2015, between the Company and Nuveen Asset Management, LLC, which is attached as Exhibit 4.5 to the Company's Form 10-Q (Commission File No. 001-13561) filed on October 29, 2015, is hereby incorporated by reference as Exhibit 4.13
|
|
|
4.14
|
Indenture, dated June 30, 2010, among the Company, certain of its subsidiaries, and UMB Bank, N.A. as trustee, which is attached as Exhibit 4.1 to the Company's Form 8-K (Commission File No. 001-13561) filed on July 1, 2010, is hereby incorporated by reference as Exhibit 4.14
|
|
|
4.15
|
Form of 7.750% Senior Notes due 2020 (included as Exhibit A to Exhibit 4.14 above)
|
|
|
4.16
|
Indenture, dated August 8, 2012, among the Company, certain of its subsidiaries, and U.S. Bank National Association. as trustee, which is attached as Exhibit 4.1 to the Company's Form 8-K (Commission File No. 001-13561) filed on August 8, 2012, is hereby incorporated by reference as Exhibit 4.16
|
|
|
4.17
|
Form of 5.750% Senior Notes due 2022 (included as Exhibit A to Exhibit 4.16 above)
|
|
|
4.18
|
Indenture, dated June 18, 2013, among the Company, certain of its subsidiaries, as guarantors, and U.S. Bank National Association, as trustee, which is attached as Exhibit 4.1 to the Company's Form 8-K (Commission File No. 001-13561) filed on June 18, 2013, is hereby incorporated by reference as Exhibit 4.18
|
|
|
4.19
|
Form of 5.250% Senior Note due 2023 (included as Exhibit A to Exhibit 4.18 above)
|
|
|
4.20
|
Indenture, dated March 16, 2015, among the Company, certain of its subsidiaries, as guarantors, and UMB Bank, n.a., as trustee, which is attached as Exhibit 4.1 to the Company's Form 8-K (Commission File No. 001-13561) filed on March 16, 2015, is hereby incorporated by reference as Exhibit 4.20
|
|
|
4.21
|
Form of 4.500% Senior Note due 2025 (included as Exhibit A to Exhibit 4.20 above)
|
|
|
4.22
|
Note Purchase Agreement, dated as of August 1, 2016, by and among the Company and the purchasers named therein, which is attached as Exhibit 4.1 to the Company's Form 8-K (Commission File No. 001-13561) filed on August 3, 2016, is hereby incorporated by reference as Exhibit 4.22
|
|
|
4.23
|
Ownership Limit Waiver Agreement, dated as of September 19, 2016, between the Company and Invesco Advisers, Inc., which is attached as Exhibit 4.6 to the Company's Form 10-Q (Commission File No. 001-13561) filed on November 3, 2016, is hereby incorporated by reference as Exhibit 4.23
|
|
|
4.24
|
Indenture, dated December 14, 2016, among the Company, certain of its subsidiaries, as guarantors, and UMB Bank, n.a., as trustee, which is attached as Exhibit 4.1 to the Company's Form 8-K (Commission File No. 001-13561) filed on December 14, 2016, is hereby incorporated by reference as Exhibit 4.24
|
|
|
4.25
|
Form of 4.750% Senior Note due 2026 (included as Exhibit A to Exhibit 4.24 above)
|
|
138
|
10.1
|
Amended, Restated and Consolidated Credit Agreement, dated as of April 24, 2015, among the Company and certain subsidiaries of the Company named therein, as borrowers, KeyBank National Association, as administrative agent, JP Morgan Chase Bank, N.A. and RBC Capital Markets, as co-syndication agents, Citibank, N.A., Bank of America, N.A. and Barclays Bank PLC, as co-documentation agents, KeyBanc Capital Markets, LLC, J.P. Morgan Securities, Inc. and RBC Capital Markets, as joint book runners and joint lead arrangers, and the lenders party thereto, which is attached as Exhibit 10.1 to the Company's Form 8-K (Commission File No. 001-13561) filed on April 27, 2015, is hereby incorporated by reference as Exhibit 10.1
|
|
|
10.2*
|
|
Form of Indemnification Agreement entered into between the Company and each of its trustees and officers, which is attached as Exhibit 10.8 to Amendment No. 1, filed on October 28, 1997, to the Company's Registration Statements on Form S-11 (Registration No. 333-35281), is hereby incorporated by reference as Exhibit 10.2
|
|
10.3*
|
|
Form of Indemnification Agreement, which is attached as Exhibit 10.2 to the Company's Form 8-K (Commission File No. 001-13561) filed on May 14, 2007, is hereby incorporated by reference as Exhibit 10.3
|
|
10.4*
|
Deferred Compensation Plan for Non-Employee Trustees, which is attached as Exhibit 10.10 to Amendment No. 2, filed on November 5, 1997, to the Company's Registration Statement on Form S-11 (Registration No. 333-35281), is hereby incorporated by reference as Exhibit 10.4
|
|
|
10.5*
|
Annual Incentive Program, which is attached as Exhibit 10.11 to Amendment No. 2, filed on November 5, 1997, to the Company's Registration Statement on Form S-11 (Registration No. 333-35281), is hereby incorporated by reference as Exhibit 10.5
|
|
|
10.6*
|
|
First Amended and Restated 1997 Share Incentive Plan included as Appendix D to the Company's definitive proxy statement filed on April 8, 2004 (Commission File No. 001-13561), is hereby incorporated by reference as Exhibit 10.6
|
|
10.7*
|
|
Form of 1997 Share Incentive Plan Restricted Shares Award Agreement, which is attached as Exhibit 10.14 to the Company's Form 10-K (Commission File No. 001-13561) filed on February 28, 2007, is hereby incorporated by reference as Exhibit 10.7
|
|
10.8*
|
|
Form of Option Certificate Issued Pursuant to the Company's 1997 Share Incentive Plan, which is attached as Exhibit 10.15 to the Company's Form 10-K (Commission File No. 001-13561) filed on February 28, 2007, is hereby incorporated by reference as Exhibit 10.8
|
|
10.9*
|
|
2007 Equity Incentive Plan, as amended, which is attached as Exhibit 10.2 to the Company's Form 8-K filed on May 15, 2013 (Commission File No. 001-13561), is hereby incorporated by reference as Exhibit 10.9
|
|
10.10*
|
|
Form of 2007 Equity Incentive Plan Nonqualified Share Option Agreement for Employee Trustees, which is attached as Exhibit 10.2 to the Company's Registration Statement on Form S-8 (Registration No. 333-142831) filed on May 11, 2007, is hereby incorporated by reference as Exhibit 10.10
|
|
10.11*
|
|
Form of 2007 Equity Incentive Plan Nonqualified Share Option Agreement for Non-Employee Trustees, which is attached as Exhibit 10.3 to the Company's Registration Statement on Form S-8 (Registration No. 333-142831) filed on May 11, 2007, is hereby incorporated by reference as Exhibit 10.11
|
|
10.12*
|
|
Form of 2007 Equity Incentive Plan Restricted Shares Agreement for Employees, which is attached as Exhibit 10.4 to the Company's Registration Statement on Form S-8 (Registration No. 333-142831) filed on May 11, 2007, is hereby incorporated by reference as Exhibit 10.12
|
|
10.13*
|
|
Form of 2007 Equity Incentive Plan Restricted Shares Agreement for Non-Employee Trustees, which is attached as Exhibit 10.3 to the Company's Form 8-K filed on May 20, 2009 (Commission File No. 001-13561), is hereby incorporated by reference as Exhibit 10.13
|
|
10.14*
|
Employment Agreement, dated as of May 13, 2015, by and between the Company and Gregory K. Silvers, which is attached as Exhibit 10.1 to the Company's Form 8-K (Commission File No. 001-13561) filed on May 18, 2015, is hereby incorporated by reference as Exhibit 10.14
|
|
|
10.15*
|
Employment Agreement, dated as of May 13, 2015, by and between the Company and Mark A. Peterson, which is attached as Exhibit 10.2 to the Company's Form 8-K (Commission File No. 001-13561) filed on May 18, 2015, is hereby incorporated by reference as Exhibit 10.15
|
|
|
10.16*
|
Employment Agreement, dated as of May 13, 2015, by and between the Company and Morgan G. Earnest II, which is attached as Exhibit 10.3 to the Company's Form 8-K (Commission File No. 001-13561) filed on May 18, 2015, is hereby incorporated by reference as Exhibit 10.16
|
|
139
|
10.17*
|
Employment Agreement, dated as of May 13, 2015, by and between the Company and Craig L. Evans, which is attached as Exhibit 10.4 to the Company's Form 8-K (Commission File No. 001-13561) filed on May 18, 2015, is hereby incorporated by reference as Exhibit 10.17
|
|
|
10.18*
|
Employment Agreement, dated as of May 13, 2015, by and between the Company and Thomas B. Wright, III, which is attached as Exhibit 10.5 to the Company's Form 8-K (Commission File No. 001-13561) filed on May 18, 2015, is hereby incorporated by reference as Exhibit 10.18
|
|
|
10.19*
|
Employment Agreement, dated as of May 13, 2015, by and between the Company and Michael L. Hirons, which is attached as Exhibit 10.6 to the Company's Form 8-K (Commission File No. 001-13561) filed on May 18, 2015, is hereby incorporated by reference as Exhibit 10.19
|
|
|
10.20*
|
Retirement Agreement, effective as of March 31, 2015, by and between the Company and David M. Brain, which is attached as Exhibit 10.1 to the Company's Form 8-K (Commission File No. 001-13561) filed on March 17, 2015, is hereby incorporated by reference as Exhibit 10.20
|
|
|
10.21*
|
Separation Agreement and Release, executed on November 20, 2014, effective as of October 31, 2014, between the Company and Neil E. Sprague, which is attached as Exhibit 10.1 to the Company's Form 8-K (Commission File No. 001-13561) filed on November 24, 2014, is hereby incorporated by reference as Exhibit 10.21
|
|
|
10.22*
|
EPR Properties 2016 Equity Incentive Plan, which is attached as Exhibit 10.1 to the Company's Form 8-K (Commission File No. 001-13561) filed on May 12, 2016, is hereby incorporated by reference as Exhibit 10.22
|
|
|
10.23*
|
Form of 2016 Equity Incentive Plan Incentive and Nonqualified Share Option Award Agreement for Employees, which is attached as Exhibit 10.2 to the Company's Form 8-K (Commission File No. 001-13561) filed on May 12, 2016, is hereby incorporated by reference as Exhibit 10.23
|
|
|
10.24*
|
Form of 2016 Equity Incentive Plan Restricted Shares Award Agreement for Employees, which is attached as Exhibit 10.3 to the Company's Form 8-K (Commission File No. 001-13561) filed on May 12, 2016, is hereby incorporated by reference as Exhibit 10.24
|
|
|
10.25*
|
Form of 2016 Equity Incentive Plan Restricted Share Unit Award Agreement for Non-Employee Trustees, which is attached as Exhibit 10.4 to the Company's Form 8-K (Commission File No. 001-13561) filed on May 12, 2016, is hereby incorporated by reference as Exhibit 10.25
|
|
|
10.26
|
Joint Buyers Agreement by and between the Company and Ski Resort Holdings LLC, dated as of November 2, 2016, which is attached as Exhibit 10.1 to the Company's Form 8-K (Commission File No. 001-13561) filed on November 3, 2016, is hereby incorporated by reference as Exhibit 10.26
|
|
|
12.1
|
|
Computation of Ratio of Earnings to Fixed Charges is attached hereto as Exhibit 12.1
|
|
12.2
|
|
Computation of Ratio of Earnings to Combined Fixed Charges and Preferred Dividends is attached hereto as Exhibit 12.2
|
|
21
|
|
The list of the Company's Subsidiaries is attached hereto as Exhibit 21
|
|
23
|
|
Consent of KPMG LLP is attached hereto as Exhibit 23
|
|
31.1
|
|
Certification of Gregory K. Silvers pursuant to Rule 13a-14(a) or 15d-14(a) of the Securities Exchange Act, as adopted pursuant to Section 302 of the Sarbanes-Oxley Act of 2002 is attached hereto as Exhibit 31.1
|
|
31.2
|
|
Certification of Mark A. Peterson pursuant to Rule 13a-14(a) or 15d-14(a) of the Securities Exchange Act, as adopted pursuant to Section 302 of the Sarbanes-Oxley Act of 2002 is attached hereto as Exhibit 31.2
|
|
32.1
|
|
Certification by Chief Executive Officer pursuant to 18 U.S.C. Section 1350, as adopted pursuant to Section 906 of the Sarbanes-Oxley Act of 2002, is attached hereto as Exhibit 32.1
|
|
32.2
|
|
Certification by Chief Financial Officer pursuant to 18 USC 1350, as adopted pursuant to Section 906 of the Sarbanes-Oxley Act of 2002, is attached hereto as Exhibit 32.2
|
|
101.INS
|
|
XBRL Instance Document
|
|
101.SCH
|
|
XBRL Taxonomy Extension Schema
|
|
101.CAL
|
|
XBRL Extension Calculation Linkbase
|
|
101.DEF
|
|
XBRL Taxonomy Extension Definition Linkbase
|
140
|
101.LAB
|
|
XBRL Taxonomy Extension Label Linkbase
|
|
101.PRE
|
|
XBRL Taxonomy Extension Presentation Linkbase
|
|
* Management contracts or compensatory plans
|
||
PLEASE NOTE: Pursuant to the rules and regulations of the Securities and Exchange Commission, we have filed or incorporated by reference the agreements referenced above as exhibits to this Annual Report on Form 10-K. The agreements have been filed to provide investors with information regarding their respective terms. The agreements are not intended to provide any other factual information about the Company or its business or operations. In particular, the assertions embodied in any representations, warranties and covenants contained in the agreements may be subject to qualifications with respect to knowledge and materiality different from those applicable to investors and may be qualified by information in confidential disclosure schedules not included with the exhibits. These disclosure schedules may contain information that modifies, qualifies and creates exceptions to the representations, warranties and covenants set forth in the agreements. Moreover, certain representations, warranties and covenants in the agreements may have been used for the purpose of allocating risk between the parties, rather than establishing matters as facts. In addition, information concerning the subject matter of the representations, warranties and covenants may have changed after the date of the respective agreement, which subsequent information may or may not be fully reflected in the Company's public disclosures. Accordingly, investors should not rely on the representations, warranties and covenants in the agreements as characterizations of the actual state of facts about the Company or its business or operations on the date hereof.
141
TABLE OF CONTENTS
Part IItem 1. BusinessItem 1A. Risk FactorsItem 1B. Unresolved Staff CommentsItem 2. PropertiesItem 3. Legal ProceedingsItem 4. Mine Safety DisclosuresPart IIItem 5. Market For Registrant S Common Equity, Related Stockholder Matters and Issuer Purchases Of Equity SecuritiesItem 6. Selected Financial DataItem 7. Management S Discussion and Analysis Of Financial Condition and Results Of OperationsItem 7A. Quantitative and Qualitative Disclosures About Market RiskItem 8. Financial Statements and Supplementary DataItem 9. Changes in and Disagreements with Accountants on Accounting and Financial DisclosureItem 9A. Controls and ProceduresItem 9B. Other InformationPart IIIItem 10. Directors, Executive Officers and Corporate GovernanceItem 11. Executive CompensationItem 12. Security Ownership Of Certain Beneficial Owners and Management and Related Stockholder MattersItem 13. Certain Relationships and Related Transactions, and Director IndependenceItem 14. Principal Accounting Fees and ServicesPart IVItem 15. Exhibits and Financial Statement SchedulesItem 16. Form 10-k Summary