UNITED STATES
SECURITIES AND EXCHANGE COMMISSION
Washington, D.C. 20549
FORM
10-K
(Mark One)
|
|
ANNUAL REPORT PURSUANT TO SECTION 13 OR 15(d) OF THE SECURITIES EXCHANGE ACT OF 1934 | ||||
For the fiscal year ended
December 31
, 2020
OR
|
|
TRANSITION REPORT PURSUANT TO SECTION 13 OR 15(d) OF THE SECURITIES EXCHANGE ACT OF 1934 | ||||
For the transition period from to
Commission File Number
001-38530
(Exact name of Registrant as specified in its Charter)
|
|
|
||||||||||
|
(State or other jurisdiction of
incorporation or organization) |
(I.R.S. Employer
Identification No.) |
||||||||||
|
|
|
||||||||||
| (Address of Principal Executive Offices) | (Zip Code) | ||||||||||
|
Registrants telephone number, including area code:
(
|
|||||||||||
Securities registered pursuant to Section 12(b) of the Act:
| Title of Each Class | Trading Symbol(s) |
Name of Each Exchange on Which
Registered |
||||||||||||
|
|
|
|
||||||||||||
Securities registered pursuant to Section 12(g) of the Act:
None
Indicate by check mark if the registrant is a well-known seasoned issuer, as defined in Rule 405 of the Securities Act.
Yes
☒ No ☐
Indicate by check mark if the registrant is not required to file reports pursuant to Section 13 or Section 15(d) of the Act. Yes ☐
No
☒
Indicate by check mark whether the registrant (1) has filed all reports required to be filed by Section 13 or 15(d) of the Securities Exchange Act of 1934 during the preceding 12 months (or for such shorter period that the registrant was required to file such reports), and (2) has been subject to such filing requirements for the past 90 days.
Yes
☒ No ☐
Indicate by check mark whether the registrant has submitted electronically every Interactive Data File required to be submitted pursuant to Rule 405 of Regulation S-T (§ 232.405 of this chapter) during the preceding 12 months (or for such shorter period that the registrant was required to submit such files).
Yes
☒ No ☐
Indicate by check mark whether the registrant is a large accelerated filer, an accelerated filer, a non-accelerated filer, a smaller reporting company, or an emerging growth company. See the definitions of “large accelerated filer,” “accelerated filer,” “smaller reporting company, “and "emerging growth company" in Rule 12b-2 of the Exchange Act.
|
|
☒
|
Accelerated filer |
☐
|
|||||||||||||||||
| Non-accelerated filer |
☐
|
Smaller reporting company |
|
|||||||||||||||||
| Emerging growth company |
|
|||||||||||||||||||
If an emerging growth company, indicate by check mark if the registrant has elected not to use the extended transition period for complying with any new or revised financial accounting standards provided pursuant to Section 13(a) of the Exchange Act. ☐
Indicate by check mark whether the registrant is a shell company (as defined in Rule 12b-2 of the Act). Yes ☐
No
☒
Indicate by check mark whether the registrant has filed a report on and attestation to its management’s assessment of the effectiveness of its internal control over financial reporting under Section 404(b) of the Sarbanes-Oxley Act (15 U.S.C. 7262(b)) by the registered public accounting firm that prepared or issued its audit report. Yes
☒
No ☐
As of June 30, 2020 (the last business day of the registrant's most recently completed second fiscal quarter), the aggregate market value of the registrant's shares of common stock, $0.01 par value, held by non-affiliates of the registrant, was $
1.4
billion based on the last reported sale price of $14.84 per share on the New York Stock Exchange on June 30, 2020.
The number of shares of the registrant's Common Stock outstanding as of February 23, 2021 was
106,934,874
.
Documents Incorporated by Reference
Table of Contents
| Page | |||||||||||
| PART I | |||||||||||
| Item 1. | |||||||||||
| Item 1A. | |||||||||||
| Item 1B. | |||||||||||
| Item 2. | |||||||||||
| Item 3. | |||||||||||
| Item 4. | |||||||||||
| PART II | |||||||||||
| Item 5. | |||||||||||
| Item 6. | |||||||||||
| Item 7. | |||||||||||
| Item 7A. | |||||||||||
| Item 8. | |||||||||||
| Item 9. | |||||||||||
| Item 9A. | |||||||||||
| Item 9B. | |||||||||||
| PART III | |||||||||||
| Item 10. | |||||||||||
| Item 11. | |||||||||||
| Item 12. | |||||||||||
| Item 13. | |||||||||||
| Item 14. | |||||||||||
| PART IV | |||||||||||
| Item 15. | |||||||||||
| Item 16 | |||||||||||
|
F-
1
|
|||||||||||
2
PART I
In this Annual Report, we refer to Essential Properties Realty Trust, Inc., a Maryland corporation, together with its consolidated subsidiaries, including, Essential Properties, L.P., a Delaware limited partnership and its operating partnership (the "Operating Partnership"), as "we," "us," "our" or "the Company" unless we specifically state otherwise or the context otherwise requires.
SPECIAL NOTE REGARDING FORWARD-LOOKING STATEMENTS
This report contains "forward-looking statements" within the meaning of Section 27A of the Securities Act of 1933, as amended (the "Securities Act"), and Section 21E of the Securities Exchange Act of 1934, as amended (the "Exchange Act"). In particular, statements pertaining to our business and growth strategies, investment, financing and leasing activities and trends in our business, including trends in the market for long-term, net leases of freestanding, single-tenant properties, contain forward-looking statements. When used in this report, the words "estimate," "anticipate," "expect," "believe," "intend," "may," "will," "should," "seek," "approximately" and "plan," and variations of such words, and similar words or phrases, that are predictions of future events or trends and that do not relate solely to historical matters, are intended to identify forward-looking statements. You can also identify forward-looking statements by discussions of strategy, plans, beliefs or intentions of management.
Forward-looking statements involve known and unknown risks and uncertainties that may cause our actual results, performance or achievements to be materially different from the results of operations or plans expressed or implied by such forward-looking statements; accordingly, you should not rely on forward-looking statements as predictions of future events. Forward-looking statements depend on assumptions, data or methods that may be incorrect or imprecise, and may not be realized. We do not guarantee that the transactions and events described will happen as described (or that they will happen at all). The following factors, among others, could cause actual results and future events to differ materially from those set forth or contemplated in the forward-looking statements:
•
the ongoing adverse impact of the COVID-19 pandemic on the Company and its tenants;
•
general business and economic conditions;
•
risks inherent in the real estate business, including tenant defaults or bankruptcies, illiquidity of real estate investments, fluctuations in real estate values and the general economic climate in local markets, competition for tenants in such markets, potential liability relating to environmental matters and potential damages from natural disasters;
•
the performance and financial condition of our tenants;
•
the availability of suitable properties to acquire and our ability to acquire and lease those properties on favorable terms;
•
our ability to renew leases, lease vacant space or re-lease space as existing leases expire or are terminated;
•
volatility and uncertainty in the credit markets and broader financial markets, including potential fluctuations in the Consumer Price Index ("CPI");
•
the degree and nature of our competition;
•
our failure to generate sufficient cash flows to service our outstanding indebtedness;
•
our ability to access debt and equity capital on attractive terms;
•
fluctuating interest rates;
•
availability of qualified personnel and our ability to retain our key management personnel;
•
changes in, or the failure or inability to comply with, applicable law or regulation;
•
our failure to continue to qualify for taxation as a real estate investment trust ("REIT");
3
•
changes in the U.S. tax law and other U.S. laws, whether or not specific to REITs; and
•
additional factors discussed in the sections entitled "Business," "Risk Factors" and "Management's Discussion and Analysis of Financial Condition and Results of Operations" in this Annual Report.
You are cautioned not to place undue reliance on forward-looking statements, which speak only as of the date of this report. While forward-looking statements reflect our good faith beliefs, they are not guarantees of future events or of our performance. We disclaim any obligation to publicly update or revise any forward-looking statement to reflect changes in underlying assumptions or factors, new information, data or methods, future events or other changes, except as required by law.
Because we operate in a highly competitive and rapidly changing environment, new risks emerge from time to time, and it is not possible for management to predict all such risks, nor can management assess the impact of all such risks on our business or the extent to which any risk, or combination of risks, may cause actual results to differ materially from those contained in any forward-looking statements. Given these risks and uncertainties, investors should not place undue reliance on forward-looking statements as a prediction of actual events or results.
Summary Risk Factors
Our business is subject to a number of risks that could materially and adversely impact our financial condition, results of operations, cash flows and liquidity, prospects, the market price of our common stock and our ability to, among other things, service our debt and to make distributions to our stockholders. The following risks, which, together with other material risks that are discussed more fully herein under “Risk Factors,” are the principal factors that make an investment in our company speculative or risky:
•
the ongoing adverse impact of the COVID-19 pandemic on us and our tenants;
•
adverse changes in the U.S., global and local markets and related economic conditions;
•
the failure of our tenants to successfully operate their businesses, or tenant defaults, bankruptcies or insolvencies;
•
defaults by borrowers on our mortgage loans receivable;
•
an inability to identify and complete acquisitions of suitable properties or yield the returns we seek with future acquisitions;
•
an inability to access debt and equity capital on commercially acceptable terms or at all;
•
a decline in the fair value of our real estate assets;
•
geographic, industry and tenant concentrations that reduce the diversity of our portfolio;
•
a reduction in the willingness or ability of consumers to physically patronize or use their discretionary income in the businesses of our tenants and potential tenants;
•
our significant indebtedness, which requires substantial cash flow to service, subjects us to covenants and exposes us to refinancing risk and the risk of default; and
•
failure to continue to qualify for taxation as a REIT.
Item 1. Business.
We are an internally managed real estate company that acquires, owns and manages primarily single-tenant properties that are net leased on a long-term basis to middle-market companies operating service-oriented or experience-based businesses. We have assembled a diversified portfolio using a disciplined strategy that focuses on properties leased to tenants in businesses such as;
•
Car washes,
4
•
Restaurants (primarily quick service restaurants),
•
Early childhood education,
•
Medical and dental services,
•
Convenience stores,
•
Automotive services,
•
Equipment rental,
•
Entertainment and
•
Health and fitness.
We believe that, in general, properties leased to tenants in these businesses and similar businesses are essential to the generation of the tenants' sales and profits. We also believe that these businesses have favorable growth potential and, because of their nature they are more insulated from e-commerce pressure than many other businesses.
We completed our initial public offering in June 2018 (our "IPO"), and we qualified to be taxed as a REIT beginning with our taxable year ended December 31, 2018. As of December 31, 2020, 95.1% of our $184.0 million of annualized base rent was attributable to properties operated by tenants in service-oriented and experience-based businesses. "Annualized base rent" means annualized contractually specified cash base rent in effect on December 31, 2020 for all of our leases (including those accounted for as loans or direct financing leases) commenced as of that date and annualized cash interest on our mortgage loans receivable as of that date.
Our primary business objective is to maximize stockholder value by generating attractive risk-adjusted returns through owning, managing and growing a diversified portfolio of commercially desirable properties. We have grown significantly since commencing our operations and investment activities in June 2016. As of December 31, 2020, our portfolio consisted of 1,181 properties, inclusive of two undeveloped land parcels and 115 properties which secure our investments in mortgage loans receivable. Our portfolio was built based on the following core investment attributes:
Diversified Portfolio.
As of December 31, 2020,
o
ur portfolio was 99.7% occupied by 238 tenants operating 336 different concepts (i.e., generally brands), in 17 industries across 43 states, with none of our tenants contributing more than 2.8% of our annualized base rent.
Our goal is that, over time, no more than 5.0% of our annualized base rent will be derived from any single tenant or more than 1% from any single property.
Long Lease Term.
As of December 31, 2020, our leases had a weighted average remaining lease term of 14.5 years (based on annualized base rent), with only 4.8% of our annualized base rent attributable to leases expiring prior to January 1, 2026.
Our properties generally are subject to, long-term net leases that we believe provide us a stable base of revenue from which to grow our portfolio.
Significant Use of Master Leases.
As of December 31, 2020, 61.1% of our annualized base rent was attributable to master leases. A master lease is a single lease pursuant to which multiple properties are leased to a single operator/tenant on a unitary (i.e., “all or none”) basis. The master lease structure spreads our investment risk across multiple properties, and we believe it reduces our exposure to operating and renewal risk at any one property, and promotes efficient asset management.
Healthy Rent Coverage Ratio and Tenant Financial Reporting.
As of December 31, 2020, our portfolio's weighted average rent coverage ratio was 2.9x, and 98.2% of our leases (based on annualized base rent) obligate the tenant to periodically provide us with specified unit-level financial reporting. "Rent coverage ratio" means,
as of a specified date,
the ratio of (x) tenant-reported or, when unavailable, management's estimate (based on tenant-reported financial information) of annual earnings before interest, taxes, depreciation, amortization and cash rent attributable to the leased property (or properties, in the case of a master lease) to (y) the annualized base rental obligation.
5
Contractual Base Rent Escalation.
As of December 31, 2020, 99.2% of our leases (based on annualized base rent) provided for increases in future base rent at a weighted average rate of
1.5% per year. Rent escalation provisions provide contractually-specified incremental yield on our investments and provide a degree of protection from inflation or a rising interest rate environment.
Significant Use of Sale-Leaseback Investments.
We seek to acquire properties owned and operated by middle-market businesses and lease the properties back to the operators pursuant to our standard lease form. For the year ended December 31, 2020, approximately 90% of our investments were sale-leaseback transactions.
Smaller, Low Basis Single-Tenant Properties.
We generally invest in freestanding "small-box" single-tenant properties. As of December 31, 2020 our average investment per property was $2.1 million (which equals our aggregate investment in our properties (including transaction costs, lease incentives and amounts funded for construction in progress) divided by the number of properties owned at such date), and we believe investments of similar size should allow us to grow our portfolio without concentrating a large amount of capital in individual properties and should allow us to limit our exposure to events that may adversely affect a particular property. Additionally, we believe that many of our properties are fungible and appropriate for multiple commercial uses, which reduces the risk that a particular property may become obsolete and increases their liquidity.
2020 Financial and Operating Highlights
•
During 2020, we completed $602.8 million of investments, including $541.5 million in 208 property acquisitions and $61.3 million in newly originated loans receivable secured by 25 properties.
•
As of December 31, 2020, our total gross investment in real estate was $2.5 billion, and we had total debt of $821.2 million.
•
During 2020, we made distributions totaling $0.93 per share of common stock.
•
On January 14, 2020, we completed an underwritten public offering of 7,935,000 shares of our common stock, raising net proceeds of approximately $191.5 million, and on September 22, 2020, we completed an underwritten public offering of 10,120,000 shares of our common stock, raising net proceeds of approximately $184.1 million. The net proceeds from these offerings were used to reduce outstanding indebtedness and for general corporate purposes, including funding investments.
•
In February 2020, we voluntarily prepaid, in part, $62.0 million of the Series 2017-1 Class A notes previously issued under our private conduit program (the "Master Trust Funding program").
•
In March 2020, we borrowed the remaining $180.0 million available under the November 2019 Term Loan (as defined herein) and used the proceeds facilitate general corporate purposes, including funding investments.
•
During 2020, we sold 4,499,057 shares of our common stock under the ATM Program (as defined herein), at a weighted average price per share of $19.02, raising gross proceeds of approximately $85.6 million.
•
During the later portion of the first quarter of 2020 through the second quarter of 2020, the COVID-19 pandemic materially and adversely affected our business and the businesses of many of our tenants, and significantly increased general uncertainty in the business environment. In response, we emphasized and focused on engaging with our tenants and, among other things, as of December 31, 2020, we had granted rent deferrals with respect to $18.5 million million of past and future rent, representing 10% of our annualized base rent as of such date. Our deferrals primarily involved tenants focused on industries that have been directly disrupted by the COVID-19 pandemic and restrictions intended to prevent its spread, particularly movie theaters, casual and family dining restaurants, entertainment, and health and fitness. During the earlier portion of the COVID-19 pandemic, we adopted a more defensive business posture and emphasized maintaining our liquidity and financial flexibility. While the COVID-19 pandemic continues to adversely affect us and our tenants, and considerable uncertainty continues to exist, more recently we have seen improvements in our operations, particularly our rent collection experience and the broader resumption of economic activity, allowing us to become less defensive and increase our acquisition activity in targeted industries, such as equipment rental, quick service restaurants and auto services, and resume our capital recycling activity during the second half of 2020.
6
Our Target Market
We are an active investor in single-tenant, net leased real estate. Our target properties are generally freestanding commercial real estate facilities where a middle-market tenant conducts activities on property that are essential to the generation of its sales and profits. We believe that this market is underserved from a capital perspective and offers attractive risk-adjusted returns.
Within this market, we emphasize investment in properties leased to tenants engaged in targeted set of service-oriented or experience-based businesses noted above, because we believe these businesses are generally more insulated from the competitive pressure of e-commerce businesses than many others.
We focus on properties leased to middle-market companies, which we define as regional and national operators with between 10 and 250 locations and $20 million to $500 million in annual revenue, and we opportunistically invest in properties leased to smaller companies, which we define as regional operators with fewer than 10 locations and less than $20 million in annual revenue. Although it is not our primary investment focus, we opportunistically consider investing in properties leased to large companies. While most of our targeted tenants are not rated by a nationally recognized statistical rating organization, we primarily seek to invest in properties leased to companies that we determine have attractive credit characteristics and stable operating histories.
Despite the market's size, the market for single-tenant, net leased real estate is highly fragmented. In particular, we believe that there is a limited number of participants addressing the long-term capital needs of unrated middle-market and small companies. We believe that many publicly traded REITs that invest in net leased properties concentrate their investment activity in properties leased to investment grade-rated tenants, which tend to be larger organizations, with the result that unrated, middle-market and small companies are relatively underserved and offer us an opportunity to make investments with attractive risk-adjusted return potential.
Furthermore, we believe that there is strong demand for our net-lease capital solutions among middle-market and small owner-operators of commercial real estate, in part, due to the bank regulatory environment, which, since the turmoil in the housing and mortgage industries from 2007-2009, has generally been characterized by increased scrutiny and regulation. We believe that this environment has made commercial banks less responsive to the long-term capital needs of unrated middle-market and small companies, many of which have historically depended on commercial banks for their financing. Accordingly, we see an attractive opportunity to address the capital needs of these companies by offering them an efficient alternative to financing their real estate with traditional mortgage or bank debt and their own equity.
As a result, while we believe our net-lease financing solutions may be attractive to a wide variety of companies, we believe our most attractive opportunity is owning properties net leased to middle-market and small companies that are generally unrated and have less access to efficient sources of long-term capital than larger, rated companies.
Our Competitive Strengths
We believe the following competitive strengths distinguish us from our competitors and allow us to compete effectively in the single-tenant, net-lease market:
•
Carefully Constructed Portfolio of Properties Leased to Service-Oriented or Experience-Based Tenants
. We have strategically constructed a portfolio that is diversified by tenant, industry, concept and geography and generally avoids exposure to businesses that we believe are subject to pressure from e-commerce businesses. Our properties are generally subject to long-term net leases that we believe provide us with a stable base of revenue from which to grow our portfolio. As of
December 31, 2020, our portfolio consisted of
1,181
properties, with annualized base rent of $184.0 million, which was carefully selected by our management team in accordance with our focused and disciplined investment strategy. Our portfolio is diversified with
238
tenants operating
336
different concepts across
43
states and
17
industries. None of our tenants contributed more than
2.8%
of our annualized base rent as of December 31, 2020, and our strategy targets a scaled portfolio that, over time, derives no more than 5.0% of its annualized base rent from any single tenant or more than 1.0% from any single property.
We focus on investing in properties leased to tenants operating in the service-oriented or experience-based businesses noted above. As of December 31, 2020, 95.1% of our annualized base rent was attributable to tenants operating service-oriented and experience-based businesses.
7
We believe that our portfolio's diversity and rigorous underwriting decrease the impact on us of an adverse event affecting a specific tenant, industry or region, and our focus on leasing to tenants in industries that we believe are well-positioned to withstand competition from e-commerce businesses increases the stability and predictability of our rental revenue.
•
Experienced and Proven Management Team
.
Our senior management has significant experience in the net lease industry and a track record of growing net lease businesses to significant scale.
Our senior management team has been responsible for our focused and disciplined investment strategy and for developing and implementing our investment sourcing, underwriting, closing and asset management infrastructure, which we believe can support significant investment growth without a proportionate increase in our operating expenses. As of December 31, 2020, 84.5% of our portfolio's annualized base rent was attributable to internally originated sale-leaseback transactions and 85.3% was acquired from parties who had previously engaged in one or more transactions that involved a member of our senior management team (including operators and tenants and other participants in the net lease industry, such as brokers, intermediaries and financing sources). The substantial experience, knowledge and relationships of our senior leadership team provide us with an extensive network of contacts that we believe allows us to originate attractive investment opportunities and effectively grow our business.
•
Growth-Oriented Balance Sheet Scalable Infrastructure
. We believe our financial position and existing infrastructure support our external growth strategy. As of December 31, 2020, we had the ability to borrow up to $382.0 million under our senior unsecured revolving credit facility that matures in April 2023, which allows for up to $400.0 million in principal borrowings and is available for general corporate purposes, including funding future acquisitions. Additionally, through our Master Trust Funding Program, we have the ability to seek additional debt capital in the asset-backed securities market. For more information about our indebtedness, see Item 7. Management's Discussion and Analysis of Financial Condition and Results of Operations - Description of certain Debt" and Note 5. Long Term Debt to our consolidated financial statements included elsewhere in this report. We also maintain an ATM Program, and as of December 31, 2020, we had the ability to issue additional common stock with an aggregate gross sales price of up to $170.7 million.
As of December 31, 2020, we had $821.2 million of gross debt outstanding, with a weighted average maturity of 3.82 years, and net debt of $788.2 million. For the three months ended December 31, 2020, our net income was $5.7 million, our Adjusted EBITDA
re
was $41.5 million, our Annualized Adjusted EBITDA
re
was $165.8 million and our ratio of net debt to Annualized Adjusted EBITDA
re
was 4.8x. Net debt, Adjusted EBITDA
re
and Annualized Adjusted EBITDAre are non-GAAP financial measures. For definitions of net debt and Annualized Adjusted EBITDA
re
, reconciliations of these measures to total debt and net income, respectively, the most directly comparable financial measures calculated in accordance with accounting principles generally accepted in the United States ("GAAP"), and a statement of why our management believes the presentation of these non-GAAP financial measures provide useful information to investors and a discussion of how management uses these measures, see "Item 7. Management's Discussion and Analysis of Financial Condition and Results of Operations' Non-GAAP Financial Measures."
As of December 31, 2020, we also had 923 unencumbered properties that contributed $154.5 million of annualized base rent.
We seek to manage our balance sheet so that we have access to multiple sources of debt capital in the future, such as term borrowings from insurance companies, banks and other sources, single-asset mortgage financing and CMBS borrowings, that may offer us the opportunity to lower our cost of funding and further diversify our sources of debt capital.
•
Differentiated Investment Strategy
. We seek to acquire and lease freestanding, single-tenant commercial real estate facilities where a tenant services its customers and conducts activities at the property that are essential to the generation of its sales and profits. We primarily seek to invest in properties leased to middle-market companies that we determine have attractive credit characteristics and stable operating histories. We believe middle-market companies are underserved from a capital perspective and that we can offer them attractive real estate financing solutions while allowing us to enter into leases that provide us with attractive risk-adjusted returns. Furthermore, many net lease transactions with middle-market companies involve properties that are individually relatively small, which allows us to avoid concentrating a large amount of capital in individual properties. We maintain close relationships with our tenants, which we believe allows us
8
to source additional investments and become the capital provider of choice as our tenants' businesses grow and their real estate needs increase.
•
Asset Base Allows for Significant Growth
.
Building on our senior leadership team's experience of more than 20 years in net lease real estate investing, we have developed leading origination, underwriting, financing, and property management capabilities. Our platform is scalable, and we seek to leverage our capabilities to improve our efficiency and processes to continue to seek attractive risk-adjusted growth. While we expect that our general and administrative expenses could increase as our portfolio grows, we expect that such expenses as a percentage of our portfolio and our revenues will decrease over time due to efficiencies and economies of scale. During the years ended December 31, 2020, 2019 and 2018, we invested in properties with aggregate investment values of $602.8 million, $598.1 million and $504.7 million, respectively. With our smaller asset base relative to other peers that focus on acquiring net leased real estate, we believe that we can achieve superior growth through manageable acquisition volume.
•
Disciplined Underwriting Leading to Strong Portfolio Characteristics
. We generally seek to execute transactions with an aggregate purchase price of $3 million to $50 million. Our size allows us to focus on investing in a segment of the market that we believe is underserved from a capital perspective and where we can originate or acquire relatively smaller assets on attractive terms that provide meaningful growth to our portfolio. In addition, we seek to invest in commercially desirable properties that are suitable for use by different tenants, offer attractive risk-adjusted returns and possess characteristics that reduce our real estate investment risks. As of December 31, 2020:
•
Our leases had a weighted average remaining lease term (based on annualized base rent) of 14.5 years, with only
4.8%
of our annualized base rent attributable to leases expiring prior to January 1, 2026;
•
Master
leases
contributed
61.1%
of our annualized base rent;
•
Our portfolio's weighted average rent coverage ratio was 2.9x, with leases contributing 55.9% of our annualized base rent having rent coverage ratios in excess of 2.0x (excluding leases that do not report unit-level financial information);
•
Our portfolio was 99.7% occupied;
•
Leases contributing 99.2% of our annualized base rent provided for increases in future annual base rent, ranging from 1.0% to 4.0% annually, with a weighted average annual escalation equal to 1.5% of base rent; and
•
Leases contributing 94.1% of annualized base rent were triple-net.
•
Extensive Tenant Financial Reporting Supports Active Asset Management.
We seek to enter into leases that obligate our tenants to periodically provide us with corporate and/or unit-level financial reporting, which we believe enhances our ability to actively monitor our investments, negotiate lease renewals and proactively manage our portfolio to protect stockholder value. As of December 31, 2020, leases contributing 98.2% of our annualized base rent required tenants to provide us with specified unit-level financial information.
Our Business and Growth Strategies
Our primary business objective is to maximize stockholder value by generating attractive risk-adjusted returns through owning, managing and growing a diversified portfolio of commercially desirable properties. We intend to pursue our objective through the following business and growth strategies.
•
Structure and Manage Our Diverse Portfolio with Focused and Disciplined Underwriting and Risk Management
.
We seek to maintain the stability of our rental revenue and maximize the long-term return on our investments while continuing our growth by using our focused and disciplined underwriting and risk management expertise. When underwriting assets, we emphasize commercially desirable properties, with strong operating performance, healthy rent coverage ratios and tenants with attractive credit characteristics.
9
Leasing.
In general, we seek to enter into leases with (i) relatively long terms (typically with initial terms of 15 years or more and tenant renewal options); (ii) attractive rent escalation provisions; (iii) healthy rent coverage ratios; and (iv) tenant obligations to periodically provide us with financial information, which provides us with information about the operating performance of the leased property and/or tenant and allows us to actively monitor the security of payments under the lease on an ongoing basis. We strongly prefer to use master lease structures, pursuant to which we lease multiple properties to a single tenant on a unitary (i.e., "all or none") basis. In addition, in the context of our sale-leaseback investments, we generally seek to establish contract rents that are at or below prevailing market rents, which we believe enhances tenant retention and reduces our releasing risk if a lease is rejected in a bankruptcy proceeding or expires.
Diversification.
We monitor and manage the diversification of our portfolio in order to reduce the risks associated with adverse developments affecting a particular tenant, property, industry or region. Our strategy targets a scaled portfolio that, over time, will (i) derive no more than 5% of its annualized base from any single tenant or more than 1% of its annualized base rent from any single property, (ii) be primarily leased to tenants operating in service-oriented or experience-based businesses and (iii) avoid significant geographic concentration. While we consider these criteria when making investments, we may be opportunistic in managing our business and make investments that do not meet one or more of these criteria if we believe the opportunity presents an attractive risk-adjusted return.
Asset Management.
We are an active asset manager and regularly review each of our properties to evaluate, various factors, including, but not limited to, changes in the business performance at the property, credit of the tenant and local real estate market conditions. Among other things, we use Moody's Analytics RiskCalc ("RiskCalc") to proactively detect credit deterioration. RiskCalc is a model for predicting private company defaults based on Moody's Analytics Credit Research Database. Additionally, we monitor market rents relative to in-place rents and the amount of tenant capital expenditures in order to refine our tenant retention and alternative use assumptions. Our management team utilizes our internal credit diligence to monitor the credit profile of each of our tenants on an ongoing basis. We believe that this proactive approach enables us to identify and address issues in a timely manner and to determine whether there are properties in our portfolio that are appropriate for disposition.
In addition, as part of our active portfolio management, we may selectively dispose of assets that we conclude do not offer a return commensurate with the investment risk, contribute to unwanted geographic, industry or tenant concentrations, or may be sold at a price we determine is attractive. During the year ended December 31, 2020, we sold 50 properties for net sales proceeds of $81.7 million, including 6 properties that were vacant. We believe that our underwriting processes and active asset management enhance the stability of our rental revenue by reducing default losses and increasing the likelihood of lease renewals.
•
Focus on Relationship-Based Sourcing to Grow Our Portfolio by Originating Sale-Leaseback Transactions.
We plan to continue our disciplined growth by originating sale-leaseback transactions and opportunistically making acquisitions of properties subject to net leases that contribute to our portfolio’s tenant, industry and geographic diversification. As of December 31, 2020, 84.5% of our portfolio’s annualized base rent was attributable to internally originated sale-leaseback transactions and 85.3% was acquired from parties who had previously engaged in transactions that involved a member of our senior management team (including operators and tenants and other participants in the net lease industry, such as brokers, intermediaries and financing sources). In addition, we seek to enhance our relationships with our tenants to facilitate investment opportunities, including selectively agreeing to reimburse certain of our tenants for development costs at our properties in exchange for contractually specified rent that generally increases proportionally with our funding. We believe our senior management team’s reputation, in-depth market knowledge and extensive network of long-standing relationships in the net lease industry provide us access to an ongoing pipeline of attractive investment opportunities.
As of February 19, 2021, we have entered into purchase and sale agreements for 19 properties with an aggregate purchase price of $44.7 million.
•
Focus on Middle-Market Companies in Service-Oriented or Experience-Based Businesses
.
We primarily focus on investing in properties that we lease on a long-term, triple-net basis to middle-market companies that we determine have attractive credit characteristics and stable operating histories. Properties leased to middle-market companies may offer us the opportunity to achieve superior risk-adjusted returns, as a result of our extensive and disciplined credit and real estate analysis, lease structuring and
10
portfolio composition. We believe our capital solutions are attractive to middle-market companies as such companies often have limited financing options, as compared to larger, credit rated organizations. We also believe that, in many cases, smaller transactions with middle-market companies will allow us to maintain and grow our portfolio's diversification. Middle-market companies are often willing to enter into leases with structures and terms that we consider attractive (such as master leases and leases that require ongoing tenant financial reporting) and believe contribute to the stability of our rental revenue.
In addition, we emphasize investment in properties leased to tenants engaged in service-oriented or experience-based businesses, such as car washes, restaurants (primarily quick service restaurants), early childhood education, medical and dental services, convenience stores, automotive services, equipment rental, entertainment and health and fitness, as we believe these businesses are generally more insulated from e-commerce pressure than many others.
•
Internal Growth Through Long-Term Triple-Net Leases That Provide for Periodic Rent Escalations
. We seek to enter into long-term (typically with initial terms of 15 years or more and tenant renewal options), triple-net leases that provide for periodic contractual rent escalations. As of December 31, 2020, our leases had a weighted average remaining lease term of 14.5 years (based on annualized base rent), with only 4.8% of our annualized base rent attributable to leases expiring prior to January 1, 2026, and 99.2% of our leases (based on annualized base rent) provided for increases in future base rent at a weighted average of 1.5% per year.
•
Actively Manage Our Balance Sheet to Maximize Capital Efficiency
.
We seek to maintain a prudent balance between debt and equity financing and to maintain funding sources that lock in long-term investment spreads and limit interest rate sensitivity. As of December 31, 2020, we had $821.2 million of gross debt outstanding and $788.2 million of net debt outstanding. Our net income for the three months ended December 31, 2020 was $5.7 million, our Adjusted EBITDA
re
was $41.5 million, our Annualized Adjusted EBITDA
re
was $165.8 million and our ratio of net debt to Annualized Adjusted EBITDA
re
was 4.8x. We target a level of net debt that, over time, is generally less than six times our Annualized Adjusted EBITDA
re
. We have access to multiple sources of debt capital, including bank debt, through our revolving credit and term loan facilities, and the investment grade-rated, asset-backed bond market, through our Master Trust Funding Program. Net debt, Adjusted EBITDA
re and
Annualized Adjusted EBITDA
re
are non-GAAP financial measures. See "Item 7. Management's Discussion and Analysis of Financial Condition and Results of Operations' Non-GAAP Financial Measures."
Competition
We face competition for acquisitions of real property from other investors, including traded and non-traded public REITs, private equity investors and institutional investment funds, some of which have greater economies of scale, lower costs of capital, access to more sources of capital, a larger base of operating resources and greater name recognition than we do, and the ability to accept more risk. We also believe that competition for real estate financing comes from middle-market business owners themselves, many of whom have had a historic preference to own, rather than lease, the real estate they use in their businesses. This competition may increase the demand for the types of properties in which we typically invest and, therefore, may reduce the number of suitable investment opportunities available to us and increase the prices paid for such acquisition properties. This competition will increase if investments in real estate become more attractive relative to other forms of investment.
As a landlord, we compete in the multi-billion dollar commercial real estate market with numerous developers and owners of properties, many of which own properties similar to ours in the same markets in which our properties are located. Some of our competitors have greater economies of scale, lower costs of capital, access to more sources of capital, a larger base of operating resources and greater name recognition than we do, and the ability to accept more risk. If our competitors offer space at rental rates below current market rates or below the rental rates we currently charge our tenants, we may lose our tenants or prospective tenants, and we may be pressured to reduce our rental rates or to offer substantial rent abatements, tenant improvement allowances, early termination rights or below-market renewal options in order to retain tenants when our leases expire.
Employees
As of December 31, 2020, we had 33 full-time employees. Our staff is mostly comprised of professionals engaged in originating, underwriting and closing investments; portfolio asset management; portfolio servicing (e.g.,
11
collections, property tax compliance, etc.); and accounting, financial reporting, cash management and capital markets activities. Women comprise nearly 40% of our employees and hold approximately 36% of our management positions, providing significant leadership at our company. Our commitment to diversity extends to our board of directors, as three of its seven independent members, or approximately 43%, are women. Additionally, we have a consistent and strong record of hiring veterans of the U.S. military, including our chief executive officer.
We seek to provide a dynamic work environment that promotes the retention and development of our employees, and is a differentiating factor in our ability to attract new talent. We strive to offer our employees attractive and equitable compensation, regular opportunities to participate in professional development activities, outlets for civic engagement and reasonable flexibility to allow a healthy work/life balance.
We value equal opportunity in the workplace and fair employment practices. We have built an inclusive culture that encourages, supports and celebrates our diverse employee population. We endeavor to maintain a workplace that is free from discrimination or harassment on the basis of color, race, sex, national origin, ethnicity, religion, age, disability, sexual orientation, gender identification or expression, or any other status protected by applicable law. We conduct annual training in an effort to ensure that all employees remain aware of and help prevent harassment and discrimination.
Our compensation program is designed to attract and retain talent, and align our employee’s efforts with the interests of all of our stakeholders. Factors we evaluate in connection with hiring, developing, training, compensating and advancing individuals include, but are not limited to, qualification, performance, skill and experience. Our employees are fairly compensated based on merit, without regard to color, race, sex, national origin, ethnicity, religion, age, disability, sexual orientation, gender identification or expression, or any other status protected by applicable law.
Insurance
Our tenants are generally required to maintain liability and property insurance coverage for the properties they lease from us pursuant to triple-net leases. These leases generally require our tenants to name us (and any of our lenders that have a mortgage on the property leased by the tenant) as additional insureds on their liability policies and additional named insured and/or loss payee (or mortgagee, in the case of our lenders) on their property policies. Depending on the location of the property, losses of a catastrophic nature, such as those caused by earthquakes and floods, may be covered by insurance policies that are held by our tenant with limitations such as large deductibles or co-payments that a tenant may not be able to meet. In addition, losses of a catastrophic nature, such as those caused by wind/hail, hurricanes, terrorism or acts of war, may be uninsurable or not economically insurable. If there is damage to our properties that is not covered by insurance and such properties are subject to recourse indebtedness, we will continue to be liable for the indebtedness, even if these properties are irreparably damaged. See "Item 1A. Risk Factor-"Risks Related to Our Business and Properties-Insurance on our properties may not adequately cover all losses and uninsured losses could materially and adversely affect us."
In addition to being a named insured on our tenants' liability policies, we separately maintain commercial general liability and umbrella coverages. We also maintain full property coverage on all untenanted properties and other property coverage as may be required by our lenders, which are not required to be carried by our tenants under our leases.
Regulation and Requirements
Our properties are subject to various laws, ordinances and regulations, including those relating to fire and safety requirements, and affirmative and negative covenants and, in some instances, common area obligations. Compliance with applicable requirements may require modifications to our properties, and the failure to comply with applicable requirements could result in the imposition of fines or an award of damages to private litigants, as well as the incurrence of the costs of making modifications to attain compliance. Our tenants have primary responsibility for compliance with these requirements pursuant to our leases. We believe that each of our properties has the necessary permits and approvals.
Environmental Matters
Federal, state and local environmental laws and regulations regulate, and impose liability for, releases of hazardous or toxic substances into the environment. Under various of these laws and regulations, a current or
12
previous owner, operator or tenant of real estate may be required to investigate and clean up hazardous or toxic substances, hazardous wastes or petroleum product releases or threats of releases at the property, and may be held liable to a government entity or to third parties for property damage and for investigation, clean-up and monitoring costs incurred by those parties in connection with the actual or threatened contamination. These laws may impose clean-up responsibility and liability without regard to fault, or whether or not the owner, operator or tenant knew of or caused the presence of the contamination. The liability under these laws may be joint and several for the full amount of the investigation, clean-up and monitoring costs incurred or to be incurred or actions to be undertaken, although a party held jointly and severally liable may seek to obtain contributions from other identified, solvent, responsible parties of their fair share toward these costs. These costs may be substantial, and can exceed the value of the property. In addition, some environmental laws may create a lien on the contaminated site in favor of the government for damages and costs it incurs in connection with the contamination. As the owner or operator of real estate, we also may be liable under common law to third parties for damages and injuries resulting from environmental contamination emanating from the real estate. The presence of contamination, or the failure to properly remediate contamination, on a property may adversely affect the ability of the owner, operator or tenant to sell or rent that property or to borrow using the property as collateral, and may adversely impact our investment in that property.
Some of our properties contain, have contained, or are adjacent to or near other properties that have contained or currently contain storage tanks for the storage of petroleum products or other hazardous or toxic substances. Similarly, some of our properties were used in the past for commercial or industrial purposes, or are currently used for commercial purposes, that involve or involved the use of petroleum products or other hazardous or toxic substances, or are adjacent to or near properties that have been or are used for similar commercial or industrial purposes. These operations create a potential for the release of petroleum products or other hazardous or toxic substances, and we could potentially be required to pay to clean up any contamination. In addition, environmental laws regulate a variety of activities that can occur on a property, including the storage of petroleum products or other hazardous or toxic substances, air emissions, water discharges and exposure to lead-based paint. Such laws may impose fines or penalties for violations, and may require permits or other governmental approvals to be obtained for the operation of a business involving such activities. As a result of the foregoing, we could be materially and adversely affected.
Environmental laws also govern the presence, maintenance and removal of asbestos-containing material ("ACM"). Federal regulations require building owners and those exercising control over a building's management to identify and warn, through signs and labels, of potential hazards posed by workplace exposure to installed ACM in their building. The regulations also have employee training, record keeping and due diligence requirements pertaining to ACM. Significant fines can be assessed for violation of these regulations. As a result of these regulations, building owners and those exercising control over a building's management may be subject to an increased risk of personal injury lawsuits by workers and others exposed to ACM. The regulations may affect the value of a building containing ACM in which we have invested. Federal, state and local laws and regulations also govern the removal, encapsulation, disturbance, handling and/or disposal of ACM when those materials are in poor condition or in the event of construction, remodeling, renovation or demolition of a building. These laws may impose liability for improper handling or a release into the environment of ACM and may provide for fines to, and for third parties to seek recovery from, owners or operators of real properties for personal injury or improper work exposure associated with ACM.
When excessive moisture accumulates in buildings or on building materials, mold growth may occur, particularly if the moisture problem remains undiscovered or is not addressed over a period of time. Some molds may produce airborne toxins or irritants. Indoor air quality issues can also stem from inadequate ventilation, chemical contamination from indoor or outdoor sources, and other biological contaminants such as pollen, viruses and bacteria. Indoor exposure to airborne toxins or irritants above certain levels can be alleged to cause a variety of adverse health effects and symptoms, including allergic or other reactions. As a result, the presence of significant mold or other airborne contaminants at any of our properties could require us to undertake a costly remediation program to contain or remove the mold or other airborne contaminants from the affected property or increase indoor ventilation. In addition, the presence of significant mold or other airborne contaminants could expose us to liability from our tenants, employees of our tenants or others if property damage or personal injury occurs.
Before completing any property acquisition, we obtain environmental assessments in order to identify potential environmental concerns at the property. These assessments are carried out in accordance with the Standard Practice for Environmental Site Assessments (ASTM Practice E 1527-13) as set by ASTM International, formerly known as the American Society for Testing and Materials, and generally include a physical site inspection,
13
a review of relevant federal, state and local environmental and health agency database records, one or more interviews with appropriate site-related personnel, review of the property's chain of title and review of historical aerial photographs and other information on past uses of the property. These assessments are limited in scope. If, however, recommended in the initial assessments, we may undertake additional assessments such as soil and/or groundwater samplings or other limited subsurface investigations and ACM or mold surveys to test for substances of concern. A prior owner or operator of a property or historic operations at our properties may have created a material environmental condition that is not known to us or the independent consultants preparing the site assessments. Material environmental conditions may have arisen after the review was completed or may arise in the future, and future laws, ordinances or regulations may impose material additional environmental liability. If environmental concerns are not satisfactorily resolved in any initial or additional assessments, we may obtain environmental insurance policies to insure against potential environmental risk or loss depending on the type of property, the availability and cost of the insurance and various other factors we deem relevant (i.e., an environmental occurrence affects one of our properties where our lessee may not have the financial capability to honor its indemnification obligations to us). Our ultimate liability for environmental conditions may exceed the policy limits on any environmental insurance policies we obtain, if any.
Generally, our leases require the lessee to comply with environmental law and provide that the lessee will indemnify us for any loss or expense we incur as a result of lessee's violation of environmental law or the presence, use or release of hazardous materials on our property attributable to the lessee. If our lessees do not comply with environmental law, or we are unable to enforce the indemnification obligations of our lessees, our results of operations would be adversely affected.
We cannot predict what other environmental legislation or regulations will be enacted in the future, how existing or future laws or regulations will be administered or interpreted or what environmental conditions may be found to exist on the properties in the future. Compliance with existing and new laws and regulations may require us or our tenants to spend funds to remedy environmental problems. If we or our tenants were to become subject to significant environmental liabilities, we could be materially and adversely affected.
About Us and Available Information
We were incorporated under the laws of Maryland on January 12, 2018. Since our June 2018 IPO, shares of our common stock have been listed on the New York Stock Exchange ("NYSE") under the ticker symbol "EPRT". Our offices are located at 902 Carnegie Center Blvd., Suite 520, Princeton, New Jersey, 08540. We lease approximately 13,453 square feet of office space from an unaffiliated third party. Our telephone number is (609) 436-0619 and our website is www.essentialproperties.com. Information contained on or hyperlinked from our website is not incorporated by reference into and should not be considered part of this Annual Report or our other filings with the Securities and Exchange Commission (the “SEC”).
We electronically file with the SEC our annual reports on Form 10-K, quarterly reports on Form 10-Q and current reports on Form 8-K, pursuant to Section 13(a) of the Exchange Act. You may obtain a free copy of our annual reports on Form 10-K, quarterly reports on Form 10-Q and current reports on Form 8-K, and amendments to those reports, on the day of filing with the SEC on our website, or by sending an email message to info@essentialproperties.com.
Item 1A. Risk Factors.
There are many factors that affect our business and results of operation, some of which are beyond our control. The occurrence of any of the following risks could
materially
and adversely impact our financial condition, results of operations, cash flows and liquidity, prospects, the market price of our common stock, and our ability to, among other things, service our debt and to make distributions to our stockholders. Some statements in this report including statements in the following risk factors constitute forward-looking statements. See "Special Note Regarding Forward-Looking Statements."
Risks Related to Our Business and Properties
The COVID-19 pandemic is materially and adversely impacting our business and could further affect our financial condition, results of operations, cash flows and liquidity, prospects, access to and costs of
14
capital, the trading price of our common stock and our ability to service our debt and make distributions to our stockholders.
The impact of the COVID-19 pandemic continues to rapidly evolve, and many states and cities, including many of those where we own properties, have instituted or may reinstitute lockdowns, quarantines, restrictions on travel, “shelter in place” rules, school closures and/or restrictions on the types of businesses that may continue to operate or limitations on certain business operations. These actions and the resulting decline in economic activity and consumer confidence have severely impaired the ability of many of our tenants to operate their businesses and meet their obligations to us, including rental payment obligations. It is unclear how long these restrictions will remain in place, whether they will be lifted partially over time or if they will be reinstituted in whole or in part in response to future surges or waves of the pandemic.
Many of our tenants have requested rent deferrals or other concessions due to the pandemic. During the year ended December 31, 2020, we have granted deferrals with respect to $18.5 million of past and future rent, representing 10% of our annualized base rent as of that date. These rent deferrals were negotiated on a tenant-by-tenant basis and, in general, allow a tenant to defer all or a portion of its rent for 2020, with all of the deferred rent to be paid to us pursuant to a schedule that generally extends up to 24 months from the original due date of the deferred rent. It is possible that the existing deterioration, or further deterioration, in our tenants’ ability to operate their businesses, caused by the COVID-19 pandemic or otherwise, will cause our tenants to be unable or unwilling to meet their contractual obligations to us, including the payment of rent (including deferred rent) or to request further rent deferrals or other concessions. This possibility would increase if the COVID-19 pandemic intensifies or persists for a prolonged period or if there is an economic shut down; if the United States enters into a recessionary period or if reduced consumer confidence further weakens economic activity; or if ongoing vaccination efforts are unsuccessful or delayed. To the extent the pandemic causes a secular change in consumer behavior that reduces patronage of service-based and/or experience-based businesses, many of our tenants would be adversely affected and their ability to meet their obligations to us could be further impaired. The rent deferrals reduce our cash flow from operations, reduce our cash available for distribution and adversely affect our ability to service our debt and make cash distributions to common stockholders. Furthermore, if tenants are unable to pay their deferred rent, we will not receive cash in the future in accordance with our expectations. In addition to COVID-19’s impact on our rental revenues, it has resulted, and may continue to result, in an increase in our general and administrative expenses, as we have incurred and may continue to incur costs to negotiate rent deferrals, restructure or terminate leases and/or enforce our contractual rights (including through litigation), as we deem appropriate on a case-by-case basis. Similarly, to the extent the pandemic leads to decreased occupancy, it would further increase our property-level costs, as we would be responsible for costs that would otherwise be borne by our tenants under triple-net leases. These factors could also cause the value of our properties to be impaired.
The COVID-19 pandemic has significantly and adversely impacted global, national, regional and local economic activity and has contributed to significant volatility and negative pressure in the financial markets. The market price of our common stock on the NYSE has experienced significant volatility since the outbreak of the COVID-19 pandemic. Similarly, the availability and pricing of debt capital has become increasingly volatile. Accordingly, we could experience difficulty accessing debt and equity capital on attractive terms, or at all, which would adversely affect our ability to grow our business, conduct our operations or address maturing liabilities. Similarly, the deterioration in access to capital is likely adversely affecting our tenants’ abilities to finance their businesses and reducing their liquidity, which reduces their ability to meet their obligations to us.
The financial impact of the COVID-19 pandemic could negatively impact our future compliance with some of the financial covenants relating to our credit facility and term loans, some of which depend, in part, on the net operating income generated by certain of our properties or our EBITDA. Non-compliance would preclude us from borrowing further under our credit facility and, under certain circumstances, could result in an event of default and an acceleration of such indebtedness and, possibly, other indebtedness through cross-default provisions. Additionally, to the extent the COVID-19 pandemic intensifies or persists for a prolonged period of time, it is possible that we will be required to record significant further impairment charges to the value of our real estate assets.
The ultimate extent to which the COVID-19 pandemic adversely impacts us (and our tenants) will depend on future developments, which are highly uncertain and cannot be predicted with confidence, including the scope, severity and duration of the pandemic, the actions taken to contain the pandemic or mitigate its impact, and the direct and indirect economic effects of the pandemic and containment and mitigation measures, among others.
15
We are subject to risks related to the ownership of commercial real estate that could adversely impact the value of our properties.
Factors beyond our control can affect the performance and value of our properties. Our performance is subject to risks incident to the ownership of commercial real estate, including: the possible inability to collect rents from tenants due to financial hardship, including bankruptcy; changes in local real estate conditions and tenant demand for our properties; changes in consumer trends and preferences that reduce the demand for products and services offered by our tenants; adverse changes in national, regional and local economic conditions; inability to re-lease or sell properties upon expiration or termination of leases; environmental risks; the subjectivity and volatility of real estate valuations and the relative illiquidity of real estate investments compared to most other financial assets, which may limit our ability to modify our portfolio promptly in response to changes in economic or other conditions; changes in laws and governmental regulations, including those governing real estate usage and zoning; acts of God, including natural disasters, which may result in uninsured losses; and acts of war or terrorism, including terrorist attacks.
Adverse changes in the U.S., global and local markets and related economic conditions may materially and adversely affect us and the ability of our tenants to make rental payments to us.
Our results of operations, as well as the results of operations of our tenants, are sensitive to changes in U.S., global and local regions or markets that impact our tenants’ businesses. Adverse changes or developments in U.S., global or regional economic conditions may impact our tenants’ financial condition, which may adversely impact their ability to make rental payments to us and may also impact their current or future leasing practices. During periods of economic slowdown and declining demand for real estate, we may experience a general decline in rents or increased rates of default under our leases. A lack of demand for rental space could adversely affect our ability to maintain our current tenants and attract new tenants, which may affect our growth, profitability and ability to pay dividends.
Our business is dependent upon our tenants successfully operating their businesses, and their failure to do so could materially and adversely affect us.
The success of our investments is materially dependent on the financial stability and operating performance of our tenants. The success of any one of our tenants is dependent on its individual business and its industry, which could be adversely affected by poor management, economic conditions in general, changes in consumer trends and preferences that decrease demand for a tenant's products or services or other factors over which neither they nor we have control.
At any given time, any tenant may experience a downturn in its business that may weaken its operating results or the overall financial condition of individual properties or its business as whole. As a result, a tenant may delay lease commencement, fail to make rental payments when due, decline to extend a lease upon its expiration, become insolvent or declare bankruptcy. We depend on our tenants to operate the properties leased from us in a manner which generates revenues sufficient to allow them to meet their obligations to us, including their obligations to pay rent, maintain certain insurance coverage, pay real estate taxes and maintain the properties in a manner so as not to jeopardize their operating licenses or regulatory status. The ability of our tenants to fulfill their obligations under our leases generally depends, to a significant degree, upon the overall profitability of their operations. Cash flow generated by certain tenant businesses may not be sufficient for a tenant to meet its obligations to us. We could be materially and adversely affected if a number of our tenants were unable to meet their obligations to us.
Our assessment that certain businesses are more insulated from e-commerce pressure than many others may prove to be incorrect, and changes in macroeconomic trends may adversely affect our tenants, either of which could impair our tenants' ability to make rental payments to us and materially and adversely affect us.
Technology and business conditions, particularly in the retail industry, are rapidly changing, and our tenants may be adversely affected by technological innovation, changing consumer preferences and competition from non-traditional sources. Businesses previously thought to be internet resistant, such as the retail grocery industry, have proven to be susceptible to competition from e-commerce. To the extent our tenants face increased competition from non-traditional competitors, such as internet vendors, some of which may have different business models and larger profit margins, their businesses could suffer. There can be no assurance that our tenants will be successful in
16
meeting any new competition, and a deterioration in our tenants’ businesses could impair their ability to meet their lease obligations to us and materially and adversely affect us.
Properties occupied by a single tenant pursuant to a single-tenant lease subject us to significant risk of tenant default.
Our strategy focuses primarily on investing in single-tenant triple-net leased properties throughout the United States. The financial failure of, or default in payment by, a single tenant under its lease is likely to cause a significant or complete reduction in our rental revenue from that property and a reduction in the value of the property. This risk is magnified in situations where we lease multiple properties to a single tenant under a master lease. The default of a tenant that leases multiple properties from us or its decision not to renew its master lease upon expiration could materially and adversely affect us.
We may experience a decline in the fair value of our real estate assets which could result in impairments and would impact our financial condition and results of operations.
A decline in the fair market value of our long-lived assets may require us to recognize an impairment against such assets (as defined by the Financial Accounting Standards Board (“FASB”)) if certain conditions or circumstances related to an asset were to change and we were to determine that, with respect to any such asset, the cash flows no longer support the carrying value of the asset. The fair value of our long-lived assets depends on market conditions, including estimates of future demand for these assets, and the revenues that can be generated from such assets. If such a determination were to be made, we would recognize the estimated unrealized losses through earnings and write down the depreciated cost of such assets to a new cost basis, based on the fair value of such assets on the date they are considered to be impaired. Such impairment charges reflect non-cash losses at the time of recognition, and subsequent dispositions or sales of such assets could further affect our future losses or gains, as they are based on the difference between the sales price received and the adjusted depreciated cost of such assets at the time of sale.
Geographic, industry and tenant concentrations reduce the diversity of our portfolio and make us more susceptible to adverse economic or regulatory developments in those areas or industries.
Geographic, industry and tenant concentrations expose us to greater economic or regulatory risks than if we owned a more diverse portfolio. Our business includes substantial holdings in the following states as of December 31, 2020 (based on annualized base rent): Texas (14.9%), Georgia (9.6%), Florida (6.1%), Arkansas (4.8%) and Ohio (4.1%). We are susceptible to adverse developments in the economic or regulatory environments of the geographic areas in which we concentrate (or in which we may develop a substantial concentration of assets in the future), such as COVID-19 pandemic surges and measures intended to mitigate its spread, business layoffs or downsizing, industry slowdowns, relocations of businesses, increases in real estate and other taxes or costs of complying with governmental regulations. As of December 31, 2020, leases representing approximately 20.0% of our annualized base rent were with tenants in industries that have been particularly adversely affected by the COVID-19 pandemic, including casual and family dining (7.8% of annualized base rent), health and fitness (5.2% of annualized base rent), entertainment (3.4% of annualized base rent), movie theaters (2.3% of annualized base rent) and home furnishings (1.3% of annualized base rent). Accordingly, to the extent the pandemic or measures intended to mitigate its spread continue to adversely affect these industries, our tenants in these industries could fail to meet their obligations to us, and we could be required to provide further tenant concessions.
As of December 31, 2020, our five largest tenants contributed 12.3% of our annualized base rent, and our ten largest tenants contributed 21.2% of our annualized base rent. If one of these tenants, or another tenant that occupies a significant portion of our properties or whose lease payments represent a significant portion of our rental revenue, were to experience financial weakness or file for bankruptcy, it could have a material adverse effect on our business, financial condition, results of operations, cash flows and liquidity, and prospects.
As we continue to acquire properties, our portfolio may become more concentrated by geographic area, industry or tenant. If our portfolio becomes less diverse, our business will be more sensitive to the general economic downturn in a particular geographic area, to changes in trends affecting a particular industry and to the financial weakness, bankruptcy or insolvency of fewer tenants.
17
The vast majority of our properties are leased to unrated tenants whose credit is evaluated through our internal underwriting and credit analysis procedures. However, the tools we use to measure credit quality, such as property-level rent coverage ratio, may not be accurate.
The vast majority of our properties are leased to unrated tenants whose credit is evaluated through our internal underwriting and credit analysis. Substantially all of our tenants are required to provide corporate-level financial information to us periodically or, in some instances, at our request. As of December 31, 2020, leases contributing 98.2% of our annualized base rent required tenants to provide us with specified unit-level financial information and leases contributing 98.3% of our annualized base rent required tenants to provide us with corporate-financial information.
We analyze the creditworthiness of our tenants using Moody’s Analytics RiskCalc, which provides an estimated default frequency (“EDF”) and a “shadow rating”, and a lease's property-level rent coverage ratio.
Our methods may not adequately assess the risk of an investment. An EDF score and a shadow rating are not the same as, and may not be as indicative of creditworthiness as, a rating published by a nationally recognized statistical rating organization. Our calculations of EDFs, shadow ratings and rent coverage ratios are unaudited and are based on financial information provided to us by our tenants and prospective tenants without independent verification on our part, and we assume the appropriateness of estimates and judgments that were made by the party preparing the financial information. If our assessment of credit quality proves to be inaccurate, we may be subject to defaults, and our cash flows may be less stable. The ability of an unrated tenant to meet its obligations to us may be more speculative than that of a rated tenant.
We may be unable to renew expiring leases with the existing tenants or re-lease the spaces to new tenants on favorable terms or at all.
Our results of operations depend on our ability to continue to lease our properties, including renewing expiring leases, leasing vacant space and re-leasing space in properties where leases are expiring. As of December 31, 2020, our occupancy was 99.7% (excluding two undeveloped land parcels), and leases representing approximately 0.1% of our annualized base rent as of such date will expire during 2021. Current tenants may decline to renew leases and we may not be able to find replacement tenants. We cannot guarantee that leases that are renewed or new leases will have terms that are as economically favorable to us as the expiring leases, or that substantial rent abatements, tenant improvement allowances, early termination rights or below-market renewal options will not be offered to retain tenants or attract new tenants or that we will be able to lease a property at all. We may experience significant costs in connection with re-leasing a significant number of our properties, which could materially and adversely affect us.
The tenants that occupy our properties compete in industries that depend upon discretionary spending by consumers. A reduction in the willingness or ability of consumers to physically patronize and use their discretionary income in the businesses of our tenants and potential tenants could adversely impact our tenants’ business and thereby adversely impact our ability to collect rents and reduce the demand for our properties.
Most of our portfolio is leased to tenants operating service-oriented or experience-based businesses at our properties. The largest industries in our portfolio are car washes, restaurants (including quick service and casual and family dining), early childhood education, medical services, convenience stores, automotive services, entertainment (including movie theaters) and health and fitness]. As of December 31, 2020, tenants operating in those industries represented approximately 87.5% of our annualized base rent. Captain D's, EquipmentShare, Mister Car Wash, Circle K, AMC, Mavis Discount Tire, Zaxby's, The Malvern School, Vasa Fitness and R-Store represent the largest concepts in our portfolio.These types of businesses have been severely affected by the COVID-19 pandemic, principally due to store closures or limitations on operations (which may be government-mandated or voluntary) and reduced economic activity. The success of most of these businesses depends on the willingness of consumers to physically patronize their businesses and use discretionary income to purchase their products or services. To the extent the COVID-19 pandemic causes a secular change in consumer behavior that reduces patronage of service-based and/or experience-based businesses, many of our tenants would be adversely affected and their ability to meet their obligations to us could be further impaired. Additional adverse economic conditions and other developments that discourage consumer spending, such as high unemployment levels, wage stagnation, interest rates, inflation, tax rates and fuel and energy costs, may have an impact on the results of operations and financial conditions of our tenants and their ability to pay rent to us.
18
Our ability to realize future rent increases on some of our leases may vary depending on changes in the CPI.
Our leases often provide for periodic contractual rent escalations. As of December 31, 2020, leases contributing 99.2% of our annualized base rent provided for increases in future annual base rent, generally ranging from 1.0% to 4.0% annually, with a weighted average annual escalation equal to 1.5% of base rent. Although many of our rent escalators increase rent at a fixed amount on fixed dates, approximately 3.0% of our rent escalators relate to an increase in the CPI over a specified period. During periods of low inflation or deflation, small increases or decreases in the CPI will subject us to the risk of receiving lower rental revenue than we otherwise would have been entitled to receive if our rent escalators were based on higher fixed percentages or amounts.
Inflation may materially and adversely affect us and our tenants.
While our tenants are generally obligated to pay property-level expenses relating to the properties they lease from us (e.g., maintenance, insurance and property taxes), we incur other expenses, such as general and administrative expense, interest expense relating to our debt (some of which bears interest at floating rates) and carrying costs for vacant properties. These expenses would increase in an inflationary environment, and such increases may exceed any increase in revenue we receive under our leases. Additionally, increased inflation may have an adverse impact on our tenants if increases in their operating expenses exceed increases in their revenue, which may adversely affect the tenants' ability to pay rent owed to us.
Some of our tenants operate under franchise or license agreements, and, if they are terminated or not renewed prior to the expiration of their leases with us, that would likely impair their ability to pay us rent.
As of December 31, 2020, tenants contributing 16.1% of our annualized base rent operated under franchise or license agreements. Often, our tenants’ franchise or license agreements have terms that end prior to the expiration dates of the properties they lease from us. In addition, a tenant's rights as a franchisee or licensee typically may be terminated and the tenant may be precluded from competing with the franchisor or licensor upon termination. Usually, we have no notice or cure rights with respect to such a termination and have no rights to assignment of any such franchise agreement. This may have an adverse effect on our ability to mitigate losses arising from a default on any of our leases. A franchisor's or licensor's termination or refusal to renew a franchise or license agreement would likely have a material adverse effect on the ability of the tenant to make payments under its lease, which could materially and adversely affect us.
Certain provisions of our leases may be unenforceable.
Our rights and obligations with respect to our leases are governed by written agreements. A court could determine that one or more provisions of such an agreement are unenforceable. We could be adversely impacted if this were to happen with respect to a property or group of properties.
The bankruptcy or insolvency of a tenant could result in the termination or modification of such tenant's lease and material losses to us.
The occurrence of a tenant bankruptcy or insolvency could diminish the income we receive from that tenant's lease or leases or force us to “take back” a property as a result of a default or a rejection of a lease by a tenant in bankruptcy. Bankruptcy risk is more acute in situations where we lease multiple properties to a tenant pursuant to a master lease. If a tenant becomes bankrupt, the automatic stay created by the bankruptcy will prohibit us from collecting pre-bankruptcy debts from that tenant, or from its property, or evicting such tenant based solely upon such bankruptcy or insolvency, unless we obtain an order permitting us to do so from the bankruptcy court. In addition, a bankrupt or insolvent tenant may be authorized to reject and terminate its lease or leases with us. Any claims against such bankrupt tenant for unpaid future rent would be subject to statutory limitations that would likely result in our receipt of rental revenues that are substantially less than the contractually specified rent we are owed under the lease or leases. In addition, any claim we have for unpaid past rent, if any, may not be paid in full. We may also be unable to re-lease a terminated or rejected space or to re-lease it on comparable or more favorable terms. As a result, a significant number of tenant bankruptcies may materially and adversely affect us.
Tenants who are considering filing for bankruptcy protection may request that we agree to amendments of their master leases to remove certain of the properties they lease from us under such master leases. We cannot guarantee that we will be able to sell or re-lease properties that we agree to release from tenants' leases in the
19
future or that lease termination fees, if any, will be sufficient to make up for the rental revenues lost as a result of lease amendments.
Property vacancies could result in us having to incur significant capital expenditures to re-tenant the properties.
Many of our leases relate to properties that have been designed or physically modified for a particular tenant. If such a lease is terminated or not renewed, we may be required to renovate the property at substantial costs, decrease the rent we charge or provide other concessions in order to lease the property to another tenant. In addition, if we determine to sell the property, we may have difficulty selling it to a party other than the tenant due to the special purpose for which the property may have been designed or modified. This potential illiquidity may limit our ability to quickly modify our portfolio in response to changes in economic or other conditions, including tenant demand.
Defaults by borrowers on mortgages we hold could lead to losses.
We make mortgage and other loans, which are often unsecured, to extend financing to tenants at our properties. A default by a borrower on its loan payments to us that would prevent us from earning interest or receiving a return of the principal of our loan could materially and adversely affect us. In the event of a default, we may also experience delays in enforcing our rights as lender and may incur substantial costs in collecting the amounts owed to us and in liquidating any collateral. Where collateral is available, foreclosure and other similar proceedings used to enforce payment of real estate loans are generally subject to principles of equity, which are designed to relieve the indebted party from the legal effect of that party's default. In the event we have to foreclose on a property, the amount we receive from the foreclosure sale of the property may be inadequate to fully pay the amounts owed to us by the borrower and our costs incurred to foreclose, repossess and sell the property.
We may be unable to identify and complete acquisitions of suitable properties, which may impede our growth, and our future acquisitions may not yield the returns we seek.
Our ability to expand through acquisitions requires us to identify, finance and complete acquisitions or investment opportunities that are compatible with our growth strategy and to successfully integrate newly acquired properties into our portfolio, which may be constrained by the following significant risks: we face competition from other real estate investors, some of which have greater economies of scale, lowers costs of capital, access to more financial resources and greater name recognition than we do, a greater ability to borrow funds and the ability to accept more risk than we can prudently manage, which may significantly reduce our acquisition volume or increase the purchase price for property we acquire, which could reduce our growth prospects; we may be unable to locate properties that will produce a sufficient spread between our cost of capital and the lease rate we can obtain from a tenant, in which case our ability to profitably grow our company will decrease; we may fail to have sufficient capital resources to complete acquisitions or our cost of capital could increase; we may incur significant costs and divert management attention in connection with evaluating and negotiating potential acquisitions, including ones that we are subsequently unable to complete; we may acquire properties that are not accretive to our results upon acquisition; our cash flow from an acquired property may be insufficient to meet our required principal and interest payments with respect to debt used to finance the acquisition of such property; we may discover unexpected items, such as unknown liabilities, during our due diligence investigation of a potential acquisition or other customary closing conditions may not be satisfied, causing us to abandon an investment opportunity after incurring expenses related thereto; we may spend more than budgeted amounts to make necessary improvements or renovations to acquired properties; we may acquire properties subject to liabilities and without any recourse, or with only limited recourse, with respect to unknown liabilities, such as liabilities for clean-up of undisclosed environmental contamination, claims by tenants, vendors or other persons dealing with the former owners of the properties, liabilities incurred in the ordinary course of business and claims for indemnification by general partners, directors, officers and others indemnified by the former owners of the properties; we may obtain only limited warranties when we acquire a property, including properties purchased in “as is” condition on a “where is” basis and “with all faults,” without warranties of merchantability or fitness for a particular purpose and pursuant to purchase agreements that contain only limited warranties, representations and indemnifications that survive for only a limited period after the closing. If any of these risks are realized, we may be materially and adversely affected.
20
Our real estate investments are generally illiquid which could significantly impede our ability to respond to market conditions or adverse changes in the performance of our tenants or our properties and which would harm our financial condition.
Our investments are relatively difficult to sell quickly. As a result of this illiquidity, our ability to promptly sell one or more properties in our portfolio in response to changing economic, financial or investment conditions is limited. Return of capital and realization of gains, if any, from an investment generally will occur upon disposition or refinancing of the underlying property. We may be unable to realize our investment objective by sale, other disposition or refinancing at attractive prices within any given period of time or may otherwise be unable to complete any exit strategy. In particular, these risks could arise from weakness in or even the lack of an established market for a property, changes adversely affecting the tenant of a property, changes adversely affecting the area in which a particular property is located, adverse changes in the financial condition or prospects of prospective purchasers and changes in local, national or international economic conditions.
In addition, the Internal Revenue Code of 1986, as amended (the “Code”), imposes restrictions on a REIT's ability to dispose of properties that are not applicable to other types of real estate companies. In particular, the tax laws applicable to REITs effectively require that we hold our properties for investment, rather than primarily for sale in the ordinary course of business, which may cause us to forgo or defer sales of properties that otherwise would be in our best interest. Therefore, we may not be able to vary our portfolio in response to economic or other conditions promptly or on favorable terms.
Our growth depends on third-party sources of capital that are outside of our control and may not be available to us on commercially reasonable terms or at all.
In order to qualify as a REIT, we are required under the Code, among other things, to distribute annually at least 90% of our REIT taxable income, determined without regard to the dividends paid deduction and excluding any net capital gain. In addition, we will be subject to income tax at the corporate rate to the extent that we distribute less than 100% of our REIT taxable income, determined without regard to the dividends paid deduction and including any net capital gain. Accordingly, we will not be able to fund all of our future capital needs, including any necessary acquisition financing, from operating cash flow. Consequently, we rely on third-party sources to fund a portion of our capital needs. Our access to debt and equity capital, and the cost thereof, depends, in part, on general market conditions, the market's perception of our growth potential, our current debt levels, our current and expected future earnings, our cash flow and cash distributions, and the market price of our common stock. The COVID-19 pandemic has significantly and adversely impacted global, national, regional and local economic activity and has contributed to significant volatility and negative pressure in the financial markets.
If we cannot obtain capital from third-party sources, or if our cost of capital increases materially, we may not be able to acquire properties when strategic opportunities exist, meet the capital and operating needs of our existing properties, satisfy our debt service obligations or make the cash distributions to our stockholders necessary to qualify as a REIT.
Loss of senior executives with long-standing business relationships could materially impair our ability to operate successfully.
Our continued success and our ability to grow our portfolio and business depend, in large part, upon the efforts of certain of our senior executives, in particular our President and Chief Executive Officer, Peter M. Mavoides, and Gregg A. Seibert, our Executive Vice President and Chief Operating Officer, who have extensive market knowledge and relationships and exercise substantial influence over our operational, financing, acquisition and disposition activity. Many of our executive personnel have extensive experience and strong reputations in the real estate industry and have been important in setting our strategic direction, operating our business, assembling and growing our portfolio, identifying, recruiting and training key personnel, and arranging necessary financing. In particular, the extent and nature of the relationships that these individuals have developed with financial institutions and existing and prospective tenants is important to our growth and the success of our business. The loss of services of one or more members of our management team, including due to the adverse health effects of the COVID-19 pandemic, or our inability to attract and retain highly qualified personnel, could adversely affect our business, diminish our investment opportunities and weaken our relationships with lenders, business partners, existing and prospective tenants and industry personnel, which could materially and adversely affect us.
21
Risks Related to Environmental and Compliance Matters and Climate Change
The costs of compliance with or liabilities related to environmental laws may materially and adversely affect us.
The properties we own or have owned in the past may subject us to known and unknown environmental liabilities. We obtain Phase I environmental site assessments on all properties we finance or acquire. However, the Phase I environmental site assessments are limited in scope and therefore may not reveal all environmental conditions affecting a property. Under various federal, state and local laws and regulations relating to the environment, as a current or former owner or operator of real property, we may be liable for costs and damages resulting from environmental matters, including the presence or discharge of hazardous or toxic substances, waste or petroleum products at, on, in, under or migrating from such property, including costs to investigate or clean up such contamination and liability for personal injury, property damage or harm to natural resources. If environmental contamination exists on our properties, we could be subject to strict, joint and/or several liability for the contamination by virtue of our ownership interest; we may face liability regardless of our knowledge of the contamination, the timing of the contamination, the cause of the contamination, or the party responsible for the contamination of the property.
If our environmental liability insurance is inadequate, we may become subject to material losses for environmental liabilities. Although our leases generally require our tenants to operate in compliance with all applicable laws and to indemnify us against any environmental liabilities arising from a tenant's activities on the property, we could be subject to strict liability by virtue of our ownership interest. We cannot be sure that our tenants will, or will be able to, satisfy their indemnification obligations, if any, under our leases. Furthermore, the discovery of environmental liabilities on any of our properties could lead to significant remediation costs or to other liabilities or obligations attributable to the tenant of that property or could result in material interference with the ability of our tenants to operate their businesses as currently operated. Noncompliance with environmental laws or discovery of environmental liabilities could each individually or collectively affect such tenant's ability to make payments to us, including rental payments and, where applicable, indemnification payments. Additionally the known or potential presence of hazardous substances on a property may adversely affect our ability to sell, lease or improve the property or to borrow using the property as collateral. Environmental laws may also create liens on contaminated properties in favor of the government for damages and costs it incurs to address such contamination. Moreover, if contamination is discovered on our properties, environmental laws may impose restrictions on the manner in which they may be used or businesses may be operated, and these restrictions may require substantial expenditures.
Insurance on our properties may not adequately cover all losses and uninsured losses could materially and adversely affect us.
Our tenants are required to maintain liability and property insurance coverage for the properties they lease from us pursuant to triple-net leases. Pursuant to such leases, our tenants are required to name us (and any of our lenders that have a mortgage on the property leased by the tenant) as additional insureds on their liability policies and additional named insured and/or loss payee (or mortgagee, in the case of our lenders) on their property policies. All tenants are required to maintain casualty coverage. Depending on the location of the property, losses of a catastrophic nature, such as those caused by earthquakes and floods, may be covered by insurance policies that are held by our tenant with limitations such as large deductibles or co-payments that a tenant may not be able to meet. In addition, losses of a catastrophic nature, such as those caused by wind/hail, hurricanes, terrorism or acts of war, may be uninsurable or not economically insurable. If there is damage to our properties that is not covered by insurance and such properties are subject to recourse indebtedness, we will continue to be liable for the indebtedness, even if these properties are irreparably damaged.
Inflation, changes in building codes and ordinances, environmental considerations and other factors, including terrorism or acts of war, may make any insurance proceeds we receive insufficient to repair or replace a property if it is damaged or destroyed. In that situation, the insurance proceeds received may not be adequate to restore our economic position with respect to the affected real property. Furthermore, if we experience a substantial or comprehensive loss of one of our properties, we may not be able to rebuild such property to its existing specifications without significant capital expenditures which may exceed any amounts received pursuant to insurance policies, as reconstruction or improvement of such a property would likely require significant upgrades to meet zoning and building code requirements. The loss of our capital investment in or anticipated future returns from our properties due to material uninsured losses could materially and adversely affect us.
22
Compliance with the ADA and fire, safety and other regulations may require us to make unanticipated expenditures.
Our properties are subject to the ADA, fire and safety regulations, building codes and other regulations. Failure to comply with these laws and regulations could result in imposition of fines by the government or an award of damages to private litigants, or both. While our tenants are obligated by law to comply with the ADA and typically obligated under our leases to cover costs associated with compliance with the ADA and other property regulations, if required changes involve greater expenditures than anticipated or if the changes must be made on a more accelerated basis than anticipated, the ability of our tenants to cover costs could be adversely affected, and we could be required to expend our own funds to comply with applicable law and regulation.
Our operations and financial condition may be adversely affected by climate change, including possible changes in weather patterns, weather-related events, government policy, laws, regulations and economic conditions.
In recent years, the assessment of the potential impact of climate change has begun to impact the activities of government authorities, the pattern of consumer behavior and other areas that impact the business environment in the U.S., including, but not limited to, energy-efficiency measures, water use measures and land-use practices. The promulgation of policies, laws or regulations relating to climate change by governmental authorities in the U.S. and the markets in which we own properties may require us to invest additional capital in our properties. In addition, the impact of climate change on businesses operated by our tenants is not reasonably determinable at this time. While not generally known at this time, climate change may impact weather patterns or the occurrence of significant weather events which could impact economic activity or the value of our properties in specific markets. The occurrence of any of these events or conditions may adversely impact our ability to lease our properties, including our or our tenants’ ability to obtain property insurance on acceptable terms, which would materially and adversely affect us.
Risks Related to Our Indebtedness
As of
December 31, 2020
, we had $821.2 million of indebtedness outstanding, which requires substantial cash flow to service, subjects us to covenants and refinancing risk and the risk of default.
As of December 31, 2020, we had $821.2 million of indebtedness outstanding. This indebtedness consisted of $173.2 million aggregate principal amount of Class A Notes and Class B Notes issued under our Master Trust Funding Program, $18.0 million of borrowings under our Revolving Credit Facility and $630.0 million of combined borrowings under the April 2019 Term Loan and the November 2019 Term Loan. Payments of principal and interest on indebtedness may leave us with insufficient cash resources to meet our cash needs, including funding our investment program, or to make the distributions to our common stockholders currently contemplated or necessary to continue to qualify as a REIT. Our indebtedness and the limitations imposed on us by our debt agreements could have significant adverse consequences, including the following: our cash flow may be insufficient to make our required principal and interest payments; cash interest expense and financial covenants relating to our indebtedness may limit or eliminate our ability to make distributions to our common stockholders; we may be unable to borrow additional funds as needed or on favorable terms, which could, among other things, adversely affect our ability to consummate investment opportunities or meet operational needs; we may be unable to refinance our indebtedness at maturity, or the refinancing terms may be less favorable than the terms of the debt being refinanced; because a portion of our debt bears interest at variable rates, increases in interest rates could increase our interest expense; we may be unable to hedge floating rate debt, counterparties may fail to honor their obligations under our hedge agreements, such agreements may not effectively hedge interest rate fluctuation risk, and, upon the expiration of our hedge agreements, we will be exposed to then-existing market rates of interest and future interest rate volatility; we may be forced to dispose of properties, possibly on unfavorable terms or in violation of certain covenants to which we may be subject; we may default on our obligations, and, with respect to our secured indebtedness, the lenders or mortgagees may foreclose on our properties or our interests in the entities that own the properties that secure their loans and receive an assignment of rents and leases; foreclosure on collateral securing indebtedness could create taxable income without accompanying cash proceeds, which could adversely affect our ability to meet the distribution requirement necessary to maintain our qualification for taxation as a REIT under the Code; we may be restricted from accessing some of our excess cash flow after debt service if certain of our tenants fail to meet certain financial performance metric thresholds; we may violate restrictive covenants in our loan documents, which would entitle the lenders to accelerate our debt obligations; and our default under any loan with cross-default provisions could result in a default on other indebtedness. The occurrence of any of these events could materially and adversely affect us.
23
Our business plan depends on external sources of capital, including debt financings, and market conditions could adversely affect our ability to refinance existing indebtedness or obtain additional financing for growth on commercially acceptable terms or at all.
Credit markets may experience significant price volatility, displacement and liquidity disruptions, including the bankruptcy, insolvency or restructuring of certain financial institutions. Such circumstances could materially impact liquidity in the financial markets, making financing terms for borrowers less attractive, and potentially result in the unavailability of various types of debt financing. As a result, we may be unable to obtain debt financing on favorable terms or at all or fully refinance maturing indebtedness with new indebtedness. Reductions in our available borrowing capacity or inability to obtain credit when required or when business conditions warrant could materially and adversely affect us.
If prevailing interest rates or other factors at the time of refinancing result in higher interest rates upon refinancing, then the interest expense relating to that refinanced indebtedness would increase. Higher interest rates on newly incurred debt may negatively impact us as well. If interest rates increase, our interest costs and overall costs of capital will increase, which could materially and adversely affect us and our ability to make distributions to our stockholders.
We have engaged in hedging transactions and may engage in additional hedging transactions in the future; such transactions may materially and adversely affect our results of operations and cash flows.
We use hedging strategies, in a manner consistent with the REIT qualification requirements, in an effort to reduce our exposure to changes in interest rates. As of December 31, 2020, we were party to eight interest rate swap agreements with third-party financial institutions having an aggregate notional amount of $630.0 million that are designated as cash flow hedges and designed to effectively fix the LIBOR component of the interest rate on the debt outstanding under our term loans. Unanticipated changes in interest rates may result in poorer overall investment performance than if we had not engaged in any such hedging transactions and may materially and adversely affect our business by increasing our cost of capital and reducing the net returns we earn on our portfolio.
A significant portion of our assets have been pledged to secure the borrowings of our subsidiaries.
A significant portion of our investment portfolio consists of assets owned by our consolidated, bankruptcy remote, special purpose entity subsidiaries that have been pledged to secure the long-term borrowings of those subsidiaries. As of December 31, 2020, we had 258 properties comprising $399.7 million of net investments pledged as collateral under our Master Trust Funding Program. We or our other consolidated subsidiaries are the equity owners of these special purpose entities, meaning we are entitled to the excess cash flows after debt service and all other required payments are made on the debt of these entities. If our subsidiaries fail to make the required payments on this indebtedness, distributions of excess cash flow to us may be reduced or eliminated and the indebtedness may become immediately due and payable. If the subsidiaries are unable to pay the accelerated indebtedness, the pledged assets could be foreclosed upon and distributions of excess cash flow to us may be suspended or terminated. In that case, our ability to make distributions to our stockholders could be materially and adversely affected.
Under certain circumstances, the subsidiaries included in our Master Trust Funding Program would be prohibited from distributing excess cash flow to us, and the assets of such subsidiaries could be foreclosed upon.
Through
our
Master Trust Funding Program, certain of our Operating Partnership's indirect wholly owned subsidiaries have issued net-lease mortgage notes payable with an aggregate outstanding principal balance of $173.2 million as of December 31, 2020. As of December 31, 2020, we had pledged 258 properties, with a net investment amount of $399.7 million, as collateral under this program. As
the
equity owner of the subsidiaries included in our Master Trust Funding Program, we are only entitled to the excess cash flows from such subsidiaries after debt service and all other required payments are made on the notes. If, at any time, the monthly debt service coverage ratio (as defined) generated by the collateral pool is less than or equal to 1.25x, excess cash flow (as defined) from the subsidiaries included in our Master Trust Funding Program will be deposited into a reserve account to be used for payments on the net-lease mortgage notes in the event there is a shortfall in cash at such subsidiaries to make required payments on the notes. Additionally, if at any time the three month average debt service coverage ratio generated by the collateral pool is less than or equal to 1.15x, excess cash flow from the subsidiaries included in our Master Trust Funding Program will be applied to an early amortization of the notes. For
24
the year ended December 31, 2020, the debt service coverage ratio was approximately 2.27x. If we fail to maintain the required debt service coverage ratios, the excess cash flows we receive from these subsidiaries would be reduced or eliminated. This could materially and adversely affect us, including by reducing our ability to pay cash distributions on our common stock and possibly prevent us from maintaining our qualification for taxation as a REIT. In addition, if the subsidiaries included in our Master Trust Funding Program are unable to repay the notes, including in connection with any acceleration of maturity, the pledged assets could be foreclosed upon and our equity in such assets eliminated.
Changes to, or the elimination of, LIBOR may adversely affect interest expense related to borrowings under our Revolving Credit Facility, the April 2019 Term Loan and the November 2019 Term Loan.
The interest rate under our Revolving Credit Facility, our April 2019 Term Loan and our November 2019 Term Loan is calculated using LIBOR. In July 2017, the Financial Conduct Authority (“FCA”) that regulates LIBOR announced it intends to stop compelling banks to submit rates for the calculation of LIBOR after 2021. As a result, the Federal Reserve Board and the
Federal
Reserve Bank of New York organized the Alternative Reference Rates Committee, which identified the Secured Overnight Financing Rate (“SOFR”) as its preferred alternative to USD-LIBOR in derivatives and other financial contracts. On November 30, 2020, ICE Benchmark Administration, the administrator of LIBOR, announced plans to consult on ceasing publication of LIBOR on December 31, 2021 for only the one week and two month LIBOR tenors, and on June 30, 2023 for all other LIBOR tenors. The Federal Reserve Board concurrently issued a statement advising banks to stop new LIBOR issuances by the end of 2021. The future of LIBOR at this time is uncertain , and weather or not SOFR, or another alternative reference rate, attains market traction as a LIBOR replacement tool remains in question. The effect of the establishment of alternative reference rates or any other reforms to LIBOR or other reference rates (including whether LIBOR will continue to be an acceptable market benchmark) cannot be predicted at this time. Factors such as the pace of the transition to replacement or reformed rates, the specific terms and parameters for and market acceptance of any alternative reference rate, prices of and the liquidity of trading markets for products based on alternative reference rates, and our ability to transition and develop appropriate systems and analytics for one or more alternative reference rates could materially and adversely affect us.
Our debt financing agreements contain restrictions and covenants which may limit our ability to enter into, or obtain funding for, certain transactions, operate our business or make distributions to our common stockholders.
Our debt financing agreements contain financial and other covenants with which we are required to comply and that limit our ability to operate our business. These covenants, as well as any additional covenants to which we may be subject in the future because of additional or replacement debt financing, could cause us to have to forego investment opportunities,
reduce
or eliminate distributions to our common stockholders or obtain financing that is more expensive than financing we could obtain if we were not subject to the covenants. The covenants impose limitations on, among other things, our ability to pay distributions to our stockholders under certain circumstances, subject to certain exceptions relating to our qualification as a REIT under the Code. In addition, these agreements have cross-default provisions that generally result in an event of default if we default under other material indebtedness.
The covenants and other restrictions under our debt agreements may affect, among other things, our ability to: incur indebtedness; create liens on assets; cause our subsidiaries to distribute cash to us to fund distributions to stockholders or to otherwise use in our business; (see “Item 7. Management's Discussion and Analysis of Financial Condition and Results of Operations-Description of Certain Debt”); sell or substitute assets; modify certain terms of our leases; manage our cash flows; and make distributions to equity holders, including our common stockholders.
Additionally, these restrictions may adversely affect our operating and financial flexibility and may limit our ability to respond to changes in our business or competitive environment, all of which may materially and adversely affect us.
Mortgage debt obligations expose us to the possibility of foreclosure, which could result in the loss of our investment in any property subject to mortgage debt.
Future borrowings may be secured by mortgages on our properties. Incurring mortgage and other secured debt obligations increases our risk of losses because defaults on secured indebtedness may result in foreclosure actions initiated by lenders and ultimately our loss of the properties securing any loans for which we are in default. If
25
we are in default under a cross-defaulted mortgage loan, we could lose multiple properties to foreclosure. For tax purposes, a foreclosure of any of our properties would be treated as a sale of the property for a purchase price equal to the outstanding balance of the debt secured by the mortgage. If the outstanding balance of the debt secured by the mortgage exceeds our tax basis in the property, we would recognize taxable income on foreclosure, but would not receive any cash proceeds, which could hinder our ability to meet the REIT distribution requirements. As we execute our business plan, we may assume or incur new mortgage indebtedness on our properties. Any default under any mortgage debt obligation we incur may increase the risk of our default on our other indebtedness.
Risks Related to Our Organizational Structure
Our charter and bylaws and Maryland law contain provisions that may delay, defer or prevent a change of control transaction, even if such a change in control may be in your interest, and as a result may depress the market price of our common stock. Our charter contains certain restrictions on ownership and transfer of our stock.
Our charter contains various provisions that are intended to, among other things, assist us in maintaining our qualification for taxation as a REIT and, subject to certain exceptions, authorizes our directors to take such actions as are necessary or appropriate to cause us to continue to qualify as a REIT. For example, our charter prohibits the actual, beneficial or constructive ownership by any person of more than 9.8% in value or in number of shares, whichever is more restrictive, of the outstanding shares of our common stock or more than 9.8% in value of the aggregate of the outstanding shares of all classes and series of our stock.
Our board of directors, in its sole and absolute discretion, may exempt a person, prospectively or retroactively, from these ownership limits if certain conditions are satisfied. The restrictions on ownership and transfer of our stock may, among other things: discourage a tender offer or other transactions or a change in management or of control that might involve a premium price for our common stock or that our stockholders otherwise believe to be in their best interests; or result in the transfer of shares acquired in excess of the restrictions to a trust for the benefit of one or more charitable beneficiaries and, as a result, the forfeiture by the acquirer of the benefits of owning the additional shares.
We could increase or decrease the number of authorized shares of stock, classify and reclassify unissued stock and issue stock without stockholder approval.
Our board of directors, without stockholder approval, has the power under our charter to amend our charter to increase or decrease the aggregate number of shares of stock or the number of shares of stock of any class or series that we are authorized to issue, to authorize us to issue authorized but unissued shares of our common stock or preferred stock and to classify or reclassify any unissued shares of our common stock or preferred stock into one or more classes or series of stock and to set the terms of such newly classified or reclassified shares. As a result, we may issue one or more classes or series of common stock or preferred stock with preferences, conversion or other rights, voting powers or rights, restrictions, limitations as to dividends or other distributions, qualifications or terms or conditions of redemption that are senior to, or otherwise conflict with, the rights of our common stockholders. Our board of directors could establish a class or series of common stock or preferred stock that could, depending on the terms of such class or series, delay, defer or prevent a transaction or a change of control that might involve a premium price for our common stock or otherwise be in the best interest of our stockholders.
Termination of the employment agreements with certain members of our senior management team could be costly and could prevent a change in control of our company.
The employment agreements with certain members of our senior management team provide that if their employment with us terminates under certain circumstances (including in connection with a change in control of our company), we may be required to pay them significant amounts of severance compensation, thereby making it costly to terminate their employment. Furthermore, these provisions could delay or prevent a transaction or a change in control of our company that might involve a premium paid for shares of our common stock or otherwise be in the best interests of our stockholders.
26
Our board of directors may change our investment and financing policies without stockholder approval, including those with respect to borrowing, and we may become more highly leveraged, which may increase our risk of default under our debt obligations.
Our investment and financing policies are exclusively determined by our board of directors. Accordingly, our stockholders do not control these policies. Further, our organizational documents do not limit the amount or percentage of indebtedness, funded or otherwise, that we may incur. Although we are not required by our organizational documents to maintain a particular leverage ratio and may not be able to do so, we generally intend to target a level of net debt (which includes recourse and non-recourse borrowings and any outstanding preferred stock issuance less unrestricted cash and cash equivalents) that, over time, is less than six times our Annualized Adjusted EBITDA
re
. However, from time to time, our ratio of net debt to our Annualized Adjusted EBITDA
re
may equal or exceed six times. Our board of directors may alter or eliminate our current policy on borrowing at any time without stockholder approval. If this policy changed, we could become more highly leveraged, which could result in an increase in our debt service and the risk of default on our obligations. In addition, a change in our investment policies, including the manner in which we allocate our resources across our portfolio or the types of assets in which we seek to invest, may increase our exposure to interest rate risk, real estate market fluctuations and liquidity risk. Changes to our policies with regard to the foregoing could materially and adversely affect us.
Our rights and the rights of our stockholders to take action against our directors and officers are limited.
As permitted by Maryland law, our charter limits the liability of our directors and officers to us and our stockholders for money damages to the maximum extent permitted by Maryland law. Therefore, our directors and officers are subject to monetary liability resulting only from: actual receipt of an improper benefit or profit in money, property or services; or active and deliberate dishonesty by the director or officer that was established by a final judgment as being material to the cause of action adjudicated.
As a result, we and our stockholders have rights against our directors and officers that are more limited than might otherwise exist. Accordingly, if actions taken by any of our directors or officers impede the performance of our company, your and our ability to recover damages from such director or officer will be limited. In addition, our charter and our bylaws require us to indemnify our directors and officers for actions taken by them in those and certain other capacities to the maximum extent permitted by Maryland law.
We are a holding company with no direct operations and rely on funds received from our Operating Partnership to make any distributions to stockholders and to pay liabilities.
We are a holding company and conduct substantially all of our operations through our Operating Partnership. We do not have any independent operations, and our only material asset is our interest in our Operating Partnership. As a result, we rely on distributions from our Operating Partnership to pay any distributions we might declare on shares of our common stock. We also rely on distributions from our Operating Partnership to meet any of our obligations, including any tax liability on taxable income allocated to us from our Operating Partnership. In addition, because we are a holding company, claims by our stockholders will be structurally subordinated to all existing and future liabilities and obligations (whether or not for borrowed money) of our Operating Partnership and its subsidiaries. Therefore, in the event of our bankruptcy, liquidation or reorganization, our assets and those of our Operating Partnership and its subsidiaries will be able to satisfy the claims of our stockholders only after all of our and our Operating Partnership's and its subsidiaries' liabilities and obligations have been paid in full.
In connection with our future acquisition of properties or otherwise, we may issue units of our Operating Partnership to third parties. Such issuances would reduce our ownership in our Operating Partnership. If you do not directly own units of our Operating Partnership, you will not have any voting rights with respect to any such issuances or other partnership level activities of our Operating Partnership.
Conflicts of interest could arise in the future between the interests of our stockholders and the interests of holders of units in our Operating Partnership, which may impede business decisions that could benefit our stockholders.
Conflicts of interest could arise in the future as a result of the relationships between us and our stockholders, on the one hand, and our Operating Partnership and its limited partners, on the other. Under the terms of the partnership agreement of our Operating Partnership, if there is a conflict between the interests of our stockholders, on one hand, and any limited partners, on the other, we will endeavor in good faith to resolve the conflict in a
27
manner not adverse to either our stockholders or any limited partners; provided, however, that so long as we own a controlling economic interest in our Operating Partnership, any conflict that cannot be resolved in a manner not adverse to either our stockholders or any limited partners shall be resolved in favor of our stockholders.
Certain mergers, consolidations and other transactions require the approval of a majority in interest of the outside limited partners in our Operating Partnership (which excludes us and our subsidiaries), which could prevent certain transactions that may result in our stockholders receiving a premium for their shares or otherwise be in their best interest.
The partnership agreement requires the general partner or us, as the parent of the general partner, to obtain the approval of a majority in interest of the outside limited partners in our Operating Partnership (which excludes us and our subsidiaries) in connection with certain mergers, consolidations or other combinations of us, or a sale of all or substantially all of our assets. This approval right could prevent a transaction that might be in the best interests of our stockholders.
Risks Related to Our Status as a REIT
Failure to continue to qualify as a REIT would materially and adversely affect us and the value of our common stock, and even if we continue to qualify as a REIT, we may be subject to certain additional taxes.
We elected to be taxed as a REIT for federal income tax purposes beginning with our taxable year ended December 31, 2018, and we believe that our current organization and operations have allowed and will continue to allow us to qualify as a REIT. We have not requested and do not plan to request a ruling from the Internal Revenue Service, or IRS, that we qualify as a REIT, and the statements in this Annual Report are not binding on the IRS or any court. Therefore, we cannot assure you that we will remain qualified as a REIT in the future. If we lose our REIT status, we will face significant tax consequences that would substantially reduce our cash available for distribution to you for each of the years involved because: we would not be allowed a deduction for distributions to stockholders in computing our taxable income and would be subject to federal income tax at the corporate rate; we also could be subject to increased state and local taxes; and unless we are entitled to relief under applicable statutory provisions, we could not elect to be taxed as a REIT for four taxable years following the year during which we were disqualified.
Any such corporate tax liability could be substantial and would reduce our cash available for, among other things, our operations and distributions to stockholders. In addition, if we fail to remain qualified as a REIT, we will not be required to make distributions to our stockholders. As a result of all these factors, our failure to remain qualified as a REIT also could impair our ability to expand our business and raise capital and could materially and adversely affect the trading price of our common stock.
Qualification as a REIT involves the application of highly technical and complex Code provisions for which there are only limited judicial and administrative interpretations. The determination of various factual matters and circumstances not entirely within our control may affect our ability to continue to qualify as a REIT. In order to continue to qualify as a REIT, we must satisfy a number of requirements, including requirements regarding the ownership of our stock, requirements regarding the composition of our assets and a requirement that at least 95% of our gross income in any year must be derived from qualifying sources, such as “rents from real property.” Also, we must make distributions to stockholders aggregating annually at least 90% of our REIT taxable income, determined without regard to the dividends paid deduction and excluding any net capital gains. In addition, legislation, new regulations, administrative interpretations or court decisions may materially and adversely affect our investors, our ability to continue to qualify as a REIT for federal income tax purposes or the desirability of an investment in a REIT relative to other investments.
Even if we continue to qualify as a REIT for federal income tax purposes, we may be subject to some federal, state and local income, property and excise taxes on our income or property and, in certain cases, a 100% penalty tax, in the event we sell property as a dealer. In addition, any taxable REIT subsidiaries will be subject to tax as regular corporations in the jurisdictions in which they operate.
If our Operating Partnership fails to qualify as a partnership for federal income tax purposes, we will cease to qualify as a REIT and suffer other adverse consequences.
We believe that our Operating Partnership will be treated as a partnership for federal income tax purposes and, as a result, will generally not be subject to federal income tax on its income. Instead, for federal income tax
28
purposes each of the partners of the Operating Partnership, including us, will be allocated, and may be required to pay tax with respect to, such partner's share of its income. Our Operating Partnership will generally be required to determine and pay an imputed underpayment of tax (plus interest and penalties) resulting from an adjustment of the Operating Partnership's items of income, gain, loss, deduction or credit at the partnership level. We cannot assure you that the IRS will not challenge the tax classification of our Operating Partnership or any other subsidiary partnership in which we own an interest, or that a court will not sustain such a challenge. If the IRS were successful in treating our Operating Partnership or any such other subsidiary partnership as an entity taxable as a corporation for federal income tax purposes, we will fail to meet the gross income tests and certain of the asset tests applicable to REITs and, accordingly, we will likely cease to qualify as a REIT. Also, the failure of our Operating Partnership or any subsidiary partnerships to qualify as a disregarded entity or partnership could cause it to become subject to federal and state corporate income tax, which will reduce significantly the amount of cash available for debt service and for distribution to its partners, including us.
To maintain our REIT status, we may be forced to borrow funds during unfavorable market conditions, and the unavailability of such capital on favorable terms at the desired times, or at all, may cause us to curtail our investment activities and/or to dispose of assets at inopportune times, which could materially and adversely affect us and the per share trading price of our common stock.
To continue to qualify as a REIT, we generally must distribute to our stockholders at least 90% of our REIT taxable income each year, determined without regard to the dividends-paid deduction and excluding any net capital gains, and we will be subject to corporate income tax on our undistributed taxable income to the extent that we distribute less than 100% of our REIT taxable income, determined without regard to the dividends-paid deduction and including any net capital gains, each year. In addition, we will be subject to a 4% nondeductible excise tax on the amount, if any, by which distributions paid by us in any calendar year are less than the sum of 85% of our ordinary income, 95% of our capital gain net income and 100% of our undistributed income from prior years.
In order to maintain our REIT status and avoid the payment of income and excise taxes, we may need to borrow funds to meet the REIT distribution requirements even if market conditions are not favorable for these borrowings. We cannot assure you that we will have access to such capital on favorable terms at the desired times, or at all, which may cause us to curtail our investment activities and/or to dispose of assets at inopportune times, and could materially and adversely affect us and the per share trading price of our common stock.
Our ability to provide certain services to our tenants may be limited by the REIT rules or may have to be provided through a Taxable REIT Subsidiary.
As a REIT, we generally cannot provide services to our tenants other than those that are customarily provided by landlords, nor can we derive income from a third party that provides such services. If we forego providing such services to our tenants, we may be at a disadvantage to competitors that are not subject to the same restrictions. However, we can provide such non-customary services to our tenants and receive our share in the revenue from such services if we do so through a taxable REIT subsidiary (“TRS”), though income earned by such TRS will be subject to U.S. federal corporate income taxation.
The IRS may treat sale-leaseback transactions as loans, which could jeopardize our REIT status or require us to make an unexpected distribution.
A significant portion of our investments were obtained through sale-leaseback transactions, where we purchase owner-occupied real estate and lease it back to the seller. We expect that a majority of our future investments will be obtained this way. The IRS may take the position that specific sale-leaseback transactions that we treat as leases are not true leases for federal income tax purposes but, instead, should be re-characterized as financing arrangements or loans.
If a sale-leaseback transaction were so re-characterized, we might fail to satisfy the REIT asset tests, the income tests or distribution requirements and consequently lose our REIT status effective with the year of re-characterization unless we elect to make an additional distribution to maintain our REIT status. The primary risk relates to our loss of previously incurred depreciation expenses, which could affect the calculation of our REIT taxable income and could cause us to fail the REIT distribution test that requires a REIT to distribute at least 90% of its REIT taxable income, determined without regard to the dividends-paid deduction and excluding any net capital gain. In this circumstance, we may elect to distribute an additional dividend of the increased taxable income so as
29
not to fail the REIT distribution test. This distribution would be paid to all stockholders at the time of declaration rather than the stockholders existing in the taxable year affected by the re-characterization.
Dividends payable by REITs do not qualify for the reduced tax rates available for some dividends.
The maximum tax rate applicable to income from "qualified dividends" payable to U.S. stockholders that are individuals, trusts and estates is 20%. Dividends payable by REITs, however, generally are not eligible for the 20% rate except to the extent the REIT dividends are attributable to "qualified dividends" received by the REIT itself. However, for non-corporate U.S. stockholders, dividends payable by REITs that are not designated as capital gain dividends or otherwise treated as "qualified dividends" generally are eligible for a deduction of 20% of the amount of such dividends, for taxable years beginning before January 1, 2026. More favorable rates will nevertheless continue to apply for regular corporate "qualified dividends." Although these rules do not adversely affect the taxation of REITs or dividends payable by REITs, if the 20% rate continues to apply to regular corporate qualified dividends, investors who are individuals, trusts and estates may regard investments in REITs to be relatively less attractive than investments in the stocks of non-REIT corporations.
The tax imposed on REITs engaging in “prohibited transactions” may limit our ability to engage in transactions which would be treated as sales for federal income tax purposes.
A REIT's net income from “prohibited transactions” is subject to a 100% penalty tax. In general, prohibited transactions are sales or other dispositions of property, other than foreclosure property, held primarily for sale to customers in the ordinary course of business. Although we do not intend to hold any properties that would be characterized as held for sale to customers in the ordinary course of our business, unless a sale or disposition qualifies under certain statutory safe harbors, no guarantee can be given that the IRS would agree with our characterization of our properties or that we will always be able to make use of the available safe harbors.
Complying with REIT requirements may limit our ability to hedge effectively and may cause us to incur tax liabilities.
The REIT provisions of the Code substantially limit our ability to hedge our assets and liabilities. Any income from a hedging transaction that we enter into to manage the risk of interest rate changes with respect to borrowings made or to be made to acquire or carry real estate assets, or from certain terminations of such hedging positions, does not constitute “gross income” for purposes of the 75% or 95% gross income tests that apply to REITs, provided that certain identification requirements are met. To the extent that we enter into other types of hedging transactions or fail to properly identify such transaction as a hedge, the income is likely to be treated as non-qualifying income for purposes of both of the gross income tests. As a result of these rules, we may be required to limit our use of advantageous hedging techniques or implement those hedges through a TRS. This could increase the cost of our hedging activities because any TRS in which we own an interest may be subject to tax on gains or expose us to greater risks associated with changes in interest rates than we would otherwise want to bear. In addition, losses in any TRS in which we own an interest will generally not provide any tax benefit, except that such losses could theoretically be carried forward against future taxable income in such TRS.
Complying with REIT requirements may affect our profitability and may force us to liquidate or forgo otherwise attractive investments.
To qualify as a REIT, we must continually satisfy tests concerning, among other things, the nature and diversification of our assets, the sources of our income and the amounts we distribute to our stockholders. We may be required to liquidate or forgo otherwise attractive investments in order to satisfy the asset and income tests or to qualify under certain statutory relief provisions. We also may be required to make distributions to stockholders at disadvantageous times or when we do not have funds readily available for distribution. As a result, having to comply with the distribution requirement could cause us to: (i) sell assets in adverse market conditions; (ii) borrow on unfavorable terms; or (iii) distribute amounts that would otherwise be invested in future acquisitions, capital expenditures or repayment of debt. Accordingly, satisfying the REIT requirements could materially and adversely affect us. Moreover, if we are compelled to liquidate our investments to meet any of these asset, income or distribution tests, or to repay obligations to our lenders, we may be unable to comply with one or more of the requirements applicable to REITs or may be subject to a 100% tax on any resulting gain if such sales are prohibited transactions.
30
There is a risk of changes in the tax law applicable to REITs.
Because the IRS, the United States Treasury Department and Congress frequently review federal income tax legislation, we cannot predict whether, when or to what extent new federal tax laws, regulations, interpretations or rulings will be adopted. Any of such legislative actions may prospectively or retroactively modify our tax treatment and, therefore, may adversely affect taxation of us and/or our investors. For example, the Tax Cuts and Jobs Act of 2017 (the “TCJA”) has significantly changed the U.S. federal income taxation of U.S. businesses and their owners, including REITs and their stockholders. You are urged to consult with your tax advisor with respect to the status of legislative, regulatory, judicial or administrative developments and proposals and their potential effect on an investment in our securities.
Risks Related to the Ownership of Our Common Stock
Changes in market conditions and volatility of stock prices could adversely affect the market price of our common stock.
The market price of our common stock on the NYSE has experienced significant volatility, particularly since the outbreak of the COVID-19 pandemic. The market price of our common stock will fluctuate, and such fluctuations could be significant and frequent; accordingly, our common stockholders may experience a significant decrease in the value of their shares, including decreases that may be related to technical market factors and may be unrelated to our operating performance or prospects. Similarly, the trading volume of our common stock may decline, and our common stockholders could experience a decrease in liquidity. A number of factors could negatively affect the price per share of our common stock, including: actual or anticipated variations in our quarterly operating results or distributions; changes in our funds from operations (“FFO”), core FFO (“Core FFO”), adjusted FFO (“AFFO”) or guidance; changes in our net investment activity; difficulties or inability to access equity or debt capital on attractive terms or extend or refinance existing debt; increases in our leverage; changes in our management or business strategy; failure to comply with the NYSE listing requirements or other regulatory requirements; and the other factors described in this Risk Factors section. Many of these factors are beyond our control. These factors may cause the market price of shares of our common stock to decline significantly, regardless of our financial condition, results of operations, business or our prospects.
Increases in market interest rates may result in a decrease in the value of shares of our common stock.
One of the factors that may influence the price of shares of our common stock is the distribution yield on shares of our common stock (as a percentage of the price of shares of our common stock) relative to market interest rates. An increase in market interest rates, which are currently at low levels relative to historical rates, may lead prospective purchasers of shares of our common stock to expect a higher distribution yield. Additionally, higher interest rates would likely increase our borrowing costs and potentially decrease funds available for distribution. Thus, higher market interest rates could cause the per share trading price of our common stock to decrease. Higher borrowing costs and a reduced trading price of our common stock would increase our overall cost of capital and adversely affect our ability to make accretive acquisitions.
We may be unable to continue to make distributions at our current distribution level, and our board may change our distribution policy in the future.
While we expect to continue to make regular quarterly distributions to the holders of our common stock, if sufficient cash is not available for distribution from our operations, we may have to fund distributions from working capital or net proceeds from asset sales, borrow to provide funds for such distributions, or reduce the amount of such distributions. To the extent we borrow to fund distributions, our future interest costs would increase, thereby reducing our earnings and cash available for distribution from what they otherwise would have been. If cash available for distribution generated by our assets is less than expected, or if such cash available for distribution decreases in future periods from expected levels, our inability to make distributions could result in a decrease in the market price of our common stock.
The decision to declare and pay distributions on our common stock, as well as the form, timing and amount of any such future distributions, is at the sole discretion of our board of directors and depends on upon a number of factors, including our actual and projected results of operations, FFO, Core FFO, AFFO, liquidity, cash flows and financial condition, the revenue we actually receive from our properties, our operating expenses, our debt service requirements, our capital expenditures, prohibitions and other limitations under our financing arrangements, our REIT taxable income, the annual REIT distribution requirements, applicable law and such other factors as our board
31
of directors deems relevant. We may not be able to make distributions in the future, and our inability to make distributions, or to make distributions at expected levels, could have a material adverse effect on the market price of our common stock.
The incurrence of additional debt, which would be senior to shares of our common stock upon liquidation, and/or preferred equity securities that may be senior to shares of our common stock for purposes of distributions or upon liquidation, may materially and adversely affect the market price of shares of our common stock.
In the future, we may attempt to increase our capital resources by making additional offerings of debt or preferred equity securities, including by causing our Operating Partnership or its subsidiaries to issue additional debt securities, or by otherwise incurring additional indebtedness. Upon liquidation, holders of our debt securities, other lenders and creditors, and any holders of preferred stock with a liquidation preference will receive distributions of our available assets prior to our stockholders. Additionally, any convertible or exchangeable securities that we issue in the future may have rights, preferences and privileges more favorable than those of our common stock and may result in dilution to owners of our common stock. Our stockholders are not entitled to preemptive rights or other protections against dilution. Our preferred stock, if issued, could have a preference on liquidating distributions or a preference on distribution payments that could limit our right to make distributions to our stockholders. Because our decision to issue securities in any future offering will depend on market conditions and other factors beyond our control, we cannot predict or estimate the amount, timing or nature of our future offerings. Our stockholders bear the risk of our future offerings reducing per share trading price of our common stock.
Sales of substantial amounts of our common stock or securities convertible into or exercisable or exchangeable therefor, or the perception that such sales might occur, could reduce the price of our common stock and may dilute your voting power and your ownership interest in us.
Sales of substantial amounts of our common stock or securities convertible into or exercisable or exchangeable therefor (such as OP Units), or the perception that such sales might occur, could adversely affect the market price of our common stock. Additionally, such sales would dilute the voting power and ownership interest of existing common stockholders. Our charter provides that we may issue up to 500,000,000 shares of common stock, and a majority of our entire board of directors has the power to amend our charter to increase the aggregate number of shares of stock or the number of shares of stock of any class or series that we are authorized to issue without stockholder approval. As of December 31, 2020, we had 106,361,524 shares of common stock outstanding and 553,847 OP Units outstanding (excluding OP Units held directly or indirectly by us). The currently outstanding OP Units are primarily held by members of our management team. OP Units are generally redeemable for cash or, at our election, shares of common stock on a one-for-one basis, which may result in stockholder dilution. In the future we may acquire properties through tax deferred contribution transactions in exchange for OP Units. This acquisition structure may have the effect of, among other things, reducing the amount of tax depreciation we could deduct over the tax life of the acquired properties, and may require that we agree to protect the contributors' ability to defer recognition of taxable gain through restrictions on our ability to dispose of the acquired properties and/or the allocation of partnership debt to the contributors to maintain their tax bases. These restrictions could limit our ability to sell an asset at a time, or on terms, that would be favorable absent such restrictions. As of December 31, 2020, 2119352 shares remain available for issuance under our 2018 Incentive Plan.
General Risk Factors
Any material failure, weakness, interruption or breach in security of our information systems could prevent us from effectively operating our business.
We rely on information systems across our operations and corporate functions, including finance and accounting, and depend on such systems to ensure payment of obligations, collection of cash, data warehousing to support analytics, and other various processes and procedures. Due to the COVID-19 pandemic, many of our business processes are being conducted remotely, which places increased reliance on our information technology systems. Our ability to efficiently manage our business depends significantly on the reliability and capacity of these systems. The failure of these systems to operate effectively, maintenance problems, upgrading or transitioning to new platforms or a breach in security of these systems, such as in the event of cyber-attacks, could adversely affect us. There can be no assurance that our security efforts and measures will be effective or that attempted security breaches or disruptions would not be successful or damaging. A security breach or other significant disruption involving our information systems could disrupt the proper functioning of our networks and systems; result in
32
misstated financial reports, violations of loan covenants and/or missed reporting deadlines; result in our inability to properly monitor our compliance with the rules and regulations regarding our qualification as a REIT; result in the unauthorized access to, and destruction, loss, theft, misappropriation or release of proprietary, confidential, sensitive or otherwise valuable information of ours or others, which others could use to compete against us or for disruptive, destructive or otherwise harmful purposes and outcomes; require significant management attention and resources to remedy any damages that result; subject us to claims for breach of contract, damages, credits, penalties or termination of leases or other agreements; or damage our reputation among our tenants and investors generally.
We are subject to litigation, which could materially and adversely affect us.
From time to time, we are party to various lawsuits, claims and other legal proceedings. These matters may involve significant expense and may result in judgments or settlements, which may be significant. There can be no assurance that insurance will be available to cover losses related to legal proceedings or that our tenants will meet any indemnification obligations that they have to us. Litigation may result in significant defense costs and potentially significant judgments against us, some of which are not, or cannot be, insured against. Resolution of these types of matters against us may result in our having to pay significant fines, judgments or settlements, which, if uninsured, or if the fines, judgments, and settlements exceed insured levels, could materially and adversely affect us.
Material weaknesses in or a failure to maintain an effective system of internal control over financial reporting or disclosure controls could prevent us from accurately and timely reporting our financial results, which could materially and adversely affect us.
Effective internal controls over financial reporting are necessary for us to provide reliable financial reports, effectively prevent fraud and operate successfully as a public company. If we cannot provide reliable financial reports or prevent fraud, our reputation and operating results would be harmed. We are required to perform system and process evaluation and testing of our internal control over financial reporting to allow management to report on, and our independent registered public accounting firm to attest to, the effectiveness of our internal control over financial reporting, as required by Section 404 of the Sarbanes-Oxley Act of 2002. Designing and implementing an effective system of internal control over financial reporting and disclosure controls and procedures is a continuous effort that requires significant resources, including the expenditure of a significant amount of time by senior members of our management team.
In connection with our ongoing monitoring of our internal control over financial reporting or audits of our financial statements, we or our auditors may identify deficiencies in our internal control over financial reporting that may be significant or rise to the level of material weaknesses. Any failure to maintain effective internal control over financial reporting or disclosure controls and procedures or to timely effect any necessary improvements to such controls, including as a result of remote work arrangements due to the COVID-19 pandemic, could harm our operating results or cause us to fail to meet our reporting obligations (which could affect the listing of our common stock on the NYSE). Additionally, ineffective internal control over financial reporting or disclosure controls and procedures could also adversely affect our ability to prevent or detect fraud, harm our reputation and cause investors to lose confidence in our reported financial information, which would likely have a negative effect on the trading price of our common stock.
Changes in accounting standards may materially and adversely affect us.
From time to time FASB and the SEC, who create and interpret accounting standards, may change the financial accounting and reporting standards or their interpretation and application of these standards that will govern the preparation of our financial statements. These changes could materially and adversely affect our reported financial condition and results of operations, and, under certain circumstances, may cause us to fail to comply with financial covenants contained in agreements relating to our indebtedness. In some cases, we could be required to apply a new or revised standard retroactively, resulting in restating prior period financial statements. Similarly, these changes could materially and adversely affect our tenants’ reported financial condition or results of operations and affect their preferences regarding leasing real estate.
Item 1B. Unresolved Staff Comments.
None.
33
Item 2. Properties.
Our Real Estate Investment Portfolio
As of December 31, 2020, we had a portfolio of 1,181 properties, inclusive of two undeveloped land parcels and 115 properties that secure our investments in mortgage loans receivable, that was diversified by tenant, industry and geography and had annualized base rent of $184.0 million. Our 238 tenants operate 336 different concepts in 16 industries across 43 states. None of our tenants represented more than 3.2% of our annualized base rent at December 31, 2020 and our top ten largest tenants represented 21.2% of our annualized base rent as of that date.
Diversification by Tenant
As of December 31, 2020, our top ten tenants included ten different concepts: Captain D's, Cadence Academy, EquipmentShare, Mister Car Wash, Circle K, AMC, Mavis Discount Tire, The Malvern School, Zaxby's, and Driver's Edge. Our 1,181 properties are operated by our 238 tenants. The following table details information about our tenants and the related concepts they operate as of December 31, 2020 (dollars in thousands):
|
Tenant
(1)
|
Concept |
Number of
Properties
(2)
|
Annualized
Base Rent |
% of
Annualized Base Rent |
||||||||||||||||||||||
| Captain D's, LLC | Captain D's | 74 | $ | 5,094 | 2.8 | % | ||||||||||||||||||||
| Cadence Education, LLC | Cadence Academy | 23 | 4,749 | 2.6 | % | |||||||||||||||||||||
| EQUIPMENTSHARE.COM INC | EquipmentShare | 16 | 4,730 | 2.6 | % | |||||||||||||||||||||
| CAR WASH PARTNERS, INC. | Mister Car Wash | 13 | 4,310 | 2.3 | % | |||||||||||||||||||||
|
Mac's Convenience Stores, LLC
(3)
|
Circle K | 34 | 3,797 | 2.1 | % | |||||||||||||||||||||
|
American Multi-Cinema, Inc
(4)
|
AMC | 5 | 3,535 | 1.9 | % | |||||||||||||||||||||
| Mavis Tire Express Services Corp. | Mavis Discount Tire | 19 | 3,395 | 1.8 | % | |||||||||||||||||||||
| Malvern School Properties, LP | The Malvern School | 13 | 3,208 | 1.7 | % | |||||||||||||||||||||
| 1788 Chicken, LLC | Zaxby's | 20 | 3,141 | 1.7 | % | |||||||||||||||||||||
| GB Auto Service, Inc. | Driver's Edge | 14 | 3,111 | 1.7 | % | |||||||||||||||||||||
| Top 10 Subtotal | 231 | 39,070 | 21.2 | % | ||||||||||||||||||||||
| Other | 945 | 144,907 | 78.8 | % | ||||||||||||||||||||||
| Total | 1,176 | 183,977 | 100.0 | % | ||||||||||||||||||||||
__________________________________________
(1)
Represents tenant or guarantor.
(2)
Excludes two undeveloped land parcels and three vacant properties.
(3)
Includes properties leased to a subsidiary of Alimentation Couche Tard Inc.
(4)
Includes four properties leased to a subsidiary of AMC Entertainment Holdings, Inc.
As of December 31, 2020, our five largest tenants, who contributed 12.3% of our annualized base rent, had a rent coverage ratio of 4.2x, and our ten largest tenants, who contributed 21.2% of our annualized base rent, had a rent coverage ratio of 3.3x.
As of December 31, 2020, 94.1% of our leases (based on annualized base rent) were triple-net, and the tenant is typically responsible for all improvements and is contractually obligated to pay all operating expenses, such as maintenance, insurance, utility and tax expense, related to the leased property. Due to the triple-net structure of our leases, we do not expect to incur significant capital expenditures relating to our triple-net leased properties, and the potential impact of inflation on our operating expenses is reduced.
34
Diversification by Concept
Our tenants operate their businesses through 336 concepts (i.e., generally brands). The following table provides information about the top ten concepts in our portfolio as of December 31, 2020 (dollars in thousands):
| Concept |
Type of
Business |
Annualized
Base Rent |
% of
Annualized Base Rent |
Number of
Properties (1) |
Building
(Sq. Ft.) |
|||||||||||||||||||||||||||
| Captain D's | Service | $ | 5,939 | 3.2 | % | 83 | 215,022 | |||||||||||||||||||||||||
| EquipmentShare | Service | 4,730 | 2.6 | % | 16 | 330,911 | ||||||||||||||||||||||||||
| Mister Car Wash | Service | 4,310 | 2.3 | % | 13 | 54,621 | ||||||||||||||||||||||||||
| Circle K | Service | 4,184 | 2.3 | % | 36 | 139,799 | ||||||||||||||||||||||||||
| AMC | Experience | 3,535 | 1.9 | % | 5 | 240,672 | ||||||||||||||||||||||||||
| Mavis Discount Tire | Service | 3,395 | 1.8 | % | 19 | 165,713 | ||||||||||||||||||||||||||
| Zaxby's | Service | 3,353 | 1.8 | % | 21 | 72,986 | ||||||||||||||||||||||||||
| The Malvern School | Service | 3,208 | 1.7 | % | 13 | 149,781 | ||||||||||||||||||||||||||
| Vasa Fitness | Experience | 2,948 | 1.6 | % | 5 | 258,085 | ||||||||||||||||||||||||||
| R-Store | Service | 2,854 | 1.6 | % | 25 | 105,703 | ||||||||||||||||||||||||||
| Top 10 Subtotal | 38,456 | 20.9 | % | 236 | 1,733,293 | |||||||||||||||||||||||||||
| Other | 145,521 | 79.1 | % | 940 | 8,416,250 | |||||||||||||||||||||||||||
| Total | $ | 183,977 | 100.0 | % | 1,176 | 10,149,543 | ||||||||||||||||||||||||||
______________________________________
(1)
Excludes two undeveloped land parcels.
35
Diversification by Industry
Our tenants' business concepts are diversified across various industries. The following table summarizes those industries as of December 31, 2020 (dollars in thousands except per sq. ft amounts):
| Tenant Industry |
Type of
Business |
Annualized
Base Rent |
% of
Annualized Base Rent |
Number of
Properties (1) |
Building
(Sq. Ft.) |
Rent Per
Sq. Ft. (2) |
||||||||||||||||||||||||||||||||
| Car Washes | Service | $ | 28,494 | 15.5 | % | 118 | 549,914 | $ | 50.60 | |||||||||||||||||||||||||||||
| Quick Service | Service | 25,536 | 13.9 | % | 330 | 878,649 | 29.02 | |||||||||||||||||||||||||||||||
| Early Childhood Education | Service | 22,571 | 12.3 | % | 99 | 1,042,979 | 21.25 | |||||||||||||||||||||||||||||||
| Medical / Dental | Service | 19,593 | 10.6 | % | 118 | 752,604 | 25.29 | |||||||||||||||||||||||||||||||
| Convenience Stores | Service | 16,615 | 9.0 | % | 142 | 576,687 | 28.81 | |||||||||||||||||||||||||||||||
| Automotive Service | Service | 13,782 | 7.5 | % | 100 | 678,715 | 20.31 | |||||||||||||||||||||||||||||||
| Casual Dining | Service | 8,301 | 4.5 | % | 55 | 337,769 | 24.95 | |||||||||||||||||||||||||||||||
| Equipment Rental and Sales | Service | 6,136 | 3.3 | % | 26 | 500,710 | 12.25 | |||||||||||||||||||||||||||||||
| Family Dining | Service | 5,960 | 3.2 | % | 40 | 232,723 | 27.34 | |||||||||||||||||||||||||||||||
| Pet Care Services | Service | 4,781 | 2.6 | % | 35 | 281,475 | 16.98 | |||||||||||||||||||||||||||||||
| Other Services | Service | 3,114 | 1.7 | % | 19 | 198,144 | 15.71 | |||||||||||||||||||||||||||||||
| Service Subtotal | 154,883 | 84.2 | % | 1,082 | 6,030,369 | 25.49 | ||||||||||||||||||||||||||||||||
| Health and Fitness | Experience | 9,593 | 5.2 | % | 25 | 1,004,189 | 9.55 | |||||||||||||||||||||||||||||||
| Entertainment | Experience | 6,280 | 3.4 | % | 18 | 647,483 | 10.30 | |||||||||||||||||||||||||||||||
| Movie Theatres | Experience | 4,166 | 2.3 | % | 6 | 293,206 | 14.21 | |||||||||||||||||||||||||||||||
| Experience Subtotal | 20,039 | 10.9 | % | 49 | 1,944,878 | 10.51 | ||||||||||||||||||||||||||||||||
| Grocery | Retail | 2,833 | 1.5 | % | 16 | 609,908 | 4.64 | |||||||||||||||||||||||||||||||
| Home Furnishings | Retail | 2,476 | 1.3 | % | 6 | 307,371 | 15.79 | |||||||||||||||||||||||||||||||
| Retail Subtotal | 5,309 | 2.9 | % | 22 | 917,279 | 6.92 | ||||||||||||||||||||||||||||||||
| Building Materials | Other | 3,746 | 2.0 | % | 23 | 1,257,017 | 2.98 | |||||||||||||||||||||||||||||||
| Total | $ | 183,977 | 100.0 | % | 1,176 | 10,149,543 | $ | 18.33 | ||||||||||||||||||||||||||||||
____________________________________________________
(1)
Excludes two undeveloped land parcels.
(2)
Excludes properties with no annualized base rent and properties under construction.
As of December 31, 2020, our tenants operating service-oriented businesses had a weighted average rent coverage ratio of 2.94x, our tenants operating experience-based businesses had a weighted average rent coverage ratio of 1.45x, our tenants operating retail businesses had a weighted average rent coverage ratio of 2.53x and our tenants operating other types of businesses had a weighted average rent coverage ratio of 8.63x.
36
Diversification by Geography
Our 1,181 property locations are spread across 43 states. The following table details the geographical locations of our properties as of December 31, 2020 (dollars in thousands):
| State | Annualized Base Rent | % of Annualized Base Rent | Number of Properties | Building (Sq. Ft.) | ||||||||||||||||||||||
| Texas | $ | 27,354 | 14.9 | % | 161 | 1,252,505 | ||||||||||||||||||||
| Georgia | 17,706 | 9.6 | % | 116 | 662,580 | |||||||||||||||||||||
| Florida | 11,183 | 6.1 | % | 56 | 561,235 | |||||||||||||||||||||
| Arkansas | 8,822 | 4.8 | % | 67 | 359,008 | |||||||||||||||||||||
| Ohio | 7,606 | 4.1 | % | 59 | 577,622 | |||||||||||||||||||||
| Alabama | 7,427 | 4.0 | % | 51 | 461,183 | |||||||||||||||||||||
| Michigan | 7,079 | 3.8 | % | 48 | 806,114 | |||||||||||||||||||||
| Arizona | 6,660 | 3.6 | % | 33 | 274,159 | |||||||||||||||||||||
| Tennessee | 6,242 | 3.4 | % | 49 | 242,029 | |||||||||||||||||||||
| Wisconsin | 6,341 | 3.4 | % | 38 | 258,723 | |||||||||||||||||||||
| Minnesota | 5,542 | 3.0 | % | 33 | 447,526 | |||||||||||||||||||||
| North Carolina | 4,971 | 2.7 | % | 24 | 308,950 | |||||||||||||||||||||
| Pennsylvania | 4,811 | 2.6 | % | 30 | 249,775 | |||||||||||||||||||||
| New York | 4,302 | 2.3 | % | 37 | 185,923 | |||||||||||||||||||||
| Oklahoma | 4,223 | 2.3 | % | 22 | 308,650 | |||||||||||||||||||||
| Colorado | 4,147 | 2.3 | % | 19 | 208,822 | |||||||||||||||||||||
| Missouri | 3,999 | 2.2 | % | 30 | 508,585 | |||||||||||||||||||||
| Illinois | 3,890 | 2.1 | % | 23 | 177,055 | |||||||||||||||||||||
| South Carolina | 3,763 | 2.0 | % | 27 | 253,137 | |||||||||||||||||||||
| Mississippi | 3,309 | 1.8 | % | 30 | 121,250 | |||||||||||||||||||||
| Massachusetts | 3,320 | 1.8 | % | 19 | 334,931 | |||||||||||||||||||||
| New Mexico | 3,027 | 1.6 | % | 19 | 113,697 | |||||||||||||||||||||
| New Jersey | 2,993 | 1.6 | % | 17 | 118,613 | |||||||||||||||||||||
| Indiana | 2,917 | 1.6 | % | 25 | 195,594 | |||||||||||||||||||||
| Kentucky | 2,885 | 1.6 | % | 25 | 148,000 | |||||||||||||||||||||
| Iowa | 2,812 | 1.5 | % | 19 | 113,101 | |||||||||||||||||||||
| Maryland | 1,923 | 1.0 | % | 8 | 68,324 | |||||||||||||||||||||
| Louisiana | 1,903 | 1.0 | % | 11 | 80,537 | |||||||||||||||||||||
| South Dakota | 1,702 | 0.9 | % | 7 | 41,472 | |||||||||||||||||||||
| Kansas | 1,677 | 0.9 | % | 7 | 102,545 | |||||||||||||||||||||
| Washington | 1,530 | 0.8 | % | 10 | 77,293 | |||||||||||||||||||||
| Connecticut | 1,315 | 0.7 | % | 7 | 75,988 | |||||||||||||||||||||
| Virginia | 1,187 | 0.6 | % | 7 | 54,130 | |||||||||||||||||||||
| Oregon | 1,093 | 0.6 | % | 6 | 124,931 | |||||||||||||||||||||
| Utah | 922 | 0.5 | % | 2 | 67,659 | |||||||||||||||||||||
| West Virginia | 915 | 0.5 | % | 18 | 44,915 | |||||||||||||||||||||
| Nebraska | 596 | 0.3 | % | 7 | 17,776 | |||||||||||||||||||||
| Wyoming | 428 | 0.2 | % | 2 | 14,001 | |||||||||||||||||||||
| California | 391 | 0.2 | % | 3 | 30,870 | |||||||||||||||||||||
| Idaho | 383 | 0.2 | % | 1 | 35,433 | |||||||||||||||||||||
| New Hampshire | 307 | 0.2 | % | 5 | 37,786 | |||||||||||||||||||||
| Nevada | 226 | 0.1 | % | 1 | 34,777 | |||||||||||||||||||||
| Alaska | 150 | 0.1 | % | 2 | 6,630 | |||||||||||||||||||||
| Total | $ | 183,977 | 100.0 | % | 1,181 | 10,163,834 | ||||||||||||||||||||
37
Lease Expirations
As of December 31, 2020, the weighted average remaining term of our leases was 14.5 years (based on annualized base rent), with only 4.8% of our annualized base rent attributable to leases expiring prior to January 1, 2026. The following table sets forth our lease expirations for leases in place as of December 31, 2020 (dollars in thousands):
| Lease Expiration Year (1) |
Annualized
Base Rent |
% of
Annualized Base Rent |
Number of
Properties (2) |
Weighted
Average Rent Coverage Ratio (3) |
||||||||||||||||||||||
| 2021 | $ | 133 | 0.1 | % | 2 | 2.3x | ||||||||||||||||||||
| 2022 | 490 | 0.3 | % | 5 | 3.0x | |||||||||||||||||||||
| 2023 | 798 | 0.4 | % | 9 | 3.4x | |||||||||||||||||||||
| 2024 | 4,759 | 2.6 | % | 46 | 4.3x | |||||||||||||||||||||
| 2025 | 2,710 | 1.5 | % | 19 | 3.0x | |||||||||||||||||||||
| 2026 | 2,425 | 1.3 | % | 15 | 2.2x | |||||||||||||||||||||
| 2027 | 4,466 | 2.4 | % | 28 | 3.0x | |||||||||||||||||||||
| 2028 | 3,967 | 2.2 | % | 14 | 1.8x | |||||||||||||||||||||
| 2029 | 5,083 | 2.8 | % | 71 | 3.9x | |||||||||||||||||||||
| 2030 | 4,154 | 2.3 | % | 50 | 3.8x | |||||||||||||||||||||
| 2031 | 9,165 | 5.0 | % | 59 | 2.5x | |||||||||||||||||||||
| 2032 | 10,966 | 6.0 | % | 55 | 3.6x | |||||||||||||||||||||
| 2033 | 7,149 | 3.9 | % | 27 | 1.8x | |||||||||||||||||||||
| 2034 | 29,722 | 16.2 | % | 212 | 3.4x | |||||||||||||||||||||
| 2035 | 19,455 | 10.6 | % | 129 | 3.1x | |||||||||||||||||||||
| 2036 | 2,341 | 1.3 | % | 19 | 1.7x | |||||||||||||||||||||
| 2037 | 5,943 | 3.2 | % | 35 | 5.0x | |||||||||||||||||||||
| 2038 | 13,056 | 7.1 | % | 83 | 2.4x | |||||||||||||||||||||
| 2039 | 26,154 | 14.2 | % | 151 | 2.6x | |||||||||||||||||||||
| 2040 | 29,215 | 15.9 | % | 141 | 2.2x | |||||||||||||||||||||
| Thereafter | 1,826 | 1.0 | % | 6 | 1.4x | |||||||||||||||||||||
| Total/Weighted Average | $ | 183,977 | 100.0 | % | 1,176 | 2.9x | ||||||||||||||||||||
_______________________________________________________________
(1)
Expiration year of contracts in place as of December 31, 2020, excluding any tenant option renewal periods that have not been exercised.
(2)
Excludes two undeveloped land parcels.
(3)
Weighted by annualized base rent.
Item 3. Legal Proceedings.
We are subject to various lawsuits, claims and other legal proceedings. Management does not believe that the resolution of any of these matters either individually or in the aggregate will have a material adverse effect on our business, financial condition, results of operations or liquidity. Further, from time to time, we are party to various lawsuits, claims and other legal proceedings for which third parties, such as our tenants, are contractually obligated to indemnify, defend and hold us harmless. In some of these matters, the indemnitors have insurance for the potential damages. In other matters, we are being defended by tenants who may not have sufficient insurance, assets, income or resources to satisfy their defense and indemnification obligations to us. The unfavorable resolution of such legal proceedings could, individually or in the aggregate, materially adversely affect the indemnitors' ability to satisfy their respective obligations to us, which, in turn, could have a material adverse effect on our business, financial condition, results of operations or liquidity. It is management's opinion that there are currently no such legal proceedings pending that will, individually or in the aggregate, have such a material adverse effect. Despite management's view of the ultimate resolution of these legal proceedings, we may have significant legal expenses and costs associated with the defense of such matters. Further, management cannot predict the outcome of these legal proceedings and if management's expectation regarding such matters is not correct, such proceedings could have a material adverse effect on our business, financial condition, results of operations or liquidity.
38
Item 4. Mine Safety Disclosures.
Not applicable.
39
PART II
Item 5. Market for Registrant's Common Equity, Related Stockholder Matters and Issuer Purchases of Equity Securities.
Our common stock is listed on the NYSE under the symbol "EPRT". As of
February 19, 2021, there were 157 holders of record of the
106,934,874
outstanding shares of our common stock. Because many of our shares of common stock are held by brokers and other institutions on behalf of stockholders, we are unable to estimate the total number of stockholders represented by these record holders.
Distributions
We have made and intend to continue to make quarterly cash distributions to our common stockholders. In particular, in order to maintain our qualification for taxation as a REIT, we intend to make annual distributions to our stockholders of at least 90% of our REIT taxable income, determined without regard to the deduction for dividends paid and excluding any net capital gain. However, any future distributions will be at the sole discretion of our board of directors, and their form, timing and amount, if any, will depend upon a number of factors, including our actual and projected results of operations, FFO, Core FFO, AFFO, liquidity, cash flows and financial condition, the revenue we actually receive from our properties, our operating expenses, our debt service requirements, our capital expenditures, prohibitions and other limitations under our financing arrangements, our REIT taxable income, the annual REIT distribution requirements, applicable law and such other factors as our board of directors deems relevant. To the extent that our cash available for distribution is less than 90% of our REIT taxable income, we may consider various means to cover any such shortfall, including borrowing under the Revolving Credit Facility or other loans, selling certain of our assets, or using a portion of the net proceeds we receive from offerings of equity, equity-related or debt securities or declaring taxable share dividends. Agreements relating to our indebtedness, including our Master Trust Funding Program and our revolving and term loan credit facilities, limit and, under certain circumstances, could eliminate our ability to make distributions. See "Item 7 - Management's Discussion and Analysis of Financial Condition and Results of Operations-Description of Certain Debt."
We have determined that, for federal income tax purposes, approximately
59.0
% of the distributions paid for the 2020 tax year represented taxable income and
41.0
% represented a return of capital.
Issuer Purchases of Equity Securities
During the year ended December 31, 2020, the Company did not repurchase any of its equity securities.
Stock Performance Graph
The following performance graph and related table compare, for the period from June 21, 2018 (the first day our common stock was traded on the NYSE) through December 31, 2020, the cumulative total stockholder return on our common stock with that of the Standard & Poor's 500 Composite Stock Index ("S&P 500") and the FTSE NAREIT All Equity REITs index ("FNER"). The graph and related table assume $100.00 was invested on June 21, 2018 and assumes the reinvestment of all dividends. The historical stock price performance reflected in the graph and related table is not necessarily indicative of future stock price performance.
40
Essential Properties Realty Trust, Inc.
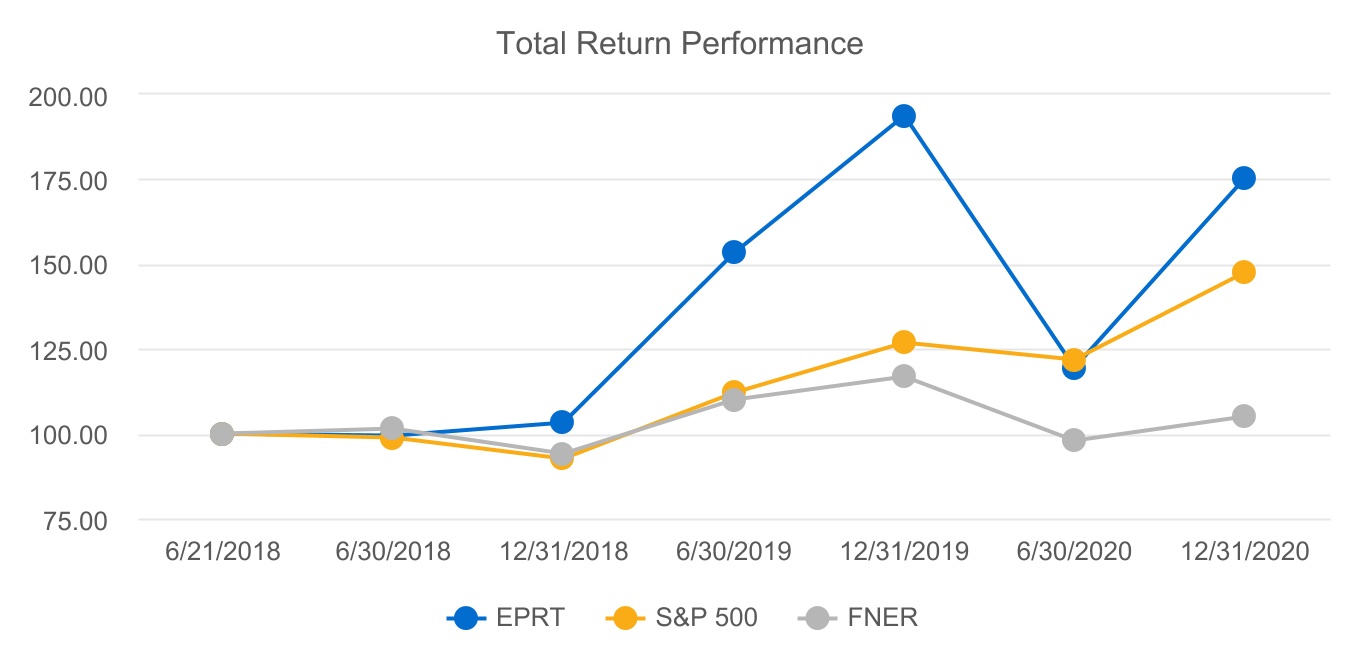
| Ticker / Index | 6/21/2018 | 6/30/2018 | 12/31/2018 | 6/30/2019 | 12/31/2019 | 6/30/2020 | 12/31/2020 | |||||||||||||||||||||||||||||||||||||
| EPRT | 100.00 | 99.27 | 103.16 | 153.26 | 193.63 | 119.31 | 175.07 | |||||||||||||||||||||||||||||||||||||
| S&P 500 | 100.00 | 98.86 | 92.65 | 112.12 | 126.83 | 121.72 | 147.49 | |||||||||||||||||||||||||||||||||||||
| FNER | 100.00 | 101.35 | 94.04 | 110.07 | 116.57 | 97.92 | 105.02 | |||||||||||||||||||||||||||||||||||||
The performance graph and the related table are being furnished solely to accompany this Annual Report on Form 10-K pursuant to Item 201(e) of Regulation S-K, and are not being filed for purposes of Section 18 of the Exchange Act and are not to be incorporated by reference into any filing of ours, whether made before or after the date hereof, regardless of any general incorporation language in such filing.
Equity Compensation Plan Information
The information concerning our Equity Compensation Plan will be included in the Proxy Statement to be filed relating to our 2021 Annual Meeting of Stockholders and is incorporated herein by reference.
Unregistered Sales of Equity Securities and Use of Proceeds
Not applicable.
Item 6. Selected Financial Data.
The following tables set forth selected consolidated financial and other information of the Company as of and for the years ended December 31, 2020, 2019, 2018 and 2017 and for the period from March 30, 2016 (Commencement of Operations) to December 31, 2016. The tables should be read in conjunction with our consolidated financial statements and the notes thereto and "Item 7. Management's Discussion and Analysis of Financial Condition and Results of Operations" included in this Annual Report on Form 10-K.
41
| Operating Data: |
Period from
March 30, 2016 (Commencement of Operations) to December 31, 2016 |
|||||||||||||||||||||||||||||||
| Year ended December 31, | ||||||||||||||||||||||||||||||||
| (In thousands, except per share data) | 2020 | 2019 | 2018 | 2017 | ||||||||||||||||||||||||||||
| Revenues: | ||||||||||||||||||||||||||||||||
| Rental revenue | $ | 155,792 | $ | 135,670 | $ | 94,944 | $ | 53,373 | $ | 15,271 | ||||||||||||||||||||||
| Interest on loans and direct financing lease receivables | 8,136 | 3,024 | 656 | 293 | 161 | |||||||||||||||||||||||||||
| Other revenue | 81 | 663 | 623 | 783 | 88 | |||||||||||||||||||||||||||
| Total revenues | 164,009 | 139,357 | 96,223 | 54,449 | 15,520 | |||||||||||||||||||||||||||
| Expenses: | ||||||||||||||||||||||||||||||||
| General and administrative | 24,444 | 21,745 | 13,762 | 8,775 | 4,321 | |||||||||||||||||||||||||||
| Property expenses | 3,881 | 3,070 | 1,980 | 1,547 | 533 | |||||||||||||||||||||||||||
| Depreciation and amortization | 59,446 | 42,745 | 31,352 | 19,516 | 5,428 | |||||||||||||||||||||||||||
| Provision for impairment of real estate | 8,399 | 2,918 | 4,503 | 2,377 | 1,298 | |||||||||||||||||||||||||||
| Provision for loan losses | 830 | — | — | — | — | |||||||||||||||||||||||||||
| Total expenses | 97,000 | 70,478 | 51,597 | 32,215 | 11,580 | |||||||||||||||||||||||||||
| Other operating income: | ||||||||||||||||||||||||||||||||
| Gain on dispositions of real estate, net | 5,821 | 10,932 | 5,445 | 6,748 | 871 | |||||||||||||||||||||||||||
| Income from operations | 72,830 | 79,811 | 50,071 | 28,982 | 4,811 | |||||||||||||||||||||||||||
| Other (loss)/income: | ||||||||||||||||||||||||||||||||
| Loss on repayment and repurchase of secured borrowings | (924) | (5,240) | — | — | — | |||||||||||||||||||||||||||
| Interest expense | (29,651) | (27,037) | (30,192) | (22,574) | (987) | |||||||||||||||||||||||||||
| Interest income | 485 | 794 | 930 | 49 | 3 | |||||||||||||||||||||||||||
| Income before income tax expense | 42,740 | 48,328 | 20,809 | 6,457 | 3,827 | |||||||||||||||||||||||||||
| Income tax expense | 212 | 303 | 195 | 161 | 77 | |||||||||||||||||||||||||||
| Net income | 42,528 | 48,025 | 20,614 | 6,296 | 3,750 | |||||||||||||||||||||||||||
| Net income attributable to non-controlling interests | (255) | (6,181) | (5,001) | — | — | |||||||||||||||||||||||||||
| Net income attributable to stockholders and members | $ | 42,273 | $ | 41,844 | $ | 15,613 | $ | 6,296 | $ | 3,750 | ||||||||||||||||||||||
| Year ended December 31, |
Period from
June 25, 2018 to December 31, 2018 |
|||||||||||||||||||||||||||||||
| 2020 | 2019 | |||||||||||||||||||||||||||||||
| Basic net income per share | $ | 0.44 | $ | 0.65 | $ | 0.26 | ||||||||||||||||||||||||||
| Diluted net income per share | 0.44 | 0.63 | 0.26 | |||||||||||||||||||||||||||||
| Cash dividends declared per share | 0.93 | 0.88 | 0.43 | |||||||||||||||||||||||||||||
42
| Consolidated Balance Sheet Data: | ||||||||||||||||||||||||||||||||
| December 31, | ||||||||||||||||||||||||||||||||
| (In thousands) | 2020 | 2019 | 2018 | 2017 | 2016 | |||||||||||||||||||||||||||
| Total real estate investments, at cost | $ | 2,359,395 | $ | 1,908,919 | $ | 1,377,044 | $ | 932,174 | $ | 455,008 | ||||||||||||||||||||||
| Total real estate investments, net | 2,223,298 | 1,818,848 | 1,325,189 | 907,349 | 448,887 | |||||||||||||||||||||||||||
| Net investments | 2,392,576 | 1,912,243 | 1,342,694 | 914,247 | 452,546 | |||||||||||||||||||||||||||
| Cash and cash equivalents | 26,602 | 8,304 | 4,236 | 7,250 | 1,825 | |||||||||||||||||||||||||||
| Restricted cash | 6,388 | 13,015 | 12,003 | 12,180 | 10,097 | |||||||||||||||||||||||||||
| Total assets | 2,488,802 | 1,975,447 | 1,380,900 | 942,220 | 466,288 | |||||||||||||||||||||||||||
| Secured borrowings, net of deferred financing costs | 171,007 | 235,336 | 506,116 | 511,646 | 272,823 | |||||||||||||||||||||||||||
| Unsecured term loans, net of deferred financing costs | 626,272 | 445,586 | — | — | — | |||||||||||||||||||||||||||
| Notes payable to related party | — | — | — | 230,000 | — | |||||||||||||||||||||||||||
| Revolving credit facility | 18,000 | 46,000 | 34,000 | — | — | |||||||||||||||||||||||||||
| Intangible lease liabilities, net | 10,168 | 9,564 | 11,616 | 12,321 | 16,385 | |||||||||||||||||||||||||||
| Total liabilities | 906,854 | 773,334 | 569,859 | 760,818 | 291,638 | |||||||||||||||||||||||||||
| Total stockholders'/members' equity | 1,574,758 | 1,194,450 | 562,179 | 181,402 | 174,650 | |||||||||||||||||||||||||||
| Non-controlling interests | 7,190 | 7,663 | 248,862 | — | — | |||||||||||||||||||||||||||
| Other Data: | Period from March 30, 2016 (Commencement of Operations) to December 31, 2016 | |||||||||||||||||||||||||||||||
| Year ended December 31, | ||||||||||||||||||||||||||||||||
| (In thousands) | 2020 | 2019 | 2018 | 2017 | ||||||||||||||||||||||||||||
|
FFO
(1)
|
$ | 104,415 | $ | 82,660 | $ | 51,007 | $ | 21,438 | $ | 9,605 | ||||||||||||||||||||||
|
Core FFO
(1)
|
106,688 | 90,648 | 51,007 | 21,438 | 9,605 | |||||||||||||||||||||||||||
|
AFFO
(1)
|
106,995 | 86,251 | 48,442 | 20,337 | 8,579 | |||||||||||||||||||||||||||
|
EBITDA
(1)
|
131,352 | 117,316 | 81,423 | 48,498 | 10,239 | |||||||||||||||||||||||||||
|
EBITDA
re
(1)
|
133,931 | 109,302 | 80,481 | 44,127 | 10,666 | |||||||||||||||||||||||||||
| December 31, | ||||||||||||||||||||||||||||||||
| (Dollar amounts in thousands) | 2020 | 2019 | 2018 | 2017 | 2016 | |||||||||||||||||||||||||||
|
Net debt
(2)
|
$ | 821,193 | $ | 713,784 | $ | 532,881 | $ | 733,511 | $ | 278,609 | ||||||||||||||||||||||
| Number of investment property locations | 1,181 | 1,000 | 677 | 508 | 344 | |||||||||||||||||||||||||||
| Occupancy | 99.7 | % | 100.0 | % | 100.0 | % | 98.8 | % | 96.8 | % | ||||||||||||||||||||||
__________________________________________________________
(1)
FFO, Core FFO, AFFO, EBITDA and EBITDAre are non-GAAP financial measures. For definitions of these measures and reconciliations of these measures to net income, the most directly comparable GAAP financial measure, and a statement of why our management believes the presentation of these measures provides useful information to investors and any additional purposes for which management uses these measures, see "Item 7. Management's Discussion and Analysis of Financial Condition and Results of Operations—Non-GAAP Financial Measures."
(2)
Net debt is a non-GAAP financial measure. For a definition of this measure and a reconciliation of this measure to total debt, the most directly comparable GAAP financial measure, and a statement of why our management believes the presentation of this measure provides useful information to investors and any additional purposes for which management uses this measure, see "Item 7. Management's Discussion and Analysis of Financial Condition and Results of Operations—Non-GAAP Financial Measures."
43
Item 7. Management's Discussion and Analysis of Financial Condition and Results of Operations.
The following discussion and analysis of our financial condition and results of operations should be read together with our consolidated financial statements and the related notes included elsewhere in this report, as well as the "Selected Financial Data" and "Business" sections of this report. Some of the information contained in this discussion and analysis or set forth elsewhere in this report, including information with respect to our plans and strategies for our business, includes forward‑looking statements that involve risks and uncertainties. You should read "Item 1A. Risk Factors" and the "Special Note Regarding Forward‑Looking Statements" sections of this report for a discussion of important factors that could cause actual results to differ materially from the results described in or implied by these forward‑looking statements.
Overview
We are an internally managed real estate company that acquires, owns and manages primarily single-tenant properties that are net leased on a long-term basis to middle-market companies operating service-oriented or experience-based businesses. We generally acquire and lease freestanding, single-tenant commercial real estate facilities where a tenant services its customers and conducts activities that are essential to the generation of the tenant's sales and profits. As of December 31, 2020, 95.1% of our $184.0 million of annualized base rent was attributable to properties operated by tenants in service-oriented and experience-based businesses. "Annualized base rent" means annualized contractually specified cash base rent in effect on December 31, 2020 for all of our leases (including those accounted for as loans or direct financing leases) commenced as of that date and annualized cash interest on our mortgage loans receivable as of that date.
We have assembled a diversified portfolio using a disciplined strategy that focuses on properties leased to tenants in businesses such as:
•
Car washes,
•
Restaurants (primarily quick service restaurants),
•
Early childhood education
•
Medical and dental services,
•
Convenience stores,
•
Automotive services,
•
Equipment rental,
•
Entertainment and
•
Health and fitness
We believe that, in general, properties leased to tenants in these businesses and similar businesses are essential to the generation of the tenants' sales and profits. We also believe that these business have favorable growth potential and, because of their nature they are more insulated from e-commerce pressure than many other businesses.
We were organized on January 12, 2018 as a Maryland corporation. We have elected to be taxed as a real estate investment trust ("REIT") for federal income tax purposes beginning with the year ended December 31, 2018, and we believe that our current organization, operations and intended distributions will allow us to continue to so qualify.
We completed our IPO in June 2018. Our common stock is listed on the New York Stock Exchange under the symbol "EPRT".
Our primary business objective is to maximize stockholder value by generating attractive risk-adjusted returns through owning, managing and growing a diversified portfolio of commercially desirable properties. We have grown
44
significantly since commencing our operations and investment activities in June 2016. As of December 31, 2020, we had a portfolio of 1,181 properties (inclusive of two undeveloped land parcels and 115 properties which secure our investments in mortgage loans receivable) that was diversified by tenant, industry, concept and geography, had annualized base rent of $184.0 million and was 99.7% occupied. Our portfolio was built based on the following core investment attributes:
•
Diversified Portfolio
•
Long Lease Term
•
Significant use of Master Leases
•
Healthy Rent Coverage Ratio and Tenant Financial Reporting
•
Contractual Base Rent Escalations
•
Significant use of Sale-Leaseback Investments
•
Smaller, Low Basis Single-Tenant Properties
We generally lease each of our properties to a single tenant on a triple-net, long-term basis, and we generate our cash from operations primarily through the monthly lease payments, or base rent we receive from the tenants that occupy our properties.
Substantially all our leases provide for periodic contractual rent escalations. As of December 31, 2020, leases contributing 99.2% of our annualized base rent provided for increases in future annual base rent, generally ranging from 1% to 4%, with a weighted average annual escalation equal to 1.5% of base rent. As of December 31, 2020, leases contributing 94.1% of annualized base rent were triple-net, which means that our tenant is responsible for all operating expenses, such as maintenance, insurance, utility and tax, related to the leased property (including any increases in those costs that may occur as a result of inflation). Our remaining leases were "double net," where the tenant is responsible for certain expenses, such as taxes and insurance, but we retain responsibility for other expenses, generally related to maintenance and structural component replacement that may be required at such leased properties. Also, we incur property-level expenses associated with our vacant properties and we occasionally incur nominal property-level expenses that are not paid by our tenants, such as the costs of periodically making site inspections of our properties. We do not currently anticipate incurring significant capital expenditures or property costs. Since our properties are predominantly single-tenant properties, which are generally subject to long-term leases, it is not necessary for us to perform significant ongoing leasing activities with respect to our properties. As of December 31, 2020, the weighted average remaining term of our leases was 14.5 years (based on annualized base rent), excluding renewal options that have not been exercised, with 4.8% of our annualized base rent attributable to leases expiring prior to January 1, 2026. Renewal options are exercisable at the option of our tenants upon expiration of their base lease term. Our leases providing for tenant renewal options generally provide for periodic contractual rent escalations during any renewed term that are similar to those applicable during the initial term of the lease.
As of December 31, 2020, 61.1% of our annualized base rent was attributable to master leases, where we have leased multiple properties to a tenant under a master lease. Since properties are generally leased under a master lease on an "all or none" basis, the structure prevents a tenant from "cherry picking" locations, where it unilaterally gives up underperforming properties while maintaining its leasehold interest in well-performing properties.
COVID-19 Pandemic Update
COVID-19 has created significant uncertainty and economic disruption, which is likely to persist, or increase, for a period of unknown duration. The pandemic has adversely affected us and our tenants, and the full extent to which it will adversely affect our financial condition, liquidity, and results of operations is difficult to predict and depends on evolving factors, including the duration and scope of the pandemic, and governmental and social responses thereto. We continue to closely monitor the impact of COVID-19 on all aspects of our business, including our portfolio and the creditworthiness of our tenants. As the pandemic intensified at the end of the first quarter of 2020, we adopted a more cautious investment strategy, as we placed an increased emphasis on liquidity, prudent
45
balance sheet management and financial flexibility. In March 2020, we initiated steps to safeguard the health and safety of our employees, and transitioned all of our employees to a remote work environment. We successfully executed our business continuity plan, with all of our core financial, operational and telecommunication systems operating from a cloud-based environment with no disruption. More recently, our employees have been able to work in our headquarters, located in Princeton, New Jersey, on a schedule designed to promote appropriate social distancing and health and safety.
The impact of the pandemic is rapidly evolving. It continues to adversely impact commercial activity and cause uncertainty and volatility in financial markets. The pandemic has adversely affected our tenants’ ability to meet their financial obligations to us (including the payment of rent and deferred rent), exposed us to increased risk of tenant default or bankruptcy, and impaired the value of certain of our properties. The pandemic has caused a large number of our tenants, to suspend or reduce their operations, which has adversely affected their ability to pay rent to us. As of December 31, 2020, we granted tenant-requested rent deferrals relating to approximately $18.5 million of rent, representing 10% of our annualized base rent as of December 31, 2020. During the year ended December 31, 2020, we collected substantially all of the $2.6 million in deferred rent we were owed from tenants where repayment was anticipated.
The adverse impacts of the pandemic and the responses designed to mitigate its effects (such as local, state, regional or national lockdowns or other limitations on business activities) have varied, and likely will continue to vary, by geography. It is possible that our properties and tenants located in certain areas will be more adversely affected than our properties and tenants located in other areas. While our properties are diversified by geography, our business includes substantial holdings in the following states as of December 31, 2020 (based on annualized base rent): Texas (14.9%), Georgia (9.6%), Florida (6.1%), Arkansas (4.8%) and Ohio (4.1%). If the pandemic surges in these states or other areas from which we derive significant revenue, the adverse impact of the pandemic on us and our tenants would likely increase.
Similarly, as of December 31, 2020, leases representing approximately 20.0% of our annualized base rent were with tenants in industries that have been particularly adversely affected by the COVID-19 pandemic, including casual and family dining (7.8% of annualized base rent), health and fitness (5.2% of annualized base rent), entertainment (3.4% of annualized base rent), movie theaters (2.3% of annualized base rent) and home furnishings (1.3% of annualized base rent).See “Our Real Estate Investment Portfolio—Diversification by Industry” and “—Diversification by Geography,” below for additional information about our exposure to various states and industries.
The pandemic could cause our occupancy to decrease, which would lead to increased property-level expenses, as we would be obligated to pay costs (e.g., real estate taxes, maintenance costs and insurance) that would otherwise be paid by a tenant at a property subject to a triple-net lease. Additionally, while we recently have begun to accelerate our investment program, the pandemic has caused us to adopt a more cautious investment strategy, as we emphasize liquidity and financial flexibility, that has slowed our pace of external growth. Conditions in the bank lending and capital markets have been volatile and may deteriorate as a result of the pandemic, and our ability, and that of our tenants, to access capital may become constrained or eliminated, or the terms on which capital may be accessed may deteriorate significantly.
One of our main operating functions is our proactive asset management approach. Accordingly, we continue to actively engage in discussions with our tenants regarding the impact of COVID-19 on their business operations, liquidity, and financial position, and, where appropriate, negotiate rent deferrals or other concessions. As noted above, as of December 31, 2020, we granted tenant-requested rent deferrals relating to approximately $18.5 million of rent, which represents 10% of our annualized base rent as of December 31, 2020. These rent deferrals were negotiated on a tenant-by-tenant basis and, in general, allow a tenant to defer all or a portion of its rent for 2020, with all of the deferred rent to be paid to us pursuant to a schedule that generally extends up to 24 months from the original due date of the deferred rent.
It is possible that the existing deterioration, or further deterioration, in our tenants’ ability to operate their businesses caused by COVID-19 or otherwise, will cause our tenants to be unable or unwilling to meet their contractual obligations to us, including the payment of rent (including deferred rent) or to request further rent deferrals or other forms of rent relief, such as rent reductions. Given the significant uncertainty around the duration and severity of the impact of COVID-19, we are unable to predict the impact it will have on our tenants’ continued ability to pay rent (including deferred rent). Therefore, information provided regarding October rent collections should not serve as an indication of expected future rent collections.
46
The extent to which COVID-19 impacts our operations will depend on future developments, which are highly uncertain and cannot be predicted with confidence, including the duration of the outbreak, geographic and industry variations in COVID-19’s impact and actions taken to contain COVID-19. The impact of COVID-19 on our tenants and properties will likely have a continuing adverse impact on us, particularly if tenants are unable to meet their rental payment obligations to us (including the payment of deferred rent), our vacancy rate increases or if we choose to grant further rent deferrals or other concessions.
Liquidity and Capital Resources
As of December 31, 2020, we had $2.4 billion of net investments in our investment portfolio, consisting of investments in 1,181 properties (inclusive of two undeveloped land parcels and 115 properties which secure our investments in mortgage loans receivable), with annualized base rent of $184.0 million. Substantially all of our cash from operations is generated by our investment portfolio.
Our liquidity requirements for operating our Company consist primarily of the funds necessary to pay principal and interest payments on our outstanding indebtedness, and the general and administrative expenses of operating our business and managing our portfolio. The occupancy level of our portfolio is high, just below 100% and because of substantially all of our leases are triple-net, our tenants are generally responsible for the maintenance, insurance and property taxes associated with our properties. When a property becomes vacant because the existing tenant has vacated the property due to default or at the expiration of the lease term the existing tenant did not renew their lease and we had not re-leased the property, we incur the property costs not paid by the tenant, as well as those property costs accruing during the time it takes to locate a substitute tenant or to sell the property. As of December 31, 2020, only three properties were vacant, less than 1% of our portfolio, and all remaining properties were subject to a lease (excluding two undeveloped land parcels), which represents a 99.7% occupancy rate. We expect to incur some property costs from time to time in periods during which properties that become vacant are being marketed for lease or sale. In addition, we may recognize an expense for certain property costs, such as real estate taxes billed in arrears, if we believe the tenant is likely to vacate the property before making payment on those obligations. The amount of such property costs can vary quarter-to-quarter based on the timing of property vacancies and the level of underperforming properties; however, we do not expect that such costs will be significant to our operations.
We intend to continue to grow through additional investments in stand-alone single tenant properties. To accomplish this objective, we seek to acquire real estate with a combination of debt and equity capital and with cash from operations that we do not distribute to our stockholders. When we sell properties, we generally reinvest the cash proceeds from our sales in new property acquisitions. Our short-term liquidity requirements also include the funding needs associated with nine properties where we have agreed to provide construction financing or reimburse the tenant for certain development, construction and renovation costs in exchange for specified contractually payments of interest or increased rent that generally increases in proportion with our level of funding. As of December 31, 2020, we had agreed to provide construction financing or reimburse the tenant for certain development, construction and renovation costs in an aggregate amount of $61.9 million, and, as of such date, we had funded $45.6 million of this commitment. We expect to fund the balance of such commitment by December 31, 2021.
Additionally, as of February 19, 2021, we were under contract to acquire 21 properties with an aggregate purchase price of $51.9 million, subject to completion of our due diligence procedures and satisfaction of customary closing conditions. We expect to meet our short-term liquidity requirements, including our investment in potential future single tenant properties, primarily with our cash and cash equivalents, net cash from operating activities and borrowings under the Revolving Credit Facility, and potentially through proceeds generated from our ATM program which has approximately $170.7 million remaining.
Our long-term liquidity requirements consist primarily of funds necessary to acquire additional properties and repay indebtedness. We expect to meet our long-term liquidity requirements through various sources of capital, including net cash from operating activities, borrowings under our revolving credit and term loan facilities, future financings, sale of common stock under our ATM Program, proceeds from the sale of the properties in our portfolio and other secured and unsecured borrowings (including potential issuances under the Master Trust Funding Program). However, at any point in time, there may be a number of factors that could have a material and adverse effect on our ability to access these capital sources, including unfavorable conditions in the overall equity and credit markets, our level of leverage, the portion of our portfolio that is unencumbered, borrowing restrictions imposed by our existing debt agreements, general market conditions for real estate and potentially REITs specifically, our
47
operating performance, our liquidity and general market perceptions about us. The success of our business strategy will depend, to a significant degree, on our ability to access these various capital sources to fund our investment in single tenant properties and thereby grow our cash flows.
An additional liquidity need is funding the required level of distributions that are among the requirements for us to continue to qualify for taxation as a REIT. During the year ended December 31, 2020, our board of directors declared total cash distributions of $0.93 per share of common stock. Holders of OP Units are entitled to distributions per unit equivalent to those paid by us per share of common stock. During the year ended December 31, 2020, we paid $86.5 million of distributions to common stockholders and OP Unit holders, and as of December 31, 2020, we recorded $25.7 million of distributions payable to common stockholders and OP Unit holders. To continue to qualify for taxation as a REIT, we must make distributions to our stockholders aggregating annually at least 90% of our REIT taxable income, determined without regard to the dividends paid deduction and excluding any net capital gain. As a result of this requirement, we cannot rely on retained earnings to fund our business needs to the same extent as other entities that are not REITs. If we do not have sufficient funds available to us from our operations to fund our business needs, we will need to find alternative ways to fund those needs. Such alternatives may include, among other things, selling properties (whether or not the sales price is optimal or otherwise meets our strategic long-term objectives), incurring additional indebtedness or issuing equity securities in public or private transactions. The availability and attractiveness of the terms of these potential sources of financing cannot be assured.
Generally, our short-term debt capital is provided through our use of our Revolving Credit Facility. We manage our long-term leverage position through the issuance of long-term fixed-rate debt on a secured or unsecured basis. Generally, we will seek to issue long-term debt on an unsecured basis as we believe this facilitates greater flexibility in our management of our existing portfolio and our ability to retain optionality in our overall financing and growth strategy. By seeking to match the expected cash inflows from our long-term leases with the expected cash outflows necessary to service for our long-term debt, we seek to "lock in," for as long as is economically feasible, the expected positive difference between our scheduled cash inflows on our leases and the cash outflows on our debt obligations. In this way, we seek to reduce the risk that increases in interest rates would adversely impact our results of operations. Our ability to execute leases that contain annual rent escalations also contributes to our ability to manage the risk of a rising interest rate environment. We use various financial instruments designed to mitigate the impact of interest rate fluctuations on our cash flows and earnings, including hedging strategies such as interest rate swaps and caps, depending on our analysis of the interest rate environment and the costs and risks of such strategies. Although we are not required to maintain a particular leverage ratio and may not be able to do so, we generally consider that, over time, a level of net debt (which includes recourse and non-recourse borrowings and any outstanding preferred stock less unrestricted cash and cash held for the benefit of lenders) that is less than six times our annualized adjusted EBITDA
re
is prudent for the real estate company like ours.
As of December 31, 2020, all of our long-term debt was fixed-rate debt or was effectively converted to a fixed-rate for the term of the debt though hedging strategies and our weighted average debt maturity was 4.7 years. As we continue to invest in real estate properties and grow our real estate portfolio, we intend to manage our long-term debt maturities to reduce the risk that a significant amount of our debt will mature in any single year in the future.
Over time, we may access additional long-term debt capital with future debt issuances through our Master Trust Funding Program, although we have no plans to currently do so. Future sources of debt capital may also include term borrowings from insurance companies, banks and other sources, mortgage financing of a single-asset or portfolio of assets and CMBS borrowings. These sources of debt capital may offer us the opportunity to lower our cost of funding and further diversify our sources of debt capital. Over time, we may choose to issue preferred equity as a part of our overall strategy for funding our investment objectives and growth goals. As our outstanding debt matures, we may refinance it as it comes due or choose to repay it using cash and cash equivalents or borrowings under the Revolving Credit Facility. Management believes that the cash generated by our operations, together with our cash and cash equivalents at December 31, 2020, our borrowing availability under the Revolving Credit Facility and our potential access to additional sources of capital, will be sufficient to fund our operations for the foreseeable future and allow us to acquire the real estate for which we currently have made commitments.
48
Description of Certain Debt
The following table summarizes our outstanding indebtedness as of December 31, 2020 and 2019:
| Principal Outstanding |
Weighted Average Interest Rate
(1)
|
|||||||||||||||||||||||||||||||
| (in thousands) | Maturity Date | December 31, 2020 |
December 31,
2019 |
December 31, 2020 |
December 31,
2019 |
|||||||||||||||||||||||||||
| Unsecured term loans: | ||||||||||||||||||||||||||||||||
| April 2019 Term Loan | April 2024 | $ | 200,000 | $ | 200,000 | 3.3% | 3.3% | |||||||||||||||||||||||||
| November 2019 Term Loan | November 2026 | 430,000 | 250,000 | 3.0% | 3.1% | |||||||||||||||||||||||||||
| Revolving Credit Facility | April 2023 | 18,000 | 46,000 | 1.4% | 3.1% | |||||||||||||||||||||||||||
| Secured borrowings: | ||||||||||||||||||||||||||||||||
| Series 2017-1 Notes | June 2047 | 173,193 | 239,102 | 4.2% | 4.2% | |||||||||||||||||||||||||||
| Total principal outstanding | $ | 821,193 | $ | 735,102 | 3.3% | 3.5% | ||||||||||||||||||||||||||
_______________________________________________________________
(1)
Interest rates are presented after giving effect to our interest rate swap agreements, where applicable.
Unsecured Revolving Credit Facility and April 2019 Term Loan
Through our Operating Partnership, we are party to an Amended Credit Agreement with a group of lenders, which provides for revolving loans of up to $400.0 million (the "Revolving Credit Facility") and up to an additional $200.0 million in term loans (the "April 2019 Term Loan").
The Revolving Credit Facility matures on April 12, 2023, with an extension option of up to one year exercisable by the Operating Partnership, subject to certain conditions, and the April 2019 Term Loan matures on April 12, 2024. The loans under each of the Revolving Credit Facility and the April 2019 Term Loan initially bear interest at an annual rate of applicable LIBOR plus the applicable margin (which applicable margin varies between the Revolving Credit Facility and the April 2019 Term Loan). The applicable LIBOR is the rate with a term equivalent to the interest period applicable to the relevant borrowing. The applicable margin initially is a spread set according to a leverage-based pricing grid. At the Operating Partnership's election, on and after receipt of an investment grade corporate credit rating from S&P or Moody's, the applicable margin will be a spread set according to the credit ratings provided by S&P and/or Moody's. Each of the Revolving Credit Facility and the April 2019 Term Loan is freely pre-payable at any time and is mandatorily payable if borrowings exceed the borrowing base or the revolving facility limit. The Operating Partnership may re-borrow amounts paid down on the Revolving Credit Facility but not on the April 2019 Term Loan. The Operating Partnership is required to pay revolving credit fees throughout the term of the Revolving Credit Agreement based upon its usage of the Revolving Credit Facility, at a rate which depends on its usage of such facility during the period before we receive an investment grade corporate credit rating from S&P or Moody's, and which rate shall be based on the corporate credit rating from S&P and/or Moody's after the time, if applicable, we receive such a rating. The Amended Credit Agreement has an accordion feature to increase, subject to certain conditions, the maximum availability of credit (either through increased revolving commitments or additional term loans) by up to $200.0 million.
The Operating Partnership is the borrower under the Amended Credit Agreement, and we and each of the subsidiaries of the Operating Partnership that owns a direct or indirect interest in an eligible real property asset are guarantors under the Amended Credit Agreement.
Under the terms of the Amended Credit Agreement, we are subject to various restrictive financial and nonfinancial covenants which, among other things, require us to maintain certain leverage ratios, cash flow and debt service coverage ratios, secured borrowing ratios and a minimum level of tangible net worth.
The Amended Credit Agreement restricts our ability to pay distributions to our stockholders under certain circumstances. However, we may make distributions to the extent necessary to maintain our qualification as a REIT under the Code. The Amended Credit Agreement contains certain additional covenants that, subject to exceptions, limit or restrict our incurrence of indebtedness and liens, disposition of assets, transactions with affiliates, mergers and fundamental changes, modification of organizational documents, changes to fiscal periods, making of investments, negative pledge clauses and lines of business and REIT qualification.
49
November 2019 Term Loan
On November 26, 2019, we, through our Operating Partnership, entered into a $430.0 million term loan credit facility (the "November 2019 Term Loan") with a group of lenders. The November 2019 Term Loan provides for term loans to be drawn up to an aggregate amount of $430.0 million with a maturity of November 26, 2026. The loans under the November 2019 Term Loan are available to be drawn in up to three draws during the six-month period beginning on November 26, 2019. In December 2019, we made an initial borrowing of $250.0 million available under the November 2019 Term Loan and in March 2020 we borrowed the remaining $180.0 million available under the November 2019 Term Loan.
Borrowings under the November 2019 Term Loan bear interest at an annual rate of applicable LIBOR plus the applicable margin. The applicable LIBOR will be the rate with a term equivalent to the interest period applicable to the relevant borrowing. The applicable margin will initially be a spread set according to a leverage-based pricing grid. At the Operating Partnership's irrevocable election, on and after receipt of an investment grade corporate credit rating from S&P or Moody's, the applicable margin will be a spread set according to our corporate credit ratings provided by S&P and/or Moody's. The November 2019 Term Loan is pre-payable at any time by the Operating Partnership, provided, that if the loans under the November 2019 Term Loan are repaid on or before November 26, 2021, they are subject to a one percent prepayment premium. After November 26, 2021 the loans may be repaid without penalty. The November 2019 Term Loan has an accordion feature to increase, subject to certain conditions, the maximum availability of the facility up to an aggregate of $500 million.
The Operating Partnership is the borrower under the November 2019 Term Loan, and our Company and each of its subsidiaries that owns a direct or indirect interest in an eligible real property asset are guarantors under the facility. Under the terms of the November 2019 Term Loan, we are subject to various restrictive financial and nonfinancial covenants which, among other things, require us to maintain certain leverage ratios, cash flow and debt service coverage ratios, secured borrowing ratios and a minimum level of tangible net worth.
The November 2019 Term Loan restricts our ability to pay distributions to our stockholders under certain circumstances. However, we may make distributions to the extent necessary to maintain our qualification as a REIT under the Code. The November 2019 Term Loan contains certain additional covenants that, subject to exceptions, limit or restrict our incurrence of indebtedness and liens, disposition of assets, transactions with affiliates, mergers and fundamental changes, modification of organizational documents, changes to fiscal periods, making of investments, negative pledge clauses and lines of business and REIT qualification.
Master Trust Funding Program
SCF RC Funding I LLC, SCF RC Funding II LLC and SCF RC Funding III LLC (collectively, the "Master Trust Issuers"), all of which are indirect wholly-owned subsidiaries of the Operating Partnership, have issued net-lease mortgage notes payable (the "Notes") with an aggregate outstanding gross principal balance of $173.2 million as of December 31, 2020. The Notes are secured by all assets owned by the Master Trust Issuers. We provide property management services with respect to the mortgaged properties owned by the Master Trust Issuers and service the related leases pursuant to an amended and restated property management and servicing agreement, dated as of July 11, 2017, among the Master Trust Issuers, the Operating Partnership (as property manager and as special servicer), Midland Loan Services, a division of PNC Bank, National Association, (as back-up manager) and Citibank, N.A. (as indenture trustee).
Beginning in 2016, two series of Notes, each comprised of two classes, were issued under the program: (i) Notes originally issued by SCF RC Funding I LLC and SCF RC Funding II LLC (the "Series 2016-1 Notes"), which were repaid in full in November 2019 and (ii) Notes originally issued by SCF RC Funding I LLC, SCF RC Funding II LLC and SCF RC Funding III LLC (the "Series 2017-1 Notes"), with an aggregate outstanding principal balance of $173.2 million as of December 31, 2020. The Notes are the joint obligations of all Master Trust Issuers.
Notes issued under our Master Trust Funding Program are secured by a lien on all of the property owned by the Master Trust Issuers and the related leases. A substantial portion of our real estate investment portfolio serves as collateral for borrowings outstanding under our Master Trust Funding Program. As of December 31, 2020, we had pledged 258 properties, with a net investment amount of $399.7 million, under the Master Trust Funding Program. The agreement governing our Master Trust Funding Program permits substitution of real estate collateral from time to time, subject to certain conditions.
50
Absent a plan to issue additional long-term debt through the Master Trust Funding Program, we are not required to add assets to, or substitute collateral in, the existing collateral pool. We can voluntarily elect to substitute assets in the collateral pool, subject to meeting prescribed conditions that are designed to protect the collateral pool by requiring the substitute assets to be of equal or greater measure in attributes such as: the asset's fair value, monthly rent payments, remaining lease term and weighted average coverage ratios. In addition, we can sell underperforming assets and reinvest the proceeds in new properties. Any substitutions and sales are subject to an overall limitation of 35% of the collateral pool which is typically reset at each new issuance unless the substitution or sale is credit- or risk-based, in which case there are no limitations.
A significant portion of our cash flows are generated by the special purpose entities comprising our Master Trust Funding Program. For the three months ended December 31, 2020, excess cash flow from the Master Trust Funding Program, after payment of debt service and servicing and trustee expenses, totaled $5.1 million on cash collections of $8.5 million, which represents a debt service coverage ratio (as defined in the program documents) of
2.27x
. If at any time the monthly debt service coverage ratio (as defined in the program documents) generated by the collateral pool is less than or equal to 1.25x, excess cash flow from the Master Trust Funding Program entities will be deposited into a reserve account to be used for payments to be made on the Notes, to the extent there is a shortfall; if at any time the three month average debt service coverage ratio generated by the collateral pool is less than or equal to 1.15x, excess cash flow from the Master Trust Funding Program entities will be applied to an early amortization of the Notes. If cash generated by our properties held in the Master Trust Funding Program is required to be held in a reserve account or applied to an early amortization of the Notes, it would reduce the amount of cash available to us and could limit or eliminate our ability to make distributions to our common stockholders.
The Notes require monthly payments of principal and interest. The payment of principal and interest on any Class B Notes is subordinate to the payment of principal and interest on any Class A Notes. The Series 2017-1 Notes mature in June 2047 and have a weighted average interest rate of 4.19% as of December 31, 2020. However, the anticipated repayment date for the Series 2017-1 Notes is June 2024, and if the notes are not repaid in full on or before such anticipated repayment date, additional interest will begin to accrue on the notes.
The Series 2017-1 Notes may be voluntarily prepaid, in whole or in part, at any time on or after the date that is 31 months prior to the anticipated repayment date in June 2024 without the payment of a make whole amount. Voluntary prepayments may be made before 31 months prior to the anticipated repayment date but will be subject to the payment of a make whole amount.
An event of default will occur under the Master Trust Funding Program if, among other things, the Master Trust Issuers fail to pay interest or principal on the Notes when due, materially default in complying with the material covenants contained in the documents evidencing the Notes or the mortgages on the mortgaged property collateral or if a bankruptcy or other insolvency event occurs. Under the master trust indenture, we have a number of Master Trust Issuer covenants including requirements to pay any taxes and other charges levied or imposed upon the Master Trust Issuers and to comply with specified insurance requirements. We are also required to ensure that all uses and operations on or of our properties comply in all material respects with all applicable environmental laws. As of December 31, 2020, we were in material compliance with all such covenants.
As of December 31, 2020, scheduled principal repayments on the Notes issued under the Master Trust Funding Program during 2021 were $4.1 million. We expect to meet these repayment requirements primarily through our net cash from operating activities.
Cash Flows
Comparison of the years ended December 31, 2020 and 2019
As of December 31, 2020, we had $26.6 million of cash and cash equivalents and $6.4 million of restricted cash as compared to $8.3 million and $13.0 million, respectively, as of December 31, 2019.
Cash Flows for the year ended December 31, 2020
During the year ended December 31, 2020, net cash provided by operating activities was $99.4 million as compared $88.6 million during the same period in 2019, an increase of approximately $10.8 million. Our cash flows from operating activities primarily depend on the occupancy of our portfolio, the rental rates specified in our leases, and the collectability of such rent and our operating expenses and other general and administrative costs. Cash
51
inflows during 2020 related to net income adjusted for non-cash items of $107.2 million (net income of $42.5 million adjusted for non-cash items, including adding back depreciation and amortization of tangible, intangible and right-of-use real estate assets, amortization of deferred financing costs and other assets, loss on repayment of secured borrowings, provision for impairment of real estate, and subtracting gains on dispositions of real estate, net, straight-line rent receivable, equity-based compensation expense and adjustment to rental revenue for tenant credit, which in aggregate net to an addition of $64.7 million) and an increase in accrued liabilities and other payables of $4.2 million. These net cash inflows were offset by an outflow related to the increase in rent receivables, prepaid expenses and other assets of $12.1 million. The increase in net cash provided by operating activities was primarily by the increased size of our investment portfolio.
Net cash used in investing activities during the year ended December 31, 2020 was $545.5 million as compared to $607.8 million in the same period in 2019, a decrease of approximately $62.3 million. Our net cash used in investing activities is generally used to fund our investments in real estate, including capital expenditures, the development of our construction in progress and investments in loans receivable, offset by cash provided from the disposition of real estate and principal collections on our loans and direct financing lease receivables. The cash used in investing activities during 2020 included $541.3 million to fund investments in real estate, including capital expenditures, $14.4 million to fund construction in progress, $60.5 million of investments in loans receivable and $12.9 million paid to tenants as lease incentives. These cash outflows were partially offset by $82.9 million of proceeds from sales of investments, net of disposition costs and $0.3 million of principal collections on our loans and direct financing lease receivables. The increase in net cash used in investing was primarily due to our increased level of investments in real estate and loans receivables offset by increased asset sales.
Net cash provided by financing activities was $457.8 million during the year ended December 31, 2020 as compared to $524.4 million in the same period in 2019, a decrease of approximately $66.6 million. Our net cash provided by financing activities in 2020 related to cash inflows of $461.0 million from the issuance of common stock in follow-on equity offerings and through our ATM Program, $87.0 million of borrowings under the Revolving Credit Facility and $180.0 million of borrowings under the November 2019 Term Loan. These cash inflows were partially offset by a $65.9 million outflow related to principal payments on our Master Trust Funding notes, $115.0 million of repayments on the Revolving Credit Facility, the payment of $86.5 million in dividends, $2.8 million of offering costs paid related to our follow-on offerings and the ATM Program and the payment of deferred financing costs of approximately $25,000. The decrease in net cash provided by financing activities was due to our net borrowings being reduced during the year by nearly $100 million and increased dividends of approximately $22.6 million, offset by our increase proceeds from the issuance of stock of approximately $50 million.
Cash Flows for the year ended December 31, 2019
During the year ended December 31, 2019, net cash provided by operating activities was $88.6 million. Our cash flows from operating activities primarily depend on the occupancy of our portfolio, the rental rates specified in our leases, and the collectability of such rent and our operating expenses and other general and administrative costs. Cash inflows related to net income adjusted for non-cash items of $86.1 million (net income of $48.0 million adjusted for non-cash items, including depreciation and amortization of tangible, intangible and right-of-use real estate assets, amortization of deferred financing costs and other assets, loss on repurchase of secured borrowings, provision for impairment of real estate, gains on dispositions of real estate, net, straight-line rent receivable, equity-based compensation expense and adjustment to rental revenue for tenant credit, of $38.1 million), an increase in accrued liabilities and other payables of $1.2 million and a decrease in rent receivables, prepaid expenses and other assets of $1.2 million.
Net cash used in investing activities during the year ended December 31, 2019 was $607.8 million. Our net cash used in investing activities is generally used to fund our investments in real estate, including capital expenditures, the development of our construction in progress and investments in loans receivable, offset by cash provided from the disposition of real estate and principal collections on our loans and direct financing lease receivables. The cash used in investing activities included $570.0 million to fund investments in real estate, including capital expenditures, $17.9 million to fund construction in progress, $94.6 million of investments in loans receivable and $2.1 million paid to tenants as lease incentives. These cash outflows were partially offset by $66.8 million of proceeds from sales of investments, net of disposition costs and $9.5 million of principal collections on our direct financing lease receivables.
Net cash provided by financing activities of $524.4 million million during the year ended December 31, 2019 related to cash inflows of $411.6 million from the issuance of common stock in our follow-on offering and through
52
our ATM program, $459.0 million of borrowings under the Revolving Credit Facility, $450.0 million of combined borrowings under the April 2019 Term Loan and November 2019 Term Loan and $1.7 million of principal collected on repurchased Master Trust Funding Notes. These cash inflows were partially offset by a net $277.4 million outflow related to principal payments and the repurchase and subsequent repayment of Master Trust Funding notes, payment of deferred financing costs of $6.1 million related to the Amended Credit Agreement, $447.0 million of repayments on the Revolving Credit Facility, the payment of $63.9 million in dividends and $1.8 million of offering costs related to our follow-on offering and the ATM Program.
Off-Balance Sheet Arrangements
We had no off-balance sheet arrangements as of December 31, 2020.
Contractual Obligations
The following table provides information with respect to our commitments as of December 31, 2020:
| Payment due by period | ||||||||||||||||||||||||||||||||
| (in thousands) | Total | 2021 | 2022-2023 | 2024-2025 | Thereafter | |||||||||||||||||||||||||||
| Secured Borrowings—Principal | $ | 173,193 | $ | 4,083 | $ | 8,804 | $ | 160,305 | $ | — | ||||||||||||||||||||||
|
Secured Borrowings—Fixed Interest
(1)
|
24,372 | 7,183 | 13,844 | 3,345 | — | |||||||||||||||||||||||||||
| Unsecured Term Loans | 630,000 | — | — | 200,000 | 430,000 | |||||||||||||||||||||||||||
| Revolving Credit Facility | 18,000 | — | 18,000 | — | — | |||||||||||||||||||||||||||
|
Tenant Construction Financing and Reimbursement Obligations
(2)
|
16,264 | 16,264 | — | — | — | |||||||||||||||||||||||||||
|
Operating Lease Obligations
(3)
|
20,539 | 1,471 | 2,621 | 1,885 | 14,562 | |||||||||||||||||||||||||||
| Total | $ | 882,368 | $ | 29,002 | $ | 43,269 | $ | 365,535 | $ | 444,562 | ||||||||||||||||||||||
_________________________________________________________
(1)
Includes interest payments on outstanding indebtedness issued under our Master Trust Funding Program through the anticipated repayment dates.
(2)
Includes obligations to reimburse certain of our tenants for construction costs that they incur in connection with construction at our properties in exchange for contractually-specified rent that generally increases proportionally with our funding.
(3)
Includes of $17.5 million rental payments due under ground lease arrangements where our tenants are directly responsible for payment.
Additionally, we may enter into commitments to purchase goods and services in connection with the operation of our business. These commitments generally have terms of one-year or less and reflect expenditure levels comparable to our historical expenditures, as adjusted for our growth.
We have made an election to be taxed as a REIT for federal income tax purposes beginning with our taxable year ended December 31, 2018; accordingly, we generally will not be subject to federal income tax for the year ended December 31, 2020, if we distribute all of our REIT taxable income, determined without regard to the dividends paid deduction, to our stockholders.
Critical Accounting Policies and Estimates
Our accounting policies are determined in accordance with GAAP. The preparation of our financial statements requires us to make estimates and assumptions that are subjective in nature and, as a result, our actual results could differ materially from our estimates. Estimates and assumptions include, among other things, subjective judgments regarding the fair values and useful lives of our properties for depreciation and lease classification purposes, the collectability of receivables and asset impairment analysis. Set forth below are the more critical accounting policies that require management judgment and estimates in the preparation of our consolidated financial statements.
Real Estate Investments
Investments in real estate are carried at cost less accumulated depreciation and impairment losses, if any. The cost of investments in real estate reflects their purchase price or development cost. We evaluate each
53
acquisition transaction to determine whether the acquired asset meets the definition of a business. Under Accounting Standards Update ("ASU") 2017-01,
Business Combinations (Topic 805): Clarifying the Definition of a Business
, an acquisition does not qualify as a business when there is no substantive process acquired or substantially all of the fair value is concentrated in a single identifiable asset or group of similar identifiable assets or the acquisition does not include a substantive process in the form of an acquired workforce or an acquired contract that cannot be replaced without significant cost, effort or delay. Transaction costs related to acquisitions that are asset acquisitions are capitalized as part of the cost basis of the acquired assets, while transaction costs for acquisitions that are deemed to be acquisitions of a business are expensed as incurred. Improvements and replacements are capitalized when they extend the useful life or improve the productive capacity of the asset. Costs of repairs and maintenance are expensed as incurred.
We allocate the purchase price of acquired properties accounted for as asset acquisitions to tangible and identifiable intangible assets or liabilities based on their relative fair values. Tangible assets may include land, site improvements and buildings. Intangible assets may include the value of in-place leases and above- and below-market leases and other identifiable intangible assets or liabilities based on lease or property specific characteristics.
We incur various costs in the leasing and development of our properties. Amounts paid to tenants that incentivize them to extend or otherwise amend an existing lease or to sign a new lease agreement are capitalized to lease incentive on our consolidated balance sheets. Tenant improvements are capitalized to building and improvements within our consolidated balance sheets. Costs incurred which are directly related to properties under development, which include pre-construction costs essential to the development of the property, development costs, construction costs, interest costs and real estate taxes and insurance, are capitalized during the period of development as construction in progress. After the determination is made to capitalize a cost, it is allocated to the specific component of a project that benefited. Determination of when a development project commences and capitalization begins, and when a development project has reached substantial completion and is available for occupancy and capitalization must cease, involves a degree of judgment. We do not engage in speculative real estate development. We do, however, opportunistically agree to reimburse certain of our tenants for development costs at our properties in exchange for contractually specified rent that generally increases proportionally with our funding.
The fair value of the tangible assets of an acquired property with an in-place operating lease is determined by valuing the property as if it were vacant, and the "as-if-vacant" value is then allocated to the tangible assets based on the fair value of the tangible assets. The fair value of in-place leases is determined by considering estimates of carrying costs during the expected lease-up periods, current market conditions, as well as costs to execute similar leases based on the specific characteristics of each tenant's lease. We estimate the cost to execute leases with terms similar to the remaining lease terms of the in-place leases, including leasing commissions, legal and other related expenses. Factors we consider in this analysis include an estimate of the carrying costs during the expected lease-up periods considering current market conditions and costs to execute similar leases. In estimating carrying costs, we include real estate taxes, insurance and other operating expenses, and estimates of lost rentals at market rates during the expected lease-up periods, which primarily range from six to 12 months. The fair value of above- or below-market leases is recorded based on the net present value (using a discount rate that reflects the risks associated with the leases acquired) of the difference between the contractual amount to be paid pursuant to the in-place lease and our estimate of the fair market lease rate for the corresponding in-place lease, measured over the remaining non-cancelable term of the lease including any below-market fixed rate renewal options for below-market leases.
In making estimates of fair values for purposes of allocating purchase price, we use a number of sources, including real estate valuations prepared by independent valuation firms. We also consider information and other factors including market conditions, the industry that the tenant operates in, characteristics of the real estate, e.g., location, size, demographics, value and comparative rental rates, tenant credit profile and the importance of the location of the real estate to the operations of the tenant's business. Additionally, we consider information obtained about each property as a result of our pre-acquisition due diligence, marketing and leasing activities in estimating the fair value of the tangible and intangible assets acquired. We use the information obtained as a result of our pre-acquisition due diligence as part of our consideration of the accounting standard governing asset retirement obligations and, when necessary, will record an asset retirement obligation as part of the purchase price allocation.
Real estate investments that are intended to be sold are designated as "held for sale" on the consolidated balance sheets at the lesser of carrying amount and fair value less estimated selling costs. Real estate investments
54
are no longer depreciated when they are classified as held for sale. If the disposal, or intended disposal, of certain real estate investments represents a strategic shift that has had or will have a major effect on our operations and financial results, the operations of such real estate investments would be presented as discontinued operations in the consolidated statements of operations for all applicable periods.
Allowance for Loan Losses
Prior to the adoption of ASC Topic 326, Financial Instruments - Credit Losses (“ASC 326”), we periodically evaluated the collectability of our loans receivable, including accrued interest, by analyzing the underlying property level economics and trends, collateral value and quality and other relevant factors in determining the adequacy of its allowance for loan losses. A loan was determined to be impaired when, in management’s judgment based on current information and events, it was probable that we would be unable to collect all amounts due according to the contractual terms of the loan agreement. Specific allowances for loan losses were provided for impaired loans on an individual loan basis in the amount by which the carrying value exceeded the estimated fair value of the underlying collateral less disposition costs. As of December 31, 2019, we had no allowance for loan losses recorded in our consolidated financial statements.
On January 1, 2020, we adopted ASC 326 on a prospective basis. ASC 326 changed how we account for credit losses for all of our loans receivable and direct financing lease receivables. ASC 326 replaces the current “incurred loss” model with an “expected loss” model that requires consideration of a broader range of information than used under the incurred losses model. Upon adoption of ASC 326, we recorded an initial allowance for loan losses of $0.2 million as of January 1, 2020, netted against loans and direct financing receivables on our consolidated balance sheet. Under ASC 326, we are required to re-evaluate the expected loss of our loans and direct financing lease receivable portfolio at each balance sheet date. As of December 31, 2020, we recorded an allowance for loan losses of $1.0 million. Changes in our allowance for loan losses are presented within provision for loan losses in our consolidated statements of operations.
In connection with our adoption of ASC 326 on January 1, 2020, we implemented a new process including the use of loan loss forecasting models. We have used the loan loss forecasting model for estimating expected lifetime credit losses, at the individual asset level, for our loans and direct financing lease receivable portfolio. The forecasting model used is the probability weighted expected cash flow method, depending on the type of loan and global assumptions.
We use a real estate loss estimate model (“RELEM”) which estimates losses on our loans and direct financing lease receivable portfolio, for purposes of calculating allowances for loan losses. The RELEM allows us to refine (on an ongoing basis) the expected loss estimate by incorporating loan specific assumptions as necessary, such as anticipated funding, interest payments, estimated extensions and estimated loan repayment/refinancing at maturity to estimate cash flows over the life of the loan. The model also incorporates assumptions related to underlying collateral values, various loss scenarios, and predicted losses to estimate expected losses. Our specific loan-level inputs include loan-to-stabilized-value “LTV” and debt service coverage ratio metrics, as well as principal balances, property type, location, coupon, origination year, term, subordination, expected repayment dates and future funding’s. We categorize the results by LTV range, which we consider the most significant indicator of credit quality for our loans and direct financing lease receivables. A lower LTV ratio typically indicates a lower credit loss risk.
Real estate lending has several risks that need to be considered. There is the potential for changes in local real estate conditions and subjectivity of real estate valuations. In addition, overall economic conditions may impact the borrowers’ financial condition. Adverse economic conditions such as high unemployment levels, interest rates, tax rates and fuel and energy costs may have an impact on the results of operations and financial conditions of borrowers.
We also evaluate each loan and direct financing lease receivable measured at amortized cost for credit deterioration at least quarterly. Credit deterioration occurs when it is deemed probable that we will not be able to collect all amounts due according to the contractual terms of the loan or direct financing lease receivables.
Our allowance for loan losses is adjusted to reflect our estimation of the current and future economic conditions that impact the performance of the real estate assets securing our loans. These estimations include various macroeconomic factors impacting the likelihood and magnitude of potential credit losses for our loans and direct financing leases during their anticipated term.
55
Impairment of Long-Lived Assets
If circumstances indicate that the carrying value of a property may not be recoverable, we review the asset for impairment. This review is based on an estimate of the future undiscounted cash flows, excluding interest charges, expected to result from the property's use and eventual disposition. These estimates consider factors such as expected future operating income, market and other applicable trends and residual value, as well as the effects of leasing demand, competition and other factors. If impairment exists due to the inability to recover the carrying value of a property, an impairment loss is recorded to the extent that the carrying value exceeds the estimated fair value of the property for properties to be held and used. For properties held for sale, the impairment loss is the adjustment to fair value less estimated cost to dispose of the asset. Impairment assessments have a direct impact on the consolidated statements of operations, because recording an impairment loss results in an immediate negative adjustment to the consolidated statements of operations.
Adjustment to Rental Revenue for Tenant Credit/Allowance for Doubtful Accounts
We continually review receivables related to rent and unbilled rent receivables and determines collectability by taking into consideration the tenant's payment history, the financial condition of the tenant, business conditions in the industry in which the tenant operates and economic conditions in the area in which the property is located. Prior to January 1, 2019, if the collectability of a receivable was in doubt, the accounts receivable and straight-line rent receivable balances were reduced by an allowance for doubtful accounts on the consolidated balance sheets or a direct write-off of the receivable was recorded in the consolidated statements of operations. The provision for doubtful accounts was included in property expenses in our consolidated statements of operations. If the accounts receivable balance or straight-line rent receivable balance was subsequently deemed to be uncollectible, such receivable amounts were written-off to the allowance for doubtful accounts.
As of January 1, 2019, if the assessment of the collectability of substantially all payments due under a lease changes from probable to not probable, any difference between the rental revenue recognized to date and the lease payments that have been collected is recognized as a current period adjustment to rental revenue in the consolidated statements of operations.
Derivative Instruments
In the normal course of business, we use derivative financial instruments, which may include interest rate swaps, caps, options, floors and other interest rate derivative contracts, to protect us against adverse fluctuations in interest rates by reducing our exposure to variability in cash flows on a portion of our floating-rate debt. Instruments that meet these hedging criteria are formally designated as hedges at the inception of the derivative contract. We record all derivatives on the consolidated balance sheets at fair value. The accounting for changes in the fair value of derivatives depends on the intended use of the derivative, whether we have elected to designate a derivative in a hedging relationship and apply hedge accounting and whether the hedging relationship has satisfied the criteria necessary to apply hedge accounting. Derivatives designated and qualifying as a hedge of the exposure to variability in expected future cash flows, or other types of forecasted transactions, are considered cash flow hedges. Hedge accounting generally provides for the matching of the timing of gain or loss recognition on the hedging instrument with the recognition of the changes in the fair value of the hedged asset or liability that are attributable to the hedged risk in a fair value hedge or the earnings effect of the hedged forecasted transactions in a cash flow hedge. We may also enter into derivative contracts that are intended to economically hedge certain risk, even though hedge accounting does not apply or we elect not to apply hedge accounting.
The accounting for subsequent changes in the fair value of these derivatives depends on whether each has been designed and qualifies for hedge accounting treatment. If a derivative is designated and qualifies for cash flow hedge accounting treatment, the change in the estimated fair value of the derivative is recorded in other comprehensive income (loss) in the consolidated statements of comprehensive income to the extent that it is effective. Any ineffective portion of a change in derivative fair value is immediately recorded in earnings. If we elect not to apply hedge accounting treatment (or for derivatives that do not qualify as hedges), any change in the fair value of these derivative instruments is recognized immediately in gains (losses) on derivative instruments in the consolidated statements of operations. We do not intend to use derivative instruments for trading or speculative purposes.
56
Revenue Recognition
Our rental revenue is primarily related to rent received from tenants. Rent from tenants is recorded in accordance with the terms of each lease on a straight-line basis over the non-cancellable initial term of the lease from the later of the date of the commencement of the lease and the date of acquisition of the property subject to the lease. Rental revenue recognition begins when the tenant controls the space and continues through the term of the related lease. Because substantially all of the leases provide for rental increases at specified intervals, we record a straight-line rent receivable and recognize revenue on a straight-line basis through the expiration of the non-cancellable term of the lease. We take into account whether the collectability of rents is reasonably assured in determining the amount of straight-line rent to record.
We defer rental revenue related to lease payments received from tenants in advance of their due dates. These amounts are presented within accrued liabilities and other payables on our consolidated balance sheets.
Certain of our properties are subject to leases that provide for contingent rent based on a percentage of the tenant's gross sales. For these leases, we recognize contingent rental revenue when the threshold upon which the contingent lease payment is based is actually reached.
Equity-Based Compensation
From time to time, we grant shares of restricted common stock and restricted share units ("RSUs") to our directors, executive officers and other employees that vest over multiple periods, subject to the recipient's continued service. Additionally, we also granted performance-based RSUs to our executive officers, the final number of which is determined based on market and subjective performance conditions and which vest over a multi-year period, subject to the recipient's continued service. We account for the restricted common stock and RSUs in accordance with ASC 718, Compensation - Stock Compensation, which requires that such compensation be recognized in the financial statements based on their estimated grant-date fair value. The value of such awards is recognized as compensation expense in general and administrative expenses in the accompanying consolidated statements of operations over the requisite service periods. We recognize compensation expense for equity-based compensation using the straight-line method based on the terms of the individual grant. Forfeitures of equity-based compensation awards, if any, are recognized as they occur.
Variable Interest Entities
The FASB provides guidance for determining whether an entity is a variable interest entity (a "VIE"). VIEs are defined as entities in which equity investors do not have the characteristics of a controlling financial interest or do not have sufficient equity at risk for the entity to finance its activities without additional subordinated financial support. A VIE is required to be consolidated by its primary beneficiary, which is the party that (i) has the power to control the activities that most significantly impact the VIE's economic performance and (ii) has the obligation to absorb losses, or the right to receive benefits, of the VIE that could potentially be significant to the VIE.
Following the completion of the Formation Transactions, we concluded that the Operating Partnership is a VIE of which we are the primary beneficiary, as we have the power to direct the activities that most significantly impact the economic performance of the Operating Partnership. Substantially all of our assets and liabilities are held by the Operating Partnership. The assets and liabilities of the Operating Partnership are consolidated and reported as assets and liabilities on our consolidated balance sheet as of December 31, 2020.
Recently Issued Accounting Pronouncements
In February 2016, the FASB issued ASU 2016-13, Measurement of Credit Losses on Financial Instruments (“ASU 2016-13”) establishing ASC 326, as amended by subsequent ASUs on the topic. ASU 2016-13 is effective for interim and annual reporting periods in fiscal years beginning after December 15, 2019. We adopted this guidance on January 1, 2020 and recorded estimates of expected loss on its loans receivable portfolio beginning on that date.
In August 2017, the FASB issued ASU 2017-12, Derivatives and Hedging (Topic 815): Targeted Improvements to Accounting for Hedging Activities (“ASU 2017-12”), which amends and simplifies existing guidance in order to allow companies to more accurately present the economic effects of risk management activities in the financial statements. We adopted ASU 2017-12 while accounting for our interest rate swaps. As we did not have other derivatives outstanding at time of adoption, no prior period adjustments were required. Pursuant to the provisions of
57
ASU 2017-12, we are no longer required to separately measure and recognize hedge ineffectiveness. Instead, we recognize the entire change in the fair value of cash flow hedges included in the assessment of hedge effectiveness in other comprehensive (loss) income. The amounts recorded in other comprehensive (loss) income will subsequently be reclassified to earnings when the hedged item affects earnings. The adoption of ASU 2017-12 did not have a material impact on our consolidated financial statements.
In August 2018, the FASB issued ASU 2018-13, Fair Value Measurement: Changes to the Disclosure Requirements for Fair Value Measurement (“ASU 2018-13”), which changes the disclosure requirements for fair value measurements by removing, adding and modifying certain disclosures. ASU 2018-13 is effective for annual periods beginning after December 15, 2019, with early adoption permitted. We adopted this guidance on January 1, 2020 and the adoption of ASU 2018-13 did not have a material impact on our related disclosures.
In March 2020, the FASB issued ASU 2020-04, Reference Rate Reform (Topic 848) (“ASU 2020-04”). ASU 2020-04 contains practical expedients for reference rate reform related activities that impact debt, leases, derivatives and other contracts. The guidance in ASU 2020-04 is optional and may be elected over time as reference rate reform activities occur. During the first quarter of 2020, the Company has elected to apply the hedge accounting expedients related to probability and the assessments of effectiveness for future LIBOR-indexed cash flows to assume that the index upon which future hedged transactions will be based matches the index on the corresponding derivatives. Application of these expedients preserves the presentation of derivatives consistent with past presentation. We continue to evaluate the impact of the guidance and may apply other elections as applicable as additional changes in the market occur.
In April 2020, the Financial Accounting Standards Board ("FASB”) staff issued a question and answer document (the “Lease Modification Q&A”) focused on the application of lease accounting guidance to lease concessions provided as a result of the COVID-19 pandemic. Under existing lease guidance, the entity would have to determine, on a lease by lease basis, if a lease concession was the result of a new arrangement reached with the tenant, which would be accounted for under the lease modification framework, or if a lease concession was under the enforceable rights and obligations that existed in the original lease, which would be accounted for outside the lease modification framework. The Lease Modification Q&A provides entities with the option to elect to account for lease concessions as though the enforceable rights and obligations existed in the original lease. This election is only available when total cash flows resulting from the modified lease are substantially similar to the cash flows in the original lease. We made this election and account for rent deferrals by increasing our rent receivables as receivables accrue and continuing to recognize income during the deferral period, resulting in $12.4 million of deferrals being recognized in rental revenues for the year ended December 31, 2020 . Lease concessions or amendments other than rent deferrals are evaluated to determine if a substantive change to the consideration in the original lease contract has occurred and should be accounted for as a lease modification. We continue to evaluate any amounts recognized for collectability, regardless of whether accounted for as a lease modification or not, and record an adjustment to rental income for tenant credit for amounts that are not probable of collection. For lease concessions granted in conjunction with the COVID-19 pandemic, we reviewed all amounts recognized on a tenant-by-tenant basis for collectability.
In August 2020, the FASB issued Accounting Standards Update (“ASU”) 2020-06, “Debt – Debt with Conversion and Other Options (Subtopic 470-20) and Derivatives and Hedging – Contracts in Entity’s Own Equity (Subtopic 815-40): Accounting for Convertible Instruments and Contracts in an Entity’s Own Equity” (“ASU 2020-06”). The guidance in ASU 2020-06 simplifies the accounting for convertible debt and convertible preferred stock by removing the requirements to separately present certain conversion features in equity. In addition, the amendments in the ASU 2020-06 also simplify the guidance in ASC Subtopic 815-40, Derivatives and Hedging: Contracts in Entity’s Own Equity, by removing certain criteria that must be satisfied in order to classify a contract as equity, which is expected to decrease the number of freestanding instruments and embedded derivatives accounted for as assets or liabilities. Finally, the amendments revise the guidance on calculating earnings per share, requiring use of the if-converted method for all convertible instruments and rescinding an entity’s ability to rebut the presumption of share settlement for instruments that may be settled in cash or other assets. The amendments in ASU 2020-06 are effective for the Company for fiscal years beginning after December 15, 2021. Early adoption is permitted, but no earlier than fiscal years beginning after December 15, 2020. The guidance must be adopted as of the beginning of the fiscal year of adoption. The Company is currently evaluating the impact of this new guidance.
58
Results of Operations
The following discusses our results of operations for the year ended December 31, 2020, as compared to our results of operations for the year ended December 31, 2019. A discussion of the changes in our results of operations for the year ended December 31, 2019, as compared to our results of operations for the year ended December 31, 2018 has been omitted from this Annual Report but may be found in "Item 7. Management's Discussion and Analysis of Financial Condition and Results of Operations—Results of Operations—Comparison of the years ended December 31, 2019 and 2018 in our annual report for the year ended December 31, 2019.
Comparison of the years ended December 31, 2020 and 2019
| Year ended December 31, | ||||||||||||||||||||||||||
| (dollar amounts in thousands) | 2020 | 2019 | Change | % | ||||||||||||||||||||||
| Revenues: | ||||||||||||||||||||||||||
| Rental revenue | $ | 155,792 | $ | 135,670 | $ | 20,122 | 14.8 | % | ||||||||||||||||||
| Interest income on loans and direct financing lease receivables | 8,136 | 3,024 | 5,112 | 169.0 | % | |||||||||||||||||||||
| Other revenue, net | 81 | 663 | (582) | (87.8) | % | |||||||||||||||||||||
| Total revenues | 164,009 | 139,357 | 24,652 | 17.7 | % | |||||||||||||||||||||
| Expenses: | ||||||||||||||||||||||||||
| General and administrative | 24,444 | 21,745 | 2,699 | 12.4 | % | |||||||||||||||||||||
| Property expenses | 3,881 | 3,070 | 811 | 26.4 | % | |||||||||||||||||||||
| Depreciation and amortization | 59,446 | 42,745 | 16,701 | 39.1 | % | |||||||||||||||||||||
| Provision for impairment of real estate | 8,399 | 2,918 | 5,481 | 187.8 | % | |||||||||||||||||||||
| Provision for loan losses | 830 | — | 830 | 100.0 | % | |||||||||||||||||||||
| Total expenses | 97,000 | 70,478 | 25,692 | 36.5 | % | |||||||||||||||||||||
| Other operating income: | ||||||||||||||||||||||||||
| Gain on dispositions of real estate, net | 5,821 | 10,932 | (5,111) | (46.8) | % | |||||||||||||||||||||
| Income from operations | 72,830 | 79,811 | (6,981) | (8.7) | % | |||||||||||||||||||||
| Other (expense)/income: | ||||||||||||||||||||||||||
| Loss on repayment and repurchase of secured borrowings | (924) | (5,240) | 4,316 | (82.4) | % | |||||||||||||||||||||
| Interest expense | (29,651) | (27,037) | (2,614) | 9.7 | % | |||||||||||||||||||||
| Interest income | 485 | 794 | (309) | (38.9) | % | |||||||||||||||||||||
| Income before income tax expense | 42,740 | 48,328 | (5,588) | (11.6) | % | |||||||||||||||||||||
| Income tax expense | 212 | 303 | (91) | (30.0) | % | |||||||||||||||||||||
| Net income | 42,528 | 48,025 | (5,497) | (11.4) | % | |||||||||||||||||||||
| Net income attributable to non-controlling interests | (255) | (6,181) | 5,926 | (95.9) | % | |||||||||||||||||||||
| Net income attributable to stockholders and members | $ | 42,273 | $ | 41,844 | $ | 429 | 1.0 | % | ||||||||||||||||||
Revenues:
Rental revenue
. Rental revenue increased by $20.1 million for the year ended December 31, 2020, as compared to the year ended December 31, 2019. The increase in revenues was driven primarily by the growth in the size of our real estate investment portfolio, which generated additional rental revenues. Our real estate investment portfolio grew from 1,000 properties, representing $1.9 billion in net investments in real estate, as of December 31, 2019 to 1,181 properties, representing $2.4 billion in net investments in real estate, as of December 31, 2020. Our real estate investments were acquired throughout the periods presented and were not all owned by us for the entirety of the periods; accordingly, a significant portion of the increase in rental revenue between periods is related to recognizing revenue in 2020 on acquisitions that were made during 2019 and 2020. A smaller component of the increase in revenues between periods is related to rent escalations recognized on our leases.
59
Interest on loans and direct financing lease receivables
. Interest on loans and direct financing lease receivables increased by $5.1 million during the year ended December 31, 2020, as compared to the year ended December 31, 2019, primarily due to our investments in loans receivable beginning in 2019 and additional investments in loans receivable during 2020, which led to a
higher average daily balance of loans receivable outstanding during
year ended December 31, 2020.
Other revenue
. Other revenue for the year ended December 31, 2020, decreased by approximately $0.6 million,
as compared to the year ended
December 31, 2019,
primarily due to the receipt of lease termination fees from former tenants during the
year ended December 31, 2019.
No lease termination income was recorded during the year ended
December 31, 2020.
Expenses:
General and administrative expenses.
General and administrative expenses increased $2.7 million for the year ended December 31, 2020, as compared to the year ended December 31, 2019. This increase in general and administrative expenses was primarily due to the increase of personnel due to operating our larger real estate portfolio, including increased equity-based compensation expense, legal fees and directors' fees.
Property expenses
. Property expenses increased by $0.8 million for the year ended December 31, 2020, as compared to the year ended December 31, 2019. The increase in property expenses was primarily due to increased reimbursable costs, insurance expenses and operational costs during the year ended December 31, 2020.
Depreciation and amortization expense
. Depreciation and amortization expense increased by $16.7 million for the year ended December 31, 2020 as compared to the year ended December 31, 2019. Depreciation and amortization expense increased in proportion to the general increase in the size of our real estate portfolio.
Provision for impairment of real estate
. Impairment charges on real estate investments were $8.4 million and $2.9 million, for the years ended December 31, 2020 and 2019, respectively. During the years ended December 31, 2020 and 2019, we recorded a provision for impairment of real estate at 17 and 8 of our real estate investments, respectively. We strategically seek to identify non-performing properties that we may re-lease or dispose of in an effort to improve our returns and manage risk exposure. An increase in vacancy associated with our disposition or re-leasing strategies may trigger impairment charges when the expected future cash flows from the properties from sale or re-lease are less than their net book value.
Other operating income:
Gain on
dispositions
of real estate, net.
Gain on dispositions of real estate, net, decreased by $5.1 million for the year ended December 31, 2020, as compared to the year ended December 31, 2019. We disposed of 49 real estate properties during the year ended December 31, 2020, compared to 37 real estate properties during the year ended December 31, 2019.
Other (expense)/income:
Loss on repayment and repurchase of secured borrowings.
Loss on repayment and repurchase of secured borrowings of $0.9 million during the year ended December 31, 2020 relates to the write-off of deferred financing costs upon our repayment of Class A Series 2017-1 Notes at par value. During the year ended December 31, 2019, we recorded a loss on repurchase Series 2016-1 Notes of $5.2 million, which includes the premium paid on the repurchase, the write-off of deferred financing costs and other associated legal expenses. Furthermore, the repurchased notes were
subsequently
canceled and the Series 2016-1 Notes that remained outstanding were fully repaid in November 2019. This repayment and repurchase were accounted for as debt extinguishments.
Interest expense
. Interest expense increased by
$2.6 million for
the year ended December 31, 2020, as compared to the
year ended
December 31, 2019. This increase in interest expense was primarily due to an increase to debt held during the year ended December 31, 2020 compared to the year ended December 31, 2019. In March 2020, the
Company borrowed the remaining amount of $180.0 million available under its November 2019 Term Loan and used the proceeds to acquire new investments and general corporate purposes.
60
Interest income
. Interest income decreased by $0.3 million for the year ended December 31, 2020, as compared to the year ended December 31, 2019. The decrease in interest income was primarily due lower daily cash balances and interest rates compared to the year ended December 31, 2019.
Income tax expense.
Income tax expense decreased by $0.1 million for the year ended December 31, 2020, as compared to the year ended December 31, 2019. We are organized and operate as a REIT and are generally not subject to U.S. federal taxation. However, the Operating Partnership is subject to taxation in certain state and local jurisdictions that impose income taxes on a partnership. The changes in income tax expense are primarily due to changes in the proportion of our real estate portfolio located in jurisdictions where we are subject to taxation.
Non-GAAP Financial Measures
Our reported results are presented in accordance with GAAP. We also disclose the following non-GAAP financial measures: funds from operations ("FFO"), core funds from operations ("Core FFO"), adjusted funds from operations ("AFFO"), earnings before interest, taxes, depreciation and amortization ("EBITDA"), EBITDA further adjusted to exclude gains (or losses) on sales of depreciable property and real estate impairment losses ("EBITDA
re"
), adjusted EBITDA
re
, annualized adjusted EBITDA
re
, net debt, net operating income ("NOI") and cash NOI ("Cash NOI"). We believe these non-GAAP financial measures are industry measures used by analysts and investors to compare the operating performance of REITs.
We compute FFO in accordance with the definition adopted by the Board of Governors of the National Association of Real Estate Investment Trusts ("NAREIT"). NAREIT defines FFO as GAAP net income or loss adjusted to exclude extraordinary items (as defined by GAAP), net gain or loss from sales of depreciable real estate assets, impairment write-downs associated with depreciable real estate assets and real estate-related depreciation and amortization (excluding amortization of deferred financing costs and depreciation of non-real estate assets), including the pro rata share of such adjustments of unconsolidated subsidiaries. FFO is used by management, and may be useful to investors and analysts, to facilitate meaningful comparisons of operating performance between periods and among our peers primarily because it excludes the effect of real estate depreciation and amortization and net gains and losses on sales (which are dependent on historical costs and implicitly assume that the value of real estate diminishes predictably over time, rather than fluctuating based on existing market conditions).
We compute Core FFO by adjusting FFO, as defined by NAREIT, to exclude certain GAAP income and expense amounts that we believe are infrequent and unusual in nature and/or not related to our core real estate operations. Exclusion of these items from similar FFO-type metrics is common within the equity REIT industry, and management believes that presentation of Core FFO provides investors with a metric to assist in their evaluation of our operating performance across multiple periods and in comparison to the operating performance of our peers, because it removes the effect of unusual items that are not expected to impact our operating performance on an ongoing basis. Core FFO is used by management in evaluating the performance of our core business operations. Items included in calculating FFO that may be excluded in calculating Core FFO include certain transaction related gains, losses, income or expense or other non-core amounts as they occur.
To derive AFFO, we modify our computation of Core FFO to include other adjustments to GAAP net income related to certain items that we believe are not indicative of our operating performance, including straight-line rental revenue, non-cash interest expense, non-cash compensation expense, other amortization and non-cash charges, capitalized interest expense and transaction costs. Such items may cause short-term fluctuations in net income but have no impact on operating cash flows or long-term operating performance. We believe that AFFO is an additional useful supplemental measure for investors to consider when assessing our operating performance without the distortions created by non-cash items and certain other revenues and expenses.
FFO, Core FFO and AFFO do not include all items of revenue and expense included in net income, they do not represent cash generated from operating activities and they are not necessarily indicative of cash available to fund cash requirements; accordingly, they should not be considered alternatives to net income as a performance measure or cash flows from operations as a liquidity measure and should be considered in addition to, and not in lieu of, GAAP financial measures. Additionally, our computation of FFO, Core FFO and AFFO may differ from the methodology for calculating these metrics used by other equity REITs and, therefore, may not be comparable to similarly titled measures reported by other equity REITs.
61
The following table reconciles net income (which is the most comparable GAAP measure) to FFO, Core FFO and AFFO attributable to stockholders and members and non-controlling interests:
| Year ended December 31, | ||||||||||||||||||||
| (in thousands) | 2020 | 2019 | 2018 | |||||||||||||||||
| Net income | $ | 42,528 | $ | 48,025 | $ | 20,614 | ||||||||||||||
| Depreciation and amortization of real estate | 59,309 | 42,649 | 31,335 | |||||||||||||||||
| Provision for impairment of real estate | 8,399 | 2,918 | 4,503 | |||||||||||||||||
| Gain on dispositions of real estate, net | (5,821) | (10,932) | (5,445) | |||||||||||||||||
| FFO attributable to stockholders and members and non-controlling interests | 104,415 | 82,660 | 51,007 | |||||||||||||||||
|
Other non-recurring expenses
(1)(2)
|
2,273 | 7,988 | — | |||||||||||||||||
| Core FFO attributable to stockholders and members and non-controlling interests | 106,688 | 90,648 | 51,007 | |||||||||||||||||
| Adjustments: | ||||||||||||||||||||
| Straight-line rental revenue, net | (11,905) | (12,215) | (8,214) | |||||||||||||||||
| Non-cash interest | 2,040 | 2,738 | 2,798 | |||||||||||||||||
| Non-cash compensation expense | 5,427 | 4,546 | 2,440 | |||||||||||||||||
| Other amortization expense | 3,854 | 815 | 495 | |||||||||||||||||
| Other non-cash charges | 829 | 9 | 84 | |||||||||||||||||
| Capitalized interest expense | (228) | (290) | (225) | |||||||||||||||||
| Transaction costs | 291 | — | 57 | |||||||||||||||||
| AFFO attributable to stockholders and members and non-controlling interests | $ | 106,995 | $ | 86,251 | $ | 48,442 | ||||||||||||||
_____________________________________
(1)
Includes non-recurring expenses of approximately $39,000 related to reimbursement of executive relocation costs, $1.1 million for severance payments and acceleration of non-cash compensation expense in connection with the termination of one of our executive officers, $0.2 million of non-recurring recruiting costs, and our $0.9 million loss on repayment of secured borrowings during the year ended December 31, 2020.
(2)
Includes non-recurring expenses of $2.4 million for costs and charges incurred in connection with the Eldridge secondary offering, $5.2 million loss on repayment and repurchase of secured borrowings and $0.3 million for a provision for settlement of litigation during the year ended December 31, 2019.
We compute EBITDA as earnings before interest, income taxes and depreciation and amortization. In 2017, NAREIT issued a white paper recommending that companies that report EBITDA also report EBITDA
re
. We compute EBITDA
re
in accordance with the definition adopted by NAREIT. NAREIT defines EBITDA
re
as EBITDA (as defined above) excluding gains (or losses) from the sales of depreciable property and real estate impairment losses. We present EBITDA and EBITDA
re
as they are measures commonly used in our industry. We believe that these measures are useful to investors and analysts because they provide supplemental information concerning our operating performance, exclusive of certain non-cash items and other costs. We use EBITDA and EBITDA
re
as measures of our operating performance and not as measures of liquidity.
EBITDA and EBITDA
re
do not include all items of revenue and expense included in net income, they do not represent cash generated from operating activities and they are not necessarily indicative of cash available to fund cash requirements; accordingly, they should not be considered alternatives to net income as a performance measure or cash flows from operations as a liquidity measure and should be considered in addition to, and not in lieu of, GAAP financial measures. Additionally, our computation of EBITDA and EBITDA
re
may differ from the methodology for calculating these metrics used by other equity REITs and, therefore, may not be comparable to similarly titled measures reported by other equity REITs.
62
The following table reconciles net income (which is the most comparable GAAP measure) to EBITDA and EBITDA
re
attributable to stockholders and members and non-controlling interests:
| Year ended December 31, | ||||||||||||||||||||
| (in thousands) | 2020 | 2019 | 2018 | |||||||||||||||||
| Net income | $ | 42,528 | $ | 48,025 | $ | 20,614 | ||||||||||||||
| Depreciation and amortization | 59,446 | 42,745 | 31,352 | |||||||||||||||||
| Interest expense | 29,651 | 27,037 | 30,192 | |||||||||||||||||
| Interest income | (485) | (794) | (930) | |||||||||||||||||
| Income tax expense | 212 | 303 | 195 | |||||||||||||||||
| EBITDA attributable to stockholders and members and non-controlling interests | 131,352 | 117,316 | 81,423 | |||||||||||||||||
| Provision for impairment of real estate | 8,399 | 2,918 | 4,503 | |||||||||||||||||
| Gain on dispositions of real estate, net | (5,821) | (10,932) | (5,445) | |||||||||||||||||
| EBITDAre attributable to stockholders and members and non-controlling interests | $ | 133,931 | $ | 109,302 | $ | 80,481 | ||||||||||||||
We further adjust EBITDA
re
for the most recently completed quarter i) based on an estimate calculated as if all re-leasing, investment and disposition activity that took place during the quarter had been made on the first day of the quarter, ii) to exclude certain GAAP income and expense amounts that we believe are infrequent and unusual in nature and iii) to eliminate the impact of lease termination fees and contingent rental revenue from certain of our tenants, which is subject to sales thresholds specified in the applicable leases ("Adjusted EBITDA
re"
). We then annualize quarterly Adjusted EBITDA
re
by multiplying it by four ("Annualized Adjusted EBITDA
re"
), which we believe provides a meaningful estimate of our current run rate for all of our investments as of the end of the most recently completed quarter. You should not unduly rely on this measure, as it is based on assumptions and estimates that may prove to be inaccurate. Our actual reported EBITDA
re
for future periods may be significantly less than our current Annualized Adjusted EBITDA
re
.
The following table reconciles net income (which is the most comparable GAAP measure) to Annualized Adjusted EBITDA
re
attributable to stockholders and non-controlling interests for the three months ended December 31, 2020:
| (in thousands) | Three months ended December 31, 2020 | |||||||
| Net income | $ | 5,705 | ||||||
| Depreciation and amortization | 19,004 | |||||||
| Interest expense | 7,764 | |||||||
| Interest income | (52) | |||||||
| Income tax expense | 56 | |||||||
| EBITDA attributable to stockholders and members and non-controlling interests | 32,475 | |||||||
| Provision for impairment of real estate | 3,319 | |||||||
| Gain on dispositions of real estate, net | (1,850) | |||||||
| EBITDAre attributable to stockholders and members and non-controlling interests | 33,944 | |||||||
| Adjustment for current quarter re-leasing, acquisition and disposition activity (1) | 4,681 | |||||||
| Adjustment to exclude other non-recurring expenses | 2,826 | |||||||
| Adjustment to exclude lease termination fees and certain percentage rent (2) | — | |||||||
| Adjusted EBITDAre attributable to stockholders and members and non-controlling interests | $ | 41,451 | ||||||
| Annualized Adjusted EBITDAre attributable to stockholders and members and non-controlling interests | $ | 165,805 | ||||||
_____________________________________
(1)
Adjustment assumes all re-leasing activity, investments and dispositions of real estate investments made during the three months ended December 31, 2020 had occurred on October 1, 2020.
(2)
Adjustment is made to exclude non-core expenses added back to compute Core FFO, our provision for loan losses and the write-off of receivables.
63
We calculate our net debt as our gross debt (defined as total debt plus net deferred financing costs on our secured borrowings) less cash and cash equivalents and restricted cash deposits held for the benefit of lenders. We believe excluding cash and cash equivalents and restricted cash deposits held for the benefit of lenders from gross debt, all of which could be used to repay debt, provides an estimate of the net contractual amount of borrowed capital to be repaid, which we believe is a beneficial disclosure to investors and analysts.
The following table reconciles total debt (which is the most comparable GAAP measure) to net debt:
| December 31, | ||||||||||||||
| (in thousands) | 2020 | 2019 | ||||||||||||
| Secured borrowings, net of deferred financing costs | $ | 171,007 | $ | 235,336 | ||||||||||
| Unsecured term loan, net of deferred financing costs | 626,272 | 445,586 | ||||||||||||
| Revolving credit facility | 18,000 | 46,000 | ||||||||||||
| Total debt | 815,279 | 726,922 | ||||||||||||
| Deferred financing costs, net | 5,914 | 8,181 | ||||||||||||
| Gross debt | 821,193 | 735,103 | ||||||||||||
| Cash and cash equivalents | (26,602) | (8,304) | ||||||||||||
| Restricted cash deposits held for the benefit of lenders | (6,388) | (13,015) | ||||||||||||
| Net debt | $ | 788,203 | $ | 713,784 | ||||||||||
We compute NOI as total revenues less property expenses. NOI excludes all other items of expense and income included in the financial statements in calculating net income or loss in accordance with GAAP. Cash NOI further excludes non-cash items included in total revenues and property expenses, such as straight-line rental revenue and other amortization and non-cash charges. We believe NOI and Cash NOI provide useful and relevant information because they reflect only those revenue and expense items that are incurred at the property level and present such items on an unlevered basis.
NOI and Cash NOI are not measures of financial performance under GAAP. You should not consider our NOI and Cash NOI as alternatives to net income or cash flows from operating activities determined in accordance with GAAP. Additionally, our computation of NOI and Cash NOI may differ from the methodology for calculating these metrics used by other equity REITs and, therefore, may not be comparable to similarly titled measures reported by other equity REITs.
The following table reconciles net income (which is the most comparable GAAP measure) to NOI and Cash NOI attributable to stockholders and members and non-controlling interests:
| Year ended December 31, | ||||||||||||||||||||
| (in thousands) | 2020 | 2019 | 2018 | |||||||||||||||||
| Net income | $ | 42,528 | $ | 48,025 | $ | 20,614 | ||||||||||||||
| General and administrative expense | 24,444 | 21,745 | 13,762 | |||||||||||||||||
| Depreciation and amortization | 59,446 | 42,745 | 31,352 | |||||||||||||||||
| Provision for impairment of real estate | 8,399 | 2,918 | 4,503 | |||||||||||||||||
| Provision for loan losses | 830 | — | — | |||||||||||||||||
| Gain on dispositions of real estate, net | (5,821) | (10,932) | (5,445) | |||||||||||||||||
| Loss on repayment and repurchase of secured borrowings | 924 | 5,240 | — | |||||||||||||||||
| Interest expense | 29,651 | 27,037 | 30,192 | |||||||||||||||||
| Interest income | (485) | (794) | (930) | |||||||||||||||||
| Income tax expense | 212 | 303 | 195 | |||||||||||||||||
| NOI attributable to stockholders and members and non-controlling interests | 160,128 | 136,287 | 94,243 | |||||||||||||||||
| Straight-line rental revenue, net | (11,905) | (12,215) | (8,214) | |||||||||||||||||
| Other amortization and non-cash charges | 3,854 | 815 | 495 | |||||||||||||||||
| Cash NOI attributable to stockholders and members and non-controlling interests | $ | 152,077 | $ | 124,887 | $ | 86,524 | ||||||||||||||
64
Item 7A. Quantitative and Qualitative Disclosures About Market Risk.
Over time, we generally seek to match the expected cash inflows from our long-term leases with the expected cash outflows for our long-term debt. To achieve this objective, we borrow on a fixed-rate basis through longer-term debt issuances under our Master Trust Funding Program. Additionally, we incur debt that bears interest at floating rates under the Revolving Credit Facility, which we use in connection with our operations, including for funding investments, the April 2019 Term Loan and the November 2019 Term Loan. We have fixed the floating rates on borrowings under our term loan facilities by entering into interest rate swap agreements where we pay a fixed interest rate and receive a floating interest rate equal to the rate we pay on the respective term loan.
| Principal Outstanding |
Weighted Average Interest Rate
(1)
|
|||||||||||||||||||||||||||||||
| (in thousands) | Maturity Date | December 31, 2020 |
December 31,
2019 |
December 31, 2020 |
December 31,
2019 |
|||||||||||||||||||||||||||
| Unsecured term loans: | ||||||||||||||||||||||||||||||||
| April 2019 Term Loan | April 2024 | $ | 200,000 | $ | 200,000 | 3.3% | 3.3% | |||||||||||||||||||||||||
| November 2019 Term Loan | November 2026 | 430,000 | 250,000 | 3.0% | 3.1% | |||||||||||||||||||||||||||
| Revolving Credit Facility | April 2023 | 18,000 | 46,000 | 1.4% | 3.1% | |||||||||||||||||||||||||||
| Secured borrowings: | ||||||||||||||||||||||||||||||||
| Series 2017-1 Notes | June 2047 | 173,193 | 239,102 | 4.2% | 4.2% | |||||||||||||||||||||||||||
| Total principal outstanding | $ | 821,193 | $ | 735,102 | 3.3% | 3.5% | ||||||||||||||||||||||||||
_______________________________________________________________
(1)
Interest rates are presented after giving effect to our interest rate swap agreements, where applicable.
We have fixed the interest rates on the term loan facilities' variable-rates through the use of interest rate swap agreements. At December 31, 2020, our aggregate liability in the event of the early termination of our swaps was $40.2 million. At December 31, 2020, a 100-basis point increase of the interest rate on this facility would increase our related interest costs by approximately $4.0 million per year and a 100-basis point decrease of the interest rate would decrease our related interest costs by approximately $4.0 million per year.
Additionally, our borrowings under the Revolving Credit Facility bear interest at an annual rate equal to LIBOR plus a leverage-based credit spread. Therefore, an increase or decrease in interest rates would result in an increase or decrease to our interest expense related to the Revolving Credit Facility. We monitor our market interest rate risk exposures using a sensitivity analysis. Our sensitivity analysis estimates the exposure to market risk sensitive instruments assuming a hypothetical adverse change in interest rates. Based on the results of a sensitivity analysis, which assumes a 100-basis point adverse change in interest rates, the estimated market risk exposure for our variable‑rate borrowings under the Revolving Credit Facility was $0.2 million as of December 31, 2020.
We are exposed to interest rate risk between the time we enter into a sale-leaseback transaction or acquire a leased property and the time we finance the related real estate with long-term fixed-rate debt. In addition, when our long-term debt matures, we may have to refinance the debt at a higher interest rate. Market interest rates are sensitive to many factors that are beyond our control. Our interest rate risk management objective is to limit the impact of future interest rate changes on our earnings and cash flows. Additionally, our long-term debt under our Master Trust Funding Program generally provides for some amortization of the principal balance over the term of the debt, which serves to reduce the amount of refinancing risk at debt maturity.
In addition to amounts that we borrow under the Revolving Credit Facility, we may incur variable-rate debt in the future that we do not choose to hedge. Additionally, decreases in interest rates may lead to increased competition for the acquisition of real estate due to a reduction in desirable alternative income-producing investments. Increased competition for the acquisition of real estate may lead to a decrease in the yields on real estate we have targeted for acquisition. In such circumstances, if we are not able to offset the decrease in yields by obtaining lower interest costs on our borrowings, our results of operations will be adversely affected. Significant increases in interest rates may also have an adverse impact on our earnings if we are unable to acquire real estate with rental rates high enough to offset the increase in interest rates on our borrowings.
Fair Value of Fixed-Rate Indebtedness
The estimated fair value of our fixed-rate indebtedness under the Master Trust Funding Program is calculated based primarily on unobservable market inputs such as interest rates and discounted cash flow analyses using
65
estimates of the amount and timing of future cash flows, market rates and credit spreads. The following table discloses fair value information related to our fixed-rate indebtedness as of December 31, 2020:
| (in thousands) |
Carrying
Value
(1)
|
Estimated
Fair Value |
||||||||||||
| Secured borrowings under Master Trust Funding Program | $ | 173,193 | $ | 176,382 | ||||||||||
_______________________________________________________________
(1)
Excludes net deferred financing costs of $2.2 million.
66
Item 8. Financial Statements and Supplementary Data.
Report of Independent Registered Public Accounting Firm
To the Stockholders and the Board of Directors of Essential Properties Realty Trust, Inc.
Opinion on the Financial Statements
We have audited the accompanying consolidated balance sheets of Essential Properties Realty Trust, Inc. as of December 31, 2020 and 2019, the related consolidated statements of operations, comprehensive income, stockholders’/members’ equity and cash flows, for each of the three years in the period ended December 31, 2020 of Essential Properties Realty Trust, Inc. and Essential Properties Realty Trust, Inc. Predecessor (the “Company”), and the related notes and financial statement schedules listed in the Index at Item 15(a) (collectively referred to as the “consolidated financial statements”). In our opinion, the consolidated financial statements present fairly, in all material respects, the financial position of the Company at December 31, 2020 and 2019, and the results of its operations and its cash flows for each of the three years in the period ended December 31, 2020, in conformity with U.S. generally accepted accounting principles.
We also have audited, in accordance with the standards of the Public Company Accounting Oversight Board (United States) (PCAOB), the Company’s internal control over financial reporting as of December 31, 2020, based on criteria established in Internal Control-Integrated Framework issued by the Committee of Sponsoring Organizations of the Treadway Commission (2013 framework) and our report dated February 23, 2021, expressed an unqualified opinion thereon.
Adoption of ASU No. 2016-02
As discussed in Note 2 to the consolidated financial statements, the Company changed its method of accounting for leases in 2020 and 2019 due to the adoption of ASU No. 2016-02,
Leases
.
Basis for Opinion
These financial statements are the responsibility of the Company’s management. Our responsibility is to express an opinion on the Company’s financial statements based on our audits. We are a public accounting firm registered with the PCAOB and are required to be independent with respect to the Company in accordance with the U.S. federal securities laws and the applicable rules and regulations of the Securities and Exchange Commission and the PCAOB.
We conducted our audits in accordance with the standards of the PCAOB. Those standards require that we plan and perform the audit to obtain reasonable assurance about whether the financial statements are free of material misstatement, whether due to error or fraud. Our audits included performing procedures to assess the risks of material misstatement of the financial statements, whether due to error or fraud, and performing procedures that respond to those risks. Such procedures included examining, on a test basis, evidence regarding the amounts and disclosures in the financial statements. Our audits also included evaluating the accounting principles used and significant estimates made by management, as well as evaluating the overall presentation of the financial statements. We believe that our audits provide a reasonable basis for our opinion.
Critical Audit Matters
The critical audit matters communicated below are matters arising from the current period audit of the financial statements that were communicated or required to be communicated to the audit committee and that: (1) relate to accounts or disclosures that are material to the financial statements and (2) involved our especially challenging, subjective or complex judgments. The communication of critical audit matters does not alter in any way our opinion on the consolidated financial statements, taken as a whole, and we are not, by communicating the critical audit matters below, providing separate opinions on the critical audit matters or on the accounts or disclosures to which they relate.
67
| Impairment of Long-Lived Assets | |||||
| Description of the Matter |
At December 31, 2020, the Company’s real estate investments totaled approximately $2.2 billion. As described in Note 2 to the consolidated financial statements, investments in real estate are reviewed for impairment when circumstances indicate that the carrying value of a property may not be recoverable. For the year ended December 31, 2020, the Company recognized a $8.4 million provision for impairment of real estate.
Auditing the Company’s accounting for impairment of real estate investments was especially challenging and involved a high degree of subjectivity as a result of the assumptions and estimates inherent in the determination of estimated future cash flows expected to result from the property’s use and eventual disposition and the estimated fair value of the property. In particular, management’s assumptions and estimates included projected rental rates during the holding period, property capitalization rates, and if applicable, discount rates, which were sensitive to expectations about future operations, market or economic conditions, demand and competition.
|
||||
| How We Addressed the Matter in Our Audit |
We obtained an understanding, evaluated the design, and tested the operating effectiveness of controls over the Company’s real estate investment impairment process. This included testing of controls over management's review of the significant assumptions and data inputs utilized in the estimation of expected future cash flows and the determination of fair value.
To test the Company’s accounting for impairment of real estate investments, we performed audit procedures that included, among others, evaluating the methodologies applied and testing the significant assumptions discussed above and the underlying data used by the Company in its impairment analyses. In certain cases, we involved our valuation specialists to assist in performing these procedures. We compared the significant assumptions used by management to historical data and observable market-specific data. We assessed the precision of management’s process to develop certain assumptions by comparing current assumptions to historical trends. We also performed sensitivity analyses of significant assumptions to evaluate the changes in estimated future cash flows that would result from changes in the assumptions. In addition, we assessed information and events subsequent to the balance sheet date to corroborate certain of the key assumptions utilized by management.
|
||||
68
| Purchase Price Allocation for Acquired Real Estate Investments | |||||
| Description of the Matter |
During 2020, the Company acquired 208 properties for an aggregate purchase price of $526.3 million. As described in Notes 2 and 3 to the consolidated financial statements, the Company allocates the purchase price of acquired properties to tangible and identifiable intangible assets and liabilities based on their relative fair values.
Auditing the Company’s accounting for these acquisitions was especially challenging and involved a high degree of subjectivity as a result of the assumptions and estimates inherent in determining the fair values of the acquired tangible and identifiable intangible assets and liabilities. In particular, management’s significant assumptions and estimates included land prices per square foot, building and site improvements per square foot, terminal capitalization rates, market-based rents and discount rates, which were sensitive to individual market and economic conditions at the date of acquisition.
|
||||
| How We Addressed the Matter in Our Audit |
We obtained an understanding, evaluated the design, and tested the operating effectiveness of controls over management’s processes to determine the fair value of the assets and liabilities acquired for purposes of allocating the purchase price. This included testing of controls over management’s review of the significant assumptions and data inputs utilized in the underlying fair value determinations.
To test the Company’s allocation of purchase price for real estate investments, we involved our real estate valuation specialists and performed audit procedures that included, among others, evaluating the valuation methodologies employed and the significant assumptions utilized to determine the fair value of the acquired tangible and identified intangible assets and liabilities. We compared significant assumptions to third party evidence or other support. In addition, with the support of our valuation specialist, we independently calculated the fair values of certain acquired tangible and identified intangible assets and liabilities and compared the independently calculated values to the fair values developed by the Company. We also tested the completeness and accuracy of the underlying data utilized in the purchase price allocations.
|
||||
/s/ Ernst & Young LLP
We have served as the Company’s auditor since 2017.
New York, New York
February 23, 2021
69
Report of Independent Registered Public Accounting Firm
To the Stockholders and the Board of Directors of Essential Properties Realty Trust, Inc.
Opinion on Internal Control over Financial Reporting
We have audited Essential Properties Realty Trust, Inc.’s internal control over financial reporting as of December 31, 2020, based on criteria established in Internal Control—Integrated Framework issued by the Committee of Sponsoring Organizations of the Treadway Commission (2013 framework) (the COSO criteria). In our opinion, Essential Properties Realty Trust, Inc. (the “Company”) maintained, in all material respects, effective internal control over financial reporting as of December 31, 2020, based on the COSO criteria.
We also have audited, in accordance with the standards of the Public Company Accounting Oversight Board (United States) (PCAOB), the consolidated balance sheets of the Company as of December 31, 2020 and 2019, the related consolidated statements of operations, comprehensive income, stockholders’/members’ equity and cash flows for each of the three years in the period ended December 31, 2020 of the Company and Essential Properties Realty Trust, Inc. Predecessor, and the related notes and financial statement schedules listed in the Index at Item 15(a) and our report dated February 23, 2021 expressed an unqualified opinion thereon.
Basis for Opinion
The Company’s management is responsible for maintaining effective internal control over financial reporting and for its assessment of the effectiveness of internal control over financial reporting included in the accompanying Management’s Report on Internal Control Over Financial Reporting. Our responsibility is to express an opinion on the Company’s internal control over financial reporting based on our audit. We are a public accounting firm registered with the PCAOB and are required to be independent with respect to the Company in accordance with the U.S. federal securities laws and the applicable rules and regulations of the Securities and Exchange Commission and the PCAOB.
We conducted our audit in accordance with the standards of the PCAOB. Those standards require that we plan and perform the audit to obtain reasonable assurance about whether effective internal control over financial reporting was maintained in all material respects.
Our audit included obtaining an understanding of internal control over financial reporting, assessing the risk that a material weakness exists, testing and evaluating the design and operating effectiveness of internal control based on the assessed risk, and performing such other procedures as we considered necessary in the circumstances. We believe that our audit provides a reasonable basis for our opinion.
Definition and Limitations of Internal Control Over Financial Reporting
A company’s internal control over financial reporting is a process designed to provide reasonable assurance regarding the reliability of financial reporting and the preparation of financial statements for external purposes in accordance with generally accepted accounting principles. A company’s internal control over financial reporting includes those policies and procedures that (1) pertain to the maintenance of records that, in reasonable detail, accurately and fairly reflect the transactions and dispositions of the assets of the company; (2) provide reasonable assurance that transactions are recorded as necessary to permit preparation of financial statements in accordance with generally accepted accounting principles, and that receipts and expenditures of the company are being made only in accordance with authorizations of management and directors of the company; and (3) provide reasonable assurance regarding prevention or timely detection of unauthorized acquisition, use, or disposition of the company’s assets that could have a material effect on the financial statements.
Because of its inherent limitations, internal control over financial reporting may not prevent or detect misstatements. Also, projections of any evaluation of effectiveness to future periods are subject to the risk that controls may become inadequate because of changes in conditions, or that the degree of compliance with the policies or procedures may deteriorate.
/s/ Ernst & Young LLP
New York, New York
February 23, 2021
70
ESSENTIAL PROPERTIES REALTY TRUST, INC.
CONSOLIDATED FINANCIAL STATEMENTS
Consolidated Balance Sheets
| December 31, | ||||||||||||||
| (In thousands, except share and per share data) | 2020 | 2019 | ||||||||||||
| ASSETS | ||||||||||||||
| Investments: | ||||||||||||||
| Real estate investments, at cost: | ||||||||||||||
| Land and improvements | $ |
|
$ |
|
||||||||||
| Building and improvements |
|
|
||||||||||||
| Lease incentives |
|
|
||||||||||||
| Construction in progress |
|
|
||||||||||||
| Intangible lease assets |
|
|
||||||||||||
| Total real estate investments, at cost |
|
|
||||||||||||
| Less: accumulated depreciation and amortization |
(
|
(
|
||||||||||||
| Total real estate investments, net |
|
|
||||||||||||
| Loans and direct financing lease receivables, net |
|
|
||||||||||||
| Real estate investments held for sale, net |
|
|
||||||||||||
| Net investments |
|
|
||||||||||||
| Cash and cash equivalents |
|
|
||||||||||||
| Restricted cash |
|
|
||||||||||||
| Straight-line rent receivable, net |
|
|
||||||||||||
| Rent receivables, prepaid expenses and other assets, net |
|
|
||||||||||||
|
Total assets
(1)
|
$ |
|
$ |
|
||||||||||
| LIABILITIES AND EQUITY | ||||||||||||||
| Secured borrowings, net of deferred financing costs | $ |
|
$ |
|
||||||||||
| Unsecured term loans, net of deferred financing costs |
|
|
||||||||||||
| Revolving credit facility |
|
|
||||||||||||
| Intangible lease liabilities, net |
|
|
||||||||||||
| Dividend payable |
|
|
||||||||||||
| Derivative liabilities |
|
|
||||||||||||
| Accrued liabilities and other payables |
|
|
||||||||||||
|
Total liabilities
(1)
|
|
|
||||||||||||
|
Commitments and contingencies (see Note 11)
|
|
|
||||||||||||
| Stockholders' equity: | ||||||||||||||
|
Preferred stock, $
|
|
|
||||||||||||
|
Common stock, $
|
|
|
||||||||||||
| Additional paid-in capital |
|
|
||||||||||||
| Distributions in excess of cumulative earnings |
(
|
(
|
||||||||||||
| Accumulated other comprehensive loss |
(
|
(
|
||||||||||||
| Total stockholders' equity |
|
|
||||||||||||
| Non-controlling interests |
|
|
||||||||||||
| Total equity |
|
|
||||||||||||
| Total liabilities and equity | $ |
|
$ |
|
||||||||||
_____________________________________
(1)
The Company's consolidated balance sheets include assets and liabilities of consolidated variable interest entities ("VIEs"). See Note 2
—Summary of Significant Accounting Policies
. As of December 31, 2020 and 2019, all of the assets and liabilities of the Company were held by its operating partnership, a consolidated VIE, with the exception of $
25.6
million and $
19.3
million, respectively, of dividends payable.
The accompanying notes are an integral part of these consolidated financial statements.
71
ESSENTIAL PROPERTIES REALTY TRUST, INC. AND ESSENTIAL PROPERTIES REALTY TRUST, INC. PREDECESSOR
CONSOLIDATED FINANCIAL STATEMENTS
Consolidated Statements of Operations
| Year ended December 31, | ||||||||||||||||||||
| (In thousands, except share and per share data) | 2020 | 2019 | 2018 | |||||||||||||||||
| Revenues: | ||||||||||||||||||||
| Rental revenue | $ |
|
$ |
|
$ |
|
||||||||||||||
| Interest on loans and direct financing lease receivables |
|
|
|
|||||||||||||||||
| Other revenue, net |
|
|
|
|||||||||||||||||
| Total revenues |
|
|
|
|||||||||||||||||
| Expenses: | ||||||||||||||||||||
| General and administrative |
|
|
|
|||||||||||||||||
| Property expenses |
|
|
|
|||||||||||||||||
| Depreciation and amortization |
|
|
|
|||||||||||||||||
| Provision for impairment of real estate |
|
|
|
|||||||||||||||||
| Provision for loan losses |
|
|
|
|||||||||||||||||
| Total expenses |
|
|
|
|||||||||||||||||
| Other operating income: | ||||||||||||||||||||
| Gain on dispositions of real estate, net |
|
|
|
|||||||||||||||||
| Income from operations |
|
|
|
|||||||||||||||||
| Other (expense)/income: | ||||||||||||||||||||
| Loss on repayment and repurchase of secured borrowings |
(
|
(
|
|
|||||||||||||||||
|
Interest expense (including $
|
(
|
(
|
(
|
|||||||||||||||||
| Interest income |
|
|
|
|||||||||||||||||
| Income before income tax expense |
|
|
|
|||||||||||||||||
| Income tax expense |
|
|
|
|||||||||||||||||
| Net income |
|
|
|
|||||||||||||||||
| Net income attributable to non-controlling interests |
(
|
(
|
(
|
|||||||||||||||||
| Net income attributable to stockholders and members | $ |
|
$ |
|
$ |
|
||||||||||||||
| Year ended December 31, |
Period from
June 25, 2018 to December 31, 2018 |
|||||||||||||||||||
| 2020 | 2019 | |||||||||||||||||||
| Basic weighted average shares outstanding |
|
|
|
|||||||||||||||||
| Basic net income per share | $ |
|
$ |
|
$ |
|
||||||||||||||
| Diluted weighted average shares outstanding |
|
|
|
|||||||||||||||||
| Diluted net income per share | $ |
|
$ |
|
$ |
|
||||||||||||||
The accompanying notes are an integral part of these consolidated financial statements.
72
ESSENTIAL PROPERTIES REALTY TRUST, INC. AND ESSENTIAL PROPERTIES REALTY TRUST, INC. PREDECESSOR
CONSOLIDATED FINANCIAL STATEMENTS
Consolidated Statements of Comprehensive Income
| Year ended December 31, | ||||||||||||||||||||
| (In thousands) | 2020 | 2019 | 2018 | |||||||||||||||||
| Net income | $ |
|
$ |
|
$ |
|
||||||||||||||
| Other comprehensive loss: | ||||||||||||||||||||
| Unrealized loss on cash flow hedges |
(
|
(
|
|
|||||||||||||||||
| Cash flow hedge losses (gains) reclassified to interest expense |
|
(
|
|
|||||||||||||||||
| Total other comprehensive loss |
(
|
(
|
|
|||||||||||||||||
| Comprehensive income |
|
|
|
|||||||||||||||||
| Net income attributable to non-controlling interests |
(
|
(
|
(
|
|||||||||||||||||
| Adjustment for cash flow hedge losses (gains) attributable to non-controlling interests |
|
|
|
|||||||||||||||||
| Comprehensive income attributable to stockholders and members | $ |
|
$ |
|
$ |
|
||||||||||||||
The accompanying notes are an integral part of these consolidated financial statements.
73
ESSENTIAL PROPERTIES REALTY TRUST, INC. AND ESSENTIAL PROPERTIES REALTY TRUST, INC. PREDECESSOR
CONSOLIDATED FINANCIAL STATEMENTS
Consolidated Statements of Stockholders'/Members' Equity
| Common Stock | ||||||||||||||||||||||||||||||||||||||||||||||||||||||||||||||||||||||||||
| (In thousands, except share data) |
Number of
Shares |
Par
Value |
Additional
Paid-In Capital |
Distributions in Excess of Cumulative
Earnings |
Accumulated
Other Comprehensive Income (Loss) |
Class A
Units |
Class B
Units |
Class C
Units |
Class D
Units |
Total Stockholders' /Members' Equity |
Non-
Controlling Interests |
Total
Equity |
||||||||||||||||||||||||||||||||||||||||||||||||||||||||||||||
| Balance at December 31, 2017 |
|
$ |
|
$ |
|
$ |
|
$ |
|
$ |
|
$ |
|
$ |
|
$ |
|
$ |
|
$ |
|
$ |
|
|||||||||||||||||||||||||||||||||||||||||||||||||||
| Contributions | — | — | — | — | — |
|
— | — | — |
|
— |
|
||||||||||||||||||||||||||||||||||||||||||||||||||||||||||||||
| Unit compensation expense | — | — | — | — | — | — |
|
— |
|
|
— |
|
||||||||||||||||||||||||||||||||||||||||||||||||||||||||||||||
| Net income | — | — | — | — | — |
|
— |
|
— |
|
— |
|
||||||||||||||||||||||||||||||||||||||||||||||||||||||||||||||
| Balance at June 24, 2018 |
|
|
|
|
|
|
|
|
|
|
|
|
||||||||||||||||||||||||||||||||||||||||||||||||||||||||||||||
| Contribution of Predecessor equity in exchange for OP Units | — | — | — | — | — |
(
|
(
|
(
|
(
|
(
|
|
|
||||||||||||||||||||||||||||||||||||||||||||||||||||||||||||||
| Initial public offering |
|
|
|
— | — | — | — | — | — |
|
— |
|
||||||||||||||||||||||||||||||||||||||||||||||||||||||||||||||
| Concurrent private placement of common stock |
|
|
|
— | — | — | — | — | — |
|
— |
|
||||||||||||||||||||||||||||||||||||||||||||||||||||||||||||||
| Concurrent private placement of OP Units | — | — | — | — | — | — | — | — | — | — |
|
|
||||||||||||||||||||||||||||||||||||||||||||||||||||||||||||||
| Costs related to initial public offering | — | — |
(
|
— | — | — | — | — | — |
(
|
— |
(
|
||||||||||||||||||||||||||||||||||||||||||||||||||||||||||||||
| Share-based compensation expense |
|
— |
|
— | — | — | — | — | — |
|
— |
|
||||||||||||||||||||||||||||||||||||||||||||||||||||||||||||||
| Unit-based compensation expense | — | — |
|
— | — | — | — | — | — |
|
— |
|
||||||||||||||||||||||||||||||||||||||||||||||||||||||||||||||
| Dividends declared on common stock and OP Units | — | — | — |
(
|
— | — | — | — | — |
(
|
(
|
(
|
||||||||||||||||||||||||||||||||||||||||||||||||||||||||||||||
| Net income | — | — | — |
|
— | — | — | — | — |
|
|
|
||||||||||||||||||||||||||||||||||||||||||||||||||||||||||||||
| Balance at December 31, 2018 |
|
|
|
(
|
|
|
|
|
|
|
|
|
||||||||||||||||||||||||||||||||||||||||||||||||||||||||||||||
| Common stock issuance |
|
|
|
— | — | — | — | — | — |
|
— |
|
||||||||||||||||||||||||||||||||||||||||||||||||||||||||||||||
| Costs related to issuance of common stock | — | — |
(
|
— | — | — | — | — | — |
(
|
— |
(
|
||||||||||||||||||||||||||||||||||||||||||||||||||||||||||||||
| Conversion of equity in Secondary Offering |
|
|
|
— | — | — | — | — | — |
|
(
|
|
||||||||||||||||||||||||||||||||||||||||||||||||||||||||||||||
| Unrealized losses on cash flow hedges | — | — | — | — |
(
|
— | — | — | — |
(
|
(
|
(
|
||||||||||||||||||||||||||||||||||||||||||||||||||||||||||||||
| Cash flow hedge gains reclassified to interest expense | — | — | — | — |
(
|
— | — | — | — |
(
|
(
|
(
|
||||||||||||||||||||||||||||||||||||||||||||||||||||||||||||||
| Share-based compensation expense |
|
|
|
— | — | — | — | — | — |
|
— |
|
||||||||||||||||||||||||||||||||||||||||||||||||||||||||||||||
| Unit-based compensation expense | — | — |
|
— | — | — | — | — | — |
|
— |
|
||||||||||||||||||||||||||||||||||||||||||||||||||||||||||||||
| Dividends declared on common stock and OP Units | — | — | — |
(
|
— | — | — | — | — |
(
|
(
|
(
|
||||||||||||||||||||||||||||||||||||||||||||||||||||||||||||||
| Net income | — | — | — |
|
— | — | — | — | — |
|
|
|
||||||||||||||||||||||||||||||||||||||||||||||||||||||||||||||
| Balance at December 31, 2019 |
|
|
|
(
|
(
|
|
|
|
|
|
|
|
||||||||||||||||||||||||||||||||||||||||||||||||||||||||||||||
| — | — | — |
(
|
— |
(
|
(
|
(
|
|||||||||||||||||||||||||||||||||||||||||||||||||||||||||||||||||||
| Common stock issuance |
|
|
|
— | — | — | — | — | — |
|
— |
|
||||||||||||||||||||||||||||||||||||||||||||||||||||||||||||||
| Costs related to issuance of common stock | — | — |
(
|
— | — | — | — | — | — |
(
|
— |
(
|
||||||||||||||||||||||||||||||||||||||||||||||||||||||||||||||
| Unrealized losses on cash flow hedges | — | — | — | — |
(
|
— | — | — | — |
(
|
(
|
(
|
||||||||||||||||||||||||||||||||||||||||||||||||||||||||||||||
| Cash flow hedge losses reclassified to interest expense | — | — | — | — |
|
— | — | — | — |
|
|
|
||||||||||||||||||||||||||||||||||||||||||||||||||||||||||||||
| Share-based compensation expense |
|
|
|
— | — | — | — | — | — |
|
— |
|
||||||||||||||||||||||||||||||||||||||||||||||||||||||||||||||
| Dividends declared on common stock and OP Units | — | — | — |
(
|
— | — | — | — | — |
(
|
(
|
(
|
||||||||||||||||||||||||||||||||||||||||||||||||||||||||||||||
| Net income | — | — | — |
|
— | — | — | — | — |
|
|
|
||||||||||||||||||||||||||||||||||||||||||||||||||||||||||||||
| Balance at December 31, 2020 |
|
$ |
|
$ |
|
$ |
(
|
$ |
(
|
$ |
|
$ |
|
$ |
|
$ |
|
$ |
|
$ |
|
$ |
|
|||||||||||||||||||||||||||||||||||||||||||||||||||
The accompanying notes are an integral part of these consolidated financial statements.
74
ESSENTIAL PROPERTIES REALTY TRUST, INC. AND ESSENTIAL PROPERTIES REALTY TRUST, INC. PREDECESSOR
CONSOLIDATED FINANCIAL STATEMENTS
Consolidated Statements of Cash Flows
| Year ended December 31, | ||||||||||||||||||||
| (In thousands) | 2020 | 2019 | 2018 | |||||||||||||||||
| Cash flows from operating activities: | ||||||||||||||||||||
| Net income | $ |
|
$ |
|
$ |
|
||||||||||||||
| Adjustments to reconcile net income to net cash provided by operating activities: | ||||||||||||||||||||
| Depreciation and amortization |
|
|
|
|||||||||||||||||
| Amortization of lease incentive |
|
|
|
|||||||||||||||||
| Amortization of above/below market leases and right of use assets, net |
|
|
|
|||||||||||||||||
| Amortization of deferred financing costs and other assets |
|
|
|
|||||||||||||||||
| Loss on repurchase and retirement of secured borrowings |
|
|
|
|||||||||||||||||
| Provision for impairment of real estate |
|
|
|
|||||||||||||||||
| Provision for loan losses |
|
|
|
|||||||||||||||||
| Gain on dispositions of investments, net |
(
|
(
|
(
|
|||||||||||||||||
| Straight-line rent receivable |
(
|
(
|
(
|
|||||||||||||||||
| Equity-based compensation expense |
|
|
|
|||||||||||||||||
| Adjustment to rental revenue for tenant credit/allowance for doubtful accounts |
|
|
|
|||||||||||||||||
| Changes in other assets and liabilities: | ||||||||||||||||||||
| Rent receivables, prepaid expenses and other assets |
(
|
|
(
|
|||||||||||||||||
| Accrued liabilities and other payables |
|
|
(
|
|||||||||||||||||
| Net cash provided by operating activities |
|
|
|
|||||||||||||||||
| Cash flows from investing activities: | ||||||||||||||||||||
| Proceeds from sales of investments, net |
|
|
|
|||||||||||||||||
| Principal collections on loans and direct financing lease receivables |
|
|
|
|||||||||||||||||
| Investments in loans receivable |
(
|
(
|
(
|
|||||||||||||||||
| Deposits for prospective real estate investments |
|
|
(
|
|||||||||||||||||
| Investment in real estate, including capital expenditures |
(
|
(
|
(
|
|||||||||||||||||
| Investment in construction in progress |
(
|
(
|
(
|
|||||||||||||||||
| Lease incentives paid |
(
|
(
|
(
|
|||||||||||||||||
| Net cash used in investing activities |
(
|
(
|
(
|
|||||||||||||||||
| Cash flows from financing activities: | ||||||||||||||||||||
| Proceeds from issuance of notes payable to related parties |
|
|
|
|||||||||||||||||
| Payments of principal on notes payable to related parties |
|
|
(
|
|||||||||||||||||
| Repurchase and repayment of secured borrowings |
(
|
(
|
(
|
|||||||||||||||||
| Principal received on repurchased secured borrowings |
|
|
|
|||||||||||||||||
| Borrowings under term loan facilities |
|
|
|
|||||||||||||||||
| Borrowings under revolving credit facility |
|
|
|
|||||||||||||||||
| Repayments under revolving credit facility |
(
|
(
|
|
|||||||||||||||||
| Deferred financing costs |
(
|
(
|
(
|
|||||||||||||||||
| Capital contributions by members in Predecessor |
|
|
|
|||||||||||||||||
| Proceeds from issuance of common stock, net |
|
|
|
|||||||||||||||||
| Offering costs |
(
|
(
|
(
|
|||||||||||||||||
| Proceeds from concurrent private placement of OP Units |
|
|
|
|||||||||||||||||
| Proceeds from concurrent private placement of common stock |
|
|
|
|||||||||||||||||
| Dividends paid |
(
|
(
|
(
|
|||||||||||||||||
| Net cash provided by financing activities |
|
|
|
|||||||||||||||||
| Net increase (decrease) in cash and cash equivalents and restricted cash |
|
|
(
|
|||||||||||||||||
| Cash and cash equivalents and restricted cash, beginning of period |
|
|
|
|||||||||||||||||
| Cash and cash equivalents and restricted cash, end of period | $ |
|
$ |
|
$ |
|
||||||||||||||
| Reconciliation of cash and cash equivalents and restricted cash: | ||||||||||||||||||||
| Cash and cash equivalents | $ |
|
$ |
|
$ |
|
||||||||||||||
| Restricted cash |
|
|
|
|||||||||||||||||
| Cash and cash equivalents and restricted cash, end of period | $ |
|
$ |
|
$ |
|
||||||||||||||
The accompanying notes are an integral part of these consolidated financial statements.
75
ESSENTIAL PROPERTIES REALTY TRUST, INC. AND ESSENTIAL PROPERTIES REALTY TRUST, INC. PREDECESSOR
CONSOLIDATED FINANCIAL STATEMENTS
Consolidated Statements of Cash Flows (continued)
| Year ended December 31, | ||||||||||||||||||||
| (In thousands) | 2020 | 2019 | 2018 | |||||||||||||||||
| Supplemental disclosure of cash flow information: | ||||||||||||||||||||
| Cash paid for interest, net of amounts capitalized | $ |
|
$ |
|
$ |
|
||||||||||||||
| Cash paid for income taxes |
|
|
|
|||||||||||||||||
| Non-cash investing and financing activities: | ||||||||||||||||||||
| Adjustment upon adoption of ASC 326 | $ |
|
$ |
|
$ |
|
||||||||||||||
| Reclassification from construction in progress upon project completion |
|
|
|
|||||||||||||||||
| Net settlement of proceeds on the sale of investments |
|
|
|
|||||||||||||||||
| Non-cash investments in loan receivable activity |
(
|
|
|
|||||||||||||||||
| Lease liabilities arising from the recognition of right of use assets |
|
|
|
|||||||||||||||||
| Unrealized losses on cash flow hedges |
|
|
|
|||||||||||||||||
| Contribution of Predecessor equity in exchange for OP Units |
|
|
|
|||||||||||||||||
| Conversion of equity in Secondary Offering |
|
|
|
|||||||||||||||||
| Payable and accrued offering costs |
|
|
|
|||||||||||||||||
| Discounts and fees on capital raised through issuance of common stock |
|
|
|
|||||||||||||||||
| Payable and accrued deferred financing costs |
|
|
|
|||||||||||||||||
| Dividends declared |
|
|
|
|||||||||||||||||
The accompanying notes are an integral part of these consolidated financial statements.
76
Notes to Consolidated Financial Statements
December 31, 2020
1.
Organization
Description of Business
Essential Properties Realty Trust, Inc. (the “Company”) is an internally managed real estate company that acquires, owns and manages primarily single-tenant properties that are net leased on a long-term basis to middle-market companies operating service-oriented or experience-based businesses. The Company generally invests in and leases freestanding, single-tenant commercial real estate facilities where a tenant services its customers and conducts activities that are essential to the generation of the tenant’s sales and profits.
The Company was organized on January 12, 2018 as a Maryland corporation. It elected to be taxed as a real estate investment trust (“REIT”) for federal income tax purposes beginning with the year ended December 31, 2018, and it believes that its current organizational and operational status and intended distributions will allow it to continue to so qualify. Substantially all of the Company’s business is conducted directly and indirectly through its operating partnership, Essential Properties, L.P. (the “Operating Partnership”).
On June 25, 2018, the Company completed the initial public offering (“IPO”) of its common stock. The common stock of the Company is listed on the New York Stock Exchange under the ticker symbol “EPRT”. See Note 7—Equity for additional information.
COVID-19 Pandemic
On March 11, 2020, the World Health Organization declared the outbreak of the novel coronavirus (“COVID-19”) a pandemic. The global spread of COVID-19 has created significant uncertainty and economic disruption, which is likely to persist, or increase, for a period of unknown duration. The pandemic has adversely affected the Company and its tenants, and the full extent to which it will adversely affect the Company’s financial condition, liquidity, and results of operations is impossible to predict and depends on evolving factors, including the duration and scope of the pandemic, and governmental and social responses thereto.
The Company is closely monitoring the impact of COVID-19 on all aspects of its business, including its portfolio and the creditworthiness of its tenants. As the pandemic intensified at the end of the first quarter of 2020, the Company adopted a more cautious investment strategy, as it placed an increased emphasis on liquidity, prudent balance sheet management and financial flexibility.
The Company has entered into deferral agreements with certain of its tenants, and during the year ended December 31, 2020, recognized $
12.4
million of contractual base rent related to these agreements as a component of rental revenue in its consolidated statement of operations. These rent deferrals were negotiated on a tenant-by-tenant basis, and, in general, allow a tenant to defer all or a portion of its rent for a portion of 2020, with all of the deferred rent to be paid to the Company pursuant to a schedule that generally extends up to
24
months from the original due date of the deferred rent. It is possible that the existing deterioration, or further deterioration, in the Company's tenants’ ability to operate their businesses, or delays in the supply of products or services to the Company's tenants from vendors that they need to operate their businesses, caused by COVID-19 or otherwise, will cause the Company's tenants to be unable or unwilling to meet their contractual obligations to the Company, including the payment of rent (including deferred rent), or to request further rent deferrals or other concessions. The likelihood of this would increase if COVID-19 intensifies or persists for a prolonged period. To the extent COVID-19 causes a secular change in consumer behavior that reduces patronage of service-based and/or experience-based businesses, many of the Company's tenants would be adversely affected and their ability to meet their obligations to us could be further impaired. These deferrals reduce the Company's cash flow from operations, reduce its cash available for distribution and adversely affect its ability to make cash distributions to common stockholders. Furthermore, if tenants are unable to pay their deferred rent, the Company will not receive cash in the future in accordance with its expectations.
77
2.
Summary of Significant Accounting Policies
Reclassification
Certain amounts previously reported in the consolidated balance sheets and statements of operations have been reclassified to conform with the current period by presenting derivative liabilities separate from accrued liabilities and other payables and by presenting interest expense as a component of other expense/income.
Use of Estimates
The preparation of the consolidated financial statements in conformity with GAAP requires management to make estimates and assumptions that affect the reported amounts of assets and liabilities and disclosure of contingent assets and liabilities at the date of the consolidated financial statements and the reported amounts of revenue and expenses during the reporting period. Actual results could differ from those estimates.
Real Estate Investments
Investments in real estate are carried at cost less accumulated depreciation and impairment losses. The cost of investments in real estate reflects their purchase price or development cost. The Company evaluates each acquisition transaction to determine whether the acquired asset meets the definition of a business. Under Accounting Standards Update ("ASU") 2017-1,
Business Combinations (Topic 805): Clarifying the Definition of a Business
, an acquisition does not qualify as a business when there is no substantive process acquired or substantially all of the fair value is concentrated in a single identifiable asset or group of similar identifiable assets or the acquisition does not include a substantive process in the form of an acquired workforce or an acquired contract that cannot be replaced without significant cost, effort or delay. Transaction costs related to acquisitions that are asset acquisitions are capitalized as part of the cost basis of the acquired assets, while transaction costs for acquisitions that are deemed to be acquisitions of a business are expensed as incurred. Improvements and replacements are capitalized when they extend the useful life or improve the productive capacity of the asset. Costs of repairs and maintenance are expensed as incurred.
The Company allocates the purchase price of acquired properties accounted for as asset acquisitions to tangible and identifiable intangible assets or liabilities based on their relative fair values. Tangible assets may include land, site improvements and buildings. Intangible assets may include the value of in-place leases and above- and below-market leases and other identifiable intangible assets or liabilities based on lease or property specific characteristics.
The Company incurs various costs in the leasing and development of its properties. Amounts paid to tenants that incentivize them to extend or otherwise amend an existing lease or to sign a new lease agreement are capitalized to lease incentives on the Company's consolidated balance sheets. Tenant improvements are capitalized to building and improvements within the Company's consolidated balance sheets. Costs incurred which are directly related to properties under development, which include pre-construction costs essential to the development of the property, development costs, construction costs, interest costs and real estate taxes and insurance, are capitalized during the period of development as construction in progress. After the determination is made to capitalize a cost, it is allocated to the specific component of a project that benefited. Determination of when a development project
78
commences, and capitalization begins, and when a development project has reached substantial completion, and is available for occupancy and capitalization must cease, involves a degree of judgment. The Company does not engage in speculative real estate development. The Company does, however, opportunistically agree to reimburse certain of its tenants for development costs at its properties in exchange for contractually-specified rent that generally increases proportionally with its funding.
The fair value of the tangible assets of an acquired property with an in-place operating lease is determined by valuing the property as if it were vacant, and the "as-if-vacant" value is then allocated to the tangible assets based on the fair value of the tangible assets. The fair value of in-place leases is determined by considering estimates of carrying costs during the expected lease-up periods, current market conditions, as well as costs to execute similar leases based on the specific characteristics of each tenant's lease. The Company estimates the cost to execute leases with terms similar to the remaining lease terms of the in-place leases, including leasing commissions, legal and other related expenses. Factors the Company considers in this analysis include an estimate of the carrying costs during the expected lease-up periods considering current market conditions and costs to execute similar leases. In estimating carrying costs, the Company includes real estate taxes, insurance and other operating expenses, and estimates of lost rentals at market rates during the expected lease-up periods, which primarily range from
to
12
months. The fair value of above- or below-market leases is recorded based on the net present value (using a discount rate that reflects the risks associated with the leases acquired) of the difference between the contractual amount to be paid pursuant to the in-place lease and the Company's estimate of the fair market lease rate for the corresponding in-place lease, measured over the remaining non-cancelable term of the lease including any below-market fixed rate renewal options for below-market leases.
In making estimates of fair values for purposes of allocating purchase price, the Company uses a number of sources, including real estate valuations prepared by independent valuation firms. The Company also considers information and other factors including market conditions, the industry that the tenant operates in, characteristics of the real estate (e.g., location, size, demographics, value and comparative rental rates), tenant credit profile and the importance of the location of the real estate to the operations of the tenant's business. Additionally, the Company considers information obtained about each property as a result of its pre-acquisition due diligence, marketing and leasing activities in estimating the fair value of the tangible and intangible assets acquired. The Company uses the information obtained as a result of its pre-acquisition due diligence as part of its consideration of the accounting standard governing asset retirement obligations and, when necessary, will record an asset retirement obligation as part of the purchase price allocation.
Real estate investments that are intended to be sold are designated as "held for sale" on the consolidated balance sheets at the lesser of carrying amount and fair value less estimated selling costs. Real estate investments are no longer depreciated when they are classified as held for sale. If the disposal, or intended disposal, of certain real estate investments represents a strategic shift that has had or will have a major effect on the Company's operations and financial results, the operations of such real estate investments would be presented as discontinued operations in the consolidated statements of operations for all applicable periods.
Depreciation and Amortization
Depreciation is computed using the straight-line method over the estimated useful lives of up to
40
years for buildings and
15
years for site improvements.
The Company recorded the following amounts of depreciation expense on its real estate investments during the periods presented:
| Year ended December 31, | ||||||||||||||||||||
| (in thousands) | 2020 | 2019 | 2018 | |||||||||||||||||
| Depreciation on real estate investments | $ |
|
$ |
|
$ |
|
||||||||||||||
Lease incentives are amortized on a straight-line basis as a reduction of rental income over the remaining non-cancellable terms of the respective leases. If a tenant terminates its lease, the unamortized portion of the lease incentive is charged to rental revenue. Construction in progress is not depreciated until the development has reached substantial completion. Tenant improvements are depreciated over the non-cancellable term of the related lease or their estimated useful life, whichever is shorter.
Capitalized above-market lease values are amortized on a straight-line basis as a reduction of rental revenue over the remaining non-cancellable terms of the respective leases. Capitalized below-market lease values are
79
accreted on a straight-line basis as an increase to rental revenue over the remaining non-cancellable terms of the respective leases including any below-market fixed rate renewal option periods.
Capitalized above-market ground lease values are accreted as a reduction of property expenses over the remaining terms of the respective leases. Capitalized below-market ground lease values are amortized as an increase to property expenses over the remaining terms of the respective leases and any expected below-market renewal option periods where renewal is considered probable.
The value of in-place leases, exclusive of the value of above-market and below-market lease intangibles, is amortized to depreciation and amortization expense on a straight-line basis over the remaining periods of the respective leases.
If a tenant terminates its lease, the unamortized portion of each intangible, including in-place lease values, is charged to depreciation and amortization expense, while above- and below-market lease adjustments are recorded within rental revenue in the consolidated statements of operations.
Direct Financing Lease Receivables
Certain of the Company's real estate investment transactions are accounted for as direct financing leases. The Company records the direct financing lease receivables at their net investment, determined as the aggregate minimum lease payments and the estimated non-guaranteed residual value of the leased property less unearned income. The unearned income is recognized over the term of the related lease so as to produce a constant rate of return on the net investment in the asset. The Company's investment in direct financing lease receivables is reduced over the applicable lease term to its non-guaranteed residual value by the portion of rent allocated to the direct financing lease receivables. Subsequent to the adoption of ASC 842,
Leases
("ASC 842"), existing direct financing lease receivables will continue to be accounted for in the same manner, unless the underlying contracts are modified.
Impairment of Long-Lived Assets
If circumstances indicate that the carrying value of a property may not be recoverable, the Company reviews the property for impairment. This review is based on an estimate of the future undiscounted cash flows, excluding interest charges, expected to result from the property’s use and eventual disposition. These estimates consider factors such as expected future operating income, market and other applicable trends and residual value, as well as
80
The Company recorded the following provisions for impairment of long lived assets during the periods presented:
| Year ended December 31, | ||||||||||||||||||||
| (in thousands) | 2020 | 2019 | 2018 | |||||||||||||||||
| Provision for impairment of real estate | $ |
|
$ |
|
$ |
|
||||||||||||||
Cash and Cash Equivalents
Cash and cash equivalents includes cash in the Company’s bank accounts. The Company considers all cash balances and highly liquid investments with original maturities of three months or less to be cash and cash equivalents. The Company deposits cash with high quality financial institutions. These deposits are guaranteed by the Federal Deposit Insurance Corporation (“FDIC”) up to an insurance limit.
As of December 31, 2020 and 2019, the Company had deposits of $
26.6
million and $
8.3
million, respectively, of which $
26.4
million and $
8.1
million, respectively, were in excess of the amount insured by the FDIC. Although the Company bears risk with respect to amounts in excess of those insured by the FDIC, it does not anticipate any losses as a result.
Restricted Cash
Restricted cash primarily consists of cash held with the trustee for the Company’s Master Trust Funding Program (as defined in Note 5—Long Term Debt). This restricted cash is used to make principal and interest payments on the Company’s secured borrowings, to pay trust expenses and to invest in future real estate investments which will be pledged as collateral under the Master Trust Funding Program. See Note 5—Long Term Debt for further discussion.
Adjustment to Rental Revenue/Allowance for Doubtful Accounts
The Company continually reviews receivables related to rent and unbilled rent receivables and determines collectability by taking into consideration the tenant’s payment history, the financial condition of the tenant, business conditions in the industry in which the tenant operates and economic conditions in the area in which the property is located. Prior to January 1, 2019, if the collectability of a receivable was in doubt, the accounts receivable and straight-line rent receivable balances were reduced by an allowance for doubtful accounts on the consolidated balance sheets or a direct write-off of the receivable was recorded in the consolidated statements of operations. The provision for doubtful accounts was included in property expenses in the Company’s consolidated statements of operations. If the accounts receivable balance or straight-line rent receivable balance was subsequently deemed to be uncollectible, such receivable amounts were written-off to the allowance for doubtful accounts.
Subsequent to January 1, 2019, if the assessment of the collectability of substantially all payments due under a lease changes from probable to not probable, any difference between the rental revenue recognized to date and the lease payments that have been collected is recognized as a current period reduction of rental revenue in the consolidated statements of operations.
The Company recorded the following amounts as adjustments to rental revenue or allowance for doubtful accounts during the periods presented:
| Year ended December 31, | ||||||||||||||||||||
| (in thousands) | 2020 | 2019 | 2018 | |||||||||||||||||
| Adjustment to rental revenue/allowance for doubtful accounts | $ |
|
$ |
|
$ |
|
||||||||||||||
81
Deferred Financing Costs
Financing costs related to establishing the Company’s 2018 Credit Facility and Revolving Credit Facility (as defined below) were deferred and are being amortized as an increase to interest expense in the consolidated statements of operations over the term of the facility and are reported as a component of rent receivables, prepaid expenses and other assets, net on the consolidated balance sheets.
Financing costs related to the issuance of the Company’s secured borrowings under the Master Trust Funding Program, the April 2019 Term Loan and the November 2019 Term Loan (each as defined below) were deferred and are being amortized as an increase to interest expense in the consolidated statements of operations over the term of the related debt instrument and are reported as a reduction of the related debt balance on the consolidated balance sheets.
Derivative Instruments
In the normal course of business, the Company uses derivative financial instruments, which may include interest rate swaps, caps, options, floors and other interest rate derivative contracts, to protect the Company against adverse fluctuations in interest rates by reducing its exposure to variability in cash flows on a portion of the Company’s floating-rate debt. Instruments that meet these hedging criteria are formally designated as hedges at the inception of the derivative contract. The Company records all derivatives on the consolidated balance sheets at fair value. The accounting for changes in the fair value of derivatives depends on the intended use of the derivative, whether the Company has elected to designate a derivative in a hedging relationship and apply hedge accounting and whether the hedging relationship has satisfied the criteria necessary to apply hedge accounting. Derivatives designated and qualifying as a hedge of the exposure to variability in expected future cash flows, or other types of forecasted transactions, are considered cash flow hedges. Hedge accounting generally provides for the matching of the timing of gain or loss recognition on the hedging instrument with the recognition of the changes in the fair value of the hedged asset or liability that are attributable to the hedged risk in a fair value hedge or the earnings effect of the hedged forecasted transactions in a cash flow hedge. The Company may also enter into derivative contracts that are intended to economically hedge certain risk, even though hedge accounting does not apply or the Company elects not to apply hedge accounting.
The accounting for subsequent changes in the fair value of these derivatives depends on whether each has been designed and qualifies for hedge accounting treatment. If a derivative is designated and qualifies for cash flow hedge accounting treatment, the change in the estimated fair value of the derivative is recorded in other comprehensive income (loss) in the consolidated statements of comprehensive income to the extent that it is effective. Any ineffective portion of a change in derivative fair value is immediately recorded in earnings. If the Company elects not to apply hedge accounting treatment (or for derivatives that do not qualify as hedges), any change in the fair value of such derivative instruments would be recognized immediately as a gain or loss on derivative instruments in the consolidated statements of operations.
Fair Value Measurement
The Company estimates fair value of financial and non-financial assets and liabilities based on the framework established in fair value accounting guidance. Fair value is defined as the price that would be received to sell an asset or paid to transfer a liability in an orderly transaction between market participants at the measurement date (an exit price). The hierarchy described below prioritizes inputs to the valuation techniques used in measuring the fair value of assets and liabilities. This hierarchy maximizes the use of observable inputs and minimizes the use of unobservable inputs by requiring the most observable inputs to be used when available. The hierarchy is broken down into three levels based on the reliability of inputs as follows:
Level 1—Quoted prices in active markets for identical assets and liabilities that the Company has the ability to access at the measurement date.
Level 2—Inputs other than quoted prices included within Level 1 that are observable for the asset and liability or can be corroborated with observable market data for substantially the entire contractual term of the asset or liability.
82
Revenue Recognition
The Company’s rental revenue is primarily rent received from tenants. Rent from tenants is recorded in accordance with the terms of each lease on a straight-line basis over the non-cancellable initial term of the lease from the later of the date of the commencement of the lease and the date of acquisition of the property subject to the lease. Rental revenue recognition begins when the tenant controls the space and continues through the term of the related lease. Because substantially all of the leases provide for rental increases at specified intervals, the Company records a straight-line rent receivable and recognizes revenue on a straight-line basis through the expiration of the non-cancelable term of the lease. The Company considers whether the collectability of rents is reasonably assured in determining the amount of straight-line rent to record.
Generally, the Company’s leases provide the tenant with one or more multi-year renewal options, subject to generally the same terms and conditions provided under the initial lease term, including rent increases. If economic incentives make it reasonably certain that an option period to extend the lease will be exercised, the Company will include these options in determining the non-cancelable term of the lease.
The Company defers rental revenue related to lease payments received from tenants in advance of their due dates. These amounts are presented within accrued liabilities and other payables on the Company’s consolidated balance sheets.
Certain properties in the Company’s investment portfolio are subject to leases that provide for contingent rent based on a percentage of the tenant’s gross sales. For these leases, the Company recognizes contingent rental revenue when the threshold upon which the contingent lease payment is based is actually reached.
The Company recorded the following amounts as contingent rent, which are included as a component of rental revenue in the Company's consolidated statements of operations, during the periods presented:
| Year ended December 31, | ||||||||||||||||||||
| (in thousands) | 2020 | 2019 | 2018 | |||||||||||||||||
| Contingent rent | $ |
|
$ |
|
$ |
|
||||||||||||||
Offering Costs
In connection with the completion of equity offerings, the Company incurs legal, accounting and other offering-related costs. Such costs are deducted from the gross proceeds of each equity offering when the offering is completed. As of December 31, 2020 and 2019, the Company had capitalized a total of $
67.2
million and $
49.0
million, respectively, of such costs in the Company’s consolidated balance sheets. These costs are presented as a reduction of additional paid-in capital as of December 31, 2020 and 2019.
Legal, accounting and other offering-related costs incurred in connection with the Secondary Offering (as defined below) were expensed when incurred and were recorded within general and administrative expense in the Company’s consolidated statements of operations.
Income Taxes
The Company elected and qualified to be taxed as a REIT under sections 856 through 860 of the Internal Revenue Code of 1986, as amended, commencing with its taxable year ended December 31, 2018. REITs are subject to a number of organizational and operational requirements, including a requirement that 90% of ordinary “REIT taxable income” (as determined without regard to the dividends paid deduction or net capital gains) be distributed. As a REIT, the Company will generally not be subject to U.S. federal income tax to the extent that it meets the organizational and operational requirements and its distributions equal or exceed REIT taxable income. For the period subsequent to the effective date of its REIT election, the Company continues to meet the organizational and operational requirements and expects distributions to exceed REIT taxable income. Accordingly, no provision has been made for U.S. federal income taxes. Even though the Company has elected and qualifies for taxation as a REIT, it may be subject to state and local income and franchise taxes, and to federal income and
83
excise tax on its undistributed income. Franchise taxes and federal excise taxes on the Company’s undistributed income, if any, are included in general and administrative expenses on the accompanying consolidated statements of operations. Additionally, taxable income from non-REIT activities managed through the Company's taxable REIT subsidiary is subject to federal, state, and local taxes.
The Company analyzes its tax filing positions in all of the U.S. federal, state and local tax jurisdictions where it is required to file income tax returns, as well as for all open tax years in such jurisdictions. The Company follows a two-step process to evaluate uncertain tax positions. Step one, recognition, occurs when an entity concludes that a tax position, based solely on its technical merits, is more-likely-than-not to be sustained upon examination. Step two, measurement, determines the amount of benefit that is more-likely-than-not to be realized upon settlement. Derecognition of a tax position that was previously recognized would occur when the Company subsequently determines that a tax position no longer meets the more-likely-than-not threshold of being sustained. The use of a valuation allowance as a substitute for derecognition of tax positions is prohibited.
As of December 31, 2020 and 2019, the Company had no accruals recorded for uncertain tax positions. The Company’s policy is to classify interest expense and penalties relating to taxes in general and administrative expense in the consolidated statements of operations. During the years ended December 31, 2020, 2019 and 2018, the Company recorded de minimis interest or penalties relating to taxes, and there were no interest or penalties with respect to taxes accrued as of December 31, 2020 or 2019. The 2019, 2018, 2017 and 2016 taxable years remain open to examination by federal and/or state taxing jurisdictions to which the Company is subject.
Equity-Based Compensation
The Company grants shares of restricted common stock and restricted share units (“RSUs”) to its directors, executive officers and other employees that vest over specified time periods, subject to the recipient’s continued service. The Company also grants performance-based RSUs to its executive officers, the final number of which is determined based on objective and subjective performance conditions and which vest over a multi-year period, subject to the recipient’s continued service. The Company accounts for the restricted common stock and RSUs in accordance with ASC 718, Compensation – Stock Compensation, which requires that such compensation be recognized in the financial statements based on its estimated grant-date fair value. The value of such awards is recognized as compensation expense in general and administrative expenses in the accompanying consolidated statements of operations over the applicable service periods.
The Company recognizes compensation expense for equity-based compensation using the straight-line method based on the terms of the individual grant. Forfeitures of equity-based compensation awards, if any, are recognized as they occur.
Variable Interest Entities
The Financial Accounting Standards Board (“FASB”) provides guidance for determining whether an entity is a variable interest entity (a “VIE”). VIEs are defined as entities in which equity investors do not have the characteristics of a controlling financial interest or do not have sufficient equity at risk for the entity to finance its activities without additional subordinated financial support. A VIE is required to be consolidated by its primary beneficiary, which is the party that (i) has the power to control the activities that most significantly impact the VIE’s economic performance and (ii) has the obligation to absorb losses, or the right to receive benefits, of the VIE that could potentially be significant to the VIE.
The Company has concluded that the Operating Partnership is a VIE of which the Company is the primary beneficiary, as the Company has the power to direct the activities that most significantly impact the economic performance of the Operating Partnership. Substantially all of the Company’s assets and liabilities are held by the Operating Partnership. The assets and liabilities of the Operating Partnership are consolidated and reported as assets and liabilities on the Company’s consolidated balance sheets as of December 31, 2020 and 2019.
Additionally, the Company has concluded that certain entities to which it has provided mortgage loans are VIEs because the entities' equity was not sufficient to finance their activities without additional subordinated financial
84
support.
The following table presents information about the Company’s mortgage loan-related VIEs as of the dates presented:
| December 31, | ||||||||||||||||||||
| (Dollars in thousands) | 2020 | 2019 | 2018 | |||||||||||||||||
| Number of VIEs |
|
|
|
|||||||||||||||||
| Aggregate carrying value | $ |
|
$ |
|
$ |
|
||||||||||||||
Reportable Segments
ASC Topic 280, Segment Reporting, establishes standards for the manner in which enterprises report information about operating segments. Substantially all of the Company's investments, at acquisition, are comprised of real estate owned that is leased to tenants on a long-term basis. Therefore, the Company aggregates these investments for reporting purposes and operates in
one
reportable segment.
Recent Accounting
Developments
In February 2016, the FASB issued ASU 2016-13,
Measurement of Credit Losses on Financial Instruments
(“ASU 2016-13”) establishing ASC 326, as amended by subsequent ASUs on the topic. ASU 2016-13 is effective for interim and annual reporting periods in fiscal years beginning after December 15, 2019. The Company adopted this guidance on January 1, 2020 and recorded estimates of expected loss on its loans and direct financing lease receivable portfolio beginning on that date, as discussed above.
In August 2017, the FASB issued ASU 2017-12,
Derivatives and Hedging (Topic 815): Targeted Improvements to Accounting for Hedging Activities
(“ASU 2017-12”), which amends and simplifies existing guidance in order to allow companies to more accurately present the economic effects of risk management activities in the financial statements. The Company adopted ASU 2017-12 while accounting for its initial interest rate swaps in 2019 (see Note 6—Derivative and Hedging Activities). As the Company did not have other derivatives outstanding at time of adoption, no prior period adjustments were required. Pursuant to the provisions of ASU 2017-12, the Company is no longer required to separately measure and recognize hedge ineffectiveness. Instead, the Company recognizes the entire change in the fair value of cash flow hedges included in the assessment of hedge effectiveness in other comprehensive (loss) income. The amounts recorded in other comprehensive (loss) income will subsequently be reclassified to earnings when the hedged item affects earnings. The adoption of ASU 2017-12 did not have a material impact on the Company’s consolidated financial statements.
In August 2018, the FASB issued ASU 2018-13,
Fair Value Measurement: Changes to the Disclosure Requirements for Fair Value
Measurement
(“ASU 2018-13”), which changes the disclosure requirements for fair value measurements by removing, adding and modifying certain disclosures. ASU 2018-13 is effective for annual periods beginning after December 15, 2019, with early adoption permitted. The Company adopted this guidance on January 1, 2020 and the adoption of ASU 2018-13 did not have a material impact on the Company’s related disclosures.
In March 2020, the FASB issued ASU 2020-4,
Reference Rate Reform
(Topic 848)
(“ASU 2020-4”). ASU 2020-4 contains practical expedients for reference rate reform related activities that impact debt, leases, derivatives and other contracts. The guidance in ASU 2020-4 is optional and may be elected over time as reference rate reform activities occur. During the first quarter of 2020, the Company elected to apply the hedge accounting expedients related to probability and the assessments of effectiveness for future LIBOR-indexed cash flows to assume that the index upon which future hedged transactions will be based matches the index on the corresponding derivatives. Application of these expedients preserves the presentation of derivatives consistent with past presentation. The Company continues to evaluate the impact of the guidance and may apply other elections as applicable as additional changes in the market occur.
85
In April 2020, the FASB staff issued a question and answer document (the “Lease Modification Q&A”) focused on the application of lease accounting guidance to lease concessions provided as a result of the COVID-19 pandemic. Under existing lease guidance, the entity would have to determine, on a lease by lease basis, if a lease concession was the result of a new arrangement reached with the tenant, which would be accounted for under the lease modification framework, or if a lease concession was under the enforceable rights and obligations that existed in the original lease, which would be accounted for outside the lease modification framework. The Lease Modification Q&A provides entities with the option to elect to account for lease concessions as though the enforceable rights and obligations existed in the original lease. This election is only available when total cash flows resulting from the modified lease are substantially similar to or less than the cash flows in the original lease. The Company made this election and accounts for rent deferrals by increasing its rent receivables as receivables accrue and continuing to recognize income during the deferral period, resulting in $
12.4
million of deferrals being recognized in rental revenues for the year ended December 31, 2020. Lease concessions or amendments other than rent deferrals are evaluated to determine if a substantive change to the consideration in the original lease contract has occurred and should be accounted for as a lease modification. The Company continues to evaluate any amounts recognized for collectability, regardless of whether accounted for as a lease modification or not, and records an adjustment to rental income for tenant credit for amounts that are not probable of collection. For lease concessions granted in conjunction with the COVID-19 pandemic, the Company reviewed all amounts recognized on a tenant-by-tenant basis for collectability.
In August 2020, the FASB issued Accounting Standards Update (“ASU”) 2020-06, “Debt – Debt with Conversion and Other Options (Subtopic 470-20) and Derivatives and Hedging – Contracts in Entity’s Own Equity (Subtopic 815-40): Accounting for Convertible Instruments and Contracts in an Entity’s Own Equity” (“ASU 2020-06”). The guidance in ASU 2020-06 simplifies the accounting for convertible debt and convertible preferred stock by removing the requirements to separately present certain conversion features in equity. In addition, the amendments in the ASU 2020-06 also simplify the guidance in ASC Subtopic 815-40, Derivatives and Hedging: Contracts in Entity’s Own Equity, by removing certain criteria that must be satisfied in order to classify a contract as equity, which is expected to decrease the number of freestanding instruments and embedded derivatives accounted for as assets or liabilities. Finally, the amendments revise the guidance on calculating earnings per share, requiring use of the if-converted method for all convertible instruments and rescinding an entity’s ability to rebut the presumption of share settlement for instruments that may be settled in cash or other assets. The amendments in ASU 2020-06 are effective for the Company for fiscal years beginning after December 15, 2021. Early adoption is permitted, but no earlier than fiscal years beginning after December 15, 2020. The guidance must be adopted as of the beginning of the fiscal year of adoption. The Company is currently evaluating the impact of this new guidance.
3.
Investments
The following table presents information about the Company’s real estate investment portfolio as of each date presented:
| December 31, | ||||||||||||||
| 2020 | 2019 | |||||||||||||
|
Owned properties
(1)
|
|
|
||||||||||||
|
Properties securing investments in mortgage loans
(2)
|
|
|
||||||||||||
|
Ground lease interests
(3)
|
|
|
||||||||||||
| Total number of investments |
|
|
||||||||||||
_____________________________________
(1)
Includes
11
and
8
properties which are subject to leases accounted for as direct financing leases or loans as of December 31, 2020 and 2019, respectively.
(2)
Properties secure
8
and
6
mortgage loans receivable as of December 31, 2020 and 2019, respectively.
(3)
Includes
one
building which is subject to a lease accounted for as a direct financing lease as of December 31, 2020 and 2019.
86
The following table presents information about the Company’s gross investment portfolio as of each date presented:
| December 31, | ||||||||||||||
| (in thousands) | 2020 | 2019 | ||||||||||||
| Gross investment portfolio: | ||||||||||||||
| Real estate investments, at cost |
|
|
||||||||||||
| Loans and direct financing lease receivables, net |
|
|
||||||||||||
| Real estate investments held for sale, net |
|
|
||||||||||||
| Total gross investments | $ |
|
$ |
|
||||||||||
As of December 31, 2020 and 2019,
258
and
355
of these investments, comprising $
399.7
million and $
601.3
million, respectively, of gross investments, were assets of consolidated special purpose entity subsidiaries and were pledged as collateral under the non-recourse obligations of the Company’s Master Trust Funding Program. (See Note 5—Long Term Debt.)
Acquisitions in 2020 and 2019
The following table presents information about the Company’s acquisition activity during the years ended December 31, 2020 and 2019:
| Year ended December 31, | ||||||||||||||
| (Dollars in thousands) | 2020 | 2019 | ||||||||||||
| Ownership type | (1) | (2) | ||||||||||||
| Number of properties |
|
|
||||||||||||
| Purchase price allocation: | ||||||||||||||
| Land and improvements | $ |
|
$ |
|
||||||||||
| Building and improvements |
|
|
||||||||||||
|
Construction in progress
(3)
|
|
|
||||||||||||
| Intangible lease assets |
|
|
||||||||||||
| Total purchase price |
|
|
||||||||||||
| Intangible lease liabilities |
(
|
(
|
||||||||||||
| Purchase price (including acquisition costs) | $ |
|
$ |
|
||||||||||
_____________________________________
(1)
During the year ended December 31, 2020, the Company acquired the fee interest in
206
properties and acquired
two
properties subject to ground lease arrangements.
(2)
During the year ended December 31, 2019, the Company acquired the fee interest in
279
properties and acquired
two
properties subject to ground lease arrangements.
During the years ended December 31, 2020 and 2019, the Company did
no
t have any investments that individually represented more than 5% of the Company’s total investment activity.
87
Gross Investment Activity
During the years ended December 31, 2020, 2019 and 2018, the Company had the following gross investment activity:
| (Dollar amounts in thousands) |
Number of
Investment Locations |
Dollar
Amount of Investments |
||||||||||||
| Gross investments, December 31, 2017 |
|
$ |
|
|||||||||||
| Acquisitions of and additions to real estate investments |
|
|
||||||||||||
| Sales of investments in real estate |
(
|
(
|
||||||||||||
| Relinquishment of properties at end of ground lease term |
(
|
(
|
||||||||||||
|
Provisions for impairment of real estate
(1)
|
— |
(
|
||||||||||||
|
Investments in loans receivable
(2)(3)
|
|
|
||||||||||||
| Principal collections on and settlements of loans and direct financing lease receivables |
|
(
|
||||||||||||
| Other | — |
(
|
||||||||||||
| Gross investments, December 31, 2018 |
|
|
||||||||||||
| Acquisitions of and additions to real estate investments |
|
|
||||||||||||
| Sales of investments in real estate |
(
|
(
|
||||||||||||
| Relinquishment of properties at end of ground lease term |
(
|
(
|
||||||||||||
|
Provisions for impairment of real estate
(4)
|
— |
(
|
||||||||||||
| Investments in loans receivable |
|
|
||||||||||||
| Principal collections on and settlements of loans and direct financing lease receivables |
(
|
(
|
||||||||||||
| Other | — |
(
|
||||||||||||
| Gross investments, December 31, 2019 |
|
|
||||||||||||
| Acquisitions of and additions to real estate investments |
|
|
||||||||||||
| Sales of investments in real estate |
(
|
(
|
||||||||||||
| Relinquishment of properties at end of ground lease term |
(
|
(
|
||||||||||||
|
Provisions for impairment of real estate
(5)
|
— |
(
|
||||||||||||
|
Investments in loans receivable
(6)
|
|
|
||||||||||||
| Principal collections on and settlements of loans and direct financing lease receivables |
|
(
|
||||||||||||
| Other | — |
(
|
||||||||||||
| Gross investments, December 31, 2020 |
|
|
||||||||||||
|
Less: Accumulated depreciation and amortization
(7)
|
— |
(
|
||||||||||||
| Net investments, December 31, 2020 |
|
$ |
|
|||||||||||
_____________________________________________
(1)
During the year ended December 31, 2018, the Company identified and recorded provisions for impairment at
7
vacant and
14
tenanted properties. The amount in the table above excludes $
40,000
related to intangible lease liabilities for these assets.
(2)
Includes a $
3.5
million of loan receivable made to the purchaser of one real estate property as of December 31, 2018.
(3)
Excludes improvements at one property securing a $
3.2
million development construction loan as the land at this location is included in acquisitions of and additions to real estate investments for 2018.
(4)
During the year ended December 31, 2019, the Company identified and recorded provisions for impairment at
1
vacant and
7
tenanted properties.
(5)
During the year ended December 31, 2020, the Company identified and recorded provisions for impairment at
7
vacant and
10
tenanted properties.
(6)
During the year ended December 31, 2020, the Company invested in
25
properties that secured
five
of its loans receivable for an aggregate investment of $
57.0
million.
(7)
Includes $
112.1
million of accumulated depreciation as of December 31, 2020.
88
Real Estate Investments
The Company's investment properties are leased to tenants under long-term operating leases that typically include one or more renewal options. See Note 4—Leases for more information about the Company's leases.
Loans and Direct Financing Lease Receivables
As of December 31, 2020 and 2019, the Company had
13
and
seven
loans receivable outstanding, with an aggregate carrying amount of $
150.8
million and $
89.6
million, respectively. The maximum amount of loss due to credit risk is the Company's current principal balance of $
150.8
million as of December 31, 2020.
The Company's loans receivable principal portfolio as of December 31, 2020 and 2019 are summarized below (dollars in thousands):
| Loan Type | Monthly Payment | Number of Secured Properties | Effective Interest Rate | Stated Interest Rate | Maturity Date | December 31, | ||||||||||||||||||||||||||||||||||||||
| 2020 | 2019 | |||||||||||||||||||||||||||||||||||||||||||
|
Mortgage
(2)(3)
|
I/O |
|
|
|
2039 | $ |
|
$ |
|
|||||||||||||||||||||||||||||||||||
|
Mortgage
(3)
|
P+I |
|
|
|
2059 |
|
|
|||||||||||||||||||||||||||||||||||||
|
Mortgage
(2)
|
I/O |
|
|
|
2039 |
|
|
|||||||||||||||||||||||||||||||||||||
|
Mortgage
(2)
|
I/O |
|
|
|
2034 |
|
|
|||||||||||||||||||||||||||||||||||||
|
Mortgage
(2)
|
I/O |
|
|
|
2034 |
|
|
|||||||||||||||||||||||||||||||||||||
|
Mortgage
(2)
|
I/O |
|
|
|
2040 |
|
|
|||||||||||||||||||||||||||||||||||||
|
Mortgage
(2)
|
I/O |
|
|
|
2021 |
|
|
|||||||||||||||||||||||||||||||||||||
|
Mortgage
(2)
|
I/O |
|
|
|
2022 |
|
|
|||||||||||||||||||||||||||||||||||||
|
Mortgage
(2)
|
I/O |
|
|
|
2035 |
|
|
|||||||||||||||||||||||||||||||||||||
| Leasehold interest | P+I |
|
|
(4) | 2039 |
|
|
|||||||||||||||||||||||||||||||||||||
| Leasehold interest | P+I |
|
|
(5) | 2034 |
|
|
|||||||||||||||||||||||||||||||||||||
| Leasehold interest | P+I |
|
|
(5) | 2034 |
|
|
|||||||||||||||||||||||||||||||||||||
| Leasehold interest | P+I |
|
|
(5) | 2038 |
|
|
|||||||||||||||||||||||||||||||||||||
| Net investment | $ |
|
$ |
|
||||||||||||||||||||||||||||||||||||||||
________________________________________________
(1)
I/O: Interest Only; P+I: Principal and Interest
(2)
Loan requires monthly payments of interest only with a balloon payment due at maturity.
(3)
Loan allows for prepayments in whole or in part without penalty.
(4)
This leasehold interest is accounted for as a loan receivable, as the lease for
two
land parcels contains an option for the lessee to repurchase the leased parcels in 2024 or 2025.
(5)
These leasehold interests are accounted for as loans receivable, as the leases for each property contain an option for the relevant lessee to repurchase the leased property in the future.
89
Scheduled principal payments due to be received under the Company's loans receivable as of December 31, 2020 are as follows:
| (in thousands) | Loans Receivable | |||||||
| 2021 | $ |
|
||||||
| 2022 |
|
|||||||
| 2023 |
|
|||||||
| 2024 |
|
|||||||
| 2025 |
|
|||||||
| Thereafter |
|
|||||||
| Total | $ |
|
||||||
As of December 31, 2020 and 2019, the Company had $
2.4
million and $
2.6
million of net investments accounted for as direct financing lease receivables, respectively.
The components of the investments accounted for as direct financing lease receivables were as follows:
| December 31, | ||||||||||||||
| (in thousands) | 2020 | 2019 | ||||||||||||
| Minimum lease payments receivable | $ |
|
$ |
|
||||||||||
| Estimated unguaranteed residual value of leased assets |
|
|
||||||||||||
| Unearned income from leased assets |
(
|
(
|
||||||||||||
| Net investment | $ |
|
$ |
|
||||||||||
| (in thousands) | Future Minimum Base Rental Payments | |||||||
| 2021 | $ |
|
||||||
| 2022 |
|
|||||||
| 2023 |
|
|||||||
| 2024 |
|
|||||||
| 2025 |
|
|||||||
| Thereafter |
|
|||||||
| Total | $ |
|
||||||
Allowance for Loan Losses
As discussed in Note
2—Summary of Significant Accounting Policies
, the Company utilizes a RELEM model which estimates losses on loans and direct financing
lease
receivables for purposes of calculating an allowance for loan losses.
As of December 31, 2020, the Company recorded an allowance for loan losses of $
1.0
million. Changes in the Company’s allowance for loan losses are presented within provision for loan losses in the Company’s consolidated statements of operations.
90
For the year ended December 31, 2020, the changes to allowance for loan losses were as follows:
| (in thousands) | Loans and Direct Financing Lease Receivables | |||||||
| Balance at December 31, 2019 | $ |
|
||||||
| Cumulative-effect adjustment upon adoption of ASC 326 |
|
|||||||
|
Current period provision for expected credit losses
(1)
|
|
|||||||
| Write-offs charged |
|
|||||||
| Recoveries |
|
|||||||
| Balance at December 31, 2020 | $ |
|
||||||
_____________________________________
(1)
The increase in expected credit losses is due to the changes in assumptions regarding current macroeconomic factors related to COVID and our investment in new loans receivable during the period.
The significant credit quality indicators for the Company’s loans and direct financing lease receivables measured at amortized cost, were as follows as of December 31, 2020:
| Amortized Cost Basis by Origination Year | ||||||||||||||||||||||||||||||||||||||
| (in thousands) | 2020 | 2019 | 2018 | 2017 | 2016 | Total Amortized Costs Basis | ||||||||||||||||||||||||||||||||
| Credit Quality Indicator: | ||||||||||||||||||||||||||||||||||||||
| LTV <60% | $ |
|
$ |
|
$ |
|
$ |
|
$ |
|
$ |
|
||||||||||||||||||||||||||
| LTV 60%-70% |
|
|
|
|
|
|
||||||||||||||||||||||||||||||||
| LTV >70% |
|
|
|
|
|
|
||||||||||||||||||||||||||||||||
| $ |
|
$ |
|
$ |
|
$ |
|
$ |
|
$ |
|
|||||||||||||||||||||||||||
Real Estate Investments Held for Sale
The Company continually evaluates its portfolio of real estate investments and may elect to dispose of investments considering criteria
including
, but not limited to, tenant concentration, tenant credit quality, tenant operation type (e.g., industry, sector or concept), unit-level financial performance, local market conditions and lease rates, associated indebtedness and asset location. Real estate investments held for sale are expected to be sold within twelve months.
The following table shows the activity in real estate investments held for sale and intangible lease liabilities held for sale during the years ended December 31, 2020 and 2019:
| (Dollar amounts in thousands) |
Number of
Properties |
Real Estate
Investments |
Intangible Lease
Liabilities |
Net Carrying
Value |
||||||||||||||||||||||
| Held for sale balance, December 31, 2018 |
|
$ |
|
$ |
|
$ |
|
|||||||||||||||||||
| Transfers to held for sale classification |
|
|
|
|
||||||||||||||||||||||
| Sales |
(
|
(
|
|
(
|
||||||||||||||||||||||
| Transfers to held and used classification |
|
|
|
|
||||||||||||||||||||||
| Held for sale balance, December 31, 2019 |
|
|
|
|
||||||||||||||||||||||
| Transfers to held for sale classification |
|
|
|
|
||||||||||||||||||||||
| Sales |
(
|
(
|
|
(
|
||||||||||||||||||||||
| Transfers to held and used classification |
|
|
|
|
||||||||||||||||||||||
| Held for sale balance, December 31, 2020 |
|
$ |
|
$ |
|
$ |
|
|||||||||||||||||||
Significant Concentrations
The Company did not have any tenants (including for this purpose, all affiliates of such tenants) whose rental revenue for the years ended December 31, 2020, 2019 or 2018 represented 10% or more of total rental revenue in the Company's consolidated statements of operations.
91
The following table lists the states where the rental revenue from the properties in that state during the periods presented represented 10% or more of total rental revenue in the Company's consolidated statements of operations:
| Year ended December 31, | ||||||||||||||||||||
| State | 2020 | 2019 | 2018 | |||||||||||||||||
| Texas |
|
|
|
|||||||||||||||||
| Georgia |
|
|
|
|||||||||||||||||
Intangible Assets and Liabilities
Intangible assets and liabilities consisted of the following as of the dates presented:
| December 31, 2020 | December 31, 2019 | |||||||||||||||||||||||||||||||||||||
| (in thousands) |
Gross
Carrying Amount |
Accumulated
Amortization |
Net
Carrying Amount |
Gross
Carrying Amount |
Accumulated
Amortization |
Net
Carrying Amount |
||||||||||||||||||||||||||||||||
| Intangible assets: | ||||||||||||||||||||||||||||||||||||||
| In-place leases | $ |
|
$ |
|
$ |
|
$ |
|
$ |
|
$ |
|
||||||||||||||||||||||||||
| Intangible market lease assets |
|
|
|
|
|
|
||||||||||||||||||||||||||||||||
| Total intangible assets | $ |
|
$ |
|
$ |
|
$ |
|
$ |
|
$ |
|
||||||||||||||||||||||||||
| Intangible market lease liabilities | $ |
|
$ |
|
$ |
|
$ |
|
$ |
|
$ |
|
||||||||||||||||||||||||||
| Years Remaining | |||||
| In-place leases |
|
||||
| Intangible market lease assets |
|
||||
| Total intangible assets |
|
||||
| Intangible market lease liabilities |
|
||||
| Year ended December 31, | ||||||||||||||||||||
| (in thousands) | 2020 | 2019 | 2018 | |||||||||||||||||
|
Amortization of in-place leases
(1)
|
$ |
|
$ |
|
$ |
|
||||||||||||||
|
Amortization (accretion) of market lease intangibles, net
(2)
|
|
|
|
|||||||||||||||||
|
Amortization (accretion) of above- and below-market ground lease intangibles, net
(3)
|
(
|
(
|
(
|
|||||||||||||||||
______________________________________________________
(1)
Reflected within depreciation and amortization expense.
(2)
Reflected within rental revenue.
(3)
Reflected within property expenses.
92
The following table provides the estimated amortization of in-place lease assets to be recognized as a component of depreciation and amortization expense for the next five years and thereafter:
| (in thousands) | In-Place Lease Assets | |||||||
| 2021 | $ |
|
||||||
| 2022 |
|
|||||||
| 2023 |
|
|||||||
| 2024 |
|
|||||||
| 2025 |
|
|||||||
| Thereafter |
|
|||||||
| Total | $ |
|
||||||
The following table provides the estimated net amortization of above- and below-market lease intangibles to be recognized as a component of rental revenue for the next five years and thereafter:
| (in thousands) | Above Market Lease Asset | Below Market Lease Liabilities | Net Adjustment to Rental Revenue | |||||||||||||||||
| 2021 | $ |
(
|
$ |
|
$ |
(
|
||||||||||||||
| 2022 |
(
|
|
(
|
|||||||||||||||||
| 2023 |
(
|
|
(
|
|||||||||||||||||
| 2024 |
(
|
|
(
|
|||||||||||||||||
| 2025 |
(
|
|
(
|
|||||||||||||||||
| Thereafter |
(
|
|
|
|||||||||||||||||
| Total | $ |
(
|
$ |
|
$ |
|
||||||||||||||
4
. Leases
As Lessor
The Company’s investment properties are leased to tenants under long-term operating leases that typically include one or more tenant renewal options. The Company’s leases provide for annual base rental payments (generally payable in monthly installments), and generally provide for increases in rent based on fixed contractual terms or as a result of increases in the Consumer Price Index.
Substantially all of the leases are triple-net, which means that the lessees are responsible for paying all property operating expenses, including maintenance, insurance, utilities, property taxes and, if applicable, ground rent expense; therefore, the Company is generally not responsible for repairs or other capital expenditures related to the properties while the triple-net leases are in effect and, at the end of the lease term, the lessees are responsible for returning the property to the Company in a substantially similar condition as when they took possession. Some of the Company’s leases provide that in the event the Company wishes to sell the property subject to that lease, it first must offer the lessee the right to purchase the property on the same terms and conditions as any offer which it intends to accept for the sale of the property.
93
Scheduled future minimum base rental payments due to be received under the remaining non-cancelable term of the operating leases in place as of December 31, 2020 were as follows:
| (in thousands) |
Future Minimum Base
Rental Receipts |
|||||||
| 2021 | $ |
|
||||||
| 2022 |
|
|||||||
| 2023 |
|
|||||||
| 2024 |
|
|||||||
| 2025 |
|
|||||||
| Thereafter |
|
|||||||
| Total | $ |
|
||||||
Since lease renewal periods are exercisable at the option of the lessee, the preceding table presents future minimum base rental payments to be received during the initial non-cancelable lease term only. In addition, the future minimum lease payments exclude contingent rent payments, as applicable, that may be collected from certain tenants based on provisions related to performance thresholds and exclude increases in annual rent based on future changes in the Consumer Price Index, among other items.
The fixed and variable components of lease revenues for the years ended December 31, 2020, 2019, and 2018 were as follows:
| Year ended December 31, | ||||||||||||||||||||
| (in thousands) | 2020 | 2019 | 2018 | |||||||||||||||||
| Fixed lease revenues | $ |
|
$ |
|
$ |
|
||||||||||||||
|
Variable lease revenues
(1)
|
|
|
|
|||||||||||||||||
|
Total lease revenues
(2)
|
$ |
|
$ |
|
$ |
|
||||||||||||||
_____________________________________
(1)
Includes contingent rent based on a percentage of the tenant’s gross sales and costs paid by the Company for which it is reimbursed by its tenants.
(2)
Excludes the amortization and accretion of above- and below-market lease intangible assets and liabilities and lease incentives and the adjustment to rental revenue for tenant credit.
As Lessee
The Company has a number of ground leases, an office lease and other equipment leases which are classified as operating leases. On January 1, 2019, the Company recorded $
4.8
million of right of use ("ROU") assets and lease liabilities related to these operating leases. The Company's ROU assets were reduced by $
0.1
million of accrued rent expense reclassified from accrued liabilities and other payables and $
1.2
million of acquired above-market lease liabilities, net, reclassified from intangible lease liabilities, net and increased by $
0.1
million of acquired below-market lease assets, net, reclassified from intangible lease assets, net of accumulated depreciation and amortization and $
0.2
million of prepaid lease payments. As of December 31, 2020, the Company's ROU assets and lease liabilities were $
6.4
million and $
8.8
million, respectively. As of December 31, 2019, the Company's ROU assets and lease liabilities were $
4.8
million and $
7.5
million, respectively.
The discount rate applied to measure each ROU asset and lease liability is based on the Company's incremental borrowing rate ("IBR"). The Company considers the general economic environment and its historical borrowing activity and factors in various financing and asset specific adjustments to ensure the IBR is appropriate to the intended use of the underlying lease. As the Company did not elect to apply hindsight, lease term assumptions determined under ASC 840 were carried forward and applied in calculating the lease liabilities recorded under ASC 842. Certain of the Company's ground leases offer renewal options which it assesses against relevant economic factors to determine whether it is reasonably certain of exercising or not exercising the option. Lease payments associated with renewal periods that the Company is reasonably certain will be exercised, if any, are included in the measurement of the corresponding lease liability and ROU asset.
94
The following table sets forth information related to the measurement of the Company's lease liabilities as of the dates presented:
| December 31, 2020 | December 31, 2019 | |||||||||||||
| Weighted average remaining lease term (in years) |
|
|
||||||||||||
| Weighted average discount rate |
|
|
||||||||||||
The Company recognizes rent expense on its ground leases as a component of property expenses and rent expense on its office lease and other equipment leases as a component of general and administrative expense on its consolidated statements of operations. At certain of these ground leased properties, the Company’s lease as lessor of the building directly obligates the building lessee to pay rents due under the ground lease to the ground lessor; under ASC 840, such ground lease rents are presented on a net basis in the Company’s consolidated statements of operations for the years ended December 31, 2018. Upon adoption of ASC 842 on January 1, 2019 (see Note 2—Summary of Significant Accounting Policies), ground lease rents are no longer presented on a net basis and instead are reflected on a gross basis in the Company’s consolidated statements of operations for the years ended December 31, 2020 and 2019.
The following table sets forth the details of rent expense for the years ended December 31, 2020, 2019 and 2018:
| Year ended December 31, | ||||||||||||||||||||
| (in thousands) | 2020 | 2019 | 2018 | |||||||||||||||||
| Fixed rent expense - Ground Rent | $ |
|
$ |
|
$ |
|
||||||||||||||
| Fixed rent expense - Office Rent |
|
|
|
|||||||||||||||||
| Variable rent expense |
|
|
|
|||||||||||||||||
| Total rent expense | $ |
|
$ |
|
$ |
|
||||||||||||||
As of December 31, 2020, under ASC 842, future lease payments due from the Company under the ground, office and equipment operating leases where the Company is directly responsible for payment and the future lease payments due under the ground operating leases where the Company's tenants are directly responsible for payment over the next five years and thereafter were as follows:
| (in thousands) | Office and Equipment Leases |
Ground Leases
to be Paid by the Company |
Ground Leases
to be Paid Directly by the Company’s Tenants |
Total Future
Minimum Base Rental Payments |
||||||||||||||||||||||
| 2021 | $ |
|
$ |
|
$ |
|
$ |
|
||||||||||||||||||
| 2022 |
|
|
|
|
||||||||||||||||||||||
| 2023 |
|
|
|
|
||||||||||||||||||||||
| 2024 |
|
|
|
|
||||||||||||||||||||||
| 2025 |
|
|
|
|
||||||||||||||||||||||
| Thereafter |
|
|
|
|
||||||||||||||||||||||
| Total | $ |
|
$ |
|
$ |
|
|
|||||||||||||||||||
| Present value discount |
(
|
|||||||||||||||||||||||||
| Lease liabilities | $ |
|
||||||||||||||||||||||||
The Company has adopted the short-term lease policy election and accordingly, the table above excludes future minimum base cash rental payments by the Company or its tenants on leases that have a term of less than 12 months at lease inception. The total of such future obligations is not material.
95
5.
Long Term Debt
The following table summarizes the Company's outstanding indebtedness as of December 31, 2020 and 2019:
| Principal Outstanding | Weighted Average Interest Rate | |||||||||||||||||||||||||||||||
| (in thousands) | Maturity Date | December 31, 2020 | December 31, 2019 | December 31, 2020 | December 31, 2019 | |||||||||||||||||||||||||||
| Unsecured term loans: | ||||||||||||||||||||||||||||||||
| April 2019 Term Loan | April 2024 | $ |
|
$ |
|
|
|
|||||||||||||||||||||||||
| November 2019 Term Loan | November 2026 |
|
|
|
|
|||||||||||||||||||||||||||
| Revolving Credit Facility | April 2023 |
|
|
|
|
|||||||||||||||||||||||||||
| Secured borrowings: | ||||||||||||||||||||||||||||||||
| Series 2017-1 Notes | June 2047 |
|
|
|
|
|||||||||||||||||||||||||||
| Total principal outstanding | $ |
|
$ |
|
|
|
||||||||||||||||||||||||||
The following table summarizes the scheduled principal payments on the Company’s outstanding indebtedness as of December 31, 2020:
| (in thousands) | April 2019 Term Loan | November 2019 Term Loan | Revolving Credit Facility | Secured Borrowings | Total | |||||||||||||||||||||||||||
| 2021 | $ |
|
$ |
|
$ |
|
$ |
|
$ |
|
||||||||||||||||||||||
| 2022 |
|
|
|
|
|
|||||||||||||||||||||||||||
| 2023 |
|
|
|
|
|
|||||||||||||||||||||||||||
| 2024 |
|
|
|
|
|
|||||||||||||||||||||||||||
| 2025 |
|
|
|
|
|
|||||||||||||||||||||||||||
| Thereafter |
|
|
|
|
|
|||||||||||||||||||||||||||
| Total | $ |
|
$ |
|
$ |
|
$ |
|
$ |
|
||||||||||||||||||||||
The Company was not in default of any provisions under any of its outstanding indebtedness as of December 31, 2020 or 2019.
Revolving Credit Facility and April 2019 Term Loan
On April 12, 2019, the Company, through the Operating Partnership, entered into an amended and restated credit agreement (the “Amended Credit Agreement”) with its group of lenders, amending and restating the terms of the Company’s previous $
300.0
million revolving credit facility (the “2018 Credit Facility”) to increase the maximum aggregate initial original principal amount of the revolving loans available thereunder up to $
400.0
million (the “Revolving Credit Facility”) and to permit the incurrence of an additional $
200.0
million in term loans thereunder (the “April 2019 Term Loan”).
The Revolving Credit Facility has a term of
four years
from April 12, 2019, with an extension option of up to
one year
exercisable by the Operating Partnership, subject to certain conditions, and the April 2019 Term Loan has a term of
five years
from the effective date of the amended agreement. The loans under each of the Revolving Credit Facility and the April 2019 Term Loan initially bear interest at an annual rate of applicable LIBOR plus the applicable margin (which applicable margin varies between the Revolving Credit Facility and the April 2019 Term Loan).
The applicable LIBOR is the rate with a term equivalent to the interest period applicable to the relevant borrowing. The applicable margin initially is a spread set according to a leverage-based pricing grid. At the Operating Partnership’s election, on and after receipt of an investment grade corporate credit rating from Standard & Poor’s (“S&P”) or Moody’s Investors Services, Inc. (“Moody’s”), the applicable margin will be a spread set according to the Company’s corporate credit ratings provided by S&P and/or Moody’s. The Revolving Credit Facility and the April 2019 Term Loan are freely pre-payable at any time and the Revolving Credit Facility is mandatorily payable if borrowings exceed the borrowing base or the facility limit. The Operating Partnership may re-borrow amounts paid down on the Revolving Credit Facility but not on the April 2019 Term Loan.
96
The Operating Partnership is required to pay revolving credit fees throughout the term of the Revolving Credit Agreement based upon its usage of the Revolving Credit Facility, at a rate which depends on its usage of such facility during the period before the Company receives an investment grade corporate credit rating from S&P or Moody’s, and which rate shall be based on the corporate credit rating from S&P and/or Moody’s after the time, if applicable, the Company receives such a rating. The Operating Partnership was required to pay a ticking fee on the April 2019 Term Loan for the period from April 12, 2019 through May 14, 2019, the date the term loan was fully drawn. The Amended Credit Agreement has an accordion feature to increase, subject to certain conditions, the maximum availability of credit (either through increased revolving commitments or additional term loans) by up to $
200
million.
Additionally, on November 22, 2019, the Company further amended the Amended Credit Agreement to update certain terms to be consistent with those as described under, and to acknowledge, where applicable, the November 2019 Term Loan (as defined below) and to make certain other changes to the Amended Credit Agreement consistent with market practice on future replacement of the LIBOR rate and qualified financial contracts.
The Operating Partnership is the borrower under the Amended Credit Agreement, and the Company and each of its subsidiaries that owns a direct or indirect interest in an eligible real property asset are guarantors under the Amended Credit Agreement.
Under the terms of the Amended Credit Agreement, the Company is subject to various restrictive financial and nonfinancial covenants which, among other things, require the Company to maintain certain leverage ratios, cash flow and debt service coverage ratios, secured borrowing ratios and a minimum level of tangible net worth.
The Amended Credit Agreement restricts the Company’s ability to pay distributions to its stockholders under certain circumstances. However, the Company may make distributions to the extent necessary to maintain its qualification as a REIT under the Internal Revenue Code of 1986, as amended. The Amended Credit Agreement contains certain additional covenants that, subject to exceptions, limit or restrict the Company’s incurrence of indebtedness and liens, disposition of assets, transactions with affiliates, mergers and fundamental changes, modification of organizational documents, changes to fiscal periods, making of investments, negative pledge clauses and lines of business and REIT qualification.
In May 2019, the Company borrowed the entire $
200.0
million available under the April 2019 Term Loan and used the proceeds to repurchase, in part, notes previously issued under its Master Trust Funding Program. The Company borrowed the entire $
430.0
million available under the November 2019 Term Loan in separate draws in December 2019 and March 2020 and used the proceeds to voluntarily prepay notes previously issued under its Master Trust Funding Program at par, to repay amounts outstanding under the Revolving Credit Facility and for general working capital purposes.
The Company was in compliance with all financial covenants and was not in default of any other provisions under the Amended Credit Facility as of December 31, 2020 and 2019.
The following table presents information about the Revolving Credit Facility and the 2018 Credit Facility in effect for the years ended December 31, 2020, 2019 and 2018:
| (in thousands) | 2020 | 2019 | 2018 | |||||||||||||||||
| Balance on Balance on January 1, | $ |
|
$ |
|
$ |
|
||||||||||||||
| Borrowings |
|
|
|
|||||||||||||||||
| Repayments |
(
|
(
|
|
|||||||||||||||||
| Balance on December 31, | $ |
|
$ |
|
$ |
|
||||||||||||||
The following table presents information about interest expense related to the Revolving Credit Facility and the 2018 Credit Facility:
| Year ended December 31, | ||||||||||||||||||||
| (in thousands) | 2020 | 2019 | 2018 | |||||||||||||||||
| Interest expense | $ |
|
$ |
|
$ |
|
||||||||||||||
| Amortization of deferred financing costs |
|
|
|
|||||||||||||||||
| Total | $ |
|
$ |
|
$ |
|
||||||||||||||
97
Total deferred financing costs, net, of $
2.5
million and $
3.5
million related to the Revolving Credit Facility were included within rent receivables, prepaid expenses and other assets, net on the Company’s consolidated balance sheets as of December 31, 2020 and 2019, respectively.
As of December 31, 2020 and 2019, the Company had $
382.0
million and $
354.0
million, respectively, of unused borrowing capacity related to the Revolving Credit Facility.
November 2019 Term Loan
On November 26, 2019, the Company, through the Operating Partnership, entered into a new $
430
million term loan credit facility (the “November 2019 Term Loan”) with a group of lenders. The November 2019 Term Loan provides for term loans to be drawn up to an aggregate amount of $
430
million with a maturity of November 26, 2026.
Borrowings under the November 2019 Term Loan bear interest at an annual rate of applicable LIBOR plus the applicable margin. The applicable LIBOR will be the rate with a term equivalent to the interest period applicable to the relevant borrowing. The applicable margin will initially be a spread set according to a leverage-based pricing grid. At the Operating Partnership’s irrevocable election, on and after receipt of an investment grade corporate credit rating from S&P or Moody’s, the applicable margin will be a spread set according to the Company’s corporate credit ratings provided by S&P and/or Moody’s.
The November 2019 Term Loan is pre-payable at any time by the Operating Partnership (as borrower), provided, that if the loans under the November 2019 Term Loan are repaid on or before November 26, 2020, they are subject to a two percent prepayment premium, and if repaid thereafter but on or before November 26, 2021, they are subject to a one percent prepayment premium. After November 26, 2021, the loans may be repaid without penalty. The Operating Partnership may not re-borrow amounts paid down on the November 2019 Term Loan. The Operating Partnership was required to pay a ticking fee on any undrawn portion of the November 2019 Term Loan for the period from November 26, 2019 through March 26, 2020, the date that the November 2019 Term Loan was fully drawn. The November 2019 Term Loan has an accordion feature to increase, subject to certain conditions, the maximum availability of the facility up to an aggregate of $
500
million.
The Operating Partnership is the borrower under the November 2019 Term Loan, and the Company and each of its subsidiaries that owns a direct or indirect interest in an eligible real property asset are guarantors under the facility. Under the terms of the November 2019 Term Loan, the Company is subject to various restrictive financial and nonfinancial covenants which, among other things, require the Company to maintain certain leverage ratios, cash flow and debt service coverage ratios, secured borrowing ratios and a minimum level of tangible net worth.
Additionally, the November 2019 Term Loan restricts the Company’s ability to pay distributions to its stockholders under certain circumstances. However, the Company may make distributions to the extent necessary to maintain its qualification as a REIT under the Internal Revenue Code of 1986, as amended. The facility contains certain covenants that, subject to exceptions, limit or restrict the Company’s incurrence of indebtedness and liens, disposition of assets, transactions with affiliates, mergers and fundamental changes, modification of organizational documents, changes to fiscal periods, making of investments, negative pledge clauses and lines of business and REIT qualification.
The Company was in compliance with all financial covenants and was not in default of any other provisions under the November 2019 Term Loan as of December 31, 2020 and 2019.
The following table presents information about aggregate interest expense related to the April 2019 and November 2019 Term Loan Facilities:
| Year ended December 31, | ||||||||||||||
| (in thousands) | 2020 | 2019 | ||||||||||||
| Interest expense | $ |
|
$ |
|
||||||||||
| Amortization of deferred financing costs |
|
|
||||||||||||
| Total | $ |
|
$ |
|
||||||||||
98
Total deferred financing costs, net, of $
3.7
million and $
4.4
million as of December 31, 2020 and 2019, respectively, related to the Term Loan Facilities are included as a component of unsecured term loans, net of deferred financing costs on the Company’s consolidated balance sheets.
The Company fixed the interest rates on its term loan facilities’ variable-rate debt through the use of interest rate swap agreements. See Note 6—Derivative and Hedging Activities for additional information.
Secured Borrowings
In the normal course of business, the Company transfers financial assets in various transactions with Special Purpose Entities (“SPE”) determined to be VIEs, which primarily consist of securitization trusts established for a limited purpose (the “Master Trust Funding Program”). These SPEs are formed for the purpose of securitization transactions in which the Company transfers assets to an SPE, which then issues to investors various forms of debt obligations supported by those assets. In these securitization transactions, the Company typically receives cash from the SPE as proceeds for the transferred assets and retains the rights and obligations to service the transferred assets in accordance with servicing guidelines. All debt obligations issued from the SPEs are non-recourse to the Company.
In accordance with the accounting guidance for asset transfers, the Company considers any ongoing involvement with transferred assets in determining whether the assets can be derecognized from the balance sheets. For transactions that do not meet the requirements for derecognition and remain on the consolidated balance sheets, the transferred assets may not be pledged or exchanged by the Company.
The Company evaluates its interest in certain entities to determine if these entities meet the definition of a VIE and whether the Company is the primary beneficiary and, therefore, should consolidate the entity based on the variable interests it held both at inception and when there was a change in circumstances that required a reconsideration. The Company has determined that the SPEs created in connection with its Master Trust Funding Program should be consolidated as the Company is the primary beneficiary of each of these entities. Tenant rentals received on assets transferred to SPEs under the Master Trust Funding Program are sent to the trustee and used to pay monthly principal and interest payments.
Series 2016-1 Notes
In December 2016, the Company issued its first series of notes under the Master Trust Funding Program, consisting of $
263.5
million of Class A Notes and $
17.3
million of Class B Notes (together, the “Series 2016-1 Notes”). These notes were issued to an affiliate of Eldridge Industries, LLC (“Eldridge”) through underwriting agents. The Series 2016-1 Notes were issued by
two
SPEs formed to hold assets and issue the secured borrowings associated with the securitization.
The Series 2016-1 Notes were scheduled to mature in November 2046, but the terms of the Class A Notes required principal to be paid monthly through November 2021, with a balloon repayment at that time, and the terms of the Class B Notes required no monthly principal payments but required the full principal balance to be paid in November 2021.
In May 2019, the Company repurchased a portion of its Class A Series 2016-1 Notes with a face value of $
200
million for $
201.4
million from an affiliate of Eldridge. On November 12, 2019, the Company cancelled all $
200
million of these repurchased Class A Series 2016-1 Notes.
In November 2019, the Company prepaid all $
70.4
million of the then outstanding Series 2016-1 Notes (consisting of the remaining $
53.2
million Class A Series 2016-1 Notes and $
17.2
million Class B Series 2016-1 Notes) at par plus accrued interest pursuant to the terms of the agreements related to such securities.
Series 2017-1 Notes
In July 2017, the Company issued its second series of notes under the Master Trust Funding Program, consisting of $
232.4
million of Class A Notes and $
15.7
million of Class B Notes (together, the “Series 2017-1 Notes”). The Series 2017-1 Notes were issued by
three
SPEs formed to hold assets and issue the secured borrowings associated with the securitization.
99
The Series 2017-1 Notes mature in June 2047 and have a weighted average interest rate of
4.19
% as of December 31, 2020. If the notes are not repaid in full on or before such anticipated repayment date, additional interest will begin to accrue on the notes. The anticipated repayment date for the Series 2017-1 Notes is June 2024.
The Series 2017-1 Notes may be voluntarily prepaid, in whole or in part, beginning in November 2021 without the payment of a make whole amount. Voluntary prepayments may be made before
31
months prior to the anticipated repayment date.
In February 2020, the Company voluntarily prepaid $
62.3
million of the Class A Series 2017-1 Notes at par plus accrued interest pursuant to the terms of the agreements related to such securities. The Company was not subject to the payment of a make whole amount in connection with this prepayment. The Company accounted for this prepayment as a debt extinguishment.
The following table presents information about interest expense related to the Master Trust Funding Program:
| Year ended December 31, | ||||||||||||||||||||
| (in thousands) | 2020 | 2019 | 2018 | |||||||||||||||||
| Interest expense | $ |
|
$ |
|
$ |
|
||||||||||||||
| Amortization of deferred financing costs |
|
|
|
|||||||||||||||||
| Total | $ |
|
$ |
|
$ |
|
||||||||||||||
Total deferred financing costs, net, of $
2.2
million and $
3.8
million related to the Master Trust Funding Program were included within secured borrowings, net of deferred financing costs on the Company’s consolidated balance sheets as of December 31, 2020 and 2019, respectively.
The Company recorded a $
0.9
million loss on repurchase and repayment of secured borrowings related to the amortization of deferred financing costs on the $
62.3
million voluntary prepayment of the Class A Series 2017-1 Notes during the year ended December 31, 2020. The Company recorded a $
5.2
million loss on the repurchase of a portion of the Class A Series 2016-1 during the year end December 31, 2019, which includes the write-off of unamortized deferred financing charges and the amount paid above par to repurchase these notes.
Notes Payable to Related Parties
Until the completion of the IPO, the Company had a secured warehouse line of credit with an affiliate of Eldridge through which it issued short-term notes (the “Warehouse Notes”) and used the proceeds to acquire investments in real estate. During the year ended December 31, 2018, the Company issued
20
Warehouse Notes for a combined $
154.0
million. On January 31, 2018, the Company made principal payments on the Warehouse Notes of $
50.0
million, repaying
three
of the Warehouse Notes in full and one of the Warehouse Notes in part, prior to maturity. On June 25, 2018, the Company used a portion of the net proceeds from the IPO and the Concurrent Private Placement (as defined in Note 7—Equity below) to repay all
36
of the then outstanding Warehouse Notes, with an aggregate outstanding principal amount of $
334.0
million, in full, prior to maturity, and had
no
amounts outstanding related to the Warehouse Notes as of December 31, 2020, 2019 and 2018.
The following table presents the activity related to the Company’s notes payable to related parties for the year ended December 31, 2018:
| (in thousands) |
Warehouse
Notes |
|||||||
| Outstanding, January 1, 2018 | $ |
|
||||||
| Borrowings |
|
|||||||
| Repayments |
(
|
|||||||
| Outstanding, December 31, 2018 | $ |
|
||||||
During the year ended December 31, 2018, the Company incurred $
4.6
million of interest expense related to these notes payable to related parties. No interest expense from notes payable related parties was incurred during the years ended December 31, 2020 and 2019.
100
6.
Derivative and Hedging Activities
The Company does not enter into derivative financial instruments for speculative or trading purposes. The Company's objectives in using interest rate derivatives are to add stability to interest expense and to manage its exposure to interest rate movements. To accomplish these objectives, the Company uses interest rate swaps as part of its interest rate risk management strategy. Interest rate swaps designated as cash flow hedges involve the receipt of variable-rate amounts from a counterparty in exchange for the Company making fixed-rate payments over the life of the agreements without exchange of the underlying notional amount.
These derivatives are considered cash flow hedges and are recorded on a gross basis at fair value. Subsequent to the adoption of ASU 2017-12, assessments of hedge effectiveness are performed quarterly using either a qualitative or quantitative approach. The Company recognizes the entire change in the fair value in accumulated other comprehensive income (loss) and the change is reflected as derivative changes in fair value in the supplemental disclosures of non-cash financing activities in the consolidated statements of cash flows. The amounts recorded in accumulated other comprehensive income (loss) will subsequently be reclassified to interest expense as interest payments are made on the Company's borrowings under its variable-rate term loan facilities. During the next twelve months, the Company estimates that $
9.8
million will be reclassified from accumulated other comprehensive loss as an increase to interest expense. The Company does not have netting arrangements related to its derivatives.
The use of derivative financial instruments carries certain risks, including the risk that the counterparties to these contractual arrangements are not able to perform under the agreements. To mitigate this risk, the Company only enters into derivative financial instruments with counterparties with high credit ratings and with major financial institutions with which the Company and its affiliates may also have other financial relationships. The Company does not anticipate that any of the counterparties will fail to meet their obligations. As of December 31, 2020 and 2019, there were no events of default related to the interest rate swaps.
The following table summarizes the notional amount at inception and fair value of these instruments on the Company's balance sheet as of December 31, 2020 and 2019 (dollar amounts in thousands):
| Fair Value of Asset/(Liability) | ||||||||||||||||||||||||||||||||||||||
|
Derivatives
Designated as
Hedging Instruments
(1)
|
Fixed Rate Paid by
Company |
Effective Date | Maturity Date |
Notional Value
(2)
|
December 31, 2020
(3)
|
December 31,
2019
(3)(4)
|
||||||||||||||||||||||||||||||||
| Interest Rate Swap |
|
5/14/2019 | 4/12/2024 | $ |
|
$ |
(
|
$ |
(
|
|||||||||||||||||||||||||||||
| Interest Rate Swap |
|
5/14/2019 | 4/12/2024 |
|
(
|
(
|
||||||||||||||||||||||||||||||||
| Interest Rate Swap |
|
5/14/2019 | 4/12/2024 |
|
(
|
(
|
||||||||||||||||||||||||||||||||
| Interest Rate Swap |
|
12/9/2019 | 11/26/2026 |
|
(
|
|
||||||||||||||||||||||||||||||||
| Interest Rate Swap |
|
12/9/2019 | 11/26/2026 |
|
(
|
|
||||||||||||||||||||||||||||||||
| Interest Rate Swap |
|
12/9/2019 | 11/26/2026 |
|
(
|
|
||||||||||||||||||||||||||||||||
| Interest Rate Swap |
|
7/9/2020 | 11/26/2026 |
|
(
|
|
||||||||||||||||||||||||||||||||
| Interest Rate Swap |
|
7/9/2020 | 11/26/2026 |
|
(
|
|
||||||||||||||||||||||||||||||||
| $ |
|
$ |
(
|
$ |
(
|
|||||||||||||||||||||||||||||||||
_____________________________________
(1)
All interest rate swaps have a 1 month LIBOR variable rate paid by the bank.
(2)
Notional value indicates the extent of the Company’s involvement in these instruments, but does not represent exposure to credit, interest rate or market risks.
(3)
Derivatives in a liability position are included within derivative liabilities in the Company’s consolidated balance sheets totaling to $
38.9
million and $
4.0
million at December 31, 2020 and December 31, 2019, respectively.
(4)
Derivatives in a net asset position are included within rent receivables, prepaid expenses and other assets, net in the Company’s consolidated balance sheets totaling to $
1.1
million at December 31, 2019.
The Company has agreements with each of its derivative counterparties that contain a provision where if the Company either defaults or is capable of being declared in default on any of its indebtedness, then the Company could also be declared in default on its derivative obligations.
101
The following table presents amounts recorded to accumulated other comprehensive loss related to derivative and hedging activities for the periods presented:
| Year ended December 31, | ||||||||||||||
| (in thousands) | 2020 | 2019 | ||||||||||||
| Accumulated other comprehensive loss | $ |
(
|
$ |
(
|
||||||||||
As of December 31, 2020, the fair value of derivatives in a net liability position including accrued interest but excluding any adjustment for nonperformance risk related to these agreements was $
38.9
million. As of December 31, 2019, the fair value of derivatives in a net liability position including accrued interest but excluding any adjustment for nonperformance risk related to these agreements was $
4.1
million. As of December 31, 2020, there were
no
derivatives in a net asset position. As of December 31, 2019, the fair value of derivatives in a net asset position including accrued interest but excluding any adjustment for nonperformance risk related to these agreements was $
1.0
million.
During the year ended December 31, 2020 and 2019, the Company recorded a loss on the change in fair value of its interest rate swaps of $
6.7
million and $
0.1
million, respectively, which included in interest expense in the Company's consolidated statements of operations.
As of December 31, 2020 and December 31, 2019, the Company had not posted any collateral related to these agreements and was not in breach of any provisions of such agreements. If the Company had breached any of these provisions, it could have been required to settle its obligations under the agreements at their aggregate termination value of $
40.2
million and $
3.1
million as of December 31, 2020 and December 31, 2019, respectively.
7.
Equity
Stockholders' Equity
On June 25, 2018, the Company completed its IPO and issued
32,500,000
shares of its common stock at an initial public offering price of $
14.00
per share, pursuant to a registration statement on Form S-11 (File No. 333-225215), filed with the U.S. Securities and Exchange Commission (the “SEC”) under the Securities Act of 1933, as amended (the “Securities Act”).
Prior to the completion of the IPO, a number of formation transactions (the “Formation Transactions”) took place that were designed to facilitate the completion of the IPO. Among other things, on June 20, 2018, Essential Properties Realty Trust LLC (“EPRT LLC”) converted from a Delaware limited liability company into a Delaware limited partnership, changed its name to Essential Properties, L.P. and became the subsidiary through which the Company holds substantially all of its assets and conducts its operations. Prior to the completion of the Formation Transactions, EPRT LLC was a wholly owned subsidiary of EPRT Holdings LLC (“EPRT Holdings” and, together with EPRT LLC, the “Predecessor”), and EPRT Holdings received
17,913,592
units of limited partnership interest in the Operating Partnership (“OP Units”) in connection with EPRT LLC’s conversion into a Delaware limited partnership. Essential Properties OP G.P., LLC, a wholly owned subsidiary of the Company, became the sole general partner of the Operating Partnership. The Formation Transactions were accounted for as a reorganization of entities under common control in the consolidated financial statements and the assets and liabilities of the Predecessor were recorded by the Company at their historical carrying amounts.
Concurrently with the completion of the IPO, the Company received an additional $
125.0
million investment from an affiliate of Eldridge Industries, LLC (“Eldridge”) in private placements (the “Concurrent Private Placement”) of
7,785,611
shares of its common stock and
1,142,960
OP Units at a price per share/unit of $
14.00
. The issuance and sale of the shares and OP Units in the Concurrent Private Placement were made pursuant to private placement purchase agreements and there were
no
underwriting discounts or commissions associated with the sales.
As part of the IPO, the underwriters of the IPO were granted an option to purchase up to an additional
4,875,000
shares of the Company’s common stock at the IPO price of $
14.00
per share, less underwriting discounts and commissions. On July 20, 2018, the underwriters of the IPO exercised this option in part, and on July 24, 2018, the Company issued an additional
2,772,191
shares of common stock. The net proceeds to the Company from the IPO (including the purchase of additional shares pursuant to the underwriters’ option) and the Concurrent Private Placement, after deducting underwriting discounts and commissions and other expenses, were $
583.7
million.
102
On June 25, 2018, the Company issued
691,290
shares of restricted
common stock to certain of its directors, executive officers and other employees under the Equity Incentive Plan. See Note 9—Equity Based Compensation for additional information.
On March 18, 2019, the Company completed a follow-on offering of
14,030,000
shares of its common stock, including
1,830,000
shares of common stock purchased by the underwriters pursuant to an option to purchase additional shares, at an offering price of $
17.50
per share, pursuant to a registration statement on Form S-11 (File Nos. 333-230188 and 333-230252) filed with the SEC under the Securities Act of 1933, as amended (the “Securities Act”). Net proceeds from this follow-on offering, after deducting underwriting discounts and commissions and other expenses, were $
234.6
million.
On July 22, 2019, EPRT Holdings and Security Benefit Life Insurance Company (together, the “Selling Stockholders”), affiliates of Eldridge, completed a secondary public offering (the “Secondary Offering”) of
26,288,316
shares of the Company’s common stock, including
3,428,910
shares of common stock purchased by underwriters pursuant to an option to purchase additional shares. Prior to completion of the Secondary Offering, the Selling Stockholders exchanged
18,502,705
OP Units of the Operating Partnership for a like number of shares of the Company’s common stock. The Company did not receive any proceeds from this transaction.
On January 14, 2020, the Company completed a follow-on offering of
7,935,000
shares its common stock, including
1,035,000
shares of common stock purchased by the underwriters pursuant to an option to purchase additional shares, at an offering price of $
25.20
per share. Net proceeds from this follow-on offering, after deducting underwriting discounts and commissions and other expenses, were $
191.5
million.
On September 22, 2020, the Company completed a follow-on offering of
10,120,000
shares its common stock, including
1,320,000
shares of common stock purchased by the underwriters pursuant to an option to purchase additional shares, at an offering price of $
19.00
per share. Net proceeds from this follow-on offering, after deducting underwriting discounts and commissions and other expenses, were $
184.1
million.
At the Market Program
In June 2020, the Company established a new at the market common equity offering program, pursuant to which it can publicly offer and sell, from time to time, shares of its common stock with an aggregate gross sales price of up to $
250
million (the “2020 ATM Program”). In connection with establishing the 2020 ATM Program, the Company terminated its prior at the market program, which it established in August 2019 (the “2019 ATM Program”). and no additional stock can be issued thereunder. Pursuant to the 2019 ATM Program, the Company could publicly offer and sell shares of its common stock with an aggregate gross sales price of up to $
200
million and, prior to its termination, the Company issued common stock with an aggregate gross sales price of $
184.4
million thereunder. As of December 31, 2020, the Company issued common stock with an aggregate gross sales price of $
79.3
million under the 2020 ATM Program and could issue additional common stock with an aggregate gross sales price of up to $
170.7
million under the 2020 ATM Program. As the context requires, the 2020 ATM Program and the 2019 ATM Program are referred to herein as the “ATM Program."
103
The following table details information related to activity under the ATM Program for each period presented:
| Year ended December 31, | ||||||||||||||
| (in thousands, except share and per share data) | 2020 | 2019 | ||||||||||||
| Shares of common stock sold |
|
|
||||||||||||
| Weighted average sale price per share | $ |
|
$ |
|
||||||||||
| Gross proceeds | $ |
|
$ |
|
||||||||||
| Net proceeds | $ |
|
$ |
|
||||||||||
Dividends on Common Stock
During the years ended December 31, 2020 and 2019 and the period from June 25, 2018 to December 31, 2018, the Company's board of directors declared the following quarterly cash dividends on common stock:
| Date Declared | Record Date | Date Paid |
Dividend per Share of
Common Stock |
Total Dividend (dollars in thousands) | ||||||||||||||||||||||
| December 3, 2020 | December 31, 2020 | January 15, 2021 | $ |
|
$ |
|
||||||||||||||||||||
| September 4, 2020 | September 30, 2020 | October 15, 2020 | $ |
|
$ |
|
||||||||||||||||||||
| June 11, 2020 | June 30, 2020 | July 15, 2020 | $ |
|
$ |
|
||||||||||||||||||||
| March 18, 2020 | March 31, 2020 | April 15, 2020 | $ |
|
$ |
|
||||||||||||||||||||
| December 6, 2019 | December 31, 2019 | January 15, 2020 | $ |
|
$ |
|
||||||||||||||||||||
| September 6, 2019 | September 30, 2019 | October 15, 2019 | $ |
|
$ |
|
||||||||||||||||||||
| June 5, 2019 | June 28, 2019 | July 15, 2019 | $ |
|
$ |
|
||||||||||||||||||||
| March 7, 2019 | March 29, 2019 | April 16, 2019 | $ |
|
$ |
|
||||||||||||||||||||
| December 7, 2018 | December 31, 2018 | January 14, 2019 | $ |
|
$ |
|
||||||||||||||||||||
| August 29, 2018 | September 28, 2018 | October 12, 2018 | $ |
|
$ |
|
||||||||||||||||||||
The Company has determined that, during the years ended December 31, 2020 and 2019 and the period from June 25, 2018 to December 31, 2018, approximately
59.0
%,
58.8
%, and
58.9
%, respectively, of the distributions it paid represented taxable income and
41.0
%,
41.2
% and
41.1
%, respectively, of the distributions it paid represented return of capital for federal income tax purposes.
Members' Equity
EPRT LLC was initially capitalized in 2017 by SCF Funding LLC, Stonebriar Holdings LLC and certain members of EPRT LLC's management and board of managers through direct and indirect capital contributions.
On December 31, 2017, EPRT LLC reorganized (the "EPRT LLC Reorganization") and the holders of interests in EPRT LLC contributed all of their interests in EPRT Holdings, in exchange for interests in EPRT Holdings with the same rights as the interests they held in EPRT LLC. As of such date, EPRT LLC became a wholly owned subsidiary of EPRT Holdings.
On January 31, 2018, Stonebriar Holdings LLC made a $
50.0
million direct equity contribution to EPRT Holdings. EPRT Holdings used these proceeds to repay $
50.0
million of outstanding principal on the Warehouse Notes.
8.
Non-controlling Interests
Essential Properties OP G.P., LLC, a wholly owned subsidiary of the Company, is the sole general partner of the Operating Partnership and holds a
1.0
% general partner interest in the Operating Partnership. The Company contributes the net proceeds from issuing shares of common stock to the Operating Partnership in exchange for a number of OP Units equal to the number of shares of common stock issued.
Prior to completion of the Secondary Offering, the Selling Stockholders exchanged
18,502,705
OP Units of the Operating Partnership for a like number of shares of the Company's common stock. Concurrently, EPRT Holdings, one of the Selling Stockholders, distributed the remaining
553,847
OP Units it held to former members of EPRT Holdings (the "Non-controlling OP Unit Holders"). The Selling Stockholders thereafter sold all of the shares of
104
common stock that they owned through the Secondary Offering and accordingly no longer owned shares of the Company's common stock or held OP Units following the completion of the Secondary Offering.
As of December 31, 2020, the Company held
106,361,524
OP Units, representing a
99.5
% limited partner interest in the Operating Partnership. As of the same date, the Non-controlling OP Unit Holders held
553,847
OP Units in the aggregate, representing a
0.5
% limited partner interest in the Operating Partnership. As of December 31, 2019, the Company held
83,761,151
OP Units, representing a
98.3
% limited partner interest in the Operating Partnership. As of the same date, the Non-controlling OP Unit Holders held
553,847
OP Units in the aggregate, representing a
0.7
% limited partner interest in the Operating Partnership. The OP Units held by EPRT Holdings and Eldridge prior to the completion of the Secondary Offering and the OP Units held by the Non-controlling OP Unit Holders are presented as non-controlling interests in the Company's consolidated financial statements.
A holder of OP Units has the right to distributions per unit equal to dividends per share paid on the Company's common stock and has the right to redeem OP Units for cash or, at the Company's election, shares of the Company's common stock on a
one
-for-one basis, provided, however, that such OP Units must have been outstanding for at least
one year
. Distributions to OP Unit holders are declared and paid concurrently with the Company's cash dividends to common stockholders. See Note 7—Equity for details.
9.
Equity Based Compensation
Equity Incentive Plan
In 2018, the Company adopted an equity incentive plan (the “Equity Incentive Plan”), which provides for the grant of incentive stock options, nonqualified stock options, stock appreciation rights, restricted stock, restricted stock units, other stock awards, performance awards and LTIP units. Officers, employees, non-employee directors, consultants, independent contractors and agents who provide services to the Company or to any subsidiary of the Company are eligible to receive such awards. A maximum of
3,550,000
shares may be issued under the Equity Incentive Plan, subject to certain conditions.
The following table presents information about the Company's restricted stock awards ("RSAs"), restricted stock units ("RSUs"), Class B Units and Class D Units during the years ended December 31, 2020, 2019 and 2018:
|
Restricted Stock Awards
|
Restricted Stock Units | Class B Units | Class D Units | |||||||||||||||||||||||||||||||||||
| Shares | Wtd. Avg. Grant Date Fair Value | Units | Wtd. Avg. Grant Date Fair Value | |||||||||||||||||||||||||||||||||||
| Unvested, January 1, 2018 |
|
$ |
|
|
$ |
|
|
|
||||||||||||||||||||||||||||||
| Granted |
|
|
|
|
|
|
||||||||||||||||||||||||||||||||
| Vested |
|
|
|
|
(
|
(
|
||||||||||||||||||||||||||||||||
| Forfeited |
|
|
|
|
|
|
||||||||||||||||||||||||||||||||
| Unvested, December 31, 2018 |
|
$ |
|
|
$ |
|
|
|
||||||||||||||||||||||||||||||
| Unvested, January 1, 2019 |
|
$ |
|
|
$ |
|
|
|
||||||||||||||||||||||||||||||
| Granted |
|
|
|
|
|
|
||||||||||||||||||||||||||||||||
| Vested |
(
|
|
|
|
(
|
(
|
||||||||||||||||||||||||||||||||
| Forfeited |
|
|
|
|
|
|
||||||||||||||||||||||||||||||||
| Unvested, December 31, 2019 |
|
$ |
|
|
$ |
|
|
|
||||||||||||||||||||||||||||||
| Unvested, January 1, 2020 |
|
$ |
|
|
$ |
|
|
|
||||||||||||||||||||||||||||||
| Granted |
|
|
|
|
|
|
||||||||||||||||||||||||||||||||
| Vested |
(
|
|
(
|
|
|
|
||||||||||||||||||||||||||||||||
| Forfeited |
|
|
(
|
|
|
|
||||||||||||||||||||||||||||||||
| Unvested, December 31, 2020 |
|
$ |
|
|
$ |
|
|
|
||||||||||||||||||||||||||||||
105
Restricted Stock Awards
On June 25, 2018,
an
aggregate of
691,290
shares of unvested restricted common stock awards ("RSAs") were issued to the Company's directors, executive officers and other employees under the Equity Incentive Plan. These RSAs vest over periods ranging from
one year
to
three years
from the date of grant, subject to the individual recipient's continued provision of service to the Company through the applicable vesting dates.
In January 2019, an aggregate of
46,368
shares of unvested RSAs were issued to the Company's executive officers, other employees and an external consultant under the Equity Incentive Plan. These RSAs vest over periods ranging from
one year
to
four years
from the date of grant, subject to the individual recipient's continued provision of service to the Company through the applicable vesting dates. In June 2020, an additional
3,658
RSAs were issued to certain members of the Company's board of directors which vested immediately upon grant. The Company estimates the grant date fair value of RSAs granted under the Equity Incentive Plan using the average market price of the Company's common stock on the date of grant.
The following table presents information about the Company's RSAs for the periods presented:
| Year ended December 31, | ||||||||||||||||||||
| (in thousands) | 2020 | 2019 | 2018 | |||||||||||||||||
| Compensation cost recognized in general and administrative expense | $ |
|
$ |
|
$ |
|
||||||||||||||
| Dividends declared on unvested RSAs and charged directly to distributions in excess of cumulative earnings |
|
|
|
|||||||||||||||||
| Fair value of shares vested during the period |
|
|
|
|||||||||||||||||
The following table presents information about the Company's RSAs as of the dates presented:
| December 31, | ||||||||||||||
| (Dollars in thousands) | 2020 | 2019 | ||||||||||||
| Total unrecognized compensation cost | $ |
|
$ |
|
||||||||||
| Weighted average period over which compensation cost will be recognized (in years) |
|
|
||||||||||||
Restricted Stock Units
In January 2019 and 2020, the Company issued target grants of
119,085
and
84,684
performance-based RSUs, respectively, to the Company's executive officers under the Equity Incentive Plan. Of these awards,
75
% are non-vested RSUs for which vesting percentages and the ultimate number of units vesting will be calculated based on the total shareholder return ("TSR") of the Company's common stock as compared to the TSR of peer companies identified in the grant agreements. The payout schedule can produce vesting percentages ranging from
0
% to
250
%. TSR will be calculated based upon the average closing price for the 20-trading day period ending December 31, 2021 (for the 2019 grants) or December 31, 2022 (for the 2020 grants), divided by the average closing price for the
20
-trading day period ended January 1, 2019 (for the 2019 grants) or January 1, 2020 (for the 2020 grants). The target number of units is based on achieving a TSR equal to the
50
th percentile of the peer group. The Company recorded expense on these TSR RSUs based on achieving the target.
The grant date fair value of the TSR RSUs was measured using a Monte Carlo simulation model based on the following assumptions:
| January | ||||||||||||||
| 2020 | 2019 | |||||||||||||
| Volatility |
|
% |
|
% | ||||||||||
| Risk free rate |
|
% |
|
% | ||||||||||
The remaining
25
% of these performance-based RSUs vest based on the Compensation Committee's subjective evaluation of the individual recipient's achievement of certain strategic objectives. In May 2020, the Compensation Committee evaluated and subjectively awarded
7,596
of these RSUs to a former executive officer of the Company, which vested immediately. During the year ended December 31, 2020, the Company recorded $
0.1
million of compensation expense related to the subjective RSUs awarded to this former executive. As of December 31, 2020, the Compensation Committee had not identified specific performance targets relating to the
106
individual recipients' achievement of strategic objectives for the remainder of the subjective awards. As such, these awards do not have either a service inception or a grant date for GAAP accounting purposes and the Company recorded
no
compensation cost with respect to this portion of the performance-based RSUs during the years ended December 31, 2020 and 2019.
In June 2019 and 2020, the Company issued
11,500
and
26,817
RSUs, respectively, to the Company's independent directors. These awards vest in full on the earlier of
one year
from the grant date or the first annual meeting of stockholders that occurs after the grant date, subject to the individual recipient's continued provision of service to the Company through the applicable vesting date. The Company estimated the grant date fair value of these RSUs using the average market price of the Company's common stock on the date of grant.
Additionally, during the year ended December 31, 2020, the Company issued an aggregate
157,943
RSUs to the Company’s executive officers, other employees and directors under the Equity Incentive Plan. These awards vest over a period of up to
four years
from the date of grant, subject to the individual recipient’s continued provision of service to the Company through the applicable vesting dates.
The following table presents information about the Company's RSUs for the periods presented:
| Year ended December 31, | ||||||||||||||
| (in thousands) | 2020 | 2019 | ||||||||||||
| Compensation cost recognized in general and administrative expense | $ |
|
$ |
|
||||||||||
| Dividend equivalents declared and charged directly to distributions in excess of cumulative earnings |
|
|
||||||||||||
| Fair value of units vested during the period |
|
|
||||||||||||
The following table presents information about the Company's RSUs as of the date presented:
| December 31, | ||||||||||||||
| (Dollars in thousands) | 2020 | 2019 | ||||||||||||
| Total unrecognized compensation cost | $ |
|
$ |
|
||||||||||
| Weighted average period over which compensation cost will be recognized (in years) |
|
|
||||||||||||
Unit-Based Compensation
In 2017, the Company's predecessor approved and issued unvested Class B and Class D units equity interests to members of EPRT Management, the predecessor's board of managers and external unitholders. Following the completion of the Formation Transactions, the Class B and Class D unit holders continued to hold vested and unvested interests in EPRT Holdings and, indirectly, the OP Units held by EPRT Holdings.
On July 22, 2019, in conjunction with the completion of the Secondary Offering,
3,520
previously unvested Class B units and
1,200
previously unvested Class D units in EPRT Holdings automatically vested in accordance with the terms of the grant agreements, which represented all of the remaining outstanding unvested Class B and Class D units. Due to this accelerated vesting, the Company recorded all remaining unrecognized compensation cost on the Class B and Class D units to general and administrative expenses in its consolidated statements of operations during the year ended December 31, 2019.
The following table presents information about the Class B and Class D units for the periods presented:
| Year ended December 31, | ||||||||||||||||||||
| (in thousands) | 2020 | 2019 | 2018 | |||||||||||||||||
| Compensation cost recognized in general and administrative expense | $ |
|
$ |
|
$ |
|
||||||||||||||
| Fair value of units vested during the period |
|
|
|
|||||||||||||||||
10.
Net Income Per Share
107
common stock and units, which contain rights to receive non-forfeitable dividends or dividend equivalents, as participating securities requiring the two-class method of computing net income per share. Diluted net income per share of common stock further considers the effect of potentially dilutive shares of common stock outstanding during the period, including the assumed vesting of restricted share units with a market-based or service-based vesting condition, where dilutive. The OP Units held by non-controlling interests represent potentially dilutive securities as the OP Units may be redeemed for cash or, at the Company’s election, exchanged for shares of the Company’s common stock on a one-for-one basis.
The following is a reconciliation of the numerator and denominator used in the computation of basic and diluted net income per share (dollars in thousands):
| Year ended December 31, |
Period from
June 25, 2018 to December 31, 2018 |
|||||||||||||||||||
| (dollar amounts in thousands) | 2020 | 2019 | ||||||||||||||||||
| Numerator for basic and diluted earnings per share: | ||||||||||||||||||||
| Net income | $ |
|
$ |
|
$ |
|
||||||||||||||
| Less: net income attributable to non-controlling interests |
(
|
(
|
(
|
|||||||||||||||||
| Less: net income allocated to unvested restricted common stock and RSUs |
(
|
(
|
(
|
|||||||||||||||||
| Net income available for common stockholders: basic |
|
|
|
|||||||||||||||||
| Net income attributable to non-controlling interests |
|
|
|
|||||||||||||||||
| Net income available for common stockholders: diluted | $ |
|
$ |
|
$ |
|
||||||||||||||
| Denominator for basic and diluted earnings per share: | ||||||||||||||||||||
| Weighted average common shares outstanding |
|
|
|
|||||||||||||||||
| Less: weighted average number of shares of unvested restricted common stock |
(
|
(
|
(
|
|||||||||||||||||
| Weighted average shares outstanding used in basic net income per share |
|
|
|
|||||||||||||||||
| Effects of dilutive securities: (1) | ||||||||||||||||||||
| OP Units |
|
|
|
|||||||||||||||||
| Unvested restricted common stock and RSUs |
|
|
|
|||||||||||||||||
| Weighted average shares outstanding used in diluted net income per share |
|
|
|
|||||||||||||||||
_____________________________________
(1)
For the year ended December 31, 2020, excludes the impact of
124,295
unvested restricted stock units as the effect would have been antidilutive.
11.
Commitments and Contingencies
As of December 31, 2020, the Company had remaining future commitments, under mortgage notes, reimbursement obligations or similar arrangements, to fund $
16.3
million to its tenants for development, construction and renovation costs related to properties leased from the Company.
Litigation and Regulatory Matters
In the ordinary course of business, the Company may become subject to litigation, claims and regulatory matters. There are no material legal or regulatory proceedings pending or known to be contemplated against the Company or its properties.
Environmental Matters
In connection with the ownership of real estate, the Company may be liable for costs and damages related to environmental matters. As of December 31, 2020, the Company had not been notified by any governmental authority of any non-compliance, liability or other claim, and is not aware of any other environmental condition that it believes will have a material adverse effect on the Company's business, financial condition, results of operations or liquidity.
108
Defined Contribution Retirement Plan
The Company has a defined contribution retirement savings plan qualified under Section 401(a) of the Code (the "401(k) Plan"). The 401(k) Plan is available to all of the Company's full-time employees. The Company provides a matching contribution in cash equal to
100
% of the first
5
% of eligible compensation contributed by participants which vests immediately. During the years ended December 31, 2020, 2019 and 2018, the Company made matching contributions of $
0.2
million, $
0.2
million and $
0.1
million, respectively.
Employment Agreements
The Company has employment agreements with its executive officers. These employment agreements have an initial term of
four years
, with automatic
one-year
extensions unless notice of non-renewal is provided by either party. These agreements provide for initial annual base salaries and an annual performance bonus. If an executive officer's employment terminates under certain circumstances, the Company would be liable for any annual performance bonus awarded for the year prior to termination, to the extent unpaid, continued payments equal to
12
months of base salary, monthly reimbursement for
12
months of COBRA premiums, and under certain situations, a pro rata bonus for the year of termination.
12.
Fair Value Measurements
GAAP establishes a hierarchy of valuation techniques based on the observability of inputs used in measuring financial instruments at fair value. GAAP establishes market-based or observable inputs as the preferred source of values, followed by valuation models using management assumptions in the absence of market inputs.
The determination of where an asset or liability falls in the hierarchy requires significant judgment and considers factors specific to the asset or liability. In instances where the determination of the fair value measurement is based on inputs from different levels of the fair value hierarchy, the level in the fair value hierarchy within which the entire fair value measurement falls is based on the lowest level input that is significant to the fair value measurement in its entirety. The Company evaluates its hierarchy disclosures regularly and, depending on various factors, it is possible that an asset or liability may be classified differently from period to period. However, the Company expects that changes in classifications between levels will be rare.
In addition to the disclosures for assets and liabilities required to be measured at fair value at the balance sheet date, companies are required to disclose the estimated fair values of all financial instruments, even if they are not presented at their fair value on the consolidated balance sheet. The fair values of financial instruments are estimates based upon market conditions and perceived risks at December 31, 2020 and 2019. These estimates require management's judgment and may not be indicative of the future fair values of the assets and liabilities.
Financial assets and liabilities for which the carrying values approximate their fair values include cash and cash equivalents, restricted cash, accounts receivable included within prepaid expenses and other assets, dividends payable and accrued liabilities and other payables. Generally, these assets and liabilities are short term in duration and their carrying value approximates fair value on the consolidated balance sheets.
The estimated fair values of the Company's fixed‑rate loans receivable have been derived based on primarily unobservable market inputs such as interest rates and discounted cash flow analyses using estimates of the amount and timing of future cash flows, market rates and credit spreads. These measurements are classified as Level 3 within the fair value hierarchy. The Company believes the carrying value of its fixed-rate loans receivable approximates fair value as of December 31, 2020 and 2019.
The estimated fair values of the Company's borrowings under the Revolving Credit Facility, the April 2019 Term Loan and the November 2019 Term Loan have been derived based on primarily unobservable market inputs such as interest rates and discounted cash flow analyses using estimates of the amount and timing of future cash flows, market rates and credit spreads. These measurements are classified as Level 3 within the fair value hierarchy. The Company believes the carrying value of its borrowings under the Revolving Credit Facility, the April 2019 Term Loan and the November 2019 Term Loan as of December 31, 2020 and 2019 approximate fair value.
The estimated fair values of the Company's secured borrowings have been derived based on primarily unobservable market inputs such as interest rates and discounted cash flow analyses using estimates of the amount and timing of future cash flows, market rates and credit spreads. These measurements are classified as
109
Level 3 within the fair value hierarchy. As of December 31, 2020, the Company's secured borrowings had an aggregate carrying value of $
173.2
million (excluding net deferred financing costs of $
2.2
million) and an estimated fair value of $
176.4
million. As of December 31, 2019, the Company's secured borrowings had an aggregate carrying value of $
239.1
million (excluding net deferred financing costs of $
3.8
million) and an estimated fair value of
247.1
million.
The Company measures its derivative financial instruments at fair value on a recurring basis. The fair values of the Company's derivative financial instruments were determined using widely accepted valuation techniques, including discounted cash flow analysis on the expected cash flows of the derivative financial instrument. This analysis reflected the contractual terms of the derivative, including the period to maturity, and used observable market-based inputs, including interest rate market data and implied volatilities in such interest rates. While it was determined that the majority of the inputs used to value the derivatives fall within Level 2 of the fair value hierarchy under authoritative accounting guidance, the credit valuation adjustments associated with the derivatives also utilized Level 3 inputs, such as estimates of current credit spreads to evaluate the likelihood of default. However, as of December 31, 2020, the significance of the impact of the credit valuation adjustments on the overall valuation of the derivative financial instruments was assessed and it was determined that these adjustments were not significant to the overall valuation of the derivative financial instruments. As a result, it was determined that the derivative financial instruments in their entirety should be classified in Level 2 of the fair value hierarchy. As of December 31, 2020 and 2019, the Company estimated the fair value of its interest rate swap contracts to be a $
38.9
million and $
2.9
million, respectively.
The Company measures its real estate investments at fair value on a nonrecurring basis. The fair values of these real estate investments were determined using the following input levels as of the dates presented:
|
Net
Carrying |
Fair Value Measurements Using Fair
Value Hierarchy |
|||||||||||||||||||||||||||||||
| (in thousands) | Value | Fair Value | Level 1 | Level 2 | Level 3 | |||||||||||||||||||||||||||
| December 31, 2020 | ||||||||||||||||||||||||||||||||
| Non-financial assets: | ||||||||||||||||||||||||||||||||
| Long-lived assets | $ |
|
$ |
|
$ |
|
$ |
|
$ |
|
||||||||||||||||||||||
| December 31, 2019 | ||||||||||||||||||||||||||||||||
| Non-financial assets: | ||||||||||||||||||||||||||||||||
| Long-lived assets | $ |
|
$ |
|
$ |
|
$ |
|
$ |
|
||||||||||||||||||||||
Long-Lived Assets
The Company reviews its investments in real estate when events or circumstances change indicating that the carrying amount of an asset may not be recoverable. In the evaluation of an investment in real estate for impairment, many factors are considered, including estimated current and expected operating cash flows from the asset during the projected holding period, costs necessary to extend the life or improve the asset, expected capitalization rates, projected stabilized net operating income, selling costs, and the ability to hold and dispose of the asset in the ordinary course of business.
Quantitative information about Level 3 fair value measurements as of December 31, 2020 is as follows:
| (dollar amounts in thousands) | Fair Value | Valuation Techniques |
Significant Unobservable
Inputs |
|||||||||||||||||||||||
| Non-financial assets: | ||||||||||||||||||||||||||
| Long-lived assets: | ||||||||||||||||||||||||||
| Restaurant - Family Dining - Inverness, FL | $ |
|
Sales comparison
approach |
Binding sales contract | $ |
|
||||||||||||||||||||
| Restaurant - Family Dining - Nashville, GA |
|
Sales comparison
approach |
Binding sales contract |
|
||||||||||||||||||||||
| Restaurant - Family Dining - Barnesville, GA |
|
Sales comparison
approach |
Non-binding sales contract |
|
||||||||||||||||||||||
| Vacant - Augusta, GA |
|
Sales comparison
approach |
Non-binding sales contract |
|
||||||||||||||||||||||
| Pet Care Services - Arvada, CO |
|
Sales comparison
approach |
Comparable sales prices |
|
||||||||||||||||||||||
110
13.
Related-Party Transactions
During the years ended December 31, 2019 and 2018, an affiliate of Eldridge provided certain treasury and information technology services to the Company. The Company incurred a de minimis amount of expense for these services during the years ended December 31, 2019 and 2018, which is included in general and administrative expense in the Company’s consolidated statements of operations. No services were provided to the Company by Eldridge during the year ended December 31, 2020.
During the year ended December 31, 2018, the Company issued and repaid short-term notes to affiliates of Eldridge. See Note 5—Long Term Debt for additional information.
In May 2019, the Company repurchased a portion of its Class A Series 2016-1 Notes with a face value of $
200
million for $
201.4
million from an affiliate of Eldridge. See Note 5—Long Term Debt for additional information.
14.
Quarterly Results (Unaudited)
Presented below is a summary of unaudited quarterly financial information for the years ended December 31, 2020 and 2019. All adjustments (consisting of only normal recurring accruals) necessary for a fair presentation of the interim periods presented are included. The calculation of basic and diluted per share amounts for each quarter is based on the weighted average shares outstanding for that period; consequently, the sum of the quarters may not necessarily be equal to the full year basic and diluted net income per share.
| Three months ended | ||||||||||||||||||||||||||
| (in thousands, except per share data) | March 31 | June 30 | September 30 | December 31 | ||||||||||||||||||||||
| 2020: | ||||||||||||||||||||||||||
| Total revenues | $ |
|
$ |
|
$ |
|
$ |
|
||||||||||||||||||
| Net income |
|
|
|
|
||||||||||||||||||||||
| Net income attributable to non-controlling interests |
|
|
|
|
||||||||||||||||||||||
| Net income per share of common stock—basic and diluted |
|
|
|
|
||||||||||||||||||||||
| Dividends declared per common share |
|
|
|
|
||||||||||||||||||||||
| 2019: | ||||||||||||||||||||||||||
| Total revenues | $ |
|
$ |
|
$ |
|
$ |
|
||||||||||||||||||
| Net income |
|
|
|
|
||||||||||||||||||||||
| Net income attributable to non-controlling interests |
|
|
|
|
||||||||||||||||||||||
| Net income per share of common stock—basic and diluted |
|
|
|
|
||||||||||||||||||||||
| Dividends declared per common share |
|
|
|
|
||||||||||||||||||||||
15. Subsequent Events
The Company has evaluated all events and transactions that occurred after December 31, 2020 through the filing of this Annual Report on Form 10-K and determined that there have been no events that have occurred that would require adjustment to disclosures in the consolidated financial statements except as disclosed below.
In January and February 2021, the Company issued an aggregate of
102,156
shares of unvested RSUs to the Company’s executive officers and other employees under the Equity Incentive Plan. These awards vest over a period of up to
four years
from the date of grant, subject to the individual recipient’s continued provision of service to the Company through the applicable vesting dates.
111
In February 2021, the Company issued an aggregate of
126,353
performance-based RSUs to the Company's executive officers under the Equity Incentive Plan. These are non-vested share awards and
75
% of the award shall vest based on the Company's TSR as compared to the TSR of
10
peer companies and
25
% of the award shall vest based on the compensation committee's subjective evaluation of the achievement of strategic objectives deemed relevant by the committee. The performance schedule can produce vesting percentages ranging from
0
% to
250
%. TSR will be calculated based upon the average closing price for the
20
-trading day period ending January 1, 2021, divided by the average closing price for the
20
-trading day period ending December 31, 2023.
Subsequent to December 31, 2020, the Company acquired
21
real estate properties with an aggregate investment (including acquisition costs) of $
51.9
million and invested $
1.4
million in new and ongoing construction in progress and reimbursements to tenants for development, construction and renovation costs.
Subsequent to December 31, 2020, the Company sold or transferred its investment in
11
real estate properties for an aggregate gross sales price of $
14.1
million and incurred $
0.7
million of disposition costs related to these transactions.
112
Item 9. Changes in and Disagreements with Accountants on Accounting and Financial Disclosure.
None.
Item 9A. Controls and Procedures.
Disclosure Controls and Procedures
Disclosure controls and procedures are controls and other procedures that are designed to ensure that information we are required to disclose in the reports that we file or submit under the Exchange Act is recorded, processed, summarized and reported, within the time periods specified in the SEC's rules and forms. Disclosure controls and procedures include, without limitation, controls and procedures designed to ensure that information required to be disclosed by us in the reports that we file or submit under the Exchange Act is accumulated and communicated to management, including our Chief Executive Officer and Chief Financial Officer, as appropriate to allow timely decisions regarding required disclosure.
As of the end of the period covered by this Annual Report on Form 10-K, our management evaluated, under the supervision and with the participation of our Chief Executive Officer and Chief Financial Officer, the effectiveness of our disclosure controls and procedures (as such term is defined in Rules 13a-15(e) and 15d-15(e) under the Exchange Act). Based on this evaluation, our Chief Executive Officer and Chief Financial Officer concluded that, as of the end of the period covered by this Annual Report on Form 10-K, our disclosure controls and procedures were effective in providing reasonable assurance of compliance.
Management's Report on Internal Control over Financial Reporting
Our management is responsible for establishing and maintaining adequate internal control over financial reporting (as such term is defined in Rules 13a-15(f) and 15d-15(f) under the Exchange Act). Our internal control system was designed to provide reasonable assurance regarding the reliability of financial reporting and the preparation of financial statements for external purposes, in accordance with generally accepted accounting principles in the United States. Due to inherent limitations, internal control over financial reporting may not prevent or detect misstatements. Also, projections of any evaluation of effectiveness of the internal control over financial reporting to future periods are subject to the risk that controls may become inadequate because of changes in conditions, or that the degree of compliance with policies and procedures may deteriorate. Our management, under the supervision and with the participation of our Chief Executive Officer and Chief Financial Officer, evaluated the effectiveness of our internal control over financial reporting as of the end of the period covered by this Annual Report on Form 10-K based on the framework in Internal Control-Integrated Framework issued by the Committee of Sponsoring Organizations (2013 Framework) (COSO). Based on such evaluation, our management concluded that our internal control over financial reporting was effective as of the end of the period covered by this Annual Report on Form 10-K.
The effectiveness of our internal control over financial reporting as of December 31, 2020 has been audited by Ernst & Young LLP, an independent registered public accounting firm, as stated in their report which is presented in this Annual Report on Form 10-K.
Changes in Internal Control Over Financial Reporting
There have not been any changes in our internal control over financial reporting (as such term is defined in Rules 13a-15(f) and 15d-15(f) under the Exchange Act) during our most recent fiscal quarter that materially affected, or are reasonably likely to materially affect, our internal control over financial reporting.
Item 9B. Other Information.
None.
113
PART III
Item 10. Directors, Executive Officers and Corporate Governance
The information concerning our directors and executive officers required by Item 10 will be included in the Proxy Statement to be filed relating to our 2021 Annual Meeting of Stockholders and is incorporated herein by reference.
Item 11. Executive Compensation.
The information concerning our executive compensation required by Item 11 will be included in the Proxy Statement to be filed relating to our 2021 Annual Meeting of Stockholders and is incorporated herein by reference.
Item 12. Security Ownership of Certain Beneficial Owners and Management and Related Stockholder Matters.
The information concerning our security ownership of certain beneficial owners and management and related stockholder matters (including equity compensation plan information) required by Item 12 will be included in the Proxy Statement to be filed relating to our 2021 Annual Meeting of Stockholders and is incorporated herein by reference.
Item 13. Certain Relationships and Related Transactions, and Director Independence.
The information concerning certain relationships, related transactions and director independence required by Item 13 will be included in the Proxy Statement to be filed relating to our 2021 Annual Meeting of Stockholders and is incorporated herein by reference.
Item 14. Principal Accounting Fees and Services.
The information concerning our principal accounting fees and services required by Item 14 will be included in the Proxy Statement to be filed relating to our 2021 Annual Meeting of Stockholders and is incorporated herein by reference.
114
PART IV
Item 15. Exhibits, Financial Statement Schedules.
(a)
(1) and (2) The following financial statements and financial statement schedules are filed as part of this Annual Report on Form 10-K.
Financial Statements.
(see Item 8)
Report of Independent Registered Public Accounting Firm
Consolidated Balance Sheets as of December 31, 2020 and 2019
Consolidated Statements of Operations for the years ended December 31, 2020, 2019 and 2018
Consolidated Statements of Comprehensive Income for the years ended December 31, 2020, 2019 and 2018
Consolidated Statements of Stockholders'/Members' Equity for the years ended December 31, 2020, 2019 and 2018
Consolidated Statements of Cash Flows for the years ended December 31, 2020, 2019 and 2018
Notes to Consolidated Financial Statements
Financial Statement Schedules.
(see schedules beginning on page F-1)
Schedule III - Real Estate and Accumulated Depreciation
Schedule IV - Mortgage Loans on Real Estate
All other schedules are omitted since the required information is not present or is not present in amounts sufficient to require submission of the schedule, or because the information required is included in the consolidated financial statements and notes thereto.
(b)
Exhibits. The following exhibits are included or incorporated by reference in this Annual Report on Form 10-K (and are numbered in accordance with Item 601 of Regulation S-K).
115
|
Exhibit
Number |
Description | |||||||
| 3.1 | Articles of Amendment and Restatement of Essential Properties Realty Trust, Inc., dated as of June 19, 2018 (Incorporated by reference to Exhibit 3.1 to the Company's Annual Report on Form 10-K filed on February 28, 2019) | |||||||
| 3.2 | Certificate of Correction to the Articles of Amendment and Restatement of Essential Properties Realty Trust, Inc., dated as of February 27, 2019 (Incorporated by reference to Exhibit 3.2 to the Company's Annual Report on Form 10-K filed on February 28, 2019) | |||||||
| 3.3 | Certificate of Notice, dated August 8, 2019 (Incorporated by reference to Exhibit 3.1 to the Company's Current Report on Form 8-K filed on August 8, 2019) | |||||||
| 3.4 | Certificate of Notice, dated February 28, 2020 (Incorporated by reference to Exhibit 3.4 to the Company's Annual Report on Form 10-K filed on March 2, 2020 | |||||||
| 3.5 | Amended and Restated Bylaws of Essential Properties Realty Trust, Inc. (Incorporated by reference to Exhibit 3.1 to the Company's Current Report on Form 8-K filed on November 16, 2020) | |||||||
| 4.1 | Form of Common Stock Certificate (Incorporated by reference to Exhibit 4.1 to the Company's Registration Statement on Form S-11 filed on May 25, 2018) | |||||||
| 4.2 | Amended and Restated Master Indenture dated as of July 11, 2017, among SCF RC Funding I LLC, SCF RC Funding II LLC and SCF RC Funding III LLC, each a Delaware limited liability company, collectively as issuers, and Citibank, N.A., as indenture trustee, relating to Net-Lease Mortgage Notes (Incorporated by reference to Exhibit 4.2 to the Company's Registration Statement on Form S-11 filed on May 25, 2018) | |||||||
| 4.3 | Series 2017-1 Indenture Supplement dated as of July 11, 2017, among SCF RC Funding I LLC, SCF RC Funding II LLC, SCF RC Funding III LLC and Citibank, N.A., as indenture trustee (Incorporated by reference to Exhibit 4.4 to the Company's Registration Statement on Form S-11 filed on May 25, 2018) | |||||||
|
4.4
*
|
Description of the Company's Common Stock, $0.01 par value | |||||||
| 10.1 | Agreement of Limited Partnership of Essential Properties, L.P. (Incorporated by reference to Exhibit 10.1 to the Company's Current Report on Form 8-K filed on June 26, 2018) | |||||||
| 10.2 | Amended and Restated Credit Agreement, dated as of April 12, 2019, among the Company, the Operating Partnership, the several lenders from time to time parties thereto, Barclays Bank PLC, as administrative agent, and Citigroup Global Markets Inc. and Bank of America, N.A., as co-syndication agents (Incorporated by reference to Exhibit 10.1 to the Company's Current Report on Form 8-K filed on April 18, 2019) | |||||||
| 10.3 | First Amendment to Amended and Restated Credit Agreement, dated November 22, 2019, among the Company, the Operating Partnership, Barclays Bank PLC, as administrative agent, and the lenders party thereto (Incorporated by reference to Exhibit 10.2 to the Company's Current Report on Form 8-K filed on November 27, 2019) | |||||||
| 10.4 | Credit Agreement, dated as of November 26, 2019, among the Company, the Operating Partnership, the several lenders from time to time parties thereto, Capital One, National Association, as administrative agent, Suntrust Robinson Humphrey, Inc. and Mizuho Bank Ltd., as co-syndication agents, and Chemical Bank, a division of TCF National Bank, as documentation agent (Incorporated by reference to Exhibit 10.1 to the Company's Current Report on Form 8-K filed on November 27, 2019) | |||||||
| 10.5 | Amended and Restated Property Management and Servicing Agreement dated as of July 11, 2017, among SCF RC Funding I LLC, SCF RC Funding II LLC and SCF RC Funding III LLC, each a Delaware limited liability company, collectively as issuers, SCF Realty Capital LLC, a Delaware limited liability company, as property manager and special servicer, and Midland Loan Services, a division of PNC Bank, National Association, as back-up manager and Citibank, N.A., as indenture trustee (Incorporated by reference to Exhibit 10.14 to the Company's Registration Statement on Form S-11 filed on May 25, 2018) | |||||||
| 10.6† | Employment Agreement between Essential Properties Realty Trust, Inc. and Peter M. Mavoides, effective as of June 25, 2018 (Incorporated by reference to Exhibit 10.15 to the Company's Current Report on Form 8-K filed on June 26, 2018) | |||||||
| 10.7† | Employment Agreement between Essential Properties Realty Trust, Inc. and Gregg A. Seibert, effective as of June 25, 2018 (Incorporated by reference to Exhibit 10.16 to the Company's Current Report on Form 8-K filed on June 26, 2018) | |||||||
| 10.8† | Essential Properties Realty Trust, Inc. 2018 Incentive Award Plan, effective as of June 19, 2018 (Incorporated by reference to Exhibit 10.18 to the Company’s Current Report on Form 8-K filed on June 26, 2018) | |||||||
| 10.9† | Employment Agreement between Essential Properties Realty Trust, Inc. and Mark E. Patten, effective as of August 10, 2020 (Incorporated by reference to Exhibit 10.1 to the Company's Current Report on Form 8-K filed on July 7, 2020) | |||||||
116
|
Exhibit
Number |
Description | |||||||
| 10.10 | Form of Indemnification Agreement between Essential Properties Realty Trust, Inc. and each of its directors and executive officers (Incorporated by reference to Exhibit 10.2 to the Company’s Current Report on Form 8-K filed on July 7, 2020) | |||||||
|
21.1
*
|
Subsidiaries of the Company | |||||||
|
23.1
*
|
Consent of Independent Registered Public Accounting Firm. | |||||||
| 24.1* | Power of Attorney (set forth on the signature page to this Annual Report on Form 10-K) | |||||||
|
31.1
*
|
Certification of Principal Executive Officer Pursuant to Rules 13a-14(a) and 15d-14(a) under the Securities Exchange Act of 1934, as Adopted Pursuant to Section 302 of the Sarbanes-Oxley Act of 2002 | |||||||
|
31.2
*
|
Certification of Principal Financial Officer Pursuant to Rules 13a-14(a) and 15d-14(a) under the Securities Exchange Act of 1934, as Adopted Pursuant to Section 302 of the Sarbanes-Oxley Act of 2002 | |||||||
|
32.1
**
|
Certification of Principal Executive Officer Pursuant to 18 U.S.C. Section 1350, as Adopted Pursuant to Section 906 of the Sarbanes-Oxley Act of 2002 | |||||||
|
32.2
**
|
Certification of Principal Financial Officer Pursuant to 18 U.S.C. Section 1350, as Adopted Pursuant to Section 906 of the Sarbanes-Oxley Act of 2002 | |||||||
| 101.INS* | XBRL Instance Document | |||||||
| 101.SCH* | XBRL Taxonomy Extension Schema Document | |||||||
| 101.CAL* | XBRL Taxonomy Extension Calculation Linkbase Document | |||||||
| 101.DEF* | XBRL Taxonomy Extension Definition Linkbase Document | |||||||
| 101.LAB* | XBRL Taxonomy Extension Label Linkbase Document | |||||||
| 101.PRE* | XBRL Taxonomy Extension Presentation Linkbase Document | |||||||
| 104* | Cover Page Interactive Data File (embedded within the Inline XBRL document) | |||||||
| * | Filed herewith. | ||||
| ** | Furnished herewith. | ||||
| † | Indicates management contract or compensatory plan. | ||||
Item 16. Form 10-K Summary
None
117
SIGNATURES
Pursuant to the requirements of Section 13 or 15(d) of the Securities Exchange Act of 1934, the registrant has duly caused this report to be signed on its behalf by the undersigned thereunto duly authorized
.
| ESSENTIAL PROPERTIES REALTY TRUST, INC. | |||||||||||
| Date: | February 23, 2021 | By: | /s/ Peter M. Mavoides | ||||||||
| Peter M. Mavoides | |||||||||||
| President and Chief Executive Officer | |||||||||||
| (Principal Executive Officer) | |||||||||||
POWER OF ATTORNEY
KNOW ALL PERSONS BY THESE PRESENTS, that each person whose signature appears below does hereby constitute and appoint Peter M. Mavoides and Mark E. Patten, and each of them singly, his or her true and lawful attorneys with full power to them, and each of them singly, to sign for each of the undersigned and in his or her name in the capacities indicated below, any and all amendments to this Annual Report on Form 10-K, and generally to do all such things in our names and in our capacities as officers and directors to enable Essential Properties Realty Trust, Inc. to comply with the provisions of the Securities Exchange Act of 1934, as amended, and all requirements of the Securities and Exchange Commission in connection therewith.
Pursuant to the requirements of the Securities Exchange Act of 1934, this report has been signed below by the following persons on behalf of the registrant and in the capacities and on the dates indicated.
118
| Name | Title | Date | ||||||||||||
| /s/ Peter M. Mavoides | Director, President and Chief Executive Officer | February 23, 2021 | ||||||||||||
| Peter M. Mavoides | (Principal Executive Officer) | |||||||||||||
| /s/ Mark E. Patten | Chief Financial Officer, Treasurer and Executive Vice President | February 23, 2021 | ||||||||||||
| Mark E. Patten | (Principal Financial Officer) | |||||||||||||
| /s/ Timothy J. Earnshaw | Chief Accounting Officer and Senior Vice President | February 23, 2021 | ||||||||||||
| Timothy J. Earnshaw | (Principal Accounting Officer) | |||||||||||||
| /s/ Paul T. Bossidy | Director | February 23, 2021 | ||||||||||||
| Paul T. Bossidy | ||||||||||||||
| /s/ Joyce DeLucca | Director | February 23, 2021 | ||||||||||||
| Joyce DeLucca | ||||||||||||||
| /s/ Scott A. Estes | Director | February 23, 2021 | ||||||||||||
| Scott A. Estes | ||||||||||||||
| /s/ Lawrence J. Minich | Director | February 23, 2021 | ||||||||||||
| Lawrence J. Minich | ||||||||||||||
| /s/ Heather Leed Neary | Director | February 23, 2021 | ||||||||||||
| Heather Leed Neary | ||||||||||||||
| /s/ Stephen D. Sautel | Director | February 23, 2021 | ||||||||||||
| Stephen D. Sautel | ||||||||||||||
| /s/ Janaki Sivanesan | Director | February 23, 2021 | ||||||||||||
| Janaki Sivanesan | ||||||||||||||
119
ESSENTIAL PROPERTIES REALTY TRUST, INC. AND ESSENTIAL PROPERTIES REALTY TRUST, INC. PREDECESSOR
Schedule III - Real Estate and Accumulated Depreciation
As of December 31, 2020
(Dollar amounts in thousands)
| Description(a) | Encumbrances | Initial Cost to Company |
Cost Capitalized Subsequent
to Acquisition |
Gross Amount at
December 31, 2020(b)(c) |
Accumulated Depreciation
(d)(e) |
Year Constructed | Date Acquired | |||||||||||||||||||||||||||||||||||||||||||||||||||||||||||||||||||||||||||||||||||||
| Tenant Industry | City | State | Land & Improvements | Building & Improvements | Land & Improvements | Building & Improvements | Land & Improvements | Building & Improvements | Total | |||||||||||||||||||||||||||||||||||||||||||||||||||||||||||||||||||||||||||||||||||
| Restaurants - Quick Service | Alexander City | AL | {f} | $ |
|
$ |
|
$ |
|
$ |
|
$ |
|
$ |
|
$ |
|
$ |
|
1987 | 6/16/2016 | |||||||||||||||||||||||||||||||||||||||||||||||||||||||||||||||||||||||
| Restaurants - Quick Service | Zanesville | OH | {f} |
|
|
|
|
|
|
|
|
1988 | 6/16/2016 | |||||||||||||||||||||||||||||||||||||||||||||||||||||||||||||||||||||||||||||||
| Restaurants - Quick Service | Belleville | IL | {f} |
|
|
|
|
|
|
|
|
1988 | 6/16/2016 | |||||||||||||||||||||||||||||||||||||||||||||||||||||||||||||||||||||||||||||||
| Restaurants - Quick Service | Grand Rapids | MI | {f} |
|
|
|
|
|
|
|
|
1989 | 6/16/2016 | |||||||||||||||||||||||||||||||||||||||||||||||||||||||||||||||||||||||||||||||
| Restaurants - Quick Service | Petaluma | CA |
|
|
|
|
|
|
|
|
1992 | 6/16/2016 | ||||||||||||||||||||||||||||||||||||||||||||||||||||||||||||||||||||||||||||||||
| Restaurants - Quick Service | Clarkesville | GA |
|
|
|
|
|
|
|
|
6/16/2016 | |||||||||||||||||||||||||||||||||||||||||||||||||||||||||||||||||||||||||||||||||
| Restaurants - Quick Service | Philadelphia | PA |
|
|
|
|
|
|
|
|
1980 | 6/16/2016 | ||||||||||||||||||||||||||||||||||||||||||||||||||||||||||||||||||||||||||||||||
| Other Services | Nashville | TN |
|
|
|
|
|
|
|
|
1992 | 6/16/2016 | ||||||||||||||||||||||||||||||||||||||||||||||||||||||||||||||||||||||||||||||||
| Restaurants - Quick Service | Ruskin | FL | {f} |
|
|
|
|
|
|
|
|
1993 | 6/16/2016 | |||||||||||||||||||||||||||||||||||||||||||||||||||||||||||||||||||||||||||||||
| Restaurants - Quick Service | Brownsville | TX |
|
|
|
|
|
|
|
|
1995 | 6/16/2016 | ||||||||||||||||||||||||||||||||||||||||||||||||||||||||||||||||||||||||||||||||
| Restaurants - Quick Service | Waco | TX |
|
|
(
|
(g) |
(
|
(g) |
|
|
|
|
1991 | 6/16/2016 | ||||||||||||||||||||||||||||||||||||||||||||||||||||||||||||||||||||||||||||||
| Restaurants - Family Dining | Palantine | IL | {f} |
|
|
|
|
|
|
|
|
1990 | 6/16/2016 | |||||||||||||||||||||||||||||||||||||||||||||||||||||||||||||||||||||||||||||||
| Restaurants - Family Dining | LaGrange | IL | {f} |
|
|
|
|
|
|
|
|
1990 | 6/16/2016 | |||||||||||||||||||||||||||||||||||||||||||||||||||||||||||||||||||||||||||||||
| Restaurants - Family Dining | Jacksonville | FL | {f} |
|
|
(
|
(g) |
(
|
(g) |
|
|
|
|
1997 | 6/16/2016 | |||||||||||||||||||||||||||||||||||||||||||||||||||||||||||||||||||||||||||||
| Restaurants - Casual Dining | Corpus Christi | TX |
|
|
|
|
|
|
|
|
2015 | 6/16/2016 | ||||||||||||||||||||||||||||||||||||||||||||||||||||||||||||||||||||||||||||||||
| Restaurants - Casual Dining | Centennial | CO | {f} |
|
|
|
|
|
|
|
|
1993 | 6/16/2016 | |||||||||||||||||||||||||||||||||||||||||||||||||||||||||||||||||||||||||||||||
| Restaurants - Quick Service | Redford | MI |
|
|
|
|
|
|
|
|
1998 | 6/16/2016 | ||||||||||||||||||||||||||||||||||||||||||||||||||||||||||||||||||||||||||||||||
| Other Services | Landrum | SC | {f} |
|
|
|
|
|
|
|
|
1992 | 6/16/2016 | |||||||||||||||||||||||||||||||||||||||||||||||||||||||||||||||||||||||||||||||
| Restaurants - Family Dining | Virginia Beach | VA |
|
|
|
|
|
|
|
|
1997 | 6/16/2016 | ||||||||||||||||||||||||||||||||||||||||||||||||||||||||||||||||||||||||||||||||
| Restaurants - Casual Dining | Thomasville | GA |
|
|
|
|
|
|
|
|
1999 | 6/16/2016 | ||||||||||||||||||||||||||||||||||||||||||||||||||||||||||||||||||||||||||||||||
| Restaurants - Casual Dining | Grapevine | TX |
|
|
|
|
|
|
|
|
1999 | 6/16/2016 | ||||||||||||||||||||||||||||||||||||||||||||||||||||||||||||||||||||||||||||||||
| Restaurants - Family Dining | Plano | TX |
|
|
|
|
|
|
|
|
1998 | 6/16/2016 | ||||||||||||||||||||||||||||||||||||||||||||||||||||||||||||||||||||||||||||||||
| Restaurants - Family Dining | Coon Rapids | MN | {f} |
|
|
|
|
|
|
|
|
1991 | 6/16/2016 | |||||||||||||||||||||||||||||||||||||||||||||||||||||||||||||||||||||||||||||||
| Restaurants - Family Dining | Mankato | MN | {f} |
|
|
|
|
|
|
|
|
1992 | 6/16/2016 | |||||||||||||||||||||||||||||||||||||||||||||||||||||||||||||||||||||||||||||||
| Restaurants - Casual Dining | Omaha | NE | {f} |
|
|
(
|
(g) |
(
|
(g) |
|
|
|
|
1979 | 6/16/2016 | |||||||||||||||||||||||||||||||||||||||||||||||||||||||||||||||||||||||||||||
| Restaurants - Family Dining | Merrillville | IN | {f} |
|
|
|
|
|
|
|
|
1977 | 6/16/2016 | |||||||||||||||||||||||||||||||||||||||||||||||||||||||||||||||||||||||||||||||
| Restaurants - Family Dining | Green Bay | WI |
|
|
|
|
|
|
|
|
1977 | 6/16/2016 | ||||||||||||||||||||||||||||||||||||||||||||||||||||||||||||||||||||||||||||||||
| Restaurants - Family Dining | Appleton | WI |
|
|
|
|
|
|
|
|
1977 | 6/16/2016 | ||||||||||||||||||||||||||||||||||||||||||||||||||||||||||||||||||||||||||||||||
| Restaurants - Family Dining | St. Joseph | MO |
|
|
|
|
|
|
|
|
1978 | 6/16/2016 | ||||||||||||||||||||||||||||||||||||||||||||||||||||||||||||||||||||||||||||||||
| Restaurants - Family Dining | Gladstone | MO |
|
|
|
|
|
|
|
|
1979 | 6/16/2016 | ||||||||||||||||||||||||||||||||||||||||||||||||||||||||||||||||||||||||||||||||
| Restaurants - Family Dining | Brainerd | MN |
|
|
|
|
|
|
|
|
1990 | 6/16/2016 | ||||||||||||||||||||||||||||||||||||||||||||||||||||||||||||||||||||||||||||||||
| Restaurants - Family Dining | Cedar Rapids | IA |
|
|
|
|
|
|
|
|
1994 | 6/16/2016 | ||||||||||||||||||||||||||||||||||||||||||||||||||||||||||||||||||||||||||||||||
| Restaurants - Family Dining | Brooklyn Park | MN |
|
|
|
|
|
|
|
|
1997 | 6/16/2016 | ||||||||||||||||||||||||||||||||||||||||||||||||||||||||||||||||||||||||||||||||
| Restaurants - Quick Service | Pontiac | MI | {f} |
|
|
|
|
|
|
|
|
2003 | 6/16/2016 | |||||||||||||||||||||||||||||||||||||||||||||||||||||||||||||||||||||||||||||||
| Restaurants - Quick Service | Troy | MI |
|
|
|
|
|
|
|
|
6/16/2016 | |||||||||||||||||||||||||||||||||||||||||||||||||||||||||||||||||||||||||||||||||
| Restaurants - Quick Service | Clay | NY | {f} |
|
|
|
|
|
|
|
|
1991 | 6/16/2016 | |||||||||||||||||||||||||||||||||||||||||||||||||||||||||||||||||||||||||||||||
| Restaurants - Quick Service | Buna | TX |
|
|
|
|
|
|
|
|
1976 | 6/16/2016 | ||||||||||||||||||||||||||||||||||||||||||||||||||||||||||||||||||||||||||||||||
| Restaurants - Quick Service | Carthage | TX |
|
|
|
|
|
|
|
|
1975 | 6/16/2016 | ||||||||||||||||||||||||||||||||||||||||||||||||||||||||||||||||||||||||||||||||
F-1
| Description(a) | Encumbrances | Initial Cost to Company |
Cost Capitalized Subsequent
to Acquisition |
Gross Amount at
December 31, 2020(b)(c) |
Accumulated Depreciation
(d)(e) |
Year Constructed | Date Acquired | |||||||||||||||||||||||||||||||||||||||||||||||||||||||||||||||||||||||||
| Tenant Industry | City | State |
Land &
Improvements |
Building &
Improvements |
Land &
Improvements |
Building &
Improvements |
Land &
Improvements |
Building &
Improvements |
Total | |||||||||||||||||||||||||||||||||||||||||||||||||||||||||||||||||||||||
| Restaurants - Quick Service | Dayton | TX | $ |
|
$ |
|
$ |
|
$ |
|
$ |
|
$ |
|
$ |
|
$ |
|
1969 | 6/16/2016 | ||||||||||||||||||||||||||||||||||||||||||||||||||||||||||||
| Restaurants - Quick Service | Diboll | TX |
|
|
|
|
|
|
|
|
1990 | 6/16/2016 | ||||||||||||||||||||||||||||||||||||||||||||||||||||||||||||||||||||
| Restaurants - Quick Service | Huntington | TX |
|
|
|
|
|
|
|
|
1980 | 6/16/2016 | ||||||||||||||||||||||||||||||||||||||||||||||||||||||||||||||||||||
| Restaurants - Quick Service | Huntsville | TX |
|
|
|
|
|
|
|
|
1985 | 6/16/2016 | ||||||||||||||||||||||||||||||||||||||||||||||||||||||||||||||||||||
| Restaurants - Quick Service | Jasper | TX |
|
|
|
|
|
|
|
|
1992 | 6/16/2016 | ||||||||||||||||||||||||||||||||||||||||||||||||||||||||||||||||||||
| Restaurants - Quick Service | Kountze | TX |
|
|
|
|
|
|
|
|
1995 | 6/16/2016 | ||||||||||||||||||||||||||||||||||||||||||||||||||||||||||||||||||||
| Restaurants - Quick Service | Rusk | TX |
|
|
|
|
|
|
|
|
1989 | 6/16/2016 | ||||||||||||||||||||||||||||||||||||||||||||||||||||||||||||||||||||
| Restaurants - Quick Service | Sour Lake | TX |
|
|
|
|
|
|
|
|
1978 | 6/16/2016 | ||||||||||||||||||||||||||||||||||||||||||||||||||||||||||||||||||||
| Restaurants - Quick Service | Vernon | CT |
|
|
|
|
|
|
|
|
1983 | 6/16/2016 | ||||||||||||||||||||||||||||||||||||||||||||||||||||||||||||||||||||
| Restaurants - Quick Service | Battle Creek | MI | {f} |
|
|
|
|
|
|
|
|
1969 | 6/16/2016 | |||||||||||||||||||||||||||||||||||||||||||||||||||||||||||||||||||
| Restaurants - Quick Service | Mt Clemens | MI | {f} |
|
|
|
|
|
|
|
|
1989 | 6/16/2016 | |||||||||||||||||||||||||||||||||||||||||||||||||||||||||||||||||||
| Restaurants - Quick Service | Clio | MI | {f} |
|
|
|
|
|
|
|
|
1991 | 6/16/2016 | |||||||||||||||||||||||||||||||||||||||||||||||||||||||||||||||||||
| Restaurants - Quick Service | Charlotte | MI | {f} |
|
|
|
|
|
|
|
|
1991 | 6/16/2016 | |||||||||||||||||||||||||||||||||||||||||||||||||||||||||||||||||||
| Restaurants - Quick Service | St. Johns | MI | {f} |
|
|
|
|
|
|
|
|
1991 | 6/16/2016 | |||||||||||||||||||||||||||||||||||||||||||||||||||||||||||||||||||
| Automotive Service | Burnsville | MN |
|
|
|
|
|
|
|
|
1973 | 6/16/2016 | ||||||||||||||||||||||||||||||||||||||||||||||||||||||||||||||||||||
| Restaurants - Family Dining | Albert Lea | MN |
|
|
|
|
|
|
|
|
1975 | 6/16/2016 | ||||||||||||||||||||||||||||||||||||||||||||||||||||||||||||||||||||
| Restaurants - Family Dining | Crystal | MN |
|
|
|
|
|
|
|
|
1975 | 6/16/2016 | ||||||||||||||||||||||||||||||||||||||||||||||||||||||||||||||||||||
| Restaurants - Casual Dining | West Monroe | LA | {f} |
|
|
|
|
|
|
|
|
1988 | 6/16/2016 | |||||||||||||||||||||||||||||||||||||||||||||||||||||||||||||||||||
| Restaurants - Quick Service | Greenfield | WI | {f} |
|
|
|
|
|
|
|
|
1983 | 6/16/2016 | |||||||||||||||||||||||||||||||||||||||||||||||||||||||||||||||||||
| Restaurants - Quick Service | Redford | MI |
|
|
|
|
|
|
|
|
6/16/2016 | |||||||||||||||||||||||||||||||||||||||||||||||||||||||||||||||||||||
| Restaurants - Quick Service | Bridgeport | MI |
|
|
|
|
|
|
|
|
1989 | 6/16/2016 | ||||||||||||||||||||||||||||||||||||||||||||||||||||||||||||||||||||
| Restaurants - Quick Service | Birmingham | AL | {f} |
|
|
|
|
|
|
|
|
2000 | 6/16/2016 | |||||||||||||||||||||||||||||||||||||||||||||||||||||||||||||||||||
| Restaurants - Quick Service | Oneonta | AL | {f} |
|
|
|
|
|
|
|
|
1993 | 6/16/2016 | |||||||||||||||||||||||||||||||||||||||||||||||||||||||||||||||||||
| Restaurants - Quick Service | Union City | GA | {f} |
|
|
|
|
|
|
|
|
1976 | 6/16/2016 | |||||||||||||||||||||||||||||||||||||||||||||||||||||||||||||||||||
| Restaurants - Quick Service | Marietta | GA | {f} |
|
|
|
|
|
|
|
|
1979 | 6/16/2016 | |||||||||||||||||||||||||||||||||||||||||||||||||||||||||||||||||||
| Restaurants - Quick Service | Vicksburg | MS | {f} |
|
|
|
|
|
|
|
|
1979 | 6/16/2016 | |||||||||||||||||||||||||||||||||||||||||||||||||||||||||||||||||||
| Restaurants - Quick Service | Riverdale | GA | {f} |
|
|
|
|
|
|
|
|
1978 | 6/16/2016 | |||||||||||||||||||||||||||||||||||||||||||||||||||||||||||||||||||
| Restaurants - Quick Service | Snellville | GA | {f} |
|
|
|
|
|
|
|
|
1981 | 6/16/2016 | |||||||||||||||||||||||||||||||||||||||||||||||||||||||||||||||||||
| Restaurants - Quick Service | Trussville | AL | {f} |
|
|
|
|
|
|
|
|
1996 | 6/16/2016 | |||||||||||||||||||||||||||||||||||||||||||||||||||||||||||||||||||
| Restaurants - Quick Service | Forest Park | GA | {f} |
|
|
|
|
|
|
|
|
1988 | 6/16/2016 | |||||||||||||||||||||||||||||||||||||||||||||||||||||||||||||||||||
| Restaurants - Quick Service | Decatur | GA | {f} |
|
|
|
|
|
|
|
|
1982 | 6/16/2016 | |||||||||||||||||||||||||||||||||||||||||||||||||||||||||||||||||||
| Restaurants - Quick Service | Monroe | GA | {f} |
|
|
|
|
|
|
|
|
1985 | 6/16/2016 | |||||||||||||||||||||||||||||||||||||||||||||||||||||||||||||||||||
| Restaurants - Quick Service | Decatur | GA | {f} |
|
|
|
|
|
|
|
|
1983 | 6/16/2016 | |||||||||||||||||||||||||||||||||||||||||||||||||||||||||||||||||||
| Restaurants - Quick Service | Columbia | SC | {f} |
|
|
|
|
|
|
|
|
1981 | 6/16/2016 | |||||||||||||||||||||||||||||||||||||||||||||||||||||||||||||||||||
| Restaurants - Quick Service | Decatur | GA | {f} |
|
|
|
|
|
|
|
|
1986 | 6/16/2016 | |||||||||||||||||||||||||||||||||||||||||||||||||||||||||||||||||||
| Restaurants - Quick Service | Conyers | GA | {f} |
|
|
|
|
|
|
|
|
1982 | 6/16/2016 | |||||||||||||||||||||||||||||||||||||||||||||||||||||||||||||||||||
| Restaurants - Quick Service | Stockbridge | GA | {f} |
|
|
|
|
|
|
|
|
1975 | 6/16/2016 | |||||||||||||||||||||||||||||||||||||||||||||||||||||||||||||||||||
| Restaurants - Quick Service | Lawrenceville | GA | {f} |
|
|
|
|
|
|
|
|
1988 | 6/16/2016 | |||||||||||||||||||||||||||||||||||||||||||||||||||||||||||||||||||
| Restaurants - Quick Service | Lithonia | GA | {f} |
|
|
|
|
|
|
|
|
1979 | 6/16/2016 | |||||||||||||||||||||||||||||||||||||||||||||||||||||||||||||||||||
| Restaurants - Quick Service | Tucker | GA | {f} |
|
|
|
|
|
|
|
|
1976 | 6/16/2016 | |||||||||||||||||||||||||||||||||||||||||||||||||||||||||||||||||||
| Restaurants - Quick Service | Covington | GA | {f} |
|
|
|
|
|
|
|
|
1979 | 6/16/2016 | |||||||||||||||||||||||||||||||||||||||||||||||||||||||||||||||||||
| Restaurants - Quick Service | Columbus | GA | {f} |
|
|
|
|
|
|
|
|
1987 | 6/16/2016 | |||||||||||||||||||||||||||||||||||||||||||||||||||||||||||||||||||
| Restaurants - Quick Service | Tupelo | MS | {f} |
|
|
|
|
|
|
|
|
2000 | 6/16/2016 | |||||||||||||||||||||||||||||||||||||||||||||||||||||||||||||||||||
| Restaurants - Quick Service | New Albany | MS | {f} |
|
|
|
|
|
|
|
|
1993 | 6/16/2016 | |||||||||||||||||||||||||||||||||||||||||||||||||||||||||||||||||||
| Restaurants - Quick Service | Parkersburg | WV | {f} |
|
|
|
|
|
|
|
|
1976 | 6/16/2016 | |||||||||||||||||||||||||||||||||||||||||||||||||||||||||||||||||||
| Restaurants - Quick Service | Ashland | KY | {f} |
|
|
|
|
|
|
|
|
1979 | 6/16/2016 | |||||||||||||||||||||||||||||||||||||||||||||||||||||||||||||||||||
| Restaurants - Quick Service | Huntington | WV | {f} |
|
|
|
|
|
|
|
|
1979 | 6/16/2016 | |||||||||||||||||||||||||||||||||||||||||||||||||||||||||||||||||||
F-2
| Description(a) | Encumbrances | Initial Cost to Company |
Cost Capitalized Subsequent
to Acquisition |
Gross Amount at
December 31, 2020(b)(c) |
Accumulated Depreciation
(d)(e) |
Year Constructed |
Date
Acquired |
|||||||||||||||||||||||||||||||||||||||||||||||||||||||||||||||||||||||||
| Tenant Industry | City | State |
Land &
Improvements |
Building &
Improvements |
Land &
Improvements |
Building &
Improvements |
Land &
Improvements |
Building &
Improvements |
Total | |||||||||||||||||||||||||||||||||||||||||||||||||||||||||||||||||||||||
| Restaurants - Quick Service | North Little Rock | AR | {f} | $ |
|
$ |
|
$ |
|
$ |
|
$ |
|
$ |
|
$ |
|
|
1978 | 6/16/2016 | ||||||||||||||||||||||||||||||||||||||||||||||||||||||||||||
| Restaurants - Quick Service | Jackson | MS | {f} |
|
|
|
|
|
|
|
|
1981 | 6/16/2016 | |||||||||||||||||||||||||||||||||||||||||||||||||||||||||||||||||||
| Restaurants - Quick Service | Madison | TN | {f} |
|
|
|
|
|
|
|
|
1988 | 6/16/2016 | |||||||||||||||||||||||||||||||||||||||||||||||||||||||||||||||||||
| Restaurants - Quick Service | Little Rock | AR | {f} |
|
|
|
|
|
|
|
|
1979 | 6/16/2016 | |||||||||||||||||||||||||||||||||||||||||||||||||||||||||||||||||||
| Restaurants - Quick Service | Hurricane | WV | {f} |
|
|
|
|
|
|
|
|
1981 | 6/16/2016 | |||||||||||||||||||||||||||||||||||||||||||||||||||||||||||||||||||
| Restaurants - Quick Service | Parkersburg | WV | {f} |
|
|
|
|
|
|
|
|
1982 | 6/16/2016 | |||||||||||||||||||||||||||||||||||||||||||||||||||||||||||||||||||
| Restaurants - Quick Service | Chattanooga | TN | {f} |
|
|
|
|
|
|
|
|
1983 | 6/16/2016 | |||||||||||||||||||||||||||||||||||||||||||||||||||||||||||||||||||
| Restaurants - Quick Service | Knoxville | TN | {f} |
|
|
|
|
|
|
|
|
1981 | 6/16/2016 | |||||||||||||||||||||||||||||||||||||||||||||||||||||||||||||||||||
| Restaurants - Quick Service | Jacksonville | NC |
|
|
|
|
|
|
|
|
1986 | 6/16/2016 | ||||||||||||||||||||||||||||||||||||||||||||||||||||||||||||||||||||
| Restaurants - Quick Service | Knoxville | TN | {f} |
|
|
|
|
|
|
|
|
1982 | 6/16/2016 | |||||||||||||||||||||||||||||||||||||||||||||||||||||||||||||||||||
| Restaurants - Quick Service | Forestdale | AL | {f} |
|
|
|
|
|
|
|
|
1975 | 6/16/2016 | |||||||||||||||||||||||||||||||||||||||||||||||||||||||||||||||||||
| Restaurants - Quick Service | Louisville | KY |
|
|
|
|
|
|
|
|
1988 | 6/16/2016 | ||||||||||||||||||||||||||||||||||||||||||||||||||||||||||||||||||||
| Restaurants - Quick Service | Festus | MO | {f} |
|
|
|
|
|
|
|
|
1979 | 6/16/2016 | |||||||||||||||||||||||||||||||||||||||||||||||||||||||||||||||||||
| Restaurants - Quick Service | Jacksonville | FL | {f} |
|
|
|
|
|
|
|
|
1976 | 6/16/2016 | |||||||||||||||||||||||||||||||||||||||||||||||||||||||||||||||||||
| Restaurants - Quick Service | Jacksonville | FL | {f} |
|
|
|
|
|
|
|
|
1979 | 6/16/2016 | |||||||||||||||||||||||||||||||||||||||||||||||||||||||||||||||||||
| Restaurants - Quick Service | Winter Garden | FL | {f} |
|
|
|
|
|
|
|
|
1987 | 6/16/2016 | |||||||||||||||||||||||||||||||||||||||||||||||||||||||||||||||||||
| Restaurants - Quick Service | Sanford | FL | {f} |
|
|
|
|
|
|
|
|
1986 | 6/16/2016 | |||||||||||||||||||||||||||||||||||||||||||||||||||||||||||||||||||
| Restaurants - Quick Service | Lebanon | TN | {f} |
|
|
|
|
|
|
|
|
1974 | 6/16/2016 | |||||||||||||||||||||||||||||||||||||||||||||||||||||||||||||||||||
| Restaurants - Quick Service | Prattville | AL | {f} |
|
|
|
|
|
|
|
|
1978 | 6/16/2016 | |||||||||||||||||||||||||||||||||||||||||||||||||||||||||||||||||||
| Restaurants - Quick Service | Calhoun | GA | {f} |
|
|
|
|
|
|
|
|
1979 | 6/16/2016 | |||||||||||||||||||||||||||||||||||||||||||||||||||||||||||||||||||
| Restaurants - Quick Service | Mableton | GA | {f} |
|
|
|
|
|
|
|
|
1977 | 6/16/2016 | |||||||||||||||||||||||||||||||||||||||||||||||||||||||||||||||||||
| Restaurants - Quick Service | Brunswick | GA | {f} |
|
|
|
|
|
|
|
|
1995 | 6/16/2016 | |||||||||||||||||||||||||||||||||||||||||||||||||||||||||||||||||||
| Restaurants - Quick Service | Summerville | SC | {f} |
|
|
|
|
|
|
|
|
1978 | 6/16/2016 | |||||||||||||||||||||||||||||||||||||||||||||||||||||||||||||||||||
| Restaurants - Quick Service | Thomaston | GA | {f} |
|
|
|
|
|
|
|
|
1987 | 6/16/2016 | |||||||||||||||||||||||||||||||||||||||||||||||||||||||||||||||||||
| Restaurants - Quick Service | Smyrna | GA | {f} |
|
|
|
|
|
|
|
|
1981 | 6/16/2016 | |||||||||||||||||||||||||||||||||||||||||||||||||||||||||||||||||||
| Restaurants - Quick Service | Smyrna | TN | {f} |
|
|
|
|
|
|
|
|
1982 | 6/16/2016 | |||||||||||||||||||||||||||||||||||||||||||||||||||||||||||||||||||
| Restaurants - Quick Service | Tullahoma | TN | {f} |
|
|
|
|
|
|
|
|
1975 | 6/16/2016 | |||||||||||||||||||||||||||||||||||||||||||||||||||||||||||||||||||
| Restaurants - Quick Service | Shelbyville | TN | {f} |
|
|
|
|
|
|
|
|
1976 | 6/16/2016 | |||||||||||||||||||||||||||||||||||||||||||||||||||||||||||||||||||
| Restaurants - Quick Service | Dallas | GA | {f} |
|
|
|
|
|
|
|
|
1985 | 6/16/2016 | |||||||||||||||||||||||||||||||||||||||||||||||||||||||||||||||||||
| Restaurants - Quick Service | North Charleston | SC | {f} |
|
|
|
|
|
|
|
|
1990 | 6/16/2016 | |||||||||||||||||||||||||||||||||||||||||||||||||||||||||||||||||||
| Restaurants - Quick Service | LaGrange | GA | {f} |
|
|
|
|
|
|
|
|
1985 | 6/16/2016 | |||||||||||||||||||||||||||||||||||||||||||||||||||||||||||||||||||
| Restaurants - Quick Service | Cullman | AL | {f} |
|
|
|
|
|
|
|
|
1999 | 6/16/2016 | |||||||||||||||||||||||||||||||||||||||||||||||||||||||||||||||||||
| Restaurants - Quick Service | Batesville | MS | {f} |
|
|
|
|
|
|
|
|
1992 | 6/16/2016 | |||||||||||||||||||||||||||||||||||||||||||||||||||||||||||||||||||
| Restaurants - Quick Service | Phenix City | AL | {f} |
|
|
|
|
|
|
|
|
1979 | 6/16/2016 | |||||||||||||||||||||||||||||||||||||||||||||||||||||||||||||||||||
| Restaurants - Quick Service | Montgomery | AL | {f} |
|
|
|
|
|
|
|
|
1986 | 6/16/2016 | |||||||||||||||||||||||||||||||||||||||||||||||||||||||||||||||||||
| Restaurants - Quick Service | Starke | FL | {f} |
|
|
|
|
|
|
|
|
1980 | 6/16/2016 | |||||||||||||||||||||||||||||||||||||||||||||||||||||||||||||||||||
| Restaurants - Quick Service | Madisonville | KY | {f} |
|
|
|
|
|
|
|
|
1976 | 6/16/2016 | |||||||||||||||||||||||||||||||||||||||||||||||||||||||||||||||||||
| Restaurants - Quick Service | Marietta | OH | {f} |
|
|
|
|
|
|
|
|
1979 | 6/16/2016 | |||||||||||||||||||||||||||||||||||||||||||||||||||||||||||||||||||
| Restaurants - Quick Service | Hueytown | AL | {f} |
|
|
|
|
|
|
|
|
1979 | 6/16/2016 | |||||||||||||||||||||||||||||||||||||||||||||||||||||||||||||||||||
| Restaurants - Quick Service | Gallipolis | OH | {f} |
|
|
|
|
|
|
|
|
1979 | 6/16/2016 | |||||||||||||||||||||||||||||||||||||||||||||||||||||||||||||||||||
| Restaurants - Quick Service | Valdosta | GA | {f} |
|
|
|
|
|
|
|
|
1980 | 6/16/2016 | |||||||||||||||||||||||||||||||||||||||||||||||||||||||||||||||||||
| Restaurants - Quick Service | Douglas | GA | {f} |
|
|
|
|
|
|
|
|
1979 | 6/16/2016 | |||||||||||||||||||||||||||||||||||||||||||||||||||||||||||||||||||
| Restaurants - Quick Service | Fayetteville | GA | {f} |
|
|
|
|
|
|
|
|
1984 | 6/16/2016 | |||||||||||||||||||||||||||||||||||||||||||||||||||||||||||||||||||
| Restaurants - Quick Service | Troy | AL | {f} |
|
|
|
|
|
|
|
|
1985 | 6/16/2016 | |||||||||||||||||||||||||||||||||||||||||||||||||||||||||||||||||||
| Restaurants - Quick Service | Wetumpka | AL | {f} |
|
|
|
|
|
|
|
|
1986 | 6/16/2016 | |||||||||||||||||||||||||||||||||||||||||||||||||||||||||||||||||||
| Restaurants - Quick Service | St. Albans | WV | {f} |
|
|
|
|
|
|
|
|
1975 | 6/16/2016 | |||||||||||||||||||||||||||||||||||||||||||||||||||||||||||||||||||
| Restaurants - Quick Service | Huntington | WV | {f} |
|
|
|
|
|
|
|
|
1992 | 6/16/2016 | |||||||||||||||||||||||||||||||||||||||||||||||||||||||||||||||||||
| Restaurants - Quick Service | Newburgh | NY | {f} |
|
|
|
|
|
|
|
|
1975 | 6/16/2016 | |||||||||||||||||||||||||||||||||||||||||||||||||||||||||||||||||||
| Restaurants - Quick Service | Erie | PA | {f} |
|
|
|
|
|
|
|
|
1977 | 6/16/2016 | |||||||||||||||||||||||||||||||||||||||||||||||||||||||||||||||||||
| Restaurants - Quick Service | Dickson | TN | {f} |
|
|
|
|
|
|
|
|
1977 | 6/16/2016 | |||||||||||||||||||||||||||||||||||||||||||||||||||||||||||||||||||
| Restaurants - Quick Service | South Daytona | FL | {f} |
|
|
|
|
|
|
|
|
1984 | 6/16/2016 | |||||||||||||||||||||||||||||||||||||||||||||||||||||||||||||||||||
| Restaurants - Quick Service | Milford | NH | {f} |
|
|
|
|
|
|
|
|
1993 | 6/16/2016 | |||||||||||||||||||||||||||||||||||||||||||||||||||||||||||||||||||
F-3
| Description(a) | Encumbrances | Initial Cost to Company |
Cost Capitalized Subsequent
to Acquisition |
Gross Amount at
December 31, 2020(b)(c) |
Accumulated Depreciation
(d)(e) |
Year Constructed | Date Acquired | |||||||||||||||||||||||||||||||||||||||||||||||||||||||||||||||||||||||||||||||
| Tenant Industry | City | State |
Land &
Improvements |
Building &
Improvements |
Land &
Improvements |
Building &
Improvements |
Land &
Improvements |
Building &
Improvements |
Total | |||||||||||||||||||||||||||||||||||||||||||||||||||||||||||||||||||||||||||||
| Restaurants - Quick Service | Portland | OR | {f} | $ |
|
$ |
|
|
|
$ |
|
$ |
|
$ |
|
$ |
|
2015 | 6/16/2016 | |||||||||||||||||||||||||||||||||||||||||||||||||||||||||||||||||||
| Restaurants - Quick Service | Superior | CO | {f} |
|
|
|
|
|
|
|
|
2002 | 6/16/2016 | |||||||||||||||||||||||||||||||||||||||||||||||||||||||||||||||||||||||||
| Restaurants - Casual Dining | Fond du Lac | WI | {f} |
|
|
(
|
(g) |
(
|
(g) |
|
|
|
|
1996 | 6/16/2016 | |||||||||||||||||||||||||||||||||||||||||||||||||||||||||||||||||||||||
| Restaurants - Casual Dining | Alexandria | LA |
|
|
|
|
|
|
|
|
1994 | 6/16/2016 | ||||||||||||||||||||||||||||||||||||||||||||||||||||||||||||||||||||||||||
| Medical / Dental | Hurst | TX |
|
|
|
|
|
|
|
|
1997 | 6/16/2016 | ||||||||||||||||||||||||||||||||||||||||||||||||||||||||||||||||||||||||||
| Restaurants - Quick Service | Jacksonville | FL | {f} |
|
|
|
|
|
|
|
|
2006 | 6/16/2016 | |||||||||||||||||||||||||||||||||||||||||||||||||||||||||||||||||||||||||
| Restaurants - Casual Dining | Fleming Island | FL | {f} |
|
|
|
|
|
|
|
|
2006 | 6/16/2016 | |||||||||||||||||||||||||||||||||||||||||||||||||||||||||||||||||||||||||
| Restaurants - Casual Dining | Port St. Lucie | FL | {f} |
|
|
|
|
|
|
|
|
1988 | 6/16/2016 | |||||||||||||||||||||||||||||||||||||||||||||||||||||||||||||||||||||||||
| Restaurants - Casual Dining | Waycross | GA | {f} |
|
|
|
|
|
|
|
|
1994 | 6/16/2016 | |||||||||||||||||||||||||||||||||||||||||||||||||||||||||||||||||||||||||
| Restaurants - Casual Dining | Kingsland | GA | {f} |
|
|
|
|
|
|
|
|
1995 | 6/16/2016 | |||||||||||||||||||||||||||||||||||||||||||||||||||||||||||||||||||||||||
| Restaurants - Casual Dining | Jacksonville | FL | {f} |
|
|
|
|
|
|
|
|
1995 | 6/16/2016 | |||||||||||||||||||||||||||||||||||||||||||||||||||||||||||||||||||||||||
| Restaurants - Casual Dining | North Fort Myers | FL | {f} |
|
|
|
|
|
|
|
|
1994 | 6/16/2016 | |||||||||||||||||||||||||||||||||||||||||||||||||||||||||||||||||||||||||
| Restaurants - Casual Dining | Cape Coral | FL | {f} |
|
|
|
|
|
|
|
|
1996 | 6/16/2016 | |||||||||||||||||||||||||||||||||||||||||||||||||||||||||||||||||||||||||
| Restaurants - Casual Dining | Panama City Beach | FL | {f} |
|
|
|
|
|
|
|
|
1999 | 6/16/2016 | |||||||||||||||||||||||||||||||||||||||||||||||||||||||||||||||||||||||||
| Restaurants - Casual Dining | Dothan | AL | {f} |
|
|
|
|
|
|
|
|
1993 | 6/16/2016 | |||||||||||||||||||||||||||||||||||||||||||||||||||||||||||||||||||||||||
| Restaurants - Casual Dining | Albany | GA | {f} |
|
|
|
|
|
|
|
|
1991 | 6/16/2016 | |||||||||||||||||||||||||||||||||||||||||||||||||||||||||||||||||||||||||
| Restaurants - Casual Dining | Panama City | FL | {f} |
|
|
|
|
|
|
|
|
1991 | 6/16/2016 | |||||||||||||||||||||||||||||||||||||||||||||||||||||||||||||||||||||||||
| Restaurants - Casual Dining | Valdosta | GA | {f} |
|
|
|
|
|
|
|
|
1994 | 6/16/2016 | |||||||||||||||||||||||||||||||||||||||||||||||||||||||||||||||||||||||||
| Restaurants - Casual Dining | Gainesville | FL | {f} |
|
|
|
|
|
|
|
|
1994 | 6/16/2016 | |||||||||||||||||||||||||||||||||||||||||||||||||||||||||||||||||||||||||
| Restaurants - Casual Dining | Panama City | FL | {f} |
|
|
|
|
|
|
|
|
1999 | 6/16/2016 | |||||||||||||||||||||||||||||||||||||||||||||||||||||||||||||||||||||||||
| Restaurants - Family Dining | Leesburg | FL |
|
|
|
|
|
|
|
|
2007 | 6/16/2016 | ||||||||||||||||||||||||||||||||||||||||||||||||||||||||||||||||||||||||||
| N/A | San Antonio | TX |
|
|
|
|
|
|
|
|
6/16/2016 | |||||||||||||||||||||||||||||||||||||||||||||||||||||||||||||||||||||||||||
| Restaurants - Quick Service | Augusta | GA | {f} |
|
|
(
|
(g) |
(
|
(g) |
|
|
|
|
6/16/2016 | ||||||||||||||||||||||||||||||||||||||||||||||||||||||||||||||||||||||||
| Restaurants - Quick Service | Warner Robins | GA | {f} |
|
|
|
|
|
|
|
|
1975 | 6/16/2016 | |||||||||||||||||||||||||||||||||||||||||||||||||||||||||||||||||||||||||
| Automotive Service | Spring | TX |
|
|
|
|
|
|
|
|
2013 | 8/4/2016 | ||||||||||||||||||||||||||||||||||||||||||||||||||||||||||||||||||||||||||
| Home Furnishings | Frisco | TX |
|
|
|
|
|
|
|
|
2006 | 8/19/2016 | ||||||||||||||||||||||||||||||||||||||||||||||||||||||||||||||||||||||||||
| Convenience Stores | Binghamton | NY |
|
|
|
|
|
|
|
|
1970 | 8/22/2016 | ||||||||||||||||||||||||||||||||||||||||||||||||||||||||||||||||||||||||||
| Convenience Stores | Windsor | NY |
|
|
|
|
|
|
|
|
1980 | 8/22/2016 | ||||||||||||||||||||||||||||||||||||||||||||||||||||||||||||||||||||||||||
| Convenience Stores | Greene | NY |
|
|
|
|
|
|
|
|
1989 | 8/22/2016 | ||||||||||||||||||||||||||||||||||||||||||||||||||||||||||||||||||||||||||
| Convenience Stores | Afton | NY |
|
|
|
|
|
|
|
|
1994 | 8/22/2016 | ||||||||||||||||||||||||||||||||||||||||||||||||||||||||||||||||||||||||||
| Convenience Stores | Lansing | NY |
|
|
|
|
|
|
|
|
2010 | 8/22/2016 | ||||||||||||||||||||||||||||||||||||||||||||||||||||||||||||||||||||||||||
| Convenience Stores | Freeville | NY |
|
|
|
|
|
|
|
|
1994 | 8/22/2016 | ||||||||||||||||||||||||||||||||||||||||||||||||||||||||||||||||||||||||||
| Convenience Stores | Marathon | NY |
|
|
|
|
|
|
|
|
1995 | 8/22/2016 | ||||||||||||||||||||||||||||||||||||||||||||||||||||||||||||||||||||||||||
| Convenience Stores | New Hartford | NY |
|
|
|
|
|
|
|
|
1995 | 8/22/2016 | ||||||||||||||||||||||||||||||||||||||||||||||||||||||||||||||||||||||||||
| Convenience Stores | Chadwicks | NY |
|
|
|
|
|
|
|
|
1987 | 8/22/2016 | ||||||||||||||||||||||||||||||||||||||||||||||||||||||||||||||||||||||||||
| Convenience Stores | Liberty | NY |
|
|
|
|
|
|
|
|
2004 | 8/22/2016 | ||||||||||||||||||||||||||||||||||||||||||||||||||||||||||||||||||||||||||
| Convenience Stores | Earlville | NY |
|
|
|
|
|
|
|
|
1997 | 8/22/2016 | ||||||||||||||||||||||||||||||||||||||||||||||||||||||||||||||||||||||||||
| Convenience Stores | Vestal | NY |
|
|
|
|
|
|
|
|
1996 | 8/22/2016 | ||||||||||||||||||||||||||||||||||||||||||||||||||||||||||||||||||||||||||
| Convenience Stores | Delhi | NY |
|
|
|
|
|
|
|
|
1992 | 8/22/2016 | ||||||||||||||||||||||||||||||||||||||||||||||||||||||||||||||||||||||||||
| Convenience Stores | Franklin | NY |
|
|
|
|
|
|
|
|
1998 | 8/22/2016 | ||||||||||||||||||||||||||||||||||||||||||||||||||||||||||||||||||||||||||
| Convenience Stores | Endicott | NY |
|
|
|
|
|
|
|
|
1995 | 8/22/2016 | ||||||||||||||||||||||||||||||||||||||||||||||||||||||||||||||||||||||||||
| Convenience Stores | Davenport | NY |
|
|
|
|
|
|
|
|
1993 | 8/22/2016 | ||||||||||||||||||||||||||||||||||||||||||||||||||||||||||||||||||||||||||
| Restaurants - Family Dining | Salem | NH |
|
|
|
|
|
|
|
|
1998 | 9/16/2016 | ||||||||||||||||||||||||||||||||||||||||||||||||||||||||||||||||||||||||||
| Other Services | Anniston | AL | {f} |
|
|
|
|
|
|
|
|
1992 | 9/16/2016 | |||||||||||||||||||||||||||||||||||||||||||||||||||||||||||||||||||||||||
| Early Childhood Education | Cumming | GA |
|
|
|
|
|
|
|
|
2001 | 9/30/2016 | ||||||||||||||||||||||||||||||||||||||||||||||||||||||||||||||||||||||||||
F-4
| Description(a) | Encumbrances | Initial Cost to Company |
Cost Capitalized Subsequent
to Acquisition |
Gross Amount at
December 31, 2020(b)(c) |
Accumulated Depreciation
(d)(e) |
Year Constructed | Date Acquired | |||||||||||||||||||||||||||||||||||||||||||||||||||||||||||||||||||||||||||||||||||||
| Tenant Industry | City | State |
Land &
Improvements |
Building &
Improvements |
Land &
Improvements |
Building &
Improvements |
Land &
Improvements |
Building &
Improvements |
Total | |||||||||||||||||||||||||||||||||||||||||||||||||||||||||||||||||||||||||||||||||||
| Early Childhood Education | Suwanee | GA | $ |
|
$ |
|
$ |
|
$ |
|
$ |
|
$ |
|
$ |
|
$ |
|
2009 | 9/30/2016 | ||||||||||||||||||||||||||||||||||||||||||||||||||||||||||||||||||||||||
| Medical / Dental | Fort Worth | TX |
|
|
|
|
|
|
|
|
2017 | 10/12/2016 | ||||||||||||||||||||||||||||||||||||||||||||||||||||||||||||||||||||||||||||||||
| Car Washes | Acworth | GA | {f} |
|
|
|
|
|
|
|
|
2006 | 10/17/2016 | |||||||||||||||||||||||||||||||||||||||||||||||||||||||||||||||||||||||||||||||
| Car Washes | Douglasville | GA | {f} |
|
|
|
|
|
|
|
|
2006 | 10/17/2016 | |||||||||||||||||||||||||||||||||||||||||||||||||||||||||||||||||||||||||||||||
| Car Washes | Hiram | GA | {f} |
|
|
|
|
|
|
|
|
2004 | 10/17/2016 | |||||||||||||||||||||||||||||||||||||||||||||||||||||||||||||||||||||||||||||||
| Car Washes | Marietta | GA | {f} |
|
|
|
|
|
|
|
|
2002 | 10/17/2016 | |||||||||||||||||||||||||||||||||||||||||||||||||||||||||||||||||||||||||||||||
| Medical / Dental | Port Charlotte | FL | {f} |
|
|
|
|
|
|
|
|
2000 | 10/20/2016 | |||||||||||||||||||||||||||||||||||||||||||||||||||||||||||||||||||||||||||||||
| Automotive Service | Lackawanna | NY |
|
|
|
|
|
|
|
|
1987 | 10/28/2016 | ||||||||||||||||||||||||||||||||||||||||||||||||||||||||||||||||||||||||||||||||
| Automotive Service | Cheektowaga | NY |
|
|
|
|
|
|
|
|
1978 | 10/28/2016 | ||||||||||||||||||||||||||||||||||||||||||||||||||||||||||||||||||||||||||||||||
| Automotive Service | Amherst | NY |
|
|
|
|
|
|
|
|
1998 | 10/28/2016 | ||||||||||||||||||||||||||||||||||||||||||||||||||||||||||||||||||||||||||||||||
| Automotive Service | Niagara Falls | NY |
|
|
|
|
|
|
|
|
1985 | 10/28/2016 | ||||||||||||||||||||||||||||||||||||||||||||||||||||||||||||||||||||||||||||||||
| Automotive Service | Williamsville | NY |
|
|
|
|
|
|
|
|
1988 | 10/28/2016 | ||||||||||||||||||||||||||||||||||||||||||||||||||||||||||||||||||||||||||||||||
| Automotive Service | Dunkirk | NY |
|
|
|
|
|
|
|
|
1980 | 10/28/2016 | ||||||||||||||||||||||||||||||||||||||||||||||||||||||||||||||||||||||||||||||||
| Car Washes | Tucson | AZ |
|
|
|
|
|
|
|
|
2010 | 11/9/2016 | ||||||||||||||||||||||||||||||||||||||||||||||||||||||||||||||||||||||||||||||||
| Restaurants - Quick Service | Burlington | IA | {f} |
|
|
|
|
|
|
|
|
1976 | 11/15/2016 | |||||||||||||||||||||||||||||||||||||||||||||||||||||||||||||||||||||||||||||||
| Restaurants - Quick Service | Cedar Rapids | IA | {f} |
|
|
|
|
|
|
|
|
1991 | 11/15/2016 | |||||||||||||||||||||||||||||||||||||||||||||||||||||||||||||||||||||||||||||||
| Restaurants - Quick Service | Fort Madison | IA | {f} |
|
|
|
|
|
|
|
|
1987 | 11/15/2016 | |||||||||||||||||||||||||||||||||||||||||||||||||||||||||||||||||||||||||||||||
| Restaurants - Quick Service | Waterloo | IA | {f} |
|
|
|
|
|
|
|
|
1982 | 11/15/2016 | |||||||||||||||||||||||||||||||||||||||||||||||||||||||||||||||||||||||||||||||
| Restaurants - Quick Service | Nebraska City | NE | {f} |
|
|
|
|
|
|
|
|
2014 | 11/15/2016 | |||||||||||||||||||||||||||||||||||||||||||||||||||||||||||||||||||||||||||||||
| Restaurants - Quick Service | Plattsmouth | NE | {f} |
|
|
|
|
|
|
|
|
1999 | 11/15/2016 | |||||||||||||||||||||||||||||||||||||||||||||||||||||||||||||||||||||||||||||||
| Restaurants - Quick Service | Red Oak | IA | {f} |
|
|
|
|
|
|
|
|
2000 | 11/15/2016 | |||||||||||||||||||||||||||||||||||||||||||||||||||||||||||||||||||||||||||||||
| Movie Theatres | Florence | AL | {f} |
|
|
|
|
|
|
|
|
2015 | 12/19/2016 | |||||||||||||||||||||||||||||||||||||||||||||||||||||||||||||||||||||||||||||||
| Restaurants - Casual Dining | Gardendale | AL | {f} |
|
|
|
|
|
|
|
|
2005 | 12/29/2016 | |||||||||||||||||||||||||||||||||||||||||||||||||||||||||||||||||||||||||||||||
| Restaurants - Casual Dining | Jasper | AL | {f} |
|
|
|
|
|
|
|
|
2005 | 12/29/2016 | |||||||||||||||||||||||||||||||||||||||||||||||||||||||||||||||||||||||||||||||
| Restaurants - Casual Dining | Homewood | AL | {f} |
|
|
|
|
|
|
|
|
1976 | 12/29/2016 | |||||||||||||||||||||||||||||||||||||||||||||||||||||||||||||||||||||||||||||||
| Medical / Dental | Stevenson | AL | {f} |
|
|
|
|
|
|
|
|
1990 | 12/30/2016 | |||||||||||||||||||||||||||||||||||||||||||||||||||||||||||||||||||||||||||||||
| Medical / Dental | Tucson | AZ | {f} |
|
|
|
|
|
|
|
|
1967 | 12/30/2016 | |||||||||||||||||||||||||||||||||||||||||||||||||||||||||||||||||||||||||||||||
| Medical / Dental | Miami | FL | {f} |
|
|
|
|
|
|
|
|
1981 | 12/30/2016 | |||||||||||||||||||||||||||||||||||||||||||||||||||||||||||||||||||||||||||||||
| Medical / Dental | Sarasota | FL | {f} |
|
|
|
|
|
|
|
|
1973 | 12/30/2016 | |||||||||||||||||||||||||||||||||||||||||||||||||||||||||||||||||||||||||||||||
| Medical / Dental | Sarasota | FL | {f} |
|
|
|
|
|
|
|
|
2001 | 12/30/2016 | |||||||||||||||||||||||||||||||||||||||||||||||||||||||||||||||||||||||||||||||
| Medical / Dental | Dalton | GA | {f} |
|
|
|
|
|
|
|
|
1960 | 12/30/2016 | |||||||||||||||||||||||||||||||||||||||||||||||||||||||||||||||||||||||||||||||
| Medical / Dental | Alton | IL | {f} |
|
|
|
|
|
|
|
|
2001 | 12/30/2016 | |||||||||||||||||||||||||||||||||||||||||||||||||||||||||||||||||||||||||||||||
| Medical / Dental | Quincy | IL | {f} |
|
|
|
|
|
|
|
|
2001 | 12/30/2016 | |||||||||||||||||||||||||||||||||||||||||||||||||||||||||||||||||||||||||||||||
| Medical / Dental | Clarksville | IN | {f} |
|
|
|
|
|
|
|
|
1994 | 12/30/2016 | |||||||||||||||||||||||||||||||||||||||||||||||||||||||||||||||||||||||||||||||
| Medical / Dental | Terre Haute | IN | {f} |
|
|
|
|
|
|
|
|
1998 | 12/30/2016 | |||||||||||||||||||||||||||||||||||||||||||||||||||||||||||||||||||||||||||||||
| Medical / Dental | Brewster | MA | {f} |
|
|
|
|
|
|
|
|
1986 | 12/30/2016 | |||||||||||||||||||||||||||||||||||||||||||||||||||||||||||||||||||||||||||||||
| Medical / Dental | Kansas City | MO | {f} |
|
|
|
|
|
|
|
|
1979 | 12/30/2016 | |||||||||||||||||||||||||||||||||||||||||||||||||||||||||||||||||||||||||||||||
| Medical / Dental | Laurel | MS | {f} |
|
|
|
|
|
|
|
|
1970 | 12/30/2016 | |||||||||||||||||||||||||||||||||||||||||||||||||||||||||||||||||||||||||||||||
| Medical / Dental | Picayune | MS | {f} |
|
|
|
|
|
|
|
|
1977 | 12/30/2016 | |||||||||||||||||||||||||||||||||||||||||||||||||||||||||||||||||||||||||||||||
| Medical / Dental | Rochester | NH | {f} |
|
|
|
|
|
|
|
|
1958 | 12/30/2016 | |||||||||||||||||||||||||||||||||||||||||||||||||||||||||||||||||||||||||||||||
| Medical / Dental | Canandaigua | NY | {f} |
|
|
|
|
|
|
|
|
2009 | 12/30/2016 | |||||||||||||||||||||||||||||||||||||||||||||||||||||||||||||||||||||||||||||||
| Medical / Dental | Anderson | SC | {f} |
|
|
|
|
|
|
|
|
1948 | 12/30/2016 | |||||||||||||||||||||||||||||||||||||||||||||||||||||||||||||||||||||||||||||||
| Medical / Dental | Camden | SC | {f} |
|
|
|
|
|
|
|
|
1985 | 12/30/2016 | |||||||||||||||||||||||||||||||||||||||||||||||||||||||||||||||||||||||||||||||
| Medical / Dental | Columbia | SC | {f} |
|
|
|
|
|
|
|
|
1986 | 12/30/2016 | |||||||||||||||||||||||||||||||||||||||||||||||||||||||||||||||||||||||||||||||
| Medical / Dental | Austin | TX | {f} |
|
|
|
|
|
|
|
|
1970 | 12/30/2016 | |||||||||||||||||||||||||||||||||||||||||||||||||||||||||||||||||||||||||||||||
| Medical / Dental | Richmond | TX | {f} |
|
|
|
|
|
|
|
|
1982 | 12/30/2016 | |||||||||||||||||||||||||||||||||||||||||||||||||||||||||||||||||||||||||||||||
| Medical / Dental | Terrell Hills | TX | {f} |
|
|
|
|
|
|
|
|
2002 | 12/30/2016 | |||||||||||||||||||||||||||||||||||||||||||||||||||||||||||||||||||||||||||||||
| Health and Fitness | West Valley City | UT |
|
|
|
|
|
|
|
|
1984 | 12/30/2016 | ||||||||||||||||||||||||||||||||||||||||||||||||||||||||||||||||||||||||||||||||
| Medical / Dental | Rock Springs | WY | {f} |
|
|
|
|
|
|
|
|
2001 | 1/17/2017 | |||||||||||||||||||||||||||||||||||||||||||||||||||||||||||||||||||||||||||||||
F-5
| Description(a) | Encumbrances | Initial Cost to Company |
Cost Capitalized Subsequent
to Acquisition |
Gross Amount at
December 31, 2020(b)(c) |
Accumulated Depreciation
(d)(e) |
Year
Constructed |
Date
Acquired |
|||||||||||||||||||||||||||||||||||||||||||||||||||||||||||||||||||||||||||||||||||||
| Tenant Industry | City | State |
Land &
Improvements |
Building &
Improvements |
Land &
Improvements |
Building &
Improvements |
Land &
Improvements |
Building &
Improvements |
Total | |||||||||||||||||||||||||||||||||||||||||||||||||||||||||||||||||||||||||||||||||||
| Car Washes | Conyers | GA | {f} | $ |
|
$ |
|
$ |
|
$ |
|
$ |
|
$ |
|
$ |
|
$ |
|
2013 | 1/24/2017 | |||||||||||||||||||||||||||||||||||||||||||||||||||||||||||||||||||||||
| Car Washes | Covington | GA | {f} |
|
|
|
|
|
|
|
|
2011 | 1/24/2017 | |||||||||||||||||||||||||||||||||||||||||||||||||||||||||||||||||||||||||||||||
| Movie Theatres | North Myrtle Beach | SC |
|
|
|
|
|
|
|
|
2006 | 1/31/2017 | ||||||||||||||||||||||||||||||||||||||||||||||||||||||||||||||||||||||||||||||||
| Medical / Dental | Bridgeton | MO | {f} |
|
|
|
|
|
|
|
|
1982 | 2/9/2017 | |||||||||||||||||||||||||||||||||||||||||||||||||||||||||||||||||||||||||||||||
| Medical / Dental | Mokena | IL | {f} |
|
|
|
|
|
|
|
|
2008 | 2/9/2017 | |||||||||||||||||||||||||||||||||||||||||||||||||||||||||||||||||||||||||||||||
| Medical / Dental | Lexington | KY | {f} |
|
|
|
|
|
|
|
|
2014 | 2/9/2017 | |||||||||||||||||||||||||||||||||||||||||||||||||||||||||||||||||||||||||||||||
| Medical / Dental | Islip Terrace | NY | {f} |
|
|
|
|
|
|
|
|
1986 | 2/9/2017 | |||||||||||||||||||||||||||||||||||||||||||||||||||||||||||||||||||||||||||||||
| Early Childhood Education | Alpharetta | GA |
|
|
|
|
|
|
|
|
2016 | 2/28/2017 | ||||||||||||||||||||||||||||||||||||||||||||||||||||||||||||||||||||||||||||||||
| Home Furnishings | Westland | MI |
|
|
|
|
|
|
|
|
1987 | 3/1/2017 | ||||||||||||||||||||||||||||||||||||||||||||||||||||||||||||||||||||||||||||||||
| Home Furnishings | Ann Arbor | MI |
|
|
|
|
|
|
|
|
1992 | 3/1/2017 | ||||||||||||||||||||||||||||||||||||||||||||||||||||||||||||||||||||||||||||||||
| Home Furnishings | Muskegon | MI |
|
|
|
|
|
|
|
|
1987 | 3/1/2017 | ||||||||||||||||||||||||||||||||||||||||||||||||||||||||||||||||||||||||||||||||
| Home Furnishings | Battle Creek | MI |
|
|
|
|
|
|
|
|
1996 | 3/1/2017 | ||||||||||||||||||||||||||||||||||||||||||||||||||||||||||||||||||||||||||||||||
| Automotive Service | Frisco | TX |
|
|
|
|
|
|
|
|
2003 | 3/8/2017 | ||||||||||||||||||||||||||||||||||||||||||||||||||||||||||||||||||||||||||||||||
| Automotive Service | Grapevine | TX |
|
|
|
|
|
|
|
|
2001 | 3/8/2017 | ||||||||||||||||||||||||||||||||||||||||||||||||||||||||||||||||||||||||||||||||
| Automotive Service | Prosper | TX |
|
|
|
|
|
|
|
|
2010 | 3/8/2017 | ||||||||||||||||||||||||||||||||||||||||||||||||||||||||||||||||||||||||||||||||
| Automotive Service | Southlake | TX |
|
|
|
|
|
|
|
|
2002 | 3/8/2017 | ||||||||||||||||||||||||||||||||||||||||||||||||||||||||||||||||||||||||||||||||
| Restaurants - Quick Service | Cedartown | GA | {f} |
|
|
|
|
|
|
|
|
1987 | 3/9/2017 | |||||||||||||||||||||||||||||||||||||||||||||||||||||||||||||||||||||||||||||||
| Restaurants - Quick Service | Forsyth | GA | {f} |
|
|
|
|
|
|
|
|
1989 | 3/9/2017 | |||||||||||||||||||||||||||||||||||||||||||||||||||||||||||||||||||||||||||||||
| Convenience Stores | Topeka | KS |
|
|
|
|
|
|
|
|
2008 | 3/10/2017 | ||||||||||||||||||||||||||||||||||||||||||||||||||||||||||||||||||||||||||||||||
| Automotive Service | New Freedom | PA | {f} |
|
|
|
|
|
|
|
|
1997 | 3/28/2017 | |||||||||||||||||||||||||||||||||||||||||||||||||||||||||||||||||||||||||||||||
| Car Washes | Huntingtown | MD | {f} |
|
|
|
|
|
|
|
|
1998 | 3/28/2017 | |||||||||||||||||||||||||||||||||||||||||||||||||||||||||||||||||||||||||||||||
| Automotive Service | Gambrills | MD | {f} |
|
|
|
|
|
|
|
|
2009 | 3/28/2017 | |||||||||||||||||||||||||||||||||||||||||||||||||||||||||||||||||||||||||||||||
| Convenience Stores | Tyler | TX |
|
|
|
|
|
|
|
|
1980 | 3/30/2017 | ||||||||||||||||||||||||||||||||||||||||||||||||||||||||||||||||||||||||||||||||
| Early Childhood Education | San Antonio | TX |
|
|
|
|
|
|
|
|
2016 | 4/25/2017 | ||||||||||||||||||||||||||||||||||||||||||||||||||||||||||||||||||||||||||||||||
| Medical / Dental | Payson | AZ |
|
|
|
|
|
|
|
|
1988 | 4/28/2017 | ||||||||||||||||||||||||||||||||||||||||||||||||||||||||||||||||||||||||||||||||
| Medical / Dental | Brownsville | TX |
|
|
|
|
|
|
|
|
2018 | 5/5/2017 | ||||||||||||||||||||||||||||||||||||||||||||||||||||||||||||||||||||||||||||||||
| Medical / Dental | Baytown | TX |
|
|
|
|
|
|
|
|
2008 | 5/18/2017 | ||||||||||||||||||||||||||||||||||||||||||||||||||||||||||||||||||||||||||||||||
| Car Washes | Las Cruces | NM |
|
|
|
|
|
|
|
|
2008 | 5/24/2017 | ||||||||||||||||||||||||||||||||||||||||||||||||||||||||||||||||||||||||||||||||
| Car Washes | Las Cruces | NM |
|
|
|
|
|
|
|
|
2010 | 5/24/2017 | ||||||||||||||||||||||||||||||||||||||||||||||||||||||||||||||||||||||||||||||||
| Restaurants - Quick Service | Inverness | FL |
|
|
|
|
|
|
|
|
2003 | 5/30/2017 | ||||||||||||||||||||||||||||||||||||||||||||||||||||||||||||||||||||||||||||||||
| Building Materials | Columbia Station | OH | {f} |
|
|
|
|
|
|
|
|
1961 | 6/1/2017 | |||||||||||||||||||||||||||||||||||||||||||||||||||||||||||||||||||||||||||||||
| Building Materials | Maumee | OH | {f} |
|
|
|
|
|
|
|
|
1963 | 6/1/2017 | |||||||||||||||||||||||||||||||||||||||||||||||||||||||||||||||||||||||||||||||
| Building Materials | Troy | OH | {f} |
|
|
|
|
|
|
|
|
1991 | 6/1/2017 | |||||||||||||||||||||||||||||||||||||||||||||||||||||||||||||||||||||||||||||||
| Building Materials | Jackson | OH | {f} |
|
|
|
|
|
|
|
|
1995 | 6/1/2017 | |||||||||||||||||||||||||||||||||||||||||||||||||||||||||||||||||||||||||||||||
| Building Materials | Lancaster | OH | {f} |
|
|
|
|
|
|
|
|
1995 | 6/1/2017 | |||||||||||||||||||||||||||||||||||||||||||||||||||||||||||||||||||||||||||||||
| Building Materials | Portsmouth | OH | {f} |
|
|
|
|
|
|
|
|
1996 | 6/1/2017 | |||||||||||||||||||||||||||||||||||||||||||||||||||||||||||||||||||||||||||||||
| Building Materials | Radcliff | KY | {f} |
|
|
|
|
|
|
|
|
1984 | 6/1/2017 | |||||||||||||||||||||||||||||||||||||||||||||||||||||||||||||||||||||||||||||||
| Building Materials | Gainesville | FL | {f} |
|
|
|
|
|
|
|
|
2003 | 6/1/2017 | |||||||||||||||||||||||||||||||||||||||||||||||||||||||||||||||||||||||||||||||
| Building Materials | Cartersville | GA | {f} |
|
|
|
|
|
|
|
|
2003 | 6/1/2017 | |||||||||||||||||||||||||||||||||||||||||||||||||||||||||||||||||||||||||||||||
| Building Materials | Douglasville | GA | {f} |
|
|
|
|
|
|
|
|
2004 | 6/1/2017 | |||||||||||||||||||||||||||||||||||||||||||||||||||||||||||||||||||||||||||||||
| Building Materials | El Paso | TX | {f} |
|
|
|
|
|
|
|
|
1984 | 6/1/2017 | |||||||||||||||||||||||||||||||||||||||||||||||||||||||||||||||||||||||||||||||
| Building Materials | Garland | TX | {f} |
|
|
|
|
|
|
|
|
2001 | 6/1/2017 | |||||||||||||||||||||||||||||||||||||||||||||||||||||||||||||||||||||||||||||||
F-6
| Description(a) | Encumbrances | Initial Cost to Company |
Cost Capitalized Subsequent
to Acquisition |
Gross Amount at
December 31, 2020(b)(c) |
Accumulated Depreciation
(d)(e) |
Year
Constructed |
Date
Acquired |
|||||||||||||||||||||||||||||||||||||||||||||||||||||||||||||||||||||||||
| Tenant Industry | City | State |
Land &
Improvements |
Building &
Improvements |
Land &
Improvements |
Building &
Improvements |
Land &
Improvements |
Building &
Improvements |
Total | |||||||||||||||||||||||||||||||||||||||||||||||||||||||||||||||||||||||
| Building Materials | Conroe | TX | {f} | $ |
|
$ |
|
$ |
|
$ |
|
$ |
|
$ |
|
$ |
|
$ |
|
2002 | 6/1/2017 | |||||||||||||||||||||||||||||||||||||||||||||||||||||||||||
| Building Materials | Amarillo | TX | {f} |
|
|
|
|
|
|
|
|
2002 | 6/1/2017 | |||||||||||||||||||||||||||||||||||||||||||||||||||||||||||||||||||
| Building Materials | Grand Junction | CO | {f} |
|
|
|
|
|
|
|
|
1983 | 6/1/2017 | |||||||||||||||||||||||||||||||||||||||||||||||||||||||||||||||||||
| Building Materials | Mt. Pleasant | SC | {f} |
|
|
|
|
|
|
|
|
1983 | 6/1/2017 | |||||||||||||||||||||||||||||||||||||||||||||||||||||||||||||||||||
| Building Materials | Irondale | AL | {f} |
|
|
|
|
|
|
|
|
1975 | 6/1/2017 | |||||||||||||||||||||||||||||||||||||||||||||||||||||||||||||||||||
| Building Materials | Bessemer | AL | {f} |
|
|
|
|
|
|
|
|
2002 | 6/1/2017 | |||||||||||||||||||||||||||||||||||||||||||||||||||||||||||||||||||
| Car Washes | Farmington | NM |
|
|
|
|
|
|
|
|
2005 | 6/6/2017 | ||||||||||||||||||||||||||||||||||||||||||||||||||||||||||||||||||||
| Car Washes | Farmington | NM |
|
|
|
|
|
|
|
|
2013 | 6/6/2017 | ||||||||||||||||||||||||||||||||||||||||||||||||||||||||||||||||||||
| Car Washes | Pueblo | CO |
|
|
|
|
|
|
|
|
2008 | 6/6/2017 | ||||||||||||||||||||||||||||||||||||||||||||||||||||||||||||||||||||
| Restaurants - Quick Service | Nashville | GA |
|
|
|
|
|
|
|
|
1991 | 6/6/2017 | ||||||||||||||||||||||||||||||||||||||||||||||||||||||||||||||||||||
| Restaurants - Quick Service | Soperton | GA |
|
|
|
|
|
|
|
|
1992 | 6/6/2017 | ||||||||||||||||||||||||||||||||||||||||||||||||||||||||||||||||||||
| Movie Theatres | Kenosha | WI |
|
|
|
|
|
|
|
|
1997 | 6/8/2017 | ||||||||||||||||||||||||||||||||||||||||||||||||||||||||||||||||||||
| Entertainment | Visalia | CA |
|
|
|
|
|
|
|
|
1984 | 6/30/2017 | ||||||||||||||||||||||||||||||||||||||||||||||||||||||||||||||||||||
| Automotive Service | Knoxville | TN | {f} |
|
|
|
|
|
|
|
|
2008 | 7/21/2017 | |||||||||||||||||||||||||||||||||||||||||||||||||||||||||||||||||||
| Automotive Service | Forest Park | GA | {f} |
|
|
|
|
|
|
|
|
1992 | 7/21/2017 | |||||||||||||||||||||||||||||||||||||||||||||||||||||||||||||||||||
| Automotive Service | Martinez | GA | {f} |
|
|
|
|
|
|
|
|
1992 | 7/21/2017 | |||||||||||||||||||||||||||||||||||||||||||||||||||||||||||||||||||
| Automotive Service | Clarksville | TN | {f} |
|
|
|
|
|
|
|
|
1998 | 7/21/2017 | |||||||||||||||||||||||||||||||||||||||||||||||||||||||||||||||||||
| Automotive Service | Ocala | FL | {f} |
|
|
|
|
|
|
|
|
1989 | 7/21/2017 | |||||||||||||||||||||||||||||||||||||||||||||||||||||||||||||||||||
| Automotive Service | Orlando | FL | {f} |
|
|
|
|
|
|
|
|
1989 | 7/21/2017 | |||||||||||||||||||||||||||||||||||||||||||||||||||||||||||||||||||
| Medical / Dental | Montgomery | AL |
|
|
|
|
|
|
|
|
2001 | 8/7/2017 | ||||||||||||||||||||||||||||||||||||||||||||||||||||||||||||||||||||
| Restaurants - Quick Service | Algona | IA |
|
|
|
|
|
|
|
|
1993 | 8/10/2017 | ||||||||||||||||||||||||||||||||||||||||||||||||||||||||||||||||||||
| Car Washes | Buford | GA | {f} |
|
|
|
|
|
|
|
|
2010 | 8/15/2017 | |||||||||||||||||||||||||||||||||||||||||||||||||||||||||||||||||||
| Early Childhood Education | Orlando | FL |
|
|
|
|
|
|
|
|
2010 | 8/25/2017 | ||||||||||||||||||||||||||||||||||||||||||||||||||||||||||||||||||||
| Automotive Service | Garden City | MI |
|
|
|
|
|
|
|
|
1984 | 8/29/2017 | ||||||||||||||||||||||||||||||||||||||||||||||||||||||||||||||||||||
| Automotive Service | Troy | MI |
|
|
|
|
|
|
|
|
1974 | 8/29/2017 | ||||||||||||||||||||||||||||||||||||||||||||||||||||||||||||||||||||
| Automotive Service | Burton | MI |
|
|
|
|
|
|
|
|
1955 | 8/29/2017 | ||||||||||||||||||||||||||||||||||||||||||||||||||||||||||||||||||||
| Pet Care Services | Arvada | CO |
|
|
(
|
(g) |
(
|
(g) |
|
|
|
|
1982 | 9/5/2017 | ||||||||||||||||||||||||||||||||||||||||||||||||||||||||||||||||||
| Medical / Dental | Round Rock | TX | {f} |
|
|
|
|
|
|
|
|
2016 | 9/12/2017 | |||||||||||||||||||||||||||||||||||||||||||||||||||||||||||||||||||
| Car Washes | Little Rock | AR |
|
|
|
|
|
|
|
|
1976 | 9/12/2017 | ||||||||||||||||||||||||||||||||||||||||||||||||||||||||||||||||||||
| Car Washes | Bryant | AR |
|
|
|
|
|
|
|
|
1997 | 9/20/2017 | ||||||||||||||||||||||||||||||||||||||||||||||||||||||||||||||||||||
| Automotive Service | Longwood | FL | {f} |
|
|
|
|
|
|
|
|
2000 | 9/25/2017 | |||||||||||||||||||||||||||||||||||||||||||||||||||||||||||||||||||
| Car Washes | Anderson | SC |
|
|
|
|
|
|
|
|
2008 | 9/26/2017 | ||||||||||||||||||||||||||||||||||||||||||||||||||||||||||||||||||||
| Car Washes | Cornelia | GA |
|
|
|
|
|
|
|
|
2001 | 9/26/2017 | ||||||||||||||||||||||||||||||||||||||||||||||||||||||||||||||||||||
| Car Washes | South Commerce | GA |
|
|
|
|
|
|
|
|
2016 | 9/26/2017 | ||||||||||||||||||||||||||||||||||||||||||||||||||||||||||||||||||||
| Car Washes | Seneca | SC |
|
|
|
|
|
|
|
|
2005 | 9/26/2017 | ||||||||||||||||||||||||||||||||||||||||||||||||||||||||||||||||||||
| Restaurants - Quick Service | East Bethel | MN |
|
|
|
|
|
|
|
|
1996 | 9/27/2017 | ||||||||||||||||||||||||||||||||||||||||||||||||||||||||||||||||||||
| Restaurants - Quick Service | Isanti | MN |
|
|
|
|
|
|
|
|
1989 | 9/27/2017 | ||||||||||||||||||||||||||||||||||||||||||||||||||||||||||||||||||||
| Convenience Stores | Braham | MN |
|
|
|
|
|
|
|
|
1986 | 9/27/2017 | ||||||||||||||||||||||||||||||||||||||||||||||||||||||||||||||||||||
| Restaurants - Quick Service | Grantsburg | WI |
|
|
|
|
|
|
|
|
2005 | 9/27/2017 | ||||||||||||||||||||||||||||||||||||||||||||||||||||||||||||||||||||
| Health and Fitness | Hobbs | NM |
|
|
|
|
|
|
|
|
2016 | 9/28/2017 | ||||||||||||||||||||||||||||||||||||||||||||||||||||||||||||||||||||
| Health and Fitness | Florence | KY |
|
|
|
|
|
|
|
|
1994 | 9/28/2017 | ||||||||||||||||||||||||||||||||||||||||||||||||||||||||||||||||||||
| Automotive Service | Magnolia | TX |
|
|
|
|
|
|
|
|
2017 | 9/29/2017 | ||||||||||||||||||||||||||||||||||||||||||||||||||||||||||||||||||||
| Early Childhood Education | Winter Garden | FL |
|
|
|
|
|
|
|
|
2015 | 9/29/2017 | ||||||||||||||||||||||||||||||||||||||||||||||||||||||||||||||||||||
| Car Washes | Springdale | AR |
|
|
|
|
|
|
|
|
2009 | 9/29/2017 | ||||||||||||||||||||||||||||||||||||||||||||||||||||||||||||||||||||
| Car Washes | Rogers | AR |
|
|
|
|
|
|
|
|
2005 | 9/29/2017 | ||||||||||||||||||||||||||||||||||||||||||||||||||||||||||||||||||||
| Car Washes | Shreveport | LA |
|
|
|
|
|
|
|
|
2017 | 9/29/2017 | ||||||||||||||||||||||||||||||||||||||||||||||||||||||||||||||||||||
| Convenience Stores | Jacksonville | TX |
|
|
|
|
|
|
|
|
2012 | 9/29/2017 | ||||||||||||||||||||||||||||||||||||||||||||||||||||||||||||||||||||
| Convenience Stores | Daingerfield | TX |
|
|
|
|
|
|
|
|
1979 | 9/29/2017 | ||||||||||||||||||||||||||||||||||||||||||||||||||||||||||||||||||||
| Convenience Stores | Jacksonville | TX |
|
|
|
|
|
|
|
|
1996 | 9/29/2017 | ||||||||||||||||||||||||||||||||||||||||||||||||||||||||||||||||||||
F-7
| Description(a) | Encumbrances | Initial Cost to Company |
Cost Capitalized Subsequent
to Acquisition |
Gross Amount at
December 31, 2020(b)(c) |
Accumulated Depreciation
(d)(e) |
Year Constructed |
Date
Acquired |
|||||||||||||||||||||||||||||||||||||||||||||||||||||||||||||||||||||||||||||||||||||
| Tenant Industry | City | State |
Land &
Improvements |
Building &
Improvements |
Land &
Improvements |
Building &
Improvements |
Land &
Improvements |
Building &
Improvements |
Total | |||||||||||||||||||||||||||||||||||||||||||||||||||||||||||||||||||||||||||||||||||
| Entertainment | Orlando | FL |
|
|
|
|
|
|
|
|
2007 | 9/29/2017 | ||||||||||||||||||||||||||||||||||||||||||||||||||||||||||||||||||||||||||||||||
| Medical / Dental | North Lima | OH |
|
|
|
|
|
|
|
|
1976 | 10/5/2017 | ||||||||||||||||||||||||||||||||||||||||||||||||||||||||||||||||||||||||||||||||
| Medical / Dental | West Lafayette | IN |
|
|
|
|
|
|
|
|
1976 | 10/5/2017 | ||||||||||||||||||||||||||||||||||||||||||||||||||||||||||||||||||||||||||||||||
| Medical / Dental | Salem | OH |
|
|
|
|
|
|
|
|
1985 | 10/5/2017 | ||||||||||||||||||||||||||||||||||||||||||||||||||||||||||||||||||||||||||||||||
| Medical / Dental | Toledo | OH |
|
|
|
|
|
|
|
|
1995 | 10/5/2017 | ||||||||||||||||||||||||||||||||||||||||||||||||||||||||||||||||||||||||||||||||
| Medical / Dental | Pittsburgh | PA |
|
|
|
|
|
|
|
|
1983 | 10/5/2017 | ||||||||||||||||||||||||||||||||||||||||||||||||||||||||||||||||||||||||||||||||
| Medical / Dental | Youngstown | OH |
|
|
|
|
|
|
|
|
1971 | 10/5/2017 | ||||||||||||||||||||||||||||||||||||||||||||||||||||||||||||||||||||||||||||||||
| Medical / Dental | Madison | OH |
|
|
|
|
|
|
|
|
1950 | 10/5/2017 | ||||||||||||||||||||||||||||||||||||||||||||||||||||||||||||||||||||||||||||||||
| Medical / Dental | Youngstown | OH |
|
|
|
|
|
|
|
|
1995 | 10/5/2017 | ||||||||||||||||||||||||||||||||||||||||||||||||||||||||||||||||||||||||||||||||
| Medical / Dental | Penn Yan | NY |
|
|
|
|
|
|
|
|
1986 | 10/5/2017 | ||||||||||||||||||||||||||||||||||||||||||||||||||||||||||||||||||||||||||||||||
| Medical / Dental | Kent | OH | {f} |
|
|
|
|
|
|
|
|
1970 | 10/5/2017 | |||||||||||||||||||||||||||||||||||||||||||||||||||||||||||||||||||||||||||||||
| Convenience Stores | Tyler | TX |
|
|
|
|
|
|
|
|
1996 | 10/16/2017 | ||||||||||||||||||||||||||||||||||||||||||||||||||||||||||||||||||||||||||||||||
| Entertainment | Hoover | AL |
|
|
|
|
|
|
|
|
2017 | 10/13/2017 | ||||||||||||||||||||||||||||||||||||||||||||||||||||||||||||||||||||||||||||||||
| Convenience Stores | Farmington | NM |
|
|
|
|
|
|
|
|
1966 | 11/8/2017 | ||||||||||||||||||||||||||||||||||||||||||||||||||||||||||||||||||||||||||||||||
| Convenience Stores | Farmington | NM |
|
|
|
|
|
|
|
|
1972 | 11/8/2017 | ||||||||||||||||||||||||||||||||||||||||||||||||||||||||||||||||||||||||||||||||
| Convenience Stores | Farmington | NM |
|
|
|
|
|
|
|
|
2013 | 11/8/2017 | ||||||||||||||||||||||||||||||||||||||||||||||||||||||||||||||||||||||||||||||||
| Convenience Stores | Aztec | NM |
|
|
|
|
|
|
|
|
1982 | 11/8/2017 | ||||||||||||||||||||||||||||||||||||||||||||||||||||||||||||||||||||||||||||||||
| Convenience Stores | Farmington | NM |
|
|
|
|
|
|
|
|
1980 | 11/8/2017 | ||||||||||||||||||||||||||||||||||||||||||||||||||||||||||||||||||||||||||||||||
| Convenience Stores | Farmington | NM |
|
|
|
|
|
|
|
|
1980 | 11/8/2017 | ||||||||||||||||||||||||||||||||||||||||||||||||||||||||||||||||||||||||||||||||
| Convenience Stores | Farmington | NM |
|
|
|
|
|
|
|
|
1982 | 11/8/2017 | ||||||||||||||||||||||||||||||||||||||||||||||||||||||||||||||||||||||||||||||||
| Convenience Stores | Ignacio | CO |
|
|
|
|
|
|
|
|
1983 | 11/8/2017 | ||||||||||||||||||||||||||||||||||||||||||||||||||||||||||||||||||||||||||||||||
| Convenience Stores | Farmington | NM |
|
|
|
|
|
|
|
|
1985 | 11/8/2017 | ||||||||||||||||||||||||||||||||||||||||||||||||||||||||||||||||||||||||||||||||
| Convenience Stores | Farmington | NM |
|
|
|
|
|
|
|
|
1990 | 11/8/2017 | ||||||||||||||||||||||||||||||||||||||||||||||||||||||||||||||||||||||||||||||||
| Convenience Stores | Kirtland | NM |
|
|
|
|
|
|
|
|
1980 | 11/8/2017 | ||||||||||||||||||||||||||||||||||||||||||||||||||||||||||||||||||||||||||||||||
| Restaurants - Quick Service | Gray | GA |
|
|
|
|
|
|
|
|
1992 | 11/10/2017 | ||||||||||||||||||||||||||||||||||||||||||||||||||||||||||||||||||||||||||||||||
| Restaurants - Quick Service | Sandersville | GA |
|
|
|
|
|
|
|
|
1989 | 11/10/2017 | ||||||||||||||||||||||||||||||||||||||||||||||||||||||||||||||||||||||||||||||||
| Restaurants - Quick Service | Barnesville | GA |
|
|
(
|
(g) |
(
|
(g) |
|
|
|
|
1996 | 11/10/2017 | ||||||||||||||||||||||||||||||||||||||||||||||||||||||||||||||||||||||||||||||
| Health and Fitness | Greeley | CO |
|
|
|
|
|
|
|
|
1989 | 11/16/2017 | ||||||||||||||||||||||||||||||||||||||||||||||||||||||||||||||||||||||||||||||||
| Restaurants - Quick Service | Hutchinson | KS | {f} |
|
|
|
|
|
|
|
|
1971 | 11/16/2017 | |||||||||||||||||||||||||||||||||||||||||||||||||||||||||||||||||||||||||||||||
| Medical / Dental | Tyler | TX |
|
|
|
|
|
|
|
|
1999 | 11/17/2017 | ||||||||||||||||||||||||||||||||||||||||||||||||||||||||||||||||||||||||||||||||
| Medical / Dental | Lindale | TX |
|
|
|
|
|
|
|
|
2013 | 11/17/2017 | ||||||||||||||||||||||||||||||||||||||||||||||||||||||||||||||||||||||||||||||||
| Convenience Stores | Farmington | NM |
|
|
|
|
|
|
|
|
1998 | 11/21/2017 | ||||||||||||||||||||||||||||||||||||||||||||||||||||||||||||||||||||||||||||||||
| Pet Care Services | Franklin | IN |
|
|
|
|
|
|
|
|
2007 | 12/1/2017 | ||||||||||||||||||||||||||||||||||||||||||||||||||||||||||||||||||||||||||||||||
| Pet Care Services | Fayetteville | AR |
|
|
|
|
|
|
|
|
1979 | 12/1/2017 | ||||||||||||||||||||||||||||||||||||||||||||||||||||||||||||||||||||||||||||||||
| Pet Care Services | Greenwood | IN |
|
|
|
|
|
|
|
|
1952 | 12/1/2017 | ||||||||||||||||||||||||||||||||||||||||||||||||||||||||||||||||||||||||||||||||
| Pet Care Services | Indianapolis | IN |
|
|
|
|
|
|
|
|
1954 | 12/1/2017 | ||||||||||||||||||||||||||||||||||||||||||||||||||||||||||||||||||||||||||||||||
| Early Childhood Education | Lansdowne | VA |
|
|
|
|
|
|
|
|
2006 | 12/4/2017 | ||||||||||||||||||||||||||||||||||||||||||||||||||||||||||||||||||||||||||||||||
| Early Childhood Education | Overland Park | KS |
|
|
|
|
|
|
|
|
2017 | 12/8/2017 | ||||||||||||||||||||||||||||||||||||||||||||||||||||||||||||||||||||||||||||||||
| Restaurants - Casual Dining | Bossier City | LA | {f} |
|
|
|
|
|
|
|
|
1993 | 12/15/2017 | |||||||||||||||||||||||||||||||||||||||||||||||||||||||||||||||||||||||||||||||
| Restaurants - Casual Dining | Augusta | GA |
|
|
|
|
|
|
|
|
1982 | 12/15/2017 | ||||||||||||||||||||||||||||||||||||||||||||||||||||||||||||||||||||||||||||||||
| Movie Theatres | Dublin | OH |
|
|
|
|
|
|
|
|
1994 | 12/15/2017 | ||||||||||||||||||||||||||||||||||||||||||||||||||||||||||||||||||||||||||||||||
| Restaurants - Quick Service | Daleville | AL |
|
|
|
|
|
|
|
|
1983 | 12/19/2017 | ||||||||||||||||||||||||||||||||||||||||||||||||||||||||||||||||||||||||||||||||
| Restaurants - Quick Service | Roanoke | AL |
|
|
|
|
|
|
|
|
1990 | 12/19/2017 | ||||||||||||||||||||||||||||||||||||||||||||||||||||||||||||||||||||||||||||||||
| Restaurants - Quick Service | Jasper | AL |
|
|
|
|
|
|
|
|
2005 | 12/19/2017 | ||||||||||||||||||||||||||||||||||||||||||||||||||||||||||||||||||||||||||||||||
| Restaurants - Quick Service | Alexander City | AL |
|
|
|
|
|
|
|
|
2004 | 12/19/2017 | ||||||||||||||||||||||||||||||||||||||||||||||||||||||||||||||||||||||||||||||||
| Restaurants - Quick Service | Headland | AL |
|
|
|
|
|
|
|
|
2007 | 12/19/2017 | ||||||||||||||||||||||||||||||||||||||||||||||||||||||||||||||||||||||||||||||||
| Restaurants - Quick Service | Tallassee | AL |
|
|
|
|
|
|
|
|
2008 | 12/19/2017 | ||||||||||||||||||||||||||||||||||||||||||||||||||||||||||||||||||||||||||||||||
| Restaurants - Quick Service | Talladega | AL |
|
|
|
|
|
|
|
|
1999 | 12/19/2017 | ||||||||||||||||||||||||||||||||||||||||||||||||||||||||||||||||||||||||||||||||
| Restaurants - Quick Service | Enterprise | AL |
|
|
|
|
|
|
|
|
1974 | 12/19/2017 | ||||||||||||||||||||||||||||||||||||||||||||||||||||||||||||||||||||||||||||||||
F-8
| Description(a) | Encumbrances | Initial Cost to Company |
Cost Capitalized Subsequent
to Acquisition |
Gross Amount at
December 31, 2020(b)(c) |
Depreciation
(d)(e) |
Year
Constructed |
Date
Acquired |
|||||||||||||||||||||||||||||||||||||||||||||||||||||||||||||||||||||||||
| Tenant Industry | City | State |
Land &
Improvements |
Building &
Improvements |
Land &
Improvements |
Building &
Improvements |
Land &
Improvements |
Building &
Improvements |
Total | |||||||||||||||||||||||||||||||||||||||||||||||||||||||||||||||||||||||
| Restaurants - Quick Service | Valley | AL |
|
|
|
|
|
|
|
|
2004 | 12/19/2017 | ||||||||||||||||||||||||||||||||||||||||||||||||||||||||||||||||||||
| Restaurants - Quick Service | Selma | AL |
|
|
|
|
|
|
|
|
1996 | 12/19/2017 | ||||||||||||||||||||||||||||||||||||||||||||||||||||||||||||||||||||
| Restaurants - Casual Dining | Linthcum | MD |
|
|
|
|
|
|
|
|
2004 | 12/21/2017 | ||||||||||||||||||||||||||||||||||||||||||||||||||||||||||||||||||||
| Restaurants - Casual Dining | Pocomoke City | MD |
|
|
|
|
|
|
|
|
2005 | 12/21/2017 | ||||||||||||||||||||||||||||||||||||||||||||||||||||||||||||||||||||
| Restaurants - Casual Dining | D'Iberville | MS |
|
|
|
|
|
|
|
|
2004 | 12/21/2017 | ||||||||||||||||||||||||||||||||||||||||||||||||||||||||||||||||||||
| Restaurants - Casual Dining | Clarksville | TN |
|
|
|
|
|
|
|
|
2003 | 12/21/2017 | ||||||||||||||||||||||||||||||||||||||||||||||||||||||||||||||||||||
| Restaurants - Casual Dining | Scranton | PA |
|
|
|
|
|
|
|
|
1995 | 12/21/2017 | ||||||||||||||||||||||||||||||||||||||||||||||||||||||||||||||||||||
| Restaurants - Casual Dining | Alexander City | AL |
|
|
|
|
|
|
|
|
2007 | 12/21/2017 | ||||||||||||||||||||||||||||||||||||||||||||||||||||||||||||||||||||
| Restaurants - Casual Dining | Columbia | SC |
|
|
(
|
(g) |
(
|
(g) |
|
|
|
|
2003 | 12/21/2017 | ||||||||||||||||||||||||||||||||||||||||||||||||||||||||||||||||||
| Restaurants - Casual Dining | Palm City | FL |
|
|
(
|
(
|
|
|
|
|
2003 | 12/21/2017 | ||||||||||||||||||||||||||||||||||||||||||||||||||||||||||||||||||||
| Restaurants - Casual Dining | St Robert | MO |
|
|
|
|
|
|
|
|
2001 | 12/21/2017 | ||||||||||||||||||||||||||||||||||||||||||||||||||||||||||||||||||||
| Restaurants - Quick Service | Jasper | IN | {f} |
|
|
|
|
|
|
|
|
1998 | 12/22/2017 | |||||||||||||||||||||||||||||||||||||||||||||||||||||||||||||||||||
| Automotive Service | Spring | TX |
|
|
|
|
|
|
|
|
2017 | 12/27/2017 | ||||||||||||||||||||||||||||||||||||||||||||||||||||||||||||||||||||
| Car Washes | Bentonville | AR |
|
|
|
|
|
|
|
|
2017 | 12/28/2017 | ||||||||||||||||||||||||||||||||||||||||||||||||||||||||||||||||||||
| Health and Fitness | Auburn | AL |
|
|
|
|
|
|
|
|
2007 | 12/29/2017 | ||||||||||||||||||||||||||||||||||||||||||||||||||||||||||||||||||||
| Health and Fitness | Columbus | GA |
|
|
|
|
|
|
|
|
2005 | 12/29/2017 | ||||||||||||||||||||||||||||||||||||||||||||||||||||||||||||||||||||
| Early Childhood Education | Southaven | MS |
|
|
|
|
|
|
|
|
2002 | 12/29/2017 | ||||||||||||||||||||||||||||||||||||||||||||||||||||||||||||||||||||
| Restaurants - Quick Service | Saginaw | MI |
|
|
|
|
|
|
|
|
2012 | 1/4/2018 | ||||||||||||||||||||||||||||||||||||||||||||||||||||||||||||||||||||
| Restaurants - Quick Service | Grand Rapids | MI |
|
|
|
|
|
|
|
|
2016 | 1/4/2018 | ||||||||||||||||||||||||||||||||||||||||||||||||||||||||||||||||||||
| Restaurants - Quick Service | Grand Rapids | MI |
|
|
|
|
|
|
|
|
2013 | 1/4/2018 | ||||||||||||||||||||||||||||||||||||||||||||||||||||||||||||||||||||
| Health and Fitness | Wichita | KS |
|
|
|
|
|
|
|
|
2018 | 1/19/2018 | ||||||||||||||||||||||||||||||||||||||||||||||||||||||||||||||||||||
| Convenience Stores | Bloomfield | NM |
|
|
|
|
|
|
|
|
1980 | 1/24/2018 | ||||||||||||||||||||||||||||||||||||||||||||||||||||||||||||||||||||
| Early Childhood Education | Trumbull | CT |
|
|
|
|
|
|
|
|
2018 | 1/31/2018 | ||||||||||||||||||||||||||||||||||||||||||||||||||||||||||||||||||||
| Restaurants - Casual Dining | Davenport | IA | {f} |
|
|
|
|
|
|
|
|
1955 | 2/8/2018 | |||||||||||||||||||||||||||||||||||||||||||||||||||||||||||||||||||
| Restaurants - Casual Dining | Bettendorf | IA | {f} |
|
|
|
|
|
|
|
|
1975 | 2/8/2018 | |||||||||||||||||||||||||||||||||||||||||||||||||||||||||||||||||||
| Restaurants - Casual Dining | Kewanee | IL |
|
|
|
|
|
|
|
|
1993 | 2/8/2018 | ||||||||||||||||||||||||||||||||||||||||||||||||||||||||||||||||||||
| Restaurants - Casual Dining | Davenport | IA |
|
|
|
|
|
|
|
|
1990 | 2/8/2018 | ||||||||||||||||||||||||||||||||||||||||||||||||||||||||||||||||||||
| Restaurants - Casual Dining | Davenport | IA |
|
|
|
|
|
|
|
|
1952 | 2/8/2018 | ||||||||||||||||||||||||||||||||||||||||||||||||||||||||||||||||||||
| Automotive Service | Roseville | MN |
|
|
|
|
|
|
|
|
1971 | 2/16/2018 | ||||||||||||||||||||||||||||||||||||||||||||||||||||||||||||||||||||
| Automotive Service | Woodbury | MN |
|
|
|
|
|
|
|
|
2000 | 2/16/2018 | ||||||||||||||||||||||||||||||||||||||||||||||||||||||||||||||||||||
| Grocery | Burlington | NC |
|
|
|
|
|
|
|
|
1992 | 2/16/2018 | ||||||||||||||||||||||||||||||||||||||||||||||||||||||||||||||||||||
| Health and Fitness | Aiken | SC |
|
|
|
|
|
|
|
|
1998 | 3/1/2018 | ||||||||||||||||||||||||||||||||||||||||||||||||||||||||||||||||||||
| Early Childhood Education | Burlington | CT |
|
|
|
|
|
|
|
|
2004 | 3/9/2018 | ||||||||||||||||||||||||||||||||||||||||||||||||||||||||||||||||||||
| Early Childhood Education | Canton | CT |
|
|
|
|
|
|
|
|
1979 | 3/9/2018 | ||||||||||||||||||||||||||||||||||||||||||||||||||||||||||||||||||||
| Early Childhood Education | Farmington | CT |
|
|
|
|
|
|
|
|
1985 | 3/9/2018 | ||||||||||||||||||||||||||||||||||||||||||||||||||||||||||||||||||||
| Early Childhood Education | Dublin | OH |
|
|
|
|
|
|
|
|
2008 | 3/13/2018 | ||||||||||||||||||||||||||||||||||||||||||||||||||||||||||||||||||||
| Movie Theatres | Shelby | NC |
|
|
|
|
|
|
|
|
2004 | 3/22/2018 | ||||||||||||||||||||||||||||||||||||||||||||||||||||||||||||||||||||
| Health and Fitness | Tulsa | OK |
|
|
|
|
|
|
|
|
2018 | 3/22/2018 | ||||||||||||||||||||||||||||||||||||||||||||||||||||||||||||||||||||
| Automotive Service | Elk River | MN |
|
|
|
|
|
|
|
|
1996 | 3/29/2018 | ||||||||||||||||||||||||||||||||||||||||||||||||||||||||||||||||||||
| Early Childhood Education | San Antonio | TX |
|
|
|
|
|
|
|
|
2007 | 3/29/2018 | ||||||||||||||||||||||||||||||||||||||||||||||||||||||||||||||||||||
| Pet Care Services | Cave Creek | AZ |
|
|
|
|
|
|
|
|
2008 | 4/5/2018 | ||||||||||||||||||||||||||||||||||||||||||||||||||||||||||||||||||||
F-9
| Description(a) | Encumbrances | Initial Cost to Company |
Cost Capitalized Subsequent
to Acquisition |
Gross Amount at
December 31, 2020(b)(c) |
Accumulated Depreciation
(d)(e) |
Year
Constructed |
Date
Acquired |
|||||||||||||||||||||||||||||||||||||||||||||||||||||||||||||||||||||||||
| Tenant Industry | City | State |
Land &
Improvements |
Building &
Improvements |
Land &
Improvements |
Building &
Improvements |
Land &
Improvements |
Building &
Improvements |
Total | |||||||||||||||||||||||||||||||||||||||||||||||||||||||||||||||||||||||
| Pet Care Services | Maricopa | AZ | $ |
|
$ |
|
$ |
|
$ |
|
$ |
|
$ |
|
$ |
|
$ |
|
2008 | 4/5/2018 | ||||||||||||||||||||||||||||||||||||||||||||||||||||||||||||
| Early Childhood Education | Byron Center | MI | {f} |
|
|
|
|
|
|
|
|
2012 | 4/9/2018 | |||||||||||||||||||||||||||||||||||||||||||||||||||||||||||||||||||
| Medical / Dental | Russellville | AR |
|
|
|
|
|
|
|
|
2015 | 4/20/2018 | ||||||||||||||||||||||||||||||||||||||||||||||||||||||||||||||||||||
| Car Washes | Bel Air | MD | {f} |
|
|
|
|
|
|
|
|
2016 | 4/26/2018 | |||||||||||||||||||||||||||||||||||||||||||||||||||||||||||||||||||
| Automotive Service | Apex | NC | {f} |
|
|
|
|
|
|
|
|
2000 | 5/1/2018 | |||||||||||||||||||||||||||||||||||||||||||||||||||||||||||||||||||
| Automotive Service | Holly Springs | NC | {f} |
|
|
|
|
|
|
|
|
2003 | 5/1/2018 | |||||||||||||||||||||||||||||||||||||||||||||||||||||||||||||||||||
| Automotive Service | Fuquay Varina | NC | {f} |
|
|
|
|
|
|
|
|
2008 | 5/1/2018 | |||||||||||||||||||||||||||||||||||||||||||||||||||||||||||||||||||
| Movie Theatres | Decatur | AL |
|
|
|
|
|
|
|
|
2013 | 5/10/2018 | ||||||||||||||||||||||||||||||||||||||||||||||||||||||||||||||||||||
| Automotive Service | North Canton | OH |
|
|
|
|
|
|
|
|
1960 | 5/17/2018 | ||||||||||||||||||||||||||||||||||||||||||||||||||||||||||||||||||||
| Automotive Service | Clinton Township | MI |
|
|
|
|
|
|
|
|
1983 | 5/17/2018 | ||||||||||||||||||||||||||||||||||||||||||||||||||||||||||||||||||||
| Automotive Service | Baltimore | MD |
|
|
|
|
|
|
|
|
1952 | 5/17/2018 | ||||||||||||||||||||||||||||||||||||||||||||||||||||||||||||||||||||
| Convenience Stores | Sartell | MN |
|
|
|
|
|
|
|
|
2013 | 5/17/2018 | ||||||||||||||||||||||||||||||||||||||||||||||||||||||||||||||||||||
| Convenience Stores | St. Augusta | MN |
|
|
|
|
|
|
|
|
1978 | 5/17/2018 | ||||||||||||||||||||||||||||||||||||||||||||||||||||||||||||||||||||
| Convenience Stores | Rice | MN |
|
|
|
|
|
|
|
|
2005 | 5/17/2018 | ||||||||||||||||||||||||||||||||||||||||||||||||||||||||||||||||||||
| Convenience Stores | Pine City | MN |
|
|
|
|
|
|
|
|
1967 | 5/17/2018 | ||||||||||||||||||||||||||||||||||||||||||||||||||||||||||||||||||||
| Convenience Stores | Cambridge | MN |
|
|
|
|
|
|
|
|
2007 | 5/17/2018 | ||||||||||||||||||||||||||||||||||||||||||||||||||||||||||||||||||||
| Early Childhood Education | Acworth | GA | {f} |
|
|
|
|
|
|
|
|
2000 | 5/18/2018 | |||||||||||||||||||||||||||||||||||||||||||||||||||||||||||||||||||
| Pet Care Services | Lakewood Ranch | FL |
|
|
|
|
|
|
|
|
2019 | 5/24/2018 | ||||||||||||||||||||||||||||||||||||||||||||||||||||||||||||||||||||
| Other Services | Bluff City | TN |
|
|
|
|
|
|
|
|
1949 | 6/1/2018 | ||||||||||||||||||||||||||||||||||||||||||||||||||||||||||||||||||||
| Other Services | Erwin | TN |
|
|
|
|
|
|
|
|
1981 | 6/1/2018 | ||||||||||||||||||||||||||||||||||||||||||||||||||||||||||||||||||||
| Other Services | Sparta | NC |
|
|
|
|
|
|
|
|
1973 | 6/1/2018 | ||||||||||||||||||||||||||||||||||||||||||||||||||||||||||||||||||||
| Other Services | Kingsport | TN |
|
|
|
|
|
|
|
|
1979 | 6/1/2018 | ||||||||||||||||||||||||||||||||||||||||||||||||||||||||||||||||||||
| Other Services | Cleveland | TN |
|
|
|
|
|
|
|
|
1975 | 6/1/2018 | ||||||||||||||||||||||||||||||||||||||||||||||||||||||||||||||||||||
| Other Services | Cleveland | TN |
|
|
|
|
|
|
|
|
1964 | 6/1/2018 | ||||||||||||||||||||||||||||||||||||||||||||||||||||||||||||||||||||
| Other Services | Castlewood | VA |
|
|
|
|
|
|
|
|
1991 | 6/1/2018 | ||||||||||||||||||||||||||||||||||||||||||||||||||||||||||||||||||||
| Other Services | Covington | GA |
|
|
|
|
|
|
|
|
1991 | 6/1/2018 | ||||||||||||||||||||||||||||||||||||||||||||||||||||||||||||||||||||
| Other Services | Harlem | GA |
|
|
|
|
|
|
|
|
1895 | 6/1/2018 | ||||||||||||||||||||||||||||||||||||||||||||||||||||||||||||||||||||
| Other Services | London | KY |
|
|
|
|
|
|
|
|
1999 | 6/1/2018 | ||||||||||||||||||||||||||||||||||||||||||||||||||||||||||||||||||||
| Other Services | Elizabethton | TN |
|
|
|
|
|
|
|
|
2010 | 6/1/2018 | ||||||||||||||||||||||||||||||||||||||||||||||||||||||||||||||||||||
| Other Services | Elizabethton | TN |
|
|
|
|
|
|
|
|
1996 | 6/1/2018 | ||||||||||||||||||||||||||||||||||||||||||||||||||||||||||||||||||||
| Other Services | Mountain City | TN |
|
|
|
|
|
|
|
|
1936 | 6/1/2018 | ||||||||||||||||||||||||||||||||||||||||||||||||||||||||||||||||||||
| Convenience Stores | Mosinee | WI |
|
|
|
|
|
|
|
|
1994 | 6/15/2018 | ||||||||||||||||||||||||||||||||||||||||||||||||||||||||||||||||||||
| Convenience Stores | Wausau | WI |
|
|
|
|
|
|
|
|
1995 | 6/15/2018 | ||||||||||||||||||||||||||||||||||||||||||||||||||||||||||||||||||||
| Convenience Stores | Wausau | WI |
|
|
|
|
|
|
|
|
1995 | 6/15/2018 | ||||||||||||||||||||||||||||||||||||||||||||||||||||||||||||||||||||
| Convenience Stores | Wausau | WI |
|
|
|
|
|
|
|
|
1989 | 6/15/2018 | ||||||||||||||||||||||||||||||||||||||||||||||||||||||||||||||||||||
| Convenience Stores | Wausau | WI |
|
|
|
|
|
|
|
|
1991 | 6/15/2018 | ||||||||||||||||||||||||||||||||||||||||||||||||||||||||||||||||||||
| Convenience Stores | Prentice | WI |
|
|
|
|
|
|
|
|
1989 | 6/15/2018 | ||||||||||||||||||||||||||||||||||||||||||||||||||||||||||||||||||||
| Convenience Stores | Rothschild | WI |
|
|
|
|
|
|
|
|
1985 | 6/15/2018 | ||||||||||||||||||||||||||||||||||||||||||||||||||||||||||||||||||||
| Convenience Stores | Phillips | WI |
|
|
|
|
|
|
|
|
1970 | 6/15/2018 | ||||||||||||||||||||||||||||||||||||||||||||||||||||||||||||||||||||
| Convenience Stores | Pound | WI |
|
|
|
|
|
|
|
|
1983 | 6/15/2018 | ||||||||||||||||||||||||||||||||||||||||||||||||||||||||||||||||||||
| Convenience Stores | Gillett | WI |
|
|
|
|
|
|
|
|
1990 | 6/15/2018 | ||||||||||||||||||||||||||||||||||||||||||||||||||||||||||||||||||||
| Convenience Stores | Tigerton | WI |
|
|
|
|
|
|
|
|
1998 | 6/15/2018 | ||||||||||||||||||||||||||||||||||||||||||||||||||||||||||||||||||||
| Convenience Stores | Stevens Point | WI |
|
|
|
|
|
|
|
|
1993 | 6/15/2018 | ||||||||||||||||||||||||||||||||||||||||||||||||||||||||||||||||||||
| Convenience Stores | Merrill | WI |
|
|
|
|
|
|
|
|
1996 | 6/15/2018 | ||||||||||||||||||||||||||||||||||||||||||||||||||||||||||||||||||||
| Convenience Stores | Tomahawk | WI |
|
|
|
|
|
|
|
|
1992 | 6/15/2018 | ||||||||||||||||||||||||||||||||||||||||||||||||||||||||||||||||||||
| Convenience Stores | Marathon | WI |
|
|
|
|
|
|
|
|
1987 | 6/15/2018 | ||||||||||||||||||||||||||||||||||||||||||||||||||||||||||||||||||||
| Convenience Stores | Edgar | WI |
|
|
|
|
|
|
|
|
1984 | 6/15/2018 | ||||||||||||||||||||||||||||||||||||||||||||||||||||||||||||||||||||
| Convenience Stores | Plover | WI |
|
|
|
|
|
|
|
|
2006 | 6/15/2018 | ||||||||||||||||||||||||||||||||||||||||||||||||||||||||||||||||||||
| Convenience Stores | Hatley | WI |
|
|
|
|
|
|
|
|
1997 | 6/15/2018 | ||||||||||||||||||||||||||||||||||||||||||||||||||||||||||||||||||||
F-10
| Description(a) | Encumbrances | Initial Cost to Company |
Cost Capitalized Subsequent
to Acquisition |
Gross Amount at
December 31, 2020(b)(c) |
Accumulated Depreciation
(d)(e) |
Year
Constructed |
Date
Acquired |
|||||||||||||||||||||||||||||||||||||||||||||||||||||||||||||||||||||||||
| Tenant Industry | City | State |
Land &
Improvements |
Building &
Improvements |
Land &
Improvements |
Building &
Improvements |
Land &
Improvements |
Building &
Improvements |
Total | |||||||||||||||||||||||||||||||||||||||||||||||||||||||||||||||||||||||
| Convenience Stores | Minoqua | WI | $ |
|
$ |
|
$ |
|
$ |
|
$ |
|
$ |
|
$ |
|
$ |
|
1984 | 6/15/2018 | ||||||||||||||||||||||||||||||||||||||||||||||||||||||||||||
| Convenience Stores | Wittenberg | WI |
|
|
|
|
|
|
|
|
1999 | 6/15/2018 | ||||||||||||||||||||||||||||||||||||||||||||||||||||||||||||||||||||
| Convenience Stores | Rudolph | WI |
|
|
|
|
|
|
|
|
1992 | 6/15/2018 | ||||||||||||||||||||||||||||||||||||||||||||||||||||||||||||||||||||
| Convenience Stores | Mountain | WI |
|
|
|
|
|
|
|
|
1998 | 6/15/2018 | ||||||||||||||||||||||||||||||||||||||||||||||||||||||||||||||||||||
| Convenience Stores | Park Falls | WI |
|
|
|
|
|
|
|
|
1984 | 6/15/2018 | ||||||||||||||||||||||||||||||||||||||||||||||||||||||||||||||||||||
| Convenience Stores | Weston | WI |
|
|
|
|
|
|
|
|
1993 | 6/15/2018 | ||||||||||||||||||||||||||||||||||||||||||||||||||||||||||||||||||||
| Early Childhood Education | Surprise | AZ |
|
|
|
|
|
|
|
|
2008 | 6/21/2018 | ||||||||||||||||||||||||||||||||||||||||||||||||||||||||||||||||||||
| Car Washes | Fayetteville | AR |
|
|
|
|
|
|
|
|
2018 | 6/21/2018 | ||||||||||||||||||||||||||||||||||||||||||||||||||||||||||||||||||||
| Early Childhood Education | Malvern | PA |
|
|
|
|
|
|
|
|
2006 | 6/28/2018 | ||||||||||||||||||||||||||||||||||||||||||||||||||||||||||||||||||||
| Early Childhood Education | Frazer | PA |
|
|
|
|
|
|
|
|
1998 | 6/28/2018 | ||||||||||||||||||||||||||||||||||||||||||||||||||||||||||||||||||||
| Early Childhood Education | Glen Mills | PA |
|
|
|
|
|
|
|
|
1992 | 6/28/2018 | ||||||||||||||||||||||||||||||||||||||||||||||||||||||||||||||||||||
| Early Childhood Education | Erial | NJ |
|
|
|
|
|
|
|
|
2000 | 6/28/2018 | ||||||||||||||||||||||||||||||||||||||||||||||||||||||||||||||||||||
| Early Childhood Education | Exton | PA |
|
|
|
|
|
|
|
|
2000 | 6/28/2018 | ||||||||||||||||||||||||||||||||||||||||||||||||||||||||||||||||||||
| Early Childhood Education | Voorhees | NJ |
|
|
|
|
|
|
|
|
2002 | 6/28/2018 | ||||||||||||||||||||||||||||||||||||||||||||||||||||||||||||||||||||
| Early Childhood Education | Royersford | PA |
|
|
|
|
|
|
|
|
2002 | 6/28/2018 | ||||||||||||||||||||||||||||||||||||||||||||||||||||||||||||||||||||
| Early Childhood Education | West Norriton | PA |
|
|
|
|
|
|
|
|
2003 | 6/28/2018 | ||||||||||||||||||||||||||||||||||||||||||||||||||||||||||||||||||||
| Early Childhood Education | King of Prussia | PA |
|
|
|
|
|
|
|
|
2004 | 6/28/2018 | ||||||||||||||||||||||||||||||||||||||||||||||||||||||||||||||||||||
| Early Childhood Education | Downingtown | PA |
|
|
|
|
|
|
|
|
2007 | 6/28/2018 | ||||||||||||||||||||||||||||||||||||||||||||||||||||||||||||||||||||
| Early Childhood Education | Collegeville | PA |
|
|
|
|
|
|
|
|
2008 | 6/28/2018 | ||||||||||||||||||||||||||||||||||||||||||||||||||||||||||||||||||||
| Early Childhood Education | Phoenixville | PA |
|
|
|
|
|
|
|
|
2010 | 6/28/2018 | ||||||||||||||||||||||||||||||||||||||||||||||||||||||||||||||||||||
| Early Childhood Education | Blue Bell | PA |
|
|
|
|
|
|
|
|
1967 | 6/28/2018 | ||||||||||||||||||||||||||||||||||||||||||||||||||||||||||||||||||||
| Medical / Dental | Mountain Grove | MO |
|
|
|
|
|
|
|
|
2012 | 6/28/2018 | ||||||||||||||||||||||||||||||||||||||||||||||||||||||||||||||||||||
| Medical / Dental | Harrison | AR |
|
|
|
|
|
|
|
|
2006 | 6/28/2018 | ||||||||||||||||||||||||||||||||||||||||||||||||||||||||||||||||||||
| Medical / Dental | Jonesboro | AR |
|
|
|
|
|
|
|
|
2005 | 6/28/2018 | ||||||||||||||||||||||||||||||||||||||||||||||||||||||||||||||||||||
| Medical / Dental | El Dorado | AR |
|
|
|
|
|
|
|
|
2000 | 6/28/2018 | ||||||||||||||||||||||||||||||||||||||||||||||||||||||||||||||||||||
| Medical / Dental | Berryville | AR |
|
|
|
|
|
|
|
|
2000 | 6/28/2018 | ||||||||||||||||||||||||||||||||||||||||||||||||||||||||||||||||||||
| Medical / Dental | Batesville | AR |
|
|
|
|
|
|
|
|
2017 | 6/28/2018 | ||||||||||||||||||||||||||||||||||||||||||||||||||||||||||||||||||||
| Health and Fitness | Salisbury | MA |
|
|
|
|
|
|
|
|
2004 | 6/29/2018 | ||||||||||||||||||||||||||||||||||||||||||||||||||||||||||||||||||||
| Health and Fitness | Peabody | MA |
|
|
|
|
|
|
|
|
2009 | 6/29/2018 | ||||||||||||||||||||||||||||||||||||||||||||||||||||||||||||||||||||
| Health and Fitness | Methuen | MA |
|
|
|
|
|
|
|
|
2002 | 6/29/2018 | ||||||||||||||||||||||||||||||||||||||||||||||||||||||||||||||||||||
| Health and Fitness | Moncks Corner | SC |
|
|
|
|
|
|
|
|
2002 | 6/29/2018 | ||||||||||||||||||||||||||||||||||||||||||||||||||||||||||||||||||||
| Medical / Dental | Brownsville | TX |
|
|
|
|
|
|
|
|
2008 | 7/13/2018 | ||||||||||||||||||||||||||||||||||||||||||||||||||||||||||||||||||||
| Pet Care Services | Mesa | AZ |
|
|
|
|
|
|
|
|
1990 | 7/13/2018 | ||||||||||||||||||||||||||||||||||||||||||||||||||||||||||||||||||||
| Pet Care Services | Chandler | AZ |
|
|
|
|
|
|
|
|
2002 | 7/13/2018 | ||||||||||||||||||||||||||||||||||||||||||||||||||||||||||||||||||||
| Pet Care Services | Green Valley | AZ |
|
|
|
|
|
|
|
|
2015 | 7/13/2018 | ||||||||||||||||||||||||||||||||||||||||||||||||||||||||||||||||||||
| Restaurants - Quick Service | Brownsville | KY |
|
|
|
|
|
|
|
|
1990 | 7/18/2018 | ||||||||||||||||||||||||||||||||||||||||||||||||||||||||||||||||||||
| Car Washes | Athen | GA |
|
|
|
|
|
|
|
|
2006 | 7/26/2018 | ||||||||||||||||||||||||||||||||||||||||||||||||||||||||||||||||||||
| Car Washes | Winder | GA |
|
|
|
|
|
|
|
|
2008 | 7/26/2018 | ||||||||||||||||||||||||||||||||||||||||||||||||||||||||||||||||||||
| Car Washes | Decatur | GA |
|
|
|
|
|
|
|
|
1967 | 7/26/2018 | ||||||||||||||||||||||||||||||||||||||||||||||||||||||||||||||||||||
| Car Washes | Decatur | GA |
|
|
|
|
|
|
|
|
2007 | 7/26/2018 | ||||||||||||||||||||||||||||||||||||||||||||||||||||||||||||||||||||
| Car Washes | Duluth | GA |
|
|
|
|
|
|
|
|
2006 | 7/26/2018 | ||||||||||||||||||||||||||||||||||||||||||||||||||||||||||||||||||||
| Restaurants - Quick Service | Fort Oglethorpe | GA |
|
|
|
|
|
|
|
|
2001 | 8/8/2018 | ||||||||||||||||||||||||||||||||||||||||||||||||||||||||||||||||||||
| Restaurants - Quick Service | Ringgold | GA |
|
|
|
|
|
|
|
|
2015 | 8/8/2018 | ||||||||||||||||||||||||||||||||||||||||||||||||||||||||||||||||||||
| Restaurants - Quick Service | Chattanooga | TN |
|
|
|
|
|
|
|
|
2009 | 8/8/2018 | ||||||||||||||||||||||||||||||||||||||||||||||||||||||||||||||||||||
| Restaurants - Quick Service | Chattanooga | TN |
|
|
|
|
|
|
|
|
2004 | 8/8/2018 | ||||||||||||||||||||||||||||||||||||||||||||||||||||||||||||||||||||
| Restaurants - Quick Service | Chattanooga | TN |
|
|
|
|
|
|
|
|
2012 | 8/8/2018 | ||||||||||||||||||||||||||||||||||||||||||||||||||||||||||||||||||||
| Restaurants - Quick Service | Dayton | TN |
|
|
|
|
|
|
|
|
2016 | 8/8/2018 | ||||||||||||||||||||||||||||||||||||||||||||||||||||||||||||||||||||
| Restaurants - Quick Service | Ooltewah | TN |
|
|
|
|
|
|
|
|
2003 | 8/8/2018 | ||||||||||||||||||||||||||||||||||||||||||||||||||||||||||||||||||||
| Restaurants - Quick Service | Soddy Daisy | TN |
|
|
|
|
|
|
|
|
2006 | 8/8/2018 | ||||||||||||||||||||||||||||||||||||||||||||||||||||||||||||||||||||
| Automotive Service | Oklahoma City | OK |
|
|
|
|
|
|
|
|
1980 | 8/9/2018 | ||||||||||||||||||||||||||||||||||||||||||||||||||||||||||||||||||||
F-11
| Description(a) | Encumbrances | Initial Cost to Company |
Cost Capitalized Subsequent
to Acquisition |
Gross Amount at
December 31, 2020(b)(c) |
Accumulated Depreciation
(d)(e) |
Year
Constructed |
Date
Acquired |
|||||||||||||||||||||||||||||||||||||||||||||||||||||||||||||||||||||||||
| Tenant Industry | City | State |
Land &
Improvements |
Building &
Improvements |
Land &
Improvements |
Building &
Improvements |
Land &
Improvements |
Building &
Improvements |
Total | |||||||||||||||||||||||||||||||||||||||||||||||||||||||||||||||||||||||
| Automotive Service | Midwest City | OK | $ |
|
$ |
|
$ |
|
$ |
|
$ |
|
$ |
|
$ |
|
$ |
|
1995 | 8/9/2018 | ||||||||||||||||||||||||||||||||||||||||||||||||||||||||||||
| Automotive Service | Del City | OK |
|
|
|
|
|
|
|
|
1985 | 8/9/2018 | ||||||||||||||||||||||||||||||||||||||||||||||||||||||||||||||||||||
| Automotive Service | Midwest City | OK |
|
|
|
|
|
|
|
|
1980 | 8/9/2018 | ||||||||||||||||||||||||||||||||||||||||||||||||||||||||||||||||||||
| Early Childhood Education | Eden Prairie | MN | {f} |
|
|
|
|
|
|
|
|
1995 | 8/10/2018 | |||||||||||||||||||||||||||||||||||||||||||||||||||||||||||||||||||
| Restaurants - Quick Service | Blytheville | AR |
|
|
|
|
|
|
|
|
2007 | 8/22/2018 | ||||||||||||||||||||||||||||||||||||||||||||||||||||||||||||||||||||
| Restaurants - Quick Service | Paragould | AR |
|
|
|
|
|
|
|
|
2008 | 8/22/2018 | ||||||||||||||||||||||||||||||||||||||||||||||||||||||||||||||||||||
| Restaurants - Quick Service | Van Buren | AR |
|
|
|
|
|
|
|
|
2008 | 8/22/2018 | ||||||||||||||||||||||||||||||||||||||||||||||||||||||||||||||||||||
| Convenience Stores | Seguin | TX |
|
|
|
|
|
|
|
|
1974 | 9/4/2018 | ||||||||||||||||||||||||||||||||||||||||||||||||||||||||||||||||||||
| Convenience Stores | Burleson | TX |
|
|
|
|
|
|
|
|
1985 | 9/4/2018 | ||||||||||||||||||||||||||||||||||||||||||||||||||||||||||||||||||||
| Convenience Stores | Winfield | TX |
|
|
|
|
|
|
|
|
1979 | 9/4/2018 | ||||||||||||||||||||||||||||||||||||||||||||||||||||||||||||||||||||
| Automotive Service | Pontiac | MI |
|
|
|
|
|
|
|
|
1978 | 9/7/2018 | ||||||||||||||||||||||||||||||||||||||||||||||||||||||||||||||||||||
| Restaurants - Quick Service | San Angelo | TX |
|
|
|
|
|
|
|
|
1978 | 9/12/2018 | ||||||||||||||||||||||||||||||||||||||||||||||||||||||||||||||||||||
| Health and Fitness | Springfield | OR | {f} |
|
|
|
|
|
|
|
|
1999 | 9/13/2018 | |||||||||||||||||||||||||||||||||||||||||||||||||||||||||||||||||||
| Health and Fitness | Eugene | OR | {f} |
|
|
|
|
|
|
|
|
1980 | 9/13/2018 | |||||||||||||||||||||||||||||||||||||||||||||||||||||||||||||||||||
| Early Childhood Education | San Antonio | TX |
|
|
|
|
|
|
|
|
2008 | 9/14/2018 | ||||||||||||||||||||||||||||||||||||||||||||||||||||||||||||||||||||
| Early Childhood Education | Colleyville | TX |
|
|
|
|
|
|
|
|
1997 | 9/18/2018 | ||||||||||||||||||||||||||||||||||||||||||||||||||||||||||||||||||||
| Restaurants - Quick Service | Marion | AR |
|
|
|
|
|
|
|
|
2007 | 9/21/2018 | ||||||||||||||||||||||||||||||||||||||||||||||||||||||||||||||||||||
| Entertainment | Metairie | LA |
|
|
|
|
|
|
|
|
2016 | 9/21/2018 | ||||||||||||||||||||||||||||||||||||||||||||||||||||||||||||||||||||
| Restaurants - Quick Service | Montrose | CO |
|
|
|
|
|
|
|
|
2000 | 9/25/2018 | ||||||||||||||||||||||||||||||||||||||||||||||||||||||||||||||||||||
| Restaurants - Family Dining | Augusta | GA |
|
|
|
|
|
|
|
|
1968 | 9/25/2018 | ||||||||||||||||||||||||||||||||||||||||||||||||||||||||||||||||||||
| Restaurants - Family Dining | Macon | GA |
|
|
|
|
|
|
|
|
1983 | 9/25/2018 | ||||||||||||||||||||||||||||||||||||||||||||||||||||||||||||||||||||
| Restaurants - Family Dining | Macon | GA |
|
|
|
|
|
|
|
|
1972 | 9/25/2018 | ||||||||||||||||||||||||||||||||||||||||||||||||||||||||||||||||||||
| Restaurants - Quick Service | Fairbanks | AK |
|
|
|
|
|
|
|
|
1971 | 9/27/2018 | ||||||||||||||||||||||||||||||||||||||||||||||||||||||||||||||||||||
| Restaurants - Quick Service | Fairbanks | AK |
|
|
|
|
|
|
|
|
2006 | 9/27/2018 | ||||||||||||||||||||||||||||||||||||||||||||||||||||||||||||||||||||
| Medical / Dental | Abilene | TX |
|
|
|
|
|
|
|
|
2006 | 9/27/2018 | ||||||||||||||||||||||||||||||||||||||||||||||||||||||||||||||||||||
| Automotive Service | Bremen | IN | {f} |
|
|
|
|
|
|
|
|
1970 | 9/28/2018 | |||||||||||||||||||||||||||||||||||||||||||||||||||||||||||||||||||
| Car Washes | Springdale | AR |
|
|
|
|
|
|
|
|
2018 | 9/28/2018 | ||||||||||||||||||||||||||||||||||||||||||||||||||||||||||||||||||||
| Restaurants - Quick Service | Andalusia | AL |
|
|
|
|
|
|
|
|
1988 | 9/28/2018 | ||||||||||||||||||||||||||||||||||||||||||||||||||||||||||||||||||||
| Medical / Dental | Forrest City | AR |
|
|
|
|
|
|
|
|
2007 | 9/28/2018 | ||||||||||||||||||||||||||||||||||||||||||||||||||||||||||||||||||||
| Early Childhood Education | Ashburn | VA |
|
|
|
|
|
|
|
|
2001 | 9/28/2018 | ||||||||||||||||||||||||||||||||||||||||||||||||||||||||||||||||||||
| Restaurants - Quick Service | North Richard Hills | TX |
|
|
|
|
|
|
|
|
2017 | 9/28/2018 | ||||||||||||||||||||||||||||||||||||||||||||||||||||||||||||||||||||
| Restaurants - Quick Service | Grapevine | TX |
|
|
|
|
|
|
|
|
2016 | 9/28/2018 | ||||||||||||||||||||||||||||||||||||||||||||||||||||||||||||||||||||
| Restaurants - Quick Service | St Augustine | FL |
|
|
|
|
|
|
|
|
2010 | 9/28/2018 | ||||||||||||||||||||||||||||||||||||||||||||||||||||||||||||||||||||
| Early Childhood Education | Fleming Island | FL | {f} |
|
|
|
|
|
|
|
|
2006 | 9/28/2018 | |||||||||||||||||||||||||||||||||||||||||||||||||||||||||||||||||||
| Restaurants - Quick Service | Hot Springs | AR |
|
|
|
|
|
|
|
|
1979 | 10/4/2018 | ||||||||||||||||||||||||||||||||||||||||||||||||||||||||||||||||||||
| Health and Fitness | Tucson | AZ |
|
|
|
|
|
|
|
|
2019 | 10/10/2018 | ||||||||||||||||||||||||||||||||||||||||||||||||||||||||||||||||||||
| Restaurants - Quick Service | Countryside | IL |
|
|
|
|
|
|
|
|
2013 | 10/26/2018 | ||||||||||||||||||||||||||||||||||||||||||||||||||||||||||||||||||||
| Medical / Dental | Midland | TX |
|
|
|
|
|
|
|
|
1993 | 10/31/2018 | ||||||||||||||||||||||||||||||||||||||||||||||||||||||||||||||||||||
| Early Childhood Education | McDonough | GA |
|
|
|
|
|
|
|
|
2002 | 11/2/2018 | ||||||||||||||||||||||||||||||||||||||||||||||||||||||||||||||||||||
| Convenience Stores | Tucson | AZ |
|
|
|
|
|
|
|
|
1985 | 11/7/2018 | ||||||||||||||||||||||||||||||||||||||||||||||||||||||||||||||||||||
| Convenience Stores | Phoenix | AZ |
|
|
|
|
|
|
|
|
1987 | 11/7/2018 | ||||||||||||||||||||||||||||||||||||||||||||||||||||||||||||||||||||
| Convenience Stores | Centralia | WA |
|
|
|
|
|
|
|
|
1976 | 11/7/2018 | ||||||||||||||||||||||||||||||||||||||||||||||||||||||||||||||||||||
| Medical / Dental | Montgomery | AL | {f} |
|
|
|
|
|
|
|
|
2004 | 11/7/2018 | |||||||||||||||||||||||||||||||||||||||||||||||||||||||||||||||||||
| Medical / Dental | Prattville | AL | {f} |
|
|
|
|
|
|
|
|
2012 | 11/7/2018 | |||||||||||||||||||||||||||||||||||||||||||||||||||||||||||||||||||
| Convenience Stores | Duncanville | TX |
|
|
|
|
|
|
|
|
1980 | 11/8/2018 | ||||||||||||||||||||||||||||||||||||||||||||||||||||||||||||||||||||
| Early Childhood Education | Canton | GA |
|
|
|
|
|
|
|
|
2006 | 11/9/2018 | ||||||||||||||||||||||||||||||||||||||||||||||||||||||||||||||||||||
| Restaurants - Quick Service | Pembroke | NY |
|
|
|
|
|
|
|
|
2017 | 11/28/2018 | ||||||||||||||||||||||||||||||||||||||||||||||||||||||||||||||||||||
| Medical / Dental | Fort Worth | TX |
|
|
|
|
|
|
|
|
1997 | 11/30/2018 | ||||||||||||||||||||||||||||||||||||||||||||||||||||||||||||||||||||
| Medical / Dental | Arlington | TX |
|
|
|
|
|
|
|
|
1999 | 11/30/2018 | ||||||||||||||||||||||||||||||||||||||||||||||||||||||||||||||||||||
| Medical / Dental | Burleson | TX |
|
|
|
|
|
|
|
|
1942 | 11/30/2018 | ||||||||||||||||||||||||||||||||||||||||||||||||||||||||||||||||||||
| Medical / Dental | Dallas | TX |
|
|
|
|
|
|
|
|
1979 | 11/30/2018 | ||||||||||||||||||||||||||||||||||||||||||||||||||||||||||||||||||||
| Early Childhood Education | Olive Branch | MS |
|
|
|
|
|
|
|
|
2009 | 12/5/2018 | ||||||||||||||||||||||||||||||||||||||||||||||||||||||||||||||||||||
F-12
| Description(a) | Encumbrances | Initial Cost to Company |
Cost Capitalized Subsequent
to Acquisition |
Gross Amount at
December 31, 2020(b)(c) |
Accumulated Depreciation
(d)(e) |
Year
Constructed |
Date
Acquired |
|||||||||||||||||||||||||||||||||||||||||||||||||||||||||||||||||||||||||||||||
| Tenant Industry | City | State |
Land &
Improvements |
Building &
Improvements |
Land &
Improvements |
Building &
Improvements |
Land &
Improvements |
Building &
Improvements |
Total | |||||||||||||||||||||||||||||||||||||||||||||||||||||||||||||||||||||||||||||
| Early Childhood Education | Manchester | CT | $ |
|
$ |
|
$ |
|
$ |
|
$ |
|
$ |
|
$ |
|
$ |
|
1977 | 12/7/2018 | ||||||||||||||||||||||||||||||||||||||||||||||||||||||||||||||||||
| Early Childhood Education | Macon | GA | {f} |
|
|
|
|
|
|
|
|
2007 | 12/14/2018 | |||||||||||||||||||||||||||||||||||||||||||||||||||||||||||||||||||||||||
| Early Childhood Education | Macon | GA | {f} |
|
|
|
|
|
|
|
|
2008 | 12/14/2018 | |||||||||||||||||||||||||||||||||||||||||||||||||||||||||||||||||||||||||
| Entertainment | Andover | MN |
|
|
|
|
|
|
|
|
2005 | 12/12/2018 | ||||||||||||||||||||||||||||||||||||||||||||||||||||||||||||||||||||||||||
| Entertainment | Rochester | MN |
|
|
|
|
|
|
|
|
1958 | 12/12/2018 | ||||||||||||||||||||||||||||||||||||||||||||||||||||||||||||||||||||||||||
| Entertainment | South St. Paul | MN |
|
|
|
|
|
|
|
|
1978 | 12/12/2018 | ||||||||||||||||||||||||||||||||||||||||||||||||||||||||||||||||||||||||||
| Entertainment | Mounds View | MN |
|
|
|
|
|
|
|
|
1967 | 12/12/2018 | ||||||||||||||||||||||||||||||||||||||||||||||||||||||||||||||||||||||||||
| Entertainment | St. Paul Park | MN |
|
|
|
|
|
|
|
|
1959 | 12/12/2018 | ||||||||||||||||||||||||||||||||||||||||||||||||||||||||||||||||||||||||||
| Entertainment | Oakdale | MN |
|
|
|
|
|
|
|
|
2009 | 12/12/2018 | ||||||||||||||||||||||||||||||||||||||||||||||||||||||||||||||||||||||||||
| Entertainment | Monticello | MN |
|
|
|
|
|
|
|
|
2007 | 12/12/2018 | ||||||||||||||||||||||||||||||||||||||||||||||||||||||||||||||||||||||||||
| Entertainment | St. Paul | MN |
|
|
|
|
|
|
|
|
1955 | 12/12/2018 | ||||||||||||||||||||||||||||||||||||||||||||||||||||||||||||||||||||||||||
| Entertainment | Ramsey | MN |
|
|
|
|
|
|
|
|
1988 | 12/12/2018 | ||||||||||||||||||||||||||||||||||||||||||||||||||||||||||||||||||||||||||
| Health and Fitness | Winston Salem | NC |
|
|
(
|
(g) |
(
|
(g) |
|
|
|
|
1972 | 12/19/2018 | ||||||||||||||||||||||||||||||||||||||||||||||||||||||||||||||||||||||||
| Automotive Service | Denton | TX |
|
|
|
|
|
|
|
|
1982 | 12/20/2018 | ||||||||||||||||||||||||||||||||||||||||||||||||||||||||||||||||||||||||||
| Car Washes | Dubuque | IA |
|
|
|
|
|
|
|
|
1992 | 12/20/2018 | ||||||||||||||||||||||||||||||||||||||||||||||||||||||||||||||||||||||||||
| Car Washes | Davenport | IA |
|
|
|
|
|
|
|
|
1990 | 12/20/2018 | ||||||||||||||||||||||||||||||||||||||||||||||||||||||||||||||||||||||||||
| Car Washes | Rock Island | IL |
|
|
|
|
|
|
|
|
1996 | 12/20/2018 | ||||||||||||||||||||||||||||||||||||||||||||||||||||||||||||||||||||||||||
| Pet Care Services | Georgetown | TX |
|
|
|
|
|
|
|
|
2020 | 12/21/2018 | ||||||||||||||||||||||||||||||||||||||||||||||||||||||||||||||||||||||||||
| Pet Care Services | Middleburg | FL |
|
|
|
|
|
|
|
|
2020 | 12/21/2018 | ||||||||||||||||||||||||||||||||||||||||||||||||||||||||||||||||||||||||||
| Early Childhood Education | Arlington | TX |
|
|
|
|
|
|
|
|
1989 | 12/27/2018 | ||||||||||||||||||||||||||||||||||||||||||||||||||||||||||||||||||||||||||
| Home Furnishings | Kansas City | MO |
|
|
|
|
|
|
|
|
2007 | 12/28/2018 | ||||||||||||||||||||||||||||||||||||||||||||||||||||||||||||||||||||||||||
| Restaurants - Casual Dining | Flint | MI |
|
|
|
|
|
|
|
|
1975 | 1/2/2019 | ||||||||||||||||||||||||||||||||||||||||||||||||||||||||||||||||||||||||||
| Restaurants - Casual Dining | Saginaw | MI |
|
|
|
|
|
|
|
|
1967 | 1/2/2019 | ||||||||||||||||||||||||||||||||||||||||||||||||||||||||||||||||||||||||||
| Restaurants - Quick Service | Alexandria | LA | {f} |
|
|
|
|
|
|
|
|
1985 | 1/10/2019 | |||||||||||||||||||||||||||||||||||||||||||||||||||||||||||||||||||||||||
| Restaurants - Quick Service | Leesville | LA | {f} |
|
|
|
|
|
|
|
|
1983 | 1/10/2019 | |||||||||||||||||||||||||||||||||||||||||||||||||||||||||||||||||||||||||
| Restaurants - Quick Service | Griffin | GA | {f} |
|
|
|
|
|
|
|
|
1983 | 1/10/2019 | |||||||||||||||||||||||||||||||||||||||||||||||||||||||||||||||||||||||||
| Car Washes | Springdale | AR |
|
|
(
|
(
|
|
|
|
|
2018 | 1/10/2019 | ||||||||||||||||||||||||||||||||||||||||||||||||||||||||||||||||||||||||||
| Entertainment | Nampa | ID |
|
|
|
|
|
|
|
|
2008 | 1/17/2019 | ||||||||||||||||||||||||||||||||||||||||||||||||||||||||||||||||||||||||||
| Medical / Dental | West Memphis | AR |
|
|
|
|
|
|
|
|
2007 | 1/22/2019 | ||||||||||||||||||||||||||||||||||||||||||||||||||||||||||||||||||||||||||
| Early Childhood Education | Gilbert | AZ |
|
|
|
|
|
|
|
|
2020 | 1/29/2019 | ||||||||||||||||||||||||||||||||||||||||||||||||||||||||||||||||||||||||||
| Pet Care Services | Denham Springs | LA |
|
|
|
|
|
|
|
|
2007 | 1/31/2019 | ||||||||||||||||||||||||||||||||||||||||||||||||||||||||||||||||||||||||||
| Medical / Dental | Little Rock | AR |
|
|
|
|
|
|
|
|
2004 | 1/31/2019 | ||||||||||||||||||||||||||||||||||||||||||||||||||||||||||||||||||||||||||
| Medical / Dental | Bryant | AR |
|
|
|
|
|
|
|
|
2014 | 1/31/2019 | ||||||||||||||||||||||||||||||||||||||||||||||||||||||||||||||||||||||||||
| Restaurants - Quick Service | Ruston | LA |
|
|
|
|
|
|
|
|
2016 | 2/14/2019 | ||||||||||||||||||||||||||||||||||||||||||||||||||||||||||||||||||||||||||
| Restaurants - Quick Service | El Dorado | AR |
|
|
|
|
|
|
|
|
2017 | 2/14/2019 | ||||||||||||||||||||||||||||||||||||||||||||||||||||||||||||||||||||||||||
| Restaurants - Quick Service | Percival | IA | {f} |
|
|
|
|
|
|
|
|
2004 | 2/15/2019 | |||||||||||||||||||||||||||||||||||||||||||||||||||||||||||||||||||||||||
| Early Childhood Education | Garner | NC |
|
|
|
|
|
|
|
|
2007 | 2/28/2019 | ||||||||||||||||||||||||||||||||||||||||||||||||||||||||||||||||||||||||||
| Restaurants - Casual Dining | Wilder | KY |
|
|
|
|
|
|
|
|
2010 | 2/28/2019 | ||||||||||||||||||||||||||||||||||||||||||||||||||||||||||||||||||||||||||
| Medical / Dental | Meridian | MS |
|
|
|
|
|
|
|
|
2006 | 3/8/2019 | ||||||||||||||||||||||||||||||||||||||||||||||||||||||||||||||||||||||||||
| Health and Fitness | Abilene | TX |
|
|
|
|
|
|
|
|
1974 | 3/8/2019 | ||||||||||||||||||||||||||||||||||||||||||||||||||||||||||||||||||||||||||
| Early Childhood Education | St. Augustine | FL |
|
|
|
|
|
|
|
|
2016 | 3/8/2019 | ||||||||||||||||||||||||||||||||||||||||||||||||||||||||||||||||||||||||||
| Early Childhood Education | St. Augustine | FL |
|
|
|
|
|
|
|
|
2006 | 3/8/2019 | ||||||||||||||||||||||||||||||||||||||||||||||||||||||||||||||||||||||||||
| Early Childhood Education | St. Augustine | FL |
|
|
|
|
|
|
|
|
1981 | 3/8/2019 | ||||||||||||||||||||||||||||||||||||||||||||||||||||||||||||||||||||||||||
| Health and Fitness | Las Vegas | NV | {f} |
|
|
|
|
|
|
|
|
1970 | 3/13/2019 | |||||||||||||||||||||||||||||||||||||||||||||||||||||||||||||||||||||||||
| Automotive Service | St. Augusta | MN | {f} |
|
|
|
|
|
|
|
|
1991 | 3/13/2019 | |||||||||||||||||||||||||||||||||||||||||||||||||||||||||||||||||||||||||
F-13
| Description(a) | Encumbrances | Initial Cost to Company |
Cost Capitalized Subsequent
to Acquisition |
Gross Amount at
December 31, 2020(b)(c) |
Accumulated Depreciation
(d)(e) |
Year
Constructed |
Date
Acquired |
|||||||||||||||||||||||||||||||||||||||||||||||||||||||||||||||||||||||||
| Tenant Industry | City | State |
Land &
Improvements |
Building &
Improvements |
Land &
Improvements |
Building &
Improvements |
Land &
Improvements |
Building &
Improvements |
Total | |||||||||||||||||||||||||||||||||||||||||||||||||||||||||||||||||||||||
| Pet Care Services | Carbondale | IL | $ |
|
$ |
|
$ |
|
$ |
|
$ |
|
$ |
|
$ |
|
$ |
|
1986 | 3/29/2019 | ||||||||||||||||||||||||||||||||||||||||||||||||||||||||||||
| Pet Care Services | Energy | IL |
|
|
|
|
|
|
|
|
1995 | 3/29/2019 | ||||||||||||||||||||||||||||||||||||||||||||||||||||||||||||||||||||
| Pet Care Services | Crete | NE |
|
|
|
|
|
|
|
|
1967 | 3/29/2019 | ||||||||||||||||||||||||||||||||||||||||||||||||||||||||||||||||||||
| Pet Care Services | Ballwin | MO |
|
|
|
|
|
|
|
|
1986 | 3/29/2019 | ||||||||||||||||||||||||||||||||||||||||||||||||||||||||||||||||||||
| Pet Care Services | Pea Ridge | AR |
|
|
|
|
|
|
|
|
1996 | 3/29/2019 | ||||||||||||||||||||||||||||||||||||||||||||||||||||||||||||||||||||
| Pet Care Services | Norman | OK |
|
|
|
|
|
|
|
|
1993 | 3/29/2019 | ||||||||||||||||||||||||||||||||||||||||||||||||||||||||||||||||||||
| Pet Care Services | Martinsville | IN |
|
|
|
|
|
|
|
|
1989 | 3/29/2019 | ||||||||||||||||||||||||||||||||||||||||||||||||||||||||||||||||||||
| Pet Care Services | Carbondale | IL |
|
|
|
|
|
|
|
|
1976 | 3/29/2019 | ||||||||||||||||||||||||||||||||||||||||||||||||||||||||||||||||||||
| Pet Care Services | Nashville | IN |
|
|
|
|
|
|
|
|
1970 | 3/29/2019 | ||||||||||||||||||||||||||||||||||||||||||||||||||||||||||||||||||||
| Entertainment | Monroeville | PA |
|
|
|
|
|
|
|
|
2016 | 3/29/2019 | ||||||||||||||||||||||||||||||||||||||||||||||||||||||||||||||||||||
| Early Childhood Education | Stockbridge | GA |
|
|
|
|
|
|
|
|
2004 | 3/29/2019 | ||||||||||||||||||||||||||||||||||||||||||||||||||||||||||||||||||||
| Entertainment | Huntersville | NC |
|
|
|
|
|
|
|
|
1996 | 3/29/2019 | ||||||||||||||||||||||||||||||||||||||||||||||||||||||||||||||||||||
| Entertainment | Greensboro | NC |
|
|
|
|
|
|
|
|
1988 | 3/29/2019 | ||||||||||||||||||||||||||||||||||||||||||||||||||||||||||||||||||||
| Medical / Dental | Tuscaloosa | AL |
|
|
|
|
|
|
|
|
1991 | 3/29/2019 | ||||||||||||||||||||||||||||||||||||||||||||||||||||||||||||||||||||
| Early Childhood Education | Duluth | GA |
|
|
|
|
|
|
|
|
1994 | 3/29/2019 | ||||||||||||||||||||||||||||||||||||||||||||||||||||||||||||||||||||
| Medical / Dental | Indianapolis | IN |
|
|
|
|
|
|
|
|
2016 | 3/29/2019 | ||||||||||||||||||||||||||||||||||||||||||||||||||||||||||||||||||||
| Medical / Dental | Fort Wayne | IN |
|
|
|
|
|
|
|
|
2020 | 3/29/2019 | ||||||||||||||||||||||||||||||||||||||||||||||||||||||||||||||||||||
| Restaurants - Quick Service | Woodstock | GA | {f} |
|
|
|
|
|
|
|
|
1990 | 4/5/2019 | |||||||||||||||||||||||||||||||||||||||||||||||||||||||||||||||||||
| Restaurants - Quick Service | Commerce | GA | {f} |
|
|
|
|
|
|
|
|
1990 | 4/5/2019 | |||||||||||||||||||||||||||||||||||||||||||||||||||||||||||||||||||
| Health and Fitness | Norman | OK |
|
|
|
|
|
|
|
|
2018 | 4/17/2019 | ||||||||||||||||||||||||||||||||||||||||||||||||||||||||||||||||||||
| Convenience Stores | Alpena | AR |
|
|
|
|
|
|
|
|
1970 | 4/19/2019 | ||||||||||||||||||||||||||||||||||||||||||||||||||||||||||||||||||||
| Convenience Stores | Gassville | AR |
|
|
|
|
|
|
|
|
1995 | 4/19/2019 | ||||||||||||||||||||||||||||||||||||||||||||||||||||||||||||||||||||
| Convenience Stores | Mountain Home | AR |
|
|
|
|
|
|
|
|
1977 | 4/19/2019 | ||||||||||||||||||||||||||||||||||||||||||||||||||||||||||||||||||||
| Early Childhood Education | Alpharetta | GA |
|
|
|
|
|
|
|
|
1999 | 4/30/2019 | ||||||||||||||||||||||||||||||||||||||||||||||||||||||||||||||||||||
| Early Childhood Education | Johns Creek | GA |
|
|
|
|
|
|
|
|
2004 | 4/30/2019 | ||||||||||||||||||||||||||||||||||||||||||||||||||||||||||||||||||||
| Medical / Dental | Tyler | TX |
|
|
|
|
|
|
|
|
1940 | 5/15/2019 | ||||||||||||||||||||||||||||||||||||||||||||||||||||||||||||||||||||
| Medical / Dental | Groesbeck | TX |
|
|
|
|
|
|
|
|
2005 | 5/15/2019 | ||||||||||||||||||||||||||||||||||||||||||||||||||||||||||||||||||||
| Medical / Dental | Greenville | TX |
|
|
|
|
|
|
|
|
1985 | 5/15/2019 | ||||||||||||||||||||||||||||||||||||||||||||||||||||||||||||||||||||
| Medical / Dental | Marshall | TX |
|
|
|
|
|
|
|
|
1969 | 5/15/2019 | ||||||||||||||||||||||||||||||||||||||||||||||||||||||||||||||||||||
| Pet Care Services | Prescott | AZ |
|
|
|
|
|
|
|
|
1990 | 5/24/2019 | ||||||||||||||||||||||||||||||||||||||||||||||||||||||||||||||||||||
| Entertainment | Trussville | AL |
|
|
|
|
|
|
|
|
2002 | 5/30/2019 | ||||||||||||||||||||||||||||||||||||||||||||||||||||||||||||||||||||
| Early Childhood Education | Coral Springs | FL |
|
|
|
|
|
|
|
|
2004 | 5/31/2019 | ||||||||||||||||||||||||||||||||||||||||||||||||||||||||||||||||||||
| Convenience Stores | New Lexington | OH |
|
|
|
|
|
|
|
|
1997 | 6/6/2019 | ||||||||||||||||||||||||||||||||||||||||||||||||||||||||||||||||||||
| Convenience Stores | Waterford | PA |
|
|
|
|
|
|
|
|
1996 | 6/6/2019 | ||||||||||||||||||||||||||||||||||||||||||||||||||||||||||||||||||||
| Convenience Stores | Creston | OH |
|
|
|
|
|
|
|
|
1997 | 6/6/2019 | ||||||||||||||||||||||||||||||||||||||||||||||||||||||||||||||||||||
| Convenience Stores | Alexandria | KY |
|
|
|
|
|
|
|
|
1998 | 6/6/2019 | ||||||||||||||||||||||||||||||||||||||||||||||||||||||||||||||||||||
| Convenience Stores | Richmond | KY |
|
|
|
|
|
|
|
|
1998 | 6/6/2019 | ||||||||||||||||||||||||||||||||||||||||||||||||||||||||||||||||||||
| Convenience Stores | Canton | OH |
|
|
|
|
|
|
|
|
1998 | 6/6/2019 | ||||||||||||||||||||||||||||||||||||||||||||||||||||||||||||||||||||
| Convenience Stores | Wooster | OH |
|
|
|
|
|
|
|
|
1998 | 6/6/2019 | ||||||||||||||||||||||||||||||||||||||||||||||||||||||||||||||||||||
| Convenience Stores | Louisville | KY |
|
|
|
|
|
|
|
|
1998 | 6/6/2019 | ||||||||||||||||||||||||||||||||||||||||||||||||||||||||||||||||||||
| Convenience Stores | Fairfield | OH |
|
|
|
|
|
|
|
|
1999 | 6/6/2019 | ||||||||||||||||||||||||||||||||||||||||||||||||||||||||||||||||||||
| Convenience Stores | Nicholasville | KY |
|
|
|
|
|
|
|
|
1999 | 6/6/2019 | ||||||||||||||||||||||||||||||||||||||||||||||||||||||||||||||||||||
| Convenience Stores | Louisville | KY |
|
|
|
|
|
|
|
|
1998 | 6/6/2019 | ||||||||||||||||||||||||||||||||||||||||||||||||||||||||||||||||||||
| Convenience Stores | Paris | KY |
|
|
|
|
|
|
|
|
1998 | 6/6/2019 | ||||||||||||||||||||||||||||||||||||||||||||||||||||||||||||||||||||
| Convenience Stores | Fairborn | OH |
|
|
|
|
|
|
|
|
1998 | 6/6/2019 | ||||||||||||||||||||||||||||||||||||||||||||||||||||||||||||||||||||
| Convenience Stores | Eastlake | OH |
|
|
|
|
|
|
|
|
1998 | 6/6/2019 | ||||||||||||||||||||||||||||||||||||||||||||||||||||||||||||||||||||
| Convenience Stores | Beavercreek | OH |
|
|
|
|
|
|
|
|
1999 | 6/6/2019 | ||||||||||||||||||||||||||||||||||||||||||||||||||||||||||||||||||||
| Convenience Stores | Milford | OH |
|
|
|
|
|
|
|
|
1998 | 6/6/2019 | ||||||||||||||||||||||||||||||||||||||||||||||||||||||||||||||||||||
| Convenience Stores | Louisville | KY |
|
|
|
|
|
|
|
|
1998 | 6/6/2019 | ||||||||||||||||||||||||||||||||||||||||||||||||||||||||||||||||||||
| Convenience Stores | Wauseon | OH |
|
|
|
|
|
|
|
|
1998 | 6/6/2019 | ||||||||||||||||||||||||||||||||||||||||||||||||||||||||||||||||||||
F-14
| Description(a) | Encumbrances | Initial Cost to Company |
Cost Capitalized Subsequent
to Acquisition |
Gross Amount at
December 31, 2020(b)(c) |
Accumulated Depreciation
(d)(e) |
Year
Constructed |
Date
Acquired |
|||||||||||||||||||||||||||||||||||||||||||||||||||||||||||||||||||||||||
| Tenant Industry | City | State |
Land &
Improvements |
Building &
Improvements |
Land &
Improvements |
Building &
Improvements |
Land &
Improvements |
Building &
Improvements |
Total | |||||||||||||||||||||||||||||||||||||||||||||||||||||||||||||||||||||||
| Convenience Stores | Milan | OH | $ |
|
$ |
|
$ |
|
$ |
|
$ |
|
$ |
|
$ |
|
$ |
|
1999 | 6/6/2019 | ||||||||||||||||||||||||||||||||||||||||||||||||||||||||||||
| Convenience Stores | Canton | OH |
|
|
|
|
|
|
|
|
1999 | 6/6/2019 | ||||||||||||||||||||||||||||||||||||||||||||||||||||||||||||||||||||
| Convenience Stores | Mount Sterling | KY |
|
|
|
|
|
|
|
|
1998 | 6/6/2019 | ||||||||||||||||||||||||||||||||||||||||||||||||||||||||||||||||||||
| Convenience Stores | Lorain | OH |
|
|
|
|
|
|
|
|
1999 | 6/6/2019 | ||||||||||||||||||||||||||||||||||||||||||||||||||||||||||||||||||||
| Convenience Stores | Fairdale | KY |
|
|
|
|
|
|
|
|
1999 | 6/6/2019 | ||||||||||||||||||||||||||||||||||||||||||||||||||||||||||||||||||||
| Convenience Stores | South Bloomfield | OH |
|
|
|
|
|
|
|
|
1999 | 6/6/2019 | ||||||||||||||||||||||||||||||||||||||||||||||||||||||||||||||||||||
| Convenience Stores | Newtown | OH |
|
|
|
|
|
|
|
|
1999 | 6/6/2019 | ||||||||||||||||||||||||||||||||||||||||||||||||||||||||||||||||||||
| Convenience Stores | Hudson | OH |
|
|
|
|
|
|
|
|
1999 | 6/6/2019 | ||||||||||||||||||||||||||||||||||||||||||||||||||||||||||||||||||||
| Convenience Stores | Seymour | IN |
|
|
|
|
|
|
|
|
1999 | 6/6/2019 | ||||||||||||||||||||||||||||||||||||||||||||||||||||||||||||||||||||
| Convenience Stores | Powell | OH |
|
|
|
|
|
|
|
|
1996 | 6/6/2019 | ||||||||||||||||||||||||||||||||||||||||||||||||||||||||||||||||||||
| Convenience Stores | Avon | OH |
|
|
|
|
|
|
|
|
1999 | 6/6/2019 | ||||||||||||||||||||||||||||||||||||||||||||||||||||||||||||||||||||
| Convenience Stores | Columbus | OH |
|
|
|
|
|
|
|
|
1999 | 6/6/2019 | ||||||||||||||||||||||||||||||||||||||||||||||||||||||||||||||||||||
| Convenience Stores | Louisville | KY |
|
|
|
|
|
|
|
|
1999 | 6/6/2019 | ||||||||||||||||||||||||||||||||||||||||||||||||||||||||||||||||||||
| Convenience Stores | Bedford | OH |
|
|
|
|
|
|
|
|
1999 | 6/6/2019 | ||||||||||||||||||||||||||||||||||||||||||||||||||||||||||||||||||||
| Convenience Stores | Elizabethtown | KY |
|
|
|
|
|
|
|
|
1999 | 6/6/2019 | ||||||||||||||||||||||||||||||||||||||||||||||||||||||||||||||||||||
| Convenience Stores | Parma | OH |
|
|
|
|
|
|
|
|
2001 | 6/6/2019 | ||||||||||||||||||||||||||||||||||||||||||||||||||||||||||||||||||||
| Restaurants - Casual Dining | Warren | MI |
|
|
|
|
|
|
|
|
1969 | 6/7/2019 | ||||||||||||||||||||||||||||||||||||||||||||||||||||||||||||||||||||
| Restaurants - Casual Dining | Detroit | MI |
|
|
|
|
|
|
|
|
1948 | 6/7/2019 | ||||||||||||||||||||||||||||||||||||||||||||||||||||||||||||||||||||
| Restaurants - Casual Dining | Dearborn | MI |
|
|
|
|
|
|
|
|
1992 | 6/7/2019 | ||||||||||||||||||||||||||||||||||||||||||||||||||||||||||||||||||||
| Restaurants - Casual Dining | Farmington Hills | MI |
|
|
|
|
|
|
|
|
1964 | 6/7/2019 | ||||||||||||||||||||||||||||||||||||||||||||||||||||||||||||||||||||
| Restaurants - Casual Dining | Livonia | MI |
|
|
|
|
|
|
|
|
1974 | 6/7/2019 | ||||||||||||||||||||||||||||||||||||||||||||||||||||||||||||||||||||
| Restaurants - Quick Service | Albion | NY |
|
|
|
|
|
|
|
|
1968 | 6/12/2019 | ||||||||||||||||||||||||||||||||||||||||||||||||||||||||||||||||||||
| Medical / Dental | Huntsville | TX |
|
|
|
|
|
|
|
|
2003 | 6/13/2019 | ||||||||||||||||||||||||||||||||||||||||||||||||||||||||||||||||||||
| Medical / Dental | Longview | TX |
|
|
|
|
|
|
|
|
1998 | 6/13/2019 | ||||||||||||||||||||||||||||||||||||||||||||||||||||||||||||||||||||
| Convenience Stores | Deming | NM |
|
|
|
|
|
|
|
|
1990 | 6/21/2019 | ||||||||||||||||||||||||||||||||||||||||||||||||||||||||||||||||||||
| Restaurants - Casual Dining | Danville | IL | {f} |
|
|
|
|
|
|
|
|
1991 | 6/26/2019 | |||||||||||||||||||||||||||||||||||||||||||||||||||||||||||||||||||
| Restaurants - Casual Dining | Wooster | OH | {f} |
|
|
|
|
|
|
|
|
1995 | 6/26/2019 | |||||||||||||||||||||||||||||||||||||||||||||||||||||||||||||||||||
| Restaurants - Casual Dining | New Philadelphia | OH |
|
|
|
|
|
|
|
|
1991 | 6/26/2019 | ||||||||||||||||||||||||||||||||||||||||||||||||||||||||||||||||||||
| Restaurants - Casual Dining | Bristol | VA |
|
|
|
|
|
|
|
|
2005 | 6/26/2019 | ||||||||||||||||||||||||||||||||||||||||||||||||||||||||||||||||||||
| Early Childhood Education | Olympia | WA |
|
|
|
|
|
|
|
|
2002 | 6/27/2019 | ||||||||||||||||||||||||||||||||||||||||||||||||||||||||||||||||||||
| Early Childhood Education | Tumwater | WA |
|
|
|
|
|
|
|
|
1997 | 6/27/2019 | ||||||||||||||||||||||||||||||||||||||||||||||||||||||||||||||||||||
| Early Childhood Education | Klamath Falls | OR |
|
|
|
|
|
|
|
|
2010 | 6/27/2019 | ||||||||||||||||||||||||||||||||||||||||||||||||||||||||||||||||||||
| Early Childhood Education | Gig Harbor | WA |
|
|
|
|
|
|
|
|
1990 | 6/27/2019 | ||||||||||||||||||||||||||||||||||||||||||||||||||||||||||||||||||||
| Early Childhood Education | Olympia | WA |
|
|
|
|
|
|
|
|
1984 | 6/27/2019 | ||||||||||||||||||||||||||||||||||||||||||||||||||||||||||||||||||||
| Early Childhood Education | Tacoma | WA |
|
|
|
|
|
|
|
|
1987 | 6/27/2019 | ||||||||||||||||||||||||||||||||||||||||||||||||||||||||||||||||||||
| Early Childhood Education | Olympia | WA |
|
|
|
|
|
|
|
|
1924 | 6/27/2019 | ||||||||||||||||||||||||||||||||||||||||||||||||||||||||||||||||||||
| Restaurants - Casual Dining | Cadillac | MI |
|
|
|
|
|
|
|
|
1906 | 6/27/2019 | ||||||||||||||||||||||||||||||||||||||||||||||||||||||||||||||||||||
| Restaurants - Casual Dining | Alden | MI |
|
|
|
|
|
|
|
|
1952 | 6/27/2019 | ||||||||||||||||||||||||||||||||||||||||||||||||||||||||||||||||||||
| Medical / Dental | Highland | AR | {f} |
|
|
|
|
|
|
|
|
2008 | 6/27/2019 | |||||||||||||||||||||||||||||||||||||||||||||||||||||||||||||||||||
| Restaurants - Family Dining | Kelso | WA |
|
|
|
|
|
|
|
|
1982 | 6/27/2019 | ||||||||||||||||||||||||||||||||||||||||||||||||||||||||||||||||||||
| Restaurants - Family Dining | Port Orchard | WA |
|
|
|
|
|
|
|
|
1999 | 6/27/2019 | ||||||||||||||||||||||||||||||||||||||||||||||||||||||||||||||||||||
| Restaurants - Family Dining | Milwaukee | WI |
|
|
|
|
|
|
|
|
2018 | 6/28/2019 | ||||||||||||||||||||||||||||||||||||||||||||||||||||||||||||||||||||
| Restaurants - Quick Service | Sisseton | SD |
|
|
|
|
|
|
|
|
1984 | 6/28/2019 | ||||||||||||||||||||||||||||||||||||||||||||||||||||||||||||||||||||
| Restaurants - Quick Service | Knoxville | IA |
|
|
|
|
|
|
|
|
1972 | 6/28/2019 | ||||||||||||||||||||||||||||||||||||||||||||||||||||||||||||||||||||
| Restaurants - Quick Service | Centerville | IA |
|
|
|
|
|
|
|
|
1975 | 6/28/2019 | ||||||||||||||||||||||||||||||||||||||||||||||||||||||||||||||||||||
| Pet Care Services | Lancaster | SC |
|
|
|
|
|
|
|
|
1994 | 6/28/2019 | ||||||||||||||||||||||||||||||||||||||||||||||||||||||||||||||||||||
| Convenience Stores | Yuma | CO | {f} |
|
|
|
|
|
|
|
|
1977 | 6/28/2019 | |||||||||||||||||||||||||||||||||||||||||||||||||||||||||||||||||||
| Car Washes | Sioux Falls | SD |
|
|
|
|
|
|
|
|
2006 | 6/28/2019 | ||||||||||||||||||||||||||||||||||||||||||||||||||||||||||||||||||||
| Car Washes | Sioux Falls | SD |
|
|
|
|
|
|
|
|
2015 | 6/28/2019 | ||||||||||||||||||||||||||||||||||||||||||||||||||||||||||||||||||||
| Car Washes | Sioux Falls | SD |
|
|
|
|
|
|
|
|
2017 | 6/28/2019 | ||||||||||||||||||||||||||||||||||||||||||||||||||||||||||||||||||||
| Car Washes | Sioux Falls | SD |
|
|
|
|
|
|
|
|
2017 | 6/28/2019 | ||||||||||||||||||||||||||||||||||||||||||||||||||||||||||||||||||||
| Medical / Dental | Amarillo | TX |
|
|
|
|
|
|
|
|
1994 | 6/28/2019 | ||||||||||||||||||||||||||||||||||||||||||||||||||||||||||||||||||||
F-15
| Description(a) | Encumbrances | Initial Cost to Company |
Cost Capitalized Subsequent
to Acquisition |
Gross Amount at
December 31, 2020(b)(c) |
Accumulated Depreciation
(d)(e) |
Year
Constructed |
Date
Acquired |
|||||||||||||||||||||||||||||||||||||||||||||||||||||||||||||||||||||||||
| Tenant Industry | City | State |
Land &
Improvements |
Building &
Improvements |
Land &
Improvements |
Building &
Improvements |
Land &
Improvements |
Building &
Improvements |
Total | |||||||||||||||||||||||||||||||||||||||||||||||||||||||||||||||||||||||
| Early Childhood Education | Nashville | TN | $ |
|
$ |
|
$ |
|
$ |
|
$ |
|
$ |
|
$ |
|
$ |
|
1996 | 7/5/2019 | ||||||||||||||||||||||||||||||||||||||||||||||||||||||||||||
| Early Childhood Education | Myrtle Beach | SC |
|
|
|
|
|
|
|
|
1999 | 7/5/2019 | ||||||||||||||||||||||||||||||||||||||||||||||||||||||||||||||||||||
| Health and Fitness | Champaign | IL |
|
|
|
|
|
|
|
|
1986 | 7/11/2019 | ||||||||||||||||||||||||||||||||||||||||||||||||||||||||||||||||||||
| Convenience Stores | Flippin | AR |
|
|
|
|
|
|
|
|
2004 | 7/16/2019 | ||||||||||||||||||||||||||||||||||||||||||||||||||||||||||||||||||||
| Convenience Stores | Mountain Home | AR |
|
|
|
|
|
|
|
|
1960 | 7/16/2019 | ||||||||||||||||||||||||||||||||||||||||||||||||||||||||||||||||||||
| Convenience Stores | Milan | TN |
|
|
|
|
|
|
|
|
2003 | 7/16/2019 | ||||||||||||||||||||||||||||||||||||||||||||||||||||||||||||||||||||
| Convenience Stores | Wynne | AR |
|
|
|
|
|
|
|
|
1992 | 7/16/2019 | ||||||||||||||||||||||||||||||||||||||||||||||||||||||||||||||||||||
| Convenience Stores | Montain View | AR |
|
|
|
|
|
|
|
|
1999 | 7/16/2019 | ||||||||||||||||||||||||||||||||||||||||||||||||||||||||||||||||||||
| Convenience Stores | Bull Shoals | AR |
|
|
|
|
|
|
|
|
1999 | 7/16/2019 | ||||||||||||||||||||||||||||||||||||||||||||||||||||||||||||||||||||
| Convenience Stores | Marshall | AR |
|
|
|
|
|
|
|
|
2012 | 7/16/2019 | ||||||||||||||||||||||||||||||||||||||||||||||||||||||||||||||||||||
| Convenience Stores | Mountain Home | AR |
|
|
|
|
|
|
|
|
1999 | 7/16/2019 | ||||||||||||||||||||||||||||||||||||||||||||||||||||||||||||||||||||
| Convenience Stores | Midway | AR |
|
|
|
|
|
|
|
|
1995 | 7/16/2019 | ||||||||||||||||||||||||||||||||||||||||||||||||||||||||||||||||||||
| Convenience Stores | West Plains | MO |
|
|
|
|
|
|
|
|
2000 | 7/16/2019 | ||||||||||||||||||||||||||||||||||||||||||||||||||||||||||||||||||||
| Restaurants - Quick Service | Cabot | AR |
|
|
|
|
|
|
|
|
2008 | 7/31/2019 | ||||||||||||||||||||||||||||||||||||||||||||||||||||||||||||||||||||
| Restaurants - Quick Service | Searcy | AR |
|
|
|
|
|
|
|
|
2008 | 7/31/2019 | ||||||||||||||||||||||||||||||||||||||||||||||||||||||||||||||||||||
| Restaurants - Quick Service | Conway | AR |
|
|
|
|
|
|
|
|
2009 | 7/31/2019 | ||||||||||||||||||||||||||||||||||||||||||||||||||||||||||||||||||||
| Medical / Dental | Amarillo | TX |
|
|
|
|
|
|
|
|
1994 | 7/31/2019 | ||||||||||||||||||||||||||||||||||||||||||||||||||||||||||||||||||||
| Restaurants - Quick Service | Owosso | MI |
|
|
|
|
|
|
|
|
1998 | 8/15/2019 | ||||||||||||||||||||||||||||||||||||||||||||||||||||||||||||||||||||
| Restaurants - Quick Service | Stevensville | MI |
|
|
|
|
|
|
|
|
1981 | 8/15/2019 | ||||||||||||||||||||||||||||||||||||||||||||||||||||||||||||||||||||
| Early Childhood Education | Schaumburg | IL |
|
|
|
|
|
|
|
|
8/30/2019 | |||||||||||||||||||||||||||||||||||||||||||||||||||||||||||||||||||||
| Restaurants - Quick Service | Cloverdale | IN |
|
|
|
|
|
|
|
|
1996 | 9/3/2019 | ||||||||||||||||||||||||||||||||||||||||||||||||||||||||||||||||||||
| Restaurants - Quick Service | Port Huron | MI |
|
|
|
|
|
|
|
|
1973 | 9/5/2019 | ||||||||||||||||||||||||||||||||||||||||||||||||||||||||||||||||||||
| Restaurants - Quick Service | Cedar Springs | MI |
|
|
|
|
|
|
|
|
2000 | 9/5/2019 | ||||||||||||||||||||||||||||||||||||||||||||||||||||||||||||||||||||
| Health and Fitness | Gainesville | FL |
|
|
|
|
|
|
|
|
1983 | 9/6/2019 | ||||||||||||||||||||||||||||||||||||||||||||||||||||||||||||||||||||
| Restaurants - Quick Service | Louisville | MS |
|
|
|
|
|
|
|
|
2018 | 9/13/2019 | ||||||||||||||||||||||||||||||||||||||||||||||||||||||||||||||||||||
| Restaurants - Quick Service | Macon | MS |
|
|
|
|
|
|
|
|
1992 | 9/13/2019 | ||||||||||||||||||||||||||||||||||||||||||||||||||||||||||||||||||||
| Restaurants - Quick Service | Ruleville | MS |
|
|
|
|
|
|
|
|
2017 | 9/13/2019 | ||||||||||||||||||||||||||||||||||||||||||||||||||||||||||||||||||||
| Restaurants - Quick Service | Quitman | MS |
|
|
|
|
|
|
|
|
1978 | 9/13/2019 | ||||||||||||||||||||||||||||||||||||||||||||||||||||||||||||||||||||
| Restaurants - Quick Service | Philadelphia | MS |
|
|
|
|
|
|
|
|
2003 | 9/13/2019 | ||||||||||||||||||||||||||||||||||||||||||||||||||||||||||||||||||||
| Restaurants - Quick Service | Prentiss | MS |
|
|
|
|
|
|
|
|
1978 | 9/13/2019 | ||||||||||||||||||||||||||||||||||||||||||||||||||||||||||||||||||||
| Restaurants - Quick Service | Aston | PA |
|
|
|
|
|
|
|
|
1963 | 9/13/2019 | ||||||||||||||||||||||||||||||||||||||||||||||||||||||||||||||||||||
| Restaurants - Quick Service | Essex | MD |
|
|
|
|
|
|
|
|
2002 | 9/13/2019 | ||||||||||||||||||||||||||||||||||||||||||||||||||||||||||||||||||||
| Pet Care Services | Kittrell | NC | {f} |
|
|
|
|
|
|
|
|
2014 | 9/19/2019 | |||||||||||||||||||||||||||||||||||||||||||||||||||||||||||||||||||
| Convenience Stores | Gassville | AR |
|
|
|
|
|
|
|
|
1999 | 9/20/2019 | ||||||||||||||||||||||||||||||||||||||||||||||||||||||||||||||||||||
| Convenience Stores | West Plains | MO |
|
|
|
|
|
|
|
|
1999 | 9/20/2019 | ||||||||||||||||||||||||||||||||||||||||||||||||||||||||||||||||||||
| Convenience Stores | Bald Knob | AR |
|
|
|
|
|
|
|
|
2006 | 9/20/2019 | ||||||||||||||||||||||||||||||||||||||||||||||||||||||||||||||||||||
| Convenience Stores | Willow Springs | MO |
|
|
|
|
|
|
|
|
2003 | 9/20/2019 | ||||||||||||||||||||||||||||||||||||||||||||||||||||||||||||||||||||
| Convenience Stores | Mountain Home | AR |
|
|
|
|
|
|
|
|
1999 | 9/20/2019 | ||||||||||||||||||||||||||||||||||||||||||||||||||||||||||||||||||||
| Convenience Stores | Calico Rock | AR |
|
|
|
|
|
|
|
|
1979 | 9/20/2019 | ||||||||||||||||||||||||||||||||||||||||||||||||||||||||||||||||||||
| Convenience Stores | Atkins | AR |
|
|
|
|
|
|
|
|
1990 | 9/20/2019 | ||||||||||||||||||||||||||||||||||||||||||||||||||||||||||||||||||||
| Convenience Stores | Russellville | AR |
|
|
|
|
|
|
|
|
1991 | 9/20/2019 | ||||||||||||||||||||||||||||||||||||||||||||||||||||||||||||||||||||
| Convenience Stores | Russellville | AR |
|
|
|
|
|
|
|
|
2000 | 9/20/2019 | ||||||||||||||||||||||||||||||||||||||||||||||||||||||||||||||||||||
| Convenience Stores | Harrisburg | AR |
|
|
|
|
|
|
|
|
2007 | 9/20/2019 | ||||||||||||||||||||||||||||||||||||||||||||||||||||||||||||||||||||
| Convenience Stores | Horseshoe Bend | AR |
|
|
|
|
|
|
|
|
1999 | 9/20/2019 | ||||||||||||||||||||||||||||||||||||||||||||||||||||||||||||||||||||
| Convenience Stores | Koshkonong | MO |
|
|
|
|
|
|
|
|
1997 | 9/20/2019 | ||||||||||||||||||||||||||||||||||||||||||||||||||||||||||||||||||||
| Health and Fitness | Greenville | SC |
|
|
|
|
|
|
|
|
1993 | 9/25/2019 | ||||||||||||||||||||||||||||||||||||||||||||||||||||||||||||||||||||
| Health and Fitness | Anderson | SC |
|
|
|
|
|
|
|
|
1997 | 9/25/2019 | ||||||||||||||||||||||||||||||||||||||||||||||||||||||||||||||||||||
| Health and Fitness | Spartanburg | SC |
|
|
|
|
|
|
|
|
2010 | 9/25/2019 | ||||||||||||||||||||||||||||||||||||||||||||||||||||||||||||||||||||
| Car Washes | Denver | CO |
|
|
|
|
|
|
|
|
2012 | 9/26/2019 | ||||||||||||||||||||||||||||||||||||||||||||||||||||||||||||||||||||
| Car Washes | Aurora | CO |
|
|
|
|
|
|
|
|
2008 | 9/26/2019 | ||||||||||||||||||||||||||||||||||||||||||||||||||||||||||||||||||||
F-16
| Description(a) | Encumbrances | Initial Cost to Company |
Cost Capitalized Subsequent
to Acquisition |
Gross Amount at
December 31, 2020(b)(c) |
Accumulated Depreciation
(d)(e) |
Year
Constructed |
Date
Acquired |
|||||||||||||||||||||||||||||||||||||||||||||||||||||||||||||||||||||||||
| Tenant Industry | City | State |
Land &
Improvements |
Building &
Improvements |
Land &
Improvements |
Building &
Improvements |
Land &
Improvements |
Building &
Improvements |
Total | |||||||||||||||||||||||||||||||||||||||||||||||||||||||||||||||||||||||
| Car Washes | Denver | CO | $ |
|
$ |
|
$ |
|
$ |
|
$ |
|
$ |
|
$ |
|
$ |
|
2014 | 9/26/2019 | ||||||||||||||||||||||||||||||||||||||||||||||||||||||||||||
| Car Washes | Fort Collins | CO |
|
|
|
|
|
|
|
|
2002 | 9/26/2019 | ||||||||||||||||||||||||||||||||||||||||||||||||||||||||||||||||||||
| Car Washes | Thornton | CO |
|
|
|
|
|
|
|
|
2018 | 9/26/2019 | ||||||||||||||||||||||||||||||||||||||||||||||||||||||||||||||||||||
| Restaurants - Family Dining | Cheyenne | WY |
|
|
|
|
|
|
|
|
1982 | 9/27/2019 | ||||||||||||||||||||||||||||||||||||||||||||||||||||||||||||||||||||
| Early Childhood Education | Frankfort | KY |
|
|
|
|
|
|
|
|
2002 | 9/27/2019 | ||||||||||||||||||||||||||||||||||||||||||||||||||||||||||||||||||||
| Pet Care Services | Onalaska | WI | {f} |
|
|
|
|
|
|
|
|
2011 | 9/27/2019 | |||||||||||||||||||||||||||||||||||||||||||||||||||||||||||||||||||
| Restaurants - Quick Service | Jonesboro | AR |
|
|
|
|
|
|
|
|
2006 | 9/30/2019 | ||||||||||||||||||||||||||||||||||||||||||||||||||||||||||||||||||||
| Restaurants - Quick Service | Bryant | AR |
|
|
|
|
|
|
|
|
2008 | 9/30/2019 | ||||||||||||||||||||||||||||||||||||||||||||||||||||||||||||||||||||
| Restaurants - Casual Dining | West Chester | OH |
|
|
|
|
|
|
|
|
2004 | 9/30/2019 | ||||||||||||||||||||||||||||||||||||||||||||||||||||||||||||||||||||
| Early Childhood Education | Leawood | KS | {f} |
|
|
|
|
|
|
|
|
2007 | 9/30/2019 | |||||||||||||||||||||||||||||||||||||||||||||||||||||||||||||||||||
| Grocery | Claremore | OK | {f} |
|
|
|
|
|
|
|
|
1989 | 9/30/2019 | |||||||||||||||||||||||||||||||||||||||||||||||||||||||||||||||||||
| Other Services | Little Rock | AR |
|
|
|
|
|
|
|
|
1982 | 9/30/2019 | ||||||||||||||||||||||||||||||||||||||||||||||||||||||||||||||||||||
| Other Services | Conyers | GA |
|
|
|
|
|
|
|
|
1999 | 9/30/2019 | ||||||||||||||||||||||||||||||||||||||||||||||||||||||||||||||||||||
| Other Services | LaVergne | TN |
|
|
|
|
|
|
|
|
2018 | 9/30/2019 | ||||||||||||||||||||||||||||||||||||||||||||||||||||||||||||||||||||
| Other Services | Seattle | WA |
|
|
|
|
|
|
|
|
1977 | 9/30/2019 | ||||||||||||||||||||||||||||||||||||||||||||||||||||||||||||||||||||
| Automotive Service | Albany | GA |
|
|
|
|
|
|
|
|
1994 | 10/1/2019 | ||||||||||||||||||||||||||||||||||||||||||||||||||||||||||||||||||||
| Automotive Service | Bainridge | GA |
|
|
|
|
|
|
|
|
1999 | 10/1/2019 | ||||||||||||||||||||||||||||||||||||||||||||||||||||||||||||||||||||
| Automotive Service | Hinesville | GA |
|
|
|
|
|
|
|
|
1998 | 10/1/2019 | ||||||||||||||||||||||||||||||||||||||||||||||||||||||||||||||||||||
| Automotive Service | Macon | GA |
|
|
|
|
|
|
|
|
2000 | 10/1/2019 | ||||||||||||||||||||||||||||||||||||||||||||||||||||||||||||||||||||
| Automotive Service | Perry | GA |
|
|
|
|
|
|
|
|
1996 | 10/1/2019 | ||||||||||||||||||||||||||||||||||||||||||||||||||||||||||||||||||||
| Automotive Service | Valdosta | GA |
|
|
|
|
|
|
|
|
1996 | 10/1/2019 | ||||||||||||||||||||||||||||||||||||||||||||||||||||||||||||||||||||
| Automotive Service | Pratville | AL |
|
|
|
|
|
|
|
|
2003 | 10/1/2019 | ||||||||||||||||||||||||||||||||||||||||||||||||||||||||||||||||||||
| Automotive Service | Montgomery | AL |
|
|
|
|
|
|
|
|
1991 | 10/1/2019 | ||||||||||||||||||||||||||||||||||||||||||||||||||||||||||||||||||||
| Pet Care Services | Medford | OR | {f} |
|
|
|
|
|
|
|
|
1990 | 10/4/2019 | |||||||||||||||||||||||||||||||||||||||||||||||||||||||||||||||||||
| Medical / Dental | Horizon City | TX |
|
|
|
|
|
|
|
|
2017 | 10/10/2019 | ||||||||||||||||||||||||||||||||||||||||||||||||||||||||||||||||||||
| Medical / Dental | El Paso | TX |
|
|
|
|
|
|
|
|
2019 | 10/10/2019 | ||||||||||||||||||||||||||||||||||||||||||||||||||||||||||||||||||||
| Convenience Stores | Houston | TX |
|
|
|
|
|
|
|
|
2009 | 10/11/2019 | ||||||||||||||||||||||||||||||||||||||||||||||||||||||||||||||||||||
| Convenience Stores | Pasadena | TX |
|
|
|
|
|
|
|
|
2016 | 10/11/2019 | ||||||||||||||||||||||||||||||||||||||||||||||||||||||||||||||||||||
| Early Childhood Education | Conway | SC |
|
|
|
|
|
|
|
|
10/17/2019 | |||||||||||||||||||||||||||||||||||||||||||||||||||||||||||||||||||||
| Convenience Stores | Avon | MN |
|
|
|
|
|
|
|
|
2004 | 10/17/2019 | ||||||||||||||||||||||||||||||||||||||||||||||||||||||||||||||||||||
| Car Washes | Davenport | IA |
|
|
|
|
|
|
|
|
2001 | 10/24/2019 | ||||||||||||||||||||||||||||||||||||||||||||||||||||||||||||||||||||
| Car Washes | Moline | IL |
|
|
|
|
|
|
|
|
1998 | 10/24/2019 | ||||||||||||||||||||||||||||||||||||||||||||||||||||||||||||||||||||
| Medical / Dental | West Helena | AR |
|
|
|
|
|
|
|
|
2003 | 10/28/2019 | ||||||||||||||||||||||||||||||||||||||||||||||||||||||||||||||||||||
| Other Services | Springfield | MO |
|
|
|
|
|
|
|
|
2007 | 10/31/2019 | ||||||||||||||||||||||||||||||||||||||||||||||||||||||||||||||||||||
| Early Childhood Education | Charlotte | NC |
|
|
|
|
|
|
|
|
1996 | 11/1/2019 | ||||||||||||||||||||||||||||||||||||||||||||||||||||||||||||||||||||
| Pet Care Services | Brandon | FL |
|
|
|
|
|
|
|
|
2003 | 11/1/2019 | ||||||||||||||||||||||||||||||||||||||||||||||||||||||||||||||||||||
| Pet Care Services | Griffin | GA |
|
|
|
|
|
|
|
|
1979 | 11/1/2019 | ||||||||||||||||||||||||||||||||||||||||||||||||||||||||||||||||||||
| Pet Care Services | Indianapolis | IN |
|
|
|
|
|
|
|
|
1967 | 11/1/2019 | ||||||||||||||||||||||||||||||||||||||||||||||||||||||||||||||||||||
| Pet Care Services | Wildwood | FL |
|
|
|
|
|
|
|
|
2005 | 11/1/2019 | ||||||||||||||||||||||||||||||||||||||||||||||||||||||||||||||||||||
| Early Childhood Education | Tucson | AZ |
|
|
|
|
|
|
|
|
1965 | 11/5/2019 | ||||||||||||||||||||||||||||||||||||||||||||||||||||||||||||||||||||
| Early Childhood Education | Tucson | AZ |
|
|
|
|
|
|
|
|
1975 | 11/5/2019 | ||||||||||||||||||||||||||||||||||||||||||||||||||||||||||||||||||||
| Early Childhood Education | Tucson | AZ |
|
|
|
|
|
|
|
|
1985 | 11/5/2019 | ||||||||||||||||||||||||||||||||||||||||||||||||||||||||||||||||||||
| Early Childhood Education | Tempe | AZ |
|
|
|
|
|
|
|
|
1971 | 11/5/2019 | ||||||||||||||||||||||||||||||||||||||||||||||||||||||||||||||||||||
| Early Childhood Education | Tucson | AZ |
|
|
|
|
|
|
|
|
1971 | 11/5/2019 | ||||||||||||||||||||||||||||||||||||||||||||||||||||||||||||||||||||
| Early Childhood Education | Tucson | AZ |
|
|
|
|
|
|
|
|
1932 | 11/5/2019 | ||||||||||||||||||||||||||||||||||||||||||||||||||||||||||||||||||||
| Early Childhood Education | Tucson | AZ |
|
|
|
|
|
|
|
|
1986 | 11/5/2019 | ||||||||||||||||||||||||||||||||||||||||||||||||||||||||||||||||||||
| Early Childhood Education | Tucson | AZ |
|
|
|
|
|
|
|
|
1958 | 11/5/2019 | ||||||||||||||||||||||||||||||||||||||||||||||||||||||||||||||||||||
| Early Childhood Education | Tucson | AZ |
|
|
|
|
|
|
|
|
1976 | 11/5/2019 | ||||||||||||||||||||||||||||||||||||||||||||||||||||||||||||||||||||
F-17
| Description(a) | Encumbrances | Initial Cost to Company |
Cost Capitalized Subsequent
to Acquisition |
Gross Amount at
December 31, 2020(b)(c) |
Accumulated Depreciation
(d)(e) |
Year
Constructed |
Date
Acquired |
|||||||||||||||||||||||||||||||||||||||||||||||||||||||||||||||||||||||||
| Tenant Industry | City | State |
Land &
Improvements |
Building &
Improvements |
Land &
Improvements |
Building &
Improvements |
Land &
Improvements |
Building &
Improvements |
Total | |||||||||||||||||||||||||||||||||||||||||||||||||||||||||||||||||||||||
| Convenience Stores | Houston | TX | $ |
|
$ |
|
$ |
|
$ |
|
$ |
|
$ |
|
$ |
|
$ |
|
1975 | 11/14/2019 | ||||||||||||||||||||||||||||||||||||||||||||||||||||||||||||
| Convenience Stores | Houston | TX |
|
|
|
|
|
|
|
|
1965 | 11/14/2019 | ||||||||||||||||||||||||||||||||||||||||||||||||||||||||||||||||||||
| Convenience Stores | Prairie View | TX |
|
|
|
|
|
|
|
|
1984 | 11/14/2019 | ||||||||||||||||||||||||||||||||||||||||||||||||||||||||||||||||||||
| Restaurants - Quick Service | Lewisburg | TN | {f} |
|
|
|
|
|
|
|
|
2016 | 11/18/2019 | |||||||||||||||||||||||||||||||||||||||||||||||||||||||||||||||||||
| Restaurants - Quick Service | Odessa | TX |
|
|
|
|
|
|
|
|
2019 | 11/21/2019 | ||||||||||||||||||||||||||||||||||||||||||||||||||||||||||||||||||||
| Restaurants - Quick Service | Odessa | TX |
|
|
|
|
|
|
|
|
2019 | 11/21/2019 | ||||||||||||||||||||||||||||||||||||||||||||||||||||||||||||||||||||
| Other Services | Salt Lake City | UT |
|
|
|
|
|
|
|
|
1973 | 11/27/2019 | ||||||||||||||||||||||||||||||||||||||||||||||||||||||||||||||||||||
| Other Services | Sanford | FL |
|
|
|
|
|
|
|
|
1964 | 11/27/2019 | ||||||||||||||||||||||||||||||||||||||||||||||||||||||||||||||||||||
| Convenience Stores | Mosinee | WI |
|
|
|
|
|
|
|
|
1975 | 12/2/2019 | ||||||||||||||||||||||||||||||||||||||||||||||||||||||||||||||||||||
| Car Washes | Ocala | FL |
|
|
|
|
|
|
|
|
2019 | 12/10/2019 | ||||||||||||||||||||||||||||||||||||||||||||||||||||||||||||||||||||
| Car Washes | Hampstead | NC |
|
|
|
|
|
|
|
|
2019 | 12/10/2019 | ||||||||||||||||||||||||||||||||||||||||||||||||||||||||||||||||||||
| Medical / Dental | Conyers | GA |
|
|
|
|
|
|
|
|
1996 | 12/12/2019 | ||||||||||||||||||||||||||||||||||||||||||||||||||||||||||||||||||||
| Medical / Dental | Covington | GA |
|
|
|
|
|
|
|
|
2004 | 12/12/2019 | ||||||||||||||||||||||||||||||||||||||||||||||||||||||||||||||||||||
| Automotive Service | Fayetteville | GA | {f} |
|
|
|
|
|
|
|
|
2006 | 12/13/2019 | |||||||||||||||||||||||||||||||||||||||||||||||||||||||||||||||||||
| Early Childhood Education | Boulder | CO |
|
|
|
|
|
|
|
|
1988 | 12/13/2019 | ||||||||||||||||||||||||||||||||||||||||||||||||||||||||||||||||||||
| Restaurants - Quick Service | Columbia City | IN |
|
|
|
|
|
|
|
|
1973 | 12/17/2019 | ||||||||||||||||||||||||||||||||||||||||||||||||||||||||||||||||||||
| Restaurants - Quick Service | North Manchester | IN |
|
|
|
|
|
|
|
|
1987 | 12/17/2019 | ||||||||||||||||||||||||||||||||||||||||||||||||||||||||||||||||||||
| Restaurants - Quick Service | Winona | MS |
|
|
|
|
|
|
|
|
2019 | 12/19/2019 | ||||||||||||||||||||||||||||||||||||||||||||||||||||||||||||||||||||
| Restaurants - Quick Service | Hazlehurst | MS |
|
|
|
|
|
|
|
|
2019 | 12/19/2019 | ||||||||||||||||||||||||||||||||||||||||||||||||||||||||||||||||||||
| Restaurants - Quick Service | Vicksburg | MS |
|
|
|
|
|
|
|
|
2019 | 12/19/2019 | ||||||||||||||||||||||||||||||||||||||||||||||||||||||||||||||||||||
| Restaurants - Quick Service | Blytheville | AR |
|
|
|
|
|
|
|
|
2019 | 12/19/2019 | ||||||||||||||||||||||||||||||||||||||||||||||||||||||||||||||||||||
| Restaurants - Quick Service | Wynne | AR |
|
|
|
|
|
|
|
|
2019 | 12/19/2019 | ||||||||||||||||||||||||||||||||||||||||||||||||||||||||||||||||||||
| Restaurants - Quick Service | Salem | IN | {f} |
|
|
|
|
|
|
|
|
2019 | 12/19/2019 | |||||||||||||||||||||||||||||||||||||||||||||||||||||||||||||||||||
| Restaurants - Quick Service | Ashland City | TN |
|
|
|
|
|
|
|
|
2019 | 12/19/2019 | ||||||||||||||||||||||||||||||||||||||||||||||||||||||||||||||||||||
| Restaurants - Quick Service | Shelbyville | KY | {f} |
|
|
|
|
|
|
|
|
2018 | 12/19/2019 | |||||||||||||||||||||||||||||||||||||||||||||||||||||||||||||||||||
| Restaurants - Quick Service | Whiteland | IN | {f} |
|
|
|
|
|
|
|
|
2003 | 12/19/2019 | |||||||||||||||||||||||||||||||||||||||||||||||||||||||||||||||||||
| Restaurants - Quick Service | Bloomington | IN |
|
|
|
|
|
|
|
|
2018 | 12/23/2019 | ||||||||||||||||||||||||||||||||||||||||||||||||||||||||||||||||||||
| Restaurants - Quick Service | Cheektowaga | NY |
|
|
|
|
|
|
|
|
2000 | 12/23/2019 | ||||||||||||||||||||||||||||||||||||||||||||||||||||||||||||||||||||
| Restaurants - Quick Service | Memphis | TN |
|
|
|
|
|
|
|
|
2019 | 12/23/2019 | ||||||||||||||||||||||||||||||||||||||||||||||||||||||||||||||||||||
| Restaurants - Quick Service | Somerset | KY |
|
|
|
|
|
|
|
|
2019 | 12/23/2019 | ||||||||||||||||||||||||||||||||||||||||||||||||||||||||||||||||||||
| Car Washes | Sioux Falls | SD |
|
|
|
|
|
|
|
|
1992 | 12/19/2019 | ||||||||||||||||||||||||||||||||||||||||||||||||||||||||||||||||||||
| Car Washes | Sioux Falls | SD |
|
|
|
|
|
|
|
|
1987 | 12/19/2019 | ||||||||||||||||||||||||||||||||||||||||||||||||||||||||||||||||||||
| Car Washes | Sioux City | IA |
|
|
|
|
|
|
|
|
2020 | 12/19/2019 | ||||||||||||||||||||||||||||||||||||||||||||||||||||||||||||||||||||
| Car Washes | South Sioux City | NE |
|
|
|
|
|
|
|
|
2020 | 12/19/2019 | ||||||||||||||||||||||||||||||||||||||||||||||||||||||||||||||||||||
| Automotive Service | Crystal Lake | IL |
|
|
|
|
|
|
|
|
1974 | 12/20/2019 | ||||||||||||||||||||||||||||||||||||||||||||||||||||||||||||||||||||
| Car Washes | Jonesboro | AR |
|
|
|
|
|
|
|
|
2019 | 12/20/2019 | ||||||||||||||||||||||||||||||||||||||||||||||||||||||||||||||||||||
| Medical / Dental | Grand Blanc | MI |
|
|
|
|
|
|
|
|
2007 | 12/23/2019 | ||||||||||||||||||||||||||||||||||||||||||||||||||||||||||||||||||||
| Convenience Stores | Roscoe | IL |
|
|
|
|
|
|
|
|
1999 | 12/27/2019 | ||||||||||||||||||||||||||||||||||||||||||||||||||||||||||||||||||||
| Medical / Dental | Arnold | MO | {f} |
|
|
|
|
|
|
|
|
2015 | 12/30/2019 | |||||||||||||||||||||||||||||||||||||||||||||||||||||||||||||||||||
| Medical / Dental | Allen | TX |
|
|
|
|
|
|
|
|
1983 | 12/31/2019 | ||||||||||||||||||||||||||||||||||||||||||||||||||||||||||||||||||||
| Medical / Dental | Flower Mound | TX |
|
|
|
|
|
|
|
|
1999 | 12/31/2019 | ||||||||||||||||||||||||||||||||||||||||||||||||||||||||||||||||||||
| Medical / Dental | Plano | TX |
|
|
|
|
|
|
|
|
1998 | 12/31/2019 | ||||||||||||||||||||||||||||||||||||||||||||||||||||||||||||||||||||
F-18
| Description(a) | Encumbrances | Initial Cost to Company |
Cost Capitalized Subsequent
to Acquisition |
Gross Amount at
December 31, 2020(b)(c) |
Accumulated Depreciation
(d)(e) |
Year
Constructed |
Date
Acquired |
|||||||||||||||||||||||||||||||||||||||||||||||||||||||||||||||||||||||||
| Tenant Industry | City | State |
Land &
Improvements |
Building &
Improvements |
Land &
Improvements |
Building &
Improvements |
Land &
Improvements |
Building &
Improvements |
Total | |||||||||||||||||||||||||||||||||||||||||||||||||||||||||||||||||||||||
| Automotive Service | Houston | TX | $ |
|
$ |
|
$ |
|
$ |
|
$ |
|
$ |
|
$ |
|
$ |
|
1986 | 1/30/2020 | ||||||||||||||||||||||||||||||||||||||||||||||||||||||||||||
| Automotive Service | Pasadena | TX |
|
|
|
|
|
|
|
|
1971 | 1/30/2020 | ||||||||||||||||||||||||||||||||||||||||||||||||||||||||||||||||||||
| Early Childhood Education | Weston | MA |
|
|
|
|
|
|
|
|
1990 | 2/7/2020 | ||||||||||||||||||||||||||||||||||||||||||||||||||||||||||||||||||||
| Grocery | Tulsa | OK |
|
|
|
|
|
|
|
|
1991 | 3/24/2020 | ||||||||||||||||||||||||||||||||||||||||||||||||||||||||||||||||||||
| Grocery | Tulsa | OK |
|
|
|
|
|
|
|
|
1993 | 3/24/2020 | ||||||||||||||||||||||||||||||||||||||||||||||||||||||||||||||||||||
| Restaurants - Quick Service | Fall River | MA |
|
|
|
|
|
|
|
|
1984 | 1/15/2020 | ||||||||||||||||||||||||||||||||||||||||||||||||||||||||||||||||||||
| Restaurants - Quick Service | Worcester | MA |
|
|
|
|
|
|
|
|
1965 | 1/15/2020 | ||||||||||||||||||||||||||||||||||||||||||||||||||||||||||||||||||||
| Restaurants - Quick Service | Plainville | MA |
|
|
|
|
|
|
|
|
1984 | 1/15/2020 | ||||||||||||||||||||||||||||||||||||||||||||||||||||||||||||||||||||
| Restaurants - Quick Service | Stoughton | MA |
|
|
|
|
|
|
|
|
1983 | 1/15/2020 | ||||||||||||||||||||||||||||||||||||||||||||||||||||||||||||||||||||
| Restaurants - Quick Service | Fall River | MA |
|
|
|
|
|
|
|
|
1987 | 1/15/2020 | ||||||||||||||||||||||||||||||||||||||||||||||||||||||||||||||||||||
| Restaurants - Quick Service | Worcester | MA |
|
|
|
|
|
|
|
|
1965 | 1/15/2020 | ||||||||||||||||||||||||||||||||||||||||||||||||||||||||||||||||||||
| Restaurants - Quick Service | Leominster | MA |
|
|
|
|
|
|
|
|
1980 | 1/15/2020 | ||||||||||||||||||||||||||||||||||||||||||||||||||||||||||||||||||||
| Restaurants - Quick Service | Dorchester | MA |
|
|
|
|
|
|
|
|
1984 | 1/15/2020 | ||||||||||||||||||||||||||||||||||||||||||||||||||||||||||||||||||||
| Restaurants - Quick Service | Sudbury | MA |
|
|
|
|
|
|
|
|
1983 | 1/15/2020 | ||||||||||||||||||||||||||||||||||||||||||||||||||||||||||||||||||||
| Car Washes | Manor | TX |
|
|
|
|
|
|
|
|
2019 | 1/21/2020 | ||||||||||||||||||||||||||||||||||||||||||||||||||||||||||||||||||||
| Early Childhood Education | Charlotte | NC |
|
|
|
|
|
|
|
|
1987 | 8/17/2020 | ||||||||||||||||||||||||||||||||||||||||||||||||||||||||||||||||||||
| Restaurants - Quick Service | Loudon | TN |
|
|
|
|
|
|
|
|
2020 | 2/26/2020 | ||||||||||||||||||||||||||||||||||||||||||||||||||||||||||||||||||||
| Restaurants - Quick Service | St. Mary's | PA | {f} |
|
|
|
|
|
|
|
|
2020 | 4/3/2020 | |||||||||||||||||||||||||||||||||||||||||||||||||||||||||||||||||||
| Restaurants - Quick Service | Dyersburg | TN |
|
|
|
|
|
|
|
|
2007 | 1/30/2020 | ||||||||||||||||||||||||||||||||||||||||||||||||||||||||||||||||||||
| Restaurants - Quick Service | Memphis | TN |
|
|
|
|
|
|
|
|
2011 | 1/30/2020 | ||||||||||||||||||||||||||||||||||||||||||||||||||||||||||||||||||||
| Restaurants - Quick Service | Memphis | TN |
|
|
|
|
|
|
|
|
2011 | 1/30/2020 | ||||||||||||||||||||||||||||||||||||||||||||||||||||||||||||||||||||
| Restaurants - Quick Service | Memphis | TN |
|
|
|
|
|
|
|
|
2000 | 1/30/2020 | ||||||||||||||||||||||||||||||||||||||||||||||||||||||||||||||||||||
| Restaurants - Quick Service | Memphis | TN |
|
|
|
|
|
|
|
|
1994 | 1/30/2020 | ||||||||||||||||||||||||||||||||||||||||||||||||||||||||||||||||||||
| Restaurants - Quick Service | Senatobia | MS |
|
|
|
|
|
|
|
|
2013 | 1/30/2020 | ||||||||||||||||||||||||||||||||||||||||||||||||||||||||||||||||||||
| Restaurants - Quick Service | Jackson | MS |
|
|
|
|
|
|
|
|
1985 | 1/29/2020 | ||||||||||||||||||||||||||||||||||||||||||||||||||||||||||||||||||||
| Car Washes | Arvada | CO |
|
|
|
|
|
|
|
|
2008 | 1/24/2020 | ||||||||||||||||||||||||||||||||||||||||||||||||||||||||||||||||||||
| Car Washes | Golden | CO |
|
|
|
|
|
|
|
|
2005 | 1/24/2020 | ||||||||||||||||||||||||||||||||||||||||||||||||||||||||||||||||||||
| Car Washes | Sioux City | IA |
|
|
|
|
|
|
|
|
2020 | 8/13/2020 | ||||||||||||||||||||||||||||||||||||||||||||||||||||||||||||||||||||
| Restaurants - Casual Dining | Fort Wayne | IN |
|
|
|
|
|
|
|
|
1999 | 1/7/2020 | ||||||||||||||||||||||||||||||||||||||||||||||||||||||||||||||||||||
| Early Childhood Education | Naperville | IL |
|
|
|
|
|
|
|
|
2009 | 2/21/2020 | ||||||||||||||||||||||||||||||||||||||||||||||||||||||||||||||||||||
| Early Childhood Education | Northbrook | IL |
|
|
|
|
|
|
|
|
2014 | 2/24/2020 | ||||||||||||||||||||||||||||||||||||||||||||||||||||||||||||||||||||
| Medical / Dental | Tyler | TX |
|
|
|
|
|
|
|
|
2015 | 1/17/2020 | ||||||||||||||||||||||||||||||||||||||||||||||||||||||||||||||||||||
| Early Childhood Education | Franklin | TN | {f} |
|
|
|
|
|
|
|
|
1996 | 9/4/2020 | |||||||||||||||||||||||||||||||||||||||||||||||||||||||||||||||||||
| Restaurants - Casual Dining | Grand Rapids | MI |
|
|
|
|
|
|
|
|
2003 | 1/29/2020 | ||||||||||||||||||||||||||||||||||||||||||||||||||||||||||||||||||||
| Medical / Dental | Flagstaff | AZ |
|
|
|
|
|
|
|
|
1980 | 2/27/2020 | ||||||||||||||||||||||||||||||||||||||||||||||||||||||||||||||||||||
| Medical / Dental | Portland | OR |
|
|
|
|
|
|
|
|
1981 | 2/27/2020 | ||||||||||||||||||||||||||||||||||||||||||||||||||||||||||||||||||||
| Other Services | Watsontown | PA |
|
|
|
|
|
|
|
|
1987 | 2/13/2020 | ||||||||||||||||||||||||||||||||||||||||||||||||||||||||||||||||||||
| Early Childhood Education | Concord | NC |
|
|
|
|
|
|
|
|
2003 | 8/17/2020 | ||||||||||||||||||||||||||||||||||||||||||||||||||||||||||||||||||||
| Medical / Dental | DeLand | FL |
|
|
|
|
|
|
|
|
2004 | 3/9/2020 | ||||||||||||||||||||||||||||||||||||||||||||||||||||||||||||||||||||
| Automotive Service | King | NC |
|
|
|
|
|
|
|
|
1985 | 3/10/2020 | ||||||||||||||||||||||||||||||||||||||||||||||||||||||||||||||||||||
| Automotive Service | Elkin | NC |
|
|
|
|
|
|
|
|
1997 | 3/10/2020 | ||||||||||||||||||||||||||||||||||||||||||||||||||||||||||||||||||||
| Automotive Service | Yadkinville | NC |
|
|
|
|
|
|
|
|
2001 | 3/10/2020 | ||||||||||||||||||||||||||||||||||||||||||||||||||||||||||||||||||||
| Automotive Service | Lancaster | SC |
|
|
|
|
|
|
|
|
2007 | 3/10/2020 | ||||||||||||||||||||||||||||||||||||||||||||||||||||||||||||||||||||
| Automotive Service | Lenoir | NC |
|
|
|
|
|
|
|
|
1991 | 3/10/2020 | ||||||||||||||||||||||||||||||||||||||||||||||||||||||||||||||||||||
| Automotive Service | Hickory | NC |
|
|
|
|
|
|
|
|
1988 | 3/10/2020 | ||||||||||||||||||||||||||||||||||||||||||||||||||||||||||||||||||||
| Automotive Service | St. Albans | WV |
|
|
|
|
|
|
|
|
1987 | 3/10/2020 | ||||||||||||||||||||||||||||||||||||||||||||||||||||||||||||||||||||
| Automotive Service | Hurricane | WV |
|
|
|
|
|
|
|
|
1989 | 3/10/2020 | ||||||||||||||||||||||||||||||||||||||||||||||||||||||||||||||||||||
| Automotive Service | South Boston | VA |
|
|
|
|
|
|
|
|
1996 | 3/10/2020 | ||||||||||||||||||||||||||||||||||||||||||||||||||||||||||||||||||||
F-19
| Description(a) | Encumbrances | Initial Cost to Company |
Cost Capitalized Subsequent
to Acquisition |
Gross Amount at
December 31, 2020(b)(c) |
Accumulated Depreciation
(d)(e) |
Year
Constructed |
Date
Acquired |
|||||||||||||||||||||||||||||||||||||||||||||||||||||||||||||||||||||||||
| Tenant Industry | City | State |
Land &
Improvements |
Building &
Improvements |
Land &
Improvements |
Building &
Improvements |
Land &
Improvements |
Building &
Improvements |
Total | |||||||||||||||||||||||||||||||||||||||||||||||||||||||||||||||||||||||
| Automotive Service | Pittsboro | NC | $ |
|
$ |
|
$ |
|
$ |
|
$ |
|
$ |
|
$ |
|
$ |
|
2006 | 3/10/2020 | ||||||||||||||||||||||||||||||||||||||||||||||||||||||||||||
| Early Childhood Education | Hartland | WI |
|
|
|
|
|
|
|
|
2000 | 3/6/2020 | ||||||||||||||||||||||||||||||||||||||||||||||||||||||||||||||||||||
| Early Childhood Education | Menomonee Falls | WI |
|
|
|
|
|
|
|
|
1978 | 3/6/2020 | ||||||||||||||||||||||||||||||||||||||||||||||||||||||||||||||||||||
| Early Childhood Education | Menomonee Falls | WI |
|
|
|
|
|
|
|
|
2000 | 3/6/2020 | ||||||||||||||||||||||||||||||||||||||||||||||||||||||||||||||||||||
| Early Childhood Education | Waukesha | WI |
|
|
|
|
|
|
|
|
1996 | 3/6/2020 | ||||||||||||||||||||||||||||||||||||||||||||||||||||||||||||||||||||
| Early Childhood Education | Oconomowoc | WI |
|
|
|
|
|
|
|
|
2007 | 3/6/2020 | ||||||||||||||||||||||||||||||||||||||||||||||||||||||||||||||||||||
| Medical / Dental | Lake City | FL |
|
|
|
|
|
|
|
|
1974 | 3/4/2020 | ||||||||||||||||||||||||||||||||||||||||||||||||||||||||||||||||||||
| Early Childhood Education | Waterford | MI | {f} |
|
|
|
|
|
|
|
|
1997 | 9/18/2020 | |||||||||||||||||||||||||||||||||||||||||||||||||||||||||||||||||||
| Early Childhood Education | Tucson | AZ |
|
|
|
|
|
|
|
|
2008 | 3/6/2020 | ||||||||||||||||||||||||||||||||||||||||||||||||||||||||||||||||||||
| Car Washes | Casa Grande | AZ |
|
|
|
|
|
|
|
|
2020 | 2/6/2020 | ||||||||||||||||||||||||||||||||||||||||||||||||||||||||||||||||||||
| Early Childhood Education | Marietta | GA |
|
|
|
|
|
|
|
|
1997 | 3/6/2020 | ||||||||||||||||||||||||||||||||||||||||||||||||||||||||||||||||||||
| Early Childhood Education | Alpharetta | GA |
|
|
|
|
|
|
|
|
1995 | 3/6/2020 | ||||||||||||||||||||||||||||||||||||||||||||||||||||||||||||||||||||
| Automotive Service | Arlington | TX |
|
|
|
|
|
|
|
|
2015 | 2/14/2020 | ||||||||||||||||||||||||||||||||||||||||||||||||||||||||||||||||||||
| Medical / Dental | Orange | TX |
|
|
|
|
|
|
|
|
2015 | 2/21/2020 | ||||||||||||||||||||||||||||||||||||||||||||||||||||||||||||||||||||
| Automotive Service | Little Elm | TX |
|
|
|
|
|
|
|
|
2007 | 3/6/2020 | ||||||||||||||||||||||||||||||||||||||||||||||||||||||||||||||||||||
| Automotive Service | McKinney | TX |
|
|
|
|
|
|
|
|
2010 | 3/6/2020 | ||||||||||||||||||||||||||||||||||||||||||||||||||||||||||||||||||||
| Restaurants - Quick Service | West Dundee | IL |
|
|
|
|
|
|
|
|
2020 | 3/6/2020 | ||||||||||||||||||||||||||||||||||||||||||||||||||||||||||||||||||||
| Pet Care Services | Catonsville | MD |
|
|
|
|
|
|
|
|
1998 | 5/4/2020 | ||||||||||||||||||||||||||||||||||||||||||||||||||||||||||||||||||||
| Restaurants - Family Dining | Greenville | SC |
|
|
|
|
|
|
|
|
1972 | 3/19/2020 | ||||||||||||||||||||||||||||||||||||||||||||||||||||||||||||||||||||
| Restaurants - Family Dining | Charleston | SC |
|
|
|
|
|
|
|
|
1978 | 3/19/2020 | ||||||||||||||||||||||||||||||||||||||||||||||||||||||||||||||||||||
| Automotive Service | Gilbert | AZ | {f} |
|
|
|
|
|
|
|
|
2019 | 4/30/2020 | |||||||||||||||||||||||||||||||||||||||||||||||||||||||||||||||||||
| Restaurants - Quick Service | Yazoo City | MS | {f} |
|
|
|
|
|
|
|
|
1975 | 5/7/2020 | |||||||||||||||||||||||||||||||||||||||||||||||||||||||||||||||||||
| Other Services | Richmond Hill | GA |
|
|
|
|
|
|
|
|
2019 | 6/8/2020 | ||||||||||||||||||||||||||||||||||||||||||||||||||||||||||||||||||||
| Other Services | Centennial | CO |
|
|
|
|
|
|
|
|
2005 | 6/8/2020 | ||||||||||||||||||||||||||||||||||||||||||||||||||||||||||||||||||||
| Other Services | Joplin | MO |
|
|
|
|
|
|
|
|
1997 | 6/8/2020 | ||||||||||||||||||||||||||||||||||||||||||||||||||||||||||||||||||||
| Other Services | Kansas City | MO |
|
|
|
|
|
|
|
|
2015 | 6/8/2020 | ||||||||||||||||||||||||||||||||||||||||||||||||||||||||||||||||||||
| Automotive Service | Tempe | AZ | {f} |
|
|
|
|
|
|
|
|
1987 | 5/28/2020 | |||||||||||||||||||||||||||||||||||||||||||||||||||||||||||||||||||
| Restaurants - Quick Service | Byram | MS | {f} |
|
|
|
|
|
|
|
|
2003 | 6/8/2020 | |||||||||||||||||||||||||||||||||||||||||||||||||||||||||||||||||||
| Restaurants - Quick Service | Big Spring | TX |
|
|
|
|
|
|
|
|
2020 | 6/25/2020 | ||||||||||||||||||||||||||||||||||||||||||||||||||||||||||||||||||||
| Car Washes | Flagstaff | AZ |
|
|
|
|
|
|
|
|
2018 | 7/24/2020 | ||||||||||||||||||||||||||||||||||||||||||||||||||||||||||||||||||||
| Car Washes | Phoenix | AZ |
|
|
|
|
|
|
|
|
2018 | 7/24/2020 | ||||||||||||||||||||||||||||||||||||||||||||||||||||||||||||||||||||
| Car Washes | Sun City | AZ |
|
|
|
|
|
|
|
|
1988 | 7/24/2020 | ||||||||||||||||||||||||||||||||||||||||||||||||||||||||||||||||||||
| Car Washes | Scottsdale | AZ |
|
|
|
|
|
|
|
|
1994 | 7/24/2020 | ||||||||||||||||||||||||||||||||||||||||||||||||||||||||||||||||||||
| Car Washes | Yuma | AZ |
|
|
|
|
|
|
|
|
2001 | 7/24/2020 | ||||||||||||||||||||||||||||||||||||||||||||||||||||||||||||||||||||
| Restaurants - Quick Service | Sparta | TN |
|
|
|
|
|
|
|
|
1997 | 6/25/2020 | ||||||||||||||||||||||||||||||||||||||||||||||||||||||||||||||||||||
| Restaurants - Quick Service | McMinnville | TN | {f} |
|
|
|
|
|
|
|
|
2017 | 7/16/2020 | |||||||||||||||||||||||||||||||||||||||||||||||||||||||||||||||||||
| Restaurants - Quick Service | Newnan | GA |
|
|
|
|
|
|
|
|
1987 | 8/19/2020 | ||||||||||||||||||||||||||||||||||||||||||||||||||||||||||||||||||||
| Restaurants - Quick Service | Newnan | GA |
|
|
|
|
|
|
|
|
2005 | 8/19/2020 | ||||||||||||||||||||||||||||||||||||||||||||||||||||||||||||||||||||
| Restaurants - Quick Service | Lawrenceville | GA |
|
|
|
|
|
|
|
|
2005 | 8/19/2020 | ||||||||||||||||||||||||||||||||||||||||||||||||||||||||||||||||||||
| Grocery | Dexter | MO |
|
|
|
|
|
|
|
|
1998 | 9/30/2020 | ||||||||||||||||||||||||||||||||||||||||||||||||||||||||||||||||||||
| Grocery | Kennett | MO | {f} |
|
|
|
|
|
|
|
|
2013 | 9/30/2020 | |||||||||||||||||||||||||||||||||||||||||||||||||||||||||||||||||||
| Grocery | Park Hills | MO |
|
|
|
|
|
|
|
|
1970 | 9/30/2020 | ||||||||||||||||||||||||||||||||||||||||||||||||||||||||||||||||||||
| Grocery | Piggott | AR |
|
|
|
|
|
|
|
|
1986 | 9/30/2020 | ||||||||||||||||||||||||||||||||||||||||||||||||||||||||||||||||||||
| Grocery | Potosi | MO |
|
|
|
|
|
|
|
|
1970 | 9/30/2020 | ||||||||||||||||||||||||||||||||||||||||||||||||||||||||||||||||||||
F-20
| Description(a) | Encumbrances | Initial Cost to Company |
Cost Capitalized Subsequent
to Acquisition |
Gross Amount at
December 31, 2020(b)(c) |
Accumulated Depreciation
(d)(e) |
Year
Constructed |
Date
Acquired |
|||||||||||||||||||||||||||||||||||||||||||||||||||||||||||||||||||||||||
| Tenant Industry | City | State |
Land &
Improvements |
Building &
Improvements |
Land &
Improvements |
Building &
Improvements |
Land &
Improvements |
Building &
Improvements |
Total | |||||||||||||||||||||||||||||||||||||||||||||||||||||||||||||||||||||||
| Grocery | Malden | MO | {f} | $ |
|
$ |
|
$ |
|
$ |
|
$ |
|
$ |
|
$ |
|
$ |
|
1978 | 9/30/2020 | |||||||||||||||||||||||||||||||||||||||||||||||||||||||||||
| Grocery | Mayflower | AR |
|
|
|
|
|
|
|
|
2020 | 9/30/2020 | ||||||||||||||||||||||||||||||||||||||||||||||||||||||||||||||||||||
| Automotive Service | East Brunswick | NJ |
|
|
|
|
|
|
|
|
1960 | 9/18/2020 | ||||||||||||||||||||||||||||||||||||||||||||||||||||||||||||||||||||
| Automotive Service | Washington | NJ |
|
|
|
|
|
|
|
|
1969 | 9/18/2020 | ||||||||||||||||||||||||||||||||||||||||||||||||||||||||||||||||||||
| Automotive Service | Princeton | NJ |
|
|
|
|
|
|
|
|
1947 | 9/18/2020 | ||||||||||||||||||||||||||||||||||||||||||||||||||||||||||||||||||||
| Automotive Service | Lawrenceville | NJ |
|
|
|
|
|
|
|
|
1960 | 9/18/2020 | ||||||||||||||||||||||||||||||||||||||||||||||||||||||||||||||||||||
| Automotive Service | Madison | NJ |
|
|
|
|
|
|
|
|
1950 | 9/18/2020 | ||||||||||||||||||||||||||||||||||||||||||||||||||||||||||||||||||||
| Automotive Service | Chester | NJ |
|
|
|
|
|
|
|
|
1995 | 9/18/2020 | ||||||||||||||||||||||||||||||||||||||||||||||||||||||||||||||||||||
| Automotive Service | Manville | NJ |
|
|
|
|
|
|
|
|
1977 | 9/18/2020 | ||||||||||||||||||||||||||||||||||||||||||||||||||||||||||||||||||||
| Automotive Service | North Caldwell | NJ |
|
|
|
|
|
|
|
|
1968 | 9/18/2020 | ||||||||||||||||||||||||||||||||||||||||||||||||||||||||||||||||||||
| Automotive Service | Kerhonkson | NY |
|
|
|
|
|
|
|
|
1982 | 9/18/2020 | ||||||||||||||||||||||||||||||||||||||||||||||||||||||||||||||||||||
| Automotive Service | Bethlehem | PA |
|
|
|
|
|
|
|
|
1968 | 9/18/2020 | ||||||||||||||||||||||||||||||||||||||||||||||||||||||||||||||||||||
| Automotive Service | Langhorne | PA |
|
|
|
|
|
|
|
|
1999 | 9/18/2020 | ||||||||||||||||||||||||||||||||||||||||||||||||||||||||||||||||||||
| Automotive Service | Quakertown | PA |
|
|
|
|
|
|
|
|
2012 | 9/18/2020 | ||||||||||||||||||||||||||||||||||||||||||||||||||||||||||||||||||||
| Restaurants - Quick Service | Hattiesburg | MS |
|
|
|
|
|
|
|
|
2000 | 9/11/2020 | ||||||||||||||||||||||||||||||||||||||||||||||||||||||||||||||||||||
| Car Washes | Fort Worth | TX |
|
|
|
|
|
|
|
|
2020 | 8/31/2020 | ||||||||||||||||||||||||||||||||||||||||||||||||||||||||||||||||||||
| Car Washes | Westminster | CO |
|
|
|
|
|
|
|
|
2003 | 9/24/2020 | ||||||||||||||||||||||||||||||||||||||||||||||||||||||||||||||||||||
| Car Washes | Palatka | FL |
|
|
|
|
|
|
|
|
2020 | 9/30/2020 | ||||||||||||||||||||||||||||||||||||||||||||||||||||||||||||||||||||
| Car Washes |
|
|
|
|
|
|
|
|
2020 | 9/30/2020 | ||||||||||||||||||||||||||||||||||||||||||||||||||||||||||||||||||||||
| Restaurants - Quick Service | Greenwood | SC |
|
|
|
|
|
|
|
|
2014 | 9/24/2020 | ||||||||||||||||||||||||||||||||||||||||||||||||||||||||||||||||||||
| Medical / Dental | Flint | TX |
|
|
|
|
|
|
|
|
2008 | 9/24/2020 | ||||||||||||||||||||||||||||||||||||||||||||||||||||||||||||||||||||
| Other Services | Alabaster | AL |
|
|
|
|
|
|
|
|
2003 | 9/29/2020 | ||||||||||||||||||||||||||||||||||||||||||||||||||||||||||||||||||||
| Other Services | Albuquerque | NM |
|
|
|
|
|
|
|
|
1970 | 9/29/2020 | ||||||||||||||||||||||||||||||||||||||||||||||||||||||||||||||||||||
| Other Services | Shreveport | LA |
|
|
|
|
|
|
|
|
2012 | 9/29/2020 | ||||||||||||||||||||||||||||||||||||||||||||||||||||||||||||||||||||
| Automotive Service | Skiatook | OK |
|
|
|
|
|
|
|
|
2005 | 9/30/2020 | ||||||||||||||||||||||||||||||||||||||||||||||||||||||||||||||||||||
| Automotive Service | Bartlesville | OK |
|
|
|
|
|
|
|
|
1967 | 9/30/2020 | ||||||||||||||||||||||||||||||||||||||||||||||||||||||||||||||||||||
| Automotive Service | Owasso | OK |
|
|
|
|
|
|
|
|
2007 | 9/30/2020 | ||||||||||||||||||||||||||||||||||||||||||||||||||||||||||||||||||||
| Automotive Service | Bartlesville | OK |
|
|
|
|
|
|
|
|
2003 | 9/30/2020 | ||||||||||||||||||||||||||||||||||||||||||||||||||||||||||||||||||||
| Automotive Service | Broken Arrow | OK |
|
|
|
|
|
|
|
|
2014 | 9/30/2020 | ||||||||||||||||||||||||||||||||||||||||||||||||||||||||||||||||||||
| Automotive Service | Tulsa | OK |
|
|
|
|
|
|
|
|
2019 | 9/30/2020 | ||||||||||||||||||||||||||||||||||||||||||||||||||||||||||||||||||||
| Automotive Service | Bartlesville | OK |
|
|
|
|
|
|
|
|
1980 | 9/30/2020 | ||||||||||||||||||||||||||||||||||||||||||||||||||||||||||||||||||||
| Medical / Dental | Taunton | MA | {f} |
|
|
|
|
|
|
|
|
1972 | 10/1/2020 | |||||||||||||||||||||||||||||||||||||||||||||||||||||||||||||||||||
| Medical / Dental | Plymouth | MA | {f} |
|
|
|
|
|
|
|
|
2005 | 10/1/2020 | |||||||||||||||||||||||||||||||||||||||||||||||||||||||||||||||||||
| Medical / Dental | Middleborough | MA | {f} |
|
|
|
|
|
|
|
|
1925 | 10/1/2020 | |||||||||||||||||||||||||||||||||||||||||||||||||||||||||||||||||||
| Car Washes | Phenix City | AL |
|
|
|
|
|
|
|
|
2020 | 10/5/2020 | ||||||||||||||||||||||||||||||||||||||||||||||||||||||||||||||||||||
| Medical / Dental | Pine Bluff | AR |
|
|
|
|
|
|
|
|
1983 | 10/9/2020 | ||||||||||||||||||||||||||||||||||||||||||||||||||||||||||||||||||||
| Early Childhood Education | Jackson | MI | {f} |
|
|
|
|
|
|
|
|
1990 | 10/14/2020 | |||||||||||||||||||||||||||||||||||||||||||||||||||||||||||||||||||
| Early Childhood Education | Jackson | MI | {f} |
|
|
|
|
|
|
|
|
1987 | 10/14/2020 | |||||||||||||||||||||||||||||||||||||||||||||||||||||||||||||||||||
| Medical / Dental | Valdosta | GA |
|
|
|
|
|
|
|
|
1996 | 10/15/2020 | ||||||||||||||||||||||||||||||||||||||||||||||||||||||||||||||||||||
| Medical / Dental | Valdosta | GA |
|
|
|
|
|
|
|
|
1990 | 10/15/2020 | ||||||||||||||||||||||||||||||||||||||||||||||||||||||||||||||||||||
| Grocery | Jackson | MO |
|
|
|
|
|
|
|
|
1995 | 10/22/2020 | ||||||||||||||||||||||||||||||||||||||||||||||||||||||||||||||||||||
| Grocery | Marble Hill | MO |
|
|
|
|
|
|
|
|
1999 | 10/22/2020 | ||||||||||||||||||||||||||||||||||||||||||||||||||||||||||||||||||||
| Equipment Rental and Sales | Chatham | NY |
|
|
|
|
|
|
|
|
1974 | 10/22/2020 | ||||||||||||||||||||||||||||||||||||||||||||||||||||||||||||||||||||
F-21
| Description(a) | Encumbrances | Initial Cost to Company |
Cost Capitalized Subsequent
to Acquisition |
Gross Amount at
December 31, 2020(b)(c) |
Accumulated Depreciation
(d)(e) |
Year
Constructed |
Date
Acquired |
|||||||||||||||||||||||||||||||||||||||||||||||||||||||||||||||||||||||||
| Tenant Industry | City | State |
Land &
Improvements |
Building &
Improvements |
Land &
Improvements |
Building &
Improvements |
Land &
Improvements |
Building &
Improvements |
Total | |||||||||||||||||||||||||||||||||||||||||||||||||||||||||||||||||||||||
| Equipment Rental and Sales | Clifton Park | NY |
$
|
$
|
|
|
$ |
|
$ |
|
$ |
|
$ |
|
2000 | 10/22/2020 | ||||||||||||||||||||||||||||||||||||||||||||||||||||||||||||||||
| Equipment Rental and Sales | Goshen | NY |
|
|
|
|
|
|
|
|
1974 | 10/22/2020 | ||||||||||||||||||||||||||||||||||||||||||||||||||||||||||||||||||||
| Equipment Rental and Sales | Fultonville | NY |
|
|
|
|
|
|
|
|
1980 | 10/22/2020 | ||||||||||||||||||||||||||||||||||||||||||||||||||||||||||||||||||||
| Equipment Rental and Sales | Lancaster | MA |
|
|
|
|
|
|
|
|
2012 | 10/22/2020 | ||||||||||||||||||||||||||||||||||||||||||||||||||||||||||||||||||||
| Equipment Rental and Sales | Greenfield | MA |
|
|
|
|
|
|
|
|
1971 | 10/22/2020 | ||||||||||||||||||||||||||||||||||||||||||||||||||||||||||||||||||||
| Equipment Rental and Sales | Farmington | CT |
|
|
|
|
|
|
|
|
2005 | 10/22/2020 | ||||||||||||||||||||||||||||||||||||||||||||||||||||||||||||||||||||
| Equipment Rental and Sales | Pembroke | NH |
|
|
|
|
|
|
|
|
1978 | 10/22/2020 | ||||||||||||||||||||||||||||||||||||||||||||||||||||||||||||||||||||
| Grocery | Farmington | MO |
|
|
|
|
|
|
|
|
2006 | 10/29/2020 | ||||||||||||||||||||||||||||||||||||||||||||||||||||||||||||||||||||
| Grocery | Fredericktown | MO |
|
|
|
|
|
|
|
|
2001 | 10/29/2020 | ||||||||||||||||||||||||||||||||||||||||||||||||||||||||||||||||||||
| Automotive Service | Byram | NJ |
|
|
|
|
|
|
|
|
1992 | 10/29/2020 | ||||||||||||||||||||||||||||||||||||||||||||||||||||||||||||||||||||
| Automotive Service | Westfield | NJ |
|
|
|
|
|
|
|
|
1970 | 10/29/2020 | ||||||||||||||||||||||||||||||||||||||||||||||||||||||||||||||||||||
| Automotive Service | East Windsor | NJ |
|
|
|
|
|
|
|
|
1965 | 10/29/2020 | ||||||||||||||||||||||||||||||||||||||||||||||||||||||||||||||||||||
| Automotive Service | Fords | NJ |
|
|
|
|
|
|
|
|
1974 | 10/29/2020 | ||||||||||||||||||||||||||||||||||||||||||||||||||||||||||||||||||||
| Automotive Service | Jackson | NJ |
|
|
|
|
|
|
|
|
1995 | 10/29/2020 | ||||||||||||||||||||||||||||||||||||||||||||||||||||||||||||||||||||
| Automotive Service | West Berlin | NJ |
|
|
|
|
|
|
|
|
1995 | 10/29/2020 | ||||||||||||||||||||||||||||||||||||||||||||||||||||||||||||||||||||
| Other Services | Zeeland | MI |
|
|
|
|
|
|
|
|
1973 | 11/2/2020 | ||||||||||||||||||||||||||||||||||||||||||||||||||||||||||||||||||||
| Other Services | Wyoming | MI |
|
|
|
|
|
|
|
|
2020 | 11/2/2020 | ||||||||||||||||||||||||||||||||||||||||||||||||||||||||||||||||||||
| Other Services | Waterford | MI |
|
|
|
|
|
|
|
|
1995 | 11/2/2020 | ||||||||||||||||||||||||||||||||||||||||||||||||||||||||||||||||||||
| Other Services | Elkhart | IN |
|
|
|
|
|
|
|
|
1989 | 11/2/2020 | ||||||||||||||||||||||||||||||||||||||||||||||||||||||||||||||||||||
| Other Services | Mishawaka | IN |
|
|
|
|
|
|
|
|
1979 | 11/2/2020 | ||||||||||||||||||||||||||||||||||||||||||||||||||||||||||||||||||||
| Restaurants - Quick Service | Franklin | IN |
|
|
|
|
|
|
|
|
2017 | 11/12/2020 | ||||||||||||||||||||||||||||||||||||||||||||||||||||||||||||||||||||
| Car Washes | Princeton | TX |
|
|
|
|
|
|
|
|
2020 | 11/16/2020 | ||||||||||||||||||||||||||||||||||||||||||||||||||||||||||||||||||||
| Automotive Service | Point Pleasant | NJ |
|
|
|
|
|
|
|
|
1977 | 11/19/2020 | ||||||||||||||||||||||||||||||||||||||||||||||||||||||||||||||||||||
| Pet Care Services | Douglasville | GA | {f} |
|
|
|
|
|
|
|
|
1989 | 11/24/2020 | |||||||||||||||||||||||||||||||||||||||||||||||||||||||||||||||||||
| Pet Care Services | Alpharetta | GA | {f} |
|
|
|
|
|
|
|
|
2007 | 11/24/2020 | |||||||||||||||||||||||||||||||||||||||||||||||||||||||||||||||||||
| Grocery | Fayetteville | AR |
|
|
|
|
|
|
|
|
1990 | 12/1/2020 | ||||||||||||||||||||||||||||||||||||||||||||||||||||||||||||||||||||
| Automotive Service | Fairmont | WV |
|
|
|
|
|
|
|
|
1997 | 12/2/2020 | ||||||||||||||||||||||||||||||||||||||||||||||||||||||||||||||||||||
| Automotive Service | Fairmont | WV |
|
|
|
|
|
|
|
|
1999 | 12/2/2020 | ||||||||||||||||||||||||||||||||||||||||||||||||||||||||||||||||||||
| Restaurants - Quick Service | Richardson | TX |
|
|
|
|
|
|
|
|
1979 | 12/15/2020 | ||||||||||||||||||||||||||||||||||||||||||||||||||||||||||||||||||||
| Restaurants - Quick Service | Arlington | TX |
|
|
|
|
|
|
|
|
1979 | 12/15/2020 | ||||||||||||||||||||||||||||||||||||||||||||||||||||||||||||||||||||
| Restaurants - Quick Service | Oklahoma City | OK |
|
|
|
|
|
|
|
|
1979 | 12/15/2020 | ||||||||||||||||||||||||||||||||||||||||||||||||||||||||||||||||||||
| Restaurants - Quick Service | Moore | OK |
|
|
|
|
|
|
|
|
1983 | 12/15/2020 | ||||||||||||||||||||||||||||||||||||||||||||||||||||||||||||||||||||
| Restaurants - Quick Service | Norman | OK |
|
|
|
|
|
|
|
|
1992 | 12/15/2020 | ||||||||||||||||||||||||||||||||||||||||||||||||||||||||||||||||||||
| Restaurants - Quick Service | Owasso | OK |
|
|
|
|
|
|
|
|
1986 | 12/15/2020 | ||||||||||||||||||||||||||||||||||||||||||||||||||||||||||||||||||||
| Restaurants - Quick Service | Waco | TX |
|
|
|
|
|
|
|
|
1987 | 12/15/2020 | ||||||||||||||||||||||||||||||||||||||||||||||||||||||||||||||||||||
| Restaurants - Quick Service | Carrollton | TX |
|
|
|
|
|
|
|
|
1992 | 12/15/2020 | ||||||||||||||||||||||||||||||||||||||||||||||||||||||||||||||||||||
| Restaurants - Quick Service | Rowlett | TX |
|
|
|
|
|
|
|
|
1999 | 12/15/2020 | ||||||||||||||||||||||||||||||||||||||||||||||||||||||||||||||||||||
| Restaurants - Quick Service | Mesquite | TX |
|
|
|
|
|
|
|
|
1999 | 12/15/2020 | ||||||||||||||||||||||||||||||||||||||||||||||||||||||||||||||||||||
| Restaurants - Quick Service | Grand Prairie | TX |
|
|
|
|
|
|
|
|
1999 | 12/15/2020 | ||||||||||||||||||||||||||||||||||||||||||||||||||||||||||||||||||||
| Restaurants - Quick Service | Dallas | TX |
|
|
|
|
|
|
|
|
1977 | 12/15/2020 | ||||||||||||||||||||||||||||||||||||||||||||||||||||||||||||||||||||
| Restaurants - Quick Service | Oklahoma City | OK |
|
|
|
|
|
|
|
|
2010 | 12/15/2020 | ||||||||||||||||||||||||||||||||||||||||||||||||||||||||||||||||||||
F-22
| Description(a) | Encumbrances | Initial Cost to Company |
Cost Capitalized Subsequent
to Acquisition |
Gross Amount at
December 31, 2020(b)(c) |
Accumulated Depreciation
(d)(e) |
Year
Constructed |
Date
Acquired |
|||||||||||||||||||||||||||||||||||||||||||||||||||||||||||||||||||||||||
| Tenant Industry | City | State |
Land &
Improvements |
Building &
Improvements |
Land &
Improvements |
Building &
Improvements |
Land &
Improvements |
Building &
Improvements |
Total | |||||||||||||||||||||||||||||||||||||||||||||||||||||||||||||||||||||||
| Restaurants - Quick Service | Kilgore | TX | $ |
|
$ |
|
$ |
|
$ |
|
$ |
|
$ |
|
$ |
|
$ |
|
1979 | 12/15/2020 | ||||||||||||||||||||||||||||||||||||||||||||||||||||||||||||
| Car Washes | Fort Worth | TX |
|
|
|
|
|
|
|
|
1942 | 12/18/2020 | ||||||||||||||||||||||||||||||||||||||||||||||||||||||||||||||||||||
| Car Washes | Hudson Oaks | TX |
|
|
|
|
|
|
|
|
1948 | 12/18/2020 | ||||||||||||||||||||||||||||||||||||||||||||||||||||||||||||||||||||
| Car Washes | Garland | TX |
|
|
|
|
|
|
|
|
2012 | 12/18/2020 | ||||||||||||||||||||||||||||||||||||||||||||||||||||||||||||||||||||
| Car Washes | Fort Worth | TX |
|
|
|
|
|
|
|
|
2013 | 12/18/2020 | ||||||||||||||||||||||||||||||||||||||||||||||||||||||||||||||||||||
| Car Washes | Crowley | TX |
|
|
|
|
|
|
|
|
2016 | 12/18/2020 | ||||||||||||||||||||||||||||||||||||||||||||||||||||||||||||||||||||
| Car Washes | Flower Mound | TX |
|
|
|
|
|
|
|
|
2018 | 12/18/2020 | ||||||||||||||||||||||||||||||||||||||||||||||||||||||||||||||||||||
| Car Washes | Fort Worth | TX |
|
|
|
|
|
|
|
|
2018 | 12/18/2020 | ||||||||||||||||||||||||||||||||||||||||||||||||||||||||||||||||||||
| Medical / Dental | Naperville | IL |
|
|
|
|
|
|
|
|
1998 | 12/21/2020 | ||||||||||||||||||||||||||||||||||||||||||||||||||||||||||||||||||||
| Automotive Service | Washington Court House | OH |
|
|
|
|
|
|
|
|
2004 | 12/21/2020 | ||||||||||||||||||||||||||||||||||||||||||||||||||||||||||||||||||||
| Automotive Service | Cincinnati | OH |
|
|
|
|
|
|
|
|
1991 | 12/21/2020 | ||||||||||||||||||||||||||||||||||||||||||||||||||||||||||||||||||||
| Restaurants - Quick Service | Dothan | AL |
|
|
|
|
|
|
|
|
2019 | 12/22/2020 | ||||||||||||||||||||||||||||||||||||||||||||||||||||||||||||||||||||
| Restaurants - Quick Service | Philadelphia | MS |
|
|
|
|
|
|
|
|
2020 | 12/22/2020 | ||||||||||||||||||||||||||||||||||||||||||||||||||||||||||||||||||||
| Restaurants - Quick Service | Ashford | AL |
|
|
|
|
|
|
|
|
2020 | 12/22/2020 | ||||||||||||||||||||||||||||||||||||||||||||||||||||||||||||||||||||
| Restaurants - Quick Service | Newton | MS |
|
|
|
|
|
|
|
|
2020 | 12/22/2020 | ||||||||||||||||||||||||||||||||||||||||||||||||||||||||||||||||||||
| Car Washes | Slidell | LA |
|
|
|
|
|
|
|
|
2012 | 12/23/2020 | ||||||||||||||||||||||||||||||||||||||||||||||||||||||||||||||||||||
| Car Washes | Gulfport | MS |
|
|
|
|
|
|
|
|
2008 | 12/23/2020 | ||||||||||||||||||||||||||||||||||||||||||||||||||||||||||||||||||||
| Car Washes | Carbondale | IL |
|
|
|
|
|
|
|
|
2018 | 12/23/2020 | ||||||||||||||||||||||||||||||||||||||||||||||||||||||||||||||||||||
| Medical / Dental | Arlington | TX |
|
|
|
|
|
|
|
|
1983 | 12/23/2020 | ||||||||||||||||||||||||||||||||||||||||||||||||||||||||||||||||||||
| Medical / Dental | Austin | TX |
|
|
|
|
|
|
|
|
1968 | 12/23/2020 | ||||||||||||||||||||||||||||||||||||||||||||||||||||||||||||||||||||
| Medical / Dental | Florissant | MO |
|
|
|
|
|
|
|
|
1987 | 12/23/2020 | ||||||||||||||||||||||||||||||||||||||||||||||||||||||||||||||||||||
| Medical / Dental | Temple | TX |
|
|
|
|
|
|
|
|
2015 | 12/23/2020 | ||||||||||||||||||||||||||||||||||||||||||||||||||||||||||||||||||||
| Medical / Dental | Norcross | GA |
|
|
|
|
|
|
|
|
1975 | 12/23/2020 | ||||||||||||||||||||||||||||||||||||||||||||||||||||||||||||||||||||
| Medical / Dental | Carrolton | TX |
|
|
|
|
|
|
|
|
1983 | 12/23/2020 | ||||||||||||||||||||||||||||||||||||||||||||||||||||||||||||||||||||
| Car Washes | Jacksonville | NC |
|
|
|
|
|
|
|
|
2003 | 12/29/2020 | ||||||||||||||||||||||||||||||||||||||||||||||||||||||||||||||||||||
| Other Services | Pensacola | FL |
|
|
|
|
|
|
|
|
1970 | 12/29/2020 | ||||||||||||||||||||||||||||||||||||||||||||||||||||||||||||||||||||
| Medical / Dental | Amarillo | TX |
|
|
|
|
|
|
|
|
2018 | 12/29/2020 | ||||||||||||||||||||||||||||||||||||||||||||||||||||||||||||||||||||
| Medical / Dental | Amarillo | TX |
|
|
|
|
|
|
|
|
1978 | 12/29/2020 | ||||||||||||||||||||||||||||||||||||||||||||||||||||||||||||||||||||
| Medical / Dental | Amarillo | TX |
|
|
|
|
|
|
|
|
2015 | 12/29/2020 | ||||||||||||||||||||||||||||||||||||||||||||||||||||||||||||||||||||
| Equipment Rental and Sales | Milford | NH |
|
|
|
|
|
|
|
|
1982 | 12/30/2020 | ||||||||||||||||||||||||||||||||||||||||||||||||||||||||||||||||||||
| Equipment Rental and Sales | Beaumon | TX |
|
|
|
|
|
|
|
|
1991 | 12/31/2020 | ||||||||||||||||||||||||||||||||||||||||||||||||||||||||||||||||||||
| Equipment Rental and Sales | Cibilo | TX |
|
|
|
|
|
|
|
|
1980 | 12/31/2020 | ||||||||||||||||||||||||||||||||||||||||||||||||||||||||||||||||||||
| $ |
|
$ |
|
$ |
|
$ |
|
$ |
|
$ |
|
$ |
|
$ |
|
|||||||||||||||||||||||||||||||||||||||||||||||||||||||||||||||||
(a)
As of December 31, 2020, the Company had investments in
1,181
single-tenant real estate property locations including
1,056
owned properties and
10
ground lease interests. All or a portion of
6
of the Company’s owned properties and
1
property subject to ground lease interests are subject to leases accounted for as direct financing leases and the portions relating to the direct financing leases are excluded from the table above. The Company owns
5
properties which are accounted for as a loan receivable, as the leases contain purchase options. Initial costs exclude intangible lease assets totaling $
68.0
million.
(b)
The aggregate cost for federal income tax purposes is $
2.3
billion.
F-23
(c)
The following is a reconciliation of carrying value for land and improvements and building and improvements for the periods presented:
| (in thousands) | Year ended December 31, 2020 | Year ended December 31, 2019 | Year ended December 31, 2018 | |||||||||||||||||
| Balance, beginning of period | $ |
|
$ |
|
$ |
|
||||||||||||||
| Additions | ||||||||||||||||||||
| Acquisitions |
|
|
|
|||||||||||||||||
| Improvements |
|
|
|
|||||||||||||||||
| Deductions | ||||||||||||||||||||
| Provisions for impairment of real estate |
(
|
(
|
(
|
|||||||||||||||||
| Real estate investments held for sale |
(
|
(
|
|
|||||||||||||||||
| Cost of real estate sold |
(
|
(
|
(
|
|||||||||||||||||
| Balance, end of period | $ |
|
$ |
|
$ |
|
||||||||||||||
(d)
The following is a reconciliation of accumulated depreciation for the periods presented:
| (in thousands) | Year ended December 31, 2020 | Year ended December 31, 2019 | Year ended December 31, 2018 | |||||||||||||||||
| Balance, beginning of period | $ |
|
$ |
|
$ |
|
||||||||||||||
| Additions | ||||||||||||||||||||
| Depreciation expense |
|
|
|
|||||||||||||||||
| Deductions | ||||||||||||||||||||
| Accumulated depreciation associated with real estate sold |
(
|
(
|
(
|
|||||||||||||||||
| Balance, end of period | $ |
|
$ |
|
$ |
|
||||||||||||||
(e)
Depreciation is calculated using the straight-line method over the estimated useful lives of the properties, which is up to
40
years for buildings and improvements and
15
years for land improvements.
(f)
Property is collateral for non-recourse debt obligations totaling $
399.7
million issued under the Company’s Master Trust Funding Program.
(g)
Amounts shown as reductions to cost capitalized subsequent to acquisition represent provisions recorded for impairment of real estate.
See accompanying report of independent registered public accounting firm.
F-24
ESSENTIAL PROPERTIES REALTY TRUST, INC. AND ESSENTIAL PROPERTIES REALTY TRUST, INC. PREDECESSOR
Schedule IV - Mortgage Loans on Real Estate
As of December 31, 2020
(Dollar amounts in thousands)
| Description |
Interest
rate |
Final
Maturity Date |
Periodic
Payment Terms |
Final
Payment Terms |
Prior
Liens |
Face
Amount of Mortgages |
Carrying
Amount of Mortgages |
Principal Amount
of Loans Subject to Delinquent Principal or Interest |
||||||||||||||||||||||||||||||||||||||||||
| First mortgage loans: | ||||||||||||||||||||||||||||||||||||||||||||||||||
| Two Early Childhood Education Centers located in Florida |
|
5/8/2039 | Interest only |
Balloon - $
|
None | $ |
|
$ |
|
None | ||||||||||||||||||||||||||||||||||||||||
| Two Early Childhood Education Centers located in Florida |
|
7/15/2039 | Interest only |
Balloon - $
|
None |
|
|
None | ||||||||||||||||||||||||||||||||||||||||||
| Two Family Dining Restaurants located in Texas |
|
6/30/2059 | Principal + Interest | Fully amortizing | None |
|
|
None | ||||||||||||||||||||||||||||||||||||||||||
| Sixty-nine Quick Service Restaurants located in fifteen states |
|
8/31/2034 | Interest only |
Balloon - $
|
None |
|
|
None | ||||||||||||||||||||||||||||||||||||||||||
| Eighteen Car Washes located in six states |
|
12/31/2034 | Interest only |
Balloon - $
|
None |
|
|
None | ||||||||||||||||||||||||||||||||||||||||||
| One Early Childhood Education Centers located in Florida |
|
2/29/2040 | Interest only |
Balloon - $
|
None |
|
|
None | ||||||||||||||||||||||||||||||||||||||||||
| One Medical/Dental Center located in Texas |
|
4/21/2021 | Interest only |
Balloon - $
|
None |
|
|
None | ||||||||||||||||||||||||||||||||||||||||||
| Three Convenience Stores located in Minnesota |
|
12/10/2022 | Interest only |
Balloon - $
|
None |
|
|
None | ||||||||||||||||||||||||||||||||||||||||||
| Eight Car Washes located in three states |
|
12/31/2035 | Interest only |
Balloon - $
|
None |
|
|
None | ||||||||||||||||||||||||||||||||||||||||||
| Eleven Car Washes located in six states |
|
12/31/2035 | Interest only |
Balloon - $
|
None |
|
|
None | ||||||||||||||||||||||||||||||||||||||||||
| $ |
|
$ |
|
|||||||||||||||||||||||||||||||||||||||||||||||
The following shows changes in carrying amounts of mortgage loans receivable during the years ended December 31, 2020, 2019 and 2018 (in thousands):
| Year ended December 31, | ||||||||||||||||||||
| 2020 | 2019 | 2018 | ||||||||||||||||||
| Balance, beginning of period | $ |
|
$ |
|
$ |
|
||||||||||||||
| Additions: | ||||||||||||||||||||
| New mortgage loans |
|
|
|
|||||||||||||||||
| Subsequent funding on existing mortgage loans |
|
|
|
|||||||||||||||||
| Deductions: | ||||||||||||||||||||
| Collections of principal |
(
|
(
|
|
|||||||||||||||||
| Provision for loan losses |
(
|
|
|
|||||||||||||||||
| Balance, end of period | $ |
|
$ |
|
$ |
|
||||||||||||||
See accompanying report of independent registered public accounting firm.
F-25
TABLE OF CONTENTS
Part IItem 1. BusinessItem 1A. Risk FactorsItem 1B. Unresolved Staff CommentsItem 2. PropertiesItem 3. Legal ProceedingsItem 4. Mine Safety DisclosuresPart IIItem 5. Market For Registrant's Common Equity, Related Stockholder Matters and Issuer Purchases Of Equity SecuritiesItem 6. Selected Financial DataItem 7. Management's Discussion and Analysis Of Financial Condition and Results Of OperationsItem 7A. Quantitative and Qualitative Disclosures About Market RiskItem 8. Financial Statements and Supplementary DataItem 9. Changes in and Disagreements with Accountants on Accounting and Financial DisclosureItem 9A. Controls and ProceduresItem 9B. Other InformationPart IIIItem 10. Directors, Executive Officers and Corporate GovernanceItem 11. Executive CompensationItem 12. Security Ownership Of Certain Beneficial Owners and Management and Related Stockholder MattersItem 13. Certain Relationships and Related Transactions, and Director IndependenceItem 14. Principal Accounting Fees and ServicesPart IVItem 15. Exhibits, Financial Statement SchedulesItem 16. Form 10-k Summary